Minimum Required Capital Levels
Banks have been required to hold minimum levels of capital based on guidelines established by the bank regulatory agencies since 1983. The minimums have been expressed in terms of ratios of “capital” divided by “total assets.” As discussed below, bank capital measures have become more sophisticated over the years and have focused more on the quality of capital and the risk of assets. Bank holding companies have historically had to comply with less stringent capital standards than their bank subsidiaries and have been able to raise capital with hybrid instruments such as trust preferred securities. The Dodd-Frank Act mandated the Federal Reserve to establish minimum capital levels for holding companies on a consolidated basis as stringent as those required for FDIC-insured institutions. A result of this change is that the proceeds of hybrid instruments, such as trust preferred securities, were excluded from capital over a phase-out period. However, if such securities were issued prior to May 19, 2010 by bank holding companies with less than $15 billion of assets, they may be retained, subject to certain restrictions. Because the Company has assets of less than $15 billion, the Company is able to maintain its trust preferred proceeds as capital but the Company has to comply with new capital mandates in other respects and will not be able to raise capital in the future through the issuance of trust preferred securities.
The Basel International Capital Accords
The risk-based capital guidelines for U.S. banks sincebeginning in 1989 werehave been based upon the 1988international capital accordaccords, known as “Basel I”“Basel” rules, adopted by the international Basel Committee on Banking Supervision, a committee of central banks and bank supervisors that acts as the primary global standard-setter for prudential regulation, as implemented by the U.S. bank regulatory agencies on an interagency basis. The accordaccords recognized that bank assets for the purpose of the capital ratio calculations needed to be assigned risk weightsweighted (the theory being that riskier assets should require more capital) and that off-balance sheet exposures needed to be factored ininto the calculations. Basel I had a very simple formula for assigning risk weights to bank assets from 0% to 100% based on four categories. In 2008,Following the banking agencies collaboratively began to phase-in capital standards based on a second capital accord, referred to as “Basel II,” for large or “core” international banks (generally defined for U.S. purposes as having total assets of $250 billion or more, or consolidated foreign exposures of $10 billion or more) known as “advanced approaches” banks. The primary focus of Basel II was on the calculation of risk weights based on complex models developed by each advanced approaches bank. Because most banks were not subject to Basel II, the U.S. bank regulators worked to improve the risk sensitivity of Basel I standards without imposing the complexities of Basel II. This “standardized approach” increased the number of risk-weight categories and recognized risks well above the original 100% risk weight. It is institutionalized by the Dodd-Frank Act for all banking organizations, even for the advanced approaches banks, as a floor.
7
On September 12, 2010,global financial crisis, the Group of Governors and Heads of Supervision, the oversight body of the Basel Committee on Banking Supervision, announced agreement on a strengthened set of capital requirements for banking organizations around the world, known as Basel III, to address deficiencies recognized in connection with the global financial crisis.
The Basel III Rule
In July 2013, the U.S. federal banking agencies approved the implementation ofadopted the Basel III regulatory capital reforms in pertinent part, and, at the same time, promulgated rules effecting certain changes required by the Dodd-Frank Act (the “Basel III Rule”). In contrast to in regulations that were effective (with a number of phase-ins) in 2015. The Basel III Rule established capital requirements historically, which werestandards for banks and bank holding companies that are meaningfully more stringent than those in place previously: it increased the required quantity and quality of capital; and it required a more complex, detailed, and calibrated assessment of risk in the formcalculation of guidelines, Basel III was released in the form of enforceable regulations by each of the regulatory agencies.risk weightings. The Basel III Rule is applicable to all banking organizations that are subject to minimum capital requirements, including federal and state banks and savings and loan associations, as well as to most bank and savings and loan holding companies, other than “small bank holding companies” (generally holding companies with consolidated assets of less than $3 billion that do not have securities registered withcompanies. The Company and the SEC). Banking organizations becameBank are each subject to the Basel III Rule on January 1, 2015 and all parts of it were fully phased-in as of January 1, 2019.described below.
The Basel III Rule increased the required quantity and quality of capital and, for nearly every class of assets, it requires a more complex, detailed and calibrated assessment of risk and calculation of risk-weight amounts. Not only did the Basel III Rule increase most of the required minimum capital ratios in effect prior to January 1, 2015, but also, in requiring that forms of capital be of higher quality to absorb loss, it introduced the concept of Common Equity Tier 1 Capital, which consists primarily of common stock, related surplus (net of Treasury stock), retained earnings, and Common Equity Tier 1 minority interests subject to certain regulatory adjustments. The Basel III Rule also changed the definition of capital by establishing more stringent criteria that instruments must meet to be considered Additional Tier 1 Capital (primarily non-cumulative perpetual preferred stock that meets certain requirements) and Tier 2 Capital (primarily other types of preferred stock and subordinated debt, subject to limitations). A number of instruments that qualified as Tier 1 Capital under Basel I do not qualify, or their qualifications changed. For example, noncumulative perpetual preferred stock, which qualified as simple Tier 1 Capital under Basel I, does not qualify as Common Equity Tier 1 Capital, but qualifies as Additional Tier 1 Capital. The Basel III Rule also constrained the inclusion of minority interests, mortgage-servicing assets, and deferred tax assets in capital and requiresrequired deductions from Common Equity Tier 1 Capital in the event that such assets exceedexceeded a certain percentage of a banking institution’s Common Equity Tier 1 Capital.
Minimum Capital Ratio Requirements
The Basel III Rule required requires minimum capital ratios as of January 1, 2015, as follows:
| A ratio of |
|
|
| A continuation of the minimum required amount of Total Capital (Tier 1 plus Tier 2) at 8% of risk-weighted assets; and |
| A |
12
Capital Conservation Buffer
In addition, institutions that seek the freedom to make capital distributions (including for dividends and repurchases of stock) and pay discretionary bonuses to executive officers without restriction also must also maintain 2.5% in Common Equity Tier 1 Capital attributable to a capital conservation buffer (fully phased-in as of January 1, 2019).buffer. The purpose of the conservation buffer is to ensure that banking institutions maintain a buffer of capital that can be used to absorb losses during periods of financial and economic stress. Factoring in the conservation buffer increases the minimum ratios depicted above to 7% for Common Equity Tier 1 Capital, 8.5% for Tier 1 Capital and 10.5% for Total Capital. Federal bank regulators released a joint statement in response to the COVID-19 pandemic reminding the industry that capital and liquidity buffers were meant to give banks the means to support the economy in adverse situations, and that the agencies would support banks that use the buffers for that purpose if undertaken in a safe and sound manner.
Well-Capitalized Requirements
The ratios described above are minimum standards in order for banking organizations to be considered “adequately capitalized.” Bank regulatory agencies uniformly encourage banks to hold more capital and be “well-capitalized” and, to that end, federal law and regulations provide various incentives for banking organizations to maintain regulatory capital at levels in excess of minimum regulatory requirements. For example, a banking organization that is well-capitalized may: (i) qualify for exemptions from prior notice or application requirements otherwise applicable to certain types of activities; (ii) qualify for expedited processing of other required notices or applications; and (iii) accept, roll-over or renew brokered deposits. Higher capital levels also could also be required if warranted by the particular circumstances or risk profiles of individual banking organizations. For example, the Federal Reserve’s capital guidelines contemplate that additional capital may be required to take adequate account of, among other things, interest rate risk, or the risks posed by concentrations of credit, nontraditional activities, or securities trading activities. Further, any banking organization experiencing or anticipating significant growth would be expected to maintain capital ratios, including tangible capital positions (i.e., Tier 1 Capital less all intangible assets), well above the minimum levels.
8
Under the capital regulations of the FDIC and Federal Reserve, in order to be well‑capitalized,well-capitalized, a banking organization must maintain:maintain all of the following:
| A Common Equity Tier 1 Capital ratio to risk-weighted assets of 6.5% or |
| A ratio of Tier 1 Capital to total risk-weighted assets of 8% or more |
| A ratio of Total Capital to total risk-weighted assets of 10% or more |
| A leverage ratio of Tier 1 Capital to total adjusted average quarterly assets of 5% or |
It is possible under the Basel III Rule to be well-capitalized while remaining out of compliance with the capital conservation buffer discussed above.
As of December 31, 2018:2021: (i) neither Busey Bank nor TheBANK was not subject to a directive from the FDIC to increase its capital and (ii) the Banks wereBusey Bank was well-capitalized, as defined by FDIC regulations. As of December 31, 2018,2021, the Company had regulatory capital in excess of the Federal Reserve’s requirements and met the Basel III Rule requirements to be well-capitalized.The Company also is in compliance with the capital conservation buffer.
13
Prompt Corrective Action
The concept of an institution being “well-capitalized” is part of a regulatory enforcement regime that provides the federal banking regulators with broad power to take “prompt corrective action” to resolve the problems of depository institutions based on the capital level of each particular institution.The extent of the regulators’ powers depends on whether the institution in question is “adequately capitalized,” “undercapitalized,” “significantly undercapitalized” or “critically undercapitalized,” in each case as defined by regulation. Depending upon the capital category to which an institution is assigned, the regulators’ corrective powers include: (i) requiring the institution to submit a capital restoration plan; (ii) limiting the institution’s asset growth and restricting its activities; (iii) requiring the institution to issue additional capital stock (including additional voting stock) or to sell itself; (iv) restricting transactions between the institution and its affiliates; (v) restricting the interest rate that the institution may pay on deposits; (vi) ordering a new election of directors of the institution; (vii) requiring that senior executive officers or directors be dismissed; (viii) prohibiting the institution from accepting deposits from correspondent banks; (ix) requiring the institution to divest certain subsidiaries; (x) prohibiting the payment of principal or interest on subordinated debt; and (xi) ultimately, appointing a receiver for the institution.
RegulationSupervision and SupervisionRegulation of the Company
General
The Company, as the sole stockholder of the Banks,Busey Bank, is a bank holding company. As a bank holding company, the Company is registered with, and subject to regulation, supervision, and enforcement by, the Federal Reserve under the Bank Holding Company Act of 1956, as amended (the “BHCA”).BHCA. The Company is legally obligated to act as a source of financial and managerial strength to each of the BanksBusey Bank and to commit resources to support themit in circumstances where we might not otherwise do so. Under the BHCA, the Company is subject to periodic examination by the Federal Reserve and is required to file with the Federal Reserve periodic reports of its operations and such additional information regarding the Company and each of the BanksBusey Bank as the Federal Reserve may require.
Acquisitions, Activities and Financial Holding Company Election
The primary purpose of a bank holding company is to control and manage banks. The BHCA generally requires the prior approval of the Federal Reserve for any merger involving a bank holding company or any acquisition by a bank holding company of another bank or bank holding company. Subject to certain conditions (including deposit concentration limits established by the BHCA), the Federal Reserve may allow a bank holding company to acquire banks located in any state of the United States.U.S. In approving interstate acquisitions, the Federal Reserve is required to give effect to applicable state law limitations on the aggregate amount of deposits that may be held by the acquiring bank holding company and its FDIC-insured institution affiliates in the state in which the target bank is located (provided that those limits do not discriminate against out-of-state institutions or their holding companies) and state laws that require that the target bank have been in existence for a minimum period of time (not to exceed five years) before being acquired by an out-of-state bank holding company. Furthermore, in accordance with the Dodd-Frank Act, bank holding companies must be well-capitalized and well-managed in order to effect interstate mergers or acquisitions. For a discussion of the capital requirements, see “—“Item 1. Business—Supervision, Regulation and Other Factors—The Role of Capital” above.
The BHCA generally prohibits the Company from acquiring direct or indirect ownership or control of more than 5% of the voting shares of any company that is not a bank and from engaging in any business other than that of banking, managing, and controlling banks, or furnishing services to banks and their subsidiaries. This general prohibition is subject to a number of exceptions. The principal exception allows bank holding companies to engage in, and to own shares of companies engaged in, certain businesses found by the Federal Reserve prior to November 11, 1999, to be “so closely related to banking ... as to be a proper incident thereto.” This authority permits the Company to engage in a variety of banking-related businesses, including the ownership and operation of a
9
savings association, or any entity engaged in consumer finance, equipment leasing, the operation of a computer service bureau (including software development) and mortgage banking and brokerage services. The BHCA does not place territorial restrictions on the domestic activities of nonbank subsidiaries of bank holding companies.
14
Additionally, bank holding companies that meet certain eligibility requirements prescribed by the BHCA and elect to operate as financial holding companies may engage in, or own shares in companies engaged in, a wider range of nonbanking activities, including securities and insurance underwriting and sales, merchant banking and any other activity that the Federal Reserve, in consultation with the Secretary of the Treasury, determines by regulation or order is financial in nature or incidental to any such financial activity, or that the Federal Reserve determines by order to be complementary to any such financial activity, andas long as the activity does not pose a substantial risk to the safety or soundness of FDIC-insured institutions or the financial system generally. The Company has elected to operate as a financial holding company. In order to maintain its status as a financial holding company, the Company and each of the BanksBusey Bank must be well-capitalized, well-managed, and the BanksBusey Bank must have a least a satisfactory Community Reinvestment Act (“CRA”)CRA rating. If the Federal Reserve determines that a financial holding company is not well-capitalized or well-managed, the company has a period of time in which to achieve compliance, but during the period of noncompliance, the Federal Reserve may place any limitations on the company it believes to be appropriate. Furthermore, if the Federal Reserve determines that a financial holding company’s subsidiary bank has not received a satisfactory CRA rating, that company will not be able to commence any new financial activities or acquire a company that engages in such activities.
Change in Control
Federal law also prohibits any person or company from acquiring “control” of an FDIC-insured depository institution or its holding company without prior notice to the appropriate federal bank regulator. “Control” is conclusively presumed to exist upon the acquisition of 25% or more of the outstanding voting securities of a bank or bank holding company, but may arise under certain circumstances between 10% and 24.99% ownership.
Capital Requirements
Bank holding companies are required to maintain capital in accordance with Federal Reserve capital adequacy requirements. For a discussion of capital requirements, see “—“Item 1. Business—Supervision, Regulation and Other Factors—The Role of Capital” above.
Dividend Payments
The Company’s ability to pay dividends to its stockholders may be affected by both general corporate law considerations and the policies of the Federal Reserve applicable to bank holding companies. As a Nevada corporation, the Company is subject to the limitations of Nevada law, which allows the Company to pay dividends unless, after such dividend, (i) the Company would not be able to pay its debts as they become due in the usual course of business or (ii) the Company’s total assets would be less than the sum of its total liabilities plus any amount that would be needed, if the Company were to be dissolved at the time of the dividend payment, to satisfy the preferential rights upon dissolution of stockholders whose rights are superior to the rights of the stockholders receiving the distribution.
As a general matter, the Federal Reserve has indicated that the board of directors of a bank holding company should eliminate, defer or significantly reduce dividends to stockholders if: (i) the company’s net income available to stockholders for the past four quarters, net of dividends previously paid during that period, is not sufficient to fully fund the dividends; (ii) the prospective rate of earnings retention is inconsistent with the company’s capital needs and overall current and prospective financial condition; or (iii) the company will not meet, or is in danger of not meeting, its minimum regulatory capital adequacy ratios. The Federal Reserve also possesses enforcement powers over bank holding companies and their nonbank subsidiaries to prevent or remedy actions that represent unsafe or unsound practices or violations of applicable statutes and regulations. Among these powers is the ability to proscribe the payment of dividends by banks and bank holding companies. In addition, under the Basel III Rule, institutions that seek the freedom to pay dividends have to maintain 2.5% in Common Equity Tier 1 Capital attributable to the capital conservation buffer. See “—“Item 1. Business—Supervision, Regulation and Other Factors—The Role of Capital” above.
15
Incentive Compensation
There have been a number of developments in recent years focused on incentive compensation plans sponsored by bank holding companies and banks, reflecting recognition by the bank regulatory agencies and Congress that flawed incentive compensation practices in the financial industry were one of many factors contributing to the global financial crisis. Layered on top of that wereare the abuses in the headlines dealing with product cross-selling incentive plans. The result is interagency guidance on sound incentive compensation practices.
10
The interagency guidance recognized three core principles. Effective incentive plans should: (i) provide employees incentives that appropriately balance risk and reward; (ii) be compatible with effective controls and risk-management; and (iii) be supported by strong corporate governance, including active and effective oversight by the organization’s board of directors. Much of the guidance addresses large banking organizations and, because of the size and complexity of their operations, the regulators expect those organizations to maintain systematic and formalized policies, procedures, and systems for ensuring that the incentive compensation arrangements for all executive and non-executive employees covered by this guidance are identified and reviewed, and appropriately balance risks and rewards. Smaller banking organizations, like the Company, that use incentive compensation arrangements are expected to be less extensive, formalized, and detailed than those of the larger banks.
Monetary Policy
The monetary policy of the Federal Reserve has a significant effect on the operating results of financial or bank holding companies and their subsidiaries.subsidiaries, and this has come into play during the COVID-19 pandemic. Among the tools available to the Federal Reserve to affect the money supply are open market transactions in U.S. government securities and changes in the discount rate on bank borrowings and changes in reserve requirements against bank deposits.borrowings. These meanstools are used in varying combinations to influence overall growth and distribution of bank loans, investments, and deposits, and their use may affect interest rates charged on loans or paid on deposits.
Federal Securities Regulation
The Company’s common stock is registered with the SEC under the Securities Act and the Exchange Act of 1934, as amended (the “Exchange Act”).Act. Consequently, the Company is subject to the information, proxy solicitation, insider trading and other restrictions and requirements of the SEC under the Exchange Act.
Corporate Governance
The Dodd-Frank Act addressed many investor protection, corporate governance, and executive compensation matters that will affect most U.S. publicly traded companies. The Dodd-Frank ActIt increased stockholder influence over boards of directors by requiring companies to give stockholders a nonbinding vote on executive compensation and so-called “golden parachute” payments, and authorizing the SEC to promulgate rules that would allow stockholders to nominate and solicit voters for their own candidates using a company’s proxy materials. The legislation also directed the Federal Reserve to promulgate rules prohibiting excessive compensation paid to executives of bank holding companies, regardless of whether such companies are publicly traded.
Supervision and Regulation and Supervision of the BanksBusey Bank
General
Both of the Banks areBusey Bank is an Illinois-chartered banks. Theirbank. Its deposit accounts are insured by the FDIC’s Deposit Insurance Fund (“DIF”)DIF to the maximum extent provided under federal law and FDIC regulations, currently $250,000$250,000 per insured depositor category.category. As an Illinois-chartered FDIC-insured banks, the Banks arebank, Busey Bank is subject to the examination, supervision, reporting, and enforcement requirements of the DFPR, the chartering authority for Illinois banks. The Banks areBusey Bank is also regulated by the FDIC, designated by federal law as the primary federal regulator of insured state banks that, like the Banks,Busey Bank, are not members of the Federal Reserve System.
16
Deposit Insurance
As an FDIC-insured institutions, the Banks areinstitution, Busey Bank is required to pay deposit insurance premium assessments to the FDIC. The FDIC has adopted a risk-based assessment system whereby FDIC-insured institutions pay insurance premiums at rates based on their risk classification. FDIC assessment rates for institutions that have more than $10.0 billion in assets, such as Busey Bank, are calculated based on a “scorecard” methodology that seeks to capture both the probability that an individual large institution will fail and the magnitude of the impact on the DIF if such a failure occurs, based primarily on the difference between the institution’s average of total assets and average tangible equity. The FDIC has the ability to make discretionary adjustments to the total score, up or down, based upon significant risk factors that are not adequately captured in the scorecard. For institutions like Busey Bank, after accounting for potential base-rate adjustments, the Banks that are not considered large and highly complex banking organizations, assessments are now based on examination ratings and financial ratios. The total base assessment rates currentlyrate could range from 1.5 to 40 basis points to 30 basis points. At least semi-annually, the FDIC updateson an annualized basis. An institution’s assessment is determined by multiplying its loss and income projections for the DIF and, if needed, increases or decreases the assessment rates, following notice and comment on proposed rulemaking. Therate by its assessment base, against which an FDIC-insured institution’s deposit insurance premiums paid to the DIF has been calculated since effectiveness of the Dodd-Frank Act based on its average consolidated total assets less its average tangible equity. This method shifted the burden of deposit insurance premiums toward those large depository institutions that rely on funding sources other than U.S. deposits. is asset based.
The reserve ratio is the FDIC insurance fund balance divided by estimated insured deposits. The Dodd-Frank Act altered the minimum reserve ratio of the DIF, increasing the minimum from 1.15% to 1.35% of the estimated amount of total insured deposits, and eliminating the requirement that the FDIC pay dividends to FDIC-insured institutions when the reserve ratio exceeds certain thresholds.deposits. The reserve ratio reached 1.36% as of September 30, 2018 (most recent available), exceeding2018. As a result, the statutory required minimum reserve ratio of 1.35%. The FDIC will provideprovided assessment credits to insured depository institutions, like Busey Bank at the Banks,time, with total consolidated assets of less than $10$10.0 billion for the portion of their regular assessments that contributecontributed to growth in the reserve
11
ratio between 1.15% and 1.35%. The FDIC will applyapplied the small bank credits each quarterfor quarterly assessment periods beginning July 1, 2019. However, the reserve ratio fell to 1.30% in 2020 because of extraordinary insured deposit growth caused by an unprecedented inflow of more than $1.0 trillion in estimated insured deposits in the first half of 2020, stemming mainly from the COVID-19 pandemic. Although the FDIC could have ceased the small bank credits, it waived the requirement that the reserve ratio isbe at least 1.38% to offset the regular deposit insurance assessments of institutions with credits.
FICO Assessments
In addition to paying basic deposit insurance assessments, FDIC-insured institutions must pay Fair Isaac Corporation (“FICO”) assessments. FICO is a mixed-ownership governmental corporation chartered by the former Federal Home Loan Bank Board pursuant to the Competitive Equality Banking Act of 1987 to function as a financing vehicle1.35% for the recapitalizationfull remittance of the former Federal Savingsremaining assessment credits, and Loan Insurance Corporation. FICO issued 30-year noncallable bondsit refunded all small bank credits as of approximately $8.1September 30, 2020.
The DIF balance was $121.9 billion on September 30, 2021, up $1.4 billion from the end of the second quarter. The reserve ratio remained at 1.27%, as growth in the fund balance kept pace with growth in insured deposits. The FDIC staff continues to closely monitor the factors that mature through 2019. FICO’s authority to issue bonds ended on December 12, 1991. Since 1996, federal legislation has required that all FDIC-insured institutions pay assessments to cover interest payments on FICO’s outstanding obligations. The FICO assessment rate is adjusted quarterlyaffect the reserve ratio, and for the fourth quarter of 2018 was 32 cents per $100 dollars of assessable deposits.any change could impact FDIC assessments.
Supervisory Assessments
All Illinois-chartered banks are required to pay supervisory assessments to the DFPR to fund the operations of that agency. The amount of the assessment is calculated on the basis of each bank’s total assets. During the year ended December 31, 2021, Busey Bank paid supervisory assessments to the DFPR totaling approximately $0.8 million.
Capital Requirements
Banks are generally required to maintain capital levels in excess of other businesses. For a discussion of capital requirements, see “—“Item 1. Business—Supervision, Regulation and Other Factors—The Role of Capital” above.
Liquidity Requirements
Liquidity is a measure of the ability and ease with which bank assets may be converted to cash. Liquid assets are those that can be converted to cash quickly if needed to meet financial obligations. To remain viable, FDIC-insured institutions must have enough liquid assets to meet their near-term obligations, such as withdrawals by depositors. Because the global financial crisis was in part a liquidity crisis, Basel III also includes a liquidity framework that requires FDIC-insured institutions to measure their liquidity against specific liquidity tests. One test, referred to as the LCR, is designed to ensure that the banking entity has an adequate stock of unencumbered high-quality liquid assets that can be converted easily and immediately in private markets into cash to meet liquidity needs for a 30-calendar day liquidity stress scenario. The other test, known as the NSFR, is designed to promote more medium- and long-term funding of the assets and activities of FDIC-insured institutions over a one-year horizon. These tests provide an incentive for banks and holding companies to increase their holdings in Treasury securities and other sovereign debt as a component of assets, increase the use of long-term debt as a funding source and rely on stable funding like core deposits (in lieu of brokered deposits).
17
In addition to liquidity guidelines already in place, the federal bank regulatory agencies implemented the Basel III LCR in September 2014, which requires large financial firms to hold levels of liquid assets sufficient to protect against constraints on their funding during times of financial turmoil, and in 2016 proposed implementation of the NSFR. While these rules do not, and will not, apply to the Banks, the CompanyBusey Bank, it continues to review its liquidity risk management policies in light of developments.
Dividend Payments
The primary source of funds for the Company is dividends from its subsidiary banks.Busey Bank. Under Illinois banking law, Illinois-chartered banks generally may pay dividends only out of undivided profits. The DFPR may restrict the declaration or payment of a dividend by an Illinois-chartered bank. The payment of dividends by any FDIC-insured institution is affected by the requirement to maintain adequate capital pursuant to applicable capital adequacy guidelines and regulations, and a FDIC-insured institution generally is prohibited from paying any dividends if, following payment thereof, the institution would be undercapitalized. Notwithstanding the availability of funds for dividends, the FDIC and the DFPR may prohibit the payment of dividends by the BanksBusey Bank if either or both determine such payment would constitute an unsafe or unsound practice. In addition, under the Basel III Rule, institutions that seek the freedom to pay dividends will have to maintain 2.5% in Common Equity Tier 1 Capital attributable to the capital conservation buffer.
The ability of the Company to pay cash dividends to its stockholders and to service its debt was historically dependent on the receipt of cash dividends from its subsidiaries. Under applicable regulatory requirements, an Illinois state-chartered bank such as Busey Bank may not pay dividends in excess of its net profits. Because Busey Bank had been in an accumulated deficit position since 2009, it was not able to pay dividends. With prior approval from its regulators, however, an Illinois state-chartered bank in that situation was able to reduce its capital stock by amending its charter to decrease the authorized number of shares, and then make a subsequent distribution to its holding company. Using this approach, and with the approval of its regulators, Busey Bank has distributed funds to
12
the Company, the most recent of which was $40.0 million on October 12, 2018. Busey Bank returned to positive retained earnings in the second quarter of 2018. The Company expects Busey Bank to return to paying dividends from net profits in future periods.
State Bank Investments and Activities
The Banks areBusey Bank is permitted to make investments and engage in activities directly or through subsidiaries as authorized by Illinois law. However, under federal law and FDIC regulations, FDIC-insured state banks are prohibited, subject to certain exceptions, from making or retaining equity investments of a type, or in an amount, that are not permissible for a national bank. Federal law and FDIC regulations also prohibit FDIC-insured state banks and their subsidiaries, subject to certain exceptions, from engaging as principal in any activity that is not permitted for a national bank unless the bank meets, and continues to meet, its minimum regulatory capital requirements, and the FDIC determines that the activity would not pose a significant risk to the DIF. These restrictions have not had, and are not currently expected to have, a material impact on the operations of the Banks.Busey Bank.
Insider Transactions
The Banks areBusey Bank is subject to certain restrictions imposed by federal law on “covered transactions” between the BanksBusey Bank and theirits “affiliates.” The Company is an affiliate of the BanksBusey Bank for purposes of these restrictions, and covered transactions subject to the restrictions include extensions of credit to the Company, investments in the stock or other securities of the Company, and the acceptance of the stock or other securities of the Company as collateral for loans made by the Banks.Busey Bank. The Dodd-Frank Act enhanced the requirements for certain transactions with affiliates, including an expansion of the definition of “covered transactions” and an increase in the amount of time for which collateral requirements regarding covered transactions must be maintained.
Certain limitations and reporting requirements are also placed on extensions of credit by the BanksBusey Bank to theirits directors and officers, to directors and officers of the Company and its subsidiaries, to principal stockholders of the Company, and to “related interests” of such directors, officers, and principal stockholders. In addition, federal law and regulations may affect the terms upon which any person who is a director or officer of the Company or the Banks,Busey Bank, or a principal stockholder of the Company, may obtain credit from banks with which the Banks maintainBusey Bank maintains a correspondent relationship.
Safety and Soundness Standards/Risk Management
The federalFederal banking agencies have adopted operational and managerial standards to promote the safety and soundness of FDIC-insured institutions. The standards apply to internal controls, information systems, internal audit systems, loan documentation, credit underwriting, interest rate exposure, asset growth, compensation, fees and benefits, asset quality, and earnings.
18
In general, the safety and soundness standards prescribe the goals to be achieved in each area, and each institution is responsible for establishing its own procedures to achieve those goals. While regulatory standards do not have the force of law, if an institution operates in an unsafe and unsound manner, the FDIC-insured institution’s primary federal regulator may require the institution to submit a plan for achieving and maintaining compliance. If an FDIC-insured institution fails to submit an acceptable compliance plan, or fails in any material respect to implement a compliance plan that has been accepted by its primary federal regulator, the regulator is required to issue an order directing the institution to cure the deficiency. Until the deficiency cited in the regulator’s order is cured, the regulator may restrict the FDIC-insured institution’s rate of growth, require the FDIC-insured institution to increase its capital, restrict the rates the institution pays on deposits, or require the institution to take any action the regulator deems appropriate under the circumstances. Noncompliance with safety and soundness may also constitute grounds for other enforcement action by the federal bank regulatory agencies, including cease and desist orders and civil money penalty assessments.
During the past decade, the bank regulatory agencies have increasingly emphasized the importance of sound risk management processes and strong internal controls when evaluating the activities of the FDIC-insured institutions they supervise. Properly managing risksrisk has been identified as critical to the conduct of safe and sound banking activities, and has become even more important as new technologies, product innovation, and the size and speed of financial transactions have changed the nature of banking markets. The agencies have identified a spectrum of risks facing a banking institution including, but not limited to, credit, market, liquidity, operational, legal, and reputational risk. In particular, recent regulatory pronouncements have focused on operationalThe key risk which arises fromthemes identified by the potential that inadequate information systems, operational problems, breaches in internal controls, fraud, or unforeseen catastrophes will result in unexpected losses. New products and services, third-party risk and cybersecurityCompany for 2022 are critical sources of operational risk that FDIC-insured institutions are expected to address in the current environment. The Banks arediscussed under “Item 1A. Risk Factors” below. Busey Bank is expected to have active board and senior management oversight; adequate policies, procedures, and limits; adequate risk measurement, monitoring, and management information systems; and comprehensive internal controls.
Privacy and Cybersecurity
Busey Bank is subject to many U.S. federal and state laws and regulations governing requirements for maintaining policies and procedures to protect non-public confidential information of its customers. These laws require Busey Bank to periodically disclose its privacy policies and practices relating to sharing such information and permit consumers to opt out of their ability to share information with unaffiliated third parties under certain circumstances. They also impact Busey Bank’s ability to share certain information with affiliates and non-affiliates for marketing and/or non-marketing purposes, or to contact customers with marketing offers. In addition, Busey Bank is required to implement a comprehensive information security program that includes administrative, technical, and physical safeguards to ensure the security and confidentiality of customer records and information. These security and privacy policies and procedures, for the protection of personal and confidential information, are in effect across all businesses and geographic locations.
13
Branching Authority
Illinois banks, such as the Banks,Busey Bank, have the authority under Illinois law to establish branches anywhere in the State of Illinois, subject to receipt of all required regulatory approvals. The Dodd-Frank Act permits well-capitalized and well-managed banks to establish new interstate branches or acquire individual branches of a bank in another state (rather than the acquisition of an out-of-state bank in its entirety) without impediments. Federal law permits state and national banks to merge with banks in other states subject to: (i) regulatory approval; (ii) federal and state deposit concentration limits; and (iii) state law limitations requiring the merging bank to have been in existence for a minimum period of time (not to exceed five years) prior to the merger. The Company expects to merge TheBANK with and into Busey Bank in the second half
19
Transaction Account Reserves
Federal Reserve regulations requirelaw requires FDIC-insured institutions to maintain reserves against their transaction accounts (primarily NOW and regular checking accounts). For 2019, the first $16.3 million of otherwise reservable balances are exempt from reserves and have a zero percent reserve requirement; for transaction accounts aggregating between $16.3 million to $124.2 million, the reserve requirement is 3% of those transaction account balances; and for net transaction accounts in excess of $124.2 million, the reserve requirement is 10% of the aggregateprovide liquidity. The amount of total transaction account balances in excess of $124.2 million. These reserve requirements are subject to annual adjustmentreserves is determined by the Federal Reserve.Reserve based on tranches of zero, three, and ten percent of a bank’s transaction account deposits. However, in March 2020, in an unprecedented move, the Federal Reserve announced that the banking system had ample reserves, and, as reserve requirements no longer played a significant role in this regime, it reduced all reserve tranches to zero percent, thereby freeing banks from the legally mandated reserve maintenance requirement. The action permits Busey Bank to loan or invest funds that previously were unavailable. The Federal Reserve has indicated that it expects to continue to operate in an ample reserves regime for the foreseeable future.
Community Reinvestment Act Requirements
The CRA requires each of the BanksBusey Bank to have a continuing and affirmative obligation in a safe and sound manner to help meet the credit needs of the entire community, including low- and moderate-income neighborhoods. Federal regulators regularly assess the Banks’ recordsBusey Bank’s record of meeting the credit needs of its communities. Applications for additional acquisitions would be affected by the evaluation of each of theBusey Bank’s effectiveness in meeting theirits CRA requirements. In a joint statement responding to the COVID-19 pandemic, the bank regulatory agencies announced favorable CRA consideration for banks providing retail banking services and lending activities in their assessment areas, consistent with safe and sound banking practices, that are responsive to the needs of low- and moderate-income individuals, small businesses, and small farms affected by the pandemic. Those activities include waiving certain fees, easing restrictions on out-of-state and non-customer checks, expanding credit products, increasing credit limits for creditworthy borrowers, providing alternative service options, and offering prudent payment accommodations. The joint statement also provided favorable CRA consideration for certain pandemic-related community development activities.
Anti-Money Laundering
The USA PatriotPATRIOT Act, isthe Bank Secrecy Act and other similar laws are designed to deny terrorists and criminals the ability to obtain access to the U.S. financial system and hashave significant implications for FDIC-insured institutions brokers, dealers and other businesses involved in the transfer of money. The USA Patriot Act mandatesThese laws mandate financial services companies to have policies and procedures with respect to measures designed to address any or all of the following matters: (i) customer identification programs; (ii) money laundering; (iii) terrorist financing; (iv) identifying and reporting suspicious activities and currency transactions; (v) currency crimes; and (vi) cooperation between FDIC-insured institutions and law enforcement authorities.
Privacy and Cybersecurity
The Banks are subject to many U.S. federal and state laws and regulations governing requirements for maintaining policies and procedures to protect non-public confidential information of their customers. These laws require the Banks to periodically disclose their privacy policies and practices relating to sharing such information and permit consumers to opt out of their ability to share information with unaffiliated third parties under certain circumstances. They also impact the Banks’ ability to share certain information with affiliates and non-affiliates for marketing and/or non-marketing purposes, or to contact customers with marketing offers. In addition, the Banks are required to implement a comprehensive information security program that includes administrative, technical, and physical safeguards to ensure the security and confidentiality of customer records and information. These security and privacy policies and procedures, for the protection of personal and confidential information, are in effect across all businesses and geographic locations.
Concentrations in Commercial Real Estate
Concentration risk exists when FDIC-insured institutions deploy too many assets to any one industry or segment. A concentration in commercial real estateCRE is one example of regulatory concern. The interagency Concentrations in Commercial Real Estate Lending, Sound Risk Management Practices guidance (“CRE Guidance”)Guidance provides supervisory criteria, including the following numerical indicators, to assist bank examiners in identifying banks with potentially significant commercial real estateCRE loan concentrations that may warrant greater supervisory scrutiny: (i) commercial real estateCRE loans exceeding 300% of capital and increasing 50% or more in the preceding three years; or (ii) construction and land development loans exceeding 100% of capital. The CRE Guidance does not limit banks’ levels of commercial real estateCRE lending activities, but rather guides institutions in developing risk management practices and levels of capital that are commensurate with the level and nature of their commercial real estateCRE concentrations. On December 18, 2015, the federal banking agencies issued a statement to reinforce prudent risk-management practices related to CRE lending, having observed substantial growth in many CRE asset and lending markets, increased competitive pressures, rising CRE concentrations in banks, and an easing of CRE underwriting standards. The federalFederal bank agencies reminded FDIC-insured institutions to maintain
14
underwriting discipline and exercise prudent risk-management practices to identify, measure, monitor, and manage the risks arising from CRE lending. In addition, FDIC-insured institutions must maintain capital commensurate with the level and nature of their CRE concentration risk. As of December 31, 2018,2021, Busey Bank did not exceed these guidelines.
20
Consumer Financial Services
The historical structure of federal consumer protection regulation applicable to all providers of consumer financial products and services changed significantly on July 21, 2011, when the CFPB commenced operations to supervise and enforce consumer protection laws. The CFPB has broad rulemaking authority for a wide range of consumer protection laws that apply to all providers of consumer products and services, including the Banks,Busey Bank, as well as the authority to prohibit “unfair, deceptive or abusive” acts and practices. The CFPB has examination and enforcement authority over providers with more than $10$10.0 billion in assets, and that will includeassets. The CFPB is in the process of assuming supervisory authority over Busey Bank when its assets exceedin that amount. Inregard.
Because abuses in connection with residential mortgages were a significant factor contributing to the meantime, as long as the Banks are FDIC-insured institutions with $10 billion or less in assets, they will continue to be examinedfinancial crisis, many new rules issued by the CFPB and required by the Dodd-Frank Act addressed mortgage and mortgage-related products, their underwriting, origination, servicing, and sales. The Dodd-Frank Act significantly expanded underwriting requirements applicable bank regulators.to loans secured by 1-4 family residential real property, and augmented federal law combating predatory lending practices. In addition to numerous disclosure requirements, the Dodd-Frank Act imposed new standards for mortgage loan originations on all lenders, including banks and savings associations, in an effort to strongly encourage lenders to verify a borrower’s ability to repay, while also establishing a presumption of compliance for certain “qualified mortgages.” The CFPB has from time to time released additional rules as to qualified mortgages and the borrower’s ability to repay. The CFPB’s rules have not had a significant impact on the Banks’Bank’s operations, except for higher compliance costs.
Supervision and Regulation of Busey Risk Management
First Busey Risk Management, incorporated in Nevada, is a captive insurance company which insures against certain risks unique to the operations of the Company and its subsidiaries and for which insurance may not be currently available or economically feasible in today’s insurance marketplace. First Busey Risk Management is subject to regulations of the State of Nevada and periodic examinations by the Nevada Division of Insurance.
Executive Officers
Following is a description of the business experience for at least the past five years of our executive officers.
Van A. Dukeman.Mr. Dukeman, age 60,63, has served as a Director, Chief Executive Officer and President of First Busey since August 2007. Effective February 28, 2009 through March 31, 2010, Mr. Dukeman also served as the Chief Executive Officer and President of Busey Bank. Prior to August 2007, Mr. Dukeman served as a Director, Chief Executive Officer and President of Main Street Trust, Inc. (“Main Street Trust”)from May 1998 until its merger with First Busey.
Curt A. Anderson. Robin N. Elliott.Mr. Anderson,Elliott, age 63, currently serves as President of Busey Wealth Management, a division of Busey Bank. Prior to that appointment, he had served as45, was appointed President and Chief Executive Officer of Busey Wealth Management, Inc. from February 2016Bank in April 2019. Prior to October 2018 andthat, he served as Executive Vice President and Senior Managing Director at Busey Wealth Management, Inc. since 2007.
Robin N. Elliott. Mr. Elliott, age 42, was appointed Chief Operating Officer of First Busey insince February 2016. He continues to serve as2016 and Chief Financial Officer of First Busey which he has served since January 1, 2014, as the Company conducts a search to name a new Chief Financial Officer.2014. Mr. Elliott had previously served as Director of the Business Banking Group of Busey Bank since November 2011. Prior to that appointment, he had served as Director of Finance & Treasury since joining the organization in 2006.
Barbara J. Harrington. Mrs. Harrington,Jeffrey D. Jones. Mr. Jones, age 59,48, was appointed Chief Financial Officer of First Busey in July 2019. Prior to that, he was Co-Head of the US Depository Group and Head of Depository Investment Banking with Stephens, Inc., since 2015.
Monica L. Bowe. Ms. Bowe, age 48, has served as Chief Risk Officer of First Busey since March 2010, priorJanuary 2020. Prior to whichthat, she had served as Chief Financial OfficerSenior Director of First Busey since March 1999. She also served as Controller and Senior Vice President of Busey Bank from December 1994 to March 1999, and has served in various financial and accounting positions since joining the organization in 1991.
Howard F. Mooney II. Mr. Mooney, age 54, has served as President and Chief Executive Officer of FirsTech Inc., our payment processing subsidiary, since 2000. In addition, Mr. Mooney has served as Chief Information Officer of First Busey since January 1, 2014. Prior to our August 2007 merger, FirsTech wasOperational Risk Program Management at KeyBank, a subsidiary of Main Street Trust.KeyCorp headquartered in Cleveland, Ohio since 2015.
Robert F. Plecki, Jr. Mr. Plecki, age 58, has served as Chief Credit Officer of First Busey since March 2010. Mr. Plecki previously served as President & Chief Executive Officer of Busey Wealth Management, Inc. from October 2013 until February 2016 and Chief Operating Officer of First Busey from October 2012 until February 2016. Prior to March 2010, he had served as Executive Vice President of our southwest Florida market since early 2009. Prior to that he served as Executive Vice President of our Champaign-Urbana market following First Busey’s merger with Main Street Trust in 2007, and, prior to the merger, had served as President of Main Street Bank & Trust Retail Banking since 2004.
John J. Powers.Mr. Powers, age 63,66, has served as General Counsel of First Busey since December 2011. Prior to that, he was a shareholderstockholder of Meyer Capel, P.C., a law firm based in Champaign, Illinois, since 1998.
21
Amy L. Randolph.Mrs. Randolph, age 44,47, was appointed Chief of Staff in April 2017. Prior to that appointment she served as Executive Vice President and Chief Brand Officer since March 2014. Prior to March 2014, she served as Senior Vice President of Growth Strategies since 2008.
Christopher M. Shroyer. Mr. Shroyer, age 53, has served as PresidentHuman Capital
First Busey was built upon a strong commitment to associate, customer, stockholder, and Chief Executive Officercommunity experiences. Our associates are the cornerstone of this unwavering commitment. Busey’s vision, Service Excellence in Everything We Do, starts with dedication to our associates. We are deeply humbled to be consistently recognized nationally and locally throughout our footprint for this steadfastness. Busey Bank has been named among America’s Best Banks by Forbes magazine. Ranked 52nd overall on the 2022 list, Busey was the top-ranked bank headquartered in Illinois, and only three other Illinois-based banks were included. The organization has also been named among American Banker’s Best Banks to Work For since March 2010, prior2016; voted as one of the Best Places to which he had servedWork in Illinois since 2016; recognized as Executive Vice Presidentone of the 2018 & 2019 Top Workplaces in St. Louis; recognized as a Best Company to Work For in Florida since 2017; recognized among the Best Places to Work in Money Management since 2018 by Pensions & Investments; and recognized as a Best Place to Work in Indiana by the Indiana Chamber of Commerce since 2019 – all in addition to various wellness, training and development, philanthropic and other workplace awards. From exceeding the needs of customers and colleagues to serving our communities selflessly, our associates show unmatched dedication to Busey. Their shared experiences are what make these and other awards possible. Since we opened our doors over 150 years ago, we have maintained our core values, creating a strong foundation and shaping our inclusive culture.
First Busey remains committed to bringing diversity and inclusion to our organization, the banking profession, and the communities where we live and work. Busey is dedicated to attracting and retaining talent across a variety of backgrounds and experiences. A diverse team – one with varying beliefs and opinions – promotes productivity, creativity, and innovation, while better meeting and exceeding the needs of a diverse customer base. Recruiting, supporting, and retaining a diversified workforce with varying perspectives and ideas, while having an inclusive culture, is the foundation of our East Region since early 2009. Priorcore values – One Busey. We strive to 2009, he servedmaintain an inclusive environment free from discrimination of any kind. Busey recognizes the richness diversity brings to our workplace. Our endeavors in this regard are reported to the Employee Benefit and Compensation Committee, which holds the organization accountable to this core value at the highest levels of management. We maintain an Affirmative Action Plan, the results of which – including proactive steps for inclusion – are reviewed by this same group. Busey supports and empowers women in the workplace as reflected in our gender-diverse workforce. In 2021, women comprised of 59% of Team Busey and made up 26% of our senior leadership, providing meaningful contributions not only within the organization but throughout the communities we serve.
Associate engagement is an important barometer of our cultural health. We regularly solicit feedback and understand views of our associates about their work environment and Busey’s culture. The results from engagement surveys are used to implement programs and processes designed to enhance engagement and improve the associate experience. One such way to keep associates informed and engaged is through our quarterly update calls, which are conducted by Busey leadership. The recordings are available for all associates. These calls provide important information about the financial health of the company, but more importantly they provide a cultural touchpoint to solidify Busey’s commitment to our number one asset – our associates. A tenet of our engaged culture is a commitment to investing in associates through unique, award-winning training and development programs. In 2021, 51% of our associate base engaged in talent and leadership development programs. As a result of these programs, 49% of Busey’s open roles were filled internally during 2021 by associates who were promoted or who transferred to new roles. Since 2017, Busey has been a proud recipient of the Association for Talent Development’s BEST Award, which is presented to organizations that demonstrate enterprise-wide success as a result of employee talent development.
Additionally, we care about the health and wellbeing of our associates and their families, as evidenced in the 97% participation rate in our innovative health and wellness program, B Well. Investments in B Well include a stress management component, lifesaving biometric screenings, a corporate health and wellness coach, health club reimbursements, and Health Savings Account (HSA) investments funded by the Company. Busey is honored to be recognized among the 2021 Illinois' Healthiest Employers, presented by Cigna and Crain’s Content Studio.
1522
as Executive Vice President of our Decatur market following First Busey’s merger with Main Street Trust in 2007, and, prior to the merger, had served as Executive Vice President of Main Street Bank & Trust Commercial Banking since 2004.
Employees
As of December 31, 2018,2021, First Busey and itsour subsidiaries had a total of 1,270 employees (full-time equivalents).1,463 full-time equivalents.
Geographic distribution of our associates is as follows:
| | | | | | | | | | | | | | | | |
| | As of December 31, 2021 | | |||||||||||||
| | | | | Associates | | ||||||||||
| | Locations | | Full-time | | Part-time | | Total | | % | | |||||
Banking center associates by location | | | | | | | | | | | | | | | | |
Illinois | | | 46 | | | 776 | | | 48 | | | 824 | | | 55.0 | % |
Missouri | | | 8 | | | 143 | | | 3 | | | 146 | | | 9.7 | % |
Florida | | | 3 | | | 62 | | | — | | | 62 | | | 4.1 | % |
Indiana | | | 1 | | | 17 | | | 1 | | | 18 | | | 1.2 | % |
Banking center associates | | | 58 | | | 998 | | | 52 | | | 1,050 | | | 70.0 | % |
Corporate office associates (1) | | | | | | 429 | | | 20 | | | 449 | | | 30.0 | % |
Total number of associates | | | | | | 1,427 | | | 72 | | | 1,499 | | | 100.0 | % |
Percentage of associates | | | | | | 95.2 | % | | 4.8 | % | | | | | | |
| (1) | Corporate office associates work at our corporate headquarters in Illinois, in various banking centers, and remotely. |
Securities and Exchange Commission Reporting and Other Information
First Busey’s website address is www.busey.com. We make available on this website our Annual Report on Form 10-K, quarterly reports on Form 10-Q, current reports on Form 8-K,Reports, Quarterly Reports, Current Reports, and any amendments thereto, as soon as reasonably practicable after such reports are filed or furnished with the SEC, and in any event, on the same day as such filing with the SEC. Reference to this website does not constitute incorporation by reference of the information contained on the website and it should not be considered part of this document.
First Busey has adopted a code of ethics applicable to our employees, officers, and directors. The text of this code of ethics may be found under “Investor Relations” on our website.
Non-GAAP Financial Information
This Annual Report on Form 10-K contains certain financial information determined by methods other than in accordance with U.S. Generally Accepted Accounting Principles (“GAAP”).GAAP. These measures include pre-provision net revenue, adjusted pre-provision net revenue, pre-provision net revenue to average assets, adjusted pre-provision net revenue to average assets, adjusted net income, adjusted diluted earnings per share, adjusted return on average assets, adjusted net interest income, adjusted net interest margin, adjusted noninterest income, adjusted noninterest expense, efficiency ratio, adjusted efficiency ratio, tangible common equity, tangible common equity to tangible assets, tangible book value per common share, and return on average tangible common equity. Management uses these non-GAAP measures, together with the related GAAP measures, to analyze the Company’s performance and to make business decisions. Management also uses these measures for peer comparisons.
A reconciliation to what management believes to be the most direct compared GAAP financial measures, specifically total net interest income in the case of pre-provision net revenue, adjusted pre-provision net revenue, pre-provision net revenue to average assets, and adjusted pre-provision net revenue to average assets; net income in the case of adjusted net income, adjusted diluted earnings per share, and adjusted return on average assets,assets; total net interest income in the case of adjusted net interest margin; total non-interestnoninterest income and total non-interestnoninterest expense in the case of adjusted noninterest expense, efficiency ratio, and adjusted efficiency ratio; and total stockholders’ equity in the case of thetangible common equity, tangible common equity to tangible assets, tangible book value per common share, and return on average tangible common equity, appears below (dollars in thousands, except per share data).below. The Company believes each of the adjusted measures isare useful for investors and management to understand the effects of certain non-recurring non-interestnoninterest items and providesprovide additional perspective on the Company’s performance over time as well as comparison to the Company’s peers.
These non-GAAP disclosures have inherent limitations and are not audited. They should not be considered in isolation or as a substitute for the results reported in accordance with GAAP, nor are they necessarily comparable to non-GAAP performance measures that may be presented by other companies. Tax effected numbers included in these non-GAAP disclosures are based on estimated statutory rates.rates and effective rates as appropriate.
Reconciliation of Non-GAAP Financial Measures — Adjusted Net Income and Return on Average Assets
|
|
|
|
|
|
|
|
|
| December 31, |
| December 31, |
| ||
|
| 2018 |
| 2017 |
| ||
Net income |
| $ | 98,928 |
| $ | 62,726 |
|
Acquisition expenses |
|
|
|
|
|
|
|
Salaries, wages, and employee benefits |
|
| 1,233 |
|
| 840 |
|
Data processing |
|
| 406 |
|
| 2,616 |
|
Other (includes professional and legal) |
|
| 2,486 |
|
| 3,617 |
|
Other restructuring costs |
|
|
|
|
|
|
|
Salaries, wages, and employee benefits |
|
| 1,058 |
|
| 711 |
|
Fixed asset impairments |
|
| 817 |
|
| — |
|
Other |
|
| — |
|
| 66 |
|
Related tax benefit |
|
| (1,451) |
|
| (3,012) |
|
Tax Cuts and Jobs Act (the “TCJA”) related adjustment |
|
| — |
|
| 8,098 |
|
Adjusted net income |
| $ | 103,477 |
| $ | 75,662 |
|
|
|
|
|
|
|
|
|
Average assets |
| $ | 7,742,142 |
| $ | 6,294,105 |
|
|
|
|
|
|
|
|
|
Reported: Return on average assets |
|
| 1.28 | % |
| 1.00 | % |
Adjusted: Return on average assets |
|
| 1.34 | % |
| 1.20 | % |
1623
RECONCILIATION OF NON-GAAP FINANCIAL MEASURES (unaudited)
Pre-Provision Net Revenue, Adjusted Pre-Provision Net Revenue,
Reconciliation of Non-GAAP Financial Measures —Pre-Provision Net Revenue to Average Assets, and Adjusted Pre-Provision Net Interest MarginRevenue to Average Assets(dollars in thousands)
|
|
|
|
|
|
|
|
|
|
| Year Ended |
| |||||||
| December 31, |
| December 31, |
| December 31, |
| |||
| 2018 |
| 2017 |
| 2016 |
| |||
|
|
|
|
|
|
|
|
|
|
Reported: Net interest income | $ | 241,406 |
| $ | 203,366 |
| $ | 154,660 |
|
Tax-equivalent adjustment |
| 2,258 |
|
| 3,656 |
|
| 3,493 |
|
Less: Purchase accounting accretion |
| (10,550) |
|
| (12,458) |
|
| (8,123) |
|
Adjusted: Net interest income | $ | 233,114 |
| $ | 194,564 |
| $ | 150,030 |
|
|
|
|
|
|
|
|
|
|
|
Average interest-earning assets | $ | 7,067,710 |
| $ | 5,784,408 |
| $ | 4,630,768 |
|
|
|
|
|
|
|
|
|
|
|
Reported: Net interest margin |
| 3.45 | % |
| 3.58 | % |
| 3.42 | % |
Adjusted: Net Interest margin |
| 3.30 | % |
| 3.36 | % |
| 3.24 | % |
| | | | | | | | | | |
| | | | | | | | | | |
| | Years Ended December 31, |
| |||||||
|
| 2021 |
| 2020 |
| 2019 |
| |||
Pre-provision net revenue | | | | | | | | | | |
Net interest income | | $ | 270,698 | | $ | 282,935 | | $ | 287,223 | |
Noninterest income | | | 132,804 | | | 118,265 | | | 116,415 | |
Less net (gains) losses on sales of securities and unrealized (gains) losses recognized on equity securities | |
| (3,070) | |
| (1,331) | |
| 18 | |
Noninterest expense | |
| (261,780) | |
| (234,197) | |
| (258,794) | |
Total pre-provision net revenue | | $ | 138,652 | | $ | 165,672 | | $ | 144,862 | |
| | | | | | | | | | |
Adjustments to pre-provision net revenue | | | | | | | | |||
Acquisition and other restructuring expenses | | | 17,351 | | | 10,711 | | | 20,094 | |
Provision for unfunded commitments | | | (774) | | | 1,822 | | | — | |
Amortization of NMTC | | | 5,563 | | | 2,311 | | | 1,200 | |
Adjusted pre-provision net revenue | | $ | 160,792 | | $ | 180,516 | | $ | 166,156 | |
| | | | | | | | | | |
Average total assets | | $ | 11,904,935 | | $ | 10,292,256 | | $ | 9,443,690 | |
| | | | | | | | | | |
Reported: Pre-provision net revenue to average asset | |
| 1.16 | % |
| 1.61 | % |
| 1.53 | % |
Adjusted: Pre-provision net revenue to average assets | | | 1.35 | % | | 1.75 | % | | 1.76 | % |
Reconciliation of Non-GAAP Financial Measures — Adjusted Efficiency Ratio
|
|
|
|
|
|
|
|
|
| Year Ended |
| ||||
|
|
| December 31, |
|
| December 31, |
|
|
| 2018 |
| 2017 |
| ||
Reported: Net Interest income |
| $ | 241,406 |
| $ | 203,366 |
|
Tax-equivalent adjustment |
|
| 2,258 |
|
| 3,656 |
|
Tax equivalent interest income |
| $ | 243,664 |
| $ | 207,022 |
|
|
|
|
|
|
|
|
|
Reported: Non-interest income |
|
| 89,993 |
|
| 84,474 |
|
Less: Security gains, net |
|
| 331 |
|
| 1,143 |
|
Adjusted: Non-interest income |
| $ | 89,662 |
| $ | 83,331 |
|
|
|
|
|
|
|
|
|
Reported: Non-interest expense |
|
| 193,043 |
|
| 174,426 |
|
Less: |
|
|
|
|
|
|
|
Amortization of intangible assets |
|
| (5,854) |
|
| (5,245) |
|
Non-operating adjustments: |
|
|
|
|
|
|
|
Salaries, wages, and employee benefits |
|
| (2,291) |
|
| (1,551) |
|
Data processing |
|
| (406) |
|
| (2,616) |
|
Other |
|
| (2,858) |
|
| (3,683) |
|
Adjusted: Non-interest expense |
| $ | 181,634 |
| $ | 161,331 |
|
|
|
|
|
|
|
|
|
Reported: Efficiency ratio |
|
| 56.16 | % |
| 58.27 | % |
Adjusted: Efficiency ratio |
|
| 54.49 | % |
| 55.56 | % |
1724
RECONCILIATION OF NON-GAAP FINANCIAL MEASURES (unaudited)
Adjusted Net Income, Adjusted Diluted Earnings Per Share, and
Adjusted Return on Average Assets
(dollars in thousands, except per share amounts)
| | | | | | | | | | |
| | | | | | | | | | |
| | Years Ended December 31, |
| |||||||
|
| 2021 |
| 2020 |
| 2019 |
| |||
Net income | | $ | 123,449 | | $ | 100,344 | | $ | 102,953 | |
| | | | | | | | | | |
Adjustments to net income | | | | | | | | | | |
Acquisition expenses: | |
|
| |
|
| |
|
| |
Salaries, wages, and employee benefits | |
| 7,347 | |
| — | |
| 4,083 | |
Data processing | |
| 3,700 | |
| 56 | |
| 1,523 | |
Lease or fixed asset impairment | |
| — | |
| 479 | |
| 580 | |
Professional fees, occupancy, and other | | | 2,599 | | | 864 | | | 8,477 | |
Other restructuring costs: | |
|
| |
|
| |
|
| |
Salaries, wages, and employee benefits | |
| 472 | |
| 2,470 | |
| 495 | |
Data processing | | | — | | | — | | | 827 | |
Lease or fixed asset impairment | | | 3,227 | | | 6,657 | | | 1,861 | |
Professional fees, occupancy, and other | |
| 6 | |
| 185 | |
| 2,248 | |
Related tax benefit | | | (3,692) | | | (2,327) | | | (4,618) | |
Adjusted net income | | $ | 137,108 | | $ | 108,728 | | $ | 118,429 | |
| | | | | | | | | | |
Dilutive average common shares outstanding | | | 56,008,805 | | | 54,826,939 | | | 55,132,494 | |
| | | | | | | | | | |
Reported: Diluted earnings per share | | $ | 2.20 | | $ | 1.83 | | $ | 1.87 | |
Adjusted: Diluted earnings per share | | | 2.45 | | | 1.98 | | | 2.15 | |
| | | | | | | | | | |
Average total assets | | $ | 11,904,935 | | $ | 10,292,256 | | $ | 9,443,690 | |
| | | | | | | | | | |
Reported: Return on average assets | |
| 1.04 | % |
| 0.97 | % |
| 1.09 | % |
Adjusted: Return on average assets | |
| 1.15 | % |
| 1.06 | % |
| 1.25 | % |
25
ReconciliationRECONCILIATION OF NON-GAAP FINANCIAL MEASURES (unaudited)
Adjusted Net Interest Margin
(dollars in thousands)
| | | | | | | | | | |
| | | | | | | | | | |
|
| Years Ended December 31, |
| |||||||
| | 2021 |
| 2020 |
| 2019 |
| |||
Net interest income | | $ | 270,698 | | $ | 282,935 | | $ | 287,223 | |
| | | | | | | | | | |
Adjustments to net interest income | | | | | | | | | | |
Tax-equivalent adjustment | |
| 2,355 | |
| 2,740 | |
| 3,013 | |
Acquisition-related purchase accounting accretion | |
| (7,151) | |
| (10,391) | |
| (12,422) | |
Adjusted net interest income | | $ | 265,902 | | $ | 275,284 | | $ | 277,814 | |
| | | | | | | | | | |
Average interest-earning assets | | $ | 10,978,116 | | $ | 9,417,938 | | $ | 8,590,262 | |
| | | | | | | | | | |
Reported: Net interest margin | |
| 2.49 | % |
| 3.03 | % |
| 3.38 | % |
Adjusted: Net Interest margin | | | 2.42 | % | | 2.92 | % | | 3.23 | % |
26
Table of Non-GAAP Financial Measures —Contents
RECONCILIATION OF NON-GAAP FINANCIAL MEASURES (unaudited)
Adjusted Noninterest Expense, Efficiency Ratio, and Adjusted Efficiency Ratio
(dollars in thousands)
| | | | | | | | | | |
| | | | | | | | | | |
| | Years Ended December 31, |
| |||||||
|
| 2021 |
| 2020 |
| 2019 |
| |||
Net interest income | | $ | 270,698 | | $ | 282,935 | | $ | 287,223 | |
Tax-equivalent adjustment | | | 2,355 | | | 2,740 | | | 3,013 | |
Tax-equivalent interest income | | $ | 273,053 | | $ | 285,675 | | $ | 290,236 | |
| | | | | | | | | | |
Noninterest income | |
| 132,804 | |
| 118,265 | |
| 116,415 | |
Less net (gains) losses on sales of securities and unrealized (gains) losses recognized on equity securities | |
| (3,070) | |
| (1,331) | |
| 18 | |
Adjusted noninterest income | | $ | 129,734 | | $ | 116,934 | | $ | 116,433 | |
| | | | | | | | | | |
Noninterest expense | |
| 261,780 | |
| 234,197 | |
| 258,794 | |
Amortization of intangible assets | |
| (11,274) | |
| (10,008) | |
| (9,547) | |
Non-operating adjustments: | |
|
| |
|
| |
|
| |
Salaries, wages, and employee benefits | |
| (7,819) | |
| (2,470) | |
| (4,578) | |
Data processing | |
| (3,700) | |
| (56) | |
| (2,350) | |
Lease or fixed asset impairment | | | (3,227) | | | (7,136) | | | (2,441) | |
Professional fees and other | |
| (2,605) | |
| (1,049) | |
| (10,725) | |
Adjusted noninterest expense | | $ | 233,155 | | $ | 213,478 | | $ | 229,153 | |
| | | | | | | | | | |
Reported: Efficiency ratio (1) | |
| 62.19 | % |
| 55.68 | % |
| 61.29 | % |
Adjusted: Efficiency ratio (2) | |
| 57.89 | % |
| 53.02 | % |
| 56.35 | % |
| (1) | Calculated as total noninterest expense, less amortization charges, as a percentage of tax-equivalent net interest income, plus noninterest income, less security gains and losses. |
| (2) | Calculated as adjusted noninterest expense, as a percentage of tax-equivalent net interest income plus noninterest income, less security gains and losses. |
27
RECONCILIATION OF NON-GAAP FINANCIAL MEASURES (unaudited)
Tangible Common Equity, Tangible Common Equity to Tangible Assets,
Tangible Book Value perPer Common Share, Return on Average Tangible Common Equity
(dollars in thousands, except per share amounts)
| | | | | | | |
| | | | | | | |
|
| As of December 31, |
| ||||
|
| 2021 |
| 2020 |
| ||
Total assets | | $ | 12,859,689 | | $ | 10,544,047 | |
Goodwill and other intangible assets, net | |
| (375,924) | |
| (363,521) | |
Tax effect of other intangible assets, net | |
| 16,254 | |
| 14,556 | |
Tangible assets | | $ | 12,500,019 | | $ | 10,195,082 | |
| | | | | | | |
Total stockholders’ equity | |
| 1,319,112 | |
| 1,270,069 | |
Goodwill and other intangible assets, net | |
| (375,924) | |
| (363,521) | |
Tax effect of other intangible assets, net | |
| 16,254 | |
| 14,556 | |
Tangible common equity | | $ | 959,442 | | $ | 921,104 | |
| | | | | | | |
Ending number of common shares outstanding | | | 55,434,910 | | | 54,404,379 | |
| | | | | | | |
Tangible common equity to tangible assets (1) | |
| 7.68 | % |
| 9.03 | % |
Tangible book value per share | | $ | 17.01 | | $ | 16.66 | |
| | | | | | | |
Average common equity | | $ | 1,324,862 | | $ | 1,240,374 | |
Average goodwill and other intangible assets, net | |
| (372,593) | |
| (368,624) | |
Average tangible common equity | | $ | 952,269 | | $ | 871,750 | |
| | | | | | | |
Reported: Return on average tangible common equity | |
| 12.96 | % |
| 11.51 | % |
Adjusted: Return on average tangible common equity (2) | |
| 14.40 | % |
| 12.47 | % |
|
|
|
|
|
|
|
|
|
| As of |
| ||||
|
| December 31, |
| December 31, |
| ||
|
| 2018 |
| 2017 |
| ||
|
|
|
|
|
|
|
|
Total Assets |
| $ | 7,702,357 |
| $ | 7,860,640 |
|
Less: |
|
|
|
|
|
|
|
Goodwill and other intangible assets, net |
|
| (300,558) |
|
| (308,073) |
|
Tax effect of other intangible assets, net |
|
| 8,547 |
|
| 11,039 |
|
Tangible assets |
| $ | 7,410,346 |
| $ | 7,563,606 |
|
|
|
|
|
|
|
|
|
Total stockholders’ equity |
|
| 994,964 |
|
| 935,003 |
|
Less: |
|
|
|
|
|
|
|
Goodwill and other intangible assets, net |
|
| (300,558) |
|
| (308,073) |
|
Tax effect of other intangible assets, net |
|
| 8,547 |
|
| 11,039 |
|
Tangible common equity |
| $ | 702,953 |
| $ | 637,969 |
|
|
|
|
|
|
|
|
|
Tangible common equity to tangible assets(1) |
|
| 9.49 | % |
| 8.43 | % |
Tangible book value per share |
| $ | 14.21 |
| $ | 12.88 |
|
|
|
|
|
|
|
|
|
Average stockholders’ common equity |
| $ | 954,949 |
| $ | 739,825 |
|
Less: Average goodwill and other intangible assets, net |
|
| (303,917) |
|
| (199,419) |
|
Average tangible stockholders’ common equity |
| $ | 651,032 |
| $ | 540,406 |
|
|
|
|
|
|
|
|
|
Reported: Return on average tangible common equity |
|
| 15.20 | % |
| 11.61 | % |
Adjusted: Return on average tangible common equity(2) |
|
| 15.89 | % |
| 14.00 | % |
(1) | Tax effected |
(2) | Calculated using adjusted net |
1828
Special Cautionary Note Regarding Forward-Looking Statements
Statements contained in or incorporated by reference into this Annual Report on Form 10-K that are not historical facts may constitute forward-looking statements within the meaning of Section 27A of the Securities Act, of 1933, as amended (the “Securities Act”), and Section 21E of the Exchange Act. These forward-looking statements are covered by the safe harbor provisions for forward-looking statements contained in the Private Securities Litigation Reform Act of 1995. These statements, which are based on certain assumptions and estimates and describe our future plans, strategies, and expectations, can generally be identified by the use of the words “may,” “will,” “should,” “could,” “would,” “goal,” “plan,” “potential,” “estimate,” “project,” “believe,” “intend,” “anticipate,” “expect,” “target,” “aim” and similar expressions. These forward-looking statements include statements relating to our projected growth, anticipated future financial performance, financial condition, credit quality, and management’s long-term performance goals, as well as statements relating to the anticipated effects on results of operations and financial condition from expected developments or events, our business and growth strategies, and any other statements that are not historical facts.
These forward-looking statements are subject to significant risks, assumptions, and uncertainties, and could be affected by many factors. Factors that could have a material adverse effect on our financial condition, results of operations, and future prospects can be found under “Item 1A “Risk Factors”1A. Risk Factors” in this Annual Report on Form 10-K and elsewhere in our periodic and current reports filed with the SEC. These factors include, but are not limited to, the following:
| the strength of the local, state, national, and international |
| ● | the economic impact of any future terrorist threats or attacks, widespread disease or pandemics (including the |
| changes in state and federal laws, regulations, and governmental policies concerning First Busey’s general business; |
| changes in interest rates and prepayment rates of First Busey’s |
| increased competition in the financial services sector and the inability to attract new customers; |
| changes in technology and the ability to develop and maintain secure and reliable electronic systems; |
| the loss of key executives or |
| changes in consumer spending; |
| unexpected results of current and/or future acquisitions, which may include failure to realize the anticipated benefits of |
| unexpected outcomes of existing or new litigation involving First Busey; |
|
|
| the economic impact of exceptional weather occurrences such as tornadoes, hurricanes, floods, and |
| changes in accounting policies and practices; and |
| other factors and risks described under |
Because of those risks and other uncertainties, our actual future results, performance, or achievement, or industry results, may be materially different from the results indicated by these forward-looking statements. In addition, our past results of operations are not necessarily indicative of our future results.
You should not place undue reliance on any forward-looking statements, which speak only as of the dates on which they were made. We are not undertaking an obligation to update these forward-looking statements, even though circumstances may change in the future, except as required under federal securities law. We qualify all of our forward-looking statements by these cautionary statements.
29
ITEM 1A. RISK FACTORS
This section highlights the risks management believes could adversely affect our financial performance. Additional possible risks that could affect the Company adversely and cannot be predicted may arise at any time. Other risks that are immaterial at this time may also have an adverse impact on our future financial condition.
Economic and Market Risks
The COVID-19 pandemic continues to create disruptions that affect our business, financial condition, liquidity, and results of operations.
The extent to which COVID-19 will continue to affect business operations, financial condition, credit quality, and results of operations will depend on future developments that cannot be predicted, including the duration and scope of the pandemic. The direct or indirect impact on employees, customers, counterparties, and service providers, as well as other market participants, is likely to continue through 2022 as the world attempts to gain control over the virus and emerging variants. The impact that the virus continues to have on global markets, the economy, business restrictions, and employment is ongoing as a projected return to pre-pandemic operating conditions is unknown.
In the past year, the U.S. economy began to rebound from severe disruptions caused by the onset of the pandemic in March 2020. Economic conditions have begun to normalize with the availability of vaccines and treatments, increasing workforce employment and participation, the lessening of business and education restrictions, and demand for services beginning to return. The financial conditions of households and businesses was bolstered significantly by government stimulus, which contributed to the economic recovery but also brought about growing pains as evidenced by supply chain problems and rising prices. Although current economic conditions are more favorable than the prior year, the outlook for continued growth is characterized by elevated uncertainty with potential for unevenness across markets and sectors. Although household and business credit and liquidity is strong currently, further pandemic-related disruptions could result in increased risk of delinquencies, defaults, foreclosures, and losses on our loans; declines in assets under management, affecting wealth management revenues; negative impacts on regional economic conditions resulting in declines in local loan demand, liquidity of loan guarantors, loan collateral (particularly in real estate), loan originations, and deposit availability; and impacts on the implementation of our growth strategy. While the recovery this past year has been strong, the pace of growth in the U.S. and globally could decline as a result of rising inflation, higher interest rates, the pervasiveness of supply chain challenges across industries, and the persistence of the virus in variant forms.
Overall, we believe that the economic impact from COVID-19 will continue for some time and could have a material and adverse impact on our business and result in significant losses in our loan portfolio, all of which would adversely and materially impact our earnings and capital. Even after the COVID-19 pandemic has subsided, we may continue to experience materially adverse impacts to our business as a result of the global economic impact of the COVID-19 pandemic, including the availability of credit, adverse impacts on liquidity, and any recession that has occurred or may occur in the future. There are no comparable recent events that provide guidance as to the effect the spread of COVID-19 as a global pandemic may have, nor are there historical indicators to rely on in terms of how markets will react, and as a result, the ultimate impact of the pandemic is highly uncertain and subject to change.
Conditions in the financial market and economic conditions, including conditions in the states in which it operates, generally may adversely affect the Company’s business.
The Company’s general financial performance is highly dependent upon the business environment in the markets where it operates and, in particular, the ability of borrowers to pay interest on and repay principal of outstanding loans and value of collateral securing those loans, as well as demand for loans and other products and services it offers. A favorable business environment is generally characterized by, among other factors, economic growth, efficient capital markets, low inflation, low unemployment, high business and investor confidence, and strong business earnings. Unfavorable or uncertain economic and market conditions can be caused by
19
declines in economic growth, business activity or investor or business confidence; limitations on the availability or increases in the cost of credit and capital; increases in inflation or interest rates; high unemployment, natural disasters, or a combination of these or other factors.
While economic conditions have both improved and stabilized since the 2008-2009 recession, there can be no assurance that either improvement or stability will continue. Uncertainty regarding continuing economic conditions may result in changes in consumer and business spending, borrowing, and savings habits. Such conditions could adversely affect the credit quality30
The Company’s financial performance is also affected by the condition of the markets in which it conducts business. The Company currently conducts its banking operations in downstate Illinois, the Southwest suburbs ofIllinois; suburban Chicago, Illinois,Illinois; the St. Louis, Missouri metropolitan area,area; central IndianaIndiana; and southwest Florida. Economic conditions within Busey’s markets were adversely impacted by the COVID-19 pandemic, and although conditions have improved this past year, elevated unemployment, economic decline, on-going business restrictions and operational uncertainty continue to impact the markets overall, and in particular, certain industry sectors. The financial condition of the State of Illinois, in which the largest portion of the Company’s customer base resides, is characterized with low credit ratings, pension under-funding, budget deficits, and lower job growth rates than most of the country.country; furthermore, Illinois was one of three states in the country to lose population in the last decade. Notably, with the recent improvement in the state’s financial outlook, during the second half of 2021 Illinois received improved ratings from Moody’s Investor Service, S&P Global Ratings, and Fitch. The Company operates in markets with significant university and healthcare presence, which rely heavily on state and federal funding and contracts. Payment delays by the State of Illinois to its vendors and government-sponsored entities, as well as potential federal changes to healthcare laws, could affect the Company’s primary market areas, which could in turn adversely affect its financial condition and results of operations. DownturnsThe partial shutdown of colleges and universities across the state may also impact businesses heavily reliant on the colleges and universities for revenue generation. Recent downturns in local operating markets where banking operations occur could result in a decrease in demand for the Company’s products and services, an increase in loan delinquencies and defaults, high or increased levels of problem assets and foreclosures, and reduced wealth management fees resulting from lower asset values.
Market volatility and changes in interest rates could have an adverse effect on the Company.
In certain recent periods, the capital and credit markets experienced heightened volatility and disruption. In some cases, the markets produced downward pressure on stock prices and credit availability for certain issuers without regard to those issuers’ underlying financial condition or performance. Conversely, significant increases in the stock markets can also have destabilizing effects. If the capital and credit markets experience these heightened levels of disruption and volatility again, both the Company and its customers’ ability to maintain or access capital could be adversely affected which could have an impact on the Company’s business, financial condition and results of operations.
Changes in interest rates could affect the level of assets and liabilities held on the Company’s balance sheet and the revenue that the Company earns from net interest income, as earnings and profitability depend significantly on our net interest income. Net interest income represents the difference between interest income and fees earned on interest-earning assets, such as loans and investment securities, and interest expense incurred on interest-bearing liabilities, such as deposits and borrowed funds. Interest rates are sensitive to many factors that are beyond the Company’s control, including general economic conditions and policies of various governmental and regulatory agencies, including the Federal Open Market Committee.FOMC. Changes in monetary policy, including changes in interest rates, could influence not only the interest the Company receives on loans and investment securities and the amount of interest it pays on deposits and borrowings, but such changes could also affect the Company’s ability to originate loans and obtain deposits and the fair value of the Company’s financial assets and liabilities. In addition, a rise in interest rates could result in decreased demand for first mortgages as well as mortgage refinancing, activities which have historically contributed to a significant portion of the Company’s mortgage revenue. Furthermore, if the interest rates paid on deposits and other borrowings increase at a faster rate than the interest rates received on loans and investment securities, the Company’s net interest income, and therefore earnings, could be adversely affected. Earnings could also be adversely affected if the interest rates received on loans and other investments fall more quickly than the interest rates paid on deposits and other borrowings. Finally, when interest rates rise, competition for deposits often increases, which can lead to a change in the Company’s funding mix and cost of funding. Any substantial, unexpected, prolonged change in market interest rates could have a material adverse effect on the Company’s business, financial condition, and results of operations.
In March 2020, the Federal Reserve reduced the target federal funds rate and announced a $700.0 billion quantitative easing program in response to the expected economic downturn caused by the COVID-19 pandemic and reduced the interest it pays on excess reserves. The prolonged reduction in interest rates is likely to continue to have an adverse effect on our net interest income and margins and our profitability. The impact of the prolonged low rates will also continue to affect rate spreads and return on earning assets.
The Company’s wealth management business may also be negatively impacted by changes in general economic conditions and the conditions in the financial and securities markets, which could affect the values of assets held under care. Management contracts generally provide for fees payable for wealth management services based on the market value of assets under care. Because most of the Company’s contracts provide for a fee based on market values of securities, declines in securities prices may have an adverse effect on the Company’s results of operations from this business. Market declines and reductions in the value of customers'customers’ wealth management accounts, could also result in the loss of wealth management customers, including those who are also banking customers.
2031
The Federal Reserve has signaled that it will begin to increase rates, taper its quantitative easing program, and reduce its balance sheet of bonds and other assets in 2022, but will do so with the goal of avoiding abrupt or unpredictable changes in economic or financial conditions so as not to disrupt the financial systems, also known as “shocks;” despite this, the impact of these changes cannot be certain. Vulnerabilities in the financial system can amplify the impact of an initial shock following rate increases, potentially leading to unintended volatility, as well to disruptions in the provision of financial services, such as clearing payments, the provision of liquidity, and the availability of credit. Furthermore, asset liquidation pressures can be amplified by liquidity mismatches and the leverage of certain nonbank financial intermediaries such as hedge funds. The financial crisis in March 2020 also demonstrated that pressures on dealer intermediation can limit the availability of liquidity during times of market stress. Given the interconnectedness of the global financial system, these vulnerabilities could impact the Company’s business operations and financial condition.
The transition to an alternative reference rate could cause instability and have a negative effect on financial market conditions.
The London Inter-bank Offered Rate (“LIBOR”)LIBOR represents the interest rate at which banks offer to lend funds to one another in the international interbank market for short-term loans. Beginning in 2008, concerns were expressed that some of the member banks surveyed by the British Bankers’ Association (the “BBA”) in connection with the calculation of LIBOR rates may have been under-reporting or otherwise manipulating the interbank lending rates applicable to them. Regulators and law enforcement agencies from a number of governments have conducted investigations relating to the calculation of LIBOR across a range of maturities and currencies. If manipulation of LIBOR or another inter-bank lending rate occurred, it may have resulted in that rate being artificially lower (or higher) than it otherwise would have been. Responsibility for the calculation of LIBOR was transferred to ICE Benchmark Administration Limited, as independent LIBOR administrator, effective February 1, 2014.
On July 27, 2017, the U.K.United Kingdom Financial Conduct Authority announced that it will no longer persuade or compel banks to submit rates for the calculation of LIBOR rates after 2021. End dates for LIBOR have now been set, and U.S. Regulators have issued guidance as of October 2021 (the “July 27th Announcement”).that urges market participants to address their existing LIBOR exposures and transition to robust and sustainable alternative rates by December 31, 2021. The July 27th Announcement indicatesAlternative Reference Rate Committee has proposed that SOFR is the continuation of LIBOR onrate that represents best practice as the current basis cannotalternative to U.S. dollar-LIBOR for use in derivatives and will not be guaranteed after 2021. Consequently, at this time, it is not possible to predict whether and to what extent banks will continue to provide LIBOR submissions to the administrator of LIBOR or whether any additional reformsother financial contracts that are currently indexed to LIBOR, may be enacted in the United Kingdom or elsewhere. Similarly, it is not possiblebut has also advised market participants to predict whether LIBOR will continue to be viewed as an acceptable benchmark, what rate or rates may become accepted alternatives to LIBOR or the effectconduct a comprehensive evaluation of any such changes in views or alternatives on the value of LIBOR-linked securities.
Although the Financial Stability Oversight Council has recommended a transition to an alternative reference rate in the event LIBOR is no longer available after 2021, such plans are still in development and, if enacted, could present challenges. Moreover, contractsrates being considered for use.
Contracts linked to LIBOR are vast in number and value, are intertwined with numerous financial products and services, and have diverse parties. TheAlthough the Company has actively worked to plan for the transition away from LIBOR, the transition is both complex and challenging and the downstream effect of unwinding or transitioning such contracts could cause instability and negatively impact the financial markets and individual institutions. The uncertainty surrounding the sustainability of LIBOR more generally could undermine market integrity and threaten individual financial institutions and the U.S. financial system more broadly.
The Company could recognize losses on securities held in its securities portfolio, particularly if interest rates increase or economic and market conditions deteriorate.
Factors beyondIf the Company’s control may significantly influence the fair valueselected alternative rate is based on a small transaction volume, it could be susceptible to volatility and disruption during times of securities in its portfolio and may cause potential adverse changes to the fair value of these securities. For example, fixed-rate securities acquired bymarket stress. Furthermore, if the Company are generally subjectfails to decreases inproperly address legacy contracts by adding robust fallback positions, it will be exposed to interest rate risks and potential loss of yields. Finally, if the Company or other market value when interestparticipants fail to properly plan to implement alternative rates rise. A change in the fair value of securities could cause an other-than-temporary impairment (“OTTI”) in future periods and result in realized losses.
The process for determining whether impairment is an OTTI usually requires difficult, subjective judgments about the future financial performance of the issuer and any collateral underlying the security in order to assess the probability of receiving all contractual principal and interest payments on the security. Because of changing economic and market conditions affecting interest rates, the financial condition of issuers of the securities and the performance of the underlying collateral, we may recognize realized and/or unrealized losses in future periods, whichother than LIBOR, it could have an adverse effect on the Company and the financial system as a whole. In 2021, we began the transition to SOFR and other interest rate benchmarks in anticipation of the cessation of the publication of LIBOR.
Continued elevated levels of inflation could adversely impact our financial conditionbusiness and results of operations.
Downgrades in the credit ratings of one or more insurers that provide credit enhancements for the Company’s state and municipal securities portfolio may have an adverse impact on the market for and valuation of these types of securities.
The Company investsU.S. has recently experienced elevated levels of inflation, with the consumer price index climbing approximately 7.0% in tax-exempt state2021. Continued levels of inflation could have complex effects on our business and local municipal securities,results of operations, some of which are insuredcould be materially adverse. For example, if interest rates were to rise in response to, or as a result of, elevated levels of inflation, the value of our securities portfolio would be negatively impacted. In addition, while we generally expect any inflation-related increases in our interest expense to be offset by monoline insurers. In recent years, severalincreases in our interest revenue, inflation-driven increases in our levels of these insurers have come under scrutiny by rating agencies. Even though management generally purchases municipal securities on the overall credit strengthnon-interest expense could negatively impact our results of the issuer, the reductionoperations. Continued elevated levels of inflation could also cause increased volatility and uncertainty in the credit rating of an insurer may negatively impact the market for and valuation of the Company’s investment securities. A downgrade or a default by an issuerbusiness environment, which could adversely affect the Company’s liquidity, financial conditionloan demand and results of operations.
Changes in U.S. trade policies, such as the implementation of tariffs, and other factors beyond the Company’s control may adversely impact our business, financial condition and results of operations.
In recent months, the U.S. government implemented tariffs on certain products, and certain countries or entities, such as Mexico, Canada, China and the European Union, have issued or continue to threaten retaliatory tariffs against products from the United States, including agricultural products. Additional tariffs and retaliatory tariffs may be imposed in the future by the United States and these and other countries. Tariffs, retaliatory tariffs or other trade restrictions on products and materials that our customers import or export, including among others, agricultural products, could cause the prices of our customers’ products to increase which could reduce demand for such products, or reduce our customer’s margins, and adversely impact their revenues, financial results andclients’ ability to service debt, which, in turn,repay indebtedness. It is also possible that governmental responses to the current inflation environment could adversely affect our financial conditionbusiness, such as changes to monetary and resultsfiscal policy that are too strict, or the imposition or threatened imposition of operations. In addition, toprice controls. The duration and severity of the extent changescurrent inflationary period cannot be estimated with precision.
2132
in the political environment have a negativeLabor shortages and failure to attract and retain qualified employees could negatively impact on us or on the markets in which we operate, our business, results of operations and financial conditioncondition.
A number of factors may adversely affect the labor force available to us or increase labor costs, including high employment levels, decreased labor force size and participation rates as a result of the COVID-19 pandemic, expanded unemployment benefits offered in response to the ongoing COVID-19 pandemic, and other government actions. Although we have not experienced any material labor shortage to date, we have recently observed an overall tightening and increasingly competitive local labor market. A sustained labor shortage or increased turnover rates within our employee base could lead to increased costs, such as increased compensation expense to attract and retain employees.
In addition, if we are unable to hire and retain employees capable of performing at a high-level, or if mitigation measures we may take to respond to a decrease in labor availability have unintended negative effects, our business could be materially and adversely impacted in the future.affected. An overall labor shortage, lack of skilled labor, increased turnover, or labor inflation, caused by COVID-19 or as a result of general macroeconomic factors, could have a material adverse impact on our operations, results of operations, liquidity, or cash flows.
Regulatory and Legal Risks
The financial services industry, as well as the broader economy, may be subject to new legislation, regulation, and government policy.
At this time, it is difficult to predict future legislativeLegislative and regulatory changes. Although both the President and senior members of Congress have advocated for and successfully passed some reductions of financial services regulation, exactly which regulatory changes will be pursuedactions taken now or in the future may increase our costs and impact our business, governance structure, financial condition, or results of operations.
Laws, regulations, rules, policies, and regulatory interpretations governing the Company continue to evolve and will likely continue to change over time as wellCongress and various regulatory agencies react to adverse economic conditions or other matters. The 2021 change of the presidential administration and Congressional control has prompted new or revitalized financial services regulation. The extent and scope of potential financial regulations is hard to predict, but continued changes are expected to occur as the timingleadership and extentpriorities in various regulatory bodies shifts.
Implementation of current or proposed regulatory or legislative changes that could be enacted, remains uncertain. New appointmentsto laws applicable to the Board of Governorsfinancial industry may impact the profitability of the Federal ReserveCompany’s business activities and may change certain business practices, including the ability to offer new products, obtain financing, attract deposits, make loans, achieve satisfactory interest spreads, and enter into acquisition and merger agreements, and could expose the Company to additional expense, including increased compliance costs. Appointments to the primary banking regulatory agencies affect monetary policy and interest rates, and changes in fiscal policy could affect broader patterns of trade and economic growth. FutureExecutive orders, future legislation, regulation, and government policy could affect the banking industry as a whole, including our business and results of operations, in ways that are difficult to predict. In addition, our results of operations also could be adversely affected by changes in the way in which existing statutes and regulations are interpreted or applied by courts and government agencies.
Legislative and regulatory reforms applicable to the financial services industry, as well as heightened focus on particular regulations, may have a significant impact on the Company’s business, financial condition and results of operations.
The laws, regulations, rules, policies and regulatory interpretations governing the Company continue to evolve and will likely continue to change over time as Congress and various regulatory agencies react to adverse economic conditions or other matters. The global financial crisis of 2008-2009 served as a catalyst for a number of significant changes in the financial services industry, including the Dodd-Frank Act, which reformed the regulation of financial institutions in a comprehensive manner, and the Basel III regulatory capital reforms, which increase both the amount and quality of capital that financial institutions must hold. The implementation of these provisions, as well as any other aspects of current or proposed regulatory or legislative changes to laws applicable to the financial industry, may impact the profitability of the Company’s business activities and may change certain business practices, including the ability to offer new products, obtain financing, attract deposits, make loans, and achieve satisfactory interest spreads, and could expose the Company to additional expense, including increased compliance costs.
These rule and regulatory changes may also require the Company to invest significant management attention and resources so as to make necessary changes to operations in order to comply. In addition to the expense and uncertainty related to increased regulation, the financial services industry in recent years has faced more intense scrutiny from regulatory agencies in the examination process and more aggressive enforcement of regulations on both the federal and state levels, particularly with respect to mortgage-related practicespractices; fee-based products and other consumer compliance matters, and compliance with the Bank Secrecy Act, anti-money laundering laws, and the PatriotUSA PATRIOT Act, which focuses on money laundering in the form of terrorist financing. Federal law grants substantial enforcement powers to financial services’ regulators including, among other things, the ability to assess significant civil or criminal monetary penalties, fines, or restitution; to issue cease and desist orders; and to initiate injunctive actions against banking organizations. These enforcement actions may be initiated for violations of laws or regulations and for unsafe or unsound practices. If the Company were the subject of an enforcement action, it could have an adverse impact on the Company.
33
As the Company continues to grow in asset size and complexity, regulatory expectations and scrutiny will likely increase and could have a potential impact on the Company’s operations and business.
The Company has grown steadily over the past several years, increasing size through both organic growth and strategic acquisitions. As financial institutions grow, so do the expectations of regulatory agencies regarding the financial institution’s ability to control for increasingly complex and sophisticated business operations. Certain regulations and laws have embedded asset thresholds that change regulatory expectations, have different financial statement impacts, require different committee and management compositions, or enhance certain reporting requirements. For example, as further discussed in the Supervision and Regulation section, the Dodd-Frank Act included a number of requirements that trigger when a banking entity crosses over $10.0 billion in assets. The Company anticipated crossing the $10.0 billion threshold for some time, and it did so in 2020.
On November 20, 2020, the federal bank regulatory agencies announced an Interim Final Rule, providing temporary relief for certain community banking organizations related to certain regulations and reporting requirements as a result of growth in size from the COVID-19 response. The Company has been provided temporary relief under this rule with respect to the interchange revenue impacts of the Durbin Amendment. The Company did not reduce its asset size back below the $10.0 billion threshold and has instead increased assets to $12.9 billion as of December 31, 2021. The relief expired December 31, 2021, and as a result, regulatory expectations, scrutiny, and reporting requirements are expected to continue to increase, and may affect the Company’s operations and strategies.
Laws impacting cannabis-related businesses in Illinois and other states may have an impact on the Company’s operations and risk profile.
The Controlled Substances Act makes it illegal under federal law to manufacture, distribute, or dispense marijuana. Starting January 1, 2020, however, the Illinois Cannabis Regulation and Tax Act began permitting adults to legally purchase marijuana for recreational use from licensed dispensaries. It is Busey Bank’s current practice to avoid knowingly providing banking products or services to entities or individuals that: (i) directly or indirectly manufacture, distribute, or dispense marijuana or hemp products, or those with a significant financial interest in such entities; or (ii) derive a material amount of revenue from providing products or services to, or other involvement with, such entities. Busey Bank is taking reasonable measures, including appropriate new account screening and customer due diligence measures, to ensure that existing and potential customers that operate in the states in which the Bank operates do not engage in any such activities. Nonetheless, shifts in Illinois law legalizing cannabis use, along with shifts in Missouri and Florida law allowing medicinal use and decriminalizing possession, have increased the number of direct and indirect cannabis-related businesses in some of the states in which the Company operates, and therefore increases the likelihood that Busey Bank could interact with such businesses, as well as their owners and employees. Such interactions could create additional legal, regulatory, strategic, and reputational risk to Busey Bank and the Company.
Credit and Lending Risks
Heightened credit risk associated with lending activities may result in insufficient loan loss provisions, which could have material adverse effect on the Company’s results of operations and financial condition.
There are risks in making any loan, including risks inherent in dealing with individual borrowers, risks of nonpayment, risks resulting from uncertainties as to the future value of collateral and cash flows available to service debt, and risks resulting from economic and market conditions. The Company attempts to reduce its credit risk through loan application approval procedures, monitoring the concentration of loans within specific industries and geographic location,locations, and periodic independent reviews of outstanding loans by its loan review and audit departments as well as external parties. However, while such procedures help reduce risks, they cannot be expected to completely eliminate the Company’s credit risks. Borrowers may experience difficulties in repaying their loans for any of a variety of reasons resulting in a rise in the level of nonperforming loans, charge-offs, and delinquencies, and/or a need for increases in the provision for loan losses. When economic conditions decline or significant shifts in demand change, as they have during the COVID-19 pandemic, increases in non-performing loans, charge-offs, and delinquencies become more likely.
34
The Company estimates and establishes an allowancereserves for loancredit losses and maintains itthem at a level considered adequate by management to absorb probable loancredit losses based on a continual analysis of the Company’s portfolio and market environment. The allowance for loan losses representsThese reserves represent the Company’s estimate of probable losses in the portfolio at each balance sheet date and isare based upon other relevant information available. The allowance contains provisions
In 2016, the FASB published CECL, which requires recording loss estimates for probable losses that have been identified relating to specific borrowing relationships, as well as probable losses inherentthe life of the instrument for loans, a change from the 40-year standard in the loan portfolio and credit undertakings that are not specifically identified.
22
Changes to the allowance for loan losses, which are charged to earnings through the provision for loan losses are determined based on a varietyrecorded under the “incurred loss” concept. Adoption of factors, including an analysis of the loan portfolio, historical loss experience and an evaluation of current economic conditionsCECL in the relevant market areas. The actual amount of loan losses is affected by changes2020 resulted in economic, operating and other market conditions, which may be beyond the Company’s control, and such losses may exceed current estimates.
additional reserves being set aside to protect against future credit losses. Although management believes the allowance for loan losses isreserves are adequate to absorb losses on existing loans that may become uncollectible, management cannot guarantee that additional provisions for loancredit losses will not be required in the future. Additional provision could be recorded, either as a result of management’s decision or as a requirement by regulators, to further supplement the allowance for loan losses, particularly if economic conditions unfold in a manner which differs significantly from what management currently expects. Additional provisions to the allowance for loan losses and loan losses in excess of the Company’s current allowance for loan losses may adversely affect its business, financial condition and results of operations.
Non-performing assets take significant time to resolve and adversely affect the Company’s results of operations and financial condition and could result in further losses in the future.
The Company’s non-performing assets adversely affect its net income in various ways. While the Company pays interest expense to fund non-performing assets, it does not record interest income on non-accrual loans or other real estate owned, thereby adversely affecting its income and returns on assets and equity. In addition, loan administration costs increase, and the Company’s efficiency ratio is adversely affected. When the Company takes collateral in foreclosures and similar proceedings, it is required to mark the collateral to its then-fair market value, which, when compared to the outstanding balance of the loan, may result in a loss. Non-performing loans and other real estate owned also increase the Company’s risk profile and the capital its regulators believe is appropriate in light of such risks. The resolution of non-performing assets requires significant time commitments from management, which can be detrimental to the performance of their other responsibilities. The Company cannot guarantee thatAlthough it is hard to fully predict the affect the COVID-19 pandemic will not experiencehave on the Company’s asset quality, it’s performance may be adversely affected if it experiences increases in non-performing loans in the future, and its non-performing assets may result in further losses in the future.
Federal regulatory agencies, in consultation with FASB, issued updated guidance on March 22, 2020, for classifying loans as TDRs, which allowed banks to modify loans of customers stressed by COVID-19 without having to classify the loan as a TDR. While this updated guidance provided temporary relief for both borrowers and banks, these loan modifications may not be sufficient to keep the assets the Company holds from deteriorating if the duration of the pandemic is prolonged.
Concentrations of credit and market risk could increase the potential for significant losses.
The Company may have higher credit risk, or experience higher credit losses, to the extent its loans are concentrated by loan type, industry segment, borrower type, or geographic location of the borrower or collateral. A significant portion of the Company’s loan portfolio is made up of mortgage, commercial, commercial real estate, and industrial loans, and secured byretail real estate.estate loans. Thus, deterioration in economic conditions or real estate values could result in higher credit costs and losses to the Company. The global pandemic in 2020 significantly impacted both global and domestic markets and economies as shutdowns and restrictions to prevent the spread of the virus affected several different business sectors. Although many business sectors rebounded as restrictions lifted during 2021, the full impact of the shutdowns and restrictions, along with the effect of changing demands resulting from the pandemic cannot be known at this time. The Company has taken additional steps to quantify the potential risk and impacted industries that are likely to experience stress to cash flows and pose higher potential default risk.
The Company’s commercial loans are primarily made based on the identified cash flow of the borrower and secondarily on the underlying collateral provided by the borrower. Most often, this collateral is accounts receivable, inventory, machinery or real estate. Credit support provided by the borrower for most of these loans and the probability of repayment is based on the liquidation of the pledged collateral and enforcement of a personal guarantee, which the Company requires whenever appropriate on commercial loans. As a result, in the case of loans secured by accounts receivable, the availability of funds for the repayment of these loans may be substantially dependent on the ability of the borrower to collect amounts due from its customers. The collateral securing other loans may depreciate over time, may be difficult to appraise, and may fluctuate in value based on the success of the business. As a result of the larger average size of each commercial loan, as well as collateral that is generally less readily-marketable, losses incurred on a small number of commercial loans could have a material adverse impact on the Company’s financial condition and results of operations.
As previously noted, a35
A significant portion of the Company’s loans are collateralized by real estate. The market value of real estate can fluctuate significantly in a short period of time as a result of market conditions in the area in which the real estate is located. Adverse changes affecting real estate values and the liquidity of real estate in one or more markets could increase the credit risk associated with the Company’s loan portfolio, and could result in losses which would adversely affect profitability. Mortgage loans in the Company’ portfolio with high loan-to-value ratios are more sensitive to declining property values and may experience a higher incident of default and severity of losses. Adverse changes in the economy affecting real estate values and liquidity generally, and in markets in which the Company has banking operations, could significantly impair the value of property pledged as collateral on loans and affect the Company’s ability to sell the collateral upon foreclosure without a loss or additional losses. Collateral may have to be sold for less than the outstanding balance of the loan which would result in losses.
Credit risk associated with concentration of securities in the Company’s investment portfolio may increase the potential for loss.
The Company’s investment portfolio consists, in part, of securities issued by government or government sponsored agencies and non-government entities. A downturn in the financial condition of the issuers, the performance of the underlying collateral, or the financial condition of the individual mortgagors with respect to the underlying securities could create results such as rating agency downgrades of the securities and default by issuers or individual mortgagors. Any of the foregoing factors could cause an OTTI in future periods and result in realized losses, which could adversely affect the Company’s financial condition and results of operations.
23
Real estate construction, land acquisition and development loans are based upon estimates of costs and values associated with the complete project. These estimates may be inaccurate, and the Company may be exposed to significant losses on loans for these projects.
Construction, land acquisition, and development loans involve additional risks because funds are advanced upon the security of the project, which is of uncertain value prior to its completion, and costs may exceed realizable values in declining real estate markets. Because of the uncertainties inherent in estimating construction costs and the realizable market value of the completed project, and the effects of governmental regulation on real property, it is relatively difficult to evaluate accurately the total funds required to complete a project and the related loan-to-value ratio. As a result, construction loans often involve the disbursement of substantial funds with repayment dependent, in part, on the success of the ultimate project and the ability of the borrower to sell or lease the property, rather than the ability of the borrower or guarantor to repay principal and interest. If the Company’s appraisal of the value of the completed project proves to be overstated or market values or rental rates decline, there may be inadequate security for the repayment of the loan upon completion of construction of the project. If the Company is forced to foreclose on a project prior to or at completion due to a default, there can be no assurance that it will be able to recover all of the unpaid balance of, and accrued interest on, the loan as well as related foreclosure and holding costs. In addition, the Company may be required to fund additional amounts to complete the project and may have to hold the property for an unspecified period of time while it attempts to dispose of it.
TheCredit risk associated with concentration of securities in the Company’s exposure to home equity lines of creditinvestment portfolio may increase the potential for loss.
The Company’s mortgage loaninvestment portfolio consists, in part, of home equity lines of credit.securities issued by government or government sponsored agencies and non-government entities. A large portion of home equity lines of credit are originated in conjunction with the origination of first mortgage loans eligible for saledownturn in the secondary market, which the Company typically does not service if the loan is sold. By not servicing the first mortgage loans, the Company is unable to track the delinquency status which may indicate whether such loans are at risk of foreclosure by others. In addition, home equity lines of credit are initially offered as “revolving” lines of credit whereby the borrowers are only required to make scheduled interest payments during the initial termsfinancial condition of the loans, which is generally five years. Thereafter,issuers, the borrowers no longer have the ability to make principal draws from the lines and the loans convert to a fully-amortizing basis, requiring scheduled principal and interest payments sufficient to repay the loans within a certain period of time, which is generally 10 years. The conversion of a home equity line of credit to a fully amortizing basis presents an increased level of default risk to us since the borrower no longer has the ability to make principal draws on the line, and the amountperformance of the required monthly paymentunderlying collateral, or the financial condition of the individual mortgagors with respect to the underlying securities could substantially increase to provide for scheduled repaymentcreate results such as rating agency downgrades of principalthe securities and interest.default by issuers or individual mortgagors. Any of the foregoing factors could result in realized losses, which could adversely affect the Company’s financial condition and results of operations.
Capital and Liquidity Risks
The Company is required to maintain capital to meet regulatory requirements, and if it fails to maintain sufficient capital, whether as a result of losses, inability to raise additional capital, or otherwise, its financial condition, liquidity, and results of operations, as well as its ability to maintain regulatory compliance would be adversely affected.
First Busey and Busey Bank must meet regulatory capital requirements and maintain sufficient liquidity. The Company’s ability to raise additional capital, when and if needed, will depend on conditions in the capital markets, economic conditions, and a number of other factors, including investor perceptions regarding the banking industry and market condition, and governmental activities, many of which are outside the Company’s control, and on its financial condition and performance. Accordingly, the Company cannot guarantee that it will be able to raise additional capital if needed or on terms acceptable to the Company. If it fails to meet these capital and other regulatory requirements, its financial condition, liquidity, and results of operations would be materially and adversely affected.
36
The Company’s failure to continue to maintain capital ratios in excess of the amounts necessary to be considered “well-capitalized” for bank regulatory purposes could affect customer confidence, its ability to grow, its costs of funds and FDIC insurance costs, its ability to pay dividends to its stockholders or on outstanding stock, its ability to make acquisitions, and its business, results of operations, and financial condition. Furthermore, under FDIC rules, if the Company ceases to meet the requirements to be considered a “well-capitalized” institution for bank regulatory purposes, the interest rates it pays on deposits and its ability to accept, renew, or rollover deposits, particularly brokered deposits, may be restricted.
Liquidity risks could affect operations and jeopardize the Company’s business, financial condition, and results of operations.
Liquidity is essential to the Company’s business. An inability to raise funds through deposits, borrowings, the sale of loans, and other sources could have a substantial negative effect on liquidity. The Company’s primary sources of funds consist of deposits and funds from sales of investment securities, investment maturities and sales, and cash from operations. Additional liquidity is available through repurchase agreements, brokered deposits, and the ability to borrow from the Federal Reserve Bank and the Federal Home Loan Bank (“FHLB”).FHLB. Access to funding sources in amounts adequate to finance or capitalize the Company’s activities or on terms that are acceptable to the Company could be impaired by factors that affect it directly or the financial services industry or economy in
24
general, such as disruptions in the financial markets or negative views and expectations about the prospects for the financial services industry.
During periods of economic turmoil, the financial services industry and the credit markets generally may be materially and adversely affected by significant declines in asset values and depressed levels of liquidity. These and other factors could negatively affect the Company’s ability to engage in routine funding and other transactions with other financial institutions and lead to market-wide liquidity problems, loss of depositor, creditor, and counterparty confidence, which could lead to losses or defaults by the Company or by other institutions. Furthermore, regional and community banks generally have less access toAlthough the capital markets than do the national and super-regional banks because of their smaller size, limited analyst coverage, and lack of credit rating resulting from significant expense required to obtain it.
Company is not currently experiencing liquidity stress, pandemic-related market conditions remain uncertain. Any decline in available funding and/or capital could adversely impact the Company’s ability to originate loans, invest in securities, meet its expenses, pay dividends to its stockholders, or meet deposit withdrawal demands, any of which could have a material adverse impact on its liquidity, business, financial condition, and results of operations.
The soundness of other financial institutions could negatively affect the Company.
TheAs indicated in the “Item 1A. Risk Factors—Economic and Market Risks” section above, the Company’s ability to engage in routine funding and other transactions could be negatively affected by the actions and commercial soundness of other financial institutions. Financial services institutions are interrelated as a result of trading, clearing, counterparty, or other relationships. Defaults by, or even rumors or questions about, one or more financial services institutions, or the financial services industry generally, have led to market-wide liquidity problems and losses of depositor, creditor, and counterparty confidence and could lead to losses or defaults by the Company or by other institutions. The Company could experience growth as a result of the difficulties or failures of other banks or government-sponsored financial institutions, which would increase its funding needs.
In addition, a prolonged period of illiquidity in the secondary mortgage market, and an increase in interest rates, could reduce the demand for residential mortgage loans and increase investor yield requirements for those loans. As a result, the Company may be at higher risk of retaining a larger portion of mortgage loans than in other environments until they are sold to investors. The Company’s ability to retain fixed-rate residential mortgage loans is limited and could result in a reduction of loan production volumes, which could have a material adverse effect on our financial condition and results of operations.
Competitive and Strategic Risks
If securities or industry analysts do not publish or cease publishing research reports about us, if they adversely change their recommendations regarding our stock, or if our operating results do not meet their expectations, the price of our stock could decline.
The trading market for our common stock will be influenced by the research and reports that industry or securities analysts may publish about us, our business, our market, or our competitors. If there is limited or no securities or industry analyst coverage of us, the market price for our stock would be negatively impacted. Moreover, if any of the analysts who elect to cover us downgrade our common stock, provide more favorable relative recommendations about our competitors, or if our operating results or prospects do not meet their expectations, the market price of our common stock may decline. If one or more of these analysts ceases coverage of us or fails to publish reports on us regularly, demand for our stock could decrease, which could cause our stock price and trading volume to decline.
37
The Company faces strong competition from financial service companies and other companies that offer banking and wealth management services, which could harm its business.
The Company currently conducts its banking operations in downstate Illinois,Illinois; suburban Chicago, Illinois; the Southwest suburbs of Chicago, Illinois, St. Louis, Missouri, metropolitan area,area; central IndianaIndiana; and southwest Florida. In addition, the Company currently offers fiduciary and wealth management services, which account for an importanta significant portion of its non-interest income. Many competitors offer the same, or a wider variety of, banking and wealth management services within the Company’s market areas. These competitors include national banks, regional banks, and other community banks. The Company also faces competition from many other types of financial institutions, including savings and loan institutions, finance companies, brokerage firms, insurance companies, credit unions, mortgage banks and online lenders, and other financial intermediaries. In addition, a number of out-of-state financial intermediaries have opened production offices or otherwise solicit deposits in the Company’s market areas. Also, technology and other changes have lowered barriers to entry and made it possible for non-banks or financial technology companies, as well as other large technology corporations, to offer products and services traditionally provided by banks. For example, customers can maintain funds that would have historically been held as bank deposits in brokerage accounts or mutual funds. Customersfunds, can apply for and receive credit, and can also complete transactions such as paying bills and/or transferring funds directly without the assistance of banks. The process of eliminating banks as intermediaries, known as “disintermediation,” could result in the loss of fee income, as well as the loss of customer deposits and the related income generated from those deposits. Increased competition in the Company’s markets may result in reduced loans, deposits, and commissions and brokers’ fees, as well as reduced net interest margin and profitability. Ultimately, the Company may not be able to compete successfully against current and future competitors. If the Company is unable to attract and retain banking and wealth management customers, it may be unable to grow its loan and deposit portfolios or its wealth management commissions, which could adversely affect its business, results of operations, and financial condition.
Rapid speed of disruptive innovations enabled by new and emerging technologies and/or other market forces may outpace the Company’s ability to compete.
Many well-established industries are experiencing significant disruptions created by advancesThe financial services industry is undergoing rapid technological changes with frequent introductions of new technology driven products and services. In addition to better serving clients, the effective use of technology increases efficiency and enables financial institutions to both reduce costs and service customers beyond the bank’s traditional branch footprint. Our future success will depend in technologies and changing customer requirements, thus thepart upon our ability to quickly recognizeaddress the change,needs of our clients by using technology to provide products and then respond and adapt becomes criticalservices that will satisfy client demands for convenience as well as to long-term sustainability. If the Company’s culture does not sufficiently encourage the timely identification and escalation of emerging risk issues, these risks
25
have the potential to significantly affect our core operations and achievement of strategic objectives. Similarly, cultural resistance to change may restrict the Company from making the necessary adjustments to the business model and core operations to remain competitive. Inability to utilize data analytics and “big data” to achieve market intelligence and increase productivity and efficiency could also significantly affectcreate additional efficiencies in our operations. Ultimately, if we fall behind in our ability to be adaptive and innovative, attracting new customers and sustaining customer loyalty and retention may be increasingly difficult as a result of evolving customer preferences and/or demographic shifts in our existing customer base.
Our strategy of pursuing acquisitions exposes us to financial, execution, and operational risks that could negatively affect us.
To help us fulfill our strategic objectives and enhance our earnings, part of our strategy is to supplement organic growth by acquiring other financial institutions in our market areas and in nearby markets. As our capital position and asset quality allow, we may againcontinue to supplement organic growth through acquisitions, as we did with recent acquisitions.have in the past. There are risks associated with an acquisition strategy,strategies, including the following:
| We are exposed to potential asset and credit quality risks and unknown or contingent liabilities of the banks or businesses we acquire. If these issues or liabilities exceed our estimates, our earnings and financial condition may be materially and adversely affected. |
| Prices at which acquisitions can be made fluctuate with market conditions. We have experienced times during which acquisitions could not be made in specific markets at prices our management considered acceptable and expect that we will experience this condition in the future in one or more markets. |
38
| The acquisition of other entities generally requires integration of systems, procedures, and personnel of the acquired entity in order to make the transaction economically feasible. This integration process is complicated and time consuming and can also be disruptive to the customers of the acquired business. If the integration process is not conducted successfully and with minimal effect on the acquired business and its customers, we may not realize the anticipated economic benefits of particular acquisitions within the expected time frame, and we may lose customers or employees of the acquired business. |
| We are subject to due diligence expenses which may not result in an acquisition. |
| To finance an acquisition, we may borrow funds, thereby increasing our leverage and diminishing our liquidity, or issue capital stock to the sellers in an acquisition or to third-parties to raise capital, which could dilute the interests of our existing stockholders. |
| The time period in which anticipated benefits of a merger are fully realized may take longer than anticipated, or we may be unsuccessful in realizing the anticipated benefits from mergers and future acquisitions. |
New lines of business or new products and services may subject us to additional risks.
From time to time, we may seek to implement new lines of business or offer new products, services, or delivery channels within existing lines of business in our current markets or new markets. There are substantial risks and uncertainties associated with these efforts, particularly in instances where the markets are either highly competitive or, conversely, not fully developed. In developing and marketing new lines of business and/or new products and services, we may invest significant time and resources. Initial timetables for the introduction and development of new lines of business and/or new products or services may not be achieved, and price and profitability targets may not prove feasible, which could in turn have a material negative effect on our operating results.
Accounting and Tax Risks
Financial statements are created, in part, by estimates and assumptions and methods used by management, which, if incorrect, could cause unexpected losses in the future.
The Company’s financial performance is impacted by accounting principles, policies, and guidelines. Some of these policies require the use of estimates and assumptions that may affect the value of assets or liabilities and financial results. Certain accounting policies are critical and require management to make difficult, subjective, and complex judgments about matters that are inherently uncertain, and materially different amounts could be reported under different conditions or using different assumptions. If such estimates or assumptions underlying the Company’s Consolidated Financial Statements are incorrect, the Company may experience material losses.
One such assumption and estimate is the valuation analysis of its goodwill.goodwill and other intangible assets. Although the Company’s analysis does not indicate impairments exist;exist, the Company is required to perform additional goodwill impairment assessments on at least an annual basis, and perhaps more frequently, which could result in further goodwill impairment charges. Any future goodwill or other intangible assets impairment charge,charges, based on the current goodwill balancebalances or future goodwillbalances arising out of acquisitions, could have a material adverse effect on the results of operations by reducing net income or increasing net losses.
2639
The Company is subject to changes in accounting principles, policies, or guidelines.
Periodically, agencies such as the FASB or the SEC change the financial accounting and reporting standards or the interpretation of those standards that govern the preparation of the Company’s Financial Statements. These changes are beyond the Company’s control, can be difficult to predict, and could materially impact how the Company reports its financial condition and results of operations. Changes in these standards are continuously occurring and the implementation of such changes could have a material adverse effect on the Company’s financial condition and results of operations.
In 2016, the FASB published new Current Expected Credit Loss impairment standards (“CECL”) which requires recording loss estimates for the life of the instrument for loans and held-to-maturity investment securities. This is a change from the 40-year standard in which losses are recorded under the “incurred loss” concept. The CECL methodology estimates losses in consideration of a reasonably foreseeable economic forecast. Implementing this change in accounting involves compliance and operational challenges and the results may decrease capital and increase volatility in the estimate of losses. The Company will make changes to its policies, procedures and technology systems to properly account for and comply with the new methodology. CECL is not set to take effect until 2020.
The Company is subject to changes in tax law and may not realize tax benefits which could adversely affect our results of operations.
Changes in tax laws at national or state levels could have an effect on the Company’s short-term and long-term earnings. Tax law changes are both difficult to predict and are beyond the Company’s control. Changes in tax laws could affect the Company’s earnings as well as its customers’ financial positions, or both.
Deferred tax assets are designed to reduce subsequent period’s income tax expense and arise, in part, as a result of net loss carry-overs, and other book accounting to tax accounting differences including the allowance for loanexpected credit losses, stock-based compensation, and deferred compensation. Such items are recorded as assets when it is anticipated the tax consequences will be recorded in future periods. A valuation allowance is established against a deferred tax asset when it is unlikely the future tax effects will be realized. Significant judgment by management about matters that are by nature uncertain is required to record a deferred tax asset and establish a valuation allowance.
In evaluating the need for a valuation allowance, the Company estimatedestimates future taxable income based on management forecasts and tax planning strategies that may be available to us. IfWhile the Company has determined that no valuation allowance is currently required for any deferred tax assets, if future events differ significantly from our current forecasts, it may need to establish a valuation allowance against its net deferred tax assets, which would have a material adverse effect on its results of operations and financial condition. In addition, current portions of the net deferred tax assets relate to tax effected state net operating loss carry-forward, the utilization of which may be further limited in the event of certain material changes in the Company’s ownership.
In addition, changes in ownership could further limit the Company’s realization of deferred tax assets. The ultimate realization of deferred tax assets is dependent upon the generation of future taxable income during the periods prior to the expiration of the related net operating losses and may be limited by Section 382 of the Internal Revenue Code. If
Further, the Company’s investments in certain tax-advantaged projects may not generate returns as anticipated and may have an adverse impact on the Company’s financial results. The Company undergoes an ownership change, its abilityinvests in certain tax-advantaged projects promoting affordable housing, community development and other community revitalization projects. The Company’s investments in these projects are designed to use net operating loss carry-forwards,generate a return primarily through the realization of federal and state income tax credits, and other tax benefits, over specified time periods. The Company is subject to the risk that previously recorded tax credits, which remain subject to recapture by taxing authorities based on compliance features required to be met at the project level, will fail to meet certain government compliance requirements and will not be able to be realized. The possible inability to realize these tax credit carry-forwards or net unrealized built-in losses atand other tax benefits can have a negative impact on the timeCompany’s financial results. The ultimate realization of ownership change may be limited. The limitation may affect the amounttax credits and other tax benefits depends upon having sufficient taxable income and on many factors outside of the Company’s deferred incomecontrol, including changes in the applicable tax assetcode and depending on the limitation, a portionability of its built-in losses. the projects to be completed.
Operational Risks
The Company’s framework for managing risks may not be effective in mitigating risk and loss.
The Company’s risk management framework seeks to mitigate risk and loss. It has established processes and procedures intended to identify, measure, monitor, report, and analyze the types of risk to which it is subject, compliance risk and reputational risk, among others. However, as with any risk management framework, there are inherent limitations. Risks may exist, or emerge in the future, that have not been appropriately identified or anticipated. As it continues to grow, the Company’s ability to successfully identify and manage the risks it faces is an important factor that can significantly impact results. If its risk management framework is not commensurate with its risk profile, the Company could suffer unexpected losses and could be materially adversely affected.
40
The Company relies on the integrity of its operating systems and employees, and those of third-parties, and certain failures of such systems or error by employees or customers could materially and adversely affect the Company’s operations.
Communications and information systems are essential to conduct the Company’s business, as it uses such systems to manage customer transactions and relationships, the general ledger, and deposits, loans, and investments. However, the computer systems and network infrastructure the Company uses could be vulnerable to unforeseen problems as operations are dependent upon the protection of computer equipment against damage from physical theft, fire, power loss, telecommunications failure, or a similar catastrophic event, as well as from security breaches, cybersecurity attacks, viruses and other disruptive problems caused by hackers. The termination of a third party software license or service agreement on which any of these systems is based could also interrupt our operations.events.
In addition, the Company outsources certain processing functions to third-party providers. If third-party providers encounter difficulties or if the Company has difficulty in communicating with them, the ability to adequately process and account for customer transactions may be affected and business operations may be adversely impacted. If third-party providers are unable to meet service
27
expectations, experience system or processing failure, or incur disruptions affecting operations, results could adversely impact the Company. Moreover, it may be difficult forWhile the Company to replace third party vendors, particularly vendors providing core banking and information services, in a timely manner if they are unwilling or unable to provide the Company with these services in the future or for any reason and, even if the Company is able to replace them, it may be at higher cost or result in the loss of customers. The Company follows certain due diligence procedures in reviewing and vetting its third-parties, however, it cannot control their actions.
Although the Company has procedures in place to prevent or limit the effects of any of these potential problems and intends to continue to implement security technology and establish operational procedures to prevent such occurrences, technology-related disruptions, failures, and cybersecurity risks are a constant threat, both for the Company and for the third-parties it works with. Therefore, it cannot guarantee that these measures will be successful. Any failure, interruption in, or breach in security of, its computer systems and network infrastructure, as well as those of its customers engaging in internet banking activities or electronic funds transfers, could damage its reputation, result in a loss of customer business, subject it to additional regulatory scrutiny, or expose it to civil litigation and possible financial liability, any of which could have a material adverse effect on its financial condition and results of operations.
Similarly, the Company is reliant upon its employees. Such dependencies create risks for potential losses resulting from employee errors, breakdowns in process or control, failures to properly execute change management, negligence, or a number of other factors outside the Company’s control. The Company maintains a system of internal controls and insurance coverage to mitigate operational risks, including data processing system failures and errors, customer or employee fraud, and other disruptions which might impact its business. In addition, the Company’s Internal Audit department routinely reviews operations and high riskhigh-risk areas for error, deficient controls, and failure to adhere to policy.
Potential legal actions, fines, and civil money penalties could arise as results of an operational deficiency or as a result of noncompliance with applicable regulatory standards, adverse business decisions or their implementation, and customer attrition due to potential negative publicity.
A breach in the security of the Company’s systems could disrupt its businesses, result in the disclosure of confidential information, damage its reputation, and create significant financial and legal exposure for the Company.
Although the Company devotes significant resources to maintain and regularly upgrade systems and processes designed to protect the security of its computer systems, software, networks, and other technology assets, these measures do not provide absolute security. Several financial servicesIn the past year, a myriad of industries and institutions government agencies, retailers and other companies have reported breaches in the security of their websites or other systems, some of which have involved sophisticated and targeted attacks intended to obtain unauthorized access to confidential information, destroy data, disable or degrade service, or sabotage systems, often through the introduction of computer viruses or malware, cyber-attacks, and other means.
Some companies in the United States In addition, cyber attackers have experienced well-publicized attacks from technically sophisticated and well-resourced third-parties that were intended to disrupt normal business activities by making internet banking systems inaccessible to customers for extended periods. These “denial-of-service” attacks may not have breached data security systems, but require substantial resources to defend, and may affect customer satisfaction and behavior. Even if not directed at the Company, attacks on financial or other institutions important to the overall functioningtaken advantage of the financial system could adversely affect, directly or indirectly, aspectspandemic to create campaigns to leverage individuals fears and uncertainties as well as capitalize on the increased number of the Company’s businesses.transactions occurring on digital channels. The implementation of remote working arrangements that use virtual private networks, virtual conferencing services, and telecommunication technologies can increase insider risk, cybersecurity vulnerabilities, and other operational exposures. Industry trends in ransomware, phishing, and other intrusion methods have increased significantly and will continue to pose increased risk.
Threats to security also exist in the processing of customer information through various other third-parties, their personnel, and their use of subcontractors. Advances in computer capabilities, new discoveries in the field of cryptography or other developments could result in a compromise or breach of the algorithms the Company and its third-party service providers use to encrypt and protect customer transaction data. Such cyber incidents may go undetected for a period of time. An inability by our third-party providers, and their third-party providers, known as “supply chain risk,” to anticipate, detect,
41
or failure to adequately mitigate, breaches of security could result in a number of negative events, including losses to us or our clients, loss of business or clients, damage to our reputation, the incurrence of additional expenses, additional regulatory scrutiny or penalties, or exposure to civil litigation and possible financial liability, any of which could have a material adverse effect on our business, financial condition, results of operations, and growth prospects.
The Company also faces risks related to cyber-attacks and other security breaches in connection with credit card, and debit card and other payment-related transactions that typically involve the transmission of sensitive information regarding the Company’s customers through various third-parties, including merchant acquiring banks, payment processors, payment card networks, and its processors. Because card transactions involve third-parties and environments such as the point of sale that the Company does not control or secure, future security breaches or cyber-attacks affecting any of these third-parties could impact the Company through no fault of its own, and in some cases it may have exposure and suffer losses for breaches or attacks relating to them. Cyber-attacks or other breaches, whether affecting the Company or others, could intensify consumer concern and regulatory focus and result in reduced use of payment cardsbreach and fraud-related losses as well as increased costs, all of which could have a material adverse effect on the Company’s business.
28
Penetration or circumvention of the Company’s security systems could result in serious negative consequences for the Company, including significant disruption of the Company’s operations, misappropriation of confidential information of the Company or that of its customers or employees, or damage to computers or systems of the Company and those of its customers and counterparties. Such events could result in violations of applicable privacy and other laws, financial loss to the Company or its customers, loss of confidence in the Company’s security measures, customer dissatisfaction, significant litigation exposure and harm to the Company’s reputation, all of which would adversely affect the Company.
These risks have increased for all financial institutions globally as new technologies, the use of the Internet and telecommunications technologies, including mobile devices, to conduct financial and other business transactions, and the increased sophistication and activities of organized crime, perpetrators of fraud, hackers, terroristsmalicious individuals and others.organizations have increased substantially. Despite the Company’s significant investment in security resources and its continued efforts to prevent or limit the effects of potential threats, it is possible that the Company may not be able to anticipate or implement effective preventative measures against all security breaches of these types, especially because the techniques used change frequently or are not recognized until launched, and because security-related attacks can originate from a wide variety of sources, including organized crime, hackers, terrorists, activists, and other external parties, including parties sponsored by hostile foreign governments. Those parties may also attempt to fraudulently induce employees, customers, third-party service providers or other users of the Company’s systems to disclose sensitive information in order to gain access to the Company’s data or that of its customers. These risks may increase in the future as the Company increases its mobile payments, internet-based product offerings, and expand its internal usage of web-based products and applications.incidents.
Customer or employee misconduct or fraud may affect operations, result in significant financial loss, and have an adverse impact on the Company’s reputation.
Misconduct could subject the Company to financial losses or regulatory sanctions and seriously harm its reputation. Misconduct by employees and customers could include hiding unauthorized activities, conducting improper or unauthorized activities, or improper use of confidential information. It is not possible to prevent all errors and misconduct, and the precautions the Company takes to prevent and detect this activity may not be effective in all cases.
Customer or other outsiders may also attempt to perpetuate fraud or scams in the form of identity theft, money laundering, fraudulent or altered deposits, or use of counterfeit instruments, as a few examples. The Company also faces fraud risk associated with the origination of loans, including the intentional misstatement of information in property appraisals or other underwriting documentation provided to it by customers or by third-parties. Customers may expose the Company to certain fraud risks associated with the compromise of their computing systems or accounts, as well.
Should the Company’s internal controls fail to prevent or detect an occurrence, or if any resulting loss is not insured or exceeds applicable insurance limits, such failures could adversely affect its business, results of operations and financial condition. Both the number and sophistication level of attempted fraudulent transactions are increasing. Should our internal controls fail to prevent or detect an occurrence of fraud, or if any resulting loss is not insured or exceeds applicable insurance limits, it could have a material adverse effect on the Company’s business, results of operations, and financial condition.
The Company’s ability to attract and retain management and key personnel may affect future growth and earnings and legislation imposing new compensation restrictions could adversely affect its ability to do so.
Much of the Company’s success and growth has been influenced strongly by its ability to attract and retain management experienced in banking and financial services and familiar with the communities in its market areas. The Company’s ability to retain executive officers, current management teams, lending and retail banking officers, and administrative staff of its subsidiaries continues to be important to the successful implementation of its strategy. In addition, the Company’s ability to retain key personnel at acquired financial institutions is vitally important to the Company’s strategy to grow through mergers and acquisitions. Also critical is the Company’s ability to attract and retain diverse and qualified staff with the appropriate level of experience and knowledge about its market areas so as to implement its community-based operating strategy. Recent changes in labor market conditions have contributed to heightened levels of employee attrition and increased competition for talent, which has in turn driven wage rates higher and may contribute to an increase in operating expenses. The unexpected loss of services of key personnel, or the inability to recruit and retain qualified personnel in the future, could have an adverse effect on the Company’s business, financial condition, and results of operation.
42
Damage resulting from negative publicity could harm the Company’s reputation and adversely impact its business and financial condition.
The Company’s ability to attract and maintain customers, investors, and employees is contingent upon maintaining trust. Negative public opinion could result from the Company’s actual or alleged conduct in a number of activities, including, but not limited to, employee misconduct, a failure or perceived failure to deliver appropriate standards of service and quality or to treat customers fairly, faulty lending practices, compliance failures, security breaches, corporate governance, sharing or inadequate protection of customer information, failure to comply with laws or regulations, and actions taken by government regulators and community organizations in
29
response to that conduct. The results of such actual or alleged misconduct could include customer dissatisfaction, inability to attract potential acquisition prospects, litigation, and heightened regulatory scrutiny, all of which could lead to lost revenue, higher operating costs, and harm to the Company’s reputation. No assurance can be made, despite the cost or efforts made by the Company to address the issues arising from reputational harm, that results could not adversely affect the Company’s business, financial condition, and results of operations.
Severe weather, natural disasters, acts of terrorism or warClimate change or other adverse external events could significantly impact the Company’s business.
Severe weather, natural disasters, geopolitical risks and acts of terrorism or war, widespread disease or pandemics, as is currently being experienced, and other adverse external events could have a significant impact on the Company’s ability to conduct business. In addition, suchClimate change, in particular, presents multi‐faceted risks including: operational risk from the physical effects of climate events could affect the stability of the Company’s deposit base; impair the ability ofon our and our customers’ facilities and other assets; credit risk from borrowers with significant exposure to repay outstanding loans, impair the value of collateral securing loans, cause significant property damage, result in loss of revenue and/or causeclimate risk; and reputational risk from stakeholder concerns about our practices related to climate change.
Climate change exposes the Company to incur additional expenses. The occurrencephysical risk as its effects may lead to more frequent shifts in weather patterns and more extreme weather events that could damage, destroy, or otherwise impact the value or productivity of any such event inour properties and other assets; reduce the futureavailability of insurance to cover losses; and/or disrupt our operations through prolonged outages. Such events and long‐term shifts may also have a significant impact on our customers, which could amplify credit risk by diminishing borrowers’ repayment capacity or collateral values, and other businesses and counterparties with whom we transact, which could have a material adverse effectbroader impact on the Company’s business,economy, supply chains, and distribution networks.
Furthermore, banking regulators and other supervisory authorities, investors and other stakeholders have increasingly viewed financial institutions as important in helping to address the risks related to climate change both directly and with respect to their customers, which may result in turn,financial institutions coming under increased pressure regarding the disclosure and management of their climate risks and related lending and investment activities. Given that climate change could have a material adverse effect onimpose systemic risks upon the financial condition and resultssector, either via disruptions in economic activity resulting from the physical impacts of operation.
The Company’s frameworkclimate change or changes in policies as the economy transitions to a less carbon‐intensive environment, we face regulatory risk of increasing focus on our resilience to climate‐related risks, including in the context of stress testing for managing risks may not be effective in mitigating risk and loss.
The Company’svarious climate stress scenarios. Ongoing legislative or regulatory changes regarding climate risk management framework seeks to mitigate risk and loss. It has established processes and procedures intended to identify, measure, monitor, report, and analyze the types of risk to which it is subject,practices may result in higher regulatory, compliance, riskcredit and reputational risk, among others. However, as with any risk management framework, there are inherent limitations. Risks may exist, or emerge in the future, that have not been appropriately identified or anticipated. As it continues to grow, the Company’s ability to successfully identify and manage the risks it faces is an important factor that can significantly impact results. If its risk management framework proves ineffective, the Company could suffer unexpected losses and could be materially adversely affected.
If securities or industry analysts do not publish or cease publishing research reports about us, if they adversely change their recommendations regarding our stock or if our operating results do not meet their expectations, the price of our stock could decline.
The trading market for our common stock will be influenced by the research and reports that industry or securities analysts may publish about us, our business, our market or our competitors. If there is limited or no securities or industry analyst coverage of us, the market price for our stock would be negatively impacted. Moreover, if any of the analysts who elect to cover us downgrade our common stock, provide more favorable relative recommendations about our competitors or if our operating results or prospects do not meet their expectations, the market price of our common stock may decline. If one or more of these analysts ceases coverage of us or fails to publish reports on us regularly, demand for our stock could decrease, which could cause our stock price and trading volume to decline.
New lines of business or new products and services may subject us to additional risks.
From time to time, we may seek to implement new lines of business or offer new products, services or delivery channels within existing lines of business in our current markets or new markets. There are substantial risks and uncertainties associated with these efforts, particularly in instances where the markets are not fully developed. In developing and marketing new lines of business and/or new products and services, we may invest significant time and resources. Initial timetables for the introduction and development of new lines of business and/or new products or services may not be achieved and price and profitability targets may not prove feasible, which could in turn have a material negative effect on our operating results.costs.
ITEM 1B. UNRESOLVED STAFF COMMENTS
Item 1B. Unresolved Staff Comments
None.
ITEM 2. PROPERTIES
First Busey and Busey Bank’s headquarters are located at 100 West University Avenue, Champaign, Illinois. FirsTech’s headquarters areis located at 130 North Water Street, Decatur, Illinois. These facilities, which are owned by the Company, house the executive and primary administrative offices of each respective entity. The CompanyFirst Busey and its subsidiaries also ownsown or leaseslease other facilities, such as banking centers of Busey Bank, for business operations.
First Busey and its subsidiaries own or lease all of the real property and/or buildings on which each respective entity is located. The Company considers its properties to be suitable and adequate for its present needs. None of the properties are subject to any material encumbrance.
3043
ITEM 3. LEGAL PROCEEDINGS
As part of the ordinary course of business, First Busey and its subsidiaries are parties to litigation that is incidental to their regular business activities.
There is no material pending litigation, other than ordinary routine litigation incidental to its business, in which First Busey or any of its subsidiaries is involved or of which any of their property is the subject. Furthermore, there is no pending legal proceeding that is adverse to First Busey in which any director, officer, or affiliate of First Busey, or any associate of any such director or officer, is a party, or has a material interest.
ITEM 4. MINE SAFETY DISCLOSURES
Item 4. Mine Safety Disclosures
Not applicable.
PART II
Part II
ITEM 5. MARKET FOR REGISTRANT’S COMMON EQUITY, RELATED STOCKHOLDER MATTERS, AND ISSUER PURCHASES OF EQUITY SECURITIES
Item 5. Market for Registrant’s Common Equity, Related Stockholder Matters and Issuer Purchases of Equity Securities
Common Stock
First Busey’s common stock is traded on The Nasdaq Global Select Market under the symbol “BUSE.”
The Company’s board of directors and management are currently committed to continue paying regular cash dividends; however, no guarantee can be given with respect to future dividends, as they are dependent on certain regulatory restrictions, future earnings, capital requirements, and financial condition of the Company and its subsidiaries. See “Item“Item 1. Business—Supervision, Regulation and Other Factors—Supervision and Regulation and Supervision of the Company—Dividend Payments” and Regulation” and “Item“Item 1. Business—Supervision, Regulation and Other Factors—Supervision and Regulation and Supervision of the Banks—Busey Bank—Dividend Payments”Payments” for further discussion of these matters.
As of February 27, 2019,24, 2022, First Busey Corporation had 55,600,18455,290,645 shares of common stock outstanding held by 3,0342,269 holders of record. Additionally, there were an estimated 9,85511,536 beneficial holders whose stock was held in street name by brokerage houses and nominees as of that date.
Stock Repurchases
On February 3, 2015, First Busey’s board of directors authorized the Company to repurchase up to an aggregate of 666,667 shares of its common stock. The repurchase plan has no expiration datedate. On May 22, 2019, First Busey’s board of directors approved an amendment to increase the authorized shares under the repurchase program by 1,000,000 shares, and replacedon February 5, 2020, First Busey’s board of directors approved another amendment to increase the priorauthorized shares under the repurchase plan originally approved in 2008. There were no purchases madeprogram by or on behalfan additional 2,000,000 shares. During the fourth quarter of First Busey of its common stock2021, the Company purchased 418,000 shares duringunder the quarter ended December 31, 2018.plan. At December 31, 2018,2021, the Company had 333,334535,824 shares that may still be purchased under the plan.
| | | | | | | | | |
Period | | Total Number of Shares Purchased | | Weighted Average Price Paid per Common Share | | Number of Shares Purchased as Part of Publicly Announced Plans or Programs | | Maximum Number of Shares That May Yet Be Purchased Under the Plans or Programs | |
October 1-31, 2021 | | 158,000 | | $ | 25.62 | | 158,000 | | 795,824 |
November 1-30, 2021 | | 124,000 | | $ | 27.00 | | 124,000 | | 671,824 |
December 1-31, 2021 | | 136,000 | | $ | 26.55 | | 136,000 | | 535,824 |
Three Months Ended December 31, 2021 | | 418,000 | | $ | 26.33 | | 418,000 | | |
| | | | | | | | | |
Year Ended December 31, 2021 | | 1,323,000 | | $ | 24.98 | | 1,323,000 | | |
3144
Performance Graph
The following graph compares First Busey’s performance, as measured by the change in price of its common stock plus reinvested dividends, with the Nasdaq Composite and the SNLS&P US BMI Banks – Midwest Bank IndexRegion for the five years ended December 31, 2018.2021.
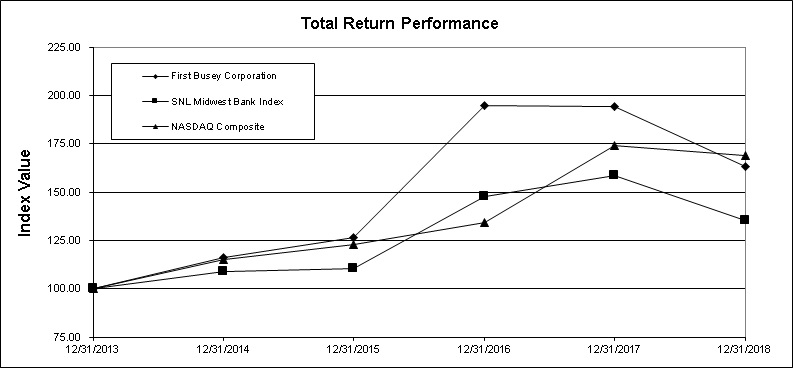
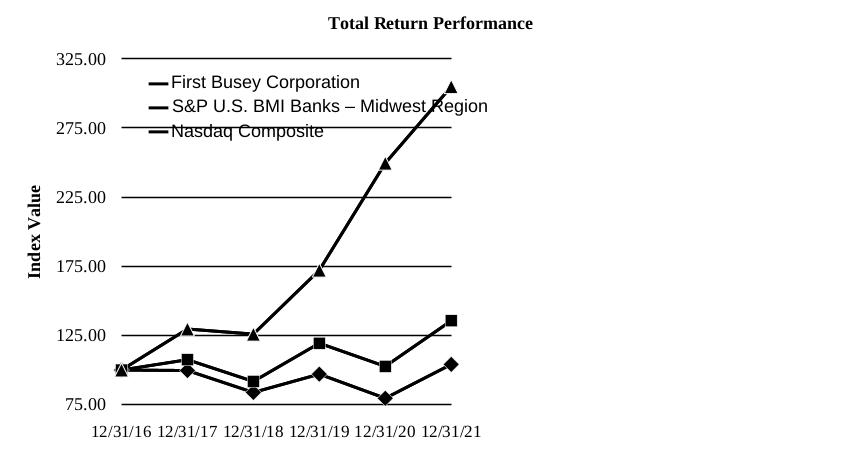
| | | | | | | | | | | | | | | | | | |
Index |
| 12/31/16 |
| 12/31/17 |
| 12/31/18 |
| 12/31/19 |
| 12/31/20 |
| 12/31/21 | ||||||
First Busey Corporation | | $ | 100.00 | | $ | 99.63 | | $ | 83.80 | | $ | 97.03 | | $ | 79.59 | | $ | 104.07 |
S&P U.S. BMI Banks – Midwest Region | |
| 100.00 | |
| 107.46 | |
| 91.76 | |
| 119.38 | |
| 102.64 | |
| 135.60 |
Nasdaq Composite | |
| 100.00 | |
| 129.64 | |
| 125.96 | |
| 172.17 | |
| 249.51 | |
| 304.85 |
|
|
|
|
|
|
|
|
|
|
|
|
|
|
|
|
|
|
|
Index |
| 12/31/13 |
| 12/31/14 |
| 12/31/15 |
| 12/31/16 |
| 12/31/17 |
| 12/31/18 | ||||||
First Busey Corporation |
| $ | 100.00 |
| $ | 116.00 |
| $ | 126.51 |
| $ | 194.86 |
| $ | 194.14 |
| $ | 163.30 |
SNL Midwest Bank Index |
|
| 100.00 |
|
| 108.71 |
|
| 110.36 |
|
| 147.46 |
|
| 158.46 |
|
| 135.31 |
Nasdaq Composite |
|
| 100.00 |
|
| 114.83 |
|
| 122.99 |
|
| 134.03 |
|
| 173.87 |
|
| 168.99 |
The banks inIn prior years, the Company used the SNL Midwest Bank Index, which was retired as of August 7, 2021. The S&P U.S. BMI Banks – Midwest Region is deemed the closest replacement currently available.
Banks in the S&P U.S. BMI Banks - Midwest Region represent all publicly traded banks, thrifts or financial service companies locatedMajor Exchange Traded Banks in Iowa,S&P Capital IQ’s coverage universe headquartered in Illinois, Indiana, Iowa, Kansas, Kentucky, Michigan, Minnesota, Missouri, North Dakota, Nebraska, Ohio, South Dakota, and Wisconsin.
ITEM 6. [Reserved]
ITEM 7. MANAGEMENT’S DISCUSSION AND ANALYSIS OF FINANCIAL CONDITION AND RESULTS OF OPERATIONS
Item 6. Selected Financial Data
Selected Consolidated Financial Information
The following selected financial data (dollars in thousands, except per share data), as of and for each of the periods indicated, has been derived from First Busey’s audited Consolidated Financial Statements and the results of operations for each period. This financial data should be read in conjunction with the Consolidated Financial Statements and the related Notes to the Consolidated Financial Statements included in this Annual Report. The per common share data provided below has been adjusted to reflect First Busey's one-for-three reverse stock split, which became effective on September 8, 2015 (the “Reverse Stock Split”). First Busey's periodic reports filed prior to the Reverse Stock Split have not been revised to reflect the Reverse Stock Split.
|
|
|
|
|
|
|
|
|
|
|
|
|
|
|
|
|
|
| 2018 |
| 2017 |
| 2016 |
| 2015 |
| 2014 |
| |||||
Balance Sheet Items |
|
|
|
|
|
|
|
|
|
|
|
|
|
|
|
|
Securities available for sale |
| $ | 697,685 |
| $ | 872,682 |
| $ | 759,811 |
| $ | 834,838 |
| $ | 759,065 |
|
Securities held to maturity |
|
| 608,660 |
|
| 443,550 |
|
| 47,820 |
|
| 49,832 |
|
| 2,373 |
|
Loans held for sale |
|
| 25,895 |
|
| 94,848 |
|
| 256,319 |
|
| 9,351 |
|
| 10,400 |
|
Portfolio loans |
|
| 5,568,428 |
|
| 5,519,500 |
|
| 3,878,900 |
|
| 2,627,739 |
|
| 2,405,290 |
|
Allowance for loan losses |
|
| 50,648 |
|
| 53,582 |
|
| 47,795 |
|
| 47,487 |
|
| 47,453 |
|
Total assets |
|
| 7,702,357 |
|
| 7,860,640 |
|
| 5,425,170 |
|
| 3,998,976 |
|
| 3,665,607 |
|
Tangible assets(1) |
|
| 7,410,346 |
|
| 7,563,606 |
|
| 5,311,271 |
|
| 3,969,001 |
|
| 3,640,903 |
|
Total deposits |
|
| 6,249,321 |
|
| 6,125,965 |
|
| 4,374,298 |
|
| 3,289,106 |
|
| 2,900,848 |
|
Short-term debt(2) |
|
| 185,796 |
|
| 524,566 |
|
| 264,157 |
|
| 172,972 |
|
| 198,893 |
|
Long-term debt |
|
| 50,000 |
|
| 50,000 |
|
| 80,000 |
|
| 80,000 |
|
| 50,000 |
|
Senior notes, net of unamortized issuance costs |
|
| 39,539 |
|
| 39,404 |
|
| — |
|
| — |
|
| — |
|
Subordinated notes, net of unamortized issuance costs |
|
| 59,147 |
|
| 64,715 |
|
| — |
|
| — |
|
| — |
|
Junior subordinated debt owed to unconsolidated trusts |
|
| 71,155 |
|
| 71,008 |
|
| 70,868 |
|
| 55,000 |
|
| 55,000 |
|
Stockholders’ equity |
|
| 994,964 |
|
| 935,003 |
|
| 594,314 |
|
| 373,186 |
|
| 433,639 |
|
Common stockholders’ equity |
|
| 994,964 |
|
| 935,003 |
|
| 594,314 |
|
| 373,186 |
|
| 360,975 |
|
Tangible common stockholders’ equity(3) |
|
| 702,953 |
|
| 637,969 |
|
| 480,415 |
|
| 343,211 |
|
| 336,271 |
|
Results of Operations |
|
|
|
|
|
|
|
|
|
|
|
|
|
|
|
|
Interest income |
| $ | 286,033 |
| $ | 224,302 |
| $ | 164,889 |
| $ | 118,022 |
| $ | 108,075 |
|
Interest expense |
|
| 44,627 |
|
| 20,936 |
|
| 10,229 |
|
| 6,207 |
|
| 6,499 |
|
Net interest income |
|
| 241,406 |
|
| 203,366 |
|
| 154,660 |
|
| 111,815 |
|
| 101,576 |
|
Provision for loan losses |
|
| 4,429 |
|
| 5,303 |
|
| 5,550 |
|
| 1,600 |
|
| 2,000 |
|
Net income available for common stockholders |
|
| 98,928 |
|
| 62,726 |
|
| 49,694 |
|
| 38,306 |
|
| 32,047 |
|
Per Share Data |
|
|
|
|
|
|
|
|
|
|
|
|
|
|
|
|
Diluted earnings |
| $ | 2.01 |
| $ | 1.45 |
| $ | 1.40 |
| $ | 1.32 |
| $ | 1.10 |
|
Cash dividends |
|
| 0.80 |
|
| 0.72 |
|
| 0.68 |
|
| 0.62 |
|
| 0.57 |
|
Book value(4) |
|
| 20.36 |
|
| 19.21 |
|
| 15.54 |
|
| 13.01 |
|
| 12.47 |
|
Tangible book value(5) |
|
| 14.21 |
|
| 12.88 |
|
| 12.37 |
|
| 11.86 |
|
| 11.52 |
|
Closing stock price |
|
| 24.54 |
|
| 29.94 |
|
| 30.78 |
|
| 20.63 |
|
| 19.53 |
|
Other Information |
|
|
|
|
|
|
|
|
|
|
|
|
|
|
|
|
Return on average assets |
|
| 1.28 | % |
| 1.00 | % |
| 1.00 | % |
| 0.98 | % |
| 0.91 | % |
Return on average common equity |
|
| 10.36 | % |
| 8.48 | % |
| 9.59 | % |
| 10.41 | % |
| 9.11 | % |
Net interest margin(6) |
|
| 3.45 | % |
| 3.58 | % |
| 3.42 | % |
| 3.10 | % |
| 3.15 | % |
Equity to assets ratio(7) |
|
| 12.33 | % |
| 11.75 | % |
| 10.42 | % |
| 9.39 | % |
| 9.94 | % |
Dividend payout ratio(8) |
|
| 39.80 | % |
| 49.66 | % |
| 48.57 | % |
| 46.97 | % |
| 51.82 | % |
|
|
|
|
|
|
|
|
|
|
|
|
|
|
|
|
33
Item 7. Management’s Discussion and Analysis of Financial Condition and Results of Operations
The following is management’s discussion and analysis of the financial condition as of December 31, 20182021, and 20172020, and the results of operations for the years ended December 31, 2018, 2017,2021, 2020, and 20162019, of First Busey and its subsidiaries. It should be read in conjunction with “Item“Item 1. Business,” “Item 6. Selected Financial Data,” the Consolidated Financial Statements, and the related Notes to the Consolidated Financial Statements included in this Annual Report.
Detailed discussion and analysis of the financial condition and results of operation for 2021 as compared to 2020 can be found below. Comparison of 2020 to 2019 can be found in “Item 7. Management’s Discussion and Analysis of Financial Condition and Results of Operations” of the 2020 Annual Report.
45
Impact of COVID-19
Although the progression of the COVID-19 pandemic in the U.S. has impacted First Busey’s results of operations, we continue to navigate the economic environment caused by COVID-19 effectively and prudently and remain resolute in our focus on serving our customers, communities, and associates while protecting our balance sheet. We remain vigilant, given that negative impacts of COVID-19, such as further margin compression and a deterioration in asset quality, could impact future quarters.
Effects on Our Market Areas
Our commercial and consumer banking products and services are delivered in Illinois, Missouri, Florida, and Indiana. Each state has taken different steps to reopen after COVID-19 thrust the country into lockdown starting in March 2020, and these efforts are subject to changes and delays based on case monitoring in each state.
Policy and Regulatory Developments
Federal, state, and local governments, and regulatory authorities have enacted and issued a range of policy responses to the COVID-19 pandemic. Regulatory actions taken during 2021 include the following:
| ● | On March 11, 2021, President Biden signed the American Rescue Plan Act of 2021, a $1.9 trillion relief package providing a third round of Economic Impact Payments to millions of eligible Americans, expanding unemployment benefits and tax credits, providing additional assistance to small businesses, and creating a $10 billion homeowner assistance fund. This fund can be used toward delinquent mortgage payments and is intended to minimize foreclosures in the coming months. An additional $7.25 billion in PPP funding was provided, and eligibility criteria was expanded to include some non-profit organizations. |
| ● | On March 30, 2021, President Biden signed the PPP Extension Act of 2021, which extended the PPP application deadline to May 31, 2021, or until funding was exhausted. PPP funding for loans originated by lenders other than community financial institutions was exhausted as of May 6, 2021. All PPP funding was exhausted as of May 28, 2021. |
Our Response
We have taken, and continue to take, numerous steps in response to the COVID-19 pandemic, including the following:
| ● | First Busey offered aFinancial Relief Program to qualifying customers designed to alleviate some of the financial hardships that they faced as a result of COVID-19. This program offered solutions for all types of customers—including retail, personal loan, and mortgage—as well as commercial clients and small businesses. The program included options for loan payment deferrals as well as certain fee waivers. As of December 31, 2021, we had 32 commercial loans remaining on interest-only payment deferrals representing $128.7 million in loans. In addition, as of December 31, 2021, we had two retail loans on payment deferrals representing $0.1 million. |
46
| ● | First Busey has served as a bridge for the PPP, actively helping existing and new business clients sign up for this important financial resource. The following table summarizes our PPP loans as of December 31, 2021 (dollars in thousand): |
| | | | | | | | | |
| | CARES | | Economic Aid | | PPP Loan | |||
|
| Act |
| Act |
| Totals | |||
Customers with PPP loans processed/acquired | | | 4,595 | | | 2,753 | | | 7,348 |
PPP loans originated/acquired | | $ | 765,212 | | $ | 324,593 | | $ | 1,089,805 |
| | | | | | | | | |
Customers with PPP loans outstanding | | | 51 | | | 741 | | | 792 |
PPP loans outstanding | | $ | 5,738 | | $ | 71,152 | | $ | 76,890 |
PPP loans outstanding, amortized cost | | | 5,731 | | | 69,227 | | | 74,958 |
| | | | | | | | | |
PPP loan balance forgiveness: | | | | | | | | | |
Received | | $ | 746,899 | | $ | 252,131 | | $ | 999,030 |
Balances submitted to the SBA for forgiveness | | | 1,952 | | | 5,144 | | | 7,096 |
Critical Accounting Estimates
First Busey has established various accounting policies that govern the application of GAAP in the preparation of its Consolidated Financial Statements. Significant accounting policies are described in “Note 1. Significant Accounting Policies” in the Notes to the Consolidated Financial Statements.
Critical accounting estimates are those that are critical to the portrayal and understanding of First Busey’s financial condition and results of operations and require management to make assumptions that are difficult, subjective, or complex. These estimates involve judgments, assumptions, and uncertainties that are susceptible to change. In the event that different assumptions or conditions were to prevail, and depending on the severity of such changes, the possibility of a materially different financial condition or materially different results of operations is a reasonable likelihood. Further, changes in accounting standards could impact the Company’sour critical accounting estimates. The following policies could be deemed critical:
Fair Value of Investment Securities. Debt Securities Available for Sale
The fair values of investmentdebt securities available for sale are measurements from an independent pricing service and are based on observable data that may include dealer quotes, market spreads, cash flows, the U.S. Treasury yield curve, live trading levels, trade execution data, market consensus prepayment speeds, credit information, and the security’s terms and conditions, among other things. The use of different judgments and estimates to determine the fair value of securities could result in a different fair value estimate.
Realized securities gains or losses are reported in the Consolidated Statements of Income. The cost of securities sold is based on the specific identification method. Declines in
A debt security available for sale is impaired if the fair value of debt securitiesthe security declines below theirits amortized cost are evaluated tobasis. To determine whether such declines are temporary or OTTI. If the Company (a) has the intentappropriate accounting, we must first determine if we intend to sell a debtthe security or (b)if it is more likely than not that we will more-likely-than-not be required to sell the debt security before the fair value increases to at least the amortized cost basis. If either of those selling events is expected, we will write down the amortized cost basis of the security to its anticipated recovery, thenfair value. This is achieved by writing off any previously recorded allowance, if applicable, and recognizing any incremental impairment through earnings. If we do not intend to sell the Company recognizessecurity, nor believe it more likely than not that we will be required to sell the entiresecurity before the fair value recovers to the amortized cost basis, we must determine whether any of the decline in fair value as an OTTI loss. If neither of these conditions are met, the Company evaluates whetherhas resulted from a credit loss, exists. Theor if it is entirely the result of noncredit factors.
47
We consider the following factors in assessing whether the decline is due to a credit loss:
| ● | Extent to which the fair value is less than the amortized cost basis; |
| ● | Adverse conditions specifically related to the security, an industry, or a geographic area (for example, changes in the financial condition of the issuer of the security, or in the case of an asset-backed debt security, in the financial condition of the underlying loan obligors); |
| ● | Payment structure of the debt security and the likelihood of the issuer being able to make payments that increase in the future; |
| ● | Failure of the issuer of the security to make scheduled interest or principal payments; and |
| ● | Any changes to the rating of the security by a rating agency. |
Impairment related to a credit loss must be measured using the discounted cash flow method. Credit loss recognition is limited to the fair value of the security. The impairment is separated into the amount of impairmentrecognized by establishing an allowance through provision for credit losses. Impairment related to the credit loss and the amount of impairment related to all other factors. The amount of the impairment related to credit loss is recognized in earnings, and the amount of impairment related to all othernoncredit factors is recognized in other comprehensive income (loss).AOCI, net of applicable taxes.
Fair Value of Assets Acquired and Liabilities Assumed in Business Combinations. Combinations
Business combinations are accounted for using the acquisition method of accounting. Under the acquisition method of accounting, assets acquired and liabilities assumed are recorded at their estimated fair value on the date of acquisition. Fair values are determined based on the definition of “fair value” defined in FASB ASC Topic 820 — Fair Value Measurement as “the price that would be received to sell an asset or paid to transfer a liability in an orderly transaction between market participants at the measurement date.”
The fair value of a loan portfolio acquired in a business combination generally requires greater levels of management estimates and judgment than other assets acquired or liabilities assumed. AtAcquired loans are in the scope of ASC 326. However, the offset to record the allowance at the date of acquisition whenon acquired loans have evidence of credit deterioration since origination and itdepends on whether or not the loan is probable that the Company will not collect all contractually required principal and interest payments, the difference between contractually required payments and the cash flows expected to be collected at acquisitionclassified as PCD. The allowance for PCD loans is referred to as the non-accretable difference. At each future reporting date, the Company re-estimates the expected cash flows of the loans. Subsequent decreases in the expected cash flows will generally result inrecorded through a provision for loan losses. Subsequent increases in the expected cash flows will generally be offset againstgross-up effect, while the allowance for loan losses toacquired non-PCD loans is recorded through provision expense, consistent with originated loans. Thus, the extent an allowance has been established or will be recognized as interest income prospectively.determination of which loans are PCD and non-PCD can have a significant effect on the accounting for these loans.
Goodwill. Goodwill
Goodwill represents the excess of purchase price over the fair value of net assets acquired using the acquisition method of accounting. Determining the fair value often involves estimates based on third-party valuations, such as appraisals, or internal valuations based on discounted cash flow analyses or other valuation techniques. Goodwill is not amortized, instead, the Companywe assess the potential for impairment on an annual basis or more frequently if events and circumstances indicate that goodwill might be impaired.
Income Taxes
First Busey estimates income tax expense based on amounts expected to be owed to federal and state tax jurisdictions. Estimated income tax expense is reported in the Consolidated Statements of Income. Accrued and deferred taxes, as reported in other assets or other liabilities in the Consolidated Balance Sheets, represent the net estimated amount due to or to be received from taxing jurisdictions either currently or in the future. Management judgment is involved in estimating accrued and deferred taxes, as it may be necessary to evaluate the risks and merits of the tax treatment of transactions, filing positions, and taxable income calculations after considering tax-related statutes, regulations, and other relevant factors. Because of the complexity of tax laws and interpretations, interpretation is subject to judgment.
Allowance for Loan Losses. Credit Losses
First Busey has establishedcalculates the ACL at each reporting date. We recognize an allowance for loanthe lifetime expected credit losses which represents its estimatefor the amount we do not expect to collect. Measurement of expected credit losses is based on relevant information about past events, including historical experience, current conditions, and reasonable and supportable forecasts that affect the collectability of the probable losses inherent inreported book value. The calculation also contemplates that First Busey may not be able to make or obtain such forecasts for the loan portfolio asentire life of the datefinancial assets and requires a reversion to historical credit loss information.
48
In determining the Consolidated Financial Statementsallowance, management relies predominantly on a disciplined credit review and reducesapproval process that extends to the total loans outstanding byfull range of First Busey’s credit exposure. The ACL must be determined on a collective (pool) basis when similar risk characteristics exists. On a case-by-case basis, we may conclude a loan should be evaluated on an estimate of uncollectible loans. individual basis based on the disparate risk characteristics.
Loans deemed uncollectible are charged against and reduce the allowance. A provision for loancredit losses is charged to current expense and acts to replenish the allowance for loan lossesACL in order to maintain the allowance at a level
34
that management deems adequate. Acquired loans from business combinations with uncollected principal balances are carried net of a fair value adjustment for credit and interest rates. These loans are only included inDetermining the allowance calculation to the extent that the reserve requirement exceeds the fair value adjustment. However, as the acquired loans renew, it is generally necessary to establish an allowance which represents an amount that, in management’s opinion, will be adequate to absorb probable credit losses in such loans.
To determine the adequacyinvolves significant judgments and assumptions by management. Because of the allowance for loan losses, a formal analysis is completed quarterly to assess the risk within the loan portfolio. This assessment is reviewed by the Company’s senior management. The analysis includes a review of historical performance, dollar amount and trends of past due loans, dollar amount and trends in non-performing loans, certain impaired loans, and loans identified as sensitive assets. Sensitive assets include non-accrual loans, past-due loans, loans on First Busey’s watch loan reports and other loans identified as having probable potential for loss.
The allowance consists of specific and general components. The specific component considers loans that are classified as impaired. For such loans that are classified as impaired, an allowance is established when either the discounted cash flows or collateral value or observable market pricenature of the impaired loan is lower than the carrying amount of that loan. The general component covers non-classified loansjudgments and classified loans not considered impaired,assumptions made by management, actual results may differ from these judgments and is based on historical loss experience adjusted for qualitative factors. Other adjustments may be made to the allowance for pools of loans after an assessment of internal or external influences on credit quality that are not fully reflected in the historical loss experience.assumptions.
A loan is considered to be impaired when, based on current information and events, it is probable First Busey will not be able to collect all principal and interest amounts due according to the contractual terms of the loan agreement. When a loan becomes impaired, management generally calculates the impairment based on the fair value of the collateral, if the loan is collateral-dependent or based on the discounted cash flows of the loan at the loan’s effective interest rate. The amount of impairment and any subsequent changes are recorded through a charge to the provision for loan losses. For collateral dependent loans, the allowance is based upon the estimated fair value, net of selling costs, of the applicable collateral. The required allowance or actual loss on an impaired loan could differ significantly if the ultimate fair value of the collateral is significantly different from the fair value estimate.
Executive Summary
Operating Results
Results of our operations are presented below, segregated by operating segment (dollars in thousands):
|
|
|
|
| |||||||||||
|
| Years Ended December 31, | |||||||||||||
|
| 2018 |
| 2017 | |||||||||||
Net income by operating segment: |
|
|
|
| |||||||||||
| | | | | | | | | | ||||||
| | Years Ended December 31, | |||||||||||||
|
| 2021 |
| 2020 |
| 2019 | |||||||||
Net income by operating segment |
| |
|
| |
|
| |
| ||||||
Banking |
| $ | 97,369 |
| $ | 65,704 | | $ | 117,844 | | $ | 101,226 | | $ | 106,409 |
Remittance Processing |
| 3,710 |
| 2,007 | |||||||||||
FirsTech | |
| 1,527 | |
| 2,372 | |
| 4,060 | ||||||
Wealth Management |
| 9,372 |
| 6,229 | |
| 18,570 | |
| 13,181 | |
| 11,135 | ||
Other |
|
| (11,523) |
| (11,214) | |
| (14,492) | |
| (16,435) | |
| (18,651) | |
Net income |
| $ | 98,928 |
| $ | 62,726 | | $ | 123,449 | | $ | 100,344 | | $ | 102,953 |
Operating Performance
The Company recorded net income of $98.9 million forOperating performance metrics presented in the year ended December 31, 2018, an increase of $36.2 million comparedtable below have been derived from information used by management to $62.7 million for the year ended 2017. Earningsmonitor and manage our financial performance (dollars in thousands, except per diluted common share were $2.01 for the year ended December 31, 2018 as compared to $1.45 for the year ended December 31, 2017. Adjusted net income(1) for the year ended December 31, 2018 was $103.5 million, or $2.10 per diluted common share, as compared to $75.7 million, or $1.75 per diluted common share for 2017. The 2018 annual results were favorably impacted by the prior year acquisitions of First Community and Mid Illinois.amounts):
| | | | | | | | | | | |
| | | Years Ended December 31, |
| |||||||
| |
| 2021 |
| 2020 |
| 2019 |
| |||
Reported: | Net income | | $ | 123,449 | | $ | 100,344 | | $ | 102,953 | |
Adjusted: | Net income (1) | |
| 137,108 | |
| 108,728 | |
| 118,429 | |
| | | | | | | | | | | |
Reported: | Diluted earnings per common share | | $ | 2.20 | | $ | 1.83 | | $ | 1.87 | |
Adjusted: | Diluted earnings per common share (1) | | | 2.45 | | | 1.98 | | | 2.15 | |
| | | | | | | | | | | |
Reported: | Pre-provision net revenue (1) | | $ | 138,652 | | $ | 165,672 | | $ | 144,862 | |
Adjusted: | Pre-provision net revenue (1) | | | 160,792 | | | 180,516 | | | 166,156 | |
| | | | | | | | | | | |
Reported: | Pre-provision net revenue to average assets (1) | |
| 1.16 | % |
| 1.61 | % |
| 1.53 | % |
Adjusted: | Pre-provision net revenue to average assets (1) | |
| 1.35 | % |
| 1.75 | % |
| 1.76 | % |
| (3) | See “Item 1. Business—Non-GAAP Financial Information.” |
On JanuaryMay 31, 2019, the Company2021, First Busey completed its acquisition of Banc Ed, which is identifiedCAC, the holding company for GSB. GSB was operated as a “subsequent event”separate banking subsidiary from June 1, 2021, until August 14, 2021, when it was merged with and into Busey Bank. At that time GSB’s seven banking centers became banking centers of Busey Bank. When we completed the GSB acquisition, we reset the baseline for the future financial performance of First Busey in a multitude of positive ways. With GSB now merged and integrated, we expect to see the full contribution of synergies of GSB reflected in our financial performance in the Notes to the Consolidated Financial Statements included in this Annual Report on Form 10-K. The operating resultsyears ahead.
49
On November 19, 2021, 17 banking centers, two of which were previously GSB banking centers, were closed and consolidated, as part of the Company’s Consolidated Financial Statements included herein.efforts to ensure a balance between its physical banking center network and robust digital banking services while also optimizing operating efficiency. Following the completion of these banking center closures and consolidations, the Company continues to operate a total of 58 banking centers across its markets.
The CompanyFirst Busey views certain non-operating items, including but not limited to, acquisitionacquisition-related and restructuring charges, and the 2017 tax adjustment related to the TCJA as adjustments to net income.income reported under GAAP. Non-operating pretax adjustments for 2018 include2021 included $13.6 million of expenses related to acquisitions and $3.7 million of pre-tax acquisition costs, $0.8 million in pre-tax fixed asset impairments and $1.1 million in pre-taxexpenses related to other restructuring costs. The reconciliation of non-GAAP measures (including pre-provision net revenue, adjusted pre-provision net revenue, pre-provision net revenue to average assets, adjusted pre-provision net revenue to average assets, adjusted net income, adjusted earnings per share, adjusted return on average assets, adjusted net interest margin, adjusted noninterest expense, efficiency ratio, adjusted efficiency ratio, tangible common equity, tangible common equity to tangible assets, tangible book value per share, and return on average tangible common equity), which the CompanyFirst Busey believes facilitates the assessment of its financial results and peer comparability, is included in tabular form in this Annual Report on Form 10-K.Report. See “Item 1. Business—Non-GAAP Financial Information.
|
|
Information.”
35
RevenuesCombined, revenues from trust fees, commissions and brokers’wealth management fees and remittance processingpayment technology solutions activities represented 50.4%53.8% of the Company’s non-interestFirst Busey’s noninterest income in 2018,2021, providing a balance to spread-based revenue from traditional banking activities. TwoFurther, noninterest income, excluding net securities gains (losses) represented 32.4% of total revenue for the Company’s acquisitions, Pulaski and First Community, had no legacy fee income in these businesses; therefore, the addition of First Busey’s fee-based service offerings in the respective acquired bank markets is expected to continue providing attractive growth opportunities in future periods.
Asset Quality
As ofyear ended December 31, 2018, the Company reported non-performing loans of $36.6 million compared to $27.4 million as of December 31, 2017. Non-performing loans were 0.66% of total portfolio loans as of December 31, 2018 compared to 0.50% as of December 31, 2017. With a continued commitment to asset quality and the strength of our balance sheet, near-term loan losses are expected to remain generally low. While these results are encouraging, asset quality metrics can be generally influenced by market-specific economic conditions, and specific measures may fluctuate from period to period. The key metrics are as follows (dollars in thousands):2021.
|
|
|
|
|
|
|
|
|
|
|
|
|
|
|
|
|
| December 31, |
| December 31, |
| ||
|
| 2018 |
| 2017 |
| ||
Portfolio loans |
| $ | 5,568,428 |
| $ | 5,519,500 |
|
Allowance for loan losses |
|
| 50,648 |
|
| 53,582 |
|
Non-performing loans |
|
|
|
|
|
|
|
Non-accrual loans |
|
| 34,997 |
|
| 24,624 |
|
Loans 90+ days past due |
|
| 1,601 |
|
| 2,741 |
|
Loans 30-89 days past due |
|
| 7,121 |
|
| 12,897 |
|
Other non-performing assets |
|
| 376 |
|
| 1,283 |
|
Allowance as a percentage of non-performing loans |
|
| 138.4 | % |
| 195.8 | % |
Allowance for loan losses to portfolio loans |
|
| 0.91 | % |
| 0.97 | % |
Results of Operation — Three Years Ended December 31, 20182021
Net Interest Income
Net interest income is the difference between interest income and fees earned on earning assets and interest expense incurred on interest-bearing liabilities. Interest rate levels and volume fluctuations within earning assets and interest-bearing liabilities impact net interest income. Net interest margin is tax-equivalent net interest income as a percent of average earning assets.
Certain assets with tax favorable treatment are evaluated on a tax-equivalent basis. Tax-equivalent basis assumes ana federal income tax rate of 21% in 2018 and 35% in 2017 and 2016.21.0%. Tax favorable assets generally have lower contractual pre-tax yields than fully taxable assets. A tax-equivalent analysis is performed by adding the tax savings to the earnings on tax favorable assets. After factoring in the tax favorable effects of these assets, the yields may be more appropriately evaluated against alternative earning assets. In addition to yield, various other risks are factored into the evaluation process.
The following tables (dollars in thousands) show our Consolidated Average Balance Sheets, detailing the major categories of assets and liabilities, the interest income earned on interest-earning assets, the interest expense paid for the interest-bearing liabilities, and the related interest rates for the periods shown. The tables also show, for the periods indicated, a summary of the changes in interest earned and interest expense resulting from changes in volume and rates for the major components of interest-earning assets and interest-bearing liabilities. For purposes of this table, changes attributable to both rate and volume, which cannot be segregated, have been allocated proportionately, based on changes due to rate and changes due to volume. All average information is provided on a daily average basis.
3650
Average Balance Sheets and Interest Rates
Average balances, income and expense, and yield rates are presented below for the periods indicated (dollars in thousands):
| | | | | | | | | | | | | | | | | | | | | | | | | | | |
| | Years Ended December 31, | | ||||||||||||||||||||||||
| | 2021 | | | 2020 | | | 2019 | | ||||||||||||||||||
|
| Average |
| Income/ |
| Yield/ | | | Average |
| Income/ |
| Yield/ | | | Average |
| Income/ |
| Yield/ | | ||||||
| | Balance |
| Expense |
| Rate | |
| Balance |
| Expense |
| Rate | |
| Balance |
| Expense |
| Rate | | ||||||
Assets | | | | | | | | | | | | | | | | | | | | | | | | | | | |
Interest-bearing bank deposits and federal funds sold | | $ | 630,687 | | $ | 1,151 |
| 0.18 | % | | $ | 488,786 | | $ | 1,723 |
| 0.35 | % | | $ | 312,604 | | | 6,320 |
| 2.02 | % |
Investment securities: | |
|
| |
|
|
|
| | |
| | |
|
|
|
| | |
|
| |
|
|
|
| |
U.S. Government obligations | |
| 180,041 | |
| 1,692 |
| 0.94 | % | |
| 135,204 | |
| 2,915 |
| 2.16 | % | |
| 300,805 | |
| 7,323 |
| 2.43 | % |
Obligations of states and political subdivisions (1) | |
| 299,064 | |
| 7,694 | | 2.57 | % | |
| 293,070 | |
| 8,353 |
| 2.85 | % | |
| 281,460 | |
| 8,294 |
| 2.95 | % |
Other securities | |
| 2,876,714 | |
| 37,166 |
| 1.29 | % | |
| 1,411,826 | |
| 29,857 |
| 2.11 | % | |
| 1,187,026 | |
| 31,335 |
| 2.64 | % |
Loans held for sale | |
| 21,803 | |
| 506 |
| 2.32 | % | |
| 82,106 | |
| 2,184 |
| 2.66 | % | |
| 38,447 | |
| 1,275 |
| 3.32 | % |
Portfolio loans (1), (2) | |
| 6,969,807 | |
| 252,946 |
| 3.63 | % | |
| 7,006,946 | |
| 284,306 |
| 4.06 | % | |
| 6,469,920 | |
| 304,700 |
| 4.71 | % |
Total interest-earning assets (1), (3) | | $ | 10,978,116 | | $ | 301,155 |
| 2.74 | % | | $ | 9,417,938 | | $ | 329,338 |
| 3.50 | % | | $ | 8,590,262 | | $ | 359,247 |
| 4.18 | % |
| | | | | | | | | | | | | | | | | | | | | | | | | | | |
Cash and due from banks | |
| 133,711 | |
|
|
|
| | |
| 118,739 | |
|
|
|
| | |
| 114,619 | |
|
|
|
| |
Premises and equipment | |
| 138,731 | |
| |
|
| | |
| 146,144 | |
| |
|
| | |
| 148,063 | |
| |
|
| |
ACL | |
| (97,397) | |
| |
|
| | |
| (88,248) | |
| |
|
| | |
| (52,284) | |
| |
|
| |
Other assets | |
| 751,774 | |
|
|
|
| | |
| 697,683 | |
|
|
|
| | |
| 643,030 | |
|
|
|
| |
Total assets | | $ | 11,904,935 | |
|
|
|
| | | $ | 10,292,256 | |
|
|
|
| | | $ | 9,443,690 | |
|
|
|
| |
| | | | | | | | | | | | | | | | | | | | | | | | | | | |
Liabilities and Stockholders’ Equity | |
|
|
|
| | |
|
| |
|
|
|
| | |
|
| |
|
|
|
| | |||
Interest-bearing transaction deposits | | $ | 2,619,942 | | $ | 1,922 |
| 0.07 | % | | $ | 2,153,230 | | $ | 4,718 |
| 0.22 | % | | $ | 1,865,506 | | $ | 10,638 |
| 0.57 | % |
Savings and money market deposits | |
| 3,092,992 | |
| 2,817 |
| 0.09 | % | |
| 2,567,962 | |
| 5,960 |
| 0.23 | % | |
| 2,386,171 | |
| 13,767 |
| 0.58 | % |
Time deposits | |
| 1,040,709 | |
| 7,844 |
| 0.75 | % | |
| 1,356,347 | |
| 20,013 |
| 1.48 | % | |
| 1,675,477 | |
| 30,672 |
| 1.83 | % |
Federal funds purchased and repurchase agreements | |
| 218,454 | | | 227 |
| 0.10 | % | |
| 187,811 | |
| 660 |
| 0.35 | % | |
| 196,681 | |
| 2,348 |
| 1.19 | % |
Borrowings (4) | |
| 268,767 | | | 12,452 |
| 4.63 | % | |
| 217,702 | |
| 9,352 |
| 4.30 | % | |
| 219,920 | |
| 8,172 |
| 3.72 | % |
Junior subordinated debt issued to unconsolidated trusts | |
| 71,545 | | | 2,840 |
| 3.97 | % | |
| 71,376 | |
| 2,960 |
| 4.15 | % | |
| 71,214 | |
| 3,414 |
| 4.79 | % |
Total interest-bearing liabilities | | $ | 7,312,409 | | $ | 28,102 |
| 0.38 | % | | $ | 6,554,428 | | $ | 43,663 |
| 0.67 | % | | $ | 6,414,969 | | $ | 69,011 |
| 1.08 | % |
| | | | | | | | | | | | | | | | | | | | | | | | | | | |
Net interest spread (1) | |
|
| |
| |
| 2.36 | % | |
|
| |
| |
| 2.83 | % | |
|
| |
| |
| 3.10 | % |
| | | | | | | | | | | | | | | | | | | | | | | | | | | |
Noninterest-bearing deposits | |
| 3,142,155 | |
|
|
|
| | |
| 2,364,442 | |
|
|
|
| | |
| 1,746,938 | |
|
|
|
| |
Other liabilities | |
| 125,509 | |
|
|
|
| | |
| 133,012 | |
|
|
|
| | |
| 95,656 | |
|
|
|
| |
Stockholders’ equity | |
| 1,324,862 | |
|
|
|
| | |
| 1,240,374 | |
|
|
|
| | |
| 1,186,127 | |
|
|
|
| |
Total liabilities and stockholders’ equity | | $ | 11,904,935 | |
|
|
|
| | | $ | 10,292,256 | |
|
|
|
| | | $ | 9,443,690 | |
|
|
|
| |
| | | | | | | | | | | | | | | | | | | | | | | | | | | |
Interest income / earning assets (1), (3) | | $ | 10,978,116 | | $ | 301,155 |
| 2.74 | % | | $ | 9,417,938 | | $ | 329,338 |
| 3.50 | % | | $ | 8,590,262 | | $ | 359,247 |
| 4.18 | % |
Interest expense / earning assets | | $ | 10,978,116 | | $ | 28,102 |
| 0.25 | % | | $ | 9,417,938 | | $ | 43,663 |
| 0.47 | % | | $ | 8,590,262 | | $ | 69,011 |
| 0.80 | % |
Net interest margin (1) | |
|
| | $ | 273,053 |
| 2.49 | % | |
|
| | $ | 285,675 |
| 3.03 | % | |
|
| | $ | 290,236 |
| 3.38 | % |
|
|
|
|
|
|
|
|
|
|
|
|
|
|
|
|
|
|
|
|
|
|
|
|
|
|
|
| Years Ended December 31, | |||||||||||||||||||||||
|
| 2018 |
| 2017 |
| 2016 |
| ||||||||||||||||||
|
| Average |
| Income/ |
| Yield/ |
| Average |
| Income/ |
| Yield/ |
| Average |
| Income/ |
| Yield/ |
| ||||||
|
| Balance |
| Expense |
| Rate |
| Balance |
| Expense |
| Rate |
| Balance |
| Expense |
| Rate |
| ||||||
Assets |
|
|
|
|
|
|
|
|
|
|
|
|
|
|
|
|
|
|
|
|
|
|
|
|
|
Interest-bearing bank deposits and federal funds sold |
| $ | 134,035 |
| $ | 2,491 |
| 1.86 | % | $ | 132,464 |
| $ | 1,444 |
| 1.09 | % | $ | 233,804 |
| $ | 1,093 |
| 0.47 | % |
Investment securities: |
|
|
|
|
|
|
|
|
|
|
|
|
|
|
|
|
|
|
|
|
|
|
|
|
|
U.S. Government obligations |
|
| 152,086 |
|
| 2,501 |
| 1.64 | % |
| 148,116 |
|
| 2,112 |
| 1.43 | % |
| 185,855 |
|
| 2,143 |
| 1.15 | % |
Obligations of states and political subdivisions(1) |
|
| 284,262 |
|
| 7,386 |
| 2.60 | % |
| 243,403 |
|
| 7,219 |
| 2.97 | % |
| 212,559 |
|
| 6,102 |
| 2.87 | % |
Other securities |
|
| 934,112 |
|
| 23,654 |
| 2.53 | % |
| 573,230 |
|
| 12,960 |
| 2.26 | % |
| 439,470 |
|
| 9,397 |
| 2.14 | % |
Loans held for sale |
|
| 29,666 |
|
| 1,241 |
| 4.18 | % |
| 119,936 |
|
| 4,479 |
| 3.73 | % |
| 164,728 |
|
| 5,997 |
| 3.64 | % |
Portfolio loans(1), (2) |
|
| 5,533,549 |
|
| 251,018 |
| 4.54 | % |
| 4,567,259 |
|
| 199,744 |
| 4.37 | % |
| 3,394,352 |
|
| 143,650 |
| 4.23 | % |
Total interest-earning assets(1), (3) |
| $ | 7,067,710 |
| $ | 288,291 |
| 4.08 | % | $ | 5,784,408 |
| $ | 227,958 |
| 3.94 | % | $ | 4,630,768 |
| $ | 168,382 |
| 3.64 | % |
|
|
|
|
|
|
|
|
|
|
|
|
|
|
|
|
|
|
|
|
|
|
|
|
|
|
Cash and due from banks |
|
| 105,114 |
|
|
|
|
|
|
| 92,184 |
|
|
|
|
|
|
| 70,785 |
|
|
|
|
|
|
Premises and equipment |
|
| 119,388 |
|
|
|
|
|
|
| 93,025 |
|
|
|
|
|
|
| 74,919 |
|
|
|
|
|
|
Allowance for loan losses |
|
| (53,789) |
|
|
|
|
|
|
| (50,924) |
|
|
|
|
|
|
| (47,294) |
|
|
|
|
|
|
Other assets |
|
| 503,719 |
|
|
|
|
|
|
| 375,412 |
|
|
|
|
|
|
| 244,735 |
|
|
|
|
|
|
Total assets |
| $ | 7,742,142 |
|
|
|
|
|
| $ | 6,294,105 |
|
|
|
|
|
| $ | 4,973,913 |
|
|
|
|
|
|
|
|
|
|
|
|
|
|
|
|
|
|
|
|
|
|
|
|
|
|
|
|
|
|
|
|
Liabilities and Stockholders’ Equity |
|
|
|
|
|
|
|
|
|
|
|
|
|
|
|
|
|
|
|
|
|
|
|
|
|
Interest-bearing transaction deposits |
| $ | 1,257,491 |
| $ | 4,532 |
| 0.36 | % | $ | 1,103,245 |
| $ | 1,980 |
| 0.18 | % | $ | 924,078 |
| $ | 810 |
| 0.09 | % |
Savings and money market deposits |
|
| 1,958,435 |
|
| 6,968 |
| 0.36 | % |
| 1,729,492 |
|
| 3,805 |
| 0.22 | % |
| 1,392,335 |
|
| 2,233 |
| 0.16 | % |
Time deposits |
|
| 1,491,363 |
|
| 21,101 |
| 1.41 | % |
| 927,736 |
|
| 7,147 |
| 0.77 | % |
| 721,124 |
|
| 4,022 |
| 0.56 | % |
Short-term borrowings: |
|
|
|
|
|
|
|
|
|
|
|
|
|
|
|
|
|
|
|
|
|
|
|
|
|
Federal funds purchased and repurchase agreements |
|
| 234,587 |
|
| 1,626 |
| 0.69 | % |
| 213,531 |
|
| 978 |
| 0.46 | % |
| 181,644 |
|
| 393 |
| 0.22 | % |
Other(4) |
|
| 81,438 |
|
| 1,536 |
| 1.89 | % |
| 84,201 |
|
| 1,096 |
| 1.30 | % |
| 99,294 |
|
| 641 |
| 0.65 | % |
Long-term debt(5) |
|
| 152,638 |
|
| 5,614 |
| 3.68 | % |
| 128,417 |
|
| 3,404 |
| 2.65 | % |
| 80,000 |
|
| 220 |
| 0.28 | % |
Junior subordinated debt issued to unconsolidated trusts |
|
| 71,065 |
|
| 3,250 |
| 4.57 | % |
| 70,922 |
|
| 2,526 |
| 3.56 | % |
| 65,540 |
|
| 1,910 |
| 2.91 | % |
Total interest-bearing liabilities |
| $ | 5,247,017 |
| $ | 44,627 |
| 0.85 | % | $ | 4,257,544 |
| $ | 20,936 |
| 0.49 | % | $ | 3,464,015 |
| $ | 10,229 |
| 0.30 | % |
|
|
|
|
|
|
|
|
|
|
|
|
|
|
|
|
|
|
|
|
|
|
|
|
|
|
Net interest spread(1) |
|
|
|
|
|
|
| 3.23 | % |
|
|
|
|
|
| 3.45 | % |
|
|
|
|
|
| 3.34 | % |
|
|
|
|
|
|
|
|
|
|
|
|
|
|
|
|
|
|
|
|
|
|
|
|
|
|
Noninterest-bearing deposits |
|
| 1,492,242 |
|
|
|
|
|
|
| 1,252,363 |
|
|
|
|
|
|
| 949,271 |
|
|
|
|
|
|
Other liabilities |
|
| 47,934 |
|
|
|
|
|
|
| 44,373 |
|
|
|
|
|
|
| 42,375 |
|
|
|
|
|
|
Stockholders’ equity |
|
| 954,949 |
|
|
|
|
|
|
| 739,825 |
|
|
|
|
|
|
| 518,252 |
|
|
|
|
|
|
Total liabilities and stockholders’ equity |
| $ | 7,742,142 |
|
|
|
|
|
| $ | 6,294,105 |
|
|
|
|
|
| $ | 4,973,913 |
|
|
|
|
|
|
|
|
|
|
|
|
|
|
|
|
|
|
|
|
|
|
|
|
|
|
|
|
|
|
|
|
|
|
|
|
|
|
|
|
|
|
|
|
|
|
|
|
|
|
|
|
|
|
|
|
|
|
Interest income / earning assets(1), (3) |
| $ | 7,067,710 |
| $ | 288,291 |
| 4.08 | % | $ | 5,784,408 |
| $ | 227,958 |
| 3.94 | % | $ | 4,630,768 |
| $ | 168,382 |
| 3.64 | % |
Interest expense / earning assets |
| $ | 7,067,710 |
| $ | 44,627 |
| 0.63 | % | $ | 5,784,408 |
| $ | 20,936 |
| 0.36 | % | $ | 4,630,768 |
| $ | 10,229 |
| 0.22 | % |
Net interest margin(1) |
|
|
|
| $ | 243,664 |
| 3.45 | % |
|
|
| $ | 207,022 |
| 3.58 | % |
|
|
| $ | 158,153 |
| 3.42 | % |
| On a tax-equivalent basis, assuming a federal income tax rate of |
| Non-accrual loans have been included in average portfolio loans. |
| Interest income includes a tax-equivalent adjustment of |
| Includes |
|
|
3751
Average Balance Sheets and Interest Rates (continued)
Changes in Net Interest Income:Income are presented in the table below:
|
|
|
|
|
|
|
|
|
|
|
|
|
|
|
|
|
|
|
| |||||||||||||||||||
|
| Years Ended December 31, 2018, 2017 and 2016 |
| |||||||||||||||||||||||||||||||||||
|
| Year 2018 vs. 2017 Change due to |
| Year 2017 vs. 2016 Change due to |
| |||||||||||||||||||||||||||||||||
|
| Average |
| Average |
| Total |
| Average |
| Average |
| Total |
| |||||||||||||||||||||||||
|
| Volume |
| Yield/Rate |
| Change |
| Volume |
| Yield/Rate |
| Change |
| |||||||||||||||||||||||||
Increase (decrease) in interest income: |
|
|
|
|
|
|
|
|
|
|
|
|
|
|
|
|
|
|
| |||||||||||||||||||
| | | | | | | | | | | | | | | | | | | | |||||||||||||||||||
| | Years Ended December 31, |
| |||||||||||||||||||||||||||||||||||
| | 2021 vs. 2020 Change Due To | | 2020 vs. 2019 Change Due To |
| |||||||||||||||||||||||||||||||||
|
| Average |
| Average |
| Total |
| Average |
| Average |
| Total |
| |||||||||||||||||||||||||
| | Volume |
| Yield/Rate |
| Change | | Volume |
| Yield/Rate |
| Change |
| |||||||||||||||||||||||||
Increase (decrease) in interest income | | | | | | | | | | | | | | | | | | | | |||||||||||||||||||
Interest-bearing bank deposits and federal funds sold |
| $ | 7 |
| $ | 1,040 |
| $ | 1,047 |
| $ | (630) |
| $ | 981 |
| $ | 351 |
| | $ | 410 | | $ | (982) | | $ | (572) | | $ | 2,369 | | $ | (6,966) | | $ | (4,597) | |
Investment securities: |
|
|
|
|
|
|
|
|
|
|
|
|
|
|
|
|
|
|
| |
|
| |
|
| |
|
| |
|
| |
|
| |
|
| |
U.S. Government obligations |
|
| 58 |
|
| 331 |
|
| 389 |
|
| (483) |
|
| 452 |
|
| (31) |
| |
| 765 | |
| (1,988) | |
| (1,223) | |
| (3,650) | |
| (758) | |
| (4,408) | |
Obligations of state and political subdivisions |
|
| 1,125 |
|
| (958) |
|
| 167 |
|
| 909 |
|
| 208 |
|
| 1,117 |
| |
| 168 | |
| (827) | |
| (659) | |
| 336 | |
| (277) | |
| 59 | |
Other securities |
|
| 8,982 |
|
| 1,712 |
|
| 10,694 |
|
| 2,998 |
|
| 565 |
|
| 3,563 |
| |
| 22,213 | |
| (14,904) | |
| 7,309 | |
| 5,359 | |
| (6,837) | |
| (1,478) | |
Loans held for sale |
|
| (3,720) |
|
| 482 |
|
| (3,238) |
|
| (1,669) |
|
| 151 |
|
| (1,518) |
| |
| (1,430) | |
| (248) | |
| (1,678) | |
| 1,204 | |
| (295) | |
| 909 | |
Portfolio loans |
|
| 43,598 |
|
| 7,676 |
|
| 51,274 |
|
| 88,186 |
|
| (32,092) |
|
| 56,094 |
| |
| (1,499) | |
| (29,861) | |
| (31,360) | |
| 23,979 | |
| (44,373) | |
| (20,394) | |
Change in interest income |
| $ | 50,050 |
| $ | 10,283 |
| $ | 60,333 |
| $ | 89,311 |
| $ | (29,735) |
| $ | 59,576 |
| | $ | 20,627 | | $ | (48,810) | | $ | (28,183) | | $ | 29,597 | | $ | (59,506) | | $ | (29,909) | |
|
|
|
|
|
|
|
|
|
|
|
|
|
|
|
|
|
|
|
| |||||||||||||||||||
Increase (decrease) in interest expense: |
|
|
|
|
|
|
|
|
|
|
|
|
|
|
|
|
|
|
| |||||||||||||||||||
| | | | | | | | | | | | | | | | | | | | |||||||||||||||||||
Increase (decrease) in interest expense | |
|
| |
|
| |
|
| |
|
| |
|
| |
|
| | |||||||||||||||||||
Interest-bearing transaction deposits |
| $ | 311 |
| $ | 2,241 |
| $ | 2,552 |
| $ | 183 |
| $ | 987 |
| $ | 1,170 |
| | $ | 855 | | $ | (3,651) | | $ | (2,796) | | $ | 1,438 | | $ | (7,358) | | $ | (5,920) | |
Savings and money market deposits |
|
| 355 |
|
| 2,808 |
|
| 3,163 |
|
| 574 |
|
| 998 |
|
| 1,572 |
| |
| 931 | |
| (4,074) | | | (3,143) | |
| 769 | |
| (8,576) | |
| (7,807) | |
Time deposits |
|
| 5,870 |
|
| 8,084 |
|
| 13,954 |
|
| 1,341 |
|
| 1,784 |
|
| 3,125 |
| |
| (3,923) | |
| (8,246) | |
| (12,169) | |
| (5,281) | |
| (5,378) | |
| (10,659) | |
Short-term borrowings: |
|
|
|
|
|
|
|
|
|
|
|
|
|
|
|
|
|
|
| |||||||||||||||||||
Federal funds purchased and repurchase agreements |
|
| 103 |
|
| 545 |
|
| 648 |
|
| 79 |
|
| 506 |
|
| 585 |
| |
| 95 | |
| (528) | |
| (433) | |
| (109) | |
| (1,579) | |
| (1,688) | |
Other |
|
| (37) |
|
| 477 |
|
| 440 |
|
| (110) |
|
| 565 |
|
| 455 |
| |||||||||||||||||||
Long-term debt |
|
| 723 |
|
| 1,487 |
|
| 2,210 |
|
| 208 |
|
| 2,976 |
|
| 3,184 |
| |||||||||||||||||||
Borrowings | |
| 2,289 | |
| 811 | |
| 3,100 | |
| 260 | |
| 920 | |
| 1,180 | | |||||||||||||||||||
Junior subordinated debt owed to unconsolidated trusts |
|
| 5 |
|
| 719 |
|
| 724 |
|
| 166 |
|
| 450 |
|
| 616 |
| |
| 7 | |
| (127) | |
| (120) | |
| 8 | |
| (462) | |
| (454) | |
Change in interest expense |
| $ | 7,330 |
| $ | 16,361 |
| $ | 23,691 |
| $ | 2,441 |
| $ | 8,266 |
| $ | 10,707 |
| | $ | 254 | | $ | (15,815) | | $ | (15,561) | | $ | (2,915) | | $ | (22,433) | | $ | (25,348) | |
Increase (decrease) in net interest income |
| $ | 42,720 |
| $ | (6,078) |
| $ | 36,642 |
| $ | 86,870 |
| $ | (38,001) |
| $ | 48,869 |
| | $ | 20,373 | | $ | (32,995) | | $ | (12,622) | | $ | 32,512 | | $ | (37,073) | | $ | (4,561) | |
|
|
|
|
|
|
|
|
|
|
|
|
|
|
|
|
|
|
|
| |||||||||||||||||||
Percentage increase in net interest income over prior period |
|
|
|
|
|
|
|
| 17.7 | % |
|
|
|
|
|
|
| 30.9 | % | |||||||||||||||||||
| | | | | | | | | | | | | | | | | | | | |||||||||||||||||||
Percentage (decrease) increase in net interest income over prior period | |
|
| |
|
| |
| (4.4) | % |
|
| |
|
| |
| (1.6) | % | |||||||||||||||||||
Earning Assets, Sources of Funds, and Net Interest Margin
Changes in average earning assets, sources of funds, and net interest margin are presented in the tables below (dollars in thousands):
| | | | | | | | | | | | | |
| | Years Ended December 31, | | | | | | | | ||||
|
| 2021 |
| 2020 |
| Change |
| % Change |
| ||||
Average interest-earning assets | | $ | 10,978,116 | | $ | 9,417,938 | | $ | 1,560,178 | | | 16.6 | % |
Average interest-bearing liabilities | | | 7,312,409 | | | 6,554,428 | | | 757,981 | | | 11.6 | % |
Average noninterest-bearing deposits | | | 3,142,155 | | | 2,364,442 | | | 777,713 | | | 32.9 | % |
| | | | | | | | | | | | | |
Total average deposits | | | 9,895,798 | | | 8,441,981 | | | 1,453,817 | | | 17.2 | % |
Total average liabilities | | | 10,580,073 | | | 9,051,882 | | | 1,528,191 | | | 16.9 | % |
| | | | | | | | | | | | | |
Average noninterest-bearing deposits as a percent of total average deposits | | | 31.8 | % | | 28.0 | % | | | | | | |
Total average deposits as a percent of total average liabilities | | | 93.5 | % | | 93.3 | % | | | | | | |
52
| | | | | | | | | | | | | |
| | Years Ended December 31, | | | | | | | | ||||
|
| 2021 |
| 2020 |
| Change |
| % Change |
| ||||
Net interest income | | | | | | | | | | | | | |
Interest income, on a tax-equivalent basis (1) | | $ | 301,155 | | $ | 329,338 | | $ | (28,183) | | | (8.6) | % |
Interest expense | | | 28,102 | | | 43,663 | | | (15,561) | | | (35.6) | % |
Net interest income, on a tax equivalent basis (1) | | $ | 273,053 | | $ | 285,675 | | $ | (12,622) | | | (4.4) | % |
| | | | | | | | | | | | | |
Net interest margin (1), (2) | | | 2.49 | % | | 3.03 | % | | | | | | |
| (1) | Assuming a federal income tax rate of 21.0%. |
| (2) | Net interest income expressed as a percentage of average earning assets, stated on a tax-equivalent basis. |
The Consolidated Average Balance Sheets and interest rates were impacted in 2021 and 2020 by numerous factors surrounding COVID-19. Further, the 2021 Consolidated Average Balance Sheet was impacted by the 2017 acquisitionsCAC acquisition. The FOMC rate cuts during the first quarter of First Community and Mid Illinois, along with organic growth. Total average interest-earning assets increased $1.3 billion, or 22.2%, to $7.1 billion in 2018, as compared to $5.8 billion in 2017. Total average interest-earning assets increased $1.2 billion, or 24.9%, to $5.8 billion in 2017, as compared to $4.6 billion in 2016. Average loans increased each year due to acquisitions and organic growth. Loans generally2020 have notably higher yields compared to interest-bearing bank deposits and investment securities and our loan growth contributed to a positive effect onthe decline in net interest margin.margin, as assets, in particular commercial loans, repriced more quickly and to a greater extent than liabilities. Net interest margin has also been negatively impacted by existing loan amortization and paydowns at higher rates than new loan production, the sizeable balance of lower-yielding PPP loans, significant growth in the Company’s liquidity position, and the issuance of debt. Those impacts were partially offset by the Company’s efforts to lower deposit funding costs as well as the fees recognized on PPP loans.
Total average interest-bearing liability balances increased $989.5 million, or 23.2%, to $5.2 billion in 2018 as compared to $4.3 billion in 2017. Total average interest-bearing liability balances increased $793.5 million, or 22.9%, to $4.3 billion in 2017, as compared to $3.5 billion in 2016. Average noninterest-bearing deposits increased $239.9 million, or 19.2%, to $1.5 billion in 2018, as compared to $1.3 billion in 2017. Average noninterest-bearing deposits increased $303.1 million, or 31.9%, to $1.3 billion in 2017, as compared to $949.3 million in 2016. Average non-interest bearing deposits represented 24.1% of total average deposits in 2018. The CompanyFirst Busey remains stronglysubstantially core deposit funded, with total average deposits in 2018 representing 91.3% of total average liabilities, with solidrobust liquidity and significant market share in the communities we serve. As of December 31, 2021, our loan to deposit ratio was 66.8% and core deposits represented 98.7% of total deposits outstanding (excluding time deposits with balances greater than $250,000).
Interest income, on a tax-equivalent basis, increased $60.3 million, or 26.5%, to $288.3 million in 2018, from $228.0 million in 2017. Interest income, on a tax-equivalent basis, increased $59.6 million, or 35.4%, to $228.0 million in 2017, from $168.4 million in 2016. The interest income increase for both years related primarily to increases in loan volumes.
Interest expense increased during 2018 by $23.7 million to $44.6 million from $20.9 million in 2017. Interest expense increased during 2017 by $10.7 million to $20.9 million from $10.2 million in 2016. The increase in 2018 was primarily the result of the increase in deposits and borrowings related to acquisitions and rising interest rates.
38
Net interest income, on a tax-equivalent basis, increased $36.6 million, or 17.7%, in 2018 as compared to 2017. Net interest income, on a tax-equivalent basis, increased $48.9 million, or 30.9%, in 2017 as compared to 2016. The Federal Open Market Committee announced that the federal funds rate increased from 1.50% to 1.75% on March 21, 2018, from 1.75% to 2.00% on June 13, 2018, from 2.00% to 2.25% on September 26, 2018 and from 2.25% to 2.50% on December 19, 2018, for a combined increase of 100 basis points. For comparison, the federal funds rate increased 75 basis points, from 0.75% to 1.50%, in 2017. The Company expects the increases in interest rates to be modestly favorable to net interest income in 2019; however, rising interest rates could result in decreased demand for first mortgages as well as mortgage refinancing, activities which contribute to a portion of the Company’s mortgage revenue.
Net interest margin, our net interest income expressed as a percentage of average earning assets stated on a tax-equivalent basis, decreased to 3.45% in 2018, which included a tax-equivalent adjustment of $2.3 million, compared to 3.58% in 2017, which included a tax-equivalent adjustment of $3.7 million, and increased from 3.42% in 2016, with a tax-equivalent adjustment of $3.5 million. Net of purchase accounting accretion and amortization(2), the net interest margin for the year 2018 was 3.30%, a decrease from 3.36% for the year 2017 and an increase from 3.24% for the year 2016.
The net interest spread, which represents the difference between the average rate earned on earning assets and the average rate paid on interest-bearing liabilities, was 3.23%2.36% in 20182021 compared to 3.45%2.83% in 20172020 and 3.34%3.10% in 2016,2019, each on a tax-equivalenttax equivalent basis.
The quarterlyAnnualized net interest margins for the quarterly periods indicated were as follows:
|
|
|
|
|
|
|
| ||||||||
|
| 2018 |
| 2017 |
| 2016 |
| ||||||||
| | | | | | | | | |||||||
| 2021 |
| | 2020 |
| | 2019 | | |||||||
First Quarter |
| 3.52 | % | 3.53 | % | 3.10 | % | 2.72 | % |
| 3.20 | % |
| 3.46 | % |
Second Quarter |
| 3.51 | % | 3.47 | % | 3.32 | % | 2.50 | % |
| 3.03 | % |
| 3.43 | % |
Third Quarter |
| 3.41 | % | 3.60 | % | 3.51 | % | 2.41 | % |
| 2.86 | % |
| 3.35 | % |
Fourth Quarter |
| 3.38 | % | 3.68 | % | 3.63 | % | 2.36 | % |
| 3.06 | % |
| 3.27 | % |
Management attempts to mitigate the effects of an unpredictable interest-rate environment through effective portfolio management, prudent loan underwriting and operational efficiencies.
|
|
Non-interest Income (dollars in thousands)
|
|
|
|
|
|
|
|
|
|
|
|
|
|
|
|
|
|
|
|
|
|
|
|
|
| As of December 31, |
| ||||||||||||||||||||
|
|
|
|
|
|
|
| $ |
| % |
|
|
|
|
|
|
| $ |
| % |
| ||
|
| 2018 |
| 2017 |
| Change |
| Change |
| 2017 |
| 2016 |
| Change |
| Change |
| ||||||
Trust fees |
| $ | 27,184 |
| $ | 23,665 |
| $ | 3,519 |
| 14.9 | % | $ | 23,665 |
| $ | 20,302 |
| $ | 3,363 |
| 16.6 | % |
Commissions and brokers’ fees, net |
|
| 3,790 |
|
| 3,372 |
|
| 418 |
| 12.4 | % |
| 3,372 |
|
| 2,839 |
|
| 533 |
| 18.8 | % |
Remittance processing |
|
| 14,345 |
|
| 11,427 |
|
| 2,918 |
| 25.5 | % |
| 11,427 |
|
| 11,255 |
|
| 172 |
| 1.5 | % |
Fees for customer services |
|
| 28,879 |
|
| 25,841 |
|
| 3,038 |
| 11.8 | % |
| 25,841 |
|
| 23,253 |
|
| 2,588 |
| 11.1 | % |
Mortgage revenue |
|
| 5,545 |
|
| 11,140 |
|
| (5,595) |
| (50.2) | % |
| 11,140 |
|
| 11,952 |
|
| (812) |
| (6.8) | % |
Security gains, net |
|
| 331 |
|
| 1,143 |
|
| (812) |
| (71.0) | % |
| 1,143 |
|
| 1,232 |
|
| (89) |
| (7.2) | % |
Other income |
|
| 9,919 |
|
| 7,886 |
|
| 2,033 |
| 25.8 | % |
| 7,886 |
|
| 4,336 |
|
| 3,550 |
| 81.9 | % |
Total non-interest income |
| $ | 89,993 |
| $ | 84,474 |
| $ | 5,519 |
| 6.5 | % | $ | 84,474 |
| $ | 75,169 |
| $ | 9,305 |
| 12.4 | % |
Total non-interest income of $90.0 million increased $5.5 million from $84.5 million in 2018. Total non-interest income of $84.5 million increased $9.3 million from $75.2 million in 2017. The 2018 increases reflect organic growth as well as the 2017 acquisitions of First Community and Mid Illinois, offset by a decline in mortgage revenue. The 2016 results were inclusive of Pulaski since April 30, 2016.
Combined wealth management revenue, consisting of trust fees and commissions and broker’s fees, net, increased to $31.0 million in 2018 compared to $27.0 million in 2017. The 2018 increase was a result of market expansion and increased assets under care. Combined wealth management revenue, consisting of trust fees and commissions and broker’s fees, net, of $27.0 million in 2017 increased from $23.1 million in 2016. The 2017 increase was a result of new assets under care and market performance. Two of the Company’s acquisitions, Pulaski and First Community, had no legacy fee income in these businesses; therefore, the addition of First Busey’s fee-based service offerings in the respective acquired bank markets is expected to provide attractive growth opportunities in future periods. Combined wealth management revenue includes professional farm management and brokerage services provided to the agricultural industry.
3953
Noninterest Income
Remittance processing
Changes in noninterest income are summarized in the tables below for the periods presented (dollars in thousands):
| | | | | | | | | | | | | |
| | Year Ended December 31, | | | | | | | | ||||
|
| 2021 |
| 2020 |
| Change |
| % Change |
| ||||
Noninterest income | | | | | | | | | | | | | |
Wealth management fees | | $ | 53,086 | | $ | 42,928 | | $ | 10,158 | | | 23.7 | % |
Fees for customer services | | | 35,604 | | | 31,604 | | | 4,000 | | | 12.7 | % |
Payment technology solutions | |
| 18,347 | | | 15,628 | |
| 2,719 | | | 17.4 | % |
Mortgage revenue | |
| 7,239 | | | 13,038 | |
| (5,799) | | | (44.5) | % |
Income on bank owned life insurance | |
| 5,166 | | | 5,380 | |
| (214) | | | (4.0) | % |
Net gains (losses) on sales of securities | |
| 29 | | | 1,724 | |
| (1,695) | | | (98.3) | % |
Unrealized gains (losses) recognized on equity securities | | | 3,041 | | | (393) | | | 3,434 | | | 873.8 | % |
Other income | | | 10,292 | | | 8,356 | | | 1,936 | | | 23.2 | % |
Total noninterest income | | $ | 132,804 | | $ | 118,265 | | $ | 14,539 | | | 12.3 | % |
| | | | | | | | | | | | | |
| | Years Ended December 31, | | | | | | | | ||||
|
| 2020 |
| 2019 |
| Change |
| % Change |
| ||||
Noninterest income | | | | | | | | | | | | | |
Wealth management fees | | $ | 42,928 | | $ | 38,561 | | $ | 4,367 | | | 11.3 | % |
Fees for customer services | | | 31,604 | | | 36,683 | | | (5,079) | | | (13.8) | % |
Payment technology solutions | |
| 15,628 | | | 15,643 | |
| (15) | | | (0.1) | % |
Mortgage revenue | |
| 13,038 | | | 11,703 | |
| 1,335 | | | 11.4 | % |
Income on bank owned life insurance | |
| 5,380 | | | 5,795 | |
| (415) | | | (7.2) | % |
Net gains (losses) on sales of securities | |
| 1,724 | | | 741 | |
| 983 | | | NM | |
Unrealized gains (losses) recognized on equity securities | | | (393) | | | (759) | | | 366 | | | 48.2 | % |
Other income | | | 8,356 | | | 8,048 | | | 308 | | | 3.8 | % |
Total noninterest income | | $ | 118,265 | | $ | 116,415 | | $ | 1,850 | | | 1.6 | % |
Total noninterest income increased 12.3% to $132.8 million for the year ended December 31, 2021, compared to $118.3 million for the year ended December 31, 2020. Revenues from wealth management fees and payment technology solutions represented 53.8% for the year ended December 31, 2021, compared to 49.5% for the year ended December 31, 2020. Payment technology solutions revenue relates to our payment processing company, FirsTech. Remittance processing revenue of $14.3
Wealth management fees increased 23.7% to $53.1 million in 2018 increased 25.5%2021, compared to $11.4$42.9 million in 2017. Remittance processing revenue2020. Assets under care increased 24.5% to $12.7 billion as of $11.4December 31, 2021, compared to $10.2 billion at December 31, 2020. The increase in assets under care includes $1.2 billion related to assets obtained in the acquisition of CAC, with the remaining $1.3 million related to organic and market related growth.
Fees for customer services increased 12.7% to $35.6 million in 2017 increased 1.5%2021, compared to $11.3$31.6 million in 2016. The positive 2018 results are a reflection of new2020. Fees for customer services have been impacted since early 2020 by changing customer behaviors resulting from COVID-19, and government stimulus programs, and continue to rebound with improving economic conditions and customer activity levels.
Payment technology solutions revenue increased 17.4% to $18.3 million in 2021, compared to $15.6 million in 2020. Fluctuations in payment technology solutions revenue were primarily the result of increased payment and volume increases from existing customers. The 2017 increase was due toactivity as well as growth in various remittance processes, including lockbox and continued growth in the online and mobile service revenues. Remittance processing addscustomers served by FirsTech. FirsTech operations add important diversity to our revenue stream while widening our array of service offerings to larger commercial clients both within our footprint and nationally.We are currently making strategic investments in FirsTech to further enhance future growth including further upgrades to the product and engineering teams to build an API first cloud-based platform to provide for fully integrated payment capabilities as well as the continued development of our BaaS platform.
Fees for customer services were impacted by acquisition activity and increased to $28.9 million in 2018 as compared to $25.8 million in 2017, and $23.3 million in 2016. Evolving regulation, product changes and changing behaviors by our client base may impact the revenue derived from charges on deposit accounts.
Mortgage revenue of $5.5decreased 44.5% to $7.2 million in 2018 decreased $5.6 million2021, compared to $11.1$13.0 million in 2017. 2018 results reflect the realignment2020. Sold-loan mortgage volume declined in 2021 compared to 2020 due to a higher share of mortgage origination resourcesportfolio loan production in 2021.
54
Income on bank owned life insurance decreased 4.0% to the Company’s branch market areas through the sale of certain mortgage origination offices in the fourth quarter of 2017 as well as general declines in volume in the mortgage market. Mortgage revenue of $11.1$5.2 million in 2017 decreased $0.8 million2021, compared to $12.0$5.4 million in 2016 due to lower mortgage volumes.2020, as a result of a decrease in earnings on the cash surrender value of the policies.
Other income of $9.9increased 23.2% to $10.3 million in 2018 increased as2021 compared to $7.9$8.4 million in 2017 and as compared to $4.3 million2020. Other income variances are primarily driven by fluctuations in 2016 across multiple revenue sources, includingincome generated from swap origination fees, commercial loan sales gains, and swap origination fee income.gains and losses on fixed asset disposal.
Non-interestNoninterest Expense (dollars
Changes in noninterest expense are summarized in the tables below for the periods presented (dollars in thousands):
| | | | | | | | | | | | | |
| | Year Ended December 31, | | | | | | | | ||||
|
| 2021 |
| 2020 |
| Change |
| % Change |
| ||||
Noninterest expense | | | | | | | | | | | | | |
Salaries, wages, and employee benefits | | $ | 145,312 | | $ | 126,719 | | $ | 18,593 | | | 14.7 | % |
Data processing | | | 21,862 | | | 16,426 | | | 5,436 | | | 33.1 | % |
Net occupancy expense of premises | |
| 18,346 | |
| 17,607 | |
| 739 | | | 4.2 | % |
Furniture and equipment expenses | |
| 8,301 | |
| 9,550 | |
| (1,249) | | | (13.1) | % |
Professional fees | |
| 7,549 | |
| 8,396 | |
| (847) | | | (10.1) | % |
Amortization of intangible assets | |
| 11,274 | |
| 10,008 | |
| 1,266 | | | 12.6 | % |
Interchange expense | | | 5,792 | | | 4,810 | | | 982 | | | 20.4 | % |
Other expense | |
| 43,344 | |
| 40,681 | |
| 2,663 | | | 6.5 | % |
Total noninterest expense | | $ | 261,780 | | $ | 234,197 | | $ | 27,583 | | | 11.8 | % |
| | | | | | | | | | | | | |
Income taxes | | $ | 33,374 | | $ | 27,862 | | $ | 5,512 | | | 19.8 | % |
Effective income tax rate | |
| 21.3 | % |
| 21.7 | % |
| | | | | |
| | | | | | | | | | | | | |
Efficiency ratio (1) | |
| 62.2 | % |
| 55.7 | % |
| | | | | |
Adjusted efficiency ratio (1) | | | 57.9 | % | | 53.0 | % | | | | | | |
| | | | | | | | | | | | | |
Full-time equivalent employees as of period-end | |
| 1,463 | | | 1,346 | |
| 117 | | | 8.7 | % |
|
|
|
|
|
|
|
|
|
|
|
|
|
|
|
|
|
|
|
|
|
|
|
|
|
| As of December 31, |
| ||||||||||||||||||||
|
|
|
|
|
|
|
| $ |
| % |
|
|
|
|
|
|
| $ |
| % |
| ||
|
| 2018 |
| 2017 |
| Change |
| Change |
| 2017 |
| 2016 |
| Change |
| Change |
| ||||||
Salaries, wages and employee benefits |
| $ | 107,844 |
| $ | 95,633 |
| $ | 12,211 |
| 12.8 | % | $ | 95,633 |
| $ | 78,397 |
| $ | 17,236 |
| 22.0 | % |
Net occupancy expense of premises |
|
| 14,803 |
|
| 13,830 |
|
| 973 |
| 7.0 | % |
| 13,830 |
|
| 11,633 |
|
| 2,197 |
| 18.9 | % |
Furniture and equipment expenses |
|
| 7,233 |
|
| 7,089 |
|
| 144 |
| 2.0 | % |
| 7,089 |
|
| 6,591 |
|
| 498 |
| 7.6 | % |
Data processing |
|
| 16,383 |
|
| 16,716 |
|
| (333) |
| (2.0) | % |
| 16,716 |
|
| 18,229 |
|
| (1,513) |
| (8.3) | % |
Amortization of intangible assets |
|
| 5,854 |
|
| 5,245 |
|
| 609 |
| 11.6 | % |
| 5,245 |
|
| 4,438 |
|
| 807 |
| 18.2 | % |
Other expense |
|
| 40,926 |
|
| 35,913 |
|
| 5,013 |
| 14.0 | % |
| 35,913 |
|
| 28,574 |
|
| 7,339 |
| 25.7 | % |
Total non-interest expense |
| $ | 193,043 |
| $ | 174,426 |
| $ | 18,617 |
| 10.7 | % | $ | 174,426 |
| $ | 147,862 |
| $ | 26,564 |
| 18.0 | % |
|
|
|
|
|
|
|
|
|
|
|
|
|
|
|
|
|
|
|
|
|
|
|
|
Income taxes |
| $ | 34,999 |
| $ | 45,385 |
| $ | (10,386) |
| (22.9) | % | $ | 45,385 |
| $ | 26,723 |
| $ | 18,662 |
| 69.8 | % |
Effective rate on income taxes |
|
| 26.1 | % |
| 42.0 | % |
|
|
|
|
|
| 42.0 | % |
| 35.0 | % |
|
|
|
|
|
|
|
|
|
|
|
|
|
|
|
|
|
|
|
|
|
|
|
|
|
|
|
|
|
Efficiency ratio |
|
| 56.2 | % |
| 58.3 | % |
|
|
|
|
|
| 58.3 | % |
| 61.8 | % |
|
|
|
|
|
Full-time equivalent employees as of period-end |
|
| 1,270 |
|
| 1,347 |
|
|
|
|
|
|
| 1,347 |
|
| 1,295 |
|
|
|
|
|
|
| (1) | For a reconciliation of efficiency ratio and adjusted efficiency ratio, both of which are non-GAAP financial measures, see “Item 1. Business—Non-GAAP Financial Information.” |
55
| | | | | | | | | | | | | |
| | Years Ended December 31, | | | | | | | | ||||
|
| 2020 |
| 2019 |
| Change |
| % Change |
| ||||
Noninterest expense | | | | | | | | | | | | | |
Salaries, wages, and employee benefits | | $ | 126,719 | | $ | 140,473 | | $ | (13,754) | | | (9.8) | % |
Data processing | | | 16,426 | | | 21,511 | | | (5,085) | | | (23.6) | % |
Net occupancy expense of premises | |
| 17,607 | |
| 18,176 | |
| (569) | | | (3.1) | % |
Furniture and equipment expenses | |
| 9,550 | |
| 9,506 | |
| 44 | | | 0.5 | % |
Professional fees | |
| 8,396 | |
| 11,104 | |
| (2,708) | | | (24.4) | % |
Amortization of intangible assets | |
| 10,008 | |
| 9,547 | |
| 461 | | | 4.8 | % |
Interchange expense | | | 4,810 | | | 4,141 | | | 669 | | | 16.2 | % |
Other expense | |
| 40,681 | |
| 44,336 | |
| (3,655) | | | (8.2) | % |
Total noninterest expense | | $ | 234,197 | | $ | 258,794 | | $ | (24,597) | | | (9.5) | % |
| | | | | | | | | | | | | |
Income taxes | | $ | 27,862 | | $ | 31,485 | | $ | (3,623) | | | (11.5) | % |
Effective income tax rate | |
| 21.7 | % |
| 23.4 | % |
|
| | |
| |
| | | | | | | | | | | | | |
Efficiency ratio (1) | |
| 55.7 | % |
| 61.3 | % |
|
| | |
| |
Adjusted efficiency ratio (1) | | | 53.0 | % |
| 56.3 | % | | | | | | |
| | | | | | | | | | | | | |
Full-time equivalent employees as of period-end | |
| 1,346 | | | 1,531 | |
| (185) | | | (12.1) | % |
| (1) | For a reconciliation of efficiency ratio and adjusted efficiency ratio, non-GAAP financial measures, see “Item 1. Business—Non-GAAP Financial Information.” |
Total non-interestnoninterest expense of $193.0increased to $261.8 million in 2018 increased by $18.6 million as2021, compared to $174.4$234.2 million in 2017,2020. Non-operating acquisition and other restructuring increased by $26.5to $17.4 million in 2017 as2021, compared to $147.9$10.7 million in 2016. 2020, contributing $6.7 million of the total $27.6 million increase in noninterest expense. In addition, GSB’s results of operations were included in First Busey’s consolidated results of operations beginning June 1, 2021. We remain focused on expense discipline and have begun to realize synergies from the GSB merger and Personal Banking Transformation Plan, which resulted in the consolidation of 17 branches across our various markets.
Salaries, wages, and employee benefits increased to $107.8$145.3 million in 2018 as2021, compared to $95.6$126.7 million in 20172020. Non-operating expenses contributed $5.3 million of the total $18.6 million increase. Salaries, wages, and $78.4 millionemployee benefit expenses were also impacted by increases in 2016. The increasesfull-time equivalent employees since June 1, 2021, related to the CAC acquisition, and we began to see synergies in late August after GSB was merged into Busey Bank. We had a total of 1,463 full-time equivalents at December 31, 2021, compared to 1,346 at December 31, 2020. Current labor market trends reflect a shrinking labor supply, while job growth reflects increasing demand for a skilled workforce, putting further upward pressure on salaries, wages, and employee benefits primarily relatesbenefits.
Data processing expense increased to fluctuations in the number of employees resulting from acquisitions. The Company recorded non-recurring salaries, wages and employee benefits expense of $2.3$21.9 million in 2018, $1.62021, compared to $16.4 million in 2017 and $2.62020. Non-operating expenses comprised $3.6 million in 2016. of the total $5.4 million increase. Data processing for 2021 also includes data processing related to CAC from June 1, 2021, until GSB merged with Busey Bank on August 14, 2021.
Combined, net occupancy expense of premises and furniture and equipment expenses of $22.0decreased to $26.6 million in 2018 increased as2021, compared to $20.9$27.2 million in 2017 and increased in 2017 as compared to $18.2 million in 2016. This increase was largely due to acquisitions, which in 2017 resulted in 21 additional banking centers.2020. GSB added 7 branches on June 1, 2021. We continue to evaluate our banking center network and fiveclosed 12 banking centers in October 2020, and completed the previously announced closure and consolidation of 17 banking centers, two of which were closedformerly GSB banking centers, in the first quarterNovember 2021. The full benefit of 2018.
Data processing expense decreased 2.0%reduction in 2018 to $16.4 million as compared to $16.7 million in 2017 and decreased 8.3% in 2017 as compared to $18.2 million in 2016. Variances are largely related to deconversion expenses related to acquisitionsthese locations will be realized in future periods as those properties are divested.
Professional fees decreased to $7.5 million in 2021, compared to $8.4 million in 2020, as a result of decreases in legal fees, audit and accounting fees, payroll service costs, and consulting fees. Excluding non-operating expenses, professional fees decreased from $7.8 million in 2020 to efficiencies realized as the Company completes integrations.$5.9 million in 2021.
Amortization of intangible assets were $5.9increased to $11.3 million in 2018 as2021, compared to $5.2$10.0 million in 2017 and $4.4 million in 20162020, as a result of acquisitions.increases in intangible asset balances from the acquisition of CAC.
4056
Interchange expense increased to $5.8 million in 2021, compared to $4.8 million in 2020, as a result of increased payment and volume activity at FirsTech.
Other expense of $40.9increased to $43.3 million in 2018 increased as2021, compared to $35.9$40.7 million in 2017 and as compared to $28.6 million in 2016.2020. Variances areoccurred across multiple expense categories, including professional and legal fees related to acquisitions, fluctuations in gains and losses on OREO sales,NMTC amortization, regulatory expenses, marketing, business development, recruiting and marketingonboarding, director compensation, and acquisition-related check card service expense.fees, partially offset by lower MSR valuation impairment, lower fixed asset impairment, and releases in the provision for unfunded commitments.
Efficiency Ratio (1)
The effective income tax rate, or income taxes divided by income before taxes, was 26.1%, 42.0% and 35.0% for the years ended December 31, 2018, 2017 and 2016, respectively. The 2017 rate was impacted by a one-time, non-cash charge of $8.1 million due to the revaluation of the Company’s net deferred tax position following the enactment of the TCJA.
In general and not including the 2017 TCJA impact, rates were lower than the combined federal and state statutory rate of approximately 28% in 2018 and 40% in 2017 and 2016 due to fairly stable amounts of tax preferred interest income, such as municipal bond interest and bank owned life insurance income. The Company continues to monitor evolving federal and state tax legislation and its potential impact on operations on an ongoing basis. Effective July 1, 2017, the combined Illinois corporate income tax rate and replacement tax rate increased from 7.75% to 9.50%. Effective January 1, 2018 in connection with the TCJA, the corporate federal tax rate was reduced from 35.0% to 21.0%.
The efficiency ratio(3)ratio is calculated as total non-interestnoninterest expense, less amortization charges, as a percentage of tax-equivalent net interest income plus non-interestnoninterest income, less security gains and losses. The efficiency ratio, which is a measure commonly used by management and the banking industry, measures the amount of expense incurred to generate a dollar of revenue. The efficiency ratio improvedwas 62.2% in 2018 to 56.2% as2021, compared to 58.3%55.7% in 2017 and 61.8% in 2016.2020. Operating costs have been influenced by acquisitionsacquisition expenses and other restructuring costs, and the adjusted efficiency ratio(3), excluding the impact of such acquisition costs among other items,ratio1 was 54.5%57.9% for the year ended December 31, 2018. While acquisition expenses may have a negative2021, compared to 53.0% for the year ended December 31, 2020.
Income Taxes
The effective income tax rate, or income taxes divided by income before taxes, was 21.3%, 21.7%, and 23.4% for the years ended December 31, 2021, 2020, and 2019, respectively. The decrease in the effective tax rate was driven by an increase in tax exempt income, such as municipal bond interest and bank owned life insurance income, combined with the benefits received from various investments in federal and state tax credits, including an Illinois NMTC. We continue to monitor evolving federal and state tax legislation and its potential impact on the efficiency ratios, the Company expects to realize operating efficiencies creating a positive impact in future years. Further, the Company started to see greater operating efficiencies from the South Side Bank integration beginning in the second quarteroperations on an ongoing basis. As of 2018. December 31, 2021, we were not under examination by any tax authority.
|
|
Balance Sheet
SignificantChanges in significant items included in our Consolidated Balance Sheet ItemsSheets are summarized in the table below (dollars in thousands):
| | | | | | | | | | | | | |
|
| As of December 31, | | | | | | |
| ||||
|
| 2021 |
| 2020 |
| Change |
| % Change |
| ||||
Assets |
| |
|
| |
|
| |
|
| |
| |
Debt securities available for sale | | $ | 3,981,251 | | $ | 2,261,187 | | $ | 1,720,064 |
| | 76.1 | % |
Portfolio loans, net | |
| 7,101,111 | |
| 6,713,129 | |
| 387,982 |
| | 5.8 | % |
| | | | | | | | | | | | | |
Total assets | | $ | 12,859,689 | | $ | 10,544,047 | | $ | 2,315,642 |
| | 22.0 | % |
| | | | | | | | | | | | | |
Liabilities | |
|
| |
|
| |
|
|
| |
| |
Deposits: | |
|
| |
|
| |
|
|
| |
| |
Noninterest-bearing | | $ | 3,670,267 | | $ | 2,552,039 | | $ | 1,118,228 |
| | 43.8 | % |
Interest-bearing | |
| 7,098,310 | |
| 6,125,810 | |
| 972,500 |
| | 15.9 | % |
Total deposits | | $ | 10,768,577 | | $ | 8,677,849 | | $ | 2,090,728 |
| | 24.1 | % |
| | | | | | | | | | | | | |
Securities sold under agreements to repurchase | | $ | 270,139 | | $ | 175,614 | | $ | 94,525 |
| | 53.8 | % |
Subordinated notes, net of unamortized issuance costs | |
| 182,773 | |
| 182,226 | |
| 547 |
| | 0.3 | % |
Junior subordinated debt owed to unconsolidated trusts | |
| 71,635 | |
| 71,468 | |
| 167 |
| | 0.2 | % |
| | | | | | | | | | | | | |
Total liabilities | | $ | 11,540,577 | | $ | 9,273,978 | | $ | 2,266,599 |
| | 24.4 | % |
| | | | | | | | | | | | | |
Stockholders’ equity | | $ | 1,319,112 | | $ | 1,270,069 | | $ | 49,043 |
| | 3.9 | % |
|
|
|
|
|
|
|
|
|
|
|
|
|
|
| December 31, |
| December 31, |
|
|
|
|
|
| ||
|
| 2018 |
| 2017 |
| $ Change |
| % Change |
| |||
Assets |
|
|
|
|
|
|
|
|
|
|
|
|
Securities available for sale |
| $ | 697,685 |
| $ | 872,682 |
| $ | (174,997) |
| (20.1) | % |
Securities held to maturity |
|
| 608,660 |
|
| 443,550 |
|
| 165,110 |
| 37.2 | % |
Loans held for sale |
|
| 25,895 |
|
| 94,848 |
|
| (68,953) |
| (72.7) | % |
Portfolio loans, net |
|
| 5,517,780 |
|
| 5,465,918 |
|
| 51,862 |
| 0.9 | % |
|
|
|
|
|
|
|
|
|
|
|
|
|
Total assets |
| $ | 7,702,357 |
| $ | 7,860,640 |
| $ | (158,283) |
| (2.0) | % |
|
|
|
|
|
|
|
|
|
|
|
|
|
Liabilities |
|
|
|
|
|
|
|
|
|
|
|
|
Deposits: |
|
|
|
|
|
|
|
|
|
|
|
|
Noninterest-bearing |
| $ | 1,464,700 |
| $ | 1,597,421 |
| $ | (132,721) |
| (8.3) | % |
Interest-bearing |
|
| 4,784,621 |
|
| 4,528,544 |
|
| 256,077 |
| 5.7 | % |
Total deposits |
| $ | 6,249,321 |
| $ | 6,125,965 |
| $ | 123,356 |
| 2.0 | % |
|
|
|
|
|
|
|
|
|
|
|
|
|
Securities sold under agreements to repurchase |
| $ | 185,796 |
| $ | 304,566 |
| $ | (118,770) |
| (39.0) | % |
Short-term borrowings |
|
| — |
|
| 220,000 |
|
| (220,000) |
| (100.0) | % |
Long-term debt |
|
| 50,000 |
|
| 50,000 |
|
| — |
| — | % |
Senior notes, net of unamortized issuance costs |
|
| 39,539 |
|
| 39,404 |
|
| 135 |
| 0.3 | % |
Subordinated notes, net of unamortized issuance costs |
|
| 59,147 |
|
| 64,715 |
|
| (5,568) |
| (8.6) | % |
Junior subordinated debt owed to unconsolidated trusts |
|
| 71,155 |
|
| 71,008 |
|
| 147 |
| 0.2 | % |
|
|
|
|
|
|
|
|
|
|
|
|
|
Total liabilities |
| $ | 6,707,393 |
| $ | 6,925,637 |
| $ | (218,244) |
| (3.2) | % |
|
|
|
|
|
|
|
|
|
|
|
|
|
Stockholders’ equity |
| $ | 994,964 |
| $ | 935,003 |
| $ | 59,961 |
| 6.4 | % |
(1)For a reconciliation of the efficiency ratio and the adjusted efficiency ratio, both of which are non-GAAP financial measures, see “Item 1. Business—Non-GAAP Financial Information.”
4157
Investment Securities
SecuritiesDebt securities available for sale are carried at fair value. Securities held to maturity are carried at amortized cost. Equity securities are carried at fair value. As of December 31, 2018,2021, the fair value of debt securities available for sale was $697.7 million$4.0 billion, and the amortized cost was $707.2 million.also $4.0 billion. There were $0.8$22.4 million of gross unrealized gains and $10.3$54.7 million of gross unrealized losses for a net unrealized loss of $9.5$32.3 million. The net unrealized loss, net of tax, is recorded in stockholders’ equity. Equity securities are carried at fair value. As of December 31, 2018, the amortized cost of securities held to maturity was $608.7 million and the fair value was $603.4 million. As of December 31, 2018,2021, the fair value of equity securities was $6.2$13.6 million.
The composition of debt securities available for sale was as follows (dollars in thousands):
|
|
|
|
|
|
|
|
|
|
| ||||||||||
|
| As of December 31, | ||||||||||||||||||
|
| 2018 |
| 2017 |
| 2016 |
| |||||||||||||
| | | | | | | | | | | ||||||||||
| | As of December 31, | | |||||||||||||||||
|
| 2021 |
| 2020 |
| 2019 |
| |||||||||||||
Debt securities available for sale | | | | | | | | | | | ||||||||||
U.S. Treasury securities |
| $ | 25,411 |
| $ | 60,348 |
| $ | 74,944 |
| | $ | 165,762 | | $ | 27,837 | | $ | 51,737 | |
Obligations of U.S. government corporations and agencies |
|
| 52,342 |
|
| 103,665 |
|
| 79,127 |
| |
| 38,470 | |
| 69,519 | |
| 163,000 | |
Obligations of states and political subdivisions |
|
| 170,044 |
|
| 280,199 |
|
| 154,938 |
| |
| 306,869 | |
| 304,711 | |
| 268,291 | |
Asset-backed securities | | | 492,186 | | | — | | | — | | ||||||||||
Commercial mortgage-backed securities |
|
| 1,942 |
|
| — |
|
| — |
| | | 614,998 | | | 418,616 | | | 139,287 | |
Residential mortgage-backed securities |
|
| 315,748 |
|
| 397,436 |
|
| 302,249 |
| |
| 2,069,313 | |
| 1,368,315 | |
| 921,966 | |
Corporate debt securities |
|
| 132,198 |
|
| 31,034 |
|
| 143,343 |
| |
| 293,653 | |
| 72,189 | |
| 103,976 | |
Fair value of securities available for sale |
| $ | 697,685 |
| $ | 872,682 |
| $ | 754,601 |
| ||||||||||
Amortized cost |
| $ | 707,213 |
| $ | 877,459 |
| $ | 755,276 |
| ||||||||||
Debt securities available for sale, fair value | | $ | 3,981,251 | | $ | 2,261,187 | | $ | 1,648,257 | | ||||||||||
| | | | | | | | | | | ||||||||||
Debt securities available for sale, amortized cost | | $ | 4,013,523 | | $ | 2,211,543 | | $ | 1,627,065 | | ||||||||||
Fair value as a percentage of amortized cost |
|
| 98.65 | % |
| 99.46 | % |
| 99.91 | % | |
| 99.20 | % |
| 102.24 | % |
| 101.30 | % |
The composition of securities held to maturity was as follows (dollars in thousands):
|
|
|
|
|
|
|
|
|
|
|
|
| As of December 31, | ||||||||
|
| 2018 |
| 2017 |
| 2016 |
| |||
Obligations of states and political subdivisions |
| $ | 33,928 |
| $ | 41,464 |
| $ | 44,295 |
|
Commercial mortgage-backed securities |
|
| 58,062 |
|
| 60,218 |
|
| 3,388 |
|
Residential mortgage-backed securities |
|
| 511,370 |
|
| 339,370 |
|
| — |
|
Fair value of securities held to maturity |
| $ | 603,360 |
| $ | 441,052 |
| $ | 47,683 |
|
Amortized cost |
| $ | 608,660 |
| $ | 443,550 |
| $ | 47,820 |
|
Fair value as a percentage of amortized cost |
|
| 99.13 | % |
| 99.44 | % |
| 99.71 | % |
The primary purposes of theour investment securities portfolio are to provide a source of liquidity; to provide collateral for pledging purposes against public monies and repurchase agreements; to serve as a tool for interest rate risk positioning; and to provide a source of earnings by deploying funds which are not needed to fulfill loan demand, deposit redemptions, or other liquidity purposes. Pledged securities totaled $498.3$708.9 million, or 38.0% of total securities, and $638.2 million, or 48.4%17.8% of total securities, at December 31, 20182021, and 2017, respectively.$628.0 million, or 27.8% of total securities, at December 31, 2020.
4258
The maturities,By maturity date, fair values, and weighted average yields of debt securities available for sale and held to maturity as of December 31, 20182021, were (dollars in thousands):
| | | | | | | | | | | | | | | | | | | | | |
| | | | | | | Due after 1 year | | Due after 5 years | | Due after |
| |||||||||
| | Due in 1 year or less | | through 5 years | | through 10 years | | 10 years |
| ||||||||||||
| | | | | Weighted | | | | | Weighted | | | | | Weighted | | | | | Weighted |
|
| | Fair | | Average | | Fair | | Average | | Fair | | Average | | Fair | | Average |
| ||||
|
| Value |
| Yield |
| Value |
| Yield |
| Value |
| Yield |
| Value |
| Yield |
| ||||
Debt securities available for sale (1) | | | | | | | | | | | | | | | | | |||||
U.S. Treasury securities |
| $ | 47,546 | | 0.19 | % | $ | 118,216 | | 0.21 | % | $ | — | | — | % | $ | — | | — | % |
Obligations of U.S. government corporations and agencies | |
| 16,566 | | 2.55 | % |
| 17,906 | | 2.52 | % |
| 3,998 | | 0.66 | % |
| — | | — | % |
Obligations of states and political subdivisions (2) | |
| 29,926 | | 2.73 | % |
| 108,227 | | 2.60 | % |
| 100,442 | | 2.32 | % |
| 68,274 | | 2.68 | % |
Asset-backed securities | | | — | | — | % | | — | | — | % | | 29,498 | | 1.27 | % | | 462,688 | | 1.26 | % |
Commercial mortgage-backed securities | | | 13,522 | | 1.99 | % | | 71,509 | | 1.37 | % | | 54,104 | | 1.56 | % | | 475,863 | | 1.53 | % |
Residential mortgage-backed securities | |
| 54 |
| 2.60 | % |
| 23,008 |
| 2.45 | % |
| 128,597 |
| 1.82 | % |
| 1,917,654 |
| 1.31 | % |
Corporate debt securities | |
| 22,234 |
| 1.15 | % |
| 224,607 |
| 1.03 | % |
| 45,418 |
| 2.92 | % |
| 1,394 |
| 3.00 | % |
Debt securities available for sale | | $ | 129,848 |
| 1.43 | % | $ | 563,473 |
| 1.31 | % | $ | 362,057 |
| 2.00 | % | $ | 2,925,873 |
| 1.37 | % |
|
|
|
|
|
|
|
|
|
|
|
|
|
|
|
|
|
|
|
|
|
|
|
|
|
|
|
|
| Due after 1 year |
| Due after 5 years |
| Due after |
| |||||||||
|
| Due in 1 year or less |
| through 5 years |
| through 10 years |
| 10 years |
| ||||||||||||
|
|
|
|
| Weighted |
|
|
|
| Weighted |
|
|
|
| Weighted |
|
|
|
| Weighted |
|
|
| Fair |
| Average |
| Fair |
| Average |
| Fair |
| Average |
| Fair |
| Average |
| ||||
Available for sale(1) |
| Value |
| Yield(2) |
| Value |
| Yield(2) |
| Value |
| Yield(2) |
| Value |
| Yield(2) |
| ||||
U.S. Treasury securities |
| $ | 299 |
| 1.77 |
% | $ | 25,112 |
| 1.75 |
% | $ | — |
| — |
% | $ | — |
| — | % |
Obligations of U.S. government corporations and agencies |
|
| 10,654 |
| 1.51 | % |
| 34,370 |
| 1.86 | % |
| 6,543 |
| 2.28 | % |
| 775 |
| 3.92 | % |
Obligations of states and political subdivisions(3) |
|
| 28,671 |
| 2.04 | % |
| 43,933 |
| 2.77 | % |
| 60,539 |
| 2.82 | % |
| 36,901 |
| 2.96 | % |
Commercial mortgage-backed securities |
|
| — |
| — |
|
| — |
| — |
|
| — |
| — |
|
| 1,942 |
| 1.86 |
|
Residential mortgage-backed securities |
|
| 72 |
| 4.03 | % |
| 7,219 |
| 2.77 | % |
| 67,473 |
| 2.53 | % |
| 240,984 |
| 2.36 | % |
Corporate debt securities |
|
| 20,063 |
| 2.39 | % |
| 111,572 |
| 3.20 | % |
| 563 |
| 3.69 | % |
| — |
| — | % |
Total |
| $ | 59,759 |
| 2.06 | % | $ | 222,206 |
| 2.73 | % | $ | 135,118 |
| 2.65 | % | $ | 280,602 |
| 3.71 | % |
|
|
|
|
|
|
|
|
|
|
|
|
|
|
|
|
|
|
|
|
|
|
|
|
|
|
|
|
| Due after 1 year |
| Due after 5 years |
| Due after |
| |||||||||
|
| Due in 1 year or less |
| through 5 years |
| through 10 years |
| 10 years |
| ||||||||||||
|
|
|
|
| Weighted |
|
|
|
| Weighted |
|
|
|
| Weighted |
|
|
|
| Weighted |
|
|
| Fair |
| Average |
| Fair |
| Average |
| Fair |
| Average |
| Fair |
| Average |
| ||||
Held to maturity(1) |
| Value |
| Yield(2) |
| Value |
| Yield(2) |
| Value |
| Yield(2) |
| Value |
| Yield(2) |
| ||||
Obligations of states and political subdivisions(3) |
| $ | 5,589 |
| 2.66 | % | $ | 17,792 |
| 2.68 | % | $ | 10,547 |
| 2.87 | % | $ | — |
| — | % |
Commercial mortgage-backed securities |
|
| 2,499 |
| 1.89 | % |
| 37,215 |
| 2.22 | % |
| 18,348 |
| 2.64 | % |
| — |
| — | % |
Residential mortgage-backed securities |
|
| — |
| — | % |
| — |
| — | % |
| — |
| — | % |
| 511,370 |
| 2.88 | % |
Total |
| $ | 8,088 |
| 2.42 | % | $ | 55,007 |
| 2.37 | % | $ | 28,895 |
| 2.72 | % | $ | 511,370 |
| 2.88 | % |
| Securities are presented based upon final contractual maturity or pre-refunded date. |
|
|
| Weighted average yield calculated on a tax-equivalent basis, assuming a federal income tax rate of |
We consider many factors in determining the composition of our investment portfolio including, but not limited to, credit quality, duration, interest rate risk, liquidity, tax-equivalent yield, regulatory, and overall portfolio allocation. As of December 31, 2018, the Company2021, we did not have any non-U.S. Treasury securities or obligations of U.S. government corporations and agencies issued securities that exceeded 10% of the Company’sour total stockholders’ equity.
Portfolio Loans
The Company believesWe believe that making sound and profitable loans is a necessary and desirable means of employing funds available for investment. Authorized personnel are expected to seek to develop and make sound, profitable loans that resources permit and that opportunity affords. The CompanyFirst Busey maintains lending policies and procedures designed to focus lending efforts on the types, locations, and duration of loans most appropriate for its business model and markets. GSB’s policies were similar in nature to Busey Bank’s policies, and we are migrating the legacy GSB portfolio toward Busey Bank’s policies. While not specifically limited, the Company attemptswe attempt to focus its originating loans withour lending on short to intermediate termsintermediate-term (0-10 years) loans in geographic areas within a reasonable distance from its125 miles of our lending offices. A small portionLoans originated outside of these areas are generally residential mortgage loans may be originated outside offor sale in the Company’s marketssecondary market or loans to accommodate existing customers of theBusey Bank. The Company attemptsWe attempt to utilize government-assisted lending programs, such as the Small Business AdministrationSBA and United StatesU.S. Department of Agriculture lending programs, when prudent. Generally, loans are collateralized by assets, primarily real estate, of the borrowers and guaranteed by individuals. The loansLoans are expected to be repaid primarily from cash flows of the borrowers or from proceeds from the sale of selected assets of the borrowers.
59
Management reviews and approves the Company’sBusey Bank’s lending policies and procedures on a routineregular basis. The policies for legacy First Community Financial Bank and South Side Bank loans were similar in nature to Busey Bank’s policies and the Company has migrated loan production to Busey Bank policies. Management routinely (at least quarterly) reviews the Company’s allowance for loan lossesACL in conjunction with reports related to loan production, loan quality, concentrations of credit, loan delinquencies, and non-performing loans, and potential problem loans. The Company’sOur underwriting standards are designed to encourage relationship banking rather than transactional banking. Relationship banking implies a primary banking relationship with the borrower that includes, at a
43
minimum, an active deposit banking relationship in addition to the lending relationship. Additional significantSignificant underwriting factors beyondin addition to location, duration, a sound and profitable cash flow basis, and the borrower’s character, include the quality of the borrower’s financial history, the liquidity of the underlying collateral, and the reliability of the valuation of the underlying collateral.
As a matter of policy and practice, we limit the level of concentration exposure in any particular loan segment with the goal of maintaining a well-diversified loan portfolio. In anticipation of the potential risks associated with COVID-19, we took actions starting in early March 2020 to escalate the monitoring of susceptible industry sectors within our portfolio.
At no time is a borrower’s total borrowing relationship permitted to exceed the Company’sBusey Bank’s regulatory lending limit. We generally limit and, generally, relationshipsuch relationships to amounts are substantially less than the regulatory limit. Loans to related parties, including executive officers and directors of the CompanyFirst Busey and its subsidiaries, are reviewed for compliance with regulatory guidelines by the Company’s board of directors at least annually.guidelines.
The CompanyFirst Busey maintains an independent loan review department that reviews the loans for compliance with the Company’sour loan policy on a periodic basis. In addition, the loan review department reviews the risk assessments made by the Company’sour credit department, lenders, and loan committees. Results of these reviews are presented to management and the audit committee at least quarterly.
The Company’sBusey Bank’s lending can be summarized into five primary areas: commercial loans, commercial real estate loans, real estate construction loans, retail real estate loans, and retail other loans.
Commercial Loans
Commercial loans typically comprise working capital loans or business expansion loans, including loans for asset purchases and other business loans. Commercial loans will generally be guaranteed, in full or a significant amountmaterial percentage, by the primary owners of the business. Commercial loans are made based primarily on the historical and projected cash flow of the underlying borrower and secondarily on the underlying assets pledged as collateral by the borrower. The cashCash flows of the underlying borrower, however, may not perform consistently with historical or projected information. Further, the collateral securing loans may fluctuate in value due to individual economic or other factors. The CompanyBusey Bank has established minimum standards and underwriting guidelines for all commercial loan types.
Commercial Real Estate Loans
The commercial environment, along with the academic presence in some of the Company’sour markets, provides for the majority of the Company’sour commercial lending opportunities to be commercial real estate related, including multi-unit housing. As the majority of the Company’sour loan portfolio is within the commercial real estate class, the Company’sour goal is to maintain a high quality, geographically diverse portfolio of commercial real estate loans. Commercial real estate loans are subject to underwriting standards and guidelines similar to commercial loans. Commercial real estate loans willare generally be guaranteed, in full or a significant amountmaterial percentage, by the primary owners of the business. The repaymentRepayment of these loans is primarily dependent on the cash flows of the underlying property. However, commercial real estate loans generally must be supported by an adequate underlying collateral value. The performance and the value of the underlying property may be adversely affected by economic factors or geographical and/or industry specific factors. These loans are subject to other industry guidelines that arewhich we closely monitored by the Company.monitor.
60
Real Estate Construction Loans
Real estate construction loans are typicallyprimarily commercial in nature. The loanLoan proceeds are monitored by the Company and advanced for the improvement of real estate in which the Company holdswe hold a mortgage. Real estate construction loans will generally be guaranteed, in full or a significant amountmaterial percentage, by the developer or primary owners of the business. These loans are subject to underwriting standards and guidelines similar to commercial loans. The loan generally must be supported by an adequate “as completed” value of the underlying project. In addition to the underlying project, the financial history of the developer and business owners weighs significantly in determining approval. The repaymentRepayment of these loans is typically through permanent financing following completion of the construction. Real estate construction loans are inherently more risky than loans on completed properties as the unimproved nature and the financial risks of construction significantly enhance the risks of commercial real estate loans. These loans are closely monitored and subject to other industry guidelines.
Retail Real Estate Loans
Retail real estate loans are comprised of direct consumer loans that include residential real estate, residential real estate construction loans, home equity lines of credit, and home equity loans. In 2018, the Company2021, we sold the majority of itsour newly originated 30-year fixed rate retail real estate loans to secondary market purchasers.purchasers, while retaining a larger percentage of the 15-year fixed rate loans in our portfolio. As retail real estate loan underwriting is subject to specific regulations, the Companywe typically underwrites itsunderwrite our retail real estate loans to conform to widely accepted standards. Several factors are considered in underwriting including the debt-to-income ratio and credit history of the borrower, as well as the value of the underlying real estate and the debt to income and credit history of the borrower. estate.
44
Retail Other Loans
Retail other loans consist of installment loans to individuals, including automotive loans.loans and indirect lending. These loans are centrally underwritten utilizing the borrower’s financial history, including the FICO credit scoring, and information as to the underlying collateral. In 2021, associated with the CAC acquisition and purchased participations, retail other loans now also include whole-life loans which are secured by the cash value of life insurance policies. Repayment of retail other loans is expected from the cash flow of the borrower.
The composition of our portfolio loans as of the dates indicated was as follows (dollars in thousands):
| | | | | | | | | | | | | | | |
| | As of December 31, | |||||||||||||
|
| 2021 |
| 2020 |
| 2019 |
| 2018 |
| 2017 | |||||
Portfolio loans | | | | | | | | | | | | | | | |
Commercial | | $ | 1,943,886 | | $ | 2,014,576 | | $ | 1,748,368 | | $ | 1,405,106 | | $ | 1,414,631 |
Commercial real estate | |
| 3,119,807 | |
| 2,892,535 | |
| 2,793,417 | |
| 2,366,823 | |
| 2,354,684 |
Real estate construction | |
| 385,996 | |
| 461,786 | |
| 401,861 | |
| 288,197 | |
| 261,506 |
Retail real estate | |
| 1,512,976 | |
| 1,407,852 | |
| 1,693,769 | |
| 1,480,133 | |
| 1,460,801 |
Retail other | |
| 226,333 | |
| 37,428 | |
| 49,834 | |
| 28,169 | |
| 27,878 |
Portfolio loans | | $ | 7,188,998 | | $ | 6,814,177 | | $ | 6,687,249 | | $ | 5,568,428 | | $ | 5,519,500 |
| | | | | | | | | | | | | | | |
ACL | | | (87,887) | | | (101,048) | | | (53,748) | | | (50,648) | | | (53,582) |
Portfolio loans, net | | $ | 7,101,111 | | $ | 6,713,129 | | $ | 6,633,501 | | $ | 5,517,780 | | $ | 5,465,918 |
|
|
|
|
|
|
|
|
|
|
|
|
|
|
|
|
|
| As of December 31, | |||||||||||||
|
| 2018 |
| 2017 |
| 2016 |
| 2015 |
| 2014 | |||||
Commercial |
| $ | 1,405,106 |
| $ | 1,414,631 |
| $ | 959,888 |
| $ | 656,576 |
| $ | 601,760 |
Commercial real estate |
|
| 2,366,823 |
|
| 2,354,684 |
|
| 1,654,164 |
|
| 1,208,429 |
|
| 1,104,151 |
Real estate construction |
|
| 288,197 |
|
| 261,506 |
|
| 182,078 |
|
| 96,568 |
|
| 107,054 |
Retail real estate |
|
| 1,480,133 |
|
| 1,460,801 |
|
| 1,069,060 |
|
| 651,191 |
|
| 582,073 |
Retail other |
|
| 28,169 |
|
| 27,878 |
|
| 13,710 |
|
| 14,975 |
|
| 10,252 |
Portfolio loans |
| $ | 5,568,428 |
| $ | 5,519,500 |
| $ | 3,878,900 |
| $ | 2,627,739 |
| $ | 2,405,290 |
61
Geographic distributions of portfolio loans, based on origination, by category were as follows (dollars in thousands):
|
|
|
|
|
|
|
|
|
|
|
|
|
|
|
| |||||||||||||||
|
| December 31, 2018 | ||||||||||||||||||||||||||||
|
| Illinois |
| Missouri |
| Florida |
| Indiana |
| Total | ||||||||||||||||||||
| | | | | | | | | | | | | | | | |||||||||||||||
| | December 31, 2021 | ||||||||||||||||||||||||||||
|
| Illinois |
| Missouri |
| Florida |
| Indiana |
| Total | ||||||||||||||||||||
Portfolio loans | | | | | | | | | | | | | | | | |||||||||||||||
Commercial |
| $ | 972,072 |
| $ | 394,043 |
| $ | 17,954 |
| $ | 21,037 |
| $ | 1,405,106 | | $ | 1,372,584 | | $ | 463,085 | | $ | 55,180 | | $ | 53,037 | | $ | 1,943,886 |
Commercial real estate |
|
| 1,448,937 |
|
| 579,536 |
|
| 158,337 |
|
| 180,013 |
|
| 2,366,823 | | | 2,063,681 | | | 691,969 | | | 191,303 | | | 172,854 | | | 3,119,807 |
Real estate construction |
|
| 78,489 |
|
| 122,385 |
|
| 17,859 |
|
| 69,464 |
|
| 288,197 | |
| 199,471 | |
| 120,785 | |
| 31,265 | |
| 34,475 | |
| 385,996 |
Retail real estate |
|
| 874,910 |
|
| 475,739 |
|
| 102,117 |
|
| 27,367 |
|
| 1,480,133 | | | 1,124,486 | | | 235,083 | | | 96,563 | | | 56,844 | | | 1,512,976 |
Retail other |
|
| 24,849 |
|
| 1,294 |
|
| 1,455 |
|
| 571 |
|
| 28,169 | |
| 219,000 | |
| 3,684 | |
| 2,181 | |
| 1,468 | |
| 226,333 |
Portfolio loans |
| $ | 3,399,257 |
| $ | 1,572,997 |
| $ | 297,722 |
| $ | 298,452 |
| $ | 5,568,428 | |||||||||||||||
|
|
|
|
|
|
|
|
|
|
|
|
|
|
|
| |||||||||||||||
Less allowance for loan losses |
|
|
|
|
|
|
|
|
|
|
|
|
|
| 50,648 | |||||||||||||||
Total portfolio loans | | $ | 4,979,222 | | $ | 1,514,606 | | $ | 376,492 | | $ | 318,678 | | $ | 7,188,998 | |||||||||||||||
| | | | | | | | | | | | | | | | |||||||||||||||
ACL | |
|
| |
|
| |
|
| |
|
| |
| (87,887) | |||||||||||||||
Portfolio loans, net |
|
|
|
|
|
|
|
|
|
|
|
|
| $ | 5,517,780 | |
|
| |
|
| |
|
| |
|
| | $ | 7,101,111 |
|
|
|
|
|
|
|
|
|
|
|
|
|
|
|
| |||||||||||||||
|
| December 31, 2017 | ||||||||||||||||||||||||||||
|
| Illinois |
| Missouri |
| Florida |
| Indiana |
| Total | ||||||||||||||||||||
| | | | | | | | | | | | | | | | |||||||||||||||
| | December 31, 2020 | ||||||||||||||||||||||||||||
|
| Illinois |
| Missouri |
| Florida |
| Indiana |
| Total | ||||||||||||||||||||
Portfolio loans | | | | | | | | | | | | | | | | |||||||||||||||
Commercial |
| $ | 974,392 |
| $ | 378,424 |
| $ | 19,005 |
| $ | 42,810 |
| $ | 1,414,631 | | $ | 1,386,587 | | $ | 529,281 | | $ | 50,878 | | $ | 47,830 | | $ | 2,014,576 |
Commercial real estate |
|
| 1,505,819 |
|
| 547,200 |
|
| 147,360 |
|
| 154,305 |
|
| 2,354,684 | |
| 1,880,437 | | | 715,680 | | | 154,234 | | | 142,184 | |
| 2,892,535 |
Real estate construction |
|
| 87,084 |
|
| 74,662 |
|
| 26,209 |
|
| 73,551 |
|
| 261,506 | |
| 192,971 | |
| 115,227 | |
| 57,381 | |
| 96,207 | |
| 461,786 |
Retail real estate |
|
| 835,287 |
|
| 509,500 |
|
| 98,112 |
|
| 17,902 |
|
| 1,460,801 | |
| 963,538 | | | 295,352 | | | 94,748 | | | 54,214 | |
| 1,407,852 |
Retail other |
|
| 26,230 |
|
| 685 |
|
| 961 |
|
| 2 |
|
| 27,878 | |
| 32,678 | |
| 2,415 | |
| 1,188 | |
| 1,147 | |
| 37,428 |
Portfolio loans |
| $ | 3,428,812 |
| $ | 1,510,471 |
| $ | 291,647 |
| $ | 288,570 |
| $ | 5,519,500 | |||||||||||||||
|
|
|
|
|
|
|
|
|
|
|
|
|
|
|
| |||||||||||||||
Less allowance for loan losses |
|
|
|
|
|
|
|
|
|
|
|
|
|
| 53,582 | |||||||||||||||
Total portfolio loans | | $ | 4,456,211 | | $ | 1,657,955 | | $ | 358,429 | | $ | 341,582 | | $ | 6,814,177 | |||||||||||||||
| | | | | | | | | | | | | | | | |||||||||||||||
ACL | |
|
| |
|
| |
|
| |
|
| |
| (101,048) | |||||||||||||||
Portfolio loans, net |
|
|
|
|
|
|
|
|
|
|
|
|
| $ | 5,465,918 | |
|
| |
|
| |
|
| |
|
| | $ | 6,713,129 |
Portfolio loans increased $48.9 million, or 0.9%, asAs of December 31, 2018 compared to December 31, 2017 as a result2021, portfolio loan balances included balances acquired in the CAC acquisition. The Company generated $460.7 million in core loan growth, excluding PPP loans, over the last three quarters of organic growth.2021. Commercial balances (consisting– consisting of commercial, commercial real estate and real estate construction loans)loans – excluding PPP loans, increased $29.3by $452.2 million, fromor 9.2%, during the year ended December 31, 2017.2021. Retail real estate and retail other loans increased $19.6by $294.0 million, fromor 20.3%, during the year ended December 31, 2017. 2021. PPP loans decreased $371.4 million during the year ended December 31, 2021, to $75.0 million.
Commitments to extend credit and standby letters of credit totaled $1.4 billion and $1.3increased $222.9 million, or 12.4%, to a total of $2.0 billion as of December 31, 2018 and 2017, respectively.2021, compared to $1.8 billion as of December 31, 2020.
Relationship banking, rather than transactional banking, remains a focus for the Company. Relationship banking implies a primary banking relationship with the borrower that includes, at minimum, an active deposit banking relationship in addition to the lending relationship.
45
The following table sets forth remaining maturities of selected loans (excluding deferred loan accretionfees and costs, purchase premiums and discounts, and certain real estate-mortgage loans and installment loans to individuals) at December 31, 20182021 (dollars in thousands):. The determination of loan maturities is based on contractual loan terms. For the purposes of categorization within the table below, demand loans, loans having no stated schedule of repayments and no stated maturity, and overdrafts are considered to mature within one year. Maturities for non-contractual rollovers or extensions are determined based on the rate review date.
| | | | | | | | | | | | | | | |
|
| |
| After 1 Year |
| After 5 Years |
| |
| | |||||
|
| Within 1 Year |
| Through 5 Years |
| Through 15 Years |
| After 15 Years |
| Total | |||||
Selected Loans | | | | | | | | | | | | | | | |
Commercial | | $ | 1,043,137 | | $ | 659,421 | | $ | 222,780 | | $ | 20,719 | | $ | 1,946,057 |
Commercial real estate | |
| 994,593 | |
| 1,499,314 | |
| 627,520 | |
| 815 | |
| 3,122,242 |
Real estate construction | |
| 214,680 | |
| 121,293 | |
| 53,877 | |
| 506 | |
| 390,356 |
Total selected loans | | $ | 2,252,410 | | $ | 2,280,028 | | $ | 904,177 | | $ | 22,040 | | $ | 5,458,655 |
|
|
|
|
|
|
|
|
|
|
|
|
|
|
| 1 Year or Less |
| 1 to 5 Years |
| Over 5 Years |
| Total | ||||
Commercial |
| $ | 855,868 |
| $ | 463,792 |
| $ | 86,531 |
| $ | 1,406,191 |
Commercial real estate |
|
| 584,216 |
|
| 1,491,339 |
|
| 300,022 |
|
| 2,375,577 |
Real estate construction |
|
| 184,949 |
|
| 73,277 |
|
| 30,210 |
|
| 288,436 |
Total |
| $ | 1,625,033 |
| $ | 2,028,408 |
| $ | 416,763 |
| $ | 4,070,204 |
|
|
|
|
|
|
|
|
|
|
|
|
|
Interest rate sensitivity of selected loans |
|
|
|
|
|
|
|
|
|
|
|
|
Fixed rate |
| $ | 732,842 |
| $ | 1,784,354 |
| $ | 398,789 |
| $ | 2,915,985 |
Adjustable rate |
|
| 892,191 |
|
| 244,054 |
|
| 17,974 |
|
| 1,154,219 |
Total |
| $ | 1,625,033 |
| $ | 2,028,408 |
| $ | 416,763 |
| $ | 4,070,204 |
62
Selected loans maturing after one year are summarized below by interest rate sensitivity and loan category (dollars in thousands):
| | | | | | | | | |
| | Interest Rate Sensitivity of Selected Loans | |||||||
| | Fixed | | Adjustable | | | | ||
| | Rate | | Rate | | Total | |||
Selected loans maturing after 1 year | | | | | | | | | |
Commercial | | $ | 862,688 | | $ | 40,232 | | $ | 902,920 |
Commercial real estate | |
| 1,967,626 | |
| 160,023 | |
| 2,127,649 |
Real estate construction | |
| 161,388 | |
| 14,288 | |
| 175,676 |
Total selected loans maturing after 1 year | | $ | 2,991,702 | | $ | 214,543 | | $ | 3,206,245 |
Allowance for LoanCredit Losses
The following table showssummarizes, by loan category, activity affecting the allowance for loan losses (dollars in thousands):
|
|
|
|
|
|
|
|
|
|
|
|
|
|
|
|
|
|
| Years ended December 31, |
| |||||||||||||
|
| 2018 |
| 2017 |
| 2016 |
| 2015 |
| 2014 |
| |||||
Average portfolio loans outstanding during period |
| $ | 5,533,549 |
| $ | 4,567,259 |
| $ | 3,394,352 |
| $ | 2,518,328 |
| $ | 2,290,441 |
|
Allowance for loan losses: |
|
|
|
|
|
|
|
|
|
|
|
|
|
|
|
|
Balance at beginning of period |
| $ | 53,582 |
| $ | 47,795 |
| $ | 47,487 |
| $ | 47,453 |
| $ | 47,567 |
|
|
|
|
|
|
|
|
|
|
|
|
|
|
|
|
|
|
Loans charged-off: |
|
|
|
|
|
|
|
|
|
|
|
|
|
|
|
|
Commercial |
| $ | (3,968) |
| $ | (994) |
| $ | (6,598) |
| $ | (1,333) |
| $ | (1,990) |
|
Commercial real estate |
|
| (4,352) |
|
| (1,965) |
|
| (470) |
|
| (1,462) |
|
| (1,173) |
|
Real estate construction |
|
| (97) |
|
| (48) |
|
| (24) |
|
| — |
|
| (726) |
|
Retail real estate |
|
| (1,815) |
|
| (2,691) |
|
| (2,106) |
|
| (1,534) |
|
| (3,052) |
|
Retail other |
|
| (712) |
|
| (541) |
|
| (458) |
|
| (365) |
|
| (430) |
|
Total charge-offs |
| $ | (10,944) |
| $ | (6,239) |
| $ | (9,656) |
| $ | (4,694) |
| $ | (7,371) |
|
Recoveries: |
|
|
|
|
|
|
|
|
|
|
|
|
|
|
|
|
Commercial |
| $ | 1,251 |
| $ | 3,561 |
| $ | 1,266 |
| $ | 391 |
| $ | 410 |
|
Commercial real estate |
|
| 449 |
|
| 716 |
|
| 123 |
|
| 1,491 |
|
| 2,379 |
|
Real estate construction |
|
| 218 |
|
| 458 |
|
| 441 |
|
| 284 |
|
| 1,612 |
|
Retail real estate |
|
| 1,327 |
|
| 1,563 |
|
| 2,317 |
|
| 729 |
|
| 644 |
|
Retail other |
|
| 336 |
|
| 425 |
|
| 267 |
|
| 233 |
|
| 212 |
|
Total recoveries |
| $ | 3,581 |
| $ | 6,723 |
| $ | 4,414 |
| $ | 3,128 |
| $ | 5,257 |
|
Net loan (charge-offs) recoveries |
| $ | (7,363) |
| $ | 484 |
| $ | (5,242) |
| $ | (1,566) |
| $ | (2,114) |
|
Provision for loan losses |
| $ | 4,429 |
| $ | 5,303 |
| $ | 5,550 |
| $ | 1,600 |
| $ | 2,000 |
|
Balance at end of period |
| $ | 50,648 |
| $ | 53,582 |
| $ | 47,795 |
| $ | 47,487 |
| $ | 47,453 |
|
Ratios: |
|
|
|
|
|
|
|
|
|
|
|
|
|
|
|
|
Net charge-offs (recoveries) to average portfolio loans |
|
| 0.13 | % |
| (0.01) | % |
| 0.15 | % |
| 0.06 | % |
| 0.09 | % |
Allowance for loan losses to portfolio loans at period end |
|
| 0.91 | % |
| 0.97 | % |
| 1.23 | % |
| 1.81 | % |
| 1.97 | % |
Our allowance for loan losses was $50.6 million, or 0.91% ofACL and average portfolio loans and $53.6 million, or 0.97%outstanding for the year ended December 31, 2021, as well as the related ratios of net charge-offs (recoveries) to average portfolio loans at December 31, 2018(dollars in thousands):
| | | | | | | | | | |
|
| |
| | | | Ratio of | | ||
| | | | | | Net Charge-offs | | |||
| | | | | Average | | (Recoveries) | | ||
| | | | Portfolio Loans | | To Average | | |||
| | ACL | | Outstanding | | Portfolio Loans | | |||
ACL Balance, January 1, 2021 | �� | $ | 101,048 | | | | | | | |
Day 1 PCD (1) | | | 4,178 | | | | | | | |
Net (charge-offs) recoveries and average portfolio loans by loan category: | | | | | | | | |||
Commercial | | | (1,397) | | $ | 1,985,511 | | | 0.07 | % |
Commercial real estate | |
| (666) | | | 2,953,944 | | | 0.02 | % |
Real estate construction | |
| 89 | | | 450,713 | | | (0.02) | % |
Retail real estate | |
| (76) | | | 1,446,673 | | | 0.01 | % |
Retail other | |
| (188) | | | 132,966 | | | 0.14 | % |
Net (charge-offs) recoveries and average portfolio loans | | | (2,238) | | $ | 6,969,807 | | | 0.03 | % |
Provision for credit losses | | | (15,101) | | | | | | | |
ACL Balance, December 31, 2021 | | $ | 87,887 | | | | | | | |
| (1) | The Day 1 PCD is attributable to the CAC acquisition. |
The following table summarizes the relationship between the ACL and 2017, respectively. As a resulttotal portfolio loans, as of acquisitions, the Company is holding $1.2 billion of acquired loans that are carried net of a fair value adjustment of $13.9 million for credit and interest rate marks and are only includedperiods indicated (dollars in the allowance calculation to the extent that the reserve requirement exceeds the fair value adjustment. thousands):
| | | | | | | | | | |
| | As of December 31, | | |||||||
|
| 2021 |
| 2020 |
| 2019 |
| |||
Portfolio loans | | | | | | | | | | |
Portfolio loans, excluding PPP loans | | $ | 7,114,040 | | $ | 6,367,774 | | $ | 6,687,249 | |
PPP loans, amortized cost | | | 74,958 | | | 446,403 | | | — | |
Total portfolio loans | | $ | 7,188,998 | | $ | 6,814,177 | | $ | 6,687,249 | |
| | | | | | | | | | |
ACL | | $ | 87,887 | | $ | 101,048 | | $ | 53,748 | |
| | | | | | | | | | |
Ratios | | | | | | | | | | |
ACL to portfolio loans | | | 1.22 | % | | 1.48 | % | | 0.80 | % |
ACL to portfolio loans, excluding PPP loans | | | 1.24 | % | | 1.59 | % | | 0.80 | % |
4663
The following table sets forth the allowance for loan lossesACL by loan categories and percentage of loans to total loans as of December 31 for each of the years indicated (dollars in thousands):
|
|
|
|
|
|
|
|
|
|
|
|
|
|
|
|
|
|
|
|
|
|
|
|
|
|
| ||||||||||||||||||||||||||
|
| 2018 |
| 2017 |
| 2016 |
| 2015 |
| 2014 |
| |||||||||||||||||||||||||||||||||||||||||
|
|
|
|
| % of |
|
|
|
| % of |
|
|
|
| % of |
|
|
|
| % of |
|
|
|
| % of |
| ||||||||||||||||||||||||||
|
|
|
|
| Loans |
|
|
|
| Loans |
|
|
|
| Loans |
|
|
|
| Loans |
|
|
|
| Loans |
| ||||||||||||||||||||||||||
|
|
|
|
| to Total |
|
|
|
| to Total |
|
|
|
| to Total |
|
|
|
| to Total |
|
|
|
| to Total |
| ||||||||||||||||||||||||||
|
| Amount |
| Loans |
| Amount |
| Loans |
| Amount |
| Loans |
| Amount |
| Loans |
| Amount |
| Loans |
| |||||||||||||||||||||||||||||||
|
|
|
|
|
|
|
|
|
|
|
|
|
|
|
|
|
|
|
|
|
|
|
|
|
|
| ||||||||||||||||||||||||||
| | | | | | | | | | | | | | | | | | | | | | | | | | | ||||||||||||||||||||||||||
| | 2021 | | 2020 | | 2019 | | 2018 | | 2017 |
| |||||||||||||||||||||||||||||||||||||||||
|
| | |
| % of |
| | |
| % of |
| | |
| % of |
| | |
| % of |
| | |
| % of |
| ||||||||||||||||||||||||||
| | | | | Loans | | | | | Loans | | | | | Loans | | | | | Loans | | | | | Loans |
| ||||||||||||||||||||||||||
| | | | | to Total | | | | | to Total | | | | | to Total | | | | | to Total | | | | | to Total |
| ||||||||||||||||||||||||||
|
| Amount |
| Loans |
| Amount |
| Loans |
| Amount |
| Loans |
| Amount |
| Loans |
| Amount |
| Loans |
| |||||||||||||||||||||||||||||||
ACL | | | | | | | | | | | | | | | | | | | | | | | | | | | ||||||||||||||||||||||||||
Commercial |
| $ | 17,829 |
| 25.2 | % | $ | 14,779 |
| 25.6 | % | $ | 13,303 |
| 24.7 | % | $ | 13,115 |
| 24.9 | % | $ | 10,041 |
| 24.9 | % | | $ | 23,855 |
| 27.0 | % | $ | 23,866 |
| 29.6 | % | $ | 18,291 |
| 26.2 | % | $ | 17,829 |
| 25.2 | % | $ | 14,779 |
| 25.6 | % |
Commercial real estate |
|
| 21,137 |
| 42.5 | % |
| 21,813 |
| 42.7 | % |
| 20,623 |
| 42.6 | % |
| 18,604 |
| 45.8 | % |
| 20,639 |
| 45.8 | % | |
| 38,249 |
| 43.4 | % |
| 46,230 |
| 42.4 | % |
| 21,190 |
| 41.8 | % |
| 21,137 |
| 42.5 | % |
| 21,813 |
| 42.7 | % |
Real estate construction |
|
| 2,723 |
| 5.2 | % |
| 2,861 |
| 4.7 | % |
| 1,870 |
| 4.7 | % |
| 1,763 |
| 3.6 | % |
| 2,795 |
| 4.4 | % | |
| 5,102 |
| 5.4 | % |
| 8,193 |
| 6.8 | % |
| 3,204 |
| 6.0 | % |
| 2,723 |
| 5.2 | % |
| 2,861 |
| 4.7 | % |
Retail real estate |
|
| 8,471 |
| 26.6 | % |
| 13,783 |
| 26.5 | % |
| 11,648 |
| 27.6 | % |
| 13,714 |
| 25.1 | % |
| 13,662 |
| 24.5 | % | |
| 17,589 |
| 21.0 | % |
| 21,992 |
| 20.7 | % |
| 10,495 |
| 25.3 | % |
| 8,471 |
| 26.6 | % |
| 13,783 |
| 26.5 | % |
Retail other |
|
| 488 |
| 0.5 | % |
| 346 |
| 0.5 | % |
| 351 |
| 0.4 | % |
| 291 |
| 0.6 | % |
| 316 |
| 0.4 | % | |
| 3,092 |
| 3.2 | % |
| 767 |
| 0.5 | % |
| 568 |
| 0.7 | % |
| 488 |
| 0.5 | % |
| 346 |
| 0.5 | % |
Total |
| $ | 50,648 |
| 100.0 | % | $ | 53,582 |
| 100.0 | % | $ | 47,795 |
| 100.0 | % | $ | 47,487 |
| 100.0 | % | $ | 47,453 |
| 100.0 | % | ||||||||||||||||||||||||||
Total ACL | | $ | 87,887 |
| 100.0 | % | $ | 101,048 |
| 100.0 | % | $ | 53,748 |
| 100.0 | % | $ | 50,648 |
| 100.0 | % | $ | 53,582 |
| 100.0 | % | ||||||||||||||||||||||||||
The ongoing impacts of CECL will be dependent upon changes in economic conditions and forecasts, originated and acquired loan portfolio composition, credit performance trends, portfolio duration, and other factors. As of December 31, 2018,2021, management believed the level of the allowance and coverage of non-performing loans to be appropriate based upon the information available. However, additional losses may be identified in our loan portfolio as new information is obtained.
Provision for LoanCredit Losses
The provision for loan lossesACL is a current charge against incomesignificant estimate in our Consolidated Balance Sheet, affecting both earnings and representscapital. The methodology adopted influences, and is influenced by, Busey Bank’s overall credit risk management processes. The ACL is recorded in accordance with GAAP to provide an amount which management believesadequate reserve for expected credit losses that is sufficientreflective of management’s best estimate of what is expected to maintain an appropriate allowance for known and probablebe collected. All estimates of credit losses inshould be based on a careful consideration of all significant factors affecting the loan portfolio. In assessing the appropriatenesscollectability as of the allowance for loan losses, management considers the size and quality of the loan portfolio measured against prevailing economic conditions, regulatory guidelines, historical loan loss experience and credit quality of the portfolio. When a determinationevaluation date. The ACL is made by management to charge-off a loan balance, a write-off is charged against the allowance for loan losses. Management focuses on identifying problem loan situations on a proactive basis and makes adjustments toestablished through the provision for loan losses based upon current information available.credit loss expense charged to income. We recorded a provision release of $15.1 million for the year ended December 31, 2021, reflecting improvements in macroeconomic conditions and asset quality, compared to a provision expense of $38.8 million and $10.4 million for the years ended December 31, 2020, and 2019, respectively.
The provision for loan losses was $4.4 million in 2018, $5.3 million in 2017 and $5.6 million in 2016. As a result of acquisitions, the Company is holding acquired loans that are carried net of a fair value adjustment for credit and interest rate marks and are only included in the allowance calculation to the extent that the reserve requirement exceeds the fair value adjustment. As these acquired loans renew an allowance for loan losses is established, which in management’s opinion, will be adequate to absorb probable credit losses.
Sensitive assets include non-accrual loans, loans on our classified loan reports and other loans identified as having the potential for loss. Management reviews sensitive assets on at least a quarterly basis for changes in the applicable customer’s ability to pay and changes in the value of underlying collateral and incorporates this assessment in the estimate of probable losses. The majority of sensitive assets are repaid in conformance with their contracts.
Non-performing Loans and Non-performing Assets
Loans are considered past due if the required principal and interest payments have not been received as of the date such payments were due. Loans are placed on non-accrual status when, in management’s opinion, the borrower may be unable to meet payment obligations as they become due, as well as when required by regulatory provisions.guidelines. Loans may be placed on non-accrual status regardless of whether or not such loans are considered past due. Loans are returned to accrual status when all the principal and interest amounts contractually due are brought current and future payments are reasonably assured.
Typically, loans are collateral dependent.secured by collateral. When a collateral dependent loan is classified as non-accrual and determined to be collateral dependent, it is appropriately reserved or charged down through the allowance for loan lossesACL to the fair value of our interest in the underlying collateral less estimated costs to sell. Our loan portfolio is collateralized primarily by real estate.
4764
The following table sets forth information concerning non-performing loans and performing restructured loans at December 31 for each year indicated (dollars(dollars in thousands):
|
|
|
|
|
|
|
|
|
|
|
|
|
|
|
|
|
|
| 2018 |
| 2017 |
| 2016 |
| 2015 |
| 2014 |
| |||||
Non-accrual loans |
| $ | 34,997 |
| $ | 24,624 |
| $ | 21,423 |
| $ | 12,748 |
| $ | 9,000 |
|
Loans 90+ days past due and still accruing |
|
| 1,601 |
|
| 2,741 |
|
| 131 |
|
| 15 |
|
| 10 |
|
Total non-performing loans |
| $ | 36,598 |
| $ | 27,365 |
| $ | 21,554 |
| $ | 12,763 |
| $ | 9,010 |
|
|
|
|
|
|
|
|
|
|
|
|
|
|
|
|
|
|
Repossessed assets |
|
| 375 |
|
| 1,282 |
|
| 2,517 |
|
| 779 |
|
| — |
|
Other assets acquired in satisfaction of debts previously contracted |
|
| 1 |
|
| 1 |
|
| 1 |
|
| 4 |
|
| 216 |
|
Total other real estate owned (“OREO”) |
| $ | 376 |
| $ | 1,283 |
| $ | 2,518 |
| $ | 783 |
| $ | 216 |
|
|
|
|
|
|
|
|
|
|
|
|
|
|
|
|
|
|
Total non-performing loans and OREO |
| $ | 36,974 |
| $ | 28,648 |
| $ | 24,072 |
| $ | 13,546 |
| $ | 9,226 |
|
Non-performing loans to portfolio loans, before allowance for loan losses |
|
| 0.66 | % |
| 0.50 | % |
| 0.56 | % |
| 0.49 | % |
| 0.37 | % |
Non-performing loans and OREO to portfolio loans, before allowance for loan losses |
|
| 0.66 | % |
| 0.52 | % |
| 0.62 | % |
| 0.52 | % |
| 0.38 | % |
Performing restructured loans not included above |
| $ | 8,446 |
| $ | 9,981 |
| $ | 10,652 |
| $ | 8,830 |
| $ | 11,866 |
|
| | | | | | | | | | | | | | | | |
| | As of December 31, | | |||||||||||||
|
| 2021 |
| 2020 |
| 2019 |
| 2018 |
| 2017 |
| |||||
Loans 30 – 89 days past due | | $ | 6,261 | | $ | 7,578 | | $ | 14,271 | | $ | 7,121 | | $ | 12,897 | |
| | | | | | | | | | | | | | | | |
Non-performing assets | | | | | | | | | | | | | | | | |
Non-performing loans: | | | | | | | | | | | | | | | | |
Non-accrual loans | | | 15,946 | | | 22,930 | | | 27,896 | | | 34,997 | | | 24,624 | |
Loans 90+ days past due and still accruing | |
| 906 | |
| 1,371 | |
| 1,611 | |
| 1,601 | |
| 2,741 | |
Total non-performing loans | | | 16,852 | | | 24,301 | | | 29,507 | | | 36,598 | | | 27,365 | |
OREO and other repossessed assets | | | 4,416 | | | 4,571 | | | 3,057 | | | 376 | | | 1,283 | |
Total non-performing assets | | $ | 21,268 | | $ | 28,872 | | $ | 32,564 | | $ | 36,974 | | $ | 28,648 | |
| | | | | | | | | | | | | | | | |
Substandard (excludes 90+ days past due) | | | 70,565 | | | 68,924 | | | 74,315 | | | 85,062 | | | 87,372 | |
Classified assets | | $ | 91,833 | | $ | 97,796 | | $ | 106,879 | | $ | 122,036 | | $ | 116,020 | |
| | | | | | | | | | | | | | | | |
Performing TDRs (includes 30 – 89 days past due) | | $ | 1,801 | | $ | 3,829 | | $ | 5,005 | | $ | 8,446 | | $ | 9,981 | |
ACL | | | 87,887 | | | 101,048 | | | 53,748 | | | 50,648 | | | 53,582 | |
| | | | | | | | | | | | | | | | |
Ratios | | | | | | | | | | | | | | | | |
ACL to non-accrual loans | | | 551.15 | % | | 440.68 | % | | 192.67 | % | | 144.72 | % | | 217.60 | % |
ACL to non-performing loans | | | 521.52 | % | | 415.82 | % | | 182.15 | % | | 138.39 | % | | 195.80 | % |
ACL to non-performing assets | | | 413.24 | % | | 349.99 | % | | 165.05 | % | | 136.98 | % | | 187.04 | % |
Non-accrual loans to portfolio loans | | | 0.22 | % | | 0.34 | % | | 0.42 | % | | 0.63 | % | | 0.45 | % |
Non-performing assets to total assets | | | 0.17 | % | | 0.27 | % | | 0.34 | % | | 0.48 | % | | 0.41 | % |
Non-performing loans to portfolio loans | | | 0.23 | % | | 0.36 | % | | 0.44 | % | | 0.66 | % | | 0.50 | % |
Non-performing loans to portfolio loans, excluding PPP loans | | | 0.24 | % | | 0.38 | % | | 0.44 | % | | 0.66 | % | | 0.50 | % |
Non-performing assets to portfolio loans and OREO | | | 0.30 | % | | 0.42 | % | | 0.49 | % | | 0.66 | % | | 0.52 | % |
Classified assets to Busey Bank Tier 1 Capital and ACL | | | 6.91 | % | | 8.47 | % | | 9.72 | % | | 14.28 | % | | 14.69 | % |
Credit quality continues to be exceptionally strong. Total non-performing loans and OREOassets were $37.0$21.3 million at December 31, 2018,2021, compared to $28.6$28.9 million at December 31, 2017.2020. Asset quality metrics remain dependent upon market-specific economic conditions, and specific measures may fluctuate from period to period. Continued disciplined credit management resulted in non-performing loans as a percentage of portfolio loans of 0.23% at December 31, 2021, compared with 0.36% at December 31, 2020. If economic conditions were to deteriorate, we would expect the credit quality of our loan portfolio to decline and loan defaults to increase. Allowance coverage of non-performing loans increased to 521.5% at December 31, 2021, compared to 415.8% at December 31, 2020.
Classified assets, which includes non-performing assets and substandard loans, declined to $91.8 million at December 31, 2021, compared to $97.8 million at December 31, 2020. The ratio of classified assets to Busey Bank Tier 1 capital and ACL declined to 6.9% at December 31, 2021, from 8.5% at December 31, 2020.
65
Potential Problem Loans
Potential problem loans are those loans classified as substandard which are not categorized as impaired,individually evaluated, restructured, non-accrual, or 90+ days past due, but where current information indicates that the borrower may not be able to comply with loan repayment terms. Management assesses the potential for loss on such loans and considers the effect of any potential loss in determining its provision for probable loanexpected credit losses. Potential problem loans totaled $70.9increased to $70.5 million at December 31, 2018,2021, compared to $70.4$68.8 million at December 31, 2017.2020. Management continues to monitor these credits and anticipates that restructurings, guarantees, additional collateral, or other planned actions will result in full repayment of the debts. As of December 31, 2018,2021, management identified no other loans that represent or result from trends or uncertainties which would be expected to materially impact future operating results, liquidity, or capital resources.
Deposits
The following table shows the deposit mix for each of the periods presented (dollars in thousands):
| | | | | | | | | | | | | | | | | | | |
| | As of December 31, | | ||||||||||||||||
| | 2021 | | 2020 | | 2019 | | ||||||||||||
|
| Balance |
| % Total | | Balance |
| % Total | | Balance |
| % Total | | ||||||
Deposits | | | | | | | | | | | | | | | | | | | |
Non-maturity deposits: | | | | | | | | | | | | | | | | | | | |
Demand deposits, noninterest-bearing | | $ | 3,670,267 |
| | 34.1 | % | $ | 2,552,039 |
| | 29.4 | % | $ | 1,832,619 |
| | 23.2 | % |
Interest-bearing transaction deposits | |
| 2,720,417 |
| | 25.2 | % |
| 2,263,093 |
| | 26.1 | % |
| 1,989,854 |
| | 25.2 | % |
Saving deposits and money market deposits | |
| 3,442,244 |
| | 32.0 | % |
| 2,743,369 |
| | 31.6 | % |
| 2,545,073 |
| | 32.2 | % |
Total non-maturity deposits | | | 9,832,928 | | | 91.3 | | | 7,558,501 | | | 87.1 | | | 6,367,546 | | | 80.6 | |
| | | | | | | | | | | | | | | | | | | |
Time deposits | |
| 935,649 |
| | 8.7 | % |
| 1,119,348 |
| | 12.9 | % |
| 1,534,850 |
| | 19.4 | % |
Total deposits | | $ | 10,768,577 |
| | 100.0 | % | $ | 8,677,849 |
| | 100.0 | % | $ | 7,902,396 |
| | 100.0 | % |
| | | | | | | | | | | | | | | | | | | |
Change in non-maturity deposits | | | 2,274,427 | | | | | | 1,190,955 | | | | | | | | | | |
Percent change in non-maturity deposits | | | 30.1 | % | | | | | 18.7 | % | | | | | | | | | |
We focus on deepening our relationship with customers to foster core deposit growth, allowing us to reduce our reliance on wholesale funding. Our 2021 deposit balances were impacted by the retention of PPP loan funding in customer deposit accounts, the impacts of economic stimulus, and other core deposit growth. As indicated in the following table, average noninterest-bearingCore deposits include non-brokered transaction accounts, money market deposit accounts, and time deposits of $250,000 or less. Time deposits as a percentage of average total deposits were 24.1% for the year endeddecreased to 8.7% as of December 31, 2018, 25.0% for the year ended2021, compared to 12.9% as of December 31, 2017, and 23.8% for2020. As time deposits mature, we are actively engaging our customers to renew at current market rates.
Deposits are federally insured up to the year ended December 31, 2016 (dollarsFDIC insurance limit of $250,000. When a portion of a deposit account exceeds the FDIC insurance limit, that portion is uninsured. The following table summarizes the uninsured portion of time deposits by maturity date (dollars in thousands):
| | | |
|
| As of | |
| | December 31, 2021 | |
Uninsured time deposits by schedule of maturities | | | |
3 months or less |
| $ | 24,946 |
Over 3 months through 6 months | |
| 23,108 |
Over 6 months through 12 months | |
| 34,362 |
Thereafter | |
| 47,396 |
Uninsured time deposits | | $ | 129,812 |
|
|
|
|
|
|
|
|
|
|
|
|
|
|
|
|
|
|
|
|
|
|
|
|
| Years Ended December 31, |
| |||||||||||||||||||
|
| 2018 |
| 2017 |
| 2016 |
| |||||||||||||||
|
| Average |
|
|
| Average |
| Average |
|
|
| Average |
| Average |
|
|
| Average |
| |||
|
| Balance |
| % Total |
| Rate |
| Balance |
| % Total |
| Rate |
| Balance |
| % Total |
| Rate |
| |||
Demand deposits, noninterest- bearing |
| $ | 1,492,242 |
| 24.1 | % | — | % | $ | 1,252,363 |
| 25.0 | % | — | % | $ | 949,271 |
| 23.8 | % | — | % |
Interest-bearing transaction deposits |
|
| 1,257,491 |
| 20.3 | % | 0.36 | % |
| 1,103,245 |
| 22.0 | % | 0.18 | % |
| 924,078 |
| 23.2 | % | 0.09 | % |
Saving deposits and money market deposits |
|
| 1,958,435 |
| 31.6 | % | 0.36 | % |
| 1,729,492 |
| 34.5 | % | 0.22 | % |
| 1,392,335 |
| 34.9 | % | 0.16 | % |
Time deposits |
|
| 1,491,363 |
| 24.0 | % | 1.41 | % |
| 927,736 |
| 18.5 | % | 0.77 | % |
| 721,124 |
| 18.1 | % | 0.56 | % |
Total |
| $ | 6,199,531 |
| 100.0 | % | 0.53 | % | $ | 5,012,836 |
| 100.0 | % | 0.26 | % | $ | 3,986,808 |
| 100.0 | % | 0.18 | % |
66
Borrowings
Securities sold under agreements to repurchase, which are classified as secured borrowings, generally mature daily. Short-term borrowings include FHLB advances which mature in less than one year from the date of origination.origination, and the current portion of long-term debt due within 12 months.
48
On April 30, 2018, the CompanyMay 28, 2021, First Busey entered into a third amendment to extend the maturity of its revolving facility from April 30, 2018 to April 30, 2019, to decrease the maximum principal amount from $40.0 million to $20.0 million, and to amend the annual interest rate. Subsequent to year end, on January 29, 2019, the Company entered into anSecond Amended and Restated Credit Agreement, pursuant to allow any outstanding balance on thewhich we have access to (i) a $40.0 million revolving facility at the maturityline of credit with a termination date of April 30, 2019 to be converted into2022, and (ii) a $60.0 million term loan with a maturity date of April 30, 2021.May 31, 2026. The loans have an annual interest rate of 1.75% plus the 1-month LIBOR rate. Proceeds of the term loan were used to fund a part of the cash portion of the merger consideration related to the acquisition of CAC and for general corporate purposes. The revolving credit facility incurs a non-usage fee based on theany undrawn amount. The Company hadamounts. As of December 31, 2021, there was no balance outstanding balance on the revolving credit facility at December 31, 2018 or 2017.
The Amended and Restated Credit Agreement also provides for a $60.0total of $54.0 million outstanding on the term loan, (the “Term Loan”) with a maturity date of November 30, 2023. The loan has an annual interest rate of one-month LIBOR plus a spread of 1.50%. The proceeds of the Term Loan were used to fund the cash consideration related to the acquisition of Banc Ed.which $12.0 million is short-term and $42.0 million is long-term.
The following table sets forth the distribution of short-term borrowings and weighted average interest rates thereon as of December 31, 2018, 2017 and 2016 (dollars in thousands).:
| | | | | | | | | | |
|
| Years Ended December 31, | | |||||||
|
| 2021 |
| 2020 |
| 2019 | | |||
Securities sold under agreements to repurchase |
| |
|
| |
|
| |
| |
Balance at end of period | | $ | 270,139 | | $ | 175,614 | | $ | 205,491 | |
Weighted average interest rate at end of period | |
| 0.08 | % |
| 0.13 | % |
| 1.05 | % |
Maximum outstanding at any month end in year-to-date period | | $ | 270,139 | | $ | 210,529 | | $ | 225,531 | |
Average daily balance for the year-to-date period | | $ | 218,454 | | $ | 187,032 | | $ | 196,681 | |
Weighted average interest rate during period (1) | |
| 0.10 | % |
| 0.35 | % |
| 1.19 | % |
| | | | | | | | | | |
Short-term borrowings, FHLB advances | |
|
| |
|
| |
|
| |
Balance at end of period | | $ | 5,678 | | $ | 4,658 | | $ | 2,551 | |
Weighted average interest rate at end of period | |
| 0.36 | % |
| 0.43 | % |
| 1.90 | % |
Maximum outstanding at any month end in year-to-date period | | $ | 5,678 | | $ | 4,658 | | $ | 99,739 | |
Average daily balance for the year-to-date period | | $ | 4,934 | | $ | 3,556 | | $ | 27,495 | |
Weighted average interest rate during period (1) | |
| 0.41 | % |
| 0.53 | % |
| 2.81 | % |
| | | | | | | | | | |
Term loan, current portion due within 12 months | |
|
| |
|
| |
|
| |
Balance at end of period | | $ | 12,000 | | $ | — | | $ | — | |
Weighted average interest rate at end of period | |
| 1.88 | % |
| — | % |
| — | % |
Maximum outstanding at any month end in year-to-date period | | $ | 12,000 | | $ | — | | $ | — | |
Average daily balance for the year-to-date period | | $ | 7,167 | | $ | — | | $ | — | |
Weighted average interest rate during period (1) | |
| 1.79 | % |
| — | % |
| — | % |
|
|
|
|
|
|
|
|
|
|
|
|
| December 31, |
| December 31, |
| December 31, |
| |||
|
| 2018 |
| 2017 |
| 2016 |
| |||
Securities sold under agreements to repurchase |
|
|
|
|
|
|
|
|
|
|
Balance at end of period |
| $ | 185,796 |
| $ | 304,566 |
| $ | 189,157 |
|
Weighted average interest rate at end of period |
|
| 1.05 | % |
| 0.57 | % |
| 0.30 | % |
Maximum outstanding at any month end in year-to-date period |
| $ | 267,596 |
| $ | 304,566 |
| $ | 216,293 |
|
Average daily balance for the year-to-date period |
| $ | 234,239 |
| $ | 213,527 |
| $ | 181,474 |
|
Weighted average interest rate during period(1) |
|
| 0.69 | % |
| 0.46 | % |
| 0.22 | % |
|
|
|
|
|
|
|
|
|
|
|
Short-term borrowings, FHLB advances |
|
|
|
|
|
|
|
|
|
|
Balance at end of period |
| $ | — |
| $ | 220,000 |
| $ | 75,000 |
|
Weighted average interest rate at end of period |
|
| — | % |
| 1.42 | % |
| 0.63 | % |
Maximum outstanding at any month end in year-to-date period |
| $ | 225,000 |
| $ | 234,600 |
| $ | 236,700 |
|
Average daily balance for the year-to-date period |
| $ | 81,438 |
| $ | 84,201 |
| $ | 96,698 |
|
Weighted average interest rate during period(1) |
|
| 1.80 | % |
| 1.20 | % |
| 0.53 | % |
|
|
|
|
|
|
|
|
|
|
|
Short-term borrowings, revolving loan |
|
|
|
|
|
|
|
|
|
|
Balance at end of period |
| $ | — |
| $ | — |
| $ | — |
|
Weighted average interest rate at end of period |
|
| — | % |
| — | % |
| — | % |
Maximum outstanding at any month end in year-to-date period |
| $ | — |
| $ | — |
| $ | 10,000 |
|
Average daily balance for the year-to-date period |
| $ | — |
| $ | — |
| $ | 2,596 |
|
Weighted average interest rate during period(1) (2) |
|
| — | % |
| — | % |
| 4.78 | % |
| The weighted average interest rate is computed by dividing total interest for the period by the average daily balance outstanding. |
|
|
Long-termIn addition to the term loan, long-term debt includes funds borrowed from the FHLB which totaled $4.1 million and totaled $50.0$4.8 million at December 31, 20182021, and 2017.2020, respectively.
On May 25, 2017, the Companywe issued $40.0 million of 3.75% senior notes that mature on May 25, 2022. The senior notes are payable semi-annually on each May 25 and November 25, commencing on November 25, 2017. The senior notes are not subject to optional redemption by the Company. Additionally, on May 25, 2017, the Companywe issued $60.0 million of fixed-to-floating rate subordinated notes that mature on May 25, 2027. The subordinated notes, which qualify as Tier 2 capital for First Busey, arebear interest at an initialannual rate of 4.75% for the first five years after issuance and thereafter bear interest at an annuala floating rate equal to three-month3-month LIBOR plus a spread of 2.919%., as calculated on each applicable determination date. The subordinated notes are payable semi-annually on each May 25 and November 25, commencing on November 25, 2017, during the five year fixed-term and thereafter eachon February 25, May 25, August 25, and November 25 of each year, commencing on August 25, 2022. The subordinated notes have an optional redemption in whole or in part on any interest payment date on or after May 25, 2022. The senior notes and subordinated notes are unsecured obligations of First Busey.
67
On June 1, 2020, we issued $125.0 million of fixed-to-floating rate subordinated notes that mature on June 1, 2030. The subordinated notes, which qualify as Tier 2 capital for First Busey, bear interest at an annual rate of 5.25% for the Company. first five years after issuance and thereafter bear interest at a floating rate equal to a three-month benchmark rate plus a spread of 5.11%, as calculated on each applicable determination date. The subordinated notes are payable semi-annually on each June 1 and December 1, during the five-year fixed-term, and thereafter on March 1, June 1, September 1, and December 1 of each year, commencing on September 1, 2025. The subordinated notes have an optional redemption, in whole or in part, on any interest payment date on or after June 1, 2025. The subordinated notes are unsecured obligations of First Busey.
Unamortized debt issuance costs related to the senior notes and subordinated notes totaled $0.5are presented in the following table (dollars in thousands):
| | | | | | |
|
| As of December 31, | ||||
|
| 2021 |
| 2020 | ||
Unamortized debt issuance costs | | | | | | |
Senior notes issued in 2017 | | $ | 56 | | $ | 191 |
Subordinated notes issued in 2017 | | | 549 | | | 651 |
Subordinated notes issued in 2020 | | | 1,678 | | | 2,123 |
Total unamortized debt issuance costs | | $ | 2,283 | | $ | 2,965 |
Junior Subordinated Debt Owed to Unconsolidated Trusts
First Busey maintains statutory trusts for the sole purpose of issuing and servicing trust preferred securities and related trust common securities. Proceeds from such issuances were used by the trusts to purchase junior subordinated notes of First Busey, which are the sole assets of each trust. Concurrent with the issuance of the trust preferred securities, we issued guarantees for the benefit of the holders of the trust preferred securities. The trust preferred securities are instruments that qualify, and are treated by First Busey, as Tier 1 regulatory capital. First Busey owns all of the common securities of each trust. The trust preferred securities issued by each trust rank equally with the common securities in right of payment, except that if an event of default under the indenture governing the notes has occurred and is continuing, the preferred securities will rank senior to the common securities in right of payment. In connection with the Pulaski acquisition in 2016, we acquired similar statutory trusts previously maintained by Pulaski and the fair value adjustment is being accreted over their weighted average remaining life, with a balance of $3.0 million remaining to be accreted. We had $71.6 million and $0.9$71.5 million respectively,of junior subordinated debt owed to unconsolidated trusts at December 31, 2018. Unamortized debt issuance costs related to the senior notes2021, and subordinated notes totaled $0.6 million and $1.0 million, respectively, at December 31, 2017. The Company used the net proceeds from the offering to finance a portion of the cash consideration for its acquisition of First Community, to redeem a portion of First Community subordinated debentures in July 2017, and to finance a portion of the cash consideration for its acquisition of Mid Illinois in October 2017, with the remaining proceeds used for general corporate purposes.2020, respectively.
49
In relation to the First Community acquisition, the Company assumed $15.3 million in subordinated debt, of which $9.8 million was simultaneously redeemed. A $0.3 million purchase accounting premium was recorded on the remaining balance of the subordinated debt. On September 30, 2018, the Company, at its option, redeemed the balance of the subordinated debt at a redemption price equal to the principal amount outstanding plus accrued but unpaid interest.
Liquidity
Liquidity management is the process by which we ensure that adequate liquid funds are available to meet the present and future cash flow obligations arising in the daily operations of our business. These financial obligations consist of needs for funds to meet commitments to borrowers for extensions of credit, fund capital expenditures, honor withdrawals by customers, pay dividends to stockholders, and pay operating expenses. Our most liquid assets are cash and due from banks, interest-bearing bank deposits, and federal funds sold. The balancesBalances of these assets are dependent on the Company’sour operating, investing, lending, and financing activities during any given period.
Average liquid assets are summarized in the table below (dollars in thousands):
| | | | | | | | | | |
| | Years Ended December 31, |
| |||||||
|
| 2021 |
| 2020 |
| 2019 |
| |||
Average liquid assets | | | | | | | | | | |
Cash and due from banks | | $ | 133,711 | | $ | 118,739 | | $ | 114,619 | |
Interest-bearing bank deposits | |
| 630,687 | |
| 488,786 | |
| 312,580 | |
Federal funds sold | |
| — | |
| — | |
| 24 | |
Total average liquid assets | | $ | 764,398 | | $ | 607,525 | | $ | 427,223 | |
| | | | | | | | | | |
Average liquid assets as a percent of average total assets | |
| 6.4 | % |
| 5.9 | % |
| 4.5 | % |
|
|
|
|
|
|
|
|
|
|
|
|
| Years Ended December 31, |
| |||||||
|
| 2018 |
| 2017 |
| 2016 |
| |||
Cash and due from banks |
| $ | 105,114 |
| $ | 92,184 |
| $ | 70,785 |
|
Interest-bearing bank deposits |
|
| 132,661 |
|
| 130,805 |
|
| 232,460 |
|
Federal funds sold |
|
| 1,374 |
|
| 1,659 |
|
| 1,344 |
|
Total |
| $ | 239,149 |
| $ | 224,648 |
| $ | 304,589 |
|
Percent of average total assets |
|
| 3.1 | % |
| 3.6 | % |
| 6.1 | % |
68
First Busey’s primary sources of funds consist of deposits, investment maturities and sales, loan principal repayments, and capital funds. At December 31, 2021, cash and unencumbered securities on our Consolidated Balance Sheets totaled $4.1 billion. Additional liquidity is provided by the ability to borrow from the FHLB, the Federal Reserve, First Busey’s revolving loancredit facility, or to utilize brokered deposits.deposits, as summarized in the table below (dollars in thousands):
| | | | | | |
| | As of December 31, | ||||
|
| 2021 |
| 2020 | ||
Additional borrowing capacity available from: | | | | | | |
FHLB | |
| 1,536,019 | |
| 1,336,655 |
Federal Reserve | | | 624,627 | | | 507,813 |
Revolving credit facility | |
| 40,000 | |
| 20,000 |
Additional borrowing capacity | | $ | 2,200,646 | | $ | 1,864,468 |
As of December 31, 2018,2021, management believed that adequate liquidity existed to meet all projected cash flow obligations. We seek to achieve a satisfactory degree of liquidity by actively managing both assets and liabilities. Asset management guides the proportion of liquid assets to total assets, while liability management monitors future funding requirements and prices liabilities accordingly.
TheOur ability of the Company to pay cash dividends to itsour stockholders and to service itsour debt was historicallyis dependent on the receipt of cash dividends from itsour subsidiaries. Under applicable regulatory requirements, an Illinois state-chartered bank such as Busey Bank may not paypaid dividends in excess of its net profits. Becauseto First Busey Bank had been in a retained earnings deficit position since 2009, it was not able to pay dividends. With prior approval from its regulators, however, an Illinois state-chartered bank in that situation was able to reduce its capital stock by amending its charter to decreasetotaling $60.0 million and $122.0 million for the authorized number of shares,years ended December 31, 2021, and then make a subsequent distribution to its holding company. Using this approach, and with the approval of its regulators, Busey Bank has distributed funds to the Company, the most recent of which was $40.0 million on October 12, 2018. Busey Bank returned to positive retained earnings in the second quarter of 2018. The Company expects Busey Bank to return to paying dividends out of net profits in future periods.2020, respectively.
Off-Balance-Sheet Arrangements
TheBusey Bank routinely enters into commitments to extend credit and standby letters of credit in the normal course of business to meet the financing needs of its customers. As of December 31, 20182021, and 2017,2020, we had outstanding loan commitments and standby letters of credit of $1.4$2.0 billion and $1.3$1.8 billion, respectively. The balance of commitments to extend credit represents future cash requirements and some of these commitments may expire without being drawn upon. We anticipate we will have sufficient funds available to meet current loan commitments, including loan applications received and in process prior to the issuance of firm commitments.
Contractual Obligations
We have entered into certain contractual obligations and other commitments which generally relate to funding of operations through deposits, debt issuance, and property and equipment leases.
50
The following table summarizes significant contractual obligations and other commitments, excluding short-term borrowings, as of December 31, 2018 (dollars2021, (dollars in thousands):
| | | | | | | | | | | | | | | | | | |
|
|
| |
|
| |
| Junior |
| |
|
| |
|
| | ||
| | | | | | | | Subordinated | | | | Senior and | | | | |||
| | | | | | | | Debt Owed to | | | | Subordinated Notes, | | | | |||
| | Certificates of | | Operating | | Unconsolidated | | Long-term | | Net of Unamortized | | | | |||||
|
| Deposit |
| Leases |
| Trusts |
| Debt |
| Issuance Costs |
| Total | ||||||
Contractual obligations by schedule of maturities | | | | | | | | | | | | | ||||||
2022 | | $ | 643,826 | | $ | 2,271 | | $ | — | | $ | — | | $ | 39,944 | | $ | 686,041 |
2023 | |
| 191,995 | |
| 2,098 | |
| — | |
| 16,056 | |
| — | |
| 210,149 |
2024 | |
| 70,111 | |
| 1,650 | |
| — | |
| 12,000 | |
| — | |
| 83,761 |
2025 | |
| 16,149 | |
| 1,413 | |
| — | |
| 12,000 | |
| — | |
| 29,562 |
2026 | |
| 12,834 | |
| 1,164 | |
| — | |
| 6,000 | |
| — | |
| 19,998 |
Thereafter | |
| 734 | |
| 2,766 | |
| 71,635 | |
| — | |
| 182,773 | |
| 257,908 |
Contractual obligations | | $ | 935,649 | | $ | 11,362 | | $ | 71,635 | | $ | 46,056 | | $ | 222,717 | | $ | 1,287,419 |
| | | | | | | | | | | | | | | | | | |
Commitments to extend credit and standby letters of credit | | $ | 2,016,207 | |||||||||||||||
|
|
|
|
|
|
|
|
|
|
|
|
|
|
|
|
|
|
|
|
|
|
|
|
|
|
| Junior |
|
|
|
|
|
|
|
|
| |
|
|
|
|
|
|
|
| Subordinated |
|
|
|
| Senior and |
|
|
| ||
|
|
|
|
|
|
|
| Debt Owed to |
|
|
|
| Subordinated Notes, |
|
|
| ||
|
| Certificates of |
| Operating |
| Unconsolidated |
| Long-term |
| net of unamortized |
|
|
| |||||
|
| Deposit |
| Leases |
| Trusts |
| Debt |
| issuance costs |
| Total | ||||||
2019 |
| $ | 996,048 |
| $ | 1,716 |
| $ | — |
| $ | 20,000 |
| $ | — |
| $ | 1,017,764 |
2020 |
|
| 305,167 |
|
| 1,571 |
|
| — |
|
| — |
|
| — |
|
| 306,738 |
2021 |
|
| 83,220 |
|
| 1,019 |
|
| — |
|
| 18,000 |
|
| — |
|
| 102,239 |
2022 |
|
| 72,048 |
|
| 795 |
|
| — |
|
| — |
|
| 39,539 |
|
| 112,382 |
2023 |
|
| 40,504 |
|
| 503 |
|
| — |
|
| — |
|
| — |
|
| 41,007 |
Thereafter |
|
| 16 |
|
| 1,189 |
|
| 71,155 |
|
| 12,000 |
|
| 59,147 |
|
| 143,507 |
Total |
| $ | 1,497,003 |
| $ | 6,793 |
| $ | 71,155 |
| $ | 50,000 |
| $ | 98,686 |
| $ | 1,723,637 |
|
|
|
|
|
|
|
|
|
|
|
|
|
|
|
|
|
|
|
Commitments to extend credit and standby letters of credit |
|
|
|
|
|
|
|
|
|
|
|
|
|
|
|
| $ | 1,430,639 |
69
Cash Flows
Net cash flows provided by operating activities totaled $202.5$162.0 million in 20182021, compared to $253.4$163.2 million in 2017 and compared to cash flows used in operating activities of $20.9 million in 2016.2020. Significant items affecting the cash flows provided by operating activities include net income, depreciation, amortization expenses,income; the provision for loan losses, deferred income taxes,credit losses; depreciation and amortization; gain on sales of mortgage loans, net of origination costs and activities related to the origination and sales of loans held for sale.sale; and stock-based compensation. Net cash provided by loan originations was $79.4used to originate mortgage loans held for sale totaled $31.7 million in 2018,2021, compared to $205.9$38.7 million of in 2017 and compared to cash used by loan originations of $54.8 million in 2016.2020. Fluctuations in sales are also a function of changes in market rates for mortgage loans, which influence refinance activity. Our provision for credit losses reflects a reserve release of to $15.1 million in 2021, compared to a provision expense of $38.8 million in 2020, reflecting forecasted improvements in macroeconomic conditions and asset quality, partially offset by core loan growth. Stock-based compensation increased to $7.9 million in 2021, compared to $7.1 million in 2020.
Net cash used in investing activities was $55.4totaled $829.2 million in 2018 and $293.92021, compared to $729.5 million in 2017 compared to cash provided by2020. Significant investment activities of $149.7 million in 2016. Significant items affecting cash flows from investing activities are those activities associated with managing the Company’sFirst Busey’s investment and loan portfolios, andas well as acquisition activities. We purchased $2.3 billion of debt securities in 2021, compared to $1.3 billion in 2020. Investing outflows were partially offset with $228.3 million net cash received in acquisitions. The Company experienced a net increaseconnection with the CAC acquisition in loans of $49.9 million in 2018, $169.2 million in 2017 and $1.3 million in 2016, excluding acquired loans.2021.
Net cash used in financing activities totaled $260.5 million in 2018, compared to cash provided by financing activities of $227.1totaled $814.7 million in 2017 and2021, compared to cash used in financial activities of $281.4$725.6 million in 2016.2020. Significant items affecting cash flows from financing activities are debt issuance, deposits, short-term borrowings, long-term debt, payment of dividends, and proceeds and redemption from stock issuances. Deposits, which represent the Company’sFirst Busey’s primary funding source, increased by $123.6$767.5 million in 2018,2021, compared to an increase of $111.8$776.4 million in 2017 and compared to a decrease of $142.1 million in 2016,2020, excluding acquired deposits. Securities sold under agreements to repurchase decreased $118.8 million in 2018 compared to an increase of $28.9 million in 2017 and decrease of $6.7 million in 2016.
Capital Resources
CPP Warrant
In connection with the Company’s participation in the Capital Purchase Program (“CPP”), the Company issued to Treasury a warrant to purchase shares of the Company’s common stock. At December 31, 2018, this warrant to purchase 191,278 shares of the Company’s common stock, at an exercise price of $39.21, remained outstanding.
Regulatory Capital
The ability of the Company to pay cash dividends to its stockholders and to service its debt was historically dependent on the receipt of cash dividends from its subsidiaries. Under applicable regulatory requirements, an Illinois state-chartered bank such as Busey Bank may not pay dividends in excess of its net profits. Because Busey Bank had been in an accumulated deficit position since 2009, it was not able to pay dividends. With prior approval from its regulators, however, an Illinois state-chartered bank in that situation was able to reduce its capital stock by amending its charter to decrease the authorized number of shares, and then make a subsequent distribution to its holding company. Using this approach, and with the approval of its regulators, Busey Bank has distributed funds to the Company, the most recent of which was $40.0 million on October 12, 2018. Busey Bank returned to positive retained earnings in the second quarter of 2018. The Company expects Busey Bank to return to paying dividends out of net profits in future periods.
51
The Dodd-Frank Act established minimum capital levels for bank holding companies on a consolidated basis. The components of Tier 1 capital are restricted to capital instruments that, at the time of signing, were considered to be Tier 1 capital for insured depository institutions. Under this legislation, the Company is able to maintain its trust preferred securities as Tier 1 capital, but it will have to comply with new capital mandates in other respects, and it will not be able to raise Tier 1 capital through the issuance of trust preferred securities in the future.
In July 2013, the U.S. federal banking authorities approved the implementation of the Basel III Rule required by the Dodd-Frank Act. The Basel III Rule is applicable to all U.S. banks that are subject to minimum capital requirements, as well as to bank and savings and loan holding companies other than “small bank holding companies” (generally non-public bank holding companies with consolidated assets of less than $1.0 billion). The Basel III Rule not only increased most of the required minimum regulatory capital ratios, but they also introduced a new Common Equity Tier 1 Capital ratio and the concept of a capital conservation buffer.
The Basel III Rule also expanded the definition of capital as in effect currently by establishing criteria that instruments must meet to be considered Additional Tier 1 Capital (Tier 1 Capital in addition to Common Equity) and Tier 2 Capital. A number of instruments that generally qualified as Tier 1 Capital under the old guidelines no longer qualify, or their qualifications will change, as the Basel III Rule is being fully implemented.
The Basel III Rule also permitted banking organizations with less than $15.0 billion in assets to retain, through a one-time election, the past treatment for accumulated other comprehensive income (loss), which did not affect regulatory capital. First Busey and Busey Bank made this election in the first quarter of 2015 to avoid variations in the level of their capital depending on fluctuations in the fair value of their securities portfolio. The Basel III Rule maintained the general structure of the prompt corrective action framework, while incorporating increased requirements. The prompt corrective action guidelines were also revised to add the Common Equity Tier 1 Capital ratio. Under the final capital rules that became effective on January 1, 2015, there was a requirement for a Common Equity Tier 1 capital conservation buffer of 2.5% of risk weighted assets which is in addition to the other minimum risk based capital standards in the rule. Failure to maintain the buffer will result in restrictions on the Company’s ability to make capital distributions, including the payment of dividends, and to pay discretionary bonuses to executive officers. The capital buffer requirement was phased-in over three years beginning in 2016.
Our capital ratios are in excess of those required to be considered “well-capitalized” pursuant to applicable regulatory guidelines. The Federal Reserve Board uses capital adequacy guidelines in its examination and regulation of bank holding companies and their subsidiary banks. Risk-based capital ratios are established by allocating assets and certain off-balance-sheet commitments into risk-weighted categories. These balances are then multiplied by the factor appropriate for that risk-weighted category. For 2018, the guidelines, including theIn order to refrain from restrictions on dividends, equity repurchases, and discretionary bonus payments, banking institutions must maintain capital conservationin excess of regulatory minimum capital requirements. The table below presents minimum capital ratios with capital buffer required bank holding companies and their subsidiary bank to maintain a total capital to total risk-weighted asset ratio of not less than 9.875%, Tier 1 capital to total risk-weighted asset ratio of not less than 7.875%, Common Equity Tier 1 capital to total risk-weighted asset ratio of not less than 6.375% and a Tier 1 leverage ratio of not less than 4.00%. The Basel III Rule was fully phased-in on January 1, 2019. As of December 31, 2018,2021, capital ratios for First Busey had a total capital to total risk-weighted asset ratio of 14.83%, a Tier 1 capital to risk-weighted asset ratio of 12.99%, Common Equity Tier 1 capital to risk-weighted asset ratio of 11.77% and a Tier 1 leverage ratio of 10.36%; Busey Bank had ratios of 14.19%, 13.35%, 13.35% and 10.64%, respectively. Bank.
| | | | | | | | | | |
| | Minimum Capital | | As of December 31, 2021 | | |||||
| | Requirements with | | First Busey | | Busey | | |||
|
| Capital Buffer |
| Corporation |
| Bank | | |||
Common Equity Tier 1 Capital to Risk Weighted Assets | | | 7.00 | % | | 11.85 | % | | 14.81 | % |
Tier 1 Capital to Risk Weighted Assets | | | 8.50 | % | | 12.73 | % | | 14.81 | % |
Total Capital to Risk Weighted Assets | | | 10.50 | % | | 15.70 | % | | 15.59 | % |
Leverage Ratio of Tier 1 Capital to Average Assets | | | 6.50 | | | 8.52 | % | | 9.91 | % |
Management believes that no conditions or events have occurred since December 31, 20182021, that would materially adversely change the Company’sFirst Busey’s or Busey Bank’s capital classifications.
New Accounting Pronouncements
The Company reviewsWe review new accounting standards as issued. Information relating to accounting pronouncements issued in 2021 and applicable to the Company in 2018First Busey appears in “Note 1. Significant Accounting Policies”Policies” in the Notes to the Consolidated Financial Statements.
70
Effects of Inflation
The effect of inflation on a financial institution differs significantly from the effect on an industrial company. While a financial institution’s operating expenses, particularly salaries, wages, and employee benefits, are affected by general inflation, the asset and liability structure of a financial institution consists largely of monetary items. Monetary items, such as cash, loans, and deposits, are those assets and liabilities which are or will be converted into a fixed number of dollars regardless of changes in prices. As a result, changes in interest rates have a more significant impact on a financial institution’s performance than does general inflation. For additional information regarding interest rates and changes in net interest income see “Item 7. Management’s Discussion and Analysis of Financial Condition and Results of Operations - —Results of Operation — Three Years Ended December 31, 2021—Average Balance Sheets and Interest Rates” and “Item 7A. Quantitative and Qualitative Disclosures About Market Risk.Risk.”
5271
ITEM 7A. QUANTITATIVE AND QUALITATIVE DISCLOSURES ABOUT MARKET RISK
Item 7A. Quantitative and Qualitative Disclosures about Market Risk
Market risk is the risk of changes in asset values due to movements in underlying market rates and prices. Interest rate risk is a type of market risk to earnings and capital arising from movements in interest rates. Interest rate risk is the most significant market risk affecting First Busey as other types of market risk, such as foreign currency exchange rate risk and commodity price risk, have minimal impact or do not arise in the normal course of First Busey’s business activities.
First Busey has an asset-liability committee, whose policy is to meet at least quarterly, to review current market conditions and to structure the Consolidated Balance Sheets to maximize stableoptimize stability in net interest income in consideration of projected future changes in interest rates.
As interest rate changes do not impact all categories of assets and liabilities equally or simultaneously, the asset-liability committee primarily relies on balance sheet and income simulation analysis to determine the potential impact of changes in market interest rates on net interest income. In these standard simulation models, the balance sheet is projected over a year-oneone-year and a two-year time horizon and net interest income is calculated under current market rates and assuming permanent instantaneous shifts of +/-100, +/-200+200 and +300 basis points. Due to the current low interest rate environment, a downward adjustment in federal fund rates was not meaningful as of December 31, 2021, or 2020. The model assumes immediate and sustained shifts in the federal funds rate and other market rate indices and corresponding shifts in other non-market rate indices based on their historical changes relative to changes in the federal funds rate and other market indices. Assets and liabilities are assumed to remain constant as of the measurement date; variable-rate assets and liabilities are repriced based on repricing frequency; and prepayment speeds on loans are projected for both declining and rising rate environments.
The interest rate risk of First Busey as a result of immediate and sustained changes in interest rates, expressed as a change in net interest income as a percentage of the net interest income calculated in the constant base model, was as follows (as of December 31, 2017, due to the low interest rate environment, a -200 interest rate shock was not meaningful):follows:
|
|
|
|
|
|
|
|
|
|
|
|
|
| Year-One: Basis Point Changes | |||||||||
|
| - 200 |
| - 100 |
| +100 |
| +200 |
| +300 |
|
|
|
|
|
|
|
|
|
|
|
|
|
December 31, 2018 |
| (9.86) | % | (3.58) | % | 1.08 | % | 2.01 | % | 2.88 | % |
|
|
|
|
|
|
|
|
|
|
|
|
December 31, 2017 |
| NA |
| 0.34 | % | (0.72) | % | (1.61) | % | (2.56) | % |
| | | | | | | |
| | Year-One: Basis Point Changes | | ||||
|
| +100 |
| +200 |
| +300 |
|
December 31, 2021 |
| 8.77 | % | 17.19 | % | 25.64 | % |
December 31, 2020 |
| 7.40 | % | 14.16 | % | 20.20 | % |
| | | | | | | |
|
| Year-Two: Basis Point Changes | | ||||
|
| +100 |
| +200 |
| +300 |
|
December 31, 2021 |
| 9.51 | % | 18.22 | % | 26.84 | % |
December 31, 2020 |
| 9.59 | % | 17.95 | % | 25.40 | % |
|
|
|
|
|
|
|
|
|
|
|
|
|
| Year-Two: Basis Point Changes | |||||||||
|
| - 200 |
| - 100 |
| +100 |
| +200 |
| +300 |
|
|
|
|
|
|
|
|
|
|
|
|
|
December 31, 2018 |
| (13.71) | % | (5.13) | % | 1.97 | % | 3.70 | % | 5.32 | % |
|
|
|
|
|
|
|
|
|
|
|
|
December 31, 2017 |
| NA |
| (2.65) | % | 1.53 | % | 2.91 | % | 4.14 | % |
Interest rate risk is monitored and managed within approved policy limits. The calculation of potential effects of hypothetical interest rate changes is based on numerous assumptions and should not be relied upon as indicative of actual results. Actual results would likely differ from simulated results due to the timing, magnitude, and frequency of interest rate changes as well as changes in market conditions and management strategies. The above results do not take into account any management action to mitigate potential risk.
Item 8. Financial Statements and Supplementary Data
The Consolidated Financial Statements are presented beginning on page 66, and incorporated herein by reference.
Item 9. Changes in and Disagreements with Accountants on Accounting and Financial Disclosure
Not applicable.
5372
ITEM 8. FINANCIAL STATEMENTS AND SUPPLEMENTARY DATA
Table of Contents
| | |
| | |
REPORT OF INDEPENDENT REGISTERED PUBLIC ACCOUNTING FIRM(PCAOB ID 49) | 74 | |
| | |
77 | ||
| 77 | |
| 78 | |
| 79 | |
| 80 | |
| 81 | |
| | |
83 | ||
| 83 | |
| 95 | |
| 97 | |
| 100 | |
| Note 5 – Other Real Estate Owned and Other Repossessed Assets | 108 |
| 109 | |
| 109 | |
| 110 | |
| 111 | |
| Note 10 – Junior Subordinated Debt Owed to Unconsolidated Trusts | 113 |
| 113 | |
| 115 | |
| 116 | |
| 117 | |
| 120 | |
| Note 16 – Outstanding Commitments and Contingent Liabilities | 120 |
| 121 | |
| 124 | |
| 128 | |
| 129 | |
| 130 | |
| 132 | |
| 134 | |
73
Item 9A. Controls and Procedures
Evaluation of Disclosure Controls and Procedures
An evaluation of our disclosure controls and procedures (as defined in Rule 13a-15(e) under the Exchange Act was carried out as of December 31, 2018, under the supervision and with the participation of our Chief Executive Officer, Chief Financial Officer and several other members of our senior management. Based on this evaluation, our Chief Executive Officer and Chief Financial Officer concluded that, as of December 31, 2018, our disclosure controls and procedures were effective in ensuring that the information we are required to disclose in the reports we file or submit under the Exchange Act was (i) accumulated and communicated to our management (including the Chief Executive Officer and Chief Financial Officer) to allow timely decisions regarding required disclosure, and (ii) recorded, processed, summarized, and reported within the time periods specified in the SEC’s rules and forms.
Management’s Report on Internal Control Over Financial Reporting
First Busey’s management is responsible for establishing and maintaining adequate internal control over financial reporting. The Company’s internal control over financial reporting is a process designed under the supervision of the Company’s Chief Executive Officer and Chief Financial Officer to provide reasonable assurance regarding the reliability of financial reporting and the preparation of the Company’s Consolidated Financial Statements for external reporting purposes in accordance with U.S. generally accepted accounting principles.
As of December 31, 2018, management assessed the effectiveness of the Company’s internal control over financial reporting based on the criteria for effective internal control over financial reporting established in “Internal Control — Integrated Framework,” issued by the Committee of Sponsoring Organizations of the Treadway Commission (“COSO”) in 2013. Based on this assessment, management determined that the Company maintained effective internal control over financial reporting as of December 31, 2018, based on the COSO criteria.
RSM US LLP, an independent registered public accounting firm that audited the Consolidated Financial Statements of the Company included in this Annual Report on Form 10-K, has issued an audit opinion on the effectiveness of the Company’s internal control over financial reporting as of December 31, 2018. The report, which expresses an unqualified opinion on the effectiveness of the Company’s internal control over financial reporting as of December 31, 2018, is included in this Item under the heading “Report of Independent Registered Public Accounting Firm on Internal Control over Financial Reporting.”
54
Report of Independent Registered Public Accounting Firm on Internal Control Over Financial Reporting
To the Stockholders and the Board of Directors of
First Busey Corporation
Opinion on the Internal Control Over Financial Reporting
We have audited First Busey Corporation and Subsidiaries' (the Company) internal control over financial reporting as of December 31, 2018, based on criteria established in Internal Control — Integrated Framework issued by the Committee of Sponsoring Organizations of the Treadway Commission in 2013. In our opinion, the Company maintained, in all material respects, effective internal control over financial reporting as of December 31, 2018, based on criteria established in Internal Control — Integrated Framework issued by the Committee of Sponsoring Organizations of the Treadway Commission in 2013.
We have also audited, in accordance with the standards of the Public Company Accounting Oversight Board (United States) (PCAOB), the consolidated financial statements of the Company and our report dated February 27, 2019, expressed an unqualified opinion.
Basis for Opinion
The Company’s management is responsible for maintaining effective internal control over financial reporting and for its assessment of the effectiveness of internal control over financial reporting in the accompanying Management’s Report on Internal Control over Financial Reporting. Our responsibility is to express an opinion on the Company’s internal control over financial reporting based on our audit. We are a public accounting firm registered with the PCAOB and are required to be independent with respect to the Company in accordance with U.S. federal securities laws and the applicable rules and regulations of the Securities and Exchange Commission and the PCAOB.
We conducted our audit in accordance with the standards of the PCAOB. Those standards require that we plan and perform the audit to obtain reasonable assurance about whether effective internal control over financial reporting was maintained in all material respects. Our audit included obtaining an understanding of internal control over financial reporting, assessing the risk that a material weakness exists, and testing and evaluating the design and operating effectiveness of internal control based on the assessed risk. Our audit also included performing such other procedures as we considered necessary in the circumstances. We believe that our audit provides a reasonable basis for our opinion.
Definition and Limitations of Internal Control Over Financial Reporting
A company's internal control over financial reporting is a process designed to provide reasonable assurance regarding the reliability of financial reporting and the preparation of financial statements for external purposes in accordance with generally accepted accounting principles. A company's internal control over financial reporting includes those policies and procedures that (1) pertain to the maintenance of records that, in reasonable detail, accurately and fairly reflect the transactions and dispositions of the assets of the company; (2) provide reasonable assurance that transactions are recorded as necessary to permit preparation of financial statements in accordance with generally accepted accounting principles, and that receipts and expenditures of the company are being made only in accordance with authorizations of management and directors of the company; and (3) provide reasonable assurance regarding prevention or timely detection of unauthorized acquisition, use or disposition of the company's assets that could have a material effect on the financial statements.
Because of its inherent limitations, internal control over financial reporting may not prevent or detect misstatements. Also, projections of any evaluation of effectiveness to future periods are subject to the risk that controls may become inadequate because of changes in conditions, or that the degree of compliance with the policies or procedures may deteriorate.
/s/ RSM US LLP
Champaign, Illinois
February 27, 2019
55
Changes in Internal Control Over Financial Reporting
During the quarter ended December 31, 2018, no change occurred in our internal control over financial reporting that has materially affected, or is reasonably likely to materially affect, our internal control over financial reporting.
None.
Item 10. Directors, Executive Officers and Corporate Governance
(a) Directors of the Registrant and Corporate Governance. Information required by this Item is incorporated herein by reference to First Busey’s Proxy Statement for its 2019 Annual Meeting of Stockholders to be filed with the SEC within 120 days of First Busey’s fiscal year-end under the captions “Proposal 1: Election of Directors,” “Section 16(a) Beneficial Ownership Reporting Compliance,” and “Corporate Governance and Board of Directors Matters.”
(b) Executive Officers of the Registrant. The information required by this Item is incorporated herein by reference to Part I, Item I of this Form 10-K under the caption “Executive Officers.”
Item 11. Executive Compensation
The information required by this Item is incorporated herein by reference to First Busey’s Proxy Statement for its 2019 Annual Meeting of Stockholders to be filed with the SEC within 120 days of First Busey’s fiscal year-end under the captions “Director Compensation,” “Compensation Discussion and Analysis,” “Executive Management Compensation and Succession Committee Report,” “Compensation of Named Executive Officers,” and “Executive Management Compensation and Succession Committee Interlocks and Insider Participation.”
Item 12. Security Ownership of Certain Beneficial Owners and Management and Related Stockholder Matters
Stock Incentive Plans
The following table discloses the number of outstanding options, warrants and rights granted by First Busey to participants in equity compensation plans, as well as the number of securities remaining available for future issuance under these plans as of December 31, 2018. The table provides this information separately for equity compensation plans that have and have not been approved by security holders. Additional information regarding stock incentive plans is presented in “Note 16. Share-based Compensation” in the Notes to the Consolidated Financial Statements included pursuant to Item 8.
|
|
|
|
|
|
|
|
|
|
|
|
|
|
|
| (c) |
|
|
|
|
|
|
|
| Number of |
|
|
|
|
|
|
|
| securities |
|
|
| (a) |
| (b) |
| remaining for |
| |
|
| Number of |
| Weighted- |
| future issuance |
| |
|
| securities to be |
| average |
| under equity |
| |
|
| issued upon |
| exercise price of |
| compensation |
| |
|
| exercise of |
| outstanding |
| plans (excluding |
| |
|
| outstanding |
| options, |
| securities |
| |
|
| options, warrants |
| warrants and |
| reflected in |
| |
Plan Category |
| and rights |
| rights(1) |
| column (a)) |
| |
Equity compensation plans approved by stockholders(2) |
| 864,795 | (3) | $ | 20.58 |
| 1,114,326 | (4) |
Equity compensation plans not approved by stockholders |
| — |
|
| — |
| — |
|
Total |
| 864,795 |
| $ | 20.58 |
| 1,114,326 |
|
|
|
|
|
|
|
56
|
|
Other information required by Item 12 is incorporated herein by reference to First Busey’s Proxy Statement for its 2019 Annual Meeting of Stockholders to be filed with the SEC within 120 days of First Busey’s fiscal year-end under the caption “Stock Ownership of Certain Beneficial Owners and Management.”
Item 13. Certain Relationships and Related Transactions, and Director Independence
The information required by this Item is incorporated herein by reference to First Busey’s Proxy Statement for its 2019 Annual Meeting of Stockholders to be filed with the SEC within 120 days of First Busey’s fiscal year-end under the captions “Certain Relationships and Related-Person Transactions” and “Corporate Governance and Board of Directors Matters.”
Item 14. Principal Accountant Fees and Services
The information required by this Item is incorporated herein by reference to First Busey’s Proxy Statement for its 2019 Annual Meeting of Stockholders to be filed with the SEC within 120 days of First Busey’s fiscal year-end under the caption “Audit and Related Fees.”
Item 15. Exhibits and Financial Statement Schedules
Exhibits
A list of exhibits to this Form 10-K is set forth on the Exhibit Index immediately following the signature page hereto and is incorporated into this report by reference. Our Consolidated Financial Statements can be found immediately following the Exhibit Index.
Stockholders may obtain a copy of any of the exhibits by writing to First Busey Corporation, Corporate Secretary, at 100 W. University, Champaign, IL 61820, or by visiting the SEC’s EDGAR database at http://www.sec.gov. The Company’s SEC file number is 0-15950.
None.
57
Signatures
Pursuant to the requirements of Section 13 or 15(d) of the Securities Exchange Act of 1934, the registrant has duly caused this report to be signed on its behalf by the undersigned, thereunto duly authorized.
| ||
| ||
|
| |
| ||
| ||
| ||
|
| |
| ||
| ||
| ||
|
| |
| ||
| ||
| ||
Pursuant to the requirements of the Securities Exchange Act of 1934, this report has been signed below by the following persons on behalf of the registrant and in the capacities and on the dates indicated.
|
|
| ||
|
|
| ||
|
| |||
|
|
| ||
|
| |||
|
|
| ||
|
| |||
|
|
| ||
| ||||
|
|
| ||
| ||||
|
|
| ||
| ||||
|
|
| ||
| ||||
|
|
| ||
| ||||
|
|
| ||
| ||||
|
|
| ||
| ||||
58
|
|
| ||
|
|
| ||
| ||||
|
|
| ||
| ||||
|
|
| ||
| ||||
|
|
| ||
| ||||
59
Exhibit Index
|
| |
| ||
| ||
| ||
|
| |
| ||
| ||
| ||
| ||
| ||
| ||
| ||
| ||
| ||
60
|
| |
| ||
| ||
| ||
| ||
| ||
| ||
| ||
| ||
| ||
| ||
| ||
| ||
| ||
| ||
61
|
| |
| ||
| ||
| ||
| ||
| ||
| ||
| ||
| ||
| ||
| ||
| ||
| ||
| ||
| ||
|
62
|
| |
| ||
| ||
| ||
| ||
| ||
| ||
| ||
| ||
|
|
| |
| |
|
63
FIRST BUSEY CORPORATION AND SUBSIDIARIES
CONSOLIDATED FINANCIAL STATEMENTS
DECEMBER 31, 2018, 2017 AND 2016
CONTENTS
| |
64
Report of Independent Registered Public Accounting Firm
To the Stockholders and the Board of Directors of First Busey Corporation
Opinion on the Financial Statements
We have audited the accompanying consolidated balance sheets of First Busey Corporation and Subsidiaries (the Company) as of December 31, 20182021 and 2017,2020, the related consolidated statements of income, comprehensive income, stockholders’ equity, and cash flows for each of the three years in the period ended December 31, 2018,2021, and the related notes to the consolidated financial statements (collectively, referred to as the "financial statements")financial statements). In our opinion, the financial statements present fairly, in all material respects, the financial position of the Company as ofDecember 31, 20182021 and 2017,2020, and the results of its operations and its cash flows for each of the three years in the period ended December 31, 2018,2021, in conformity with accounting principles generally accepted in the United States of America.
We have also audited, in accordance with the standards of the Public Company Accounting Oversight Board (United States) (PCAOB), the Company’s internal control over financial reporting as of December 31, 2018,2021, based on criteria established in Internal Control – Control—Integrated Framework issued by the Committee of Sponsoring Organizations of the Treadway Commission in 2013, and our report dated February 27, 201924, 2022 expressed an unqualified opinion on the effectiveness of the Company’s internal control over financial reporting.
Basis for Opinion
These financial statements are the responsibility of the Company's management. Our responsibility is to express an opinion on the Company's financial statements based on our audits. We are a public accounting firm registered with the PCAOB and are required to be independent with respect to the Company in accordance with U.S. federal securities laws and the applicable rules and regulations of the Securities and Exchange Commission and the PCAOB.
We conducted our audits in accordance with the standards of the PCAOB. Those standards require that we plan and perform the audits to obtain reasonable assurance about whether the financial statements are free of material misstatement, whether due to error or fraud. Our audits included performing procedures to assess the risks of material misstatement of the financial statements, whether due to error or fraud, and performing procedures that respond to those risks. Such procedures included examining, on a test basis, evidence regarding the amounts and disclosures in the financial statements. Our audits also included evaluating the accounting principles used and significant estimates made by management, as well as evaluating the overall presentation of the financial statements. We believe that our audits provide a reasonable basis for our opinion.
/S/RSM US LLPCritical Audit Matters
The critical audit matters communicated below are matters arising from the current period audit of the financial statements that were communicated or required to be communicated to the audit committee and that: (1) relate to accounts or disclosures that are material to the financial statements and (2) involved our especially challenging, subjective, or complex judgments. The communication of critical audit matters does not alter in any way our opinion on the financial statements, taken as a whole, and we are not, by communicating the critical audit matters below, providing a separate opinion on the critical audit matters or on the accounts or disclosures to which they relate.
Allowance for Credit Losses - Adjustments to historical loss factors
As described in Notes 1 and 4 to the consolidated financial statements, the Company’s allowance for credit losses totaled $87.9 million, which consists of a reserve on loans collectively evaluated for impairment (a/k/a general reserve) of $84.3 million and a reserve on loans individually evaluated (a/k/a specific reserve) of $3.6 million at December 31, 2021. The allowance for credit losses is measured on a collective loan pool basis when similar risk characteristics exist. Loans that do not share similar risk characteristics are evaluated on an individual basis, at the balance sheet date. The measurement of expected credit losses on collectively evaluated loans is based on relevant information about past events, including historical experience, current conditions and reasonable and supportable forecasts that affect the collectability of the amortized cost basis. Adjustments to historical loss information are made for differences in current loan-specific risk characteristics such as differences in underwriting standards, portfolio mix, delinquency level, or term as well as for changes in environmental conditions such as changes in unemployment rates, property values and other relevant factors.
74
The calculation also contemplates that the Company may not be able to make or obtain such forecasts for the entire life of the financial assets and requires a reversion to historical credit loss information.
We identified the adjustments to historical loss factors components of the allowance for credit losses as a critical audit matter as auditing the underlying adjustments required significant auditor judgment as amounts determined by management rely on analysis that is highly subjective and includes significant estimation uncertainty.
Our audit procedures related to the adjustments to historical factors within the allowance for credit losses include the following, among others:
| ● | We obtained an understanding of the relevant controls related to the adjustments to historical factors in the calculation of the allowance for credit losses and tested such controls for design and operating effectiveness, including management’s review of the allowance memo and calculation in support of adjustments. |
| ● | We tested the completeness and accuracy of data used by management in determining adjustments to historical loss factors by agreeing the supporting data to internal or external source data. |
| ● | We tested management’s conclusions regarding the appropriateness of the adjustments, including magnitude and directional consistency, to historical loss factors and agreed the impact to the allowance for credit losses calculation. |
Business Combination - Fair Value of Acquired Loans
As described in Notes 1 and 2 to the consolidated financial statements, on May 31, 2021, the Company completed its acquisition of Cummins-American Corp. (CAC). The Company recorded $6.3 million of goodwill as a result of the acquisition, which represents the excess of the purchase price over the fair value of net assets acquired using the acquisition method of accounting. The fair value determination of a loan portfolio requires greater levels of estimates and assumptions than the other assets acquired or liabilities assumed. Acquired loans are initially recorded at their acquisition-date fair values using Level 3 inputs. The Company prepared loan fair value adjustments that it believed a market participant might employ in estimating the fair value for the acquired loan portfolio. This analysis was performed for loans without signs of credit deterioration as well as those identified as purchase credit deteriorated (PCD). The acquired loan portfolio was recorded at an estimated fair value of $430.5 million at the acquisition date, of which $60.5 million was for PCD loans, without carryover of CAC’s previously established allowance for loan losses.
We identified the fair value of acquired loans as a critical audit matter, because of the judgments necessary to determine the fair value of the loan portfolio acquired, the high degree of auditor judgment involved and the extensive audit effort involved in testing management estimates and assumptions.
Our audit procedures related to the valuation of the acquired loan portfolio included the following, among others:
We obtained an understanding of the relevant controls related to the business combination, including the valuation of the acquired loan portfolio and management’s development of significant assumptions, and tested such controls for design and operating effectiveness.
| ● | We obtained the valuation report prepared by a third party engaged by management, and gained an understanding of the valuation methodology applied, as well as key inputs and assumptions. |
| ● | We tested the completeness and accuracy of data inputs provided by management and utilized in the calculation performed by the third-party specialist. |
| ● | We utilized internal valuation specialists to assist in evaluating significant assumptions such as credit risk, expected lifetime losses, environmental factors, discount rates, expected payments and expected prepayments. |
| ● | We evaluated the appropriateness of management’s classification of PCD loans, and tested the propriety of the fair value adjustments applied to these loans. |
75
We or our predecessor firms have served as the Company's auditor since at least 1980, however, an earlier year could not be established.
/s/ RSM US LLP
Champaign, Illinois
February 27, 201924, 2022
6576
FIRST BUSEY CORPORATION AND SUBSIDIARIES
CONSOLIDATED BALANCE SHEETS
(dollars in thousands)
| | | | | | |
| | As of | ||||
| | December 31, | | December 31, | ||
| | 2021 | | 2020 | ||
Assets | | | | | | |
Cash and cash equivalents: | | | | | | |
Cash and due from banks | | $ | 102,983 | | $ | 118,824 |
Interest-bearing deposits | | | 733,112 | | | 569,713 |
Total cash and cash equivalents | | | 836,095 | | | 688,537 |
| | | | | | |
Debt securities available for sale | |
| 3,981,251 | |
| 2,261,187 |
Equity securities | | | 13,571 | | | 5,530 |
Loans held for sale, at fair value | |
| 23,875 | |
| 42,813 |
Portfolio loans (net of ACL of $87,887 at December 31, 2021; $101,048 at December 31, 2020) | |
| 7,101,111 | |
| 6,713,129 |
Premises and equipment, net | |
| 136,147 | |
| 135,191 |
Right of use assets | | | 10,533 | | | 7,714 |
Goodwill | |
| 317,873 | |
| 311,536 |
Other intangible assets, net | |
| 58,051 | |
| 51,985 |
Cash surrender value of bank owned life insurance | |
| 176,940 | |
| 176,405 |
Other assets | |
| 204,242 | |
| 150,020 |
Total assets | | $ | 12,859,689 | | $ | 10,544,047 |
| | | | | | |
Liabilities and Stockholders’ Equity | | | | | | |
Liabilities | | | | | | |
Deposits: | | | | | | |
Noninterest-bearing | | $ | 3,670,267 | | $ | 2,552,039 |
Interest-bearing | |
| 7,098,310 | |
| 6,125,810 |
Total deposits | | | 10,768,577 | | | 8,677,849 |
| | | | | | |
Securities sold under agreements to repurchase | |
| 270,139 | |
| 175,614 |
Short-term borrowings | | | 17,678 | | | 4,658 |
Long-term debt | |
| 46,056 | |
| 4,757 |
Senior notes, net of unamortized issuance costs | | | 39,944 | | | 39,809 |
Subordinated notes, net of unamortized issuance costs | | | 182,773 | | | 182,226 |
Junior subordinated debt owed to unconsolidated trusts | | | 71,635 | | | 71,468 |
Lease liabilities | | | 10,591 | | | 7,757 |
Other liabilities | |
| 133,184 | |
| 109,840 |
Total liabilities | | | 11,540,577 | | | 9,273,978 |
| | | | | | |
Outstanding commitments and contingent liabilities (see Notes 16 and 22) | | | | | | |
| | | | | | |
Stockholders’ Equity | | | | | | |
Common stock, ($.001 par value; 100,000,000 shares authorized) | |
| 58 | |
| 56 |
Additional paid-in capital | |
| 1,316,984 | |
| 1,253,360 |
Retained earnings | |
| 92,463 | |
| 20,830 |
AOCI | |
| (23,758) | |
| 33,309 |
Total stockholders’ equity before treasury stock | | | 1,385,747 | | | 1,307,555 |
| | | | | | |
Treasury stock at cost | |
| (66,635) | |
| (37,486) |
Total stockholders’ equity | | | 1,319,112 | | | 1,270,069 |
Total liabilities and stockholders’ equity | | $ | 12,859,689 | | $ | 10,544,047 |
| | | | | | |
Shares | | | | | | |
Common shares issued | | | 58,116,970 | | | 55,910,733 |
Less treasury shares | | | (2,682,060) | | | (1,506,354) |
Common shares outstanding | | | 55,434,910 | | | 54,404,379 |
December 31, 2018 and 2017
|
|
|
|
|
|
|
|
| December 31, 2018 |
| December 31, 2017 | ||
|
| (dollars in thousands) | ||||
Assets |
|
|
|
|
|
|
Cash and due from banks |
| $ | 128,838 |
| $ | 118,383 |
Interest-bearing deposits |
|
| 111,135 |
|
| 229,250 |
Federal funds sold |
|
| — |
|
| 5,639 |
Total cash and cash equivalents |
|
| 239,973 |
|
| 353,272 |
|
|
|
|
|
|
|
Securities available for sale |
|
| 697,685 |
|
| 872,682 |
Securities held to maturity (fair value 2018 $603,360; 2017 $441,052) |
|
| 608,660 |
|
| 443,550 |
Securities equity investments |
|
| 6,169 |
|
| 5,378 |
Loans held for sale |
|
| 25,895 |
|
| 94,848 |
Portfolio loans (net of allowance for loan losses 2018 $50,648; 2017 $53,582) |
|
| 5,517,780 |
|
| 5,465,918 |
Premises and equipment, net |
|
| 117,672 |
|
| 116,913 |
Goodwill |
|
| 267,685 |
|
| 269,346 |
Other intangible assets, net |
|
| 32,873 |
|
| 38,727 |
Cash surrender value of bank owned life insurance |
|
| 128,491 |
|
| 126,737 |
Deferred tax asset, net |
|
| 11,431 |
|
| 17,296 |
Other assets |
|
| 48,043 |
|
| 55,973 |
Total assets |
| $ | 7,702,357 |
| $ | 7,860,640 |
Liabilities and Stockholders’ Equity |
|
|
|
|
|
|
Liabilities |
|
|
|
|
|
|
Deposits: |
|
|
|
|
|
|
Noninterest-bearing |
| $ | 1,464,700 |
| $ | 1,597,421 |
Interest-bearing |
|
| 4,784,621 |
|
| 4,528,544 |
Total deposits |
|
| 6,249,321 |
|
| 6,125,965 |
|
|
|
|
|
|
|
Securities sold under agreements to repurchase |
|
| 185,796 |
|
| 304,566 |
Short-term borrowings |
|
| — |
|
| 220,000 |
Long-term debt |
|
| 50,000 |
|
| 50,000 |
Senior notes, net of unamortized issuance costs |
|
| 39,539 |
|
| 39,404 |
Subordinated notes, net of unamortized issuance costs |
|
| 59,147 |
|
| 64,715 |
Junior subordinated debt owed to unconsolidated trusts |
|
| 71,155 |
|
| 71,008 |
Other liabilities |
|
| 52,435 |
|
| 49,979 |
Total liabilities |
|
| 6,707,393 |
|
| 6,925,637 |
|
|
|
|
|
|
|
Commitments and contingencies (see Note 18) |
|
|
|
|
|
|
|
|
|
|
|
|
|
Stockholders’ Equity |
|
|
|
|
|
|
Common stock, $.001 par value, authorized 66,666,667 shares; shares issued 49,185,581 |
|
| 49 |
|
| 49 |
Additional paid-in capital |
|
| 1,080,084 |
|
| 1,084,889 |
Accumulated deficit |
|
| (72,167) |
|
| (132,122) |
Accumulated other comprehensive loss |
|
| (6,812) |
|
| (2,810) |
Total stockholders’ equity before treasury stock |
|
| 1,001,154 |
|
| 950,006 |
|
|
|
|
|
|
|
Treasury stock, at cost (2018 310,745 shares; 2017 500,638 shares) |
|
| (6,190) |
|
| (15,003) |
Total stockholders’ equity |
|
| 994,964 |
|
| 935,003 |
Total liabilities and stockholders’ equity |
| $ | 7,702,357 |
| $ | 7,860,640 |
|
|
|
|
|
|
|
Common shares outstanding at period end |
|
| 48,874,836 |
|
| 48,684,943 |
See accompanying Notes to Consolidated Financial Statements.
6677
FIRST BUSEY CORPORATION AND SUBSIDIARIES
CONSOLIDATED STATEMENTS OF INCOME
(dollars in thousands, except per share amounts)
| | | | | | | | | |
| | Years Ended December 31, | |||||||
|
| 2021 |
| 2020 |
| 2019 | |||
Interest income | | | | | | | | | |
Interest and fees on loans | | $ | 252,097 | | $ | 284,959 | | $ | 304,193 |
Interest and dividends on investment securities: | | | | | | | | | |
Taxable interest income | | | 41,787 | | | 35,364 | | | 41,090 |
Non-taxable interest income | | | 3,765 | | | 4,552 | | | 4,631 |
Other interest income | | | 1,151 | | | 1,723 | | | 6,320 |
Total interest income | | | 298,800 | | | 326,598 | | | 356,234 |
| | | | | | | | | |
Interest expense | | | | | | | | | |
Deposits | | | 12,583 | | | 30,691 | | | 55,077 |
Federal funds purchased and securities sold under agreements to repurchase | | | 227 | | | 660 | | | 2,348 |
Short-term borrowings | | | 279 | | | 234 | | | 1,041 |
Long-term debt | | | 657 | | | 525 | | | 2,608 |
Senior notes | | | 1,598 | | | 1,598 | | | 1,599 |
Subordinated notes | | | 9,918 | | | 6,995 | | | 2,924 |
Junior subordinated debt owed to unconsolidated trusts | | | 2,840 | | | 2,960 | | | 3,414 |
Total interest expense | | | 28,102 | | | 43,663 | | | 69,011 |
| | | | | | | | | |
Net interest income | | | 270,698 | | | 282,935 | | | 287,223 |
Provision for credit losses | | | (15,101) | | | 38,797 | | | 10,406 |
Net interest income after provision for credit losses | | | 285,799 | | | 244,138 | | | 276,817 |
| | | | | | | | | |
Noninterest income | | | | | | | | | |
Wealth management fees | | | 53,086 | | | 42,928 | | | 38,561 |
Fees for customer services | | | 35,604 | | | 31,604 | | | 36,683 |
Payment technology solutions | | | 18,347 | | | 15,628 | | | 15,643 |
Mortgage revenue | | | 7,239 | | | 13,038 | | | 11,703 |
Income on bank owned life insurance | | | 5,166 | | | 5,380 | | | 5,795 |
Net gains (losses) on sales of securities | | | 29 | | | 1,724 | | | 741 |
Unrealized gains (losses) recognized on equity securities | | | 3,041 | | | (393) | | | (759) |
Other income | | | 10,292 | | | 8,356 | | | 8,048 |
Total noninterest income | | | 132,804 | | | 118,265 | | | 116,415 |
| | | | | | | | | |
Noninterest expense | | | | | | | | | |
Salaries, wages, and employee benefits | | | 145,312 | | | 126,719 | | | 140,473 |
Data processing | | | 21,862 | | | 16,426 | | | 21,511 |
Net occupancy expense of premises | | | 18,346 | | | 17,607 | | | 18,176 |
Furniture and equipment expenses | | | 8,301 | | | 9,550 | | | 9,506 |
Professional fees | | | 7,549 | | | 8,396 | | | 11,104 |
Amortization of intangible assets | | | 11,274 | | | 10,008 | | | 9,547 |
Interchange expense | | | 5,792 | | | 4,810 | | | 4,141 |
Other expense | | | 43,344 | | | 40,681 | | | 44,336 |
Total noninterest expense | | | 261,780 | | | 234,197 | | | 258,794 |
| | | | | | | | | |
Income before income taxes | | | 156,823 | | | 128,206 | | | 134,438 |
Income taxes | | | 33,374 | | | 27,862 | | | 31,485 |
Net income | | $ | 123,449 | | $ | 100,344 | | $ | 102,953 |
| | | | | | | | | |
Basic earnings per common share | | $ | 2.23 | | $ | 1.84 | | $ | 1.88 |
Diluted earnings per common share | | $ | 2.20 | | $ | 1.83 | | $ | 1.87 |
Dividends declared per share of common stock | | $ | 0.92 | | $ | 0.88 | | $ | 0.84 |
Years Ended December 31, 2018, 2017 and 2016
|
|
|
|
|
|
|
|
|
|
|
| 2018 |
| 2017 |
| 2016 | |||
|
| (dollars in thousands, except per share amounts) | |||||||
Interest income: |
|
|
|
|
|
|
|
|
|
Interest and fees on loans |
| $ | 251,249 |
| $ | 202,643 |
| $ | 147,816 |
Interest and dividends on investment securities: |
|
|
|
|
|
|
|
|
|
Taxable interest income |
|
| 30,086 |
|
| 17,803 |
|
| 13,987 |
Non-taxable interest income |
|
| 4,698 |
|
| 3,856 |
|
| 3,086 |
Total interest income |
|
| 286,033 |
|
| 224,302 |
|
| 164,889 |
Interest expense: |
|
|
|
|
|
|
|
|
|
Deposits |
|
| 32,601 |
|
| 12,932 |
|
| 7,065 |
Federal funds purchased and securities sold under agreements to repurchase |
|
| 1,626 |
|
| 978 |
|
| 393 |
Short-term borrowings |
|
| 1,536 |
|
| 1,096 |
|
| 641 |
Long-term debt |
|
| 906 |
|
| 550 |
|
| 220 |
Senior notes |
|
| 1,598 |
|
| 962 |
|
| — |
Subordinated notes |
|
| 3,110 |
|
| 1,892 |
|
| — |
Junior subordinated debt owed to unconsolidated trusts |
|
| 3,250 |
|
| 2,526 |
|
| 1,910 |
Total interest expense |
|
| 44,627 |
|
| 20,936 |
|
| 10,229 |
Net interest income |
|
| 241,406 |
|
| 203,366 |
|
| 154,660 |
Provision for loan losses |
|
| 4,429 |
|
| 5,303 |
|
| 5,550 |
Net interest income after provision for loan losses |
|
| 236,977 |
|
| 198,063 |
|
| 149,110 |
Non-interest income: |
|
|
|
|
|
|
|
|
|
Trust fees |
|
| 27,184 |
|
| 23,665 |
|
| 20,302 |
Commissions and brokers’ fees, net |
|
| 3,790 |
|
| 3,372 |
|
| 2,839 |
Remittance processing |
|
| 14,345 |
|
| 11,427 |
|
| 11,255 |
Fees for customer services |
|
| 28,879 |
|
| 25,841 |
|
| 23,253 |
Mortgage revenue |
|
| 5,545 |
|
| 11,140 |
|
| 11,952 |
Security gains, net |
|
| 331 |
|
| 1,143 |
|
| 1,232 |
Other income |
|
| 9,919 |
|
| 7,886 |
|
| 4,336 |
Total non-interest income |
|
| 89,993 |
|
| 84,474 |
|
| 75,169 |
Non-interest expense: |
|
|
|
|
|
|
|
|
|
Salaries, wages and employee benefits |
|
| 107,844 |
|
| 95,633 |
|
| 78,397 |
Net occupancy expense of premises |
|
| 14,803 |
|
| 13,830 |
|
| 11,633 |
Furniture and equipment expenses |
|
| 7,233 |
|
| 7,089 |
|
| 6,591 |
Data processing |
|
| 16,383 |
|
| 16,716 |
|
| 18,229 |
Amortization of intangible assets |
|
| 5,854 |
|
| 5,245 |
|
| 4,438 |
Other expense |
|
| 40,926 |
|
| 35,913 |
|
| 28,574 |
Total non-interest expense |
|
| 193,043 |
|
| 174,426 |
|
| 147,862 |
Income before income taxes |
|
| 133,927 |
|
| 108,111 |
|
| 76,417 |
Income taxes |
|
| 34,999 |
|
| 45,385 |
|
| 26,723 |
Net income |
| $ | 98,928 |
| $ | 62,726 |
| $ | 49,694 |
|
|
|
|
|
|
|
|
|
|
Basic earnings per common share |
| $ | 2.02 |
| $ | 1.47 |
| $ | 1.42 |
Diluted earnings per common share |
| $ | 2.01 |
| $ | 1.45 |
| $ | 1.40 |
See accompanying Notes to Consolidated Financial Statements.
6778
FIRST BUSEY CORPORATION AND SUBSIDIARIES
CONSOLIDATED STATEMENTS OF COMPREHENSIVE INCOME
(dollars in thousands)
| | | | | | | | | |
| | Years Ended December 31, | |||||||
|
| 2021 |
| 2020 |
| 2019 | |||
Net income | | $ | 123,449 | | $ | 100,344 | | $ | 102,953 |
| | | | | | | | | |
OCI: | | | | | | | | | |
Unrealized gains (losses) on debt securities available for sale: | | | | | | | | | |
Net unrealized holding gains (losses) on debt securities available for sale, net of taxes of $23,367, ($8,615), and ($7,525), respectively | | | (58,610) | | | 21,561 | | | 18,905 |
Net unrealized (gains) losses on debt securities transferred from held to maturity to available for sale, net of taxes of $—, $—, and ($1,433), respectively | | | — | | | — | | | 3,590 |
Reclassification adjustment for realized (gains) losses on debt securities available for sale included in net income, net of taxes of ($17), $496, and $210, respectively | |
| 44 | | | (1,228) | | | (523) |
Net change in unrealized gains (losses) on debt securities available for sale | | | (58,566) | | | 20,333 | | | 21,972 |
| | | | | | | | | |
Unrealized gains (losses) on cash flow hedges: | | | | | | | | | |
Net unrealized holding gains (losses) on cash flow hedges, net of taxes of ($294), $1,007, and $81, respectively | |
| 736 | | | (2,526) | | | (202) |
Reclassification adjustment for realized (gains) losses on cash flow hedges included in net income, net of taxes of ($304), ($216), and ($1), respectively | | | 763 | | | 542 | | | 2 |
Net change in unrealized gains (losses) on cash flow hedges | | | 1,499 | | | (1,984) | | | (200) |
| | | | | | | | | |
Net change in AOCI | | | (57,067) | | | 18,349 | | | 21,772 |
| | | | | | | | | |
Total comprehensive income | | $ | 66,382 | | $ | 118,693 | | $ | 124,725 |
Years Ended December 31, 2018, 2017 and 2016
|
|
|
|
|
|
|
|
|
|
|
|
|
|
|
|
|
|
|
|
|
|
|
|
|
|
|
|
|
|
|
| 2018 |
| 2017 |
| 2016 | |||
|
| (dollars in thousands) | |||||||
Net income |
| $ | 98,928 |
| $ | 62,726 |
| $ | 49,694 |
Other comprehensive loss, before tax: |
|
|
|
|
|
|
|
|
|
Securities available for sale: |
|
|
|
|
|
|
|
|
|
Unrealized net losses on securities: |
|
|
|
|
|
|
|
|
|
Unrealized net holding losses arising during period |
|
| (4,420) |
|
| (3,694) |
|
| (2,611) |
Reclassification adjustment for gains included in net income |
|
| (331) |
|
| (1,143) |
|
| (1,232) |
Other comprehensive loss, before tax |
|
| (4,751) |
|
| (4,837) |
|
| (3,843) |
Income tax benefit related to items of other comprehensive income |
|
| (1,354) |
|
| (1,991) |
|
| (1,539) |
Other comprehensive loss, net of tax |
|
| (3,397) |
|
| (2,846) |
|
| (2,304) |
Comprehensive income |
| $ | 95,531 |
| $ | 59,880 |
| $ | 47,390 |
See accompanying Notes to Consolidated Financial Statements.
6879
FIRST BUSEY CORPORATION AND SUBSIDIARIES
| | | | | | | | | | | | | | | | | | | | |
CONSOLIDATED STATEMENTS OF STOCKHOLDERS’ EQUITY
Years Ended December 31, 2018, 2017 and 2016
(dollars in thousands, except shares and per share data)amounts)
|
|
|
|
|
|
|
|
|
|
|
|
|
|
|
|
|
|
|
|
|
|
|
|
|
|
|
|
|
| Accumulated |
|
|
|
|
|
| |
|
|
|
|
| Additional |
|
|
| Other |
|
|
|
|
|
| |||
|
| Common |
| Paid-in |
| Accumulated |
| Comprehensive |
| Treasury |
|
|
| |||||
|
| Stock |
| Capital |
| (Deficit) |
| Income (loss) |
| Stock |
| Total | ||||||
Balance, December 31, 2015 |
| $ | 29 |
| $ | 591,053 |
| $ | (190,265) |
| $ | 2,340 |
| $ | (29,971) |
| $ | 373,186 |
|
|
|
|
|
|
|
|
|
|
|
|
|
|
|
|
|
|
|
Net income |
|
| — |
|
| — |
|
| 49,694 |
|
| — |
|
| — |
|
| 49,694 |
Other comprehensive loss |
|
| — |
|
| — |
|
| — |
|
| (2,304) |
|
| — |
|
| (2,304) |
Issuance of 14,749 shares of treasury stock for employee stock purchase plan |
|
| — |
|
| (616) |
|
| — |
|
| — |
|
| 929 |
|
| 313 |
Net issuance of 43,396 shares of treasury stock for restricted stock unit vesting and related tax benefit |
|
| — |
|
| (3,477) |
|
| — |
|
| — |
|
| 2,668 |
|
| (809) |
Net issuance of 41,771 shares of treasury stock for stock options exercised, net of shares redeemed and related tax |
|
| — |
|
| (2,587) |
|
| — |
|
| — |
|
| 2,591 |
|
| 4 |
Stock issued for acquisition of Pulaski, net of stock issuance costs |
|
| 10 |
|
| 195,188 |
|
| — |
|
| — |
|
| — |
|
| 195,198 |
Cash dividends common stock at $0.68 per share |
|
| — |
|
| — |
|
| (22,748) |
|
| — |
|
| — |
|
| (22,748) |
Stock dividend equivalents restricted stock units at $0.68 per share |
|
| — |
|
| 352 |
|
| (352) |
|
| — |
|
| — |
|
| — |
Stock dividend accrued on restricted stock awards assumed with the Pulaski Financial Corp. acquisition at $0.34 per share |
|
| — |
|
| — |
|
| (18) |
|
| — |
|
| — |
|
| (18) |
Stock based employee compensation |
|
| — |
|
| 1,803 |
|
| — |
|
| — |
|
| — |
|
| 1,803 |
Return of 261 equity trust shares |
|
| — |
|
| — |
|
| — |
|
| — |
|
| (5) |
|
| (5) |
Balance, December 31, 2016 |
| $ | 39 |
| $ | 781,716 |
| $ | (163,689) |
| $ | 36 |
| $ | (23,788) |
| $ | 594,314 |
| | | | | | | | | | | | | | | | | | | | |
| | | | | | | | | | Retained | | | | | | | | | ||
| | | | | | | Additional | | Earnings | | | | | | | Total | ||||
| | | | Common | | Paid-in | | (Accumulated | | | | Treasury | | Stockholders' | ||||||
| | Shares |
| Stock |
| Capital |
| Deficit) |
| AOCI |
| Stock |
| Equity | ||||||
Balance, December 31, 2018 | | 48,874,836 | | $ | 49 | | $ | 1,080,084 | | $ | (72,167) | | $ | (6,812) | | $ | (6,190) | | $ | 994,964 |
Net income | | — | |
| — | |
| — | |
| 102,953 | |
| — | |
| — | |
| 102,953 |
OCI, net of tax | | — | |
| — | |
| — | |
| — | |
| 21,772 | |
| — | |
| 21,772 |
Stock issued for acquisition of Banc Ed, net of stock issuance costs | | 6,725,152 | | | 7 | | | 166,274 | | | — | | | — | | | — | | | 166,281 |
Repurchase of stock | | (943,396) | | | — | | | — | | | — | | | — | | | (24,292) | | | (24,292) |
Issuance of treasury stock for ESPP | | 25,698 | |
| — | |
| 137 | |
| — | |
| — | |
| 487 | |
| 624 |
Net issuance of treasury stock for restricted/deferred stock unit vesting and related tax | | 92,996 | |
| — | |
| (2,600) | | | — | | | — | | | 382 | |
| (2,218) |
Issuance of treasury stock for stock options exercised, net of shares redeemed and related tax | | 13,486 | | | — | | | (104) | | | — | | | — | | | 1,628 | | | 1,524 |
Cash dividends common stock at $0.84 per share | | — | |
| — | |
| — | |
| (45,171) | |
| — | |
| — | |
| (45,171) |
Stock dividend equivalents RSUs at $0.84 per share | | — | |
| — | |
| 428 | |
| (428) | |
| — | |
| — | |
| — |
Stock-based compensation | | — | | | — | |
| 3,997 | |
| — | |
| — | |
| — | | | 3,997 |
Balance, December 31, 2019 | | 54,788,772 | | $ | 56 | | $ | 1,248,216 | | $ | (14,813) | | $ | 14,960 | | $ | (27,985) | | $ | 1,220,434 |
Cumulative effect of change in accounting principle (ASU 2016-13) | | — | | | — | | | — | | | (15,922) | | | — | | | — | | | (15,922) |
Net income | | — | | | — | | | �� | | | 100,344 | | | — | | | — | |
| 100,344 |
OCI, net of tax | | — | | | — | | | — | | | — | | | 18,349 | | | — | |
| 18,349 |
Repurchase of stock | | (531,114) | | | — | | | — | | | — | | | — | | | (12,272) | |
| (12,272) |
Issuance of treasury stock for ESPP | | 32,063 | | | — | | | (59) | | | — | | | — | | | 606 | | | 547 |
Net issuance of treasury stock for restricted/deferred stock unit vesting and related tax | | 106,589 | | | — | | | (2,648) | | | — | | | — | | | 2,013 | | | (635) |
Issuance of treasury stock for stock options exercised, net of shares redeemed and related tax | | 8,069 | | | — | | | (51) | | | — | | | — | | | 152 | | | 101 |
Cash dividends common stock at $0.88 per share | | — | | | — | | | — | | | (48,012) | | | — | | | — | |
| (48,012) |
Stock dividend equivalents RSUs at $0.88 per share | | — | | | — | | | 767 | | | (767) | | | — | | | — | |
| — |
Stock-based compensation | | — | | | — | | | 7,135 | | | — | | | — | | | — | |
| 7,135 |
Balance, December 31, 2020 | | 54,404,379 | | $ | 56 | | $ | 1,253,360 | | $ | 20,830 | | $ | 33,309 | | $ | (37,486) | | $ | 1,270,069 |
Net income | | — | | | — | | | — | | | 123,449 | | | — | | | — | | | 123,449 |
OCI, net of tax | | — | | | — | | | — | | | — | | | (57,067) | | | — | | | (57,067) |
Stock issued in acquisition, net of stock issuance costs | | 2,206,237 | | | 2 | | | 58,953 | | | — | | | — | | | — | | | 58,955 |
Repurchase of stock | | (1,323,000) | | | — | | | — | | | — | | | — | | | (33,043) | | | (33,043) |
Issuance of treasury stock for ESPP | | 30,390 | | | — | | | (136) | | | — | | | — | | | 782 | | | 646 |
Net issuance of treasury stock for restricted/deferred stock unit vesting and related tax | | 116,904 | | | — | | | (4,109) | | | — | | | — | | | 3,112 | | | (997) |
Cash dividends common stock at $0.92 per share | | — | | | — | | | — | | | (50,764) | | | — | | | — | | | (50,764) |
Stock dividend equivalents RSUs at $0.92 per share | | — | | | — | | | 1,052 | | | (1,052) | | | — | | | — | | | — |
Stock-based compensation | | — | | | — | | | 7,864 | | | — | | | — | | | — | | | 7,864 |
Balance, December 31, 2021 | | 55,434,910 | | $ | 58 | | $ | 1,316,984 | | $ | 92,463 | | $ | (23,758) | | $ | (66,635) | | $ | 1,319,112 |
See accompanying Notes to Consolidated Financial Statements.
6980
FIRST BUSEY CORPORATION AND SUBSIDIARIES
CONSOLIDATED STATEMENTS OF STOCKHOLDERS’ EQUITY (continued)CASH FLOWS
Years Ended December 31, 2018, 2017 and 2016
(dollars in thousands, except shares and per share data)thousands)
|
|
|
|
|
|
|
|
|
|
|
|
|
|
|
|
|
|
|
|
|
|
|
|
|
|
|
|
|
| Accumulated |
|
|
|
|
|
| |
|
|
|
|
| Additional |
|
|
| Other |
|
|
|
|
|
| |||
|
| Common |
| Paid-in |
| Accumulated |
| Comprehensive |
| Treasury |
|
|
| |||||
|
| Stock |
| Capital |
| (Deficit) |
| Income (loss) |
| Stock |
| Total | ||||||
Balance, December 31, 2016 |
| $ | 39 |
| $ | 781,716 |
| $ | (163,689) |
| $ | 36 |
| $ | (23,788) |
| $ | 594,314 |
|
|
|
|
|
|
|
|
|
|
|
|
|
|
|
|
|
|
|
Net income |
|
| — |
|
| — |
|
| 62,726 |
|
| — |
|
| — |
|
| 62,726 |
Other comprehensive loss |
|
| — |
|
| — |
|
| — |
|
| (2,846) |
|
| — |
|
| (2,846) |
Issuance of 16,842 shares of treasury stock for employee stock purchase plan |
|
| — |
|
| (540) |
|
| — |
|
| — |
|
| 1,016 |
|
| 476 |
Net issuance of 79,459 shares of treasury stock for restricted stock unit vesting and related tax benefit |
|
| — |
|
| (5,521) |
|
| — |
|
| — |
|
| 4,864 |
|
| (657) |
Net issuance of 64,941 shares of treasury stock for stock options exercised, net of shares redeemed and related tax |
|
| — |
|
| (3,139) |
|
| — |
|
| — |
|
| 3,765 |
|
| 626 |
Stock issued for acquisition of First Community, net of stock issuance costs |
|
| 7 |
|
| 211,575 |
|
| — |
|
| — |
|
| — |
|
| 211,582 |
Stock issued for acquisition of Mid Illinois, net of stock issuance costs |
|
| 3 |
|
| 97,594 |
|
| — |
|
| — |
|
| — |
|
| 97,597 |
Cash dividends common stock at $0.72 per share |
|
| — |
|
| — |
|
| (30,697) |
|
| — |
|
| — |
|
| (30,697) |
Stock dividend equivalents restricted stock units at $0.72 per share |
|
| — |
|
| 452 |
|
| (452) |
|
| — |
|
| — |
|
| — |
Stock dividend accrued on restricted stock awards assumed with the Pulaski Financial Corp. acquisition at $0.54 per share |
|
| — |
|
| — |
|
| (10) |
|
| — |
|
| — |
|
| (10) |
Return of 28,648 equity trust shares |
|
| — |
|
| — |
|
| — |
|
| — |
|
| (860) |
|
| (860) |
Stock based employee compensation |
|
| — |
|
| 2,752 |
|
| — |
|
| — |
|
| — |
|
| 2,752 |
Balance, December 31, 2017 |
| $ | 49 |
| $ | 1,084,889 |
| $ | (132,122) |
| $ | (2,810) |
| $ | (15,003) |
| $ | 935,003 |
| | | | | | | | | |
| | Years Ended December 31, | |||||||
|
| 2021 |
| 2020 |
| 2019 | |||
Cash Flows Provided by (Used in) Operating Activities | | | | | | | | | |
Net income | | $ | 123,449 | | $ | 100,344 | | $ | 102,953 |
Adjustments to reconcile net income to net cash provided by (used in) operating activities: | | | | | | | | | |
Provision for credit losses | |
| (15,101) | |
| 38,797 | |
| 10,406 |
Amortization of intangible assets | | | 11,274 | | | 10,008 | | | 9,547 |
Amortization of mortgage servicing rights | | | 5,292 | | | 5,667 | | | 2,710 |
Amortization of NMTC | | | 5,563 | | | 2,311 | | | 1,200 |
Depreciation and amortization of premises and equipment | |
| 11,610 | |
| 12,273 | |
| 11,879 |
Net amortization (accretion) on portfolio loans | | | (11,545) | | | (15,372) | | | (3,383) |
Net amortization (accretion) of premium (discount) on investment securities | |
| 24,251 | |
| 9,716 | |
| 6,106 |
Net amortization (accretion) of premium (discount) on time deposits | | | (1,142) | | | (933) | | | (1,648) |
Net amortization (accretion) of premium (discount) on FHLB advances and other borrowings | | | 826 | | | 586 | | | 309 |
Impairment of OREO and other repossessed assets | | | 1 | | | 68 | | | 62 |
Impairment of fixed assets held for sale | |
| 3,227 | |
| 6,901 | |
| 2,026 |
Impairment of mortgage servicing rights | | | (639) | | | 648 | | | — |
Impairment of leases | | | — | | | — | | | 348 |
Unrealized (gains) losses recognized on equity securities | | | (3,041) | | | 393 | | | 759 |
(Gain) loss on sales of equity securities, net | | | — | | | — | | | (8) |
(Gain) loss on sales of debt securities, net | | | (29) | | | (1,724) | | | (733) |
(Gain) loss on sales of loans, net | |
| (9,323) | |
| (26,999) | |
| (16,819) |
(Gain) loss on sales of OREO | | | 174 | | | (133) | | | (102) |
(Gain) loss on sales of premises and equipment | | | (1,023) | | | 286 | | | 113 |
(Gain) loss on life insurance proceeds | | | (1,257) | | | (1,270) | | | (1,604) |
(Increase) decrease in cash surrender value of bank owned life insurance | |
| (3,909) | |
| (4,110) | |
| (4,191) |
Provision for deferred income taxes | |
| 4,665 | |
| (5,309) | |
| 96 |
Stock-based compensation | |
| 7,864 | |
| 7,135 | |
| 3,997 |
Increase (decrease) in deferred compensation | | | — | | | — | | | (6,781) |
Mortgage loans originated for sale | | | (274,356) | | | (881,398) | | | (667,515) |
Proceeds from sales of mortgage loans | | | 306,074 | | | 920,050 | | | 641,778 |
Net change in operating assets and liabilities: | | | | | | | | | |
(Increase) decrease in other assets | |
| 7,203 | |
| (8,210) | |
| 4,197 |
Increase (decrease) in other liabilities | |
| (28,096) | |
| (6,551) | |
| (7,380) |
Net cash provided by (used in) operating activities | | $ | 162,012 | | $ | 163,174 | | $ | 88,322 |
| | | | | | | | | |
Cash Flows Provided by (Used in) Investing Activities | | | | | | | | | |
Purchases of equity securities | | $ | (11,017) | | $ | (13,123) | | $ | (550) |
Purchases of debt securities available for sale | | | (2,298,055) | | | (1,282,199) | | | (408,941) |
Purchases of FHLB stock | | | — | | | — | | | (3,700) |
Proceeds from sales of equity securities | | | 7,254 | | | 13,152 | | | 1,474 |
Proceeds from sales of debt securities available for sale | |
| 290,955 | |
| — | |
| 227,371 |
Proceeds from paydowns and maturities of debt securities held to maturity | | | — | | | — | | | 14,422 |
Proceeds from paydowns and maturities of debt securities available for sale | |
| 868,083 | |
| 665,744 | |
| 541,753 |
Proceeds from the redemption of FHLB stock | | | — | | | — | | | 5,369 |
Net cash received in (paid for) acquisitions (see Note 2) | | | 228,279 | | | — | | | (61,481) |
Net (increase) decrease in loans | |
| 76,826 | |
| (113,744) | |
| (251,855) |
Cash paid for premiums on bank-owned life insurance | | | (124) | | | (120) | | | (6) |
Proceeds from life insurance | | | 4,755 | | | 2,696 | | | 3,915 |
Purchases of premises and equipment | | | (5,042) | | | (4,198) | | | (13,238) |
Proceeds from disposition of premises and equipment | |
| 7,306 | |
| 814 | |
| 424 |
Capitalized expenditures on OREO | | | — | | | — | | | (2) |
Proceeds from sales of OREO | |
| 1,590 | |
| 1,439 | |
| 2,481 |
Net cash provided by (used in) investing activities | | $ | (829,190) | | $ | (729,539) | | $ | 57,436 |
(continued)
81
FIRST BUSEY CORPORATION
CONSOLIDATED STATEMENTS OF CASH FLOWS (Continued)
(dollars in thousands)
| | | | | | | | | |
| | Years Ended December 31, | |||||||
| | 2021 | | 2020 | | 2019 | |||
Cash Flows Provided by (Used in) Financing Activities | | | | | | | | | |
Net increase (decrease) in deposits | | $ | 767,474 | | $ | 776,386 | | $ | 215,519 |
Net change in federal funds purchased and securities sold under agreements to repurchase | |
| 77,874 | |
| (29,877) | |
| (30,904) |
Proceeds from FHLB advances | | | 5,000 | | | 4,000 | | | — |
Repayment of FHLB advances | | | (4,658) | | | (32,711) | | | (24,667) |
Proceeds from other borrowings | | | 72,500 | | | 142,634 | | | 60,000 |
Repayment of other borrowings | | | (18,500) | | | (74,000) | | | (6,000) |
Cash dividends paid | | | (50,764) | | | (48,012) | | | (45,171) |
Purchase of treasury stock | | | (33,043) | | | (12,272) | | | (24,292) |
Cash paid for withholding taxes on stock-based payments | | | (997) | | | (635) | | | (863) |
Proceeds from stock options exercised | | | — | | | 101 | | | 169 |
Common stock issuance costs | | | (150) | | | — | | | (234) |
Net cash provided by (used in) financing activities | | $ | 814,736 | | $ | 725,614 | | $ | 143,557 |
| | | | | | | | | |
Net increase (decrease) in cash and cash equivalents | | | 147,558 | | | 159,249 | | | 289,315 |
Cash and cash equivalents, beginning of period | | | 688,537 | | | 529,288 | | | 239,973 |
| | | | | | | | | |
Cash and cash equivalents, ending of period | | $ | 836,095 | | $ | 688,537 | | $ | 529,288 |
| | | | | | | | | |
SUPPLEMENTAL DISCLOSURES OF CASH FLOW INFORMATION | | | | | | | | | |
| | | | | | | | | |
Cash payments for: | | | | | | | | | |
Interest | | $ | 25,374 | | $ | 53,601 | | $ | 70,577 |
Income taxes | |
| 12,542 | |
| 22,195 | |
| 24,725 |
| | | | | | | | | |
Non-cash investing and financing activities: | | | | | | | | | |
OREO acquired in settlement of loans | |
| 1,610 | |
| 2,867 | |
| 4,872 |
Transfer of loans held for sale to portfolio loans | | | (4,808) | | | — | | | — |
Transfer of debt securities held to maturity to available for sale | | | — | | | — | | | 593,548 |
See accompanying Notes to Consolidated Financial Statements.
7082
FIRST BUSEY CORPORATION AND SUBSIDIARIES
CONSOLIDATED STATEMENTS OF STOCKHOLDERS’ EQUITY (continued)
Years Ended December 31, 2018, 2017 and 2016
(dollars in thousands, except shares and per share data)
|
|
|
|
|
|
|
|
|
|
|
|
|
|
|
|
|
|
|
|
|
|
|
|
|
|
|
|
|
| Accumulated |
|
|
|
|
|
| |
|
|
|
|
| Additional |
|
|
| Other |
|
|
|
|
|
| |||
|
| Common |
| Paid-in |
| Accumulated |
| Comprehensive |
| Treasury |
|
|
| |||||
|
| Stock |
| Capital |
| (Deficit) |
| Income (loss) |
| Stock |
| Total | ||||||
|
|
|
|
|
|
|
|
|
|
|
|
|
|
|
|
|
|
|
Balance, December 31, 2017 |
| $ | 49 |
| $ | 1,084,889 |
| $ | (132,122) |
| $ | (2,810) |
| $ | (15,003) |
| $ | 935,003 |
|
|
|
|
|
|
|
|
|
|
|
|
|
|
|
|
|
|
|
Net income |
|
| — |
|
| — |
|
| 98,928 |
|
| — |
|
| — |
|
| 98,928 |
Other comprehensive loss |
|
| — |
|
| — |
|
| — |
|
| (3,397) |
|
| — |
|
| (3,397) |
TCJA reclassification |
|
| — |
|
| — |
|
| 605 |
|
| (605) |
|
| — |
|
| — |
Issuance of 19,442 shares of treasury stock for employee stock purchase plan |
|
| — |
|
| (275) |
|
| — |
|
| — |
|
| 811 |
|
| 536 |
Net issuance of 104,637 shares of treasury stock for restricted stock unit vesting and related tax benefit |
|
| — |
|
| (5,930) |
|
| — |
|
| — |
|
| 4,924 |
|
| (1,006) |
Net issuance of 65,814 shares of treasury stock for stock options exercised net of shares redeemed and related tax |
|
| — |
|
| (2,889) |
|
| — |
|
| — |
|
| 3,078 |
|
| 189 |
Cash dividends common stock at $0.80 per share |
|
| — |
|
| — |
|
| (39,010) |
|
| — |
|
| — |
|
| (39,010) |
Stock dividend equivalents restricted stock units at $0.80 per share |
|
| — |
|
| 568 |
|
| (568) |
|
| — |
|
| — |
|
| — |
Stock-based compensation |
|
| — |
|
| 3,721 |
|
| — |
|
| — |
|
| — |
|
| 3,721 |
Balance, December 31, 2018 |
| $ | 49 |
| $ | 1,080,084 |
| $ | (72,167) |
| $ | (6,812) |
| $ | (6,190) |
| $ | 994,964 |
See accompanying Notes to Consolidated Financial Statements.
71
FIRST BUSEY CORPORATION AND SUBSIDIARIES
CONSOLIDATED STATEMENTS OF CASH FLOWS
Years Ended December 31, 2018, 2017 and 2016
|
|
|
|
|
|
|
|
|
| 2018 |
| 2017 |
| 2016 | |||
| (dollars in thousands) | |||||||
Cash Flows from Operating Activities |
|
|
|
|
|
|
|
|
Net income | $ | 98,928 |
| $ | 62,726 |
| $ | 49,694 |
Adjustments to reconcile net income to net cash provided by operating activities: |
|
|
|
|
|
|
|
|
Stock-based and non-cash compensation |
| 3,721 |
|
| 2,752 |
|
| 1,803 |
Depreciation |
| 9,556 |
|
| 8,577 |
|
| 7,295 |
Amortization of intangible assets |
| 5,854 |
|
| 5,245 |
|
| 4,438 |
Premises and equipment impairment |
| 817 |
|
| 99 |
|
| 756 |
Provision for loan losses |
| 4,429 |
|
| 5,303 |
|
| 5,550 |
Provision for deferred income taxes |
| 7,219 |
|
| 13,907 |
|
| 2,953 |
Amortization of security premiums and discounts, net |
| 8,412 |
|
| 6,711 |
|
| 6,877 |
Accretion of premiums and discounts on time deposits and trust preferred securities, net |
| (97) |
|
| (226) |
|
| (669) |
Accretion of premiums and discounts on portfolio loans, net |
| (10,452) |
|
| (12,205) |
|
| (7,429) |
Security loss (gain), net |
| (331) |
|
| (1,143) |
|
| (1,232) |
Change in equity securities, net |
| 4,618 |
|
| — |
|
| — |
Gain on sales of mortgage loans, net of origination costs |
| (10,446) |
|
| (45,443) |
|
| (28,299) |
Mortgage loans originated for sale |
| (425,322) |
|
| (1,487,726) |
|
| (1,822,027) |
Proceeds from sales of mortgage loans |
| 504,721 |
|
| 1,693,632 |
|
| 1,767,220 |
Net losses (gains) on disposition of premises and equipment |
| 162 |
|
| (327) |
|
| 251 |
(Decrease) increase in deferred compensation |
| (3,780) |
|
| (757) |
|
| 142 |
Increase in cash surrender value of bank owned life insurance |
| (1,754) |
|
| (1,997) |
|
| (1,522) |
Change in assets and liabilities: |
|
|
|
|
|
|
|
|
Decrease (increase) in other assets |
| 4,097 |
|
| 8,423 |
|
| (407) |
Increase (decrease) in other liabilities |
| 2,195 |
|
| (4,193) |
|
| (6,288) |
Net cash provided by (used in) operating activities | $ | 202,547 |
| $ | 253,358 |
| $ | (20,894) |
|
|
|
|
|
|
|
|
|
Cash Flows from Investing Activities |
|
|
|
|
|
|
|
|
Proceeds from sales of securities classified available for sale |
| 122,584 |
|
| 139,765 |
|
| 52,587 |
Proceeds from sales of securities classified equity |
| 920 |
|
| — |
|
| — |
Proceeds from maturities of securities classified available for sale |
| 163,582 |
|
| 193,294 |
|
| 241,304 |
Proceeds from sales of securities classified held to maturity |
| — |
|
| — |
|
| 399 |
Proceeds from maturities of securities classified held to maturity |
| 50,560 |
|
| 11,268 |
|
| 3,811 |
Purchases of securities classified available for sale |
| (124,234) |
|
| (141,685) |
|
| (180,447) |
Purchases of securities classified held to maturity |
| (217,766) |
|
| (352,679) |
|
| (2,103) |
Net increase in loans |
| (49,864) |
|
| (169,150) |
|
| (1,294) |
Proceeds from disposition of premises and equipment |
| 324 |
|
| 2,224 |
|
| 2,485 |
Proceeds from sale of OREO properties |
| 5,298 |
|
| 5,024 |
|
| 4,498 |
Purchases of premises and equipment |
| (11,618) |
|
| (14,980) |
|
| (8,991) |
Proceeds (purchases) from the redemption of FHLB stock, net |
| 4,864 |
|
| 6,090 |
|
| 11,919 |
Net cash received in acquisitions |
| — |
|
| 26,979 |
|
| 25,575 |
Net cash (used in) provided by investing activities | $ | (55,350) |
| $ | (293,850) |
| $ | 149,743 |
(continued)
72
FIRST BUSEY CORPORATION AND SUBSIDIARIES
CONSOLIDATED STATEMENTS OF CASH FLOWS (Continued)
Years Ended December 31, 2018, 2017 and 2016
|
|
|
|
|
|
|
|
|
|
|
|
| 2018 |
| 2017 |
| 2016 |
| |||
|
| (dollars in thousands) |
| |||||||
Cash Flows from Financing Activities |
|
|
|
|
|
|
|
|
|
|
Net increase (decrease) in certificates of deposit |
| $ | 161,085 |
| $ | 100,600 |
| $ | (173,385) |
|
Net (decrease) increase in demand deposits, money market and savings accounts |
|
| (37,485) |
|
| 11,188 |
|
| 31,322 |
|
Net (decrease) increase in federal funds purchased and securities sold under agreements to repurchase |
|
| (118,770) |
|
| 28,898 |
|
| (6,655) |
|
Proceeds from short-term borrowings, net |
|
| (220,000) |
|
| 60,300 |
|
| (104,000) |
|
Repayment of subordinated debt |
|
| (5,500) |
|
| — |
|
| — |
|
Net proceeds from issuance of senior debt |
|
| — |
|
| 39,326 |
|
| — |
|
Net proceeds from issuance of subordinated debt |
|
| — |
|
| 49,186 |
|
| — |
|
Cash dividends paid |
|
| (39,010) |
|
| (30,707) |
|
| (22,748) |
|
Repayment of long-term debt |
|
| — |
|
| (30,000) |
|
| (4,906) |
|
Value of shares surrendered upon vesting to satisfy tax withholding obligations of stock- based compensation |
|
| (1,208) |
|
| (2,274) |
|
| (809) |
|
Proceeds from stock options exercised |
|
| 392 |
|
| 906 |
|
| 4 |
|
Common stock issuance costs |
|
| — |
|
| (365) |
|
| (246) |
|
Net cash (used in) provided by financing activities |
| $ | (260,496) |
| $ | 227,058 |
| $ | (281,423) |
|
|
|
|
|
|
|
|
|
|
|
|
Net (decrease) increase in cash and cash equivalents |
|
| (113,299) |
|
| 186,566 |
|
| (152,574) |
|
Cash and cash equivalents, beginning of period |
|
| 353,272 |
|
| 166,706 |
|
| 319,280 |
|
|
|
|
|
|
|
|
|
|
|
|
Cash and cash equivalents, ending of period |
| $ | 239,973 |
| $ | 353,272 |
| $ | 166,706 |
|
|
|
|
|
|
|
|
|
|
|
|
SUPPLEMENTAL DISCLOSURES OF CASH FLOW INFORMATION |
|
|
|
|
|
|
|
|
|
|
|
|
|
|
|
|
|
|
|
|
|
Cash Payments for: |
|
|
|
|
|
|
|
|
|
|
Interest |
| $ | 40,639 |
| $ | 19,342 |
| $ | 9,674 |
|
Income taxes |
|
| 23,183 |
|
| 26,419 |
|
| 20,186 |
|
|
|
|
|
|
|
|
|
|
|
|
Non-cash Investing and Financing Activities: |
|
|
|
|
|
|
|
|
|
|
Other real estate acquired in settlement of loans |
|
| 4,025 |
|
| 1,417 |
|
| 2,775 |
|
Other assets transferred to equity investments |
|
| 4,000 |
|
| — |
|
| — |
|
See accompanying Notes to Consolidated Financial Statements.
73
FIRST BUSEY CORPORATION AND SUBSIDIARIES
NOTES TO CONSOLIDATED FINANCIAL STATEMENTS
Note 1. Significant Accounting Policies
Nature of operations
First Busey Corporation is a financial holding company organized under the laws of Nevada. The Company’s subsidiaries provide retail and commercial banking services remittance processing,and payment technology solutions, and offer a full range of financial products and services including depository, lending, security brokerage, services, investment management, and fiduciary services, to individual, corporate, institutional, and governmental customers through itstheir locations in Illinois, Missouri, southwest Florida and Indianapolis, Indiana. The Company and its subsidiaries are subject to the regulations of certain regulatory agencies and undergo periodic examinations by those regulatory agencies.
The significant accounting and reporting policies for the Company and its subsidiaries follow:
Principles of consolidation
The Consolidated Financial Statements include the accounts of the Company and its subsidiaries, which includesinclude First Busey Risk Management, Deed of Trust Services Corporation, and Busey Bank, and itsincluding Busey Bank’s wholly-owned subsidiaries FirsTech, Inc., Pulaski Service Corporation, Mid Illinois Insurance Services Inc. and Busey Capital Management, Inc. Operating results generated from acquired businesses are included with the Company’s results of operations starting from each date of acquisition. The Company and its subsidiaries maintain various LLCs that hold specific assets for risk mitigation purposes and are consolidated into these Consolidated Financial Statements. All intercompanyIntercompany balances and transactions have been eliminated in consolidation.
TheBecause the Company is not the primary beneficiary, the Consolidated Financial Statements exclude the following wholly-owned variable interest entities: First Busey Statutory Trust II, First Busey Statutory Trust III, First Busey Statutory Trust IV, Pulaski Financial Statutory Trust I, and Pulaski Financial Statutory Trust II because the Company is not the primary beneficiary.II.
Use of estimates
In preparing the accompanying Consolidated Financial Statements in conformity with GAAP, the Company’s management is required to make estimates and assumptions that affect the amounts reported in the Consolidated Financial Statements and the disclosures provided. Actual results could differ from those estimates. Material estimates which are particularly susceptible to significant change in the near-term relate to the fair value of investmentdebt securities available for sale, fair value of assets acquired and liabilities assumed in business combinations, goodwill, income taxes, and the determination of the allowance for loan losses.ACL.
Comprehensive income (loss)
Accounting principles generally require that recognized revenue, expenses, gains, and losses be included in net income. Although certain changes in assets and liabilities, such as unrealized gains and losses on available for sale debt securities and unrealized gains and losses on cash flow hedges, are reported as a separate component ofwithin the equity section of the balance sheet, such items, along with net income, are components of comprehensive income (loss).
Trust assets
Assets held for customers in a fiduciary or agency capacity, other than trust cash on deposit at the Company’s bank subsidiaries,Busey Bank, are not assets of the Company and, accordingly, are not included in the accompanying Consolidated Financial Statements. The Company had assets under care of $7.1$12.7 billion and $6.0$10.2 billion at December 31, 20182021, and 2017,2020, respectively.
Cash and cash equivalents
Cash and cash equivalents include cash andon hand, cash items in process of collection, amounts due from other banks, interest-bearing deposits held with banksother financial institutions, and federal funds sold. Cash and cash equivalents have original maturities of three months or less. Accordingly, theThe carrying amount of suchthese instruments is considered a reasonable estimate of fair value. Net cash flows are reported for customer loan and deposit transactions, interest bearing deposits in other financial institutions and repurchase agreements.
83
The Company maintains its cash in deposit accounts, the balance of which, at times, may exceed federally insured limits. The Company has not experienced any losses in such accounts. Management believes the Company is not exposed to any significant credit risk on cash and cash equivalents.
74
Securities
Securities classified as held to maturity are those debtDebt securities that the Company has the intent and ability to hold to maturity and are carried at amortized cost.
Securities classified as available for sale are those debt securities that the Company intends to hold for an indefinite period of time, but not necessarily to maturity. Any decision to sell a security classified as available for sale would be based on factors including significant movements in interest rates, changes in the maturity mix of the Company's assets and liabilities, liquidity needs, regulatory capital considerations, and other similar factors. SecuritiesDebt securities available for sale are carried at fair value, with unrealized gains and losses reported in other comprehensive income (loss), net of taxes.
Purchase premiums and discounts are recognized in interest income using the interest method over the terms of the securities. The amortization period for certain callable debt securities held at a premium are amortized to the earliest call date, while discounts on debt securities are amortized to maturity. Gains and losses on the sale of securities are recorded on the trade date and are determined using the specific identification method.
Management evaluatesDebt securities available for sale are not within the scope of CECL, however, the accounting for credit losses on these securities is affected by ASC 326-30. A debt securitiessecurity available for OTTI on a quarterly basis, or more frequently,sale is impaired if economic or market conditions warrant an evaluation. Declines in the fair value of debt securitiesthe security declines below theirits amortized cost are evaluated tobasis. To determine whether they are temporary or OTTI. Ifthe appropriate accounting, the Company (a) has the intentmust first determine if it intends to sell a debtthe security or (b)if it is more likely than not that the Companyit will be required to sell the debt security before its anticipated recovery,the fair value increases to at least the amortized cost basis. If either of those selling events is expected, the Company recognizeswill write down the entire unrealized loss in earnings as an OTTI loss.amortized cost basis of the security to its fair value. This is achieved by writing off any previously recorded allowance, if applicable, and recognizing any incremental impairment through earnings. If neither of these conditions are met, the Company evaluatesneither intends to sell the security, nor believes it more likely than not will be required to sell the security, before the fair value recovers to the amortized cost basis, the Company must determine whether any of the decline in fair value has resulted from a credit loss, exists. or if it is entirely the result of noncredit factors.
The impairmentCompany considers the following factors in assessing whether the decline is separated into (a)due to a credit loss:
| ● | Extent to which the fair value is less than the amortized cost basis |
| ● | Adverse conditions specifically related to the security, an industry, or a geographic area (for example, changes in the financial condition of the issuer of the security, or in the case of an asset-backed debt security, in the financial condition of the underlying loan obligors) |
| ● | Payment structure of the debt security and the likelihood of the issuer being able to make payments that increase in the future |
| ● | Failure of the issuer of the security to make scheduled interest or principal payments |
| ● | Any changes to the rating of the security by a rating agency |
Impairment related to a credit loss must be measured using the amountdiscounted cash flow method. Credit loss recognition is limited to the fair value of the total impairmentsecurity. Impairment is recognized by establishing an ACL through provision for credit losses. Impairment related to the credit loss and (b) the amount of total impairment related to all other factors. The amount of the total OTTI related to the credit loss is recognized in earnings and the amount related to all othernoncredit factors is recognized in AOCI, net of applicable taxes. The Company did not recognize any impairment in 2021, 2020, or 2019.
Accrued interest receivable for debt securities available for sale totaled $11.4 million at December 31, 2021, and is excluded from the estimate of credit losses. Accrued interest receivable is reported in other comprehensive income (loss).assets on the Consolidated Balance Sheets.
WithDebt securities classified as held to maturity were those debt securities that the adoption of Accounting Standards Update (“ASU”) 2016-01, “"Financial Instruments - Overall (Subtopic 825-10): RecognitionCompany had the intent and Measurement of Financial Assetsability to hold to maturity and Financial Liabilities," equitywere carried at amortized cost. The Company no longer carries debt securities classified as held to maturity.
Equity securities are carried at fair value with changes in fair value recognized in net income.earnings.
84
Loans held for sale
Loans held for sale include mortgage loans which the Company intends to sell to investors and/or the secondary mortgage market. Loans held for sale are recorded at fair value, as the Company has elected to apply the fair value method of accounting, with changes in fair value recognized in earnings. Fair value adjustments are recorded as an adjustment to mortgage revenues. The fair value of loans held for sale is measured using observable quoted market orprices, contract prices, or market price equivalents, consistent with those used by other market participants. Direct loan origination fees and costs related to loans accounted for at fair value are recognized when earned or incurred.earned.
Loan servicing
Servicing assets are recognized when servicing rights are acquired or retained through the sale of mortgage and government-guaranteed commercial loans. The unpaid principal balances of loans serviced by the Company for the benefit of others totaled $1.8 billion and are not included in the accompanying Consolidated Balance Sheets. Servicing rights are initially recorded at fair value which is determined using a valuation model that calculates the present value of estimated future net servicing income. Capitalized servicing rights are reported in other assets and are amortized into non-interestnoninterest income in proportion to, and over the period of, the estimated future net servicing income of the underlying financial assets. The amortization of mortgage servicing rights is included in mortgage revenue. The amortization of government-guaranteed commercial loans is included in other income.
Servicing rights are periodically evaluated for impairment based on the fair value of those rights as compared to book value. Fair values are estimated using discounted cash flows based on current expected future prepayment rates.rates and other inputs. For purposes of measuring impairment, theservicing rights are stratified by one or more predominant risk characteristics of the underlying loans. The Company stratifies its capitalized servicing rights based onA valuation allowance is recognized in the type of the underlying loans. The amount of impairment allowance recognized is the amount, if any, by which the amortized cost of the rights for each stratum exceeds its fair value.value, if any. If the Company later determines that all or a portion of the impairment no longer exists for a particular group of loans, a reductionreversal of the allowance may be recorded as an increase to income.in current period earnings. The Company had noan insignificant amount of impairment recorded at December 31, 2018 or 2017.2021, and had $0.6 million impairment recorded at December 31, 2020.
Servicing fee income is recorded for fees earned for servicing loans. The fees are based on a contractual percentage of the outstanding principal and are recorded as income when earned.
75
Portfolio loans
Loan receivablesLoans that management has the intent and ability to hold for the foreseeable future, or until maturity or pay-off, are reported at the principal balance outstanding, net of purchase premiums and discounts, or net deferred origination fees or costs, charge-offs, and the allowance for loan losses.ACL.
Loan origination fees, net of certain direct loan origination costs, are deferred and the net amount is amortized as an adjustment of the related loan’s yield. The Company amortizes the net amount over the contractual life of the related loan. However, for long-term, fixed-rate residential mortgages, the Company has anticipated prepayments and assumes an estimated economic life for the amortization period.
Interest income is accrued daily on outstanding loan balances. Loans are placed on non-accrual status when, in management’s opinion, the borrower may be unable to meet payment obligations as they become due, as well as when required by regulatory provisions. Loans may be placed on non-accrual status regardless of whether or not such loans are considered past due. Past due status is based on the contractual terms of the loan.
Interest accrued in the current year but not collected for loans that are placed on non-accrual status or charged-off is reversed against interest income. Interest accrued during the prior year but not collected for loans that are placed on non-accrual status or charged-off is charged against the allowance for loan losses. The interest on non-accrual loans is accounted for on the cash-basis or cost-recovery method, until returned to accrual status. Loans are returned to accrual status when all the principal and interest amounts contractually due are brought current and future payments are reasonably assured.
85
At December 31, 2021, the Company had $76.9 million in PPP loans outstanding, with an amortized cost of $75.0 million. In comparison, at December 31, 2020, the Company had $451.5 million in PPP loans outstanding, with an amortized cost of $446.4 million. The Company received fees totaling $20.1 million and $25.4 million, and incurred incremental direct origination costs of $4.2 million and $5.1 million, for the years ended December 31, 2021, and 2020, respectively, both of which have been deferred and are being amortized over the contractual life of these loans, subject to prepayment. The Company recognized $14.0 million and $15.2 million in net interest income for fees, net of deferred cost, during the years ended December 31, 2021, and 2020, respectively. As of December 31, 2021, $1.9 million in fees, net of deferred costs, remained to be recognized. PPP loans contain a forgiveness feature for funds spent on covered expenses, including both principal and accrued interest. Any remaining balance after loan forgiveness maintains a 100% government guarantee for the remaining term of the loan. The Company has implemented an online portal designed to streamline the PPP loan forgiveness process by providing a tool that borrowers can use to apply for forgiveness. As these loans are forgiven, the recognition of these fees and direct origination costs will be accelerated. As of December 31, 2021, the Company had received approximately $999.0 million in borrower loan forgiveness from the SBA and had submitted forgiveness applications to the SBA on behalf of borrowers for another $7.1 million.
Troubled debt restructurings
The Company’s loan portfolio includes certain loans that have been modified in a troubled debt restructurings (“TDR”),TDR, where concessions have been granted to borrowers who have experienced financial difficulties. The Company will restructure a loan for its customer after evaluating whether the borrower is able to meet the terms of the loan over the long term, though unable to meet the terms of the loan in the near term due to individual circumstances.
The Company considers the customer’s past performance, previous and current credit history, the individual circumstances surrounding the customer’s current difficulties, and the customer’s plan to meet the terms of the loan in the future prior to restructuring the terms of the loan. Generally, restructurings consist of short-term interest rate relief, short-term principal payment relief, short-term principal and interest payment relief, or forbearance (debt forgiveness). A restructured loan that exceeds 90 days past due or is placed on non-accrual status, is classified as non-performing.
All TDRs are considered to be impairedindividually evaluated for purposes of assessing the adequacy of the allowance for loan lossesACL and for financial reporting purposes. When the Company modifies a loan in a TDR, it evaluates any possible impairment similar to other impaired loans based onTDRs are evaluated using present value of the expected future cash flows discounted at the loan’s original effective interest rate, the loan’s observable market price, or the fair value of the collateral if the loan is collateral dependent. If the Company determines that the fair value of the TDR is less than the recorded investment in the loan, impairment is recognized through a charge to the allowance for loan lossesACL in the period of the modification and in periods subsequent to the modification.
Purchased credit-impairedModified loans with payment deferrals that fall under the CARES Act or revised Interagency Statement that suspended requirements under GAAP related to TDR classifications are not included in the Company’s TDR totals.
Assets purchased with credit deterioration
On January 1, 2020, First Busey adopted ASC 326 using the prospective transition approach for financial assets PCD that were previously classified as PCI and accounted for under ASC 310-30. In accordance with the standard, management did not reassess whether PCI assets met the criteria of PCD assets as of the date of adoption. In accordance with ASC 326, the amortized cost basis of PCD assets were adjusted to reflect an ACL for any remaining credit discount. Subsequent changes in expected cash flows will be adjusted through the ACL. The Company holdsnoncredit discount will be accreted into interest income at the effective interest rate as of January 1, 2020.
Subsequent to the adoption of ASC 326, acquired loans acquired through business combinations, someare separated into two categories based on the credit risk characteristics of the underlying borrowers as either PCD, for loans which have shown evidence ofexperienced more than insignificant credit deterioration since origination. These purchased credit-impaired (“PCI”)origination, or all other loans. At the date of acquisition, an ACL on PCD loans are initially recorded at fair value onis determined and netted against the acquisition date. Accordingly, the seller’s allowance for loan losses is not carried over or recorded asamortized cost basis of the acquisition date.
PCI loans are reviewed individually or are aggregated into pools of loans based on common risk characteristics.individual loans. The Company estimatesdifference between the amount and timing of expected cash flowsinitial amortized cost basis and the excesspar value of the cash flows expected to be collected over the recorded investment, if material,loan is the accretable yield anda noncredit discount or premium, which is recognized asamortized into interest income over the life. The excess of the contractual cash flows over the cash flows expected to be collected is the nonaccretable difference.
Over the life of the loan. The ACL on PCD loans expected cash flows continueis recorded in the acquisition accounting and no provision for credit losses is recognized at the acquisition date. Subsequent changes to be estimated and any increases in expected cash flows over those expected at purchase date in excess of fair value thatthe ACL are significant and probable are adjustedrecorded through provision expense. For all other loans, an ACL is established immediately after the accretable yield onacquisition through a prospective basis. Any subsequent decreases in expected cash flows over those expected at purchase date that are probable are recognized by recording an allowancecharge to the provision for loancredit losses.
7686
Allowance for loancredit losses
The allowance for loan losses represents anACL is a significant estimate of the amount of probable losses believed to be inherent in the Company’s loanConsolidated Financial Statements, affecting both earnings and capital. The ACL is a valuation account that is deducted from the portfolio atloans’ amortized cost bases to present the Consolidated Balance Sheet date. The allowance calculation involves a high degree of estimation that management attemptsnet amount expected to mitigate throughbe collected on the use of objective historical data where available. Loan lossesportfolio loans. Portfolio loans are charged off against the allowance for loan lossesACL when management believes the uncollectibility of thea loan balance is confirmed. Subsequent recoveries, if any, are creditedRecoveries will be recognized up to the allowance. Overall,aggregate amount of previously charged-off balances. The ACL is established through provision for credit loss expense charged to income.
A loan’s amortized cost basis is comprised of the unpaid principal balance of the loan, accrued interest receivable, purchase premiums or discounts, and net deferred origination fees or costs. The Company believeshas estimated its allowance on the amortized cost basis, exclusive of government guaranteed loans and accrued interest receivable. The Company writes-off uncollectible accrued interest receivable in a timely manner and has elected to not measure an allowance methodology is consistent with prior periodsfor accrued interest receivable.The Company presents the aggregate amount of accrued interest receivable for all financial instruments in other assets on the Consolidated Balance Sheets and the balance was adequate to cover the estimated lossesof accrued interest receivable is disclosed in“Note 18. Fair Value Measurements.”
Our methodology influences, and is influenced by, the Company’s loan portfolio at December 31, 2018 and 2017.
overall credit risk management processes. The allowanceACL is managed in accordance with GAAP to provide an adequate reserve for loanexpected credit losses that is calculated by segmenting the loan portfolio by product type, geography and risk classification. The Company’s loan portfolio consistsreflective of commercial, commercial real estate, real estate construction, retail real estate, and retail other loans. Segmentation based on product type captures the riskmanagement’s best estimate of credit loss inherent in each category including fluctuations in underlying collateral values, changes in operating cash flows, changes in borrower characteristics, and changes in economic and other factors. Segmentation by geography and risk classification further enhances Management’s evaluation of these factors in the assessment of the adequacy of the allowance for loan loss.
The allowance for loan loss consists of a general reserve and a specific reserve. The general portion of the Company’s allowancewhat is developed based on historical loss ratios adjusted for qualitative factors which management believes capture inherent loss not reflected in historical loss experience. Historical loss ratios are an annualized rate based on the previous five years of loss history with more consideration given to the most recent loss experience. Qualitative factors are estimated by considering risk factors both internal and external to the Company. Specifically, management considers the following when estimating qualitative factors: (i) Management & Staff; (ii) Loan Underwriting, Policy and Procedures; (iii) Internal/External Audit & Loan Review; (iv) Valuation of Underlying Collateral; (v) Macro and Local Economic Factors; (vi) Impact of Competition, Legal & Regulatory Issues; (vii) Nature and Volume of Loan Portfolio; (viii) Concentrations of Credit; (ix) Net Charge-Off Trends; and (x) Non-Accrual, Past Due and Classified Trends. Management evaluates the probable impact from the degree of risk that each one of these components has on the quality of the loan portfolio on a quarterly basis.
The specific portion of the Company’s allowance relates to loans that are identified as impaired, which includes non-performing loans, TDRs and other loans determinedexpected to be impaired. A loan is classified as impaired when, based on current information and events, it is probable the Company will be unable to collect scheduled principal and interest payments when due according to the terms of the loan agreement. Factors considered by management in determining impairment include payment status, collateral value, and the probability of collecting scheduled principal and interest payments when due. Loans that experience insignificant payment delays and payment shortfalls generally are not classified as impaired. Management determines the significance of payment delays and payment shortfalls on a case-by-case basis, taking into consideration all of the circumstances surrounding the loan and the borrower, including the length of the delay, the reasons for the delay, the borrower’s prior payment record, and the amount of the shortfall in relation to the principal and interest owed.
If a loan is impaired, impairmentcollected. The ACL is measured on a loan-by-loancollective pool basis for commercial and construction loanswhen similar risk characteristics exist. Loans that do not share risk characteristics are evaluated on an individual basis.
The measurement of expected credit losses is based on relevant information about past events, including historical experience, current conditions, and reasonable and supportable forecasts that affect the present valuecollectability of the expected future cash flows discounted atamortized cost basis. Adjustments to historical loss information are made for differences in current loan-specific risk characteristics such as differences in underwriting standards, portfolio mix, delinquency level, or term as well as for changes in environmental conditions such as changes in unemployment rates, property values, and other relevant factors. The calculation also contemplates that the loan’s effective interest rate,Company may not be able to make or obtain such forecasts for the loan’s observable market price, or the fair valueentire life of the collateral less costfinancial assets and requires a reversion to sell, ifhistorical credit loss information. The Company uses four quarters as its reasonable and supportable forecast period. Due to rapidly changing forecasts around the loan is collateral dependent. Loans are considered collateral dependent if repayment is expected solely from the saleimpact of the collateral. Collateral values are estimated using a combination of observable inputs, including recent appraisals discounted for collateral specific changes and current market conditions, and unobservable inputs based on customized discounting criteria.
Large groups of smaller balance homogenous loans are collectively evaluated for impairment. Accordingly,COVID-19, the Company does not separately identify individual consumerbelieve it has the current ability to incorporate reasonable and residential loans for impairment unless such loans are the subject of a restructuring. supportable forecasts into its CECL models extending beyond four quarters.
The allowance for loan losses is evaluated on a regular basis by management and is based upon management’s periodic reviewOngoing impacts of the collectibility of the loansCECL methodology will be dependent upon changes in light of historical experience, the natureeconomic conditions and volume of theforecasts, originated and acquired loan portfolio adverse situations that may affect the borrower’s ability to repay, estimated value of any underlying collateralcomposition, credit performance trends, portfolio duration, and prevailing economic conditions. This evaluation is inherently subjective as it requires estimates that are susceptible to revision as more information becomes available.other factors.
77
Premises and equipment, net
Land is carried at cost less accumulated depreciation of depreciable land improvements. Premises and equipment are stated at cost less accumulated depreciation. Depreciation is computed by the straight-line method over the estimated useful lives of the assets. The estimated useful lives for premises and equipment are:
|
|
|
|
|
|
Asset Description |
| Estimated Useful Life | |||
Buildings and improvements |
| 3 | — | 40 | years |
Furniture and equipment |
| 3 | — | 10 | years |
| | | |
Asset Description | Estimated Useful Life | ||
Buildings and improvements |
| 3 — 40 | years |
Furniture and equipment | 3 — 10 | years | |
Leases
A determination is made at inception if an arrangement contains a lease. For arrangements containing leases, the Company recognizes leases on the Consolidated Balance Sheets as right of use assets and corresponding lease liabilities. Lease-related assets, or right of use assets, are recognized on the lease commencement date at amounts equal to the respective lease liabilities, adjusted for prepaid lease payments, initial direct costs, and lease incentives received. Lease-related liabilities are recognized at the present value of the remaining contractual fixed lease payments, discounted using our incremental borrowing rate. Operating lease expense is recognized on a straight-line basis over the lease term, while variable lease payments are expensed as incurred.
87
ASC 842 requires the use of the rate implicit in the lease whenever this rate is readily determinable. If not readily determinable, the Company utilizes its incremental borrowing rate at lease inception, on a collateralized basis, over a similar term. For operating leases existing prior to January 1, 2019, the Company used a borrowing rate that corresponded to the remaining lease term.
The Company’s lease agreements often include one or more options to renew at the Company’s discretion. If, at lease inception, the Company considers the exercising of a renewal option to be reasonably certain, the Company will include the extended term in the calculation of its right of use assets and lease liabilities.
Long-lived assets
Long-lived assets, including premises and equipment, right of use assets, and intangible assets, are reviewed for impairment whenever events or changes in circumstances indicate that the carrying amount of the asset may not be recoverable. An impairment loss is recognized when estimated undiscounted future cash flows from operations of the asset are less than the carrying value of the asset. The cashCash flows used for this analysis are those directly associated with, and that are expected to arise as a direct result of, the use and eventual disposition of the asset. An impairment loss would be measured by the amount by which the carrying value of the asset exceeds its fair value.
Other real estate owned and other repossessed assets
OREO representsand other repossessed assets represent properties and other assets acquired through foreclosure or other proceedings in settlement of loans. OREO isand other repossessed assets are recorded at the date of foreclosure at the fair value of the propertiesproperty or asset, less estimated costs of disposal, which establishes a new cost basis. Any adjustment to fair value at the time of transfer to OREO or other repossessed assets is charged to the allowance for loan losses.ACL. OREO property isand other repossessed assets are evaluated regularly to ensure the recorded amount is supported by its current fair value, and valuation allowances to reduce the carrying amount to fair value less estimated costs to dispose are recorded, as necessary. OREO and other repossessed assets are included in other assets on the Consolidated Balance Sheets. Revenue, expense, gains, and losses from the operations of foreclosed assets are included in operations.earnings.
Goodwill and other intangibles
Goodwill represents the excess of the cost ofconsideration transferred in a business acquiredcombination over the fair value of the newnet assets acquired. Goodwill is not amortized but is subject to at least annual impairment assessments. The Company has established December 31 as the annual impairment assessment date. As part of this analysis, theeach reporting unit's carrying value is compared to its fair value.
The Company estimates the fair value of its reporting units as of the measurement date utilizing valuation methodologies including the comparable transactions approachcompany analysis and the control premium approach.precedent transaction analysis. Goodwill is considered impaired if the carrying value of the reporting unit exceeds its fair value. There was no0 impairment determined atas of December 31, 20182021, or 2017.2020. See “Note 9.7. Goodwill and Other Intangible Assets” for further discussion.
Other intangible assets consistsconsist of core deposit and acquired customer relationship intangible assets arising from bank acquisitions and are amortized over their estimated useful lives.
Cash surrender value of bank-ownedbank owned life insurance
The Company has purchased, or acquired through acquisitions, life insurance policies on certain executives and senior officers. Life insurance is recorded at its cash surrender value, which estimates its fair value.
88
ASC Topic 715, “Compensation—Retirement Benefits” requires an employer to recognizeFIRST BUSEY CORPORATION
NOTES TO CONSOLIDATED FINANCIAL STATEMENTS
The Company maintains a liability for post-employment benefits promised to an employee based on an arrangement between an employerthe Company and an employee. In an endorsement split-dollar life insurance arrangement, the employer owns and controls the policy, and the employer and employee split the life insurance policy’s cash surrender value and/or death benefits. If the employer agrees to maintain a life insurance policy during the employee’s retirement, the present value of the cost of maintaining the insurance policy would be accrued over the employee’s active service period. Similarly, if the employer agrees to provide the employee with a death benefit, the present value of the death benefit would be accrued over the employee’s active service period. The Company has an accrued liability of $5.5 million as of December 31, 2021, included in other liabilities, for these arrangements.arrangements, compared with $5.6 million as of December 31, 2020.
Other asset investments
The Company has invested in certain tax-advantaged projects promoting affordable housing, new markets, and historic rehabilitation. These investments are designed to generate returns primarily though the realization of federal and state income tax credits and other tax benefits, such as tax deductions from operating losses of the investments, over specified time periods. In addition, the Company has private equities, which are primarily small business investment companies in the financial technology, agricultural, environmental, and affordable housing preservation markets. These investments are considered to be variable interest entities, and are accounted for under the equity method or deferral method, as appropriate. The Company is not required to consolidate variable interest entities in which it has concluded it does not have a controlling financial interest, and is not the primary beneficiary.
The following table summarizes the impact of the Company’s other asset investments on our Consolidated Balance Sheets for the periods indicated (dollars in thousands):
| | | | | | | | | |
| | | | | As of December 31, | ||||
|
| Location |
| 2021 |
| 2020 | |||
Other asset investments | | | | | | | | | |
Funded investments | | Other assets | | $ | 37,417 | | | 20,368 | |
Unfunded investments | | Other assets | | | 52,765 | | | 16,776 | |
Other asset investments | | | | | $ | 90,182 | | | 37,144 |
| | | | | | | | | |
Unfunded investment obligations | | Other liabilities | | $ | (52,765) | | $ | (16,776) | |
Further, the Company owns Visa Class B shares, recorded at a nominal carrying value. These shares are subject to certain transfer restrictions currently and will be convertible into Visa Class A shares upon final resolution of certain litigation matters involving Visa.
Transfers of financial assets
Transfers of financial assets are accounted for as sales only when control over the assets has been surrendered. Control over transferred assets is deemed to be surrendered when: (1)(i) the assets have been isolated from the Company, (2)(ii) the transferee obtains the right to pledge or exchange the assets it receives, and no condition both constrains the transferee from taking advantage of its right to
78
pledge or exchange and provides more than a trivial benefit to the transferor, and (3)(iii) the Company does not maintain effective control over the transferred assets through an agreement to repurchase them before their maturity or the ability to unilaterally cause the holder to return specific assets.
Income taxes
The Company is subject to income taxes in the U.S. federal and various state jurisdictions. The Company and its subsidiaries file consolidated federal and state income tax returns with each subsidiary computing its taxes on a separate entity basis. Tax regulations within each jurisdiction are subject to the interpretation of the related tax laws and regulations and require significant judgment to apply. With few exceptions, the Company is no longer subject to U.S. federal, state, or local tax examinations by tax authorities for the years before 2014. 2017.
89
The Company has maintained significant net deferred tax assets for deductible temporary differences, the largest of which relates to the allowance for loan losses. For income tax return purposes, only actual charge-offs are deductible, not the provision for loan losses. The Company took a one-time, non-cash charge of $8.1 million in the fourth quarter of 2017 as a result of the revaluation of the Company’s net deferred tax position following the enactment of the TCJA.FIRST BUSEY CORPORATION
NOTES TO CONSOLIDATED FINANCIAL STATEMENTS
Under GAAP, a valuation allowance is required to be recognized if it is more likely than not that the deferred tax assets will not be realized. The determination of the recoverability of the deferred tax assets is highly subjective and dependent upon judgment concerning management’s evaluation of both positive and negative evidence, the forecasts of future income, applicable tax planning strategies, and assessments of the current and future economic and business conditions.
Management believes that it is more likely than not that the deferred tax assets included in the accompanying Consolidated Financial Statements will be fully realized. The Company determined that no0 valuation allowance was required as of December 31, 2018.2021, or 2020.
Positions taken in tax returns may be subject to challenge upon examination by the taxing authorities. Uncertain tax positions are initially recognized in the Consolidated Financial Statements when it is more likely than not the position will not be sustained upon examination by the tax authorities. Such tax positions are both initially and subsequently measured as the largest amount of tax benefit that has a greater than 50% likelihood of being realized upon settlement with the tax authority, assuming full knowledge of the position and all relevant facts. When applicable, the Company recognizes interest accrued related to unrecognized tax benefits and penalties in operating expenses. The Company had no0 accruals for payments of interest and penalties at December 31, 20182021, or 2017.2020.
At December 31, 2018,2021, the Company was not under examination by any tax authority.
Treasury Stock
Treasury stock acquired is recorded at cost. Treasury stock issued is valued based on the “first-in, first-out” method. Gains and losses on issuance are recorded as increases or decreases to additional paid-in capital.
Stock-based employee compensation
During the first quarter of 2010, the Company adopted the First Busey Corporation 2010The 2020 Equity Incentive Plan (“2010 Equity Plan”), which was approved by stockholders at the annual stockholders meeting on May 19, 2010. During2020 Annual Meeting of Stockholders. A description of the second quarter of 2015, the Company adopted an amendment to revise some technical terms to the 20102020 Equity Plan which was approved at the annual stockholders meeting on May 20, 2015, and can be found as Appendix C ofin the Company’s Proxy Statement for the 20152020 Annual Meeting of Stockholders.Stockholders filed on April 9, 2020. The Company grants share-based compensation awards to its employees and members of its board of directors as provided for under2020 Equity Plan replaces the Company’s 2010 Equity Plan. In addition, pursuant to the terms ofIncentive Plan and the First Community 2016 Equity Incentive Plan, which, from time to time, the Company mayused to grant equity awards with respect to First Busey common stock to legacy employees and directors of First Community or its subsidiaries.Community. Under the terms of the 2020 Equity Plan, the Company has granted RSU, DSU and PSU awards.
The Company’s equity incentive plans are designed to encourage ownership of its common stock by its employees and directors, to provide additional incentive for them to promote the success of the Company’s business, and to attract and retain talented personnel. All of the Company’s employees and directors and those of its subsidiaries are eligible to receive awards under the plans. See “Note 16. Share-based Compensation” for further discussion.
The Company calculatesgrants RSU awards to members of management periodically throughout the compensation costyear. Each RSU is equivalent to 1 share of the Company’s common stock. These units have requisite service periods ranging from one to five years, subject to accelerated vesting upon eligible retirement from the Company. Recipients earn quarterly dividend equivalents on their respective units which entitle the recipients to additional units. Therefore, dividends earned each quarter compound based upon the updated unit balances.
The Company grants DSU awards, which are RSU awards with a deferred settlement date, to its non-vested stockdirectors and advisory directors. Each DSU is equivalent to 1 share of the Company’s common stock. DSUs vest over a one-year period following the grant date. These units generally are subject to the same terms as RSUs under the Company’s 2020 Equity Plan, except that, following vesting, settlement occurs within 30 days following the earlier of separation from the board or a change in control of the Company. After vesting and prior to delivery, these units will continue to earn dividend equivalents.
The Company also grants PSU awards (restricted stock units)to members of management periodically throughout the year. Each PSU is equivalent to 1 share of the Company’s common stock. The number of units that ultimately vest will be determined based on the Company’s stock price onachievement of market or other performance goals, subject to accelerated service-based vesting conditions upon eligible retirement from the grant date multiplied by the number of units granted. This cost is recorded over a specified requisite service period (i.e. vesting period) ranging from one to five years. As the restricted stock units cliff vest, the cost is recorded using straight-line amortization. No compensation cost is recognized for unvested awards that are forfeited.Company.
7990
The Company has outstanding stock options assumed from acquisitions.
In 2021, the stockholders of First Busey approved the 2021 ESPP, and since the purchase price under the plan is 85% of the fair market value of a share of common stock (a 15% discount to the market price), the plan is considered to be a compensatory plan under current accounting guidance. Therefore, the entire amount of the discount is recognized in salaries, wages, and employee benefits on the Consolidated Statements of Income.
See “Note 14. Stock-based Compensation” for further discussion.
Segment disclosure
Operating segments are components of a business that (i) engage in business activities from which the component may earn revenues and incur expenses; (ii) hashave operating results that are reviewed regularly by the entity’s chief operating decision maker to make decisions about resources to be allocated to the segments and assess their performance; and (iii) for which discrete financial information is available. The Company’s operations are managed along three3 operating segments consisting of Banking, Remittance ProcessingFirsTech, and Wealth Management. See “Note 21. Operating Segments and Related Information” for further discussion.
Business Combinations
Business combinations are accounted for under ASC Topic 805, BusinessCombinations, using the acquisition method of accounting. The acquisition method of accounting requires an acquirer to recognize the assets acquired and the liabilities assumed at the acquisition date measured at their estimated fair values as of that date. To determine the fair values, the Company may rely onutilize third-party valuations, such as appraisals, or internal valuations based on discounted cash flow analyses or other valuation techniques. Under the acquisition method of accounting, the Company will identify the acquirer and the closing date and apply applicable recognition principles.
Operating results generated from acquired businesses are included with the Company’s results of operations sincestarting from each date of acquisition. Acquisition related costs are costs the Company incurs to effect a business combination. Those costs may include legal, accounting, valuation, other professional or consulting fees, system conversions, and marketing costs. The Company will accountaccounts for acquisition related costs as expenses in the periods in which the costs are incurred and the services are received. Costs that the Company expects, but is not obligated to incur in the future, to effect its plan to exit an activity of an acquiree or to terminate the employment of an acquiree’s employees are not liabilities at the acquisition date. Instead, the Company will recognizerecognizes these costs in its post-combination Consolidated Financial Statements in accordance with other applicable accounting guidance.
Derivative Financial Instruments
The Company utilizes interest rate swap agreements as part of its asset liability management strategy to help manage its interest rate risk position. Additionally, the Company enters into derivative financial instruments, including interest rate lock commitments issued to residential loan customers for loans that will be held for sale, forward sales commitments to sell residential mortgage loans to loan investors, and derivatives to customers for interest rate swaps.swaps with customers and other third parties.
Interest Rate Swaps Designated as Cash Flow Hedges
The Company entered into derivative instruments designated as cash flow hedges. For a derivative instrument that is designated and qualifies as a cash flow hedge, the change in fair value of the derivative instrument is reported as a component of other comprehensive income (loss) and reclassified into earnings in the same period or periods during which the hedged transaction affects earnings. Changes in fair value of components excluded from the assessment of effectiveness are recognized in current earnings.
91
Interest Rate Swaps Not Designated as Hedges
The Company may offer derivative contracts to its customers in connection with their risk management needs. The Company manages the risk associated with these contracts by entering into an equal and offsetting derivative with a third-party dealer. These instruments have certainderivatives generally worked together as an economic interest rate risk characteristics that change in value based uponhedge, but the Company did not designate them for hedge accounting treatment. Consequently, changes in fair value of the capital markets.corresponding derivative financial asset or liability were recorded as either a charge or credit to current earnings during the period in which the changes occurred.
Interest Rate Lock Commitments.Commitments to originate loans held for sale (interest
Interest rate lock commitments), which primarily consistcommitments that meet the definition of commitments to originate fixed-rate residential mortgage loans,derivative financial instruments under ASC Topic 815, Derivatives and Hedging, are recordedcarried at their fair valuevalues in other assets or other liabilities in the Consolidated Financial Statements, with changes in the fair valuevalues of the corresponding derivative financial assets or liabilities recorded as either a charge or credit to mortgage revenuescurrent earnings during the period in which the changes occurred. Such derivative financial instruments are recorded as an adjustment to the carrying value of the resulting loan once funded.
Forward Sales Commitments. As a general rule, theCommitments
The Company economically hedges mortgage loans held for sale and interest rate lock commitments issued to its residential loan customers related to loans that will be held for sale by obtaining corresponding best-efforts forward sales commitments with an investor to sell the loans at an agreed-upon price at the time the interest rate locks are issued to the customers. Forward sales commitments that meet the definition of derivative financial instruments under ASC Topic 815, Derivatives and Hedging,, are carried at their fair valuevalues in other assets or other liabilities in the Consolidated Financial Statements. The Company does not designate theseWhile such forward sales commitments generally served as an economic hedge to mortgage loans held for sale and interest rate lock commitments, the Company did not designate them for hedge accounting treatment, and accordingly, changes in fair value of the corresponding derivative financial asset or liability are recorded as either a charge or credit to mortgage revenue during the period in which the changes occur.
Derivatives to Customers. The Company may offer derivative contracts to its customers in connection with their risk management needs. These derivatives are primarily interest rate swaps. The Company manages the risk associated with these contracts by entering into an equal and offsetting derivative with a third-party dealer. These derivatives are carried at their fair value in other assets or other liabilities in the Consolidated Financial Statements.treatment. Changes in fair value of the corresponding derivative financial asset or liability arewere recorded as either a charge or credit to current earnings during the period in non-interest incomewhich the changes occurred.
Risk Participation Agreements
The Company has entered into a risk participation agreement to manage the credit risk of its derivative position. This agreement transfers counterparty credit risk related to an interest rate swap to another financial institution. In this type of transaction, the Company (purchaser) has a swap agreement with a customer. The Company then enters into a risk participation agreement with a counterparty (seller), under which the counterparty receives a fee to accept a portion of the credit risk. If the customer defaults on the swap contract, the counterparty to the risk participation agreement must reimburse the Company for the counterparty's percentage of the positive fair value of the customer swap as of the default date. If the customer swap has a negative fair value, the counterparty has no reimbursement requirements. If the customer defaults on the swap contract and expense.the counterparty (seller) fulfills its payment obligations under the risk participation agreement, the seller is entitled to a pro rata share of the Company’s claim against the customer under the terms of the swap agreement.
Off-balance sheetOff-balance-sheet arrangements
The Company is a party to credit-related financial instruments with off-balance-sheet risk in the normal course of business to meet the financing needs of its customers. These financial instruments include commitments to extend credit and standby letters of credit. Those instruments involve, to varying degrees, elements of credit and interest rate risk in excess of the amount recognized in the Consolidated Balance Sheets. The Company’s exposure to credit loss is represented by the contractual amount of those commitments.
80
The Company uses the same credit policies in making commitments and conditional obligations as it does for on-balance-sheet instruments.
Commitments to extend credit are agreements to lend to a customer as long as no condition established in the contract has been violated. These commitments are generally at variable interest rates and generally have fixed expiration dates or other termination clauses and may require payment of a fee. The commitments for equity lines of credit may expire without being drawn upon. Therefore, the total commitment amounts do not necessarily represent future cash requirements. These commitments may be secured based on management’s credit evaluation of the borrower.
92
Standby letters of credit are conditional commitments issued by the Company to guarantee the performance of a customer’s obligation to a third-party. Those guarantees are primarily issued to support public and private borrowing arrangements, including bond financing and similar transactions, and primarily have terms of one year or less. The credit risk involved in issuing letters of credit is essentially the same as that involved in extending loan facilities to customers. The Company holds collateral, which may include accounts receivable, inventory, property and equipment, and income producing properties, supporting those commitments if deemed necessary. In the event the customer does not perform in accordance with the terms of the agreement with the third-party, the Company would be required to fund the commitment. The maximum potential amount of future payments the Company could be required to make is represented by the contractual amount shown in the summary above. If the commitment is funded, the Company would be entitled to seek recovery from the customer. As
The Company estimates expected credit losses for off-balance sheet arrangements over the contractual period in which it is exposed to credit risk via a present contractual obligation to extend credit, unless that obligation is unconditionally cancellable by the issuer. To be considered unconditionally cancelable for accounting purposes, the Company must have the ability to, at any time, with or without cause, refuse to extend credit under the commitment. Off-balance-sheet credit exposure segments share the same risk characteristics as portfolio loans. The Company incorporates a probability of funding and utilizes the ACL loss rates to calculate the reserve. The reserve for off-balance-sheet credit exposure is carried on the Consolidated Balance Sheets in other liabilities rather than as a component of the ACL. The reserve for off-balance-sheet credit exposure is adjusted as a provision for off-balance-sheet credit exposure reported as a component of noninterest expense in the accompanying Consolidated Statements of Income. Liabilities recorded as reserves for the Company’s off-balance sheet credit exposure under these commitments was $6.5 million as of December 31, 20182021, and 2017, no amounts were recordedwas $7.3 million as liabilities for the Company’s potential obligations under these guarantees.of December 31, 2020.
Fair value of financial instruments
Fair value of financial instruments areis estimated using relevant market information and other assumptions, as more fully disclosed in “Note 20.18. Fair Value Measurements.”. Fair value estimates involve uncertainties and matters of significant judgementjudgment regarding interest rates, credit risk, prepayments, and other factors, especially in the absence of broad markets for particular items. Changes in assumptions or in market conditions could significantly affect these estimates.
ReclassificationsRevenue
Reclassifications have been made to certain prior year account balances, with no effect on net income or stockholders’ equity, to be consistent with the classifications adopted as of and for the year ended December 31, 2018.
Subsequent events
The Company has evaluated subsequent events for potential recognition and/or disclosure through the date the Consolidated Financial Statements included in this Annual Report on Form 10-K were issued. On January 31, 2019, First Busey completed its acquisition of Banc Ed. See Note 2. Acquisitions for further discussion. On January 29, 2019, First Busey entered into an Amended and Restated Credit Agreement. See Note 11. Borrowings for further discussion. Other than these two items, there were no significant subsequent events for the year ended December 31, 2018 through the filing date of these Consolidated Financials.
Impact of recently adopted accounting standards
ASU 2014-09, “Revenue from Contracts with Customers (Topic 606).” ASU 2014-09ASC 606 outlines a single model for companies to use in accounting for revenue arising from contracts with customers and supersedes most prior revenue recognition guidance, including industry-specific guidance. ASU 2014-09ASC 606 requires that companies recognize revenue based on the value of transferred goods or services as they occur in the contract and establishes additional disclosures. The Company’s revenue is comprised of net interest income, which is explicitly excluded from the scope of ASU 2014-09,ASC 606, and non-interestnoninterest income. The Company has evaluated its non-interestnoninterest income and the nature of its contracts with customers and determined that further disaggregation of revenue beyond what is presented in the accompanying Consolidated Financial Statements wasis not necessary. The Company satisfies its performance obligations on its contracts with customers as services are rendered so there is limited judgment involved in applying TopicASC 606 that affects the determination of the timing and amount of revenue from contracts with customers.
Descriptions of the Company’s primary revenue generating activities that are within TopicASC 606, and are presented in the accompanying Consolidated Statements of Income as components of non-interestnoninterest income, include trustwealth management fees, commission and brokers’ fees, net, remittance processing,payment technology solutions, and fees for customer services. Trust
Wealth Management Fees
Wealth management fees and commission and brokers’ fees, net, represents monthlyrepresent fees due from wealth management customers as consideration for managing the customers' assets. Wealth management and trust services include custody of assets, investment management, fees for trust services, and other fiduciary activities. Also included are fees received from a third partythird-party broker-dealer as part of a revenue sharing agreement for fees earned from customers that the Company refers to the third party. Revenue is recognized when the performance obligation is completed, which is generally monthly. Remittance processing represents transaction-based fees for pay processing solutions such as online bill payments, lockbox and walk-
8193
in payments.Payment Technology Solutions
Payment technology solutions revenue represents transaction-based fees for technology-driven payment solutions primarily for walk-in, lockbox, interactive voice recognition, and online bill payments through the Company’s subsidiary, FirsTech. Revenue is recognized when the performance obligation is completed, which is generally monthly.
Fees for Customer Services
Fees for customer services represents generalconsist of time-based revenue from service fees for monthly account maintenance, item-based revenue from fee-based activity, and activity or transaction-based fees and consists of transaction-based revenue, time-based revenue, or item-basedfee revenue. Revenue is recognized when the performance obligation is completed, which is generally monthly for account maintenance services or when a transaction has been completed. PaymentPayments for such performance obligations are generally received at the time the performance obligations are satisfied.
Reclassifications
Reclassifications have been made to certain prior year account balances, with no effect on net income or stockholders’ equity, to be consistent with the classifications adopted as of and for the year ended December 31, 2021.
Subsequent events
The adoptionCompany has evaluated subsequent events for potential recognition and/or disclosure through the date the Consolidated Financial Statements included in this Annual Report on Form 10-K were issued. There were no significant subsequent events for the year ended December 31, 2021, through the filing date of this guidance on January 1, 2018 did not changethese Consolidated Financial Statements.
Impact of recently adopted accounting standards
ASU 2020-01, “Investments – Equity Securities (Topic 321), Investments – Equity Method and Joint Ventures (Topic 323), and Derivatives and Hedging (Topic 815).” ASU 2020-01 clarifies the method in which non-interest income is recognized therefore a cumulative effect adjustment to retained earnings was not necessary.
interaction between ASU 2016-01, "FinancialFinancial Instruments -– Overall (Subtopic 825-10): Recognition and Measurement of Financial Assets and Financial Liabilities."Liabilities and the ASU on equity method investments. ASU 2016-01 requires:provides companies with an alternative to measure certain equity investments, with certain exceptions, to be measured atsecurities without a readily determinable fair value with changes in fair value recognized in net income; to useat cost, minus impairment, if any, unless an observable transaction for an identical or similar security occurs. ASU 2020-01 clarifies that for purposes of applying the exit price notion when measuring the fair value of financial instruments for disclosure purposes; separate presentation of financial assets and financial liabilities byTopic 321 measurement category and form of financial assets; eliminating the requirement to disclose the method and significant assumptions used to estimate the fair value for financial instruments measured at amortized cost on the Balance Sheet; and requiresalternative, an entity should consider observable transactions that require it to present separately in other comprehensive income (loss)either apply or discontinue the portionequity method of accounting under Topic 323, immediately before applying or upon discontinuing the total change in fair value ofequity method. In addition, the new ASU provides direction that a liability resulting fromcompany should not consider whether the change inunderlying securities would be accounted for under the instrument-specific credit risk whenequity method or the fair value option has been electedwhen it is determining the accounting for the liability. ASU 2016-01 was effective on January 1, 2018certain forward contracts and the adoption ofpurchased options, upon either settlement or exercise. The amendments in this guidance resulted in separate classification of equity securities previously included in available for sale securities on the Consolidated Financial Statements. There was no cumulative effect adjustment recorded with the adoption of this guidance.
ASU 2018-02, "Income Statement-Reporting Comprehensive Income (Topic 220): Reclassification of Certain Tax Effects from Accumulated Other Comprehensive Income." ASU 2018-02 allows companies to make a one-time reclassification from accumulated other comprehensive income (loss) to retained earnings for the effects of remeasuring deferred tax liabilities and assets originally recorded in other comprehensive income as a result of the change in the federal tax rate by the TCJA. The Company adopted this guidance in the first quarter of 2018 with no impact on total stockholders' equity or net income.
Recently issued accounting standards
ASU 2016-02, "Leases (Topic 842)." ASU 2016-02 intends to increase transparency and comparability among organizations by recognizing all lease transactions (with terms in excess of 12 months) on the Consolidated Balance Sheet as a lease liability and a right-of-use asset. The guidance also requires qualitative and quantitative disclosures of the amount, timing and uncertainty of cash flows arising from leases. This guidance is effective for annual reporting periods beginning after December 15, 2018, including interim periods within those fiscal years. In July 2018, ASU 2018-11, "Leases (Topic 842): Targeted Improvements" was issued to allow companies to choose to recognize the cumulative effect of applying the new standard to leased assets and liabilities as an adjustment to the opening balance of retained earnings rather than recasting prior year results upon adoption of the standard. The Company has calculated the transition impact of the guidance on its Consolidated Financial Statements and related disclosures. Where the Company is a lessee, the Company will record approximately $8.1 million initial increase in assets and liabilities to reflect the right of use asset and the lease liability.
ASU 2016-13, "Financial Instruments - Credit Losses (Topic 326): Measurement of Credit Losses on Financial Instruments." ASU 2016-13 implements a change from the current impaired loss model to an expected credit loss model over the life of an instrument, including loans and securities held to maturity. The expected credit loss model is expected to result in earlier recognition of losses. ASU 2016-13 isupdate become effective for fiscal years beginning after December 15, 2019 including interim periods with those years. The Company has developed2020, and is executing a project plan to implement this guidance. The project plan includes an assessment of data, development of CECL methodologies, model validation, and parallel runs to assess the impact of CECL calculations on its Consolidated Financial Statements and evaluation of related disclosures.
ASU 2017-04, "Intangibles - Goodwill and Other (Topic 350): Simplifying the Test for Goodwill Impairment." ASU 2017-04 is intended to simplify goodwill impairment testing by eliminating the second step of the analysis which required an entity to determine the fair value of its assets and liabilities as of the impairment test date. Instead, ASU 2017-04 requires entities to compare the fair value of a reporting unit with its carrying amount and recognize an impairment charge for any amount by which the carrying amount exceeds the reporting unit's fair value, to the extent that the loss recognized does not exceed the amount of goodwill allocated to that reporting unit. This guidance is effective for annual and interim periods beginning after December 15, 2019, with early adoption permitted. The Company does not expect this guidance to have a material impact on its Consolidated Financial Statements.
ASU 2017-08, "Receivables - Nonrefundable Fees and Other Costs (Subtopic 310-20), Premium Amortization on Purchased Callable Debt Securities." ASU 2017-08 shortens the amortization period for certain callable debt securities held at a premium, requiring the premium to be amortized to the earliest call date. ASU 2017-08 does not require an accounting change for securities held at a discount; the discount continues to be amortized to maturity. This guidance is effective for annual reporting periods beginning after December 15, 2018, including interim periods within those fiscal years. The Company doesAdoption of this standard did not expect this guidance to have a material impact on its Consolidated Financial Statements.
82
ASU 2017-12, "Derivatives and Hedging (Topic 815): Targeted Improvements to Accounting for Hedging Activities." ASU 2017-12 amends Topic 815 to reduce the cost and complexity of applying hedge accounting and expands the types of relationships that qualify for hedge accounting. The guidance eliminates the requirement to separately measure and report hedge ineffectiveness, requires all items that affect earnings to be presented in the same income statement line as the hedged item, provides for applying hedge accounting to additional hedging strategies, provides for new approaches to measuring the hedged item in fair value hedges of interest rate risk, and eases the requirements for effective testing and hedge documentation. This guidance is effective for annual reporting periods beginning after December 15, 2018, including interim periods within those fiscal years. The Company does not expect this guidance to have a material impact on its Consolidated Financial Statements.
ASU 2018-07, "Compensation-Stock Compensation (Topic 718): Improvements to Nonemployee Share-Based Payment Accounting." ASU 2018-07 expands the scope of Topic 718 to include share-based payment transactions for acquiring goods and services from nonemployees. This guidance is effective for annual reporting periods beginning after December 15, 2018, including interim periods within those fiscal years. The Company does not expect this guidance to have a material impact on its Consolidated Financial Statements.
ASU 2018-13, "Fair Value Measurement (Topic 820): Disclosure Framework-Changes to the Disclosure Requirements for Fair Value Measurement." ASU 2018-13 removes, modifies, and adds certain disclosure requirements on fair value measurements. This guidance is effective for annual reporting periods beginning after December 15, 2019, including interim periods within those fiscal years, with early adoption permitted. The guidance has no impact on the Company’s Consolidated Financial Statements and is not expected to have a material impact on the Company’s Consolidated Financial Statements.
ASU 2021-06 “Presentation of Financial Statements (Topic 205), Financial Services—Depository and Lending (Topic 942), and Financial Services—Investment Companies (Topic 946): Amendments to SEC Paragraphs Pursuant to SEC Final Rule Releases No. 33-10786, Amendments to Financial Disclosures about Acquired and Disposed Businesses, and No. 33-10835, Update of Statistical Disclosures for Bank and Savings and Loan Registrants” amends certain disclosure requirements for banks and bank holding companies, as well as savings and loan organizations, by 1) simplifying loan category disclosure requirements, 2) requiring separate disclosure of the amounts of total loans, related allowance for losses, and unearned income, and 3) when a threshold is met, requires disclosure of the aggregate amount of loans to directors, executive officers, or principal holders of equity securities, or to any associate of such persons, including an explanation of changes in the amount of such loans, as well as disclosure of such loans that are past due, nonaccrual, or TDRs. This update was effective upon issuance on August 9, 2021, and applies prospectively. Adoption of this standard did not have a material impact on our results of operations or our consolidated financial statements.
94
Recently issued accounting standards
ASU 2021-04 “Earnings Per Share (Topic 260), Debt—Modifications and Extinguishments (Subtopic 470-50), Compensation—Stock Compensation (Topic 718), and Derivatives and Hedging—Contracts in Entity’s Own Equity (Subtopic 815-40): Issuer’s Accounting for Certain Modifications or Exchanges of Freestanding Equity-Classified Written Call Options” clarifies how an issuer should account for modifications or exchanges of equity-classified written call options (i.e. a warrant to purchase the issuer’s common stock). This accounting standard requires the issuer to treat a modification of an equity-classified warrant that does not cause the warrant to become liability-classified as an exchange of the original warrant for a new warrant. This guidance applies whether the modification is structured as an amendment to the terms and conditions of the warrant or as termination of the original warrant and issuance of a new warrant. This guidance is effective beginning January 1, 2022, and will be applied on a prospective basis. Adoption of this standard will not have a material impact on our financial position or results of operations.
ASU 2021-05 “Leases (Topic 842): Lessors—Certain Leases with Variable Lease Payments” amends the lessor’s classification of certain leases under ASC 842. Under this updated guidance, leases that would otherwise be classified as a sales-type or direct financing lease must be classified by a lessor as an operating lease when the following conditions are met: 1) the contract includes variable lease payments that do not depend on an index or rate and 2) classification as a sales-type or direct financing lease would result in recognition of a selling loss at lease commencement. This guidance is effective beginning January 1, 2022, and will be applied on a prospective basis. Adoption of this standard will not have a material impact on our financial position or results of operations.
ASU 2021-08 “Business Combinations (Topic 805): Accounting for Contract Assets and Contract Liabilities from Contracts with Customers” requires measurement and recognition in accordance with Topic 606 for contract assets and contract liabilities acquired in a business combination. This update is effective beginning January 1, 2023, and may be adopted early. This standard applies prospectively to all business combinations that occur on or after the date it is adopted and, if applicable, retrospectively to all business combinations for which the acquisition date occurs on or after the beginning of the fiscal year that includes the interim period of early application. We have not yet selected an adoption date and we are currently evaluating the effect on our financial position and results of operations.
ASU 2021-10 “Government Assistance (Topic 832): Disclosures by Business Entities about Government Assistance” establishes disclosure requirements for transactions with a government that have been accounted for by analogizing to a grant or contribution accounting model. Disclosures required disclosures.under this standard include 1) the types of transactions, 2) the accounting for those transactions, and 3) the effect of those transactions on the consolidated financial statements. This update is effective for annual periods beginning January 1, 2022, and applies prospectively to all transactions within the scope of the amendments that are reflected in financial statements at the date of initial application and new transactions that are entered into after the date of initial application. Adoption of this standard will not have a material impact on our financial position or results of operations.
Note 2. Acquisitions
Pulaski FinancialCummins-American Corp.
On April 30, 2016, First BuseyEffective May 31, 2021, the Company completed its acquisition of Pulaski, which was headquartered in St. Louis, Missouri. Pulaski Bank, which was Pulaski’s wholly-owned bank subsidiary prior toCAC, the acquisition, offered a full line of retail andholding company for GSB. The partnership has enhanced the Company’s existing deposit, commercial banking, products through thirteen full-service banking centersand wealth management presence in the St. Louis metropolitan area. The operatingChicago-Naperville-Elgin, IL-IN-WI Metropolitan Statistical Area. GSB’s results of Pulaski areoperations were included within the Company’s results of operations since the date of acquisition.beginning June 1, 2021. First Busey operated Pulaski BankGSB as a separate banking subsidiary from May 1, 2016 until November 4, 2016,August 14, 2021, when it was merged with and into Busey Bank. At that time, Pulaski Bank’sall GSB banking centers became banking centersbranches of Busey Bank.
95
Under the terms of the definitive agreement, at the effective time of the acquisition, each share of PulaskiCAC common stock issued and outstanding as of the effective date was converted into the right to receive 0.79444.4783 shares of First Busey common stock and $14,173.96 in cash, which reflects adjustments made to the cash consideration in lieuaccordance with the terms of fractional shares.the definitive agreement. The marketfair value of the 9.4 million sharescommon stock of First Busey issued as part of the consideration paid to the holders of CAC common stock issued atwas determined on the effective timebasis of the acquisition was approximately $193.0 million based onclosing price of First Busey’s closing stock price of $20.44common shares on April 29, 2016. In addition, all ofMay 28, 2021, the options to purchase shares of Pulaski common stock that were outstanding atlast trading day immediately preceding the acquisition date were converted into optionsof May 31, 2021. As additional consideration provided to purchase sharesCAC’s shareholders in the merger, CAC paid a special dividend to its shareholders in the amount of First Busey$60.0 million, or $12,087.58 per share of CAC common stock, adjusted for the 0.79 exchange ratio.on May 28, 2021.
This transaction was accounted for using the acquisition method of accounting and, accordingly, assets acquired, liabilities assumed, and consideration exchanged were recorded at their estimated fair values on the date of acquisition. The total consideration paid, which was used to determine the amount of goodwill resulting from the transaction, also included the fair value of outstanding Pulaski stock options that were converted into options to purchase common shares of First Busey. As the total consideration paid for Pulaski exceeded the net assets acquired, goodwill of $77.3 million was recorded as a result of the acquisition. Goodwill recorded in the transaction, which reflected the synergies expected from the acquisition and the enhanced revenue opportunities from the Company’s broader service capabilities in the St. Louis market, is not tax deductible, and was assigned to the Banking operating segment.
First Busey did not incur any expenses for the twelve months ended December 31, 2018 related to the acquisition of Pulaski and incurred an immaterial amount of expenses related to the acquisition of Pulaski for the twelve months ended December 31, 2017. First Busey incurred $10.0 million in pre-tax expenses related to the acquisition of Pulaski for the twelve months ended December 31, 2016, including professional and legal fees of $1.2 million to directly consummate the acquisition, all of which are reported as a component of non-interest expense in the accompanying Consolidated Financial Statements. The remainder of the expenses primarily related to data processing conversion expenses and restructuring expenses.
83
The following table presents the fair value of Pulaski assets acquired and liabilities assumed as of April 30, 2016 (dollars in thousands):
|
|
|
|
|
| As Recorded by | |
|
| First Busey | |
Assets acquired: |
|
|
|
Cash and cash equivalents |
| $ | 25,580 |
Securities |
|
| 48,000 |
Loans held for sale |
|
| 184,856 |
Portfolio loans |
|
| 1,229,461 |
Premises and equipment |
|
| 16,569 |
OREO |
|
| 2,488 |
Goodwill |
|
| — |
Other intangible assets |
|
| 15,468 |
Other assets |
|
| 70,243 |
Total assets acquired |
|
| 1,592,665 |
|
|
|
|
Liabilities assumed: |
|
|
|
Deposits |
|
| 1,228,008 |
Other borrowings |
|
| 206,746 |
Trust preferred securities |
|
| 15,784 |
Other liabilities |
|
| 23,982 |
Total liabilities assumed |
|
| 1,474,520 |
|
|
|
|
Net assets acquired |
| $ | 118,145 |
|
|
|
|
Consideration paid: |
|
|
|
Cash |
| $ | 5 |
Common stock |
|
| 192,990 |
Fair value of stock options assumed |
|
| 2,454 |
Total consideration paid |
| $ | 195,449 |
|
|
|
|
Goodwill |
| $ | 77,304 |
The loans acquired in this transaction were recorded at fair value with no carryover of any existing allowance for loan losses. Loans that were not deemed to be credit-impaired at the acquisition date were accounted for under FASB ASC 310-20, Receivables-Nonrefundable Fees and Other Costs, and were subsequently considered as part of the Company’s determination of the adequacy of the allowance for loan losses. PCI loans, which are loans with evidence of credit quality deterioration at the date of acquisition, were accounted for under ASC 310-30, Receivables – Loans and Debt Securities Acquired with Deteriorated Credit Quality. As of the acquisition date, the aggregate principal outstanding and aggregate fair value of the acquired performing loans, including loans held for sale, both rounded to $1.4 billion. The difference between the aggregate principal balance outstanding and aggregate fair value of $16.6 million is expected to be accreted over the estimated remaining life of the respective loans in a manner that approximates the level yield method. As of the acquisition date, the aggregate principal balance outstanding of PCI loans totaled $21.2 million and the aggregate fair value of PCI loans totaled $9.7 million, which became such loans’ new carrying value. At December 31, 2018, PCI loans related to this transaction outstanding were immaterial. Material activity includes PCI loans with a carrying value of $6.2 million sold to outside parties in the third quarter of 2016 and a commercial PCI loan with a carrying value of $1.6 million collected in the fourth quarter of 2016. For PCI loans, the difference between contractually required payments at the acquisition date and the cash flow expected to be collected is the non-accretable difference. The excess of cash flows expected at acquisition over the fair value is the accretable yield. The accretable yield, as of the acquisition date, of $0.3 million on PCI loans was expected to be recognized over the estimated remaining life of the respective loans in a manner that approximates the level yield method; however, the majority of the accretable yield was recognized in 2016 as a result of the third quarter loan sale and fourth quarter collection.
The following table provides the unaudited pro forma information for the results of operations for the twelve months ended December 31, 2016, as if the acquisition had occurred January 1, 2016. The pro forma results combine the historical results of Pulaski in the Company's Consolidated Statements of Income, adjusted for the impact of the application of the acquisition method of accounting including loan discount accretion, intangible assets amortization, and deposit and trust preferred securities premium accretion, net of taxes. The pro forma results have been prepared for comparative purposes only and are not necessarily indicative of the results that would have been obtained had the acquisition actually occurred on January 1, 2016. No assumptions have been applied to the pro
84
forma results of operations regarding possible revenue enhancements, expense efficiencies or asset dispositions. Only the acquisition related expenses that had been recognized are included in net income in the table below (dollars in thousands, except per share data):
|
|
|
|
|
| Pro Forma | |
|
| Twelve Months Ended | |
|
| December 31, 2016 | |
Total revenues (net interest income plus non-interest income) |
| $ | 245,861 |
Net income |
|
| 46,276 |
Diluted earnings per common share |
|
| 1.20 |
First Community Financial Partners, Inc.
On July 2, 2017, the Company completed its acquisition of First Community, which was headquartered in Joliet, Illinois. Founded in 2004, First Community operated nine banking centers in Will, DuPage and Grundy Counties, which encompass portions of the southwestern suburbs of Chicago. The operating results of First Community are included with the Company’s results of operations since the date of acquisition. First Busey operated First Community Financial Bank as a separate subsidiary from July 3, 2017 until November 3, 2017, when it was merged with and into Busey Bank. At that time, First Community Financial Bank’s banking centers became banking centers of Busey Bank.
Under the terms of the merger agreement with First Community, at the effective time of the acquisition, each share of First Community common stock issued and outstanding was converted into the right to receive 0.396 shares of the Company’s common stock, cash in lieu of fractional shares and $1.35 cash consideration per share. The market value of the 7.2 million shares of First Busey common stock issued at the effective time of the acquisition was approximately $211.1 million based on First Busey’s closing stock price of $29.32 on June 30, 2017. In addition, certain options to purchase shares of First Community common stock that were outstanding at the acquisition date were converted into options to purchase shares of First Busey common stock, adjusted for the 0.44 option exchange ratio, and the fair value was included in the purchase price. The purchase price included cash payouts relating to unconverted stock options and restricted stock units outstanding as of the acquisition date.
This transaction was accounted for using the acquisition method of accounting and, accordingly, assets acquired, liabilities assumed, and consideration exchanged were recorded at their estimated fair values on the date of acquisition. The total consideration paid, which was used to determine the amount of goodwill resulting from the transaction, also included the fair value of outstanding First Community stock options that were converted into options to purchase common shares of First Busey and cash paid out relating to stock options and restricted stock units not converted. As the total consideration paid for First Community exceeded the net assets acquired, goodwill of $116.0 million was recorded as a result of the acquisition. Goodwill recorded in the transaction, which reflected the synergies expected from the acquisition and the greater revenue opportunities from the Company’s broader service capabilities in the Chicagoland area, is not tax deductible, and was assigned to the Banking operating segment.
First Busey incurred $0.1 million in pre-tax expenses related to the acquisition of First Community for the twelve months ended December 31, 2018, primarily for professional and legal fees. First Busey incurred $4.5 million in pre-tax expenses related to the acquisition of First Community for the twelve months ended December 31, 2017, including professional and legal fees of $1.6 million to directly consummate the acquisition, all of which were reported as a component of non-interest expense in the accompanying Consolidated Financial Statements. The remainder of the expenses primarily related to data processing conversion expenses and restructuring expenses.
85
The following table presents the fair value of First Community assets acquired and liabilities assumed as of July 2, 2017 (dollars in thousands):
|
|
|
|
|
| As Recorded by | |
|
| First Busey | |
Assets acquired: |
|
|
|
Cash and cash equivalents |
| $ | 60,686 |
Securities |
|
| 165,843 |
Loans held for sale |
|
| 905 |
Portfolio loans |
|
| 1,096,583 |
Premises and equipment |
|
| 18,094 |
OREO |
|
| 722 |
Other intangible assets |
|
| 13,979 |
Other assets |
|
| 41,755 |
Total assets acquired |
|
| 1,398,567 |
|
|
|
|
Liabilities assumed: |
|
|
|
Deposits |
|
| 1,134,355 |
Other borrowings |
|
| 125,751 |
Other liabilities |
|
| 11,862 |
Total liabilities assumed |
|
| 1,271,968 |
|
|
|
|
Net assets acquired |
| $ | 126,599 |
|
|
|
|
Consideration paid: |
|
|
|
Cash |
| $ | 24,557 |
Cash payout of options and restricted stock units |
|
| 6,182 |
Common stock |
|
| 211,120 |
Fair value of stock options assumed |
|
| 722 |
Total consideration paid |
| $ | 242,581 |
|
|
|
|
Goodwill |
| $ | 115,982 |
The loans acquired in this transaction were recorded at fair value with no carryover of any existing allowance for loan losses. Loans that were not deemed to be credit-impaired at the acquisition date were accounted for under FASB ASC 310-20, Receivables-Nonrefundable Fees and Other Costs, and were subsequently considered as part of the Company’s determination of the adequacy of the allowance for loan losses. PCI loans were accounted for under ASC 310-30, Receivables – Loans and Debt Securities Acquired with Deteriorated Credit Quality. As of the acquisition date, the aggregate principal outstanding and aggregate fair value of the acquired performing loans, including loans held for sale, was $1.1 billion. The difference between the aggregate principal balance outstanding and aggregate fair value of $14.4 million is expected to be accreted over the estimated remaining life of the respective loans in a manner that approximates the level yield method. As of the acquisition date, the aggregate principal balance outstanding of PCI loans totaled $17.9 million and the aggregate fair value of PCI loans totaled $12.5 million, which became such loans’ new carrying value. At December 31, 2018, PCI loans related to this transaction with a carrying value of $2.6 million were outstanding, with the decrease relating to collections and a loan sale. For PCI loans, the difference between contractually required payments at the acquisition date and the cash flow expected to be collected is the non-accretable difference. The excess of cash flows expected at acquisition over the fair value is the accretable yield. The accretable yield, as of the acquisition date, of $0.6 million on PCI loans was expected to be recognized over the estimated remaining life of the respective loans in a manner that approximates the level yield method; however, $0.2 million was recognized in 2017 as a result of collections of PCI loan balances so the majority of the balance was recognized by December 2018.
The following table provides the unaudited pro forma information for the results of operations for the twelve months ended December 31, 2017 and 2016, as if the acquisition had occurred January 1, 2016. The pro forma results combine the historical results of First Community into the Company's Consolidated Statements of Income, including the impact of purchase accounting adjustments including loan discount accretion, intangible assets amortization, deposit accretion and premises accretion, net of taxes. The 2016 pro forma results reflect Pulaski pro forma information as well, which is shown separately above. The pro forma results have been prepared for comparative purposes only and are not necessarily indicative of the results that would have been obtained had the acquisition actually occurred on January 1, 2016. No assumptions have been applied to the pro forma results of operations regarding
86
possible revenue enhancements, expense efficiencies or asset dispositions. Only the merger related expenses that have been recognized are included in net income in the table below (dollars in thousands, except per share data):
|
|
|
|
|
|
|
|
| Pro Forma | ||||
|
| Twelve Months Ended December 31, | ||||
|
| 2017 |
| 2016 | ||
Total revenues (net interest income plus non-interest income) |
| $ | 316,417 |
| $ | 293,190 |
Net income |
|
| 67,413 |
|
| 59,326 |
Diluted earnings per common share |
|
| 1.47 |
|
| 1.29 |
Mid Illinois Bancorp, Inc.
On October 1, 2017, the Company completed its acquisition of Mid Illinois and its wholly owned bank subsidiary South Side Bank, under which each share of Mid Illinois common stock issued and outstanding as of the effective time was converted into, at the election of the stockholder the right to receive, either (i) $227.94 in cash, (ii) 7.5149 shares of the Company’s common stock, or (iii) mixed consideration of $68.38 in cash and 5.2604 shares of the Company’s common stock, subject to certain adjustments and proration. In the aggregate, total consideration consisted of 70% stock and 30% cash. Mid Illinois stockholders electing the cash consideration option were subject to proration under the terms of the merger agreement with Mid Illinois and ultimately received a mixture of cash and stock consideration. First Busey operated South Side Bank as a separate bank subsidiary from October 2, 2017 until March 16, 2018, when it was merged with and into Busey Bank. At that time, South Side Bank’s banking centers became banking centers of Busey Bank.
This transaction was accounted for using the acquisition method of accounting and, accordingly, assets acquired, liabilities assumed, and consideration exchanged were recorded at their estimated fair values on the date of acquisition. An adjustment to the fair value was recorded in the first quarter of 2018 as additional information became available. As the total consideration paid for Mid Illinois exceeded the net assets acquired, goodwill of $48.9 million was recorded as a result of the acquisition. Goodwill recorded in the transaction, which reflected the synergies expected from the acquisition and expansion within the greater Peoria area, is not tax deductible, and was assigned to the Banking operating segment.
First Busey incurred $3.1 million of pre-tax expenses related to the acquisition of Mid Illinois for the twelve months ended December 31, 2018, primarily for salaries, wages and employee benefits expense, professional and legal fees and data conversion expenses, all of which are reported as a component of non-interest expense in the accompanying Consolidated Financial Statements. First Busey incurred $2.5 million in pre-tax expenses related to the acquisition of Mid Illinois for the twelve months ended December 31, 2017, including professional and legal fees of $1.3 million to directly consummate the acquisition, all of which were reported as a component of non-interest expense in the accompanying Consolidated Financial Statements.
87
The following table presents the fair value of Mid Illinois assets acquired and liabilities assumed as of October 1, 2017 (dollars in thousands):
|
|
|
|
|
| As Recorded by | |
|
| First Busey | |
Assets acquired: |
|
|
|
Cash and cash equivalents |
| $ | 39,443 |
Securities |
|
| 208,003 |
Loans held for sale |
|
| 5,031 |
Portfolio loans |
|
| 356,651 |
Premises and equipment |
|
| 16,551 |
Other intangible assets |
|
| 11,531 |
Other assets |
|
| 29,564 |
Total assets acquired |
|
| 666,774 |
|
|
|
|
Liabilities assumed: |
|
|
|
Deposits |
|
| 505,917 |
Other borrowings |
|
| 61,040 |
Other liabilities |
|
| 10,497 |
Total liabilities assumed |
|
| 577,454 |
|
|
|
|
Net assets acquired |
| $ | 89,320 |
|
|
|
|
Consideration paid: |
|
|
|
Cash |
| $ | 40,507 |
Common stock |
|
| 97,702 |
Total consideration paid |
| $ | 138,209 |
|
|
|
|
Goodwill |
| $ | 48,889 |
The loans acquired in this transaction were recorded at fair value with no carryover of any existing allowance for loan losses. Loans that were not deemed to be credit-impaired at the acquisition date were accounted for under FASB ASC 310-20, Receivables-Nonrefundable Fees and Other Costs, and were subsequently considered as part of the Company’s determination of the adequacy of the allowance for loan losses. PCI loans were accounted for under ASC 310-30, Receivables – Loans and Debt Securities Acquired with Deteriorated Credit Quality. As of the acquisition date, the aggregate principal outstanding was $362.4 million and aggregate fair value of the acquired performing loans was $357.0 million, including loans held for sale. The difference between the aggregate principal balance outstanding and aggregate fair value of $5.4 million is expected to be accreted over the estimated remaining life of the respective loans in a manner that approximates the level yield method. As of the acquisition date, the aggregate principal balance outstanding of PCI loans totaled $7.6 million and the aggregate fair value of PCI loans totaled $4.7 million, which became such loans’ new carrying value. At December 31, 2018, PCI loans related to this transaction with a carrying value of $0.1 million were outstanding, with the decrease primarily relating to loan sales. For PCI loans, the difference between contractually required payments at the acquisition date and the cash flow expected to be collected is the non-accretable difference. The excess of cash flows expected at acquisition over the fair value is the accretable yield. The accretable yield, as of the acquisition date, of $0.1 million on PCI loans was expected to be recognized over the estimated remaining life of the respective loans in a manner that approximates the level yield method; however, the full amount was recognized in 2018 due to loan sales of PCI loans.
The Company held $2.6 million of banking center real estate in the Peoria market at December 31, 2018 that was no longer in use and was classified as bank properties held for sale. These properties, recorded at the lower of amortized cost or estimated fair value less estimated cost to sell, were recorded in the amount of $1.8 million and were included in premises and equipment, net. The Company recognized an impairment charge of $0.8 million in the second quarter of 2018 related to these bank properties held for sale.
The Banc Ed Corp.
On August 21, 2018, the Company entered into Merger Agreement with Banc Ed, pursuant to which Banc Ed would merge into First Busey, with First Busey as the surviving corporation. TheBANK, Banc Ed’s wholly-owned bank subsidiary, will be merged with and into First Busey’s bank subsidiary, Busey Bank, at a date following the completion of the holding company merger. At the time of the bank merger, TheBANK’s banking offices will become branches of Busey Bank. The holding company merger was completed on January 31, 2019 and is a subsequent event to this Annual Report on Form 10-K. The operating results of Banc Ed are not included in the Company’s Consolidated Financial Statements included herein. TheBANK was founded in 1868 and was a privately held
88
commercial bank headquartered in Edwardsville, Illinois. As of December 31, 2018, Banc Ed had total consolidated assets of $1.8 billion, gross loans of $902.1 million and total deposits of $1.5 billion. The Company expects the acquisition of Banc Ed to enhance First Busey’s existing deposit, commercial banking and wealth management presence in the greater St. Louis Missouri-Illinois Metropolitan Statistical Area.
Under the terms of the Merger Agreement with Banc Ed, at the effective time of the acquisition, each share of Banc Ed common stock issued and outstanding was converted into the right to receive 8.2067 shares of the Company’s common stock, cash in lieu of fractional shares and $111.53 cash consideration per share. The market value of the 6.7 million shares of First Busey common stock issued at the effective time of the acquisition was approximately $166.5 million based on First Busey’s closing stock price of $24.76 on January 31, 2019.
This transaction will be accounted for using the acquisition method of accounting and, accordingly, assets acquired, liabilities assumed, and consideration exchanged will be recorded at estimated fair values on the date of acquisition. Fair values are considered provisional until finalsubject to refinement for up to one year after the closing date as additional information regarding the closing date fair values are determined orbecomes available. For the measurement period has passed, but no later than one year from the acquisition date. Reviewsended December 31, 2021, $0.4 million of third party valuations are still being performed by Management. Therefore amounts are subject to change and could change materially from the provisional amounts disclosed below. fair value adjustments were recorded as more information became available regarding unrecorded liabilities. The Company does not expect any further adjustments will be necessary.
As the total consideration paid for Banc EdCAC exceeded the estimated fair value of net assets acquired, preliminary goodwill of $48.5$6.3 million is estimated to bewas recorded as a result of the acquisition. The amount of goodwill recognized as a result of this transaction is expected to be fully tax deductible for federal income tax purposes in accordance with the Company’s election pursuant to Section 338(h)(10) of the Internal Revenue Code. Goodwill recorded for this transaction which reflects the synergies expected from the acquisition and expansion within the revenue opportunities from the Company’s increased presence in the greater St. Louis Missouri-IllinoisChicago-Naperville-Elgin, IL-IN-WI Metropolitan Statistical Area, is not tax deductible, and will bewas assigned to the Banking and Wealth Management operating segments.segment.
First Busey incurred $0.4$13.6 million in pre-tax expenses related to the acquisition of Banc EdCAC for the twelve monthsyear ended December 31, 2018,2021, primarily for compensation expense, data processing expense, and professional and legal fees, all of which are reported as a componentcomponents of non-interestnoninterest expense in the accompanying Consolidated Financial Statements.Statements of Income.
96
The following table presentsFIRST BUSEY CORPORATION
NOTES TO CONSOLIDATED FINANCIAL STATEMENTS
Estimated fair values of the estimated fair value of Banc Ed assets acquired and liabilities assumed, as well as the fair value of January 31, 2019 consideration transferred, were as follows (dollars in thousands):
|
|
| ||||
|
| Estimated by | ||||
|
| First Busey | ||||
Assets acquired: |
|
|
| |||
| | | | |||
|
| CAC | ||||
|
| May 31, 2021 | ||||
Assets acquired | |
| | |||
Cash and cash equivalents |
| $ | 42,013 | | $ | 298,637 |
Securities |
|
| 692,692 | |
| 702,367 |
Loans held for sale |
|
| 2,157 | |||
Portfolio loans |
|
| 870,838 | |||
Portfolio loans, net of ACL | |
| 430,470 | |||
Premises and equipment |
|
| 32,203 | |
| 17,034 |
Other intangible assets |
|
| 28,047 | | | 17,340 |
Mortgage servicing rights |
|
| 6,946 | |
| 629 |
Other assets |
|
| 62,342 | |
| 8,176 |
Total assets acquired |
|
| 1,737,238 | |
| 1,474,653 |
|
|
|
| |||
Liabilities assumed: |
|
|
| |||
| | | | |||
Liabilities assumed | | | | |||
Deposits |
|
| 1,439,203 | |
| 1,315,671 |
Other borrowings |
|
| 63,439 | |
| 16,651 |
Other liabilities |
|
| 25,214 | |
| 19,205 |
Total liabilities assumed |
|
| 1,527,856 | |
| 1,351,527 |
|
|
|
| |||
| | | | |||
Net assets acquired |
| $ | 209,382 | | $ | 123,126 |
|
|
|
| |||
| | | | |||
Consideration paid: |
|
|
| | | |
Cash |
| $ | 91,400 | | $ | 70,358 |
Common stock |
|
| 166,515 | |
| 59,105 |
Total consideration paid |
| $ | 257,915 | | $ | 129,463 |
|
|
|
| |||
| | | | |||
Goodwill |
| $ | 48,533 | | $ | 6,337 |
The fair value of PCD financial assets was $60.5 million on the date of acquisition. Gross contractual amounts receivable relating to the PCD financial assets was $65.2 million. The Company estimated, on the date of acquisition, that $4.2 million of the contractual cash flows specific to the PCD financial assets will not be collected.
89
Note 3. Debt Securities
The table below provides the amortized cost, unrealized gains and losses, and fair values of debt securities, summarized by major category (dollars in thousands):
|
|
|
|
|
|
|
|
|
|
|
|
| ||||||||||||
|
|
|
|
| Gross |
| Gross |
|
|
| ||||||||||||||
|
| Amortized |
| Unrealized |
| Unrealized |
| Fair | ||||||||||||||||
December 31, 2018: |
| Cost |
| Gains |
| Losses |
| Value | ||||||||||||||||
Available for sale |
|
|
|
|
|
|
|
|
|
|
|
| ||||||||||||
| | | | | | | | | | | | | ||||||||||||
| | As of December 31, 2021 | ||||||||||||||||||||||
| | Amortized | | Unrealized | | Fair | ||||||||||||||||||
|
| Cost |
| Gross Gains |
| Gross Losses |
| Value | ||||||||||||||||
Debt securities available for sale | | | | | | | | | | | | | ||||||||||||
U.S. Treasury securities |
| $ | 25,824 |
| $ | 1 |
| $ | (414) |
| $ | 25,411 | | $ | 166,768 | | $ | 41 | | $ | (1,047) | | $ | 165,762 |
Obligations of U.S. government corporations and agencies |
|
| 53,096 |
|
| 7 |
|
| (761) |
|
| 52,342 | |
| 37,579 | |
| 891 | |
| — | |
| 38,470 |
Obligations of states and political subdivisions |
|
| 171,131 |
|
| 484 |
|
| (1,571) |
|
| 170,044 | |
| 300,602 | |
| 7,760 | |
| (1,493) | |
| 306,869 |
Asset-backed securities | | | 492,055 | | | 295 | | | (164) | | | 492,186 | ||||||||||||
Commercial mortgage-backed securities |
|
| 2,003 |
|
| — |
|
| (61) |
|
| 1,942 | | | 625,339 | | | 3,425 | | | (13,766) | | | 614,998 |
Residential mortgage-backed securities |
|
| 322,646 |
|
| 245 |
|
| (7,143) |
|
| 315,748 | |
| 2,095,104 | |
| 8,889 | |
| (34,680) | |
| 2,069,313 |
Corporate debt securities |
|
| 132,513 |
|
| 61 |
|
| (376) |
|
| 132,198 | |
| 296,076 | |
| 1,081 | |
| (3,504) | |
| 293,653 |
Total |
| $ | 707,213 |
| $ | 798 |
| $ | (10,326) |
| $ | 697,685 | ||||||||||||
|
|
|
|
|
|
|
|
|
|
|
|
| ||||||||||||
Held to maturity |
|
|
|
|
|
|
|
|
|
|
|
| ||||||||||||
Obligations of states and political subdivisions |
| $ | 33,947 |
| $ | 68 |
| $ | (87) |
| $ | 33,928 | ||||||||||||
Commercial mortgage-backed securities |
|
| 59,054 |
|
| 11 |
|
| (1,003) |
|
| 58,062 | ||||||||||||
Residential mortgage-backed securities |
|
| 515,659 |
|
| 1,748 |
|
| (6,037) |
|
| 511,370 | ||||||||||||
Total |
| $ | 608,660 |
| $ | 1,827 |
| $ | (7,127) |
| $ | 603,360 | ||||||||||||
Total debt securities available for sale | | $ | 4,013,523 | | $ | 22,382 | | $ | (54,654) | | $ | 3,981,251 | ||||||||||||
|
|
|
|
|
|
|
|
|
|
|
|
|
|
|
|
|
| Gross |
| Gross |
|
|
| ||
|
| Amortized |
| Unrealized |
| Unrealized |
| Fair | ||||
December 31, 2017: |
| Cost |
| Gains |
| Losses |
| Value | ||||
Available for sale |
|
|
|
|
|
|
|
|
|
|
|
|
U.S. Treasury securities |
| $ | 60,829 |
| $ | 7 |
| $ | (488) |
| $ | 60,348 |
Obligations of U.S. government corporations and agencies |
|
| 104,807 |
|
| 1 |
|
| (1,143) |
|
| 103,665 |
Obligations of states and political subdivisions |
|
| 280,216 |
|
| 1,160 |
|
| (1,177) |
|
| 280,199 |
Residential mortgage-backed securities |
|
| 400,661 |
|
| 612 |
|
| (3,837) |
|
| 397,436 |
Corporate debt securities |
|
| 30,946 |
|
| 132 |
|
| (44) |
|
| 31,034 |
Total |
| $ | 877,459 |
| $ | 1,912 |
| $ | (6,689) |
| $ | 872,682 |
|
|
|
|
|
|
|
|
|
|
|
|
|
Held to maturity |
|
|
|
|
|
|
|
|
|
|
|
|
Obligations of states and political subdivisions |
| $ | 41,300 |
| $ | 228 |
| $ | (64) |
| $ | 41,464 |
Commercial mortgage-backed securities |
|
| 60,474 |
|
| 41 |
|
| (297) |
|
| 60,218 |
Residential mortgage-backed securities |
|
| 341,776 |
|
| 25 |
|
| (2,431) |
|
| 339,370 |
Total |
| $ | 443,550 |
| $ | 294 |
| $ | (2,792) |
| $ | 441,052 |
The Company held equity securities, consisting of common stock with fair values of $6.2 million and an immaterial amount of money market mutual funds at December 31, 2018. The Company held equity securities, consisting of common stock and money market mutual funds, with fair values of $0.8 million and $4.6 million, respectively, at December 31, 2017. The Company recorded $0.1 million of unrealized losses in non-interest income in the accompanying Consolidated Financial Statements during the twelve months ended December 31, 2018 related to common stock. The Company recorded $2.3 million in security gains during the twelve months ended December 31, 2018 related to common stock, as well as a transfer from other assets.
9097
| | | | | | | | | | | | |
| | As of December 31, 2020 | ||||||||||
| | Amortized | | Unrealized | | Fair | ||||||
|
| Cost |
| Gross Gains |
| Gross Losses |
| Value | ||||
Debt securities available for sale | | | | | | | | | | | | |
U.S. Treasury securities | | $ | 27,481 | | $ | 356 | | $ | — | | $ | 27,837 |
Obligations of U.S. government corporations and agencies | |
| 67,406 | |
| 2,162 | |
| (49) | |
| 69,519 |
Obligations of states and political subdivisions | |
| 292,940 | |
| 11,779 | |
| (8) | |
| 304,711 |
Commercial mortgage-backed securities | | | 408,716 | | | 10,212 | | | (312) | | | 418,616 |
Residential mortgage-backed securities | |
| 1,344,047 | |
| 24,571 | |
| (303) | |
| 1,368,315 |
Corporate debt securities | |
| 70,953 | |
| 1,237 | |
| (1) | |
| 72,189 |
Total debt securities available for sale | | $ | 2,211,543 | | $ | 50,317 | | $ | (673) | | $ | 2,261,187 |
The amortizedAmortized cost and fair value of debt securities, as of December 31, 2018, by contractual maturity or pre-refunded date, are shown below. Mortgages underlying mortgage-backed securities and asset-backed securities may be called or prepaid; therefore, actual maturities could differ from the contractual maturities. All mortgage-backed securities were issued by U.S. government corporations and agencies and corporations (dollars in thousands).:
|
|
|
|
|
|
|
|
|
|
|
|
| ||||||
|
| Available for sale |
| Held to maturity | ||||||||||||||
|
| Amortized |
| Fair |
| Amortized |
| Fair | ||||||||||
|
| Cost |
| Value |
| Cost |
| Value | ||||||||||
| | | | | | | ||||||||||||
| | As of December 31, 2021 | ||||||||||||||||
|
| Amortized |
| Fair | ||||||||||||||
|
| Cost |
| Value | ||||||||||||||
Debt securities available for sale | | | | | | | ||||||||||||
Due in one year or less |
| $ | 60,006 |
| $ | 59,759 |
| $ | 8,103 |
| $ | 8,088 | | $ | 129,260 | | $ | 129,848 |
Due after one year through five years |
|
| 223,813 |
|
| 222,206 |
|
| 55,638 |
|
| 55,007 | |
| 564,284 | |
| 563,473 |
Due after five years through ten years |
|
| 136,411 |
|
| 135,118 |
|
| 29,260 |
|
| 28,895 | |
| 356,782 | |
| 362,057 |
Due after ten years |
|
| 286,983 |
|
| 280,602 |
|
| 515,659 |
|
| 511,370 | |
| 2,963,197 | |
| 2,925,873 |
Total |
| $ | 707,213 |
| $ | 697,685 |
| $ | 608,660 |
| $ | 603,360 | ||||||
Total debt securities available for sale | | $ | 4,013,523 | | $ | 3,981,251 | ||||||||||||
Realized gains and losses related to sales and calls of debt securities available for sale are summarized as follows (dollars in thousands):
| | | | | | | | | |
| | Years Ended December 31, | |||||||
|
| 2021 |
| 2020 |
| 2019 | |||
Realized gains and losses on sales of debt securities | | | | | | | | | |
Gross security gains | | $ | 543 | | $ | 1,732 | | $ | 1,318 |
Gross security (losses) | | | (514) |
| | (8) |
| | (585) |
Net gains (losses) on sales of debt securities (1) | | $ | 29 | | $ | 1,724 | | $ | 733 |
|
|
|
|
|
|
|
|
|
|
|
| For the Years Ended December 31, | |||||||
|
| 2018 |
| 2017 |
| 2016 | |||
Gross security gains |
| $ | — |
| $ | 1,259 |
| $ | 1,383 |
Gross security (losses) |
|
| (1,991) |
|
| (116) |
|
| (151) |
Security gains (losses), net(1) |
| $ | (1,991) |
| $ | 1,143 |
| $ | 1,232 |
(1) |
|
The estimated tax benefit for net realized gains and losses was $0.4 million for the year ended December 31, 2018. The estimated tax provision for net realized gains and losses was $0.4 million for the years ended December 31, 2017 and 2016.
InvestmentDebt securities with carrying amounts of $498.3 million and $638.2$708.9 million on December 31, 20182021, and 2017, respectively,$628.0 million on December 31, 2020, were pledged as collateral for public deposits, securities sold under agreements to repurchase, and for other purposes as required or permitted by law.required.
98
Information pertainingFIRST BUSEY CORPORATION
NOTES TO CONSOLIDATED FINANCIAL STATEMENTS
The following information pertains to debt securities with gross unrealized losses, at December 31, 2018 and 2017 aggregated by investment category and the length of time that individual securities have been in a continuous loss position follows (dollars in thousands):
|
|
|
|
|
|
|
|
|
|
|
|
|
|
|
|
|
| ||||||||||||||||||
| Continuous unrealized |
| Continuous unrealized |
|
|
|
|
|
| ||||||||||||||||||||||||||
| losses existing for less than |
| losses existing for greater |
|
|
|
|
|
| ||||||||||||||||||||||||||
| 12 months, gross |
| than 12 months, gross |
| Total, gross | ||||||||||||||||||||||||||||||
| Fair |
| Unrealized |
| Fair |
| Unrealized |
| Fair |
| Unrealized | ||||||||||||||||||||||||
December 31, 2018: | Value |
| Losses |
| Value |
| Losses |
| Value |
| Losses | ||||||||||||||||||||||||
Available for sale |
|
|
|
|
|
|
|
|
|
|
|
|
|
|
|
|
| ||||||||||||||||||
| | | | | | | | | | | | | | | | | | | |||||||||||||||||
| | As of December 31, 2021 | |||||||||||||||||||||||||||||||||
| | Less than 12 months | | 12 months or more | | Total | |||||||||||||||||||||||||||||
| | Fair |
| Unrealized |
| Fair |
| Unrealized |
| Fair |
| Unrealized | |||||||||||||||||||||||
|
| Value |
| Losses |
| Value |
| Losses |
| Value |
| Losses | |||||||||||||||||||||||
Debt securities available for sale | | | | | | | | | | | | | | | | | | | |||||||||||||||||
U.S. Treasury securities | $ | 995 |
| $ | (4) |
| $ | 24,343 |
| $ | (410) |
| $ | 25,338 |
| $ | (414) | | $ | 163,653 | | $ | (1,047) | | $ | — | | $ | — | | $ | 163,653 | | $ | (1,047) |
Obligations of U.S. government corporations and agencies |
| 749 |
|
| (3) |
|
| 50,744 |
|
| (758) |
|
| 51,493 |
|
| (761) | ||||||||||||||||||
Obligations of states and political subdivisions |
| 49,893 |
|
| (460) |
|
| 77,651 |
|
| (1,111) |
|
| 127,544 |
|
| (1,571) | | | 92,680 | | | (1,493) | | | — | | | — | | | 92,680 | | | (1,493) |
Asset-backed securities | | | 89,983 | | | (164) | | | — | | | — | | | 89,983 | | | (164) | |||||||||||||||||
Commercial mortgage-backed securities |
| — |
|
| — |
|
| 1,942 |
|
| (61) |
|
| 1,942 |
|
| (61) | | | 389,078 | | | (10,186) | | | 85,905 | | | (3,580) | | | 474,983 | | | (13,766) |
Residential mortgage-backed securities |
| 48,387 |
|
| (496) |
|
| 247,573 |
|
| (6,647) |
|
| 295,960 |
|
| (7,143) | |
| 1,700,187 | |
| (33,453) | |
| 20,538 | |
| (1,227) | |
| 1,720,725 | |
| (34,680) |
Corporate debt securities |
| 90,713 |
|
| (268) |
|
| 15,083 |
|
| (108) |
|
| 105,796 |
|
| (376) | |
| 241,153 | |
| (3,504) | |
| — | |
| — | |
| 241,153 | |
| (3,504) |
Total temporarily impaired securities | $ | 190,737 |
| $ | (1,231) |
| $ | 417,336 |
| $ | (9,095) |
| $ | 608,073 |
| $ | (10,326) | | $ | 2,676,734 | | $ | (49,847) | | $ | 106,443 | | $ | (4,807) | | $ | 2,783,177 | | $ | (54,654) |
|
|
|
|
|
|
|
|
|
|
|
|
|
|
|
|
|
| ||||||||||||||||||
Held to maturity |
|
|
|
|
|
|
|
|
|
|
|
|
|
|
|
|
| ||||||||||||||||||
Obligations of states and political subdivisions | $ | 9,531 |
| $ | (33) |
| $ | 9,538 |
| $ | (54) |
| $ | 19,069 |
| $ | (87) | ||||||||||||||||||
Commercial mortgage-backed securities |
| 12,067 |
|
| (212) |
|
| 45,041 |
|
| (791) |
|
| 57,108 |
|
| (1,003) | ||||||||||||||||||
Residential mortgage-backed securities |
| 77,071 |
|
| (974) |
|
| 245,128 |
|
| (5,063) |
|
| 322,199 |
|
| (6,037) | ||||||||||||||||||
Total temporarily impaired securities | $ | 98,669 |
| $ | (1,219) |
| $ | 299,707 |
| $ | (5,908) |
| $ | 398,376 |
| $ | (7,127) | ||||||||||||||||||
| | | | | | | | | | | | | | | | | | |
| | As of December 31, 2020 | ||||||||||||||||
| | Less than 12 months | | 12 months or more | | Total | ||||||||||||
| | Fair |
| Unrealized |
| Fair |
| Unrealized |
| Fair |
| Unrealized | ||||||
|
| Value |
| Losses |
| Value |
| Losses |
| Value |
| Losses | ||||||
Debt securities available for sale | | | | | | | | | | | | | | | | | | |
Obligations of U.S. government corporations and agencies | | $ | — | | $ | — | | $ | 4,957 | | $ | (49) | | $ | 4,957 | | $ | (49) |
Obligations of states and political subdivisions | | | 762 | | | (8) | | | — | | | — | | | 762 | | | (8) |
Commercial mortgage-backed securities | | | 129,655 | | | (312) | | | — | | | — | | | 129,655 | | | (312) |
Residential mortgage-backed securities | |
| 89,997 | |
| (300) | |
| 139 | |
| (3) | |
| 90,136 | |
| (303) |
Corporate debt securities | |
| 1,499 | |
| (1) | |
| — | |
| — | |
| 1,499 | |
| (1) |
Total temporarily impaired securities | | $ | 221,913 | | $ | (621) | | $ | 5,096 | | $ | (52) | | $ | 227,009 | | $ | (673) |
91
|
|
|
|
|
|
|
|
|
|
|
|
|
|
|
|
|
|
| Continuous unrealized |
| Continuous unrealized |
|
|
|
|
|
| ||||||||
| losses existing for less than |
| losses existing for greater |
|
|
|
|
|
| ||||||||
| 12 months, gross |
| than 12 months, gross |
| Total, gross | ||||||||||||
| Fair |
| Unrealized |
| Fair |
| Unrealized |
| Fair |
| Unrealized | ||||||
December 31, 2017: | Value |
| Losses |
| Value |
| Losses |
| Value |
| Losses | ||||||
Available for sale |
|
|
|
|
|
|
|
|
|
|
|
|
|
|
|
|
|
U.S. Treasury securities | $ | 59,773 |
| $ | (488) |
| $ | — |
| $ | — |
| $ | 59,773 |
| $ | (488) |
Obligations of U.S. government corporations and agencies |
| 78,610 |
|
| (636) |
|
| 24,831 |
|
| (507) |
|
| 103,441 |
|
| (1,143) |
Obligations of states and political subdivisions |
| 162,213 |
|
| (1,027) |
|
| 12,045 |
|
| (150) |
|
| 174,258 |
|
| (1,177) |
Residential mortgage-backed securities |
| 223,261 |
|
| (1,428) |
|
| 90,930 |
|
| (2,409) |
|
| 314,191 |
|
| (3,837) |
Corporate debt securities |
| 16,176 |
|
| (44) |
|
| — |
|
| — |
|
| 16,176 |
|
| (44) |
Total temporarily impaired securities | $ | 540,033 |
| $ | (3,623) |
| $ | 127,806 |
| $ | (3,066) |
| $ | 667,839 |
| $ | (6,689) |
|
|
|
|
|
|
|
|
|
|
|
|
|
|
|
|
|
|
Held to maturity |
|
|
|
|
|
|
|
|
|
|
|
|
|
|
|
|
|
Obligations of states and political subdivisions | $ | 17,939 |
| $ | (64) |
| $ | — |
| $ | — |
| $ | 17,939 |
| $ | (64) |
Commercial mortgage-backed securities |
| 44,514 |
|
| (214) |
|
| 2,374 |
|
| (83) |
|
| 46,888 |
|
| (297) |
Residential mortgage-backed securities |
| 277,826 |
|
| (2,431) |
|
| — |
|
| — |
|
| 277,826 |
|
| (2,431) |
Total temporarily impaired securities | $ | 340,279 |
| $ | (2,709) |
| $ | 2,374 |
| $ | (83) |
| $ | 342,653 |
| $ | (2,792) |
Securities are periodically evaluated for OTTI.1,252 securities as of December 31, 2021, compared to 1,114 securities as of December 31, 2020. The total number of debt securities in the investment portfolio in an unrealized loss position was 373 representing an unrealized loss of 1.4% of the aggregate fair value of debt securities as of December 31, 2018 was 570, and represented a2021, compared to 23 securities representing an unrealized loss of 1.70%0.03% of the aggregate carrying value. The Company has evaluated the naturefair value of unrealizeddebt securities as of December 31, 2020. Unrealized losses in the investment securities portfolio to determine if OTTI exists. The unrealized losses relatewere related to changes in market interest rates and market conditions that do not represent credit-related impairments. Furthermore, the Company does not intend to sell such securities and it is more likely than not that the Company will recover the amortized cost prior to being required to sell the debt securities. Full collection of the amounts due according to the contractual terms of the debt securities is expected; therefore, the Company does not consider these investmentsimpairment related to be OTTI at December 31, 2018.
The Company had available for sale obligationsnoncredit factors is recognized in AOCI, net of state and political subdivisions with a fair value of $170.1 million and $280.2 million as of December 31, 2018 and 2017, respectively. In addition, the Company had held to maturity obligations of state and political subdivisions with a fair value of $33.9 million and $41.5 million at December 31, 2018 and 2017, respectively.
applicable taxes. As of December 31, 2018, the fair value of the Company’s obligations of state and political subdivisions portfolio was comprised of $171.1 million of general obligation bonds and $32.9 million of revenue bonds issued by 303 issuers, primarily consisting of states, counties, cities, towns, villages and school districts. The Company held investments in general obligation bonds in 31 states (including the District of Columbia), including eight states in which the aggregate fair value exceeded $5.0 million. The Company held investments in revenue bonds in 18 states, including one state where the aggregate fair value exceeded $5.0 million.
As of December 31, 2017, the fair value of the Company’s obligations of state and political subdivisions portfolio was comprised of $271.7 million of general obligation bonds and $50.0 million of revenue bonds issued by 446 issuers, primarily consisting of states, counties, cities, towns, villages and school districts. The Company held investments in general obligation bonds in 36 states (including the District of Columbia), including nine states in which the aggregate fair value exceeded $5.0 million. The Company held investments in revenue bonds in 22 states, including three states where the aggregate fair value exceeded $5.0 million.
92
The amortized cost and fair values of the Company’s portfolio of general obligation bonds are summarized in the following tables by the issuers’ state (dollars in thousands):
|
|
|
|
|
|
|
|
|
|
|
December 31, 2018: |
|
|
|
|
|
|
|
| Average Exposure | |
| Number of |
|
| Amortized |
| Fair |
| Per Issuer | ||
U.S. State | Issuers |
| Cost |
| Value |
| (Fair Value) | |||
Illinois | 70 |
| $ | 56,324 |
| $ | 55,999 |
| $ | 800 |
Wisconsin | 20 |
|
| 12,624 |
|
| 12,544 |
|
| 627 |
Texas | 36 |
|
| 21,637 |
|
| 21,428 |
|
| 595 |
Michigan | 19 |
|
| 10,799 |
|
| 10,890 |
|
| 573 |
Ohio | 17 |
|
| 9,543 |
|
| 9,545 |
|
| 561 |
Pennsylvania | 10 |
|
| 6,317 |
|
| 6,298 |
|
| 630 |
Missouri | 8 |
|
| 5,202 |
|
| 5,172 |
|
| 646 |
California | 6 |
|
| 8,303 |
|
| 8,322 |
|
| 1,387 |
Other | 74 |
|
| 41,274 |
|
| 40,906 |
|
| 553 |
Total general obligations bonds | 260 |
| $ | 172,023 |
| $ | 171,104 |
| $ | 658 |
|
|
|
|
|
|
|
|
|
|
|
December 31, 2017: |
|
|
|
|
|
|
| Average Exposure | ||
| Number of |
| Amortized |
| Fair |
| Per Issuer | |||
U.S. State | Issuers |
| Cost |
| Value |
| (Fair Value) | |||
Illinois | 97 |
| $ | 95,340 |
| $ | 95,344 |
| $ | 983 |
Wisconsin | 41 |
|
| 27,852 |
|
| 27,809 |
|
| 678 |
Texas | 46 |
|
| 27,485 |
|
| 27,514 |
|
| 598 |
Michigan | 34 |
|
| 19,641 |
|
| 19,849 |
|
| 584 |
Ohio | 20 |
|
| 15,172 |
|
| 15,162 |
|
| 758 |
Pennsylvania | 18 |
|
| 12,189 |
|
| 12,174 |
|
| 676 |
New Jersey | 15 |
|
| 7,755 |
|
| 7,760 |
|
| 517 |
Missouri | 10 |
|
| 5,759 |
|
| 5,747 |
|
| 575 |
Minnesota | 8 |
|
| 5,657 |
|
| 5,667 |
|
| 708 |
Other | 92 |
|
| 54,649 |
|
| 54,633 |
|
| 594 |
Total general obligations bonds | 381 |
| $ | 271,499 |
| $ | 271,659 |
| $ | 713 |
The general obligation bonds are diversified across many issuers, with $5.0 million and $4.0 million being the largest exposure to a single issuer at December 31, 2018 and 2017, respectively. Accordingly, as of December 31, 2018 and 2017,2021, the Company did not hold general obligation bonds of any single issuer, the aggregate book or market value of which exceeded 10% of the Company’s stockholders’ equity. Of the general obligation bonds in the Company’s portfolio, 99.3% had been rated by at least one nationally recognized statistical rating organization and 0.7% were unrated, based on the fair value as of December 31, 2018 and 2017.
The amortized cost and fair values of the Company’s portfolio of revenue bonds are summarized in the following tables by the issuers’ state (dollars in thousands):
|
|
|
|
|
|
|
|
|
|
|
December 31, 2018: |
|
|
|
|
|
|
| Average Exposure | ||
| Number of |
| Amortized |
| Fair |
| Per Issuer | |||
U.S. State | Issuers |
| Cost |
| Value |
| (Fair Value) | |||
Indiana | 10 |
| $ | 9,588 |
| $ | 9,582 |
| $ | 958 |
Other | 33 |
|
| 23,467 |
|
| 23,286 |
|
| 705 |
Total revenue bonds | 43 |
| $ | 33,055 |
| $ | 32,868 |
| $ | 764 |
|
|
|
|
|
|
|
|
|
|
|
December 31, 2017: |
|
|
|
|
|
|
| Average Exposure | ||
| Number of |
| Amortized |
| Fair |
| Per Issuer | |||
U.S. State | Issuers |
| Cost |
| Value |
| (Fair Value) | |||
Indiana | 14 |
| $ | 12,001 |
| $ | 12,054 |
| $ | 861 |
Missouri | 6 |
|
| 7,376 |
|
| 7,336 |
|
| 1,223 |
Illinois | 7 |
|
| 6,477 |
|
| 6,456 |
|
| 922 |
Other | 38 |
|
| 24,163 |
|
| 24,158 |
|
| 636 |
Total revenue bonds | 65 |
| $ | 50,017 |
| $ | 50,004 |
| $ | 769 |
9399
The revenue bonds are diversified across many issuers and revenue sources with $3.5 million and $3.6 million being the largest exposure to a single issuer at each of December 31, 2018 and 2017, respectively. Accordingly, as of December 31, 2018 and 2017, the Company did not hold revenue bonds of any single issuer, the aggregate book or market value of which exceeded 10% of the Company’s stockholders’ equity. Of the revenue bonds in the Company’s portfolio, 100.0% had been rated by at least one nationally recognized statistical rating organization, based on the fair value as of December 31, 2018. Of the revenue bonds in the Company’s portfolio, 99.4% had been rated by at least one nationally recognized statistical rating organization and 0.6% were unrated, based on the fair value as of December 31, 2017. Some of the primary types of revenue bonds held in the Company’s portfolio include: primary education or government building lease rentals secured by ad valorem taxes, utility systems secured by utility system net revenues, housing authorities secured by mortgage loans or principal receipts on mortgage loans, secondary education secured by student fees/tuitions, and pooled issuances (i.e. bond bank) consisting of multiple underlying municipal obligors.
At December 31, 2018, all of the Company’s obligations of state and political subdivision securities are owned by its subsidiary bank, which has adopted First Busey’s investment policy requiring that state and political subdivision securities purchased be investment grade. Such investment policy also limits the amount of rated state and political subdivision securities to an aggregate 100% of the subsidiary banks’ total capital (as defined by federal regulations) at the time of purchase and an aggregate 15% of total capital for unrated state and political subdivision securities issued by municipalities having taxing authority or located in counties/micropolitan statistical areas/metropolitan statistical areas in which an office is located.
All securities in First Busey’s obligations of state and political subdivision securities portfolio are subject to periodic review. Factors that may be considered as part of monitoring of state and political subdivision securities include credit rating changes by nationally recognized rating organizations, market valuations, third-party municipal credit analysis, which may include indicative information regarding the issuer’s capacity to pay, market and economic data and such other factors as are available and relevant to the security or the issuer such as its budgetary position and sources, strength and stability of taxes and/or other revenue.
Note 4. Portfolio Loans held for sale
Loans held for sale totaled $25.9 million and $94.8 million at December 31, 2018 and 2017, respectively. Loans held for sale generate net interest income until loans are delivered to investors, at which point mortgage revenue will be recognized.
The following is a summary of mortgage revenue (dollars in thousands):
|
|
|
|
|
|
|
|
|
| December 31, | |||||
|
| 2018 | 2017 | 2016 | |||
Premiums received on sales of mortgage loans, including fair value adjustments |
| $ | 12,105 | $ | 42,598 | $ | 43,119 |
Less direct origination costs |
|
| (8,683) |
| (33,363) |
| (32,793) |
Less provisions to liability for loans sold |
|
| (132) |
| (225) |
| (175) |
Mortgage servicing revenues, net of servicing expense |
|
| 2,255 |
| 2,130 |
| 1,801 |
Mortgage revenue |
| $ | 5,545 | $ | 11,140 | $ | 11,952 |
Note 5. Mortgage Loan Servicing
The largest portion of the Company’s servicing assets relate to mortgage loans. The unpaid principal balances of mortgage loans serviced by the Company for the benefit of others are not included in the accompanying Consolidated Balance Sheets. These unpaid principal balances were $1.5 billion as of December 31, 2018 and 2017. Servicing such loans for others generally consists of collecting mortgage payments, maintaining escrow accounts, disbursing payments to investors and collection and foreclosure processing. Mortgage servicing revenues, a component of mortgage revenue, is recorded on the accrual basis and includes servicing fees from investors and certain charges collected from borrowers, such as late payment fees, and is net of amortization of capitalized mortgage servicing rights.
94
The balance of capitalized mortgage servicing rights included in other assets in the accompanying Consolidated Balance Sheets at December 31, 2018 and 2017, was $3.3 million and $3.7 million, respectively. The fair values of these servicing rights were $11.1 million and $8.6 million, respectively, at December 31, 2018 and 2017. The following summarizes mortgage servicing rights capitalized, acquired and amortized (dollars in thousands):
|
|
|
|
|
|
|
|
|
|
|
| For the Years Ended December 31, | |||||||
|
| 2018 |
| 2017 |
| 2016 | |||
|
|
| |||||||
Mortgage servicing rights capitalized |
| $ | 1,166 |
| $ | 1,366 |
| $ | 1,488 |
Mortgage servicing rights acquired |
| $ | — |
| $ | 751 |
| $ | — |
Mortgage servicing rights amortized |
| $ | 1,531 |
| $ | 1,584 |
| $ | 1,921 |
Note 6. Portfolio loans and allowance for loan losses
Distributions of portfolio loans were as follows (dollars in thousands):
|
|
|
|
|
|
| ||||||
|
| December 31, |
| December 31, | ||||||||
|
| 2018 |
| 2017 | ||||||||
| | | | | | | ||||||
|
| As of December 31, | ||||||||||
|
| 2021 |
| 2020 | ||||||||
Portfolio loans | | | | | | | ||||||
Commercial |
| $ | 1,405,106 |
| $ | 1,414,631 | | $ | 1,943,886 | | $ | 2,014,576 |
Commercial real estate |
|
| 2,366,823 |
|
| 2,354,684 | | | 3,119,807 | | | 2,892,535 |
Real estate construction |
|
| 288,197 |
|
| 261,506 | | | 385,996 | | | 461,786 |
Retail real estate |
|
| 1,480,133 |
|
| 1,460,801 | | | 1,512,976 | | | 1,407,852 |
Retail other |
|
| 28,169 |
|
| 27,878 | | | 226,333 | | | 37,428 |
Portfolio loans |
| $ | 5,568,428 |
| $ | 5,519,500 | ||||||
|
|
|
|
|
|
| ||||||
Less allowance for loan losses |
|
| 50,648 |
|
| 53,582 | ||||||
Total portfolio loans | | $ | 7,188,998 | | $ | 6,814,177 | ||||||
| | | | | | | ||||||
ACL | | | (87,887) | | | (101,048) | ||||||
Portfolio loans, net |
| $ | 5,517,780 |
| $ | 5,465,918 | | $ | 7,101,111 | | $ | 6,713,129 |
Net deferred loan origination costs included in the tablesbalances above were $5.6 million and $4.1$9.0 million as of December 31, 2018 and 2017, respectively.2021, compared to $2.4 million as of December 31, 2020. Net accretable purchase accounting adjustments included in the tablebalances above reduced loans by $13.9 million and $23.6$8.8 million as of December 31, 20182021, and 2017, respectively.by $10.9 million as of December 31, 2020. Commercial balances include loans originated under the PPP with an amortized cost of $75.0 million, as of December 31, 2021, compared to $446.4 million in loans originated under PPP included in the December 31, 2020, balance.
The Company purchased retail real estate loans totaling $32.2 million during the year ended December 31, 2021, compared to $43.9 million of retail real estate loan purchases during the year ended December 31, 2020.
Risk Grading
The Company utilizes a loan grading scale to assign a risk grade to all of its loans. A description of the general characteristics of each grade is as follows:
|
|
|
|
| Special |
|
|
| Substandard |
100
All loans are graded at their inception. Most commercialCommercial lending relationships that are $1.0 million or less are usually processed through an expedited underwriting process. If the credit receives a pass grade, it is aggregated into a homogenous pool of either: $0.35 million or less, or $0.35 million to $1.0 million. These pools are monitored on a regular basis and reviewed annually. Most commercial loans greater than $1.0 million are included in a portfolio review at least annually. Commercial loans greater than $0.35 million that have a
95
grading of special mention or worse are typically reviewed on a quarterly basis. Interim reviews may take place if circumstances of the borrower warrant.warrant a more frequent review. GSB’s policies were similar in nature to Busey Bank’s policies and the Company is migrating the legacy GSB portfolio and grading toward the Busey Bank policies.
Pass and watch rated portfolio loans totaled $5.3 billion at December 31, 2018 and 2017. Portfolio loans graded special mention, substandard and substandard non-accrual totaled $263.9 million at December 31, 2018, compared to $193.8 million at December 31, 2017.
The following table is a summary of risk grades segregated by category of portfolio loans (excluding accretable purchase accounting adjustments and clearings) (dollars in thousands):
| | | | | | | | | | | | | | | | | | |
| | As of December 31, 2021 | ||||||||||||||||
|
| |
| |
| Special |
| |
| Substandard |
| | ||||||
|
| Pass |
| Watch |
| Mention |
| Substandard |
| Non-accrual |
| Total | ||||||
Portfolio loans | | | | | | | | | | | | | | | | | | |
Commercial | | $ | 1,747,756 | | $ | 93,582 | | $ | 69,427 | | $ | 26,117 | | $ | 7,004 | | $ | 1,943,886 |
Commercial real estate | |
| 2,682,441 | |
| 343,304 | |
| 49,695 | |
| 38,394 | |
| 5,973 | |
| 3,119,807 |
Real estate construction | |
| 369,797 | |
| 13,793 | |
| 6 | |
| 2,400 | |
| — | |
| 385,996 |
Retail real estate | |
| 1,491,845 | |
| 12,374 | |
| 1,992 | |
| 3,867 | |
| 2,898 | |
| 1,512,976 |
Retail other | |
| 226,262 | |
| — | |
| — | |
| — | |
| 71 | |
| 226,333 |
Total portfolio loans | | $ | 6,518,101 | | $ | 463,053 | | $ | 121,120 | | $ | 70,778 | | $ | 15,946 | | $ | 7,188,998 |
| | | | | | | | | | | | | | | | | | |
| | As of December 31, 2020 | ||||||||||||||||
|
| |
| |
| Special |
| |
| Substandard |
| | ||||||
|
| Pass |
| Watch |
| Mention |
| Substandard |
| Non-accrual |
| Total | ||||||
Portfolio loans | | | | | | | | | | | | | | | | | | |
Commercial | | $ | 1,768,755 | | $ | 136,948 | | $ | 72,447 | | $ | 27,903 | | $ | 8,523 | | $ | 2,014,576 |
Commercial real estate | |
| 2,393,372 | |
| 383,277 | |
| 75,486 | |
| 34,897 | |
| 5,503 | |
| 2,892,535 |
Real estate construction | |
| 434,681 | |
| 24,481 | |
| 77 | |
| 2,546 | |
| 1 | |
| 461,786 |
Retail real estate | |
| 1,382,616 | |
| 10,264 | |
| 2,471 | |
| 3,702 | |
| 8,799 | |
| 1,407,852 |
Retail other | |
| 37,324 | |
| — | |
| — | |
| — | |
| 104 | |
| 37,428 |
Total portfolio loans | | $ | 6,016,748 | | $ | 554,970 | | $ | 150,481 | | $ | 69,048 | | $ | 22,930 | | $ | 6,814,177 |
|
|
|
|
|
|
|
|
|
|
|
|
|
|
|
|
|
| December 31, 2018 | |||||||||||||
|
|
|
|
|
| Special |
|
|
| Substandard | |||||
|
| Pass |
| Watch |
| Mention |
| Substandard |
| Non-accrual | |||||
Commercial |
| $ | 1,126,257 |
| $ | 172,449 |
| $ | 47,000 |
| $ | 42,532 |
| $ | 17,953 |
Commercial real estate |
|
| 2,106,711 |
|
| 137,214 |
|
| 85,148 |
|
| 36,205 |
|
| 10,298 |
Real estate construction |
|
| 268,069 |
|
| 14,562 |
|
| 3,899 |
|
| 1,888 |
|
| 18 |
Retail real estate |
|
| 1,448,964 |
|
| 6,425 |
|
| 6,792 |
|
| 5,435 |
|
| 6,698 |
Retail other |
|
| 26,707 |
|
| — |
|
| — |
|
| — |
|
| 30 |
Total |
| $ | 4,976,708 |
| $ | 330,650 |
| $ | 142,839 |
| $ | 86,060 |
| $ | 34,997 |
101
|
|
|
|
|
|
|
|
|
|
|
|
|
|
|
|
|
| December 31, 2017 | |||||||||||||
|
|
|
|
|
| Special |
|
|
| Substandard | |||||
|
| Pass |
| Watch |
| Mention |
| Substandard |
| Non-accrual | |||||
Commercial |
| $ | 1,175,421 |
| $ | 141,776 |
| $ | 51,366 |
| $ | 43,933 |
| $ | 5,285 |
Commercial real estate |
|
| 2,169,420 |
|
| 130,056 |
|
| 21,151 |
|
| 36,482 |
|
| 11,997 |
Real estate construction |
|
| 212,952 |
|
| 41,292 |
|
| 3,880 |
|
| 3,071 |
|
| 608 |
Retail real estate |
|
| 1,436,156 |
|
| 6,883 |
|
| 5,162 |
|
| 4,135 |
|
| 6,714 |
Retail other |
|
| 28,300 |
|
| 9 |
|
| — |
|
| 7 |
|
| 20 |
Total |
| $ | 5,022,249 |
| $ | 320,016 |
| $ | 81,559 |
| $ | 87,628 |
| $ | 24,624 |
FIRST BUSEY CORPORATION
NOTES TO CONSOLIDATED FINANCIAL STATEMENTS
Risk grades of portfolio loans, further sorted by origination year, are as follows (dollars in thousands):
| | | | | | | | | | | | | | | | | | | | | | | | |
|
| As of December 31, 2021 | ||||||||||||||||||||||
|
| Term Loans Amortized Cost Basis by Origination Year | | | Revolving | | | | ||||||||||||||||
Risk Grade Ratings |
| 2021 |
| 2020 |
| 2019 |
| 2018 |
| 2017 |
| | Prior |
| | loans |
| | Total | |||||
Commercial |
| | | | | | | | | | | | | | | | | | | | | | | |
Pass | | $ | 512,729 | | $ | 228,811 | | $ | 107,877 | | $ | 84,873 | | $ | 74,351 | | $ | 122,418 | | $ | 616,697 | | $ | 1,747,756 |
Watch | | | 13,847 | | | 5,913 | | | 14,274 | | | 5,060 | | | 1,361 | | | 2,866 | | | 50,261 | | | 93,582 |
Special Mention | | | 7,062 | | | 898 | | | 5,961 | | | 4,025 | | | 6,790 | | | 11,845 | | | 32,846 | | | 69,427 |
Substandard | | | 3,595 | | | 3,362 | | | 3,136 | | | 1,855 | | | 1,125 | | | 5,459 | | | 7,585 | | | 26,117 |
Substandard non-accrual | | | 4,126 | | | 364 | | | 142 | | | — | | | 320 | | | 52 | | | 2,000 | | | 7,004 |
Total commercial | | | 541,359 | | | 239,348 | | | 131,390 | | | 95,813 | | | 83,947 | | | 142,640 | | | 709,389 | | | 1,943,886 |
| | | | | | | | | | | | | | | | | | | | | | | | |
Commercial real estate | | | | | | | | | | | | | | | | | | | | | | |||
Pass | | | 969,548 | | | 637,550 | | | 425,850 | | | 235,928 | | | 200,373 | | | 198,002 | | | 15,190 | | | 2,682,441 |
Watch | | | 51,560 | | | 38,820 | | | 123,324 | | | 48,088 | | | 46,761 | | | 32,608 | | | 2,143 | | | 343,304 |
Special Mention | | | 9,542 | | | 7,060 | | | 6,585 | | | 10,098 | | | 6,357 | | | 9,870 | | | 183 | | | 49,695 |
Substandard | | | 21,002 | | | 3,781 | | | 1,218 | | | 11,451 | | | 521 | | | 421 | | | — | | | 38,394 |
Substandard non-accrual | | | 112 | | | 181 | | | 359 | | | 1,893 | | | 3,407 | | | 21 | | | — | | | 5,973 |
Total commercial real estate | | | 1,051,764 | | | 687,392 | | | 557,336 | | | 307,458 | | | 257,419 | | | 240,922 | | | 17,516 | | | 3,119,807 |
| | | | | | | | | | | | | | | | | | | | | | | | |
Real estate construction | | | | | | | | | | | | | | | | | | | | | | |||
Pass | | | 202,082 | | | 123,491 | | | 31,927 | | | 3,155 | | | 738 | | | 1,223 | | | 7,181 | | | 369,797 |
Watch | | | 7,886 | | | 4,159 | | | 54 | | | — | | | 1,574 | | | 120 | | | — | | | 13,793 |
Special Mention | | | — | | | — | | | 6 | | | — | | | — | | | — | | | — | | | 6 |
Substandard | | | — | | | 2,400 | | | — | | | — | | | — | | | — | | | — | | | 2,400 |
Substandard non-accrual | | | — | | | — | | | — | | | — | | | — | | | — | | | — | | | — |
Total real estate construction | | | 209,968 | | | 130,050 | | | 31,987 | | | 3,155 | | | 2,312 | | | 1,343 | | | 7,181 | | | 385,996 |
| | | | | | | | | | | | | | | | | | | | | | | | |
Retail real estate |
| | | | | | | | | | | | | | | | | | | | | | | |
Pass | | | 523,541 | | | 215,068 | | | 96,617 | | | 79,158 | | | 82,478 | | | 281,737 | | | 213,246 | | | 1,491,845 |
Watch | | | 4,100 | | | 2,460 | | | 1,780 | | | 1,312 | | | 343 | | | 150 | | | 2,229 | | | 12,374 |
Special Mention | | | 1,965 | | | 27 | | | — | | | — | | | — | | | — | | | — | | | 1,992 |
Substandard | | | 1,369 | | | 232 | | | 12 | | | 71 | | | 165 | | | 1,687 | | | 331 | | | 3,867 |
Substandard non-accrual | | | 235 | | | 63 | | | — | | | 16 | | | 227 | | | 1,705 | | | 652 | | | 2,898 |
Total retail real estate | | | 531,210 | | | 217,850 | | | 98,409 | | | 80,557 | | | 83,213 | | | 285,279 | | | 216,458 | | | 1,512,976 |
| | | | | | | | | | | | | | | | | | | | | | | | |
Retail other |
| | | | | | | | | | | | | | | | | | | | | | | |
Pass | | | 59,366 | | | 22,305 | | | 26,126 | | | 16,189 | | | 7,180 | | | 1,326 | | | 93,770 | | | 226,262 |
Watch | | | — | | | — | | | — | | | — | | | — | | | — | | | — | | | — |
Special Mention | | | — | | | — | | | — | | | — | | | — | | | — | | | — | | | — |
Substandard | | | — | | | — | | | — | | | — | | | — | | | — | | | — | | | — |
Substandard non-accrual | | | 34 | | | 10 | | | — | | | 14 | | | 13 | | | — | | | — | | | 71 |
Total retail other | | | 59,400 | | | 22,315 | | | 26,126 | | | 16,203 | | | 7,193 | | | 1,326 | | | 93,770 | | | 226,333 |
| | | | | | | | | | | | | | | | | | | | | | | | |
Total portfolio loans | | $ | 2,393,701 | | $ | 1,296,955 | | $ | 845,248 | | $ | 503,186 | | $ | 434,084 | | $ | 671,510 | | $ | 1,044,314 | | $ | 7,188,998 |
102
| | | | | | | | | | | | | | | | | | | | | | | | |
|
| As of December 31, 2020 | ||||||||||||||||||||||
|
| Term Loans Amortized Cost Basis by Origination Year | | | Revolving | | | | ||||||||||||||||
Risk Grade Ratings |
| 2020 |
| 2019 |
| 2018 |
| 2017 |
| 2016 |
| | Prior |
| | loans |
| | Total | |||||
Commercial |
| | | | | | | | | | | | | | | | | | | | | | | |
Pass | | $ | 812,536 | | $ | 158,307 | | $ | 107,565 | | $ | 93,190 | | $ | 61,847 | | $ | 79,970 | | $ | 455,340 | | $ | 1,768,755 |
Watch | | | 16,544 | | | 22,247 | | | 14,954 | | | 13,724 | | | 2,577 | | | 10,943 | | | 55,959 | | | 136,948 |
Special Mention | | | 6,402 | | | 2,671 | | | 2,069 | | | 7,164 | | | 6,763 | | | 13,733 | | | 33,645 | | | 72,447 |
Substandard | | | 7,772 | | | 3,791 | | | 2,371 | | | 1,939 | | | 819 | | | 1,233 | | | 9,978 | | | 27,903 |
Substandard non-accrual | | | 150 | | | 3,045 | | | 451 | | | 2,168 | | | 641 | | | 68 | | | 2,000 | | | 8,523 |
Total commercial | | | 843,404 | | | 190,061 | | | 127,410 | | | 118,185 | | | 72,647 | | | 105,947 | | | 556,922 | | | 2,014,576 |
| | | | | | | | | | | | | | | | | | | | | | | | |
Commercial real estate | | | | | | | | | | | | | | | | | | | | | | |||
Pass | | | 717,559 | | | 503,977 | | | 360,573 | | | 384,843 | | | 180,555 | | | 227,068 | | | 18,797 | | | 2,393,372 |
Watch | | | 88,297 | | | 110,526 | | | 90,412 | | | 33,734 | | | 32,887 | | | 27,023 | | | 398 | | | 383,277 |
Special Mention | | | 16,490 | | | 8,858 | | | 10,490 | | | 10,505 | | | 7,102 | | | 21,808 | | | 233 | | | 75,486 |
Substandard | | | 17,445 | | | 4,166 | | | 1,491 | | | 7,812 | | | 2,111 | | | 1,377 | | | 495 | | | 34,897 |
Substandard non-accrual | | | 1,091 | | | 776 | | | 821 | | | 882 | | | 286 | | | 1,647 | | | — | | | 5,503 |
Total commercial real estate | | | 840,882 | | | 628,303 | | | 463,787 | | | 437,776 | | | 222,941 | | | 278,923 | | | 19,923 | | | 2,892,535 |
| | | | | | | | | | | | | | | | | | | | | | | | |
Real estate construction | | | | | | | | | | | | | | | | | | | | | | |||
Pass | | | 179,232 | | | 171,663 | | | 64,025 | | | 1,468 | | | 761 | | | 1,444 | | | 16,088 | | | 434,681 |
Watch | | | 18,485 | | | 3,657 | | | 337 | | | 1,838 | | | 164 | | | | | | | | | 24,481 |
Special Mention | | | 67 | | | 10 | | | — | | | — | | | — | | | — | | | — | | | 77 |
Substandard | | | 2,400 | | | — | | | — | | | — | | | 146 | | | — | | | — | | | 2,546 |
Substandard non-accrual | | | — | | | — | | | — | | | — | | | — | | | 1 | | | — | | | 1 |
Total real estate construction | | | 200,184 | | | 175,330 | | | 64,362 | | | 3,306 | | | 1,071 | | | 1,445 | | | 16,088 | | | 461,786 |
| | | | | | | | | | | | | | | | | | | | | | | | |
Retail real estate |
| | | | | | | | | | | | | | | | | | | | | | | |
Pass | | | 319,302 | | | 162,711 | | | 135,065 | | | 136,427 | | | 140,600 | | | 257,147 | | | 231,364 | | | 1,382,616 |
Watch | | | 2,715 | | | 2,053 | | | 1,396 | | | 349 | | | 579 | | | 233 | | | 2,939 | | | 10,264 |
Special Mention | | | 509 | | | — | | | — | | | — | | | 1,962 | | | — | | | — | | | 2,471 |
Substandard | | | 899 | | | 96 | | | 56 | | | 26 | | | 727 | | | 1,631 | | | 267 | | | 3,702 |
Substandard non-accrual | | | 687 | | | 78 | | | 646 | | | 1,147 | | | 233 | | | 4,815 | | | 1,193 | | | 8,799 |
Total retail real estate | | | 324,112 | | | 164,938 | | | 137,163 | | | 137,949 | | | 144,101 | | | 263,826 | | | 235,763 | | | 1,407,852 |
| | | | | | | | | | | | | | | | | | | | | | | | |
Retail other |
| | | | | | | | | | | | | | | | | | | | | | | |
Pass | | | 8,357 | | | 9,430 | | | 5,600 | | | 2,516 | | | 691 | | | 440 | | | 10,290 | | | 37,324 |
Watch | | | — | | | — | | | — | | | — | | | — | | | — | | | — | | | — |
Special Mention | | | — | | | — | | | — | | | — | | | — | | | — | | | — | | | — |
Substandard | | | — | | | — | | | — | | | — | | | — | | | — | | | — | | | — |
Substandard non-accrual | | | 14 | | | 7 | | | 5 | | | 15 | | | 5 | | | 57 | | | 1 | | | 104 |
Total retail other | | | 8,371 | | | 9,437 | | | 5,605 | | | 2,531 | | | 696 | | | 497 | | | 10,291 | | | 37,428 |
| | | | | | | | | | | | | | | | | | | | | | | | |
Total portfolio loans | | $ | 2,216,953 | | $ | 1,168,069 | | $ | 798,327 | | $ | 699,747 | | $ | 441,456 | | $ | 650,638 | | $ | 838,987 | | $ | 6,814,177 |
103
Past Due and Non-accrual Loans
An analysis of the amortized cost basis of portfolio loans that are past due and still accruing, or on a non-accrual status, is as follows (dollars in thousands):
|
|
|
|
|
|
|
|
|
|
|
|
| ||||||||||||
|
| December 31, 2018 | ||||||||||||||||||||||
|
| Loans past due, still accruing |
| Non-accrual | ||||||||||||||||||||
|
| 30-59 Days |
| 60-89 Days |
| 90+Days |
| Loans | ||||||||||||||||
| | | | | | | | | | | | | ||||||||||||
| | As of December 31, 2021 | ||||||||||||||||||||||
| | Loans past due, still accruing | | Non-accrual | ||||||||||||||||||||
|
| 30-59 Days |
| 60-89 Days |
| 90+Days |
| Loans | ||||||||||||||||
Past due and non-accrual loans | | | | | | | | | | | | | ||||||||||||
Commercial |
| $ | 158 |
| $ | 140 |
| $ | 775 |
| $ | 17,953 | | $ | 363 | | $ | 10 | | $ | 213 | | $ | 7,004 |
Commercial real estate |
|
| 148 |
|
| 558 |
|
| — |
|
| 10,298 | | | 151 | | | 441 | | | — | | | 5,973 |
Real estate construction |
|
| 121 |
|
| — |
|
| 58 |
|
| 18 | |
| 56 | |
| — | |
| — | |
| — |
Retail real estate |
|
| 4,578 |
|
| 1,368 |
|
| 766 |
|
| 6,698 | | | 3,312 | | | 1,830 | | | 693 | | | 2,898 |
Retail other |
|
| 48 |
|
| 2 |
|
| 2 |
|
| 30 | |
| 82 | |
| 16 | |
| — | |
| 71 |
Total |
| $ | 5,053 |
| $ | 2,068 |
| $ | 1,601 |
| $ | 34,997 | ||||||||||||
Total past due and non-accrual loans | | $ | 3,964 | | $ | 2,297 | | $ | 906 | | $ | 15,946 | ||||||||||||
|
|
|
|
|
|
|
|
|
|
|
|
| ||||||||||||
|
| December 31, 2017 | ||||||||||||||||||||||
|
| Loans past due, still accruing |
| Non-accrual | ||||||||||||||||||||
|
| 30-59 Days |
| 60-89 Days |
| 90+Days |
| Loans | ||||||||||||||||
| | | | | | | | | | | | | ||||||||||||
| | As of December 31, 2020 | ||||||||||||||||||||||
| | Loans past due, still accruing | | Non-accrual | ||||||||||||||||||||
|
| 30-59 Days |
| 60-89 Days |
| 90+Days |
| Loans | ||||||||||||||||
Past due and non-accrual loans | | | | | | | | | | | | | ||||||||||||
Commercial |
| $ | 1,615 |
| $ | 323 |
| $ | 1,808 |
| $ | 5,285 | | $ | 243 | | $ | — | | $ | — | | $ | 8,523 |
Commercial real estate |
|
| 1,856 |
|
| 2,737 |
|
| — |
|
| 11,997 | |
| — | | | — | | | — | | | 5,503 |
Real estate construction |
|
| — |
|
| — |
|
| — |
|
| 608 | |
| 237 | |
| 235 | |
| — | |
| 1 |
Retail real estate |
|
| 4,840 |
|
| 1,355 |
|
| 933 |
|
| 6,714 | |
| 6,248 | | | 400 | | | 1,305 | | | 8,799 |
Retail other |
|
| 166 |
|
| 5 |
|
| — |
|
| 20 | |
| 66 | |
| 149 | |
| 66 | |
| 104 |
Total |
| $ | 8,477 |
| $ | 4,420 |
| $ | 2,741 |
| $ | 24,624 | ||||||||||||
Total past due and non-accrual loans | | $ | 6,794 | | $ | 784 | | $ | 1,371 | | $ | 22,930 | ||||||||||||
The grossGross interest income recorded on 90+ days past due loans, and that would have been recorded in the years ended December 31, 2018, 2017 and 2016on non-accrual loans if impaired loansthey had been currentaccruing interest in accordance with their original terms, was approximately $1.7$1.6 million, $1.4$1.8 million, and $0.9$2.3 million for the years ended December 31, 2021, 2020, and 2019, respectively. The amount of interestInterest collected on impairedthose loans and recognized on a cash basis that was included in interest income was immaterial$0.4 million for the year ended 2021, and was insignificant for the years ended December 31, 2020, and 2019.
Troubled Debt Restructurings
TDR loan balances are summarized as follows (dollars in 2018, $0.3 million in 2017 and immaterial in 2016.thousands):
| | | | | | |
| | As of December 31, | ||||
|
| 2021 |
| 2020 | ||
TDRs | | | | | | |
In compliance with modified terms | | $ | 1,801 | | $ | 3,814 |
30 – 89 days past due | | | — | | | 15 |
Non-performing TDRs | | | 551 | | | 1,249 |
Total TDRs | | $ | 2,352 | | $ | 5,078 |
96104
A summary of restructured loans is as follows (dollars in thousands):
|
|
|
|
|
|
|
|
| December 31, |
| December 31, | ||
|
| 2018 |
| 2017 | ||
In compliance with modified terms |
| $ | 8,319 |
| $ | 9,873 |
30 — 89 days past due |
|
| 127 |
|
| 108 |
Included in non-performing loans |
|
| 392 |
|
| 1,919 |
Total |
| $ | 8,838 |
| $ | 11,900 |
Loans classifiedthat were designated as TDRs during the twelve months ended December 31, 2018 consisted of one retail real estate modifications for short-term interest rate relief, with a recorded investment of $0.1 million. periods presented are summarized as follows (dollars in thousands):
| | | | | ��� | | | | |
| | Newly Designated TDRs | |||||||
| | | | | Recorded Investment (2) | ||||
| | Number of | | Rate | | Payment | |||
|
| Contracts (1) |
| Modification (3) | | Modification (3) | |||
December 31, 2021 | | | | | | | | | |
Commercial | | | 1 | | $ | 364 | | $ | — |
| | | | | | | | | |
December 31, 2020 | | | | | | | | | |
Commercial | | | 3 | | $ | 130 | | $ | — |
Commercial real estate | |
| 1 | | | 651 | | | — |
Retail real estate | |
| 4 | | | — | | | 986 |
Total | | | 8 | | $ | 781 | | $ | 986 |
| | | | | | | | | |
December 31, 2019 | | | | | | | | | |
Commercial | | | 2 | | $ | 342 | | $ | — |
Commercial real estate (4) | | | 1 | | | — | | | — |
Real estate construction | | | 1 | | | 185 | | | — |
Total | | | 4 | | $ | 527 | | $ | — |
| (1) | Total number of contracts that were newly designated as TDRs during years ended on the dates indicated. |
| (2) | Recorded investment for newly designated TDR’s that were still outstanding as of the dates indicated. |
| (3) | TDRs may include multiple concessions; those that include an interest rate concession and payment concession are shown in the rate modification columns. |
| (4) | NaN commercial real estate TDR that was entered into during the year ended December 31, 2019, subsequently had payment defaults; it was then transferred to OREO by December 31, 2019. |
Loans classifiedthat were designated as TDRs during the twelveand had subsequent defaults within 12 months ended December 31, 2017 consisted of three retail real estate modifications for short-term interest payment relief, with a recorded investment of $0.7 million.
The gross interest income that would have been recordedare summarized in the twelve months ended December 31, 2018 and 2017 if performing TDRs had beentable below (dollars in accordance with their original terms instead of modified terms was immaterial.
There were no TDRs that were entered into during the last twelve months that were subsequently classified as non-performing and had payment defaults (athousands). A default occurs when a loan is 90 days or more past due or transferred to non-accrual)non-accrual.
| | | | | | | | | |
| | Year Ended December 31, | |||||||
| | 2021 | | 2020 | | 2019 | |||
Defaults on loans designated as TDRs within the last 12 months | | | | | | | | | |
Commercial | | $ | — | | $ | — | | $ | — |
Commercial real estate | |
| — | |
| — | |
| 3,277 |
Gross interest income that would have been recorded during the twelve monthsyears ended December 31, 2018. There were no2021, 2020, and 2019, if TDRs had performed in accordance with their original terms compared with their modified terms, was insignificant.
Loans Modified Under the CARES Act or Interagency Statement
The CARES Act provided financial institutions the option to temporarily suspend certain requirements under GAAP related to TDRs for a limited period of time to account for the effects of COVID-19. Federal regulatory agencies, in consultation with FASB, also issued an Interagency Statement to encourage financial institutions to work with borrowers affected by COVID-19, and updating guidance which allowed banks to modify loans of customers stressed by COVID-19 without having to classify the loan as a TDR. The Company’s TDR loan totals do not include the following modified loans with payment deferrals that were entered into duringfall under the prior twelve monthsCARES Act or Interagency Statement that were subsequently classified as non-performing and had payment defaults during the twelve months ended December 31, 2017. suspended requirements under GAAP related to TDR classification (dollars in thousands):
105
| | | | | | | | | | | | |
| | As of December 31, 2021 | | As of December 31, 2020 | ||||||||
| | Number of | | Recorded | | Number of | | Recorded | ||||
|
| Contracts |
| Investment |
| Contracts |
| Investment | ||||
COVID-19 loan modifications | | | | | | | | | | | | |
Commercial loans: | | | | | | | | | | | | |
Full payment deferral (1) | | | — | | $ | — | | | 46 | | $ | 37,150 |
Interest-only deferrals | | | 32 | | | 128,730 | | | 23 | | | 85,270 |
Blended principal and interest and interest-only deferrals | | | — | | | — | | | 29 | | | 86,204 |
Total commercial loans | | | 32 | | | 128,730 | | | 98 | | | 208,624 |
| | | | | | | | | | | | |
Retail loans: | |
| | | | | | | | | | |
Mortgage and personal loan deferrals | | | 2 | | | 137 | | | 351 | | | 47,671 |
Purchased home equity line of credit pool deferrals | | | — | | | — | | | 1 | | | 119 |
Total retail loans | | | 2 | | | 137 | | | 352 | | | 47,790 |
| | | | | | | | | | | | |
Total COVID-19 loans modifications | | | 34 | | $ | 128,867 | | | 450 | | $ | 256,414 |
| (1) | Includes SBA loans with additional 90-day full payment deferrals granted by Busey. |
Loans Evaluated Individually
The Company evaluates loans with disparate risk characteristics on an individual basis. The following tables provide details of loans identified as impaired,evaluated individually, segregated by category. The unpaid contractual principal balance represents the recordedcustomer outstanding contractual principal balance prior toexcluding any partial charge-offs. The recordedRecorded investment represents the amortized cost of customer balances net of any partial charge-offs recognized on the loan. The averageAverage recorded investment is calculated using the most recent four quarters (dollars in thousands).:
| | | | | | | | | | | | | | | | | | |
| | As of and for the Year Ended December 31, 2021 | ||||||||||||||||
| | Unpaid | | Recorded Investment | | | | | Average | |||||||||
| | Principal | | With No | | With | | | | Related | | Recorded | ||||||
|
| Balance |
| Allowance |
| Allowance |
| Total |
| Allowance |
| Investment | ||||||
Loans evaluated individually | | | | | | | | | | | | | | | | | | |
Commercial | | $ | 10,247 | | $ | 498 | | $ | 6,490 | | $ | 6,988 | | $ | 3,564 | | $ | 8,791 |
Commercial real estate | |
| 6,456 | | | 5,750 | | | — | |
| 5,750 | |
| — | |
| 6,390 |
Real estate construction | |
| 272 | |
| 272 | |
| — | |
| 272 | |
| — | |
| 282 |
Retail real estate | |
| 2,514 | |
| 2,345 | |
| 25 | |
| 2,370 | |
| 25 | |
| 4,093 |
Retail other | |
| — | |
| — | |
| — | |
| — | |
| — | |
| — |
Total loans evaluated individually | | $ | 19,489 | | $ | 8,865 | | $ | 6,515 | | $ | 15,380 | | $ | 3,589 | | $ | 19,556 |
| | | | | | | | | | | | | | | | | | |
| | As of and for the Year Ended December 31, 2020 | ||||||||||||||||
| | Unpaid | | Recorded Investment | | | | | Average | |||||||||
| | Principal | | With No | | With | | | | Related | | Recorded | ||||||
|
| Balance |
| Allowance |
| Allowance |
| Total |
| Allowance |
| Investment | ||||||
Loans evaluated individually | | | | | | | | | | | | | | | | | | |
Commercial | | $ | 16,771 | | $ | 4,001 | | $ | 4,371 | | $ | 8,372 | | $ | 1,600 | | $ | 7,920 |
Commercial real estate | |
| 7,406 | | | 6,067 | | | — | |
| 6,067 | |
| — | |
| 9,349 |
Real estate construction | |
| 292 | |
| 292 | |
| — | |
| 292 | |
| — | |
| 581 |
Retail real estate | |
| 5,873 | |
| 5,490 | |
| 25 | |
| 5,515 | |
| 25 | |
| 7,439 |
Retail other | |
| — | |
| — | |
| — | |
| — | |
| — | |
| 10 |
Total loans evaluated individually | | $ | 30,342 | | $ | 15,850 | | $ | 4,396 | | $ | 20,246 | | $ | 1,625 | | $ | 25,299 |
|
|
|
|
|
|
|
|
|
|
|
|
|
|
|
|
|
|
|
|
| December 31, 2018 | ||||||||||||||||
|
| Unpaid |
| Recorded |
|
|
|
|
|
|
|
|
|
|
|
| ||
|
| Contractual |
| Investment |
| Recorded |
| Total |
|
|
|
| Average | |||||
|
| Principal |
| with No |
| Investment |
| Recorded |
| Related |
| Recorded | ||||||
|
| Balance |
| Allowance |
| with Allowance |
| Investment |
| Allowance |
| Investment | ||||||
Commercial |
| $ | 21,442 |
| $ | 6,858 |
| $ | 12,001 |
| $ | 18,859 |
| $ | 4,319 |
| $ | 13,364 |
Commercial real estate |
|
| 19,079 |
|
| 13,082 |
|
| 4,498 |
|
| 17,580 |
|
| 1,181 |
|
| 18,077 |
Real estate construction |
|
| 478 |
|
| 453 |
|
| — |
|
| 453 |
|
| — |
|
| 712 |
Retail real estate |
|
| 14,418 |
|
| 13,196 |
|
| 61 |
|
| 13,257 |
|
| 61 |
|
| 14,110 |
Retail other |
|
| 117 |
|
| 33 |
|
| — |
|
| 33 |
|
| — |
|
| 40 |
Total |
| $ | 55,534 |
| $ | 33,622 |
| $ | 16,560 |
| $ | 50,182 |
| $ | 5,561 |
| $ | 46,303 |
106
|
|
|
|
|
|
|
|
|
|
|
|
|
|
|
|
|
|
|
|
| December 31, 2017 | ||||||||||||||||
|
| Unpaid |
| Recorded |
|
|
|
|
|
|
|
|
|
|
|
| ||
|
| Contractual |
| Investment |
| Recorded |
| Total |
|
|
|
| Average | |||||
|
| Principal |
| with No |
| Investment |
| Recorded |
| Related |
| Recorded | ||||||
|
| Balance |
| Allowance |
| with Allowance |
| Investment |
| Allowance |
| Investment | ||||||
Commercial |
| $ | 10,604 |
| $ | 7,192 |
| $ | 191 |
| $ | 7,383 |
| $ | 138 |
| $ | 10,184 |
Commercial real estate |
|
| 22,218 |
|
| 16,472 |
|
| 1,964 |
|
| 18,436 |
|
| 704 |
|
| 15,195 |
Real estate construction |
|
| 1,040 |
|
| 1,016 |
|
| — |
|
| 1,016 |
|
| — |
|
| 692 |
Retail real estate |
|
| 18,517 |
|
| 14,957 |
|
| 25 |
|
| 14,982 |
|
| 25 |
|
| 13,009 |
Retail other |
|
| 40 |
|
| 20 |
|
| — |
|
| 20 |
|
| — |
|
| 44 |
Total |
| $ | 52,419 |
| $ | 39,657 |
| $ | 2,180 |
| $ | 41,837 |
| $ | 867 |
| $ | 39,124 |
Management's evaluation as to the ultimate collectability of loans includes estimates regarding future cash flows from operations and the value of property, real and personal, pledged as collateral. These estimates are affected by changing economic conditions and the economic prospects of borrowers. Collateral dependent loans are loans in which repayment is expected to be provided solely by the underlying collateral and there are no other available and reliable sources of repayment. Loans are written down to the lower of cost or fair value of underlying collateral, less estimated costs to sell. The Company had $7.9 million and $14.8 million of collateral dependent loans secured by real estate or business assets as of December 31, 2021, and December 31, 2020, respectively.
97
Allowance for LoanCredit Losses
Management estimates the ACL balance using relevant available information from internal and external sources, relating to past events, current conditions, and reasonable and supportable forecasts. Historical credit loss experience provides the basis for the estimation of expected credit losses. The cumulative loss rate used as the basis for the estimate of credit losses is comprised of the Company’s historical loss experience beginning in 2010. As of December 31, 2021, the Company expects the markets in which it operates to experience continued economic uncertainty around the levels of delinquencies over the next four quarters. Management adjusted the historical loss experience for these expectations with an immediate reversion to historical loss rate beyond this forecast period. PPP loans were excluded from the ACL calculation as they are 100% government guaranteed.
The following table detailstables summarize activity in the allowance for loan losses.ACL. Allocation of a portion of the allowanceACL to one category does not preclude its availability to absorb losses in other categories (dollars in thousands).:
| | | | | | | | | | | | | | | | | | |
| | As of and for the Year Ended December 31, 2021 | ||||||||||||||||
| | | |
| Commercial |
| Real Estate |
| Retail | | | | | | | |||
|
| Commercial |
| Real Estate |
| Construction |
| Real Estate |
| Retail Other |
| Total | ||||||
ACL beginning balance | | $ | 23,866 | | $ | 46,230 | | $ | 8,193 | | $ | 21,992 | | $ | 767 | | $ | 101,048 |
Day 1 PCD (1) | | | 3,546 | | | 336 | | | — | | | 129 | | | 167 | | | 4,178 |
Provision for credit losses | |
| (2,160) | |
| (7,651) | |
| (3,180) | |
| (4,456) | |
| 2,346 | |
| (15,101) |
Charged-off | |
| (2,026) | |
| (925) | |
| (209) | | | (1,145) | |
| (478) | |
| (4,783) |
Recoveries | |
| 629 | |
| 259 | |
| 298 | |
| 1,069 | |
| 290 | |
| 2,545 |
ACL ending balance | | $ | 23,855 | | $ | 38,249 | | $ | 5,102 | | $ | 17,589 | | $ | 3,092 | | $ | 87,887 |
|
|
|
|
|
|
|
|
|
|
|
|
|
|
|
|
|
|
|
|
| Year Ended December 31, 2018 | ||||||||||||||||
|
|
|
|
| Commercial |
| Real Estate |
| Retail Real |
|
|
|
|
|
| |||
|
| Commercial |
| Real Estate |
| Construction |
| Estate |
| Retail Other |
| Total | ||||||
Beginning balance |
| $ | 14,779 |
| $ | 21,813 |
| $ | 2,861 |
| $ | 13,783 |
| $ | 346 |
| $ | 53,582 |
Provision for loan losses |
|
| 5,767 |
|
| 3,227 |
|
| (259) |
|
| (4,824) |
|
| 518 |
|
| 4,429 |
Charged-off |
|
| (3,968) |
|
| (4,352) |
|
| (97) |
|
| (1,815) |
|
| (712) |
|
| (10,944) |
Recoveries |
|
| 1,251 |
|
| 449 |
|
| 218 |
|
| 1,327 |
|
| 336 |
|
| 3,581 |
Ending balance |
| $ | 17,829 |
| $ | 21,137 |
| $ | 2,723 |
| $ | 8,471 |
| $ | 488 |
| $ | 50,648 |
| (1) | The Day 1 PCD is attributable to the CAC acquisition. |
|
|
|
|
|
|
|
|
|
|
|
|
|
|
|
|
|
|
|
|
| Year Ended December 31, 2017 | ||||||||||||||||
|
|
|
|
| Commercial |
| Real Estate |
| Retail Real |
|
|
|
|
|
| |||
|
| Commercial |
| Real Estate |
| Construction |
| Estate |
| Retail Other |
| Total | ||||||
Beginning balance |
| $ | 13,303 |
| $ | 20,623 |
| $ | 1,870 |
| $ | 11,648 |
| $ | 351 |
| $ | 47,795 |
Provision for loan losses |
|
| (1,091) |
|
| 2,439 |
|
| 581 |
|
| 3,263 |
|
| 111 |
|
| 5,303 |
Charged-off |
|
| (994) |
|
| (1,965) |
|
| (48) |
|
| (2,691) |
|
| (541) |
|
| (6,239) |
Recoveries |
|
| 3,561 |
|
| 716 |
|
| 458 |
|
| 1,563 |
|
| 425 |
|
| 6,723 |
Ending balance |
| $ | 14,779 |
| $ | 21,813 |
| $ | 2,861 |
| $ | 13,783 |
| $ | 346 |
| $ | 53,582 |
| | | | | | | | | | | | | | | | | | |
| | As of and for the Year Ended December 31, 2020 | ||||||||||||||||
| | | |
| Commercial |
| Real Estate |
| Retail Real | | | | | | | |||
|
| Commercial |
| Real Estate |
| Construction |
| Estate |
| Retail Other |
| Total | ||||||
Beginning balance, prior to adoption of ASC 326-30 | | $ | 18,291 | | $ | 21,190 | | $ | 3,204 | | $ | 10,495 | | $ | 568 | | $ | 53,748 |
Adoption of ASC 326-30 | | | 715 | | | 9,306 | | | 2,954 | | | 3,292 | | | 566 | | | 16,833 |
Provision for credit losses | |
| 10,832 | |
| 17,511 | |
| 1,452 | |
| 9,050 | |
| (48) | |
| 38,797 |
Charged-off | |
| (6,376) | |
| (1,972) | |
| (18) | | | (2,057) | |
| (665) | |
| (11,088) |
Recoveries | |
| 404 | |
| 195 | |
| 601 | |
| 1,212 | |
| 346 | |
| 2,758 |
ACL ending balance | | $ | 23,866 | | $ | 46,230 | | $ | 8,193 | | $ | 21,992 | | $ | 767 | | $ | 101,048 |
|
|
|
|
|
|
|
|
|
|
|
|
|
|
|
|
|
|
| ||||||||||||||||||
|
| Year Ended December 31, 2016 | ||||||||||||||||||||||||||||||||||
|
|
|
|
| Commercial |
| Real Estate |
| Retail Real |
|
|
|
|
|
| |||||||||||||||||||||
|
| Commercial |
| Real Estate |
| Construction |
| Estate |
| Retail Other |
| Total | ||||||||||||||||||||||||
| | | | | | | | | | | | | | | | | | | ||||||||||||||||||
| | As of and for the Year Ended December 31, 2019 | ||||||||||||||||||||||||||||||||||
| | | |
| Commercial |
| Real Estate |
| Retail Real | | | | | | | |||||||||||||||||||||
|
| Commercial |
| Real Estate |
| Construction |
| Estate |
| Retail Other |
| Total | ||||||||||||||||||||||||
Beginning balance |
| $ | 13,115 |
| $ | 18,604 |
| $ | 1,763 |
| $ | 13,714 |
| $ | 291 |
| $ | 47,487 | | $ | 17,829 | | $ | 21,137 | | $ | 2,723 | | $ | 8,471 | | $ | 488 | | $ | 50,648 |
Provision for loan losses |
|
| 5,520 |
|
| 2,366 |
|
| (310) |
|
| (2,277) |
|
| 251 |
|
| 5,550 | ||||||||||||||||||
Provision for credit losses | |
| 4,893 | |
| 3,002 | |
| (70) | |
| 2,102 | |
| 479 | |
| 10,406 | ||||||||||||||||||
Charged-off |
|
| (6,598) |
|
| (470) |
|
| (24) |
|
| (2,106) |
|
| (458) |
|
| (9,656) | |
| (6,478) | |
| (3,257) | |
| — | | | (1,162) | |
| (863) | |
| (11,760) |
Recoveries |
|
| 1,266 |
|
| 123 |
|
| 441 |
|
| 2,317 |
|
| 267 |
|
| 4,414 | |
| 2,047 | |
| 308 | |
| 551 | |
| 1,084 | |
| 464 | |
| 4,454 |
Ending balance |
| $ | 13,303 |
| $ | 20,623 |
| $ | 1,870 |
| $ | 11,648 |
| $ | 351 |
| $ | 47,795 | | $ | 18,291 | | $ | 21,190 | | $ | 3,204 | | $ | 10,495 | | $ | 568 | | $ | 53,748 |
The following table presents the allowance for loan losses and recorded investments in portfolio loans by category (dollars in thousands):
|
|
|
|
|
|
|
|
|
|
|
|
|
|
|
|
|
|
|
|
| As of December 31, 2018 | ||||||||||||||||
|
|
|
|
| Commercial |
| Real Estate |
| Retail Real |
|
|
|
|
|
| |||
|
| Commercial |
| Real Estate |
| Construction |
| Estate |
| Retail Other |
| Total | ||||||
Allowance for loan losses |
|
|
|
|
|
|
|
|
|
|
|
|
|
|
|
|
|
|
Ending balance attributed to: |
|
|
|
|
|
|
|
|
|
|
|
|
|
|
|
|
|
|
Loans individually evaluated for impairment |
| $ | 4,319 |
| $ | 1,181 |
| $ | — |
| $ | 61 |
| $ | — |
| $ | 5,561 |
Loans collectively evaluated for impairment |
|
| 13,510 |
|
| 19,956 |
|
| 2,723 |
|
| 8,410 |
|
| 488 |
|
| 45,087 |
Ending balance |
| $ | 17,829 |
| $ | 21,137 |
| $ | 2,723 |
| $ | 8,471 |
| $ | 488 |
| $ | 50,648 |
|
|
|
|
|
|
|
|
|
|
|
|
|
|
|
|
|
|
|
Loans: |
|
|
|
|
|
|
|
|
|
|
|
|
|
|
|
|
|
|
Loans individually evaluated for impairment |
| $ | 18,441 |
| $ | 15,318 |
| $ | 453 |
| $ | 13,159 |
| $ | 33 |
| $ | 47,404 |
Loans collectively evaluated for impairment |
|
| 1,386,247 |
|
| 2,349,243 |
|
| 287,744 |
|
| 1,466,876 |
|
| 28,136 |
|
| 5,518,246 |
PCI loans evaluated for impairment |
|
| 418 |
|
| 2,262 |
|
| — |
|
| 98 |
|
| — |
|
| 2,778 |
Ending balance |
| $ | 1,405,106 |
| $ | 2,366,823 |
| $ | 288,197 |
| $ | 1,480,133 |
| $ | 28,169 |
| $ | 5,568,428 |
98107
|
|
|
|
|
|
|
|
|
|
|
|
|
|
|
|
|
|
|
|
| As of December 31, 2017 | ||||||||||||||||
|
|
|
|
| Commercial |
| Real Estate |
| Retail Real |
|
|
|
|
|
| |||
|
| Commercial |
| Real Estate |
| Construction |
| Estate |
| Retail Other |
| Total | ||||||
Allowance for loan losses |
|
|
|
|
|
|
|
|
|
|
|
|
|
|
|
|
|
|
Ending balance attributed to: |
|
|
|
|
|
|
|
|
|
|
|
|
|
|
|
|
|
|
Loans individually evaluated for impairment |
| $ | 138 |
| $ | 704 |
| $ | — |
| $ | 25 |
| $ | — |
| $ | 867 |
Loans collectively evaluated for impairment |
|
| 14,641 |
|
| 21,109 |
|
| 2,861 |
|
| 13,758 |
|
| 346 |
|
| 52,715 |
Ending balance |
| $ | 14,779 |
| $ | 21,813 |
| $ | 2,861 |
| $ | 13,783 |
| $ | 346 |
| $ | 53,582 |
|
|
|
|
|
|
|
|
|
|
|
|
|
|
|
|
|
|
|
Loans: |
|
|
|
|
|
|
|
|
|
|
|
|
|
|
|
|
|
|
Loans individually evaluated for impairment |
| $ | 6,572 |
| $ | 11,491 |
| $ | 435 |
| $ | 12,673 |
| $ | 20 |
| $ | 31,191 |
Loans collectively evaluated for impairment |
|
| 1,407,248 |
|
| 2,336,248 |
|
| 260,490 |
|
| 1,445,819 |
|
| 27,858 |
|
| 5,477,663 |
PCI loans evaluated for impairment |
|
| 811 |
|
| 6,945 |
|
| 581 |
|
| 2,309 |
|
| — |
|
| 10,646 |
Ending balance |
| $ | 1,414,631 |
| $ | 2,354,684 |
| $ | 261,506 |
| $ | 1,460,801 |
| $ | 27,878 |
| $ | 5,519,500 |
The following tables present the ACL and amortized cost of portfolio loans by category (dollars in thousands):
| | | | | | | | | | | | | | | | | | |
| | As of December 31, 2021 | ||||||||||||||||
| | Portfolio Loans | | ACL Attributed to Portfolio Loans | ||||||||||||||
| | Collectively | | Individually | | | | Collectively | | Individually | | | | |||||
| | Evaluated for | | Evaluated for | | | | Evaluated for | | Evaluated for | | | ||||||
|
| Impairment |
| Impairment |
| Total |
| Impairment |
| Impairment |
| Total | ||||||
Portfolio loan category | | | | | | | | | | | | | | | | | | |
Commercial | | $ | 1,936,898 | | $ | 6,988 | | $ | 1,943,886 | | $ | 20,291 | | $ | 3,564 | | $ | 23,855 |
Commercial real estate | | | 3,114,057 | | | 5,750 | | | 3,119,807 | | | 38,249 | | | — | | | 38,249 |
Real estate construction | | | 385,724 | | | 272 | | | 385,996 | | | 5,102 | | | — | | | 5,102 |
Retail real estate | | | 1,510,606 | | | 2,370 | | | 1,512,976 | | | 17,564 | | | 25 | | | 17,589 |
Retail other | | | 226,333 | | | — | | | 226,333 | | | 3,092 | | | — | | | 3,092 |
Total portfolio loans and related ACL | | $ | 7,173,618 | | $ | 15,380 | | $ | 7,188,998 | | $ | 84,298 | | $ | 3,589 | | $ | 87,887 |
| | | | | | | | | | | | | | | | | | |
| | As of December 31, 2020 | ||||||||||||||||
| | Portfolio Loans | | ACL Attributed to Portfolio Loans | ||||||||||||||
| | Collectively | | Individually | | | | Collectively | | Individually | | | | |||||
| | Evaluated for | | Evaluated for | | | | Evaluated for | | Evaluated for | | | ||||||
|
| Impairment |
| Impairment |
| Total |
| Impairment |
| Impairment |
| Total | ||||||
Portfolio loan category | | | | | | | | | | | | | | | | | | |
Commercial | | $ | 2,006,204 | | $ | 8,372 | | $ | 2,014,576 | | $ | 22,266 | | $ | 1,600 | | $ | 23,866 |
Commercial real estate | | | 2,886,468 | | | 6,067 | | | 2,892,535 | | | 46,230 | | | — | | | 46,230 |
Real estate construction | | | 461,494 | | | 292 | | | 461,786 | | | 8,193 | | | — | | | 8,193 |
Retail real estate | | | 1,402,337 | | | 5,515 | | | 1,407,852 | | | 21,967 | | | 25 | | | 21,992 |
Retail other | | | 37,428 | | | — | | | 37,428 | | | 767 | | | — | | | 767 |
Total portfolio loans and related ACL | | $ | 6,793,931 | | $ | 20,246 | | $ | 6,814,177 | | $ | 99,423 | | $ | 1,625 | | $ | 101,048 |
Note 7. OREO5. Other Real Estate Owned and Other Repossessed Assets
OREO representsand other repossessed assets represent properties and other assets acquired through foreclosure or other proceedings in settlement of loans and is included in other assets in the accompanying Consolidated Balance Sheets. The following table summarizes the composition of the Company’s OREO and other repossessed asset balances as of the periods presented (dollars in thousands):
| | | | | | |
|
| As of December 31, | ||||
|
| 2021 |
| 2020 | ||
OREO | | | | | | |
Commercial |
| $ | 2,839 |
| $ | 4,206 |
Residential |
| | 235 |
| | 364 |
Total OREO | | | 3,074 | | | 4,570 |
Other repossessed assets | |
| 1,342 | |
| 1 |
OREO and other repossessed assets | | $ | 4,416 | | $ | 4,571 |
The following table summarizes activity related to OREO and other repossessed assets (dollars in thousands):
| | | | | | |
|
| As of and for the Years Ended December 31, | ||||
|
| 2021 |
| 2020 | ||
Changes in OREO and other repossessed assets |
| | | | | |
OREO and other repossessed assets beginning balance |
| $ | 4,571 |
| $ | 3,057 |
Additions, transfers from loans | |
| 1,610 | |
| 2,867 |
Sales | |
| (1,721) | |
| (1,282) |
Cash payments collected | |
| (43) | |
| (3) |
Impairment of OREO and other repossessed assets | | | (1) | | | (68) |
OREO and other repossessed assets ending balance | | $ | 4,416 | | $ | 4,571 |
108
At December 31, 2018, the Company held $0.2 million in commercial OREO, $0.2 million in residential OREO and an immaterial amount of other repossessed assets. At December 31, 2017, the Company held $1.2 million in commercial OREO, $0.1 million in residential OREO and an immaterial amount of other repossessed assets. At December 31, 20182021, the Company had $2.9$0.2 million of residential real estate in the process of foreclosure. The Company has elected to follow Federal Housing Finance Agency guidelines on single-family foreclosures and real estate owned evictions on portfolio loans, as well as all COVID-19 related state foreclosure and eviction orders.
The following table summarizes activity related to OREO (dollars in thousands):
|
|
|
|
|
|
|
|
| Year Ended |
| Year Ended | ||
|
| December 31, 2018 |
| December 31, 2017 | ||
OREO: |
|
|
| |||
Beginning balance |
| $ | 1,283 |
| $ | 2,518 |
Additions, transfers from loans |
|
| 4,025 |
|
| 1,417 |
Additions, fair value from First Community acquisition |
|
| — |
|
| 722 |
Additions, fair value from Mid Illinois acquisition |
|
| — |
|
| 60 |
Proceeds from sales of OREO |
|
| (5,298) |
|
| (5,024) |
Gain on sales of OREO |
|
| 384 |
|
| 1,632 |
Valuation allowance for OREO |
|
| (18) |
|
| (42) |
Ending balance |
| $ | 376 |
| $ | 1,283 |
Note 8.6. Premises and Equipment, net
Premises and equipment, net are summarized as follows (dollars in thousands):
|
|
|
|
|
|
| ||||||
|
| December 31, | ||||||||||
|
| 2018 |
| 2017 | ||||||||
| | | | | | | ||||||
| | As of December 31, | ||||||||||
|
| 2021 |
| 2020 | ||||||||
Premises and equipment | | | | | | | ||||||
Land and improvements |
| $ | 36,453 |
| $ | 36,249 | | $ | 45,595 | | $ | 40,762 |
Buildings and improvements |
|
| 108,137 |
|
| 104,656 | |
| 132,011 | |
| 130,610 |
Furniture and equipment |
|
| 48,060 |
|
| 42,323 | |
| 54,473 | |
| 53,766 |
|
|
| 192,650 |
|
| 183,228 | ||||||
Less accumulated depreciation |
|
| 74,978 |
|
| 66,315 | ||||||
Total premises and equipment, net |
| $ | 117,672 |
| $ | 116,913 | ||||||
Premises and equipment, gross | |
| 232,079 | |
| 225,138 | ||||||
Accumulated depreciation | |
| 95,932 | |
| 89,947 | ||||||
Premises and equipment, net | | $ | 136,147 | | $ | 135,191 | ||||||
Depreciation expense was $9.6$11.6 million, $8.6$12.3 million, and $7.3$11.9 million for the years ended December 31, 2018, 20172021, 2020, and 2016,2019, respectively.
99
Note 9.7. Goodwill and Other Intangible Assets
Other than goodwill, the Company does not have any other intangible assets that are not amortized. The Company’s goodwill is associated with its three3 operating segments, Banking, Remittance ProcessingFirsTech, and Wealth Management. Goodwill is tested annually for impairment, and as part of this analysis, the reporting unit's carrying value is compared to its estimated fair value. Based on the impairment testing performed at December 31, 2018,2021, there were no indicators of potential impairment based on the estimated fair value of those operating segments. All three3 operating segments have sustainedproduced quarterly and annual profits.earnings.
During 2018, the Company adjusted goodwill by $1.7 million, relating to2021, in connection with the acquisition of Mid Illinois as it finalized its assessment ofCAC, the initial fair value of assets acquired and liabilities assumed. During 2017, the Companycompany recorded in the Banking operating segment, goodwill totaling $116.0$6.3 million and other intangible assets totaling $14.0$8.8 million in connection with the acquisition of First Community. During 2017, the Company recorded, in the Banking operating segment, goodwill totaling $50.6 million andas well as other intangible assets totaling $10.5$8.5 million in connection with the acquisition of Mid Illinois.Wealth Management segment. During 2017,2020, the Company recorded $1.0 million of other intangible assets totaling $0.4 million in the Wealth Management operating segment in connection with the acquisition of Mid Illinois. an asset acquisition.
The carrying amount of goodwill by operating segment at December 31, 2018 and 2017 is as follows (dollars in thousands):
| | | | | | |
| | As of December 31, | ||||
|
| 2021 |
| 2020 | ||
Goodwill | | | | | | |
Banking | | $ | 294,773 | | $ | 288,436 |
FirsTech | | | 8,992 | | | 8,992 |
Wealth Management | |
| 14,108 | |
| 14,108 |
Total goodwill | | $ | 317,873 | | $ | 311,536 |
|
|
|
|
|
|
|
|
| Balance at |
| Balance at | ||
Goodwill: |
| December 31, 2018 |
| December 31, 2017 | ||
Banking |
| $ | 246,999 |
| $ | 248,660 |
Remittance Processing |
|
| 8,992 |
|
| 8,992 |
Wealth Management |
|
| 11,694 |
|
| 11,694 |
Total goodwill |
| $ | 267,685 |
| $ | 269,346 |
109
Core deposit and customer relationship intangible assets are amortized on an accelerated or straight-line basis over the estimated period benefited. Other intangibleIntangible asset disclosures are as follows (dollars in thousands):
|
|
|
|
|
|
|
|
|
|
|
|
|
|
| Balance at |
|
|
|
| Balance at |
|
|
| ||
|
| December 31, |
| 2018 |
| December 31, |
| 2017 | ||||
|
| 2018 |
| Amortization |
| 2017 |
| Amortization | ||||
Amortized intangible assets: |
|
|
|
|
|
|
|
|
|
|
|
|
Core deposit intangible assets |
| $ | 31,836 |
| $ | 5,535 |
| $ | 37,371 |
| $ | 4,529 |
Customer relationship intangible assets |
|
| 1,037 |
|
| 319 |
|
| 1,356 |
|
| 716 |
|
| $ | 32,873 |
| $ | 5,854 |
| $ | 38,727 |
| $ | 5,245 |
| | | | | | | | | | | | | | | | | | |
| | As of and for the Years Ended December 31, | ||||||||||||||||
| | 2021 | | 2020 | ||||||||||||||
| | | | | Customer | | | | | | | | Customer | | | | ||
| | Core deposit | | relationship | | | | Core deposit | | relationship | | | | |||||
|
| intangible |
| intangible |
| Total |
| intangible |
| intangible |
| Total | ||||||
Intangibles | | | | | | | | | | | | | | | | | | |
Intangible assets, gross | | $ | 99,065 | | $ | 33,138 | | $ | 132,203 | | $ | 90,256 | | $ | 24,608 | | $ | 114,864 |
Accumulated amortization | | | 55,161 | | | 18,991 | | | 74,152 | | | 46,909 | | | 15,970 | | | 62,879 |
Intangible assets, net | | $ | 43,904 | | $ | 14,147 | | $ | 58,051 | | $ | 43,347 | | $ | 8,638 | | $ | 51,985 |
| | | | | | | | | | | | | | | | | | |
Amortization expense | | $ | 8,253 | | $ | 3,021 | | $ | 11,274 | | $ | 7,753 | | $ | 2,255 | | $ | 10,008 |
|
|
|
|
|
|
|
|
|
|
|
| Customer | |
|
| Core deposit |
| relationship | ||
|
| intangible |
| intangible | ||
As of December 31, 2018: |
|
|
|
|
|
|
Gross carrying amount |
| $ | 63,029 |
| $ | 13,168 |
Accumulated amortization |
|
| 31,193 |
|
| 12,131 |
|
| $ | 31,836 |
| $ | 1,037 |
|
|
|
|
|
|
|
Estimated amortization expense at December 31, 2018: |
|
|
|
|
|
|
2019 |
| $ | 5,108 |
| $ | 276 |
2020 |
|
| 4,680 |
|
| 233 |
2021 |
|
| 4,251 |
|
| 191 |
2022 |
|
| 3,820 |
|
| 148 |
2023 |
|
| 3,387 |
|
| 106 |
Thereafter |
|
| 10,590 |
|
| 83 |
|
| $ | 31,836 |
| $ | 1,037 |
Future expense for the amortization of intangible assets, as estimated, is summarized in the table below for the periods presented (dollars in thousands):
| | | | | | | | | | | | | | | | | | |
| | | | | | | | | | | As of December 31, 2021 | |||||||
| | | | | | | | | | | | | | Customer | | | | |
| | | | | | | | | | | Core deposit | | relationship | | | |||
| | | | | | | | | | | intangible | | intangible | | Total | |||
Estimated amortization expense | | | | | | | | | | | | | | | | |||
2022 | | | | | | | | | | | $ | 8,315 | | $ | 3,313 | | $ | 11,628 |
2023 | | | | | | | | | | | | 7,616 | |
| 2,816 | |
| 10,432 |
2024 | | | | | | | | | | | | 6,902 | |
| 2,318 | |
| 9,220 |
2025 | | | | | | | | | | | | 5,956 | |
| 1,887 | |
| 7,843 |
2026 | | | | | | | | | | | | 5,227 | | | 1,479 | | | 6,706 |
Thereafter | | | | | | | | | | | | 9,888 | | | 2,334 | | | 12,222 |
Total estimated amortization expense | | | | | | | | $ | 43,904 | | $ | 14,147 | | $ | 58,051 | |||
100
Note 10.8. Deposits
The composition of deposits is as follows (dollars in thousands):
|
|
|
|
|
|
| ||||||
|
| December 31, 2018 |
| December 31, 2017 | ||||||||
| | | | | | | ||||||
|
| As of December 31, | ||||||||||
|
| 2021 |
| 2020 | ||||||||
Deposits | | | | | | | ||||||
Demand deposits, noninterest-bearing |
| $ | 1,464,700 |
| $ | 1,597,421 | | $ | 3,670,267 | | $ | 2,552,039 |
Interest-bearing transaction deposits |
|
| 1,435,574 |
|
| 1,166,170 | |
| 2,720,417 | |
| 2,263,093 |
Saving deposits and money market deposits |
|
| 1,852,044 |
|
| 2,026,212 | |
| 3,442,244 | | | 2,743,369 |
Time deposits |
|
| 1,497,003 |
|
| 1,336,162 | |
| 935,649 | |
| 1,119,348 |
Total |
| $ | 6,249,321 |
| $ | 6,125,965 | ||||||
Total deposits | | $ | 10,768,577 | | $ | 8,677,849 | ||||||
The Company did not hold any brokered interest-bearing transactionAdditional information about our deposits at December 31, 2018. The Company held brokered interest-bearing transaction depositsis as follows (dollars in thousands):
| | | | | | |
|
| As of December 31, | ||||
|
| 2021 |
| 2020 | ||
Brokered savings deposits and money market deposits | | $ | 2,248 | | $ | 2,251 |
Brokered time deposits | | | 266 | | | 5,257 |
Aggregate amount of time deposits with a minimum denomination of $100,000 | | | 454,649 | | | 568,735 |
Aggregate amount of time deposits with a minimum denomination that meets or exceeds the FDIC insurance limit of $250,000 | | | 137,449 | | | 192,563 |
110
FIRST BUSEY CORPORATION
The aggregate amount of time deposits with a minimum denomination of $100,000 was approximately $673.7 million and $578.9 million at December 31, 2018 and 2017, respectively. The aggregate amount of time deposits with a minimum denomination that meets or exceeds the FDIC insurance limit of $250,000 was approximately $264.1 million and $197.9 million at December 31, 2018 and 2017, respectively. The Company held brokered time deposits of $262.5 million and $247.7 million at December 31, 2018 and 2017, respectively.NOTES TO CONSOLIDATED FINANCIAL STATEMENTS
As of December 31, 2018, the scheduledScheduled maturities of time deposits are as follows (dollars in thousands):
|
|
| |||
2019 | $ | 996,048 | |||
2020 |
| 305,167 | |||
2021 |
| 83,220 | |||
| | | | ||
|
| As of | |||
| | December 31, 2021 | |||
Time deposits by schedule of maturities | | | | ||
2022 |
| 72,048 |
| $ | 643,826 |
2023 |
| 40,504 | |
| 191,995 |
2024 | |
| 70,111 | ||
2025 | |
| 16,149 | ||
2026 | |
| 12,834 | ||
Thereafter |
| 16 | |
| 734 |
| $ | 1,497,003 | |||
Time deposits | | $ | 935,649 | ||
Note 11.9. Borrowings
Federal funds purchased are short-term borrowings that generally mature between one and ninety days. The Company had no federal funds purchased at December 31, 2018 and 2017.Securities sold under agreements to repurchase
Securities sold under agreements to repurchase, which are classified as secured borrowings, generally mature daily. Securities sold under agreements to repurchase are reflected at the amount of cash received in connection with the transaction. The underlying securities are held by the Company’s safekeeping agent. The Company may be required to provide additional collateral based on fluctuations in the fair value of the underlying securities. Securities sold under agreements to repurchase were as follows (dollars in thousands):
| | | | | | | |
|
| As of December 31, | | ||||
|
| 2021 |
| 2020 |
| ||
Securities sold under agreements to repurchase | | $ | 270,139 | | $ | 175,614 | |
Weighted average rate for securities sold under agreements to repurchase | | | 0.08 | % | | 0.13 | % |
Short-term borrowings include FHLB advances which mature in less than one year from date of origination. Term Loan
On April 30, 2018,May 28, 2021, the Company entered into a third amendment to extend the maturity of its revolving facility from April 30, 2018 to April 30, 2019, to decrease the maximum principal amount from $40.0 million to $20.0 million, and to amend the annual interest rate. Subsequent to year end, on January 29, 2019, the Company entered into anSecond Amended and Restated Credit Agreement, pursuant to allow any outstanding balance onwhich the Company has access to (i) a $40.0 million revolving facility at the maturityline of credit with a termination date of April 30, 2019 to be converted into2022, and (ii) a $60.0 million term loan with a maturity date of April 30, 2021.May 31, 2026. The loans have an annual interest rate of 1.75% plus the 1-month LIBOR rate. Proceeds of the term loan were used to fund a part of the cash portion of the merger consideration related to the acquisition of CAC and for general corporate purposes. The revolving credit facility incurs a non-usage fee based on any undrawn amounts. As of December 31, 2021, there was 0 balance outstanding on the undrawn amount.revolving credit facility and a total of $54.0 million outstanding on the term loan, of which $12.0 million is short-term and $42.0 million is long-term. Quarterly payments on the term loan reduce the outstanding principal balance by $3.0 million each quarter.
Short-term Borrowings
Short-term borrowings are summarized as follows (dollars in thousands):
| | | | | | |
|
| As of December 31, | ||||
|
| 2021 |
| 2020 | ||
Short-term borrowings | | | | | | |
FHLB advances maturing in less than one year from date of origination, and the current portion of long-term FHLB advances due within 12 months | | $ | 5,678 | | $ | 4,658 |
Term Loan, current portion due within 12 months | | | 12,000 | | | — |
Total short-term debt | | $ | 17,678 | | $ | 4,658 |
Federal funds purchased are short-term borrowings that generally mature between one and 90 days. The Company had no outstanding balance on the revolving facility at0 federal funds purchased as of December 31, 20182021, or 2017. 2020.
The Amended and Restated Credit Agreement also provides for a $60.0 million term loan (the “Term Loan”) with a maturity date of November 30, 2023. The loan has an annual interest rate of one-month LIBOR plus a spread of 1.50%. The proceeds of the Term Loan were used to fund the cash consideration related to the acquisition of Banc Ed.
101111
Long-term Debt
The following table sets forth the distribution of securities sold under agreements to repurchase and short-term borrowings and weighted average interest rates (dollars in thousands):
|
|
|
|
|
|
|
|
|
| December 31, |
| December 31, |
| ||
|
| 2018 |
| 2017 |
| ||
Securities sold under agreements to repurchase |
|
|
|
|
|
|
|
Balance at end of period |
| $ | 185,796 |
| $ | 304,566 |
|
Weighted average interest rate at end of period |
|
| 1.05 | % |
| 0.57 | % |
Maximum outstanding at any month end in year-to-date period |
| $ | 267,596 |
| $ | 304,566 |
|
Average daily balance for the year-to-date period |
| $ | 234,239 |
| $ | 213,527 |
|
Weighted average interest rate during period(1) |
|
| 0.69 | % |
| 0.46 | % |
|
|
|
|
|
|
|
|
Short-term borrowings, FHLB advances |
|
|
|
|
|
|
|
Balance at end of period |
| $ | — |
| $ | 220,000 |
|
Weighted average interest rate at end of period |
|
| — | % |
| 1.42 | % |
Maximum outstanding at any month end in year-to-date period |
| $ | 225,000 |
| $ | 234,600 |
|
Average daily balance for the year-to-date period |
| $ | 81,438 |
| $ | 84,201 |
|
Weighted average interest rate during period(1) |
|
| 1.80 | % |
| 1.20 | % |
|
|
Long-term debt is summarized as follows (dollars in thousands):
|
|
|
|
|
|
|
|
| December 31, |
| December 31, | ||
|
| 2018 |
| 2017 | ||
Notes payable, FHLB, ranging in original maturity from nineteen months to ten years, collateralized by FHLB deposits, residential and commercial real estate loans and FHLB stock. |
| $ | 50,000 |
| $ | 50,000 |
| | | | | | |
|
| As of December 31, | ||||
|
| 2021 |
| 2020 | ||
Long-term debt | | | | | | |
Notes payable, FHLB, original maturity of 5 years, collateralized by FHLB deposits, residential and commercial real estate loans and FHLB stock | | $ | 4,056 | | $ | 4,757 |
Term Loan | | | 42,000 | | | — |
Total long-term debt | | $ | 46,056 | | $ | 4,757 |
As of December 31, 2018,2021, and 2020, funds borrowed from the FHLB, listed above, consisted of one variable-rate notesnote maturing through September 2024,May 2023, with an interest rates ranging from 2.20% to 2.41%. The weighted average rate on these long-term advances was 2.28% as of December 31, 2018. As of December 31, 2017, funds borrowed from the FHLB, listed above, consisted of variable-rate3.04%.
Senior and subordinated notes maturing through September 2024, with interest rates ranging from 1.10% to 1.32%. The weighted average rate on these long-term advances was 1.19% as of December 31, 2017.
On May 25, 2017, the Company issued $40.0 million of 3.75% senior notes that mature on May 25, 2022. The senior notes are payable semi-annually on each May 25 and November 25, commencing on November 25, 2017. The senior notes are not subject to optional redemption by the Company. Additionally, on May 25, 2017, the Company issued $60.0 million of fixed-to-floating rate subordinated notes that mature on May 25, 2027. The subordinated notes, which qualify as Tier 2 capital for First Busey, arebear interest at an initialannual rate of 4.75% for the first five years after issuance and thereafter bear interest at an annuala floating rate equal to three-monththe 3-month LIBOR plus a spread of 2.919%., as calculated on each applicable determination date. The subordinated notes are payable semi-annually on each May 25 and November 25, commencing on November 25, 2017, during the five year fixed-termfive-year fixed term and thereafter eachon February 25, May 25, August 25, and November 25 of each year, commencing on August 25, 2022. The subordinated notes have an optional redemption in whole or in part on any interest payment date on or after May 25, 2022. The senior notes and subordinated notes are unsecured obligations of the Company.
On June 1, 2020, the Company issued $125.0 million of fixed-to-floating rate subordinated notes that mature on June 1, 2030. The subordinated notes, which qualify as Tier 2 capital for First Busey, bear interest at an annual rate of 5.25% for the first five years after issuance and thereafter bear interest at a floating rate equal to a three-month benchmark rate plus a spread of 5.11%, as calculated on each applicable determination date. The subordinated notes are payable semi-annually on each June 1 and December 1, during the five-year fixed-term, and thereafter on March 1, June 1, September 1, and December 1 of each year, commencing on September 1, 2025. The subordinated notes have an optional redemption, in whole or in part, on any interest payment date on or after June 1, 2025. The subordinated notes are unsecured obligations of the Company.
Unamortized debt issuance costs related to the senior notes and subordinated notes totaled $0.5 million and $0.9 million, respectively, at December 31, 2018. Unamortized debt issuance costs related toare presented in the senior notes and subordinated notes totaled $0.6 million and $1.0 million, respectively, at December 31, 2017. The Company used the net proceeds from the offering to finance a portion of the cash consideration for its acquisition of First Community, to redeem a portion of First Community subordinated debenturesfollowing table (dollars in July 2017, and to finance a portion of the cash consideration for its acquisition of Mid Illinois in October 2017, with the remaining proceeds to be used for general corporate purposes.thousands):
| | | | | | |
|
| As of December 31, | ||||
|
| 2021 |
| 2020 | ||
Unamortized debt issuance costs | | | | | | |
Senior notes issued in 2017 | | $ | 56 | | $ | 191 |
Subordinated notes issued in 2017 | | | 549 | | | 651 |
Subordinated notes issued in 2020 | | | 1,678 | | | 2,123 |
Total unamortized debt issuance costs | | $ | 2,283 | | $ | 2,965 |
In relation to the First Community acquisition, the Company assumed $15.3 million in subordinated debt, of which $9.8 million was simultaneously redeemed. A $0.3 million purchase accounting premium was recorded on the remaining subordinated debt. On September 30, 2018, the Company, at its option, redeemed the balance of the subordinated debt at a redemption price equal to the principal amount outstanding plus accrued but unpaid interest.
102112
Note 12.10. Junior Subordinated Debt Owed to Unconsolidated Trusts
First Busey maintains statutory trusts for the sole purpose of issuing and servicing trust preferred securities and related trust common securities. The proceedsProceeds from such issuances were used by the trusts to purchase junior subordinated notes of the Company, which are the sole assets of each trust. Concurrent with the issuance of the trust preferred securities, the Company issued guarantees for the benefit of the holders of the trust preferred securities. The trust preferred securities are instruments that qualify, and are treated by the Company, as Tier 1 regulatory capital. The Company owns all of the common securities of each trust. The trust preferred securities issued by each trust rank equally with the common securities in right of payment, except that if an event of default under the indenture governing the notes has occurred and is continuing, the preferred securities will rank senior to the common securities in right of payment. In connection with the Pulaski acquisition in 2016, the Company acquired similar statutory trusts previously maintained by Pulaski and the fair value adjustment is being accreted over thetheir weighted average remaining life.life, with a balance of $3.0 million remaining to be accreted. The Company had $71.2$71.6 million and $71.0$71.5 million of junior subordinated debt owed to unconsolidated trusts at December 31, 20182021, and 2017, respectively.2020, respectively, maturing in 2034 through 2036.
The trust preferred securities are subject to mandatory redemption, in whole or in part, upon repayment of the junior subordinated notes at par value at the stated maturity date or upon redemption. Each trust’s ability to pay amounts due on the trust preferred securities is solely dependent upon the Company making payment on the related junior subordinated notes. The Company’s obligations under the junior subordinated notes and other relevant trust agreements, in aggregate, constitute a full and unconditional guarantee by the Company of each trust’s obligations under the trust preferred securities issued by each trust. The Company has the right to defer payment of interest on the notes, in which case the distributions on the trust preferred securities will also be deferred, for up to five years, but not beyond the stated maturity date.
UnderFor regulatory capital purposes, current banking regulations bank holding companies are allowed to includeallow for the inclusion in Tier 1 Capital qualifying trust preferred securities in their Tier 1 Capital for regulatory capital purposes, subject to a 25% limitation to all core (Tier 1) capital elements, net of goodwill and other intangible assets less any associated deferred tax liability. As of December 31, 2018, 100% of the trust preferred securities qualified as Tier 1 capital under the final rule adopted in March 2005.
The Dodd-Frank Act mandated the Federal Reserve to establish minimum capital levels for holding companies on a consolidated basis as stringent as those required for FDIC-insured institutions. A result of this change is that the proceeds of hybrid instruments, such as trust preferred securities, are excluded from capital over a phase-out period. However, if such securities were issued prior to May 19, 2010, by bank holding companies with less than $15.0 billion of assets, they maybut do not allow for additional Tier 1 Capital to be retained, subject to certain restrictions. Becauseraised through the Company has assets of less than $15.0 billion, it is able to maintain its trust preferred proceeds as capital, but the Company has to comply with new capital mandates in other respects and will not be able to raise capital in the future through the issuance of trust preferred securities. As of December 31, 2021, 100% of the trust preferred securities qualified as Tier 1 Capital; however, once the Company reaches $15.0 billion in assets, its trust preferred securities will no longer quality as Tier 1 Capital.
103
Note 13.11. Regulatory Capital
The Company and the BanksBusey Bank are subject to various regulatory capital requirements administered by federal banking agencies. Failure to meet minimum capital requirements can initiate certain mandatory—mandatory – and possibly additional discretionary—discretionary – actions by regulators that, if undertaken, could have a direct material effect on the Company's consolidated financial statements.The capital Capital amounts and classification also are subject to qualitative judgments by the regulators about components, risk weightings, and other factors.
Banking regulations identify five capital categories for insured depository institutions: well capitalized, adequately capitalized, undercapitalized, significantly undercapitalized, and critically undercapitalized. As of December 31, 20182021, and 2017,2020, all capital ratios of the Company and the BanksBusey Bank exceeded the well capitalized levels under the applicable regulatory capital adequacy guidelines.Management believes that no events or changes have occurred subsequent to December 31, 20182021, that would change this designation.
The following tables summarizeOn March 27, 2020, the applicable holding companyFDIC and bankother federal banking agencies published an Interim Final Rule that provides those banking organizations adopting CECL during 2020 with the option to delay for two years the estimated impact of CECL on regulatory capital requirements (dollarsand to phase in thousands):the aggregate impact of the deferral on regulatory capital over a subsequent three-year period. On August 26, 2020, the CECL final rule was finalized and was substantially similar to the Interim Final Rule. Under this final rule, because the Company has elected to use the deferral option, the regulatory capital impact of our transition adjustments recorded on January 1, 2020, from the adoption of CECL will be deferred for two years, until January 1, 2022. In addition, 25 percent of the ongoing impact of CECL on our ACL, retained earnings, and average total consolidated assets from January 1, 2020, through the end of the two-year deferral period, each as reported for regulatory capital purposes, will be added to the deferred transition amounts (“adjusted transition amounts”) and deferred for the two-year period. At the conclusion of the two-year period, the adjusted transition amounts will be phased-in for regulatory capital purposes at a rate of 25 percent per year, with the phased-in amounts included in regulatory capital at the beginning of each year.
|
|
|
|
|
|
|
|
|
|
|
|
|
|
|
|
|
|
|
|
|
|
|
|
|
|
|
| Minimum |
| ||||||
|
|
|
|
|
|
| Minimum |
|
| To Be Well |
| ||||||
| Actual |
|
| Capital Requirement |
|
| Capitalized |
| |||||||||
| Amount |
| Ratio |
|
| Amount |
| Ratio |
|
| Amount |
| Ratio |
| |||
As of December 31, 2018: |
|
|
|
|
|
|
|
|
|
|
|
|
|
|
|
|
|
Total Capital (to Risk Weighted Assets) |
|
|
|
|
|
|
|
|
|
|
|
|
|
|
|
|
|
Consolidated | $ | 894,572 |
| 14.83 | % |
| $ | 482,638 |
| 8.00 | % |
| $ | 603,297 |
| 10.00 | % |
Busey Bank | $ | 854,351 |
| 14.19 | % |
| $ | 481,701 |
| 8.00 | % |
| $ | 602,126 |
| 10.00 | % |
|
|
|
|
|
|
|
|
|
|
|
|
|
|
|
|
|
|
Tier 1 Capital (to Risk Weighted Assets) |
|
|
|
|
|
|
|
|
|
|
|
|
|
|
|
|
|
Consolidated | $ | 783,924 |
| 12.99 | % |
| $ | 361,978 |
| 6.00 | % |
| $ | 482,638 |
| 8.00 | % |
Busey Bank | $ | 803,703 |
| 13.35 | % |
| $ | 361,276 |
| 6.00 | % |
| $ | 481,701 |
| 8.00 | % |
|
|
|
|
|
|
|
|
|
|
|
|
|
|
|
|
|
|
Common Equity Tier 1 Capital (to Risk Weighted Assets) |
|
|
|
|
|
|
|
|
|
|
|
|
| ||||
Consolidated | $ | 709,924 |
| 11.77 | % |
| $ | 271,484 |
| 4.50 | % |
| $ | 392,143 |
| 6.50 | % |
Busey Bank | $ | 803,703 |
| 13.35 | % |
| $ | 270,957 |
| 4.50 | % |
| $ | 391,382 |
| 6.50 | % |
|
|
|
|
|
|
|
|
|
|
|
|
|
|
|
|
|
|
Tier 1 Capital (to Average Assets) |
|
|
|
|
|
|
|
|
|
|
|
|
|
|
|
|
|
Consolidated | $ | 783,924 |
| 10.36 | % |
| $ | 302,704 |
| 4.00 | % |
|
| N/A |
| N/A |
|
Busey Bank | $ | 803,703 |
| 10.64 | % |
| $ | 302,232 |
| 4.00 | % |
| $ | 377,789 |
| 5.00 | % |
|
|
|
|
|
|
|
|
|
|
|
|
|
|
|
|
|
|
|
|
|
|
|
|
| Minimum |
|
| Minimum |
| ||||||
|
|
|
|
|
|
| Capital Requirement plus |
|
| To Be Well |
| ||||||
| Actual |
|
| Capital Buffer |
|
| Capitalized |
| |||||||||
| Amount |
| Ratio |
|
| Amount |
| Ratio |
|
| Amount |
| Ratio |
| |||
As of December 31, 2017: |
|
| |||||||||||||||
Total Capital (to Risk Weighted Assets) |
|
|
|
|
|
|
|
|
|
|
|
|
|
|
|
|
|
Consolidated | $ | 837,183 |
| 14.15 | % |
| $ | 473,310 |
| 8.00 | % |
| $ | 591,638 |
| 10.00 | % |
Busey Bank | $ | 704,807 |
| 12.78 | % |
| $ | 441,062 |
| 8.00 | % |
| $ | 551,327 |
| 10.00 | % |
South Side Bank | $ | 84,914 |
| 22.61 | % |
| $ | 30,049 |
| 8.00 | % |
| $ | 37,561 |
| 10.00 | % |
|
|
|
|
|
|
|
|
|
|
|
|
|
|
|
|
|
|
Tier 1 Capital (to Risk Weighted Assets) |
|
|
|
|
|
|
|
|
|
|
|
|
|
|
|
|
|
Consolidated | $ | 718,101 |
| 12.14 | % |
| $ | 354,983 |
| 6.00 | % |
| $ | 473,310 |
| 8.00 | % |
Busey Bank | $ | 651,432 |
| 11.82 | % |
| $ | 330,797 |
| 6.00 | % |
| $ | 441,062 |
| 8.00 | % |
South Side Bank | $ | 84,707 |
| 22.55 | % |
| $ | 22,537 |
| 6.00 | % |
| $ | 30,049 |
| 8.00 | % |
|
|
|
|
|
|
|
|
|
|
|
|
|
|
|
|
|
|
Common Equity Tier 1 Capital (to Risk Weighted Assets) |
|
|
|
|
|
|
|
|
|
|
|
|
| ||||
Consolidated | $ | 644,633 |
| 10.90 | % |
| $ | 266,237 |
| 4.50 | % |
| $ | 384,565 |
| 6.50 | % |
Busey Bank | $ | 651,432 |
| 11.82 | % |
| $ | 248,098 |
| 4.50 | % |
| $ | 358,363 |
| 6.50 | % |
South Side Bank | $ | 84,707 |
| 22.55 | % |
| $ | 16,903 |
| 4.50 | % |
| $ | 24,415 |
| 6.50 | % |
|
|
|
|
|
|
|
|
|
|
|
|
|
|
|
|
|
|
Tier 1 Capital (to Average Assets) |
|
|
|
|
|
|
|
|
|
|
|
|
|
|
|
|
|
Consolidated | $ | 718,101 |
| 9.78 | % |
| $ | 293,588 |
| 4.00 | % |
|
| N/A |
| N/A |
|
Busey Bank | $ | 651,432 |
| 9.80 | % |
| $ | 265,847 |
| 4.00 | % |
| $ | 332,309 |
| 5.00 | % |
South Side Bank | $ | 84,707 |
| 12.75 | % |
| $ | 26,571 |
| 4.00 | % |
| $ | 33,214 |
| 5.00 | % |
104113
On June 1, 2020, the Company issued $125.0 million of fixed-to-floating rate subordinated notes that mature on June 1, 2030, which qualify as Tier 2 capital for regulatory purposes.
The following tables summarize regulatory capital requirements applicable to the holding company and its subsidiary bank (dollars in thousands):
| | | | | | | | | | | | | | | | |
| | As of December 31, 2021 | | |||||||||||||
| | | | | | | | | | | | Minimum | | |||
| | | | | | | Minimum | | To Be Well |
| ||||||
| | Actual | | Capital Requirement | | Capitalized |
| |||||||||
|
| Amount |
| Ratio |
| Amount |
| Ratio |
| Amount |
| Ratio |
| |||
Common Equity Tier 1 Capital to Risk Weighted Assets | | | | | | | | | | | | |||||
Consolidated | | $ | 995,874 |
| 11.85 | % | $ | 378,334 |
| 4.50 | % | $ | 546,482 |
| 6.50 | % |
Busey Bank | | $ | 1,241,303 |
| 14.81 | % | $ | 377,096 |
| 4.50 | % | $ | 544,695 |
| 6.50 | % |
| | | | | | | | | | | | | | | | |
Tier 1 Capital to Risk Weighted Assets | | | | | | | | | | | | | | | | |
Consolidated | | $ | 1,069,874 |
| 12.73 | % | $ | 504,445 |
| 6.00 | % | $ | 672,594 |
| 8.00 | % |
Busey Bank | | $ | 1,241,303 |
| 14.81 | % | $ | 502,795 |
| 6.00 | % | $ | 670,394 |
| 8.00 | % |
| | | | | | | | | | | | | | | | |
Total Capital to Risk Weighted Assets | | | | | | | | | | | | | | | | |
Consolidated | | $ | 1,320,187 |
| 15.70 | % | $ | 672,594 |
| 8.00 | % | $ | 840,742 |
| 10.00 | % |
Busey Bank | | $ | 1,306,616 |
| 15.59 | % | $ | 670,394 |
| 8.00 | % | $ | 837,992 |
| 10.00 | % |
| | | | | | | | | | | | | | | | |
Leverage Ratio of Tier 1 Capital to Average Assets | | | | | | | | | | | | | | | | |
Consolidated | | $ | 1,069,874 |
| 8.52 | % | $ | 502,336 |
| 4.00 | % |
| N/A |
| N/A | |
Busey Bank | | $ | 1,241,303 |
| 9.91 | % | $ | 501,104 |
| 4.00 | % | $ | 626,379 |
| 5.00 | % |
| | | | | | | | | | | | | | | | |
| | As of December 31, 2020 | | |||||||||||||
| | | | | | | | | | | | Minimum | | |||
| | | | | | | Minimum | | To Be Well | | ||||||
| | Actual | | Capital Requirement | | Capitalized | | |||||||||
|
| Amount |
| Ratio |
| Amount |
| Ratio |
| Amount |
| Ratio |
| |||
Common Equity Tier 1 Capital to Risk Weighted Assets | | | | | | | | | | | | |||||
Consolidated | | $ | 909,033 |
| 12.43 | % | $ | 329,071 |
| 4.50 | % | $ | 475,325 |
| 6.50 | % |
Busey Bank | | $ | 1,053,910 |
| 14.44 | % | $ | 328,546 |
| 4.50 | % | $ | 474,567 |
| 6.50 | % |
| | | | | | | | | | | | | | | | |
Tier 1 Capital to Risk Weighted Assets | | | | | | | | | | | | | | | | |
Consolidated | | $ | 983,033 |
| 13.44 | % | $ | 438,761 |
| 6.00 | % | $ | 585,015 |
| 8.00 | % |
Busey Bank | | $ | 1,053,910 |
| 14.44 | % | $ | 438,062 |
| 6.00 | % | $ | 584,082 |
| 8.00 | % |
| | | | | | | | | | | | | | | | |
Total Capital to Risk Weighted Assets | | | | | | | | | | | | | | | | |
Consolidated | | $ | 1,245,997 |
| 17.04 | % | $ | 585,015 |
| 8.00 | % | $ | 731,269 |
| 10.00 | % |
Busey Bank | | $ | 1,131,875 |
| 15.50 | % | $ | 584,082 |
| 8.00 | % | $ | 730,103 |
| 10.00 | % |
| | | | | | | | | | | | | | | | |
Leverage Ratio of Tier 1 Capital to Average Assets | | | | | | | | | | | | | | | | |
Consolidated | | $ | 983,033 |
| 9.79 | % | $ | 401,717 |
| 4.00 | % |
| N/A |
| N/A | |
Busey Bank | | $ | 1,053,910 |
| 10.52 | % | $ | 400,581 |
| 4.00 | % | $ | 500,727 |
| 5.00 | % |
114
In July 2013, the U.S. federal banking authorities approved the Basel III Rule for strengthening international capital standards. The Basel III Rule introduced a capital conservation buffer, composed entirely of CET1,Common Equity Tier 1 Capital, which is added to the minimum risk-weighted asset ratios. The capital conservation buffer is not a minimum capital requirement; however, banking institutions with a ratio of CET1Common Equity Tier 1 Capital to risk-weighted assets below the capital conservation buffer will face constraints on dividends, equity repurchases, and discretionary bonus payments based on the amount of the shortfall. When fully phased in on January 1, 2019, the capital conservation buffer is 2.5% of CET1. In order to refrain from restrictions on dividends, equity repurchases, and discretionary bonus payments, banking institutions must maintain minimum ratios of (i) CET1Common Equity Tier 1 to risk-weighted assets of at least 7.0%, (ii) Tier 1 capital to risk-weighted assets of at least 8.5%, and (iii) Total capital to risk-weighted assets of at least 10.5%.
The ability of the Company to pay cash dividends to its stockholders and to service its debt was historicallyis dependent on the receipt of cash dividends from its subsidiaries. Under applicable regulatory requirements, an Illinois state-chartered bank, such as Busey Bank, may not pay dividends in excess of its net profits. Because Busey Bank had been in an accumulated deficit position since 2009, it was not able to pay dividends. With prior approval from its regulators, however, an Illinois state-chartered bank in that situation was able to reduce its capital stock by amending its charter to decrease the authorized number of shares, and then make a subsequent distribution to its holding company. Using this approach, and with the approval of its regulators, Busey Bank has distributed fundspaid dividends to the Company of $60.0 million during the most recent of which was $40.0year ended December 31, 2021, and $122.0 million on October 12, 2018. Busey Bank returned to positive retained earnings induring the second quarter of 2018. The Company expects Busey Bank to return to paying dividends in future periods.year ended December 31, 2020.
Note 14.12. Income Taxes
The components of income taxes consist of (dollars in thousands):
|
|
|
|
|
|
|
|
|
| |||||||||
|
| Years Ended December 31, | ||||||||||||||||
|
| 2018 |
| 2017 |
| 2016 | ||||||||||||
| | | | | | | | | | |||||||||
| | Years Ended December 31, | ||||||||||||||||
|
| 2021 |
| 2020 |
| 2019 | ||||||||||||
Income tax expense | | | | | | | | | | |||||||||
Current expense: |
|
|
|
|
|
|
|
|
| | | | | | | | | |
Federal |
| $ | 18,076 |
| $ | 27,168 |
| $ | 15,486 | | $ | 20,261 | | $ | 21,027 | | $ | 22,479 |
State |
|
| 9,807 |
|
| 4,117 |
|
| 785 | | | 8,448 | | | 12,144 | | | 8,910 |
Deferred expense: |
|
|
|
|
|
|
|
|
| |
| | | | | | | |
Federal |
|
| 5,068 |
|
| 11,583 |
|
| 6,147 | | | 3,644 | | | (3,657) | | | (380) |
State |
|
| 2,048 |
|
| 2,517 |
|
| 4,305 | | | 1,021 | | | (1,652) | | | 476 |
Total income tax expense |
| $ | 34,999 |
| $ | 45,385 |
| $ | 26,723 | | $ | 33,374 | | $ | 27,862 | | $ | 31,485 |
A reconciliation of federal and state income taxes at statutory rates to the income taxes included in the accompanying Consolidated Statements of Income is as follows:
|
|
|
|
|
|
|
| ||||||||||
|
| Years Ended December 31, |
| ||||||||||||||
|
| 2018 |
| 2017 |
| 2016 |
| ||||||||||
|
| % of |
| % of |
| % of |
| ||||||||||
|
| Pretax |
| Pretax |
| Pretax |
| ||||||||||
|
| Income |
| Income |
| Income |
| ||||||||||
| | | | | | | | | | | |||||||
| | | Years Ended December 31, |
| |||||||||||||
|
|
| 2021 |
|
| 2020 |
|
| 2019 |
| |||||||
Percent of pretax income | | | | | | | | | | | |||||||
Income tax at federal statutory rate |
| 21.0 | % | 35.0 | % | 35.0 | % |
|
| 21.0 | % |
| 21.0 | % |
| 21.0 | % |
Effect of: |
|
|
|
|
|
|
| | | | | | | | | | |
TCJA |
| — | % | 7.5 | % | — | % | ||||||||||
Tax-exempt interest, net |
| (1.3) | % | (2.1) | % | (2.4) | % |
|
| (1.1) | % |
| (1.6) | % |
| (1.7) | % |
Stock incentive |
| (0.3) | % | (0.5) | % | — | % | | | — | % | | 0.2 | % | | (0.1) | % |
State income taxes, net |
| 7.3 | % | 4.0 | % | 4.3 | % |
|
| 4.5 | % |
| 6.5 | % |
| 5.5 | % |
Income on bank owned life insurance |
| (0.6) | % | (0.9) | % | (1.0) | % |
|
| (0.7) | % |
| (0.9) | % |
| (0.9) | % |
Tax credit investments | | | (3.6) | % | | (3.2) | % | | (1.3) | % | |||||||
Other, net |
| — | % | (1.0) | % | (0.9) | % |
|
| 1.2 | % |
| (0.3) | % |
| 0.9 | % |
|
| 26.1 | % | 42.0 | % | 35.0 | % | ||||||||||
Effective income tax rate |
|
| 21.3 | % |
| 21.7 | % |
| 23.4 | % | |||||||
On December 22, 2017, TCJA was signed into law and became effective January 2018. The TCJA reduced the corporate tax rate as well as adjusted tax rates, deductions and exemptions for individuals and businesses alike. The Company took a non-recurring, non-cash charge of $8.1 million in the fourth quarter of 2017 as a result of the revaluation of the Company’s net deferred tax position following the enactment of the TCJA.
105115
Net deferred taxes, at December 31, 2018 and 2017reported in other assets or other liabilities in the accompanying Consolidated Balance Sheets, include the following amounts of deferred tax assets and liabilities (dollars in thousands).:
|
|
|
|
|
|
| ||||||
|
| 2018 |
| 2017 | ||||||||
| | | | | | | ||||||
|
| As of December 31, | ||||||||||
|
| 2021 |
| 2020 | ||||||||
Deferred taxes | | | | | | | ||||||
Deferred tax assets: |
|
|
|
|
|
| | | | | | |
ACL | | $ | 25,884 | | $ | 30,332 | ||||||
Unrealized loss on cash flow hedge | | | 273 | | | 871 | ||||||
Unrealized losses on securities available for sale |
| $ | 2,716 |
| $ | 1,362 | | | 9,199 | | | — |
Allowance for loan losses |
|
| 14,885 |
|
| 15,751 | ||||||
Stock-based compensation |
|
| 2,208 |
|
| 1,869 | |
| 4,204 | |
| 2,975 |
Deferred compensation |
|
| 1,454 |
|
| 2,455 | |
| 55 | |
| 66 |
Affordable housing partnerships and other investments |
|
| 691 |
|
| 970 | ||||||
Purchase accounting adjustments |
|
| 4,563 |
|
| 7,712 | | | 1,213 | | | 4,470 |
Accrued vacation |
|
| 744 |
|
| 604 | |
| 398 | |
| 610 |
Lease liabilities | | | 2,893 | | | 2,142 | ||||||
Employee costs |
|
| 260 |
|
| 759 | |
| 2,847 | |
| 1,598 |
Other |
|
| 1,095 |
|
| 1,336 | |
| 390 | |
| 431 |
|
| $ | 28,616 |
| $ | 32,818 | ||||||
|
|
|
|
|
|
| ||||||
Total deferred tax assets | | | 47,356 | | | 43,495 | ||||||
| | | | | | | ||||||
Deferred tax liabilities: |
|
|
|
|
|
| | | | | | |
Unrealized gain on securities available for sale | | | — | | | (14,151) | ||||||
Basis in premises and equipment |
|
| (1,213) |
|
| (1,909) | |
| (1,347) | |
| (348) |
Affordable housing partnerships and other investments |
|
| (1,868) |
|
| (1,769) | | | (3,696) | | | (1,995) |
Purchase accounting adjustments |
|
| (1,102) |
|
| (1,262) | | | (1,362) | | | (1,835) |
Mortgage servicing assets |
|
| (1,159) |
|
| (1,120) | |
| (2,853) | |
| (3,418) |
Basis in core deposit and customer intangible assets |
|
| (9,299) |
|
| (10,955) | ||||||
Basis in core deposit, customer intangible assets, and asset purchase goodwill | |
| (9,485) | |
| (12,714) | ||||||
Deferred loan origination costs |
|
| (1,593) |
|
| (1,168) | |
| (2,454) | |
| (2,654) |
Right of use assets | | | (2,877) | | | (2,130) | ||||||
Unrealized gain on equity securities | | | (1,099) | | | (276) | ||||||
Other |
|
| (984) |
|
| — | |
| (560) | |
| (405) |
|
| $ | (17,218) |
| $ | (18,183) | ||||||
Net operating loss carryforward, net of valuation allowance |
|
| 33 |
|
| 2,661 | ||||||
Net deferred tax assets |
| $ | 11,431 |
| $ | 17,296 | ||||||
Total deferred tax liabilities | | | (25,733) | | | (39,926) | ||||||
| | | | | | | ||||||
Net deferred tax asset | | $ | 21,623 | | $ | 3,569 | ||||||
At December 31, 2018,2021, the Company had an immaterial federalstate net operating loss carryforward remainingcarryforwards for Wisconsin and California, both of which were an insignificant amount and will begin to expire in relation to the First Community acquisition, which is subject to limitations under Section 382 of the Internal Revenue Code. At December 31, 2017, the Company had a federal net operating loss carryforward of $2.7 million, or approximately $12.7 million pre-tax.year 2041.
At December 31, 2017, the Company had a Florida net operating loss carryforward of $0.1 million with a full valuation allowance, which was utilized in 2018.
Management believes that it is more likely than not that the other deferred tax assets included in the accompanying Consolidated Balance Sheets will be fully realized. The Company has determined that no additional0 valuation allowance is required for any other deferred tax assets as of December 31, 2018 and 2017.2021, or 2020.
Note 15.13. Employee Benefit Plans
Employees' Stock OwnershipActive Benefit Plans
Profit-Sharing Plan
Prior to 2014, the First Busey Corporation Employees' Stock Ownership Plan (“ESOP”) was available to all full-time employees who met certain age and length of service requirements. Effective in 2014, the ESOP was frozen, all shares were fully vested and there will be no new contributions under the ESOP. Dividends on allocated shares of common stock are distributed directly to the participants. All shares held by the ESOP, which were acquired prior to the issuance of ASC Topic 718-40, "Employee Stock Ownership Plans", are included in the computation of average common shares and common share equivalents. This accounting treatment is grandfathered under ASC Topic 718-40 for shares purchased prior to December 31, 1992.
All shares held in the ESOP which were acquired prior to December 31, 1992 were allocated as of December 31, 2006. The number of shares and associated fair values were 115,602 worth $2.8 million and 121,082 worth $3.6 million at December 31, 2018 and 2017, respectively.
Shares held in the ESOP which were acquired after December 31, 1992 and associated fair values were 36,639 worth $0.9 million and 42,439 worth $1.3 million at December 31, 2018 and 2017, respectively.
106
Profit Sharing Plan
All full-time employeesassociates who meet certain age and service requirements are eligible to participate in the Company's profit-sharing plan. TheDiscretionary profit-sharing contributions and related expenses, if any, are determinedapproved solely by the boardsFirst Busey board of directors, of the Company and its subsidiaries, and in no case may the annual contributions be greater than the amounts deductible for federal income tax purposes for that year.
The rights of participants in the participantsprofit-sharing plan vest ratably over a five-year period, except for the 401(k) Safe Harbor match portion,component of the profit-sharing plan, which vests immediately. Expenses related
116
Terminated Benefit Plans
Employees’ Stock Ownership Plan
Prior to 2014, the employee benefit plans are $5.4 million, $5.1 millionFirst Busey ESOP was available to all associates who met certain age and $4.3 million forservice requirements. Effective March 20, 2014, the years ended DecemberESOP was frozen, all shares were fully vested, and there were no new contributions under the ESOP. On October 31, 2018, 20172019, First Busey’s board of directors elected to terminate the ESOP. First Busey filed a determination letter with the Internal Revenue Service on February 10, 2020. During 2020, First Busey received a favorable determination ruling from the Internal Revenue Service, and 2016, respectively.all plan assets were distributed by the end of the year.
Deferred Compensation Plan
The Company hadpreviously sponsored deferred compensation plans for executive officers for deferral of compensation. Effective March 28, 2018, the deferred compensation plan wasplans were terminated, and all account balances will bewere distributed in April 2019. The deferred compensation expense reportedThere was $0.3 million for the years ended December 31, 2018, 2017 and 2016. The0 deferred compensation liability was $6.4 million and $10.2 million atbalance as of December 31, 20182021, or 2020.
Benefit Plan Expenses
Expenses related to our employee benefit plans, reported in salaries, wages, and 2017, respectively. The 2017 deferred compensation liability was impacted byemployee benefits in the Mid Illinois acquisition and included $3.9 million which was distributedaccompanying Consolidated Statements of Income, are summarized in January 2018.the table below (dollars in thousands):
| | | | | | | | | |
| | Years Ended December 31, | |||||||
|
| 2021 |
| 2020 |
| 2019 | |||
Employee benefit plan expenses | | | | | | | | | |
Profit-sharing plan | | $ | 6,531 | | $ | 5,982 | | $ | 5,777 |
Deferred compensation plan | | | — | | | — | | | 80 |
Total employee benefit plan expenses | | $ | 6,531 | | $ | 5,982 | | $ | 5,857 |
Note 16. Share-based14. Stock-based Compensation
OverviewStock Options
During the first quarter of 2010, the Company adopted the 2010 Equity Plan, which was approved at the annual stockholders meeting on May 19, 2010. During the second quarter of 2015, the Company adopted an amendment to the 2010 Equity Plan, which was approved at the annual stockholders meeting on May 20, 2015.
Subject to permitted adjustments for certain corporate transactions, the maximum number of shares that may be delivered to participants, or their beneficiaries, under the 2010 Equity Plan is 1,333,333 shares of First Busey common stock. To the extent that any shares of stock covered by an award (including non-vested stock awards) under the 2010 Equity Plan, or the prior plans, are not delivered for any reason, including because the award is forfeited, canceled, settled in cash or shares are withheld to satisfy tax withholding requirements, such shares will not be deemed to have been delivered for purposes of determining the maximum number of shares of stock available for delivery and will again become available for usage under the 2010 Equity Plan. If any option granted under the 2010 Equity Plan is exercised by tendering shares of stock, only the number of shares of stock issued net of the shares of stock tendered shall be counted for purposes of these limitations. Any shares covered under the terms of a prior First Busey plan award that would otherwise become available for reuse under the terms of the prior plan will become available for issuance under the 2010 Equity Plan.
The 2010 Equity Plan's effective date was May 19, 2010. The 2010 Equity Plan will continue in effect until terminated by the board of directors; provided that no awards may be granted under the 2010 Equity Plan after the ten-year anniversary of the effective date. Any awards that are outstanding after the tenth anniversary of the effective date will remain subject to the terms of the 2010 Equity Plan.
The following additional limits apply to awards under the 2010 Equity Plan, however due to changes imposed by the TCJA, “performance-based compensation” only applies to arrangements subject to a written binding contract in effect on November 2, 2017, that have not subsequently been materially modified:
|
|
|
|
|
|
The Company grants share-based compensation awards to its employeeshas outstanding stock options assumed from acquisitions. A summary of the status of, and members of its board of directors as provided for under the Company’s 2010 Equity Plan. Further, in 2017, the Company registered 443,619 shares of its common stock issuablechanges in, the future pursuant to First Community 2016 Equity Incentive Plan to legacy employees and directors of First Community and its subsidiaries and upon theCompany's stock option awards follows (dollars in thousands, except weighted-average exercise of currently outstanding equity awards under the First Community 2016 Equity Incentive Plan and the First Community Amended and Restated 2008 Equity Incentive Plan held by former employees of First Community and its subsidiaries. Pursuant to the terms of the First Community 2016 Equity Incentive Plan, the Company may grant awards with respect to First Busey common stock to legacy employees and directors of First Community or its subsidiaries, including but not limited to non-qualified stock options, incentive stock options, stock appreciation rights, restricted stock and restricted stock units.price):
| | | | | | | | | | | | |
| | As of and for the Year Ended December 31, 2021 | ||||||||||
| | | | | | | | Weighted- | | | | |
| | |
|
| Weighted- | | Average | | | | ||
| | | | | Average | | Remaining | | | | ||
| | | | | Exercise | | Contractual | | Intrinsic | |||
|
| Shares |
| Price |
| Life |
| Value | ||||
Outstanding at beginning of year | | | 39,085 | | $ | 23.53 | | | 5.88 | | $ | — |
Exercised | | | — | | | — | | | | | | |
Forfeited | | | — | | | — | | | | | | |
Expired | | | (7,699) | |
| 23.53 | | | | | | |
Outstanding at end of year | | | 31,386 | | $ | 23.53 | | | 4.88 | | $ | 113 |
| | | | | | | | | | | | |
Exercisable at end of year | | | 31,386 | | $ | 23.53 | | | 4.88 | | $ | 113 |
107117
2020 Equity Plan
TheUnder the terms of the 2020 Equity Plan, the Company currently grants share-based compensation in the form of restricted stock units (“RSUs”)has granted RSU, PSU, and deferred stock units (“DSUs”).DSU awards. The Company grants RSUs to members of management periodically throughout the year. Each RSU is equivalent to one1 share of the Company’s common stock. These units have requisite service periods ranging from one to five years. years, subject to accelerated vesting upon eligible retirement from the Company. Recipients earn quarterly dividend equivalents on their respective units which entitle the recipients to additional units. Therefore, dividends earned each quarter compound based upon the updated unit balances.
The Company annuallyalso grants share-basedPSU awards into members of management periodically throughout the formyear. Each PSU is equivalent to 1 share of the Company’s common stock. The number of units that ultimately vest will be determined based on the achievement of market or other performance goals, subject to accelerated service-based vesting conditions upon eligible retirement from the Company.
The Company grants DSUs, which are RSUsrestricted stock units with a deferred settlement date, to its board ofdirectors and advisory directors. Each DSU is equivalent to one1 share of the Company’s common stock. The DSUs vest over a twelve-monthone-year period following the grant date or on the date of the next Annual Meeting of Stockholders, whichever is earlier.date. These units generally are subject to the same terms as RSUs under the Company’s 2010 Equity Plan or the First Community 20162020 Equity Plan, except that, following vesting, settlement occurs within 30 days following the earlier of separation from the board or a change in control of the Company. Subsequent toAfter vesting and prior to delivery, these units will continue to earn dividend equivalents. The Company also has outstanding stock options granted prior to 2011 and stock options assumed from acquisitions.
Under the terms of the Company’s 2010 Equity Plan and First Community 2016 Equity Incentive Plan, the Company is allowed, but not required, to source stock option exercises and grants of RSUs and DSUs from its inventory of treasury stock. As of December 31, 2018, the Company held 310,745 shares in treasury. On February 3, 2015, First Busey announced that its board of directors approved a repurchase plan under which the Company is authorized to repurchase up to an aggregate of 666,667 shares of its common stock. The repurchase plan has no expiration date and replaced the prior repurchase plan originally approved in 2008. During 2015, the Company purchased 333,333 shares under this repurchase plan. At December 31, 2018 the Company had 333,334 shares that may still be purchased under the plan.
Stock Option Plan
In relation to the First Community acquisition, the Company assumed stock options that were previously issued under First Community incentive plans. The First Community Amended and Restated 2008 Equity Incentive Plan was approved by First Community shareholders. This plan was subsequently amended without approval by First Community shareholders to increase the number of shares available for issuance. The First Community 2016 Equity Incentive Plan was approved by First Community shareholders. At the effective time of the merger, each outstanding and unexercised option to purchase shares of First Community common stock held by an employee, whether vestedUpon exercise or unvested, was converted into an option to purchase First Busey common stock. The converted option is equal to the number of shares of such First Community stock option multiplied by the option exchange ratio (rounded down to the nearest whole share), at an exercise price per share equal to the exercise price for each share of First Community common stock subject to such First Community stock option divided by the option exchange ratio (rounded up to the nearest whole cent). The option exchange ratio is the sum of the exchange ratio (0.396) multiplied by the closing sales price of a share of First Busey common stock on the Nasdaq Global Select Market on June 30, 2017, plus the cash consideration ($1.35), divided by the closing sales price of a share of First Busey common stock on the Nasdaq Global Select Market on June 30, 2017. Each First Community stock option assumed and converted continues to be subject to the same terms and conditions (including vesting periods), as applicable immediately prior to the effective time of the merger.
In relation to the Pulaski acquisition, the Company assumed stock options that were previously issued under shareholder approved Pulaski incentive plans. At the effective time of the acquisition, each outstanding option to purchase shares of Pulaski common stock was converted automatically into a stock option exercisable for that number of shares of First Busey common stock equal to (i) the number of shares of Pulaski common stock subject to the Pulaski stock option immediately prior to the effective time multiplied by (ii) the exchange ratio (rounded down to the nearest whole share), with an exercise price per share equal to (A) the exercise price per share of Pulaski common stock subject to such Pulaski stock option immediately prior to the effective time divided by (B) the exchange ratio (rounded up to the nearest whole cent). Each Pulaski stock option assumed and converted continues to be subject to the same terms and conditions, as applicable immediately prior to the effective time of the merger. All Pulaski stock options are fully vested.
108
A summary of the status of the Company's stock option awards for the years ended December 31, 2018, 2017, and 2016, and the changes during the years ended on those dates is as follows:
|
|
|
|
|
|
|
|
|
|
|
|
|
|
|
|
|
| 2018 |
| 2017 |
| 2016 | |||||||||
|
|
|
| Weighted- |
|
|
| Weighted- |
|
|
| Weighted- | |||
|
|
|
| Average |
|
|
| Average |
|
|
| Average | |||
|
|
|
| Exercise |
|
|
| Exercise |
|
|
| Exercise | |||
|
| Shares |
| Price |
| Shares |
| Price |
| Shares |
| Price | |||
|
|
|
|
|
|
|
|
|
|
|
|
|
|
|
|
Outstanding at beginning of year |
| 213,428 |
| $ | 16.97 |
| 209,382 |
| $ | 15.13 |
| 96,568 |
| $ | 43.64 |
Converted options from Pulaski |
| — |
|
| — |
| — |
|
| — |
| 309,700 |
|
| 13.29 |
Converted options from First Community |
| — |
|
| — |
| 121,360 |
|
| 21.41 |
| — |
|
| — |
Exercised |
| (105,275) |
|
| 13.38 |
| (99,605) |
|
| 13.74 |
| (145,774) |
|
| 15.09 |
Forfeited |
| (16,014) |
|
| 22.02 |
| (5,279) |
|
| 23.53 |
| (394) |
|
| 13.87 |
Expired |
| (4,539) |
|
| 12.90 |
| (12,430) |
|
| 52.40 |
| (50,718) |
|
| 58.23 |
Outstanding at end of year |
| 87,600 |
| $ | 20.58 |
| 213,428 |
| $ | 16.97 |
| 209,382 |
| $ | 15.13 |
|
|
|
|
|
|
|
|
|
|
|
|
|
|
|
|
Exercisable at end of year |
| 70,034 |
| $ | 19.84 |
| 167,144 |
| $ | 15.16 |
| 209,382 |
| $ | 15.13 |
The following table summarizes information about stock options outstanding at December 31, 2018:
|
|
|
|
|
|
|
|
|
|
|
|
|
|
|
|
|
|
|
|
|
|
|
|
|
|
|
|
|
| Options | |||
|
|
| Options Outstanding |
| Exercisable | |||||||||||
|
|
|
|
|
|
|
| Weighted- |
|
|
|
|
|
|
|
|
|
|
|
|
| Weighted- |
| Average |
|
|
|
|
|
|
|
| |
Range of |
|
|
| Average |
| Remaining |
|
|
|
|
|
|
|
| ||
Exercise |
|
|
| Exercise |
| Contractual |
| Intrinsic |
|
|
| Intrinsic | ||||
Prices |
| Number |
| Price |
| Life |
| Value |
| Number |
| Value | ||||
$ | 10.43-13.47 |
| 21,173 |
| $ | 12.31 |
| 2.16 |
|
|
|
| 21,173 |
|
|
|
| 17.05 |
| 924 |
|
| 17.05 |
| 1.05 |
|
|
|
| 924 |
|
|
|
| 21.03-23.53 |
| 65,503 |
|
| 23.30 |
| 6.32 |
|
|
|
| 47,937 |
|
|
|
|
|
| 87,600 |
| $ | 20.58 |
| 5.26 |
| $ | 312 |
| 70,034 |
| $ | 295 |
The Company recorded $0.2 million stock option compensation expense for the twelve months ended December 31, 2018 and 2017 related to the converted options from First Community. The Company did not record any stock option compensation expense during 2016. As of December 31, 2018, the Company had $0.2 million of unrecognized stock option expense. This cost is expected to be recognized in 2019.
109
Restricted Stock Unit Plan
In relation to the Pulaski acquisition, the Company also assumed performance based restricted stock unit awards. At the effective time of the acquisition, the number of Pulaski common shares covered by each award was fixed at the target level under Pulaski’s existing plan and automatically converted into a service-based restricted stock unit award of First Busey common stock that was equal to the number of shares of Pulaski common stock multiplied by the exchange ratio. Each assumed restricted stock unit award vested, without regard to any performance metrics, on September 30, 2017 or if applicable, the award holders' earlier involuntary termination of employment for reasons other than cause or voluntary termination of employment for good reason, as specified in the award agreement.
A summary of the changes in the Company’s RSUs for the years ended December 31, 2018, 2017 and 2016 is as follows:
|
|
|
|
|
|
|
|
|
|
|
|
|
|
|
|
|
| 2018 |
| 2017 |
| 2016 | |||||||||
|
|
|
| Weighted- |
|
|
| Weighted- |
|
|
| Weighted- | |||
|
|
|
| Average |
|
|
| Average |
|
|
| Average | |||
|
|
|
| Grant Date |
|
|
| Grant Date |
|
|
| Grant Date | |||
|
| Shares |
| Fair Value |
| Shares |
| Fair Value |
| Shares |
| Fair Value | |||
|
|
|
|
|
|
|
|
|
|
|
|
|
|
|
|
Outstanding at beginning of year |
| 587,763 |
| $ | 22.68 |
| 552,610 |
| $ | 18.45 |
| 424,930 |
| $ | 17.10 |
Reclass DSU to RSU |
| 23,977 |
|
| 25.47 |
| — |
|
| — |
| — |
|
| — |
Converted units from Pulaski |
| — |
|
| — |
| — |
|
| — |
| 53,004 |
|
| 14.25 |
Granted |
| 172,571 |
|
| 31.70 |
| 160,532 |
|
| 30.34 |
| 126,669 |
|
| 22.44 |
Dividend equivalents earned |
| 16,879 |
|
| 29.96 |
| 13,479 |
|
| 30.14 |
| 14,935 |
|
| 21.09 |
Vested |
| (104,512) |
|
| 16.40 |
| (116,498) |
|
| 14.73 |
| (54,913) |
|
| 14.61 |
Forfeited |
| (6,183) |
|
| 24.84 |
| (22,360) |
|
| 19.20 |
| (12,015) |
|
| 15.19 |
Outstanding at end of year |
| 690,495 |
| $ | 26.14 |
| 587,763 |
| $ | 22.68 |
| 552,610 |
| $ | 18.45 |
Recipients earn quarterly dividend equivalents on their respective units which entitle the recipients to additional units. Therefore, dividends earned each quarter compound based upon the updated unit balances. Upon vesting/delivery, shares are expected (though not required) to be issued from treasury. Dividends related to
Restricted Stock Unit, Performance-Based Restricted Stock Unit, and Deferred Stock Unit Awards
Changes in the converted Pulaski units were accumulatedCompany’s RSU, PSU, and paid in cash upon vesting in 2017.DSU awards are summarized as follows:
| | | | | | | | | | | | | | | | | | |
| | As of and for the Year Ended December 31, 2021 | ||||||||||||||||
| | RSU Awards | | PSU Awards | | DSU Awards | ||||||||||||
| | | | | Weighted- | | | | | Weighted- | | | | | Weighted- | |||
| | | | Average | | | | Average | | | | Average | ||||||
| | | | Grant Date | | | | Grant Date | | | | Grant Date | ||||||
|
| Shares |
| Fair Value |
| Shares (1) |
| Fair Value |
| Shares |
| Fair Value | ||||||
Nonvested at beginning of period |
| | 1,017,038 |
| $ | 23.87 |
| | 15,724 |
| $ | 16.25 |
| | 34,263 |
| $ | 17.18 |
Granted |
| | 260,231 | |
| 24.26 |
| | 99,159 | |
| 23.91 |
| | 35,664 | |
| 24.59 |
Dividend equivalents earned |
| | 43,783 | |
| 23.65 |
| | — | |
| — |
| | 4,891 | |
| 23.72 |
Vested |
| | (143,242) | |
| 23.50 |
| | — | |
| — |
| | (40,683) | |
| 18.24 |
Forfeited |
| | (29,883) | |
| 24.88 |
| | (968) | |
| 23.48 |
| | — | |
| — |
Nonvested at end of period |
| | 1,147,927 |
| $ | 23.97 |
| | 113,915 |
| $ | 22.86 |
| | 34,135 |
| $ | 24.59 |
| | | | | | | | | | | | | | | | | | |
Vested and outstanding at end of period |
| | | | | | | | | | | |
| | 97,297 |
| $ | 22.02 |
| (1) | Shares for PSU awards represent target shares at grant date. |
On August 1, 2018,March 24, 2021, under the terms of the 20102020 Equity Plan, the Company granted 152,926212,426 RSUs to members of management, and under the termsmanagement. The grant date fair value of the First Community 2016 Equity Incentive Plan, granted 12,545 RSUs to members of management who were legacy First Community employees. As the stock price on the grant date of August 1, 2018 was $31.70, total compensation cost to be recognized isaward totaled $5.2 million. This costmillion and will be recognized as compensation expense over athe requisite service period of fourranging from one year to five years. The terms of these awards included an accelerated vesting provision upon eligible retirement from the Company, after a one-year minimum requisite service period. Subsequent to the requisite service period, the awards will become 100% vested. Further, the Company granted 7,100 RSUs,33,288 DSUs to directors and advisory directors. The grant date fair value of the award totaled $0.8 million and will be recognized as compensation expense over the requisite service period of one year. Subsequent to the requisite service period, the awards will become 100% vested.
During the first quarter of 2021, the Company also granted a target of 70,815 market-based PSUs with a maximum award of 113,304 units. The actual number of units issued at the vesting date could range from 0% to 160% of the initial grant, depending on attaining the market-based total shareholder return performance goal. The grant date fair value of the award was $1.7 million and will be recognized in compensation expense over the performance period ending December 31, 2023.
118
Further, during the first quarter of 2021, the Company granted a target of 28,344 PSUs with a maximum award of 39,682 units. The actual number of units issued at the vesting date could range from 0% to 140% of the initial grant, depending on attaining a performance goal based upon FirsTech’s compounded annual revenue growth rate. The grant date fair value of the award is $0.7 million and will be recognized in compensation expense over the performance period ending August 31, 2023, subject to achievement of the performance goal.
On May 19, 2021, under the terms of the 20102020 Equity Plan, the Company granted 2,376 DSUs to the Chairmandirectors. The grant date fair value of the Board. As the stock price on the grant date of August 1, 2018 was $31.70, total compensation cost to be recognized is $0.2 million. This costaward totaled $0.1 million and will be recognized as compensation expense over athe requisite service period of one year. Subsequent to the requisite service period, the awards will become 100% vested.
On September 22, 2021, under the terms of the 2020 Equity Plan, the Company granted 47,805 RSUs to members of management. The grant date fair value of the award totaled $1.1 million and will be recognized as compensation expense over the requisite service period ranging from three year to five years. Subsequent to the requisite service period, the awards will become 100% vested.
A description of RSUsRSU, PSU and DSU awards granted in 20172020 and 20162019 under the terms of the 2020 Equity Plan, 2010 Equity Plan, or the First Community 2016 Equity Incentive Plan can be found in the Company’s Annual Reports on Form 10-K for the years ended December 31, 20172020, and 2016.2019.
110
Deferred Stock Unit Plan
A summary of the changes in the Company’s DSUs for the years ended December 31, 2018, 2017 and 2016 is as follows:
|
|
|
|
|
|
|
|
|
|
|
|
|
|
|
|
|
| 2018 |
| 2017 |
| 2016 | |||||||||
|
|
|
| Weighted- |
|
|
| Weighted- |
|
|
| Weighted- | |||
|
|
|
| Average |
|
|
| Average |
|
|
| Average | |||
|
|
|
| Grant Date |
|
|
| Grant Date |
|
|
| Grant Date | |||
|
| Shares |
| Fair Value |
| Shares |
| Fair Value |
| Shares |
| Fair Value | |||
|
|
|
|
|
|
|
|
|
|
|
|
|
|
|
|
Non-vested at beginning of year |
| 42,411 |
| $ | 25.47 |
| 35,038 |
| $ | 21.04 |
| 24,763 |
| $ | 19.25 |
Reclass DSU to RSU |
| (23,977) |
|
| 25.47 |
| — |
|
| — |
| — |
|
| — |
Granted |
| 20,500 |
|
| 31.70 |
| 24,100 |
|
| 29.61 |
| 22,428 |
|
| 22.44 |
Dividend equivalents earned |
| 2,300 |
|
| 29.99 |
| 2,426 |
|
| 30.22 |
| 2,576 |
|
| 21.20 |
Vested |
| (20,584) |
|
| 29.68 |
| (19,153) |
|
| 23.18 |
| (14,729) |
|
| 20.18 |
Forfeited |
| (201) |
|
| 31.67 |
| — |
|
| — |
| — |
|
| — |
Non-vested at end of year |
| 20,449 |
| $ | 27.93 |
| 42,411 |
| $ | 25.47 |
| 35,038 |
| $ | 21.04 |
Outstanding at end of year |
| 86,700 |
| $ | 22.42 |
| 119,985 |
| $ | 21.00 |
| 93,459 |
| $ | 18.54 |
On August 1, 2018, under the terms of the 2010 Equity Plan, the Company granted 17,500 DSUs to directors and under the terms of the First Community 2016 Equity Incentive Plan granted 1,500 DSUs to a director who was a legacy First Community director. In addition, under the terms of the 2010 Equity Plan, the Company granted 1,500 advisory DSUs to advisory directors. As the stock price on the grant date of August 1, 2018 was $31.70, total compensation cost to be recognized is $0.6 million. These costs will be recognized over the requisite service period of one year from the date of grant or the next Annual Meeting of Stockholders; whichever is earlier.
A description of DSUs granted in 2017 and 2016 under the terms of the 2010 Equity Plan or First Community 2016 Equity Incentive Plan can be found in the Company’s Annual Reports on Form 10-K for the years ended December 31, 2017 and 2016.
The Company issued 104,637, 79,459 and 43,396116,904 treasury shares in conjunction with the vesting of RSUs and settlement of DSUs in 2018, 2017 and 2016, respectively.2021. The difference between the number of shares issued and the number of vested units is due to shares issued under a net share settlement option.
2021 Employee Stock Purchase Plan
The 2021 ESPP was approved at the Company’s 2021 Annual Meeting of Stockholders, replacing the 2011 ESPP which terminated at the end of 2020. The purpose of the 2021 ESPP is to provide a means through which our employees may acquire a proprietary interest in the Company by purchasing shares of our common stock at a 15% discount through voluntary payroll deductions, to assist us in retaining the services of our employees and securing and retaining the services of new employees, and to provide incentives for our employees to exert maximum efforts toward our success. Under the terms of the 2021 ESPP, all participating employees will have equal rights and privileges. Substantially all of our employees are eligible to participate in the 2021 ESPP. Further details can be found within First Busey’s Definitive Proxy Statement filed with the SEC on April 8, 2021.
The first offering under the 2021 ESPP began on July 1, 2021. There were 569,610 shares available for issuance under the 2021 ESPP as of December 31, 2021.
Stock-based Compensation Expense
The Company recognized $3.5 million, $2.6 million and $1.8 million of compensation expense related to both non-vested RSUsRSU, PSU, and DSUs forDSU awards, as well as the years ended December 31, 2018, 2017 and 2016, respectively. As2021 ESPP, as presented in the table below (dollars in thousands):
| | | | | | | | | |
| | Years Ended December 31, | |||||||
|
| 2021 |
| 2020 |
| 2019 | |||
Stock-based compensation expense | | | | | | | | | |
Stock options (1) | | $ | — | | $ | — | | $ | 146 |
RSU awards | | | 5,809 | | | 6,493 | | | 3,249 |
PSU awards | | | 979 | | | 77 | | | — |
DSU awards | | | 962 | | | 565 | | | 602 |
2021 ESPP | | | 114 | | | — | | | — |
Total stock-based compensation expense | | $ | 7,864 | | $ | 7,135 | | $ | 3,997 |
| (1) | Stock option compensation expense recorded in 2019 was attributable to converted options related to the 2017 acquisition of First Community. |
119
Table of December 31, 2018, there was $10.9 million of total unrecognizedContents
FIRST BUSEY CORPORATION
NOTES TO CONSOLIDATED FINANCIAL STATEMENTS
Unamortized stock-based compensation cost related to these non-vested stock awards. This costexpense is expected to be recognized over a period of 3.6 years.presented in the table below (dollars in thousands):
| | | | | | | |
| | As of December 31, | | ||||
|
| 2021 |
| 2020 |
| ||
Unamortized stock-based compensation | | | | | | | |
RSU awards | | $ | 10,204 | | $ | 10,411 | |
PSU awards | | | 1,547 | | | 179 | |
DSU awards | | | 209 | | | 294 | |
Total unamortized stock-based compensation | | $ | 11,960 | | $ | 10,884 | |
| | | | | | | |
Weighted average period over which expense is to be recognized | | | 2.9 | yrs | | 3.0 | yrs |
Note 17.15. Transactions with Related Parties
The Company has had, and may be expected to have in the future, banking transactions in the ordinary course of business with related parties which include directors, executive officers, chief credit officers, their immediate families, and affiliated companies in which they have 10% or more beneficial ownership, on the same terms, including interest rates and collateral, as those prevailing at the time for comparable transactions with others.
The following is an analysis of the changes in loans to related parties, as a group during the year ended December 31, 2018 (dollars in thousands):
|
|
|
| |||
| | | | |||
|
| As of and for the Year Ended | ||||
| | December 31, 2021 | ||||
Loans to related parties | | | | |||
Balance at beginning of year |
| $ | 46,915 |
| $ | 41,921 |
Change in relationship |
|
| (5,891) | |
| (2,033) |
New loans/advances |
|
| 4,795 | |
| 31,761 |
Repayments | �� |
| (13,025) | | | (29,092) |
Balance at end of year |
| $ | 32,794 | | $ | 42,557 |
TotalLoans to related parties did not include amounts that were past due, nonaccrual, or TDRs.
Additionally, total unused commitments to directors and executive officers were $20.3$8.6 million at December 31, 2018.2021.
111
Note 18.16. Outstanding Commitments and Contingent Liabilities
Legal Matters
The Company is a party to legal actions which arise in the normal course of its business activities. In the opinion of management, the ultimate resolution of these matters is not expected to have a material effect on the Company’s financial position or the results of operations of the Company.operations.
Credit Commitments and Contingencies
A summary of the contractual amount of the Company’s exposure to off-balance-sheet risk relating to the Company’s commitments to extend credit and standby letters of credit follows (dollars in thousands):
|
|
|
|
|
|
| ||||||
|
| December 31, 2018 |
| December 31, 2017 | ||||||||
Financial instruments whose contract amounts represent credit risk: |
|
|
|
|
|
| ||||||
| | | | | | | ||||||
| | As of December 31, | ||||||||||
|
| 2021 |
| 2020 | ||||||||
Financial instruments whose contract amounts represent credit risk | | | | | | | ||||||
Commitments to extend credit |
| $ | 1,398,483 |
| $ | 1,300,294 | | $ | 1,983,655 | | $ | 1,754,370 |
Standby letters of credit |
|
| 32,156 |
|
| 37,231 | |
| 32,552 | |
| 38,937 |
Total commitments | | $ | 2,016,207 | | $ | 1,793,307 | ||||||
Lease Commitments
120
FIRST BUSEY CORPORATION
At December 31, 2018, the Company was obligated under noncancelable operating leases for office space and other commitments. Rent expense under operating leases, included in net occupancy and equipment expense, was $2.4 million, $3.7 million, and $2.7 million for the years ended December 31, 2018, 2017 and 2016, respectively.NOTES TO CONSOLIDATED FINANCIAL STATEMENTS
Rent commitments before considering renewal options that generally are present, were as follows at December 31, 2018 (dollars in thousands):
|
|
|
|
2019 |
| $ | 1,716 |
2020 |
|
| 1,571 |
2021 |
|
| 1,019 |
2022 |
|
| 795 |
2023 |
|
| 503 |
Thereafter |
|
| 1,189 |
|
| $ | 6,793 |
Note 19.17. Derivative Financial Instruments
The Company utilizes interest rate swap agreements as part of its asset liability management strategy to help manage its interest rate risk position. Additionally, the Company enters into derivative financial instruments, including interest rate lock commitments issued to residential loan customers for loans that will be held for sale, forward sales commitments to sell residential mortgage loans to loan investors, and derivatives to customers for interest rate swaps.swaps with customers and other third parties. See “Note 20.18. Fair Value Measurements” for further discussion of the fair value measurement of such derivatives.
Derivative Instruments Designated as Hedges
Interest Rate Swaps Designated as Cash Flow Hedges
The Company entered into derivative instruments designated as cash flow hedges. For a derivative instrument that is designated and qualifies as a cash flow hedge, the change in fair value of the derivative instrument is reported as a component of other comprehensive income (loss) and reclassified into earnings in the same period or periods during which the hedged transaction affects earnings. Changes in fair value of components excluded from the assessment of effectiveness are recognized in current earnings.
Interest rate swaps with notional amounts totaling $50.0 million as of December 31, 2021, and $70.0 million as of December 31, 2020, were designated as cash flow hedges to hedge the risk of variability in cash flows (future interest payments) attributable to changes in the contractually specified 3-month LIBOR benchmark interest rate on the Company’s junior subordinated debt owed to unconsolidated trusts and were determined to be highly effective during the period. A $20.0 million swap matured on September 17, 2021, and the Company has one remaining swap. The gross aggregate fair value of the swaps of $1.0 million as of December 31, 2021, and $3.1 million as of December 31, 2020, is recorded in other liabilities in the Consolidated Balance Sheets, with changes in fair value recorded net of tax in other comprehensive income (loss). The Company expects its hedge to remain highly effective during the remaining term of the swap.
A summary of the interest-rate swaps designated as cash flow hedges is presented below (dollars in thousands):
| | | | | | | |
| | As of December 31, | | ||||
|
| 2021 |
| 2020 |
| ||
Notional amount | | $ | 50,000 | | $ | 70,000 | |
Weighted average fixed pay rates | |
| 1.79 | % |
| 1.80 | % |
Weighted average variable 3-month LIBOR receive rates | | | 0.20 | % | | 0.22 | % |
Weighted average maturity, in years | | | 2.71 | yrs | | 2.85 | yrs |
Unrealized gains (losses), net of tax | | $ | (685) | | $ | (2,184) | |
The Company expects $0.2 million of the unrealized gain (loss) to be reclassified from OCI to interest expense during the next three months. This reclassified amount could differ from amounts actually recognized due to changes in interest rates, hedge de-designations, and the addition of other hedges subsequent to December 31, 2021.
Interest income (expense) recorded on swap transactions was as follows for the periods presented (dollars in thousands):
| | | | | | | | | |
| | Years Ended December 31, | |||||||
|
| 2021 |
| 2020 |
| 2019 | |||
Interest income (expense) on swap transactions | | $ | (1,067) | | $ | (758) | | $ | 60 |
121
The following table reflects the net gains (losses) recorded in AOCI and the Consolidated Statements of Comprehensive Income relating to cash flow derivative instruments for the periods presented (dollars in thousands):
| | | | | | | | | |
| | Years Ended December 31, | |||||||
|
| 2021 |
| 2020 |
| 2019 | |||
Unrealized gains (losses) on cash flow hedges | | | | | | | | | |
Gain (loss) recognized in OCI, net of tax | | $ | 736 | | $ | (2,526) | | $ | (202) |
(Gain) loss reclassified from OCI to interest expense, net of tax | | | 763 | | | 542 | | | 2 |
Net change in unrealized gains (losses) on cash flow hedges | | $ | 1,499 | | $ | (1,984) | | $ | (200) |
The Company pledged $1.0 million and $3.2 million in cash to secure its obligation under these contracts at December 31, 2021, and 2020, respectively.
Derivative Instruments Not Designated as Hedges
Interest Rate Swaps
The Company may offer derivative contracts to its customers in connection with their risk management needs. The Company manages the risk associated with these contracts by entering into equal and offsetting derivative agreements with a third-party dealer. These contracts support variable rate, commercial loan relationships totaling $491.4 million and $395.0 million, at December 31, 2021, and 2020, respectively. These derivatives generally worked together as an economic interest rate hedge, but the Company did not designate them for hedge accounting treatment. Consequently, changes in fair value of the corresponding derivative financial asset or liability were recorded as either a charge or credit to current earnings during the period in which the changes occurred.
Amounts and fair values of derivative assets and liabilities related to customer interest rate swaps, included in other assets and other liabilities in the Consolidated Balance Sheets, are summarized as follows (dollars in thousands):
| | | | | | | | | | | | |
| | As of December 31, 2021 | ||||||||||
| | Derivative Asset | | Derivative Liability | ||||||||
| | Notional | | Fair | | Notional | | Fair | ||||
|
| Amount |
| Value |
| Amount |
| Value | ||||
Derivatives not designated as hedging instruments | | | | | | | | | | | | |
Interest rate swaps – pay floating, receive fixed | | $ | 404,572 | | $ | 17,839 | | $ | 86,784 | | $ | 2,259 |
Interest rate swaps – pay fixed, receive floating | | | 86,784 | | | 2,259 | | | 404,572 | | | 17,839 |
Total derivatives not designated as hedging instruments | | $ | 491,356 | | $ | 20,098 | | $ | 491,356 | | $ | 20,098 |
| | | | | | | | | | | | |
| | As of December 31, 2020 | ||||||||||
| | Derivative Asset | | Derivative Liability | ||||||||
| | Notional | | Fair | | Notional | | Fair | ||||
|
| Amount |
| Value |
| Amount |
| Value | ||||
Derivatives not designated as hedging instruments | | | | | | | | | | | | |
Interest rate swaps – pay floating, receive fixed | | $ | 394,954 | | $ | 32,685 | | $ | — | | $ | — |
Interest rate swaps – pay fixed, receive floating | | | — | | | — | | | 394,954 | | | 32,685 |
Total derivatives not designated as hedging instruments | | $ | 394,954 | | $ | 32,685 | | $ | 394,954 | | $ | 32,685 |
Changes in fair value of these derivative assets and liabilities are recorded in noninterest expense in the Consolidated Statements of Income and summarized as follows (dollars in thousands):
| | | | | | | | | | | | |
| | | | | Years Ended December 31, | |||||||
|
| Location |
| 2021 |
| 2020 |
| 2019 | ||||
Interest rate swaps | | | | | | | | | | | | |
Pay floating, receive fixed | | Noninterest expense | | $ | (12,587) | | $ | 20,331 | | $ | 10,915 | |
Pay fixed, receive floating | | Noninterest expense | | | 12,587 | | | (20,331) | | | (10,915) | |
Net change in fair value of interest rate swaps | | | | | $ | — | | $ | — | | $ | — |
122
The Company pledged $26.3 million and $36.0 million in cash to secure its obligation under these contracts at December 31, 2021, and 2020, respectively.
Risk Participation Agreement
In addition, the Company has entered into 1 risk participation agreement in conjunction with a loan participation with another financial institution to manage the credit risk exposure related to a customer-facing swap. The notional amount of the risk participation agreement was $4.0 million, and it had an insignificant fair value as of December 31, 2021. This risk participation agreement matures in 2028.
Mortgage Banking Derivatives
Interest Rate Lock Commitments. At December 31, 2018 and 2017, the Company had issued $27.2 million and $51.7 million, respectively, of unexpired interest rate lock commitments to loan customers. Such interestCommitments
Interest rate lock commitments that meet the definition of derivative financial instruments under ASC Topic 815, Derivatives and Hedging, are carried at their fair values in other assets or other liabilities in the Consolidated Financial Statements,Balance Sheets, with changes in the fair values of the corresponding derivative financial assets or liabilities recorded as either a charge or credit to current earnings during the period in which the changes occurred.
Forward Sales Commitments. At December 31, 2018 and 2017, the Company had issued $48.6 million and $139.7 million, respectively, of unexpired forward sales commitments to mortgage loan investors. Typically, theCommitments
The Company economically hedges mortgage loans held for sale and interest rate lock commitments issued to its residential loan customers related to loans that will be held for sale by obtaining corresponding best-efforts forward sales commitments with an investor to sell the loans at an agreed-upon price at the time the interest rate locks are issued to the customers. Forward sales commitments that meet the definition of derivative financial instruments under ASC Topic 815, Derivatives and Hedging, are carried at their fair values in other assets or other liabilities in the Consolidated Financial Statements.Balance Sheets. While such forward sales commitments generally served as an economic hedge to the mortgage loans held for sale and interest rate lock commitments, the Company did not designate them for hedge accounting treatment. Changes in fair value of the corresponding derivative financial asset or liability were recorded as either a charge or credit to current earnings during the period in which the changes occurred.
112
TheAmounts and fair values of derivative assets and liabilities related to interest rate lock commitments and forward sales commitments recordedmortgage banking derivatives included in the Consolidated Balance Sheets are summarized as follows (dollars in thousands):
| | | | | | | | | | | | | | | |
| | | | | As of December 31, 2021 | | As of December 31, 2020 | ||||||||
| | | | | Notional | | Fair | | Notional | | Fair | ||||
|
| Location |
| Amount |
| Value |
| Amount |
| Value | |||||
Derivatives with positive fair value | | | | | | | | | | | | | | | |
Interest rate lock commitments | | Other assets | | $ | 19,384 | | $ | 206 | | $ | 45,004 | | $ | 1,201 | |
Forward sales commitments | | Other assets | | | 1,884 | | | 10 | | | 978 | | | 32 | |
Mortgage banking derivatives recorded in other assets | | $ | 21,268 | | $ | 216 | | $ | 45,982 | | $ | 1,233 | |||
| | | | | | | | | | | | | | | |
Derivatives with negative fair value | | | | | | | | | | | | | | | |
Interest rate lock commitments | | Other liabilities | | $ | 499 | | $ | 6 | | $ | 118 | | $ | 1 | |
Forward sales commitments | | Other liabilities | | | 41,002 | | | 439 | | | 84,964 | | | 2,662 | |
Mortgage banking derivatives recorded in other liabilities | | $ | 41,501 | | $ | 445 | | $ | 85,082 | | $ | 2,663 | |||
|
|
|
|
|
|
|
|
| December 31, 2018 |
| December 31, 2017 | ||
Fair value recorded in other assets |
| $ | 624 |
| $ | 675 |
Fair value recorded in other liabilities |
|
| 1,205 |
|
| 2,148 |
123
Net gains and losses on(losses) relating to these derivative assets and liabilities related to interest rate lock commitments and forward sales commitments recorded in non-interest income and expense in the Consolidated Statements of Income for the twelve months ended December 31, 2018, 2017 and 2016instruments are summarized as follows for the periods presented (dollars in thousands):
|
|
|
|
|
|
|
|
|
|
|
| December 31, 2018 |
| December 31, 2017 |
| December 31, 2016 | |||
|
|
|
|
|
|
|
|
|
|
Gross gains |
| $ | 3,494 |
| $ | 14,724 |
| $ | 25,270 |
Gross (losses) |
|
| (3,874) |
|
| (13,250) |
|
| (24,783) |
Net gains (losses) |
| $ | (380) |
| $ | 1,474 |
| $ | 487 |
| | | | | | | | | | | | |
| | | | | Years Ended December 31, | |||||||
|
| Location |
| 2021 |
| 2020 |
| 2019 | ||||
Net gains (losses) | | | | | | | | | | | | |
Interest rate lock commitments | | Mortgage revenue | | $ | 1,702 | | $ | 9,667 | | $ | 3,988 | |
Forward sales commitments | | Mortgage revenue | |
| (4,045) | | | (18,329) | | | (6,751) | |
Net gains (losses) | | | | | $ | (2,343) | | $ | (8,662) | | $ | (2,763) |
The impact of the net gains or losses on derivative financial instruments related to interest rate lock commitments issued to residential loan customers for loans that will be held for sale and forward sales commitments to sell residential mortgage loans to loan investors are almost entirely offset by a corresponding change in the fair value of loans held for sale.
Derivatives to Customers. The Company may offer derivative contracts to its customers in connection with their risk management needs. These derivatives are primarily interest rate swaps. The Company manages the risk associated with these contracts by entering into an equal and offsetting derivative with a third-party dealer. With notional values of $243.7 million and $161.3 million at December 31, 2018 and 2017, respectively, these contracts support variable rate, commercial loan relationships totaling $121.8 million and $80.7 million, respectively. These derivatives generally worked together as an economic interest rate hedge, but the Company did not designate them for hedge accounting treatment. Consequently, changes in fair value of the corresponding derivative financial asset or liability were recorded as either a charge or credit to current earnings during the period in which the changes occurred.
The fair values of derivative assets and liabilities related to derivatives for customers for interest rate swaps recorded in the Consolidated Balance Sheets are summarized as follows (dollars in thousands):
|
|
|
|
|
|
|
|
|
| December 31, 2018 |
|
| December 31, 2017 |
Fair value recorded in other assets |
| $ | 1,438 |
| $ | 262 |
Fair value recorded in other liabilities |
|
| 1,438 |
|
| 262 |
The gross gains and losses on these derivative assets and liabilities recorded in non-interest income and expense in the Consolidated Statements of Income for the year ended December 31, 2018 and 2017 are summarized as follows (dollars in thousands):
|
|
|
|
|
|
|
| December 31, 2018 |
|
| December 31, 2017 |
Gross gains | $ | 1,176 |
| $ | 262 |
Gross losses |
| (1,176) |
|
| (262) |
Net gains (losses) | $ | — |
| $ | — |
The Company pledged $1.0 million in cash to secure its obligation under these contracts at December 31, 2018. The Company pledged $2.0 million in cash and $0.4 million in securities to secure its obligation under these contracts at December 31, 2017.
Note 20.18. Fair Value Measurements
The fair value of an asset or liability is the price that would be received by selling that asset or paid in transferring that liability (exit price) in an orderly transaction occurring in the principal market (or most advantageous market in the absence of a principal market) for such asset or liability. ASC Topic 820, Fair Value Measurement, establishes a fair value hierarchy for valuation inputs that gives the highest priority to quoted prices in active markets for identical assets or liabilities and the lowest priority to unobservable inputs. The fair value hierarchy is as follows:
| ● | Level 1 Inputs – Unadjusted quoted prices in active markets for identical assets or liabilities that the Company has the ability to access at the measurement date. |
Level 1 Inputs - Unadjusted quoted prices in active markets for identical assets or liabilities that the Company has the ability to access at the measurement date.
| ● | Level 2 Inputs – Inputs other than quoted prices included in Level 1 that are observable for the asset or liability, either directly or indirectly. These might include quoted prices for similar assets or liabilities in active markets, quoted prices for identical or similar assets or liabilities in markets that are not active, inputs other than quoted prices that are observable for the asset or liability (such as interest rates, volatilities, prepayment speeds, credit risks, etc.) or inputs that are derived principally from or corroborated by market data by correlation or other means. |
| ● | Level 3 Inputs – Unobservable inputs for determining the fair values of assets or liabilities that reflect the Company’s own assumptions about the assumptions that market participants would use in pricing the assets or liabilities. |
113
Level 2 Inputs - Inputs other than quoted prices included in level 1 that are observable for the asset or liability, either directly or indirectly. These might include quoted prices for similar assets or liabilities in active markets, quoted prices for identical or similar assets or liabilities in markets that are not active, inputs other than quoted prices that are observable for the asset or liability (such as interest rates, volatilities, prepayment speeds, credit risks, etc.) or inputs that are derived principally from or corroborated by market data by correlation or other means.
Level 3 Inputs - Unobservable inputs for determining the fair values of assets or liabilities that reflect the Company’s own assumptions about the assumptions that market participants would use in pricing the assets or liabilities.
A description of the valuation methodologies used for instruments measured at fair value, as well as the general classification of such instruments pursuant to the valuation hierarchy, is set forth below. These valuation methodologies were applied to those Company assets and liabilities that are carried at fair value.
There were no transfers between levels during the year ended December 31, 2018 or 2017.
In general, fair value is based upon quoted market prices, when available. If such quoted market prices are not available, fair values are measured utilizing independent valuation techniques of identical or similar securities for which significant assumptions are derived primarily from or corroborated by observable data. Valuation adjustments may be made to ensure that financial instruments are recorded at fair value. These adjustments may include amounts to reflect, among other things, counterparty credit quality and the company's creditworthiness as well as unobservable parameters. Any such valuation adjustments are applied consistently over time. While management believes the Company's valuation methodologies are appropriate and consistent with other market participants, the use of different methodologies or assumptions to determine the fair value of certain financial instruments could result in a different estimate of fair value at the reporting date.
124
Debt Securities Available for Sale. SecuritiesSale
Debt securities classified as available for sale are reported at fair value utilizing levelLevel 2 measurements.inputs. The Company obtains fair value measurements from an independent pricing service. The independent pricing service utilizes evaluated pricing models that vary by asset class and incorporate available trade, bid, and other market information. Because many fixed income securities do not trade on a daily basis, the independent pricing service applies available information, focusing on observable market data such as benchmark curves, benchmarking of like securities, sector groupings, and matrix pricing, to prepare evaluations.
The independent pricing service uses model processes, such as the Option Adjusted Spread model, to assess interest rate impact and develop prepayment scenarios. The modelsModels and processes take into account market conventions. For each asset class, a team of evaluators gathers information from market sources and integrates relevant credit information, perceived market movements, and sector news into the evaluated pricing applications and models.
The marketMarket inputs that the independent pricing service normally seeks for evaluations of securities, listed in approximate order of priority, include: benchmark yields, reported trades, broker/dealer quotes, issuer spreads, two-sided markets, benchmark securities, bids, offers, and reference data including market research publications. The independent pricing service also monitors market indicators, industry, and economic events. For certain security types, additional inputs may be used or some of the market inputs may not be applicable. Evaluators may prioritize inputs differently on any given day for any security based on market conditions, and not all inputs listed are available for use in the evaluation process for each security evaluation on a given day. Because the data utilized was observable, the securities have been classified as levelLevel 2.
Securities Equity Investments.Securities classified as equity investments
Equity securities are reported at fair value utilizing levelLevel 1 measurements. Foror Level 2 inputs. As applicable for mutual funds, and other equity securities, unadjusted quoted prices in active markets for identical assets are utilized to determine fair value at the measurement date and have beenare classified as levelLevel 1. For stock, quoted prices for identical or similar assets in markets that are not active are utilized and classified as Level 2.
Loans Held for Sale.Sale
Loans held for sale are reported at fair value utilizing levelLevel 2 measurements.inputs. The fair value of the mortgage loans held for sale are measured using observable quoted market or contract prices or market price equivalents and are classified as levelLevel 2.
Derivative Assets and Derivative Liabilities.
Derivative assets and derivative liabilities are reported at estimated fair value utilizing levelLevel 2 measurements. inputs and are included in other assets or other liabilities on the Consolidated Balance Sheets. Derivative balances consist of interest rate swaps and a risk participation agreement where there is no significant deterioration in the counterparties (loan customers) credit risk since origination of the interest rate swap or risk participation agreement, as well as mortgage banking derivatives, including interest rate lock commitments and forward sales commitments.
The fair value ofCompany values its derivative assets and liabilities is determined based onusing market prices that are obtained from a third-partyprovided by third parties which usesuse primarily observable market inputs. Derivative assetsFor purposes of potential valuation adjustments to our derivative positions, the Company evaluates the credit risk of its counterparties as well as its own credit risk. Accordingly, the Company has considered factors such as the likelihood of default, expected loss given default, net exposures, and liabilitiesremaining contractual life, among other things, in determining if any estimated fair value adjustments related to credit risk are classified as level 2. required. The Company reviews counterparty exposure quarterly, and when necessary, appropriate adjustments are made to reflect the exposure. No credit changes in counterparty credit were identified.
114125
The following table summarizestables summarize financial assets and financial liabilities measured at fair value on a recurring basis as of December 31, 20182021, and 2017,2020, segregated by the level of the valuation inputs within the fair value hierarchy utilized to measure fair value (dollars in thousands):
|
|
|
|
|
|
|
|
|
|
|
| ||||||||||||
| Level 1 |
| Level 2 |
| Level 3 |
| Total | ||||||||||||||||
December 31, 2018 | Inputs |
| Inputs |
| Inputs |
| Fair Value | ||||||||||||||||
Fair value adjusted through comprehensive income: |
|
|
|
|
|
|
|
|
|
|
| ||||||||||||
Securities available for sale |
|
|
|
|
|
|
|
|
|
|
| ||||||||||||
| | | | | | | | | | | | | |||||||||||
| | As of December 31, 2021 | |||||||||||||||||||||
| | Level 1 | | Level 2 | | Level 3 | | Total | |||||||||||||||
|
| Inputs |
| Inputs |
| Inputs |
| Fair Value | |||||||||||||||
Debt securities available for sale: | | | | | | | | | | | | | |||||||||||
U.S. Treasury securities | $ | — |
| $ | 25,411 |
| $ | — |
| $ | 25,411 | | $ | — | | $ | 165,762 | | $ | — | | $ | 165,762 |
Obligations of U.S. government corporations and agencies |
| — |
|
| 52,342 |
|
| — |
|
| 52,342 | | | — | | | 38,470 | | | — | | | 38,470 |
Obligations of states and political subdivisions |
| — |
|
| 170,044 |
|
| — |
|
| 170,044 | | | — | | | 306,869 | | | — | | | 306,869 |
Asset-backed securities | | | — | | | 492,186 | | | — | | | 492,186 | |||||||||||
Commercial mortgage-backed securities |
| — |
|
| 1,942 |
|
| — |
|
| 1,942 | | | — | | | 614,998 | | | — | | | 614,998 |
Residential mortgage-backed securities |
| — |
|
| 315,748 |
|
| — |
|
| 315,748 | | | — | | | 2,069,313 | | | — | | | 2,069,313 |
Corporate debt securities |
| — |
|
| 132,198 |
|
| — |
|
| 132,198 | | | — | | | 293,653 | | | — | | | 293,653 |
Fair value adjusted through current period earnings: |
|
|
|
|
|
|
|
|
|
|
| ||||||||||||
Securities equity investments |
| 6,169 |
|
| — |
|
| — |
|
| 6,169 | ||||||||||||
Equity securities | | | — | | | 13,571 | | | — | | | 13,571 | |||||||||||
Loans held for sale |
| — |
|
| 25,895 |
|
| — |
|
| 25,895 | | | — | | | 23,875 | | | — | | | 23,875 |
Derivative assets |
| — |
|
| 2,062 |
|
| — |
|
| 2,062 | | | — | | | 20,314 | | | — | | | 20,314 |
Derivative liabilities |
| — |
|
| 2,643 |
|
| — |
|
| 2,643 | | | — | | | 21,501 | | | — | | | 21,501 |
|
|
|
|
|
|
|
|
|
|
|
| ||||||||||||
| Level 1 |
| Level 2 |
| Level 3 |
| Total | ||||||||||||||||
December 31, 2017 | Inputs |
| Inputs |
| Inputs |
| Fair Value | ||||||||||||||||
Securities available for sale |
|
|
|
|
|
|
|
|
|
|
| ||||||||||||
| | | | | | | | | | | | | |||||||||||
| | As of December 31, 2020 | |||||||||||||||||||||
| | Level 1 | | Level 2 | | Level 3 | | Total | |||||||||||||||
|
| Inputs |
| Inputs |
| Inputs |
| Fair Value | |||||||||||||||
Debt securities available for sale: | | | | | | | | | | | | | |||||||||||
U.S. Treasury securities | $ | — |
| $ | 60,348 |
| $ | — |
| $ | 60,348 | | $ | — | | $ | 27,837 | | $ | — | | $ | 27,837 |
Obligations of U.S. government corporations and agencies |
| — |
|
| 103,665 |
|
| — |
|
| 103,665 | | | — | | | 69,519 | | | — | | | 69,519 |
Obligations of states and political subdivisions |
| — |
|
| 280,199 |
|
| — |
|
| 280,199 | | | — | | | 304,711 | | | — | | | 304,711 |
Commercial mortgage-backed securities | | | — | | | 418,616 | | | — | | | 418,616 | |||||||||||
Residential mortgage-backed securities |
| — |
|
| 397,436 |
|
| — |
|
| 397,436 | | | — | | | 1,368,315 | | | — | | | 1,368,315 |
Corporate debt securities |
| — |
|
| 31,034 |
|
| — |
|
| 31,034 | | | — | | | 72,189 | | | — | | | 72,189 |
Securities equity investments |
| 5,378 |
|
| — |
|
| — |
|
| 5,378 | ||||||||||||
Equity securities | | | — | | | 5,530 | | | — | | | 5,530 | |||||||||||
Loans held for sale |
| — |
|
| 94,848 |
|
| — |
|
| 94,848 | | | — | | | 42,813 | | | — | | | 42,813 |
Derivative assets |
| — |
|
| 937 |
|
| — |
|
| 937 | | | — | | | 33,918 | | | — | | | 33,918 |
Derivative liabilities |
| — |
|
| 2,410 |
|
| — |
|
| 2,410 | | | — | | | 38,403 | | | — | | | 38,403 |
Certain financial assets and financial liabilities are measured at fair value on a non-recurring basis; that is, the instruments are not measured at fair value on an ongoing basis but are subject to fair value adjustments in certain circumstances (for example, when there is evidence of impairment).
Impaired Loans. Evaluated Individually
The Company does not record portfolio loans at fair value on a recurring basis. However, periodically, a loan is identified as impairedevaluated individually and is reported at the fair value of the underlying collateral, less estimated costs to sell, if repayment is expected solely from the collateral. Impaired loans measured at fairIf the collateral value typically consist of loans on non-accrual status and restructured loans in compliance with modified terms.is not sufficient, a specific reserve is recorded. Collateral values are estimated using a combination of observable inputs, including recent appraisals, and unobservable inputs based on customized discounting criteria. Due to the significance of the unobservable inputs, all impaired loan fair values of individually evaluated collateral dependent loans have been classified as levelLevel 3.
OREO. OREO
Non-financial assets and non-financial liabilities measured at fair value include OREO (upon initial recognition or subsequent impairment). OREO properties are measured using a combination of observable inputs, including recent appraisals, and unobservable inputs. Due to the significance of the unobservable inputs, all OREO fair values have been classified as levelLevel 3.
126
Bank Property Held for Sale. Sale
Bank property held for sale represents certain banking center office buildings which the Company has closed and consolidated with other existing banking centers. Bank property held for sale is measured at the lower of amortized cost or fair value less estimated costs to sell. The fairsell, and is included in premises and equipment, net on the Consolidated Balance Sheets. Fair values were based upon discounted appraisals or real estate listing price. Due to the significance of the unobservable inputs, fair values of all bank property held for sale fair values have been classified as levelLevel 3.
115
The following table summarizestables summarize assets and liabilities measured at fair value on a non-recurring basis as of December 31, 2018 and 2017,for the periods presented, segregated by the level of the valuation inputs within the fair value hierarchy utilized to measure fair value (dollars in thousands):
|
|
|
|
|
|
|
|
|
|
|
|
|
|
| Level 1 |
| Level 2 |
| Level 3 |
| Total | ||||
|
| Inputs |
| Inputs |
| Inputs |
| Fair Value | ||||
December 31, 2018 |
|
| ||||||||||
Impaired loans |
| $ | — |
| $ | — |
| $ | 10,999 |
| $ | 10,999 |
OREO |
|
| — |
|
| — |
|
| 55 |
|
| 55 |
Bank property held for sale |
|
| — |
|
| — |
|
| 1,832 |
|
| 1,832 |
| | | | | | | | | | | | |
| | As of December 31, 2021 | ||||||||||
| | Level 1 | | Level 2 | | Level 3 | | Total | ||||
|
| Inputs |
| Inputs |
| Inputs |
| Fair Value | ||||
Loans evaluated individually, net of related allowance | | $ | — | | $ | — | | $ | 2,926 | | $ | 2,926 |
OREO with subsequent impairment | |
| — | |
| — | |
| 51 | |
| 51 |
Bank property held for sale with impairment | |
| — | |
| — | |
| 10,103 | |
| 10,103 |
|
|
|
|
|
|
|
|
|
|
|
|
|
December 31, 2017 |
|
|
|
|
|
|
|
|
|
|
|
|
Impaired loans |
| $ | — |
| $ | — |
| $ | 1,313 |
| $ | 1,313 |
OREO(1) |
|
| — |
|
| — |
|
| — |
|
| — |
|
|
| | | | | | | | | | | | |
| | As of December 31, 2020 | ||||||||||
| | Level 1 | | Level 2 | | Level 3 | | Total | ||||
|
| Inputs | �� | Inputs |
| Inputs |
| Fair Value | ||||
Loans evaluated individually, net of related allowance | | $ | — | | $ | — | | $ | 2,771 | | $ | 2,771 |
OREO with subsequent impairment | |
| — | |
| — | |
| 106 | |
| 106 |
Bank property held for sale with impairment | | | — | |
| — | |
| 10,676 | |
| 10,676 |
The following table presents additional quantitative information about assets measured at fair value on a non-recurring basis for which the Company has utilized levelLevel 3 inputs to determine fair value (dollars in thousands):
|
|
|
|
|
|
|
|
|
|
|
|
|
| Quantitative Information about Level 3 Fair Value Measurements | |||||||||||
| Fair Value |
| Valuation |
| Unobservable |
| Range | |||||
| Estimate |
| Techniques |
| Input |
| (Weighted Average) | |||||
December 31, 2018 |
| |||||||||||
Impaired loans | $ | 10,999 |
| Appraisal of collateral |
| Appraisal adjustments |
| - 3.3 | % | to | - 100.0 | % |
|
|
|
|
|
|
|
| (-24.1)% | ||||
OREO |
| 55 |
| Appraisal of collateral |
| Appraisal adjustments |
| - 25.0 | % | to | - 100.0 | % |
|
|
|
|
|
|
|
| (-65.0)% | ||||
Bank property held for sale |
| 1,832 |
| Appraisal of collateral or real estate listing price |
| Appraisal adjustments |
| - 0.0 | % | to | - 35.1 | % |
|
|
|
|
|
|
|
| (-28.3)% | ||||
|
|
|
|
|
|
|
|
|
|
|
|
|
December 31, 2017 |
|
|
|
|
|
|
|
|
|
|
|
|
Impaired loans | $ | 1,313 |
| Appraisal of collateral |
| Appraisal adjustments |
| - 20.3 | % | to | - 100.0 | % |
|
|
|
|
|
|
|
| (-30.8)% | ||||
OREO(1) |
| — |
| Appraisal of collateral |
| Appraisal adjustments |
| -100.0% | ||||
|
|
|
|
|
|
|
| (-100.0)% | ||||
|
|
| | | | | | | | | | | | | | | |
| | Quantitative Information about Level 3 Fair Value Measurements | |||||||||||||
| | Fair Value | | Valuation | | Unobservable | | Range | |||||||
December 31, 2021: |
| Estimate |
| Techniques |
| Input |
| (Weighted Average) | |||||||
Loans evaluated individually, net of related allowance | | $ | 2,926 | | Appraisal of collateral | | Appraisal adjustments | | -50.0 | % | to | -100.0 | % | (-55.1) | % |
OREO with subsequent impairment | | | 51 | | Appraisal of collateral | | Appraisal adjustments | | -33.0 | % | to | -100.0 | % | (-67.9) | % |
Bank property held for sale with impairment | | | 10,103 | | Appraisal of collateral or real estate listing price | | Appraisal adjustments | | -0.7 | % | to | -70.1 | % | (-41.3) | % |
| | | | | | | | | | | | | | | |
December 31, 2020: | | | | | | | | | | | | | | | |
Loans evaluated individually, net of related allowance | | $ | 2,771 | | Appraisal of collateral | | Appraisal adjustments | | -30.0 | % | to | -100.0 | % | (-37.0) | % |
OREO with subsequent impairment | | | 106 | | Appraisal of collateral | | Appraisal adjustments | | -25.0 | % | to | -100.0 | % | (-54.5) | % |
Bank property held for sale with impairment | | | 10,676 | | Appraisal of collateral or real estate listing price | | Appraisal adjustments | | -6.2 | % | to | -64.9 | % | (-42.8) | % |
The carrying value for cash and cash equivalents approximates fair value and due to the short-term maturity is classified as level 1. The carrying value approximates fair value for accrued interest receivable and accrued interest payable and both are classified as level 2. The methodologies for other financial assets and financial liabilities are discussed below:
Securities held to maturity
Fair value measurements for securities held to maturity are from an independent pricing service. The independent pricing service evaluations are based on market data. Securities held to maturity are classified as level 2.
Portfolio loans, net
Our performing portfolio loans consist of variable rate, hybrid rate and fixed rate loans. The fair value of loans are estimated by discounting the future cash flows using the current rates at which similar loans would be made to borrowers with similar credit ratings and for the same remaining maturities and are classified as level 3. Fair value of impaired loans is discussed above.
Mortgage servicing rights
The fair value of mortgage servicing rights is estimated by discounting the future cash flows at a market rate of return and classified as level 3.
116127
FIRST BUSEY CORPORATION
Other servicing rightsNOTES TO CONSOLIDATED FINANCIAL STATEMENTS
The fair value of other servicing rights relates to servicing that First Busey provides on Small Business Administration loans and is estimated by discounting the future cash flows at a market rate of return and classified as level 3.
Deposits and securities sold under agreements to repurchase
The fair value of demand deposits, savings accounts, interest-bearing transaction accounts, and certain money market deposits is defined as the amount payable on demand at the reporting date. The fair value of fixed-maturity certificates of deposit is estimated using a discounted cash flow calculation that applies interest rates currently offered for deposits of similar remaining maturities. The carrying amounts reported in the balance sheet for securities sold under agreements to repurchase approximate those liabilities' fair values. Deposits and securities sold under agreements to repurchase are classified as level 2.
Short-term borrowings
The fair value of short-term borrowings, which includes advances from the FHLB, is determined by discounting the future cash flows of existing advances using rates currently available on advances from the FHLB having similar characteristics and is classified as level 2.
Long-term debt
Rates currently available to the Company for debt with similar terms and remaining maturities are used to estimate fair value of existing debt and is classified as level 2.
Junior subordinated debt owed to unconsolidated trusts
The fair value of junior subordinated debt owed to unconsolidated trusts is estimated by discounting the future cash flows using the current rates for similar junior subordinated debt owed to unconsolidated trusts and are classified as level 2.
Senior and subordinated notes, net of unamortized issuance costs
The fair value of senior and subordinated notes is estimated based on the rates currently available to the Company with similar terms, remaining maturity and credit spread and classified as level 3.
The estimatedEstimated fair values of financial instruments that are reported at amortized cost in the Company’s Consolidated Balance Sheets, segregated by the level of the valuation inputs within the fair value hierarchy utilized to measure fair value, were as follows (dollars in thousands):
|
|
|
|
|
|
|
|
|
|
|
|
| December 31, 2018 |
| December 31, 2017 | ||||||||
| Carrying |
| Fair |
| Carrying |
| Fair | ||||
| Amount |
| Value |
| Amount |
| Value | ||||
Financial assets: |
|
|
|
|
|
|
|
|
|
|
|
Level 1 inputs: |
|
|
|
|
|
|
|
|
|
|
|
Cash and cash equivalents | $ | 239,973 |
| $ | 239,973 |
| $ | 353,272 |
| $ | 353,272 |
Level 2 inputs: |
|
|
|
|
|
|
|
|
|
|
|
Securities held to maturity |
| 608,660 |
|
| 603,360 |
|
| 443,550 |
|
| 441,052 |
Accrued interest receivable |
| 22,314 |
|
| 22,314 |
|
| 22,591 |
|
| 22,591 |
Level 3 inputs: |
|
|
|
|
|
|
|
|
|
|
|
Portfolio loans, net |
| 5,517,780 |
|
| 5,473,063 |
|
| 5,465,918 |
|
| 5,361,406 |
Mortgage servicing rights |
| 3,315 |
|
| 11,051 |
|
| 3,680 |
|
| 8,635 |
Other servicing rights |
| 781 |
|
| 1,443 |
|
| 280 |
|
| 901 |
|
|
|
|
|
|
|
|
|
|
|
|
Financial liabilities: |
|
|
|
|
|
|
|
|
|
|
|
Level 2 inputs: |
|
|
|
|
|
|
|
|
|
|
|
Time deposits(2) | $ | 1,497,003 |
| $ | 1,482,301 |
| $ | — |
| $ | — |
Deposits(2) |
| — |
|
| — |
|
| 6,125,965 |
|
| 6,119,135 |
Securities sold under agreements to repurchase |
| 185,796 |
|
| 185,796 |
|
| 304,566 |
|
| 304,566 |
Short-term borrowings |
| — |
|
| — |
|
| 220,000 |
|
| 220,000 |
Long-term debt |
| 50,000 |
|
| 49,873 |
|
| 50,000 |
|
| 50,000 |
Junior subordinated debt owed to unconsolidated trusts |
| 71,155 |
|
| 65,182 |
|
| 71,008 |
|
| 71,008 |
Accrued interest payable |
| 6,568 |
|
| 6,568 |
|
| 2,581 |
|
| 2,581 |
Level 3 inputs: |
|
|
|
|
|
|
|
|
|
|
|
Senior notes, net of unamortized issuance costs |
| 39,539 |
|
| 39,452 |
|
| 39,404 |
|
| 39,104 |
Subordinated notes, net of unamortized issuance costs |
| 59,147 |
|
| 58,186 |
|
| 64,715 |
|
| 64,350 |
|
|
| | | | | | | | | | | | |
| | As of December 31, 2021 | | As of December 31, 2020 | ||||||||
| | Carrying |
| Fair |
| Carrying |
| Fair | ||||
| | Amount |
| Value |
| Amount |
| Value | ||||
Financial assets | | | | | | | | | | | | |
Level 1 inputs: | | | | | | | | | | | | |
Cash and cash equivalents | | $ | 836,095 | | $ | 836,095 | | $ | 688,537 | | $ | 688,537 |
Level 2 inputs: | | | | | | | | | | | | |
Accrued interest receivable | |
| 31,064 | |
| 31,064 | |
| 33,240 | |
| 33,240 |
Level 3 inputs: | | | | | | | | | | | | |
Portfolio loans, net | |
| 7,101,111 | |
| 7,161,466 | |
| 6,713,129 | |
| 6,755,425 |
Mortgage servicing rights | | | 8,608 | | | 12,133 | | | 10,912 | | | 11,107 |
Other servicing rights | | | 1,830 | | | 2,268 | | | 1,434 | | | 1,966 |
| | | | | | | | | | | | |
Financial liabilities | | | | | | | | | ||||
Level 2 inputs: | | | | | | | | | | | | |
Time deposits | | $ | 935,649 | | $ | 935,778 | | $ | 1,119,348 | | $ | 1,132,107 |
Securities sold under agreements to repurchase | |
| 270,139 | |
| 270,139 | |
| 175,614 | |
| 175,614 |
Short-term borrowings | | | 17,678 | | | 17,673 | | | 4,658 | | | 4,661 |
Long-term debt | |
| 46,056 | |
| 46,164 | | | 4,757 | |
| 5,014 |
Junior subordinated debt owed to unconsolidated trusts | |
| 71,635 | |
| 63,586 | |
| 71,468 | |
| 59,943 |
Accrued interest payable | |
| 2,728 | |
| 2,728 | |
| 3,401 | |
| 3,401 |
Level 3 inputs: | | | | | | | | | | | | |
Senior notes, net of unamortized issuance costs | | | 39,944 | | | 40,400 | | | 39,809 | | | 40,104 |
Subordinated notes, net of unamortized issuance costs | | | 182,773 | | | 195,600 | | | 182,226 | | | 187,697 |
Note 21.19. Earnings Per Common Share
Basic earnings per share is computed by dividing net income available to common stockholders for the period by the weighted average number of common shares outstanding, which include deferred stock units that are vested but not delivered.
Diluted earnings per common share is computed using the treasury stock method and reflects the potential dilution that could occur if the Company’s outstanding stock options and warrants were exercised, and restricted stock units were vested. Stock optionsvested, and restricted stock units for which the exercise or the grant price exceeds the average market price over the period have an anti-dilutive effect and are excluded from the calculation. At December 31, 2018, 191,278 warrants and 172,571 restricted stock unitsESPP shares were anti-dilutive and excluded from the calculation of common stock equivalents. At December 31, 2017, 75,387 outstanding options, 191,278 warrants and 9,425 restricted stock units were anti-dilutive and excluded from the calculation of common stock equivalents.issued.
118
Earnings per common share have been computed as follows (dollars in thousands, except per share data)amounts):
| | | | | | | | | |
| | Years Ended December 31, | |||||||
| | 2021 |
| 2020 |
| 2019 | |||
Net income | | $ | 123,449 | | $ | 100,344 | | $ | 102,953 |
Shares: | | | | | | | | | |
Weighted average common shares outstanding | |
| 55,369,476 | |
| 54,567,429 | |
| 54,851,652 |
Dilutive effect of outstanding options, warrants, and stock units as determined by the application of the treasury stock method | |
| 635,221 | |
| 259,510 | |
| 280,842 |
Dilutive effect of ESPP shares | | | 4,108 | | | — | | | — |
Weighted average common shares outstanding, as adjusted for diluted earnings per share calculation | | | 56,008,805 | | | 54,826,939 | | | 55,132,494 |
| | | | | | | | | |
Basic earnings per common share | | $ | 2.23 | | $ | 1.84 | | $ | 1.88 |
| | | | | | | | | |
Diluted earnings per common share | | $ | 2.20 | | $ | 1.83 | | $ | 1.87 |
|
|
|
|
|
|
|
|
|
|
|
|
|
|
|
|
|
|
|
|
|
| For the Years Ended December 31, | |||||||
|
| 2018 |
| 2017 |
| 2016 | |||
Net income available to common stockholders |
| $ | 98,928 |
| $ | 62,726 |
| $ | 49,694 |
Shares: |
|
|
|
|
|
|
|
|
|
Weighted average common shares outstanding |
|
| 48,854 |
|
| 42,685 |
|
| 35,081 |
Dilutive effect of outstanding options, warrants and restricted stock units as determined by the application of the treasury stock method |
|
| 361 |
|
| 441 |
|
| 332 |
|
|
|
|
|
|
|
|
|
|
Weighted average common shares outstanding, as adjusted for diluted earnings per share calculation |
|
| 49,215 |
|
| 43,126 |
|
| 35,413 |
|
|
|
|
|
|
|
|
|
|
Basic earnings per common share |
| $ | 2.02 |
| $ | 1.47 |
| $ | 1.42 |
|
|
|
|
|
|
|
|
|
|
Diluted earnings per common share |
| $ | 2.01 |
| $ | 1.45 |
| $ | 1.40 |
128
Shares that were excluded from the computation of diluted earnings per common share because their effect would have been anti-dilutive are summarized in the table below for the periods presented:
| | | | | | | | | |
| | Years Ended December 31, | |||||||
| | 2021 |
| 2020 |
| 2019 | |||
Anti-dilutive common stock equivalents | | | | | | | | | |
Options | | | — | | | 39,085 | | | — |
RSU and DSU awards | | | 72,800 | | | 159,408 | | | 201,029 |
PSU awards | | | 93,026 | | | 7,862 | | | — |
Total anti-dilutive common stock equivalents | | | 165,826 | | | 206,355 | | | 201,029 |
Note 22.20. Accumulated Other Comprehensive Income (Loss)
The following table represents changes in AOCI by component, net of tax, for the periods below (dollars in thousands):
| | | | | | | | | |
|
| Year Ended December 31, 2021 | |||||||
| | | Before Tax | | | Tax Effect | | | Net of Tax |
Unrealized gains (losses) on debt securities available for sale | | | | | | | | | |
Balance at beginning of period | | $ | 49,644 | | $ | (14,151) | | $ | 35,493 |
Unrealized holding gains (losses) on debt securities available for sale, net | | | (81,977) | | | 23,367 | | | (58,610) |
Amounts reclassified from AOCI, net | | | 61 | | | (17) | | | 44 |
Balance at end of period | | | (32,272) | | | 9,199 | | | (23,073) |
| | | | | | | | | |
Unrealized gains (losses) on cash flow hedges | | | | | | | | | |
Balance at beginning of period | | | (3,055) | | | 871 | | | (2,184) |
Unrealized holding gains (losses) on cash flow hedges, net | | | 1,030 | | | (294) | | | 736 |
Amounts reclassified from AOCI, net | | | 1,067 | | | (304) | | | 763 |
Balance at end of period | | | (958) | | | 273 | | | (685) |
| | | | | | | | | |
Total AOCI | | $ | (33,230) | | $ | 9,472 | | $ | (23,758) |
| | | | | | | | | |
|
| Year Ended December 31, 2020 | |||||||
| | | Before Tax | | | Tax Effect | | | Net of Tax |
Unrealized gains (losses) on debt securities available for sale | | | | | | | | | |
Balance at beginning of period | | $ | 21,192 | | $ | (6,032) | | $ | 15,160 |
Unrealized holding gains (losses) on debt securities available for sale, net | | | 30,176 | | | (8,615) | | | 21,561 |
Amounts reclassified from AOCI, net | | | (1,724) | | | 496 | | | (1,228) |
Balance at end of period | | | 49,644 | | | (14,151) | | | 35,493 |
| | | | | | | | | |
Unrealized gains (losses) on cash flow hedges | | | | | | | | | |
Balance at beginning of period | | | (280) | | | 80 | | | (200) |
Unrealized holding gains (losses) on cash flow hedges, net | | | (3,533) | | | 1,007 | | | (2,526) |
Amounts reclassified from AOCI, net | | | 758 | | | (216) | | | 542 |
Balance at end of period | | | (3,055) | | | 871 | | | (2,184) |
| | | | | | | | | |
Total AOCI | | $ | 46,589 | | $ | (13,280) | | $ | 33,309 |
129
| | | | | | | | | |
|
| Year Ended December 31, 2019 | |||||||
| | | Before Tax | | | Tax Effect | | | Net of Tax |
Unrealized gains (losses) on debt securities available for sale | | | | | | | | | |
Balance at beginning of period | | $ | (9,528) | | $ | 2,716 | | $ | (6,812) |
Unrealized holding gains (losses) on debt securities available for sale, net | | | 26,430 | | | (7,525) | | | 18,905 |
Unrealized losses on debt securities transferred from held to maturity to available for sale | | | 5,023 | | | (1,433) | | | 3,590 |
Amounts reclassified from AOCI, net | | | (733) | | | 210 | | | (523) |
Balance at end of period | | | 21,192 | | | (6,032) | | | 15,160 |
| | | | | | | | | |
Unrealized gains (losses) on cash flow hedges | | | | | | | | | |
Balance at beginning of period | | | — | | | — | | | — |
Unrealized holding gains (losses) on cash flow hedges, net | | | (283) | | | 81 | | | (202) |
Amounts reclassified from AOCI, net | | | 3 | | | (1) | | | 2 |
Balance at end of period | | | (280) | | | 80 | | | (200) |
| | | | | | | | | |
Total AOCI | | $ | 20,912 | | $ | (5,952) | | $ | 14,960 |
Note 21. Operating Segments and Related Information
The Company has three3 reportable operating segments,segments: Banking, Remittance ProcessingFirsTech, and Wealth Management. The Banking operating segment provides a full range of banking services to individual and corporate customers through its banking center network in Illinois, St. Louis, Missouri metropolitan area, southwest Florida and through its banking center in Indianapolis, Indiana. The Remittance Processing operating segment provides for online bill payments, lockbox and walk-in payments. The Wealth Management operating segment provides a full range of asset management, investment and fiduciary services to individuals, businesses and foundations, tax preparation, philanthropic advisory services and farm and brokerage services.
The Company’s three operating segments are strategic business units that are separately managed as they offer different products and services and have different marketing strategies. The “other” category consistsBanking operating segment provides a full range of banking services to individual and corporate customers through its banking center network in Illinois; the Parent CompanySt. Louis, Missouri metropolitan area; southwest Florida; and the eliminationIndianapolis, Indiana. The FirsTech operating segment provides solutions for online bill payments, lockbox, and walk-in payments. The Wealth Management operating segment provides a full range of intercompany transactions.asset management, investment, brokerage, fiduciary, philanthropic advisory, tax preparation, and farm management services to individuals, businesses, and foundations.
The segment financial information provided below has been derived from information used by management to monitor and manage the financial performance of the Company. The accounting policies of the three3 segments are the same as those described in the summary of significant accounting policies in “Note 1. Significant Accounting Policies.”. The Company accounts for intersegment revenue and transfers at current market value.
Following is a summary of selected financial information for the Company’s operating segments segments. The “other” category included in the tables below consists of the Parent Company, First Busey Risk Management, and the elimination of intercompany transactions (dollars in thousands):
|
|
|
|
|
|
|
|
|
|
|
|
| ||||||||||||
|
| Goodwill |
| Total Assets | ||||||||||||||||||||
As of December 31, |
| 2018 |
| 2017 |
| 2018 |
| 2017 | ||||||||||||||||
|
|
|
|
|
|
|
|
|
|
|
|
| ||||||||||||
| | | | | | | | | | | | | ||||||||||||
| | Goodwill | | Total Assets | ||||||||||||||||||||
| | As of December 31, | | As of December 31, | ||||||||||||||||||||
|
| 2021 |
| 2020 |
| 2021 |
| 2020 | ||||||||||||||||
Operating segment | | | | | | | | | | | | | ||||||||||||
Banking |
| $ | 246,999 |
| $ | 248,660 |
| $ | 7,656,709 |
| $ | 7,809,738 | | $ | 294,773 | | $ | 288,436 | | $ | 12,746,833 | | $ | 10,462,673 |
Remittance Processing |
|
| 8,992 |
|
| 8,992 |
|
| 39,278 |
|
| 34,646 | ||||||||||||
FirsTech | |
| 8,992 | |
| 8,992 | |
| 47,481 | |
| 46,553 | ||||||||||||
Wealth Management |
|
| 11,694 |
|
| 11,694 |
|
| 20,992 |
|
| 32,077 | |
| 14,108 | |
| 14,108 | |
| 65,587 | |
| 46,504 |
Other |
|
| — |
|
| — |
|
| (14,622) |
|
| (15,821) | |
| — | |
| — | |
| (212) | |
| (11,683) |
Totals |
| $ | 267,685 |
| $ | 269,346 |
| $ | 7,702,357 |
| $ | 7,860,640 | ||||||||||||
Consolidated total | | $ | 317,873 | | $ | 311,536 | | $ | 12,859,689 | | $ | 10,544,047 | ||||||||||||
119130
|
|
|
|
|
|
|
|
|
|
|
| Years ended December 31, | |||||||
|
| 2018 |
| 2017 |
| 2016 | |||
Net interest income: |
|
|
|
|
|
|
|
|
|
Banking |
| $ | 248,291 |
| $ | 208,184 |
| $ | 156,374 |
Remittance Processing |
|
| 67 |
|
| 60 |
|
| 55 |
Wealth Management |
|
| 327 |
|
| 321 |
|
| 266 |
Other |
|
| (7,279) |
|
| (5,199) |
|
| (2,035) |
Total net interest income |
| $ | 241,406 |
| $ | 203,366 |
| $ | 154,660 |
|
|
|
|
|
|
|
|
|
|
Non-interest income: |
|
|
|
|
|
|
|
|
|
Banking |
| $ | 43,197 |
| $ | 47,524 |
| $ | 41,816 |
Remittance Processing |
|
| 15,876 |
|
| 12,137 |
|
| 11,554 |
Wealth Management |
|
| 31,621 |
|
| 27,270 |
|
| 23,563 |
Other |
|
| (701) |
|
| (2,457) |
|
| (1,764) |
Total non-interest income |
| $ | 89,993 |
| $ | 84,474 |
| $ | 75,169 |
|
|
|
|
|
|
|
|
|
|
Non-interest expense: |
|
|
|
|
|
|
|
|
|
Banking |
| $ | 154,455 |
| $ | 139,521 |
| $ | 117,293 |
Remittance Processing |
|
| 10,749 |
|
| 8,704 |
|
| 8,668 |
Wealth Management |
|
| 19,283 |
|
| 17,079 |
|
| 16,484 |
Other |
|
| 8,556 |
|
| 9,122 |
|
| 5,417 |
Total non-interest expense |
| $ | 193,043 |
| $ | 174,426 |
| $ | 147,862 |
|
|
|
|
|
|
|
|
|
|
Income before income taxes: |
|
|
|
|
|
|
|
|
|
Banking |
| $ | 132,604 |
| $ | 110,884 |
| $ | 75,347 |
Remittance Processing |
|
| 5,194 |
|
| 3,493 |
|
| 2,941 |
Wealth Management |
|
| 12,665 |
|
| 10,512 |
|
| 7,345 |
Other |
|
| (16,536) |
|
| (16,778) |
|
| (9,216) |
Total income before income taxes |
| $ | 133,927 |
| $ | 108,111 |
| $ | 76,417 |
|
|
|
|
|
|
|
|
|
|
Net income: |
|
|
|
|
|
|
|
|
|
Banking |
| $ | 97,369 |
| $ | 65,704 |
| $ | 48,691 |
Remittance Processing |
|
| 3,710 |
|
| 2,007 |
|
| 1,758 |
Wealth Management |
|
| 9,372 |
|
| 6,229 |
|
| 4,388 |
Other |
|
| (11,523) |
|
| (11,214) |
|
| (5,143) |
Total net income |
| $ | 98,928 |
| $ | 62,726 |
| $ | 49,694 |
| | | | | | | | | |
| | Years Ended December 31, | |||||||
| | | | | | | | | |
|
| 2021 |
| 2020 |
| 2019 | |||
Net interest income | | | | | | | | | |
Banking | | $ | 285,678 | | $ | 294,728 | | $ | 296,754 |
FirsTech | | | 79 | | | 79 | | | 76 |
Wealth Management | |
| — | |
| — | |
| — |
Other | |
| (15,059) | |
| (11,872) | |
| (9,607) |
Total net interest income | | $ | 270,698 | | $ | 282,935 | | $ | 287,223 |
| | | | | | | | | |
Noninterest income | | | | | | | | | |
Banking | | $ | 59,393 | | $ | 61,043 | | $ | 63,613 |
FirsTech | |
| 19,629 | |
| 16,548 | |
| 16,450 |
Wealth Management | |
| 53,082 | |
| 43,429 | |
| 39,075 |
Other | |
| 700 | |
| (2,755) | |
| (2,723) |
Total noninterest income | | $ | 132,804 | | $ | 118,265 | | $ | 116,415 |
| | | | | | | | | |
Noninterest expense | | | | | | | | | |
Banking | | $ | 205,905 | | $ | 185,445 | | $ | 211,559 |
FirsTech | | | 17,574 | | | 13,279 | | | 10,990 |
Wealth Management | | | 29,198 | | | 26,086 | | | 24,534 |
Other | | | 9,103 | | | 9,387 | | | 11,711 |
Total noninterest expense | | $ | 261,780 | | $ | 234,197 | | $ | 258,794 |
| | | | | | | | | |
Income before income taxes | | | | | | | | | |
Banking | | $ | 154,267 | | $ | 131,529 | | $ | 138,401 |
FirsTech | | | 2,134 | | | 3,348 | | | 5,536 |
Wealth Management | | | 23,884 | | | 17,343 | | | 14,541 |
Other | | | (23,462) | | | (24,014) | | | (24,040) |
Total income before income taxes | | $ | 156,823 | | $ | 128,206 | | $ | 134,438 |
| | | | | | | | | |
Net income | | | | | | | | | |
Banking | | $ | 117,844 | | $ | 101,226 | | $ | 106,409 |
FirsTech | |
| 1,527 | |
| 2,372 | |
| 4,060 |
Wealth Management | |
| 18,570 | |
| 13,181 | |
| 11,135 |
Other | |
| (14,492) | |
| (16,435) | |
| (18,651) |
Total net income | | $ | 123,449 | | $ | 100,344 | | $ | 102,953 |
120131
Note 22. Leases
Busey as the Lessee
The Company has operating leases consisting primarily of equipment leases and real estate leases for banking centers, ATM locations, and office space. The following table summarizes lease related information and balances the Company reported in its Consolidated Balance Sheets for the periods presented (dollars in thousands):
| | | | | | |
| As of December 31, | | ||||
| 2021 |
| 2020 |
| ||
Lease balances | | | | | | |
Right of use assets | $ | 10,533 | | $ | 7,714 | |
Lease liabilities | | 10,591 | | | 7,757 | |
| | | | | | |
Supplemental information | | | | | | |
Year through which lease terms extend | | 2031 | | | 2032 | |
Weighted average remaining lease term (in years) | | 6.47 | | | 5.93 | |
Weighted average discount rate | | 2.16 | % | | 2.82 | % |
The following table represents lease costs and cash flows related to leases for the periods presented (dollars in thousands):
| | | | | | | | | |
| | Years Ended December 31, | |||||||
|
| 2021 |
| 2020 | | 2019 | |||
Lease costs | | | | | | | | | |
Operating lease costs | | $ | 2,464 | | $ | 2,524 | | $ | 2,364 |
Variable lease costs | | | 540 | |
| 416 | |
| 432 |
Short-term lease costs | | | 49 | | | 35 | | | 84 |
Total lease cost (1) | | $ | 3,053 | | $ | 2,975 | | $ | 2,880 |
| | | | | | | | | |
Cash flows related to leases | | | | | | | | | |
Cash paid for amounts included in the measurement of lease liabilities: | | | | | | | | | |
Operating lease cash flows – Fixed payments | | $ | 2,417 | | $ | 2,526 | | $ | 2,296 |
Operating lease cash flows – Liability reduction | | | 2,217 | |
| 2,289 | |
| 2,010 |
Right of use assets obtained during the period in exchange for operating lease liabilities (2) | | | 5,818 | | | 743 | | | 923 |
| (1) | Rent expense is included in net occupancy and equipment expense in the Consolidated Statements of Income. |
| (2) | The year ended December 31, 2021, includes $0.4 million related to a lease obtained in the acquisition of CAC. |
At December 31, 2021, the Company was obligated under noncancelable operating leases for office space and other commitments.
132
Future undiscounted lease payments with initial terms of one year or more, are as follows (dollars in thousands):
| | | |
| | As of | |
|
| December 31, 2021 | |
Rent commitments | | | |
2022 | | $ | 2,271 |
2023 | |
| 2,098 |
2024 | | | 1,650 |
2025 | | | 1,413 |
2026 | | | 1,164 |
Thereafter | | | 2,766 |
Total undiscounted cash flows | | | 11,362 |
Less: Amounts representing interest | | | 771 |
Present value of net future minimum lease payments | | $ | 10,591 |
Busey as the Lessor
Busey occasionally leases parking lots and office space to outside parties. Further, in connection with the acquisition of CAC, the Company acquired 2 office buildings in Glenview, IL and 1 office building in Northbrook, IL, along with operating leases for space within these buildings that is rented to outside parties. Revenues recorded in connection with these leases and reported in other income on our Consolidated Statements of Income are summarized as follows (dollars in thousands):
| | | | | | | | | |
| | Years Ended December 31, | |||||||
|
| 2021 |
| 2020 | | 2019 | |||
Rental income | | $ | 566 | | $ | 228 | | $ | 263 |
133
Note 23. Parent Company Only Financial Information
Condensed financial data for First Busey Corporation is presented below below.
CONDENSED BALANCE SHEETS
(dollars in thousands).
| | | | | | |
| | As of December 31, | ||||
|
| 2021 |
| 2020 | ||
Assets | | | | | | |
Cash and cash equivalents | | $ | 78,217 | | $ | 129,183 |
Equity securities | | | 13,571 | | | 5,530 |
Investments in subsidiaries: | | | | | | |
Bank | |
| 1,565,226 | |
| 1,417,130 |
Non-bank | |
| 2,812 | |
| 2,746 |
Premises and equipment, net | |
| 30 | |
| 51 |
Other assets | |
| 22,444 | |
| 21,664 |
Total assets | | $ | 1,682,300 | | $ | 1,576,304 |
| | | | | | |
Liabilities and Stockholders' Equity | | | | | | |
Liabilities: | | | | | | |
Short-term borrowings | | $ | 12,000 | | $ | — |
Long-term debt | | | 42,000 | | | — |
Senior notes, net of unamortized issuance costs | | | 39,944 | | | 39,809 |
Subordinated notes, net of unamortized issuance costs | | | 182,773 | | | 182,226 |
Junior subordinated debentures owed to unconsolidated trusts | | | 71,635 | | | 71,468 |
Other liabilities | |
| 14,836 | |
| 12,732 |
Total liabilities | |
| 363,188 | |
| 306,235 |
| | | | | | |
Total stockholders' equity | |
| 1,319,112 | |
| 1,270,069 |
Total liabilities and stockholders' equity | | $ | 1,682,300 | | $ | 1,576,304 |
BALANCE SHEETS
|
|
|
|
|
|
|
|
| December 31, | ||||
|
| 2018 |
| 2017 | ||
ASSETS |
|
|
|
|
|
|
|
|
|
|
|
|
|
Cash and due from subsidiary banks |
| $ | 72,007 |
| $ | 54,946 |
Securities equity investments |
|
| 6,162 |
|
| 836 |
Investments in subsidiaries: |
|
|
|
|
|
|
Banks |
|
| 1,088,710 |
|
| 1,012,396 |
Non-bank |
|
| — |
|
| 26,319 |
Premises and equipment, net |
|
| 67 |
|
| 41 |
Other assets |
|
| 6,782 |
|
| 23,692 |
Total assets |
| $ | 1,173,728 |
| $ | 1,118,230 |
|
|
|
|
|
|
|
LIABILITIES AND STOCKHOLDERS' EQUITY |
|
|
|
|
|
|
Liabilities: |
|
|
|
|
|
|
Senior notes, net of unamortized issuance costs |
| $ | 39,539 |
| $ | 39,404 |
Subordinated notes, net of unamortized issuance costs |
|
| 59,147 |
|
| 64,715 |
Junior subordinated debentures owed to unconsolidated trusts |
|
| 71,155 |
|
| 71,008 |
Other liabilities |
|
| 8,923 |
|
| 8,100 |
Total liabilities |
|
| 178,764 |
|
| 183,227 |
|
|
|
|
|
|
|
Total stockholders' equity |
|
| 994,964 |
|
| 935,003 |
Total liabilities and stockholders' equity |
| $ | 1,173,728 |
| $ | 1,118,230 |
121134
CONDENSED STATEMENTS OF INCOME
|
|
|
|
|
|
|
|
|
|
|
| Years Ended December 31, | |||||||
|
| 2018 |
| 2017 |
| 2016 | |||
Operating income: |
|
|
|
|
|
|
|
|
|
Dividends from subsidiaries: |
|
|
|
|
|
|
|
|
|
Pulaski Bank before bank merger |
| $ | — |
| $ | — |
| $ | 8,700 |
Non-bank before Busey Trust merger |
|
| 17,000 |
|
| 4,000 |
|
| 4,000 |
Interest income |
|
| 747 |
|
| 264 |
|
| — |
Security gains, net |
|
| 2,322 |
|
| — |
|
| — |
Other income |
|
| 8,096 |
|
| 6,890 |
|
| 5,664 |
Total operating income |
|
| 28,165 |
|
| 11,154 |
|
| 18,364 |
|
|
|
|
|
|
|
|
|
|
Expense: |
|
|
|
|
|
|
|
|
|
Salaries, wages and employee benefits |
|
| 13,624 |
|
| 11,398 |
|
| 8,879 |
Interest expense |
|
| 8,026 |
|
| 5,464 |
|
| 2,035 |
Operating expense |
|
| 6,051 |
|
| 7,060 |
|
| 3,967 |
Total expense |
|
| 27,701 |
|
| 23,922 |
|
| 14,881 |
|
|
|
|
|
|
|
|
|
|
Income (loss) before income tax benefit and equity in undistributed (in excess of) net income of subsidiaries |
|
| 464 |
|
| (12,768) |
|
| 3,483 |
Income tax benefit |
|
| 5,013 |
|
| 5,553 |
|
| 4,073 |
Income (loss) before equity in undistributed (in excess of) net income of subsidiaries |
|
| 5,477 |
|
| (7,215) |
|
| 7,556 |
|
|
|
|
|
|
|
|
|
|
Equity in undistributed (in excess of) net income of subsidiaries: |
|
|
|
|
|
|
|
|
|
Banks |
|
| 103,309 |
|
| 68,635 |
|
| 41,980 |
Non-bank before Busey Trust merger |
|
| (9,858) |
|
| 1,306 |
|
| 158 |
Net income |
| $ | 98,928 |
| $ | 62,726 |
| $ | 49,694 |
(dollars in thousands)
| | | | | | | | | |
| | Years Ended December 31, | |||||||
|
| 2021 |
| 2020 |
| 2019 | |||
Operating income: | | | | | | | | | |
Dividends from subsidiaries: | | | | | | | | | |
Bank | | $ | 60,000 | | $ | 122,000 | | $ | 70,000 |
Non-bank | |
| 1,745 | |
| — | |
| — |
Interest income | |
| 79 | |
| 154 | |
| 441 |
Unrealized gains (losses) recognized on equity securities | | | 3,041 | | | (393) | | | (759) |
Other income | |
| 12,109 | |
| 10,083 | |
| 10,224 |
Total operating income | |
| 76,974 | |
| 131,844 | |
| 79,906 |
| | | | | | | | | |
Expense: | | | | | | | | | |
Salaries, wages, and employee benefits | |
| 17,914 | |
| 16,205 | |
| 15,288 |
Interest expense | |
| 15,163 | |
| 12,056 | |
| 10,054 |
Operating expense | |
| 7,429 | |
| 7,685 | |
| 8,960 |
Total expense | |
| 40,506 | |
| 35,946 | |
| 34,302 |
| | | | | | | | | |
Income (loss) before income tax benefit and equity in undistributed (in excess of) net income of subsidiaries | | | 36,468 | |
| 95,898 | |
| 45,604 |
Income tax benefit | |
| 8,974 | |
| 7,727 | |
| 5,389 |
Income (loss) before equity in undistributed (in excess of) net income of subsidiaries | |
| 45,442 | |
| 103,625 | |
| 50,993 |
| | | | | | | | | |
Equity in undistributed (in excess of) net income of subsidiaries: | | | | | | | | | |
Bank | |
| 77,941 | |
| (5,221) | |
| 51,604 |
Non-bank | |
| 66 | |
| 1,940 | |
| 356 |
Net income | | $ | 123,449 | | $ | 100,344 | | $ | 102,953 |
122135
CONDENSED STATEMENTS OF CASH FLOWS
|
|
|
|
|
|
|
|
|
|
|
| Years Ended December 31, | |||||||
|
| 2018 |
| 2017 |
| 2016 | |||
Cash Flows from Operating Activities |
|
|
|
|
|
|
|
|
|
Net income |
| $ | 98,928 |
| $ | 62,726 |
| $ | 49,694 |
Adjustments to reconcile net income to net cash provided by (used in) operating activities: |
|
|
|
|
|
|
|
|
|
Depreciation and amortization |
|
| 212 |
|
| 428 |
|
| 198 |
Distributions less than net income of subsidiaries |
|
| (93,451) |
|
| (69,940) |
|
| (42,138) |
Net security gains |
|
| (2,322) |
|
| — |
|
| — |
Stock-based compensation |
|
| 3,721 |
|
| 2,752 |
|
| 1,803 |
Changes in assets and liabilities: |
|
|
|
|
|
|
|
|
|
Decrease (increase) in other assets |
|
| 13,985 |
|
| (1,105) |
|
| 1,057 |
Increase (decrease) in other liabilities |
|
| 1,361 |
|
| (2,703) |
|
| (3,690) |
Net cash provided by (used in) operating Activities |
|
| 22,434 |
|
| (7,842) |
|
| 6,924 |
|
|
|
|
|
|
|
|
|
|
Cash Flows from Investing Activities |
|
|
|
|
|
|
|
|
|
Net cash (outlay) received for business acquisition |
|
| — |
|
| (61,371) |
|
| 602 |
Purchases of premises and equipment |
|
| (46) |
|
| — |
|
| (3) |
Net cash (used in) provided by investing activities |
|
| (46) |
|
| (61,371) |
|
| 599 |
|
|
|
|
|
|
|
|
|
|
Cash Flows from Financing Activities |
|
|
|
|
|
|
|
|
|
Proceeds from charter amendment with subsidiary bank |
|
| 40,000 |
|
| 40,000 |
|
| 30,000 |
Value of shares surrendered upon vesting to satisfy tax withholding obligations of stock based compensation |
|
| (817) |
|
| (1,414) |
|
| (809) |
Cash dividends paid |
|
| (39,010) |
|
| (30,707) |
|
| (22,748) |
Repayments of subordinated debt |
|
| (5,500) |
|
| (9,800) |
|
| — |
Proceeds from issuance of senior and subordinated debt |
|
| — |
|
| 98,312 |
|
| — |
Proceeds from stock options exercised |
|
| — |
|
| 626 |
|
| — |
Common stock issuance costs |
|
| — |
|
| (365) |
|
| (246) |
Net cash (used in) provided by financing activities |
|
| (5,327) |
|
| 96,652 |
|
| 6,197 |
|
|
|
|
|
|
|
|
|
|
Net increase in cash and due from subsidiary banks |
|
| 17,061 |
|
| 27,439 |
|
| 13,720 |
Cash and cash equivalents, beginning of period |
|
| 54,946 |
|
| 27,507 |
|
| 13,787 |
|
|
|
|
|
|
|
|
|
|
Cash and cash equivalents, ending of period |
| $ | 72,007 |
| $ | 54,946 |
| $ | 27,507 |
(dollars in thousands)
| | | | | | | | | |
| | Years Ended December 31, | |||||||
|
| 2021 |
| 2020 |
| 2019 | |||
Cash Flows Provided by (Used in) Operating Activities | | | | | | | | | |
Net income | | $ | 123,449 | | $ | 100,344 | | $ | 102,953 |
Adjustments to reconcile net income to net cash provided by (used in) operating activities: | | | | | | | | | |
Depreciation and amortization | |
| 882 | |
| 648 | |
| 420 |
Distributions more (less) than net income of subsidiaries | |
| (78,007) | |
| 3,281 | |
| (51,961) |
Unrealized (gains) losses recognized on equity securities | | | (3,041) | | | 393 | | | 759 |
Stock-based compensation | |
| 7,864 | |
| 7,135 | |
| 3,997 |
Changes in assets and liabilities: | | | | | | | | | |
(Increase) decrease in other assets | |
| (1,186) | |
| 405 | |
| (4,279) |
Increase (decrease) in other liabilities | |
| (3,302) | |
| (5,772) | |
| (1,280) |
Net cash provided by (used in) operating activities | |
| 46,659 | |
| 106,434 | |
| 50,609 |
| | | | | | | | | |
Cash Flows Provided by (Used in) Investing Activities | | | | | | | | | |
Purchases of equity securities | | | (5,000) | | | — | | | (520) |
Net cash paid for acquisitions | | | (61,656) | | | — | | | (90,722) |
Purchases of premises and equipment | |
| (15) | |
| (19) | |
| (31) |
Net cash provided by (used in) investing activities | |
| (66,671) | |
| (19) | |
| (91,273) |
| | | | | | | | | |
Cash Flows Provided by (Used in) Financing Activities | | | | | | | | | |
Cash paid for withholding taxes on stock-based payments | |
| (997) | |
| (635) | |
| (863) |
Cash dividends paid | |
| (50,764) | |
| (48,012) | |
| (45,171) |
Repayments of borrowings | | | (18,500) | | | (74,000) | | | (6,000) |
Proceeds from issuance of debt | | | 72,500 | | | 142,634 | | | 60,000 |
Proceeds from stock options exercised | | | — | | | 101 | | | 169 |
Purchase of treasury stock | | | (33,043) | | | (12,272) | | | (24,292) |
Common stock issuance costs | | | (150) | | | — | | | (234) |
Net cash provided (used in) by financing activities | |
| (30,954) | |
| 7,816 | |
| (16,391) |
| | | | | | | | | |
Net increase (decrease) in cash and cash equivalents | |
| (50,966) | |
| 114,231 | |
| (57,055) |
Cash and cash equivalents, beginning of period | |
| 129,183 | |
| 14,952 | |
| 72,007 |
| | | | | | | | | |
Cash and cash equivalents, ending of period | | $ | 78,217 | | $ | 129,183 | | $ | 14,952 |
123136
ITEM 9. CHANGES IN AND DISAGREEMENTS WITH ACCOUNTANTS ON ACCOUNTING AND FINANCIAL DISCLOSURE
None.
ITEM 9A. CONTROLS AND PROCEDURES
Changes in Internal Control Over Financial Reporting
During the three months ended December 31, 2021, no change occurred in our internal control over financial reporting that has materially affected, or is reasonably likely to materially affect, our internal control over financial reporting.
Evaluation of Disclosure Controls and Procedures
An evaluation of our disclosure controls and procedures, as defined in Rule 13a-15(e) under the Exchange Act, was carried out as of December 31, 2021, under the supervision and with the participation of our Chief Executive Officer, Chief Financial Officer, and several other members of our senior management. Based on this evaluation, our Chief Executive Officer and Chief Financial Officer concluded that, as of December 31, 2021, our disclosure controls and procedures were effective in ensuring that the information we are required to disclose in the reports we file or submit under the Exchange Act was (i) accumulated and communicated to our management (including the Chief Executive Officer and Chief Financial Officer) to allow timely decisions regarding required disclosure, and (ii) recorded, processed, summarized, and reported within the time periods specified in the SEC’s rules and forms.
Management’s Report on Internal Control Over Financial Reporting
First Busey’s management is responsible for establishing and maintaining adequate internal control over financial reporting. The Company’s internal control over financial reporting is a process designed under the supervision of the Company’s Chief Executive Officer and Chief Financial Officer to provide reasonable assurance regarding the reliability of financial reporting and the preparation of the Company’s Consolidated Financial Statements for external reporting purposes in accordance with U.S. generally accepted accounting principles.
As of December 31, 2021, management assessed the effectiveness of the Company’s internal control over financial reporting based on the criteria for effective internal control over financial reporting established in “Internal Control—Integrated Framework,” issued by the COSO in 2013. As permitted, management excluded from its assessment of internal control over financial reporting GSB from June 1, 2021, through August 14, 2021. This interim period from the acquisition date until GSB was merged into Busey Bank consisted of 74 days and GSB did not represent a material percentage of the Company’s net income, and GSB’s balance sheet accounted for 11.9% of the Company’s consolidated total assets as of the acquisition date. Based on this assessment, management determined that the Company maintained effective internal control over financial reporting as of December 31, 2021, based on the COSO criteria.
RSM US LLP, an independent registered public accounting firm that audited the Consolidated Financial Statements of the Company included in this Annual Report, has issued an audit opinion on the effectiveness of the Company’s internal control over financial reporting as of December 31, 2021. The report, which expresses an unqualified opinion on the effectiveness of the Company’s internal control over financial reporting as of December 31, 2021, is included in this Item under the heading “Report of Independent Registered Public Accounting Firm on Internal Control Over Financial Reporting.”
137
Report of Independent Registered Public Accounting Firm on
Internal Control Over Financial Reporting
Stockholders and the Board of Directors of
First Busey Corporation
Opinion on the Internal Control Over Financial Reporting
We have audited First Busey Corporation and Subsidiaries' (the Company) internal control over financial reporting as of December 31, 2021, based on criteria established in Internal Control—Integrated Framework issued by the Committee of Sponsoring Organizations of the Treadway Commission in 2013. In our opinion, the Company maintained, in all material respects, effective internal control over financial reporting as of December 31, 2021, based on criteria established in Internal Control—Integrated Framework issued by the Committee of Sponsoring Organizations of the Treadway Commission in 2013.
We have also audited, in accordance with the standards of the Public Company Accounting Oversight Board (United States) (PCAOB), the consolidated financial statements of the Company and our report dated February 24, 2022, expressed an unqualified opinion.
As described in Management’s Report on Internal Control over Financial Reporting, management has excluded Glenview State Bank from its assessment of internal control over financial reporting from June 1, 2021 through August 14, 2021 because it was acquired by the Company in a purchase business combination on May 31, 2021 and merged into Busey Bank on August 14, 2021. We have also excluded Glenview State Bank from our audit of internal control over financial reporting for the period from June 1, 2021 through August 14, 2021. Glenview State Bank was a wholly owned subsidiary whose net income did not represent a material percentage of the Company’s net income, and whose balance sheet accounted for 11.9% of the Company’s consolidated total assets as of the acquisition date.
Basis for Opinion
The Company’s management is responsible for maintaining effective internal control over financial reporting and for its assessment of the effectiveness of internal control over financial reporting in the accompanying Management’s Report on Internal Control over Financial Reporting. Our responsibility is to express an opinion on the Company’s internal control over financial reporting based on our audit. We are a public accounting firm registered with the PCAOB and are required to be independent with respect to the Company in accordance with U.S. federal securities laws and the applicable rules and regulations of the Securities and Exchange Commission and the PCAOB.
We conducted our audit in accordance with the standards of the PCAOB. Those standards require that we plan and perform the audit to obtain reasonable assurance about whether effective internal control over financial reporting was maintained in all material respects. Our audit included obtaining an understanding of internal control over financial reporting, assessing the risk that a material weakness exists, and testing and evaluating the design and operating effectiveness of internal control based on the assessed risk. Our audit also included performing such other procedures as we considered necessary in the circumstances. We believe that our audit provides a reasonable basis for our opinion.
Definition and Limitations of Internal Control Over Financial Reporting
A company's internal control over financial reporting is a process designed to provide reasonable assurance regarding the reliability of financial reporting and the preparation of financial statements for external purposes in accordance with generally accepted accounting principles. A company's internal control over financial reporting includes those policies and procedures that (1) pertain to the maintenance of records that, in reasonable detail, accurately and fairly reflect the transactions and dispositions of the assets of the company; (2) provide reasonable assurance that transactions are recorded as necessary to permit preparation of financial statements in accordance with generally accepted accounting principles, and that receipts and expenditures of the company are being made only in accordance with authorizations of management and directors of the company; and (3) provide reasonable assurance regarding prevention or timely detection of unauthorized acquisition, use or disposition of the company's assets that could have a material effect on the financial statements.
138
Because of its inherent limitations, internal control over financial reporting may not prevent or detect misstatements. Also, projections of any evaluation of effectiveness to future periods are subject to the risk that controls may become inadequate because of changes in conditions, or that the degree of compliance with the policies or procedures may deteriorate.
/s/ RSM US LLP
Champaign, Illinois
February 24, 2022
139
ITEM 9B. OTHER INFORMATION
None.
ITEM 9C. DISCLOSURE REGARDING FOREIGN JURISDICTIONS THAT PREVENT INSPECTIONS
Not applicable.
PART III
ITEM 10. DIRECTORS, EXECUTIVE OFFICERS AND CORPORATE GOVERNANCE
(a) Directors of the Registrant and Corporate Governance. Information required by this Item is incorporated herein by reference to First Busey’s Proxy Statement for its 2022 Annual Meeting of Stockholders to be filed with the SEC within 120 days of First Busey’s fiscal year-end under the captions “Proposal 1: Election of Directors,”“Delinquent Section 16(a) Reports,” and “Corporate Governance and Board of Directors Matters.”
(b) Executive Officers of the Registrant. The information required by this Item is incorporated herein by reference to Part I, Item I of this Form 10-K under the caption “Executive Officers.”
ITEM 11. EXECUTIVE COMPENSATION
The information required by this Item is incorporated herein by reference to First Busey’s Proxy Statement for its 2022 Annual Meeting of Stockholders to be filed with the SEC within 120 days of First Busey’s fiscal year-end under the captions “Director Compensation,” “Compensation Discussion and Analysis,” “Executive Management Compensation and Succession Committee Report,” “Compensation of Named Executive Officers,” and “Executive Management Compensation and Succession Committee Interlocks and Insider Participation.”
140
ITEM 12. SECURITY OWNERSHIP OF CERTAIN BENEFICIAL OWNERS AND MANAGEMENT AND RELATED STOCKHOLDER MATTERS
Note 24. Unaudited Interim Financial Data
Stock Incentive Plans
The following table reflects summarized unaudited quarterly datadiscloses the number of outstanding options, warrants and rights granted by First Busey to participants in equity compensation plans, as well as the number of securities remaining available for future issuance under these plans, as of December 31, 2021. The table provides this information separately for equity compensation plans that have and have not been approved by security holders. Additional information regarding stock incentive plans is presented in “Note 14. Stock-based Compensation” in the periods described (dollarsNotes to the Consolidated Financial Statements included pursuant to Item 8.
| | | | | | | | |
|
| |
| | |
| (c) |
|
| | | | | | | Number of |
|
| | | | | | | securities |
|
| | (a) | | (b) | | remaining for |
| |
| | Number of | | Weighted- | | future issuance |
| |
| | securities to be | | average | | under equity |
| |
| | issued upon | | exercise price of | | compensation |
| |
| | exercise of | | outstanding | | plans (excluding |
| |
| | outstanding | | options, | | securities |
| |
| | options, warrants | | warrants and | | reflected in |
| |
|
| and rights |
| rights (1) |
| column (a)) |
| |
Equity compensation plans | | | | | | | | |
Approved by stockholders (2) |
| 1,427,421 | (3) | $ | 23.53 |
| 1,597,235 | (4) |
Not approved by stockholders |
| — | |
| — |
| — | |
Total as of December 31, 2021 |
| 1,427,421 | | $ | 23.53 |
| 1,597,235 | |
| (1) | The weighted average exercise price only relates to 31,386 stock options. |
| (2) | Includes outstanding awards under the First Busey Corporation 2020 Equity Incentive Plan, the First Busey Corporation 2010 Equity Incentive Plan, as amended, the First Community Amended and Restated 2008 Equity Incentive Plan and the First Community 2016 Equity Incentive Plan. |
| (3) | Balance includes stock options assumed in connection with the acquisition of First Community. |
| (4) | Shares are reserved under the First Busey Corporation 2020 Equity Incentive Plan and 2021 ESPP in the amounts of 1,027,625 and 569,610, respectively. |
Other information required by Item 12 is incorporated herein by reference to First Busey’s Proxy Statement for its 2022 Annual Meeting of Stockholders to be filed with the SEC within 120 days of First Busey’s fiscal year-end under the caption “Stock Ownership of Certain Beneficial Owners and Management.”
ITEM 13. CERTAIN RELATIONSHIPS AND RELATED TRANSACTIONS, AND DIRECTOR INDEPENDENCE
The information required by this Item is incorporated herein by reference to First Busey’s Proxy Statement for its 2022 Annual Meeting of Stockholders to be filed with the SEC within 120 days of First Busey’s fiscal year-end under the captions “Certain Relationships and Related-Person Transactions” and “Corporate Governance and Board of Directors Matters.”
ITEM 14. PRINCIPAL ACCOUNTANT FEES AND SERVICES
The information required by this Item is incorporated herein by reference to First Busey’s Proxy Statement for its 2022 Annual Meeting of Stockholders to be filed with the SEC within 120 days of First Busey’s fiscal year-end under the caption “Audit and Related Fees.”
141
PART IV
ITEM 15. EXHIBIT AND FINANCIAL STATEMENT SCHEDULES
Financial Statement Schedules
Our Consolidated Financial Statements are included as part of this Annual Report in thousands, except per share data):“Part II, Item 8. Financial Statements and Supplementary Data,” as follows:
|
|
|
|
|
|
|
|
|
|
|
|
|
|
| 2018 | ||||||||||
|
| December 31 |
| September 30 |
| June 30 |
| March 31 | ||||
|
|
|
|
|
|
|
|
|
|
|
|
|
Total interest income |
| $ | 74,314 |
| $ | 72,761 |
| $ | 70,325 |
| $ | 68,633 |
Total interest expense |
|
| 13,811 |
|
| 11,987 |
|
| 9,953 |
|
| 8,876 |
Net interest income |
|
| 60,503 |
|
| 60,774 |
|
| 60,372 |
|
| 59,757 |
Provision for loan losses |
|
| 405 |
|
| 758 |
|
| 2,258 |
|
| 1,008 |
Total non-interest income |
|
| 22,852 |
|
| 21,853 |
|
| 22,802 |
|
| 22,486 |
Total non-interest expense |
|
| 48,769 |
|
| 45,929 |
|
| 47,305 |
|
| 51,040 |
Income before income taxes |
|
| 34,181 |
|
| 35,940 |
|
| 33,611 |
|
| 30,195 |
Income taxes |
|
| 8,891 |
|
| 9,081 |
|
| 8,749 |
|
| 8,278 |
Net income |
| $ | 25,290 |
| $ | 26,859 |
| $ | 24,862 |
| $ | 21,917 |
|
|
|
|
|
|
|
|
|
|
|
|
|
Basic earnings per share |
| $ | 0.52 |
| $ | 0.55 |
| $ | 0.51 |
| $ | 0.45 |
Diluted earnings per share |
| $ | 0.51 |
| $ | 0.55 |
| $ | 0.51 |
| $ | 0.45 |
| | |
| | |
Report of Independent Registered Public Accounting Firm (PCAOB ID 49) | 74 | |
77 | ||
78 | ||
79 | ||
80 | ||
81 | ||
83 | ||
|
|
|
|
|
|
|
|
|
|
|
|
|
|
| 2017 | ||||||||||
|
| December 31 |
| September 30 |
| June 30 |
| March 31 | ||||
|
|
|
|
|
|
|
|
|
|
|
|
|
Total interest income |
| $ | 70,847 |
| $ | 62,519 |
| $ | 46,009 |
| $ | 44,927 |
Total interest expense |
|
| 7,801 |
|
| 6,578 |
|
| 3,643 |
|
| 2,914 |
Net interest income |
|
| 63,046 |
|
| 55,941 |
|
| 42,366 |
|
| 42,013 |
Provision for loan losses |
|
| 2,809 |
|
| 1,494 |
|
| 500 |
|
| 500 |
Total non-interest income |
|
| 23,561 |
|
| 20,837 |
|
| 20,062 |
|
| 20,014 |
Total non-interest expense |
|
| 53,100 |
|
| 46,939 |
|
| 36,768 |
|
| 37,619 |
Income before income taxes |
|
| 30,698 |
|
| 28,345 |
|
| 25,160 |
|
| 23,908 |
Income taxes |
|
| 18,405 |
|
| 9,561 |
|
| 8,681 |
|
| 8,738 |
Net income |
| $ | 12,293 |
| $ | 18,784 |
| $ | 16,479 |
| $ | 15,170 |
|
|
|
|
|
|
|
|
|
|
|
|
|
Basic earnings per share |
| $ | 0.25 |
| $ | 0.41 |
| $ | 0.43 |
| $ | 0.40 |
Diluted earnings per share |
| $ | 0.25 |
| $ | 0.41 |
| $ | 0.43 |
| $ | 0.39 |
Reports on Internal Control Over Financial Reporting are included as part of this Annual Report in “Part II, Item 9A. Controls and Procedures,” as follows:
| | |
| | |
Management’s Report on Internal Control Over Financial Reporting | 137 | |
Report of Independent Registered Public Accounting Firm on Internal Control Over Financial Reporting | 138 | |
Exhibits
A list of exhibits to this Annual Report is set forth on the Exhibit Index beginning on page 143, and is incorporated into this Annual Report by reference.
Stockholders may obtain a copy of any of the exhibits by writing to First Busey Corporation, Corporate Secretary, at 100 W. University, Champaign, IL 61820, or by visiting the SEC’s EDGAR database at http://www.sec.gov. The Company’s SEC file number is 0-15950.
ITEM 16. FORM 10-K SUMMARY
None.
142
EXHIBIT INDEX
| | | | | | | | | | | | |
|---|---|---|---|---|---|---|---|---|---|---|---|---|
| | | | Incorporated herein by reference | | | ||||||
Exhibit |
| Description of Exhibit |
| Filing Entity (1) |
| Form |
| Exhibit |
| Filing Date |
| Filed |
2.1* | | | BUSE | | 8-K | | 2.1 | | 1/19/2021 | | | |
| | | | | | | | | | | | |
3.1 | | | BUSE | | 10-Q | | 3.1 | | 11/6/2015 | | | |
| | | | | | | | | | | | |
3.2 | | Certificate of Amendment to Articles of Incorporation, dated May 22, 2020 | | BUSE | | S-8 | | 4.2 | | 5/29/2020 | | |
| | | | | | | | | | | | |
3.3 | | | BUSE | | 8-K | | 3.1 | | 11/24/2008 | | | |
| | | | | | | | | | | | |
4.1 | | Certain instruments defining the rights of holders of long-term debt of the First Busey, none of which authorize a total amount of indebtedness in excess of 10% of the total assets of the First Busey and its subsidiaries on a consolidated basis, have not been filed as exhibits. First Busey hereby agrees to furnish a copy of any of these agreements to the SEC upon request. | | | | | | | | | | |
| | | | | | | | | | | | |
4.2 | | | BUSE | | 10-K | | 4.2 | | 2/25/2021 | | | |
| | | | | | | | | | | | |
10.1† | | | BUSE | | 10-K | | 10.1 | | 2/28/2018 | | | |
| | | | | | | | | | | | |
10.2† | | | MSTI | | 10-K | | 10.2 | | 3/29/2002 | | | |
| | | | | | | | | | | | |
10.3† | | Letter Agreement between Main Street Trust, Inc., and Van A. Dukeman, dated September 20, 2006 | | MSTI | | 8-K | | 99.2 | | 9/21/2006 | | |
| | | | | | | | | | | | |
10.4† | | | BUSE | | 10-Q | | 10.1 | | 5/13/2010 | | | |
| | | | | | | | | | | | |
143
| | | | | | | | | | | | |
|---|---|---|---|---|---|---|---|---|---|---|---|---|
| | | | Incorporated herein by reference | | | ||||||
Exhibit | Description of Exhibit | FilingEntity(1) | Form | Exhibit | FilingDate | Filed | ||||||
10.5† | | | BUSE | | 10-Q | | 10.4 | | 5/8/2012 | | | |
| | | | | | | | | | | | |
10.6† | | Van A. Dukeman First Amendment to Employment Agreement, dated December 31, 2008 | | BUSE | | 10-Q | | 10.1 | | 5/8/2012 | | |
| | | | | | | | | | | | |
10.7† | | | BUSE | | 10-Q | | 10.4 | | 5/13/2010 | | | |
| | | | | | | | | | | | |
10.8† | | Robert F. Plecki First Amendment to Employment Agreement, dated December 16, 2008 | | BUSE | | 10-Q | | 10.5 | | 5/8/2012 | | |
| | | | | | | | | | | | |
10.9† | | First Busey Corporation 2010 Equity Incentive Plan, as amended | | BUSE | | DEF 14A | | Appendix C | | 4/17/2015 | | |
| | | | | | | | | | | | |
10.10† | | | BUSE | | 10-K | | 10.27 | | 2/28/2018 | | | |
| | | | | | | | | | | | |
10.11† | | First Community Financial Partners, Inc. Amended and Restated 2008 Equity Incentive Plan | | FCFP | | S-4 | | 10.11 | | 11/19/2012 | | |
| | | | | | | | | | | | |
10.12† | | | FCFP | | S-4 | | 10.12 | | 11/19/2012 | | | |
| | | | | | | | | | | | |
10.13† | | | FCFP | | 10-K | | 10.8 | | 3/14/2016 | | | |
| | | | | | | | | | | | |
10.14† | | | BUSE | | 10-K | | 10.36 | | 2/28/2018 | | | |
| | | | | | | | | | | | |
10.15† | | First Community Financial Partners, Inc. 2016 Equity Incentive Plan | | FCFP | | S-8 | | 4.4 | | 6/3/2016 | | |
| | | | | | | | | | | | |
10.16† | | First Amendment of the First Community Financial Partners, Inc. 2016 Equity Incentive Plan | | BUSE | | 10-K | | 10.38 | | 2/28/2018 | | |
| | | | | | | | | | | | |
10.17† | | | FCFP | | S-8 | | 4.7 | | 6/3/2016 | | | |
| | | | | | | | | | | | |
144
| | | | | | | | | | | | |
|---|---|---|---|---|---|---|---|---|---|---|---|---|
| | | | Incorporated herein by reference | | | ||||||
Exhibit | Description of Exhibit | FilingEntity(1) | Form | Exhibit | FilingDate | Filed | ||||||
10.18† | | | FCFP | | S-8 | | 4.8 | | 6/3/2016 | | | |
| | | | | | | | | | | | |
10.19† | | | BUSE | | 10-K | | 10.41 | | 2/28/2018 | | | |
| | | | | | | | | | | | |
10.20† | | | BUSE | | 10-Q | | 10.1 | | 8/7/2018 | | | |
| | | | | | | | | | | | |
10.21† | | | BUSE | | 10-Q | | 10.2 | | 8/7/2018 | | | |
| | | | | | | | | | | | |
10.22† | | | BUSE | | 8-K | | 10.1 | | 7/26/2019 | | | |
| | | | | | | | | | | | |
10.23† | | Robin N. Elliott Employment Agreement, dated December 5, 2019 | | BUSE | | 8-K | | 10.1 | | 12/10/2019 | | |
| | | | | | | | | | | | |
10.24† | | Amy L. Randolph Employment Agreement, dated December 5, 2019 | | BUSE | | 8-K | | 10.2 | | 12/10/2019 | | |
| | | | | | | | | | | | |
10.25† | | | BUSE | | 8-K | | 10.3 | | 12/10/2019 | | | |
| | | | | | | | | | | | |
10.26† | | Jeffrey D. Jones Amendment to Employment Agreement, dated December 5, 2019 | | BUSE | | 8-K | | 10.4 | | 12/10/2019 | | |
| | | | | | | | | | | | |
10.27† | | First Busey Corporation 2020 Equity Incentive Plan, as amended | | BUSE | | 14A | | Appendix A | | 4/9/2020 | | |
| | | | | | | | | | | | |
10.28† | | | BUSE | | S-8 | | 4.5 | | 5/29/2020 | | | |
| | | | | | | | | | | | |
10.29† | | | BUSE | | 8-K | | 10.1 | | 7/9/2020 | | | |
| | | | | | | | | | | | |
10.30† | | | BUSE | | 10-Q | | 10.1 | | 8/6/2020 | | | |
| | | | | | | | | | | | |
10.31† | | | BUSE | | DEF 14A | | Appendix A | | 4/8/2021 | | | |
| | | | | | | | | | | | |
145
| | | | | | | | | | | | |
|---|---|---|---|---|---|---|---|---|---|---|---|---|
| | | | Incorporated herein by reference | | | ||||||
Exhibit |
| Description of Exhibit |
| Filing Entity (1) |
| Form |
| Exhibit |
| Filing Date |
| Filed |
10.32† | | Gregory B. Lykins Letter of Understanding, dated April 1, 2021 | | BUSE | | 10-Q | | 10.33 | | 5/6/2021 | | |
| | | | | | | | | | | | |
10.33 | | | BUSE | | 8-K | | 10.34 | | 6/2/2021 | | | |
| | | | | | | | | | | | |
21.1 | | | | | | | | | | | X | |
| | | | | | | | | | | | |
23.1 | | Consent of Independent Registered Public Accounting Firm, RSM US LLP | | | | | | | | | | X |
| | | | | | | | | | | | |
31.1 | | Certification of Principal Executive Officer, pursuant to Rule 13a-14(a) and Rule 15d-14(a) | | | | | | | | | | X |
| | | | | | | | | | | | |
31.2 | | Certification of Principal Financial Officer, pursuant to Rule 13a-14(a) and Rule 15d-14(a) | | | | | | | | | | X |
| | | | | | | | | | | | |
32.1 | | | | | | | | | | | X | |
| | | | | | | | | | | | |
32.2 | | | | | | | | | | | X | |
| | | | | | | | | | | | |
101.INS | | iXBRL Instance Document | | | | | | | | | | |
| | | | | | | | | | | | |
101.SCH | | iXBRL Taxonomy Extension Schema | | | | | | | | | | |
| | | | | | | | | | | | |
101.CAL | | iXBRL Taxonomy Extension Calculation Linkbase | | | | | | | | | | |
| | | | | | | | | | | | |
101.LAB | | iXBRL Taxonomy Extension Label Linkbase | | | | | | | | | | |
| | | | | | | | | | | | |
101.PRE | | iXBRL Taxonomy Extension Presentation Linkbase | | | | | | | | | | |
| | | | | | | | | | | | |
101.DEF | | iXBRL Taxonomy Extension Definition Linkbase | | | | | | | | | | |
| | | | | | | | | | | | |
104 | | Cover Page Interactive Data File (formatted as inline XBRL with applicable taxonomy extension information contained in Exhibits 101) | | | | | | | | | | |
| (1) | BUSE is First Busey Corporation. MSTI is Main Street Trust, Inc. FCFP is First Community Financial Partners, Inc. |
| * | First Busey has omitted schedules and similar attachments to the subject agreement pursuant to Item 601(b) of Regulation S-K. First Busey hereby agrees to furnish a copy of any omitted schedule or similar attachment to the SEC upon request. |
| † | Management contract or compensatory plan. |
146
124
SIGNATURES
Pursuant to the requirements of Section 13 or 15(d) of the Securities Exchange Act of 1934, the registrant has duly caused this report to be signed on its behalf by the undersigned, thereunto duly authorized.
Date: February 24, 2022 | | ||
| | ||
| FIRST BUSEY CORPORATION | ||
| | ||
| BY | /s/ VAN A. DUKEMAN | |
| Van A. Dukeman | ||
| Chairman, President and Chief Executive Officer | ||
| (Principal Executive Officer) | ||
| | | |
| BY | /s/ JEFFREY D. JONES | |
| Jeffrey D. Jones | ||
| Chief Financial Officer | ||
| (Principal Financial Officer) | ||
| | ||
| BY | /s/ LYNETTE M. STRODE | |
| Lynette M. Strode | ||
| Principal Accounting Officer | ||
| | ||
Pursuant to the requirements of the Securities Exchange Act of 1934, this report has been signed below by the following persons on behalf of the registrant and in the capacities and on the dates indicated.
Signature | Title | Date | ||
|---|---|---|---|---|
| | | | |
/s/ VAN A. DUKEMAN | | Chairman, President and Chief Executive Officer | | February 24, 2022 |
Van A. Dukeman | | (Principal Executive Officer) | | |
| | | | |
/s/ JEFFREY D. JONES | | Chief Financial Officer | | February 24, 2022 |
Jeffrey D. Jones | | (Principal Financial Officer) | | |
| | | | |
/s/ LYNETTE M. STRODE | | Principal Accounting Officer | | February 24, 2022 |
Lynette M. Strode | | | | |
| | | | |
/s/ GREGORY B. LYKINS | | Vice-Chairman | | February 24, 2022 |
Gregory B. Lykins | | | | |
| | | | |
/s/ SAMUEL P. BANKS | | Director | | February 24, 2022 |
Samuel P. Banks | | | | |
| | | | |
/s/ GEORGE BARR | | Director | | February 24, 2022 |
George Barr | | | | |
| | | | |
/s/ STANLEY J. BRADSHAW | | Director | | February 24, 2022 |
Stanley J. Bradshaw | | | | |
| | | | |
/s/ MICHAEL D. CASSENS | | Director | | February 24, 2022 |
Michael D. Cassens | | | | |
147
Signature | Title | Date | ||
|---|---|---|---|---|
| | | | |
/s/ KAREN M. JENSEN | | Director | | February 24, 2022 |
Karen M. Jensen | | | | |
| | | | |
/s/ FREDERIC L. KENNEY | | Director | | February 24, 2022 |
Frederic L. Kenney | | | | |
| | | | |
/s/ STEPHEN V. KING | | Director | | February 24, 2022 |
Stephen V. King | | | | |
| | | | |
/s/ THOMAS G. SLOAN | | Director | | February 24, 2022 |
Thomas G. Sloan | | | | |
| | | |
148