UNITED STATES
SECURITIES AND EXCHANGE COMMISSION
Washington, D.C. 20549
FORM 10‑K10-K
| |
(Mark One) | |
(Mark One)☒
| |
☒
| ANNUAL REPORT PURSUANT TO SECTION 13 OR 15(d) OF THE SECURITIES EXCHANGE ACT OF 1934 |
For the fiscal year ended December 31, 20182019 |
☐ | TRANSITION REPORT PURSUANT TO SECTION 13 OR 15(d) OF THE SECURITIES EXCHANGE ACT OF 1934 |
For the transition period from to |
Commission File Number 001‑32657001-32657
NABORS INDUSTRIES LTD.LTD.
(Exact name of registrant as specified in its charter)
| |
Bermuda
(State or Other Jurisdiction of
Incorporation or Organization) Crown HouseSecond Floor
4 Par‑la‑VillePar-la-Ville Road
Hamilton, HM08
Bermuda
(Address of principal executive offices) | 98036397098-0363970
(I.R.S. Employer
Identification No.)
N/A
(Zip Code) |
(441) 292‑1510(441) 292-1510
(Registrant’s telephone number, including area code)
Securities registered pursuant to Section 12(b) of the Securities Exchange Act of 1934:
| | |
Title of each class | Trading Symbol(s) | Name of each exchange on which registered |
Common shares, $.001 par value per share | NBR | New York Stock Exchange |
Preferred shares, 6.00% Mandatory Convertible Preferred Shares, Series A, $.001 par value per share | NBR.PRA | New York Stock Exchange |
Securities registered pursuant to Section 12(g) of the Securities Exchange Act of 1934: None.
Indicate by check mark whether the registrant is a well-known seasoned issuer, as defined in Rule 405 of the Securities Act. YES☒ NO ☐
Indicate by check mark if the registrant is not required to file reports pursuant to Section 13 or Section 15(d) of the Act. YES ☐NO☒
Indicate by check mark whether the registrant: (1) has filed all reports required to be filed by Section 13 or 15(d) of the Securities Exchange Act of 1934 during the preceding 12 months (or for such shorter period that the registrant was required to file such reports), and (2) has been subject to such filing requirements for the past 90 days. YES☒ NO ☐
Indicate by check mark whether the registrant has submitted electronically every Interactive Data File required to be submitted pursuant to Rule 405 of Regulation S-T during the preceding 12 months (or for such shorter period that the registrant was required to file such reports). YES☒ NO ☐
Indicate by check mark if disclosure of delinquent filers pursuant to Item 405 of Regulation S-K is not contained herein, and will not be contained, to the best of registrant’s knowledge, in definitive proxy or information statements incorporated by reference in Part III of this Form 10-K or any amendment to this Form 10-K. ☒☐
Indicate by check mark whether the registrant is a large accelerated filer, an accelerated filer, a non‑acceleratednon-accelerated filer or a smaller reporting company. See definition of “large accelerated filer”, “accelerated filer”, “smaller reporting company” and “emerging growth company” in Rule 12b‑212b-2 of the Exchange Act.
| | | |
| | | | |
Large Accelerated Filer ☒ | Accelerated Filer ☐ | Non‑acceleratedNon-accelerated Filer ☐
| Smaller Reporting Company ☐ | Emerging Growth Company ☐ |
| | | |
If an emerging growth company, indicate by check mark if the registrant has elected not to use the extended transition period for complying with any new or revised financial accounting standards provided pursuant to Section 13(a) of the Exchange Act. ☐
Indicate by check mark whether the registrant is a shell company (as defined in Rule 12b-2 of the Exchange Act). YES ☐ NO ☒
The aggregate market value of the 344,852,460347,460,335 common shares held by non‑affiliatesnon-affiliates of the registrant outstanding as of the last business day of our most recently completed second fiscal quarter, June 29, 2018,28, 2019, based on the closing price of our common shares as of such date of $6.41$2.90 per share as reported on the New York Stock Exchange, was $2,210,504,269.$1,007,634,972. Common shares held by each officer and director and by each person who owns 5% or more of the outstanding common shares have been excluded in that such persons may be deemed affiliates. This determination of affiliate status is not necessarily a conclusive determination for other purposes.
The number of common shares outstanding as of February 21, 201919, 2020 was 358,791,975,367,128,412, excluding 52,800,203 common shares held by our subsidiaries, or 411,592,178419,928,615 in the aggregate.
DOCUMENTS INCORPORATED BY REFERENCE
Specified portions of the definitive Proxy
Statement to be distributed in connection with our 20192020 Annual General Meeting of Shareholders (Part III).
NABORS INDUSTRIES LTD.
Form 10-K Annual Report
For the Year Ended December 31, 20182019
Table of Contents
Our internet address is www.nabors.com. We make available free of charge through our website our annual report on Form 10-K, quarterly reports on Form 10-Q, current reports on Form 8-K and amendments to those reports filed or furnished pursuant to Section 13(a) or 15(d) of the Securities Exchange Act of 1934, as amended (the “Exchange Act”), as soon as reasonably practicable after we electronically file such material with, or furnish it to, the Securities and Exchange Commission (the “SEC”). Reference in this document to our website address does not constitute incorporation by reference of the information contained on the website into this annual report on Form 10-K. The SEC maintains an internet site (www.sec.gov) that contains reports, proxy and information statements and other information regarding issuers that file electronically with the SEC. In addition, documents relating to our corporate governance (such as committee charters, governance guidelines and other internal policies) can be found on our website.
FORWARD-LOOKING STATEMENTS
We discuss expectations regarding our future markets, demand for our products and services, and our performance in our annual, quarterly and current reports, press releases, and other written and oral statements. Statements relating to matters that are not historical facts are ‘‘forward-looking statements’’ within the meaning of the safe harbor provisions of Section 27A of the Securities Act and Section 21E of the Securities Exchange Act of 1934, as amended (the ‘‘Exchange Act’’). These ‘‘forward-looking statements’’ are based on an analysis of currently available competitive, financial and economic data and our operating plans. They are inherently uncertain and investors should recognize that events and actual results could turn out to be significantly different from our expectations. By way of illustration, when used in this document, words such as ‘‘anticipate,’’ ‘‘believe,’’ ‘‘expect,’’ ‘‘plan,’’ ‘‘intend,’’ ‘‘estimate,’’ ‘‘project,’’ ‘‘will,’’ ‘‘should,’’ ‘‘could,’’ ‘‘may,’’ ‘‘predict’’ and similar expressions are intended to identify forward-looking statements.
Factors to consider when evaluating these forward-looking statements include, but are not limited to:
| ·
● | | fluctuations and volatility in worldwide prices of and demand for oil and natural gas; |
| ·
● | | fluctuations in levels of oil and natural gas exploration and development activities; |
| ·
● | | fluctuations in the demand for our services; |
| ·
● | | competitive and technological changes and other developments in the oil and gas and oilfield services industry; industries; |
| ·
● | | our ability to renew customer contracts in order to maintain competitiveness; |
| ·
● | | the existence of operating risks inherent in the oil and gas and oilfield services industries; |
| ·
● | | the possibility of the loss of one or a number of our large customers; |
| ·
● | | the impact of long-term indebtedness and other financial commitments on our financial and operating flexibility; |
| ·
● | | our access to and the cost of capital, including the impact of a further downgrade in our credit rating, covenant restrictions, availability under our unsecured revolving credit facilities, and future issuances of debt or equity securities; |
| ·
● | | our dependence on our operating subsidiaries and investments to meet our financial obligations; |
| ·
● | | our ability to retain skilled employees; |
| ·
● | | our ability to complete, and realize the expected benefits of, strategic transactions; |
| ·
● | | the recent changes in U.S. tax laws and the possibility of changes in other tax laws and other laws and regulations;
|
| ·
● | | the possibility of political or economic instability, civil disturbance, war or acts of terrorism in andany of the countries in which we do business; and |
| ·
● | the possibility of changes to U.S. trade policies and regulations, including the imposition of trade embargoes, sanctions or tariffs; and |
| ● | general economic conditions, including the capital and credit markets. |
Our businesses depend,business depends, to a large degree, on the level of spending by oil and gas companies for exploration, development and production activities. Therefore, a sustained increase or decrease in the price of oil or natural gas, that has a material impact on exploration, development and production activities, could also materially affect our financial position, results of operations and cash flows.
The above description of risks and uncertainties is by no means all-inclusive, but highlights certain factors that we believe are important for your consideration. For a more detailed description of risk factors, please refer to Part I, Item 1A.—Risk Factors.
PART I
ITEM 1. BUSINESS
Nabors Industries, Ltd. (NYSE: NBR) was formed as a Bermuda exempted company on December 11, 2001. Unless the context requires otherwise, references in this annual report to “we,” “us,” “our,” “the Company,” or “Nabors” mean Nabors Industries Ltd., together with our subsidiaries where the context requires. References in this annual report to “Nabors Delaware” mean Nabors Industries, Inc., a wholly ownedwholly-owned subsidiary of Nabors.
Overview
Since its founding in 1952, Nabors has grown from a small land drilling business in Canada to one of the world’s largest drilling contractors. Today, Nabors owns and operates one of the world’s largest land-based drilling rig fleets and is a provider of offshore rigs in the United States and numerous international markets. Nabors also provides directional drilling services, tubular running services, performance tools, and innovative technologies for its own rig fleet and those ofoperated by third parties. In today’s performance-driven environment, we believe we are well positioned to seamlessly integrate downhole hardware, surface equipment and software solutions into our AC rig designs. Leveraging our advanced drilling automation capabilities, Nabors’ highly skilled workforce continues to set new standards for operational excellence and transform our industry.
Our business is comprised of our global land-based and offshore drilling rig operations and other rig related services and technologies, consisting oftechnologies. These services include tubular running services, wellbore placement solutions, directional drilling, measurement-while-drilling (“MWD”), logging-while-drilling (“LWD”) systems and services, equipment manufacturing, rig instrumentation and optimization software. We also specialize in tubular services, wellbore placement solutions and are a leading provider of directional drilling and measurement while drilling (“MWD”) systems and services.
Our business consists of five reportable segments: U.S. Drilling, Canada Drilling, International Drilling, Drilling Solutions and Rig Technologies.
With operations in over 2524 countries, we are a global provider of drilling and drilling-related services for land-based and offshore oil and natural gas wells, with a fleet of rigs and drilling-related equipment which, as of December 31, 20182019 included:
| ·
● | | 384366 actively marketed rigs for land-based drilling operations in the United States, Canada and approximately 1816 other countries throughout the world; and
|
| ·
● | | 33 actively marketed rigs for offshore platform drilling operations in the United States and multiple international markets. |
The following table presents our average rigs working (a measure of activity and utilization over the year) for the years ended December 31, 2019, 2018 2017 and 2016:2017:
| | | | | | | |
| | Year Ended December 31, | |
| | 2018 | | 2017 | | 2016 | |
| | | | | | | |
| | | Year Ended December 31, |
| | | 2019 | | 2018 | | 2017 |
Average Rigs Working: | | | | | | | | | | | | |
U.S. Drilling | | 113.2 | | 100.8 | | 62.0 | | 115.3 | | 113.2 | | 100.8 |
Canada Drilling | | 16.9 | | 15.4 | | 9.7 | | 10.9 | | 16.9 | | 15.4 |
International Drilling | | 92.9 | | 91.1 | | 100.2 | | 88.3 | | 92.9 | | 91.1 |
| | 223.0 | | 207.3 | | 171.9 | |
| | | 214.5 | | 223.0 | | 207.3 |
Average rigs working represents a measure of the number of equivalent rigs operating during a given period. For example, one rig operating 182.5 days during a 365-day period represents 0.5 average rigs working.
Additional information regarding the geographic markets in which we operate and our business segments can be found in Note 21—19—Segment Information in Part II, Item 8.—Financial Statements and Supplementary Data.
U.S. Drilling
OurOperating one of the largest land-based drilling rig fleets in the U.S. Drilling operations include land, Nabors continues to drive innovation and integration in the industry. Nabors offers a full suite of options including directional drilling services, performance tools and innovations developed by our team of internal engineers who are wholly focused on advanced technologies. We maintain activities in the lower 48 states and Alaska as well as offshore drilling activities in the Gulf of Mexico. We operate one of the largest land-based drilling rig fleets in the United States, consistingOur U.S. fleet consists of 188 AC rigs and 2218 SCR rigs, which were actively marketed as of December 31, 2018.2019.
Nabors’Since our first AC land rig was built during 2002. Since then, the AC rig technology has significantly evolved as more than 900 AC rigsin 2002, we have been addedcontinued to the U.S. land market.evolve with industry-leading breakthroughs. As the industry shifted to multi wellmulti-well pad drilling, operators demandedwe anticipated the appetite for greater efficiencies and adaptability through batch drilling. We believeAs a result, we developed our latest generationsuite of PACE® drilling rigs are ideal for batch drilling, with pad optimal features, such as our proprietary side saddle design, and advanced walking capabilities.
rigs. In 2013, we introduced our PACE®-X800 rig equipped with an advanced walking system that enablesmoves the rig to move quickly over existing wells on a pad along both the X and Y axes. Most ofBecause the ancillary equipment moves withaccompanies the rig, enabling it to movemoves easily between adjacent rows of wells.
During the second half of In 2016, we introduced our PACE®-M800 and PACE®-M1000 rigs which complement our existing PACE®-X800 rigs. The PACE®-M800 rig is designed for lower-density multi-well pads whereas the PACE®-M1000 is designed for higher density pads. Both are designed to move rapidly between pads. Featuring the same advanced walking capabilities as the PACE®-X800 rig, the PACE®-M800 rig can quickly move efficiently on pads and over short distances, with minimal rig-up and rig-down components.
In addition to land drilling operations throughout the lower 48 states and Alaska, we also actively marketed 12 platform rigs in the U.S. Gulf of Mexico as of December 31, 2018.2019.
In recent years we have deployed a full suite of technology supporting Nabors and third party rigs. By seizing the opportunity to move forward, faster, Nabors has employed automation to increase safety, instill efficient processes and build agility for our customers. See Drilling Solutions below for more information.
Canada Drilling
Our rig fleet consisted of 41 land-based drilling rigs in Canada as of December 31, 2018. Over the past few years, the CanadaThe Canadian market has movedshifted focus away from the conventional drilling of vertical wells and now focuses virtuallyalmost exclusively on horizontal wells. Our focusTo align with that market shift, we concentrated on larger yet more agile rigs. As of December 31, 2019 our rig fleet consisted of 35 land-based drilling rigs in recent years has been onCanada.
International Drilling
Adaptability is key given the market for larger, more capable rigs. The majority ofremote or environmentally sensitive locations our work in Canada is in this market segment.
International Drilling
Weinternational rigs often face. As a global company, we maintain a footprintactivities in nearly every major oil and gas market, across the globe, most notably in Saudi Arabia, Algeria, Argentina, Colombia Kazakhstan and Venezuela.Kazakhstan. Many of our rigs in our international drilling markets wereare designed to specifically address the challenges inherentof working in specific drilling locations such as those required in thea desert and remote or environmentally sensitive locations,climate as well as the various shale plays.
As of December 31, 2018,2019, our international fleet consisted of 133125 land-based drilling rigs located in approximately 1816 countries. We alsoAt the same time, we actively marketed 18 platforms and three jackup rigs in the
international offshore drilling markets as ofmarkets. Anticipating the same date. We continue to upgrade
and deployappetite for high-specification desert rigs, specificallywe upgraded and delivered rigs designed for gas drilling in the Middle East. We haveIn prior years, we increased the utilization of the PACE®-X800 rigs in international markets by deploying six such rigsthrough deployments in Latin America.
Drilling Solutions
Through Nabors Drilling Solutions, we offer specialized drilling technologies, such as patented steering systems and rig instrumentation software systems that enhance drilling performance and wellbore placement. These products include:
RigWatch® Suite
Nabors’ RigWatch® suite of software solutions that turns rig site data into wellsite knowledge to help customers track and trend drilling practices to drive performance.
REVit® Software
Nabors REVit® technology features advanced top drive automation that eliminates stick slip, a common mode of vibration that limits drilling performance.
DrillSmart® Software
A best-in-class automatic driller based on proprietary technology that allows the system to adapt to operating parameters and drilling conditions while optimizing performance.
ROCKit® Software
A patented directional steering control system that oscillates drill pipe to reduce friction and increase rate of penetration.
Nabors specializes in wellbore placement solutions and is a leading provider of directional drilling and MWD systems and services. Our MWD product line is a proprietary family of advanced systems, representing the latest technology developed specifically for the unique requirements of land-based drilling applications. Our tools are ideal for applications where high reliability, precise wellbore placement and drilling efficiency are crucial. Nabors’ patented directional drilling tools enable a higher level of precision and cost effectiveness. These products include:
| ·
● | | AccuMP® mud pulseAcculine MWD system, whichseries is engineered and designed with automation in mind. All tools are 30’ ft. collar based systems that arrive to address many of the current MWD reliability issues present in the market today;
location fully assembled and pre-programmed. This reduces BHA makeup time, improves well-site handling and reduces HSE risks. |
| ·
● | | AccuWave® collar mounted Electromagnetic MWD systemAccuSteer® provides a set of advanced measurements that addressesmeets the needs of the land market throughdrilling budget. The AccuSteer tool provides downhole drilling dynamics measurements, annular and bore pressure, near bit continuous inclination and the latest technologybest azimuthal gamma image in the industry.
|
| ● | AccuMP® MWD tool provides accurate survey, gamma and design techniques;continuous inclination data. AccuMP® is also equipped with additional features such as smart telemetry and real time shock and vibration. These features provide the ability to adjust drilling parameters to maintain optimal performance and minimize the risk of failure; |
| ·
● | AccuWave® is our proprietary electromagnetic MWD system which operates in all drilling fluid environments and has an unlimited lost circulation material tolerance. The Nabors gap sub design enables reliable operations in high doglegs and areas where most electromagnetic tools do not work. Transmission of surveys during connections reduces non-productive time throughout the well saving the customer time and money; |
| Nabors’ AccuSteer® Measurement While Drilling (M/LWD) Suite which●
| Navigator™ collaborative guidance and advisory platform that delivers automated directional drilling information and instructions to drive consistent decision making, transparency, and improved performance; |
| ● | ROCKit® is a premier dynamic evaluation MWDuser friendly directional steering control system forthat increases performance of slide drilling, with integrated advanced geosteering measurements. The AccuSteer® system is a collar based M/LWD designed specifically for the unconventional market.through drill string oscillation and precise toolface control; |
| ● | ROCKit® Pilot is an advanced directional steering control system that automates slide drilling to consistently deliver high performance; and |
| ● | REVit® is an automated real time stick-slip mitigation system that preserves bit cutting structure, increases rates of penetration, and reduces unplanned trips. |
Nabors’ offers a full range of tubular running services to match operators’ requirements and preferences. These services primarily include casing running, tubing running and torque monitoring. Our propriety software empowers the driller to take control and deliver the casing with consistency and repeatability through a single touch. This includes expanded functionality such as auto-fill and cross-thread detection that delivers the most efficient casing run in the industry. The Casing Drive System™ (CDS) is an automated, versatile and powerful casing running tool, which replaces conventional pipe handling equipment and minimizes the need for manual operations on the rig floor. The CDS has been used on more than 100,000 wells worldwide to successfully run casing in deviated, horizontal and complex well and casing-while-drilling applications. All levels of our casing running service are available in all of the countries in which we operate. Additionally, the TesTORK® sub delivers high-speed data though a secured wireless signal that provides the real-time monitoring needed to deliver repeatable & accurate connections, meeting the casing manufacturers’ specifications every time. Precise measurement of each connection enables accurate and consistent makeup that ensures the integrity of entire casing string.
Nabors’ also has a portfolio of Managed Pressure Drilling (MPD) services for the management and control of drilling fluid pressure including well control equipment rentals & testing, and managed pressure drilling solutions for challenging environment with narrow drilling windows.
Rig Technologies
Our Rig Technologies segment is primarily comprised of Canrig, which manufactures and sells top drives, catwalks, wrenches, drawworks and other drilling related equipment such as robotic systems and downhole tools which are installed on both onshore and offshore drilling rigs. Rig Technologies also provides aftermarket sales and services for the installed base of its equipment.
Our Business Strategy
Our business strategy is to build shareholder value and enhance our competitive position by:
| ·
● | | achieving superior operational and health, safety and environmental performance; |
| ·
● | | leveraging our existing global infrastructure and operating reputation to capitalize on growth opportunities; |
| ·
● | | continuing to develop our existing portfolio of value-added services to our customers; |
| ·
● | | enhancing our technology position and advancing drilling technology both on the rig and downhole; and |
| ·
● | | achieving financial returns abovein excess of our cost of capital. |
During 2018the past several years we achieved several milestoneshave transformed our fleet in our drive to automate and integrate the well construction process. As the industry recovered from the severe downturn that began in 2014,Lower 48 into what we believe the investments we have made in our rigs and related technology and equipment are all paying off. We are focused on drillingis the most productive, efficient and safe wells to our clients’ specifications, engineered for highly complex and demanding geology.
Our globalcapable, modern fleet of 417 rigs is the fundamental platform for our business. We enter 2019 with nearly 100 Nabors SmartRig™ units deployed in the U.S. Lower 48,market. Our customer base recognizes the quality of our assets, the competency of our crews, our industry leading operational performance and contracted commitments to deploy an additional eight units during the first half of 2019. value added by our performance software and our services integration.
Our new PACE®-M750 rig was introduced in early 2018, as a significant, and capital efficient, retrofit to the existing PACE®-M550. This design bolsters capabilities for faster drilling, improved mobilityWe deployed seven of our PACE®-M750 rigs and extended reach at a fractiontwo remaining upgraded F-rigs during the first half of the cost2019. As of a newbuild unit.December 31, 2019, we had approximately 80% utilization on our high-spec rig fleet.
During 2018, we made further progress commercializingWe believe our drilling technology portfolio. We believe thisportfolio positions us well to address the changing market dynamic both in the United States and internationally. Our technological development efforts drive toward a seamless integration of the rig’s operations with downhole sensing. In addition,Additionally, we are addinghave added complementary services to our traditional rig offering, and in many cases replacing third-party providers of these complementary services as a single service provider.
In late 2018, Nabors acquired PetroMar Technologies, a developer As such, we have achieved growth within our U.S. Drilling and operatorDrilling Solutions operating segments despite overall market deterioration. As we move forward into 2020, we look to extract increasing value from our existing asset base. This includes the deployment of downhole LWD tools that focuses on high-value formation dataidle assets and repositioning to facilitate well completion optimization. The additionhigher-value markets.
Oil prices declined sharply during the fourth quarter of 2018. This volatility has driven certain exploration and production companies in the U.S. to announce reductions in planned year-over-year capital spending for 2019. We have positioned the Company for this volatility, while still pursuing the primary goal of reducing net debt in 2019. As the year begins, Nabors holds contracts to deploy additional drilling rigs during 2019 with multiple customers in our global markets.
Drilling Contracts
Our drilling contracts are typically daywork contracts. A daywork contract generally provides for a basic rate per day when drilling (the dayrate for providing a rig and crew) and for lower rates when the rig is moving between drilling locations, or when drilling operations are interrupted or restricted by equipment breakdowns, adverse weather conditions or other conditions beyond our control. In addition, daywork contracts may provide for a lump-sum fee for the mobilization and demobilization of the rig, which in most cases approximates our anticipated costs. A daywork contract differs from a footage contract (in which the drilling contractor is paid on the basis of a rate per foot drilled) and a turnkey contract (in which the drilling contractor is paid for drilling a well to a specified depth for a fixed price). We also offer performance enhancing drilling services, performance software and equipment such as managed pressure services, directional drilling, rotary steering systems and measurement while drilling. These additional products and services are additive to our rig charges.
Our contracts for land-based and offshore drilling have durations that are single-well, multi-well or term. Term contracts generally have durations ranging from six months to five years. Under term contracts, our rigs are committed to one customer. Offshore workover projects are often contracted on a single-well basis. We generally receive drilling contracts through competitive bidding, although we occasionally enter into contracts by direct negotiation. Most of our single-well contracts are subject to termination by the customer on short notice, while multi-well contracts and term contracts may provide us with early termination compensation in certain circumstances. Such payments may not fully compensate us for the loss of a contract, and in certain circumstances the customer may not be obligated, able or willing to make an early termination payment to us. Contract terms and rates differ depending on a variety of factors, including
competitive conditions, the geographical area, the geological formation to be drilled, the equipment and services to be supplied, the on-site drilling conditions and the anticipated duration of the work to be performed.
Our Customers
Our customers include major international, national and independent oil and gas companies. One customer, Saudi Aramco, accounted for approximately 24%22%, 29%24% and 33%29% of our consolidated operating revenues during the years ended December 31, 2019, 2018, 2017, and 2016, respectively, which operating revenues are primarily included in the results of our International Drilling reportable segment. Our contracts with Saudi Aramco are on a per rig basis. These contracts are primarily operated through SANAD, our joint venture with Saudi Aramco. See Part I, Item
1A.—Risk Factors—The loss of one or a number of our large customers could have a material adverse effect on our business, financial condition and results of operations.
Our Employees
As of December 31, 2018,2019, we employed approximately 15,00014,000 people in approximately 2524 countries. Our number of employees fluctuates depending on the current and expected demand for our services. Some rig-based employees in Alaska, Argentina, Mexico and Venezuela are represented by collective bargaining units. We believe our relationship with our employees is generally good.
Seasonality
Our operations are subject to seasonal factors. Specifically, our drilling operations in Canada and Alaska generally experience reduced levels of activity and financial results during the second quarter of each year, due to the annual spring thaw. In addition, our U.S. offshore market can be impacted during summer months by tropical weather systems in the Gulf of Mexico. Global climate change could lengthen these periods of reduced activity, but we cannot currently estimate to what degree. Our overall financial results reflect the seasonal variations experienced in these operations, but seasonality does not materially impact the remaining portions of our business.
Industry/Competitive Conditions
To a large degree, our businesses depend on the level of capital spending by oil and gas companies for exploration, development and production activities. The level of exploration, development and production activities is to a large extent tied to the prices of oil and natural gas, which can fluctuate significantly and are highly volatile. For example, oil prices were as high as $107 per barrel during 2014 and reached a near ten-year low of $26 per barrel in February 2016. Oil prices began to stabilize during 2017 and steadily increased throughout much of 2018, hitting a four-year high of $76 per barrel in September. However, during the fourth quarter of 2018, oil prices declined dramatically to a low of $42 per barrel. A decrease or prolonged decline in the price of oil or natural gas or in the exploration, development and production activities of our customers could result in a corresponding decline in the demand for our services and/or a reduction in
dayrates and utilization, which could have a material adverse effect on our financial position, results of operations and cash flows. See Part I, Item 1A.—Risk Factors— Fluctuations in oil and natural gas prices could adversely affect drilling activity and our revenues, cash flows and profitability, and—Our drilling contracts may in certain instances be renegotiated, suspended or terminated without an early termination payment and Item 7.— Management’s Discussion and Analysis of Financial Condition and Results of Operations.
The markets in which we provide our services are highly competitive. We believe that competitive pricing is a significant factor in determining which service provider is awarded a job in these markets and customers are increasingly sensitive to pricing during periods of market instability. Historically, the number of available rigs and drilling-related equipment has exceeded demand in many of the markets in which we operate, resulting in strong price competition. This is due in part to the fact that most rigs and drilling-related equipment can be readily moved from one region to another in response to changes in the levels of exploration, development and production activities and market conditions, which may result in an oversupply of rigs and drilling-related equipment in certain areas.
Although many rigs can be readily moved from one region to another in response to changes in levels of activity and many of the total available contracts are currently awarded on a bid basis, competition has increased based on the supply of existing and new rigs across all of our markets. Most available contracts for our services are currently awarded on a bid basis, which further increases competition based on price.
In addition to price, other competitive factors in the markets we serve are the overall quality of service and safety record, the technical specification and condition of equipment, the availability of skilled personnel and the ability to offer ancillary services. Our drilling business is subject to certain additional competitive factors. For example, we believe our ability to deliver rigs with new technology and features and, in certain international markets, our experience operating in certain environments and strong customer relationships have been significant factors in the selection of Nabors for the provision of drilling services. We expect that the market for our drilling services will continue to be highly competitive. See Part I, Item 1A.—Risk Factors—We operate in a highly competitive industry with excess drilling capacity, which may adversely affect our results of operations.
The global market for drilling and related products and services is competitive. Certain competitors are present in more than one of the markets in which we operate, although no one competitor operates in all such markets. We competeOur strategy combines advanced drilling rig designs – complete with (1)integrated downhole tools, surface equipment, and software – with operational performance, industry-leading safety, and an innovative technology roadmap.
Significant competitors in our U.S. Drilling segment include: Helmerich & Payne Inc., Patterson-UTI Energy Inc., Precision Drilling Corp., and several otherEnsign Energy Services Inc. In the U.S. Lower 48 land drilling market, we also compete with numerous smaller or regional drilling contractors. In our International segment, significant competitors with national,operations in multiple countries include KCA Deutag, Saipem S.p.A, as well as many contractors with regional or local rig operations in the United States, (2) Saipem S.p.A, KCA Deutagoperations.
Our Rig Technologies segment competes primarily with National Oilwell Varco Inc., Bentec, and various contractors inseveral smaller rig equipment suppliers. Our Drilling Solutions segment competes with services provided by Baker Hughes Co., Halliburton Co., Schlumberger Ltd., Frank’s International NV, Weatherford International PLC., as well as several of our international marketsdrilling competitors and (3) Precision Drilling, Ensign Energy Services, and others in Canada.smaller, specialized service providers.
Acquisitions and Divestitures
We have grown from a land drilling business centered in the U.S. Lower 48, Canada and Alaska to an international business with operations on land and offshore in most of the major oil and gas markets in the world. At the beginning of 1990, our fleet consisted of 44 actively marketed land drilling rigs in Canada, Alaska and in various international markets. Today, our worldwide fleet of actively marketed rigs consists of 384 land drilling rigs, 30 offshore platform rigs and three jackup units. This growth was fueled in part by strategic acquisitions. While we continuously consider and review strategic opportunities, including acquisitions, divestitures, joint ventures, alliances and other strategic transactions, there can be no assurance that such opportunities will continue to be available, that the pricing will be economical or that we will be successful in completing and realizing the expected benefits of such transactions in the future.
We may sell a subsidiary or group of assets outside of our core markets or business if it is strategically or economically advantageous for us to do so. We undertook the following strategic transactions over the last three years.
We entered into an agreement with Saudi Aramco, to form a new joint venture, SANAD, to own, manage and operate onshore drilling rigs in the Kingdom of Saudi Arabia. SANAD, which is equally owned by Saudi Aramco and Nabors, began operations in the fourth quarter of 2017. The joint venture leverages our established business in Saudi Arabia, with a focus on Saudi Arabia's existing and future onshore oil and gas fields.
In September 2017 we paid approximately $50.7 million in cash, subject to customary closing adjustments, to acquire Robotic Drilling Systems AS (“RDS”), a provider of automated tubular and tool handling equipment for the onshore and offshore drilling markets based in Stavanger, Norway. This transaction will allow us to integrate RDS’s highly capable team and product offering with the technology portfolio of Canrig, and strengthens the development of Canrig’s drilling automation solutions.
In December 2017, we acquired all of the outstanding common shares of Tesco in an all-stock transaction. Tesco shareholders received 0.68 common shares of Nabors for each Tesco share owned, or approximately 32.1 million Nabors common shares. Tesco was a provider of products such as top drives and automated pipe handling equipment as well as tubular services to upstream companies. The combination of Tesco with Nabors’ current product offerings strengthens our ability to accelerate and scale deployment in drilling automation and analytics.
In October 2018, we purchased PetroMar Technologies, a small developer and operator of LWD downhole tools focusing on high-value formation data to facilitate completion optimization particularly in unconventional reservoirs. The tools complement our existing wellbore placement capabilities and are included in our Drilling Solutions operating segment. Under the terms of the transaction, we paid an initial purchase price of $25.0 million. We may also be required to make future payments that are contingent upon the future financial performance of this operation.
Environmental Compliance
Sustainability is an essential part of the corporate culture at Nabors and an integral part of our strategic plans. We know that our success is directly linked to implementing and executing a broad range of sustainable practices. Through technological innovation, environmental impact planning, corporate safety initiatives and community relations activities, Nabors understands that how we conduct business is of equal importance to our results. Corporate responsibility guides every aspect of our daily activities and is the key to our continued success.
We do not anticipate that compliance with currently applicable environmental rules and regulations and controls will significantly change our competitive position, capital spending or earnings during 2019.2020. We believe we are in material compliance with applicable environmental rules and regulations and that the cost of such compliance is not material to our business or financial condition. For a more detailed description of the environmental rules and regulations applicable to our operations, see Part I, Item 1A.—Risk Factors—Changes to or noncompliance with governmental laws and regulations or exposure to environmental liabilities could adversely affect our results of operations.
ITEM 1A. RISK FACTORS
In addition to the other information set forth elsewhere in this annual report, the following factors should be carefully considered when evaluating Nabors. The risks described below are not the only ones we face. Additional risks not presently known to us or that we currently deem immaterial may also impair our business operations.
Our business, financial condition or results of operations could be materially adversely affected by any of these risks.
Fluctuations in oil and natural gas prices could adversely affect drilling activity and our revenues, cash flows and profitability.
Our operations depend on the level of spending by oil and gas companies for exploration, development and production activities. Both short-term and long-term trends in oil and natural gas prices affect these activity levels. Oil and natural gas prices, as well as the level of drilling, exploration and production activity, have been highly volatile over the past few years and are expected to continue to be volatile for the foreseeable future. For example, oil prices were as high as $107 per barrel during 2014 and reached a near ten-year low of $26 per barrel in February 2016. Oil prices began to stabilize during 2017 and steadily increased throughout much of 2018, hitting a four-year high of $76 per barrel in September. However, during the fourth quarter of 2018, oil prices declined dramatically to a low of $42 per barrel. Declines in oil prices are primarily caused by, among other things, an excess of supply of crude oil in relation to demand. Worldwide military, political and economic events, including initiatives by the Organization of Petroleum Exporting Countries (“OPEC”) and
OPEC+, affect both the supply of and demand for oil and natural gas. In addition, weather conditions, governmental regulation (both in the United States and elsewhere), levels of consumer demand for oil and natural gas, general economic conditions, oil and gas production levels by non-OPEC countries, decisions by more expensive production sources to continue producing oil and gas despite excess supply, the availability and demand for drilling equipment and pipeline capacity, availability and pricing of alternative energy sources, and other factors beyond our control may also affect the supply of and demand for oil and natural gas.
Lower oil and natural gas prices also could adversely impact our cash forecast models used to determine whether the carrying values of our long-lived assets exceed our future cash flows, which could result in future impairment to our long-lived assets. Additionally, these circumstances could indicate that the carrying amount of our goodwill and intangible assets may exceed their fair value, which could result in a future goodwill impairment. Lower oil and natural gas prices also could affect our ability to retain skilled rig personnel and affect our ability to access capital to finance and grow our business. There can be no assurances as to the future level of demand for our services or future conditions in the oil and natural gas and oilfield services industries.
Our customers and thereby our business and profitability could be adversely affected by low oil prices and/or turmoil in the global economy.
Changes in general economic and political conditions may negatively impact our business, financial condition, results of operations and cash flows. As a result of the volatility of oil and natural gas prices, we are unable to fully predict the level of exploration, drilling and production activities of our customers and whether our customers and/or vendors will be able to sustain their operations and fulfill their commitments and obligations. If oil prices remain at the current relatively low levels or decrease and/or global economic conditions deteriorate, there could be a material adverse impact on the liquidity and operations of our customers, vendors and other worldwide business partners, which in turn could have a material impact on our results of operations and liquidity. Furthermore, these conditions may result in certain of our customers experiencing an inability to pay vendors, including us. In addition, we may experience
difficulties forecasting future capital expenditures by our customers, which in turn could lead to either over capacity or, in the event of further recovery in oil prices and the world wide economy, undercapacity, either of which could adversely affect our operations. There can be no assurance that the global economic environment will not deteriorate again in the future due to one or more factors.
We operate in a highly competitive industry with excess drilling capacity, which may adversely affect our results of operations.
The oilfield services industry is very competitive with a significant amount of excess capacity, especially in low oil price environments. Contract drilling companies compete primarily on a regional basis, and competition may vary significantly from region to region at any particular time. Most rigs and drilling-related equipment can be moved from one region to another in response to changes in levels of activity and market conditions, which may result in an oversupply of such rigs and drilling-related equipment in certain areas, and accordingly, increased price competition. In addition, in recent years, the ability to deliver rigs with new technology and features has become an important factor in determining job awards. Our customers increasingly demand the services of newer, higher specification drilling rigs, which requires continued technological developments and increased capital expenditures. Our ability to continually provide technologically competitive drilling-related equipment and services can impact our ability to defend, maintain or increase prices, maintain market share, and negotiate acceptable contract terms with our customers. Our competitors may be able to respond more quickly to new or emerging technologies and services and changes in customer requirements for equipment. New technologies, services or standards could render some of our services, drilling rigs or equipment obsolete, which could adversely impact our ability to compete. Another key factor in job award determinations is our ability to maintain a strong safety record. If we are unable to remain competitive based on these and/or other competitive factors, we may be unable to increase or even maintain our market share, utilization rates and/or day rates for our services, which could adversely affect our business, financial condition, results of operations and cash flows.
We must renew customer contracts to remain competitive.
Our ability to renew existing customer contracts, or obtain new contracts, and the terms of any such contracts depends on market conditions and our customers’ future drilling plans, which are subject to change. Due to the highly competitive nature of the industry, which can be exacerbated during periods of depressed market conditions, we may not be able to renew or replace expiring contracts or, if we are able to, we may not be able to secure or improve existing
dayrates or other material terms, which could have an adverse effect on our business, financial condition and results of operations.
The nature of our operations presents inherent risks of loss, including environmental and weather-related risks, that could adversely affect our results of operations.
Our operations are subject to many hazards inherent in the drilling and workover industries, including environmental pollution, blowouts, cratering, explosions, fires, loss of well control, loss of or damage to the wellbore or underground reservoir, damaged or lost drilling equipment and damage or loss from inclement weather or natural disasters. Any of these hazards could result in personal injury or death, damage to or destruction of equipment and facilities, suspension of operations, environmental and natural resources damage and damage to the property of others. Global climate change could lengthen these periods of reduced activity, but we cannot currently estimate to what degree. Our offshore operations involve the additional hazards of marine operations including pollution of coastal waters, damage to wildlife and natural habitats, capsizing, grounding, collision, damage from hurricanes and heavy weather or sea conditions and unsound ocean bottom conditions. Our operations are also subject to risks of war, civil disturbances or other political events.
Accidents may occur, we may be unable to obtain desired contractual indemnities, and our insurance may prove inadequate in certain cases. The occurrence of an event for which we are not fully insured or indemnified against, or the failure or inability of a customer or insurer to meet its indemnification or insurance obligations, could result in substantial losses that could adversely affect our business, financial condition and liquidity. In addition, insurance may not be available to cover any or all of these risks. Even if available, insurance may be inadequate or insurance premiums or other costs may increase significantly in the future, making insurance prohibitively expensive. We expect to continue facing upward pressure in our insurance renewals, our premiums and deductibles may be higher, and some insurance coverage may either be unavailable or more expensive than it has been in the past. Moreover, our insurance coverage generally provides that we assume a portion of the risk in the form of a deductible or self-insured retention. We may
choose to increase the levels of deductibles (and thus assume a greater degree of risk) from time to time in order to minimize our overall costs, which could exacerbate the impact of our losses on our financial condition and liquidity.
Our drilling contracts may in certain instances be renegotiated, suspended or terminated without an early termination payment.
Most of our multi-well and term drilling contracts require that an early termination payment be made to us if a contract is terminated by the customer prior to its expiration. However, such payments may not fully compensate us for the loss of a contract, and in certain circumstances such as, but not limited to, non-performance caused by significant operational or equipment issues (such as destruction of a drilling rig that is not replaced within a specified period of time), sustained periods of downtime due to a force majeure event, or other events beyond our control or some other breach of our contractual obligations, our customers may not be obligated to make an early termination payment to us at all. In addition, some contracts may be suspended, rather than terminated early, for an extended period of time, in some cases without adequate compensation. The early termination or suspension of a contract may result in a rig being idle for an extended period of time, which could have a material adverse effect on our business, financial condition and results of operations.
During periods of depressed market conditions, we may be subject to an increased risk of our customers (including government-controlled entities) seeking to renegotiate, repudiate or terminate their contracts and/or to otherwise exert commercial influence to our disadvantage. The downturn in the oil price environment resulted in downward pricing pressure and decreased demand for our drilling services with existing customers, resulting in renegotiations of pricing and other terms in our drilling contracts with certain customers and early termination of contracts by others. Our customers’ ability to perform their obligations under the contracts, including their ability to pay us or fulfill their indemnity obligations, may also be impacted by an economic or industry downturn or other adverse conditions in the oil and gas industry. If we were to sustain a loss and our customers were unable to honor their indemnification and/or payment obligations, it could adversely affect our liquidity. If our customers cancel some of our contracts, and we are unable to secure new contracts on a timely basis and/or on substantially similar terms, or if contracts are suspended for an extended period of time with or without adequate compensation or renegotiated with pricing or other terms less favorable to us, it could adversely affect our financial condition and results of operations.
We may record additional losses or impairment charges related to sold or idle rigs.drilling rigs and other assets.
In 2019, 2018 2017 and 2016,2017, we recognized impairment charges of $46.1$290.5 million, $6.9$124.9 million and $245.2$6.9 million, respectively, related to tangible assets and equipment. Prolonged periods of low utilization or low dayrates, the cold stacking of idle assets, the sale of assets below their then carrying value or the decline in market value of our assets may cause us to experience further losses. If future cash flow estimates, based upon information available to management at the time, including oil and gas prices and expected utilization levels, indicate that the carrying value of any of our rigs may not be recoverable or if we sell assets for less than their then carrying value, we may recognize additional impairment charges on our fleet.
The loss of one or a number of our large customers could have a material adverse effect on our business, financial condition and results of operations.
In 2019, 2018 2017 and 2016,2017, we received approximately 41%, 45%41% and 46%45%, respectively, of our consolidated operating revenues from our three largest contract drilling customers (including their affiliates), with our largest customer and partner in our SANAD joint venture, Saudi Aramco, representing 24%22%, 29%24% and 33%29% of our consolidated operating revenues, respectively, for these periods. The loss of one or more of our larger customers would have a material adverse effect on our business, financial condition, results of operations and prospects. In addition, if a significant customer experiences liquidity constraints or other financial difficulties it may be unable to make required payments or seek to renegotiate contracts, which could adversely affect our liquidity and profitability. Financial difficulties experienced by customers could also adversely affect our utilization rates in the affected market and may cause our counterparties to seek modifications to our contracts with them.
The profitability of our operations could be adversely affected by war, civil disturbance, terrorist activity or other political or economic instability, fluctuation in currency exchange rates and local import and export controls.
We derive a significant portion of our business from global markets, including major operations in the Middle East, South America, the Far East, North Africa and Russia. These operations are subject to various risks, including war, civil disturbances, labor strikes, political or economic instability, terrorist activity and governmental actions that may limit or disrupt markets, restrict the movement of funds or result in limits or restrictions in our ability to operate or compete, the deprivation of contractual rights or the taking of property without fair compensation. In some countries, our operations may be subject to the additional risk of fluctuating currency values and exchange controls. We also are subject to various laws and regulations that govern the operation and taxation of our business and the import and export of our equipment from country to country, the imposition, application and interpretation of which can prove to be uncertain.
For example, we are exposed to risks related to political instability in Venezuela. On January 28, 2019, the United States Treasury Department’s Office of Foreign Assets Control designated Petroleos de Venezuela S.A. (“PdVSA”) as a Specially Designated National under Executive Order 13850 (the “Order”). The Order prohibited, among other things, business dealings with PdVSA or any entity in which PdVSA owns, directly or indirectly, a 50 percent or greater interest. As of December 31, 2018,Currently, Nabors operated four rigsoperates one rig in Venezuela, under contracts with Chevron and twoa joint venturesventure that areis majority-owned by PdVSA, Petroboscán and Petrocedeño.Petropiar. The political uncertainty and civil unrest in Venezuela could have a significant impact on our operations there, including the risk that one or more of our rigs could be nationalized by the government or that we will not be paid for our services. Nabors continues to evaluate the potential impact of these developments on its business and operations in Venezuela.
To the extent that any of these risks arising from our operations in global markets are realized, it could have a material adverse effect on our business, financial condition and results of operations.
Our financial and operating flexibility could be affected by our long-term debt and other financial commitments.
As of December 31, 2018, we had approximately $3.6 billion in outstanding debt, resulting inThe 2012 Revolving Credit Facility requires us to maintain a grossnet funded debt to capital ratio of 0.57:0.60:1 aor less. The net funded debt to capital ratio of 0.53:1 and an asset tois calculated by dividing net funded debt coverage ratioby net capital. For purposes of approximately 3.82:1.
Availability under both the 2012 Revolving Credit Facility and the 2018 Revolving Credit Facility, net funded debt is subject to a covenant not to exceed atotal debt minus the sum of cash and cash equivalents (other than restricted cash). Net capital is the sum of net funded debt plus shareholders’ equity. As of December 31, 2019, our net funded debt to capital ratio was approximately 0.59:1.
The 2018 Revolving Credit Facility is subjectrequires us to maintain a covenant to maintainnet leverage ratio 5.50:1 or less and an asset to debt coverage ratio of at least 2.50:1, as of the end of each calendar quarter. As of December 31, 2019, the net leverage ratio was 3.55:1 and the asset to debt coverage ratio was 4.28:1. The gross debt to capital ratio is calculated by dividing total debt by total capitalization (total debt plus shareholders’ equity). The net debt to capitalleverage ratio is calculated by dividing net funded debt (total debt minusby EBITDA (as defined in the sum2018 Revolving Credit Facility) of cashNabors and cash equivalents and short-term investments) by net capitalization (net debt plus shareholders’ equity).its subsidiaries for the latest four consecutive fiscal quarters for which financial statements are required to have been delivered pursuant to the 2018 Revolving Credit Facility. The asset to debt coverage ratio is calculated by dividing (x) drilling-related fixed assets wholly owned by certain of Nabors’ subsidiaries that are guaranteeing the 2018 Revolving Credit Facility (the ‘‘2018 Revolver GuarantorsGuarantors’’) or wholly owned subsidiaries of the 2018 Revolver Guarantors by (y) total debt ofthe commitments under the 2018 Revolver Guarantors (subjectRevolving Credit Facility and certain other indebtedness up to certain exclusions).$100 million. The asset to debt coverage ratio applies only during anythe period which Nabors Delaware fails to maintain an investment grade rating from at least two ratings agencies. rating agencies, which was the case as of the date of this report.
The grossnet funded debt to capital ratio, the net debt to capitalleverage ratio and the asset to debt coverage ratio are not measures of operating performance or liquidity defined by U.S. GAAP and may not be comparable to similarly titled measures presented by other companies. The grossnet funded debt to capital ratio and the net debt to capital ratio are methodsis a method for calculating the amount of leverage a company has in relation to its capital.
As of December 31, 2018, we would have been able to borrow $1.267 billion in aggregate under2019, our 2018 Revolving Credit Facility and an additional $496.25 million in aggregate under our 2012 Revolving Credit Facility, in each case subject to compliance with the conditions and covenants contained therein, including compliance with applicable financial ratios.
consolidated total outstanding indebtedness was $3.3 billion. We also have various financial commitments, such as leases, contracts and purchase commitments. Our ability to service our debt and other financial obligations depends in large part upon the level of cash flows generated by our operating subsidiaries’ operations, our ability to monetize and/or divest non-core assets, availability under our unsecured revolving credit facilities and our ability to access the capital markets and/or other sources of financing. If we cannot repay or refinance our debt as it becomes due, we may be forced to sell assets or reduce funding in the future for working capital, capital expenditures and general corporate purposes, any of which could negatively impact our stock price or financial condition.
Our ability to access capital markets could be limited.
From time to time, we may need to access capital markets to obtain long-term and short-term financing. However, our ability to access capital markets could be limited or adversely affected by, among other things, oil and gas prices, our existing capital structure, our credit ratings, interest rates and the health or market perceptions of the drilling and overall oil and gas industry and the global economy. In addition, many of the factors that affect our ability to access capital markets, such as the liquidity of the overall capital markets and the state of the economy and oil and gas industry, are outside of our control. No assurance can be given that we will be able to access capital markets on terms acceptable to us when required to do so, which could adversely affect our business, liquidity and results of operations.
A downgrade in our credit rating could negatively impact our cost of and ability to access capital markets or other financing sources.
Our ability to access capital markets or to otherwise obtain sufficient financing may be affected by our senior unsecured debt ratings as provided by the major U.S. credit rating agencies. Factors that may impact our credit ratings include debt levels, asset purchases or sales, as well as near-term and long-term growth opportunities and industry conditions. Liquidity, asset quality, cost structure, market diversity, and commodity pricing levels and others also are considered by the rating agencies. The major U.S. credit rating agencies have downgraded ourOur senior unsecured debt rating tohas a non-investment grade. These and furthergrade rating. Further ratings downgrades may impact our cost of capital and ability to access capital markets or other financing sources, any of which could adversely affect our financial condition, results of operations and cash flows.
Changes in the method of determining London Interbank Offered Rate ("LIBOR"), or the replacement of LIBOR with an alternative reference rate, may adversely affect interest expense related to outstanding debt.
Amounts drawn under the 2012 Revolving Credit Facility and the 2018 Revolving Credit Facility bear interest rates in relation to LIBOR. On July 27, 2017, the Financial Conduct Authority (“FCA”) in the United Kingdom announced that it would phase out LIBOR as a benchmark by the end of 2021. It is unclear whether new methods of calculating LIBOR will be established such that it continues to exist after 2021. The U.S. Federal Reserve is considering replacing U.S. dollar LIBOR with a newly created index called the Broad Treasury Financing Rate, calculated with a broad set of short-term repurchase agreements backed by treasury securities. If LIBOR ceases to exist and a generally accepted market replacement is not available, we may need to renegotiate the 2012 Revolving Credit Facility or the 2018
Revolving Credit Facility and may not able to do so with terms that are favorable to us. The overall financial markets may be disrupted as a result of the phase-out or replacement of LIBOR. Disruption in the financial market or the inability to renegotiate the 2012 Revolving Credit Facility or the 2018 Revolving Credit Facility with favorable terms could have a material adverse effect on our financial condition, results of operations and cash flows.
We may be subject to changes in tax laws and have additional tax liabilities.
We operate through various subsidiaries in numerous countries throughout the world. Consequently, we are subject to changes in tax laws, treaties or regulations or the interpretation or enforcement thereof in the United States or jurisdictions in which we or any of our subsidiaries operate or are organized. Furthermore, the Organization for Economic Co-Operation and Development (‘‘OECD’’) published a Base Erosion and Profit Shifting Action Plan in July 2013, seeking to reform the taxation of multinational companies. The recommendations made by the OECD may result in unilateral, uncoordinated changes in tax laws in the countries in which we operate or are organized, which may result in double taxation or otherwise increase our tax liabilities which in turn could have a material adverse effect on our financial condition and results of operations.
The Tax Cuts and Jobs Act of 2017 (“Tax Reform Act”) (H.R. 1), adopted sweeping changes to the U.S. Internal Revenue Code which also could have a material adverse effect on our financial condition and results of operations. In addition to lowering the U.S. corporate income tax rate and numerous other changes, the new law imposes more stringent limitations on the deductibility of interest expense, the deductibility of net operating losses and imposes a type of minimum tax designed to reduce the benefits derived from intercompany transactions and payments that result in base erosion. Tax laws, treaties and regulations are highly complex and subject to interpretation. Our income tax expense is based upon our interpretation of the tax laws in effect in various countries at the time that the expense was incurred. Although the Tax Reform Act has not had a material impact on our 2018 financial statements to date, if these tax laws, treaties
or regulations change or any tax authority successfully challenges our assessment of the effects of such laws, treaties and regulations in any country, including our operational structure, intercompany pricing policies or the taxable presence of our subsidiaries in certain countries, this could have a material adverse effect on us, resulting in a higher effective tax rate on our consolidated earnings or a reclassification of the tax impact of our significant corporate restructuring transactions.
The Company’s ability to use its net operating loss carryforwards, and possibly other tax attributes, to offset future taxable income for U.S. federal income tax purposes may be significantly limited due to various circumstances, including future transactions involving the sale or issuance of Company equity securities, or if taxable income does not reach sufficient levels.
As of December 31, 2018,2019, the Company reported consolidated federal net operating loss (“NOL”) carryforwards of approximately $578.0$418.3 million and certain other favorable federal income tax attributes. The Company’s ability to use its NOL carryforwards and certain other attributes may be limited if it experiences an “ownership change” as defined in Section 382 (“Section 382”) of the Internal Revenue Code of 1986, as amended (the “Code”). An ownership change generally occurs if there is a more than 50 percentage point increase in the aggregate equity ownership of the Company by one or more “5 percent shareholders” (as that term is defined for purposes of Sections 382 and 383 of the Code) in any testing period, which is generally the three-year period preceding any potential ownership change, measured against their lowest percentage ownership at any time during such period.
There is no assurance that the Company will not experience an ownership change under Section 382 as a result of future actions that may significantly limit or possibly eliminate its ability to use its NOL carryforwards and potentially certain other tax attributes. Potential future transactions involving the sale, issuance, redemption or other disposition of common or preferred shares, the exercise of conversion or exchange options under the terms of any convertible or exchangeable debt, the repurchase of any such debt with Company shares, in each case, by a person owning, or treated as owning, 5% or more of the Company’s shares, or a combination of such transactions, may cause or increase the possibility that the Company will experience an ownership change under Section 382. Under Section 382, an ownership change would subject the Company to an annual limitation that applies to the amount of pre-ownership change NOLs (and possibly certain other tax attributes) that may be used to offset post-ownership change taxable income. If a Section 382 limitation applies, the limitation could cause the Company’s U.S. federal income taxes to be greater, or to be paid earlier, than they otherwise would be, and could cause all or a portion of the Company’s NOL carryforwards to expire unused. Similar rules and limitations may apply for state income tax purposes. The Company’s ability to use its NOL carryforwards will also depend on the amount of taxable income it generates in future periods. The Company’s NOL carryforwards may expire before it can generate sufficient taxable income to use them in full.
Changes to or noncompliance with laws and regulations or exposure to environmental liabilities could adversely affect our results of operations.
Drilling of oil and natural gas wells is subject to various laws and regulations in the jurisdictions where we operate, including comprehensive and frequently changing laws and regulations relating to the protection of human health and the environment, including those regulating the transport, storage, use, treatment, storage, disposal and remediation of, and exposure to, solid and hazardous wastes and materials. In addition, the Outer Continental Shelf Lands Act provides the federal government with broad discretion in regulating the leasing of offshore oil and gas production sites. Our costs to comply with these laws and regulations may be substantial. Violation of environmental laws or regulations could lead to the imposition of administrative, civil or criminal penalties, capital expenditures, delays in the permitting or performance of projects, and in some cases injunctive relief. Violations may also result in liabilities for personal injuries, property and natural resource damage and other costs and claims. We are not always successful in allocating all risks of these environmental liabilities to customers, and it is possible that customers who assume the risks will be financially unable to bear any resulting costs.
In addition, U.S. federal laws and the laws of other jurisdictions regulate the prevention of oil spills and the release of hazardous substances, and may impose liability for removal costs and natural resource, real or personal property and certain economic damages arising from any spills. Some of these laws may impose strict and/or joint and several liability for clean-up costs and damages without regard to the conduct of the parties. As an owner and operator of onshore and offshore rigs and other equipment, we may be deemed to be a responsible party under federal law. In addition, we are subject to various laws governing the containment and disposal of hazardous substances, oilfield waste and other waste materials and the use of underground storage tanks.
The expansion of the scope of laws or regulations protecting the environment has accelerated in recent years, particularly outside the United States, and we expect this trend to continue. For example, the U.S. Environmental Protection Agency (‘‘EPA’’) has promulgated final rules requiring the reporting of greenhouse gas emissions applicable to certain offshore oil and natural gas production and onshore oil and natural gas production, processing, transmission, storage and distribution facilities. In June 2016, the EPA published final standards to reduce methane emissions for certain new, modified, or reconstructed facilities in the oil and gas industry but, in June 2017, the EPA published a proposed rule that would stay certain portions of the June 2016 standards for two years and reconsider the entirety of the June 2016 standards. The requirements of the June 2016 standards currently remain in effect, pending the EPA taking final action on its proposed two-year stay, which will likely be promptly challenged. In October 2018, the EPA issued a proposed rule that would reconsider limits on methane emissions set by the June 2016 standards and reduce inspection and repair requirements.
Changes in environmental laws and regulations may also negatively impact the operations of oil and natural gas exploration and production companies, which in turn could have an adverse effect on us. For example, drilling, fluids, produced water and most of the other wastes associated with the exploration, development and production of oil or gas, if properly handled, are currently exempt from regulation as hazardous waste under the Resource Conservation and Recovery Act (‘‘RCRA’’) and instead, are regulated under RCRA’s less stringent non-hazardous waste provisions. However, following the filing of a lawsuit in the U.S. District Court for the District of Columbia in May 2016 by several non-governmental environmental groups against the EPA for the agency’s failure to timely assess its RCRA Subtitle D criteria regulations for oil and gas wastes, the EPA and the environmental groups entered into an agreement that was finalized in a Consent Decree issued by the District Court on December 28, 2016. Under the Consent Decree, the EPA is required to propose no later than March 15, 2019, a rulemaking for revision of certain Subtitle D criteria regulations pertaining to oil and gas wastes or sign a determination that revision of the regulations is not necessary. If the EPA proposes a rulemaking for revised oil and gas waste regulations, the Consent Decree requires that the EPA take final action following notice and comment rulemaking no later than July 15, 2021. Any reclassification of such wastes as RCRA hazardous wastes could result in more stringent and costly handling, disposal and clean-up requirements.
Legislators and regulators in the United States and other jurisdictions where we operate also focus increasingly on restricting the emission of carbon dioxide, methane and other greenhouse gases that may contribute to warming of the Earth’s atmosphere, and other climate changes. The U.S. Congress has considered, but not adopted, legislation designed to reduce emission of greenhouse gases, and some states in which we operate have passed legislation or adopted initiatives, such as the Regional Greenhouse Gas Initiative in the Northeastern United States, which establishes greenhouse gas inventories and/or cap-and-trade programs. Some international initiatives have been or may be adopted, which could result in increased costs of operations in covered jurisdictions. In December 2015, the United Nations
Framework Convention on Climate Change in Paris, France finalized an agreement, referred to as the “Paris Agreement’, requiring member countries to review and ‘‘represent a progression’’ in their intended nationally determined contributions, which set greenhouse gas emission reduction goals every five years beginning in 2020, including pledges to voluntarily limit or make future greenhouse gas emissions. The United States signed the Paris Agreement in 2016 but formally withdrew in August 2017. The withdrawal will take effect in November 2020. Several U.S. states formed the United States Climate Alliance to advance the objectives of the Paris Agreement at the state level despite the federal withdrawal.
In addition, the EPA has published findings that emissions of greenhouse gases present an endangerment to public health and the environment, which could lead to further regulation of greenhouse gas emissions under the Clean Air Act. The EPA has already issued rules requiring monitoring and reporting of greenhouse gas emissions from the oil and natural gas sector, including onshore and offshore production activities. Although in November 2016, the Bureau of Land Management (‘‘BLM’’) issued a rule requiring reductions in methane emissions from venting, flaring, and leaking activities on public lands, the BLM rescinded the rule in September 2018. Several states have sued the BLM seeking to restore the November 2016 rule, and other states may regulate methane emissions by state law. Future or more stringent federal or state regulation could dramatically increase operating costs for oil and natural gas companies, curtail production and demand for oil and natural gas in areas of the world where our customers operate, and reduce the market for our services by making wells and/or oilfields uneconomical to operate, which may in turn adversely affect results of operations.
We rely on third-party suppliers, manufacturers and service providers to secure equipment, components and parts used in rig operations, conversions, upgrades and construction.
Our reliance on third-party suppliers, manufacturers and service providers to provide equipment and services exposes us to volatility in the quality, price and availability of such items. Certain components, parts and equipment that we use in our operations may be available only from a small number of suppliers, manufacturers or service providers. The failure of one or more third-party suppliers, manufacturers or service providers to provide equipment, components, parts or services, whether due to capacity constraints, production or delivery disruptions, price increases, quality control issues, recalls or other decreased availability of parts and equipment, is beyond our control and could materially disrupt our operations or result in the delay, renegotiation or cancellation of drilling contracts, thereby causing a loss of contract drilling backlog and/or revenue to us, as well as an increase in operating costs.
Additionally, our suppliers, manufacturers, and service providers could be negatively impacted by changes in industry conditions or global economic conditions. If certain of our suppliers, manufacturers or service providers were to curtail or discontinue their business as a result of such conditions, it could result in a reduction or interruption in supplies or equipment available to us and/or a significant increase in the price of such supplies and equipment, which could adversely impact our business, financial condition and results of operations.
Any violation of the Foreign Corrupt Practices Act or any other similar anti-corruption laws could have a negative impact on us.
A significant portion of our revenue is derived from operations outside the United States, which exposes us to complex foreign and U.S. regulations inherent in doing cross-border business and in each of the countries in which we transact business. We are subject to compliance with the United States Foreign Corrupt Practices Act (‘‘FCPA’’) and other similar anti-corruption laws, which generally prohibit companies and their intermediaries from making improper payments to foreign government officials for the purpose of obtaining or retaining business. The SEC and U.S. Department of Justice have continued to focus on enforcement activities with respect to the FCPA. While our employees and agents are required to comply with applicable anti-corruption laws, and we have adopted policies and procedures and related training programs meant to ensure compliance, we cannot be sure that our internal policies, procedures and programs will always protect us from violations of these laws. Violations of these laws may result in severe criminal and civil sanctions as well as other penalties. The occurrence or allegation of these types of risks may adversely affect our business, financial condition and results of operations.
Provisions in our organizational documents may be insufficient to thwart a coercive hostile takeover attempt; conversely, these provisions and those in our outstanding debt and Saudi joint venture documents may deter a change of control transaction and decrease the likelihood of a shareholder receiving a change of control premium.
Companies generally seek to prevent coercive takeovers by parties unwilling to pay fair value for the enterprise they acquire. Provisions in our organizational documents that are meant to help us avoid a coercive takeover include:
| ·
● | | Authorizing the Board to issue a significant number of common shares and up to 25,000,000 preferred shares, as well as to determine the price, rights (including voting rights), conversion ratios, preferences and privileges of the preferred shares, in each case without any vote or action by the holders of our common shares; |
| ·
● | | Limiting the ability of our shareholders to call or bring business before special meetings; |
| ·
● | | Prohibiting our shareholders from taking action by written consent in lieu of a meeting unless the consent is signed by all the shareholders then entitled to vote; |
| ·
● | | Requiring advance notice of shareholder proposals for business to be conducted at general meetings and for nomination of candidates for election to our Board; and |
| ·
● | | Reserving to our Board the ability to determine the number of directors comprising the full Board and to fill vacancies or newly created seats on the Board. |
Certain actions taken by us could make it easier for another party to acquire control of the Company. For instance, in June 2012 we adopted an amendment to our bye-laws to declassify the Board, we did not renew our shareholder rights plan when it expired in July 2016, and in 2017 we amended our policy regarding nomination and proxy access for director candidates recommended by shareholders. Conversely, the provisions designed to prevent hostile takeovers, or protect holders of our debt instruments and our joint venture partner, may deter transactions in which shareholders would receive a change of control premium. For example, certain change of control transactions could accelerate the principal amounts outstanding, and require premiums payments, under our debt instruments, or trigger a call option to purchase our interest in SANAD, our joint venture with Saudi Aramco.
Legal proceedings and governmental investigations could affect our financial condition and results of operations.
We are subject to legal proceedings and governmental investigations from time to time that include employment, tort, intellectual property and other claims, and purported class action and shareholder derivative actions, including claims related to our acquisition of Tesco. We are also subject to complaints and allegations from former, current or prospective employees from time to time, alleging violations of employment-related laws or other whistle blower-related matters. Lawsuits or claims could result in decisions against us that could have an adverse effect on our financial condition or results of operations. See ‘‘Item 3—Legal Proceedings’’ for a discussion of certain existing legal proceedings.
Our business is subject to cybersecurity risks.
Our operations are increasingly dependent on information technologies and services. Threats to information technology systems associated with cybersecurity risks and cyber incidents or attacks continue to grow, and include, among other things, storms and natural disasters, terrorist attacks, utility outages, theft, viruses, phishing, malware, design defects, human error, and complications encountered as existing systems are maintained, repaired, replaced, or upgraded. Risks associated with these threats include, among other things:
| ·
● | | theft or misappropriation of funds; |
| ·
● | | loss, corruption, or misappropriation of intellectual property, or other proprietary, confidential or personally identifiable information (including customer, supplier, or employee data); |
| ·
● | | disruption or impairment of our and our customers’ business operations and safety procedures; |
| ·
● | | damage to our reputation with our customers and the market; |
| ·
● | | exposure to litigation; |
| ·
● | | loss or damage to our worksite data delivery systems; and |
| ·
● | | increased costs to prevent, respond to or mitigate cybersecurity events. |
Although we utilize various procedures and controls to mitigate our exposure to such risk, cybersecurity attacks and other cyber events are evolving and unpredictable. Moreover, we have no control over the information technology systems of our customers, suppliers, and others with which our systems may connect and communicate. As a result, the occurrence of a cyber incident could go unnoticed for a period time.
We do not presently maintain insurance coverage to protect against cybersecurity risks. If we procure such coverage in the future, we cannot ensure that it will be sufficient to cover any particular losses we may experience as a result of such cyberattacks. Any cyber incident could have a material adverse effect on our business, financial condition and results of operations.
Changes to United States tax, tariff and import/export regulations may have a negative effect on global economic conditions, financial markets and our business.
There have been ongoing discussions and commentary regarding potential significant changes to the United States trade policies, treaties, tariffs and taxes, including trade policies and tariffs regarding China. In 2018, the Office of the U.S. Trade Representative (the “USTR”) enacted tariffs on imports into the U.S. from China. In September 2018, the USTR enacted another tariff on the import of other Chinese products with an additional combined import value of approximately $200 billion. The tariff became effective on September 24, 2018, with an initial rate of 10%, with the potential for significant increases if the U.S. and China do not reach a new trade deal in the near term. There is significant uncertainty about the future relationship between the United States and other countries with respect to the trade policies, treaties, taxes, government regulations and tariffs that would be applicable. It is unclear what changes might be considered or implemented and what response to any such changes may be by the governments of other countries. Significant tariffs or other restrictions placed on Chinese imports and any related counter-measures that are taken by China could have an adverse effect on our financial condition or results of operations. Even in the absence of further tariffs, the related uncertainty and the market's fear of an escalating trade war might create forecasting difficulties for us and cause our customers and business partners to place fewer orders for our products and services, which could have a material adverse effect on our business, liquidity, financial condition, and/or results of operations. These developments, or the perception that any of them could occur, may have a material adverse effect on global economic conditions and the stability of global financial markets, and may significantly reduce global trade and, in particular, trade between these nations and the United States. Any of these factors could depress economic activity and restrict our access to suppliers or customers and have a material adverse effect on our business, financial condition and results of operations and affect our strategy around the world. Given the relatively fluid regulatory environment in China and the United States and relative uncertainty with respect to tariffs, international trade agreements and policies, a trade war, further governmental action related to tariffs or international trade policies, or additional tax or other regulatory changes in the future could directly and adversely impact our financial results and results of operations.
Failure to realize the anticipated benefits of acquisitions, divestitures, investments, joint ventures and other strategic transactions may adversely affect our business, results of operations and financial position.
We undertake from time to time acquisitions, divestitures, investments, joint ventures, alliances and other strategic transactions that we expect to further our business objectives. For example, in October 2016, we announced an agreement to form a new joint venture in the Kingdom of Saudi Arabia, which commenced operations in December, 2017. The success of the Saudi joint venture depends, to a large degree, on the satisfactory performance of our joint venture partner’s obligations, including contributions of capital, drilling units and related equipment, and our ability to maintain an effective, working relationship with our joint venture partner.
We also completed the acquisition of Tesco in December 2017. We are still attempting to obtain certain regulatory approvals related to the Tesco acquisition, and may not be able to do so in certain jurisdictions.
The anticipated benefits of the Saudi joint venture, the Tesco acquisition, and other strategic transactions may not be fully realized, or may be realized more slowly than expected, and may result in operational and financial consequences, including, but not limited to, the loss of key customers, suppliers or employees, or the disposition of certain assets or operations, which may have an adverse effect on our business, financial condition and results of operations.
The loss of key executives or inability to attract and retain experienced technical personnel could reduce our competitiveness and harm prospects for future success.
The successful execution of our business strategies depends, in part, on the continued service of certain key executive officers and employees. We have employment agreements with some of our key personnel within the company, but no assurance can be given that any employee will remain with us, whether or not they have entered into an employment agreement with us.agreement. We do not carry key man insurance. In addition, our operations depend, in part, on our ability to attract and retain experienced technical professionals. Competition for such professionals is intense. The loss of key executive officers and/or our inability to retain or attract experienced technical personnel, could reduce our competitiveness and harm prospects for future success, which may adversely affect our business, financial condition and results of operations.
Significant issuances of common shares or exercises of stock options could adversely affect the market price of our common shares.
As of February 21, 2019,19, 2020, we had 800,000,000 authorized common shares, of which 411,592,178419,928,615 shares were outstanding and entitled to vote, including 52,800,203 million held by our subsidiaries. In addition, 17,352,7926,631,194 common shares were reserved for issuance pursuant to stock option and employee benefit plans, 31,997,773 common shares were reserved for issuance upon exchange of outstanding Exchangeable Notes, , and 37,096,700 common shares were reserved for issuance upon conversion of outstanding mandatory convertible preferred shares. The sale, or availability for sale, of substantial amounts of our common shares in the public market, whether directly by us or resulting from the exercise of options (and, where applicable, sales pursuant to Rule 144 under the Securities Act) or the exchange of Exchangeable Notes or the conversion of mandatory convertible preferred shares for common shares, would be dilutive to existing shareholders, could adversely affect the prevailing market price of our common shares and could impair our ability to raise additional capital through the sale of equity securities.
Our common share price has been and may continue to be volatile.
The trading price of our common shares has fluctuated in the past and is subject to significant fluctuations in response to the following factors, some of which are beyond our control:
| ·
● | | variations in quarterly operating results; |
| ·
● | | deviations in our earnings from publicly disclosed forward-looking guidance; |
| ·
● | | variability in our revenues; |
| ·
● | | our announcements of significant contracts, acquisitions, strategic partnerships or joint ventures; |
| ·
● | | general conditions in and market perceptions of the oil and gas industry; |
| ·
● | | uncertainty about current global economic conditions; |
| ·
● | | fluctuations in stock market price and volume; and |
| ·
● | | other general economic conditions. |
The trading market for our common stock is influenced by the research and reports that industry or securities analysts may publish about us, our business, our markets or our competitors. We do not have any control over these analysts and we cannot provide any assurance that analysts will cover us or provide favorable coverage. If any of the analysts who may cover us adversely change their recommendation regarding our stock, or provide more favorable
relative recommendations about our competitors, our stock price could materially decline. If any analyst who may cover us were to cease coverage of our Company or fail to regularly publish reports on us, we could lose visibility in the financial markets, which in turn could cause our stock price or trading volume to materially decline.
During 2018,2019, our stock price on the NYSE ranged from a high of $8.87$4.08 per common share to a low of $1.81$1.50 per common share. In recent years, the stock market in general has experienced extreme price and volume fluctuations that have affected the market price for many companies in industries similar to ours. Some of these fluctuations have been unrelated to the operating performance of the affected companies. These market fluctuations may decrease the market price of our common shares in the future.
As a holding company, we depend on our operating subsidiaries and investments to meet our financial obligations.
We are a holding company with no significant assets other than the stock of our subsidiaries. In order to meet our financial needs and obligations, we rely exclusively on repayments of interest and principal on intercompany loans that we have made to operating subsidiaries and income from dividends and other cash flow from such subsidiaries. There can be no assurance that such operating subsidiaries will generate sufficient net income to pay dividends or sufficient cash flow to make payments of interest and principal to Nabors in respect of intercompany loans. In addition, from time to time, such operating subsidiaries may enter into financing arrangements that contractually restrict or
prohibit these types of upstream payments to Nabors. Nabors’ debt instruments do not contain covenants prohibiting any such contractual restrictions. There may also be adverse tax consequences associated with such operating subsidiaries paying dividends. Finally, the ability of our subsidiaries to make distributions to us, may be restricted by the laws of the applicable subsidiaries’ jurisdictions of organization and other laws and regulations. If subsidiaries are unable to distribute or otherwise make payments to us, we may not be able to pay interest or principal on obligations when due, and we cannot assure you that we will be able to obtain the necessary funds from other sources.
ITEM 1B. UNRESOLVED STAFF COMMENTS
Not applicable.
ITEM 2. PROPERTIES
Nabors’ principal executive offices are located in Hamilton, Bermuda. We own or lease executive and administrative office space in Houston, Texas; Anchorage, Alaska; Calgary, Canada; Dubai in the United Arab Emirates; Bogota, Colombia; and Dhahran, Saudi Arabia.Arabia; and Sandnes, Norway. Our principal physical properties are rigs which are more fully described in Part I, Item 1.—Business.
Many of the international drilling rigs and some of the Alaska rigs in our fleet are supported by mobile camps which house the drilling crews and a significant inventory of spare parts and supplies. In addition, we own various trucks, forklifts, cranes, earth-moving and other construction and transportation equipment, which are used to support our operations. We also own or lease a number of facilities and storage yards used in support of operations in each of our geographic markets.
We own certain mineral interests in connection with our investment in development and production of natural gas, oil and natural gas liquids in the United States.
ITEM 3. LEGAL PROCEEDINGS
Nabors and its subsidiaries are defendants or otherwise involved in a number of lawsuits in the ordinary course of business. We estimate the range of our liability related to pending litigation when we believe the amount and range of loss can be estimated. We record our best estimate of a loss when the loss is considered probable. When a liability is probable and there is a range of estimated loss with no best estimate in the range, we record the minimum estimated liability related to the lawsuits or claims. As additional information becomes available, we assess the potential liability related to our pending litigation and claims and revise our estimates. Due to uncertainties related to the resolution of lawsuits and claims, the ultimate outcome may differ from our estimates. For matters where an unfavorable outcome is reasonably possible and significant, we disclose the nature of the matter and a range of potential exposure, unless an estimate cannot be made at the time of disclosure. In the opinion of management and based on liability accruals provided, our ultimate exposure with respect to these pending lawsuits and claims is not expected to have a material
adverse effect on our consolidated financial position or cash flows, although they could have a material adverse effect on our results of operations for a particular reporting period. See Note 1715 — Commitments and Contingencies in Part II, Item 8.—Financial Statements and Supplementary Data for a description of such proceedings.
ITEM 4. MINE SAFETY DISCLOSURES
Not applicable.
PART II
ITEM 5. MARKET PRICE OF AND DIVIDENDS ON THE REGISTRANT’S COMMON EQUITY, RELATED SHAREHOLDER MATTERS AND ISSUER PURCHASES OF EQUITY SECURITIES
Market Information.
Our common shares, par value $0.001 per share, are publicly traded on the New York Stock Exchange (the “NYSE”) under the symbol “NBR”.
On February 21, 2019,19, 2020, the closing price of our common shares as reported on the NYSE was $3.14.$2.27.
Holders.
At February 21, 2019,19, 2020, there were approximately 1,9081,874 shareholders of record of our common shares.
Dividends.
On February 22, 2019,20, 2020, our Board declared cash dividends of (i) $0.01 per outstanding Common Share, par value $0.001 per share, which will be paid on April 2, 2019,2020, to holders of record at the close of business on March 12, 2018,2020, and (ii) $0.75 per outstanding share of our 6.00% Mandatory Convertible Preferred Shares, Series A, par value $0.001 per share, which will be paid on May 1, 2019,2020, to holders of record at the close of business on April 15, 2019.2020.
The declaration and payment of future dividends will be at the discretion of the Board and will depend, among other things, on future earnings, general financial condition and liquidity, success in business activities, capital requirements and general business conditions in addition to legal requirements.
See Part I, Item 1A.—Risk Factors—As a holding company, we depend on our operating subsidiaries to meet our financial obligations.
Issuer Purchases of Equity Securities.
The following table provides information relating to our repurchase of common shares during the three months ended December 31, 2018:2019:
| | | | | | | | | | |
| | | | | | | | | Approximated | |
| | | | | | | Total Number | | Dollar Value of | |
| | | | | | | of Shares | | Shares that May | |
| | Total | | Average | | Purchased as | | Yet Be | |
| | Number of | | Price | | Part of Publicly | | Purchased | |
Period | | Shares | | Paid per | | Announced | | Under the | |
(In thousands, except per share amounts) | | Repurchased | | Share (1) | | Program | | Program (2) | |
October 1 - October 31 | | 23 | | $ | 1.62 | | — | | 280,645 | |
November 1 - November 30 | | 8 | | $ | 2.05 | | — | | 280,645 | |
December 1 - December 31 | | 26 | | $ | 2.07 | | — | | 280,645 | |
| | | | | | | | | | |
| | | | | | | | | Approximated | |
| | | | | | | Total Number | | Dollar Value of | |
| | | | | | | of Shares | | Shares that May | |
| | Total | | Average | | Purchased as | | Yet Be | |
| | Number of | | Price | | Part of Publicly | | Purchased | |
Period | | Shares | | Paid per | | Announced | | Under the | |
(In thousands, except per share amounts) | | Repurchased | | Share (1) | | Program | | Program (2) | |
October 1 - October 31 | | 5 | | $ | 6.27 | | — | | 280,645 | |
November 1 - November 30 | | 5 | | $ | 5.62 | | — | | 280,645 | |
December 1 - December 31 | | 27 | | $ | 3.23 | | — | | 280,645 | |
| (1) | (1)
| | Shares were withheld from employees and directors to satisfy certain tax withholding obligations due in connection with grants of shares under our 2013 Stock Plan and 2016 Stock Plan. Each of the 2016 Stock Plan, the 2013 Stock Plan, the 2003 Employee Stock Plan and the 1999 Stock Option Plan for Non-Employee Directors provide for the withholding of shares to satisfy tax obligations, but do not specify a maximum number |
| of shares that can be withheld for this purpose. These shares were not purchased as part of a publicly announced program to purchase common shares. |
| (2) | (2)
| | In August 2015, our Board authorized a share repurchase program under which we may repurchase up to $400 $400.0 million of our common shares in the open market or in privately negotiated transactions. The program was renewed by the Board in February 2019. Through December 31, 2018,2019, we repurchased 14.0 million of our common shares for an aggregate purchase price of approximately $119.4 million under this program. As of December 31, 2018,2019, we had approximately $280.6 million that remained authorized under the program that may be used to repurchase shares. The repurchased shares are held by our subsidiaries and are registered and tradable subject to applicable securities law limitations and have the same voting, dividend and other rights as other outstanding shares. As of December 31, 2018,2019, our subsidiaries held 52.8 million of our common shares. |
| | | | | | | | | | |
| | | | | | | | | Approximated | |
| | | | | | | Total Number | | Dollar Value of | |
| | | | | | | of Shares | | Shares that May | |
| | Total | | Average | | Purchased as | | Yet Be | |
| | Number of | | Price | | Part of Publicly | | Purchased | |
Period | | Shares | | Paid per | | Announced | | Under the | |
(In thousands, except per share amounts) | | Repurchased | | Share | | Program | | Program (1) | |
October 1 - October 31 | | — | | $ | — | | — | | 9,921 | |
November 1 - November 30 | | — | | $ | — | | — | | 9,921 | |
December 1 - December 31 | | 133 | | $ | 20.63 | | — | | 7,100 | |
| (1) | In May 2019, our Board of Directors authorized a share repurchase program under which we may repurchase, from time to time, up to $10.0 million of our mandatory convertible preferred shares in the open market or in privately negotiated transactions. Through December 31, 2019, we repurchased 136,772 mandatory convertible preferred shares for an aggregate purchase price of approximately $2.9 million |
Performance Graph
The following graph illustrates comparisons of five-year cumulative total returns among Nabors, the S&P 500 Index, S&P MidCap 400 Index, S&P SmallCap 600 Index, Russell 3000 Index and Dow Jones Oil Equipment and Services Index. We were included in the S&P MidCap 400 Index until the close of business on December 7, 2018, at which time we were moved to the S&P SmallCap 600 Index. We also are included in the Russell 3000 Index. We
present all of these indices. Total return assumes $100 invested on December 31, 20132014 in shares of Nabors and in the
aforementioned indices noted above assuming reinvestment of dividends at the end of each calendar year, presented in the table below.
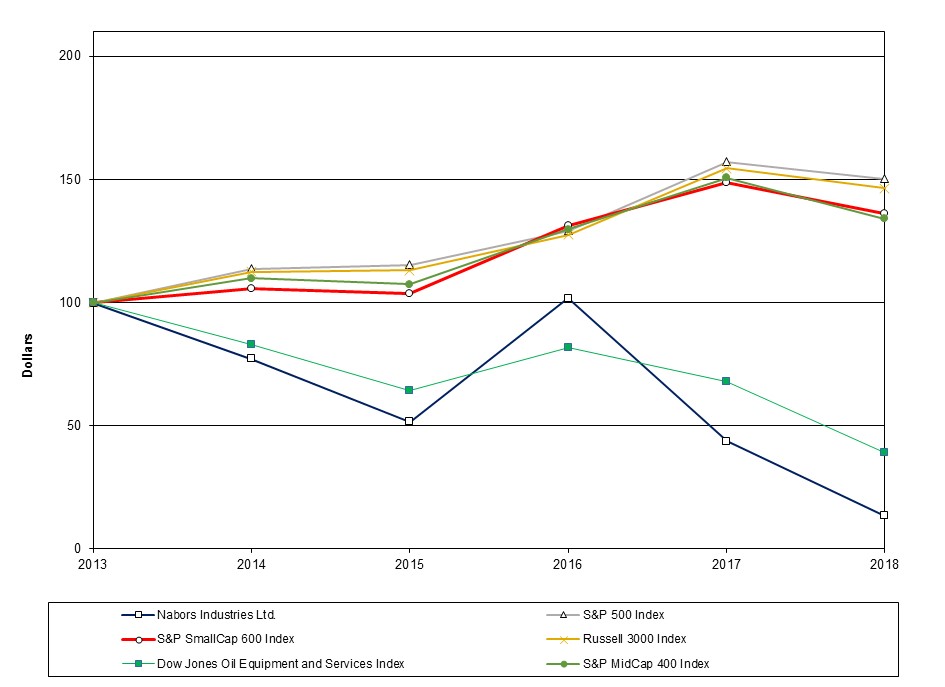
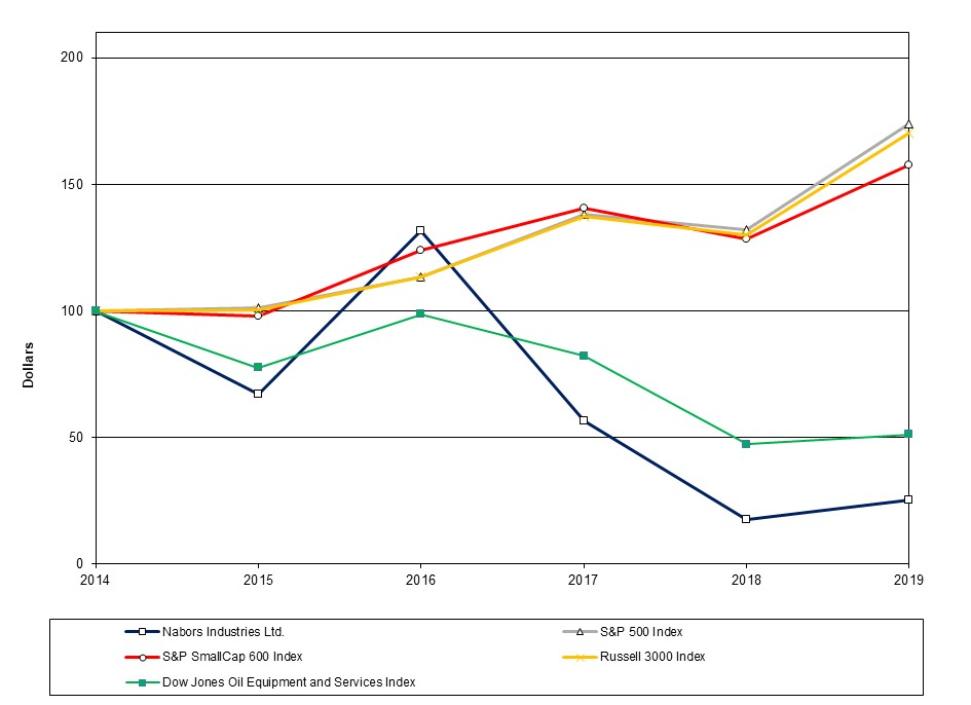
| | | | | | | | | | | | | | |
| | 2013 | | 2014 | | 2015 | | 2016 | | 2017 | | 2018 | | |
| | | | | | | | | | | | | | |
| | | 2014 | | 2015 | | 2016 | | 2017 | | 2018 | | 2019 | |
Nabors Industries Ltd. | | 100 | | 77 | | 52 | | 102 | | 44 | | 13 | | | 100 | | 67 | | 132 | | 57 | | 17 | | 25 | |
S&P 500 Index | | 100 | | 114 | | 115 | | 129 | | 157 | | 150 | | | 100 | | 101 | | 114 | | 138 | | 132 | | 174 | |
S&P MidCap 400 Index | | 100 | | 110 | | 107 | | 130 | | 151 | | 134 | | |
S&P SmallCap 600 Index | | 100 | | 106 | | 104 | | 131 | | 149 | | 136 | | | 100 | | 98 | | 124 | | 140 | | 129 | | 158 | |
Russell 3000 Index | | 100 | | 113 | | 113 | | 128 | | 154 | | 146 | | | 100 | | 100 | | 113 | | 137 | | 130 | | 170 | |
Dow Jones Oil Equipment and Services Index | | 100 | | 83 | | 64 | | 82 | | 68 | | 39 | | | 100 | | 78 | | 99 | | 82 | | 47 | | 51 | |
The foregoing graph is based on historical data and is not necessarily indicative of future performance. This graph shall not be deemed to be “soliciting material” or “filed” with the SEC or subject to Regulations 14A or 14C under the Exchange Act or to the liabilities of Section 18 under the Exchange Act.
Related Shareholder Matters
Bermuda has exchange controls which apply to residents in respect of the Bermuda dollar. As an exempted company, Nabors is designated as non-resident for Bermuda exchange control purposes by the Bermuda Monetary Authority. Pursuant to our non-resident status, there are no Bermuda restrictions on our ability to transfer funds (other than funds denominated in Bermuda dollars) in and out of Bermuda or to pay dividends to non-residents who are holders of our common shares in all other currencies, including currency of the United States.
There is no reciprocal tax treaty between Bermuda and the United States. Under current Bermuda law, there is no Bermuda withholding tax on dividends or other distributions, nor any Bermuda tax computed on profit or income payable by Nabors or its operations. Furthermore, no Bermuda tax is levied on the sale or transfer (including by gift
and/or on the death of the shareholder) of Nabors common shares (other than by shareholders resident in Bermuda).
Nabors has received an undertaking from the Minister of Finance in Bermuda that, in the event of any taxes being imposed, Nabors will be exempt from taxation in Bermuda until March 31, 2035.
ITEM 6. SELECTED FINANCIAL DATA
The following table summarizes selected financial information and should be read in conjunction with Part II, Item 7.—Management’s Discussion and Analysis of Financial Condition and Results of Operations and our consolidated financial statements and related notes thereto included under Part II, Item 8.—Financial Statements and Supplementary Data.
| | | | | | | | | | | | | | | | |
| | Year Ended December 31, | |
| | 2019 | | 2018 | | 2017 | | 2016 | | 2015 | |
Operating Data (1)(2) | | (In thousands, except per share amounts and ratio data) | |
Operating revenues | | $ | 3,043,383 | | $ | 3,057,619 | | $ | 2,564,285 | | $ | 2,227,839 | | $ | 3,864,437 | |
Income (loss) from continuing operations, net of tax | | | (680,498) | | | (598,063) | | | (497,114) | | | (1,011,244) | | | (329,497) | |
Income (loss) from discontinued operations, net of tax | | | (12) | | | (14,663) | | | (43,519) | | | (18,363) | | | (42,797) | |
Net income (loss) | | | (680,510) | | | (612,726) | | | (540,633) | | | (1,029,607) | | | (372,294) | |
Less: Net (income) loss attributable to noncontrolling interest | | | (22,375) | | | (28,222) | | | (6,178) | | | (135) | | | (381) | |
Net income (loss) attributable to Nabors | | | (702,885) | | | (640,948) | | | (546,811) | | | (1,029,742) | | | (372,675) | |
Less: Preferred stock dividend | | | (17,244) | | | (12,305) | | | — | | | — | | | — | |
Net income (loss) attributable to Nabors common shareholders | | | (720,129) | | | (653,253) | | | (546,811) | | | (1,029,742) | | | (372,675) | |
| | | | | | | | | | | | | | | | |
Earnings (losses) per share: | | | | | | | | | | | | | | | | |
Basic from continuing operations | | $ | (2.11) | | $ | (1.95) | | $ | (1.75) | | $ | (3.58) | | $ | (1.14) | |
Basic from discontinued operations | | | — | | | (0.04) | | | (0.15) | | | (0.06) | | | (0.15) | |
Total Basic | | $ | (2.11) | | $ | (1.99) | | $ | (1.90) | | $ | (3.64) | | $ | (1.29) | |
| | | | | | | | | | | | | | | | |
Diluted from continuing operations | | $ | (2.11) | | $ | (1.95) | | $ | (1.75) | | $ | (3.58) | | $ | (1.14) | |
Diluted from discontinued operations | | | — | | | (0.04) | | | (0.15) | | | (0.06) | | | (0.15) | |
Total Diluted | | $ | (2.11) | | $ | (1.99) | | $ | (1.90) | | $ | (3.64) | | $ | (1.29) | |
| | | | | | | | | | | | | | | | |
Weighted-average number of common shares outstanding: | | | | | | | | | | | | | | | | |
Basic | | | 351,617 | | | 334,397 | | | 280,653 | | | 276,475 | | | 282,982 | |
Diluted | | | 351,617 | | | 334,397 | | | 280,653 | | | 276,475 | | | 282,982 | |
| | | | | | | | | | | | | | | | |
Capital expenditures and acquisitions of businesses (3) | | $ | 423,967 | | $ | 478,435 | | $ | 769,848 | | $ | 414,379 | | $ | 925,544 | |
| | | | | | | | | | | | | | | | |
| | As of December 31, | |
| | 2019 | | 2018 | | 2017 | | 2016 | | 2015 | |
Balance Sheet Data (1)(2) | | (In thousands, except ratio data) | |
Cash, cash equivalents and short-term investments | | $ | 452,496 | | $ | 481,802 | | $ | 365,366 | | $ | 295,202 | | $ | 274,589 | |
Working capital | | | 592,118 | | | 761,486 | | | 527,860 | | | 333,905 | | | 469,398 | |
Property, plant and equipment, net | | | 4,930,549 | | | 5,467,870 | | | 6,109,565 | | | 6,267,583 | | | 7,027,802 | |
Total assets | | | 6,760,658 | | | 7,853,944 | | | 8,401,984 | | | 8,187,015 | | | 9,537,840 | |
Long-term debt | | | 3,333,220 | | | 3,585,884 | | | 4,027,766 | | | 3,578,335 | | | 3,655,200 | |
Shareholders’ equity | | | 1,982,811 | | | 2,700,850 | | | 2,911,816 | | | 3,247,025 | | | 4,282,710 | |
| | | | | | | | | | | | | | | | |
Net Debt to capital ratio (4) | | | 0.59:1 | | | 0.53:1 | | | 0.56:1 | | | 0.50:1 | | | 0.44:1 | |
| | | | | | | | | | | | | | | | |
| | Year Ended December 31, | |
| | 2018 | | 2017 | | 2016 | | 2015 | | 2014 | |
Operating Data (1)(2) | | (In thousands, except per share amounts and ratio data) | |
Operating revenues | | $ | 3,057,619 | | $ | 2,564,285 | | $ | 2,227,839 | | $ | 3,864,437 | | $ | 6,152,015 | |
Income (loss) from continuing operations, net of tax | | | (598,063) | | | (497,114) | | | (1,011,244) | | | (329,497) | | | 158,341 | |
Income (loss) from discontinued operations, net of tax | | | (14,663) | | | (43,519) | | | (18,363) | | | (42,797) | | | (11,179) | |
Net income (loss) | | | (612,726) | | | (540,633) | | | (1,029,607) | | | (372,294) | | | 147,162 | |
Less: Net (income) loss attributable to noncontrolling interest | | | (28,222) | | | (6,178) | | | (135) | | | (381) | | | (7,180) | |
Net income (loss) attributable to Nabors | | | (640,948) | | | (546,811) | | | (1,029,742) | | | (372,675) | | | 139,982 | |
Less: Preferred stock dividend | | | (12,305) | | | — | | | — | | | — | | | — | |
Net income (loss) attributable to Nabors common shareholders | | | (653,253) | | | (546,811) | | | (1,029,742) | | | (372,675) | | | 139,982 | |
| | | | | | | | | | | | | | | | |
Earnings (losses) per share: | | | | | | | | | | | | | | | | |
Basic from continuing operations | | $ | (1.95) | | $ | (1.75) | | $ | (3.58) | | $ | (1.14) | | $ | 0.51 | |
Basic from discontinued operations | | | (0.04) | | | (0.15) | | | (0.06) | | | (0.15) | | | (0.04) | |
Total Basic | | $ | (1.99) | | $ | (1.90) | | $ | (3.64) | | $ | (1.29) | | $ | 0.47 | |
| | | | | | | | | | | | | | | | |
Diluted from continuing operations | | $ | (1.95) | | $ | (1.75) | | $ | (3.58) | | $ | (1.14) | | $ | 0.51 | |
Diluted from discontinued operations | | | (0.04) | | | (0.15) | | | (0.06) | | | (0.15) | | | (0.04) | |
Total Diluted | | $ | (1.99) | | $ | (1.90) | | $ | (3.64) | | $ | (1.29) | | $ | 0.47 | |
| | | | | | | | | | | | | | | | |
Weighted-average number of common shares outstanding: | | | | | | | | | | | | | | | | |
Basic | | | 334,397 | | | 280,653 | | | 276,475 | | | 282,982 | | | 294,182 | |
Diluted | | | 334,397 | | | 280,653 | | | 276,475 | | | 282,982 | | | 296,592 | |
| | | | | | | | | | | | | | | | |
Capital expenditures and acquisitions of businesses (3) | | $ | 478,435 | | $ | 769,848 | | $ | 414,379 | | $ | 925,544 | | $ | 1,899,042 | |
Interest coverage ratio (4) | | | 3.3:1 | | | 2.4:1 | | | 3.4:1 | | | 6.2:1 | | | 9.8:1 | |
| | | | | | | | | | | | | | | | |
| | As of December 31, | |
| | 2018 | | 2017 | | 2016 | | 2015 | | 2014 | |
Balance Sheet Data (1)(2) | | (In thousands, except ratio data) | |
Cash, cash equivalents and short-term investments | | $ | 481,802 | | $ | 365,366 | | $ | 295,202 | | $ | 536,169 | | $ | 507,133 | |
Working capital | | | 761,486 | | | 527,860 | | | 333,905 | | | 1,174,399 | | | 1,442,406 | |
Property, plant and equipment, net | | | 5,467,870 | | | 6,109,565 | | | 6,267,583 | | | 8,599,125 | | | 8,597,813 | |
Total assets | | | 7,853,944 | | | 8,401,984 | | | 8,187,015 | | | 11,862,923 | | | 12,137,749 | |
Long-term debt | | | 3,585,884 | | | 4,027,766 | | | 3,578,335 | | | 4,331,840 | | | 3,882,055 | |
Shareholders’ equity | | | 2,700,850 | | | 2,911,816 | | | 3,247,025 | | | 4,908,619 | | | 5,969,086 | |
Debt to capital ratio: | | | | | | | | | | | | | | | | |
Gross (5) | | | 0.57:1 | | | 0.58:1 | | | 0.52:1 | | | 0.47:1 | | | 0.39:1 | |
Net (6) | | | 0.53:1 | | | 0.56:1 | | | 0.50:1 | | | 0.43:1 | | | 0.36:1 | |
| (1) | (1)
| | All periods present the operating activities of most of our wholly owned oil and gas businesses and our previously held equity interests in oil and gas joint ventures in Canada and Colombia as discontinued operations. |
| (2) | (2)
| | Our acquisitions’ results of operations and financial position have been included beginning on the respective dates of acquisition and include PetroMar Technologies (October 2018), SANAD (December 2017), Tesco (December 2017), RDS (September 2017), and Nabors Arabia (May 2015) and 2TD (October 2014). Following consummation of the merger of our Completion & Production Services business with C&J Energy (March 2015), we ceased consolidating that business’s results with our results of operations and began reporting our share of the earnings (losses) of CJES through earnings (losses) from unconsolidated affiliates in our consolidated statements of income (loss). As a result of the CJES Chapter 11 filing, we ceased accounting for our investment in CJES under the equity method of accounting beginning on July 20, 2016. |
| (3) | (3)
| | Represents capital expenditures and the total purchase price of acquisitions. |
| (4) | (4)
| | The interest coverage ratio is a trailing 12-month quotient of the sum of operating revenues, direct costs, general and administrative expenses and research and engineering expenses divided by interest expense. The interest coverage ratio is not a measure of operating performance or liquidity defined by generally accepted accounting principles in the United States of America (“U.S. GAAP”) and may not be comparable to similarly titled measures presented by other companies.
|
| (5)
| | The gross debt to capital ratio is calculated by dividing total debt by total capitalization (total debt plus shareholders’ equity). The gross debt to capital ratio is not a measure of operating performance or liquidity defined by U.S. GAAP and may not be comparable to similarly titled measures presented by other companies.
|
| (6)
| | The net debt to capital ratio is calculated by dividing net debt by net capitalization. Net debt is defined as total debt minus the sum of cash and cash equivalents and short-term investments. Net capitalization is defined as net debt plus shareholders’ equity. The net debt to capital ratio is not a measure of operating performance or liquidity defined by U.S. GAAP and may not be comparable to similarly titled measures presented by other companies. |
ITEM 7. MANAGEMENT’S DISCUSSION AND ANALYSIS OF FINANCIAL CONDITION AND RESULTS OF OPERATIONS
The following discussion and analysis of our financial condition and results of operations is based on, and should be read in conjunction with, our consolidated financial statements and the related notes thereto included under Part II, Item 8.—Financial Statements and Supplementary Data. This discussion and analysis contains forward-looking statements that involve risks and uncertainties. Actual results may differ materially from those anticipated in these forward-looking statements as a result of certain factors, including those set forth under Part I, Item 1A.—Risk Factors and elsewhere in this annual report. See “Forward-Looking Statements.”
Management Overview
We own and operate one of the world’s largest land-based drilling rig fleets and are a provider ofprovide offshore rigs in the United States and numerous international markets. Our business is comprised of our global land-based and offshore drilling rig operations and other rig related services and technologies, consisting oftechnologies. These services include tubular services, wellbore placement solutions, directional drilling, measurement-while-drilling, logging-while-drilling systems and services, equipment manufacturing, rig instrumentation and optimization software. We also specialize in tubular services, wellbore placement solutions and are a leading provider of directional drilling and MWD systems and services.
Outlook
The demand for our services is a function of the level of spending by oil and gas companies for exploration, development and production activities. The primary driver of customer spending is their cash flow and earnings which are largely driven by oil and natural gas prices and customers’ production volumes. The oil and natural gas markets have traditionally been volatile and tend to be highly sensitive to supply and demand cycles.
Throughout mostmuch of 2018, oil prices steadily increased2019, we experienced increases in activity and reached a four-year highpricing within our U.S. Drilling operating segment as well as moderate improvements within our Drilling Solutions operating segment. However, these increases were offset by declines in September. Theour International Drilling and Canada Drilling operating segments. During the latter part of 2019, we experienced an overall decline in market demand which adversely impacted our results for 2019. We expect the market to stabilize during the first half of 2020 with marginal increases in activity throughout the balance of the year. Internationally, we expect an increase in the price of oil spurred rig count growththroughout 2020.
Recent Developments
In December 2019, Nabors Delaware entered into Amendment No. 2 (the “Second Amendment”) to its existing 2018 Revolving Credit Facility. Among other things, the Second Amendment replaced the net funded debt to capitalization covenant with a covenant to maintain net funded indebtedness at no greater than 5.5 times EBITDA (as defined in the U.S.Second Amendment). See further details of the Second Amendment within Note 10—Debt in Part II, Item 8. —Financial Statements and Canada, as evidenced by the 12% and 10% increases, respectively, in our average rigs working during 2018 compared to 2017. Internationally, rig counts were relatively in line with the previous year. Oil prices took a sharp decline in the fourth quarter of 2018, but have since moderately recovered to approximately $50 on average during early 2019. Although we expect demand for our high-specification rigs in the U.S. Lower 48 to remain strong, it is uncertain to what extent the late-2018 oil price volatility will lead our U.S. customers to delay or scale back investment. See Part I, Item 1A.—Risk Factors—Fluctuations in oil and natural gas prices could adversely affect drilling activity and our revenues, cash flows and profitability.Supplementary Data.
Recent Developments
In January 2018,2020, Nabors Delaware completed ana private placement offering of $800$600.0 million aggregate principal amount of 5.75% senior unsecuredguaranteed notes due February 1, 2025, which2026 (the “2026 Notes”) and $400.0 million aggregate principal amount of senior guaranteed notes due 2028 (the “2028 Notes” and, together with the 2026 Notes, the “notes”). The 2026 and 2028 Notes will bear interest at an annual rate of 7.25% and 7.50%, respectively. The notes are fully and unconditionally guaranteed by Nabors. A portioncertain of theNabors’ indirect wholly owned subsidiaries. The proceeds from this offering were used primarily to repay allrepurchase $952.9 million aggregate principal amount, for a net premium of $2.7 million (excluding accrued interest), of certain of Nabors Delaware’s outstanding 6.15%senior notes that were tendered pursuant to an offer to purchase certain of our senior notes. The aggregate principal amount repurchased included approximately $407.7 million of our 5.50% senior notes due February 2018.2023, $379.7 million of our 4.625% senior notes due 2021 and $165.5 million of our 5.10% senior notes due 2023. The remaining proceeds notwere used to pay for such purposes were allocatedtransactional fees and for general corporate purposes, including to repay amounts outstanding under the commercial paper program and to repurchase or repay other indebtedness.
In May 2018, we issued 35,000,000 of our common shares at a price to the public of $7.75 per share and 5,750,000 (including the underwriters option for 750,000) of our 6% Series A Mandatory Convertible Preferred Shares (the “mandatory convertible preferred shares”), par value $.001 per share, with a liquidation preference of $50 per share. In connection with the common shares offering, in June 2018 the underwriters exercised in full their option to purchase 5,250,000 additional common shares. Nabors received aggregate net proceeds of approximately $580.6 million from these offerings after deducting underwriting discounts, commissions, and offering expenses. The net proceeds from these offerings were used to repay amounts outstanding under the 2012 Revolving Credit Facility, which we may re-borrow from time to time for the repayment of other indebtedness, and for general corporate purposes.
The dividends ondebt. We also repurchased in the mandatory convertible preferred shares are payable on a cumulative basis at a rate of 6% annually onopen market, aside from the initial liquidation preference of $50 per share. Dividends accumulate and are paid quarterly to the extent that we have available funds and our Board of Directors declares a dividend payable. We may elect to pay any accumulated and unpaid dividends in cash or common shares or any combination thereof. At issuance, each mandatory convertible preferred share was automatically convertible into between 5.3763 and 6.4516tender offer, approximately $21.2 million aggregate principal amount of our common shares basedvarious senior notes.
on the average share price over a period of twenty consecutive trading days ending prior to May 1, 2021, subject to anti-dilution adjustments. As a result of the dividends paid on our common shares since the offering, the conversion rate for each mandatory convertible preferred share has been adjusted to between 5.5775 and 6.6931 of our common shares. At any time prior to May 1, 2021, a holder of mandatory convertible preferred shares may convert such mandatory convertible preferred shares into our common shares at the minimum conversion rate, subject to adjustment.
In October 2018, Nabors Delaware, Nabors Drilling Canada Limited, Nabors and certain of Nabors’ wholly owned subsidiaries entered into a new five-year unsecured revolving facility with the lenders and issuing banks party thereto and Citibank, N.A., as administrative agent (the “2018 Revolving Credit Facility”). The 2018 Revolving Credit Facility has a borrowing capacity of $1.267 billion and is fully and unconditionally guaranteed by Nabors and certain of its wholly owned subsidiaries. The 2018 Revolving Credit Facility matures at the earlier of (a) October 11, 2023 and (b) July 19, 2022, if any of Nabors Delaware’s existing 5.5% senior notes due January 2023 remain outstanding as of such date. The 2018 Revolving Credit Facility can be used for general corporate purposes, including capital expenditures and working capital. As of the date of this report, we had no borrowings under the 2018 Revolving Credit Facility.
In connection with the 2018 Revolving Credit Facility, Nabors Delaware entered into Amendment No. 3 to its existing credit agreement dated November 29, 2012 (as amended, including such amendment, the “2012 Revolving Credit Facility”), among itself, Nabors, Nabors Canada, HSBC Bank Canada, the other lenders party thereto, Citibank, N.A., and Wilmington Trust, National Association, as successor administrative agent (the “Amendment”). The Amendment, among other things, reduces the overall commitments available to $666.25 million and provides for certain lenders to exit the facility. At December 31, 2018, we had $170.0 million outstanding under our 2012 Revolving Credit Facility.
In October 2018, we purchased PetroMar Technologies, a small developer and operator of LWD downhole tools focusing on high-value formation data to facilitate completion optimization particularly in unconventional reservoirs. The tools complement our existing wellbore placement capabilities and will be included in our Drilling Solutions operating segment. Under the terms of the transaction, we paid an initial purchase price of $25.0 million. We may also be required to make future payments that are contingent upon the future financial performance of this operation.
Financial Results
Comparison of the years ended December 31, 20182019 and 20172018
Operating revenues in 20182019 totaled $3.1$3.0 billion, representing an increasea decrease of $493.3$14.2 million or 19%, from 2017. We2018. Although we experienced an increase in operating revenue across all of our operating segments, aside from International Drilling. Activity and pricing both increased in most of the segments, as a result of the improved market conditions with the most impactful increase inwithin our U.S. Drilling operating segment as activity and Drilling Solutions operating segments, followedpricing improved, this increase was more than offset by Canada Drilling and Rig Technologies. Additionally, we benefited from incrementala decline in operating revenues of approximately $187.4 million as a result ofwithin our acquisition of Tesco, which was consummated in December 2017.Canada and International Drilling operating segments.
Net loss from continuing operations attributable to Nabors common shareholders totaled $638.6$720.1 million for 20182019 ($1.952.11 per diluted share) compared to a net loss from continuing operations attributable to Nabors common shareholders of $503.3$638.6 million ($1.751.95 per diluted share) in 2017,2018, or a $135.3an $81.5 million increase in the net loss. Although our segments’ adjusted operating income improved by approximately $200.6$30.5 million compared to the prior period, our net loss was adversely impacted by an increase in impairments and other charges of $99.9 million. This$146.0 million coupled with an increase is primarily attributable to the decline in oil prices at year end, and is comprised of rig-related impairments and retirementsforeign currency exchange losses of approximately $60.2$16.8 million. Also contributing to the increase was a loss of $64.7 million on the sale of three offshore drilling rigs and eight workover rigs within our International Drilling reportable segment.
General and administrative expenses in 20182019 totaled $265.8$258.7 million, representing a decrease of $7.1 million, or 3% from 2018. This is reflective of a reduction in workforce and general cost-reduction efforts across our operating segments and our corporate offices.
Research and engineering expenses in 2019 totaled $50.4 million, representing a decrease of $5.8 million, or 10%, from 2018. The decrease is primarily attributable to a reduction in staffing levels, fewer capital projects and other cost control efforts across many of our research and engineering projects and initiatives.
Depreciation and amortization expense in 2019 was $876.1 million, representing an increase of $14.6$9.2 million, or 6% from 2017. This is reflective of a slight increase in salaries and other compensation as well as increases in headcount as a result of increased activity, including entry into new markets and product lines from the Company’s acquisition of Tesco in the fourth quarter of 2017.
Research and engineering expenses in 2018 totaled $56.1 million, representing an increase of $5.1 million, or 10%1%, from 2017. The increase is a result of increased efforts towards a number of strategic research and engineering
projects as the market rebalanced and activity increased, including a full year of costs from the acquisition of RDS in September 2017, the Tesco acquisition in December 2017 and a partial year of costs from the PetroMar acquisition in October 2018.
Depreciation and amortization expense in 2018 was $866.9 million, representing an increase of $23.9 million, or 3%, from 2017. The slight increase was primarily due to the increased number of rigs that were working in the U.S. during the period, which results in a higher active depreciation rate, coupled with incremental depreciation expense associated with capital expenditures as we upgraded existing rigs during the acquisitionend of Tesco in December 2017.2018 and early 2019.
Segment Results of Operations
Our business consists of five reportable segments: U.S. Drilling, Canada Drilling, International Drilling, Drilling Solutions and Rig Technologies.
Management evaluates the performance of our reportable segments using adjusted operating income (loss), which is our segment performance measure, because it believes that this financial measure reflects our ongoing profitability and performance. In addition, securities analysts and investors use this measure as one of the metrics on which they analyze our performance. Adjusted operating income (loss) represents income (loss) from continuing operations before income taxes, interest expense, earnings (losses) from unconsolidated affiliates, investment income (loss), impairments and other charges and other, net. A reconciliation of adjusted operating income to net income (loss) from continuing operations before income taxes can be found in Note 21—19—Segment Information in Part II, Item 8. —Financial Statements and Supplementary Data.
The following tables set forth certain information with respect to our reportable segments and rig activity:
| | | | | | | | | | | | | | | |
| | | | Year Ended December 31, | | Increase/(Decrease) | |
| | | | 2019 | | 2018 | | 2019 to 2018 | |
| | | | (In thousands, except percentages and rig activity) |
U.S. Drilling | | | | | | | | | | | | | | | |
Operating revenues | | | | $ | 1,240,936 | | $ | 1,083,227 | | $ | 157,709 | | 15 | % | |
Adjusted operating income (loss) | | | | $ | 64,313 | | $ | (21,298) | | $ | 85,611 | | 402 | % | |
Average rigs working (1) | | | | | 115.3 | | | 113.2 | | | 2.1 | | 2 | % | |
| | | | | | | | | | | | | | | |
Canada Drilling | | | | | | | | | | | | | | | |
Operating revenues | | | | $ | 68,274 | | $ | 105,000 | | $ | (36,726) | | (35) | % | |
Adjusted operating income (loss) | | | | $ | (14,483) | | $ | (6,166) | | $ | (8,317) | | (135) | % | |
Average rigs working (1) | | | | | 10.9 | | | 16.9 | | | (6.0) | | (36) | % | |
| | | | | | | | | | | | | | | |
International Drilling | | | | | | | | | | | | | | | |
Operating revenues | | | | $ | 1,324,142 | | $ | 1,469,038 | | $ | (144,896) | | (10) | % | |
Adjusted operating income (loss) | | | | $ | (8,903) | | $ | 74,221 | | $ | (83,124) | | (112) | % | |
Average rigs working (1) | | | | | 88.3 | | | 92.9 | | | (4.6) | | (5) | % | |
| | | | | | | | | | | | | | | |
Drilling Solutions | | | | | | | | | | | | | | | |
Operating revenues | | | | $ | 252,790 | | $ | 250,242 | | $ | 2,548 | | 1 | % | |
Adjusted operating income (loss) | | | | $ | 59,465 | | $ | 37,626 | | $ | 21,839 | | 58 | % | |
| | | | | | | | | | | | | | | |
Rig Technologies | | | | | | | | | | | | | | | |
Operating revenues | | | | $ | 260,226 | | $ | 270,988 | | $ | (10,762) | | (4) | % | |
Adjusted operating income (loss) | | | | $ | (11,247) | | $ | (25,762) | | $ | 14,515 | | 56 | % | |
| | | | | | | | | | | | | | |
| | | | Year Ended December 31, | | Increase/(Decrease) |
| | | | 2018 | | 2017 | | 2018 to 2017 |
| | | | (In thousands, except percentages and rig activity) |
U.S. Drilling | | | | | | | | | | | | | | |
Operating revenues | | | | $ | 1,083,227 | | $ | 805,223 | | $ | 278,004 | | 35 | % |
Adjusted operating income (loss) | | | | $ | (21,298) | | $ | (213,877) | | $ | 192,579 | | 90 | % |
Average rigs working (1) | | | | | 113.2 | | | 100.8 | | | 12.4 | | 12 | % |
| | | | | | | | | | | | | | |
Canada Drilling | | | | | | | | | | | | | | |
Operating revenues | | | | $ | 105,000 | | $ | 82,929 | | $ | 22,071 | | 27 | % |
Adjusted operating income (loss) | | | | $ | (6,166) | | $ | (22,262) | | $ | 16,096 | | 72 | % |
Average rigs working (1) | | | | | 16.9 | | | 15.4 | | | 1.5 | | 10 | % |
| | | | | | | | | | | | | | |
International Drilling | | | | | | | | | | | | | | |
Operating revenues | | | | $ | 1,469,038 | | $ | 1,474,060 | | $ | (5,022) | | (0) | % |
Adjusted operating income (loss) | | | | $ | 74,221 | | $ | 108,428 | | $ | (34,207) | | (32) | % |
Average rigs working (1) | | | | | 92.9 | | | 91.1 | | | 1.8 | | 2 | % |
| | | | | | | | | | | | | | |
Drilling Solutions | | | | | | | | | | | | | | |
Operating revenues | | | | $ | 250,242 | | $ | 140,701 | | $ | 109,541 | | 78 | % |
Adjusted operating income (loss) | | | | $ | 37,626 | | $ | 16,738 | | $ | 20,888 | | 125 | % |
| | | | | | | | | | | | | | |
Rig Technologies | | | | | | | | | | | | | | |
Operating revenues | | | | $ | 270,988 | | $ | 234,542 | | $ | 36,446 | | 16 | % |
Adjusted operating income (loss) | | | | $ | (25,762) | | $ | (30,964) | | $ | 5,202 | | 17 | % |
| (1) | (1)
| | Represents a measure of the number of equivalent rigs operating during a given period. For example, one rig operating 182.5 days during a 365-day period represents 0.5 average rigs working. |
U.S. Drilling
Operating resultsrevenues increased in 20182019 compared to 20172018 primarily due to an increase in dayrates as market prices have continued to improve throughout most of the year, resulting in approximately $123.8$97.2 million of the increase in adjusted operating income.revenues. Additionally, we experienced ana slight increase in activity as reflected by a 12%2% increase in the average number of rigs working which representedaccounted for approximately $65.6$26.4 million of the increase in adjusted operating income. The majority of
revenue. Partially offsetting the increase in operating revenues were higher field support costs and depreciation expense associated with the increase in activity and dayrates was attributable to the Lower 48 land market, but activity also increased in our U.S. Gulf of Mexico market, including our MODS-400 rig commencing operations during the year.period.
Canada Drilling
Operating results increasedrevenues decreased in 20182019 compared to 2017 primarily2018 as reflected by the 36% decline in average rigs working. The decline in activity is mainly due to an industry-wide decline in rig count in Canada due to unfavorable economic conditions, causing customers to cancel or delay drilling programs. The decrease in operating revenues was partially offset by corresponding declines in operating costs and depreciation expense as a 10% increaseresult of the decline in activity. This segment also benefited from various cost reduction initiatives.
International Drilling
Operating revenues decreased in 2019 compared to 2018 as they were unfavorably impacted by a reduction in pre-funded amortizing revenue of approximately $110 million as well as a decline in activity, as reflected by a 5% decrease in the average number of rigs working. Additionally, this segment benefited fromThe decrease in activity was partially attributed to the mixsale of higher margin activeour workover business in Argentina as well as fewer rigs during the period supplemented by an increaseworking in dayrates as market prices have improved.
International Drilling
Operating results decreased slightlyAlgeria, India, Kuwait and Venezuela. The decrease in 2018 compared to 2017. Operating results for the period were unfavorably impacted by the expiration of higher margin contracts and dayrate reductions in certain regions, which wereoperating revenue was partially offset by new rig awardscorresponding declines in lower margin regions. Further contributingoperating costs and depreciation resulting from fewer rigs working during the period.
Drilling Solutions
Operating revenues increased marginally in 2019 compared to 2018. Although this segment experienced increased operating revenue due to growth in our performance tools and tubular running services offerings, this was mostly offset by a decline in wellbore placement as the U.S. market softened in the latter half of the year. The increase in
adjusted operating income was primarily driven by improved profitability from our wellbore placement and tubular running services offerings due to effective cost reduction efforts across this business.
Rig Technologies
Operating revenues decreased in 2019 compared to 2018 due to the overall decline in activity as well as fewer capital equipment sales. However, adjusted operating resultsincome (loss) was decreased activity resulting from the salepositively impacted by improved margins on current product offerings coupled with cost reduction initiatives.
Other Financial Information
Interest expense
Interest expense for 2019 was $204.3 million, representing a decrease of three working jackup rigs.
Drilling Solutions
Operating results increased in 2018$22.8 million, or 10%, compared to 20172018. The decrease was primarily due to the significant increaserepayment of approximately $303.5 million aggregate principal of our 9.25% senior notes due January 2019 during 2018 utilizing the proceeds from our equity offering completed in drilling activityMay 2018. This decrease was further supplemented by the repurchase of approximately $468.3 million aggregate principal amount of our senior unsecured notes throughout 2019.
Impairments and other charges
Impairments and other charges for 2019 was $290.5 million, which primarily consisted of $203.7 million of impairments to goodwill and intangible assets. As part of our goodwill impairment test, we determined the carrying value of some of our reporting units exceeded their fair value. As such, we recognized impairments of $75.6 million for the remaining goodwill balance attributable to our International Drilling operating segment, $52.2 million for the remaining goodwill balance attributable to our U.S. Drilling operating segment and $28.1 million for the remaining goodwill balance attributable to the acquisition of 2TD reported within our Rig Technologies operating segment. Additionally, we recognized an impairment of $47.7 million to write off the intangible asset due to uncertainty in commercialization and demand stemming from lower commodity prices and rig counts. These non-cash pre-tax impairment charges were primarily the U.S.result of a sustained decline in our market capitalization and inlower future cash flow projections due to expectations for future commodity prices below previous projections and the resulting impact on the lower demand projections for our products and services including tubular serviceswithin these reporting units.
The balance of $86.8 million consisted of impairments and performance tools. This segment benefited from incremental operating revenues of approximately $113.8 million primarily related to the additionretirement provisions for several tangible and other assets. These assets included some of our tubular services product lines acquired from Tesco in December 2017.
Rig Technologies
Operating results increased in 2018 compared to 2017 primarily due to approximately $73.5 million in incremental revenue as a result of the acquisition of Tesco during the fourth quarter of 2017. However, operating income (loss) was adversely impacted by the relatively unfavorable mix between higher margin capital equipment salesolder and other lower margin activity. The Rig Technologies segment continues to carry a high level of research and engineering investment related to our 2TD and RDS product offerings, which amounted to approximately $14.5 million in 2018.
Other Financial Information
Interest expense
Interest expense for 2018 was $227.1 million, representing an increase of $4.2 million, or 2%, compared to 2017. The increase was primarily due to the additional interest expense related to our issuance of $800 million in aggregate principal amount of 5.75% senior notes due 2025 in January 2018. This increase was partially offset by the repayment of the 6.15% senior notes due February 2018 and 9.25% senior notes due January 2019.
Impairments and other charges
Impairments and other charges for 2018 was $144.4 million, which primarily included impairments of long-lived assets of $60.2 million comprised of underutilizedsmaller rigs in our U.S.Canada and International Drilling segmentsrig fleets of $17.8 million and $15.4 million, respectively, underutilized offshore rigs, obsolete inventory within our Rig Technologies segment as well as a loss of $64.7rig components and inventories totaling $10.4 million on the sale of three offshore drilling rigs and eight workover rigs within our International Drilling reportable segment. Additionally, we recognized $14.3$43.2 million in transaction related costs and a $5.3various receivables or other assets impacted by foreign sanctions or other political risk issues, bankruptcies or other financial problems.
Other, net
Other, net for 2019 was $33.2 million of expense, which included foreign currency exchange losses of $20.9 million, net loss recognizedlosses on the early extinguishmentsales and disposals of debt resulting from debt repurchases.assets of approximately $7.1 million and an increase in litigation reserves of $5.2 million.
Other, net
Other, net for 2018 was $29.5 million of expense, which included net losses on sales and disposals of assets of approximately $11.8 million, an increase in litigation reserves of $9.9 million and foreign currency exchange losses of $4.2 million.
Other, net for 2017 was $14.9 million of expense, which included net losses on sales and disposals of assets of approximately $19.0 million and foreign currency exchange losses of $1.6 million.
Income tax expense (benefit)
Income tax expense for 20182019 was $79.3$91.6 million, representing an increase of $162.2$12.3 million compared to 2017.2018. The increase in tax expense during 2019 compared to 2018 was primarily attributable to the change in our geographic mix of pre-tax earnings (losses), primarily due to. The ratio of pre-tax earnings in certain high tax jurisdictions causing a net income tax despite a consolidated pre-tax loss. In addition, management has continued to assess the Company’s ability to more likely than not realize deferred tax assets associated with its Canada Drilling operations and concluded during the fourth quarter of 2018 that the pace of market recovery did not support realization at this time. Accordingly, a non-cash tax expense of $52 million was recorded to reflect the valuation allowance.
Discontinued operations
Our discontinued operations during 2018 and 2017 consisted of our historical wholly owned oil and gas businesses. Income (loss) from discontinued operations during 2018 was a loss of $14.7 million compared to a loss of $43.5 million during 2017. During 2018 and 2017, we recognized impairment charges of $17.0 million and $35.3 million, respectively, due to the deterioration of economic conditionslow or zero tax jurisdictions increased in the dry gas market in western Canada. Additionally, our net loss for 2017 included a $16.5 million charge related to the settlement of litigation associated with our previously owned Ramshorn International properties. During November 2018, we sold our remaining wholly owned oil and gas business in Canada for approximately $8.0 million.
Additional discussion of our policy pertaining to the calculations of our annual impairment tests, including any impairment of goodwill, is set forth in Critical Accounting Estimates below in this section and in Note 2—Summary of Significant Accounting Policies in Part II, Item 8.—Financial Statements and Supplementary Data. Additional information relating to discontinued operations is provided in Note 4—Assets Held for Sale and Discontinued Operations in Part II, Item 8.—Financial Statements and Supplementary Data.
Comparison of the years ended December 31, 2017 and 2016
Operating revenues in 2017 totaled $2.6 billion, representing an increase of $336.4 million, or 15%, from 2016. We had a significant increase in the number of rigs working in the U.S.2019 compared to the same period2018, resulting in the prior year, which led to higher revenues in our U.S. Drilling, Drilling Solutions and Rig Technologies reportable segments. Internationally, we experienced a decline in the number of rigs working of approximately 9%, which partially offset the increases realized in the U.S. Drilling segment.
Net loss from continuing operations attributable to Nabors common shareholders totaled $503.3 million for 2017 ($1.75 per diluted share) compared to a net loss from continuing operations attributable to Nabors common shareholders of $1.0 billion ($3.58 per diluted share) in 2016, or a $508.1 million decrease in net loss. In combination with thean increase in revenue noted above, our net loss from continuing operations attributable to Nabors was positively impacted by the absence of an equity method investment in CJES, which accounted for $442.0 million of our net loss for the year ended December 31, 2016 related to our share of the net loss of CJES as well as impairment charges associated with the investment. Our results for 2017 include a benefit for a release of reserves due to favorable tax audit outcomes during the year of $167.0 million. This was offset by $138.6 million in income tax expense recorded in connection with the Tax Reform Act.
General and administrative expenses in 2017 totaled $251.2 million, representing an increase of $23.5 million, or 10% from 2016. This is primarily reflective of an increase in headcount and compensation in response to the increase in drilling activity.
Research and engineering expenses in 2017 totaled $51.1 million, representing an increase of $17.5 million, or 52%, over 2016. The increase was a result of increased efforts towards a number of strategic research and engineering projects, including the acquisition of RDS during 2017.
Depreciation and amortization expense in 2017 was $842.9 million, representing a decrease of $28.7 million, or 3%, over 2016. The decrease was primarily due to the impact from retirements and impairments of various rigs and rig equipment in late 2016 partially offset by incremental depreciation associated with capital expenditures as we upgrade our existing rig fleet.
Segment Results of Operations
The following tables set forth certain information with respect to our reportable segments and rig activity:
| | | | | | | | | | | | | |
| | | Year Ended December 31, | | Increase/(Decrease) |
| | | 2017 | | 2016 | | 2017 to 2016 |
| | | | | | | | | | | | | |
U.S. Drilling | | | | | | | | | | | | | |
Operating revenues | | | $ | 805,223 | | $ | 554,072 | | $ | 251,151 | | 45 | % |
Adjusted operating income (loss) | | | $ | (213,877) | | $ | (197,710) | | $ | (16,167) | | (8) | % |
Average rigs working (1) | | | | 100.8 | | | 62.0 | | | 38.8 | | 63 | % |
| | | | | | | | | | | | | |
Canada Drilling | | | | | | | | | | | | | |
Operating revenues | | | $ | 82,929 | | $ | 51,472 | | $ | 31,457 | | 61 | % |
Adjusted operating income (loss) | | | $ | (22,262) | | $ | (36,818) | | $ | 14,556 | | 40 | % |
Average rigs working (1) | | | | 15.4 | | | 9.7 | | | 5.7 | | 59 | % |
| | | | | | | | | | | | | |
International Drilling | | | | | | | | | | | | | |
Operating revenues | | | $ | 1,474,060 | | $ | 1,508,890 | | $ | (34,830) | | (2) | % |
Adjusted operating income (loss) | | | $ | 108,428 | | $ | 164,677 | | $ | (56,249) | | (34) | % |
Average rigs working (1) | | | | 91.1 | | | 100.2 | | | (9.1) | | (9) | % |
| | | | | | | | | | | | | |
Drilling Solutions | | | | | | | | | | | | | |
Operating revenues | | | $ | 140,701 | | $ | 63,759 | | $ | 76,942 | | 121 | % |
Adjusted operating income (loss) | | | $ | 16,738 | | $ | (16,503) | | $ | 33,241 | | 201 | % |
| | | | | | | | | | | | | |
Rig Technologies | | | | | | | | | | | | | |
Operating revenues | | | $ | 234,542 | | $ | 151,951 | | $ | 82,591 | | 54 | % |
Adjusted operating income (loss) | | | $ | (30,964) | | $ | (31,981) | | $ | 1,017 | | 3 | % |
| (1)
| | Represents a measure of the number of equivalent rigs operating during a given period. For example, one rig operating 182.5 days during a 365-day period represents 0.5 average rigs working. International average rigs working includes our equivalent percentage ownership of rigs owned by unconsolidated affiliates.
|
U.S. Drilling
Operating revenues increased in 2017 compared to 2016. We experienced a 63% increase in the average number of rigs working during 2017 compared to 2016, which was the primary contributor to the $251.2 million, or 45%, increase in operating revenues. However, dayrates were lower on average, mitigating the impact of increased activity on our average daily margins and adjusted operating income. Additionally, positive results were partially offset by a decrease in operating revenue and adjusted operating income in our offshore operations. Our results for 2016 included a favorable resolution of negotiations for one of our rigs in the Gulf of Mexico, which resulted in partial recovery of standby revenues for past quarters of approximately $20.9 million. The absence of this incremental revenue in combination with a decline in the number of rigs working in the Gulf of Mexico contributed to the overall decline in operating results.
Canada Drilling
Operating results increased in 2017 compared to 2016 due to an increase in drilling rig activity, as evidenced by the increase in average number of rigs working during 2017 compared to 2016.
International Drilling
Operating results decreased in 2017 compared to 2016 primarily due to the loss of revenue and increased costs related to downtime incurred to perform structural work on many of our rigs in our largest international market during the first half of 2017. Additionally, results were negatively impacted by a 9% reduction in average number of rigs working during 2017 compared to 2016. Partially offsetting these declines were increased drilling activity in Colombia, Kazakhstan and Kuwait.
Drilling Solutions
Operating results increased in 2017 compared to 2016 primarily due to a substantial increase in the performance tools revenue days. Although prices on average were lower in the U.S., we experienced increased pricing throughout
2017, most notably during the fourth quarter as contracts were renegotiated. Additionally, we experienced growth across all product lines as a result of the significant increase in drilling activity in the U.S. during 2017 compared to 2016.
Rig Technologies
Operating results increased in 2017 compared to 2016 due to the significant increase in drilling activity in the U.S. for the period and in the demand for our products and services. The revenue increase in the segment is driven by an increase in capital equipment deliveries from Canrig.
Other Financial Information
Earnings (losses) from unconsolidated affiliates
Earnings (losses) from unconsolidated affiliates represents our share of the net income (loss), as adjusted for our basis differences, of our equity method investments. We previously accounted for our investment in CJES under the equity method on a one-quarter lag through June 30, 2016. On July 20, 2016, CJES voluntarily filed for protection under Chapter 11 of the Bankruptcy Code. As a result, beginning with the third quarter of 2016, we ceased accounting for our investment under the equity method of accounting. Earnings (losses) from unconsolidated affiliates for the year ended December 31, 2016 includes our share of the net income (loss) of CJES from October 1, 2015 through March 31, 2016, resulting in a loss of $221.9 million, inclusive of charges of $138.5 million representing our share of CJES’s fixed asset impairment charges for the period.
Interest expense
Interest expense for 2017 was $222.9 million, representing an increase of $37.5 million, or 20%, compared to 2016. The increase was primarily due to the additional interest expense related to the issuance of $600 million in aggregate principal amount of 5.5% senior notes due 2023 during December 2016 as well as the issuance of $575 million in aggregate principal amount of 0.75% senior exchangeable notes due 2024 during January 2017.expense. This increase was partially offset by certain discrete items. During 2019, we recognized a reduction in interest expense due to the repayment of the term loan facility with proceeds of these offerings and with the repurchase or redemption of approximately $367.9$29.6 million in aggregate principal amount of 6.15% senior notes due 2018.
Impairments and other charges
Impairments and other charges for 2017 were $44.5 million, including $21.6 million in transaction related costs, $16.0 million loss recognized on the early extinguishment of debt resultingtax benefit from debt repurchases and impairments of long-lived assets of $6.9 million comprised of underutilized rigs in our International Drilling segment.
Other, net
Other, net for 2017 was $14.9 million of expense, which included net losses on sales and disposals of assets of approximately $19.0 million and foreign currency exchange losses of $1.6 million.
Other, net for 2016 was $44.2 million of income, which was primarily comprised of net losses on sales and disposals of assets of approximately $14.8 million, legal and professional fees primarily of $12.9 million incurred in connection with preserving our interests in CJES, foreign currency exchange losses of $5.7 million and increases to litigation reserves of $3.9 million.
Income tax rate
Our worldwide effective tax rate during 2017 was 14.3% compared to 15.6% during 2016. The effective tax rate for 2017 includes a benefit for the release of reserves duea valuation allowance in one of our foreign jurisdictions related to favorable audit outcomes during the year of $167.0 million.net operating loss carryforwards. This was partially
offset by a $14.4 million settlement of a tax dispute in one of our foreign jurisdictions. During 2018, we recognized a non-cash write-downexpense of net$52.0 million to reflect a valuation allowance on deferred tax assets of $138.6 million attributable to the Tax Reform Act passed during the fourth quarter of 2017.in Canada.
Discontinued operations
Our discontinued operations during 2017 and 2016 consisted of our historical wholly owned oil and gas businesses. Income (loss) from discontinued operations during 2017 was a loss of $43.5 million compared to a loss of $18.4 million during 2016. During 2017 and 2016, we recognized impairment charges of $35.3 million and $15.4 million, respectively, due to the deterioration of economic conditions in the dry gas market in western Canada. Additionally, our net loss for 2017 included a $16.5 million charge related to the settlement of litigation associated with our previously owned Ramshorn International properties.
Liquidity and Capital Resources
Financial Condition and Sources of Liquidity
Our primary sources of liquidity are cash and investments, availability under our revolving credit facilities and cash generated from operations. As of December 31, 2019, we had cash and short-term investments of $452.5 million and working capital of $592.1 million. As of December 31, 2018, we had cash and short-term investments of $481.8 million and working capital of $761.5 million. As of December 31, 2017, we had cash and short-term investments of $365.4 million and working capital of $527.9 million. At December 31, 2018,2019, we had $170.0$355.0 million of borrowings outstanding under our revolving credit facilities.
In January 2018, Nabors Delaware completed an offering of $800 million aggregate principal amount of 5.75% senior unsecured notes due February 1, 2025, which are fully and unconditionally guaranteed by Nabors. A portion of the proceeds from this offering were used to repay all of Nabors Delaware’s outstanding 6.15% senior notes due February 2018. The remaining proceeds not used for such purposes were allocated for general corporate purposes, including to repay amounts outstanding under the commercial paper program and to repurchase or repay other indebtedness.
In May 2018, we issued 35,000,000 of our common shares at a price to the public of $7.75 per share and 5,750,000 (including the underwriters option for 750,000) of our 6% Series A Mandatory Convertible Preferred Shares (the “mandatory convertible preferred shares”), par value $.001 per share, with a liquidation preference of $50 per share. In connection with the common shares offering, in June 2018 the underwriters exercised in full their option to purchase 5,250,000 additional common shares. Nabors received aggregate net proceeds of approximately $580.6 million from these offerings after deducting underwriting discounts, commissions, and offering expenses. The net proceeds from these offerings were used to repay amounts outstanding under the 2012 Revolving Credit Facility, which we may re-borrow from time to time for the repayment of other indebtedness, and for general corporate purposes.
The dividends on the mandatory convertible preferred shares are payable on a cumulative basis at a rate of 6% annually on the initial liquidation preference of $50 per share. Dividends accumulate and are paid quarterly to the extent that we have available funds and our Board of Directors declares a dividend payable. We may elect to pay any accumulated and unpaid dividends in cash or common shares or any combination thereof. At issuance, each mandatory convertible preferred share was automatically convertible into between 5.3763 and 6.4516 of our common shares based on the average share price over a period of twenty consecutive trading days ending prior to May 1, 2021, subject to anti-dilution adjustments. As a result of the dividends paid on our common shares since the offering, the conversion rate for each mandatory convertible preferred share has been adjusted to between 5.5775 and 6.6931 of our common shares. At any time prior to May 1, 2021, a holder of mandatory convertible preferred shares may convert such mandatory convertible preferred shares into our common shares at the minimum conversion rate, subject to adjustment.
In October 2018, Nabors Delaware, Nabors Drilling Canada Limited, Nabors and certain of Nabors’ wholly owned subsidiaries entered into a new five-year unsecured revolving facility with the lenders and issuing banks party thereto and Citibank, N.A., as administrative agent (the “2018 Revolving Credit Facility”). The 2018 Revolving Credit Facility has a borrowing capacity of $1.267 billion and is fully and unconditionally guaranteed by Nabors and certain of its wholly owned subsidiaries. The 2018 Revolving Credit Facility matures at the earlier of (a) October 11, 2023 and (b) July 19, 2022, if any of Nabors Delaware’s existing 5.5% senior notes due January 2023 remain outstanding as of such date. The 2018 Revolving Credit Facility can be used for general corporate purposes, including capital expenditures and working capital. As of the date of this report, we had no borrowings under the 2018 Revolving Credit Facility. In order to make any future borrowings under the 2018 Revolving Credit Facility, Nabors and certain of its wholly owned subsidiaries are subject to compliance with the conditions and covenants contained therein, including compliance with applicable financial ratios.
In connection with the 2018 Revolving Credit Facility, Nabors Delaware entered into Amendment No. 3 to its existing credit agreement dated November 29, 2012 (as amended, including such amendment, the “2012 Revolving Credit Facility”), among itself, Nabors, Nabors Canada, HSBC Bank Canada, the other lenders party thereto, Citibank, N.A., and Wilmington Trust, National Association, as successor administrative agent (the “Amendment”). The Amendment, among other things, reduces the overall commitments available to $666.25 million and provides for certain lenders to exit the facility.
We had 1518 letter-of-credit facilities with various banks outstanding as of December 31, 2018.2019. Availability under these facilities as of December 31, 2016 was as follows:
| | | | |
| | December 31, | |
| | 2018 | |
| | (In thousands) | |
Credit available | | $ | 759,321 | |
Less: Letters of credit outstanding, inclusive of financial and performance guarantees | | | 105,036 | |
Remaining availability | | $ | 654,285 | |
| | | | |
| | December 31, | |
| | 2019 | |
| | (In thousands) | |
Credit available | | $ | 890,902 | |
Less: Letters of credit outstanding, inclusive of financial and performance guarantees | | | 146,788 | |
Remaining availability | | $ | 744,114 | |
Our ability to access capital markets or to otherwise obtain sufficient financing may be affected by our senior unsecured debt ratings as provided by the major credit rating agencies in the United States and our historical ability to access these markets as needed. While there can be no assurances that we will be able to access these markets in the future, or access them on favorable terms, we believe that we will be able to access capital markets or otherwise obtain financing in order to satisfy any payment obligation that might arise upon maturity, exchange or purchase of our notes and our debt facilities, loss of availability of our revolving credit facilities and our A/R Agreement, and that any cash payment due, in addition to our other cash obligations, would not ultimately have a material adverse impact on our liquidity or financial position. The major U.S. credit rating agencies have previously downgraded our senior unsecured debt rating to non-investment grade. These and any further ratings downgrades could adversely impact our ability to access debt markets in the future, increase the cost of future debt, and potentially require us to post letters of credit for certain obligations. See Part I, Item 1A.—Risk Factors—A downgrade in our credit rating could negatively impact our cost of and ability to access capital markets or other financing sources.
Our gross debt to capital ratio was 0.57:1 as of December 31, 2018 and 0.58:1 as of December 31, 2017. Our net debt to capital ratio was 0.53:1 as December 31, 2018 and 0.56:1 as of December 31, 2017. The gross debt to capital ratio is calculated by dividing total debt by total capitalization (total debt plus shareholders’ equity). The net debt to capital ratio is calculated by dividing net debt by net capitalization. Net debt is defined as total debt minus the sum of cash and cash equivalents and short-term investments. Net capitalization is defined as net debt plus shareholders’ equity. Availability under both the 2012 Revolving Credit Facility and the 2018 Revolving Credit Facility is subjectrequires us to a covenant not to exceedmaintain a net leverage ratio 5.50:1 or less and an asset to debt to capitalcoverage ratio of 0.60:1. In addition, availability underat least 2.50:1, as of the new 2018 Revolving Credit Facility is subjectend of each calendar quarter. The net leverage ratio became effective with the adoption of the Second Amendment. The asset to a covenant thatdebt coverage ratio applies only during anythe period in which Nabors Delaware fails to maintain an investment grade rating from at least two ratingsrating agencies, which was the guarantors undercase as of the facility and their subsidiaries will be required to maintain an asset to debt coverage ratiodate of at least 2.50:1. As of December 31, 2018, ourthis report. Our asset to debt coverage ratio was 4.28:1 as of December 31, 2019 and 3.82:1. The asset to debt coverage1 as of December 31, 2018. Our net leverage ratio is calculated by dividing (x) drilling-related fixed assets wholly owned by certainwas 3.55:1 as of Nabors’ subsidiaries that are guaranteeing the 2018 Revolving Credit Facility (the “2018 Revolver Guarantors”) or wholly owned subsidiaries of the 2018 Revolver Guarantors by (y) total debt of the 2018 Revolver Guarantors (subject to certain exclusions).December 31, 2019.
As of the date of this report, we were in compliance with all covenants under the 2018 Revolving Credit Facility and 2012 Revolving Credit Facility. If we fail to perform our obligations under the covenants, the revolving credit commitments under the 2012 Revolving Credit Facility and the 2018 Revolving Credit Facility could be terminated, and any outstanding borrowings under the facilities could be declared immediately due and payable. If necessary, we have the ability to manage these ratios by taking certain actions including reductions in discretionary capital or other types of controllable expenditures, monetization of assets, amending or renegotiating the revolving credit agreement, accessing capital markets through a variety of alternative methods, or any combination of these alternatives. We expect to remain in compliance with all covenants under the 2018 Revolving Credit Facility during the twelve month period following the date of this report based on our current operational and financial projections. However, we can make no assurance of continued compliance if our current projections or material underlying assumptions prove to be incorrect. If we fail to comply with the covenants, the revolving credit commitment could be terminated, and any outstanding borrowings under the facility could be declared immediately due and payable.
The gross2012 Revolving Credit Facility requires us to maintain a net funded debt to capital ratio of 0.60:1 or less. As of December 31, 2019 our net funded debt to capital ratio was 0.59:1. The 2012 Revolving Credit Facility expires in July 2020, or if we fail to comply with the net funded debt to capital covenant, the 2012 Revolving Credit Facility could
be terminated earlier than July 2020. However, at such time as the 2012 Revolving Credit Facility becomes unavailable, we have the ability and intent to refinance the outstanding balance utilizing the 2018 Revolving Credit Facility, which has approximately $1.0 billion of available capacity as of December 31, 2019. The net funded debt to capital ratio, the net debt to capitalleverage ratio and the asset to debt coverage ratio are not measures of operating performance or liquidity defined by U.S. GAAP and may not be comparable to similarly titled measures presented by other companies.
Our interest coverage ratio was 3.3:1 as of December 31, 2018 and 2.4:1 as of December 31, 2017. The interest coverage ratio is a trailing 12-month quotient of the sum of operating revenues, direct costs, general administrative expenses and research and engineering expenses divided by interest expense. The interest coverage ratio is not a measure of operating performance or liquidity defined by U.S. GAAP and may not be comparable to similarly titled measures presented by other companies.
We are a holding company and therefore rely exclusively on repayments of interest and principal on intercompany loans that we have made to our operating subsidiaries and income from dividends and other cash flows from our operating subsidiaries. There can be no assurance that our operating subsidiaries will generate sufficient net income to pay us dividends or sufficient cash flows to make payments of interest and principal to us. See Part I., Item 1A.—Risk Factors—As a holding company, we depend on our operating subsidiaries and investments to meet our financial obligations.
Accounts Receivable Sales Agreement
On September 13, 2019, we entered into a $250.0 million accounts receivable sales agreement (the “A/R Agreement”) whereby certain U.S. operating subsidiaries of the Company (collectively, the “Originators”) sold or contributed, and will on an ongoing basis continue to sell or contribute, certain of its domestic trade accounts receivables to a wholly-owned, bankruptcy-remote, special purpose entity (the “SPE”). The SPE would in turn, sell, transfer, convey and assign to third-party financial institutions (the “Purchasers”), all the rights, title and interest in and to its pool of eligible receivables. The sale of these receivables qualified for sale accounting treatment in accordance with ASC 860.
The amount available for purchase under the A/R Agreement fluctuates over time based on the total amount of eligible receivables generated during the normal course of business after excluding excess concentrations and certain other ineligible receivables. The maximum purchase commitment of the Purchasers under the A/R Agreement is approximately $250.0 million, and the amount of receivables purchased by the Purchasers as of December 31, 2019 was $140.0 million. As of December 31, 2019, the total amount of eligible receivables available for purchase by the Purchasers was $171.7 million. See further details at Note 4 — Accounts Receivable Sale Agreement in Part II, Item 8. —Financial Statements and Supplementary Data.
Future Cash Requirements
Our current cash and investments, projected cash flows from operations, proceeds from equity or debt issuances and our revolving credit facilityfacilities are expected to adequately finance our purchase commitments, capital expenditures, acquisitions, scheduled debt service requirements, and all other expected cash requirements for the next 12 months.
We expect capital expenditures over the next 12 months to be approximately $0.4 billion. Purchase commitments outstanding at December 31, 20182019 totaled approximately $243.3$170.4 million, primarily for rig-related enhancements, new construction and equipment, as well as sustaining capital expenditures, other operating expenses and purchases of inventory. We can reduce planned expenditures if necessary or increase them if market conditions and new business opportunities warrant it. The level of our outstanding purchase commitments and our expected level of capital expenditures over the next 12 months represent a number of capital programs that are currently underway or planned.
We have historically completed a number of acquisitions and will continue to evaluate opportunities to acquire assets or businesses to enhance our operations. Several of our previous acquisitions were funded using existing cash or debt or by issuing our common shares, such as our acquisition of Tesco in December 2017.shares. Future acquisitions may be funded using existing cash or by issuing debt or additional shares of the Company. Such capital expenditures and acquisitions will depend on our view of market conditions and other factors.
On August 25, 2015, our Board authorized a share repurchase program (the “program”) under which we may repurchase, from time to time, up to $400$400.0 million of our common shares by various means, including in the open market or in privately negotiated transactions. Authorization for the program, which was renewed in February 2019, does not have an expiration date and does not obligate us to repurchase any of our common shares. Since establishing the program, we have repurchased 14.0 million of our common shares for an aggregate purchase price of approximately $119.4 million under this program. As of December 31, 2018,2019, the remaining amount authorized under the program that may be used to purchase shares was $280.6 million. The repurchased shares, which are held by our subsidiaries, are
registered and tradable subject to applicable securities law limitations and have the same voting and other rights as other outstanding shares. As of December 31, 2018,2019, our subsidiaries held 52.8 million of our common shares.
On May 23, 2019, our Board authorized a share repurchase program under which we may repurchase, from time to time, up to $10.0 million of our mandatory convertible preferred shares by various means, including in the open market or in privately negotiated transactions. This authorization does not have an expiration date and does not obligate us to repurchase any of our mandatory convertible preferred shares. During the year ended December 31, 2019, we repurchased 136,772 mandatory convertible preferred shares for an aggregate purchase price of approximately $2.9 million.
We may from time to time seek to retire or purchase our outstanding debt through cash purchases and/or exchanges for equity securities, both in open-market purchases, privately negotiated transactions or otherwise. Such repurchases or exchanges, if any, will depend on prevailing market conditions, our liquidity requirements, contractual restrictions and other factors and may involve material amounts.
See our discussion of guarantees issued by Nabors that could have a potential impact on our financial position, results of operations or cash flows in future periods included below under “Off-Balance Sheet Arrangements (Including Guarantees)”.
The following table summarizes our contractual cash obligations as of December 31, 2018:2019:
| | | | | | | | | | | | | | | | |
| | Payments due by Period | |
| | Total | | < 1 Year | | 1-3 Years | | 3-5 Years | | More than 5 years | |
| | (In thousands) | |
Contractual cash obligations: | | | | | | | | | | | | | | | | |
Long-term debt: (1) | | | | | | | | | | | | | | | | |
Principal | | $ | 3,466,944 | | $ | 637,162 | (2) | $ | 634,999 | (3) | $ | 1,413,281 | (4) | $ | 781,502 | (5) |
Interest | | | 517,821 | | | 150,653 | | | 217,379 | | | 127,321 | | | 22,468 | |
Operating leases (6) | | | 58,071 | | | 15,586 | | | 17,443 | | | 7,393 | | | 17,649 | |
Purchase commitments (7) | | | 170,412 | | | 167,393 | | | 2,998 | | | 21 | | | — | |
| | | | | | | | | | | | | | | | |
| | Payments due by Period | |
| | Total | | < 1 Year | | 1-3 Years | | 3-5 Years | | More than 5 years | |
| | (In thousands) | |
Contractual cash obligations: | | | | | | | | | | | | | | | | |
Long-term debt: (1) | | | | | | | | | | | | | | | | |
Principal | | $ | 3,750,291 | | $ | — | | $ | 1,454,270 | (2) | $ | 929,519 | (3) | $ | 1,366,502 | (4) |
Interest | | | 718,684 | | | 167,357 | | | 297,872 | | | 183,032 | | | 70,423 | |
Operating leases (5) | | | 32,955 | | | 10,701 | | | 10,878 | | | 3,894 | | | 7,482 | |
Purchase commitments (6) | | | 243,340 | | | 239,976 | | | 3,364 | | | — | | | — | |
Transportation and processing contracts (5)(7) | | | 2,445 | | | 2,445 | | | — | | | — | | | — | |
The table above excludes liabilities for uncertain tax positions totaling $24.0$25.7 million as of December 31, 20182019 because we are unable to make reasonably reliable estimates of the timing of cash settlements with the respective taxing authorities. Further details on the uncertain tax positions can be found in Note 12—11—Income Taxes in Part II, Item 8.—Financial Statements and Supplementary Data.
| (1) | (1)
| | See Note 11—10—Debt in Part II, Item 8.—Financial Statements and Supplementary Data |
| (2) | (2)
| | Represents the aggregate principal amount of Nabors Delaware’s 5.0%5.00% senior notes due September 2020 and amounts outstanding under our 2012 Revolving Credit Facility due July 2020 and2020. |
| (3) | Represents the aggregate principal amount of Nabors Delaware’s 4.625% senior notes due September 2021. Approximately $379.7 million aggregate principal amount of our 4.625% senior notes were tendered pursuant to the previously announced offer to purchase and consent solicitation during January 2020. |
| (4) | (3)
| | Represents the aggregate principal amount of Nabors Delaware’s 5.50% senior notes due January 2023, and 5.10% senior notes due September 2023. 2023 and 0.75% senior exchangeable notes due January 2024. Approximately $407.7 million aggregate principal amount of our 5.50% senior notes and $165.5 million aggregate principal amount of our 5.10% senior notes were tendered pursuant to the previously announced offer to purchase and consent solicitation during January 2020. |
| (5) | (4)
| | Represents the aggregate principal amount of Nabors Delaware’s 0.75% senior exchangeable notes due January 2024 and 5.75% senior notes due January 2025. |
| (6) | (5)
| | See Note 17—15—Commitments and Contingencies in Part II, Item 8.—Financial Statements and Supplementary Data. |
| (7) | (6)
| | Purchase commitments include agreements to purchase goods or services that are enforceable and legally binding and that specify all significant terms, including fixed or minimum quantities to be purchased; fixed, minimum or variable pricing provisions; and the approximate timing of the transaction. |
| (7)
| | We have contracts with pipeline companies to pay specified fees based on committed volumes for gas transport and processing, as calculated on a monthly basis. See Notes 4—Assets Held for Sale and Discontinued Operations and 17—Commitments and Contingencies in Part II, Item 8.—Financial Statements and Supplementary Data.
|
During the three months ended December 31, 2018,2019, our Board declared a cash dividend of $0.06$0.01 per common share. This quarterly cash dividend was paid on January 3, 20192020 to shareholders of record on December 13, 20182019 in the amount of $21.0$3.6 million. Additionally, during the three months ended December 31, 2018,2019, our Board declared a cash dividend of $0.75 per mandatory convertible preferred share, which was be paid on February 1, 20193, 2020 to shareholders of record at the close of business on January 15, 20192020 in the amount of $4.3 million. During the year ended December 31, 2018,2019, we paid cash dividends totaling $87.1$49.6 million. See Part II, Item 5.—Market Price of and Dividends on the Registrant’s Common Equity, Related Shareholder Matters and Issuer Purchases of Equity—Dividends.
Cash Flows
Our cash flows depend, to a large degree, on the level of spending by oil and gas companies for exploration, development and production activities. Sustained decreases in the price of oil or natural gas could have a material impact on these activities, and could also materially affect our cash flows. Certain sources and uses of cash, such as the level of discretionary capital expenditures or acquisitions, purchases and sales of investments, loans, issuances and repurchases of debt and of our common shares are within our control and are adjusted as necessary based on market conditions. We discuss our 20182019 and 20172018 cash flows below.
Operating Activities. Net cash provided by operating activities totaled $684.6 million during 2019, compared to net cash provided of $325.8 million during 2018, compared to $62.8 million during 2017.2018. Operating cash flows are our primary source of capital and liquidity. The increase in cash flows from operations is primarily attributable to increases in activity and margins.margins in our U.S. Drilling operating segment. Changes in working capital items such as collection of receivables, other deferred revenue arrangements and payments of operating payables are significant factors affecting operating cash flows. Changes in working capital items provided $136.7 million in cash flows during 2019 and used $216.2 million in cash flows during 2018 and $388.0 million in cash flows during 2017.2018.
Investing Activities. Net cash used for investing activities totaled $367.1$355.9 million during 20182019 compared to net cash used of $497.9$367.1 million in 2017.2018. Our primary use of cash for investing activities is for capital expenditures related to rig-related enhancements, new construction and equipment, as well as sustaining capital expenditures. During 20182019 and 2017,2018, we used cash for capital expenditures totaling $458.9$427.7 million and $574.5$458.9 million, respectively.
We received $109.1$60.3 million in proceeds from insurance claims and sales of assets and insurance claims during 20182019 compared to $57.9$109.1 million in 2017.2018. Additionally, we paid $20.9 million, net, for businesses acquired in 2018.
Financing Activities. Net cash used for financing activities totaled $331.6 million during 2019. During 2019, we received net proceeds of $185.0 million in amounts borrowed under our revolving credit facilities, partially offset by a $455.4 million repayment on our senior notes. Additionally, we paid dividends totaling $49.6 million to our common and preferred shareholders.
Net cash provided by financing activities totaled $155.6 million during 2018. In 2018, we received net proceeds of $579.3 million from the issuance of common and mandatory convertible preferred shares and redeemable noncontrolling interest contributions totaling $156.9 million from our joint partner in SANAD. During 2018, we paid dividends totaling $87.1 million to our common and preferred shareholders. Additionally, we received net proceeds of $778.7 million in connection with the issuance of our 5.75% senior notes. This was offset by the repayment of the remaining balances of our 6.15% and 9.25% senior notes totaling $774.8 million, repurchase of $103.5 million of senior notes that matured in 2020 and beyond, and $380.0 million pay down on our 2012 Revolving Credit Facility and commercial paper program.
Net cash provided by financing activities totaled $512.2 million during 2017. During 2017, we received net proceeds of $519.9 million in connection with the issuance of our exchangeable senior unsecured notes and $550.0 million in amounts borrowed under our commercial paper program and revolving credit facility. This was partially offset by the repayment of the remaining balance of our unsecured term loan of $162.5 million and the repurchase or redemption of $381.8 million, reflecting principal and premiums incurred in connection with these repurchases of senior notes due February 2018. Additionally, we paid dividends of $68.5 million and received proceeds of $8.3 million due to stock options exercised and $80.1 million in redeemable noncontrolling interest contributions from our joint venture partner in SANAD.
Off-Balance Sheet Arrangements (Including Guarantees)
We are a party to some transactions, agreements or other contractual arrangements defined as “off-balance sheet arrangements” that could have a material future effect on our financial position, results of operations, liquidity and capital resources. The most significant of these off-balance sheet arrangements involveinclude the A/R Agreement (see —Accounts Receivable Sale Agreement, above) and certain agreements and obligations under which we provide financial
or performance assurance to third parties. Certain of these agreementsfinancial or performance assurances serve as guarantees, including standby letters of credit issued on behalf of insurance carriers in conjunction with our workers’ compensation insurance program and other financial surety instruments such as bonds. In addition, we have provided indemnifications, which serve as guarantees, to some third parties. These guarantees include indemnification provided by Naborsus to our share transfer agent and our insurance carriers. We are not able to estimate the potential future maximum payments that might be due under our indemnification guarantees. Management believes the likelihood that we would be required to perform or otherwise incur any material losses associated with any of these guarantees is remote.
The following table summarizes the total maximum amount of financial guarantees issued by Nabors:
| | | | | | | | | | | | | |
| | Maximum Amount | |
| | 2018 | | 2019 | | 2020 | | Thereafter | | Total | |
| | (In thousands) | |
Financial standby letters of credit and other financial surety instruments | | $ | 25,244 | | 163,285 | | 407 | | — | | $ | 188,936 | |
| | | | | | | | | | | | | |
| | Maximum Amount | |
| | 2020 | | 2021 | | 2022 | | Thereafter | | Total | |
| | (In thousands) | |
Financial standby letters of credit and other financial surety instruments | | $ | 216,053 | | 3,690 | | — | | — | | $ | 219,743 | |
Other Matters
Recent Accounting Pronouncements
See Note 2—Summary of Significant Accounting Policies in Part II, Item 8.—Financial Statements and
Supplementary Data.
Critical Accounting Estimates
The preparation of our financial statements in conformity with U.S. GAAP requires management to make certain estimates and assumptions. These estimates and assumptions affect the reported amounts of assets and liabilities, the disclosures of contingent assets and liabilities at the balance sheet date and the amounts of revenues and expenses recognized during the reporting period. We analyze our estimates based on our historical experience and various other assumptions that we believe to be reasonable under the circumstances. However, actual results could differ from our estimates. The following is a discussion of our critical accounting estimates. Management considers an accounting estimate to be critical if:
| ·
● | | it requires assumptions to be made that were uncertain at the time the estimate was made; and |
| ·
● | | changes in the estimate or different estimates that could have been selected could have a material impact on our consolidated financial position or results of operations. |
For a summary of all of our significant accounting policies, see Note 2—Summary of Significant Accounting Policies in Part II, Item 8.—Financial Statements and Supplementary Data.
Depreciation of Property, Plant and Equipment. The drilling and drilling services industries are very capital intensive. Property, plant and equipment represented 70%73% of our total assets as of December 31, 2018,2019, and depreciation and amortization constituted 24% of our total costs and other deductions in 2018.2019.
Depreciation for our primary operating assets, drilling rigs, is calculated based on the units-of-production method. For each day a rig is operating, we depreciate it over an approximate 4,927-day period, with the exception of our jackup rigs which are depreciated over an 8,030-day period, after provision for salvage value. For each day a rig asset is not operating, it is depreciated over an assumed depreciable life of 20 years, with the exception of our jackup rigs, where a 30-year depreciable life is typically used, after provision for salvage value.
Depreciation on our buildings, oilfield hauling and mobile equipment, aircraft equipment, and other machinery and equipment is computed using the straight-line method over the estimated useful life of the asset after provision for salvage value (buildings—10 to 30 years; aircraft equipment—5 to 20 years; oilfield hauling and mobile equipment and other machinery and equipment—3 to 10 years).
These depreciation periods and the salvage values of our property, plant and equipment were determined through an analysis of the useful lives of our assets and based on our experience with the salvage values of these assets.
Periodically, we review our depreciation periods and salvage values for reasonableness given current conditions. Depreciation of property, plant and equipment is therefore based upon estimates of the useful lives and salvage value of those assets. Estimation of these items requires significant management judgment. Accordingly, management believes that accounting estimates related to depreciation expense recorded on property, plant and equipment are critical.
There have been no factors related to the performance of our portfolio of assets, changes in technology or other factors indicating that these estimates do not continue to be appropriate. Accordingly, for the years ended December 31,
2019, 2018 2017 and 2016,2017, no significant changes have been made to the depreciation rates applied to property, plant and equipment, the underlying assumptions related to estimates of depreciation, or the methodology applied. However, certain events could occur that would materially affect our estimates and assumptions related to depreciation. Unforeseen changes in operations or technology could substantially alter management’s assumptions regarding our ability to realize the return on our investment in operating assets and therefore affect the useful lives and salvage values of our assets.
Impairment of Long-Lived Assets. As discussed above, the drilling and drilling services industries are very capital intensive. We review our assets for impairment when events or changes in circumstances indicate that their carrying amounts may not be recoverable. If the estimated undiscounted future cash flows are not sufficient to support the asset’s recorded value, an impairment charge is recognized to the extent the carrying amount of the long-lived asset exceeds its estimated fair value. Management considers a number of factors such as estimated future cash flows from the assets, appraisals and current market value analysis in determining fair value. The determination of future cash flows requires the estimation of utilization, dayrates, operating margins, sustaining capital and remaining economic life. Such estimates can change based on market conditions, technological advances in the industry or changes in regulations governing the industry. Significant and unanticipated changes to the assumptions could result in future impairments. A significantly prolonged period of lower oil and natural gas prices could continue to adversely affect the demand for and prices of our services, which could result in future impairment charges. As the determination of whether impairment charges should be recorded on our long-lived assets is subject to significant management judgment, and an impairment of these assets could result in a material charge on our consolidated statements of income (loss), management believes that accounting estimates related to impairment of long-lived assets are critical.
Assumptions in the determination of future cash flows are made with the involvement of management personnel at the operational level where the most specific knowledge of market conditions and other operating factors exists. For 2019, 2018 2017 and 2016,2017, no significant changes have been made to the methodology utilized to determine future cash flows.
For an asset classified as held for sale, we consider the asset impaired when its carrying amount exceeds fair value less its cost to sell. Fair value is determined in the same manner as a long-lived asset that is held and used.
Impairment of Goodwill and Intangible Assets. We review goodwill and intangible assets with indefinite lives for impairment annually during the second quarter of each fiscal year or more frequently if events or changes in circumstances indicate that the carrying amount of such goodwill and intangible assets may exceed their fair value. We perform our impairment tests for goodwill for all of our reporting units within our reportable segments. Our business consists of U.S. Drilling, Canada Drilling, International Drilling, Drilling Solutions and Rig Technologies reportable segments. Our Rig Technologies reportable segment includes our Canrig, RDS and 2TD reporting units. We initially assess goodwill for impairment based on qualitative factors to determine whether the existence of events or circumstances leads to a determination that it is more likely than not that the fair value of one of our reporting units is greater than its carrying amount. If the carrying amount exceeds the fair value, an impairment charge will be recognized in an amount equal to the excess; however, the loss recognized should not exceed the total amount of goodwill allocated to that reporting unit.
DuringAs part of our annual goodwill impairment test performed during the second quarter of 2018,2019, we determined the carrying value of some of our reporting units exceeded their fair value. As such, we recognized an impairment of $75.6 million for the remaining goodwill balance attributable to our International Drilling operating segment and $18.0 million for a partial impairment to our goodwill balance related to the acquisition of 2TD in 2014, reported within our Rig Technologies operating segment. These non-cash pre-tax impairment charges were primarily the result of a sustained decline in our market capitalization and lower future cash flow projections due to expectations for future commodity prices and the resulting impact on the demand for our products and services within these reporting units.
During the fourth quarter of 2019, due to current industry conditions such as the drop in U.S. rig count as well as the recent commodity prices and the corresponding impact on future expectations of demand for our products and services, including the effect that these factors have had on our stock price, we performed a qualitativequantitative impairment assessment and determined it was necessary to perform a quantitative analysis due to utilization of our assets remaining below 50%.goodwill as of December 31, 2019. Based on the results of our quantitative analysis,goodwill test, we notedrecognized additional impairment charges of $52.2 million for the fair values ofremaining goodwill balance attributable to our reporting units with goodwill were in excess of their carrying values. Our U.S. Drilling reportableoperating segment consistsand $10.1 million for the remaining goodwill balance attributable to the acquisition of three reporting units: Offshore (no Goodwill), Alaska and Lower 48. Our Alaska reporting unit had a cushion (amount by which fair value exceeded carrying value) of 19% and our Lower 48 reporting unit had a cushion of 6%. Our International Drilling reporting unit had a cushion of 10% and2TD within our Rig Technologies reportable segment, which consists of three reporting units: Canrig, RDS and 2TD each with goodwill and cushions of 12%, 14% and 6%, respectively. Our fair value estimates of these reporting units are sensitive to varying dayrates, utilization and costs. Therefore, a significantly prolonged period of lower oil and natural gas prices or changes in laws and regulations could adversely affect the demand for and prices of our services, which could in turn result in future goodwill impairment charges for these reporting units due to the potential impact on our estimate of our future operating results.segment.
Our estimated fair values of our reporting units incorporate judgment and the use of estimates by management. The fair values calculated in these impairment tests were determined using discounted cash flow models, involving
significant unobservable inputs, representative of a Level 3 fair value measurement. Our cash flow models involve assumptions based on our utilization of rigs or other oil and gas service equipment, revenues and earnings from affiliates, as well as direct costs, general and administrative costs, depreciation, applicable income taxes, capital expenditures and working capital requirements. Our fair value estimates of these reporting units are sensitive to varying dayrates, utilization and costs. A significantly prolonged period of lower oil and natural gas prices, other than those assumed in developing our forecasts, or changes in laws and regulations could adversely affect the demand for and prices of our services, which could in turn result in future goodwill and other intangible asset impairment charges for these reporting units due to the potential impact on our estimate of our future operating results. Our discounted cash flow projections for each reporting unit were based on financial forecasts. The future cash flows were discounted to present value using discount rates determined to be appropriate for each reporting unit. Terminal values for each reporting unit were calculated using a Gordon Growth methodology with a long termlong-term growth rate of 3%approximately 2%. We believe the fair value estimated for purposes of these tests represent a Level 3 fair value measurement.
During year end 2018 we updated our assessment of each reporting unit with goodwill in accordance with ASC 350. In evaluating whether it was more likely than not that the fair value of the reporting units were less than carry value we addressed each of the relevant events and circumstances set forth in ASC 350-20-35-3C.
Another factor in determining whether impairment has occurred is the relationship between our market capitalization and our consolidated book value of equity.value. As part of our annual review, we compared the sum of our reporting units’ estimated fair value, which included the estimated fair value of non-operating assets and liabilities, less debt, to our market capitalization and assessed the reasonableness of our estimated fair value. Any of the above mentionedabove-mentioned factors may cause us to re-evaluate goodwill during any quarter throughout the year. Management acknowledges the decline in market capitalization during December 2018, whereby our stock price declined significantly along with the overall oilfield drilling and services industries as oil prices fell dramatically. Within the last few weeks of the year, the dip in the oil prices erased the full year of increases. Subsequently, in January 2019, oil prices rebounded and our stock price has increased by approximately 48%. We evaluated the potential impact this decline may have had on our estimated fair values of our reporting units as of December 31, 2018 and determined that the extreme volatility in our stock price (and that of our peers) and this short-term weakness in commodity prices, which are expected to only marginally impact the first half of 2019, do not materially impact the medium-term and long-term projections of our cash flow generation and, accordingly, our estimates of the fair value of our reporting units. Our customers capital decisions and consequently the demand for our services are not materially impacted by short-term price fluctuations in oil. However, any long-term decline in oil prices could result in future goodwill impairment charges.
Income Taxes. We operate in a number of countries and our tax returns filed in those jurisdictions are subject to review and examination by tax authorities within those jurisdictions. We are currently contesting tax assessments in a number of countries and may contest future assessments. We believe the ultimate resolution of the outstanding assessments, for which we have not made any accrual, will not have a material adverse effect on our consolidated financial statements. We recognize uncertain tax positions that we believe have a greater than 50 percent likelihood of being sustained. We cannot predict or provide assurance as to the ultimate outcome of any existing or future assessments.
Audit claims of approximately $253.0$18.6 million attributable to income customs and other business taxestax have been assessed against us. We have contested, or intend to contest, these assessments, including through litigation if necessary, and we believe the ultimate resolution, for which we have not made any accrual, will not have a material adverse effect on our consolidated financial statements. Tax authorities may issue additional assessments or pursue legal actions as a result of tax audits and we cannot predict or provide assurance as to the ultimate outcome of such assessments and legal actions.
Applicable income and withholding taxes have not been provided on undistributed earnings of our subsidiaries. We do not intend to repatriate such undistributed earnings except for distributions upon which incremental income and withholding taxes would not be material.
In certain jurisdictions we have recognized deferred tax assets and liabilities. Judgment and assumptions are required in determining whether deferred tax assets will be fully or partially utilized. When we estimate that all or some portion of certain deferred tax assets such as net operating loss carryforwards will not be utilized, we establish a valuation allowance for the amount ascertained to be unrealizable. We continually evaluate strategies that could allow for future utilization of our deferred assets. Any change in the ability to utilize such deferred assets will be accounted for in the period of the event affecting the valuation allowance. If facts and circumstances cause us to change our expectations regarding future tax consequences, the resulting adjustments could have a material effect on our financial results or cash flow. Management has continued to assess the Company’s ability to more likely than not realize deferred tax assets associated with its Canada Drilling operations and concluded during the fourth quarter of 2018 that the pace of market recovery did not support realization at this time. Accordingly, a non-cash tax expense of $52 million was recorded to reflect the valuation allowance.
Litigation and Self-Insurance Reserves. Our operations are subject to many hazards inherent in the drilling and drilling services industries, including blowouts, cratering, explosions, fires, loss of well control, loss of or damage to the wellbore or underground reservoir, damaged or lost drilling equipment and damage or loss from inclement weather
or natural disasters. Any of these and other hazards could result in personal injury or death, damage to or destruction of equipment and facilities, suspension of operations, environmental and natural resources damage and damage to the property of others. Our offshore operations are also subject to the hazards of marine operations including capsizing, grounding, collision and other damage from hurricanes and heavy weather or sea conditions and unsound ocean bottom conditions. Our operations are subject to risks of war or acts of terrorism, civil disturbances and other political events.
Accidents may occur, we may be unable to obtain desired contractual indemnities, and our insurance may prove inadequate in certain cases. There is no assurance that our insurance or indemnification agreements will adequately protect us against liability from all of the consequences of the hazards described above. Moreover, our insurance coverage generally provides that we assume a portion of the risk in the form of a deductible or self-insured retention.
Based on the risks discussed above, it is necessary for us to estimate the level of our liability related to insurance and record reserves for these amounts in our consolidated financial statements. Reserves related to self-insurance are based on the facts and circumstances specific to the claims and our past experience with similar claims. The actual outcome of self-insured claims could differ significantly from estimated amounts. We maintain actuarially determined accruals in our consolidated balance sheets to cover self-insurance retentions for workers’ compensation, employers’ liability, general liability and automobile liability claims. These accruals are based on certain assumptions developed utilizing historical data to project future losses. Loss estimates in the calculation of these accruals are adjusted based upon actual claim settlements and reported claims. These loss estimates and accruals recorded in our financial statements for claims have historically been reasonable in light of the actual amount of claims paid.
Because the determination of our liability for self-insured claims is subject to significant management judgment and in certain instances is based on actuarially estimated and calculated amounts, and because such liabilities could be material in nature, management believes that accounting estimates related to self-insurance reserves are critical.
During 2019, 2018 2017 and 2016,2017, no significant changes were made to the methodology used to estimate insurance reserves. For purposes of earnings sensitivity analysis, if the December 31, 20182019 reserves were adjusted by 10%, total costs and other deductions would change by $14.3$14.5 million, or .40%.39%.
ITEM 7A. QUANTITATIVE AND QUALITATIVE DISCLOSURES
We may be exposed to certain market risks arising from the use of financial instruments in the ordinary course of business. This risk arises primarily as a result of potential changes in the fair market value of financial instruments due to adverse fluctuations in foreign currency exchange rates, credit risk, interest rates, and marketable and non-marketable security prices as discussed below.
Foreign Currency Risk. We operate in a number of international areas and are involved in transactions denominated in currencies other than U.S. dollars, which exposes us to foreign exchange rate risk and foreign currency devaluation risk. The most significant exposures arise in connection with our operations in Argentina and Canada, which usually are substantially unhedged.
At various times, we utilize local currency borrowings (foreign-currency- denominated debt), the payment structure of customer contracts and foreign exchange contracts to selectively hedge our exposure to exchange rate fluctuations in connection with monetary assets, liabilities, cash flows and commitments denominated in certain foreign currencies. A foreign exchange contract is a foreign currency transaction, defined as an agreement to exchange different currencies at a given future date and at a specified rate. A hypothetical 10% increase in the value of all our foreign currencies relative to the U.S. dollar as of December 31, 20182019 would result in an $8.2a $10.8 million increase in the fair value of our net monetary liabilities denominated in currencies other than U.S. dollars.
Credit Risk. Our financial instruments that potentially subject us to concentrations of credit risk consist primarily of cash equivalents, short-term and long-term investments and accounts receivable. Cash equivalents such as deposits and temporary cash investments are held by major banks or investment firms. Our short-term and long-term investments are managed within established guidelines that limit the amounts that may be invested with any one issuer and provide guidance as to issuer credit quality. We believe that the credit risk in our cash and investment portfolio is
minimized as a result of the mix of our investments. In addition, our trade receivables are with a variety of U.S., international and foreign-country national oil and gas companies. Management considers this credit risk to be limited due to the financial resources of these companies. We perform ongoing credit evaluations of our customers, and we generally do not require material collateral. We do occasionally require prepayment of amounts from customers whose
creditworthiness is in question prior to providing services to them. We maintain reserves for potential credit losses, and these losses historically have been within management’s expectations.
Interest Rate and Marketable and Non-marketable Security Price Risk. Our financial instruments that are potentially sensitive to changes in interest rates include our floating rate debt instruments (our revolving credit facilities), our fixed rate debt securities comprised of our 5.0%, 4.625%, 5.50%, 5.10% and 5.75% senior notes, our 0.75% senior exchangeable notes, our investments in debt securities (including corporate and mortgage-CMO debt securities) and our investments in overseas funds that invest primarily in a variety of public and private U.S. and non-U.S. securities (including asset-backed and mortgage-backed securities, global structured-asset securitizations, whole-loan mortgages and participations in whole loans and whole-loan mortgages), which are classified as long-term investments.
We may utilize derivative financial instruments that are intended to manage our exposure to interest rate risks. We account for derivative financial instruments under the Derivatives Topic of the ASC. The use of derivative financial instruments could expose us to further credit risk and market risk. Credit risk in this context is the failure of a counterparty to perform under the terms of the derivative contract. When the fair value of a derivative contract is positive, the counterparty would owe us, which can create credit risk for us. When the fair value of a derivative contract is negative, we would owe the counterparty, and therefore, we would not be exposed to credit risk. We attempt to minimize credit risk in derivative instruments by entering into transactions with major financial institutions that have a significant asset base. Market risk related to derivatives is the adverse effect on the value of a financial instrument that results from changes in interest rates. We try to manage market risk associated with interest-rate contracts by establishing and monitoring parameters that limit the type and degree of market risk that we undertake.
Fair Value of Financial Instruments. The fair value of our fixed rate long-term debt and revolving credit facilities is estimated based on quoted market prices or prices quoted from third-party financial institutions. The carrying and fair values of these liabilities were as follows:
| | | | | | | | | | | | | | | | | |
| | As of December 31, | |
| | | | | 2018 | | | | | | | | 2017 | | |
| | Effective | | | | | | | | Effective | | | | | | | |
| | Interest | | Carrying | | Fair | | Interest | | Carrying | | Fair | |
| | Rate | | Value | | Value | | Rate | | Value | | Value | |
| | | | (In thousands) | | | | (In thousands) | |
6.15% senior notes due February 2018 | | — | % | $ | — | | $ | — | | 6.27 | % | $ | 460,762 | | $ | 462,674 | |
9.25% senior notes due January 2019 | | — | % | | — | | | — | | 9.77 | % | | 303,489 | | | 321,028 | |
| | | | | | | | | | | | | | | | | |
| | | As of December 31, |
| | | 2019 | | 2018 |
| | | Interest | | Carrying | | Fair | | Interest | | Carrying | | Fair |
| | | Rate | | Value | | Value | | Rate | | Value | | Value |
| | | (In thousands) |
5.00% senior notes due September 2020 | | 5.25 | % | | 614,748 | | | 590,336 | | 5.43 | % | | 669,846 | | | 670,757 | | 5.44 | % | $ | 282,046 | | $ | 284,907 | | 5.25 | % | $ | 614,748 | | $ | 590,336 |
4.625% senior notes due September 2021 | | 4.75 | % | | 668,347 | | | 603,457 | | 4.76 | % | | 695,108 | | | 665,003 | | 4.76 | % | | 634,588 | | | 632,516 | | 4.75 | % | | 668,347 | | | 603,457 |
5.50% senior notes due January 2023 | | 5.84 | % | | 586,000 | | | 465,999 | | 5.85 | % | | 600,000 | | | 584,850 | | 5.90 | % | | 501,003 | | | 483,834 | | 5.84 | % | | 586,000 | | | 465,999 |
5.10% senior notes due September 2023 | | 5.26 | % | | 342,923 | | | 262,494 | | 5.28 | % | | 346,576 | | | 325,844 | | 5.24 | % | | 336,810 | | | 303,860 | | 5.26 | % | | 342,923 | | | 262,494 |
0.75% senior exchangeable notes due January 2024 | | 6.04 | % | | 450,689 | | | 358,012 | | 5.90 | % | | 429,982 | | | 443,940 | | 5.97 | % | | 472,603 | | | 431,503 | | 6.04 | % | | 450,689 | | | 358,012 |
5.75% senior notes due February 2025 | | 5.87 | % | | 791,502 | | | 598,953 | | — | % | | — | | | — | | 6.01 | % | | 781,502 | | | 705,040 | | 5.87 | % | | 791,502 | | | 598,953 |
2012 Revolving credit facility | | 3.58 | % | | 170,000 | | | 170,000 | | 2.73 | % | | 510,000 | | | 510,000 | | 3.71 | % | | 355,000 | | | 355,000 | | 3.58 | % | | 170,000 | | | 170,000 |
2018 Revolving credit facility | | — | % | | — | | | — | | — | % | | — | | | — | | — | % | | — | | | — | | — | % | | — | | | — |
Commercial paper | | — | % | | — | | | — | | 1.87 | % | | 40,000 | | | 40,000 | |
Other | | — | % | | 561 | | | 561 | | — | % | | 181 | | | 181 | | — | % | | — | | | — | | — | % | | 561 | | | 561 |
| | | | | 3,624,770 | | $ | 3,049,812 | | | | | 4,055,944 | | $ | 4,024,277 | |
| | | | | | 3,363,552 | | $ | 3,196,661 | | | | | 3,624,770 | | $ | 3,049,812 |
Less: current portion | | | | | 561 | | | | | | | | 181 | | | | | | | | — | | | | | | | | 561 | | | |
Less: deferred financing costs | | | | | 38,325 | | | | | | | | 27,997 | | | | | | | | 30,332 | | | | | | | | 38,325 | | | |
| | | | $ | 3,585,884 | | | | | | | $ | 4,027,766 | | | | |
| | | | | $ | 3,333,220 | | | | | | | $ | 3,585,884 | | | |
The fair values of our cash equivalents, trade receivables and trade payables approximate their carrying values due to the short-term nature of these instruments. Our cash, cash equivalents, short-term and long-term investments and other receivables as of December 31, 2019 and 2018 were carried at fair market value and 2017 are included in the table below:totaled $16.5 million and $34.0 million, respectfully.
| | | | | | | | | | | | | | | |
| | December 31, | |
| | 2018 | | 2017 | |
| | | | | | | Weighted- | | | | | | | Weighted- | |
| | | | | | | Average | | | | | | | Average | |
| | Fair | | Interest | | Life | | Fair | | Interest | | Life | |
| | Value | | Rates | | (Years) | | Value | | Rates | | (Years) | |
| | (In thousands, except rates) | |
Cash and cash equivalents | | $ | 447,766 | | 1.43 - 2.58 | % | — | | $ | 336,997 | | 0.49 - 1.50 | % | — | |
Short-term investments | | | 34,036 | | N/A | | | | | 28,369 | | N/A | | | |
Long-term investments | | | 5,782 | | N/A | | | | | 7,835 | | N/A | | | |
Total cash, cash equivalents, short-term and long-term investments | | $ | 487,584 | | | | | | $ | 373,201 | | | | | |
Our investments in debt securities listed in the above table and a portion of our long-term investments are sensitive to changes in interest rates. Additionally, our investment portfolio of debt and equity securities, which are carried at fair value, exposes us to price risk. A hypothetical 10% decrease in the market prices for all securities as of December 31, 20182019 would decrease the fair value of our marketable securities by $3.4$1.7 million.
ITEM 8. FINANCIAL STATEMENTS AND SUPPLEMENTARY DATA
INDEX
Report of Independent Registered Public Accounting Firm
To the Board of Directors and Shareholders of Nabors Industries Ltd.
Opinions on the Financial Statements and Internal Control over Financial Reporting
We have audited the accompanying consolidated balance sheets of Nabors Industries Ltd. and its subsidiaries (the “Company”) as of December 31, 20182019 and 20172018, and the related consolidated statements of income (loss), of comprehensive income (loss), of changes in equity and of cash flows for each of the three years in the period ended December 31, 2018,2019, including the related notes and financial statement schedule listed in the index appearing under Item 15 (a)15(a)(2) (collectively referred to as the “consolidated financial statements”). We also have audited the Company's internal control over financial reporting as of December 31, 2018,2019, based on criteria established in Internal Control - Integrated Framework (2013) issued by the Committee of Sponsoring Organizations of the Treadway Commission (COSO).
In our opinion, the consolidated financial statements referred to above present fairly, in all material respects, the financial position of the Company as of December 31, 20182019 and 2017,2018, and the results of its operations and its cash flows for each of the three years in the period ended December 31, 20182019 in conformity with accounting principles generally accepted in the United States of America. Also in our opinion, the Company maintained, in all material respects, effective internal control over financial reporting as of December 31, 2018,2019, based on criteria established in Internal Control - Integrated Framework (2013) issued by the COSO.
Change in Accounting Principle
As discussed in Note 21 to the consolidated financial statements, the Company has changed its method for accounting for leases in 2019 due to the adoption of ASU No. 2016-02, Leases (Topic 842).
Basis for Opinions
The Company's management is responsible for these consolidated financial statements, for maintaining effective internal control over financial reporting, and for its assessment of the effectiveness of internal control over financial reporting, included in the accompanying Management'sManagement’s Report on Internal Control over Financial Reporting appearing under Item 9A. Our responsibility is to express opinions on the Company’s consolidated financial statements and on the Company's internal control over financial reporting based on our audits. We are a public accounting firm registered with the Public Company Accounting Oversight Board (United States) (PCAOB) and are required to be independent with respect to the Company in accordance with the U.S. federal securities laws and the applicable rules and regulations of the Securities and Exchange Commission and the PCAOB.
We conducted our audits in accordance with the standards of the PCAOB. Those standards require that we plan and perform the audits to obtain reasonable assurance about whether the consolidated financial statements are free of material misstatement, whether due to error or fraud, and whether effective internal control over financial reporting was maintained in all material respects.
Our audits of the consolidated financial statements included performing procedures to assess the risks of material misstatement of the consolidated financial statements, whether due to error or fraud, and performing procedures that respond to those risks. Such procedures included examining, on a test basis, evidence regarding the amounts and disclosures in the consolidated financial statements. Our audits also included evaluating the accounting principles used and significant estimates made by management, as well as evaluating the overall presentation of the consolidated financial statements. Our audit of internal control over financial reporting included obtaining an understanding of internal control over financial reporting, assessing the risk that a material weakness exists, and testing and evaluating the design and operating effectiveness of internal control based on the assessed risk. Our audits also included performing such other procedures as we considered necessary in the circumstances. We believe that our audits provide a reasonable basis for our opinions.
Definition and Limitations of Internal Control over Financial Reporting
A company’s internal control over financial reporting is a process designed to provide reasonable assurance regarding the reliability of financial reporting and the preparation of financial statements for external purposes in accordance with generally accepted accounting principles. A company’s internal control over financial reporting includes those policies and procedures that (i) pertain to the maintenance of records that, in reasonable detail, accurately and fairly reflect the transactions and dispositions of the assets of the company; (ii) provide reasonable assurance that transactions are recorded as necessary to permit preparation of financial statements in accordance with generally accepted accounting principles, and that receipts and expenditures of the company are being made only in accordance with authorizations of management and directors of the company; and (iii) provide reasonable assurance regarding prevention or timely detection of unauthorized acquisition, use, or disposition of the company’s assets that could have a material effect on the financial statements.
Because of its inherent limitations, internal control over financial reporting may not prevent or detect misstatements. Also, projections of any evaluation of effectiveness to future periods are subject to the risk that controls may become inadequate because of changes in conditions, or that the degree of compliance with the policies or procedures may deteriorate.
Critical Audit Matters
The critical audit matter communicated below is a matter arising from the current period audit of the consolidated financial statements that was communicated or required to be communicated to the audit committee and that (i) relates to accounts or disclosures that are material to the consolidated financial statements and (ii) involved our especially challenging, subjective, or complex judgments. The communication of critical audit matters does not alter in any way our opinion on the consolidated financial statements, taken as a whole, and we are not, by communicating the critical audit matter below, providing a separate opinion on the critical audit matter or on the accounts or disclosures to which it relates.
Impairment of Goodwill for Certain Reporting Units within the U.S. and International Drilling Segments
As described in Note 2 to the consolidated financial statements, the Company had a consolidated goodwill balance of $28.4 million as of December 31, 2019. During the year ended December 31, 2019, the Company recorded consolidated impairment losses of $156.0 million for goodwill for certain reporting units including $52.2 million and $75.6 million in the U.S. and International Drilling segments, respectively. Management reviews goodwill for impairment annually during the second quarter of each fiscal year or more frequently if events or changes in circumstances indicate that the carrying amount of such goodwill may exceed their fair value. Management initially assesses goodwill for impairment based on qualitative factors to determine whether the existence of events or circumstances leads to a determination that it is more likely than not that the fair value of one or more of its reporting units is greater than its carrying amount. If the carrying amount exceeds the fair value, an impairment charge will be recognized in an amount equal to the excess; however, the loss recognized should not exceed the total amount of goodwill allocated to that reporting unit. The fair values calculated in these impairment tests were determined using discounted cash flow models which require the use of significant unobservable inputs, representative of a Level 3 fair value measurement. The cash flow models involve assumptions, that vary by reporting unit, and include the Company’s utilization of rigs or other oil and gas service equipment, revenues and earnings from affiliates, as well as direct costs, general and administrative costs, depreciation, applicable income taxes, capital expenditures and working capital requirements. As disclosed by management, the fair value estimates of these reporting units are sensitive to varying dayrates, utilization and costs. The future cash flows were discounted to present value using discount rates determined to be appropriate for each reporting unit. Terminal values for each reporting unit were calculated using a Gordon Growth methodology with a long-term growth rate of 2%.
The principal considerations for our determination that performing procedures relating to the impairment of goodwill for certain reporting units within the U.S. and International Drilling segments is a critical audit matter are there was significant judgment by management when developing the fair value for certain reporting units. This in turn led to a high degree of auditor judgment, subjectivity and effort in performing procedures and evaluating audit evidence relating to the cash flow models and significant assumptions, which vary by reporting unit for the related impairment assessments, including utilization of rigs, dayrates, applicable income taxes, capital expenditures, long term growth rates and discount rates. In addition, the audit effort involved the use of professionals with specialized skill and knowledge to assist in performing these procedures and in evaluating the audit evidence obtained.
Addressing the matter involved performing procedures and evaluating audit evidence in connection with forming our overall opinion on the consolidated financial statements. These procedures included testing the effectiveness of controls relating to management’s impairment assessment of goodwill for certain reporting units, including controls over the fair value estimates. These procedures also included, among others, testing management’s process for developing the fair value estimates; evaluating the appropriateness of the discounted cash flow models; testing the completeness, accuracy, and relevance of underlying data used in the models; and evaluating the significant assumptions used by management, which vary by reporting unit, including utilization of rigs, dayrates, applicable income taxes, capital expenditures, long term growth rates and discount rates. Evaluating management’s assumptions involved evaluating whether the assumptions used by management were reasonable considering (i) the current and past performance of the reporting units, (ii) the consistency with external market and industry data, and (iii) whether these assumptions were consistent with evidence obtained in other areas of the audit. Professionals with specialized skill and knowledge were used to assist in the evaluation of the Company’s discounted cash flow models and certain significant assumptions, including discount rates.
|
/s/ PricewaterhouseCoopers LLP |
���
Houston, Texas
February 28, 201925, 2020
We have served as the Company’s auditor since 1987.
NABORS INDUSTRIES LTD. AND SUBSIDIARIES
CONSOLIDATED BALANCE SHEETS
| | | | | | | |
| | December 31, | |
| | 2018 | | 2017 | |
| | (In thousands, except per | |
| | share amounts) | |
ASSETS | | | | | | | |
Current assets: | | | | | | | |
Cash and cash equivalents | | $ | 447,766 | | $ | 336,997 | |
Short-term investments | | | 34,036 | | | 28,369 | |
Accounts receivable, net | | | 756,320 | | | 698,477 | |
Inventory, net | | | 165,587 | | | 166,307 | |
Assets held for sale | | | 12,250 | | | 37,052 | |
Other current assets | | | 177,604 | | | 180,134 | |
Total current assets | | | 1,593,563 | | | 1,447,336 | |
Property, plant and equipment, net | | | 5,467,870 | | | 6,109,565 | |
Goodwill | | | 183,914 | | | 173,226 | |
Deferred income taxes | | | 345,091 | | | 419,003 | |
Other long-term assets | | | 263,506 | | | 252,854 | |
Total assets (1) | | $ | 7,853,944 | | $ | 8,401,984 | |
LIABILITIES AND EQUITY | | | | | | | |
Current liabilities: | | | | | | | |
Current portion of debt | | $ | 561 | | $ | 181 | |
Trade accounts payable | | | 392,843 | | | 363,416 | |
Accrued liabilities | | | 417,912 | | | 533,044 | |
Income taxes payable | | | 20,761 | | | 22,835 | |
Total current liabilities | | | 832,077 | | | 919,476 | |
Long-term debt | | | 3,585,884 | | | 4,027,766 | |
Other long-term liabilities | | | 274,485 | | | 301,633 | |
Deferred income taxes | | | 6,311 | | | 10,338 | |
Total liabilities (1) | | | 4,698,757 | | | 5,259,213 | |
Commitments and contingencies (Note 17) | | | | | | | |
Redeemable noncontrolling interest in subsidiary (Note 14) | | | 404,861 | | | 203,998 | |
Equity: | | | | | | | |
Shareholders’ equity: | | | | | | | |
Preferred shares, par value $0.001 per share: | | | | | | | |
Series A 6% Cumulative Mandatory Convertible; $50 per share liquidation preference; issued 5,750 | | | 6 | | | — | |
Common shares, par value $0.001 per share: | | | | | | | |
Authorized common shares 800,000; issued 409,652 and 367,510, respectively | | | 410 | | | 368 | |
Capital in excess of par value | | | 3,392,937 | | | 2,791,129 | |
Accumulated other comprehensive income (loss) | | | (29,325) | | | 11,185 | |
Retained earnings | | | 650,842 | | | 1,423,154 | |
Less: treasury shares, at cost, 52,800 and 52,800 common shares, respectively | | | (1,314,020) | | | (1,314,020) | |
Total shareholders’ equity | | | 2,700,850 | | | 2,911,816 | |
Noncontrolling interest | | | 49,476 | | | 26,957 | |
Total equity | | | 2,750,326 | | | 2,938,773 | |
Total liabilities and equity | | $ | 7,853,944 | | $ | 8,401,984 | |
| | | | | | | |
| | December 31, | |
| | 2019 | | 2018 | |
| | (In thousands, except per | |
| | share amounts) | |
ASSETS | | | | | | | |
Current assets: | | | | | | | |
Cash and cash equivalents | | $ | 435,990 | | $ | 447,766 | |
Short-term investments | | | 16,506 | | | 34,036 | |
Accounts receivable, net | | | 453,042 | | | 756,320 | |
Inventory, net | | | 176,341 | | | 165,587 | |
Assets held for sale | | | 2,530 | | | 12,250 | |
Other current assets | | | 164,257 | | | 177,604 | |
Total current assets | | | 1,248,666 | | | 1,593,563 | |
Property, plant and equipment, net | | | 4,930,549 | | | 5,467,870 | |
Goodwill | | | 28,380 | | | 183,914 | |
Deferred income taxes | | | 305,844 | | | 345,091 | |
Other long-term assets | | | 247,219 | | | 263,506 | |
Total assets (1) | | $ | 6,760,658 | | $ | 7,853,944 | |
LIABILITIES AND EQUITY | | | | | | | |
Current liabilities: | | | | | | | |
Current portion of debt | | $ | — | | $ | 561 | |
Trade accounts payable | | | 295,159 | | | 392,843 | |
Accrued liabilities | | | 333,282 | | | 417,912 | |
Income taxes payable | | | 14,628 | | | 20,761 | |
Current lease liabilities | | | 13,479 | | | — | |
Total current liabilities | | | 656,548 | | | 832,077 | |
Long-term debt | | | 3,333,220 | | | 3,585,884 | |
Other long-term liabilities | | | 292,184 | | | 274,485 | |
Deferred income taxes | | | 3,149 | | | 6,311 | |
Total liabilities (1) | | | 4,285,101 | | | 4,698,757 | |
Commitments and contingencies (Note 15) | | | | | | | |
Redeemable noncontrolling interest in subsidiary (Note 13) | | | 425,392 | | | 404,861 | |
| | | | | | | |
Shareholders’ equity: | | | | | | | |
Preferred shares, par value $0.001 per share: | | | | | | | |
Series A 6% Cumulative Mandatory Convertible; $50 per share liquidation preference; issued 5,613 and 5,750, respectively | | | 6 | | | 6 | |
Common shares, par value $0.001 per share: | | | | | | | |
Authorized common shares 800,000; issued 416,198 and 409,652, respectively | | | 416 | | | 410 | |
Capital in excess of par value | | | 3,412,972 | | | 3,392,937 | |
Accumulated other comprehensive income (loss) | | | (11,788) | | | (29,325) | |
Retained earnings (accumulated deficit) | | | (104,775) | | | 650,842 | |
Less: treasury shares, at cost, 52,800 and 52,800 common shares, respectively | | | (1,314,020) | | | (1,314,020) | |
Total shareholders’ equity | | | 1,982,811 | | | 2,700,850 | |
Noncontrolling interest | | | 67,354 | | | 49,476 | |
Total equity | | | 2,050,165 | | | 2,750,326 | |
Total liabilities and equity | | $ | 6,760,658 | | $ | 7,853,944 | |
_____________________________
| (1) | | The consolidated balance sheets include assets and liabilities of consolidated joint ventures. See Note 14—13—Joint Ventures for additional information. |
The accompanying notes are an integral part of these consolidated financial statements.
NABORS INDUSTRIES LTD. AND SUBSIDIARIES
CONSOLIDATED STATEMENTS OF INCOME (LOSS)
| | | | | | | | | | | | |
| | | | Year Ended December 31, | |
| | | | 2019 | | 2018 | | 2017 | |
| | | | (In thousands, except per share amounts) | |
Revenues and other income: | | | | | | | | | | | | |
Operating revenues | | | | $ | 3,043,383 | | $ | 3,057,619 | | $ | 2,564,285 | |
Earnings (losses) from unconsolidated affiliates | | | | | (5) | | | 1 | | | 7 | |
Investment income (loss) | | | | | 10,218 | | | (9,499) | | | 1,194 | |
Total revenues and other income | | | | | 3,053,596 | | | 3,048,121 | | | 2,565,486 | |
| | | | | | | | | | | | |
Costs and other deductions: | | | | | | | | | | | | |
Direct costs | | | | | 1,929,331 | | | 1,976,974 | | | 1,718,069 | |
General and administrative expenses | | | | | 258,731 | | | 265,822 | | | 251,184 | |
Research and engineering | | | | | 50,359 | | | 56,147 | | | 51,069 | |
Depreciation and amortization | | | | | 876,091 | | | 866,870 | | | 842,943 | |
Interest expense | | | | | 204,311 | | | 227,124 | | | 222,889 | |
Impairments and other charges | | | | | 290,471 | | | 144,446 | | | 44,536 | |
Other, net | | | | | 33,224 | | | 29,532 | | | 14,880 | |
Total costs and other deductions | | | | | 3,642,518 | | | 3,566,915 | | | 3,145,570 | |
Income (loss) from continuing operations before income taxes | | | | | (588,922) | | | (518,794) | | | (580,084) | |
Income tax expense (benefit): | | | | | | | | | | | | |
Current | | | | | 55,625 | | | 2,388 | | | (102,080) | |
Deferred | | | | | 35,951 | | | 76,881 | | | 19,110 | |
Total income tax expense (benefit) | | | | | 91,576 | | | 79,269 | | | (82,970) | |
Income (loss) from continuing operations, net of tax | | | | | (680,498) | | | (598,063) | | | (497,114) | |
Income (loss) from discontinued operations, net of tax | | | | | (12) | | | (14,663) | | | (43,519) | |
Net income (loss) | | | | | (680,510) | | | (612,726) | | | (540,633) | |
Less: Net (income) loss attributable to noncontrolling interest | | | | | (22,375) | | | (28,222) | | | (6,178) | |
Net income (loss) attributable to Nabors | | | | $ | (702,885) | | $ | (640,948) | | $ | (546,811) | |
Less: Preferred stock dividend | | | | | (17,244) | | | (12,305) | | | — | |
Net income (loss) attributable to Nabors common shareholders | | | | $ | (720,129) | | $ | (653,253) | | $ | (546,811) | |
| | | | | | | | | | | | |
Amounts attributable to Nabors common shareholders: | | | | | | | | | | | | |
Net income (loss) from continuing operations | | | | $ | (720,117) | | $ | (638,590) | | $ | (503,292) | |
Net income (loss) from discontinued operations | | | | | (12) | | | (14,663) | | | (43,519) | |
Net income (loss) attributable to Nabors common shareholders | | | | $ | (720,129) | | $ | (653,253) | | $ | (546,811) | |
| | | | | | | | | | | | |
Earnings (losses) per share: | | | | | | | | | | | | |
Basic from continuing operations | | | | $ | (2.11) | | $ | (1.95) | | $ | (1.75) | |
Basic from discontinued operations | | | | | — | | | (0.04) | | | (0.15) | |
Total Basic | | | | $ | (2.11) | | $ | (1.99) | | $ | (1.90) | |
Diluted from continuing operations | | | | $ | (2.11) | | $ | (1.95) | | $ | (1.75) | |
Diluted from discontinued operations | | | | | — | | | (0.04) | | | (0.15) | |
Total Diluted | | | | $ | (2.11) | | $ | (1.99) | | $ | (1.90) | |
Weighted-average number of common shares outstanding: | | | | | | | | | | | | |
Basic | | | | | 351,617 | | | 334,397 | | | 280,653 | |
Diluted | | | | | 351,617 | | | 334,397 | | | 280,653 | |
c | | | | | | | | | | | | |
| | | | Year Ended December 31, | |
| | | | 2018 | | 2017 | | 2016 | |
| | | | (In thousands, except per share amounts) | |
Revenues and other income: | | | | | | | | | | | | |
Operating revenues | | | | $ | 3,057,619 | | $ | 2,564,285 | | $ | 2,227,839 | |
Earnings (losses) from unconsolidated affiliates | | | | | 1 | | | 7 | | | (221,914) | |
Investment income (loss) | | | | | (9,499) | | | 1,194 | | | 1,183 | |
Total revenues and other income | | | | | 3,048,121 | | | 2,565,486 | | | 2,007,108 | |
| | | | | | | | | | | | |
Costs and other deductions: | | | | | | | | | | | | |
Direct costs | | | | | 1,976,974 | | | 1,718,069 | | | 1,344,298 | |
General and administrative expenses | | | | | 265,822 | | | 251,184 | | | 227,639 | |
Research and engineering | | | | | 56,147 | | | 51,069 | | | 33,582 | |
Depreciation and amortization | | | | | 866,870 | | | 842,943 | | | 871,631 | |
Interest expense | | | | | 227,124 | | | 222,889 | | | 185,360 | |
Impairments and other charges | | | | | 144,446 | | | 44,536 | | | 498,499 | |
Other, net | | | | | 29,532 | | | 14,880 | | | 44,174 | |
Total costs and other deductions | | | | | 3,566,915 | | | 3,145,570 | | | 3,205,183 | |
Income (loss) from continuing operations before income taxes | | | | | (518,794) | | | (580,084) | | | (1,198,075) | |
Income tax expense (benefit): | | | | | | | | | | | | |
Current | | | | | 2,388 | | | (102,080) | | | 14,780 | |
Deferred | | | | | 76,881 | | | 19,110 | | | (201,611) | |
Total income tax expense (benefit) | | | | | 79,269 | | | (82,970) | | | (186,831) | |
Income (loss) from continuing operations, net of tax | | | | | (598,063) | | | (497,114) | | | (1,011,244) | |
Income (loss) from discontinued operations, net of tax | | | | | (14,663) | | | (43,519) | | | (18,363) | |
Net income (loss) | | | | | (612,726) | | | (540,633) | | | (1,029,607) | |
Less: Net (income) loss attributable to noncontrolling interest | | | | | (28,222) | | | (6,178) | | | (135) | |
Net income (loss) attributable to Nabors | | | | $ | (640,948) | | $ | (546,811) | | $ | (1,029,742) | |
Less: Preferred stock dividend | | | | | (12,305) | | | — | | | — | |
Net income (loss) attributable to Nabors common shareholders | | | | $ | (653,253) | | $ | (546,811) | | $ | (1,029,742) | |
| | | | | | | | | | | | |
Amounts attributable to Nabors common shareholders: | | | | | | | | | | | | |
Net income (loss) from continuing operations | | | | $ | (638,590) | | $ | (503,292) | | $ | (1,011,379) | |
Net income (loss) from discontinued operations | | | | | (14,663) | | | (43,519) | | | (18,363) | |
Net income (loss) attributable to Nabors common shareholders | | | | $ | (653,253) | | $ | (546,811) | | $ | (1,029,742) | |
| | | | | | | | | | | | |
Earnings (losses) per share: | | | | | | | | | | | | |
Basic from continuing operations | | | | $ | (1.95) | | $ | (1.75) | | $ | (3.58) | |
Basic from discontinued operations | | | | | (0.04) | | | (0.15) | | | (0.06) | |
Total Basic | | | | $ | (1.99) | | $ | (1.90) | | $ | (3.64) | |
Diluted from continuing operations | | | | $ | (1.95) | | $ | (1.75) | | $ | (3.58) | |
Diluted from discontinued operations | | | | | (0.04) | | | (0.15) | | | (0.06) | |
Total Diluted | | | | $ | (1.99) | | $ | (1.90) | | $ | (3.64) | |
Weighted-average number of common shares outstanding: | | | | | | | | | | | | |
Basic | | | | | 334,397 | | | 280,653 | | | 276,475 | |
Diluted | | | | | 334,397 | | | 280,653 | | | 276,475 | |
| | | | | | | | | | | | |
The accompanying notes are an integral part of these consolidated financial statements.
NABORS INDUSTRIES LTD. AND SUBSIDIARIES
CONSOLIDATED STATEMENTS OF COMPREHENSIVE INCOME (LOSS)
| | | | | | | | | | | | |
| | | | Year Ended December 31, | |
| | | | 2019 | | 2018 | | 2017 | |
| | | | (In thousands) | |
Net income (loss) attributable to Nabors | | | | $ | (702,885) | | $ | (640,948) | | $ | (546,811) | |
Other comprehensive income (loss), before tax: | | | | | | | | | | | | |
Translation adjustment attributable to Nabors | | | | | 16,943 | | | (31,962) | | | 28,372 | |
Unrealized gains (losses) on marketable securities: | | | | | | | | | | | | |
Unrealized gains (losses) on marketable securities | | | | | — | | | — | | | (6,061) | |
Less: reclassification adjustment for (gains) losses included in net income (loss) | | | | | — | | | — | | | 970 | |
Unrealized gains (losses) on marketable securities | | | | | — | | | — | | | (5,091) | |
Pension liability amortization and adjustment | | | | | 217 | | | 216 | | | (275) | |
Unrealized gains (losses) and amortization on cash flow hedges | | | | | 567 | | | 567 | | | 613 | |
Adoption of ASU No. 2016-01 | | | | | — | | | (9,144) | | | — | |
Other comprehensive income (loss), before tax | | | | | 17,727 | | | (40,323) | | | 23,619 | |
Income tax expense (benefit) related to items of other comprehensive income (loss) | | | | | 190 | | | 187 | | | 315 | |
Other comprehensive income (loss), net of tax | | | | | 17,537 | | | (40,510) | | | 23,304 | |
Comprehensive income (loss) attributable to Nabors | | | | | (685,348) | | | (681,458) | | | (523,507) | |
Net income (loss) attributable to noncontrolling interest | | | | | 22,375 | | | 28,222 | | | 6,178 | |
Translation adjustment attributable to noncontrolling interest | | | | | 55 | | | (251) | | | 282 | |
Comprehensive income (loss) attributable to noncontrolling interest | | | | | 22,430 | | | 27,971 | | | 6,460 | |
Comprehensive income (loss) | | | | $ | (662,918) | | $ | (653,487) | | $ | (517,047) | |
| | | | | | | | | | | | |
| | | | Year Ended December 31, | |
| | | | 2018 | | 2017 | | 2016 | |
| | | | (In thousands) | |
Net income (loss) attributable to Nabors | | | | $ | (640,948) | | $ | (546,811) | | $ | (1,029,742) | |
Other comprehensive income (loss), before tax: | | | | | | | | | | | | |
Translation adjustment attributable to Nabors | | | | | (31,962) | | | 28,372 | | | 17,743 | |
Unrealized gains (losses) on marketable securities: | | | | | | | | | | | | |
Unrealized gains (losses) on marketable securities | | | | | — | | | (6,061) | | | 11,054 | |
Less: reclassification adjustment for (gains) losses included in net income (loss) | | | | | — | | | 970 | | | 3,495 | |
Unrealized gains (losses) on marketable securities | | | | | — | | | (5,091) | | | 14,549 | |
Pension liability amortization and adjustment | | | | | 216 | | | (275) | | | 1,061 | |
Pension buyout | | | | | — | | | — | | | 3,059 | |
Unrealized gains (losses) and amortization on cash flow hedges | | | | | 567 | | | 613 | | | 613 | |
Adoption of ASU No. 2016-01 | | | | | (9,144) | | | — | | | — | |
Other comprehensive income (loss), before tax | | | | | (40,323) | | | 23,619 | | | 37,025 | |
Income tax expense (benefit) related to items of other comprehensive income (loss) | | | | | 187 | | | 315 | | | 1,551 | |
Other comprehensive income (loss), net of tax | | | | | (40,510) | | | 23,304 | | | 35,474 | |
Comprehensive income (loss) attributable to Nabors | | | | | (681,458) | | | (523,507) | | | (994,268) | |
Net income (loss) attributable to noncontrolling interest | | | | | 28,222 | | | 6,178 | | | 135 | |
Translation adjustment attributable to noncontrolling interest | | | | | (251) | | | 282 | | | 251 | |
Comprehensive income (loss) attributable to noncontrolling interest | | | | | 27,971 | | | 6,460 | | | 386 | |
Comprehensive income (loss) | | | | $ | (653,487) | | $ | (517,047) | | $ | (993,882) | |
The accompanying notes are an integral part of these consolidated financial statements.
NABORS INDUSTRIES LTD. AND SUBSIDIARIES
CONSOLIDATED STATEMENTS OF CASH FLOWS
| | | | | | | | | | |
| | Year Ended December 31, | |
| | 2018 | | 2017 | | 2016 | |
| | (In thousands) | |
Cash flows from operating activities: | | | | | | | | | | |
Net income (loss) | | $ | (612,726) | | $ | (540,633) | | $ | (1,029,607) | |
Adjustments to net income (loss): | | | | | | | | | | |
Depreciation and amortization | | | 868,509 | | | 845,439 | | | 874,296 | |
Deferred income tax expense (benefit) | | | 71,579 | | | 9,096 | | | (206,670) | |
Impairments and other charges | | | 62,578 | | | 42,188 | | | 236,745 | |
Amortization of debt discount and deferred financing costs | | | 32,213 | | | 27,583 | | | 6,455 | |
Losses (gains) on debt buyback | | | 5,268 | | | 16,005 | | | (6,665) | |
Losses (gains) on long-lived assets, net | | | 95,741 | | | 19,064 | | | 85,064 | |
Losses (gains) on investments, net | | | 14,195 | | | 972 | | | — | |
Provision (recovery) of bad debt | | | 1,285 | | | 3,083 | | | (3,540) | |
Impairments on equity method holdings | | | — | | | — | | | 216,242 | |
Share-based compensation | | | 26,396 | | | 31,896 | | | 32,000 | |
Foreign currency transaction losses (gains), net | | | 4,235 | | | 1,604 | | | 5,669 | |
Noncontrolling interest | | | (28,222) | | | (6,178) | | | (135) | |
Equity in (earnings) losses of unconsolidated affiliates, net of dividends | | | 164 | | | (7) | | | 221,914 | |
Other | | | 720 | | | 636 | | | 4,527 | |
Changes in operating assets and liabilities, net of effects from acquisitions: | | | | | | | | | | |
Accounts receivable | | | (66,486) | | | (168,436) | | | 253,940 | |
Inventory | | | (13,981) | | | (17,444) | | | 40,647 | |
Other current assets | | | 31,770 | | | 16,518 | | | 37,904 | |
Other long-term assets | | | 11,717 | | | 28,772 | | | 98 | |
Trade accounts payable and accrued liabilities | | | (76,561) | | | 79,204 | | | (180,200) | |
Income taxes payable | | | (41,939) | | | 14,811 | | | (46,576) | |
Other long-term liabilities | | | (60,682) | | | (341,417) | | | (10,203) | |
Net cash (used for) provided by operating activities | | | 325,773 | | | 62,756 | | | 531,905 | |
Cash flows from investing activities: | | | | | | | | | | |
Purchases of investments | | | (676) | | | (6,722) | | | (24) | |
Sales and maturities of investments | | | 4,287 | | | 13,069 | | | 739 | |
Cash paid for acquisition of businesses, net of cash acquired | | | (20,859) | | | 12,319 | | | (22,278) | |
Capital expenditures | | | (458,938) | | | (574,467) | | | (395,455) | |
Proceeds from sales of assets and insurance claims | | | 109,098 | | | 57,933 | | | 34,831 | |
Net cash (used for) provided by investing activities | | | (367,088) | | | (497,868) | | | (382,187) | |
Cash flows from financing activities: | | | | | | | | | | |
Proceeds from issuance of long-term debt | | | 800,000 | | | 411,200 | | | 600,000 | |
Debt issuance costs | | | (21,277) | | | (11,043) | | | (11,520) | |
Proceeds from revolving credit facilities | | | 1,135,000 | | | 725,000 | | | 611,500 | |
Reduction in revolving credit facilities | | | (1,475,000) | | | (215,000) | | | (611,500) | |
Proceeds from issuance of common shares, net of issuance costs | | | 301,404 | | | 8,300 | | | 967 | |
Proceeds from issuance of preferred stock, net of issuance costs | | | 277,927 | | | — | | | — | |
Distributions to noncontrolling interest | | | (5,452) | | | (7,272) | | | — | |
Noncontrolling interest contribution | | | — | | | 20,000 | | | — | |
Reduction in long-term debt | | | (878,278) | | | (381,814) | | | (493,612) | |
Dividends to common and preferred shareholders | | | (87,098) | | | (68,503) | | | (50,924) | |
Proceeds from (payment for) commercial paper | | | (40,000) | | | 40,000 | | | (8,000) | |
Cash proceeds (payments) from equity component of exchangeable debt | | | — | | | 159,952 | | | — | |
Repurchase of common shares | | | — | | | (18,071) | | | (1,687) | |
Payments on term loan | | | — | | | (162,500) | | | (162,500) | |
Redeemable noncontrolling interest contribution | | | 156,935 | | | 61,123 | | | — | |
Proceeds from (payments for) short-term borrowings | | | 380 | | | (543) | | | (6,211) | |
Purchase of capped call hedge transactions | | | — | | | (40,250) | | | — | |
Other | | | (8,912) | | | (8,399) | | | (4,729) | |
Net cash provided by financing activities | | | 155,629 | | | 512,180 | | | (138,216) | |
Effect of exchange rate changes on cash and cash equivalents | | | (5,263) | | | (29) | | | (2,003) | |
Net increase (decrease) in cash and cash equivalents and restricted cash | | | 109,051 | | | 77,039 | | | 9,499 | |
Cash and cash equivalents and restricted cash, beginning of period | | | 342,029 | | | 264,990 | | | 255,491 | |
Cash and cash equivalents and restricted cash, end of period | | $ | 451,080 | | $ | 342,029 | | $ | 264,990 | |
| | | | | | | | | | |
RECONCILIATION OF CASH AND CASH EQUIVALENTS AND RESTRICTED CASH | | | | | | | | | | |
Cash and cash equivalents, beginning of period | | | 336,997 | | | 264,093 | | | 254,530 | |
Restricted cash, beginning of period | | | 5,032 | | | 897 | | | 961 | |
Cash and cash equivalents and restricted cash, beginning of period | | $ | 342,029 | | $ | 264,990 | | $ | 255,491 | |
| | | | | | | | | | |
Cash and cash equivalents, end of period | | | 447,766 | | | 336,997 | | | 264,093 | |
Restricted cash, end of period | | | 3,314 | | | 5,032 | | | 897 | |
Cash and cash equivalents and restricted cash, end of period | | $ | 451,080 | | $ | 342,029 | | $ | 264,990 | |
| | | | | | | | | | |
| | Year Ended December 31, | |
| | 2019 | | 2018 | | 2017 | |
| | (In thousands) | |
Cash flows from operating activities: | | | | | | | | | | |
Net income (loss) | | $ | (680,510) | | $ | (612,726) | | $ | (540,633) | |
Adjustments to net income (loss): | | | | | | | | | | |
Depreciation and amortization | | | 876,103 | | | 868,509 | | | 845,439 | |
Deferred income tax expense (benefit) | | | 35,894 | | | 71,579 | | | 9,096 | |
Impairments and other charges | | | 213,404 | | | 62,578 | | | 42,188 | |
Amortization of debt discount and deferred financing costs | | | 30,931 | | | 32,213 | | | 27,583 | |
Losses (gains) on debt buyback | | | (11,468) | | | 5,268 | | | 16,005 | |
Losses (gains) on long-lived assets, net | | | 40,346 | | | 95,741 | | | 19,064 | |
Losses (gains) on investments, net | | | (1,257) | | | 14,195 | | | 972 | |
Provision (recovery) of bad debt | | | 20,626 | | | 1,285 | | | 3,083 | |
Share-based compensation | | | 24,660 | | | 26,396 | | | 31,896 | |
Foreign currency transaction losses (gains), net | | | 20,876 | | | 4,235 | | | 1,604 | |
Noncontrolling interest | | | (22,375) | | | (28,222) | | | (6,178) | |
Equity in (earnings) losses from unconsolidated affiliates, net of dividends | | | 5 | | | 164 | | | (7) | |
Other | | | 667 | | | 720 | | | 636 | |
Changes in operating assets and liabilities, net of effects from acquisitions: | | | | | | | | | | |
Accounts receivable | | | 276,685 | | | (66,486) | | | (168,436) | |
Inventory | | | (18,695) | | | (13,981) | | | (17,444) | |
Other current assets | | | 5,157 | | | 31,770 | | | 16,518 | |
Other long-term assets | | | 13,106 | | | 11,717 | | | 28,772 | |
Trade accounts payable and accrued liabilities | | | (142,857) | | | (76,561) | | | 79,204 | |
Income taxes payable | | | (4,857) | | | (41,939) | | | 14,811 | |
Other long-term liabilities | | | 8,117 | | | (60,682) | | | (341,417) | |
Net cash provided by (used for) operating activities | | | 684,558 | | | 325,773 | | | 62,756 | |
Cash flows from investing activities: | | | | | | | | | | |
Purchases of investments | | | (4,323) | | | (676) | | | (6,722) | |
Sales and maturities of investments | | | 18,849 | | | 4,287 | | | 13,069 | |
Cash paid for acquisition of businesses, net of cash acquired | | | (2,929) | | | (20,859) | | | 12,319 | |
Capital expenditures | | | (427,741) | | | (458,938) | | | (574,467) | |
Proceeds from sales of assets and insurance claims | | | 60,288 | | | 109,098 | | | 57,933 | |
Net cash (used for) provided by investing activities | | | (355,856) | | | (367,088) | | | (497,868) | |
Cash flows from financing activities: | | | | | | | | | | |
Proceeds from issuance of long-term debt | | | — | | | 800,000 | | | 411,200 | |
Reduction in long-term debt | | | (455,360) | | | (878,278) | | | (381,814) | |
Debt issuance costs | | | (1,767) | | | (21,277) | | | (11,043) | |
Proceeds from revolving credit facilities | | | 1,050,000 | | | 1,135,000 | | | 725,000 | |
Reduction in revolving credit facilities | | | (865,000) | | | (1,475,000) | | | (215,000) | |
Proceeds from (payment for) commercial paper | | | — | | | (40,000) | | | 40,000 | |
Cash proceeds (payments) from equity component of exchangeable debt | | | — | | | — | | | 159,952 | |
Purchase of capped call hedge transactions | | | — | | | — | | | (40,250) | |
Payments on term loan | | | — | | | — | | | (162,500) | |
Proceeds from (payments for) short-term borrowings | | | (561) | | | 380 | | | (543) | |
Proceeds from issuance of common shares, net of issuance costs | | | — | | | 301,404 | | | 8,300 | |
Proceeds from issuance of preferred stock, net of issuance costs | | | — | | | 277,927 | | | — | |
Repurchase of common shares | | | — | | | — | | | (18,071) | |
Dividends to common and preferred shareholders | | | (49,583) | | | (87,098) | | | (68,503) | |
Redeemable noncontrolling interest contribution | | | — | | | 156,935 | | | 61,123 | |
Noncontrolling interest contribution | | | — | | | — | | | 20,000 | |
Distributions to noncontrolling interest | | | (4,552) | | | (5,452) | | | (7,272) | |
Other | | | (4,750) | | | (8,912) | | | (8,399) | |
Net cash (used for) provided by financing activities | | | (331,573) | | | 155,629 | | | 512,180 | |
Effect of exchange rate changes on cash and cash equivalents | | | (6,171) | | | (5,263) | | | (29) | |
Net increase (decrease) in cash and cash equivalents and restricted cash | | | (9,042) | | | 109,051 | | | 77,039 | |
Cash and cash equivalents and restricted cash, beginning of period | | | 451,080 | | | 342,029 | | | 264,990 | |
Cash and cash equivalents and restricted cash, end of period | | $ | 442,038 | | $ | 451,080 | | $ | 342,029 | |
| | | | | | | | | | |
RECONCILIATION OF CASH AND CASH EQUIVALENTS AND RESTRICTED CASH | | | | | | | | | | |
Cash and cash equivalents, beginning of period | | | 447,766 | | | 336,997 | | | 264,093 | |
Restricted cash, beginning of period | | | 3,314 | | | 5,032 | | | 897 | |
Cash and cash equivalents and restricted cash, beginning of period | | $ | 451,080 | | $ | 342,029 | | $ | 264,990 | |
| | | | | | | | | | |
Cash and cash equivalents, end of period | | | 435,990 | | | 447,766 | | | 336,997 | |
Restricted cash, end of period | | | 6,048 | | | 3,314 | | | 5,032 | |
Cash and cash equivalents and restricted cash, end of period | | $ | 442,038 | | $ | 451,080 | | $ | 342,029 | |
The accompanying notes are an integral part of these consolidated financial statements.
NABORS INDUSTRIES LTD. AND SUBSIDIARIES
CONSOLIDATED STATEMENTS OF CHANGES IN EQUITY
| | | | | | | | | | | | | | | | | | | | | | | | | | | | |
| | Mandatory Convertible | | | | | | | Capital | | Accumulated | | Retained | | | | | | | | | |
| | Preferred Shares | | Common Shares | | in Excess | | Other | | Earnings | | | | | Non- | | | |
| | | | Par | | | | Par | | of Par | | Comprehensive | | (Accumulated | | Treasury | | controlling | | Total |
(In thousands) | | Shares | | Value | | Shares | | Value | | Value | | Income | | Deficit) | | Shares | | Interest | | Equity |
As of December 31, 2016 | | — | | | — | | 333,598 | | | 334 | | | 2,521,332 | | | (12,119) | | | 2,033,427 | | | (1,295,949) | | | 7,770 | | | 3,254,795 |
Net income (loss) | | — | | | — | | — | | | — | | | — | | | — | | | (546,811) | | | — | | | 6,178 | | | (540,633) |
Dividends declared to common shareholders ($0.24 per share) | | — | | | — | | — | | | — | | | — | | | — | | | (68,612) | | | — | | | — | | | (68,612) |
Repurchase of treasury shares | | — | | | — | | — | | | — | | | — | | | — | | | — | | | (18,071) | | | — | | | (18,071) |
Other comprehensive income (loss), net of tax | | — | | | — | | — | | | — | | | — | | | 23,304 | | | — | | | — | | | 282 | | | 23,586 |
Issuance of common shares for stock options exercised, net of surrender of unexercised stock options | | — | | | — | | 842 | | | 1 | | | (10,736) | | | — | | | — | | | — | | | — | | | (10,735) |
Equity component of exchangeable debt | | — | | | — | | — | | | — | | | 116,195 | | | — | | | — | | | — | | | — | | | 116,195 |
Capped call transaction | | — | | | — | | — | | | — | | | (40,250) | | | — | | | — | | | — | | | — | | | (40,250) |
Adoption of ASU No. 2016-09 | | — | | | — | | — | | | — | | | 1,943 | | | — | | | 5,150 | | | — | | | — | | | 7,093 |
Share-based compensation | | — | | | — | | — | | | — | | | 31,896 | | | — | | | — | | | — | | | — | | | 31,896 |
Issuance to Tesco shareholders | | — | | | — | | 32,078 | | | 32 | | | 178,961 | | | — | | | — | | | — | | | — | | | 178,993 |
Noncontrolling interest contributions (distributions) | | — | | | — | | — | | | — | | | — | | | — | | | — | | | — | | | 13,018 | | | 13,018 |
Other | | — | | | — | | 992 | | | 1 | | | (8,212) | | | — | | | — | | | — | | | (291) | | | (8,502) |
As of December 31, 2017 | | — | | $ | — | | 367,510 | | $ | 368 | | $ | 2,791,129 | | $ | 11,185 | | $ | 1,423,154 | | $ | (1,314,020) | | $ | 26,957 | | $ | 2,938,773 |
Net income (loss) | | — | | | — | | — | | | — | | | — | | | — | | | (640,948) | | | — | | | 28,222 | | | (612,726) |
Dividends declared to common shareholders ($0.24 per share) | | — | | | — | | — | | | — | | | — | | | — | | | (82,973) | | | — | | | — | | | (82,973) |
Dividends declared to preferred shareholders ($2.14 per share) | | — | | | — | | — | | | — | | | — | | | — | | | (12,305) | | | — | | | — | | | (12,305) |
Common share issuance | | — | | | — | | 40,250 | | | 40 | | | 301,363 | | | — | | | — | | | — | | | — | | | 301,403 |
Convertible preferred share issuance | | 5,750 | | | 6 | | — | | | — | | | 277,921 | | | — | | | — | | | — | | | — | | | 277,927 |
Other comprehensive income (loss), net of tax | | — | | | — | | — | | | — | | | — | | | (40,510) | | | — | | | — | | | (251) | | | (40,761) |
Share-based compensation | | — | | | — | | — | | | — | | | 26,396 | | | — | | | — | | | — | | | — | | | 26,396 |
Adoption of ASU No. 2016-01 | | — | | | — | | — | | | — | | | — | | | — | | | 9,144 | | | — | | | — | | | 9,144 |
Adoption of ASU No. 2016-16 | | — | | | — | | — | | | — | | | — | | | — | | | (34,132) | | | — | | | — | | | (34,132) |
Noncontrolling interest contributions (distributions) | | — | | | — | | — | | | — | | | — | | | — | | | — | | | — | | | (5,452) | | | (5,452) |
Accrued distribution on redeemable noncontrolling interest in subsidiary | | — | | | — | | — | | | — | | | — | | | — | | | (11,098) | | | — | | | — | | | (11,098) |
Other | | — | | | — | | 1,892 | | | 2 | | | (3,872) | | | — | | | — | | | — | | | — | | | (3,870) |
As of December 31, 2018 | | 5,750 | | $ | 6 | | 409,652 | | $ | 410 | | $ | 3,392,937 | | $ | (29,325) | | $ | 650,842 | | $ | (1,314,020) | | $ | 49,476 | | $ | 2,750,326 |
Net income (loss) | | — | | | — | | — | | | — | | | — | | | — | | | (702,885) | | | — | | | 22,375 | | | (680,510) |
Dividends declared to common shareholders ($0.04 per share) | | — | | | — | | — | | | — | | | — | | | — | | | (14,953) | | | — | | | — | | | (14,953) |
Dividends declared to preferred shareholders ($2.14 per share) | | — | | | — | | — | | | — | | | — | | | — | | | (17,245) | | | — | | | — | | | (17,245) |
Other comprehensive income (loss), net of tax | | — | | | — | | — | | | — | | | — | | | 17,537 | | | — | | | — | | | 55 | | | 17,592 |
Share-based compensation | | — | | | — | | — | | | — | | | 24,659 | | | — | | | — | | | — | | | — | | | 24,659 |
Noncontrolling interest contributions (distributions) | | — | | | — | | — | | | — | | | — | | | — | | | — | | | — | | | (4,552) | | | (4,552) |
Accrued distribution on redeemable noncontrolling interest in subsidiary | | — | | | — | | — | | | — | | | — | | | — | | | (20,534) | | | — | | | — | | | (20,534) |
Other | | (137) | | | — | | 6,546 | | | 6 | | | (4,624) | | | — | | | — | | | — | | | — | | | (4,618) |
As of December 31, 2019 | | 5,613 | | $ | 6 | | 416,198 | | $ | 416 | | $ | 3,412,972 | | $ | (11,788) | | $ | (104,775) | | $ | (1,314,020) | | $ | 67,354 | | $ | 2,050,165 |
| | | | | | | | | | | | | | | | | | | | | | | | | | | | |
| | Mandatory Convertible | | | | | | | Capital | | Accumulated | | | | | | | | | | | | |
| | Preferred Shares | | Common Shares | | in Excess | | Other | | | | | | | | Non- | | | |
| | | | Par | | | | Par | | of Par | | Comprehensive | | Retained | | Treasury | | controlling | | Total |
(In thousands) | | Shares | | Value | | Shares | | Value | | Value | | Income | | Earnings | | Shares | | Interest | | Equity |
As of December 31, 2015 | | — | | | — | | 330,526 | | | 331 | | | 2,493,100 | | | (47,593) | | | 3,131,134 | | | (1,294,262) | | | 11,158 | | | 4,293,868 |
Net income (loss) | | — | | | — | | — | | | — | | | — | | | — | | | (1,029,742) | | | — | | | 135 | | | (1,029,607) |
Dividends to shareholders ($0.24 per share) | | — | | | — | | — | | | — | | | — | | | — | | | (67,965) | | | — | | | — | | | (67,965) |
Repurchase of treasury shares | | — | | | — | | — | | | — | | | — | | | — | | | — | | | (1,687) | | | — | | | (1,687) |
Other comprehensive income (loss), net of tax | | — | | | — | | — | | | — | | | — | | | 35,474 | | | — | | | — | | | 251 | | | 35,725 |
Issuance of common shares for stock options exercised, net of surrender of unexercised stock options | | — | | | — | | 102 | | | — | | | 967 | | | — | | | — | | | — | | | — | | | 967 |
Share-based compensation | | — | | | — | | — | | | — | | | 32,000 | | | — | | | — | | | — | | | — | | | 32,000 |
Other | | — | | | — | | 2,970 | | | 3 | | | (4,735) | | | — | | | — | | | — | | | (3,774) | | | (8,506) |
As of December 31, 2016 | | — | | $ | — | | 333,598 | | $ | 334 | | $ | 2,521,332 | | $ | (12,119) | | $ | 2,033,427 | | $ | (1,295,949) | | $ | 7,770 | | $ | 3,254,795 |
Net income (loss) | | — | | | — | | — | | | — | | | — | | | — | | | (546,811) | | | — | | | 6,178 | | | (540,633) |
Dividends to shareholders ($0.24 per share) | | — | | | — | | — | | | — | | | — | | | — | | | (68,612) | | | — | | | — | | | (68,612) |
Repurchase of treasury shares | | — | | | — | | — | | | — | | | — | | | — | | | — | | | (18,071) | | | — | | | (18,071) |
Other comprehensive income (loss), net of tax | | — | | | — | | — | | | — | | | — | | | 23,304 | | | — | | | — | | | 282 | | | 23,586 |
Issuance of common shares for stock options exercised, net of surrender of unexercised stock options | | — | | | — | | 842 | | | 1 | | | (10,736) | | | — | | | — | | | — | | | — | | | (10,735) |
Equity component of exchangeable debt | | — | | | — | | — | | | — | | | 116,195 | | | — | | | — | | | — | | | — | | | 116,195 |
Capped call transaction | | — | | | — | | — | | | — | | | (40,250) | | | — | | | — | | | — | | | — | | | (40,250) |
Adoption of ASU No. 2016-09 | | — | | | — | | — | | | — | | | 1,943 | | | — | | | 5,150 | | | — | | | — | | | 7,093 |
Share-based compensation | | — | | | — | | — | | | — | | | 31,896 | | | — | | | — | | | — | | | — | | | 31,896 |
Issuance of common shares to Tesco shareholders | | — | | | — | | 32,078 | | | 32 | | | 178,961 | | | — | | | — | | | — | | | — | | | 178,993 |
Noncontrolling interest contributions (distributions), net | | — | | | — | | — | | | — | | | — | | | — | | | — | | | — | | | 13,018 | | | 13,018 |
Other | | — | | | — | | 992 | | | 1 | | | (8,212) | | | — | | | — | | | — | | | (291) | | | (8,502) |
As of December 31, 2017 | | — | | $ | — | | 367,510 | | $ | 368 | | $ | 2,791,129 | | $ | 11,185 | | $ | 1,423,154 | | $ | (1,314,020) | | $ | 26,957 | | $ | 2,938,773 |
Net income (loss) | | — | | | — | | — | | | — | | | — | | | — | | | (640,948) | | | — | | | 28,222 | | | (612,726) |
Dividends to shareholders ($0.24 per share) | | — | | | — | | — | | | — | | | — | | | — | | | (82,973) | | | — | | | — | | | (82,973) |
Dividends to preferred shareholders ($2.14 per share) | | — | | | — | | — | | | — | | | — | | | — | | | (12,305) | | | — | | | — | | | (12,305) |
Common share issuance | | — | | | — | | 40,250 | | | 40 | | | 301,363 | | | — | | | — | | | — | | | — | | | 301,403 |
Convertible preferred share issuance | | 5,750 | | | 6 | | — | | | — | | | 277,921 | | | — | | | — | | | — | | | — | | | 277,927 |
Other comprehensive income (loss), net of tax | | — | | | — | | — | | | — | | | — | | | (40,510) | | | — | | | — | | | (251) | | | (40,761) |
Share-based compensation | | — | | | — | | — | | | — | | | 26,396 | | | — | | | — | | | — | | | — | | | 26,396 |
Adoption of ASU No. 2016-01 | | — | | | — | | — | | | — | | | — | | | — | | | 9,144 | | | — | | | — | | | 9,144 |
Adoption of ASU No. 2016-16 | | — | | | — | | — | | | — | | | — | | | — | | | (34,132) | | | — | | | — | | | (34,132) |
Noncontrolling interest contributions (distributions) | | — | | | — | | — | | | — | | | — | | | — | | | — | | | — | | | (5,452) | | | (5,452) |
Accrued distribution on redeemable noncontrolling interest in subsidiary | | — | | | — | | — | | | — | | | — | | | — | | | (11,098) | | | — | | | — | | | (11,098) |
Other | | — | | | — | | 1,892 | | | 2 | | | (3,872) | | | — | | | — | | | — | | | — | | | (3,870) |
As of December 31, 2018 | | 5,750 | | $ | 6 | | 409,652 | | $ | 410 | | $ | 3,392,937 | | $ | (29,325) | | $ | 650,842 | | $ | (1,314,020) | | $ | 49,476 | | $ | 2,750,326 |
The accompanying notes are an integral part of these consolidated financial statements.
Nabors Industries Ltd. and Subsidiaries
NOTES TO CONSOLIDATED FINANCIAL STATEMENTS
Note 1 Nature of Operations
Unless the context requires otherwise, references in this annual report to “we,” “us,” “our,” “the Company,” or “Nabors” mean Nabors Industries Ltd., together with our subsidiaries where the context requires. References in this annual report to “Nabors Delaware” mean Nabors Industries, Inc., a wholly owned subsidiary of Nabors.
Our business is comprised of our global land-based and offshore drilling rig operations and other rig related services and technologies, consisting oftechnologies. These services include tubular running services, wellbore placement solutions, directional drilling, measurement-while-drilling (“MWD”), logging-while-drilling (“LWD”) systems and services, equipment manufacturing, rig instrumentation and optimization software. We also specialize in tubular services, wellbore placement solutions and are a leading provider of directional drilling and MWD systems and services.
The consolidated financial statements and related footnotes are presented in accordance with U.S. GAAP.
Note 2 Summary of Significant Accounting Policies
Principles of Consolidation
Our consolidated financial statements include the accounts of Nabors, as well as all majority owned and non‑majoritynon-majority owned subsidiaries required to be consolidated under U.S. GAAP. All significant intercompany accounts and transactions are eliminated in consolidation.
In addition to the consolidation of our majority owned subsidiaries, we also consolidate variable interest entities (“VIE’s”) when we are determined to be the primary beneficiary of a VIE. Determination of the primary beneficiary of a VIE is based on whether an entity has (1) the power to direct activities that most significantly impact the economic performance of the VIE and (2) the obligation to absorb losses or the right to receive benefits of the VIE that could potentially be significant to the VIE. Our determination of the primary beneficiary of a VIE considers all relationships between us and the VIE. During 2016, we entered into an agreement with Saudi Aramco, to form a newOur joint venture, SANAD, to own, manage and operate onshore drilling rigs in the Kingdom of Saudi Arabia. SANAD, which is equally owned by Saudi Aramco and Nabors, began operations during the fourth quarter of 2017.has been consolidated. As we have the power to direct activities that most significantly impact SANAD’s economic performance, including operations, maintenance and certain sourcing and procurement, we have determined Nabors to be the primary beneficiary and accordingly consolidate the joint venture.beneficiary. See Note 14—13—Joint Ventures.
Cash and Cash Equivalents
Cash and cash equivalents include demand deposits and various other short‑termshort-term investments with original maturities of three months or less.
Short-term Investments
Short-term Investments
Short‑term investments consist primarily of equity securities which are stated at fair value with any changes in fair value recognized in investment income (loss) in our consolidated statements of income (loss).
Inventory
Inventory is stated at the lower of cost or net realizable value. Cost is determined using the first‑in, first‑outfirst-in, first-out or weighted‑averageweighted-average costs methods and includes the cost of materials, labor and manufacturing overhead. Inventory, which
is net of reserves of $27.9$35.0 million and $28.9$27.9 million as of December 31, 20182019 and 2017,2018, respectively, included the following:
| | | | | | | | |
| | December 31, | | |
| | 2018 | | 2017 | | |
| | (In thousands) | | |
| | | | | | | | |
| | | December 31, | |
| | | 2019 | | 2018 | |
| | | (In thousands) | |
Raw materials | | $ | 116,840 | | $ | 124,635 | | | $ | 130,414 | | $ | 116,840 | |
Work-in-progress | | | 20,329 | | | 19,113 | | | | 5,498 | | | 20,329 | |
Finished goods | | | 28,418 | | | 22,559 | | | | 40,429 | | | 28,418 | |
| | $ | 165,587 | | $ | 166,307 | | |
| | | $ | 176,341 | | $ | 165,587 | |
Property, Plant and Equipment
Property, plant and equipment, including renewals and betterments, are stated at cost, while maintenance and repairs are expensed currently. Interest costs applicable to the construction of qualifying assets are capitalized as a component of the cost of such assets. We provide for the depreciation of our drilling rigs using the units‑of‑productionunits-of-production method. For each day a rig is operating, we depreciate it over an approximate 4,927‑day4,927-day period, with the exception of our jackup rigs which are depreciated over an 8,030‑day8,030-day period, after provision for salvage value. For each day a rig asset is not operating, it is depreciated over an assumed depreciable life of 20 years, with the exception of our jackup rigs, where a 30‑year30-year depreciable life is used, after provision for salvage value.
Depreciation on our buildings, oilfield hauling and mobile equipment, and other machinery and equipment is computed using the straight‑linestraight-line method over the estimated useful life of the asset after provision for salvage value (buildings—10 to 30 years; oilfield hauling and mobile equipment and other machinery and equipment—3 to 10 years). Amortization of capitalized leases is included in depreciation and amortization expense. Upon retirement or other disposal of fixed assets, the cost and related accumulated depreciation are removed from the respective property, plant and equipment accounts and any gains or losses are included in our consolidated statements of income (loss).
We review our assets for impairment when events or changes in circumstances indicate that their carrying amounts may not be recoverable. If the estimated undiscounted future cash flows are not sufficient to support the asset’s recorded value, an impairment charge is recognized to the extent the carrying amount of the long-lived asset exceeds its estimated fair value. Management considers a number of factors such as estimated future cash flows from the assets, appraisals and current market value analysis in determining fair value. The determination of future cash flows requires the estimation of utilization, dayrates, operating margins, sustaining capital and remaining economic life. Such estimates can change based on market conditions, technological advances in the industry or changes in regulations governing the industry. Significant and unanticipated changes to the assumptions could result in future impairments. A significantly prolonged period of lower oil and natural gas prices could adversely affect the demand for and prices of our services, which could result in future impairment charges. As the determination of whether impairment charges should be recorded on our long-lived assets is subject to significant management judgment, and an impairment of these assets could result in a material charge on our consolidated statements of income (loss), management believes that accounting estimates related to impairment of long-lived assets are critical.
For an asset classified as held for sale, we consider the asset impaired when its carrying amount exceeds fair value less its cost to sell. Fair value is determined in the same manner as a long‑livedlong-lived asset that is held and used.
Goodwill
We review goodwill for impairment annually during the second quarter of each fiscal year or more frequently if events or changes in circumstances indicate that the carrying amount of such goodwill and intangible assets may exceed their fair value. We initially assess goodwill for impairment based on qualitative factors to determine whether the existence of events or circumstances leads to a determination that it is more likely than not that the fair value of one of our reporting units is greater than its carrying amount. If the carrying amount exceeds the fair value, an impairment charge will be recognized in an amount equal to the excess; however, the loss recognized should not exceed the total amount of goodwill allocated to that reporting unit.
Our estimated fair values of our reporting units incorporate judgment and the use of estimates by management. The fair values calculated in these impairment tests were determined using discounted cash flow models, involvingwhich require the use of significant unobservable inputs, representative of a Level 3 fair value measurement. Our cash flow models
involve assumptions based on our utilization of rigs or other oil and gas service equipment, revenues and earnings from
affiliates, as well as direct costs, general and administrative costs, depreciation, applicable income taxes, capital expenditures and working capital requirements. Our fair value estimates of these reporting units are sensitive to varying dayrates, utilization and costs. A significantly prolonged period of lower oil and natural gas prices, other than those assumed in developing our forecasts, or changes in laws and regulations could adversely affect the demand for and prices of our services, which could in turn result in future goodwill and other intangible asset impairment charges for these reporting units due to the potential impact on our estimate of our future operating results. Our discounted cash flow projections for each reporting unit were based on financial forecasts. The future cash flows were discounted to present value using discount rates determined to be appropriate for each reporting unit. Terminal values for each reporting unit were calculated using a Gordon Growth methodology with a long termlong-term growth rate of 3%approximately 2%.
Another factor in determining whether impairment has occurred is the relationship between our market capitalization and our book value. As part of our annual review, we compared the sum of our reporting units’ estimated fair values,value, which included the estimated fair valuesvalue of non-operating assets and liabilities, less debt, to our market capitalization and assessed the reasonableness of our estimated fair value. Any of the above mentionedabove-mentioned factors may cause us to re-evaluate goodwill during any quarter throughout the year.
The change in the carrying amount of goodwill for our segments for the years ended December 31, 20182019 and 20172018 was as follows:
| | | | | | | | | | | | | | | | | | | |
| | | | | Acquisitions | | | | | | | | | | | | | |
| | | | | and | | | | | | | | | | | | | |
| | Balance at | | Purchase | | Disposals | | Cumulative | | | | Balance at | |
| | December 31, | | Price | | and | | Translation | | Other | | December 31, | |
| | 2017 | | Adjustments | | Impairments | | Adjustment | | Adjustments | | 2018 | |
| | (In thousands) | |
U.S. Drilling | | $ | 50,149 | | $ | — | | $ | — | | $ | — | | $ | — | | $ | 50,149 | |
International Drilling | | | 75,634 | | | — | | | — | | | — | | | — | | | 75,634 | |
Drilling Solutions | | | — | | | 11,436 | (1) | | — | | | — | | | — | | | 11,436 | |
Rig Technologies | | | 47,443 | | | — | | | — | | | (748) | | | — | | | 46,695 | |
Total | | $ | 173,226 | | $ | 11,436 | | $ | — | | $ | (748) | | $ | — | | $ | 183,914 | |
| | | | | | | | | | | | | | | | | | | |
| | | | | Acquisitions | | | | | | | | | | | | | |
| | | | | and | | | | | | | | | | | | | |
| | Balance at | | Purchase | | Disposals | | Cumulative | | | | Balance at | |
| | December 31, | | Price | | and | | Translation | | Other | | December 31, | |
| | 2018 | | Adjustments | | Impairments | | Adjustment | | Adjustment | | 2019 | |
| | (In thousands) | |
U.S. Drilling | | $ | 50,149 | | $ | — | | $ | (52,203) | (2) | $ | — | | $ | 2,054 | | $ | — | |
International Drilling | | | 75,634 | | | — | | | (75,634) | (2) | | — | | | — | | | — | |
Drilling Solutions | | | 11,436 | | | — | | | — | | | — | | | — | | | 11,436 | |
Rig Technologies | | | 46,695 | | | — | | | (28,136) | (2) | | 439 | | | (2,054) | | | 16,944 | |
Total | | $ | 183,914 | | $ | — | | $ | (155,973) | | $ | 439 | | $ | — | | $ | 28,380 | |
| | | | | | | | | | | | | | | | |
| | | | | Acquisitions | | | | | | | | | | |
| | | | | and | | | | | | | | | | |
| | Balance at | | Purchase | | Disposals | | Cumulative | | Balance at | |
| | December 31, | | Price | | and | | Translation | | December 31, | |
| | 2016 | | Adjustments | | Impairments | | Adjustment | | 2017 | |
| | (In thousands) | |
U.S. Drilling | | $ | 50,149 | | $ | — | | $ | — | | $ | — | | $ | 50,149 | |
International Drilling | | | 75,634 | | | — | | | — | | | — | | | 75,634 | |
Rig Technologies | | | 41,134 | | | 5,690 | (1) | | — | | | 619 | | | 47,443 | |
Total | | $ | 166,917 | | $ | 5,690 | | $ | — | | $ | 619 | | $ | 173,226 | |
| | | | | | | | | | | | | | | | |
| | | | | Acquisitions | | | | | | | | | | |
| | | | | and | | | | | | | | | | |
| | Balance at | | Purchase | | Disposals | | Cumulative | | Balance at | |
| | December 31, | | Price | | and | | Translation | | December 31, | |
| | 2017 | | Adjustments | | Impairments | | Adjustment | | 2018 | |
| | (In thousands) | |
U.S. Drilling | | $ | 50,149 | | $ | — | | $ | — | | $ | — | | $ | 50,149 | |
International Drilling | | | 75,634 | | | — | | | — | | | — | | | 75,634 | |
Drilling Solutions | | | — | | | 11,436 | (2) | | — | | | — | | | 11,436 | |
Rig Technologies | | | 47,443 | | | — | | | — | | | (748) | | | 46,695 | |
Total | | $ | 173,226 | | $ | 11,436 | | $ | — | | $ | (748) | | $ | 183,914 | |
| (1) | | Represents the goodwill recorded in connection with our acquisition of RDS.PetroMar Technologies. See Note 5—Acquisitions for additional discussion. |
| (2) | | RepresentsWe determined the carrying value of some of our reporting units exceeded their fair value. As such, we recognized a goodwill recorded in connection with our acquisitionimpairment of PetroMar.$156.0 million. See Note 5—Acquisitions for additional discussion
3—Impairments and Other Charges. |
Goodwill for the consolidated company, totaling approximately $9.2$8.2 million, is expected to be deductible for tax purposes.
Litigation and Insurance Reserves
We estimate our reserves related to litigation and insurance based on the facts and circumstances specific to the litigation and insurance claims and our past experience with similar claims. We maintain actuarially determined accruals in our consolidated balance sheets to cover self‑insuranceself-insurance retentions. See Note 17—15—Commitments and Contingencies regarding self‑insuranceself-insurance accruals. We estimate the range of our liability related to pending litigation when we believe the amount and range of loss can reasonably be estimated. We record our best estimate of a loss when the loss is considered probable. When a liability is probable and there is a range of estimated loss with no best estimate in the range, we record
the minimum estimated liability related to the lawsuits or claims. As additional information becomes available, we assess the potential liability related to our pending litigation and claims and revise our estimates. Due to uncertainties related to the resolution of lawsuits and claims, the ultimate outcome may differ from our estimates. For matters where an unfavorable outcome is reasonably possible and significant, we disclose the nature of the matter and a range of potential exposure, unless an estimate cannot be made at the time of disclosure.
Revenue Recognition
We recognize revenues and costs on daywork contracts daily as the work progresses over the contract term. For certain contracts, we receive lump sum payments for the mobilization of rigs and other drilling equipment. We defer revenue related to mobilization periods and recognize the revenue over the term of the related drilling contract.
Costs incurred related to a mobilization period for which a contract is secured are deferred and recognized over the term of the related drilling contract. Costs incurred to relocate rigs and other drilling equipment to areas in which a contract has not been secured are expensed as incurred. We defer recognition of revenue on amounts received from customers for prepayment of services until those services are provided.
We recognize revenue for top drives and other capital equipment we manufacture upon transfer of control, which generally occurs when the product has been shipped to the customer.
We recognize, as operating revenue, proceeds from business interruption insurance claims in the period that the claim is realizable. Proceeds from casualty insurance settlements in excess of the carrying value of damaged assets are recognized in other, net in our consolidated statement of income (loss) in the period that the applicable proof of loss documentation is received. Proceeds from casualty insurance settlements that are expected to be less than the carrying value of damaged assets are recognized at the time the loss is incurred and recorded in other, net in our consolidated statement of income (loss).
We recognize reimbursements received for out of pocket expenses incurred as revenues and account for out of pocket expenses as direct costs.
Research and Engineering
Research and engineering expenses are expensed as incurred and include costs associated with the research and development of new products and services and costs associated with sustaining engineering of existing products and services. As a result of our acquisition of 2TD, RDSRobotic Drilling Systems AS (“RDS”) and PetroMar Technologies, we recorded intangible assets related to in process research and development of $47.7 million, $32.5 million and $21.7 million, respectively. As these products are developed, we will transfer the balances to completed technology and begin amortizing the intangible assets over the estimated useful life. NoNaN transfers occurred during the years ended December 31, 2019, 2018 2017 or 2016. We have made progress in the development of our rotary steerable drilling technology tools and completed several successful field tests over the past few years. We have been finalizing the design enhancements on the tools and performing pilot jobs for customers during 2018.2017.
Income Taxes
We are a Bermuda exempted company and are not subject to income taxes in Bermuda. We have provided for income taxes based on the tax laws and rates in effect in the countries where we operate and earn income. The income taxes in these jurisdictions vary substantially. Our worldwide effective tax rate for financial statement purposes will continue to fluctuate from year to year due to the change in the geographic mix of pre-tax earnings.
On December 22, 2017, the United States enacted the Tax Cut and Jobs Act of 2017 (“Tax Reform Act.Act”). Among a number of significant changes to the current U.S. federal income tax rules, the Tax Reform Act reduces the marginal U.S. corporate income tax rate from 35 percent down to 21 percent, limits the current deduction for net interest expense, limits the use of net operating losses to offset future taxable income, and imposes a type of minimum tax designed to reduce the benefits derived from intercompany transactions and payments that result in base erosion. As a result of the Tax Reform Act, we were required to revalue deferred tax assets and liabilities from 35 percent to 21 percent. This revaluation has resulted in recognition of anpercent and recognized expense of approximately $138.6 million, which is included as a component of income tax expense in continuing operations for the year ended December 31, 2017. The Tax Reform Act has not had a material impact on our 2018 financial statements. During 2018, we finalized our analysis of the Tax Reform Act on our 2017 and 2018 financial statements and we have determined there are no adjustments to be recorded for our 2017 financial statements and there is no material impact on our 2018 financial statements. Our US operations do not have any controlled foreign corporations and as such are not subject to the Global Intangible Low-Taxed Income provisions of the Tax Reform Act.
We recognize increases to our tax reserves for uncertain tax positions along with interest and penalties as an increase to other long‑termlong-term liabilities.
For U.S. and other jurisdictional income tax purposes, we have net operating loss carryforwards that we are required to assess quarterly for potential valuation allowances. We consider the sufficiency of existing temporary differences and expected future earnings levels in determining the amount, if any, of valuation allowance required against such carryforwards and against deferred tax assets.
Foreign Currency Translation
For certain of our foreign subsidiaries, such as those in Canada, the local currency is the functional currency, and therefore translation gains or losses associated with foreign‑denominatedforeign-denominated monetary accounts are accumulated in a separate section of the consolidated statements of changes in equity. For our other international subsidiaries, the U.S. dollar is the functional currency, and therefore local currency transaction gains and losses, arising from remeasurement of payables and receivables denominated in local currency, are included in our consolidated statements of income (loss).
Use of Estimates
The preparation of financial statements in conformity with U.S. GAAP requires management to make certain estimates and assumptions. These estimates and assumptions affect the reported amounts of assets and liabilities, the disclosures of contingent assets and liabilities at the balance sheet date and the amounts of revenues and expenses recognized during the reporting period. Actual results could differ from such estimates. Areas where critical accounting estimates are made by management include:
| ·
● | | depreciation of property, plant and equipment; |
| ·
● | | impairment of long‑livedlong-lived assets; |
| ·
● | | impairment of goodwill and intangible assets; |
| ·
● | | impairment of short-term and equity method investments;
income taxes; |
| ·
| | litigation and self‑insuranceself-insurance reserves; and |
| ·
● | | fair value of assets acquired and liabilities assumed. |
Recent Accounting Pronouncements Adopted
In May 2014, the Financial Accounting Standards Board (“FASB”) issued ASU No. 2014-09, Revenue from Contracts with Customers, relating to the revenue recognition from contracts with customers that creates a common revenue standard for U.S. GAAP and IFRS. The core principle requires the recognition of revenue to represent the transfer of promised goods or services to customers in an amount that reflects the consideration, including costs incurred, to which the entity expects to be entitled in exchange for those goods or services. The standard also requires significantly expanded disclosures containing qualitative and quantitative information regarding the nature, amount, timing and uncertainty of revenue and cash flows arising from contracts with customers. In July 2015, the FASB approved a one year deferral of this standard, with a new effective date for fiscal years beginning after December 15, 2017. Throughout 2017 we, along with our third party consultants, identified and reviewed our revenue streams, identified a subset of contracts to represent these revenue streams and performed a detailed analysis of such contracts. We adopted this guidance under the modified retrospective approach as of January 1, 2018. The adoption of this standard did not have a material impact on our consolidated financial statements. See Note 22—Revenue Recognition.
In January 2016, the FASB issued ASU No. 2016-01, Financial Instruments—Overall, relating to the recognition and measurement of financial assets and liabilities. This standard enhances the reporting model for financial instruments, which includes amendments to address aspects of recognition, measurement, presentation and disclosure. This new standard became effective for us on January 1, 2018. Upon adoption, we recorded an adjustment to retained
earnings of $9.1 million to eliminate the net unrealized gain balance in accumulated other comprehensive income (loss) related to the marketable securities. If we do have a material amount of investments in marketable securities in the future, we expect that the impact to our consolidated statements of income (loss) and other comprehensive income (loss) from this update could be material. Furthermore, depending on trends in the stock market, we may see increased volatility in our consolidated statements of income (loss) and other comprehensive income (loss).
In August 2016, the FASB issued ASU No. 2016-15, Statement of Cash Flows, to reduce the diversity in practice in how certain cash receipts and cash payments are presented and classified in the statement of cash flows. This guidance is effective for public companies for fiscal years beginning after December 15, 2017. Early application is permitted. The adoption of this standard did not have a material impact on our consolidated financial statements.
In October 2016, the FASB issued ASU No. 2016-16, Income Taxes, which simplifies the accounting for the income tax consequences of intra-entity transfers of assets other than inventory. We adopted this standard during the first quarter of 2018 using the modified retrospective method, through a cumulative-effect adjustment directly to retained earnings. Upon adoption, we reduced deferred tax assets by approximately $34.1 million and recognized an offsetting decrease to retained earnings.
In November 2016, the FASB issued ASU No. 2016-18, Statement of Cash Flows: Restricted Cash, to provide guidance on the classification of restricted cash in the statement of cash flows. This guidance is effective for public companies for fiscal years beginning after December 15, 2017. The amendments in the ASU should be adopted on a retrospective basis. The adoption of this standard did not have a material impact on our consolidated financial statements.
In January 2017, the FASB issued ASU 2017-01, Clarifying the Definition of a Business, which clarifies the definition of a business and provides further guidance for evaluating whether a transaction will be accounted for as an acquisition of an asset or a business. The standard provides a test to determine whether a set of assets and activities acquired is a business. When substantially all of the fair value of the gross assets acquired is concentrated in a single identifiable asset or group of similar identifiable assets, the set is not a business. Under the updated guidance, an acquisition of a single property will likely be treated as an asset acquisition as opposed to a business combination and associated transaction costs will be capitalized rather than expensed as incurred. Additionally, assets acquired, liabilities assumed, and any noncontrolling interest will be measured at their relative fair values. The adoption of this standard did not have a material impact on our consolidated financial statements.
In May 2017, the FASB issued ASU 2017-09, Compensation—Stock Compensation, to reduce diversity in practice and provide clarity regarding existing guidance in ASC 718, “Stock Compensation”. The standard provides guidance on the types of changes to the terms or conditions of share-based payment awards to which an entity would be required to apply modification accounting under ASC 718. Specifically, an entity would not apply modification accounting if the fair value, vesting conditions and classification of the awards are the same immediately before and after the modification. This guidance is effective for public companies for fiscal years beginning after December 15, 2017. The adoption of this standard did not have a material impact on our consolidated financial statements.
Recent Accounting Pronouncements Not Yet Adopted
In February 2016, the FASB issued ASU No. 2016-02, Leases, relating to leases to increase transparency and comparability among companies. This standard requires that all leases with an initial term greater than one year be recorded on the balance sheet as an asset and a lease liability. Additionally, this standard will requirerequires disclosures designed to give financial statement users information on the amount, timing, and uncertainty of cash flows arising from leases. AWe adopted this guidance under the modified retrospective approach is currently required for the adoptionas of this guidance, which is effective for our reporting period beginning January 1, 2019. Prior to the issuance of ASU No. 2018-11, weWe preliminarily determined that our drilling contracts contained a lease component, and the adoption would require us to separately recognize revenue associated with the lease and services components. In July 2018, the FASB issued ASU No. 2018-11, which provides a practical expedient that allows entities to combine lease and non-lease components where the revenue recognition pattern is the same and where the lease component, when accounted for separately, would be considered an operating lease. Our drilling contracts contain a lease component related to the underlying drilling equipment, in addition to the service component provided by our crews and our expertise to operate such drilling equipment. We are currently evaluatinghave determined that the impact this updatenon-lease service component of our drilling contracts is the predominant element of the combined component and will have on our consolidated financial statements and related disclosures.account for the combined components as a single performance obligation under Topic 606, Revenue from Contracts with Customers. We have elected the package of practical expedients permitted under the transition guidance within the new standard, which among other things, allows us to carry forward the historical accounting relating to lease identification and classification for existing leases upon adoption. With respect to leases whereby we are the lessee, we are finalizing our evaluation and expect to recognizerecognized upon adoption on January 1, 2019 lease liabilities and offsetting
"right of use"use" assets of approximately $25-$30$42.8 million based on the present value of the remaining minimum rental payments under current leasing standards for existing operating leases.payments. See Note 21 — Leases.
In February 2018, the FASB issued ASU No. 2018-02, Reclassification of Certain Tax Effects from Accumulated Other Comprehensive Income, which allows a reclassification from accumulated other comprehensive income to retained earnings for stranded tax effects resulting from the Tax Cuts and Jobs Act of 2017. In addition, the standard requires certain disclosures regarding stranded tax effects. This guidance is effective for public companies for fiscal years beginning after December 15, 2019,2018, including interim periods within those fiscal years. We have elected to not reclassify the stranded tax effects within accumulated other comprehensive income to retained earnings and therefore there is no impact on our consolidated financial statements.
Recent Accounting Pronouncements Not Yet Adopted
In June 2016, the FASB issued ASU 2016-13, Financial Instruments - Credit Losses (Topic 326): Measurement of Credit Losses on Financial Instruments, which changes accounting requirements for the recognition of credit losses from an incurred or probable impairment methodology to a current expected credit losses (CECL) methodology. The guidance is effective for interim and annual periods beginning after December 15, 2019. The guidance will be applied using the modified retrospective method with a cumulative effect adjustment to beginning retained earnings. Trade receivables (including the allowance for doubtful accounts) is the only financial instrument in scope for ASU 2016-13 currently held by the Company. We are currently evaluating the impact thiseffect the guidance will have on our consolidated financial statements.
Note 3 Impairments and Other Charges
The components of impairments and other charges are provided below:
| | | | | | | | | | | |
| | Year Ended December 31, | | |
| | 2018 | | 2017 | | 2016 | | |
| | (In thousands) | | |
| | | | | | | | | | | | |
| | | | | | | | | | | | |
| | | | Year Ended December 31, | |
| | | | 2019 | | 2018 | | 2017 | |
| | | | (In thousands) | |
Tangible Assets & Equipment: | | | | | | | | | | | | | | | | | | | | | |
Provision for retirement of assets | | $ | 14,617 | | $ | — | | $ | 69,072 | | | | $ | 33,205 | | $ | 14,617 | | $ | — | |
Impairment of long-lived assets | | | 45,570 | | | 6,895 | | | 216,355 | | | | | 10,363 | | | 45,570 | | | 6,895 | |
Subtotal | | | 60,187 | | | 6,895 | | | 285,427 | | | | | 43,568 | | | 60,187 | | | 6,895 | |
| | | | | | | | | | | |
| | | | | | | | | | | | |
Goodwill & Intangible Assets: | | | | | | | | | | | | |
Goodwill impairments | | | | | 155,973 | | | — | | | — | |
Intangible asset impairment | | | | | 47,731 | | | — | | | — | |
Subtotal | | | | | 203,704 | | | — | | | — | |
| | | | | | | | | | | | |
Other Charges: | | | | | | | | | | | | | | | | | | | | | |
Other-than-temporary impairment | | | — | | | — | | | 219,737 | | |
Provision for international activities | | | | | 43,220 | | | — | | | — | |
Severance and transaction-related costs | | | | | 11,447 | | | 14,323 | | | 21,628 | |
Loss (gain) on debt buyback | | | | | (11,468) | | | 5,268 | | | 16,013 | |
Divestiture of International assets | | | 64,668 | | | — | | | — | | | | | — | | | 64,668 | | | — | |
Transaction related costs | | | 14,323 | | | 21,628 | | | — | | |
Loss (gain) on early extinguishment of debt | | | 5,268 | | | 16,013 | | | (6,665) | | |
Total | | $ | 144,446 | | $ | 44,536 | | $ | 498,499 | | | | $ | 290,471 | | $ | 144,446 | | $ | 44,536 | |
For the year ended December 31, 2019
Tangible Assets and Equipment
During 2019, as a result of the extended period of reduced demand for some of our legacy asset classes, we retired some of our rigs within our Canada Drilling and International Drilling reportable segments resulting in a loss of $17.8 million and $15.4 million, respectively. Additionally, we recorded impairments totaling $2.5 million comprised of underutilized offshore platform rigs in our International Drilling reportable segment. These impairments resulted from the lack of future contractual opportunities on specific rigs as result of current market conditions across certain geographic regions. The balance of the impairment charge primarily related to obsolete inventory within our Rig Technologies reportable segment.
Goodwill impairments
During 2019, we recognized goodwill impairment charges of $156.0 million. As part of our annual goodwill impairment test performed during the second quarter of 2019, we determined the carrying value of some of our reporting units exceeded their fair value. As such, we recognized impairments of $75.6 million for the remaining goodwill balance attributable to our International Drilling operating segment and $18.0 million for a partial impairment to our goodwill balance attributable to the acquisition of 2TD reported within our Rig Technologies operating segment. These non-cash pre-tax impairment charges were primarily the result of a sustained decline in our market capitalization and lower future cash flow projections due to expectations for future commodity prices below previous projections and the resulting impact on the lower demand projections for our products and services within these reporting units.
During the fourth quarter of 2019, due to current industry conditions such as the drop in U.S. rig count as well as the recent commodity prices and the corresponding impact on future expectations of demand for our products and services, including the effect that these factors have had on our stock price, we performed a quantitative impairment assessment of our goodwill as of December 31, 2019. Based on the results of our goodwill test, we recognized additional impairment charges of $52.2 million for the remaining goodwill balance attributable to our U.S. Drilling operating segment and $10.1 million for the remaining goodwill balance attributable to the acquisition of 2TD within our Rig Technologies operating segment.
Intangible impairments
We determined the fair value of our rotary steerable tools in-process research and development intangible asset associated with our acquisition of 2TD was less than the current book value. As such, we recognized an impairment of $47.7 million to write off the intangible asset due to uncertainty in commercialization and demand stemming from lower commodity prices and rig counts.
Provision for international activities
During 2019, we recorded provisions aggregating to $43.2 million for certain assets, including receivables related to our international activities. The provisions were attributable to a number of foreign countries, which have been adversely impacted by foreign sanctions or other political risk issues, bankruptcies or other financial problems.
Severance and transaction related costs
During 2019, we recognized charges of $11.4 million due to severance and other related costs incurred to right-size our cost structure.
Loss (gain) on early extinguishment of debt
During 2019, we repurchased $468.3 million aggregate principal amount of our senior notes and recognized a gain of $11.5 million as part of the debt extinguishment. See Note 10—Debt for additional discussion.
For the year ended December 31, 2018
Tangible Assets and Equipment
During 2018, as a result of the decline in oil and gas prices in the fourth quarter and the extended period of reduced demand for some of our legacy asset classes, we retired 13 of our remaining SCR rigs within the U.S. Drilling reportable segment resulting in a loss of $14.6 million. Additionally, we recorded impairments totaling $45.6 million primarily comprised of underutilized rigs in our International Drilling and U.S. Drilling reportable segments. These impairments were deemed necessary due to the lack of future contractual opportunities on specific rigs as result of a change in market conditions across certain geographic regions. The balance of the impairment charge primarily relatesrelated to obsolete inventory within our Rig Technologies reportable segment.
Transaction related costs
During 2018, we incurred $14.3 million in transaction related costs, including professional fees, severances, facility closure costs and other cost rationalization items, primarily in connection with the acquisition of Tesco.
Loss (gain) on early extinguishment of debt
During 2018, we repurchased $873.0 million aggregate principal amount of our senior notes. We paid the holders an aggregate of approximately $906.5 million in cash, reflecting principal and accrued and unpaid interest and prepayment premium and recognized a loss of $5.3 million as part of the debt extinguishment. See Note 11—10—Debt for additional discussion.
Divestiture of International assets
During 2018, we recognized a loss of $64.7 million on the sale of three3 offshore drilling rigs and eight8 workover rigs within our International Drilling reportable segment.
For the year ended December 31, 2017
Tangible Assets and Equipment
In 2017, we recorded impairments totaling $6.9 million primarily comprised of underutilized rigs in our International Drilling reportable segment. These impairments were deemed necessary due to the lack of future contractual opportunities because the rigs were smaller and lower horsepower than our newer rigs and also rigs competing in an overcrowded offshore market.
Transaction related costs
During 2017, we incurred $21.6 million in transaction related costs, including professional fees, severances, facility closure costs and other cost rationalization items, primarily in connection with the acquisition of Tesco.
Loss (gain) on early extinguishment of debt
During 2017, we repurchased $367.9 million aggregate principal amount of our senior notes. We paid the holders an aggregate of approximately $381.7 million in cash, reflecting principal and accrued and unpaid interest and prepayment premium and recognized a loss of $16.0 million as part of the debt extinguishment. See Note 11—10—Debt for additional discussion.
Note 4 Accounts Receivable Sales Agreement
For the year ended December 31, 2016
Throughout the first half of 2016,On September 13, 2019, we experienced decreased demand for our services as well as increased pricing pressure. Although there wasentered into a slight uptick in activity over the latter half of 2016, management evaluated our existing rig fleet and identified asset classes that may not fully participate in the next drilling cycle given the current requirements of many drilling programs and other factors. This resulted in both the provision for retirement of assets and tangible asset impairments. The majority$250.0 million accounts receivable sales agreement (the “A/R Agreement”) whereby certain U.S. operating subsidiaries of the remaining charges are attributableCompany (collectively, the “Originators”), sold or contributed, and will on an ongoing basis continue to our previous investmentsell or contribute, certain of its domestic trade accounts receivables to a wholly-owned, bankruptcy-remote, special purpose entity (the “SPE” and “Seller”). The SPE would in CJES,
which experienced severe financial and operational difficultieseligible receivables. The sale of these receivables qualified for sale accounting treatment in their business, and ultimately commenced voluntarily cases under chapter 11accordance with ASC 860. During the period of this program, cash receipts from the Purchasers at the time of the U.S. Bankruptcy code in July 2016. These charges are outlined below.
Tangible Assets and Equipment
The following table summarizes the 2016 retirement and impairment charges for tangible assets and equipment by reportablesale were classified as operating segment:
| | | | | | | | | | |
| | Provision for | | Tangible Asset | | | | |
| | Retirements | | Impairments | | Total | |
| | (In thousands) | |
U.S. Drilling | | $ | 25,365 | | $ | 163,182 | | $ | 188,547 | |
Canada Drilling | | | 19,573 | | | 1,125 | | | 20,698 | |
International Drilling | | | 23,275 | | | 12,721 | | | 35,996 | |
Drilling Solutions | | | 859 | | | — | | | 859 | |
Rig Technologies | | | — | | | 15,343 | | | 15,343 | |
Other | | | — | | | 23,984 | | | 23,984 | |
Total | | $ | 69,072 | | $ | 216,355 | | $ | 285,427 | |
During 2016, we retired certain classes of rigs and rig componentsactivities in our U.S. Drilling, Canada Drilling and International Drilling reportable segments and reduced their carrying value to their estimated salvage value. As a resultconsolidated statement of cash flows. Subsequent collections on the pledged receivables, which were not sold, will be classified as operating cash flows in our consolidated statement of cash flows at the time of collection.
Nabors Delaware and/or another subsidiary of Nabors will act as servicers of the sustained declinesold receivables. The servicers administer, collect and otherwise enforce these receivables and are compensated for doing so on terms that are generally consistent with what would be charged by an unrelated servicer. The servicers initially receive payments made by obligors on the receivables, then remit those payments in oil and gas pricesaccordance with the Receivables Purchase Agreement. The servicers and the extended periodOriginators have contingent indemnification obligations to the SPE, and the SPE has contingent indemnification obligations to the Purchasers, in each case customary for transactions of reduced demand for some of our legacy asset classes, we retired 24 of our remaining SCR rigs withinthis type. These contingent indemnification obligations are guaranteed by the U.S. Drilling reportable segment. We utilized someCompany pursuant to an Indemnification Guarantee in favor of the parts on these retired rigs to enhance and upgrade other existing rigs in our fleet. Additionally, we retired 7 older rigs in our Canada Drilling reportable segment. Within our International Drilling reportable segment, we also retired various older, smaller and in some cases functionally obsolete rigs and yard assets.
In 2016, we also recorded impairments totaling $216.4 million primarily comprised of $163.2 millionPurchasers. The Purchasers have no recourse for underutilized rigs in our U.S. Drilling reportable segment as well as $12.7 million in our International Drilling reportable segment. These impairments were deemed necessary due to the lack of future contractual opportunities because the rigs were smaller and lower horsepower than our newer rigs, which limits the rigs functional capabilities of drilling many of the more complex wells in the current environment. Included in the other amount was an impairment of $22.4 millionreceivables that we recognized related to our retained interest in the oil and gas properties located on the North Slope of Alaska to reduce the carrying value to fair value,are uncollectible as a result of the sustained decline in oil prices. The balanceinsolvency or inability to pay of the impairment charge primarily relatesaccount debtors.
The maximum purchase commitment of the Purchasers under the A/R Agreement is $250.0 million. The amount available for sale to obsolete inventory and various rig-related equipment within our Rig Technologies reportable segment.
Other-than-temporary impairment
During 2016, we recognized impairment charges associated with our CJES holdings in the Purchasers under the A/R Agreement fluctuates over time based on the total amount of $216.2eligible receivables generated during the normal course of business after excluding excess concentrations and certain other ineligible receivables. As of December 31, 2019, the total amount of eligible receivables available for purchase by the Purchasers was $171.7 million, resultingof which $140.0 million had been sold to the Purchasers. Trade accounts receivable sold by the SPE to the Purchasers are derecognized from declines in theour condensed consolidated balance sheet. The fair value of our investment including other than temporary impairment charges of $192.4 million. Additionally, we recorded a charge relatedthe sold receivables approximated book value due to a reserve of certain other amounts associated with our CJES holdings, including affiliate receivables of $23.8 million.
The balancethe short-term nature of the charge was related to an impairment of an equity security duringreceivables and, as a result, 0 gain or loss on the third quarter of 2016. As the trading pricesale of the security remained below our cost basis for an extended period, we determinedreceivables was recorded. Trade receivables pledged by the investment was other than temporarily impaired and it was appropriateSPE as collateral to write down the investment’s carrying valuePurchasers (excluding receivables sold to its current estimated fair value. See Note 9—Investments in Unconsolidated Affiliates.
Loss (gain) on early extinguishment of debt
During 2016, we repurchased $152.7the Purchasers) totaled $143.6 million aggregate principal amount of our senior notes. We paid the holders an aggregate of approximately $157.5 million in cash, reflecting principal and accrued and unpaid interest and prepayment premium and recognized a gain as part of the debt extinguishment. See Note 11—Debt for additional discussion.
Note 4 Assets Held for Sale and Discontinued Operations
Assets Held for Sale
Assets held for sale as of December 31, 2018 and 2017 was $12.3 million and $37.1 million, respectively. As of December 31, 2017, these assets consisted primarily of our oil and gas holdings which were mainly in the Horn River basin in western Canada of $25.9 million and the operating results were reflected in discontinued operations. During November 2018, we sold our remaining wholly owned oil and gas business in Canada for approximately $8.0 million. As part of the agreement, we have agreed to keep $2.4 million of the pipeline commitment which ends in May 2019. The remainder, including the entire balance as of December 31, 2018, represents assets that meet the criteria to be classified as assets held for sale, but do not represent a disposal of a component of an entity or a group of components of an entity representing a strategic shift that has or will have a major effect on the entity's operations and financial results.
The carrying value of our assets held for sale represents the lower of carrying value or fair value less costs to sell. We continue to market these properties at prices that are reasonable compared to current fair value.
We have contracts with pipeline companies to pay specified fees based on committed volumes for gas transport and processing associated with these properties held for sale. At December 31, 2018, our undiscounted contractual commitments for these contracts approximated $2.4 million, all of which were classified as current2019 and are included in accrued liabilities. At December 31, 2017,accounts receivable, net in our undiscounted contractual commitments for these contracts approximated $11.2 million, and we had total liabilities of $8.5 million, $6.1 million of which were classified as current and are included in accrued liabilities.
condensed consolidated balance sheet. The amounts at each balance sheet date represented our best estimateassets of the fair valueSPE cannot be used by the Company for general corporate purposes. Additionally, creditors of the excess capacitySPE do not have recourse to assets of the pipeline commitments calculated using a discounted cash flow model, when considering our disposal plan, current production levels, natural gas prices and expected utilizationCompany (other than assets of the pipeline over the remaining contractual term. Decreases in actual production or natural gas prices could result in future charges related to excess pipeline commitments.SPE).
Discontinued Operations
The operating results from the assets discussed above for all periods presented are presented and accounted for as discontinued operations in the accompanying consolidated statements of income (loss) and the respective accompanying notes to the consolidated financial statements. Our condensed statements of income (loss) from discontinued operations for each reportable segment were as follows:
| | | | | | | | | | | | |
| | | | Year Ended December 31, | |
| | | | 2018 | | 2017 | | 2016 | |
| | | | (In thousands) | |
| | | | | | | | | | |
Operating revenues (1) | | | | $ | 4,078 | | $ | 6,169 | | $ | 2,859 | |
Income (loss) from Oil & Gas discontinued operations: | | | | | | | | | | | | |
Income (loss) from discontinued operations | | | | $ | (2,766) | | $ | (2,506) | | $ | (3,978) | |
Less: Impairment charges or other (gains) and losses on sale of wholly owned assets (2) | | | | $ | 17,199 | | $ | 51,028 | | $ | 19,445 | |
Less: Income tax expense (benefit) | | | | $ | (5,302) | | $ | (10,015) | | $ | (5,060) | |
Income (loss) from Oil and Gas discontinued operations, net of tax | | | | $ | (14,663) | | $ | (43,519) | | $ | (18,363) | |
| (1)
| | Reflects operating revenues of our historical oil and gas reportable segment.
|
| (2)
| | Includes impairment charges of $17.0 million, $35.3 million and $15.4 million in 2018, 2017 and 2016, respectively, due to the deterioration of economic conditions in the natural gas market in western Canada, partially offset by a gain related to our restructure of our future pipeline obligations. Additionally, this line item includes a charge of $16.5 million related to the settlement of litigation during 2017 associated with our previously owned Ramshorn International properties.
|
Additional discussion of our policy pertaining to the calculations of our annual impairment tests, including any impairment to goodwill, is set forth in Note 2—Summary of Significant Accounting Policies. A further protraction of lower commodity prices or an inability to sell these assets in a timely manner could result in recognition of future impairment charges.
Note 5 Acquisitions
2018 Acquisitions
On October 3, 2018, we purchased PetroMar Technologies, a small developer and operator of LWD downhole tools focusing on high-value formation data to facilitate completion optimization particularly in unconventional reservoirs. The tools complement our existing wellbore placement capabilities and will be included in our Drilling Solutions operating segment. Under the terms of the transaction, we paid an initial purchase price of $25.0 million. We may also be required to make future payments that are contingent upon the future financial performance of this operation. As part of our purchase price allocation, we have recorded intangible assets of $36.2 million ($13.7 million of developed technology, $21.7 million of in process research and development and $0.8 million for tradename), goodwill of approximately $11.4 million and other liabilities of $22.6 million (net of other working capital items) primarily related to the estimate of contingent payments on future financial performance as noted above. The pro forma effect on revenue and net income (loss) have been determined to be immaterial to our financial statements. After further tests, the acquisition is not significant and as such we have not included disclosures of the allocation of the purchase price or any pro forma information.
2017 Acquisitions
Robotic Drilling Systems
On September 5, 2017 we paid approximately $50.7 million in cash, subject to customary closing adjustments, to acquire Robotic Drilling Systems AS (“RDS”), a provider of automated tubular and tool handling equipment for the onshore and offshore drilling markets based in Stavanger, Norway. This transaction will allow us to integrate RDS’s highly capable team and product offering with the technology portfolio of our Rig Technologies segment and strengthens the development of our drilling automation solutions. As part of our purchase price allocation, we have recorded intangible assets of $53.3 million ($20.8 million of developed technology and $32.5 million of in process research and development), goodwill of approximately $5.7 million and other liabilities of $7.3 million (net of other working capital items). The intangible assets related to developed technology are being amortized using the straight-line method over the estimated useful life of 10 years. We have consolidated the operating results of RDS since the acquisition date and reported those results in our Rig Technologies segment. The pro forma effect on revenue and net income (loss) have been determined to be immaterial to our financial statements. Further, tests of significance for this acquisition do not result in a significant acquisition and as such we have not included disclosures of the allocation of the purchase price or any pro forma information.
Tesco Corporation
On December 15, 2017, Nabors completed the acquisition of Tesco Corporation (“Tesco”). Tesco’s tubular services business benefits our Drilling Solutions segment as we expanded into numerous key regions globally. Additionally, the acquisition combined Tesco’s rig equipment manufacturing, rental and aftermarket service business into our Rig Technologies segment, creating a leading rig equipment and drilling automation provider. Under the terms of the acquisition, Nabors acquired all common shares of Tesco in an all-stock transaction, with Tesco shareholders receiving 0.68 common shares of Nabors for each Tesco share owned, or approximately 32.1 million Nabors common shares. The fair value of common shares issued was $179.0 million based on the closing price of Nabors common shares as of the last trading day prior to the issuance as stipulated in the acquisition agreement.
The following table provides the final allocation of the purchase price as of the acquisition date.
| | | | | |
| | Fair Value | | |
| | | | | |
| | | Fair Value | |
(In thousands) | | at Acquisition | | | at Acquisition | |
Assets: | | | | | | | | |
Cash and cash equivalents | | $ | 59,804 | | | $ | 59,804 | |
Accounts receivable | | | 40,465 | | | | 40,465 | |
Inventory | | | 44,525 | | | | 44,525 | |
Other current assets | | | 13,889 | | | | 13,889 | |
Property, plant and equipment | | | 68,591 | | | | 68,591 | |
Other long-term assets | | | 3,647 | | | | 3,647 | |
Total assets | | | 230,921 | | | | 230,921 | |
Liabilities: | | | | | | | | |
Accounts payable | | $ | 14,111 | | | $ | 14,111 | |
Accrued liabilities | | | 35,383 | | | | 35,383 | |
Other long-term liabilities | | | 2,436 | | | | 2,436 | |
Total liabilities | | | 51,930 | | | | 51,930 | |
Net assets acquired | | $ | 178,991 | | | $ | 178,991 | |
We have consolidated the operating results of Tesco since the acquisition date and reported those results in our Drilling Solutions and Rig Technologies segments. We included an additional $7.7 million in operating revenues and $0.1 million in earnings from the acquisition date through December 31, 2017 in our consolidated statements of income (loss) as a result of this acquisition.
The following unaudited supplemental pro forma results present consolidated information as if the acquisition had been completed as of January 1, 2016. The unaudited supplemental pro forma results should not be considered indicative of the results that would have occurred if the acquisition had been consummated as of January 1, 2016; nor are they indicative of future results.
| | | | | | | |
| | Year Ended | |
| | December 31, | |
(In thousands, except per share amounts) | | 2017 | | 2016 | |
Operating revenues | | $ | 2,717,933 | | $ | 2,362,576 | |
Income (loss) from continuing operations, net of tax | | | (554,235) | | | (1,129,172) | |
Income (loss) from continuing operations per share - basic | | $ | (1.75) | | $ | (3.59) | |
Income (loss) from continuing operations per share - diluted | | $ | (1.75) | | $ | (3.59) | |
Note 6 Fair Value Measurements
Fair value is the price that would be received upon sale of an asset or paid upon transfer of a liability in an orderly transaction between market participants at the measurement date (exit price). We utilize market data or assumptions that market participants would use in pricing the asset or liability, including assumptions about risk and the risks inherent in the inputs to the valuation technique. These inputs can be readily observable, market‑corroborated,market-corroborated, or generally unobservable. We primarily apply the market approach for recurring fair value measurements and endeavor to utilize the best information available. Accordingly, we employ valuation techniques that maximize the use of observable inputs and minimize the use of unobservable inputs. The use of unobservable inputs is intended to allow for fair value determinations in situations where there is little, if any, market activity for the asset or liability at the measurement date. We are able to classify fair value balances utilizing a fair value hierarchy based on the observability of those inputs. Under the fair value hierarchy:
| ·
● | | Level 1 measurements include unadjusted quoted market prices for identical assets or liabilities in an active market; |
| ·
● | | Level 2 measurements include quoted market prices for identical assets or liabilities in an active market that have been adjusted for items such as effects of restrictions for transferability and those that are not quoted but are observable through corroboration with observable market data, including quoted market prices for similar assets; and |
| ·
● | | Level 3 measurements include those that are unobservable and of a subjective nature. |
The following table sets forth, by level within the fair value hierarchy, ourOur financial assets and liabilities that are accounted for at fair value on a recurring basis as of December 31, 2019 and 2018 consisted of available-for-sale equity and 2017.debt securities. Our debt securities could transfer into or out of a Level 1 or 2 measure depending on the availability of independent and current pricing at the end of each quarter. During 2018,2019, there were no0 transfers of our financial assets between Level 1 and Level 2 measures. Our financial assets and liabilities are classified in their entirety based on the lowest level of input that is significant to the fair value measurement. As of December 31, 2019 and 2018, our short-term investments were carried at fair market value and totaled $16.5 million and $34.0 million, respectively, and primarily consisted of Level 1 measurements. No material Level 2 or Level 3 measurements exist as of any of the periods presented.
| | | | | | | | | | |
| | Fair Value as of December 31, 2018 | |
| | Level 1 | | Level 2 | | Level 3 | |
| | (In thousands) | |
Assets: | | | | | | | | | | |
Short-term investments: | | | | | | | | | | |
Equity securities | | $ | 33,250 | | $ | 778 | | $ | — | |
Mortgage-CMO debt securities | | | — | | | 8 | | | — | |
Total short-term investments | | $ | 33,250 | | $ | 786 | | $ | — | |
| | | | | | | | | | |
| | Fair Value as of December 31, 2017 | |
| | Level 1 | | Level 2 | | Level 3 | |
| | (In thousands) | |
Assets: | | | | | | | | | | |
Short-term investments: | | | | | | | | | | |
Equity securities | | $ | 22,909 | | $ | 5,450 | | $ | — | |
Mortgage-CMO debt securities | | | — | | | 10 | | | — | |
Total short-term investments | | $ | 22,909 | | $ | 5,460 | | $ | — | |
Nonrecurring Fair Value Measurements
We applied fair value measurements to our nonfinancial assets and liabilities measured on a nonrecurring basis, which consist of measurements primarily to assets held-for-sale, goodwill, intangible assets and other long‑livedlong-lived assets and assets acquired and liabilities assumed in a business combination and our pipeline contractual commitment.combination. Based upon our review of the fair value hierarchy, the inputs used in these fair value measurements were considered Level 3 inputs.
Fair Value of Financial Instruments
We estimate the fair value of our financial instruments in accordance with U.S. GAAP. The fair value of our long‑termlong-term debt and revolving credit facilities is estimated based on quoted market prices or prices quoted from
third‑party third-party financial institutions, thus a levelLevel 2 measurement. The carrying and fair values of these liabilities were as follows:
| | | | | | | | | | | | | | | | |
| | As of December 31, | |
| | | | | 2018 | | | | | | | | 2017 | | |
| | Effective | | | | | | | Effective | | | | | | | |
| | Interest | | Carrying | | Fair | | Interest | | Carrying | | Fair | |
| | Rate | | Value | | Value | | Rate | | Value | | Value | |
| | | | (In thousands) | | | | (In thousands) | |
6.15% senior notes due February 2018 | | — | % | $ | — | | $ | — | | 6.27 | % | $ | 460,762 | | $ | 462,674 | |
9.25% senior notes due January 2019 | | — | % | | — | | — | | 9.77 | % | | 303,489 | | | 321,028 | |
| | | | | | | | | | | | | | | | | |
| | | As of December 31, |
| | | 2019 | | 2018 |
| | | Interest | | Carrying | | Fair | | Interest | | Carrying | | Fair |
| | | Rate | | Value | | Value | | Rate | | Value | | Value |
| | | (In thousands) |
5.00% senior notes due September 2020 | | 5.25 | % | | 614,748 | | 590,336 | | 5.43 | % | | 669,846 | | | 670,757 | | 5.44 | % | $ | 282,046 | | $ | 284,907 | | 5.25 | % | $ | 614,748 | | $ | 590,336 |
4.625% senior notes due September 2021 | | 4.75 | % | | 668,347 | | 603,457 | | 4.76 | % | | 695,108 | | | 665,003 | | 4.76 | % | | 634,588 | | | 632,516 | | 4.75 | % | | 668,347 | | | 603,457 |
5.50% senior notes due January 2023 | | 5.84 | % | | 586,000 | | 465,999 | | 5.85 | % | | 600,000 | | | 584,850 | | 5.90 | % | | 501,003 | | | 483,834 | | 5.84 | % | | 586,000 | | | 465,999 |
5.10% senior notes due September 2023 | | 5.26 | % | | 342,923 | | 262,494 | | 5.28 | % | | 346,576 | | | 325,844 | | 5.24 | % | | 336,810 | | | 303,860 | | 5.26 | % | | 342,923 | | | 262,494 |
0.75% senior exchangeable notes due January 2024 | | 6.04 | % | | 450,689 | | 358,012 | | 5.90 | % | | 429,982 | | | 443,940 | | 5.97 | % | | 472,603 | | | 431,503 | | 6.04 | % | | 450,689 | | | 358,012 |
5.75% senior notes due February 2025 | | 5.87 | % | | 791,502 | | 598,953 | | — | % | | — | | | — | | 6.01 | % | | 781,502 | | | 705,040 | | 5.87 | % | | 791,502 | | | 598,953 |
2012 Revolving credit facility | | 3.58 | % | | 170,000 | | 170,000 | | 2.73 | % | | 510,000 | | | 510,000 | | 3.71 | % | | 355,000 | | | 355,000 | | 3.58 | % | | 170,000 | | | 170,000 |
2018 Revolving credit facility | | — | % | | — | | — | | — | % | | — | | | — | | — | % | | — | | | — | | — | % | | — | | | — |
Commercial paper | | — | % | | — | | — | | 1.87 | % | | 40,000 | | | 40,000 | |
Other | | — | % | | 561 | | | 561 | | — | % | | 181 | | | 181 | | — | % | | — | | | — | | — | % | | 561 | | | 561 |
| | | | | 3,624,770 | | $ | 3,049,812 | | | | | 4,055,944 | | $ | 4,024,277 | |
| | | | | | 3,363,552 | | $ | 3,196,661 | | | | | 3,624,770 | | $ | 3,049,812 |
Less: current portion | | | | | 561 | | | | | | | 181 | | | | | | | | — | | | | | | | | 561 | | | |
Less: deferred financing costs | | | | | 38,325 | | | | | | | 27,997 | | | | | | | | 30,332 | | | | | | | | 38,325 | | | |
| | | | $ | 3,585,884 | | | | | | $ | 4,027,766 | | | | |
| | | | | $ | 3,333,220 | | | | | | | $ | 3,585,884 | | | |
The fair values of our cash equivalents, trade receivables and trade payables approximate their carrying values due to the short‑termshort-term nature of these instruments.
As of December 31, 2018, our short-term investments were carried at fair market value and included $34.0 million. As of December 31, 2017, our short-term investments were carried at fair market value and included $28.4 million.
Note 7 Share‑BasedShare-Based Compensation
Total share‑basedshare-based compensation expense, which includes stock options and restricted shares, was $24.7 million, $26.4 million and $31.9 million for 2019, 2018 and $32.0 million for 2018, 2017, and 2016, respectively. Compensation expense related to awards of restricted shares totaled $24.5 million, $26.0 million and $31.4 million for 2019, 2018 and $31.3 million for 2018, 2017, and 2016, respectively, which is included in direct costs and general and administrative expenses in our consolidated statements of income (loss). Share-based compensation expense has been allocated to our various reportable segments. See Note 21—19—Segment Information.
In addition to the time-based restricted stock share-based awards, historically we provide twohave provided 2 types of performance share awards: the first, based on our performance measured against pre-determined performance metrics (“Performance Shares”) and the second, based on market conditions measured against a predetermined peer group (“TSR Shares”). The performance period for the awards granted in 20182019 commenced on January 1, 20172018 and ended December 31, 2017.2018.
Stock Option Plans
As of December 31, 2018,2019, we had several stock plans under which options to purchase our common shares could be granted to key officers, directors and managerial employees of Nabors and its subsidiaries. Options granted under the plans generally are at prices equal to the fair market value of the shares on the date of the grant. Options granted under the plans generally are exercisable in varying cumulative periodic installments after one year. In the case
of certain key executives and directors, options granted may vest immediately on the grant date. Options granted under the plans cannot be exercised more than ten years from the date of grant. Options to purchase 15.28.5 million and
6.8 15.2 million Nabors common shares remained available for grant as of December 31, 20182019 and 2017,2018, respectively. Of the common shares available for grant as of December 31, 2018,2019, approximately 14.37.7 million of these shares are also available for issuance in the form of restricted shares.
The fair value of each option award is estimated on the date of grant using the Black-Scholes option-pricing model which uses assumptions for the risk-free interest rate, volatility, dividend yield and the expected term of the options. The risk-free interest rate is based on the U.S. Treasury yield curve in effect at the time of grant for a period equal to the expected term of the option. Expected volatilities are based on implied volatilities from traded options on Nabors’ common shares, historical volatility of Nabors’ common shares, and other factors. We use historical data to estimate the expected term of the options and employee terminations within the option-pricing model; separate groups of employees that have similar historical exercise behavior are considered separately for valuation purposes. The expected term of the options represents the period of time that the options granted are expected to be outstanding.
Stock option transactions under our various stock-based employee compensation plans are presented below:
| | | | | | | | | | | | | |
| | | | | | | Weighted- | | | | | |
| | | | Weighted- | | Average | | | | | |
| | | | Average | | Remaining | | Aggregate | | |
| | | | Exercise | | Contractual | | Intrinsic | | |
| | | | | | | | | | | | | |
| | | | | | | | Weighted- | | | | |
| | | | | Weighted- | | Average | | | | |
| | | | | Average | | Remaining | | Aggregate | |
| | | | | Exercise | | Contractual | | Intrinsic | |
Options | | Shares | | Price | | Term | | Value | | | Shares | | Price | | Term | | Value | |
| | (In thousands, except exercise price) | | |
Options outstanding as of December 31, 2017 | | 4,394 | | $ | 13.04 | | | | | | | | |
| | | (In thousands, except exercise price) | |
Options outstanding as of December 31, 2018 | | | 3,776 | | $ | 11.36 | | | | | | | |
Granted | | 171 | | | 4.82 | | | | | | | | | 138 | | | 2.60 | | | | | | | |
Exercised | | — | | | — | | | | | | | | | — | | | — | | | | | | | |
Surrendered | | | (2,269) | | | 9.83 | | | | | | | |
Forfeited | | (789) | | | 19.28 | | | | | | | | | (15) | | | 9.18 | | | | | | | |
Options outstanding as of December 31, 2018 | | 3,776 | | $ | 11.36 | | 2.03 | years | | $ | — | | |
Options exercisable as of December 31, 2018 | | 3,759 | | $ | 11.35 | | 2.01 | years | | $ | — | | |
Options outstanding as of December 31, 2019 | | | 1,630 | | $ | 12.77 | | 4.37 | years | | $ | 119 | |
Options exercisable as of December 31, 2019 | | | 1,630 | | $ | 12.77 | | 4.37 | years | | $ | 119 | |
During 2019, 2018 2017 and 2016,2017, respectively, we awarded options vesting over periods up to four years to purchase 137,954, 171,124 124,271 and 99,711124,271 of our common shares to certain of our employees, executive officers and directors.
The fair value of stock options granted during 2019, 2018 2017 and 20162017 was calculated using the Black‑ScholesBlack-Scholes option pricing model and the following weighted‑averageweighted-average assumptions:
| | | | | | | | | | |
| | Year Ended December 31, |
| | 2019 | | 2018 | | 2017 | |
Weighted average fair value of options granted | | $ | 1.07 | | $ | 1.75 | | $ | 2.86 | |
Weighted average risk free interest rate | | | 1.79% | | | 2.59% | | | 1.85% | |
Dividend yield | | | 1.65% | | | 3.03% | | | 2.94% | |
Volatility (1) | | | 57.59% | | | 57.11% | | | 50.82% | |
Expected life (in years) | | | 4.0 | | | 4.0 | | | 4.0 | |
| | | | | | | | | | |
| | Year Ended December 31, |
| | 2018 | | 2017 | | 2016 | |
Weighted average fair value of options granted | | $ | 1.75 | | $ | 2.86 | | $ | 3.52 | |
Weighted average risk free interest rate | | | 2.59% | | | 1.85% | | | 1.09% | |
Dividend yield | | | 3.03% | | | 2.94% | | | 2.21% | |
Volatility (1) | | | 57.11% | | | 50.82% | | | 45.69% | |
Expected life (in years) | | | 4.0 | | | 4.0 | | | 4.0 | |
| (1) | (1)
| | Expected volatilities are based on implied volatilities from publicly traded options to purchase Nabors' common shares, historical volatility of Nabors' common shares and other factors. |
A summary of our unvested stock options as of December 31, 2018,2019, and the changes during the year then ended is presented below:
| | | | | | | |
| | | | Weighted-Average | | |
| | | | Grant-Date Fair | | |
| | | | | | | |
| | | | | Weighted-Average | |
| | | | | Grant-Date Fair | |
Unvested Stock Options | | Outstanding | | Value | | | Outstanding | | Value | |
| | (In thousands, except fair value) | | |
Unvested as of December 31, 2017 | | 34 | | $ | 5.21 | | |
| | | (In thousands, except fair value) | |
Unvested as of December 31, 2018 | | | 17 | | $ | 5.21 | |
Granted | | 171 | | | 1.75 | | | 138 | | | 1.07 | |
Vested | | (188) | | | 2.07 | | | (155) | | | 1.53 | |
Forfeited | | — | | | — | | | — | | | — | |
Unvested as of December 31, 2018 | | 17 | | $ | 5.21 | | |
Unvested as of December 31, 2019 | | | — | | $ | — | |
The total intrinsic value of options exercised during 2017 and 2016 was $5.1 million and $0.3 million, respectively.million. There were no0 options exercised during 2019 or 2018. The total fair value of options that vested during the years ended December 31, 2019, 2018 and 2017 and 2016 was $0.2 million, $0.4 million $0.5 million and $1.9$0.5 million, respectively.
As of December 31, 2018, there was $0.04 million of total future compensation cost related to unvested options that are expected to vest. That cost is expected to be recognized over a weighted‑average period of less than one year.
Restricted Shares
Our stock plans allow grants of restricted shares. Restricted shares are issued on the grant date, but cannot be sold or transferred. Restricted shares vest in varying periodic installments ranging up to five years.
A summary of our restricted shares as of December 31, 2018,2019, and the changes during the year then ended, is presented below:
| | | | | | | |
| | | | Weighted-Average | | |
| | | | Grant-Date Fair | | |
| | | | | | | |
| | | | | Weighted-Average | |
| | | | | Grant-Date Fair | |
Restricted shares | | Outstanding | | Value | | | Outstanding | | Value | |
| | (In thousands, except fair value) | | |
Unvested as of December 31, 2017 | | 3,298 | | $ | 12.67 | | |
| | | (In thousands, except fair value) | |
Unvested as of December 31, 2018 | | | 3,612 | | $ | 9.16 | |
Granted | | 2,392 | | | 6.92 | | | 3,265 | | | 3.26 | |
Vested | | (1,290) | | | 13.32 | | | (1,444) | | | 9.66 | |
Forfeited | | (788) | | | 10.25 | | | (521) | | | 6.06 | |
Unvested as of December 31, 2018 | | 3,612 | | $ | 9.16 | | |
Unvested as of December 31, 2019 | | | 4,912 | | $ | 5.42 | |
During 2019, 2018 2017 and 2016,2017, we awarded 3,264,925, 2,392,486 1,130,304 and 1,885,4401,130,304 restricted shares, respectively, to our employees and directors. These awards had an aggregate value at their date of grant of $10.6 million, $16.6 million $14.5 million and $20.5$14.5 million, respectively, and were scheduled to vest over a period of up to four years. The fair value of restricted shares that vested during 2019, 2018 and 2017 and 2016 was $4.1 million, $8.7 million $19.2 million and $13.5$19.2 million, respectively.
As of December 31, 2018,2019, there was $22.7$17.9 million of total future compensation cost related to unvested restricted share awards that are expected to vest. That cost is expected to be recognized over a weighted‑averageweighted-average period of approximately two years.
Restricted Shares Based on Performance Conditions
During the years ended December 31, 2019, 2018 2017 and 2016,2017, we awarded 2,412,631, 1,009,948 461,919 and 1,284,829461,919 restricted shares, respectively, vesting over a period of three years to some of our executives. The Performance Share awards granted were based upon achievement of specific financial or operational objectives. The number of shares granted was determined by the percentage of performance goals achieved during fiscal years 2018, 2017 2016 and 2015,2016, respectively. These awards had an aggregate fair value at their date of grant of $7.5 million, $7.0 million $7.1 million and $13.9$7.1 million, respectively.
The following table sets forth information regarding outstanding restricted shares based on performance conditions as of December 31, 2018:2019:
| | | | | | |
| | | | Weighted-Average | |
| | | | Grant-Date Fair | |
| | | | | | |
| | | | | Weighted-Average |
| | | | | Grant-Date Fair |
Performance based restricted shares | | Outstanding | | Value | | Outstanding | | Value |
| | (In thousands, except fair value) | |
Outstanding as of December 31, 2017 | | 1,413 | | $ | 12.49 | |
| | | (In thousands, except fair value) |
Outstanding as of December 31, 2018 | | | 1,746 | | $ | 9.35 |
Granted | | 1,010 | | | 6.89 | | 2,413 | | | 3.10 |
Vested | | (677) | | | 12.24 | | (919) | | | 10.15 |
Outstanding as of December 31, 2018 | | 1,746 | | $ | 9.35 | |
Outstanding as of December 31, 2019 | | | 3,240 | | $ | 4.47 |
Until shares are granted, our Performance Share awards are liability-classified awards. Our accrued liabilities included $2.4 million for such awards at December 31, 2019 for the performance period beginning January 1, 2019 through December 31, 2019 and $2.2 million for such awards at December 31, 2018 for the performance period beginning January 1, 2018
through December 31, 2018 and $2.2 million for such awards at December 31, 2017 for the performance period beginning January 1, 2017 through December 31, 2017.2018. The fair value of these awards that vested during the years ended December 31, 2019, 2018 and 2017 and 2016 was $2.5 million, $4.8 million $7.1 million and $1.5$7.1 million, respectively. The fair value of these liability-classified awards are estimated at each reporting period, based on internal metrics and marked to market.
Restricted Shares Based on Market Conditions
During 2019, 2018 2017 and 2016,2017, we granted awards for 2,609,561, 1,058,158 397,692 and 749,427397,692 TSR Shares, respectively, which are equity classified awards and will vest on our performance compared to our peer group over a three-year period. These awards had an aggregate fair value at their date of grant of $3.7 million, $5.1 million $4.4 million and $4.2$4.4 million, respectively, after consideration of all assumptions.
The grant date fair value of these awards was based on a Monte Carlo model, using the following assumptions:
| | | | | | | | | | | |
| | | Year Ended December 31, | | |
| | 2018 | | 2017 | | 2016 | | |
| | | | | | | | | | | |
| | | | | | | | | | | |
| | | | Year Ended December 31, | |
| | | 2019 | | 2018 | | 2017 | |
| | | | | | | | | | | |
Risk free interest rate | | | 2.02% | | | 1.62% | | | 1.41% | | | | 2.48% | | | 2.02% | | | 1.62% | |
Expected volatility | | | 57.00% | | | 55.00% | | | 52.00% | | | | 70.00% | | | 57.00% | | | 55.00% | |
Closing stock price at grant date | | $ | 6.87 | | $ | 16.81 | | $ | 8.64 | | | $ | 2.19 | | $ | 6.87 | | $ | 16.81 | |
Expected term (in years) | | | 3.0 | | | 3.0 | | | 3.0 | | | | 3.0 | | | 3.0 | | | 3.0 | |
The following table sets forth information regarding outstanding restricted shares based on market conditions as of December 31, 2018:2019:
| | | | | | | |
| | | | Weighted-Average | | |
| | | | Grant-Date Fair | | |
| | | | | | | |
| | | | | Weighted-Average | |
| | | | | Grant-Date Fair | |
Market based restricted shares | | Outstanding | | Value | | | Outstanding | | Value | |
| | (In thousands, except fair value) | | |
Outstanding as of December 31, 2017 | | 1,692 | | $ | 7.89 | | |
| | | (In thousands, except fair value) | |
Outstanding as of December 31, 2018 | | | 1,357 | | $ | 7.09 | |
Granted | | 1,058 | | | 4.77 | | | 2,610 | | | 1.42 | |
Vested | | (218) | | | 8.67 | | | (188) | | | 5.58 | |
Forfeited | | (1,175) | | | 5.86 | | | (562) | | | 5.58 | |
Outstanding as of December 31, 2018 | | 1,357 | | $ | 7.09 | | |
Outstanding as of December 31, 2019 | | | 3,217 | | $ | 2.84 | |
As of December 31, 2018,2019, there was $4.9$4.2 million of total future compensation cost related to unvested TSR Share awards that are expected to vest.
Note 8 Property, Plant and Equipment
The major components of our property, plant and equipment are as follows:
| | | | | | | |
| | December 31, | |
| | 2019 | | 2018 | |
| | (In thousands) | |
Land | | $ | 33,931 | | $ | 43,187 | |
Buildings | | | 132,603 | | | 123,619 | |
Drilling rigs and related equipment | | | 12,948,504 | | | 13,021,580 | |
Oilfield hauling and mobile equipment | | | 270,826 | | | 267,223 | |
Other machinery and equipment | | | 192,081 | | | 197,094 | |
Oil and gas properties | | | 12,286 | | | 12,286 | |
Construction-in-process (1) | | | 25,391 | | | 30,395 | |
| | $ | 13,615,622 | | $ | 13,695,384 | |
Less: accumulated depreciation and amortization | | | (8,685,073) | | | (8,227,514) | |
| | $ | 4,930,549 | | $ | 5,467,870 | |
| | | | | | | |
| | December 31, | |
| | 2018 | | 2017 | |
| | (In thousands) | |
Land | | $ | 43,187 | | $ | 52,000 | |
Buildings | | | 123,619 | | | 134,318 | |
Drilling rigs and related equipment | | | 13,021,580 | | | 12,997,470 | |
Marine transportation and supply vessels | | | — | | | 4,377 | |
Oilfield hauling and mobile equipment | | | 267,223 | | | 272,384 | |
Other machinery and equipment | | | 197,094 | | | 172,674 | |
Oil and gas properties | | | 12,286 | | | 12,286 | |
Construction-in-process (1) | | | 30,395 | | | 284,348 | |
| | $ | 13,695,384 | | $ | 13,929,857 | |
Less: accumulated depreciation and amortization | | | (8,227,514) | | | (7,820,292) | |
| | $ | 5,467,870 | | $ | 6,109,565 | |
| (1) | (1)
| | Relates primarily to amounts capitalized for new or substantially new drilling rigs and related equipment that were under construction and had not yet been placed in service as of December 31, 20182019 or 2017. 2018. |
Depreciation expense included in depreciation and amortization expense in our consolidated statements of income (loss) totaled $860.1$869.6 million, $860.6 million and $835.9 million during 2019, 2018 and $855.4 million during 2018, 2017, and 2016, respectively.
Repair and maintenance expense included in direct costs in our consolidated statements of income (loss) totaled $248.6 million, $265.6 million and $241.4 million during 2019, 2018 and $151.8 million during 2018, 2017, and 2016, respectively.
Interest costs of $1.5 million, $1.0 million $2.5 million and $6.7$2.5 million were capitalized during 2019, 2018 2017 and 2016,2017, respectively.
Note 9 Investments in Unconsolidated Affiliates
On March 24, 2015, we completed the merger of our Completion & Production Services business with C&J Energy Services, Inc. (“CJES”). We received total consideration of approximately $693.5 million in cash ($650.0 million after settlement of working capital requirements) and approximately 62.5 million common shares in the combined company, CJES, representing approximately 53% of the outstanding and issued common shares of CJES as of the closing date. We recognized our share of the net income (loss) of CJES, which was a loss of $221.9 million for the year ended December 31, 2016, and is reflected in earnings (losses) from unconsolidated affiliates in our consolidated statement of income (loss). Additionally, we recognized an other-than-temporary impairment charge of $192.4 million during the year ended December 31, 2016, which is reflected in other, net in our consolidated statement of income (loss). During the third quarter of 2016, CJES commenced voluntarily cases under chapter 11 of the U.S. Bankruptcy code. As such, we ceased accounting for our investment in CJES as an equity method investment. In January 2017, CJES emerged from bankruptcy and as part of the settlement we received warrants to acquire the common equity in the reorganized CJES.
Note 109 Financial Instruments and Risk Concentration
We may be exposed to certain market risks arising from the use of financial instruments in the ordinary course of business. These risks arise primarily as a result of potential changes in the fair market value of financial instruments that would result from adverse fluctuations in foreign currency exchange rates, credit risk, interest rates, and marketable and non‑marketablenon-marketable security prices as discussed below.
Foreign Currency Risk
We operate in a number of international areas and are involved in transactions denominated in currencies other than U.S. dollars, which exposes us to foreign exchange rate risk or foreign currency devaluation risk. The most
significant exposures arise in connection with our operations in Argentina and Canada, which usually are substantially unhedged.
At various times, we utilize local currency borrowings (foreign‑currency‑denominated(foreign-currency-denominated debt), the payment structure of customer contracts and foreign exchange contracts to selectively hedge our exposure to exchange rate fluctuations in connection with monetary assets, liabilities, cash flows and commitments denominated in certain foreign currencies. A foreign exchange contract is a foreign currency transaction, defined as an agreement to exchange different currencies at a given future date and at a specified rate.
Credit Risk
Our financial instruments that potentially subject us to concentrations of credit risk consist primarily of cash equivalents, short-term and long‑termlong-term investments and accounts receivable. Cash equivalents such as deposits and temporary cash investments are held by major banks or investment firms. Our short‑termshort-term and long‑termlong-term investments are managed within established guidelines that limit the amounts that may be invested with any one issuer and provide guidance as to issuer credit quality. We believe that the credit risk in our cash and investment portfolio is minimized as a result of the mix of our investments. In addition, our trade receivables are with a variety of U.S., international and foreign‑country
foreign-country national oil and gas companies. Management considers this credit risk to be limited due to the financial resources of these companies. We perform ongoing credit evaluations of our customers, and we generally do not require material collateral. We do occasionally require prepayment of amounts from customers whose creditworthiness is in question prior to providing services to them. We maintain reserves for potential credit losses, and these losses historically have been within management’s expectations.
Interest Rate and Marketable and Non‑marketableNon-marketable Security Price Risk
Our financial instruments that are potentially sensitive to changes in interest rates include our floating rate debt instruments comprised of our revolving credit facilities and our fixed rate debt securities comprised of our 5.0%, 4.625%, 5.50%, 5.10% and 5.75% senior notes.
We may utilize derivative financial instruments that are intended to manage our exposure to interest rate risks. The use of derivative financial instruments could expose us to further credit risk and market risk. Credit risk in this context is the failure of a counterparty to perform under the terms of the derivative contract. When the fair value of a derivative contract is positive, the counterparty would owe us, which can create credit risk for us. When the fair value of a derivative contract is negative, we would owe the counterparty, and therefore, we would not be exposed to credit risk. We attempt to minimize credit risk in derivative instruments by entering into transactions with major financial institutions that have a significant asset base. Market risk related to derivatives is the adverse effect on the value of a financial instrument that results from changes in interest rates. We try to manage market risk associated with interest‑rateinterest-rate contracts by establishing and monitoring parameters that limit the type and degree of market risk that we undertake.
Note 10 Debt
Note 11 Debt
Debt consisted of the following:
| | | | | | | |
| | As of December 31, | |
| | 2019 | | 2018 | |
| | (In thousands) | |
5.00% senior notes due September 2020 (1) | | $ | 282,046 | | $ | 614,748 | |
4.625% senior notes due September 2021 | | | 634,588 | | | 668,347 | |
5.50% senior notes due January 2023 | | | 501,003 | | | 586,000 | |
5.10% senior notes due September 2023 | | | 336,810 | | | 342,923 | |
0.75% senior exchangeable notes due January 2024 | | | 472,603 | | | 450,689 | |
5.75% senior notes due February 2025 | | | 781,502 | | | 791,502 | |
2012 Revolving credit facility (1) | | | 355,000 | | | 170,000 | |
2018 Revolving credit facility | | | — | | | — | |
Other | | | — | | | 561 | |
| | | 3,363,552 | | | 3,624,770 | |
Less: current portion | | | — | | | 561 | |
Less: deferred financing costs | | | 30,332 | | | 38,325 | |
| | $ | 3,333,220 | | $ | 3,585,884 | |
| (1) | The 5.00% senior notes due September 2020 and 2012 Revolving Credit Facility have been classified as long-term because we have the ability and intent to repay this obligation utilizing our 2018 Revolving Credit Facility. |
| | | | | | | |
| | As of December 31, | |
| | 2018 | | 2017 | |
| | (In thousands) | |
6.15% senior notes due February 2018 | | $ | — | | $ | 460,762 | |
9.25% senior notes due January 2019 | | | — | | | 303,489 | |
5.00% senior notes due September 2020 | | | 614,748 | | | 669,846 | |
4.625% senior notes due September 2021 | | | 668,347 | | | 695,108 | |
5.50% senior notes due January 2023 | | | 586,000 | | | 600,000 | |
5.10% senior notes due September 2023 | | | 342,923 | | | 346,576 | |
0.75% senior exchangeable notes due January 2024 | | | 450,689 | | | 429,982 | |
5.75% senior notes due February 2025 | | | 791,502 | | | — | |
2012 Revolving credit facility | | | 170,000 | | | 510,000 | |
2018 Revolving credit facility | | | — | | | — | |
Commercial paper | | | — | | | 40,000 | |
Other | | | 561 | | | 181 | |
| | | 3,624,770 | | | 4,055,944 | |
Less: current portion | | | 561 | | | 181 | |
Less: deferred financing costs | | | 38,325 | | | 27,997 | |
| | $ | 3,585,884 | | $ | 4,027,766 | |
As of December 31, 2018,2019, the principal amount and maturities of our primary debt for each of the five years after 20182019 and thereafter are as follows:
| | | | |
| | Paid at Maturity | |
| | (In thousands) | |
2020 | | $ | 637,162 | (1) |
2021 | | | 634,999 | (2) |
2022 | | | — | |
2023 | | | 838,281 | (3) |
2024 | | | 575,000 | (4) |
Thereafter | | | 781,502 | (5) |
| | $ | 3,466,944 | |
| | | | |
| | Paid at Maturity | |
| | (In thousands) | |
2019 | | $ | — | |
2020 | | | 785,271 | (1) |
2021 | | | 668,999 | (2) |
2022 | | | — | |
2023 | | | 929,519 | (3) |
Thereafter | | | 1,366,502 | (4) |
| | $ | 3,750,291 | |
| (1) | (1)
| | Represents our 5.0%5.00% senior notes due September 2020 and amounts outstanding under our 2012 Revolving Credit Facility due July 2020. Subsequent to the balance sheet through the date of this report, approximately $3.0 million aggregate principal amount of our 5.00% senior notes were repurchased in the open market, aside from the tender offer. |
| (2) | (2)
| | Represents our 4.625% senior notes due September 2021. Approximately $379.7 million aggregate principal amount of our 4.625% senior notes were tendered pursuant to the previously announced offer to purchase and consent solicitation during January 2020 and approximately $5.0 million aggregate principal amount were repurchased in the open market, aside from the tender offer. |
| (3) | (3)
| | Represents our 5.50% senior notes due January 2023 and 5.10% senior notes due September 2023. Approximately $407.7 million aggregate principal amount of our 5.50% senior notes and $165.5 million aggregate principal amount of our 5.10% senior notes were tendered pursuant to the previously announced offer to purchase and consent solicitation during January 2020. Subsequent to the balance sheet through the date of this report, approximately $9.0 million aggregate principal amount of our 5.50% senior notes and $4.2 million aggregate principal amount of our 5.10% senior notes were repurchased in the open market. |
| (4) | (4)
| | Represents our 0.75% senior exchangeable notes due January 2024 and2024. |
| (5) | Represents our 5.75% senior notes due February 2025. |
Nabors Delaware’s various fixed rate debt securities comprised of our 5.00%, 4.625%, 5.50% and 5.10% and 5.75% senior unsecured notes are fully and unconditionally guaranteed by us. The notes rank equal in right of payment to all of Nabors Delaware’s existing and future senior unsubordinated debt. The notes rank senior in right of payment to all of Nabors Delaware’s existing and future senior subordinated and subordinated debt. Our guarantee of the notes is unsecured and ranks equal in right of payment to all of our unsecured and unsubordinated indebtedness from time to time outstanding. The notes are subject to redemption by Nabors Delaware, in whole or in part, at any time generally at a redemption price equal to the greater of (i) 100% of the principal amount of the notes then outstanding to be redeemed; or (ii) the sum of the present values of the remaining scheduled payments of principal and interest, determined in the manner set forth in the applicable indenture. In the event of a change in control triggering event, as defined in the indenture, the holders of notes may require Nabors Delaware to purchase all or any part of each note in cash equal to 101% of the principal amount plus accrued and unpaid interest, if any, to the date of purchase, except to the extent
Nabors Delaware has exercised its right to redeem the notes. The notes have customary covenants, including limitations on the incurrence of liens and entering into sale and leaseback transactions as well as customary events of default.
During 2019, 2018 2017 and 2016,2017, we repurchased $468.3 million, $873.0 million, $367.9 million, and $152.7$367.9 million aggregate principal amount of our senior unsecured notes for approximately $461.1 million, $906.5 million $381.7 million and $157.5$381.7 million, respectively, in cash, reflecting principal, accrued and unpaid interest. In connection with such repurchases, during 2019 we recognized a net gain of approximately $11.5 million. During 2018 and 2017 we recognized net losses of approximately $5.3 million and $16.0 million, respectively, which represents the premiums paid in connection with these repurchases or redemptions. During 2016, we recognized a net gain of approximately $6.7 million. These amounts are included in impairments and other charges in our consolidated statement of income (loss).
5.75% Senior Notes Due February 202567
In January 2018,2020, Nabors Delaware issued $800completed a private placement offering of $600.0 million aggregate principal amount of senior guaranteed notes due 2026 (the “2026 Notes”) and $400.0 million in aggregate principal amount of 5.75% senior unsecuredguaranteed notes due February 1, 2025, which2028 (the “2028 Notes” and, together with the 2026 Notes, the “notes”). The 2026 and 2028 Notes will bear interest at an annual rate of 7.25% and 7.50%, respectively. The notes are fully and unconditionally guaranteed by Nabors.certain of Nabors’ indirect wholly-owned subsidiaries. The notes subsequentlyproceeds from this offering were exchangedused primarily to repurchase $952.9 million aggregate principal amount, for notes registered under the Securities Act pursuant to an exchange offer that took place in August 2018. The notes pay interest semi-annually on February 1 and August 1, beginning on August 1, 2018, and will mature on February 1, 2025.
The notes rank equal in righta net premium of payment to all$2.7 million (excluding accrued interest) certain of Nabors Delaware’s existingsenior notes that were tendered pursuant to the previously announced offer to purchase and future unsubordinated indebtedness, and senior in right of payment to all of Nabors Delaware’s existing and future senior subordinated and subordinated indebtedness. Our guarantee of the notes is unsecured and an unsubordinated obligation and ranks equal in right of payments to allconsent solicitation. The aggregate principal amount repurchased included approximately $407.7 million of our unsecured and unsubordinated indebtedness from time to time outstanding. In the event of a change of control triggering event, as defined in the indenture, the holders of the notes may require Nabors Delaware to purchase all or a portion of the notes at a purchase price equal to 101% of their principal amount, plus accrued and unpaid interest, if any. The notes are redeemable in whole or in part at any time at the option of Nabors Delaware at a redemption price, plus accrued and unpaid interest, as specified in the indenture. Nabors Delaware used a portion of the proceeds to repay the amount outstanding on the 6.15%5.50% senior notes due February 2018.2023, $379.7 million of our 4.625% senior notes due 2021 and $165.5 million of our 5.10% senior notes due 2023. The remaining proceeds notwere used to pay for such purposes were allocatedtransactional fees and for general corporate purposes, including to repay amounts outstanding under the commercial paper program and to repurchase or repayrepayment of other indebtedness.debt. We also repurchased in the open market, aside from the tender offer, approximately $21.2 million aggregate principal amount of our various senior notes.
0.75% Senior Exchangeable Notes Due January 2024
In January 2017, Nabors Delaware issued $575$575.0 million in aggregate principal amount of 0.75% exchangeable senior unsecured notes due 2024, which are fully and unconditionally guaranteed by Nabors. The notes bear interest at a rate of 0.75% per year payable semiannually on January 15 and July 15 of each year, beginning on July 15, 2017. The exchangeable notes are bifurcated for accounting purposes into debt and equity components of $411.2 million and $163.8 million, respectively, based on the relative fair value at the issuance date. Debt issuance costs of $9.6 million and equity issuance costs of $3.9 million were capitalized in connection with the issuance of these notes in long-term debt and netted against the proceeds allocated to the equity component, respectively, in our consolidated balance sheet. The debt issuance costs are being amortized through January 2024.
The exchangeable notes are exchangeable, under certain conditions, at an initial exchange rate of 39.75 common shares of Nabors per $1,000 principal amount of exchangeable notes (equivalent to an initial exchange price of approximately $25.16 per common share). Upon any exchange, Nabors Delaware will settle its exchange obligation in cash, common shares of Nabors, or a combination of cash and common shares, at our election.
In connection with the pricing of the notes, we entered into privately negotiated capped call transactions which are expected to reduce potential dilution to common shares and/or offset potential cash payments required to be made in excess of the principal amount upon any exchange of notes. Such reduction and/or offset is subject to a cap representing a price per share of $31.45, an approximately 75.0% premium over our share price of $17.97 as of the pricing date of the transaction. The capped call meets the definition of a derivative under ASC 815, Derivatives and Hedging, as it has an underlying (the Company’s share price), a notional amount (the number of underlying shares to be purchased per option), an initial net investment less (by more than a nominal amount) than the amount that would have to be paid to own the underlying and provides for a default net share settlement (but could also be settled in cash at the election of the Company). However, the capped call meets the derivative scope exception under ASC 815 for instruments indexed to the Company’s own stock and classified in shareholders’ equity and therefore was initially recorded in equity. Until such
time as the Company elects a settlement method for the exchangeable notes, the capped call transaction will continue to be accounted for as equity. At conversion, if the Company elects to partially settle the notes in cash in excess of the principal amount, or fully in cash, the capped call will be subject to mark to market through earnings as a derivative until such settlement is paid.
The net proceeds from the offering of the exchangeable notes were used to prepay the remaining balance of our unsecured term loan originally scheduled to mature in 2020, as well as to pay the cost of the capped call transactions. The remaining net proceeds from the offering were allocated for general corporate purposes, including to repurchase or repay other indebtedness.
Commercial Paper Program68
2018 Revolving Credit Facility
On October 11, 2018,December 13, 2019, Nabors Delaware and Nabors Drilling Canada Limited an Alberta corporation (“(‘‘Nabors Canada”),Canada’’ and together with Nabors and certain other of Nabors’ wholly owned subsidiariesDelaware, the ‘‘Borrowers’’) entered into a new five-year unsecured revolving facilityAmendment No. 2 (the ‘‘Second Amendment’’) to the existing credit agreement dated October 11, 2018 (as amended, including such amendment, the “2018 Revolving Credit Facility”) by and among the Borrowers, the Guarantors identified therein, HSBC Bank Canada, as the Canadian lender (the ‘‘Canadian Lender’’) the issuing banks and other lenders party thereto (the ‘‘US Lenders’’ and, together with the lenders and issuing banks party theretoCanadian Lender, the ‘‘Lenders’’) and Citibank, N.A., as administrative agent (the “2018 Revolvingsolely for the U.S. Lenders. Changes to the 2018 Credit Facility”). Agreement resulting from the Second Amendment include, without limitation, the following:
| ● | Reduction of commitments of the US Lenders to $981.6 million and the commitment of the Canadian Lender to $32.0 million; |
| ● | Replacement of the net debt/capitalization covenant with a covenant to maintain net funded debt at no greater than 5.5x EBITDA (as defined in the Second Amendment); |
| ● | Maintaining the asset coverage ratio; provided that such ratio is measured only against the commitments under the 2018 Credit Agreement, plus debt incurred under the $100.0 million general indebtedness basket; |
| ● | Reductions of $50.0 million to each of the general lien and general indebtedness baskets; |
| ● | Addition of ability to incur upstream structurally-subordinated guaranteed indebtedness, subject to financial covenants; |
| ● | Addition of ability to repay up to $150.0 million of Nabors Delaware’s notes due February 2025, subject to satisfaction of certain conditions; and |
| ● | Addition of cure provisions |
The 2018 Revolving Credit Facility has a borrowing capacity of $1.267$1.0136 billion and is fully and unconditionally guaranteed by Nabors and certain of its wholly owned subsidiaries. The 2018 Revolving Credit Facility matures at the earlier of (a) October 11, 2023 andor (b) July 19, 2022, if any of Nabors Delaware’s existing 5.5%5.50% senior notes due January 2023 remain outstanding as of such date. Certain lenders have committed to provide Nabors Delaware an aggregate principal amount of $1.227 billion$981.6 million under the 2018 Revolving Credit Facility, which may be drawn in U.S. dollars, and HSBC Bank Canada has committed to provide Nabors Canada an aggregate principal amount of $40$32 million in U.S. dollar equivalent, which can be drawn upon in either U.S. or Canadian dollars. The 2018 Revolving Credit Facility contains certain affirmative and negative covenants, including a financial covenant requiring Nabors to maintain a net funded debt to capitalization ratio notEBITDA (as defined in excess of 0.60:1.the Second Amendment) at no greater than 5.5 times EBITDA. Additionally, during any period in which Nabors Delaware fails to maintain an investment grade rating from at least two ratings agencies, the guarantors under the facility and their respective subsidiaries will be required to maintain an asset to debt coverage ratio (as defined in the 2018 Revolving Credit Facility) of at least 2.50:1. As of the date of this report, we had no0 borrowings outstanding under our 2018 Revolving Credit Facility. In order to make any future borrowings under the 2018 Revolving Credit Facility, Nabors and certain of its wholly owned subsidiaries are subject to compliance with the conditions and covenants contained therein, including compliance with applicable financial ratios.
2012As of the date of this report, we were in compliance with all covenants under the 2018 Revolving Credit Facility
In connectionFacility. If we fail to perform our obligations under the covenants, including financial covenants, the revolving credit commitment could be terminated, and any outstanding borrowings under the facilities could be declared immediately due and payable. We expect to remain in compliance with all covenants under the 2018 Revolving Credit Facility during the twelve month period following the date of this report based on our current operational and financial projections. However, we can make no assurance of continued compliance if our current projections or material underlying assumptions prove to be incorrect. If we fail to comply with the covenants, the revolving credit commitment could be terminated, and any outstanding borrowings under the facility could be declared immediately due and payable.
2012 Revolving Credit Facility
On October 11, 2018, Nabors Delaware entered into Amendment No. 3 to its existing credit agreement dated November 29, 2012 (as amended, including such amendment, the “2012 Revolving Credit Facility”), among itself, Nabors, Nabors Canada, HSBC Bank Canada, the other lenders party thereto, Citibank, N.A., and Wilmington Trust, National Association, as successor administrative agent (the “Amendment”). The Amendment, among other things, provides for Citibank, N.A.’s resignation as administrative agent and the appointment of Wilmington Trust, National Association as administrative agent, reduces the overall commitments available to $666.25 million and provides for certain lenders to exit the facility in order to become lenders under the 2018 Revolving Credit Facility. Availability under the 2012 Revolving Credit Facility is subject to a covenant not to exceed a net debt to capital ratio of 0.60:1. As of December
31, 2018,2019, we had $170.0$355.0 million in borrowings outstanding under this facility. The weighted average interest rate on borrowings during the year ended December 31, 20182019 was 3.58%3.71%. Availability under the 2012 Revolving Credit Facility is subject to a covenant not to exceed a net funded debt to capital ratio of 0.60:1. As of December 31, 2019 our net funded debt to capital ratio was 0.59:1. The 2012 Revolving Credit Facility matures onexpires in July 14,2020, or if we fail to comply with the net funded debt to capital covenant, the 2012 Revolving Credit Facility could be terminated earlier than July 2020.
As of However, at such time as the date of this report,2012 Revolving Credit Facility becomes unavailable, we were in compliance with all covenants underhave the ability and intent to refinance the outstanding balance utilizing the 2018 Revolving Credit Facility, and 2012 Revolving Credit Facility. If we fail to perform our obligations under the covenants, including financial covenants, the revolving credit commitment could be terminated, and any outstanding borrowings under the facilities could be declared immediately due and payable.which has approximately $1.0 billion of available capacity as of December 31, 2019.
Short-Term Borrowings
Term Loan Facility
On September 29, 2015, Nabors Delaware entered into a new five-year unsecured term loan facility for $325.0 million, which was fully and unconditionally guaranteed by us. The term loan facility contained a mandatory prepayment of $162.5 million due in September 2018, which was repaid in December 2016 utilizing a portion of the proceeds received in connection with the 5.50% senior notes offering. In January 2017, we repaid the remaining $162.5 million term loan utilizing the proceeds received in connection with the 0.75% senior exchangeable notes and the facility was terminated.
Short‑Term Borrowings
We had 15 letter‑of‑credit18 letter-of-credit facilities with various banks as of December 31, 2018.2019. Availability and borrowings under our letter-of-credit facilities are as follows:
| | | | | |
| | December 31, | | |
| | 2018 | | |
| | (In thousands) | | |
| | | | | |
| | | December 31, | |
| | | 2019 | |
| | | (In thousands) | |
Credit available | | $ | 759,321 | | | $ | 890,902 | |
Less: Letters of credit outstanding, inclusive of financial and performance guarantees | | | 105,036 | | | | 146,788 | |
Remaining availability | | $ | 654,285 | | | $ | 744,114 | |
Note 1211 Income Taxes
Income (loss) from continuing operations before income taxes consisted of the following:
| | | | | | | | | | | |
| | Year Ended December 31, | | |
| | | | | | | | | | | |
| | | Year Ended December 31, | |
United States and Other Jurisdictions | | 2018 | | 2017 | | 2016 | | | 2019 | | 2018 | | 2017 | |
| | (In thousands) | | |
| | | (In thousands) | |
United States | | $ | (119,419) | | $ | (369,162) | | $ | (728,589) | | | $ | 5,979 | | $ | (119,419) | | $ | (369,162) | |
Other jurisdictions | | | (399,375) | | | (210,922) | | | (469,486) | | | | (594,901) | | | (399,375) | | | (210,922) | |
Income (loss) from continuing operations before income taxes | | $ | (518,794) | | $ | (580,084) | | $ | (1,198,075) | | | $ | (588,922) | | $ | (518,794) | | $ | (580,084) | |
Income tax expense (benefit) from continuing operations consisted of the following:
| | | | | | | | | | | |
| | Year Ended December 31, | | |
| | 2018 | | 2017 | | 2016 | | |
| | | | | | | | | |
| | (In thousands) | | |
| | | | | | | | | | | |
| | | Year Ended December 31, | |
| | | 2019 | | 2018 | | 2017 | |
| | | | | | | | | |
| | | (In thousands) | |
Current: | | | | | | | | | | | | | | | | | | | | |
U.S. federal | | $ | (32,351) | | $ | (160,761) | | $ | (19,937) | | | $ | 1,210 | | $ | (32,351) | | $ | (160,761) | |
Outside the U.S. | | | 32,928 | | | 59,491 | | | 31,846 | | | | 54,097 | | | 32,928 | | | 59,491 | |
State | | | 1,811 | | | (810) | | | 2,871 | | | | 318 | | | 1,811 | | | (810) | |
| | $ | 2,388 | | $ | (102,080) | | $ | 14,780 | | |
| | | $ | 55,625 | | $ | 2,388 | | $ | (102,080) | |
Deferred: | | | | | | | | | | | | | | | | | | | | |
U.S. federal | | $ | 37,476 | | $ | 49,020 | | $ | (164,297) | | | $ | 58,157 | | $ | 37,476 | | $ | 49,020 | |
Outside the U.S. | | | 39,518 | | | (26,684) | | | (14,641) | | | | (25,428) | | | 39,518 | | | (26,684) | |
State | | | (113) | | | (3,226) | | | (22,673) | | | | 3,222 | | | (113) | | | (3,226) | |
| | $ | 76,881 | | $ | 19,110 | | $ | (201,611) | | |
| | | $ | 35,951 | | $ | 76,881 | | $ | 19,110 | |
Income tax expense (benefit) | | $ | 79,269 | | $ | (82,970) | | $ | (186,831) | | | $ | 91,576 | | $ | 79,269 | | $ | (82,970) | |
A reconciliation of our statutory tax rate to our worldwide effective tax rate consists of the following:
| | | | | | | | | | | |
| | Year Ended December 31, | | |
| | 2018 | | 2017 | | 2016 | | |
| | (In thousands) | | |
| | | | | | | | | | | |
| | | Year Ended December 31, | |
| | | 2019 | | 2018 | | 2017 | |
| | | (In thousands) | |
Income tax provision at statutory (Bermuda rate of 0%) | | $ | — | | $ | — | | $ | — | | | $ | — | | $ | — | | $ | — | |
Taxes (benefit) on U.S. and other international earnings (losses) at greater than the Bermuda rate | | | 49,375 | | | (98,119) | | | (181,426) | | | | 54,060 | | | 49,375 | | | (98,119) | |
Increase (decrease) in valuation allowance | | | 38,822 | | | 29,165 | | | 17,865 | | | | 32,869 | | | 38,822 | | | 29,165 | |
Impact of Tax Reform Act | | | — | | | 138,635 | | | — | | | | — | | | — | | | 138,635 | |
Tax reserves and interest | | | (10,626) | | | (148,615) | | | (3,468) | | | | 1,107 | | | (10,626) | | | (148,615) | |
State income taxes (benefit) | | | 1,698 | | | (4,036) | | | (19,802) | | | | 3,540 | | | 1,698 | | | (4,036) | |
Income tax expense (benefit) | | $ | 79,269 | | $ | (82,970) | | $ | (186,831) | | | $ | 91,576 | | $ | 79,269 | | $ | (82,970) | |
Effective tax rate | | | (15.3%) | | | 14.3% | | | 15.6% | | | | (15.5%) | | | (15.3%) | | | 14.3% | |
The increase in tax expense during 2019 compared to 2018 was primarily attributable to the change in our geographic mix of pre-tax earnings (losses), primarily due to. The ratio of pre-tax earnings in certain high tax jurisdictions causing a netcompared to low or zero tax jurisdictions increased in 2019 compared to 2018, resulting in an increase in income tax despiteexpense. This increase was partially offset by certain discrete items. During 2019, we recognized a consolidated pre-tax loss. In addition, management has continued$29.6 million tax benefit from the release of a valuation allowance in one of our foreign jurisdictions related to assess the Company’s ability to more likely than not realize deferrednet operating loss carryforwards. This was partially offset by a $14.4 million settlement of a tax assets associated withdispute in one of our Canada Drilling operations and concluded during the fourth quarter offoreign jurisdictions. During 2018, that the pace of market recovery did not support realization at this time. Accordingly,we recognized a non-cash expense of $52$52.0 million was recorded to reflect thea valuation allowance.allowance on deferred tax assets in Canada.
The components of our net deferred taxes consisted of the following:
| | | | | | | |
| | December 31, | |
| | 2018 | | 2017 | |
| | (In thousands) | |
Deferred tax assets: | | | | | | | |
Net operating loss carryforwards | | $ | 1,967,910 | | $ | 1,974,658 | |
Equity compensation | | | 7,038 | | | 10,281 | |
Deferred revenue | | | 16,494 | | | 14,005 | |
Tax credit and other attribute carryforwards | | | 100,752 | | | 131,640 | |
Insurance loss reserves | | | 2,451 | | | 6,626 | |
Accrued interest | | | 206,088 | | | 234,033 | |
Other | | | 82,167 | | | 80,492 | |
Subtotal | | | 2,382,900 | | | 2,451,735 | |
Valuation allowance | | | (1,917,390) | | | (1,869,490) | |
Deferred tax assets: | | $ | 465,510 | | $ | 582,245 | |
Deferred tax liabilities: | | | | | | | |
Depreciation and amortization for tax in excess of book expense | | $ | 102,810 | | $ | 146,448 | |
Other | | | 23,920 | | | 27,132 | |
Deferred tax liability | | $ | 126,730 | | $ | 173,580 | |
Net deferred tax assets (liabilities) | | $ | 338,780 | | $ | 408,665 | |
Balance Sheet Summary: | | | | | | | |
Net noncurrent deferred tax asset (1) | | $ | 345,091 | | $ | 419,003 | |
Net noncurrent deferred tax liability | | | (6,311) | | | (10,338) | |
Net deferred tax asset (liability) | | $ | 338,780 | | $ | 408,665 | |
| (1)
| | This amount is included in other long-term assets.
|
| | | | | | | |
| | December 31, | |
| | 2019 | | 2018 | |
| | (In thousands) | |
Deferred tax assets: | | | | | | | |
Net operating loss carryforwards | | $ | 2,834,851 | | $ | 1,967,910 | |
Equity compensation | | | 6,577 | | | 7,038 | |
Deferred revenue | | | 8,873 | | | 16,494 | |
Tax credit and other attribute carryforwards | | | 97,215 | | | 100,752 | |
Insurance loss reserves | | | 2,248 | | | 2,451 | |
Accrued interest | | | 172,120 | | | 206,088 | |
Other | | | 95,588 | | | 82,167 | |
Subtotal | | | 3,217,472 | | | 2,382,900 | |
Valuation allowance | | | (2,813,567) | | | (1,917,390) | |
Deferred tax assets: | | $ | 403,905 | | $ | 465,510 | |
Deferred tax liabilities: | | | | | | | |
Depreciation and amortization for tax in excess of book expense | | $ | 80,155 | | $ | 102,810 | |
Other | | | 21,055 | | | 23,920 | |
Deferred tax liability | | $ | 101,210 | | $ | 126,730 | |
Net deferred tax assets (liabilities) | | $ | 302,695 | | $ | 338,780 | |
Balance Sheet Summary: | | | | | | | |
Net noncurrent deferred tax asset | | $ | 305,844 | | $ | 345,091 | |
Net noncurrent deferred tax liability | | | (3,149) | | | (6,311) | |
Net deferred tax asset (liability) | | $ | 302,695 | | $ | 338,780 | |
For U.S.December 31, 2019 we had federal, income tax purposes, we havestate, and foreign net operating loss (“NOL”) carryforwards of approximately $578.0 million.$418.3 million, $1.1 billion and 10.9 billion, respectively. Of that amount, $442.0 millionthose amounts, $3.7 billion will expire between 20302020 and 20362040 if not utilized. Additionally, we have NOL carryforwards in other jurisdictions of approximately $7.1 billion of which $526.0 million, if not utilized, will expire at various times from 2019 to 2038. We provide a valuation allowance against NOL carryforwards in various tax jurisdictions based on our consideration of existing temporary differences and expected future earning levels in those jurisdictions. We have recorded a deferred tax asset of approximately $1.67 billion as of December 31, 2018 relating to NOL carryforwards that have an indefinite life in several jurisdictions. A valuation allowance of approximately $1.70$2.6 billion has been recognized becauserelated to certain NOL carryforwards as we believe it is more likely than not that substantially allthe benefit of the deferred tax assetthese NOL carryforwards will not be realized.
In addition, for state income tax purposes, we have NOL carryforwards71
The following is a reconciliation of our uncertain tax positions:
| | | | | | | | | | | | |
| | Year Ended December 31, | |
| | 2018 | | | 2017 | | | 2016 | |
| | (In thousands) | |
Balance as of January 1 | | $ | 33,203 | | | $ | 179,255 | | | $ | 188,376 | |
Additions based on tax positions related to the current year | | | — | | | | — | | | | — | |
Additions for tax positions of prior years | | | 308 | | | | 25,119 | (2) | | | 3,873 | |
Reductions for tax positions for prior years | | | (7,800) | (1) | | | (171,171) | (3) | | | (11,547) | (4) |
Settlements | | | — | | | | — | | | | (1,447) | |
Balance as of December 31 | | $ | 25,711 | | | $ | 33,203 | | | $ | 179,255 | |
| (1)
| | Includes $4.8 million reduction in Mexico, $1.0 million in Saudi Arabia and $2.0 million in Egypt.
|
| | | | | | | | | | | |
| | Year Ended December 31, | |
| | 2019 | | | 2018 | | 2017 | |
| | (In thousands) | |
Balance as of January 1 | | $ | 25,711 | | | $ | 33,203 | | $ | 179,255 | |
Additions based on tax positions related to the current year | | | — | | | | — | | | — | |
Additions for tax positions of prior years | | | 1,003 | | | | 308 | | | 25,119 | |
Reductions for tax positions for prior years | | | (860) | | | | (7,800) | | | (171,171) | |
Settlements | | | (84) | | | | — | | | — | |
Balance as of December 31 | | $ | 25,770 | | | $ | 25,711 | | $ | 33,203 | |
| (2)
| | Includes $12.0 million addition in Norway, $9.0 million in the U.S. and $2.0 million in Egypt.
|
| (3)
| | Includes $167.0 million related to internal restructuring.
|
| (4)
| | Includes $7.2 million related to the expiration of statute of limitations in Australia, Algeria and Mexico, a $2.0 million reduction to Trinidad and $2.1 million related to foreign currency translation.
|
If the reservesunrecognized tax benefits of $25.7 million are not realized, this would favorably impact the worldwide effective tax rate. As of December 31, 2019, 2018 2017 and 2016,2017, we had approximately $7.7 million, $6.7 million $9.7 million and $9.2$9.7 million, respectively, of interest and penalties related to uncertain tax positions. During 2019, 2018 2017 and 2016,2017, we accrued and recognized estimated interest and penalties related to uncertain tax positions of approximately $0.8 million, $1.0 million $0.5 million and $0.6$0.5 million, respectively. We include potential interest and penalties related to uncertain tax positions within our global operations in the income tax expense (benefit) line item in our consolidated statements of income (loss).
It is reasonably possible that our existing liabilities related to our reserve for uncertain tax positions may increase or decrease in the next twelve months primarily due to the completion of open audits or the expiration of statutes of limitation. However, we cannot reasonably estimate a range of changes in our existing liabilities due to various uncertainties, such as the unresolved nature of various audits.
We conduct business globally and, as a result, we file numerous income tax returns in the U.S. and non-U.S. jurisdictions. In the normal course of business we are subject to examination by taxing authorities throughout the world, including major jurisdictions such as Algeria, Canada, Mexico, Saudi Arabia and the United States. We are no longer subject to U.S. Federal income tax examinations for years before 20152016 and non-U.S. income tax examinations for years before 2007.
Note 1312 Shareholders’ Equity
Common shares
Our authorized share capital consists of 825,000,000825.0 million shares of which 800,000,000800.0 million are common shares, par value $0.001 per share, and 25,000,00025.0 million are preferred shares, par value $0.001 per share. The preferred shares are issuable in one or more classes or series, full, limited or no voting rights, designations, preferences, special rights, qualifications, limitations and restrictions, as may be determined by the Board.
In MayDuring 2018, we issued 35,000,00040.25 million of our common shares at a price to the public of $7.75 per share. In connection with this offering, in June 2018 the underwriters exercised in full their option to purchase 5,250,000 additional common shares. Nabors received aggregate net proceeds of approximately $301.4 million after deducting underwriting discounts, commissions and offering expenses.
During 2017, with approval of the Board, we repurchased 3.1 million of our common shares in the open market for $18.1 million, all of which are held by our subsidiaries, and which are accounted for as treasury shares.
From time to time, treasury shares may be reissued. When shares are reissued, we use the weighted‑average‑costweighted-average-cost method for determining cost. The difference between the cost of the shares and the issuance price is added to or deducted from our capital in excess of par value account. NoNaN shares have been reissued during 2019, 2018 2017 or 2016.2017.
In 2018, 2017 and 2016, the Compensation Committee of our Board granted restricted share awards to some of our executive officers, other key employees, and independent directors. We awarded 4,460,592, 1,989,915, and 3,919,696 restricted shares at an average market price of $6.40, $13.08 and $9.85 to these individuals for 2018, 2017 and 2016, respectively. See Note 7—Share-Based Compensation for a summary of our restricted stock and option awards as of December 31, 2018.
On February 23, 2018, a cash dividend of $0.06 per share was declared for shareholders of record on March 13, 2018. The dividend was paid on April 3, 2018 in the amount of $19.1 million. On April 20, 2018, a cash dividend of $0.06 per common share was declared for shareholders of record on June 12, 2018. The dividend was paid on July 3, 2018 in the amount of $21.5 million. On July 27, 2018, a cash dividend of $0.06 per common share was declared for shareholders of record on September 11, 2018. The dividend was paid on October 2, 2018 in the amount of $21.4 million. On November 6, 2018, a cash dividend of $0.06 per common share was declared for shareholders of record on December 13, 2018. The dividend was paid on January 3, 2019 in the amount of $21.0 million. These dividends were charged to retained earnings in our consolidated statement of changes in equity for the year ended December 31, 2018.
On February 22, 2019,2020, a cash dividend of $0.01 per share was declared for shareholders of record on March 12, 20192020 and will be paid on April 2, 2019.2020.
Convertible Preferred Shares
Convertible Preferred Shares
In MayDuring 2018, we issued 5,750,0005.75 million (including the underwriters option for 750,000).75 million) of our 6% Series A Mandatory Convertible Preferred Shares (the “mandatory convertible preferred shares”), par value $.001 per share, with a liquidation preference of $50 per share. Nabors received aggregate net proceeds of approximately $277.9 million after deducting underwriting discounts, commissions and offering expenses.During 2019, we repurchased 136,772 of our mandatory convertible preferred shares for approximately $2.9 million.
The dividends on the mandatory convertible preferred shares are payable on a cumulative basis at a rate of 6% annually on the initial liquidation preference of $50 per share. Dividends accumulate and are paid quarterly to the extent that we have available funds and our Board of Directors declares a dividend payable. We may elect to pay any accumulated and unpaid dividends in cash or common shares or any combination thereof. At issuance, each mandatory convertible preferred share was automatically convertible into between 5.3763 and 6.4516 of our common shares based on the average share price over a period of twenty consecutive trading days ending prior to May 1, 2021, subject to anti-dilution adjustments. As a result of the dividends paid on our common shares since the offering, the conversion rate for each mandatory convertible preferred share has been adjusted to between 5.57755.6751 and 6.69316.8102 of our common shares. At any time prior to May 1, 2021, a holder of mandatory convertible preferred shares may convert such mandatory convertible preferred shares into our common shares at the minimum conversion rate, subject to adjustment.
On June 6, 2018, a cash dividend of $0.64 per mandatory convertible preferred share was declared for shareholders of record on July 13, 2018. The dividend was paid on August 1, 2018 in the amount of $3.7 million. On July 27, 2018, a cash dividend of $0.75 per mandatory convertible preferred share was declared for shareholders of record on October 15, 2018. The dividend was paid on November 1, 2018 in the amount of $4.3 million. On November 6, 2018, a cash dividend of $0.75 per mandatory convertible preferred share was declared for shareholders of record on January 15, 2019. The dividend was paid on February 1, 2019 in the amount of $4.3 million. These dividends were charged to retained earnings in our consolidated statement of changes in equity for the year ended December 31, 2018.
On February 22, 2019,20, 2020, a cash dividend of $0.75 per mandatory convertible preferred share was declared for shareholders of record on April 15, 20192020 and will be paid on May 1, 2019.2020.
Shareholder Rights Plan
On July 16, 2012, the Board declared the issuance of one preferred share purchase right (a “Right”) for each Common Share issued and outstanding on July 27, 2012 (the “Record Date”) to the shareholders of record on that date. On July 16, 2016, the Rights expired.
Note 1413 Joint Ventures
During 2016, we entered into an agreement with Saudi Aramco, to form a new joint venture, SANAD, to own, manage and operate onshore drilling rigs in the Kingdom of Saudi Arabia. SANAD, which is equally owned by Saudi Aramco and Nabors, began operations during the fourth quarter of 2017.
During 2017, Nabors and Saudi Aramco each contributed $20 million in cash for the purpose of capitalizing the joint venture upon formation. In addition, since inception Nabors and Saudi Aramco have each contributed a combination of drilling rigs, drilling rig equipment and other assets, including cash, each with a value of approximately $394$394 million to the joint venture. The contributions were received in exchange for redeemable ownership interests which accrue interest annually, have a twenty-five year maturity and are required to be converted to authorized capital should certain events occur, including the accumulation of specified losses. In the accompanying consolidated balance sheet Nabors has reported Saudi Aramco’s share of authorized capital as a component of noncontrolling interest in equity and Saudi Aramco’s share of the redeemable ownership interests as redeemable noncontrolling interests in subsidiary, classified as mezzanine equity.
The condensed balance sheet of SANAD, as included in our consolidated balance sheet, is presented below.
| | | | | | | | |
| | December 31, | | |
| | 2018 | | 2017 | | |
| | (In thousands) | | |
| | | | | | | | |
| | | December 31, | |
| | | 2019 | | 2018 | |
| | | (In thousands) | |
Assets: | | | | | | | | | | | | | | |
Cash and cash equivalents | | $ | 211,618 | | $ | 94,496 | | | $ | 289,575 | | $ | 211,618 | |
Accounts receivable | | | 73,699 | | | 10,580 | | | | 68,624 | | | 73,699 | |
Other current assets | | | 17,198 | | | 10,834 | | | | 18,149 | | | 17,198 | |
Property, plant and equipment, net | | | 457,963 | | | 130,218 | | | | 455,751 | | | 457,963 | |
Other long-term assets | | | 36,583 | | | 23,091 | | | | 15,118 | | | 36,583 | |
Total assets | | $ | 797,061 | | $ | 269,219 | | | $ | 847,217 | | $ | 797,061 | |
Liabilities: | | | | | | | | | | | | | | |
Accounts payable | | $ | 60,087 | | $ | 7,236 | | | $ | 64,365 | | $ | 60,087 | |
Accrued liabilities | | | 8,530 | | | 2,592 | | | | 17,929 | | | 8,530 | |
Total liabilities | | $ | 68,617 | | $ | 9,828 | | | $ | 82,294 | | $ | 68,617 | |
The assets of SANAD cannot be used by Nabors for general corporate purposes. Additionally, creditors of SANAD do not have recourse to other assets of Nabors.
Note 14 Related-Party Transactions
Note 15 Pension, Postretirement and Postemployment Benefits
Pension Plans
In conjunction with our acquisition of Pool Energy Services Co. (“Pool”) in November 1999, we acquired the assets and liabilities of a defined benefit pension plan, the Pool Company Retirement Income Plan (the “Pool Pension Plan”). Benefits under the Pool Pension Plan are frozen and participants were fully vested in their accrued retirement benefit on December 31, 1998. The unfunded liability was $5.3 million and $6.7 million as of December 31, 2018 and 2017, respectively, and our net periodic benefit expense was $0.8 million, $1.2 million and $1.1 million for the years ended December 31, 2018, 2017 and 2016, respectively.
During 2016, we launched a voluntary, one-time opportunity to buyout active employees and retirees who were eligible participants of the Pool Pension Plan. The total amount of payments to those who elected to take the buyout was approximately $10.3 million and such payments were made from pension plan assets. Additionally, we recognized a charge related to the buyout of approximately $3.0 million, which is reflected in other, net in our consolidated statement of income (loss) for the year ended December 31, 2016. Due to the immateriality of the costs and liabilities of this plan, no further disclosure is presented.
Note 16 Related‑Party Transactions
Nabors and certain current and former key employees, including Mr. Petrello, entered into split‑dollarsplit-dollar life insurance agreements, pursuant to which we pay a portion of the premiums under life insurance policies with respect to these individuals and, in some instances, members of their families. These agreements provide that we are reimbursed for the premium payments upon the occurrence of specified events, including the death of an insured individual. Any recovery of premiums paid by Nabors could be limited to the cash surrender value of the policies under certain circumstances. As such, the values of these policies are recorded at their respective cash surrender values in our consolidated balance sheets. We have made premium payments to date totaling $6.6 million related to these policies. The cash surrender value of these policies of approximately $6.0$5.5 million is included in other long‑termlong-term assets in our consolidated balance sheets as of December 31, 20182019 and 2017.2018.
Under the Sarbanes‑OxleySarbanes-Oxley Act of 2002, the payment of premiums by Nabors under the agreements could be deemed to be prohibited loans by us to these individuals. Consequently, we have paid no0 premiums related to our agreements with these individuals since the adoption of the Sarbanes‑OxleySarbanes-Oxley Act.
In the ordinary course of business, we enter into various rig leases, rig transportation and related oilfield services agreements with our unconsolidated affiliates at market prices. Historically, these transactions primarily related to our former equity method investment in Nabors Arabia. During 2017, our joint venture with Saudi Aramco, SANAD, began operations. As such, we have included transactions with Saudi Aramco effective as of the commencement of operations of SANAD. See Note 1413 — Joint Ventures. Revenues from business transactions with these affiliated entities totaled $672.9 million, $723.8 million and $65.7 million for 2019, 2018 and 2017, respectively. Expenses from business transactions with these affiliated entities totaled $0.2 million for 2018 and $0.1 million for 20172018 and 2016.2017. Additionally, we had accounts receivable from these affiliated entities of $80.6 million and $122.9 million as of December 31, 2018,2019 and $54.2 million as of December 31, 2017. We had long‑term payables with these affiliated entities of $0.8 million as of December 31, 2017, which are included in other long-term liabilities.2018.
In addition, Mr. Crane, one of our independent directors, is Chairman and Chief Executive Officer of Crane Capital Group Inc. (“CCG”), an investment company that indirectly owns a majority interest in several operating companies, some of which have provided services to us in the ordinary course of business, including international logistics and electricity. During 2019, 2018 2017 and 2016,2017, we made payments for these services of $18.9 million, $19.9 million $14.6 million and $23.5$14.6 million, respectively. We had accounts payable to these CCG‑relatedCCG-related companies of $2.4 million and $0.8 million as of December 31, 20182019 and 2017.2018.
Note 1715 Commitments and Contingencies
Commitments
Under the joint venture agreement with Saudi Aramco, the agreement requires us to backstop our share of the joint venture’s obligations to purchase the first 25 drilling rigs in the event that there is insufficient cash in the joint venture or third party financing available. Although we currently anticipate that the future rig purchase needs will be met by cash flows from the joint venture and/or third party financing, no assurance can be given that the joint venture will not require us to fund our backstop.
Leases
Nabors and its subsidiaries occupy various facilities and lease certain equipment under various lease agreements.
The minimum rental commitments under non‑cancelable operating leases, with lease terms in excess of one year subsequent to December 31, 2018, were as follows:
| | | | |
| | (In thousands) | |
2019 | | $ | 10,701 | |
2020 | | | 7,104 | |
2021 | | | 3,774 | |
2022 | | | 2,356 | |
2023 | | | 1,538 | |
Thereafter | | | 7,482 | |
| | $ | 32,955 | |
The above amounts do not include property taxes, insurance or normal maintenance that the lessees are required to pay. Rental expense relating to operating leases with terms greater than 30 days amounted to $15.9 million, $18.7 million $15.0 million and $15.7$15.0 million for the years ended December 31, 2019, 2018 and 2017, and 2016, respectively. See Note 21 — Leases for more information on the minimum rental commitments under non-cancelable operating leases.
Minimum Volume CommitmentContingencies
We have contracts with pipeline companies to pay specified fees based on committed volumes for gas transport and processing. Our pipeline contractual commitments as of December 31, 2018 was $2.4 million. The final commitment period is for the period ending May 2019. Note 4—Assets Held for Sale and Discontinued Operations for additional discussion.
Contingencies
Income Tax Contingencies
We operate in a number of countries and our tax returns filed in those jurisdictions are subject to review and examination by tax authorities within those jurisdictions. We do not recognize the benefit of income tax positions we believe are more likely than not to be disallowed upon challenge by a tax authority. If any tax authority successfully challenges our operational structure, intercompany pricing policies or the taxable presence of our subsidiaries in certain
countries, if the terms of certain income tax treaties are interpreted in a manner that is adverse to our structure, or if we lose a material tax dispute in any country, our effective tax rate on our worldwide earnings could change substantially.
We received an assessment from a tax authority in Latin America in connection with a 2007 income tax return. The assessment related to the denial of depreciation expense deductions related to drilling rigs. Similar deductions were taken in 2009. Although Nabors and its tax advisors believed these deductions were appropriate, the contingency was partially reserved. The audit period has since been closed and the reserve was released during 2018.
Self‑Insurance
We estimate the level of our liability related to insurance and record reserves for these amounts in our consolidated financial statements. Our estimates are based on the facts and circumstances specific to existing claims and our past experience with similar claims. These loss estimates and accruals recorded in our financial statements for claims have historically been reasonable in light of the actual amount of claims paid and are actuarially supported. Although we believe our insurance coverage and reserve estimates are reasonable, a significant accident or other event that is not fully covered by insurance or contractual indemnity could occur and could materially affect our financial position and results of operations for a particular period.
We self‑insure for certain losses relating to workers’ compensation, employers’ liability, general liability, automobile liability and property damage. Some of our workers’ compensation claims, employers’ liability and marine employers’ liability claims are subject to a $3.0 million per‑occurrence deductible; additionally, some of our automobile liability claims are subject to a $2.5 million deductible. General liability claims remain subject to a $5.0 million per‑occurrence deductible. Our policies were renewed effective April 1, 2017 and remain subject to these same deductibles.
In addition, we are subject to a $5.0 million deductible for land rigs and for offshore rigs. This applies to all kinds of risks of physical damage except for named windstorms in the U.S. Gulf of Mexico for which we are self‑insured. Effective May 22, 2018, our platform rig, MODS-400, is subject to a limit of $200.0 million with a $5.0 million deductible for named windstorm damage in the U.S. Gulf of Mexico.
Political risk insurance is procured for select operations in South America, Africa, the Middle East and Asia. Losses are subject to minimal deductibles, except for Colombia, which is subject to a $0.5 million deductible. Political risk insurance is not available for our operations in Venezuela. There is no assurance that such coverage will adequately protect Nabors against liability from all potential consequences.
As of December 31, 2018 and 2017, our self‑insurance accruals totaled $143.3 million and $150.9 million, respectively, and our related insurance recoveries/receivables were $30.5 million and $29.0 million as of December 31, 2018 and 2017, respectively.
Litigation
Nabors and its subsidiaries are defendants or otherwise involved in a number of lawsuits in the ordinary course of business. We estimate the range of our liability related to pending litigation when we believe the amount and range of loss can be estimated. We record our best estimate of a loss when the loss is considered probable. When a liability is probable and there is a range of estimated loss with no best estimate in the range, we record the minimum estimated liability related to the lawsuits or claims. As additional information becomes available, we assess the potential liability related to our pending litigation and claims and revise our estimates. Due to uncertainties related to the resolution of lawsuits and claims, the ultimate outcome may differ from our estimates. For matters where an unfavorable outcome is reasonably possible and significant, we disclose the nature of the matter and a range of potential exposure, unless an estimate cannot be made at the time of disclosure. In the opinion of management and based on liability accruals provided, our ultimate exposure with respect to these pending lawsuits and claims is not expected to have a material adverse effect on our consolidated financial position or cash flows, although they could have a material adverse effect on our results of operations for a particular reporting period.
In March 2011, the Court of Ouargla entered a judgment of approximately $24.6$23.7 million (at December 31, 20182019 exchange rates) against us relating to alleged violations of Algeria’s foreign currency exchange controls, which require that goods and services provided locally be invoiced and paid in local currency. The case relates to certain foreign currency payments made to us by CEPSA, a Spanish operator, for wells drilled in 2006. Approximately $7.5 million of the total contract amount was paid offshore in foreign currency, and approximately $3.2 million was paid in local currency. The judgment includes fines and penalties of approximately four4 times the amount at issue. We have appealed the ruling based on our understanding that the law in question applies only to resident entities incorporated under Algerian law. An intermediate court of appeals upheld the lower court’s ruling, and we appealed the matter to the Supreme Court. On September 25, 2014, the Supreme Court overturned the verdict against us, and the case was reheard by the Ouargla Court of Appeals on March 22, 2015 in light of the Supreme Court’s opinion. On March 29, 2015, the Ouargla Court of Appeals reinstated the initial judgment against us. We have appealed this decision again to the Supreme Court. While our payments were consistent with our historical operations in the country, and, we believe, those
of other multinational corporations there, as well as interpretations of the law by the Central Bank of Algeria, the ultimate resolution of this matter could result in a loss of up to $16.6$15.7 million in excess of amounts accrued.
On September 29, 2017, Nabors and Nabors Maple Acquisition Ltd.we were sued, along with Tesco Corporation and its Board of Directors, in a putative shareholder class action filed in the United States District Court for the Southern District of Texas, Houston Division. The plaintiff alleges that the September 18, 2017 Preliminary Proxy Statement filed by Tesco with the United States Securities and Exchange Commission omitted material information with respect to the proposed transaction between Tesco and Nabors announced on August 14, 2017. The plaintiff claims that the omissions rendered the Proxy Statement false and misleading, constituting a violation of Sections 14(a) and 20(a) of the Securities Exchange Act of 1934. The court consolidated several matters and entered a lead plaintiff appointment order. The plaintiff filed their amended complaint, adding Nabors Industries Ltd. as a party to the consolidated action. Nabors has filed its motion to dismiss, which was granted by the court on March 29, 2019. The parties have filed appellate briefs with the Fifth Circuit Court of Appeals, and arguments have been set for March 4, 2020. Nabors will vehementlycontinue to vigorously defend itself against the allegations.
Following a routine audit conducted in May and June of 2018 by the Atyrau Oblast Ecology Department (the “AOED”), our joint venture in Kazakhstan, KMG Nabors Drilling Company (“KNDC”), was administratively fined for not having emissions permits for KNDC owned or leased equipment. Prior to this audit, the AOED had always accepted the operator’s permits for all of their subcontractors. However, because of major personnel changes, AOED changed this position and is now requiring that the owner/lessor of the equipment that emits the pollutants must have its own permits. Administrative fines has been issued to KNDC and paid in the amount of $0.8$0.8 million for violations regarding the failure to have proper permits, and consequentlypermits. AOED had also assessed additional “environmental damages” that have been created duringin the amount of $3.4 million for the period while KNDC did not hold its’ own permit foremissions permit. However, KNDC appealed this fine and the emissions are pending that could exceed $3.4 million.AOED Economic Court ruled in KNDC’s favor. AOED has appealed this decision. Additional damages in the form of later year audits and taxes could become due as well exposing KNDC to possible additional penalties and fines in thean amount estimated to be up to approximately $4.0 million. In furtherance of this position, KNDC believes and is taking a stance per which the operator ofhave executed an agreement formalizing the wells has a contractualoperator’s obligation to reimburse KNDC for any and all such fines. The operator initially agreed, but then reversed its position in late 2018. In addition, KNDC has challenged the AOED’s decision both administratively and through the courts. The administrative appeal remains pending. The original administrative decision has been affirmed in the lower courts, and on February 6, 2019, the decision was appealedfinancial expenses related to the Supreme Court. The initial hearing in the Supreme Court is scheduled for March 14, 2019. Nabors intends to vigorously defend itself and pursue all remedies at its disposal.this case.
Off-Balance Sheet Arrangements (Including Guarantees)
We are a party to some transactions, agreements or other contractual arrangements defined as “off‑balance“off-balance sheet arrangements” that could have a material future effect on our financial position, results of operations, liquidity and capital resources. The most significant of these off‑balanceoff-balance sheet arrangements involveinclude the A/R Agreement (see Note 4—Accounts Receivable Sales Agreement) and certain agreements and obligations under which we provide financial or performance assurance to third parties. Certain of these agreementsfinancial or performance assurances serve as guarantees, including standby letters of credit issued on behalf of insurance carriers in conjunction with our workers’ compensation insurance program and other financial surety instruments such as bonds. In addition, we have provided indemnifications, which serve as guarantees, to some third parties. These guarantees include indemnification provided by Nabors to our share transfer agent and our insurance carriers. We are not able to estimate the potential future maximum payments that might be due under our indemnification guarantees.
Management believes the likelihood that we would be required to perform or otherwise incur any material losses associated with any of these guarantees is remote. The following table summarizes the total maximum amount of financial guarantees issued by Nabors:
| | | | | | | | | | | | | |
| | Maximum Amount | |
| | 2018 | | 2019 | | 2020 | | Thereafter | | Total | |
| | (In thousands) | |
Financial standby letters of credit and other financial surety instruments | | $ | 25,244 | | 163,285 | | 407 | | — | | $ | 188,936 | |
| | | | | | | | | | | | | |
| | Maximum Amount | |
| | 2020 | | 2021 | | 2022 | | Thereafter | | Total | |
| | (In thousands) | |
Financial standby letters of credit and other financial surety instruments | | $ | 216,053 | | 3,690 | | — | | — | | $ | 219,743 | |
Note 1816 Earnings (Losses) Per Share
ASC 260, Earnings per Share, requires companies to treat unvested share-based payment awards that have nonforfeitable rights to dividends or dividend equivalents as a separate class of securities in calculating earnings (losses) per share. We have granted and expect to continue to grant to employees restricted stock grants that contain
nonforfeitable rights to dividends. Such grants are considered participating securities under ASC 260. As such, we are required to include these grants in the calculation of our basic earnings (losses) per share and calculate basic earnings (losses) per share using the two-class method. The two-class method of computing earnings per share is an earnings allocation formula that determines earnings per share for each class of common stock and participating security according to dividends declared and participation rights in undistributed earnings. The participating security holders are not contractually obligated to share in losses. Therefore, losses are not allocated to the participating security holders.
Basic earnings (losses) per share is computed utilizing the two-class method and is calculated based on the weighted-average number of common shares outstanding during the periods presented.
Diluted earnings (losses) per share is computed using the weighted-average number of common and common equivalent shares outstanding during the periods utilizing the two-class method for stock options and unvested restricted stock. Shares issuable upon exchange of the $575$575.0 million 0.75% exchangeable notes are not included in the calculation of diluted earnings (losses) per share unless the exchange value of the notes exceeds their principal amount at the end of the relevant reporting period, in which case the notes will be accounted for as if the number of common shares that would be necessary to settle the excess are issued. Such shares are only included in the calculation of the weighted-average number of shares outstanding in our diluted earnings (losses) per share calculation, when the price of our shares exceeds $25.16 on the last trading day of the quarter, which did not occur during the year ended December 31, 2018.2019.
A reconciliation of the numerators and denominators of the basic and diluted earnings (losses) per share computations is as follows:
| | | | | | | | | | | | |
| | | | Year Ended December 31, | |
| | | | 2018 | | 2017 | | 2016 | |
| | | | (In thousands, except per share amounts) | |
BASIC EPS: | | | | | | | | | | | | |
Net income (loss) (numerator): | | | | | | | | | | | | |
Income (loss) from continuing operations, net of tax | | | | $ | (598,063) | | $ | (497,114) | | $ | (1,011,244) | |
Less: net (income) loss attributable to noncontrolling interest | | | | | (28,222) | | | (6,178) | | | (135) | |
Less: preferred stock dividends | | | | | (12,305) | | | — | | | — | |
Less: accrued distribution on redeemable noncontrolling interest in subsidiary | | | | | (11,098) | | | — | | | — | |
Less: distributed and undistributed earnings allocated to unvested shareholders | | | | | (1,819) | | | 13,210 | | | 22,730 | |
Numerator for basic earnings per share: | | | | | | | | | | | | |
Adjusted income (loss) from continuing operations, net of tax - basic | | | | $ | (651,507) | | $ | (490,082) | | $ | (988,649) | |
Income (loss) from discontinued operations, net of tax | | | | $ | (14,663) | | $ | (43,519) | | $ | (18,363) | |
| | | | | | | | | | | | |
Weighted-average number of shares outstanding - basic | | | | | 334,397 | | | 280,653 | | | 276,475 | |
Earnings (losses) per share: | | | | | | | | | | | | |
Basic from continuing operations | | | | $ | (1.95) | | $ | (1.75) | | $ | (3.58) | |
Basic from discontinued operations | | | | | (0.04) | | | (0.15) | | | (0.06) | |
Total Basic | | | | $ | (1.99) | | $ | (1.90) | | $ | (3.64) | |
DILUTED EPS: | | | | | | | | | | | | |
Adjusted income (loss) from continuing operations, net of tax - basic | | | | $ | (651,507) | | $ | (490,082) | | $ | (988,649) | |
Add: effect of reallocating undistributed earnings of unvested shareholders | | | | | — | | | — | | | — | |
Adjusted income (loss) from continuing operations, net of tax - diluted | | | | $ | (651,507) | | $ | (490,082) | | $ | (988,649) | |
Income (loss) from discontinued operations, net of tax | | | | $ | (14,663) | | $ | (43,519) | | $ | (18,363) | |
| | | | | | | | | | | | |
Weighted-average number of shares outstanding - basic | | | | | 334,397 | | | 280,653 | | | 276,475 | |
Add: dilutive effect of potential common shares | | | | | — | | | — | | | — | |
Weighted-average number of shares outstanding - diluted | | | | | 334,397 | | | 280,653 | | | 276,475 | |
Earnings (losses) per share: | | | | | | | | | | | | |
Diluted from continuing operations | | | | $ | (1.95) | | $ | (1.75) | | $ | (3.58) | |
Diluted from discontinued operations | | | | | (0.04) | | | (0.15) | | | (0.06) | |
Total Diluted | | | | $ | (1.99) | | $ | (1.90) | | $ | (3.64) | |
| | | | | | | | | | | | |
| | | | Year Ended December 31, | |
| | | | 2019 | | 2018 | | 2017 | |
| | | | (In thousands, except per share amounts) | |
BASIC EPS: | | | | | | | | | | | | |
Net income (loss) (numerator): | | | | | | | | | | | | |
Income (loss) from continuing operations, net of tax | | | | $ | (680,498) | | $ | (598,063) | | $ | (497,114) | |
Less: net (income) loss attributable to noncontrolling interest | | | | | (22,375) | | | (28,222) | | | (6,178) | |
Less: preferred stock dividends | | | | | (17,244) | | | (12,305) | | | — | |
Less: accrued distribution on redeemable noncontrolling interest in subsidiary | | | | | (20,534) | | | (11,098) | | | — | |
Less: distributed and undistributed earnings allocated to unvested shareholders | | | | | (459) | | | (1,819) | | | 13,210 | |
Numerator for basic earnings per share: | | | | | | | | | | | | |
Adjusted income (loss) from continuing operations, net of tax - basic | | | | $ | (741,110) | | $ | (651,507) | | $ | (490,082) | |
Income (loss) from discontinued operations, net of tax | | | | $ | (12) | | $ | (14,663) | | $ | (43,519) | |
| | | | | | | | | | | | |
Weighted-average number of shares outstanding - basic | | | | | 351,617 | | | 334,397 | | | 280,653 | |
Earnings (losses) per share: | | | | | | | | | | | | |
Basic from continuing operations | | | | $ | (2.11) | | $ | (1.95) | | $ | (1.75) | |
Basic from discontinued operations | | | | | — | | | (0.04) | | | (0.15) | |
Total Basic | | | | $ | (2.11) | | $ | (1.99) | | $ | (1.90) | |
DILUTED EPS: | | | | | | | | | | | | |
Adjusted income (loss) from continuing operations, net of tax - basic | | | | $ | (741,110) | | $ | (651,507) | | $ | (490,082) | |
Add: effect of reallocating undistributed earnings of unvested shareholders | | | | | — | | | — | | | — | |
Adjusted income (loss) from continuing operations, net of tax - diluted | | | | $ | (741,110) | | $ | (651,507) | | $ | (490,082) | |
Income (loss) from discontinued operations, net of tax | | | | $ | (12) | | $ | (14,663) | | $ | (43,519) | |
| | | | | | | | | | | | |
Weighted-average number of shares outstanding - basic | | | | | 351,617 | | | 334,397 | | | 280,653 | |
Add: dilutive effect of potential common shares | | | | | — | | | — | | | — | |
Weighted-average number of shares outstanding - diluted | | | | | 351,617 | | | 334,397 | | | 280,653 | |
Earnings (losses) per share: | | | | | | | | | | | | |
Diluted from continuing operations | | | | $ | (2.11) | | $ | (1.95) | | $ | (1.75) | |
Diluted from discontinued operations | | | | | — | | | (0.04) | | | (0.15) | |
Total Diluted | | | | $ | (2.11) | | $ | (1.99) | | $ | (1.90) | |
| | | | | | | | | | | | |
For all periods presented, the computation of diluted earnings (losses) per Nabors’ share excludes outstanding stock options with exercise prices greater than the average market price of Nabors’ common shares, because their inclusion would be anti‑dilutiveanti-dilutive and because they are not considered participating securities. For periods in which we experience a net loss from continuing operations, all potential common shares have been excluded from the calculation of weighted-average shares outstanding, because their inclusion would be anti-dilutive. The average number of options that were excluded from diluted earnings (losses) per share that would potentially dilute earnings per share in the future were as follows:
| | | | | | | | | | | |
| | | | Year Ended December 31, |
| | | | 2018 | | 2017 | | 2016 |
| | | | (In thousands) |
| | | | | | | | | | | |
Potentially dilutive securities excluded as anti-dilutive | | | | | 4,341 | | | 4,534 | | | 5,372 |
| | | | | | | | | | | |
| | | | Year Ended December 31, |
| | | | 2019 | | 2018 | | 2017 |
| | | | (In thousands) |
| | | | | | | | | | | |
Potentially dilutive securities excluded as anti-dilutive | | | | | 1,994 | | | 4,341 | | | 4,534 |
In any period during which the average market price of Nabors’ common shares exceeds the exercise prices of these stock options, such stock options will be included in our diluted earnings (losses) per share computation using the if‑convertedif-converted method of accounting. Restricted stock is included in our basic and diluted earnings (losses) per share computation using the two‑classtwo-class method of accounting in all periods because such stock is considered participating securities.
Additionally, we excluded 38.539.2 million common shares from the computation of diluted shares issuable upon the conversion of mandatory convertible preferred shares, because their effect would be anti-dilutive under the if-converted method.
Note 1917 Supplemental Balance Sheet, Income Statement and Cash Flow Information
Accrued liabilities include the following:
| | | | | | | | |
| | December 31, | | |
| | 2018 | | 2017 | | |
| | (In thousands) | | |
| | | | | | | | |
| | | December 31, | |
| | | 2019 | | 2018 | |
| | | (In thousands) | |
Accrued compensation | | $ | 92,358 | | $ | 130,970 | | | $ | 97,003 | | $ | 92,358 | |
Deferred revenue and proceeds on insurance and asset sales | | | 149,266 | | | 218,370 | | | | 89,051 | | | 149,266 | |
Other taxes payable | | | 33,199 | | | 32,095 | | | | 31,472 | | | 33,199 | |
Workers’ compensation liabilities | | | 16,316 | | | 13,987 | | | | 30,214 | | | 16,316 | |
Interest payable | | | 59,718 | | | 65,642 | | | | 51,316 | | | 59,718 | |
Litigation reserves | | | 24,926 | | | 18,830 | | | | 14,736 | | | 24,926 | |
Current liability to discontinued operations | | | 2,445 | | | 6,074 | | | | — | | | 2,445 | |
Dividends declared and payable | | | 25,330 | | | 17,148 | | | | 7,832 | | | 25,330 | |
Other accrued liabilities | | | 14,354 | | | 29,928 | | | | 11,658 | | | 14,354 | |
| | $ | 417,912 | | $ | 533,044 | | |
| | | $ | 333,282 | | $ | 417,912 | |
Investment income (loss) includes the following:
| | | | | | | | | | | | |
| | | Year Ended December 31, | | |
| | | 2018 | | 2017 | | 2016 | | |
| | | (In thousands) | | |
| | | | | | | | | | | | |
| | | | | | | | | | | | |
| | | | Year Ended December 31, | |
| | | | 2019 | | 2018 | | 2017 | |
| | | | (In thousands) | |
Interest and dividend income | | | $ | 4,957 | | $ | 2,227 | | $ | 1,215 | | | | $ | 8,424 | | $ | 4,957 | | $ | 2,227 | |
Gains (losses) on marketable securities | | | | (14,456) | | | (1,033) | | | (32) | | | | | 1,794 | | | (14,456) | | | (1,033) | |
| | | $ | (9,499) | | $ | 1,194 | | $ | 1,183 | | |
| | | | $ | 10,218 | | $ | (9,499) | | $ | 1,194 | |
Other, net includes the following:
| | | | | | | | | | | | |
| | | | Year Ended December 31, | |
| | | | 2019 | | 2018 | | 2017 | |
| | | | (In thousands) | |
Losses (gains) on sales, disposals and involuntary conversions of long-lived assets | | | | $ | 7,141 | | $ | 11,789 | | $ | 19,026 | |
Litigation expenses and reserves | | | | | 5,226 | | | 9,939 | | | 1,273 | |
Foreign currency transaction losses (gains) | | | | | 20,929 | | | 4,156 | | | 1,603 | |
Other losses (gains) | | | | | (72) | | | 3,648 | | | (7,022) | |
| | | | $ | 33,224 | | $ | 29,532 | | $ | 14,880 | |
| | | | | | | | | | | | |
| | | | Year Ended December 31, | |
| | | | 2018 | | 2017 | | 2016 | |
| | | | (In thousands) | |
Losses (gains) on sales, disposals and involuntary conversions of long-lived assets | | | | $ | 11,789 | | $ | 19,026 | | $ | 14,830 | |
Charges related to our CJES holdings (1) | | | | | — | | | — | | | 12,879 | |
Litigation expenses and reserves | | | | | 9,939 | | | 1,273 | | | 3,936 | |
Foreign currency transaction losses (gains) | | | | | 4,156 | | | 1,603 | | | 5,669 | |
Other losses (gains) | | | | | 3,648 | | | (7,022) | | | 6,860 | |
| | | | $ | 29,532 | | $ | 14,880 | | $ | 44,174 | |
Table of Contents
(1) Includes legal and professional fees incurred primarily in connection with preserving our interests in CJES. See Note 9 – Investments in Unconsolidated Affiliates.
The changes in accumulated other comprehensive income (loss), by component, include the following:
| | | | | | | | | | | | | | | | |
| | | | | Unrealized | | | | | | | | | | |
| | Gains | | gains (losses) | | Defined | | | | | | | |
| | (losses) on | | on available- | | benefit | | Foreign | | | | |
| | cash flow | | for-sale | | pension plan | | currency | | | | |
| | hedges | | securities | | items | | items | | Total | |
| | (In thousands (1) ) | |
As of January 1, 2018 | | $ | (922) | | $ | 9,144 | | $ | (4,111) | | $ | 7,074 | | $ | 11,185 | |
Other comprehensive income (loss) before reclassifications | | | — | | | — | | | — | | | (31,962) | | | (31,962) | |
Amounts reclassified from accumulated other comprehensive income (loss) | | | 430 | | | — | | | 166 | | | — | | | 596 | |
Adoption of ASU No. 2016-01 | | | — | | | (9,144) | | | — | | | — | | | (9,144) | |
Net other comprehensive income (loss) | | | 430 | | | (9,144) | | | 166 | | | (31,962) | | | (40,510) | |
As of December 31, 2018 | | $ | (492) | | $ | — | | $ | (3,945) | | $ | (24,888) | | $ | (29,325) | |
| | | | | | | | | | | | | | | | |
| | | | | Unrealized | | | | | | | | | | |
| | Gains | | gains (losses) | | Defined | | | | | | | |
| | (losses) on | | on available- | | benefit | | Foreign | | | | |
| | cash flow | | for-sale | | pension plan | | currency | | | | |
| | hedges | | securities | | items | | items | | Total | |
| | (In thousands (1) ) | |
As of January 1, 2017 | | $ | (1,296) | | $ | 14,235 | | $ | (3,760) | | $ | (21,298) | | $ | (12,119) | |
Other comprehensive income (loss) before reclassifications | | | — | | | (6,061) | | | (475) | | | 28,372 | | | 21,836 | |
Amounts reclassified from accumulated other comprehensive income (loss) | | | 374 | | | 970 | | | 124 | | | — | | | 1,468 | |
Net other comprehensive income (loss) | | | 374 | | | (5,091) | | | (351) | | | 28,372 | | | 23,304 | |
As of December 31, 2017 | | $ | (922) | | $ | 9,144 | | $ | (4,111) | | $ | 7,074 | | $ | 11,185 | |
| (1) | (1)
| | All amounts are net of tax. |
| | | | | | | | | | | | | | | | |
| | | | | Unrealized | | | | | | | | | | |
| | Gains | | gains (losses) | | Defined | | | | | | | |
| | (losses) on | | on available- | | benefit | | Foreign | | | | |
| | cash flow | | for-sale | | pension plan | | currency | | | | |
| | hedges | | securities | | items | | items | | Total | |
| | (In thousands (1) ) | |
As of January 1, 2019 | | $ | (492) | | $ | — | | $ | (3,945) | | $ | (24,888) | | $ | (29,325) | |
Other comprehensive income (loss) before reclassifications | | | — | | | — | | | — | | | 16,943 | | | 16,943 | |
Amounts reclassified from accumulated other comprehensive income (loss) | | | 427 | | | — | | | 167 | | | — | | | 594 | |
Net other comprehensive income (loss) | | | 427 | | | — | | | 167 | | | 16,943 | | | 17,537 | |
As of December 31, 2019 | | $ | (65) | | $ | — | | $ | (3,778) | | $ | (7,945) | | $ | (11,788) | |
| | | | | | | | | | | | | | | | |
| | | | | Unrealized | | | | | | | | | | |
| | Gains | | gains (losses) | | Defined | | | | | | | |
| | (losses) on | | on available- | | benefit | | Foreign | | | | |
| | cash flow | | for-sale | | pension plan | | currency | | | | |
| | hedges | | securities | | items | | items | | Total | |
| | (In thousands (1) ) | |
As of January 1, 2018 | | $ | (922) | | $ | 9,144 | | $ | (4,111) | | $ | 7,074 | | $ | 11,185 | |
Other comprehensive income (loss) before reclassifications | | | — | | | — | | | — | | | (31,962) | | | (31,962) | |
Amounts reclassified from accumulated other comprehensive income (loss) | | | 430 | | | — | | | 166 | | | — | | | 596 | |
Adoption of ASU No. 2016-01 | | | — | | | (9,144) | | | — | | | — | | | (9,144) | |
Net other comprehensive income (loss) | | | 430 | | | (9,144) | | | 166 | | | (31,962) | | | (40,510) | |
As of December 31, 2018 | | $ | (492) | | $ | — | | $ | (3,945) | | $ | (24,888) | | $ | (29,325) | |
| (1) | (1)
| | All amounts are net of tax. |
The line items that were reclassified to net income include the following:
Line item in consolidated statement of income (loss)
| | | | | | | | | | | |
| | | | Year Ended December 31, |
| | | | 2019 | | 2018 | | 2017 |
| | | | (In thousands) |
Impairments and other charges | | | | $ | — | | $ | — | | $ | 970 |
Interest expense | | | | | 567 | | | 567 | | | 613 |
General and administrative expenses | | | | | 217 | | | 216 | | | 200 |
Total income (loss) from continuing operations before income tax | | | | | (784) | | | (783) | | | (1,783) |
Tax expense (benefit) | | | | | (190) | | | (187) | | | (315) |
Reclassification adjustment for (gains)/ losses included in net income (loss) | | | | $ | (594) | | $ | (596) | | $ | (1,468) |
| | | | | | | | | | | | |
| | | | Year Ended December 31, | |
| | | | 2018 | | 2017 | | 2016 | |
| | | | (In thousands) | |
Impairments and other charges | | | | $ | — | | $ | 970 | | $ | 3,495 | |
Interest expense | | | | | 567 | | | 613 | | | 613 | |
General and administrative expenses | | | | | 216 | | | 200 | | | 1,061 | |
Other expense (income), net | | | | | — | | | — | | | 3,059 | |
Total income (loss) from continuing operations before income tax | | | | | (783) | | | (1,783) | | | (8,228) | |
Tax expense (benefit) | | | | | (187) | | | (315) | | | (1,551) | |
Reclassification adjustment for (gains)/ losses included in net income (loss) | | | | $ | (596) | | $ | (1,468) | | $ | (6,677) | |
Supplemental cash flow information includes the following:
| | | | | | | | |
| | Year Ended December 31, | | |
| | 2018 | | 2017 | | 2016 | | |
| | (In thousands) | | |
| | | | | | | | | | | |
| | | Year Ended December 31, | |
| | | 2019 | | 2018 | | 2017 | |
| | | (In thousands) | |
Cash paid for income taxes | | $ | 11,383 | | $ | 20,581 | | $ | 34,479 | | | $ | 6,553 | | $ | 11,383 | | $ | 20,581 | |
Cash paid for interest, net of capitalized interest | | $ | 202,803 | | $ | 191,986 | | $ | 184,445 | | | $ | 174,357 | | $ | 202,803 | | $ | 191,986 | |
Net change in accounts payable related to capital expenditures | | $ | (8,556) | | $ | (35,227) | | $ | 22,920 | | | $ | (7,624) | | $ | (8,556) | | $ | (35,227) | |
Non-cash increase in assets attributable to redeemable noncontrolling interest in subsidiary | | $ | 43,928 | | $ | 142,875 | | $ | — | | | $ | — | | $ | 43,928 | | $ | 142,875 | |
Acquisitions of businesses: | | | | | | | | | | | | | | | | | | | | |
Fair value of assets acquired | | $ | 48,053 | | $ | 280,709 | | $ | — | | | $ | 2,929 | | $ | 48,053 | | $ | 280,709 | |
Goodwill | | | 11,436 | | 5,690 | | — | | | | — | | | 11,436 | | | 5,690 | |
Liabilities assumed | | | (34,489) | | | (55,742) | | | — | | | | — | | | (34,489) | | | (55,742) | |
Share issuance as consideration (non-cash financing activity) | | | — | | (178,993) | | — | | | | — | | | — | | | (178,993) | |
Payments on future consideration | | | — | | | — | | | 22,278 | | |
Cash paid for acquisitions of businesses | | | 25,000 | | | 51,664 | | | 22,278 | | | | 2,929 | | | 25,000 | | | 51,664 | |
Cash and restricted cash acquired in acquisitions of businesses | | | (4,141) | | | (63,983) | | | — | | | | — | | | (4,141) | | | (63,983) | |
Cash (acquired in) paid for acquisitions of businesses, net | | $ | 20,859 | | $ | (12,319) | | $ | 22,278 | | | $ | 2,929 | | $ | 20,859 | | $ | (12,319) | |
Note 2018 Unaudited Quarterly Financial Information
| | | | | | | | | | | | | |
| | Year Ended December 31, 2018 | | |
| | Quarter Ended | | |
| | March 31, | | June 30, | | September 30, | | December 31, | | |
| | (In thousands, except per share amounts) | | |
| | | | | | | | | | | | | |
| | | Year Ended December 31, 2019 | |
| | | Quarter Ended | |
| | | March 31, | | June 30, | | September 30, | | December 31, | |
| | | (In thousands, except per share amounts) | |
Operating revenues | | $ | 734,194 | | $ | 761,920 | | $ | 779,425 | | $ | 782,080 | | | $ | 799,640 | | $ | 771,406 | | $ | 758,076 | | $ | 714,261 | |
Income (loss) from continuing operations, net of tax | | $ | (143,587) | | $ | (195,215) | | $ | (93,710) | | $ | (165,551) | | | $ | (103,376) | | $ | (192,801) | | $ | (99,788) | | $ | (284,533) | |
Income (loss) from discontinued operations, net of tax | | | (75) | | | (584) | | | (13,933) | | | (71) | | | | (157) | | | (34) | | | 157 | | | 22 | |
Net income (loss) | | | (143,662) | | | (195,799) | | | (107,643) | | | (165,622) | | | | (103,533) | | | (192,835) | | | (99,631) | | | (284,511) | |
Less: Net (income) loss attributable to noncontrolling interest | | | (539) | | | (2,953) | | | (6,934) | | | (17,796) | | | | (14,176) | | | (10,729) | | | (19,297) | | | 21,827 | |
Net income (loss) attributable to Nabors | | $ | (144,201) | | $ | (198,752) | | $ | (114,577) | | $ | (183,418) | | | $ | (117,709) | | $ | (203,564) | | $ | (118,928) | | $ | (262,684) | |
Less: Preferred stock dividend | | | — | | | (3,680) | | | (4,313) | | | (4,312) | | | | (4,313) | | | (4,312) | | | (4,310) | | | (4,309) | |
Net income (loss) attributable to Nabors common shareholders | | $ | (144,201) | | $ | (202,432) | | $ | (118,890) | | $ | (187,730) | | | $ | (122,022) | | $ | (207,876) | | $ | (123,238) | | $ | (266,993) | |
Earnings (losses) per share: (1) | | | | | | | | | | | | | | | | | | | | | | | | |
Basic from continuing operations | | $ | (0.46) | | $ | (0.61) | | $ | (0.31) | | $ | (0.55) | | | $ | (0.36) | | $ | (0.61) | | $ | (0.37) | | $ | (0.77) | |
Basic from discontinued operations | | | — | | | — | | | (0.04) | | | — | | | | — | | | — | | | — | | | — | |
Total Basic | | $ | (0.46) | | $ | (0.61) | | $ | (0.35) | | $ | (0.55) | | | $ | (0.36) | | $ | (0.61) | | $ | (0.37) | | $ | (0.77) | |
Diluted from continuing operations | | $ | (0.46) | | $ | (0.61) | | $ | (0.31) | | $ | (0.55) | | | $ | (0.36) | | $ | (0.61) | | $ | (0.37) | | $ | (0.77) | |
Diluted from discontinued operations | | | — | | | — | | | (0.04) | | | — | | | | — | | | — | | | — | | | — | |
Total Diluted | | $ | (0.46) | | $ | (0.61) | | $ | (0.35) | | $ | (0.55) | | | $ | (0.36) | | $ | (0.61) | | $ | (0.37) | | $ | (0.77) | |
| | | | | | | | | | | | | |
| | Year Ended December 31, 2018 | |
| | Quarter Ended | |
| | March 31, | | June 30, | | September 30, | | December 31, | |
| | (In thousands, except per share amounts) | |
| | | | | | | | | | | | | |
Operating revenues | | $ | 734,194 | | $ | 761,920 | | $ | 779,425 | | $ | 782,080 | |
Income (loss) from continuing operations, net of tax | | $ | (143,587) | | $ | (195,215) | | $ | (93,710) | | $ | (165,551) | |
Income (loss) from discontinued operations, net of tax | | | (75) | | | (584) | | | (13,933) | | | (71) | |
Net income (loss) | | | (143,662) | | | (195,799) | | | (107,643) | | | (165,622) | |
Less: Net (income) loss attributable to noncontrolling interest | | | (539) | | | (2,953) | | | (6,934) | | | (17,796) | |
Net income (loss) attributable to Nabors | | $ | (144,201) | | $ | (198,752) | | $ | (114,577) | | $ | (183,418) | |
Less: Preferred stock dividend | | | — | | | (3,680) | | | (4,313) | | | (4,312) | |
Net income (loss) attributable to Nabors common shareholders | | $ | (144,201) | | $ | (202,432) | | $ | (118,890) | | $ | (187,730) | |
Earnings (losses) per share: (1) | | | | | | | | | | | | | |
Basic from continuing operations | | $ | (0.46) | | $ | (0.61) | | $ | (0.31) | | $ | (0.55) | |
Basic from discontinued operations | | | — | | | — | | | (0.04) | | | — | |
Total Basic | | $ | (0.46) | | $ | (0.61) | | $ | (0.35) | | $ | (0.55) | |
Diluted from continuing operations | | $ | (0.46) | | $ | (0.61) | | $ | (0.31) | | $ | (0.55) | |
Diluted from discontinued operations | | | — | | | — | | | (0.04) | | | — | |
Total Diluted | | $ | (0.46) | | $ | (0.61) | | $ | (0.35) | | $ | (0.55) | |
| | | | | | | | | | | | | |
| | Year Ended December 31, 2017 | |
| | Quarter Ended | |
| | March 31, | | June 30, | | September 30, | | December 31, | |
| | (In thousands, except per share amounts) | |
| | | | | | | | | | | | | |
Operating revenues | | $ | 562,550 | | $ | 631,355 | | $ | 662,103 | | $ | 708,277 | |
Income (loss) from continuing operations, net of tax | | $ | (147,628) | | $ | (115,476) | | $ | (119,285) | | $ | (114,725) | |
Income (loss) from discontinued operations, net of tax | | | (439) | | | (15,504) | | | (27,134) | | | (442) | |
Net income (loss) | | | (148,067) | | | (130,980) | | | (146,419) | | | (115,167) | |
Less: Net (income) loss attributable to noncontrolling interest | | | (917) | | | (1,971) | | | (2,113) | | | (1,177) | |
Net income (loss) attributable to Nabors | | $ | (148,984) | | $ | (132,951) | | $ | (148,532) | | $ | (116,344) | |
Less: Preferred stock dividend | | | — | | | — | | | — | | | — | |
Net income (loss) attributable to Nabors common shareholders | | $ | (148,984) | | $ | (132,951) | | $ | (148,532) | | $ | (116,344) | |
Earnings (losses) per share: (1) | | | | | | | | | | | | | |
Basic from continuing operations | | $ | (0.52) | | $ | (0.41) | | $ | (0.42) | | $ | (0.40) | |
Basic from discontinued operations | | | — | | | (0.05) | | | (0.10) | | | — | |
Total Basic | | $ | (0.52) | | $ | (0.46) | | $ | (0.52) | | $ | (0.40) | |
Diluted from continuing operations | | $ | (0.52) | | $ | (0.41) | | $ | (0.42) | | $ | (0.40) | |
Diluted from discontinued operations | | | — | | | (0.05) | | | (0.10) | | | — | |
Total Diluted | | $ | (0.52) | | $ | (0.46) | | $ | (0.52) | | $ | (0.40) | |
| (1) | | Earnings per share is computed independently for each of the quarters presented. Therefore, the sum of the quarterly earnings per share may not equal the total computed for the year. |
Note 2119 Segment Information
Our business consists of five5 reportable segments: U.S. Drilling, Canada Drilling, International Drilling, Drilling Solutions and Rig Technologies. The accounting policies of the segments are the same as those described in Note 2—Summary of Significant Accounting Policies. Inter-segment sales are recorded at cost or cost plus a profit margin. We evaluate the performance of our segments based on several criteria, including adjusted operating income (loss).
The following table sets forth financial information with respect to our reportable operating segments:
| | | | | | | | | | | | | |
| | | | Year Ended December 31, | | |
| | | | 2018 | | 2017 | | 2016 | | |
| | | | (In thousands) | | |
| | | | | | | | | | | | | |
| | | | | Year Ended December 31, | |
| | | | | 2019 | | 2018 | | 2017 | |
| | | | | (In thousands) | |
Operating revenues: | | | | | | | | | | | | | | | | | | | | | | | | |
U.S. Drilling | | | | $ | 1,083,227 | | $ | 805,223 | | $ | 554,072 | | | | | $ | 1,240,936 | | $ | 1,083,227 | | $ | 805,223 | |
Canada Drilling | | | | | 105,000 | | | 82,929 | | | 51,472 | | | | | | 68,274 | | | 105,000 | | | 82,929 | |
International Drilling | | | | | 1,469,038 | | | 1,474,060 | | | 1,508,890 | | | | | | 1,324,142 | | | 1,469,038 | | | 1,474,060 | |
Drilling Solutions | | | | | 250,242 | | | 140,701 | | | 63,759 | | | | | | 252,790 | | | 250,242 | | | 140,701 | |
Rig Technologies | | | | | 270,988 | | | 234,542 | | | 151,951 | | | | | | 260,226 | | | 270,988 | | | 234,542 | |
Other reconciling items (1) | | | | | (120,876) | | | (173,170) | | | (102,305) | | | | | | (102,985) | | | (120,876) | | | (173,170) | |
Total | | | | $ | 3,057,619 | | $ | 2,564,285 | | $ | 2,227,839 | | | | | $ | 3,043,383 | | $ | 3,057,619 | | $ | 2,564,285 | |
| | | | | | | | | | | | |
| | | | Year Ended December 31, | |
| | | | 2018 | | 2017 | | 2016 | |
| | | | (In thousands) | |
Adjusted operating income (loss): (2) | | | | | | | | | | | | |
U.S. Drilling | | | | $ | (21,298) | | $ | (213,877) | | $ | (197,710) | |
Canada Drilling | | | | | (6,166) | | | (22,262) | | | (36,818) | |
International Drilling | | | | | 74,221 | | | 108,428 | | | 164,677 | |
Drilling Solutions | | | | | 37,626 | | | 16,738 | | | (16,503) | |
Rig Technologies | | | | | (25,762) | | | (30,964) | | | (31,981) | |
Total segment adjusted operating income (loss) | | | | $ | 58,621 | | $ | (141,937) | | $ | (118,335) | |
| | | | | | | | | | | | |
| | | | | | | | | | | | |
| | | | Year Ended December 31, | |
| | | | 2019 | | 2018 | | 2017 | |
| | | | (In thousands) | |
Adjusted operating income (loss): (2) | | | | | | | | | | | | |
U.S. Drilling | | | | $ | 64,313 | | $ | (21,298) | | $ | (213,877) | |
Canada Drilling | | | | | (14,483) | | | (6,166) | | | (22,262) | |
International Drilling | | | | | (8,903) | | | 74,221 | | | 108,428 | |
Drilling Solutions | | | | | 59,465 | | | 37,626 | | | 16,738 | |
Rig Technologies | | | | | (11,247) | | | (25,762) | | | (30,964) | |
Total segment adjusted operating income (loss) | | | | $ | 89,145 | | $ | 58,621 | | $ | (141,937) | |
| | | | | | | | | | | | |
| | | | | | | | | | | | | |
| | | | Year Ended December 31, | | |
| | | | 2018 | | 2017 | | 2016 | | |
| | | | (In thousands) | | |
| | | | | | | | | | | | | |
| | | | | Year Ended December 31, | |
| | | | | 2019 | | 2018 | | 2017 | |
| | | | | (In thousands) | |
Reconciliation of segment adjusted operating income (loss) to net income (loss) from continuing operations before income taxes: | | | | | | | | | | | | | | | | | | | | | | | | |
Total segment adjusted operating income (loss) (2) | | | | $ | 58,621 | | $ | (141,937) | | $ | (118,335) | | | | | $ | 89,145 | | $ | 58,621 | | $ | (141,937) | |
Other reconciling items (3) | | | | | (166,815) | | | (157,043) | | | (130,976) | | | | | | (160,274) | | | (166,815) | | | (157,043) | |
Earnings (losses) from unconsolidated affiliates | | | | | 1 | | | 7 | | | (221,914) | | | | | | (5) | | | 1 | | | 7 | |
Investment income (loss) | | | | | (9,499) | | | 1,194 | | | 1,183 | | | | | | 10,218 | | | (9,499) | | | 1,194 | |
Interest expense | | | | | (227,124) | | | (222,889) | | | (185,360) | | | | | | (204,311) | | | (227,124) | | | (222,889) | |
Impairments and other charges | | | | | (144,446) | | | (44,536) | | | (498,499) | | | | | | (290,471) | | | (144,446) | | | (44,536) | |
Other, net | | | | | (29,532) | | | (14,880) | | | (44,174) | | | | | | (33,224) | | | (29,532) | | | (14,880) | |
Income (loss) from continuing operations before income taxes | | | | $ | (518,794) | | $ | (580,084) | | $ | (1,198,075) | | | | | $ | (588,922) | | $ | (518,794) | | $ | (580,084) | |
| | | | | | | | | | | |
| | Year Ended December 31, | | |
| | 2018 | | 2017 | | 2016 | | |
| | (In thousands) | | |
| | | | | | | | | | | |
| | | Year Ended December 31, | |
| | | 2019 | | 2018 | | 2017 | |
| | | (In thousands) | |
Depreciation and amortization | | | | | | | | | | | | | | | | | | | | |
U.S. Drilling | | $ | 394,586 | | $ | 375,171 | | $ | 388,367 | | | $ | 419,680 | | $ | 394,586 | | $ | 375,171 | |
Canada Drilling | | | 37,172 | | | 39,597 | | | 42,143 | | | | 29,766 | | | 37,172 | | | 39,597 | |
International Drilling | | | 383,227 | | | 400,753 | | | 411,372 | | | | 372,883 | | | 383,227 | | | 400,753 | |
Drilling Solutions | | | 31,037 | | | 16,188 | | | 18,598 | | | | 32,289 | | | 31,037 | | | 16,188 | |
Rig Technologies | | | 16,387 | | | 11,530 | | | 14,552 | | | | 12,715 | | | 16,387 | | | 11,530 | |
Other reconciling items (3) | | | 4,461 | | | (296) | | | (3,401) | | | | 8,758 | | | 4,461 | | | (296) | |
Total | | $ | 866,870 | | $ | 842,943 | | $ | 871,631 | | | $ | 876,091 | | $ | 866,870 | | $ | 842,943 | |
| | | | | | | | | | | |
| | Year Ended December 31, | | |
| | 2018 | | 2017 | | 2016 | | |
| | (In thousands) | | |
| | | | | | | | | | | |
| | | Year Ended December 31, | |
| | | 2019 | | 2018 | | 2017 | |
| | | (In thousands) | |
Capital expenditures: | | | | | | | | | | | | | | | | | | | | |
U.S. Drilling | | $ | 222,338 | | $ | 330,875 | | $ | 183,146 | | | $ | 184,705 | | $ | 222,338 | | $ | 330,875 | |
Canada Drilling | | | 12,981 | | | 17,197 | | | 4,546 | | | | 5,020 | | | 12,981 | | | 17,197 | |
International Drilling | | | 172,565 | | | 159,817 | | | 169,640 | | | | 209,728 | | | 172,565 | | | 159,817 | |
Drilling Solutions | | | 30,709 | | | 35,617 | | | 21,606 | | | | 23,598 | | | 30,709 | | | 35,617 | |
Rig Technologies | | | 12,250 | | | 4,715 | | | 2,003 | | | | 6,592 | | | 12,250 | | | 4,715 | |
Other reconciling items (3) | | | 2,592 | | | (9,030) | | | 33,438 | | | | (5,676) | | | 2,592 | | | (9,030) | |
Total | | $ | 453,435 | | $ | 539,191 | | $ | 414,379 | | | $ | 423,967 | | $ | 453,435 | | $ | 539,191 | |
| | | | | | | |
| | December 31, | |
| | 2019 | | 2018 | |
| | (In thousands) | |
Total assets: | | | | | | | |
U.S. Drilling | | $ | 2,369,200 | | $ | 2,982,974 | |
Canada Drilling | | | 202,706 | | | 252,817 | |
International Drilling | | | 2,979,494 | | | 3,320,347 | |
Drilling Solutions | | | 218,004 | | | 281,078 | |
Rig Technologies | | | 324,523 | | | 401,044 | |
Other reconciling items (3) | | | 666,731 | | | 615,684 | |
Total | | $ | 6,760,658 | | $ | 7,853,944 | |
| | | | | | | |
| | December 31, | |
| | 2018 | | 2017 | |
| | (In thousands) | |
Total assets: | | | | | | | |
U.S. Drilling | | $ | 2,982,974 | | $ | 3,203,560 | |
Canada Drilling | | | 252,817 | | | 347,773 | |
International Drilling | | | 3,320,347 | | | 3,540,829 | |
Drilling Solutions | | | 281,078 | | | 182,162 | |
Rig Technologies | | | 401,044 | | | 459,665 | |
Other reconciling items (3) | | | 615,684 | | | 667,995 | |
Total | | $ | 7,853,944 | | $ | 8,401,984 | |
| (1) | (1)
| | Represents the elimination of inter-segment transactions. |
| (2) | (2)
| | Adjusted operating income (loss) represents income (loss) from continuing operations before income taxes, interest expense, earnings (losses) from unconsolidated affiliates, investment income (loss), impairments and other charges and other, net. Management evaluates the performance of our operating segments using adjusted operating income (loss), which is a segment performance measure, because it believes that this financial measure reflects our ongoing profitability and performance. In addition, securities analysts and investors use this measure as one of the metrics on which they analyze our performance. A reconciliation to income (loss) from continuing operations before income taxes is provided in the above table. |
| (3) | (3)
| | Represents the elimination of inter-segment transactions and unallocated corporate expenses, assets and capital expenditures. |
The following table sets forth financial information with respect to Nabors’ operations by geographic area based on the location of service provided:
| | | | | | | | | | | |
| | Year Ended December 31, | | |
| | 2018 | | 2017 | | 2016 | | |
| | (In thousands) | | |
| | | | | | | | | | | |
| | | Year Ended December 31, | |
| | | 2019 | | 2018 | | 2017 | |
| | | (In thousands) | |
Operating revenues | | | | | | | | | | | | | | | | | | | | |
U.S. | | $ | 1,347,448 | | $ | 973,464 | | $ | 642,835 | | | $ | 1,554,442 | | $ | 1,347,448 | | $ | 973,464 | |
Outside the U.S. | | | 1,710,171 | | | 1,590,821 | | | 1,585,004 | | | | 1,488,941 | | | 1,710,171 | | | 1,590,821 | |
| | $ | 3,057,619 | | $ | 2,564,285 | | $ | 2,227,839 | | |
| | | $ | 3,043,383 | | $ | 3,057,619 | | $ | 2,564,285 | |
Property, plant and equipment, net: | | | | | | | | | | | | | | | | | | | | |
U.S. | | $ | 2,892,910 | | $ | 3,163,425 | | $ | 3,048,749 | | | $ | 2,470,579 | | $ | 2,892,910 | | $ | 3,163,425 | |
Outside the U.S. | | | 2,574,960 | | | 2,946,140 | | | 3,218,834 | | | | 2,459,970 | | | 2,574,960 | | | 2,946,140 | |
| | $ | 5,467,870 | | $ | 6,109,565 | | $ | 6,267,583 | | |
| | | $ | 4,930,549 | | $ | 5,467,870 | | $ | 6,109,565 | |
Goodwill: | | | | | | | | | | | | | | | | | | | | |
U.S. | | $ | 65,633 | | $ | 54,198 | | $ | 54,199 | | | $ | 13,430 | | $ | 65,633 | | $ | 54,198 | |
Outside the U.S. | | | 118,281 | | | 119,028 | | | 112,718 | | | | 14,950 | | | 118,281 | | | 119,028 | |
| | $ | 183,914 | | $ | 173,226 | | $ | 166,917 | | |
| | | $ | 28,380 | | $ | 183,914 | | $ | 173,226 | |
During the years ended December 31, 2019, 2018 and 2017, and 2016,$696.4 million, $764.5 million $727.7 million and $731.4$727.7 million of our consolidated operating revenue was from Saudi Arabia. No other individual country outside of the U.S. was material to our consolidated operating revenue during any of the three periods presented.
OneNaN customer accounted for approximately 24%22%, 29%24% and 33%29% of our consolidated operating revenues during the years ended December 31, 2019, 2018 2017 and 2016,2017, respectively, and is included primarily in our International Drilling reportable segment.
Note 2220 Revenue Recognition
On January 1, 2018, we adopted Topic 606, Revenue from Contracts with Customers (ASC 606). Under ASC 606, revenue is recognized when a customer obtains control of promised goods or services in an amount that reflects the consideration we expect to receive in exchange for those goods or services. In addition, ASC 606 requires disclosure of the nature, amount, timing, and uncertainty of revenue and cash flows arising from contracts with customers.
We elected to adopt the standard using the modified retrospective method to all contracts that were not completed as of January 1, 2018. Results for reporting periods beginning after January 1, 2018 are presented under ASC 606, while prior period amounts are not adjusted and continue to be reported under the accounting standards in effect for the prior period. There was no material impact to our consolidated financial statements as a result of adopting ASC 606. Revenues for reporting periods beginning after January 1, 2018 are presented under ASC 606, while revenues prior to January 1, 2018 continue to be reported under previous revenue recognition requirements of ASC 605.
We recognize revenue when control of a good or service promised in a contract (i.e., performance obligation) is transferred to a customer. Control is obtained when a customer has the ability to direct the use of and obtain substantially all of the remaining benefits from that good or service. Contract drilling revenues are recorded over time utilizing the input method based on time elapsed. The measurement of progress considers the transfer of the service to the customer as we provide daily drilling services. We receive payment after the services have been performed by billing customers periodically (typically monthly). However, a portion of our revenues are recognized at a point-in-time as control is transferred at a distinct point in time such as with the sale of our top drives and other capital equipment. Within our drilling contracts, we have identified one performance obligation in which the transaction price is allocated.
Disaggregation of revenue
In the following table, revenue is disaggregated by geographical region. The table also includes a reconciliation of the disaggregated revenue with the reportable segments:
| | | | | | | | | | | | | | | | | | | | | | |
| | Year Ended | |
| | December 31, 2018 | |
| | | | | | | | | | | | | | | | | | | | | | |
| | | U.S. Drilling | | | Canada Drilling | | | International Drilling | | | Drilling Solutions | | | Rig Technologies | | | Other | | | Total | |
| | (In thousands) | |
| | | | | | | | | | | | | | | | | | | | | | |
| | | Year Ended |
| | | December 31, 2019 |
| | | | U.S. Drilling | | | Canada Drilling | | | International Drilling | | | Drilling Solutions | | | Rig Technologies | | | Other | | | Total |
| | | (In thousands) |
Lower 48 | | $ | 910,819 | | $ | — | | $ | — | | $ | 173,219 | | $ | 188,550 | | $ | — | | $ | 1,272,588 | | $ | 1,021,879 | | $ | — | | $ | — | | $ | 170,639 | | $ | 172,559 | | $ | — | | $ | 1,365,077 |
U.S. Offshore Gulf of Mexico | | | 122,946 | | | — | | | — | | | 13,776 | | | — | | | — | | | 136,722 | | | 156,931 | | | — | | | — | | | 13,331 | | | — | | | — | | | 170,262 |
Alaska | | | 49,462 | | | — | | | — | | | 3,670 | | | 777 | | | — | | | 53,909 | | | 62,126 | | | — | | | — | | | 4,787 | | | 986 | | | — | | | 67,899 |
Canada | | | — | | | 105,000 | | | — | | | 5,849 | | | 29,682 | | | — | | | 140,531 | | | — | | | 68,274 | | | — | | | 1,749 | | | 8,852 | | | — | | | 78,875 |
Middle East & Asia | | | — | | | — | | | 888,500 | | | 35,486 | | | 26,236 | | | — | | | 950,222 | | | — | | | — | | | 765,493 | | | 43,941 | | | 56,455 | | | — | | | 865,889 |
Latin America | | | — | | | — | | | 360,385 | | | 15,350 | | | 8,514 | | | — | | | 384,249 | | | — | | | — | | | 355,189 | | | 15,558 | | | 2,318 | | | — | | | 373,065 |
Europe, Africa & CIS | | | — | | | — | | | 220,153 | | | 2,892 | | | 17,229 | | | — | | | 240,274 | | | — | | | — | | | 203,460 | | | 2,785 | | | 19,056 | | | — | | | 225,301 |
Eliminations & other | | | — | | | — | | | — | | | — | | | — | | | (120,876) | | | (120,876) | | | — | | | — | | | — | | | — | | | — | | | (102,985) | | | (102,985) |
Total | | $ | 1,083,227 | | $ | 105,000 | | $ | 1,469,038 | | $ | 250,242 | | $ | 270,988 | | $ | (120,876) | | $ | 3,057,619 | | $ | 1,240,936 | | $ | 68,274 | | $ | 1,324,142 | | $ | 252,790 | | $ | 260,226 | | $ | (102,985) | | $ | 3,043,383 |
| | | | | | | | | | | | | | | | | | | | | | |
| | Year Ended | |
| | December 31, 2017 | |
| | | | | | | | | | | | | | | | | | | | | | |
| | | U.S. Drilling | | | Canada Drilling | | | International Drilling | | | Drilling Solutions | | | Rig Technologies | | | Other | | | Total | |
| | (In thousands) | |
| | | | | | | | | | | | | | | | | | | | | | |
| | | Year Ended |
| | | December 31, 2018 |
| | | | U.S. Drilling | | | Canada Drilling | | | International Drilling | | | Drilling Solutions | | | Rig Technologies | | | Other | | | Total |
| | | (In thousands) |
Lower 48 | | $ | 681,669 | | $ | — | | $ | — | | $ | 118,574 | | $ | 211,609 | | $ | — | | $ | 1,011,852 | | $ | 910,819 | | $ | — | | $ | — | | $ | 173,219 | | $ | 188,550 | | $ | — | | $ | 1,272,588 |
U.S. Offshore Gulf of Mexico | | | 75,994 | | | — | | | — | | | 1,021 | | | — | | | — | | | 77,015 | | | 122,946 | | | — | | | — | | | 13,776 | | | — | | | — | | | 136,722 |
Alaska | | | 47,560 | | | — | | | — | | | 3,925 | | | 623 | | | — | | | 52,108 | | | 49,462 | | | — | | | — | | | 3,670 | | | 777 | | | — | | | 53,909 |
Canada | | | — | | | 82,929 | | | — | | | 6,054 | | | 7,618 | | | — | | | 96,601 | | | — | | | 105,000 | | | — | | | 5,849 | | | 29,682 | | | — | | | 140,531 |
Middle East & Asia | | | — | | | — | | | 875,175 | | | 7,397 | | | 13,493 | | | — | | | 896,065 | | | — | | | — | | | 888,500 | | | 35,486 | | | 26,236 | | | — | | | 950,222 |
Latin America | | | — | | | — | | | 388,235 | | | 3,266 | | | 392 | | | — | | | 391,893 | | | — | | | — | | | 360,385 | | | 15,350 | | | 8,514 | | | — | | | 384,249 |
Europe, Africa & CIS | | | — | | | — | | | 210,650 | | | 464 | | | 807 | | | — | | | 211,921 | | | — | | | — | | | 220,153 | | | 2,892 | | | 17,229 | | | — | | | 240,274 |
Eliminations & other | | | — | | | — | | | — | | | — | | | — | | | (173,170) | | | (173,170) | | | — | | | — | | | — | | | — | | | — | | | (120,876) | | | (120,876) |
Total | | $ | 805,223 | | $ | 82,929 | | $ | 1,474,060 | | $ | 140,701 | | $ | 234,542 | | $ | (173,170) | | $ | 2,564,285 | | $ | 1,083,227 | | $ | 105,000 | | $ | 1,469,038 | | $ | 250,242 | | $ | 270,988 | | $ | (120,876) | | $ | 3,057,619 |
| | | | | | | | | | | | | | | | | | | | | |
| | Year Ended |
| | December 31, 2017 |
| | | U.S. Drilling | | | Canada Drilling | | | International Drilling | | | Drilling Solutions | | | Rig Technologies | | | Other | | | Total |
| | (In thousands) |
Lower 48 | | $ | 681,669 | | $ | — | | $ | — | | $ | 118,574 | | $ | 211,609 | | $ | — | | $ | 1,011,852 |
U.S. Offshore Gulf of Mexico | | | 75,994 | | | — | | | — | | | 1,021 | | | — | | | — | | | 77,015 |
Alaska | | | 47,560 | | | — | | | — | | | 3,925 | | | 623 | | | — | | | 52,108 |
Canada | | | — | | | 82,929 | | | — | | | 6,054 | | | 7,618 | | | — | | | 96,601 |
Middle East & Asia | | | — | | | — | | | 875,175 | | | 7,397 | | | 13,493 | | | — | | | 896,065 |
Latin America | | | — | | | — | | | 388,235 | | | 3,266 | | | 392 | | | — | | | 391,893 |
Europe, Africa & CIS | | | — | | | — | | | 210,650 | | | 464 | | | 807 | | | — | | | 211,921 |
Eliminations & other | | | — | | | — | | | — | | | — | | | — | | | (173,170) | | | (173,170) |
Total | | $ | 805,223 | | $ | 82,929 | | $ | 1,474,060 | | $ | 140,701 | | $ | 234,542 | | $ | (173,170) | | $ | 2,564,285 |
| | | | | | | | | | | | | | | | | | | | | |
| | Year Ended |
| | December 31, 2016 |
| | | | | | | | | | | | | | | | | | | | | |
| | | U.S. Drilling | | | Canada Drilling | | | International Drilling | | | Drilling Solutions | | | Rig Technologies | | | Other | | | Total |
| | (In thousands) |
Lower 48 | | $ | 402,415 | | $ | — | | $ | — | | $ | 49,377 | | $ | 133,271 | | $ | — | | $ | 585,063 |
U.S. Offshore Gulf of Mexico | | | 79,730 | | | — | | | — | | | 252 | | | — | | | — | | | 79,982 |
Alaska | | | 71,927 | | | — | | | — | | | 3,036 | | | 555 | | | — | | | 75,518 |
Canada | | | — | | | 51,472 | | | — | | | 4,572 | | | 8,968 | | | — | | | 65,012 |
Middle East & Asia | | | — | | | — | | | 894,216 | | | 5,152 | | | 9,157 | | | — | | | 908,525 |
Latin America | | | — | | | — | | | 306,042 | | | 1,157 | | | — | | | — | | | 307,199 |
Europe, Africa & CIS | | | — | | | — | | | 308,632 | | | 213 | | | — | | | — | | | 308,845 |
Eliminations & other | | | — | | | — | | | — | | | — | | | — | | | (102,305) | | | (102,305) |
Total | | $ | 554,072 | | $ | 51,472 | | $ | 1,508,890 | | $ | 63,759 | | $ | 151,951 | | $ | (102,305) | | $ | 2,227,839 |
Contract balances
We perform our obligations under a contract with a customer by transferring goods or services in exchange for consideration from the customer. We recognize a contract asset or liability when we transfer goods or services to a customer and bill an amount which differs from the revenue allocated to the related performance obligations.
The timing of revenue recognition may differ from the timing of invoicing to customers and these timing differences result in receivables, contract assets, or contract liabilities (deferred revenue) on our consolidated balance sheet. In general, we receive payments from customers based on dayrates as stipulated in our contracts (i.e. operating rate, standby rate). The invoices billed to the customer are based on the varying rates applicable to the operating status on each rig. Accounts receivable are recorded when the right to consideration becomes unconditional.
Dayrate contracts also may contain fees charged to the customer for up-front rig modifications, mobilization and demobilization of equipment and personnel. These fees are associated with contract fulfillment activities, and the related revenue (subject to any constraint on estimates of variable consideration) is allocated to a single performance obligation and recognized ratably over the initial term of the contract. Mobilization fees are generally billable to the customer in the initial phase of a contract and generate contract liabilities until they are recognized as revenue. Demobilization fees are generally received at the end of the contract and generate contract assets when they are recognized as revenue prior to becoming receivables from the customer.
We receive reimbursements from our customers for the purchase of supplies, equipment, personnel services and other services provided at their request. Reimbursable revenues are variable and subject to uncertainty as the amounts received and timing thereof are dependent on factors outside of our influence. Accordingly, these revenues are constrained and not recognized until the uncertainty is resolved, which typically occurs when the related costs are incurred on behalf of the customer. We are generally considered a principal in these transactions and record the associated revenues at the gross amounts billed to the customer.
The opening and closing balances of our receivables, contract assets and current and long-term contract liabilities are as follows (in millions):follows:
| | | | | | | | | | | | | | | |
| | | | Contract | | Contract | | Contract | | Contract |
| | Contract | | Assets | | Assets | | Liabilities | | Liabilities |
| | Receivables | | (Current) | | (Long-term) | | (Current) | | (Long-term) |
| | |
As of December 31, 2017 | | $ | 738.0 | | $ | 67.0 | | $ | 46.9 | | $ | 218.4 | | $ | 135.0 |
As of December 31, 2018 | | $ | 791.2 | | $ | 55.8 | | $ | 32.3 | | $ | 116.7 | | $ | 69.7 |
| | | | | | | | | | | | | | | |
| | | | Contract | | Contract | | Contract | | Contract |
| | Contract | | Assets | | Assets | | Liabilities | | Liabilities |
| | Receivables | | (Current) | | (Long-term) | | (Current) | | (Long-term) |
| | (In millions) |
As of December 31, 2018 | | $ | 791.2 | | $ | 55.8 | | $ | 32.3 | | $ | 116.7 | | $ | 69.7 |
As of December 31, 2019 | | $ | 507.0 | | $ | 48.6 | | $ | 24.9 | | $ | 66.8 | | $ | 70.5 |
Approximately 60%65% of the contract liability balance at the beginning of the period was recognized as revenue during 20182019 and 23%22% is expected to be recognized during 2019.2020. The remaining 17%13% of the contract liability balance at the beginning of the period is expected to be recognized as revenue during 20202021 or thereafter.
Additionally, 59%60% of the contract asset balance at the beginning of the period was recognized as expense during 20182019 and 27%20% is expected to be recognized during 2019.2020. The remaining 14%20% of the contract asset balance at the beginning of the period is expected to be recognized as expense during 20202021 or thereafter. This disclosure does not include variable consideration allocated entirely to a wholly unsatisfied performance obligation or promise to transfer a distinct good or service that forms part of a single performance obligation.
Note 21 Leases
Prior to January 1, 2019, we accounted for leases under ASC 840 and did not record any right of use asset or corresponding lease liability. We adopted ASC 842 using a modified retrospective approach with an effective date of January 1, 2019. As such, financial information for prior periods has not been adjusted and continues to be reported under ASC 840. Effective with the adoption of ASC 842, we have changed our accounting policy for leases as detailed below.
We have evaluated the provisions of ASC 842, including certain practical expedients allowed. The significant practical expedients we adopted include the following:
| ● | We elected the practical expedient to apply the transition approach as of the beginning of the period of adoption and not restate comparative periods; |
| ● | We elected to utilize the “package of three” expedients, as defined in ASC 842, whereby we did not reassess whether contracts existing prior to the effective date contain leases, nor did we reassess lease classification determinations nor whether initial direct costs qualify for capitalization; |
| ● | We elected the practical expedient to not capitalize any leases with initial terms of twelve months or less on our condensed consolidated balance sheet; |
| ● | For all underlying classes of leased assets, we elected the practical expedient to not separate lease and non-lease components; and |
| ● | We elected the practical expedient to continue to account for land easements (also known as “rights of way”) that were not previously accounted for as leases consistent with prior accounting until such contracts are modified or replaced, at which time they would be assessed for lease classification under ASC 842. |
As of the date of implementation on January 1, 2019, the impact of the adoption of ASC 842 resulted in the recognition of a right of use asset and lease payable obligation on our condensed consolidated balance sheet of approximately $42.8 million. As the right of use asset and the lease payable obligation were the same, there was 0 cumulative effect impact on retained earnings.
Our leases primarily consist of office space and equipment used globally within our operations. We determine whether a contract is or contains a lease at inception of the contract based on answers to a series of questions that address whether an identified asset exists and whether we have the right to obtain substantially all of the benefit of the assets and to control its use over the full term of the agreement. When available, we use the rate implicit in the lease to discount lease payments to present value; however, most of our leases do not provide a readily determinable implicit rate. Therefore, we must estimate our incremental borrowing rate using a credit notching approach to discount the lease payments based on information available at lease commencement. Certain of our lease agreements include options to extend and options to terminate the lease, which we do not include in our minimum lease terms unless management is reasonably certain to exercise. We do not separate lease and nonlease components of contracts. There are no material residual value guarantees nor any restrictions or covenants included in our lease agreements. Certain of our leases include provisions for variable payments. These variable payments are typically determined based on a measure of throughput or actual days or another measure of usage and are not included in the calculation of lease liabilities and right-of-use assets.
Lease Position
The table below presents the lease related assets and liabilities recorded on our condensed consolidated balance sheet:
| | | | |
| | | December 31, |
| | | 2019 |
| Classification on the Balance Sheet | | (In thousands) |
Assets | | | | |
Operating lease assets | Other long-term assets | | $ | 46,647 |
Total lease assets | | | $ | 46,647 |
| | | | |
Liabilities | | | | |
Current liabilities: | | | | |
Operating lease liabilities | Current lease liabilities | | $ | 13,479 |
Noncurrent liabilities: | | | | |
Operating lease liabilities | Other long-term liabilities | | $ | 33,396 |
Total lease liabilities | | | $ | 46,875 |
Lease Costs
The table below presents certain information related to the lease costs for our operating leases:
| | | | | |
| | | Year Ended |
| | | December 31, |
| | | 2019 |
| (In thousands) |
Operating lease cost | | | $ | 16,154 | |
Short-term lease cost | | | | 2,568 | |
Variable lease cost | | | | 605 | |
Total lease cost | | | $ | 19,327 | |
Other Information
The table below presents supplemental cash flow information related to leases:
| | | |
| | Year Ended December 31, |
| | 2019 |
| | (In thousands) |
Cash paid for amounts included in the measurement of lease liabilities: | | | |
Operating cash flows for operating leases | | $ | 16,154 |
| | | |
Right of use assets obtained in exchange for lease obligations: | | | |
Operating leases | | $ | 17,852 |
Lease Terms and Discount Rates
The table below presents certain information related to the weighted average remaining lease terms and weighted average discount rates for our operating leases:
| | | | | |
| | | |
| |
| December 31, |
| | | 2019 |
| | | | | |
Weighted-average remaining lease term - operating leases | | | | 7.13 | |
Weighted-average discount rate - operating leases | | | | 5.97% | |
Undiscounted Cash Flows
The table below reconciles the undiscounted cash flows for each of the first five years and the total remaining years to the operating lease liabilities recorded on the condensed consolidated balance sheet:
| | | | |
| | December 31, 2019 | |
| | (In thousands) | |
2020 | | $ | 15,586 | |
2021 | | | 10,344 | |
2022 | | | 7,099 | |
2023 | | | 4,816 | |
2024 | | | 2,577 | |
Thereafter | | | 17,649 | |
Total undiscounted lease liability | | | 58,071 | |
Less: amount of lease payments representing interest | | | (11,196) | |
Long-term lease obligations | | $ | 46,875 | |
The minimum rental commitments under non-cancelable operating leases under ASC 840 as disclosed in our 2018 Annual Report, with lease terms in excess of one year subsequent to December 31, 2018, were as follows:
| | | |
| | December 31, 2018 |
| | (In thousands) |
2019 | | $ | 10,701 |
2020 | | | 7,104 |
2021 | | | 3,774 |
2022 | | | 2,356 |
2023 | | | 1,538 |
Thereafter | | | 7,482 |
Total minimum lease payments | | $ | 32,955 |
Note 2322 Condensed Consolidating Financial Information
Nabors has fully and unconditionally guaranteed all of the issued public debt securities of Nabors Delaware, a 100% wholly-owned subsidiary. The following condensed consolidating financial information is included so that separate financial statements of Nabors Delaware is not required to be filed with the SEC. The condensed consolidating financial statements present investments in both consolidated and unconsolidated affiliates using the equity method of accounting.
The following condensed consolidating financial information presents condensed consolidating balance sheets as of December 31, 20182019 and 2017,2018, and statements of income (loss), statements of comprehensive income (loss) and the statements of cash flows for the years ended December 31, 2019, 2018 2017 and 20162017 of (a) Nabors, parent/guarantor, (b) Nabors Delaware, issuer of public debt securities guaranteed by Nabors, (c) the non‑guarantornon-guarantor subsidiaries, (d) consolidating adjustments necessary to consolidate Nabors and its subsidiaries and (e) Nabors on a consolidated basis.
Condensed Consolidating Balance Sheets
| | | | | | | | | | | | | | | | | |
| | December 31, 2018 | | |
| | | | | | | | Other | | | | | | | | |
| | Nabors | | | Nabors | | Subsidiaries | | | | | | | | |
| | (Parent/ | | Delaware | | (Non- | | Consolidating | | | | | |
| | Guarantor) | | (Issuer) | | Guarantors) | | Adjustments | | Total | | |
| | (In thousands) | | |
| | ASSETS | | |
| | | | | | | | | | | | | | | | | |
| | | December 31, 2019 | |
| | | | | | | | | Other | | | | | | | |
| | | Nabors | | Nabors | | Subsidiaries | | | | | | | |
| | | (Parent/ | | Delaware | | (Non- | | Consolidating | | | | |
| | | Guarantor) | | (Issuer) | | Guarantors) | | Adjustments | | Total | |
| | | (In thousands) | |
| | | ASSETS | |
Current assets: | | | | | | | | | | | | | | | | | | | | | | | | | | | | | | | | |
Cash and cash equivalents | | $ | 474 | | $ | 42 | | $ | 447,250 | | $ | — | | $ | 447,766 | | | $ | 319 | | $ | 38 | | $ | 435,633 | | $ | — | | $ | 435,990 | |
Short-term investments | | | — | | | — | | | 34,036 | | | — | | | 34,036 | | | | — | | | — | | | 16,506 | | | — | | | 16,506 | |
Accounts receivable, net | | | — | | | — | | | 756,320 | | | — | | | 756,320 | | | | — | | | — | | | 453,042 | | | — | | | 453,042 | |
Inventory, net | | | — | | | — | | | 165,587 | | | — | | | 165,587 | | | | — | | | — | | | 176,341 | | | — | | | 176,341 | |
Assets held for sale | | | — | | | — | | | 12,250 | | | — | | | 12,250 | | | | — | | | — | | | 2,530 | | | — | | | 2,530 | |
Other current assets | | | 50 | | | 433 | | | 177,121 | | | — | | | 177,604 | | | | 50 | | | — | | | 164,207 | | | — | | | 164,257 | |
Total current assets | | | 524 | | | 475 | | | 1,592,564 | | | — | | | 1,593,563 | | | | 369 | | | 38 | | | 1,248,259 | | | — | | | 1,248,666 | |
Property, plant and equipment, net | | | — | | | — | | | 5,467,870 | | | — | | | 5,467,870 | | | | — | | | — | | | 4,930,549 | | | — | | | 4,930,549 | |
Goodwill | | | — | | | — | | | 183,914 | | | — | | | 183,914 | | | | — | | | — | | | 28,380 | | | — | | | 28,380 | |
Intercompany receivables | | | 95,946 | | | 218,129 | | | 2,611 | | | (316,686) | | | — | | | | 51 | | | — | | | 2,611 | | | (2,662) | | | — | |
Investment in consolidated affiliates | | | 2,658,827 | | | 5,494,886 | | | 4,079,269 | | | (12,232,982) | | | — | | | | 2,001,607 | | | 5,780,656 | | | 4,226,017 | | | (12,008,280) | | | — | |
Deferred income taxes | | | — | | | 388,089 | | | 345,091 | | | (388,089) | | | 345,091 | | | | — | | | 431,441 | | | 305,844 | | | (431,441) | | | 305,844 | |
Other long-term assets | | | — | | | 142 | | | 277,689 | | | (14,325) | | | 263,506 | | | | — | | | 99 | | | 254,445 | | | (7,325) | | | 247,219 | |
Total assets | | $ | 2,755,297 | | $ | 6,101,721 | | $ | 11,949,008 | | $ | (12,952,082) | | $ | 7,853,944 | | | $ | 2,002,027 | | $ | 6,212,234 | | $ | 10,996,105 | | $ | (12,449,708) | | $ | 6,760,658 | |
| | | | | | | | | | | | | | | | | |
| | LIABILITIES AND EQUITY | | |
| | | | | | | | | | | | | | | | | |
| | | LIABILITIES AND EQUITY | |
Current liabilities: | | | | | | | | | | | | | | | | | | | | | | | | | | | | | | | | |
Current portion of debt | | $ | — | | $ | — | | $ | 561 | | $ | — | | $ | 561 | | | $ | — | | $ | — | | $ | — | | $ | — | | $ | — | |
Trade accounts payable | | | 132 | | | 14 | | | 392,697 | | | — | | | 392,843 | | | | 128 | | | 1 | | | 295,030 | | | — | | | 295,159 | |
Accrued liabilities | | | 28,815 | | | 62,830 | | | 326,267 | | | — | | | 417,912 | | | | 8,579 | | | 51,701 | | | 273,002 | | | — | | | 333,282 | |
Income taxes payable | | | — | | | — | | | 20,761 | | | — | | | 20,761 | | | | — | | | — | | | 14,628 | | | — | | | 14,628 | |
Current lease liabilities | | | | — | | | — | | | 13,479 | | | — | | | 13,479 | |
Total current liabilities | | | 28,947 | | | 62,844 | | | 740,286 | | | — | | | 832,077 | | | | 8,707 | | | 51,702 | | | 596,139 | | | — | | | 656,548 | |
Long-term debt | | | — | | | 3,600,209 | | | — | | | (14,325) | | | 3,585,884 | | | | — | | | 3,340,545 | | | — | | | (7,325) | | | 3,333,220 | |
Other long-term liabilities | | | — | | | 29,331 | | | 245,154 | | | — | | | 274,485 | | | | — | | | 29,331 | | | 262,853 | | | — | | | 292,184 | |
Deferred income taxes | | | — | | | — | | | 394,400 | | | (388,089) | | | 6,311 | | | | — | | | — | | | 434,590 | | | (431,441) | | | 3,149 | |
Intercompany payable | | | 25,500 | | | — | | | 291,186 | | | (316,686) | | | — | | | | 10,508 | | | 231,759 | | | (239,605) | | | (2,662) | | | — | |
Total liabilities | | | 54,447 | | | 3,692,384 | | | 1,671,026 | | | (719,100) | | | 4,698,757 | | | | 19,215 | | | 3,653,337 | | | 1,053,977 | | | (441,428) | | | 4,285,101 | |
Redeemable noncontrolling interest in subsidiary | | | — | | | — | | | 404,861 | | | — | | | 404,861 | | | | — | | | — | | | 425,392 | | | — | | | 425,392 | |
Shareholders’ equity | | | 2,700,850 | | | 2,409,337 | | | 9,823,645 | | | (12,232,982) | | | 2,700,850 | | | | 1,982,812 | | | 2,558,897 | | | 9,449,382 | | | (12,008,280) | | | 1,982,811 | |
Noncontrolling interest | | | — | | | — | | | 49,476 | | | — | | | 49,476 | | | | — | | | — | | | 67,354 | | | — | | | 67,354 | |
Total equity | | | 2,700,850 | | | 2,409,337 | | | 9,873,121 | | | (12,232,982) | | | 2,750,326 | | | | 1,982,812 | | | 2,558,897 | | | 9,516,736 | | | (12,008,280) | | | 2,050,165 | |
Total liabilities and equity | | $ | 2,755,297 | | $ | 6,101,721 | | $ | 11,949,008 | | $ | (12,952,082) | | $ | 7,853,944 | | | $ | 2,002,027 | | $ | 6,212,234 | | $ | 10,996,105 | | $ | (12,449,708) | | $ | 6,760,658 | |
| | | | | | | | | | | | | | | | |
| | December 31, 2017 | |
| | | | | | | | Other | | | | | | | |
| | Nabors | | Nabors | | Subsidiaries | | | | | | | |
| | (Parent/ | | Delaware | | (Non- | | Consolidating | | | | |
| | Guarantor) | | (Issuer) | | Guarantors) | | Adjustments | | Total | |
| | (In thousands) | |
| | ASSETS | |
Current assets: | | | | | | | | | | | | | | | | |
Cash and cash equivalents | | $ | 1,091 | | $ | 44 | | $ | 335,862 | | $ | — | | $ | 336,997 | |
Short-term investments | | | — | | | — | | | 28,369 | | | — | | | 28,369 | |
Accounts receivable, net | | | — | | | — | | | 698,477 | | | — | | | 698,477 | |
Inventory, net | | | — | | | — | | | 166,307 | | | — | | | 166,307 | |
Assets held for sale | | | — | | | — | | | 37,052 | | | — | | | 37,052 | |
Other current assets | | | 50 | | | 56 | | | 180,028 | | | — | | | 180,134 | |
Total current assets | | | 1,141 | | | 100 | | | 1,446,095 | | | — | | | 1,447,336 | |
Property, plant and equipment, net | | | — | | | — | | | 6,109,565 | | | — | | | 6,109,565 | |
Goodwill | | | — | | | — | | | 173,226 | | | — | | | 173,226 | |
Intercompany receivables | | | 133,602 | | | 481,092 | | | — | | | (614,694) | | | — | |
Investment in consolidated affiliates | | | 2,799,320 | | | 5,531,799 | | | 3,799,933 | | | (12,131,052) | | | — | |
Deferred income taxes | | | — | | | 333,349 | | | 419,003 | | | (333,349) | | | 419,003 | |
Other long-term assets | | | — | | | 78 | | | 324,919 | | | (72,143) | | | 252,854 | |
Total assets | | $ | 2,934,063 | | $ | 6,346,418 | | $ | 12,272,741 | | $ | (13,151,238) | | $ | 8,401,984 | |
| | | | | | | | | | | | | | | | |
| | LIABILITIES AND EQUITY | |
Current liabilities: | | | | | | | | | | | | | | | | |
Current portion of debt | | $ | — | | $ | — | | $ | 181 | | $ | — | | $ | 181 | |
Trade accounts payable | | | 147 | | | 124 | | | 363,145 | | | — | | | 363,416 | |
Accrued liabilities | | | 21,100 | | | 67,760 | | | 444,184 | | | — | | | 533,044 | |
Income taxes payable | | | — | | | — | | | 22,835 | | | — | | | 22,835 | |
Total current liabilities | | | 21,247 | | | 67,884 | | | 830,345 | | | — | | | 919,476 | |
Long-term debt | | | — | | | 4,099,909 | | | — | | | (72,143) | | | 4,027,766 | |
Other long-term liabilities | | | — | | | 16,284 | | | 285,349 | | | — | | | 301,633 | |
Deferred income taxes | | | — | | | — | | | 343,687 | | | (333,349) | | | 10,338 | |
Intercompany payable | | | 1,000 | | | — | | | 613,694 | | | (614,694) | | | — | |
Total liabilities | | | 22,247 | | | 4,184,077 | | | 2,073,075 | | | (1,020,186) | | | 5,259,213 | |
Redeemable noncontrolling interest in subsidiary | | | — | | | — | | | 203,998 | | | — | | | 203,998 | |
Shareholders’ equity | | | 2,911,816 | | | 2,162,341 | | | 9,968,711 | | | (12,131,052) | | | 2,911,816 | |
Noncontrolling interest | | | — | | | — | | | 26,957 | | | — | | | 26,957 | |
Total equity | | | 2,911,816 | | | 2,162,341 | | | 9,995,668 | | | (12,131,052) | | | 2,938,773 | |
Total liabilities and equity | | $ | 2,934,063 | | $ | 6,346,418 | | $ | 12,272,741 | | $ | (13,151,238) | | $ | 8,401,984 | |
| | | | | | | | | | | | | | | | |
| | December 31, 2018 | |
| | | | | | | | Other | | | | | | | |
| | Nabors | | Nabors | | Subsidiaries | | | | | | | |
| | (Parent/ | | Delaware | | (Non- | | Consolidating | | | | |
| | Guarantor) | | (Issuer) | | Guarantors) | | Adjustments | | Total | |
| | (In thousands) | |
| | ASSETS | |
Current assets: | | | | | | | | | | | | | | | | |
Cash and cash equivalents | | $ | 474 | | $ | 42 | | $ | 447,250 | | $ | — | | $ | 447,766 | |
Short-term investments | | | — | | | — | | | 34,036 | | | — | | | 34,036 | |
Accounts receivable, net | | | — | | | — | | | 756,320 | | | — | | | 756,320 | |
Inventory, net | | | — | | | — | | | 165,587 | | | — | | | 165,587 | |
Assets held for sale | | | — | | | — | | | 12,250 | | | — | | | 12,250 | |
Other current assets | | | 50 | | | 433 | | | 177,121 | | | — | | | 177,604 | |
Total current assets | | | 524 | | | 475 | | | 1,592,564 | | | — | | | 1,593,563 | |
Property, plant and equipment, net | | | — | | | — | | | 5,467,870 | | | — | | | 5,467,870 | |
Goodwill | | | — | | | — | | | 183,914 | | | — | | | 183,914 | |
Intercompany receivables | | | 95,946 | | | 218,129 | | | 2,611 | | | (316,686) | | | — | |
Investment in consolidated affiliates | | | 2,658,827 | | | 5,494,886 | | | 4,079,269 | | | (12,232,982) | | | — | |
Deferred income taxes | | | — | | | 388,089 | | | 345,091 | | | (388,089) | | | 345,091 | |
Other long-term assets | | | — | | | 142 | | | 277,689 | | | (14,325) | | | 263,506 | |
Total assets | | $ | 2,755,297 | | $ | 6,101,721 | | $ | 11,949,008 | | $ | (12,952,082) | | $ | 7,853,944 | |
| | | | | | | | | | | | | | | | |
| | LIABILITIES AND EQUITY | |
Current liabilities: | | | | | | | | | | | | | | | | |
Current portion of debt | | $ | — | | $ | — | | $ | 561 | | $ | — | | $ | 561 | |
Trade accounts payable | | | 132 | | | 14 | | | 392,697 | | | — | | | 392,843 | |
Accrued liabilities | | | 28,815 | | | 62,830 | | | 326,267 | | | — | | | 417,912 | |
Income taxes payable | | | — | | | — | | | 20,761 | | | — | | | 20,761 | |
Total current liabilities | | | 28,947 | | | 62,844 | | | 740,286 | | | — | | | 832,077 | |
Long-term debt | | | — | | | 3,600,209 | | | — | | | (14,325) | | | 3,585,884 | |
Other long-term liabilities | | | — | | | 29,331 | | | 245,154 | | | — | | | 274,485 | |
Deferred income taxes | | | — | | | — | | | 394,400 | | | (388,089) | | | 6,311 | |
Intercompany payable | | | 25,500 | | | — | | | 291,186 | | | (316,686) | | | — | |
Total liabilities | | | 54,447 | | | 3,692,384 | | | 1,671,026 | | | (719,100) | | | 4,698,757 | |
Redeemable noncontrolling interest in subsidiary | | | — | | | — | | | 404,861 | | | — | | | 404,861 | |
Shareholders’ equity | | | 2,700,850 | | | 2,409,337 | | | 9,823,645 | | | (12,232,982) | | | 2,700,850 | |
Noncontrolling interest | | | — | | | — | | | 49,476 | | | — | | | 49,476 | |
Total equity | | | 2,700,850 | | | 2,409,337 | | | 9,873,121 | | | (12,232,982) | | | 2,750,326 | |
Total liabilities and equity | | $ | 2,755,297 | | $ | 6,101,721 | | $ | 11,949,008 | | $ | (12,952,082) | | $ | 7,853,944 | |
Condensed Consolidating Statements of Income (Loss)
| | | | | | | | | | | | | | | | | |
| | Year Ended December 31, 2018 | | |
| | | | | Nabors | | Other | | | | | | | | |
| | Nabors | | Delaware | | Subsidiaries | | | | | | | | |
| | (Parent/ | | (Issuer/ | | (Non- | | Consolidating | | | | | |
| | Guarantor) | | Guarantor) | | Guarantors) | | Adjustments | | Total | | |
| | (In thousands) | | |
| | | | | | | | | | | | | | | | | |
| | | Year Ended December 31, 2019 | |
| | | | | | | | | Other | | | | | | | |
| | | Nabors | | Nabors | | Subsidiaries | | | | | | | |
| | | (Parent/ | | Delaware | | (Non- | | Consolidating | | | | |
| | | Guarantor) | | (Issuer) | | Guarantors) | | Adjustments | | Total | |
| | | (In thousands) | |
Revenues and other income: | | | | | | | | | | | | | | | | | | | | | | | | | | | | | | | | |
Operating revenues | | $ | — | | $ | — | | $ | 3,057,619 | | $ | — | | $ | 3,057,619 | | | $ | — | | $ | — | | $ | 3,043,383 | | $ | — | | $ | 3,043,383 | |
Earnings (losses) from unconsolidated affiliates | | | — | | | — | | | 1 | | | — | | | 1 | | | | — | | | — | | | (5) | | | — | | | (5) | |
Earnings (losses) from consolidated affiliates | | | (629,060) | | | 218,539 | | | 35,279 | | | 375,242 | | | — | | | | (693,450) | | | 285,612 | | | 140,474 | | | 267,364 | | | — | |
Investment income (loss) | | | 2 | | | — | | | 2,984 | | | (12,485) | | | (9,499) | | | | — | | | — | | | 12,330 | | | (2,112) | | | 10,218 | |
Total revenues and other income | | | (629,058) | | | 218,539 | | | 3,095,883 | | | 362,757 | | | 3,048,121 | | | | (693,450) | | | 285,612 | | | 3,196,182 | | | 265,252 | | | 3,053,596 | |
Costs and other deductions: | | | | | | | | | | | | | | | | | | | | | | | | | | | | | | | | |
Direct costs | | | — | | | — | | | 1,976,974 | | | — | | | 1,976,974 | | | | — | | | 6 | | | 1,929,325 | | | — | | | 1,929,331 | |
General and administrative expenses | | | 9,725 | | | 635 | | | 256,145 | | | (683) | | | 265,822 | | | | 8,255 | | | 673 | | | 251,375 | | | (1,572) | | | 258,731 | |
Research and engineering | | | — | | | — | | | 56,147 | | | — | | | 56,147 | | | | — | | | — | | | 50,359 | | | — | | | 50,359 | |
Depreciation and amortization | | | — | | | 125 | | | 866,745 | | | — | | | 866,870 | | | | — | | | 125 | | | 875,966 | | | — | | | 876,091 | |
Interest expense, net | | | — | | | 231,971 | | | (4,847) | | | — | | | 227,124 | | | | — | | | 204,963 | | | (652) | | | — | | | 204,311 | |
Impairments and other charges | | | — | | | 5,269 | | | 139,177 | | | — | | | 144,446 | | | | — | | | — | | | 290,471 | | | — | | | 290,471 | |
Other, net | | | 1,803 | | | — | | | 27,046 | | | 683 | | | 29,532 | | | | 1,043 | | | (17,277) | | | 47,886 | | | 1,572 | | | 33,224 | |
Intercompany interest expense, net | | | 362 | | | — | | | (362) | | | — | | | — | | | | 137 | | | — | | | (137) | | | — | | | — | |
Total costs and other deductions | | | 11,890 | | | 238,000 | | | 3,317,025 | | | — | | | 3,566,915 | | | | 9,435 | | | 188,490 | | | 3,444,593 | | | — | | | 3,642,518 | |
Income (loss) from continuing operations before income taxes | | | (640,948) | | | (19,461) | | | (221,142) | | | 362,757 | | | (518,794) | | | | (702,885) | | | 97,122 | | | (248,411) | | | 265,252 | | | (588,922) | |
Income tax expense (benefit) | | | — | | | (54,740) | | | 134,009 | | | — | | | 79,269 | | | | — | | | (43,352) | | | 134,928 | | | — | | | 91,576 | |
Income (loss) from continuing operations, net of tax | | | (640,948) | | | 35,279 | | | (355,151) | | | 362,757 | | | (598,063) | | | | (702,885) | | | 140,474 | | | (383,339) | | | 265,252 | | | (680,498) | |
Income (loss) from discontinued operations, net of tax | | | — | | | — | | | (14,663) | | | — | | | (14,663) | | | | — | | | — | | | (12) | | | — | | | (12) | |
Net income (loss) | | | (640,948) | | | 35,279 | | | (369,814) | | | 362,757 | | | (612,726) | | | | (702,885) | | | 140,474 | | | (383,351) | | | 265,252 | | | (680,510) | |
Less: Net (income) loss attributable to noncontrolling interest | | | — | | | — | | | (28,222) | | | — | | | (28,222) | | | | — | | | — | | | (22,375) | | | — | | | (22,375) | |
Net income (loss) attributable to Nabors | | $ | (640,948) | | $ | 35,279 | | $ | (398,036) | | $ | 362,757 | | $ | (640,948) | | | $ | (702,885) | | $ | 140,474 | | $ | (405,726) | | $ | 265,252 | | $ | (702,885) | |
Less: Preferred stock dividend | | | (12,305) | | | — | | | — | | | — | | | (12,305) | | | | (17,244) | | | — | | | — | | | — | | | (17,244) | |
Net income (loss) attributable to Nabors common shareholders | | $ | (653,253) | | $ | 35,279 | | $ | (398,036) | | $ | 362,757 | | $ | (653,253) | | | $ | (720,129) | | $ | 140,474 | | $ | (405,726) | | $ | 265,252 | | $ | (720,129) | |
| | | | | | | | | | | | | | | | |
| | Year Ended December 31, 2017 | |
| | | | | Nabors | | Other | | | | | | | |
| | Nabors | | Delaware | | Subsidiaries | | | | | | | |
| | (Parent/ | | (Issuer/ | | (Non- | | Consolidating | | | | |
| | Guarantor) | | Guarantor) | | Guarantors) | | Adjustments | | Total | |
| | (In thousands) | |
| | | | | | | | | | | | | | | | |
Revenues and other income: | | | | | | | | | | | | | | | | |
Operating revenues | | $ | — | | $ | — | | $ | 2,564,285 | | $ | — | | $ | 2,564,285 | |
Earnings (losses) from unconsolidated affiliates | | | — | | | — | | | 7 | | | — | | | 7 | |
Earnings (losses) from consolidated affiliates | | | (528,180) | | | 18,380 | | | (343,233) | | | 853,033 | | | — | |
Investment income (loss) | | | 17 | | | 63 | | | 13,031 | | | (11,917) | | | 1,194 | |
Total revenues and other income | | | (528,163) | | | 18,443 | | | 2,234,090 | | | 841,116 | | | 2,565,486 | |
Costs and other deductions: | | | | | | | | | | | | | | | | |
Direct costs | | | — | | | — | | | 1,718,069 | | | — | | | 1,718,069 | |
General and administrative expenses | | | 10,995 | | | 715 | | | 240,139 | | | (665) | | | 251,184 | |
Research and engineering | | | — | | | — | | | 51,069 | | | — | | | 51,069 | |
Depreciation and amortization | | | — | | | 125 | | | 842,818 | | | — | | | 842,943 | |
Interest expense, net | | | — | | | 232,103 | | | (9,214) | | | — | | | 222,889 | |
Impairments and other charges | | | — | | | — | | | 44,536 | | | — | | | 44,536 | |
Other, net | | | 7,662 | | | 19,033 | | | (12,480) | | | 665 | | | 14,880 | |
Intercompany interest expense | | | (9) | | | — | | | 9 | | | — | | | — | |
Total costs and other deductions | | | 18,648 | | | 251,976 | | | 2,874,946 | | | — | | | 3,145,570 | |
Income (loss) from continuing operations before income taxes | | | (546,811) | | | (233,533) | | | (640,856) | | | 841,116 | | | (580,084) | |
Income tax expense (benefit) | | | — | | | 109,700 | | | (192,670) | | | — | | | (82,970) | |
Income (loss) from continuing operations, net of tax | | | (546,811) | | | (343,233) | | | (448,186) | | | 841,116 | | | (497,114) | |
Income (loss) from discontinued operations, net of tax | | | — | | | — | | | (43,519) | | | — | | | (43,519) | |
Net income (loss) | | | (546,811) | | | (343,233) | | | (491,705) | | | 841,116 | | | (540,633) | |
Less: Net (income) loss attributable to noncontrolling interest | | | — | | | — | | | (6,178) | | | — | | | (6,178) | |
Net income (loss) attributable to Nabors | | $ | (546,811) | | $ | (343,233) | | $ | (497,883) | | $ | 841,116 | | $ | (546,811) | |
| | | | | | | | | | | | | | | | |
| | Year Ended December 31, 2018 | |
| | | | | | | | Other | | | | | | | |
| | Nabors | | Nabors | | Subsidiaries | | | | | | | |
| | (Parent/ | | Delaware | | (Non- | | Consolidating | | | | |
| | Guarantor) | | (Issuer) | | Guarantors) | | Adjustments | | Total | |
| | (In thousands) | |
| | | | | | | | | | | | | | | | |
Revenues and other income: | | | | | | | | | | | | | | | | |
Operating revenues | | $ | — | | $ | — | | $ | 3,057,619 | | $ | — | | $ | 3,057,619 | |
Earnings (losses) from unconsolidated affiliates | | | — | | | — | | | 1 | | | — | | | 1 | |
Earnings (losses) from consolidated affiliates | | | (629,060) | | | 218,539 | | | 35,279 | | | 375,242 | | | — | |
Investment income (loss) | | | 2 | | | — | | | 2,984 | | | (12,485) | | | (9,499) | |
Total revenues and other income | | | (629,058) | | | 218,539 | | | 3,095,883 | | | 362,757 | | | 3,048,121 | |
Costs and other deductions: | | | | | | | | | | | | | | | | |
Direct costs | | | — | | | — | | | 1,976,974 | | | — | | | 1,976,974 | |
General and administrative expenses | | | 9,725 | | | 635 | | | 256,145 | | | (683) | | | 265,822 | |
Research and engineering | | | — | | | — | | | 56,147 | | | — | | | 56,147 | |
Depreciation and amortization | | | — | | | 125 | | | 866,745 | | | — | | | 866,870 | |
Interest expense, net | | | — | | | 231,971 | | | (4,847) | | | — | | | 227,124 | |
Impairments and other charges | | | — | | | 5,269 | | | 139,177 | | | — | | | 144,446 | |
Other, net | | | 1,803 | | | — | | | 27,046 | | | 683 | | | 29,532 | |
Intercompany interest expense | | | 362 | | | — | | | (362) | | | — | | | — | |
Total costs and other deductions | | | 11,890 | | | 238,000 | | | 3,317,025 | | | — | | | 3,566,915 | |
Income (loss) from continuing operations before income taxes | | | (640,948) | | | (19,461) | | | (221,142) | | | 362,757 | | | (518,794) | |
Income tax expense (benefit) | | | — | | | (54,740) | | | 134,009 | | | — | | | 79,269 | |
Income (loss) from continuing operations, net of tax | | | (640,948) | | | 35,279 | | | (355,151) | | | 362,757 | | | (598,063) | |
Income (loss) from discontinued operations, net of tax | | | — | | | — | | | (14,663) | | | — | | | (14,663) | |
Net income (loss) | | | (640,948) | | | 35,279 | | | (369,814) | | | 362,757 | | | (612,726) | |
Less: Net (income) loss attributable to noncontrolling interest | | | — | | | — | | | (28,222) | | | — | | | (28,222) | |
Net income (loss) attributable to Nabors | | $ | (640,948) | | $ | 35,279 | | $ | (398,036) | | $ | 362,757 | | $ | (640,948) | |
Less: Preferred stock dividend | | | (12,305) | | | — | | | — | | | — | | | (12,305) | |
Net income (loss) attributable to Nabors common shareholders | | $ | (653,253) | | $ | 35,279 | | $ | (398,036) | | $ | 362,757 | | $ | (653,253) | |
| | | | | | | | | | | | | | | | |
| | Year Ended December 31, 2016 | |
| | | | | Nabors | | Other | | | | | | | |
| | Nabors | | Delaware | | Subsidiaries | | | | | | | |
| | (Parent/ | | (Issuer/ | | (Non- | | Consolidating | | | | |
| | Guarantor) | | Guarantor) | | Guarantors) | | Adjustments | | Total | |
| | (In thousands) | |
Revenues and other income: | | | | | | | | | | | | | | | | |
Operating revenues | | $ | — | | $ | — | | $ | 2,227,839 | | $ | — | | $ | 2,227,839 | |
Earnings (losses) from unconsolidated affiliates | | | — | | | — | | | (221,914) | | | — | | | (221,914) | |
Earnings (losses) from consolidated affiliates | | | (1,017,338) | | | (231,960) | | | (359,751) | | | 1,609,049 | | | — | |
Investment income (loss) | | | 2 | | | 132 | | | 12,972 | | | (11,923) | | | 1,183 | |
Intercompany interest income | | | — | | | 569 | | | — | | | (569) | | | — | |
Total revenues and other income | | | (1,017,336) | | | (231,259) | | | 1,659,146 | | | 1,596,557 | | | 2,007,108 | |
Costs and other deductions: | | | | | | | | | | | | | | | | |
Direct costs | | | — | | | — | | | 1,344,298 | | | — | | | 1,344,298 | |
General and administrative expenses | | | 10,559 | | | 603 | | | 217,333 | | | (856) | | | 227,639 | |
Research and engineering | | | — | | | — | | | 33,582 | | | — | | | 33,582 | |
Depreciation and amortization | | | — | | | 124 | | | 871,507 | | | — | | | 871,631 | |
Interest expense, net | | | — | | | 204,010 | | | (18,650) | | | — | | | 185,360 | |
Impairments and other charges | | | 1,366 | | | — | | | 497,133 | | | — | | | 498,499 | |
Other, net | | | 482 | | | (14) | | | 42,850 | | | 856 | | | 44,174 | |
Intercompany interest expense, net | | | (1) | | | — | | | 570 | | | (569) | | | — | |
Total costs and other deductions | | | 12,406 | | | 204,723 | | | 2,988,623 | | | (569) | | | 3,205,183 | |
Income (loss) from continuing operations before income taxes | | | (1,029,742) | | | (435,982) | | | (1,329,477) | | | 1,597,126 | | | (1,198,075) | |
Income tax expense (benefit) | | | — | | | (76,231) | | | (110,600) | | | — | | | (186,831) | |
Income (loss) from continuing operations, net of tax | | | (1,029,742) | | | (359,751) | | | (1,218,877) | | | 1,597,126 | | | (1,011,244) | |
Income (loss) from discontinued operations, net of tax | | | — | | | — | | | (18,363) | | | — | | | (18,363) | |
Net income (loss) | | | (1,029,742) | | | (359,751) | | | (1,237,240) | | | 1,597,126 | | | (1,029,607) | |
Less: Net (income) loss attributable to noncontrolling interest | | | — | | | — | | | (135) | | | — | | | (135) | |
Net income (loss) attributable to Nabors | | $ | (1,029,742) | | $ | (359,751) | | $ | (1,237,375) | | $ | 1,597,126 | | $ | (1,029,742) | |
Less: Preferred stock dividend | | | — | | | — | | | — | | | — | | | — | |
Net income (loss) attributable to Nabors common shareholders | | $ | (1,029,742) | | $ | (359,751) | | $ | (1,237,375) | | $ | 1,597,126 | | $ | (1,029,742) | |
| | | | | | | | | | | | | | | | |
| | Year Ended December 31, 2017 | |
| | | | | | | | Other | | | | | | | |
| | Nabors | | Nabors | | Subsidiaries | | | | | | | |
| | (Parent/ | | Delaware | | (Non- | | Consolidating | | | | |
| | Guarantor) | | (Issuer) | | Guarantors) | | Adjustments | | Total | |
| | (In thousands) | |
Revenues and other income: | | | | | | | | | | | | | | | | |
Operating revenues | | $ | — | | $ | — | | $ | 2,564,285 | | $ | — | | $ | 2,564,285 | |
Earnings (losses) from unconsolidated affiliates | | | — | | | — | | | 7 | | | — | | | 7 | |
Earnings (losses) from consolidated affiliates | | | (528,180) | | | 18,380 | | | (343,233) | | | 853,033 | | | — | |
Investment income (loss) | | | 17 | | | 63 | | | 13,031 | | | (11,917) | | | 1,194 | |
Total revenues and other income | | | (528,163) | | | 18,443 | | | 2,234,090 | | | 841,116 | | | 2,565,486 | |
Costs and other deductions: | | | | | | | | | | | | | | | | |
Direct costs | | | — | | | — | | | 1,718,069 | | | — | | | 1,718,069 | |
General and administrative expenses | | | 10,995 | | | 715 | | | 240,139 | | | (665) | | | 251,184 | |
Research and engineering | | | — | | | — | | | 51,069 | | | — | | | 51,069 | |
Depreciation and amortization | | | — | | | 125 | | | 842,818 | | | — | | | 842,943 | |
Interest expense, net | | | — | | | 232,103 | | | (9,214) | | | — | | | 222,889 | |
Impairments and other charges | | | — | | | — | | | 44,536 | | | — | | | 44,536 | |
Other, net | | | 7,662 | | | 19,033 | | | (12,480) | | | 665 | | | 14,880 | |
Intercompany interest expense, net | | | (9) | | | — | | | 9 | | | — | | | — | |
Total costs and other deductions | | | 18,648 | | | 251,976 | | | 2,874,946 | | | — | | | 3,145,570 | |
Income (loss) from continuing operations before income taxes | | | (546,811) | | | (233,533) | | | (640,856) | | | 841,116 | | | (580,084) | |
Income tax expense (benefit) | | | — | | | 109,700 | | | (192,670) | | | — | | | (82,970) | |
Income (loss) from continuing operations, net of tax | | | (546,811) | | | (343,233) | | | (448,186) | | | 841,116 | | | (497,114) | |
Income (loss) from discontinued operations, net of tax | | | — | | | — | | | (43,519) | | | — | | | (43,519) | |
Net income (loss) | | | (546,811) | | | (343,233) | | | (491,705) | | | 841,116 | | | (540,633) | |
Less: Net (income) loss attributable to noncontrolling interest | | | — | | | — | | | (6,178) | | | — | | | (6,178) | |
Net income (loss) attributable to Nabors | | $ | (546,811) | | $ | (343,233) | | $ | (497,883) | | $ | 841,116 | | $ | (546,811) | |
Less: Preferred stock dividend | | | — | | | — | | | — | | | — | | | — | |
Net income (loss) attributable to Nabors common shareholders | | $ | (546,811) | | $ | (343,233) | | $ | (497,883) | | $ | 841,116 | | $ | (546,811) | |
Condensed Consolidating Statements of Comprehensive Income (Loss)
| | | | | | | | | | | | | | | | | |
| | Year Ended December 31, 2018 | | |
| | | | | Nabors | | Other | | | | | | | | |
| | Nabors | | Delaware | | Subsidiaries | | | | | | | | |
| | (Parent/ | | (Issuer/ | | (Non- | | Consolidating | | | | | |
| | Guarantor) | | Guarantor) | | Guarantors) | | Adjustments | | Total | | |
| | (In thousands) | | |
| | | | | | | | | | | | | | | | | |
| | | Year Ended December 31, 2019 | |
| | | | | | | | | Other | | | | | | | |
| | | Nabors | | Nabors | | Subsidiaries | | | | | | | |
| | | (Parent/ | | Delaware | | (Non- | | Consolidating | | | | |
| | | Guarantor) | | (Issuer) | | Guarantors) | | Adjustments | | Total | |
| | | (In thousands) | |
Net income (loss) attributable to Nabors | | $ | (640,948) | | $ | 35,279 | | $ | (398,036) | | $ | 362,757 | | $ | (640,948) | | | $ | (702,885) | | $ | 140,474 | | $ | (405,726) | | $ | 265,252 | | $ | (702,885) | |
Other comprehensive income (loss) before tax: | | | | | | | | | | | | | | | | | | | | | | | | | | | | | | | | |
Translation adjustment attributable to Nabors | | | (31,962) | | | 4 | | | (31,962) | | | 31,958 | | | (31,962) | | | | 16,943 | | | (3) | | | 16,943 | | | (16,940) | | | 16,943 | |
Pension liability amortization and adjustment | | | 216 | | | 216 | | | 432 | | | (648) | | | 216 | | | | 217 | | | 217 | | | 434 | | | (651) | | | 217 | |
Unrealized gains (losses) and amortization on cash flow hedges | | | 567 | | | 567 | | | 567 | | | (1,134) | | | 567 | | | | 567 | | | 567 | | | 567 | | | (1,134) | | | 567 | |
Adoption of ASU No. 2016-01 | | | (9,144) | | | — | | | (9,144) | | | 9,144 | | | (9,144) | | |
Other comprehensive income (loss) before tax | | | (40,323) | | | 787 | | | (40,107) | | | 39,320 | | | (40,323) | | | | 17,727 | | | 781 | | | 17,944 | | | (18,725) | | | 17,727 | |
Income tax expense (benefit) related to items of other comprehensive income (loss) | | | 187 | | | 187 | | | 374 | | | (561) | | | 187 | | | | 190 | | | 190 | | | 380 | | | (570) | | | 190 | |
Other comprehensive income (loss), net of tax | | | (40,510) | | | 600 | | | (40,481) | | | 39,881 | | | (40,510) | | | | 17,537 | | | 591 | | | 17,564 | | | (18,155) | | | 17,537 | |
Comprehensive income (loss) attributable to Nabors | | | (681,458) | | | 35,879 | | | (438,517) | | | 402,638 | | | (681,458) | | | | (685,348) | | | 141,065 | | | (388,162) | | | 247,097 | | | (685,348) | |
Net income (loss) attributable to noncontrolling interest | | | — | | | — | | | 28,222 | | | — | | | 28,222 | | | | — | | | — | | | 22,375 | | | — | | | 22,375 | |
Translation adjustment attributable to noncontrolling interest | | | — | | | — | | | (251) | | | — | | | (251) | | | | — | | | — | | | 55 | | | — | | | 55 | |
Comprehensive income (loss) attributable to noncontrolling interest | | | — | | | — | | | 27,971 | | | — | | | 27,971 | | | | — | | | — | | | 22,430 | | | — | | | 22,430 | |
Comprehensive income (loss) | | $ | (681,458) | | $ | 35,879 | | $ | (410,546) | | $ | 402,638 | | $ | (653,487) | | | $ | (685,348) | | $ | 141,065 | | $ | (365,732) | | $ | 247,097 | | $ | (662,918) | |
| | | | | | | | | | | | | | | | |
| | Year Ended December 31, 2018 | |
| | | | | | | | Other | | | | | | | |
| | Nabors | | Nabors | | Subsidiaries | | | | | | | |
| | (Parent/ | | Delaware | | (Non- | | Consolidating | | | | |
| | Guarantor) | | (Issuer) | | Guarantors) | | Adjustments | | Total | |
| | (In thousands) | |
Net income (loss) attributable to Nabors | | $ | (640,948) | | $ | 35,279 | | $ | (398,036) | | $ | 362,757 | | $ | (640,948) | |
Other comprehensive income (loss) before tax: | | | | | | | | | | | | | | | | |
Translation adjustment attributable to Nabors | | | (31,962) | | | 4 | | | (31,962) | | | 31,958 | | | (31,962) | |
Pension liability amortization and adjustment | | | 216 | | | 216 | | | 432 | | | (648) | | | 216 | |
Unrealized gains (losses) and amortization on cash flow hedges | | | 567 | | | 567 | | | 567 | | | (1,134) | | | 567 | |
Adoption of ASU No. 2016-01 | | | (9,144) | | | — | | | (9,144) | | | 9,144 | | | (9,144) | |
Other comprehensive income (loss) before tax | | | (40,323) | | | 787 | | | (40,107) | | | 39,320 | | | (40,323) | |
Income tax expense (benefit) related to items of other comprehensive income (loss) | | | 187 | | | 187 | | | 374 | | | (561) | | | 187 | |
Other comprehensive income (loss), net of tax | | | (40,510) | | | 600 | | | (40,481) | | | 39,881 | | | (40,510) | |
Comprehensive income (loss) attributable to Nabors | | | (681,458) | | | 35,879 | | | (438,517) | | | 402,638 | | | (681,458) | |
Net income (loss) attributable to noncontrolling interest | | | — | | | — | | | 28,222 | | | — | | | 28,222 | |
Translation adjustment attributable to noncontrolling interest | | | — | | | — | | | (251) | | | — | | | (251) | |
Comprehensive income (loss) attributable to noncontrolling interest | | | — | | | — | | | 27,971 | | | — | | | 27,971 | |
Comprehensive income (loss) | | $ | (681,458) | | $ | 35,879 | | $ | (410,546) | | $ | 402,638 | | $ | (653,487) | |
| | | | | | | | | | | | | | | | |
| | Year Ended December 31, 2017 | |
| | | | | Nabors | | Other | | | | | | | |
| | Nabors | | Delaware | | Subsidiaries | | | | | | | |
| | (Parent/ | | (Issuer/ | | (Non- | | Consolidating | | | | |
| | Guarantor) | | Guarantor) | | Guarantors) | | Adjustments | | Total | |
| | (In thousands) | |
Net income (loss) attributable to Nabors | | $ | (546,811) | | $ | (343,233) | | $ | (497,883) | | $ | 841,116 | | $ | (546,811) | |
Other comprehensive income (loss) before tax: | | | | | | | | | | | | | | | | |
Translation adjustment attributable to Nabors | | | 28,372 | | | — | | | 28,372 | | | (28,372) | | | 28,372 | |
Unrealized gains (losses) on marketable securities: | | | | | | | | | | | | | | | | |
Unrealized gains (losses) on marketable securities | | | (6,061) | | | — | | | (6,061) | | | 6,061 | | | (6,061) | |
Less: reclassification adjustment for (gains) losses included in net income (loss) | | | 970 | | | — | | | 970 | | | (970) | | | 970 | |
Unrealized gains (losses) on marketable securities | | | (5,091) | | | — | | | (5,091) | | | 5,091 | | | (5,091) | |
Pension liability amortization and adjustment | | | (275) | | | (275) | | | (550) | | | 825 | | | (275) | |
Unrealized gains (losses) and amortization on cash flow hedges | | | 613 | | | 613 | | | 613 | | | (1,226) | | | 613 | |
Other comprehensive income (loss) before tax | | | 23,619 | | | 338 | | | 23,344 | | | (23,682) | | | 23,619 | |
Income tax expense (benefit) related to items of other comprehensive income (loss) | | | 315 | | | 315 | | | 630 | | | (945) | | | 315 | |
Other comprehensive income (loss), net of tax | | | 23,304 | | | 23 | | | 22,714 | | | (22,737) | | | 23,304 | |
Comprehensive income (loss) attributable to Nabors | | | (523,507) | | | (343,210) | | | (475,169) | | | 818,379 | | | (523,507) | |
Net income (loss) attributable to noncontrolling interest | | | — | | | — | | | 6,178 | | | — | | | 6,178 | |
Translation adjustment attributable to noncontrolling interest | | | — | | | — | | | 282 | | | — | | | 282 | |
Comprehensive income (loss) attributable to noncontrolling interest | | | — | | | — | | | 6,460 | | | — | | | 6,460 | |
Comprehensive income (loss) | | $ | (523,507) | | $ | (343,210) | | $ | (468,709) | | $ | 818,379 | | $ | (517,047) | |
| | | | | | | | | | | | | | | | |
| | Year Ended December 31, 2017 | |
| | | | | | | | Other | | | | | | | |
| | Nabors | | Nabors | | Subsidiaries | | | | | | | |
| | (Parent/ | | Delaware | | (Non- | | Consolidating | | | | |
| | Guarantor) | | (Issuer) | | Guarantors) | | Adjustments | | Total | |
| | (In thousands) | |
Net income (loss) attributable to Nabors | | $ | (546,811) | | $ | (343,233) | | $ | (497,883) | | $ | 841,116 | | $ | (546,811) | |
Other comprehensive income (loss) before tax | | | | | | | | | | | | | | | | |
Translation adjustment attributable to Nabors | | | 28,372 | | | — | | | 28,372 | | | (28,372) | | | 28,372 | |
Unrealized gains (losses) on marketable securities: | | | | | | | | | | | | | | | | |
Unrealized gains (losses) on marketable securities | | | (6,061) | | | — | | | (6,061) | | | 6,061 | | | (6,061) | |
Less: reclassification adjustment for (gains) losses included in net income (loss) | | | 970 | | | — | | | 970 | | | (970) | | | 970 | |
Unrealized gains (losses) on marketable securities | | | (5,091) | | | — | | | (5,091) | | | 5,091 | | | (5,091) | |
Pension liability amortization and adjustment | | | (275) | | | (275) | | | (550) | | | 825 | | | (275) | |
Unrealized gains (losses) and amortization on cash flow hedges | | | 613 | | | 613 | | | 613 | | | (1,226) | | | 613 | |
Other comprehensive income (loss) before tax | | | 23,619 | | | 338 | | | 23,344 | | | (23,682) | | | 23,619 | |
Income tax expense (benefit) related to items of other comprehensive income (loss) | | | 315 | | | 315 | | | 630 | | | (945) | | | 315 | |
Other comprehensive income (loss), net of tax | | | 23,304 | | | 23 | | | 22,714 | | | (22,737) | | | 23,304 | |
Comprehensive income (loss) attributable to Nabors | | | (523,507) | | | (343,210) | | | (475,169) | | | 818,379 | | | (523,507) | |
Net income (loss) attributable to noncontrolling interest | | | — | | | — | | | 6,178 | | | — | | | 6,178 | |
Translation adjustment attributable to noncontrolling interest | | | — | | | — | | | 282 | | | — | | | 282 | |
Comprehensive income (loss) attributable to noncontrolling interest | | | — | | | — | | | 6,460 | | | — | | | 6,460 | |
Comprehensive income (loss) | | $ | (523,507) | | $ | (343,210) | | $ | (468,709) | | $ | 818,379 | | $ | (517,047) | |
| | | | | | | | | | | | | | | | |
| | Year Ended December 31, 2016 | |
| | | | | Nabors | | Other | | | | | | | |
| | Nabors | | Delaware | | Subsidiaries | | | | | | | |
| | (Parent/ | | (Issuer/ | | (Non- | | Consolidating | | | | |
| | Guarantor) | | Guarantor) | | Guarantors) | | Adjustments | | Total | |
| | (In thousands) | |
Net income (loss) attributable to Nabors | | $ | (1,029,742) | | $ | (359,751) | | $ | (1,237,375) | | $ | 1,597,126 | | $ | (1,029,742) | |
Other comprehensive income (loss) before tax | | | | | | | | | | | | | | | | |
Translation adjustment attributable to Nabors | | | 17,743 | | | (21) | | | 17,743 | | | (17,722) | | | 17,743 | |
Unrealized gains (losses) on marketable securities: | | | | | | | | | | | | | | | | |
Unrealized gains (losses) on marketable securities | | | 11,054 | | | — | | | 11,054 | | | (11,054) | | | 11,054 | |
Less: reclassification adjustment for (gains) losses included in net income (loss) | | | 3,495 | | | — | | | 3,495 | | | (3,495) | | | 3,495 | |
Unrealized gains (losses) on marketable securities | | | 14,549 | | | — | | | 14,549 | | | (14,549) | | | 14,549 | |
Pension liability amortization and adjustment | | | 1,061 | | | 1,061 | | | 2,122 | | | (3,183) | | | 1,061 | |
Unrealized gains (losses) and amortization on cash flow hedges | | | 613 | | | 613 | | | 613 | | | (1,226) | | | 613 | |
Pension buyout | | | 3,059 | | | 3,059 | | | 6,118 | | | (9,177) | | | 3,059 | |
Other comprehensive income (loss) before tax | | | 37,025 | | | 4,712 | | | 41,145 | | | (45,857) | | | 37,025 | |
Income tax expense (benefit) related to items of other comprehensive income (loss) | | | 1,551 | | | 1,551 | | | 3,102 | | | (4,653) | | | 1,551 | |
Other comprehensive income (loss), net of tax | | | 35,474 | | | 3,161 | | | 38,043 | | | (41,204) | | | 35,474 | |
Comprehensive income (loss) attributable to Nabors | | | (994,268) | | | (356,590) | | | (1,199,332) | | | 1,555,922 | | | (994,268) | |
Net income (loss) attributable to noncontrolling interest | | | — | | | — | | | 135 | | | — | | | 135 | |
Translation adjustment attributable to noncontrolling interest | | | — | | | — | | | 251 | | | — | | | 251 | |
Comprehensive income (loss) attributable to noncontrolling interest | | | — | | | — | | | 386 | | | — | | | 386 | |
Comprehensive income (loss) | | $ | (994,268) | | $ | (356,590) | | $ | (1,198,946) | | $ | 1,555,922 | | $ | (993,882) | |
Condensed Consolidating Statements of Cash Flows
| | | | | | | | | | | | | | | | | |
| | Year Ended December 31, 2018 | | |
| | | | | Nabors | | Other | | | | | | | | |
| | Nabors | | Delaware | | Subsidiaries | | | | | | | | |
| | (Parent/ | | (Issuer/ | | (Non- | | Consolidating | | | | | |
| | Guarantor) | | Guarantor) | | Guarantors) | | Adjustments | | Total | | |
| | (In thousands) | | |
| | | | | | | | | | | | | | | | | |
| | | Year Ended December 31, 2019 | |
| | | | | | | | | Other | | | | | | | |
| | | Nabors | | Nabors | | Subsidiaries | | | | | | | |
| | | (Parent/ | | Delaware | | (Non- | | Consolidating | | | | |
| | | Guarantor) | | (Issuer) | | Guarantors) | | Adjustments | | Total | |
| | | (In thousands) | |
Net cash provided by (used for) operating activities | | $ | 86,504 | | $ | (208,943) | | $ | 495,709 | | $ | (47,497) | | $ | 325,773 | | | $ | 79,910 | | $ | (179,265) | | $ | 848,271 | | $ | (64,358) | | $ | 684,558 | |
Cash flows from investing activities: | | | | | | | | | | | | | | | | | | | | | | | | | | | | | | | | |
Purchases of investments | | | — | | | — | | | (676) | | | — | | | (676) | | | | — | | | — | | | (4,323) | | | — | | | (4,323) | |
Sales and maturities of investments | | | — | | | — | | | 4,287 | | | — | | | 4,287 | | | | — | | | — | | | 18,849 | | | — | | | 18,849 | |
Cash paid for acquisitions of businesses, net of cash acquired | | | — | | | (20,859) | | | — | | | — | | | (20,859) | | | | — | | | — | | | (2,929) | | | — | | | (2,929) | |
Cash paid for investments in consolidated affiliates | | | (587,500) | | | — | | | (206,500) | | | 794,000 | | | — | | | | — | | | — | | | (8,500) | | | 8,500 | | | — | |
Capital expenditures | | | — | | | — | | | (458,938) | | | — | | | (458,938) | | | | — | | | — | | | (427,741) | | | — | | | (427,741) | |
Proceeds from sales of assets and insurance claims | | | — | | | — | | | 109,098 | | | — | | | 109,098 | | | | — | | | — | | | 60,288 | | | — | | | 60,288 | |
Change in intercompany balances | | | — | | | 502,856 | | | (502,856) | | | — | | | — | | | | — | | | 449,888 | | | (449,888) | | | — | | | — | |
Net cash provided by (used for) investing activities | | | (587,500) | | | 481,997 | | | (1,055,585) | | | 794,000 | | | (367,088) | | | | — | | | 449,888 | | | (814,244) | | | 8,500 | | | (355,856) | |
Cash flows from financing activities: | | | | | | | | | | | | | | | | | | | | | | | | | | | | | | | | |
Proceeds from issuance of long-term debt | | | — | | | 800,000 | | | — | | | — | | | 800,000 | | |
Reduction of long-term debt | | | | — | | | (455,360) | | | — | | | — | | | (455,360) | |
Debt issuance costs | | | — | | | (21,277) | | | — | | | — | | | (21,277) | | | | — | | | (1,767) | | | — | | | — | | | (1,767) | |
Proceeds from revolving credit facilities | | | — | | | 1,135,000 | | | — | | | — | | | 1,135,000 | | | | — | | | 1,050,000 | | | — | | | — | | | 1,050,000 | |
Proceeds from parent contributions | | | — | | | 206,500 | | | 587,500 | | | (794,000) | | | — | | |
Reduction in revolving credit facilities | | | | — | | | (865,000) | | | — | | | — | | | (865,000) | |
Proceeds from (payments for) short-term borrowings | | | | — | | | — | | | (561) | | | — | | | (561) | |
Proceeds from issuance of common shares, net of issuance costs | | | 301,404 | | | — | | | — | | | — | | | 301,404 | | | | 6 | | | — | | | (6) | | | — | | | — | |
Reduction of long-term debt | | | — | | | (878,278) | | | — | | | — | | | (878,278) | | |
Proceeds from (payment for) commercial paper, net | | | — | | | (40,000) | | | — | | | — | | | (40,000) | | |
Reduction in revolving credit facilities | | | — | | | (1,475,000) | | | — | | | — | | | (1,475,000) | | |
Dividends to common and preferred shareholders | | | (99,583) | | | — | | | — | | | 12,485 | | | (87,098) | | | | (54,347) | | | — | | | 12 | | | 4,752 | | | (49,583) | |
Proceeds from (payments for) short-term borrowings | | | — | | | — | | | 380 | | | — | | | 380 | | |
Proceeds from issuance of preferred stock, net of issuance costs | | | 277,927 | | | — | | | — | | | — | | | 277,927 | | |
Distributions to noncontrolling interest | | | | — | | | — | | | (4,552) | | | — | | | (4,552) | |
Proceeds from issuance of intercompany debt | | | 45,500 | | | — | | | (45,500) | | | — | | | — | | | | 6,600 | | | — | | | (6,600) | | | — | | | — | |
Paydown of intercompany debt | | | (21,000) | | | — | | | 21,000 | | | — | | | — | | | | (27,700) | | | (7,000) | | | 34,700 | | | — | | | — | |
Distributions to Non-controlling interest | | | — | | | — | | | (5,452) | | | — | | | (5,452) | | |
Proceeds from parent contributions | | | | — | | | 8,500 | | | — | | | (8,500) | | | — | |
Distribution from subsidiary to parent | | | — | | | — | | | (35,012) | | | 35,012 | | | — | | | | — | | | — | | | (59,606) | | | 59,606 | | | — | |
Redeemable noncontrolling interest contribution | | | — | | | — | | | 156,935 | | | — | | | 156,935 | | |
Other changes | | | (3,869) | | | — | | | (5,043) | | | — | | | (8,912) | | | | (4,624) | | | — | | | (126) | | | — | | | (4,750) | |
Net cash (used for) provided by financing activities | | | 500,379 | | | (273,055) | | | 674,808 | | | (746,503) | | | 155,629 | | | | (80,065) | | | (270,627) | | | (36,739) | | | 55,858 | | | (331,573) | |
Effect of exchange rate changes on cash and cash equivalents | | | — | | | — | | | (5,263) | | | — | | | (5,263) | | | | — | | | — | | | (6,171) | | | — | | | (6,171) | |
Net increase (decrease) in cash, cash equivalents and restricted cash | | | (617) | | | (1) | | | 109,669 | | | — | | | 109,051 | | | | (155) | | | (4) | | | (8,883) | | | — | | | (9,042) | |
Cash, cash equivalents and restricted cash, beginning of period | | | 1,091 | | | 44 | | | 340,894 | | | — | | | 342,029 | | | | 474 | | | 43 | | | 450,563 | | | — | | | 451,080 | |
Cash, cash equivalents and restricted cash, end of period | | $ | 474 | | $ | 43 | | $ | 450,563 | | $ | — | | $ | 451,080 | | | $ | 319 | | $ | 39 | | $ | 441,680 | | $ | — | | $ | 442,038 | |
| | | | | | | | | | | | | | | | |
| | Year Ended December 31, 2017 | |
| | | | | Nabors | | Other | | | | | | | |
| | Nabors | | Delaware | | Subsidiaries | | | | | | | |
| | (Parent/ | | (Issuer/ | | (Non- | | Consolidating | | | | |
| | Guarantor) | | Guarantor) | | Guarantors) | | Adjustments | | Total | |
| | (In thousands) | |
Net cash provided by (used for) operating activities | | $ | 143,444 | | $ | (90,229) | | $ | 142,527 | | $ | (132,986) | | $ | 62,756 | |
Cash flows from investing activities: | | | | | | | | | | | | | | | | |
Purchases of investments | | | — | | | — | | | (6,722) | | | — | | | (6,722) | |
Sales and maturities of investments | | | — | | | — | | | 13,069 | | | — | | | 13,069 | |
Cash paid for acquisitions of businesses, net of cash acquired | | | — | | | — | | | 12,319 | | | — | | | 12,319 | |
Cash paid for investments in consolidated affiliates | | | (100) | | | — | | | (85,960) | | | 86,060 | | | — | |
Capital expenditures | | | — | | | — | | | (574,467) | | | — | | | (574,467) | |
Proceeds from sale of assets and insurance claims | | | — | | | — | | | 57,933 | | | — | | | 57,933 | |
Change in intercompany balances | | | — | | | (599,974) | | | 599,974 | | | — | | | — | |
Net cash provided by (used for) investing activities | | | (100) | | | (599,974) | | | 16,146 | | | 86,060 | | | (497,868) | |
Cash flows from financing activities: | | | | | | | | | | | | | | | | |
Debt issuance costs | | | — | | | (11,043) | | | — | | | — | | | (11,043) | |
Proceeds from issuance of common shares | | | 8,299 | | | — | | | 1 | | | — | | | 8,300 | |
Reduction in long-term debt | | | — | | | (270,269) | | | (111,545) | | | — | | | (381,814) | |
Reduction in revolving credit facilities | | | — | | | (215,000) | | | — | | | — | | | (215,000) | |
Dividends to shareholders | | | (80,419) | | | — | | | — | | | 11,916 | | | (68,503) | |
Proceeds from (payments for) commercial paper, net | | | — | | | 40,000 | | | — | | | — | | | 40,000 | |
Proceeds from (payments for) issuance of intercompany debt | | | 57,000 | | | 20,000 | | | (77,000) | | | — | | | — | |
Purchase of capped call hedge transactions | | | — | | | (40,250) | | | — | | | — | | | (40,250) | |
Proceeds from revolving credit facilities | | | — | | | 725,000 | | | — | | | — | | | 725,000 | |
Proceeds from issuance of long-term debt | | | — | | | 411,200 | | | — | | | — | | | 411,200 | |
Payments on term loan | | | — | | | (162,500) | | | — | | | — | | | (162,500) | |
Repurchase of common shares | | | (18,071) | | | — | | | — | | | — | | | (18,071) | |
Paydown of intercompany debt | | | (102,000) | | | (20,000) | | | 122,000 | | | — | | | — | |
Cash proceeds from equity component of exchangeable debt | | | — | | | 159,952 | | | — | | | — | | | 159,952 | |
Noncontrolling interest contribution | | | — | | | — | | | 20,000 | | | — | | | 20,000 | |
Redeemable noncontrolling interest | | | — | | | — | | | 61,123 | | | — | | | 61,123 | |
Distributions to Non-controlling interest | | | — | | | — | | | (7,272) | | | — | | | (7,272) | |
Proceeds from (payments for) short-term borrowings | | | — | | | — | | | (543) | | | — | | | (543) | |
Proceeds from parent contributions | | | — | | | 42,980 | | | 43,080 | | | (86,060) | | | — | |
Distribution from subsidiary to parent | | | — | | | — | | | (121,070) | | | 121,070 | | | — | |
Other changes | | | (8,210) | | | — | | | (189) | | | — | | | (8,399) | |
Net cash (used for) provided by financing activities | | | (143,401) | | | 680,070 | | | (71,415) | | | 46,926 | | | 512,180 | |
Effect of exchange rate changes on cash and cash equivalents | | | — | | | — | | | (29) | | | — | | | (29) | |
Net increase (decrease) in cash, cash equivalents and restricted cash | | | (57) | | | (10,133) | | | 87,229 | | | — | | | 77,039 | |
Cash, cash equivalents and restricted cash, beginning of period | | | 1,148 | | | 10,177 | | | 253,665 | | | — | | | 264,990 | |
Cash, cash equivalents and restricted cash, end of period | | $ | 1,091 | | $ | 44 | | $ | 340,894 | | $ | — | | $ | 342,029 | |
| | | | | | | | | | | | | | | | |
| | Year Ended December 31, 2018 | |
| | | | | | | | Other | | | | | | | |
| | Nabors | | Nabors | | Subsidiaries | | | | | | | |
| | (Parent/ | | Delaware | | (Non- | | Consolidating | | | | |
| | Guarantor) | | (Issuer) | | Guarantors) | | Adjustments | | Total | |
| | (In thousands) | |
Net cash provided by (used for) operating activities | | $ | 86,504 | | $ | (208,943) | | $ | 495,709 | | $ | (47,497) | | $ | 325,773 | |
Cash flows from investing activities: | | | | | | | | | | | | | | | | |
Purchases of investments | | | — | | | — | | | (676) | | | — | | | (676) | |
Sales and maturities of investments | | | — | | | — | | | 4,287 | | | — | | | 4,287 | |
Cash paid for acquisitions of businesses, net of cash acquired | | | — | | | (20,859) | | | — | | | — | | | (20,859) | |
Cash paid for investments in consolidated affiliates | | | (587,500) | | | — | | | (206,500) | | | 794,000 | | | — | |
Capital expenditures | | | — | | | — | | | (458,938) | | | — | | | (458,938) | |
Proceeds from sale of assets and insurance claims | | | — | | | — | | | 109,098 | | | — | | | 109,098 | |
Change in intercompany balances | | | — | | | 502,856 | | | (502,856) | | | — | | | — | |
Net cash provided by (used for) investing activities | | | (587,500) | | | 481,997 | | | (1,055,585) | | | 794,000 | | | (367,088) | |
Cash flows from financing activities: | | | | | | | | | | | | | | | | |
Proceeds from issuance of long-term debt | | | — | | | 800,000 | | | — | | | — | | | 800,000 | |
Reduction in long-term debt | | | — | | | (878,278) | | | — | | | — | | | (878,278) | |
Debt issuance costs | | | — | | | (21,277) | | | — | | | — | | | (21,277) | |
Proceeds from revolving credit facilities | | | — | | | 1,135,000 | | | — | | | — | | | 1,135,000 | |
Reduction in revolving credit facilities | | | — | | | (1,475,000) | | | — | | | — | | | (1,475,000) | |
Proceeds from (payments for) commercial paper, net | | | — | | | (40,000) | | | — | | | — | | | (40,000) | |
Proceeds from (payments for) short-term borrowings | | | — | | | — | | | 380 | | | — | | | 380 | |
Proceeds from issuance of common shares, net of issuance costs | | | 301,404 | | | — | | | — | | | — | | | 301,404 | |
Proceeds from issuance of preferred stock, net of issuance costs | | | 277,927 | | | — | | | — | | | — | | | 277,927 | |
Dividends to common and preferred shareholders | | | (99,583) | | | — | | | — | | | 12,485 | | | (87,098) | |
Redeemable noncontrolling interest | | | — | | | — | | | 156,935 | | | — | | | 156,935 | |
Distributions to noncontrolling interest | | | — | | | — | | | (5,452) | | | — | | | (5,452) | |
Proceeds from (payments for) issuance of intercompany debt | | | 45,500 | | | — | | | (45,500) | | | — | | | — | |
Paydown of intercompany debt | | | (21,000) | | | — | | | 21,000 | | | — | | | — | |
Proceeds from parent contributions | | | — | | | 206,500 | | | 587,500 | | | (794,000) | | | — | |
Distribution from subsidiary to parent | | | — | | | — | | | (35,012) | | | 35,012 | | | — | |
Other changes | | | (3,869) | | | — | | | (5,043) | | | — | | | (8,912) | |
Net cash (used for) provided by financing activities | | | 500,379 | | | (273,055) | | | 674,808 | | | (746,503) | | | 155,629 | |
Effect of exchange rate changes on cash and cash equivalents | | | — | | | — | | | (5,263) | | | — | | | (5,263) | |
Net increase (decrease) in cash, cash equivalents and restricted cash | | | (617) | | | (1) | | | 109,669 | | | — | | | 109,051 | |
Cash, cash equivalents and restricted cash, beginning of period | | | 1,091 | | | 44 | | | 340,894 | | | — | | | 342,029 | |
Cash, cash equivalents and restricted cash, end of period | | $ | 474 | | $ | 43 | | $ | 450,563 | | $ | — | | $ | 451,080 | |
| | | | | | | | | | | | | | | | |
| | Year Ended December 31, 2016 | |
| | | | | Nabors | | Other | | | | | | | |
| | Nabors | | Delaware | | Subsidiaries | | | | | | | |
| | (Parent/ | | (Issuer/ | | (Non- | | Consolidating | | | | |
| | Guarantor) | | Guarantor) | | Guarantors) | | Adjustments | | Total | |
| | (In thousands) | |
Net cash provided by (used for) operating activities | | $ | 58,406 | | $ | (233,738) | | $ | 757,660 | | $ | (50,423) | | $ | 531,905 | |
Cash flows from investing activities: | | | | | | | | | | | | | | | | |
Purchases of investments | | | — | | | — | | | (24) | | | — | | | (24) | |
Sales and maturities of investments | | | — | | | — | | | 739 | | | — | | | 739 | |
Cash paid for acquisition of businesses, net of cash acquired | | | — | | | — | | | (22,278) | | | — | | | (22,278) | |
Capital expenditures | | | — | | | — | | | (395,455) | | | — | | | (395,455) | |
Proceeds from sales of assets and insurance claims | | | — | | | — | | | 34,831 | | | — | | | 34,831 | |
Cash paid for investments in consolidated affiliates | | | — | | | (86,459) | | | (159,000) | | | 245,459 | | | — | |
Changes in intercompany balances | | | — | | | 103,384 | | | (103,384) | | | — | | | — | |
Net cash provided by (used for) investing activities | | | — | | | 16,925 | | | (644,571) | | | 245,459 | | | (382,187) | |
Cash flows from financing activities: | | | | | | | | | | | | | | | | |
Proceeds from (payments for) short-term borrowings | | | — | | | — | | | (6,211) | | | — | | | (6,211) | |
Debt issuance costs | | | — | | | (11,520) | | | — | | | — | | | (11,520) | |
Proceeds from (payments for) issuance of common shares | | | 967 | | | — | | | — | | | — | | | 967 | |
Reduction in long-term debt | | | — | | | (350,000) | | | (143,612) | | | — | | | (493,612) | |
Proceeds from revolving credit facilities | | | — | | | 610,000 | | | 1,500 | | | — | | | 611,500 | |
Payments on term loan | | | — | | | (162,500) | | | — | | | — | | | (162,500) | |
Dividends to shareholders | | | (59,866) | | | — | | | — | | | 8,942 | | | (50,924) | |
Proceeds from (payments for) commercial paper, net | | | — | | | (8,000) | | | — | | | — | | | (8,000) | |
Proceeds from issuance of long term debt | | | — | | | 600,000 | | | — | | | — | | | 600,000 | |
Reduction in revolving credit facilities | | | — | | | (610,000) | | | (1,500) | | | — | | | (611,500) | |
Repurchase of common shares | | | — | | | — | | | (1,687) | | | — | | | (1,687) | |
Proceeds (issuance) of intercompany debt | | | 45,500 | | | — | | | (45,500) | | | — | | | — | |
Proceeds from parent contributions | | | — | | | 159,000 | | | 86,458 | | | (245,458) | | | — | |
Paydown of intercompany debt | | | (40,000) | | | — | | | 40,000 | | | — | | | — | |
Payments on parent (Equity of N/P) | | | — | | | — | | | (41,480) | | | 41,480 | | | — | |
Other | | | (4,732) | | | — | | | 3 | | | — | | | (4,729) | |
Net cash (used for) provided by financing activities | | | (58,131) | | | 226,980 | | | (112,029) | | | (195,036) | | | (138,216) | |
Effect of exchange rate changes on cash and cash equivalents | | | — | | | — | | | (2,003) | | | — | | | (2,003) | |
Net increase (decrease) in cash, cash equivalents and restricted cash | | | 275 | | | 10,167 | | | (943) | | | — | | | 9,499 | |
Cash, cash equivalents and restricted cash, beginning of period | | | 873 | | | 10 | | | 254,608 | | | — | | | 255,491 | |
Cash, cash equivalents and restricted cash, end of period | | $ | 1,148 | | $ | 10,177 | | $ | 253,665 | | $ | — | | $ | 264,990 | |
| | | | | | | | | | | | | | | | |
| | Year Ended December 31, 2017 | |
| | | | | | | | Other | | | | | | | |
| | Nabors | | Nabors | | Subsidiaries | | | | | | | |
| | (Parent/ | | Delaware | | (Non- | | Consolidating | | | | |
| | Guarantor) | | (Issuer) | | Guarantors) | | Adjustments | | Total | |
| | (In thousands) | |
Net cash provided by (used for) operating activities | | $ | 143,444 | | $ | (90,229) | | $ | 142,527 | | $ | (132,986) | | $ | 62,756 | |
Cash flows from investing activities: | | | | | | | | | | | | | | | | |
Purchases of investments | | | — | | | — | | | (6,722) | | | — | | | (6,722) | |
Sales and maturities of investments | | | — | | | — | | | 13,069 | | | — | | | 13,069 | |
Cash paid for acquisitions of businesses, net of cash acquired | | | — | | | — | | | 12,319 | | | — | | | 12,319 | |
Cash paid for investments in consolidated affiliates | | | (100) | | | — | | | (85,960) | | | 86,060 | | | — | |
Capital expenditures | | | — | | | — | | | (574,467) | | | — | | | (574,467) | |
Proceeds from sale of assets and insurance claims | | | — | | | — | | | 57,933 | | | — | | | 57,933 | |
Change in intercompany balances | | | — | | | (599,974) | | | 599,974 | | | — | | | — | |
Net cash provided by (used for) investing activities | | | (100) | | | (599,974) | | | 16,146 | | | 86,060 | | | (497,868) | |
Cash flows from financing activities: | | | | | | | | | | | | | | | | |
Proceeds from issuance of long-term debt | | | — | | | 411,200 | | | — | | | — | | | 411,200 | |
Reduction in long-term debt | | | — | | | (270,269) | | | (111,545) | | | — | | | (381,814) | |
Debt issuance costs | | | — | | | (11,043) | | | — | | | — | | | (11,043) | |
Proceeds from revolving credit facilities | | | — | | | 725,000 | | | — | | | — | | | 725,000 | |
Reduction in revolving credit facilities | | | — | | | (215,000) | | | — | | | — | | | (215,000) | |
Proceeds from (payments for) commercial paper, net | | | — | | | 40,000 | | | — | | | — | | | 40,000 | |
Cash proceeds (payments) from equity component of exchangeable debt | | | — | | | 159,952 | | | — | | | — | | | 159,952 | |
Purchase of capped call hedge transactions | | | — | | | (40,250) | | | — | | | — | | | (40,250) | |
Payments on term loan | | | — | | | (162,500) | | | — | | | — | | | (162,500) | |
Proceeds from (payments for) short-term borrowings | | | — | | | — | | | (543) | | | — | | | (543) | |
Proceeds from issuance of common shares, net of issuance costs | | | 8,299 | | | — | | | 1 | | | — | | | 8,300 | |
Repurchase of common shares | | | (18,071) | | | — | | | — | | | — | | | (18,071) | |
Dividends to common and preferred shareholders | | | (80,419) | | | — | | | — | | | 11,916 | | | (68,503) | |
Redeemable noncontrolling interest | | | — | | | — | | | 61,123 | | | — | | | 61,123 | |
Noncontrolling interest contribution | | | — | | | — | | | 20,000 | | | — | | | 20,000 | |
Distributions to noncontrolling interest | | | — | | | — | | | (7,272) | | | — | | | (7,272) | |
Proceeds from (payments for) issuance of intercompany debt | | | 57,000 | | | 20,000 | | | (77,000) | | | — | | | — | |
Paydown of intercompany debt | | | (102,000) | | | (20,000) | | | 122,000 | | | — | | | — | |
Proceeds from parent contributions | | | — | | | 42,980 | | | 43,080 | | | (86,060) | | | — | |
Distribution from subsidiary to parent | | | — | | | — | | | (121,070) | | | 121,070 | | | — | |
Other changes | | | (8,210) | | | — | | | (189) | | | — | | | (8,399) | |
Net cash (used for) provided by financing activities | | | (143,401) | | | 680,070 | | | (71,415) | | | 46,926 | | | 512,180 | |
Effect of exchange rate changes on cash and cash equivalents | | | — | | | — | | | (29) | | | — | | | (29) | |
Net increase (decrease) in cash, cash equivalents and restricted cash | | | (57) | | | (10,133) | | | 87,229 | | | — | | | 77,039 | |
Cash, cash equivalents and restricted cash, beginning of period | | | 1,148 | | | 10,177 | | | 253,665 | | | — | | | 264,990 | |
Cash, cash equivalents and restricted cash, end of period | | | 1,091 | | | 44 | | | 340,894 | | | — | | | 342,029 | |
ITEM 9. CHANGES IN AND DISAGREEMENTS WITH ACCOUNTANTS ON ACCOUNTING AND FINANCIAL DISCLOSURE
Not applicable.
ITEM 9A. CONTROLS AND PROCEDURES
Disclosure Controls and Procedures
We maintain a set of disclosure controls and procedures (as such term is defined in Rule 15d-15(e) under the Exchange Act) designed to provide reasonable assurance that information required to be disclosed in our reports filed or submitted under the Exchange Act is recorded, processed, summarized and reported within the time periods specified in the SEC’s rules and forms, and that such information is accumulated and communicated to management as appropriate to allow timely decisions regarding required disclosure. We have investments in certain unconsolidated entities that we do not control or manage. Because we do not control or manage these entities, our disclosure controls and procedures with respect to these entities are necessarily more limited than those we maintain with respect to our consolidated subsidiaries.
The Company’s management, with the participation of the Chief Executive Officer and the Chief Financial Officer, has evaluated the effectiveness of the Company’s disclosure controls and procedures as of the end of the period covered by this annual report. Based on this evaluation, the Chief Executive Officer and the Chief Financial Officer have concluded that, as of December 31, 2018,2019, the Company’s disclosure controls and procedures were effective at the reasonable assurance level.
Management’s Report on Internal Control over Financial Reporting
Management is responsible for establishing and maintaining adequate internal control over financial reporting. Our internal control over financial reporting is a process designed to provide reasonable assurance regarding the reliability of financial reporting and the preparation of financial statements for external purposes in accordance with U.S. GAAP. Our internal control over financial reporting includes those policies and procedures that (i) pertain to the maintenance of records that, in reasonable detail, accurately and fairly reflect the transactions and dispositions of the assets of the Company; (ii) provide reasonable assurance that transactions are recorded as necessary to permit preparation of financial statements in accordance with U.S. GAAP, and that receipts and expenditures of the Company are being made only in accordance with authorizations of management and directors of the Company; and (iii) provide reasonable assurance regarding prevention or timely detection of unauthorized acquisition, use, or disposition of the Company’s assets that could have a material effect on the financial statements.
Internal control over financial reporting cannot provide absolute assurance of achieving financial reporting objectives because of its inherent limitations. Internal control over financial reporting is a process that involves human diligence and compliance and is subject to lapses in judgment and breakdowns resulting from human failures. Internal control over financial reporting also can be circumvented by collusion or improper management override. Because of these limitations, there is a risk that material misstatements may not be prevented or detected on a timely basis by internal control over financial reporting. However, these inherent limitations are known features of the financial reporting process. Therefore, it is possible to design into the process safeguards to reduce, though not eliminate, this risk.
Management conducted an evaluation of the effectiveness of the Company’s internal control over financial reporting based on the criteria set forth in the Internal Control—Integrated Framework issued in 2013 by the Committee of Sponsoring Organizations of the Treadway Commission (COSO). Based on this evaluation, management concluded that the Company’s internal control over financial reporting was effective as of December 31, 2018.2019.
PricewaterhouseCoopers LLP has issued a report on the effectiveness of the Company’s internal control over financial reporting as of December 31, 2018,2019, which is included in Part II, Item 8 of this annual report.
Changes in Internal Control over Financial Reporting
There have been no changes in internal control over financial reporting during the quarter ended December 31, 20182019 that have materially affected, or are reasonably likely to materially affect, the Company’s internal control over financial reporting.
ITEM 9B. OTHER INFORMATION
Not applicable.
PART III
ITEM 10. DIRECTORS, EXECUTIVE OFFICERS AND CORPORATE GOVERNANCE
The information called for by this item will be contained in the definitive Proxy Statement to be distributed in connection with our 20192020 annual general meeting of shareholders under the captions “Director Nominees,” “Election of Directors”, “Other Executive Officers”, “Meetings of the Board and Committees” and “Section 16(a) Beneficial Ownership Reporting Compliance” and is incorporated into this document by reference.
We have adopted a Code of Business Conduct (the “Code”) that applies to all directors, employees, including our principal executive officer and principal financial and accounting officer. The Code satisfies the SEC’s definition of a “Code of Ethics” and is posted on our website at www.nabors.com. We intend to disclose on our website any amendments to the Code and any waivers of the Code that apply to our principal executive officer, principal financial officer, or principal accounting officer.
On June 29, 2018,July 5, 2019, we filed with the New York Stock Exchange the Annual CEO Certification regarding our compliance with the Exchange’s Corporate Governance listing standards as required by Section 303A-12(a) of the Exchange’s Listed Company Manual.
ITEM 11. EXECUTIVE COMPENSATION
The information called for by this item will be contained in various sections of our definitive Proxy Statement to be distributed in connection with our 20192020 annual general meeting of shareholders, including under the captioncaptions “Compensation Discussion and Analysis,” “2018“2019 Summary Compensation Table,” 20182019 Grants of Plan-Based Awards,” “2018“2019 Outstanding Equity Awards at Fiscal Year End,” “2018“2019 Option Exercises and Shares Vested,” “2018“2019 Non-Qualified Deferred Compensation,” “Required Pay-Ratio Disclosure,” “2018“2019 Potential Payouts upon Termination or Change in Control,” “Non-Employee Director Compensation,” “Risk Assessment,” “Compensation Committee Interlocks and Insider Participation,” and “Compensation Committee Report,” and except as specified in the following sentence, is incorporated into this document by reference. Information in our definitive Proxy Statement not deemed to be “soliciting material” or “filed” with the SEC under its rules, including the Compensation Committee Report, is not deemed to be incorporated by reference.
ITEM 12. SECURITY OWNERSHIP OF CERTAIN BENEFICIAL OWNERS AND MANAGEMENT AND RELATED SHAREHOLDER MATTERS
The information called for by this item will be contained in our definitive Proxy Statement to be distributed in connection with our 20192020 annual general meeting of shareholders, including under the caption captions “Share Ownership” and “Securities Authorized for Issuance under Equity Compensation Plans” and is incorporated into this document by reference.
ITEM 13. CERTAIN RELATIONSHIPS AND RELATED TRANSACTIONS AND DIRECTOR INDEPENDENCE
The information called for by this item will be contained in our definitive Proxy Statement to be distributed in connection with our 20192020 annual general meeting of shareholders, including under the captioncaptions “Certain Relationships and Related Transactions” and “Overview of Key Governance Topics – Director Independence,” is incorporated into this document by reference.
ITEM 14. PRINCIPAL ACCOUNTING FEES AND SERVICES
The information called for by this item will be contained in our definitive Proxy Statement to be distributed in connection with our 20192020 annual general meeting of shareholders, including under the caption “Independent Auditor Fees” and is incorporated into this document by reference.
PART IV
ITEM 15. EXHIBITS, FINANCIAL STATEMENT SCHEDULES
(a)The following documents are filed as part of this annual report:
(1)Financial Statements
(a) | The following documents are filed as part of this annual report: |
(2)Financial Statement Schedule
| (2) | Financial Statement Schedule |
All other supplemental schedules are omitted because of the absence of the conditions under which they would be required or because the required information is included in the financial statements or related notes.
(b)Exhibit Index
See the Exhibit Index for a list of those exhibits filed herewith, which Exhibit Index also includes and identifies management contracts or compensatory plans or arrangements required to be filed as exhibits to this Form 10-K by Item 601 of Regulation S-K.
ITEM 16. FORM 10-K SUMMARY
None.
SCHEDULE II — VALUATION AND QUALIFYING ACCOUNTS
Years Ended December 31, 2019, 2018 2017 and 20162017
| | | | | | | | | | | | | | |
| | | | Charged to | | | | | | | | |
| | Balance at | | Costs and | | Charged to | | | | Balance at | | |
| | Beginning | | Other | | Other | | | | End of | | |
| | of Period | | Deductions | | Accounts | | Deductions | | Period | | |
| | (In thousands) | | |
| | | | | | | | | | | | | | |
| | | | | Charged to | | | | | | | |
| | | Balance at | | Costs and | | Charged to | | | | Balance at | |
| | | Beginning | | Other | | Other | | | | End of | |
| | | of Period | | Deductions | | Accounts | | Deductions | | Period | |
| | | (In thousands) | |
2019 | | | | | | | | | | | | | | |
Allowance for doubtful accounts | | | $ | 41,207 | | 17,529 | | (51) | | 3,097 | | $ | 61,782 | |
Inventory reserve | | | $ | 27,854 | | 11,808 | | — | | (4,614) | | $ | 35,048 | |
Valuation allowance on deferred tax assets | | | $ | 1,917,390 | | — | | 862,611 | | — | | $ | 2,780,001 | |
2018 | | | | | | | | | | | | | | | | | | | | | | | | | | |
Allowance for doubtful accounts | | $ | 44,376 | | 3,024 | | (226) | | (5,967) | | $ | 41,207 | | | $ | 44,376 | | 3,024 | | (226) | | (5,967) | | $ | 41,207 | |
Inventory reserve | | $ | 28,934 | | — | | 14,688 | | (15,768) | | $ | 27,854 | | | $ | 28,934 | | — | | 14,688 | | (15,768) | | $ | 27,854 | |
Valuation allowance on deferred tax assets | | $ | 1,869,490 | | — | | 47,900 | | — | | $ | 1,917,390 | | | $ | 1,869,490 | | — | | 47,900 | | — | | $ | 1,917,390 | |
2017 | | | | | | | | | | | | | | | | | | | | | | | | | | |
Allowance for doubtful accounts | | $ | 43,757 | | 2,544 | | 86 | | (2,011) | | $ | 44,376 | | | $ | 43,757 | | 2,544 | | 86 | | (2,011) | | $ | 44,376 | |
Inventory reserve | | $ | 26,537 | | 5,897 | | — | | (3,500) | | $ | 28,934 | | | $ | 26,537 | | 5,897 | | — | | (3,500) | | $ | 28,934 | |
Valuation allowance on deferred tax assets | | $ | 1,807,728 | | — | | 61,762 | | — | | $ | 1,869,490 | | | $ | 1,807,728 | | — | | 61,762 | | — | | $ | 1,869,490 | |
2016 | | | | | | | | | | | | | | |
Allowance for doubtful accounts | | $ | 44,553 | | 19,132 | | (58) | | (19,870) | | $ | 43,757 | | |
Inventory reserve | | $ | 46,813 | | 13,587 | | — | | (33,863) | | $ | 26,537 | | |
Valuation allowance on deferred tax assets | | $ | 1,560,162 | | — | | 247,566 | | — | | $ | 1,807,728 | | |
Exhibit No. |
| Description |
|---|
Exhibit No.2.1
| | Description
|
2.1 | | Agreement and Plan of Merger, dated as of June 25, 2014, by and among Nabors Industries Ltd., Nabors Red Lion Limited and C&J Energy Services, Inc. (incorporated by reference to Exhibit 10.1 to our Form 8-K (File No. 001-32657) filed with the SEC on July 1, 2014).
|
2.2 | | Separation Agreement, dated as of June 25, 2014, by and between Nabors Industries Ltd. and Nabors Red Lion Limited (incorporated by reference to Exhibit 10.2 to our Form 8-K (File No. 001-32657) filed with the SEC on July 1, 2014).
|
2.3 | | Amendment No. 1 to the Agreement and Plan of Merger, by and among Nabors Industries Ltd., Nabors Red Lion Limited, C&J Energy Services, Inc., Nabors Merger Co. and CJ Holding Co. (incorporated by reference to Exhibit 10.2 of our Form 8-K (File No. 001-32657) filed with the SEC on February 9, 2015).
|
2.4 | | Amendment No. 1 to the Separation Agreement, by and between Nabors Industries Ltd. and Nabors Red Lion Limited (incorporated by reference to Exhibit 10.1 of our Form 8-K (File No. 001-32657) filed with the SEC on February 9, 2015).
|
2.5 | | Arrangement Agreement, dated August 13, 2017, by and among Nabors Industries Ltd., Nabors Maple Acquisition Ltd., and Tesco Corporation (incorporated by reference to Exhibit 2.1 to our Form 8-K (File No. 001-32657) filed with the SEC on August 16, 2017). |
3.1 | | Memorandum of Association of Nabors Industries Ltd. (incorporated by reference to Annex II to the proxy statement/prospectus included in our Registration Statement on Form S-4 (File No. 333-76198) filed with the SEC on May 10, 2002, as amended). |
3.2 | | Amended and Restated Bye-laws of Nabors Industries Ltd. (incorporated by reference to Exhibit 3.2 to our Form S-8 (File No. 333-212781) filed with the SEC on July 29, 2016). |
3.2(a) | | Certificate of Designations of the 6.00% Mandatory Convertible Preferred Shares, Series A of Nabors Industries Ltd. (incorporated by reference to Exhibit 3.1 to our Form 8-K (File No. 001-32657) filed with the SEC on May 14, 2018). |
4.1 | | Indenture, dated February 20, 2008, among Nabors Industries, Inc., Nabors Industries Ltd. and Wells Fargo Bank, N.A. (incorporated by reference to Exhibit 4.2 to Nabors Industries Ltd.’s Current Report on Form 8-K (File No. 001-32657) filed with the Commission on February 25, 2008).Description of Share Capital.*
|
4.2 | | Indenture, dated as of January 12, 2009, among Nabors Industries, Inc., Nabors Industries Ltd. and Wells Fargo Bank, National Association, as trustee, with respect to Nabors Industries, Inc.’s 9.25% Senior Notes due 2019 (including form of 9.25% Senior Note due 2019) (incorporated by reference to Exhibit 4.2 to our Form 8-K (File No. 001-32657) filed with the SEC on January 14, 2009).
|
4.3 | | Indenture, dated as of September 14, 2010, among Nabors Industries, Inc., Nabors Industries Ltd., Wilmington Trust Company, as trustee, and Citibank, N.A. as securities administrator, with respect to Nabors Industries, Inc.’s 5.0% Senior Notes due 2020 (including form of 5.0% Senior Note due 2020) (incorporated by reference to Exhibit 4.2 to our Form 8-K (File No. 001-32657) filed with the SEC on September 15, 2010). |
4.44.3 | | Indenture, dated as of August 23, 2011, among Nabors Industries, Inc., Nabors Industries Ltd., Wilmington Trust, National Association, as trustee and Citibank, N.A. as securities administrator, with respect to Nabors Industries, Inc.’s 4.625% Senior Notes due 2021 (including form of 4.625% Senior Note due 2021) (incorporated by reference to Exhibit 4.1 to our Form 8-K (File No. 001-32657) filed with the SEC on August 24, 2011). |
4.54.4 | | Indenture related to the 2.35% Senior Notes due 2016 and 5.10% Senior Notes due 2023, dated as of September 12, 2013, among Nabors Industries, Inc. as Issuer, Nabors Industries Ltd. as Guarantor, Wilmington Trust, National Association as Trustee and Citibank, N.A. as Securities Administrator (including form of 2.35% Senior Note due 2016 and form of 5.10% Senior Note due 2023) (incorporated by reference to Exhibit 4.1 to Nabors Industries Ltd. Form 8-K (File No. 001-32657) filed with the SEC on September 13, 2013). |
Exhibit No.
| | Description
|
4.64.5 | | Indenture, dated as of December 9, 2016 by and among Nabors Industries, Inc., as issuer, Nabors Industries Ltd., as guarantor, Citibank, N.A., as securities administrator and Wilmington Trust, National Association, as trustee with respect to Nabors Industries, Inc.’s 5.50% Senior Notes due 2023 (incorporated by reference to Exhibit 4.1 to our Form 8-K (File No. 001-32657) filed with the SEC on December 9, 2016). |
4.74.6 | | First Supplemental Indenture to the Indenture, dated January 22, 2020, among Nabors Industries, Inc., as issuer, Nabors Industries Ltd., as guarantor, Wilmington Trust, National Associate, as trustee, and Citibank, N.A., as securities administrator (incorporated by reference to Exhibit 10.1 to our Form 8-K (File No. 001-32657) filed with the SEC on January 22, 2020). |
4.7 | | Indenture, dated as of January 10, 2020 by and among Nabors Industries Ltd., as Issuer, Nabors Industries, Inc., as Guarantor, Nabors International Finance Inc., as Guarantor, Nabors Lux Finance 1, as Guarantor, Nabors Global Holdings Limited, as Guarantor, Nabors Drilling Holdings Inc., as Guarantor, Nabors Holdings Ltd., as Guarantor, and Wells Fargo Bank, N.A., as trustee, including as exhibits thereto the form of Notes (incorporated by reference to Exhibit 4.1 to our form 8-K (File No. 00132657) filed with the SEC on January 14, 2020). |
Exhibit No. |
| Description |
|---|
4.8 | | Indenture, dated as of January 13, 2017, by and among Nabors Industries, Inc., as issuer, Nabors Industries Ltd., as guarantor, Citibank, N.A., as securities administrator and Wilmington Trust, National Association, as trustee with respect to Nabors Industries, Inc.’s 0.75% Exchangeable Senior Notes due 2024 (incorporated by reference to Exhibit 4.1 to our Form 8-K (File No. 001-32657) filed with the SEC on January 13, 2017). |
4.84.9 | | Indenture, dated as of January 23, 2018, by and among Nabors Industries, Inc., Nabors Industries Ltd., as Guarantor, Citibank, N.A., as securities administrator and Wilmington Trust National Association, as trustee with respect to Nabors Industries, Inc.’s 5.75% Senior Notes due 2025 (incorporated by reference to Exhibit 4.1 to our Form 8-K (File No. 001-32657) filed with the SEC on January 23, 2018). |
4.94.10 | | Registration Rights Agreement relating to the 5.75% Senior Notes due 2025, dated as of January 23, 2018, by and among Nabors Industries, Inc. and the certain holders identified therein (incorporated by reference to Exhibit 4.2 to Nabors Industries Ltd.’s Form 8-K (file No. 001-32657) filed with the Commission on January 23, 2018). |
10.1 | | Shareholders’ Agreement, dated October 31, 2016, between Saudi Aramco Development Company and Nabors International Netherlands B.V. (incorporated by reference to Exhibit 10.20 to our Form 10-K (File No. 001-32657) filed with the SEC on February 28, 2017).
|
10.2 | | Purchase Agreement, dated January 16, 2018, among Nabors Industries, Inc., Nabors Industries Ltd. and Goldman Sachs & Co. LLC, Citigroup Global Markets Inc., Deutsche Bank Securities Inc., Morgan Stanley & Co. LLC and Wells Fargo Securities, LLC as Initial Purchasers (incorporated by reference to Exhibit 10.1 to Nabors Industries Ltd.’s Form 8-K (File No. 001-32657) filed with the Commission on January 17, 2018).
|
10.3 | | Call Option Transaction Confirmation, dated as of January 9, 2017, between Nabors Industries Ltd., Nabors Industries, Inc. and Citigroup Global Markets Inc. (incorporated by reference to Exhibit 10.2 to our Form 8-K (File No. 001-32657) filed with the SEC on January 11, 2017). |
10.410.2 | | Call Option Transaction Confirmation, dated as of January 9, 2017, between Nabors Industries Ltd., Nabors Industries, Inc. and Goldman, Sachs & Co. (incorporated by reference to Exhibit 10.3 to our Form 8-K (File No. 001-32657) filed with the SEC on January 11, 2017). |
10.510.3 | | Additional Call Option Transaction Confirmation, dated as of January 10, 2017, between Nabors Industries Ltd., Nabors Industries, Inc. and Citigroup Global Markets Inc. (incorporated by reference to Exhibit 10.1 to our Form 8-K (File No. 001-32657) filed with the SEC on January 13, 2017). |
10.610.4 | | Additional Call Option Transaction Confirmation, dated as of January 10, 2017, between Nabors Industries Ltd., Nabors Industries, Inc. and Goldman, Sachs & Co. (incorporated by reference to Exhibit 10.2 to our Form 8-K (File No. 001-32657) filed with the SEC on January 13, 2017). |
10.710.5 | | Shareholders’ Agreement, dated October 31, 2016, between Saudi Aramco Development Company and Nabors International Netherlands B.V. (incorporated by reference to Exhibit 10.20 to our Form 10-K (File No. 001-32657) filed with the SEC on February 28, 2017). |
10.6 | | Credit Agreement, dated as of November 29, 2012, among Nabors Industries, Inc. as US borrower, Nabors Canada as Canadian borrower, Nabors Industries Ltd. as guarantor, HSBC Bank Canada as Canadian lender, the other lenders party thereto, Mizuho Corporate Bank, Ltd. and HSBC Bank USA, N.A. as documentation agents, HSBC Bank USA, N.A. as syndication agent and Citibank, N.A. as administrative agent for the US lenders (incorporated by reference to Exhibit 10.1 to our Form 8-K (File No. 001-32657) filed with the SEC on November 30, 2012). |
Exhibit No.
| | Description
|
10.7 (a)10.6(a)
| | Amendment No. 1, dated as of July 14, 2015, to Credit Agreement, dated as of November 29, 2012, among Nabors Industries, Inc. as US Borrower, Nabors Canada as Canadian Borrower, Nabors Industries Ltd. as Guarantor, HSBC Bank Canada as Canadian Lender, the other lenders party thereto, Mizuho Corporate Bank, Ltd. and HSBC Bank USA, N.A. as Documentation Agents, HSBC Bank USA, N.A. as Syndication Agent and Citibank, N.A. as Administrative Agent for the US Lenders (incorporated by reference to Exhibit 10.1 to our Form 8-K (File No. 001-32657) filed with the SEC on July 15, 2015). |
10.7(b)10.6(b)
| | Amendment No. 2, dated as of March 23, 2016, to Credit Agreement, dated as of March 23, 2016, among Nabors Industries, Inc. as US Borrower, Nabors Canada as Canadian Borrower, Nabors Industries Ltd. as Guarantor, HSBC Bank Canada as Canadian Lender, the other lenders party thereto, Mizuho Corporate Bank, Ltd. and HSBC Bank USA, N.A. as Documentation Agents, HSBC Bank USA, N.A. as Syndication Agent and Citibank, N.A. as Administrative Agent for the US Lenders.*Lenders (incorporated by reference to Exhibit 10.7(b) to our Form 10-K (File No. 001-32657) filed with the SEC on February 28, 2019). |
Exhibit No. |
| Description |
|---|
10.7(c)10.6(c)
| | Amendment No. 3 to Credit Agreement, dated as of October 11, 2018, among Nabors Industries, Inc., Nabors Drilling Canada Limited, Nabors Industries Ltd., HSBC Bank Canada, the other lenders party thereto, Citibank, N.A., and Wilmington Trust, National Association, as successor administrative agent (incorporated by reference to Exhibit 10.2 to our Form 8-K (File No. 001-32657) filed with the SEC on October 12, 2018). |
10.810.7 | | Credit Agreement, dated as of October 11, 2018, among Nabors Industries, Inc., as US Borrower, Nabors Drilling Canada Limited, as Canadian Borrower, Nabors Industries Ltd., as Holdings, the other Guarantors from time to time party thereto, HSBC Bank Canada, as Canadian Lender, the Issuing Banks and other Lenders party thereto and Citibank, N.A., as Administrative Agent solely for the US Lenders and not for the Canadian Lender (incorporated by reference to Exhibit 10.1 to our Form 8-K (File No. 001-32657) filed with the SEC on October 12, 2018). |
10.910.7(a) | | First Amendment to 2018 Credit Agreement, dated as of October 25, 2019, among Nabors Industries, Inc., as US Borrower, Nabors Drilling Canada Limited, as Canadian Borrower, Nabors Industries Ltd., as Holdings, the other Guarantors from time to time party thereto, HSBC Bank Canada, as Canadian Lender, the Issuing Banks and other Lenders party thereto and Citibank, N.A., as Administrative Agent solely for the US Lenders and not for the Canadian Lender (incorporated by reference to Exhibit 10.4 to our form 10-Q 9File No. 001-32657) filed with the SEC on November 1, 2019). |
10.7(b) | | Second Amendment to 2018 Credit Agreement, dated as of October 13, 2019, by and among Nabors Industries, Inc., as US Borrower, Nabors Drilling Canada Limited, as Canadian Borrower, Nabors Industries Ltd., as Holdings, the other Guarantors from time to time party thereto, HSBC Bank Canada, as Canadian Lender, the Issuing Banks and other Lenders party thereto and Citibank, N.A., as Administrative Agent solely for the US Lenders (incorporated by reference to Exhibit 10.1 to our Form 8-K (File No. 001-32657) filed with the SEC on December 16, 2019). |
10.8 | | Receivables Purchase Agreement dated as of September 13, 2019, by and among Nabors A.R.F., LLC, certain operating subsidiaries of Nabors Industries Ltd., and Nabors Industries, Inc., (incorporated by reference to Exhibit 10.1 to our Form 8-K (File No. 001-32657) filed with the SEC on September 18, 2019). |
10.8(a) | | Receivables Sale Agreement dated as of September 13, 2019, by and among Nabors A.R.F., LLC, , Nabors Industries, Inc., the purchasers party thereto, and Wells Fargo Bank, N.A., as Administrative Agent (incorporated by reference to Exhibit 10.2 to our Form 8-K (File No. 001-32657) filed with the SEC on September 18, 2019). |
10.8(b) | | Indemnification Agreement, dated as of September 13, 2019, between Nabors Industries Ltd. and Wells Fargo Bank, N.A. (incorporated by reference to Exhibit 10.3 to our Form 8-K (File No. 001-32657) filed with the SEC on September 18, 2019). |
10.9 | | Term Loan Agreement, dated February 6, 2015, among Nabors Industries, Inc., as borrower, Nabors Industries Ltd., as guarantor, the lenders party thereto, HSBC Bank USA, N.A. and Wells Fargo Bank N.A., as documentation agents, Mizuho Bank, Ltd., as syndication agent and Citibank, N.A. as administrative agent for the lenders (incorporated by reference to Exhibit 10.3 to our Form 8-K (File No. 001-32657) filed with the SEC on February 9, 2015). |
10.10 | | Term Loan Agreement, dated as of February 6, 2015, among Nabors Industries, Inc., as borrower, Nabors Industries Ltd., as guarantor, the lenders party thereto, HSBC Bank USA, N.A. and Wells Fargo Bank, N.A., as documentation agents, Mizuho Bank, Ltd., as syndication agent and Citibank, N.A, as administrative agent for the lenders (incorporated by reference to Exhibit 10.3 to our Form 8-K (File No. 001-32657) filed with the SEC on February 9, 2015). |
Exhibit No. |
| Description |
|---|
10.11 | | Term Loan Agreement, dated as of September 29, 2015, among Nabors Industries, Inc., as borrower, Nabors Industries Ltd., as guarantor, the lenders party thereto, Mizuho Bank, Ltd., as documentation agent, The Bank of Tokyo-Mitsubishi UFJ, Ltd., as syndication agent, and Bank of America, N.A., as administrative agent (incorporated by reference to Exhibit 10.1 to our Form 8-K (File No. 001-32657) filed with the SEC on October 1, 2015). |
10.12(+) | | Executive Employment Agreement by and among Nabors Industries Ltd., Nabors Industries, Inc. and Anthony G. Petrello, effective as of January 1, 2013 (incorporated by reference to Exhibit 99.1 to our Form 8-K (File No. 001-32657) filed with the SEC on March 11, 2013). |
10.12(a)(+) | | First Amendment to Executive Employment Agreement, dated December 19, 2014, among Nabors Industries Ltd., Nabors Industries, Inc. and Anthony G. Petrello (incorporated by reference to Exhibit 99.1 to our Form 8-K (File No. 001-32657) filed with the SEC on December 19, 2014). |
10.12(b)(+) | | Second Amendment to Executive Employment Agreement, dated as of June 5, 2015, among Nabors Industries Ltd., Nabors Industries, Inc. and Anthony G. Petrello (incorporated by reference to Exhibit 99.1 to our Form 8-K (File No. 001-32657) filed with the SEC on June 8, 2015). |
Exhibit No.
| | Description
|
10.12(c)(+) | | Third Amendment to Executive Employment Agreement, dated as of December 31, 2015, among Nabors Industries Ltd., Nabors Industries, Inc. and Anthony G. Petrello (incorporated by reference to Exhibit 99.1 to our Form 8-K (File No. 001-32657) filed with the SEC on January 5, 2016). |
10.12(d)(+) | | Fourth Amendment to Executive Employment Agreement, dated June 10, 2016, among Nabors Industries Ltd., Nabors Industries, Inc. and Anthony G. Petrello (incorporated by reference to Exhibit 99.1 to our Form 8-K (File No. 001-32657) filed with the SEC on June 13, 2016). |
10.12(e)(+) | | Fifth Amendment to Executive Employment Agreement, dated October 15, 2018, among Nabors Industries Ltd., Nabors Industries, Inc. and Anthony G. Petrello (incorporated by reference to Exhibit 10.3 to our Form 10-Q (File No. 001-32657) filed with the SEC on November 7, 2018). |
10.12(f)(+) | | Sixth Amendment to Executive Employment Agreement, dated December 31, 2018, among Nabors Industries Ltd., Nabors Industries, Inc. and Anthony G. Petrello (incorporated by reference to Exhibit 10.1 to our Form 8-K (File No. 001-32657) filed with the SEC on January 4, 2019). |
10.13(+10.12(g)(+)
| | Seventh Amendment to Executive Employment Agreement, by anddated January 2, 2020, among Nabors Industries Ltd., Nabors Industries, Inc. and William Restrepo, effective as of March 3, 2014Anthony G. Petrello (incorporated by reference to Exhibit 10.1 to our Form 8-K (File No. 001-32657) filed with the SEC on March 4, 2014)January 8, 2020). |
10.13(a)(+10.13(+)
| | First Amendment toAmended and Restated Executive Employment Agreement, dated December 19, 2014,January 2, 2020, among Nabors Industries Ltd., Nabors Industries, Inc. and William Restrepo (incorporated by reference to Exhibit 99.2 to our Form 8-K (File No. 001-32657) filed with the SEC on December 19, 2014).
|
10.13(b)(+)
| | Second Amendment to Executive Employment Agreement, dated as of June 5, 2015, among Nabors Industries Ltd., Nabors Industries, Inc. and William Restrepo (incorporated by reference to Exhibit 99.2 to our Form 8-K (File No. 001-32657) filed with the SEC on June 8, 2015).
|
10.13(c)(+)
| | Third Amendment to Executive Employment Agreement, dated as of December 31, 2015, among Nabors Industries Ltd., Nabors Industries, Inc. and William Restrepo (incorporated by reference to Exhibit 99.2 to our Form 8-K (File No. 001-32657) filed with the SEC on January 5, 2016).
|
10.13(d)(+)
| | Fourth Amendment to Executive Employment Agreement, dated June 10, 2016, among Nabors Industries Ltd., Nabors Industries, Inc. and William Restrepo (incorporated by reference to Exhibit 99.2 to our Form 8-K (File No. 001-32657) filed with the SEC on June 13, 2016).
|
10.13(e)(+)
| | Fifth Amendment to Executive Employment Agreement, dated December 31, 2018, among Nabors Industries Ltd., Nabors Industries, Inc. and William RestrepoRestrepo. (incorporated by reference to Exhibit 10.2 to our Form 8-K (File No. 001-32657) filed with the SEC on January 4, 2019)8, 2020).
|
10.14(+) | | Form of Indemnification Agreement entered into between Nabors Industries Ltd. and the directors and executive officers (incorporated by reference to Exhibit 10.28 to our Form 10-K (File No. 000-49887) filed with the SEC on March 31, 2003). |
10.15(+) | | Nabors Industries Ltd. 2016 Stock Plan (incorporated by reference to Exhibit 99.1 to our Form S-8 (File No. 333-212781) filed with the SEC on July 29, 2016). |
10.15(a)(+) | | Amendment No. 1 to Nabors Industries Ltd. 2016 Stock Plan (incorporated by reference to Annex B to our Definitive Proxy Statement (File No. 001-32657) filed with the SEC on April 26, 2018). |
10.15(b)(+) | | Amendment No. 2 to Nabors Industries Ltd. 2016 Stock Plan (incorporated by reference to Exhibit 10.2 to our Form 8-K (File No. 001-32657) filed with the SEC on February 25, 2019). |
10.15(c)(+) | | Form of Stock Option Agreement – Others, pursuant to the 2016 Stock Plan (incorporated by reference to Exhibit 10.1(b) to our Form 10-Q (File No. 001-32657) filed with the SEC on April 28, 2017). |
10.15(d)(+) | | Form of Restricted Stock Agreement – Others, pursuant to the 2016 Stock Plan (incorporated by reference to Exhibit 10.1(c) to our Form 10-Q (File No. 001-32657) filed with the SEC on April 28, 2017). |
10.15(e)(+) | | Form of Restricted Stock Agreement – Directors, pursuant to the 2016 Stock Plan (incorporated by reference to Exhibit 10.2 to our Form 10-Q (File No. 001-32657) filed with the SEC on August 1, 2018). |
| Exhibit No. | |
| | Description |
|---|
10.15(f)(+) | | Form of Nabors Industries Ltd. TSR Stock Grant Agreement – Anthony G. Petrello, pursuant to the 2016 Stock Plan (incorporated by reference to Exhibit 10.1(d) to our Form 10-Q (File No. 001-32657) filed with the SEC on April 28, 2017). |
10.15(g)(+) | | Form of Nabors Corporate Services, Inc. TSR Stock Grant Agreement – Anthony G. Petrello, pursuant to the 2016 Stock Plan (incorporated by reference to Exhibit 10.1(e) to our Form 10-Q (File No. 001-32657) filed with the SEC on April 28, 2017). |
10.15(h)(+) | | Form of Nabors Industries Ltd. TSR Stock Grant Agreement – William Restrepo, pursuant to the 2016 Stock Plan (incorporated by reference to Exhibit 10.1(f) to our Form 10-Q (File No. 001-32657) filed with the SEC on April 28, 2017). |
10.15(i)(+) | | Form of Nabors Corporate Services, Inc. TSR Grant Agreement – William Restrepo, pursuant to the 2016 Stock Plan (incorporated by reference to Exhibit 10.1(g) to our Form 10-Q (File No. 001-32657) filed with the SEC on April 28, 2017). |
10.15(j)(+) | | Form of Nabors Industries Ltd. Restricted Stock Agreement – Anthony G. Petrello, pursuant to the 2016 Stock Plan (incorporated by reference to Exhibit 10.1(h) to our Form 10-Q (File No. 001-32657) filed with the SEC on April 28, 2017). |
10.15(k)(+) | | Form of Nabors Corporate Services, Inc. Restricted Stock Agreement – Anthony G. Petrello, pursuant to the 2016 Stock Plan (incorporated by reference to Exhibit 10.1(i) to our Form 10-Q (File No. 001-32657) filed with the SEC on April 28, 2017). |
10.15(l)(+) | | Form of Nabors Industries Ltd. Restricted Stock Agreement – William Restrepo, pursuant to the 2016 Stock Plan (incorporated by reference to Exhibit 10.1(j) to our Form 10-Q (File No. 001-32657) filed with the SEC on April 28, 2017). |
10.15(m)(+) | | Form of Nabors Corporate Services, Inc. Restricted Stock Agreement – William Restrepo, pursuant to the 2016 Stock Plan (incorporated by reference to Exhibit 10.1(k) to our Form 10-Q (File No. 001-32657) filed with the SEC on April 28, 2017). |
10.15(n) | | Form of Nabors Industries Ltd. TSR Grant Agreement – Executive, pursuant to the 2016 Stock Plan and the 2013 Stock Plan.*Plan (incorporated by reference to Exhibit 10.15(n) to our Form 10-K (File No. 001-32657) filed with the SEC on February 28, 2019). |
10.15(o) | | Form of Nabors Corporate Services, Inc..Inc. TSR Grant Agreement – Executive, pursuant to the 2016 Stock Plan and the 2013 Stock Plan.*Plan (incorporated by reference to Exhibit 10.15(o) to our Form 10-K (File No. 001-32657) filed with the SEC on February 28, 2019). |
10.15(p) | | Form of Nabors Industries Ltd. TSR Stock Grant Agreement – Anthony G. Petrello (2020) (incorporated by reference to Exhibit 10.3 to our form 8-K (File No. 001-32657) filed with the SEC on January 8, 2020). |
10.15(q) | | Form of Nabors Corporate Services, Inc. TSR Stock Grant Agreement – Anthony G. Petrello (2020) (incorporated by reference to Exhibit 10.4 to our form 8-K (File No. 001-32657) filed with the SEC on January 8, 2020). |
10.15(r) | | Form of CEO Performance Based Stock Restricted Unit Agreement (2020) (incorporated by reference to Exhibit 10.5 to our form 8-K (File No. 001-32657) filed with the SEC on January 8, 2020). |
10.15(s) | | Form of CFO Performance Based Stock Restricted Unit Agreement (2020) (incorporated by reference to Exhibit 10.6 to our form 8-K (File No. 001-32657) filed with the SEC on January 8, 2020). |
10.16(+) | | Nabors Industries Ltd. 2013 Stock Plan (incorporated by reference to Appendix B of Nabors Industries Ltd.’s Definitive Proxy Statement on Schedule 14A (File No. 001-32657) filed with the SEC on April 30, 2013). |
10.16(a)(+) | | Amendment No. 1 to Nabors Industries Ltd. 2013 Stock Plan (incorporated by reference to Exhibit 10.1 to our Form 8-K (File No. 001-32657) filed with the SEC on February 25, 2019). |
10.16(b)(+) | | Form of Stock Option Agreement—Others, pursuant to the 2013 Stock Plan (incorporated by reference to Exhibit 10.8(a) to our Form 10-K (File No. 001-32657) filed with the SEC on March 3, 2014). |
Exhibit No.
| | Description
|
10.16(g)(+) | | Form of Nabors Corporate Services, Inc. Restricted Stock Agreement—Anthony G. Petrello, pursuant to the 2013 Stock Plan (incorporated by reference to Exhibit 10.8(f) to our Form 10-K (File No. 001-32657) filed with the SEC on March 3, 2014). |
10.16(h)(+) | | Form of TSR Stock Grant Agreement—William Restrepo, pursuant to the 2013 Stock Plan (incorporated by reference to Exhibit 10.1 to the Form 10-Q (File No. 001-32657) filed with the SEC on May 9, 2014). |
10.16(i)(+) | | Form of Nabors Industries Ltd. Restricted Stock Agreement—William Restrepo, pursuant to the 2013 Stock Plan (incorporated by reference to Exhibit 10.1 to the Form 10-Q (File No. 001-32657) filed with the SEC on May 9, 2014). |
10.16(j)(+) | | Form of Nabors Corporate Services, Inc. Restricted Stock Agreement—William Restrepo, pursuant to the 2013 Stock Plan (incorporated by reference to Exhibit 10.3 to the Form 10-Q (File No. 001-32657) filed with the SEC on May 9, 2014). |
10.17(+) | | Form of Restricted Stock Award—Isenberg/Petrello (incorporated by reference to Exhibit 10.01 to Nabors Industries Ltd.’s Form 8-K, File No. 000-49887, filed March 2, 2005). |
10.17(a)(+) | | Form of Restricted Stock Award—Others (incorporated by reference to Exhibit 10.02 to Nabors Industries Ltd.’s Form 8-K, File No. 000-49887, filed March 2, 2005). |
10.17(b)(+) | | Form of Stock Option Agreement—Petrello/Isenberg (incorporated by reference to Exhibit 10.03 to our Form 8-K (File No. 000-49887) filed with the SEC on March 2, 2005). |
10.17(c)(+) | | Form of Stock Option Agreement—Others (incorporated by reference to Exhibit 10.04 to our Form 8-K (File No. 000-49887) filed with the SEC on March 2, 2005). |
10.18(+) | | Nabors Industries Ltd. Amended and Restated 2003 Employee Stock Plan (incorporated by reference to Exhibit A of our Proxy Statement (File No. 001-32657) filed with the SEC on May 4, 2006). |
10.19(+) | | Amended and Restated 1999 Stock Option Plan for Non-Employee Directors (amended on May 2, 2003) (incorporated by reference to Exhibit 10.29 to our Form 10-Q (File No. 000-49887) filed with the SEC on May 12, 2003). |
10.19(a)(+) | | Form of Stock Option Agreement to the Amended and Restated 1999 Stock Option Plan for Non-Employee Directors (incorporated by reference to Exhibit 10.2 to our Form 10-Q (File No. 001-32657) filed with the SEC on April 28, 2017). |
10.20(+) | | Nabors Industries, Inc. Executive Deferred Compensation Plan (as Amended and Restated Effective as of April 1, 2017) (incorporated by reference to Exhibit 10.3(a) to our Form 10-Q (File No. 001-32657) filed with the SEC on April 28, 2017). |
10.20(a)(+) | | Amendment No. 1 to Nabors Industries, Inc. Executive Deferred Compensation Plan (incorporated by reference to Exhibit 10.5 to our form 10-Q (File No. 001-32657) filed with the SEC on November 1, 2019). |
10.20(b)(+) | | Form of Deferred Bonus Agreement under the Nabors Industries, Inc. Executive Deferred Compensation Plan (incorporated by reference to Exhibit 10.3(b) to our Form 10-Q (File No. 001-32657) filed with the SEC on April 28, 2017). |
Exhibit No. | �� | Description |
|---|
10.21(+) | | Nabors Industries, Inc. Deferred Compensation Plan (as Amended and Restated Effective as of January 1, 2017) (incorporated by reference to Exhibit 10.4 to our Form 10-Q (File No. 001-32657) filed with the SEC on April 28, 2017). |
2110.21(a)(+) | | Significant Subsidiaries.*Amendment No. 1 to Nabors Industries, Inc. Deferred Compensation Plan (incorporated by reference to Exhibit 10.6 to our form 10-Q (File No. 001-32657) filed with the SEC on November 1, 2019).
|
23.110.21(b)(+) | | Amendment No. 2 to Nabors Industries, Inc. Deferred Compensation Plan (incorporated by reference to Exhibit 10.7 to our form 10-Q (File No. 001-32657) filed with the SEC on November 1, 2019). |
21 | | Significant Subsidiaries.* |
23.1 | | Consent of Independent Registered Public Accounting Firm—PricewaterhouseCoopers LLP—Houston.* |
31.1 | | Rule 13a-14(a)/15d-14(a) Certification of Anthony G. Petrello, Chairman, President and Chief Executive Officer.* |
31.2 | | Rule 13a-14(a)/15d-14(a) Certification of William Restrepo, Chief Financial Officer.* |
32.1 | | Certifications required by Rule 13a-14(b) or Rule 15d-14(b) and Section 1350 of Chapter 63 of Title 18 of the United States Code (18 U.S.C. 1350), executed by Anthony G. Petrello, Chairman, President and Chief Executive Officer and William Restrepo, Chief Financial Officer.* |
101.INS | | Inline XBRL Instance Document* |
101.SCH | | Inline XBRL Schema Document* |
101.CAL | | Inline XBRL Calculation Linkbase Document* |
Exhibit No.
| | Description
|
101.LAB | | Inline XBRL Label Linkbase Document* |
101.PRE | | Inline XBRL Presentation Linkbase Document* |
101.DEF | | Inline XBRL Definition Linkbase Document* |
104 | | Cover Page Interactive Data File (the cover page XBRL tags are embedded in the Inline XBRL document) |
* Filed herewith.
(+) Management contract or compensatory plan or arrangement.
SIGNATURES
SIGNATURES
Pursuant to the requirements of Section 13 or 15(d) of the Securities Exchange Act of 1934, the registrant has duly caused this annual report to be signed on its behalf by the undersigned, thereunto duly authorized.
| | |
| NABORS INDUSTRIES LTD. |
| | |
| By: | /s/ ANTHONY G. PETRELLO |
| | Anthony G. Petrello |
| | Chairman, President and |
| | Chief Executive Officer |
| | (Principal Executive Officer) |
| | |
| By: | /s/ WILLIAM RESTREPO |
| | William Restrepo |
| | Chief Financial Officer |
| | (Principal Financial Officer and Accounting Officer) |
| | |
| Date: | February 28, 201925, 2020 |
Pursuant to the requirements of the Securities Exchange Act of 1934, this annual report has been signed below by the following persons on behalf of the registrant and in the capacities and on the dates indicated.
| | | | |
Signature |
| Title |
| Date |
Signature
| | Title
| | Date
|
| | | | |
/s/ ANTHONY G. PETRELLO | | Chairman, President and Chief Executive Officer | | February 28, 201925, 2020 |
Anthony G. Petrello | | | | |
| | | | |
/s/ WILLIAM RESTREPO | | | | |
William Restrepo | | Chief Financial Officer | | February 28, 201925, 2020 |
| | | | |
/s/ TANYA S. BEDER | | | | |
Tanya S. Beder | | Director | | February 28, 201925, 2020 |
| | | | |
/s/ ANTHONY R. CHASE | | | | |
Anthony R. Chase | | Director | | February 28, 201925, 2020 |
| | | | |
/s/ JAMES R. CRANE | | | | |
James R. Crane | | Director | | February 28, 201925, 2020 |
| | | | |
/s/ MICHAEL C. LINN | | | | |
Michael C. Linn | | Director | | February 28, 201925, 2020 |
| | | | |
/s/ JOHN P. KOTTS | | | | |
John P. Kotts | | Director | | February 28, 201925, 2020 |
| | | | |
/s/ JOHN YEARWOOD | | | | |
John Yearwood | | Director | | February 28, 201925, 2020 |