| the outcome of any potential legal proceedings that may be instituted against us; |
● | the performance of and our relationship with third-party agents and vendors we rely upon to distribute certain business on our behalf; |
| the adequacy of our loss |
| the direct and indirect impacts of COVID-19 and related risks such as governmental responses and economic contraction, including on the Company’s investments and business operations, its distribution or other key partners and its customers; |
● | the effects of uncertain emerging claim and coverage issues on the Company’s business, and court decisions or legislative or regulatory changes that take place after the Company issues its policies, including those taken in response to COVID-19 (such as effectively expanding workers’ compensation coverage by instituting presumptions of compensability of claims for certain types of workers or requiring insurers to cover business interruption claims irrespective of terms, exclusions or other conditions included in the policies that would otherwise preclude coverage); |
| ● | the effectiveness of our risk management policies and procedures; |
| potential technology breaches or failure of our or our business partners’ systems; |
| adverse changes in the economy which could lower the demand for our insurance products; |
| our ability to effectively start up or integrate new product opportunities; |
| cyclical changes in the insurance industry; |
| the effects of natural and man-made catastrophic events; |
| our ability to adequately assess risks and estimate losses; |
| the availability and affordability of reinsurance; |
| changes in interest rates, government monetary policies, general economic conditions, liquidity and overall market conditions; |
3
| changes in the business, financial condition or results of operations of the entities in which we invest; |
| increased costs as a result of operating as a public company, and time our management will be required to devote to new compliance initiatives; |
| our ability to protect intellectual property rights; |
| the impact of government regulation, including the impact of restrictions on our business activities under the Bank Holding Company |
| our status as an emerging growth company; |
| the absence of a previous public market for shares of our common stock; and |
4
| potential conflicts of interests with our principal stockholders. |
We discuss many of these risks in greater detail under the section titled “Risk Factors” in Part I, Item 1A of this Annual Report. Given these uncertainties, you should not place undue reliance on these forward-looking statements. We qualify all of the forward-looking statements in this Annual Report by these cautionary statements. Except as required by law, we undertake no obligation to publicly update any forward-looking statements, whether as a result of new information, future events or otherwise.
References to the "Company," "ProSight," "we," "us," and "our" are to ProSight Global, Inc. and its consolidated subsidiaries unless the context otherwise requires. References to “insurance subsidiaries” are to New York Marine and General Insurance Company (“New York Marine”), Gotham Insurance Company (“Gotham”) and Southwest Marine and General Insurance Company (“Southwest Marine”) unless the context otherwise requires.
PART I
Overview
We are an entrepreneurial specialty insurance company that since our founding in 2009 have built products, services and solutions with the goal of significantly improving the experience and value proposition for our customers. Our main office is located in Morristown, New Jersey and our common stock is publicly traded on the New York Stock Exchange (“NYSE”) under the symbol “PROS”.
We are led by a highly experienced and entrepreneurial team with decades of insurance leadership experience at the Company and other leading insurers. We write property and casualty (“P&C”) insurance with a focus on underwriting specialty risks by partnering with a select number of distributors, often on an exclusive basis. We have a diverse business mix covering specialty niches within the eight customer segments in which we operate. We market and distribute our insurance product offerings in all 50 states within the United States of America, Washington D.C, Puerto Rico and the Virgin Islands on both an admitted and non-admitted basis. We are focused on delivering consistent underwriting profitability with low volatility of underwriting results.
Merger Agreement
On January 15, 2021, we announced that we had entered into an agreement and plan of merger (the “Merger Agreement”) with Pedal Parent Inc., a Delaware corporation (“Parent”), owned by affiliates of TowerBrook Capital Partners L.P. and Further Global Capital Management, and Pedal Merger Sub, Inc., pursuant to which, subject to the terms and conditions of the Merger Agreement, Pedal Merger Sub, Inc. would merge with and into the Company (the “proposed merger”), with the Company surviving as a wholly owned subsidiary of Parent.
Pursuant to the Merger Agreement, each ProSight common share held by our stockholders will be converted into the right to receive $12.85 in cash. In connection with the proposed merger, the Company has also entered into a loss portfolio binder with Cavello Bay Reinsurance Limited (“Cavello Bay”) in connection with an adverse development cover and loss portfolio transfer transaction (a “legacy transfer transaction”) to be implemented immediately after the effective time of the proposed merger. In the event that this loss portfolio binder is terminated under certain circumstances including those related to the termination of the Merger Agreement, the Company may be required to pay Cavello Bay approximately $3 million plus certain costs.
The proposed merger is anticipated to close in the third quarter of 2021, subject to satisfaction or waiver of the closing conditions, including approval by regulatory authorities including those related to the legacy transfer transaction.
5
The stockholder approval required to consummate the proposed merger has been obtained, and no further action by our stockholders in connection with the proposed merger is required.
Our History
We were founded in 2009 by members of the current management team and secured capital commitments from affiliates of each of The Goldman Sachs Group, Inc. (“Goldman Sachs”) and TPG Global, LLC (“TPG”).LLC. We established our insurance operating platform and acquired our insurance subsidiaries through the acquisition of New York Marine and General Insurance Company (“New York Marine”) in 2010. We write insurance out of three subsidiaries: New York Marine, Gotham Insurance Company (“Gotham”) and Southwest Marine and General Insurance Company (“Southwest Marine”).Marine. New York Marine is admitted in 50 states, Washington D.C., Puerto Rico and the Virgin Islands. Southwest
4
Marine is licensed in 49 states and Washington D.C. and is eligible to write on a non-admitted basis in New York. Gotham is admitted in New York and is eligible to write on a non-admitted basis in 49 states and Puerto Rico.
The insurance subsidiaries participate in a risk sharing pool managed by ProSight Specialty Management Company (“PSMC”).Company. This structure allows us to leverage the efficiencies of having a single vehicle managing operations and providing back-office services across our business. All premiums, losses and expenses written by our insurance subsidiaries are pooled and then are allocated to these three insurance subsidiaries in accordance with their respective pool participation percentages. The pool participation percentages are 80% for New York Marine, 15% for Gotham and 5% for Southwest Marine.
In 2011, we formed a Bermuda holding company structure and acquired several entities in the United Kingdom (“U.K.”) in order to build Lloyd’s Syndicate 1110 (“Syndicate”). By 2016, however, we concluded that our business model’s emphasis on niche expertise and exclusive distribution, as well as our high profit expectations, made for an inappropriate fit with the Lloyd’s marketplace on a cost-effective basis. In 2017, we placed the Syndicate into run-off, and then entered into a two-phase sale transaction to exit our U.K. operations, which closed in October 2017 and March 2018. See Item 7. Management’s Discussion and Analysis of Financial Condition and Results of Operations — Factors Affecting Our Results of Operations on this Annual Report on Form 10-K.10-K (“Annual Report”).
Prior to July 25, 2019, the Company was a wholly-owned subsidiary of ProSight Global Holdings Limited (“PGHL”), a Bermuda holding company. Effective July 25, 2019, prior to the completion of the Company’s initial public offering (“IPO”), PGHL merged with and into the Company, with the Company surviving the merger (the merger)“IPO merger”). The prior holders of PGHL’s equity interests (other than holders of PGHL profit interests known as “P Shares”) received in the aggregate, as merger consideration, the right to receive 6.46 shares of the Company’s common stock for each such outstanding PGHL equity interest. The total merger consideration was 38,851,369 shares of the Company’s common stock, which then comprised 100% of the shares of the Company’s outstanding common stock. All P Shares then outstanding were forfeited in connection with the IPO.
As a result of the IPO merger, the assets and liabilities of the Company include, effective July 25, 2019, the assets and liabilities of PGHL. In addition, on July 24, 2019, in connection with the IPO merger, the Company’s duly adopted amended and restated certificate of incorporation (the “Certificate of Incorporation”) became effective, providing for, among other things, the authorization of 200,000,000 shares of common stock and 50,000,000 shares of preferred stock. All share and per share amounts in the audited consolidated financial statements and related notes have been restated for all historical periods presented to give effect to the IPO merger and related conversion of shares, including reclassifying an amount equal to the change in value of common stock to additional paid-in capital, as well as the effectiveness of the Certificate of Incorporation.
Prior to the IPO merger, PGHL’s subsidiaries ProSight Specialty International Holdings Limited (“PSIH”) and ProSight Specialty European Holdings Limited (“PSEH”) were merged with and into the Company, effective February 5, 2019. Additionally, effective February 5, 2019, ProSight Specialty Bermuda Limited (“PSBL”) became a wholly-owned subsidiary of the Company. Prior to February 5, 2019, PSBL was a wholly-owned subsidiary of PSEH.
6
Our Customer Segments and Niches
We define ourselves by the customer segments and niches we serve. We deliver our value and risk solutions through coverages, services we provide and third-party solutions that are attractive to our customers. We utilize our expertise in underwriting and claims to opportunistically pursue profit opportunities.
We currently write insurance coverage in eight customer segments across a broad range of specialty lines of business. Our customer segments currently include:business: Media and Entertainment, Real Estate, Professional Services, Transportation, Construction, Consumer Services, Marine and Energy, and Sports. Within each customer segment, we have multiple niches which represent similar groups of customers. We believe having deep expertise in these niches across our organization is critical and therefore, we have aligned various functional areas at the niche level, including within underwriting, operations and claims. We focus on small- and medium-sized customers, a market segment which we believe has been, and will continue to be, less affected by intense competitive dynamics of the broader P&C
5
insurance industry. On January 28, 2020, the Company announced that it will expand its insurance solutions portfolio into the captive insurance market.
From time to time, we enter and/or exit niches and reallocate existing niches to new or different customer segments in order to align them more efficiently, for reasons that may include the evolution of business or customers in that niche, the establishment or discontinuance of related niches, changes in responsibilities of our management team handling the segments, among others. All historical customer segment information is presented in accordance with the current composition of our customer segments and such reallocation of premium amounts, and as a result some customer segment information may differ from amounts previously reported.
Over time, the composition of business within our customer segments evolves as we identify certain niches that present opportunities to develop distinct customer solutions with attractive profit potential and others that were at one time attractive but may become less so. We believe our ability to remain nimble during changing market conditions is one of our key competitive advantages.
Our eight customer segments are described below:
Media and Entertainment
Our Media and Entertainment customer segment offers solutions to customers engaged directly in the film production and live media. We provide full support for our Media and Entertainment customers’ commercial insurance needs, including package policies (property and general liability), umbrella and excess, auto, workers’ compensation, and specialized productions (cast, props, sets and wardrobe). Our Media and Entertainment customers benefit from our experience and expertise through our offerings of differentiated coverages and can take advantage of innovative products such as SecureMed® and Music Mends®.
Our expertise in this customer segment comes from understanding the specific risks and requirements our media customers face, such as the unique equipment they employ. This expertise has enabled us to develop innovative solutions for our Media and Entertainment customers, which helps our customers manage risk. Our niches in the Media and Entertainment customer segment currently are:
| Film. Providing specialized inland marine, general liability, workers’ compensation, umbrella and excess, auto, property, and crime coverage for feature films, documentaries, commercials, music videos, episodic television shows and student films, ranging from small independent productions to Hollywood blockbusters, wherever they may shoot. |
| Live Entertainment. Providing workers’ compensation, general liability, umbrella and excess, auto, inland marine, property, and crime coverage for a wide range of live events, concerts, festivals and theatre, including the associated staging, rental and service technicians. |
Gross written premium (“GWP”) for our Media and Entertainment customer segment was $88.8 million and $124.9 million and $119.9 million infor the years ended December 31, 2020 and 2019, and 2018, respectively. Prior to September 30, 2019, our Motor Sports and Country Clubs niches were part
7
Real Estate
Our Real Estate customer segment is designed to support the ownership and/or management of buildings, multifamily residential properties or mixed-use urban buildings. We write property, general liability, umbrella and excess and course-of-construction policies for our Real Estate customers and differentiate ourselves through offerings such as Building and Tenant Protection Plus and our manufactured housing endorsement.Plus. We address our insureds’ unique needs through various specialized offerings, including flexible policy periods, project specific policies and all line solutions covering special considerations, such as hotel amenities.
6
considerations.
We believe that our Real Estate customer segment generates value for our customers because our industry expertise and flexible platform enable us to confidently underwrite risks that many of our competitors seemingly avoid due to the uniqueness of the risks involved. Within our Real Estate customer segment, weWe currently tackle complex risks in the following Real Estate niches:
|
|
|
|
|
|
|
|
| Property |
During 2020, the Company also tackled complex risks in the following Real Estate niches which have subsequently been exited:
| Builders Risk. Providing inland marine coverage for buildings while under construction. |
| Hotels. Providing general liability, property, and umbrella coverage to the owners and operators of franchise hotels focused on business travelers. |
| ● | Manufactured Housing. Providing general liability, property, auto, inland marine, and crime coverage to manufactured housing communities (not including campgrounds or temporary trailer parks). |
| ● | Residential. Providing property, general liability, property, auto, inland marine, and |
| Self Storage.Providing general liability, |
GWP for our Real Estate customer segment including the exited niches, was $159.2 million and $167.6 million and $132.7 million infor the years ended December 31, 20192020 and 2018,2019, respectively.
Professional Services
We offer professional liability and commercial insurance products to customers that sell professional advice or services, generally requiring a specialized license. Products offered include professional liability, umbrella, surety and excess, package lines and specialized banking covers. Our specialized approach to addressing this customer segment includes solutions to address risks facing Professional Services customers through the application of background checks, data protection, data compromise and risk management services. Niches in the Professional Services customer segment where we put our industry expertise to work currently include:
| Accountants. Providing professional liability coverage to small and medium-sized accounting firms. |
| Credit Unions. Providing crime, professional liability, property, general liability, workers’ compensation, auto, umbrella, and inland marine coverages to small and mid-sized credit unions. |
8
| Customs Brokers. Providing marine, commercial package and continuous U.S. Customs and Border Protection bonds for importers and property broker bonds for freight forwarders. |
| Lawyers. Providing professional liability coverage to law firms across the United States ranging from local and regional firms to firms with national and international practices, many of which are listed in the AmLaw 200, a listing of the largest 200 law firms in the United States by gross revenue. |
| Pest |
7
GWP for our Professional Services customer segment was $130.9 million and $119.3 million and $110.5 million infor the years ended December 31, 20192020 and 2018,2019, respectively.
Transportation
Our Transportation customer segment is defined by several subsets, but generally involves the transportation of either passengers or freight and covers a diverse group of niches which are described below. We write a wide variety of P&C coverage for our Transportation customers, including commercial auto liability and physical damage, umbrella and excess, general liability, property, inland marine and workers’ compensation.
In addition to our tailored coverage, our Transportation products are differentiated by technology and other services, such as application of proprietary risk management technology, data protection services, background checks and drug testing programs. Our niches in the Transportation customer segment where we apply our differentiated solutions and expertise currently include:
| Captive Programs. Providing general liability, professional liability, workers’ compensation and commercial auto coverage to single-parent, group and agency captives. |
● | Charter Bus. Providing auto, excess or umbrella, and general liability coverage to customers in the charter bus business, sightseeing and tour operations or hotel and employee haul operations. |
| Intermodal Transportation. Providing auto and general liability to customers with ten or more units in the business of local and line haul freight delivery (within a 100-mile radius) of non-hazardous commodities to regular destinations. |
| School Bus. Providing auto, umbrella, general liability, excess liability, property, inland marine, and crime coverage to school bus operators. |
| Taxis. Providing auto liability and excess liability coverage to customers ranging from single operators to large sophisticated fleets. |
GWP for our Transportation customer segment was $64.6 million and $112.2 million and $92.2 million infor the years ended December 31, 2020 and 2019, and 2018, respectively. Prior to September 30, 2019, our Propane & Fuel Dealers niches were part of our Transportation customer segment. This niche is now part of our Marine and Energy customer segment.
Construction
Our Construction customer segment focuses primarily on customers in several key areas of the construction trade. We offer property, general liability, workers’ compensation, commercial auto and excess coverage to our Construction customers as well as a variety of proprietary covers, such as OOPS® Coverage.
Our Construction customer segment makes use of our flexible platform given the variety of risks presented by the numerous members of the construction trade which require specialized coverage. Our niches in the Construction
9
customer segment, where we have identified and created solutions for previously underserved customers, currently include:
| Construction Managers. Providing professional liability, excess liability and general liability |
| Cranes. Providing general liability, workers’ compensation, excess, inland marine and auto coverage to crane rental companies. |
|
|
8
| Luxury Home |
| Longshore and Marine Contractors. Providing workers’ compensation, United States Longshore and Harbor Workers Compensation Act coverage, marine liability package, marine umbrella (bumbershoot coverage), protection and indemnity, auto, inland marine, and property coverage to general contractors who serve the maritime industry. |
| Scaffolding. Providing an all lines solution including general liability, workers’ compensation, excess, inland marine and auto coverage to scaffolding rental companies. |
| Specialty Trade Contractors. Providing general liability |
GWP for our Construction customer segment was $110.0 million and $117.9 million and $101.9 million infor the years ended December 31, 2020 and 2019, and 2018, respectively.
Consumer Services
Our Consumer Services customer segment works with a number of consumer-centric organizations, including many not-for-profit organizations. We provide our Consumer Services customers with workers’ compensation, package, umbrella and excess and commercial auto coverage.
Our Consumer Services customer segment primarily focuses on identifying and crafting policies and solutions for the nuanced risks generated from the manner in which these customers’ employees or volunteers engage with their customers or clients. We offer differentiated solutions to our Consumer Services customers through our diversity of offerings and products and services, specific to each niche. Our niches in the Consumer Services customer segment currently include:included:
| Auto Dealers. Providing property, umbrella, crime, auto and general liability coverage to franchised auto dealers and truck dealers with new car sales. |
| Franchise Equipment Dealers. Providing auto, workers’ compensation, property, umbrella, inland marine, general liability, and crime coverage to dealers that engage in the sale or long-term leasing of construction equipment. |
|
|
|
|
|
|
| Parking Facilities. Providing general liability, auto, property, inland marine, umbrella, workers’ compensation, garage keepers’ legal liability, and professional liability coverages to owners of parking garages, valet companies, park and rides, airport parking, and parking lots. |
910
| Snow & Ice Removal. Offering general liability, employee benefits liability, and stop gap liability coverages for snow and ice management contractors who service private premises such as office complexes, schools, residential driveways, and convenience stores. |
During 2020, our Consumer Services customer segment also included the following niches which have subsequently been exited:
| Animal |
| ● | Professional Employer Organizations. Providing workers’ compensation coverage to providers of human resources solutions to small and medium sized employers that lack the infrastructure to provide human resources services internally. |
| ● | Social Services. Providing workers’ compensation to nonprofit organizations that serve their communities. |
GWP for our Consumer Services customer segment including the exited niches, was $123.0 million and $133.7 million and $107.1 million infor the years ended December 31, 20192020 and 2018,2019, respectively.
Marine and Energy
We offer a broad array of very specialized coverages to customers that own or service assets in the maritime trades, the upstream energy space both on and off shore and the growing solar energy sector. Our policies in the Marine and Energy customer segment generally focus on third party liabilities arising out of property damage and bodily injury, but, consistent with our overall approach to insurance, we also cover more subtle, distinctive risks that arise in each niche. Our differentiators in the Marine and Energy customer segment include our cost of iron endorsement and equipment rental coverage.
We view the Marine and Energy customer segment as being well-suited to our emphasis on using industry expertise and highly tailored coverages to create value for our customers. For example, we recognize that solar contractors often face risk of professional liability arising out of their design of solar energy production systems and we view this distinct risk profile as an opportunity to craft customized coverages for such customers. Our niches in the Marine and Energy customer segment where we generate bespoke solutions currently include:
| Ocean Marine. Providing marine umbrella (bumbershoot) and excess, property, protection and indemnity, pollution liability, marine cargo, vessel hull and machinery, marine liability, inland marine, maritime employers liability, workers’ compensation, and charterer’s liability coverage to customers with over the water or maritime exposures. |
| Petroleum Services. Providing auto, umbrella, general liability, inland marine, workers’ compensation, property, and crime coverage to exploration, production and contracting companies in the upstream energy sector. |
|
|
| Propane & Fuel Dealers. Providing auto, general liability, workers’ compensation, excess liability, property, inland marine, and crime coverage to wholesale distributors of propane and fuel oil and retail distributors of propane and fuel oil to homes, farms and commercial establishments. |
| ● | Solar Contractors. Providing workers’ compensation, general liability, auto, professional liability, umbrella, property, inland marine, and crime coverage to solar energy contractors. |
GWP for our Marine and Energy customer segment was $94.1$110.2 million and $83.0$94.7 million infor the years ended December 31, 2020 and 2019, and 2018, respectively. Prior to September 30, 2019, our Propane & Fuel Dealers niches were part
11
Sports
We use our deep industry expertise to offer a wide range of flexible coverages that meet the complex and evolving needs of our Sports customer segment. The world of sports presents unique and challenging risks, whether for racetracks and motor sports facilities, driving and race schools, waterassociations, car clubs, race teams, motocross and motor sports private country clubs or public golf courses. We created comprehensive insurance and risk management solutions from participant and spectator liability to shell corporations for professional athletes in the public eye.
10
Our policies focus on general liability, workers’ compensation, participant accident, commercial auto, excess liability and drone liability.events. Differentiators and added value services include e-waivers, a more efficient process to collect, store and manage waivers, as well as payment programs that allow racetracks and motorsport facilities to take rain-out credits in advance. Our niches in the Sports customer segment include Aquatic Recreation, Country Clubs,is currently comprised of our Motor Sports niche, were we provide general liability, property, workers’ compensation, umbrella and Motor Sports. Our niches in theexcess, auto, inland marine, and crime coverage for motor sporting events.
During 2020, our Sports customer segment where we develop such tailored coverages currently include:also included the following niches which were subsequently exited:
|
|
|
|
| Country Clubs. Providing property, general liability, umbrella, auto, workers’ compensation, crime, and inland marine coverage to private golf and country clubs, public golf courses, golf management companies, associations, as well as tennis, swimming and other recreational clubs. |
|
|
GWP for our Sports customer segment including the exited niches was $23.3 million and $30.1 million and $23.6 million infor the years ended December 31, 2020 and 2019, and 2018, respectively. Prior to September 30, 2019, our Motor Sports and Country Clubs niches were part of our Media and Entertainment customer segment. Such niches are now part of our Sports customer segment.
Other
“Other”Other includes all GWP from exited niches, developing customer segments that remain immaterial certain fronting reinsurance arrangements, and participation in pools and associations. “Other”Other GWP primarily consists of the following components:
| Primary and excess workers’ compensation coverage for self-insured groups sourced through Midlands, a managing general underwriter (“MGU”) that was acquired by a third-party insurance carrier in January |
| Niches which we have terminated in 2018 and prior, the majority were focused on commercial auto such as Long Haul Trucking, Towing, Chauffeured Transportation, Settlement Carriers and Pizza Delivery. |
| Participation in industry pools and associations, the largest of which is the National Council on Compensation |
GWP related to “Other” was $68.2$7.1 million and $124.2$67.6 million infor the years ended December 31, 2020 and 2019, and 2018, respectively.
1112
Our Competitive Strengths
We believe that the following competitive strengths have supported our success to date and provide a foundation for future growth:
| Focus on profitable niches of the market where we have industry leading expertise and can deliver value to our customers. We have been selective in developing our niches within customer segments for which we have in-house expertise and will continue to focus on providing differentiated products, services and solutions that truly serve customer needs and offer attractive and profitable growth opportunities. We have a strong focus on fragmented and underserved markets which we believe have an attractive risk-adjusted return profile. We choose to avoid markets that are susceptible to commoditization by incumbent industry participants. We have specific and unique expertise such as underwriting knowledge and data, loss mitigation techniques, customer access, and claims handling for each niche that we believe are difficult to replicate. We believe that this expertise enables us to accurately price risk, deliver profitable underwriting results, and retain this profitable business. We have aligned our organization accordingly such that our underwriting, operational and claims personnel are dedicated to specific niches within a given customer segment, which differentiates us and we believe is an important component of our financial performance. Our niche focus provides several important benefits to our underwriting results: |
| Homogeneous insureds. We believe that the inherent homogenous nature of insureds within a relatively narrow and descriptive niche means that collectively the actuarial result will be more credible and more susceptible to analysis, should results suggest that improvements or changes are required. |
| Expertise in execution. Unlike many of our competitors, our communication is delivered directly to the underwriter or MGU who deals exclusively with the applicable customer rather than through layers of generic management and geographic leadership teams to underwriters that only occasionally touch such a niche. |
| Predetermined aggregations and exposure profiles at the niche level. When we launch a new niche, significant diligence and research is performed. This allows us to impose aggregation limits, price targets for catastrophic loss loads and/or buy appropriate reinsurance before the first account is written in the niche, which we believe results in a more predictable and profitable growth pattern for our niches. |
| Creation of products, services and solutions that deliver a high value proposition to our customers. We believe we will continue to succeed by proactively developing what we refer to as “differentiators,” which can be in the form of products, services, or solutions that are tailored to our customers. We often partner with our customers and distributors when developing differentiators and leverage their particular knowledge of their own needs and the needs of their customers, respectively. Unlike typical insurance companies, we co-own the intellectual property associated with the differentiators developed with our distributors during the term of our contractual relationships, allowing for a better alignment of incentives. We have dozens of differentiators across our niches, with many differentiators applicable to multiple niches. |
| Sophisticated underwriting tools that deliver prompt underwriting responses and profitable results. We have developed a multi-faceted pricing strategy that is tightly integrated into niche development, from inception to maturity. Pricing begins when a new niche is identified and submitted for |
12
internal review and approval by underwriting and actuarial management, which we believe produces a filtering mechanism that helps us pursue only the opportunities best aligned with our strategy. For those niches that make it through the submission process, targets and metrics are established immediately to monitor the early |
13
| development of the niche. We believe such monitoring allows for early detection of anomalies which can then quickly be remedied by the underwriting team. We employ our ProSight Climber GPS application to conduct such monitoring and review of our underwriting and reserving decisions on a real-time basis. Each niche undergoes a detailed annual pricing analysis that is utilized in the niche review process. These reviews incorporate a wide range of inputs such as trend, development, price change, underwriting changes, and claims results. We are highly selective in choosing which new opportunities to pursue; we estimate that we decline approximately |
| Long-standing and selective relationships with our distribution partners. We have designed an innovative distribution model with a highly targeted customer focus by engaging a limited number of distribution partners. For each niche, we partner with either a single or a select group of specialist distributors who have a deep understanding of our customers and their risk profiles. Each of our distribution partners undergoes a rigorous due diligence process before they are selected. In many of our niches, our agency and brokerage relationships are structured so that we work with a particular distribution partner on an exclusive basis. More than 70% of our |
| Highly entrepreneurial culture and management team with a track record of success. We have a seasoned and entrepreneurial management team with decades of experience. Each member of our executive management team has served in a senior leadership role at a major insurance company prior to joining the Company, and our founders all have extensive careers in underwriting. Our current leadership team has founded and built the Company from the ground up and has strong alignment of interest with stockholders. |
We are led by our Chief Executive Officer (“CEO”), Lawrence Hannon, a founding member of the Company. Mr. Hannon has more than 2930 years of underwriting and operational experience in the insurance industry. Prior to becoming Chief Executive OfficerCEO in May 2019, Mr. Hannon served as Chief Operating Officer. Prior to joining the Company, Mr. Hannon was the Chief Sales & Marketing Officer at Fireman’s Fund Insurance Company and previously spent fourteen years at Chubb Limited in various leadership and underwriting positions.
Our Chief Underwriting and Risk Officer (“CURO”), Robert Bailey, is a founding member of the Company and responsible for underwriting, risk management and reinsurance. Mr. Bailey has more than 3031 years of underwriting experience in the insurance industry. Prior to joining the Company, Mr. Bailey was the Chief Underwriting Officer of Commercial Lines at Fireman’s Fund Insurance Company and previously spent seven years at Cigna in various leadership and underwriting positions.
Our Chief Financial Officer (“CFO”), Anthony S. Piszel, joined the Company in 2012. Mr. Piszel has more than 3940 years of experience in the financial services industry including as Chief Financial OfficerCFO of public companies. He previously was Chief Financial OfficerCFO at CoreLogic, First American Corporation, Freddie Mac, and Health Net, Controller of Prudential Financial and Audit Partner at Deloitte & Touche. Mr. Piszel also served as a practice fellow at the Financial Accounting Standards Board.
Our Chief Legal Officer (“CLO”), Frank D. Papalia, joined the Company in 2011. Mr. Papalia has over 3334 years of legal and business experience in the insurance industry and, prior to joining the Company, served as General Counsel and Member of the Management Board of PARIS RE Holdings, a publicly traded reinsurance group. Mr. Papalia was also General Counsel of AXA RE from 2003 to 2006 and Vice President and Counsel with AXA Financial.
13
his intent to retire from his role as CLO effective December 31, 2020. As a new CLO or General Counsel was not in place by December 31, 2020, in accordance with Mr. Papalia’s Transition Agreement, he will remain in his role as CLO until the date the new CLO or General Counsel assumes such duties.
We have instilled this entrepreneurial mentality throughout all levels of our Company. Our employees are encouraged to be proactive, to service our customers and distributors and ensure the success of our Company. We believe
14
our people are our greatest strength, and we work consistently to foster a culture emphasizing customer focus, professional growth, accountability, and performance. This mentality is built into the mechanisms of our employee assessment and compensation. For example, to assess performance, we developed our proprietary “Climber Portal”, a cloud-based, branded internet suite that includes a nine-factorten-factor competency-based review system in which employees and their managers assess performance based on skills-strength and actual contributions. In this manner, performance is documented throughout the year in an ongoing interactive dialogue.
| Deep investment in and innovative approach to technology. Technology is a core competency of the Company and at the heart of how we deliver our high value customer proposition. We have an exclusively configured, scalable, and digitally-enabled technology platform built for growth, data integrity, and efficiency, which allows us to deploy the necessary technologies to respond quickly to business opportunities. We have invested in the development of a modern core insurance system for policy administration and billing that forms the foundation of our customer facing digital technologies. As a result, we can rapidly develop flexible, customer facing solutions. We have demonstrated our ability to develop and deploy digital products for our agents and customers that are delivered via the web over desktop and mobile devices. We consider our ability to meet ever increasing customer demands for anytime, anywhere access as a competitive strength compared to traditional and emerging carriers. |
The key features of our technology, which support our business model are: (i) We are not burdened by multiple legacy systems and are therefore able to quickly respond to changing industry dynamics and focus our information technology (“IT”) investments on innovation.innovation; (ii) Our core customer-facing policy administration and billing systems, “ProSight Premiere”, have been architected and developed by us, and are internally maintained, to meet the needs of our growing insurance business.business; (iii) Through our exclusive enterprise data warehouse and financial reporting system “ProSight Climber GPS”, we have the ability to access and mine data to manage our business and help inform our underwriting and reserving decisions on a real-time basis.basis; (iv) Our application programming interface (“API”)-enabled core systems and strong mobile development capabilities allow our customers and agents to interact with us in an easy and efficient manner. Our interactive platform, ProSight Online,“ProSight Online”, is available to all of our customers and allows them to view policy, billing, claims and loss information, all from a mobile device.device; and (v) Our unified cloud infrastructure enables us to operate our platform efficiently, deploy new services rapidly, and scale for the future.
| Scalable platform built for continued growth. We have built our systems, processes and technology platform to be easily scalable with limited incremental marginal cost, as we see multiple opportunities to grow our business at a rate that is well in excess of the broader P&C insurance industry. Our licensing, infrastructure and applications have been designed to support a significantly larger book of business, and also have the ability to manage a high volume of small business customers through our proprietary direct to consumer technology platform. We currently have a competitive expense ratio that we expect to decrease over time as we expand our premium base and diversify our distribution channels that are available to cover the largely fixed costs of maintaining this infrastructure. Our absence of legacy infrastructure and systems means we can direct our spending towards expanding our technology leadership rather than maintenance and upkeep of outdated technology. |
Our Strategy
Our objective is to leverage our competitive strengths to achieve profitable and sustainable growth. We have built a large, diversified and seasoned in-force book of business. Our strategy is built on the following principles:
| Utilize our specialized products, services and solutions to continue our growth trajectory in markets where we exhibit expertise. We have been selective in developing our target niches and will continue to focus on providing differentiators within niches that we believe offer attractive and profitable growth opportunities. We expect future growth to come from three primary |
14
segments, particularly those where we have developed expertise and a new adjacent niche provides a unique |
15
| segments as we identify a sector of the marketplace that presents an attractive opportunity. Generally, we believe that our differentiation and the value propositions we generate for our customers through our niche-by-niche growth strategy creates a profit opportunity for us. |
| Expand multi-pronged distribution network to best serve our customers in the most efficient and effective manner. We have the ability to deliver our products through three channels: (i) third party partnerships via retail agents or MGUs with whom we customarily have long-standing relationships; (ii) our owned brokerage arm, ProSight Specialty Insurance |
| Maintain strong underwriting discipline and profitability. We seek to maintain underwriting profitability while pursuing sustainable growth through a robust risk selection process. Our underwriting teams are led by experts in the niches we serve and we target niche markets that are homogeneous blocks of actuarially credible businesses that have performed at favorable loss ratios. We will continue to focus exclusively on business with an attractive risk-adjusted return profile and will not participate in markets that are commoditized and where we cannot add incremental value. All of the underwriting authority and guidelines, for every niche and customer segment, are determined and approved by our CURO. The majority of our GWP from customer segments are executed by the Company’s underwriters who are experts in their specific niche, while the remainder is handled by our MGUs, subject to the authority that the CURO has delegated to them. All of our underwriting authority delegated to MGUs is subject to stringent guidelines and regular audits. Our strong focus on underwriting expertise has led to favorable financial results. For the year ended December 31, 2020, we generated net income from continuing operations of $27.8 million and adjusted operating income from continuing operations of $40.3 million which resulted in an adjusted operating return on equity from continuing operations for the same period of 6.9%. For the year ended December 31, 2019, we generated net income from continuing operations of $45.5 million and adjusted operating income from continuing operations of $57.6 million which resulted in an adjusted operating return on equity from continuing operations for the same period of 12.4%. |
| Leverage our technology platform to drive operational efficiencies and digital capabilities. We have built an IT platform that encompasses a streamlined core system suite, customized digital solutions, and scalable and resilient cloud infrastructure. We have made significant investments to build out robust data capture capabilities that allow for a dynamic rate and loss management process as datasets evolve. Additionally, our flexible platform is able to seamlessly underwrite and onboard new business as we continue to expand. We believe we are well positioned to grow in an evolving shared economy with our exclusive technology infrastructure. Our expense ratio can decrease as we expand our business, as our platform provides us with a high degree of operational leverage. We plan to maintain and expand our technology leadership by developing new tools and applications for our distribution partners and customers. |
| Maintain our strong balance sheet. We believe a conservative balance sheet is foundational to our ability to deliver superior financial performance and returns. We have continuously maintained a rigorous reserving approach and monitor loss emergence and developments on a monthly basis in addition to our detailed quarterly reviews and daily monitoring by executive management. We protect our capital by utilizing high-quality reinsurers, setting retentions appropriate to the extent and nature of exposures we wish to retain, maintaining a strong enterprise risk management framework, closely monitoring regulatory and market developments, and adapting our approach to achieve our underwriting and risk management goals. We also follow a conservative investment portfolio management philosophy consistent with our objective to achieve consistent and predictable profitability through a careful analysis of risk and return. We believe that our investment portfolio provides sufficient liquidity to pay for the liabilities relating to the |
15
risks we underwrite while achieving attractive returns on investment. We have a high-quality, well-diversified investment portfolio with |
16
| are currently rated “A-” (Excellent) (Outlook Stable), which is the fourth highest of 16 ratings assigned by A.M. Best to insurance companies. Maintaining a strong rating from A.M. Best enables us to easily demonstrate our financial strength to policyholders, which is often a critical factor in the decision to purchase insurance. This rating is intended to provide an independent opinion of an insurer’s ability to meet its obligations to policyholders and is not an evaluation directed at investors with respect to our securities. |
Distribution and Marketing
While many of our competitors choose to distribute their products through thousands of producers, we currently work with fewer than 20 MGUs and fewer than 125 wholesalers and retailers. Each distributor is often appointed for a specific niche only. Typically, our distribution partners have an existing book of business, are well-established experts in a niche and have a deep understanding of our offering. We also complement our external distribution capabilities with ProSight Specialty Insurance Brokerage,PSIB, our owned brokerage arm, and our proprietary, online, direct-to-customer platform.
Unlike most other insurance companies, we typically offer our distribution partners exclusive or semi-exclusive access to our products within that niche. This exclusivity is in contrast to their typical experience, where the insurance company offers its product through hundreds or thousands of competing distributors. Agents highly value this exclusivity as it enables them to grow their business with fewer constraints and work with a partner who has a vested interest in their growth, which we believe leads to well-aligned incentives for our distributors. This enables us to collaborate closely with the producer to create and develop products and solutions specific to the niche. In exchange for exclusivity for the distributors, we typically have some combination of geographic exclusivity, right-of-first-refusal placement within the agency and control of our developed intellectual property. This intellectual property arrangement is part of our distributor agreement, enabling us in most cases to retain the right either to exclusively pursue or to compete for our customers in the event that an MGUmanaging general underwriter (“MGU”) chooses to terminate our relationship. In each case, we maintain the right to compete more generally in the niche.
Several of these agents are responsible for a significant portion of the premium written by us. While this model provides many benefits to us and our customers, such agents have in the past, and may in the future elect to renegotiate the terms of existing relationships, or reduce or terminate their distribution relationships with us, including as a result of industry consolidation of distributors or other industry changes that increase the competition for access to distributors. See Item 1A. Risk Factors — Risks Related to Our Business — Third-party agents we rely upon to distribute certain business on our behalf may not perform as anticipated, or may be acquired or terminate their agreements with us which could have an adverse effect on our business and results of operations.
To support our marketing and distribution efforts, we invest in building brand awareness and brand preference within our target niches. Our marketing team works closely with our distribution partners to develop joint marketing plans and digital marketing campaigns that support the growth goals of the program. In addition, we focus on developing relationships with professional associations and other affinity groups to create additional distribution and branding opportunities for our programs and distribution partners. The goal of these marketing efforts is to accelerate organic growth and create loyalty among our distribution partners.
Underwriting, Risk Selection and Pricing
All underwriting authority comes from the Board of Directors and is delegated to the CURO. All of the underwriting authority and guidelines, for every niche and customer segment, are determined and approved by our CURO. This ensures that the Company has complete determination over what an acceptable risk is for every niche. The majority of our GWP from customer segments are executed by the Company’s underwriters who are experts in their specific niche, while the remainder is handled by our MGUs, subject to the authority that the CURO has delegated to them. All of our underwriting authority delegated to MGUs is subject to stringent guidelines and regular audits.
16
All of the operational and execution-related aspects for each niche are subject to final approval from our CURO and are captured in our distributor agreements. The CURO conducts regular reviews of each niche throughout the year to ensure that the execution in each niche remains consistent with expectations. Daily and monthly metrics at the niche level are readily available to each underwriter and are utilized to track progress.
17
Niche Focus
Our niche focus provides several important benefits to our underwriting results:
| Homogeneous Insureds. This is a critical advantage to our underwriting approach. We believe that the inherent homogenous nature of insureds within a relatively narrow and descriptive niche means that collectively the actuarial result will be more credible and more susceptible to analysis, should results suggest that improvements or changes are required. Our data and reporting structures also align around niches, enabling us to better evaluate under- or over-performance. This granular focus allows underwriters and the product development team to be more tailored and specific when responding to customer needs. |
| Expertise in Execution. Our underwriters operate at a niche level. Being niche focused enables us to adjust our approach and/or execution more efficiently. Unlike many of our competitors, directives regarding a specific niche need not be communicated through layers of generic management and geographic leadership teams to underwriters that only occasionally touch such a niche. Our communication is delivered directly to the underwriter or MGU that deals exclusively with the applicable customer. We believe there is tremendous benefit to our results in that deep expertise and simplicity. We are also able to better track and account for costs directly associated with a niche, improving our ability to determine price adequacy and a given niche’s profitability. |
| Predetermined Aggregations and Exposure Profiles at the Niche Level. When we launch a new niche, the CURO tightly controls the authority process. Significant diligence and research are performed prior to moving forward with a niche. For every new niche, this means that test quotes have been completed, actuarial data assessed, filings considerations contemplated, regulatory concerns discussed, IT systems issues identified, reinsurance ramifications explored and many other matters vetted, all prior to approval. Key among these is an understanding of any aggregations of exposures that might occur due to timing or geographic bias of the customer base. Knowing these portfolio characteristics before the first account is written allows us to impose aggregation limits, price targets for catastrophic loss loads and/or buy appropriate reinsurance. We believe that this results in a more predictable and profitable growth pattern for our niches. |
General Underwriting Controls
The CURO delegates authority to our underwriters and MGUs based on the niche assigned to each underwriter, the experience of that individual and the role the individual has in the organization.
Each niche has a dedicated underwriting manager, specific underwriting appetite guidelines and controls focused on making sure that accounts written are within the parameters established for each niche. We have a series of processes utilized by underwriters and management on a daily, monthly and quarterly basis that, when added together, ensure the execution and compliance of each niche. Management drives results in a variety of ways, including:
| Peer Reviews. We mandate that a sampling of files is reviewed per niche per quarter by the supervising manager. This applies to policies written under delegated authority as well as internally written policies. Results are tracked for training and performance purposes. This is designed to give the underwriting manager a more holistic picture as to the performance of the underwriter and the niche. |
| Exception Reports. We actively monitor the parameters of each niche by using online alerts to notify the CURO and underwriting staff if selected issuance values are entered that fall outside preselected parameters. Each niche has its own exception parameters depending on the appetite for that niche. In |
17
addition, the CURO and underwriting teams review the transaction log every week, focusing on activities that could be incorrect or fraudulent, such as a claim with back-dated coverage, or unusual cancellations or reinstatements. |
| Daily Claims Tracking. All underwriters and management have daily access to the claims activity from the previous day, in addition to the historical claims information for each niche. This provides instant feedback |
18
| to each underwriter as to how their niche is performing and better enables them to adjust execution and make timely decisions to improve our profitability. |
| Underwriting Audit. We maintain an underwriting audit staff that reports to the CURO. Every niche and related MGU is audited at least every 24 months, with most being on an annual cycle. An MGU for any new niche is audited within the first twelve months. |
| Niche Reviews/Actual-to-Plan Discussions. We hold regular review meetings, led by the CURO, which cover underwriting performance, actuarial pricing trends, loss development trends, and distribution strategy and differentiation. |
Overall, we believe that these processes and controls, in addition to our niche focus, give us industry-leading insights that improve our underwriting execution to deliver more accurate, stable and predictable underwriting results.
Technology
From our founding, we believed that our technology serves as an important source of competitive advantage. It is our view that much of the industry has lagged in technology development despite investing large amounts of money into IT transformation programs, often having dozens of policy administration systems and claims systems for various business units and product lines that do not effectively communicate with one another and are not organized around the customer. We believe the result is that our competitors bear the costs of maintaining these disparate systems but struggle to effectively organize their data or processes in a way that can be provisioned to customers to create valuable digital services.
In contrast, we have built a modern technology platform that is efficient, scalable, and enables industry-leading digital capabilities. This platform provides the following major advantages:
We are not burdened by legacy systems. After the acquisition of New York Marine, and concurrent with the development of our new policy administration system, we focused on the retirement and replacement of legacy systems to ensure that we could reduce costs and eliminate the limitations associated with these older systems.
Our key customer facing systems were developed recently on modern architectures. Our policy administration system, which we call “ProSight Premiere”, supports all of our various customer segments. The system was built to enable custom rate, rules and forms by niche in a manner that is highly flexible and configurable by our own internal development staff. In order to support the various market opportunities we may pursue, the system currently supports nine product lines, 50 states, admitted and non-admitted business, and Insurance Services Office and American Association of Insurance Services, and proprietary approaches. The system handles submission and clearance, rating, quoting, issuance and all endorsement and audit transactions required for the life of the policy. The flexibility of the system and our in-house expertise enables us to fully configure most new niches in a short period. The systems, and our staffing in support of it, has been architected to ensure ease of scalability and costs being largely fixed, affording significant operational leverage as we grow.
Our Enterprise Data Warehouse and proprietary Business Intelligence system drives our day-to-day business decisions. We have developed “ProSight Climber GPS” to provide our decision makers with real-time access to detailed premium and loss data for all aspects of our business as well as customized reports and dashboards that provide the information they need to make good business decisions in a timely manner. This capability is delivered to authorized employees’ desktops via their web browser and is connected to various data sources across the Company. In-house development resources are continuously enhancing this system to improve its capability.
18
Our technology platform supports our digital business initiatives. All of our key customer facing systems are API-enabled and highly available to support the development of customer and agent facing mobile applications that can be used anytime, anywhere. Our various proprietary digital products link directly to these core systems via APIs that are developed and maintained in-house. This enables us to deliver real-time data to our customers and agents and enable transactions that are directly executed by the systems, eliminating the need for back-office operations to manually process the requests.
19
Our unified cloud infrastructure is efficient, scalable and supports innovation. In 2016, we migrated all of our company infrastructure to Amazon Web Services. As a result, we were able to reduce infrastructure costs over the course of the migration while significantly enhancing our backup, disaster recovery, and application availability. In the future, we expect this cloud infrastructure will enable us to scale our business without the need for capital investment in building and maintaining physical data centers.
We believe these components, and the general philosophy of maintaining in-house expertise and capability for core activities to be a significant competitive advantage. By not relying on a fully outsourced application development and maintenance model, we believe we can sustainably deliver higher quality systems and services at a faster pace and lower cost than our competitors.
Claims Management
Our dedicated staff have expertise that aligns with the business of our customers, which enables our claims department to create differentiated outcomes for the specific needs of our customers. Our claims department works closely with our underwriting team in order to provide customers with strong partnerships. We are guided by the following principles: (i) prompt, proactive and comprehensive investigations of each claim; (ii) engaging customers in the claims process; (iii) establishing reserves reflective of our estimate of probable case value; and (iv) proactively identifying and pursuing subrogation opportunities and the investigation of fraud. We utilize specialized, independent law firms to defend litigation filed against our insureds.
We strive to handle as many claims as possible through our internal claims staff and to make minimal use of Third-Party Administrators (“TPAs”). We utilize the services of two TPAs to assist in the adjustment of workers’ compensation claims and one TPA to assist in the adjustment of builders’ risk claims within the Real Estate customer segment. Our TPAs are not affiliated with our distribution partners. Other than in limited cases, our MGUs do not handle claims. Our internal claims managers oversee TPA and MGU claims-related activities and monitor their individual claim handling activities to prescribed ProSight standards.
Reinsurance
We actively use ceded reinsurance across our book of business to reduce our overall risk position and to protect our capital. Reinsurance involves a primary insurance company transferring, or “ceding,”“ceding”, a portion of its premium and losses in order to limit its exposure. The ceding of liability to a reinsurer does not relieve the obligation of the primary insurance to the policyholder. The primary insurer remains liable for the entire loss if the reinsurer fails to meet its obligations under the reinsurance agreement. In 2019,2020, we ceded $115.9$122.9 million, or 12.0%15.0% of our GWP to reinsurers. We attempt to purchase reinsurance from reinsurers that are rated at least “A-” (Excellent) or better by A.M. Best.
19
The following table provides our top three reinsurers by uncollateralized net reinsurance receivable (paid and unpaid) as of December 31, 2019:2020:
|
|
|
|
|
| |||||
|
| Uncollateralized |
|
| ||||||
|
| Net Reinsurance Receivable |
|
| ||||||
|
| (Paid and Unpaid) |
|
| ||||||
|
| as of December 31, 2019 |
|
| ||||||
| | | | | | |||||
|
| Uncollateralized |
| | ||||||
| | Net Reinsurance Receivable | | | ||||||
| | (Paid and Unpaid) | | | ||||||
| | as of December 31, 2020 | | | ||||||
Reinsurer |
| ($ in thousands) |
| A.M. Best Rating | | ($ in thousands) | | A.M. Best Rating | ||
Swiss Reinsurance America Corporation |
| $ | 44,797 |
| A+ | | $ | 40,563 |
| A+ |
Harco National Insurance Company | | $ | 13,164 |
| A- | |||||
Munich Reinsurance America Inc. |
| $ | 20,320 |
| A+ | | $ | 12,567 |
| A+ |
Harco National Insurance Company |
| $ | 12,906 |
| A- | |||||
We use various types of reinsurance, including quota share, excess of loss and facultative agreements, to spread the risk of loss among several reinsurers and to limit its exposure from losses on any one occurrence. Under our quota share reinsurance contracts, we cede a predetermined percentage of each risk for a class of business to the reinsurer and recover the same percentage of each loss and loss adjustment expense (“LAE”).expense. We pay the reinsurer the same percentage of the original premium, less a ceding commission.
20
Under our excess of loss reinsurance, we pay a reinsurance premium to the accepting reinsurer and, in return, cede all or a portion of the liability in excess of a predetermined deductible or retention. We generally do not receive any commission for ceding business under excess of loss reinsurance agreements.
We purchase facultative reinsurance to provide coverage on selected individual risks not covered by our quota share and excess of loss reinsurance coverage or to increase our protection on selected individual risks in excess of the limits under our quota share and excess of loss reinsurance agreements. For a further discussion of our reinsurance, see Item 7. Management’s Discussion and Analysis of Financial Conditions and Results of Operations — Reinsurance and Item 1A. Risk Factors — Risks Related to Our Business on this Annual Report on Form 10-K.Report.
Competition
Due to our focus on specialized niches, our competitors vary from niche to niche. We compete with other specialty carriers within a given niche more often than general market insurers, but no specific specialty insurers can be identified as clear competition across all of our customer segments or niches. We estimate that in each of our niches we see meaningful competition from between two and five other market participants. Some specialty carriers we compete with today include OneBeacon Insurance Group, Ltd., Everest Re Group, Ltd., RLI Corp., Markel Corporation, W.R. Berkley Corporation, Kinsale Capital Group, Inc. and James River Group Holdings, Ltd. In addition, many large generalist insurance companies have some specialty business as a subset of their overall operations with which we may compete on a niche basis. Such large carriers with specialty operations include Allianz SE, Chubb Ltd., CNA Financial Corporation, American International Group, Inc., The Travelers Companies and various London-based Lloyd’s syndicates.
Traditionally, competition within the insurance industry focused on providing the lowest priced policies, with customers viewing insurance as a commodity. However, we believe we provide a superior offering which competes based more on value creation than just price.
Human Capital
ProSight’s employees, its human capital, are a group of self-motivated “PROS” who thrive on making an impact. The employees are further guided by the company’s code of business conduct, helping them to uphold and strengthen the standards of honor and integrity that have defined our Company since its founding. In their everyday work, employees use a high-performance mindset and a diverse skillset to bring their expertise together to continually push the boundaries of what insurance can be for the niche businesses we insure. Our employees are energized by a good challenge and embrace each day as a new opportunity to accomplish more, collaborate more, and innovate more for our customers’ business success. Because when our customers succeed, we succeed.
Employees take pride in their work and value learning from one another. While they hold many values in common, ProSight employees appreciate different perspectives and embrace the opportunity to work with those of diverse backgrounds. ProSight encourages employees to become involved in their communities and many employees do contribute their time and talents to community efforts. Our employees contribute to the company’s efforts to provide a safe and healthy workplace for all, especially through 2020.
As of December 31, 2019,2020, we had 396351 employees. We consider our relationship with our employees to be good. None of our employees are represented by a labor union or party to a collective bargaining agreement.
Available Information
We maintain a public website at www.prosightspecialty.com. We use our website as a routine channel for distribution of important information, including news releases, analyst presentations, financial information and corporate
20
governance information. The information contained on, or that can be accessed through, our website is not part of, and is not incorporated into, this Annual Report on Form 10-K.Report.
21
REGULATION
Our business is subject to extensive regulation in the United States at both the state and federal level, including regulation under state insurance and federal laws. We cannot predict the impact of future state or federal laws or regulations on our business. Future laws and regulations, or the interpretation thereof, may materially adversely affect our financial condition and results of operations.
Insurance Regulation
General
Our insurance subsidiaries are subject to extensive regulation and supervision by the states in which they are domiciled, particularly with respect to their financial condition. New York Marine and Gotham are domiciled in New York where they are regulated and supervised by the New York Department of Financial Services (“NY DFS”). Southwest Marine is domiciled in Arizona where it is regulated and supervised by the Arizona Department of Insurance (“AZ DOI”).
Our insurance subsidiaries are also subject to regulation by all states in which they transact business, which oversight in practice often focuses on review of their market conduct. The extent and scope of insurance regulation varies between jurisdictions, but most jurisdictions have laws and regulations governing the financial security of insurers, including admittance of assets for purposes of calculating statutory surplus, standards of solvency, reserves, reinsurance, capital adequacy and the business conduct of insurers.
In addition, statutes and regulations usually require the licensing of insurers and their agents, the approval of policy forms and related materials and for certain lines of insurance, and the approval of rates. State statutes and regulations also prescribe the permitted types and concentrations of investments by insurers. The primary purposepurposes of this insurance industry regulation isare to protect policyholders.policyholders and ensure insurers’ solvency. P&C insurance companies are required to file detailed quarterly and annual statements with insurance regulatory authorities in each of the jurisdictions in which they are licensed or eligible to do business, and their operations and accounts are subject to periodic examination by such authorities. Regulators have discretionary authority, in connection with the continued licensing of insurance companies, to limit or prohibit the ability to issue new policies if, in their judgment, the regulators determine that an insurer is not maintaining minimum statutory surplus or capital or if the further transaction of business will be detrimental to its policyholders.
The amount of dividends that our insurance subsidiaries may pay to their stockholders, without prior approval by their respective domestic insurance regulators, is restricted under the laws of New York and Arizona.
Under New York law, the maximum amount of aggregate dividends that New York Marine or Gotham has authority to pay during any twelve month period without prior approval by the NY DFS is the lesser ofof: (i) ten percent of each of New York Marine’s or Gotham’s respective surplus as shown on the last statutory financial statement on file with the Superintendent of Insurance, including quarterly statements,statements; or (ii) one hundred percent of their respective adjusted net investment income during such twelve month period (where adjusted net investment income equals the net investment income for the 12-month period prior to the declaration or payment of the dividend plus the excess of net investment income over dividends paid in the two years prior thereto).
Under Arizona law, the maximum amount of aggregate dividends that Southwest Marine has authority to pay during any 12-month period without prior approval by the AZ DOI is the greater ofof: (i) ten percent of Southwest Marine’s surplus as of the immediately preceding December 3131; or (ii) Southwest Marine’s net income for the 12‑month12-month period ending the immediately prior December 31.
In addition, payments of dividends and advances or repayment of funds to the Company by our insurance subsidiaries are restricted by the applicable laws of our insurance subsidiaries’ respective jurisdictions requiring that
21
each insurance subsidiary hold a specified amount of minimum reserves in order to meet future obligations on its outstanding policies. These regulations specify that the minimum reserves shall be calculated to be sufficient to meet future obligations, giving consideration for required future premiums to be received, which are based on certain specified interest rates and methods of valuation, which are subject to change.
22
Insurance Holding Company Regulation
The Company is an insurance holding company and it, together with its insurance subsidiaries and its other subsidiaries and affiliates, is subject to the insurance holding company system laws of New York and Arizona. These laws vary across jurisdictions, but generally require an insurance holding company and insurers that are members of such insurance holding company’s system to register with the jurisdiction’s insurance regulatory authorities, to file reports disclosing certain information, including their capital structure, ownership, management, financial condition, enterprise risk and own risk and solvency assessment.
These laws also require disclosure of certain qualifying transactions between or among our insurance subsidiaries and the Company or any of our other subsidiaries or affiliates to which one or more of our insurance subsidiaries is a party. Such transactions could include loans, investments, sales, service agreements and reinsurance agreements among other similar inter-affiliate transactions. These laws also require that inter-company transactions be fair and reasonable. In certain circumstances, the insurance company must give prior notice of the transaction to the insurance department in its state of domicile, and the insurance department must either approve or disapprove the subject inter-company transaction within defined periods. Further, these laws require that an insurer’s contract holders’ surplus following any dividends or distributions to stockholder affiliates is reasonable in relation to the insurer’s outstanding liabilities and its financial needs.
The insurance holding company laws in some states, including New York and Arizona, require regulatory approval of a direct or indirect change of control of an insurer or an insurer’s parent company. Generally, to obtain approval from the insurance commissioner for any acquisition of control of an insurance company or its parent company, the proposed acquirer must file with the applicable commissioner an application containing information regarding: (i) the identity and background of the acquirer and its affiliates; (ii) the nature, source and amount of funds to be used to carry out the acquisition; (iii) the financial statements of the acquirer and its affiliates; (iv) any potential plans for disposition of the securities or business of the insurer; (v) the number and type of securities to be acquired; (vi) any contracts with respect to the securities to be acquired; (vii) any agreements with broker-dealers; and (viii) other matters. Different jurisdictions may have similar or additional requirements for prior approval of any acquisition of control of an insurance or reinsurance company licensed or authorized to transact business in those jurisdictions. Additional requirements may include re-licensing or subsequent approval for renewal of existing licenses upon an acquisition of control.
Statutory Examinations
We are required to file detailed quarterly and annual financial statements, in accordance with prescribed statutory accounting rules with regulatory officials in each of the jurisdictions in which we do business. As part of their routine regulatory oversight process, the NY DFS and AZ DOI conduct periodic detailed examinations, generally once every three to five years, of the books, records, accounts and operations of our insurance subsidiaries domiciled in their states.
Financial Tests
The National Association of Insurance Commissioners (“NAIC”) has developed a set of financial relationships or “tests”, known as the Insurance Regulatory Information System, (“IRIS”), which is designed for early identification of companies that may require special attention or action by insurance regulatory authorities. Insurance companies submit data annually to the NAIC, which in turn analyzes the data by utilizing ratios. State insurance regulators review this statistical report, which is available to the public, together with an analytical report, prepared by and available only to state insurance regulators, to identify insurance companies that appear to require immediate regulatory attention. A “usual range” of results for each ratio is used as a benchmark.
22
Risk-Based Capital Requirements
In order to enhance the regulation of insurers’ solvency, the NAIC adopted a model law to implement risk-based capital (“RBC”) requirements for P&C insurers. All states have adopted the NAIC’s model law or a substantively similar law. The NAIC Risk-Based Capital Model Act requires insurance companies to submit an annual RBC Report, which compares an insurer’s Total Adjusted Capital with its Authorized Control Level RBC. A company’s RBC is calculated by
23
using a specified formula that applies factors to various specified asset, premium, claim, expense and reserve items. The factors are higher for those items with greater underlying risk and lower for items with less underlying risk.
Total Adjusted Capital is defined as the sum of an insurer’s statutory capital and surplus and asset valuation reserve and the estimated amount of all dividends declared by the insurer’s board of directors prior to the end of the statement year that are not yet paid or due at the end of the year. The RBC Report is used by regulators to set in motion appropriate regulatory actions relating to insurers that show indications of weak or deteriorating conditions. RBC is an additional standard for minimum capital requirements that insurers must meet to avoid being placed in rehabilitation or liquidation by regulators. The annual RBC Report, and the information contained therein, is not intended by the NAIC as a means to rank insurers.
RBC is a method of measuring the minimum amount of capital appropriate for an insurance company to support its overall business operations in light of its size and risk profile. It provides a means of setting the capital requirement in which the degree of risk taken by the insurer is the primary determinant. The value of an insurer’s Total Adjusted Capital in relation to its RBC, together with its trend in its Total Adjusted Capital, is used as a basis for determining regulatory action that a state insurance regulator may be authorized or required to take with respect to an insurer. The four determinations, potentially applicable under each jurisdiction’s laws, are essentially as follows:
| Company Action Level Event. Total Adjusted Capital is greater than or equal to 150% but less than 200% of RBC or Total Adjusted Capital greater than or equal to 200% but less than 250% of RBC, and has a negative trend. If there is a Company Action Level Event, the insurer must submit a plan (an RBC Plan) outlining, among other things, the corrective actions it intends to take in order to remedy its capital deficiency. |
| Regulatory Action Level Event. Total Adjusted Capital is greater than or equal to 100% but less than 150% of RBC or the insurer has failed to comply with filing deadlines for its RBC Report or RBC Plan. If there is a Regulatory Action Level Event, the insurer is also required to submit an RBC Plan. In addition, the insurance regulator must undertake a comprehensive examination of the insurer’s financial condition and must issue any appropriate corrective orders. |
| Authorized Control Level Event. Total Adjusted Capital is below RBC but greater than or equal to 70% of RBC or the insurer has failed to respond to a corrective order. As noted above, if there is an Authorized Control Level Event, the insurance regulator may seek rehabilitation or liquidation of the insurer if it deems it to be in the best interests of the policyholders and creditors of the insurer and the public. |
| Mandatory Control Level Event. Total Adjusted Capital is below 70% of RBC. If there is a Mandatory Control Level Event, the insurance regulator must seek rehabilitation or liquidation of the insurer. |
Market Conduct
Our insurance subsidiaries are subject to periodic market conduct exams (“MCE”) in any jurisdiction where they do business. An MCE typically entails review of business activities, such as operations and management, complaint handling, marketing and sales, producer licensing, policyholder service, underwriting and rating, and claims handling. Regulators may impose fines and penalties upon finding violations of regulations governing such business activities.
23
Rate and Form Approvals
Our insurance subsidiaries are subject to each state’s laws and regulations regarding rate and form approvals. The applicable laws and regulations are used by states to establish standards to ensure that rates are not excessive, inadequate, unfairly discriminatory or used to engage in unfair price competition. An insurer’s ability to increase rates and the relative timing of the process are dependent upon each state’s respective requirements.
24
Assessments Against Insurers
Under the insurance guaranty fund laws existing in each state, Washington D.C., Puerto Rico and the Virgin Islands, licensed insurers can be assessed by insurance guaranty associations for certain obligations of insolvent insurance companies to policyholders and claimants. Most of these laws provide for annual limits on the assessments and for an offset against state premium taxes. These premium tax offsets must be spread over future periods ranging from five to 20 years. Since these assessments typically are not made for several years after an insurer fails and depend upon the final outcome of liquidation or rehabilitation proceedings, we cannot accurately determine the amount or timing of any future assessments.
Regulation of Investments
We are subject to state laws and regulations that require diversification of our investment portfolios and limit the amounts of investments in certain asset categories, such as below-investment grade fixed income securities, equity, real estate, other equity investments and derivatives. Failure to comply with these requirements and limitations could cause affected investments to be treated as non-admitted assets for purposes of measuring statutory surplus and, in some instances, could require the divestiture of such non-qualifying investments.
Privacy Regulation
Federal and state law and regulation require financial institutions to protect the security and confidentiality of personal information, including health-related and customer information, and to notify customers and other individuals about their policies and practices relating to their collection and disclosure of health-related and customer information and their practices relating to protecting the security and confidentiality of that information. State laws regulate the use and disclosure of social security numbers and federal and state laws require notice to affected individuals, law enforcement, regulators and others if there is a breach of the security of certain personal information, including social security numbers. Federal and state laws and regulations regulate the ability of financial institutions to make telemarketing calls and to send unsolicited e-mail or fax messages to consumers and customers. Federal and state lawmakers and regulatory bodies may be expected to consider additional or more detailed regulation regarding these subjects and the privacy and security of personal information. Notably, the California Consumer Protection Act (“CCPA”), which went into effect on January 1, 2020, is a data privacy law which may impact our cybersecurity program, use of data, and costs associated with compliance. The law contains a number of requirements regarding use of personal information of California consumers, provides those consumers new rights under the law concerning protection of their data, and establishes a private right of action in certain cases of data breach. We expect additional data privacy laws could be enacted in other jurisdictions in which we operate in coming years.
Cybersecurity Regulation
The NY DFS issued a new regulation, effective March 1, 2017, that requires banks, insurance companies, and other financial services institutions regulated by the NY DFS, to establish and maintain a cybersecurity program designed to protect consumers and ensure the safety and soundness of New York State’s financial services industry. The cybersecurity regulation adds specific requirements for these institutions’ cybersecurity compliance programs and imposes an obligation to conduct ongoing, comprehensive risk assessments. Further, on an annual basis, each institution is required to submit a certification of compliance with these requirements. In addition to New York’s cybersecurity regulation, the NAIC adopted the Insurance Data Security Model Law in October 2017. Under the model law, institutions that are compliant with the NY DFS cybersecurity regulation are deemed also to be in compliance with the model law. As of December 31, 2019, eight2020, nine states have adopted the model law or a variation of it and other states are expected to consider adopting the model law or a variation of it in the near future. We expect that additional regulations could be enacted in other jurisdictions that could impact our cybersecurity program. Depending on these and other potential implementation requirements, we will likely incur additional costs of compliance.
25
Bank Holding Company Act
24
Due to the size of Goldman Sachs’ current voting and economic interest in us, we are deemed to be controlled by Goldman Sachs for purposes of the BHCBank Holding Company (“BHC”) Act and, therefore, are considered to be a “subsidiary” of Goldman Sachs under the BHC Act. Accordingly, we have agreed to certain covenants in the Stockholders’ Agreement (as later defined) for the benefit of Goldman Sachs that are intended to facilitate its compliance with the BHC Act, but that may impose certain obligations on us. Restrictions placed on Goldman Sachs as a result of supervisory or enforcement actions under the BHC Act or otherwise may restrict us or our activities in certain circumstances, even if these actions are unrelated to our conduct or business. For additional information, see Item 1A. Risk Factors — Legal and Regulatory Risks, — We are subject to banking regulations that may limit our business activities, on this Annual Report on Form 10-K.Report.
2526
You should carefully consider the risks described below together with the other information set forth in this Annual Report on Form 10-K (“Annual Report”), which could materially affect our business, financial condition and future results. The risks described below are not the only risks facing our company. Risks and uncertainties not currently known to us or that we currently deem to be immaterial also may materially adversely affect our business, financial condition and operating results. If any of the following risks are realized, our business, financial condition, results of operations and prospects could be materially and adversely affected. In that event, the trading price of our common stock could decline.
RISK FACTORS SUMMARY
Our business is subject to a number of risks, including risks that may prevent us from achieving our business objectives or may adversely affect our business, financial condition and results of operations. These risks are discussed more fully below and include, but are not limited to, risks related to:
Risks Related to the Proposed Merger
| ● | The effect of the pendency of the proposed merger on our business and results of operations |
| ● | Failure to complete the proposed merger |
Risks Related to Our Business
| ● | The COVID-19 pandemic and its effect on our results of operations, financial position or liquidity |
| ● | Loss of third-party distribution agents |
| ● | Inadequacy of loss reserve estimates |
| ● | Ineffectiveness of risk management policies |
| ● | The occurrence of technology breaches or failures of information technology systems |
| ● | Adverse changes in the economy |
| ● | Access to capital and market liquidity |
| ● | Our inability to start up or integrate new product opportunities |
| ● | Cyclical changes in the insurance industry |
| ● | Our ability to compete effectively |
| ● | A downgrade in our financial strength ratings from A.M. Best |
| ● | The effects of natural and man-made catastrophic events |
| ● | The uncertain effect of emerging claim and coverage issues |
| ● | Concentration of insurance and other risk exposures |
| ● | Negative developments in the workers’ compensation insurance industry |
| ● | Losses resulting from global climate change and acts of terrorism |
| ● | Our ultimate financial obligations to the buyers of our U.K. operations |
| ● | Failure of loss limitation methods |
| ● | The uncertainty of models used for risk and loss estimations |
| ● | The unavailability or unaffordability of reinsurance |
| ● | Retention of risk |
| ● | Inability or non-payment of losses by our reinsurers |
| ● | The effect of changes in the overall market and/or in the entities in which we invest on our investment results |
| ● | Changes in the method for determining the London Interbank Offered Rate |
| ● | Our dependence on the efforts of our principal executive officers and qualified key employees |
| ● | Performance of third-party vendors |
| ● | Employee and third-party error and misconduct |
| ● | Significant interruption in the operation of our facilities, systems and business functions |
| ● | Increasing regulatory focus on privacy issues |
27
| ● | Incurring increased costs as a result of operating as a public company |
| ● | Failure to protect our intellectual property rights |
| ● | Changes in accounting practices |
| ● | Failure to accurately and timely pay claims |
| ● | Failure of renewals of existing contracts to meet expectations |
Legal and Regulatory Risks
| ● | Compliance with governmental regulation |
| ● | The effect of new regulations on our business |
| ● | Regulatory restraints on our ability to receive dividends from our insurance subsidiaries |
| ● | Future changes to U.S. federal income tax laws |
| ● | Losses from litigation |
| ● | Limitations on our business due to banking regulations |
Risks Related to Our Status as an Emerging Growth Company
| ● | Exemptions from various reporting requirements |
| ● | Our election to use the extended transition period for complying with new or revised accounting standards |
Risks Related to Our Common Stock
| ● | Lack of, or unfavorable analyst reports |
| ● | Volatility of our stock price |
| ● | The significant influence of our principal stockholders |
| ● | Our option to rely on certain exemptions available for “controlled companies” |
| ● | The ability of our principal stockholders to sell their interests in us to a third-party |
| ● | Depression of our stock price caused by future sales |
| ● | Our plan not to pay dividends on our common stock in the near term |
| ● | The Court of Chancery of the State of Delaware as the exclusive forum for disputes between us and our stockholders |
| ● | Provisions in our certificate of incorporation, amended and restated bylaws and/or applicable laws may prevent or delay or prevent an acquisition of us, which decrease our stock price |
Risks Related to the Proposed Merger
The pendency of the proposed merger may adversely affect our business and results of operations.
On January 14, 2021, we entered into the Merger Agreement with Parent and Pedal Merger Sub, Inc., pursuant to which Parent has agreed to acquire all of our outstanding common stock for $12.85 per share in cash. The transaction is subject to closing conditions, including the receipt of required regulatory approvals.
There are numerous risks related to the proposed transaction, including the following:
| ● | we have incurred and will continue to incur expenses in connection with the proposed transaction, which could prove to be significant; |
| ● | our business and our operating and financial results may be materially adversely affected by the diversion of management’s time and attention and the expenses incurred in connection with the proposed merger; |
| ● | existing and potential legal proceedings may be instituted against us following announcement of the transaction that may delay the transaction, make it more costly or ultimately preclude it; |
| ● | the risk that the parties will not be able to obtain regulatory approvals, or the possibility that they may delay the transaction or that materially burdensome or adverse regulatory conditions may be imposed in connection with any such regulatory approvals; |
28
| ● | the Merger Agreement contains certain restrictions during the pendency of the transaction that may impact our ability to pursue certain business opportunities or strategic transactions; |
| ● | the proposed transaction may impact the continued availability of capital and financing to us before, or in the absence of, the consummation of the transaction; |
| ● | changes in applicable laws or regulations could impact the transaction; and |
| ● | disruptions and uncertainty relating to the transaction, whether or not it is completed, may harm our relationships with our employees (both current and prospective), customers, distributors, vendors or other business partners, and may result in a negative impact on our business. |
The Merger Agreement contains provisions that could discourage or make it difficult for a third party to acquire us prior to the completion of the proposed merger.
The Merger Agreement contains certain customary provisions that restrict our ability to solicit, or engage in discussions or negotiations regarding, alternative acquisition proposals from third parties prior to the completion of the proposed merger. The Merger Agreement entitles Parent to receive a termination fee of $23,435,669 plus enforcement costs and up to $5,000,000 of transaction expenses of Parent and Pedal Merger Sub, Inc. from us if (a) the Merger Agreement is terminated on account of having reached the end date, January 12, 2022, and within six months of termination we enter into or consummate an acquisition proposal for 50% or more of the our assets or equity that was publicly known before the termination; (b) we breached or failed to perform any of our representations, warranties, covenants or other conditions to the proposed merger, including with respect to our “no shop” and related covenants; or (c) we terminated the Merger Agreement because its Board of Directors determined, in good faith after consultation with its financial advisors and outside legal counsel, that a third-party Acquisition Proposal (as defined in the Merger Agreement) is a Superior Proposal (as defined in the Merger Agreement).These provisions might discourage an otherwise-interested third party from considering orproposing an acquisition of us, even one that may be of greater value to our stockholders than the proposed merger. Furthermore, even if a thirdparty elects to propose an acquisition, our obligation to reimburse Parent for transaction expenses may result in that third party offeringa lower value to our stockholders than the third party might otherwise have offered.
Failure to complete the proposed merger could negatively affect our business, financial condition, results of operations or stock price.
The completion of the proposed merger is subject to closing conditions, such as approval by regulatory authorities. These regulatory approvals include, among others: (i) approvals from the Arizona Department of Insurance and Financial Institutions and the New York State Department of Financial Services with respect to Parent’s applications for the acquisition of control with respect to our insurance subsidiaries domiciled in the relevant state; (ii) the expiration of the applicable waiting period under the Hart-Scott-Rodino Antitrust Improvements Act of 1976; (iii) the conclusion of a review by the Committee on Foreign Investment in the United States pursuant to Section 721 of Title VII of the Defense Production Act of 1950, as amended, including the regulations promulgated thereunder, codified at 31 C.F.R. Part 800, et seq.; and (iv) approvals required for the implementation of the adverse development cover and loss portfolio transfer transaction contemplated under the Merger Agreement. There can be no assurance that these conditions will be satisfied or that the proposed merger will otherwise occur.
If the proposed merger is not completed, we will be subject to several risks, including that:
| ● | we do not receive a termination fee from Parent after it terminates the Merger Agreement because the regulatory approvals are conditioned on the imposition of materially burdensome conditions, which, under the Merger Agreement, Parent and its affiliates are not required to accept; |
| ● | customers, agents or other parties with which we maintain business relationships may experience uncertainty about our future and seek alternative relationships with other parties or seek to alter their business relationships with us; |
| ● | our employees may experience uncertainty about their future roles with us, which might adversely affect our ability to retain and hire key personnel; |
| ● | we expect to incur transaction costs in connection with the proposed merger regardless of whether the proposed merger is completed, and such costs could prove to be significant; |
29
| ● | we may not realize any of the anticipated benefits of having completed the proposed merger; and |
| ● | if the Merger Agreement is terminated and there are no other parties willing and able to acquire us at a price of $12.85 per share or higher and on other terms acceptable to us, the market price of our shares of common stock may decline. |
Risks Related to Our Business
The impact of COVID-19 and related risks could materially affect our results of operations, financial position or liquidity.
Beginning in March 2020, the pandemic related to the novel coronavirus COVID-19 began to impact the global economy. Because of the size and breadth of this pandemic, all of the direct and indirect consequences of COVID-19 are not yet known and may not emerge for some time. Risks presented by the ongoing effects of COVID-19 could include, without limitation, the following:
| ● | Revenues. The impact of COVID-19 on general economic activity has negatively impacted our premium volumes in the second, third and fourth quarters of 2020, and may continue to negatively impact our premium volumes to a degree that will vary based on the extent and duration of any economic contraction or related behavioral changes. |
| ● | Adverse Legislative and/or Regulatory Action. Federal, state and local government actions to address the impact of COVID-19 may continue to adversely affect us. We may become subject to legislative and/or regulatory action that retroactively mandates coverage for losses that our insurance policies were not intended or priced to cover, including business interruption claims, despite terms included in our policies to preclude coverage or that creates presumptions of compensability not otherwise present (including for example in workers’ compensation exposures). Regulatory requirements could also impact pricing, risk selection and our rights and obligations with respect to our policies and insureds, including our ability to cancel policies, collect premiums, or requiring us to refund premiums in a manner not otherwise required. |
| ● | Claims and Claim Adjustment Expenses. We may incur higher claims and claim adjustment expenses in certain lines of business due to increases in claims frequency and/or severity. Short-term and long-term impacts of COVID-19 could impact our various product lines in ways we cannot adequately predict. |
| ● | Losses and Loss Reserves. Anticipated and unknown risks related to COVID-19 may cause uncertainty in the process of estimating losses and loss reserves. As a result, our estimated loss reserves may change. Higher inflation than anticipated could lead to an increase in our loss costs and a need to strengthen loss reserves. Such impacts could be more pronounced for those lines of business requiring a relatively longer period of time to finalize and settle claims. |
| ● | Investments. The value of corporate, municipal and structured securities (including mortgage-backed securities) in our investment portfolio may be adversely impacted by ratings downgrades, government deficits, increased bankruptcies, credit spread widening, and real estate market disruption/devaluation, or could be subject to impairment as a result of issuer creditworthiness deterioration, default, and/or interest rate increases. Further disruption in global financial markets due to the continuing pandemic could result in net realized investment losses. |
| ● | Operational Disruptions and Heightened Cybersecurity Risks. Our operations could be disrupted if key members of management, a significant percentage of our workforce, or the workforce of certain third parties (including our agents, brokers or service providers) are unable to continue to work because of illness, government directives or otherwise. The interruption of system capabilities for our agents, brokers or service providers could result in deterioration of our ability to perform necessary business functions, and the shift to remote work arrangements by us, our business partners, and our service providers could heighten the risk of cybersecurity or data security incidents. |
30
| | |
| |
The extent of the impact of COVID-19 on our business, results of operations, financial position or liquidity will depend largely on future developments, which are highly uncertain and cannot be predicted. To the extent the COVID-19 pandemic continues to adversely affect the U.S. or global economy or adversely affects our business, results of operations, financial position or liquidity, it may also have the effect of increasing the likelihood or magnitude of the other risks described in the Annual Report. Additional risks and uncertainties not currently known to us or that we deem to be immaterial also may materially and adversely affect our business, results of operations, financial position or liquidity.
Third-party agents we rely upon to distribute certain business on our behalf may be acquired or terminate their agreements with us, or may not perform as anticipated, which could have an adverse effect on our business and results of operations.
Although we distribute our products through a variety of distribution channels, our distribution strategy is primarily focused on key agents. Our distribution model therefore relies partially upon the expertise, creditworthiness and performance of certain of our key agents. Several of these agents are responsible for a significant portion of the premium written by us. For the year ended December 31, 2019,2020, our top three MGUs distributed 28.2%33.7% of our insurance by GWP from customer segments. While this model provides many benefits to us and our customers, such agents have in the past, and may in the future elect to renegotiate the terms of existing relationships, or reduce or terminate their distribution relationships with us as a result of industry consolidation of distributors or other industry changes that increase the competition for access to distributors, developments in legislation or regulation that affect our business, adverse developments in our business, adverse rating agency actions or concerns about market-related risks. In January 2019, Midlands Management Corporation (“Midlands”), an MGU for the Self-Insured Groups niches, was acquired by a third-party insurance carrier. In 2019,2020, we wrote no GWP through Midlands and $69.1 million of GWP through Midlands and $121.8 million of GWP in 2018.2019. We seek to mitigate these risks in part through our contractual relationships with these agents, including in our MGU agreements, which in most cases have us retaining control over our intellectual property and maintaining the right to either exclusively pursue or to compete directly for our customers if an MGU terminates their relationship with us. In each case, we maintain the right to compete more generally in the niche. Nevertheless, an interruption in certain key relationships could cause operational difficulties, an inability to meet obligations (including, but not limited to, policyholder obligations), a loss of business and increased costs or suffer other negative consequences, all of which may have a material adverse effect on our business and results of operations.
In addition, our agents may fail to perform as anticipated or adhere to their obligations to us. Although our agents are subject to stringent guidelines, limited underwriting authority, ongoing oversight by our employees and monitoring through regular audits and other procedures, which have in the past enabled us to detect and remedy incidents of non-adherence, our efforts may not be adequate to prevent or detect such breaches. If our agents materially exceed their authorities or otherwise breach obligations owed to us and we are unable to timely identify and remedy such breaches, our business and results of operations could be adversely affected.
Our loss reserves are based on estimates and may be inadequate to cover our actual insured losses, which would negatively impact our profitability.
Significant periods of time often elapse between the occurrence of an insured loss, the reporting of the loss to us and our payment of that loss. To recognize liabilities for unpaid losses, we establish reserves as balance sheet liabilities representing estimates of amounts needed to pay reported and unreported losses and the related loss adjustment expense (“LAE”). Loss reserves are estimates of the ultimate cost of claims and do not represent a precise calculation of any ultimate liability. These estimates are based on historical information and on estimates of future trends that may affect the frequency and severity of claims that may be reported in the future. Estimating loss reserves is a difficult, complex
26
and inherently uncertain process involving many variables and subjective judgments. As part of the reserving process, we review historical data and consider the impact of various factors such as:
| loss emergence and cedant reporting patterns; |
31
| underlying policy terms and conditions; |
| business and exposure mix; |
| trends in claim frequency and severity; |
| changes in operations; |
| emerging economic and social trends; |
| inflation; and |
| changes in the regulatory and litigation environments. |
This process assumes that past experience, adjusted for the effects of current developments and anticipated trends, is an appropriate basis for predicting future events. It also assumes that adequate historical or other data exists upon which to make these judgments. For more information on the estimates used in the establishment of loss reserves, see Item 7. Management’s Discussion and Analysis of Financial Condition and Results of Operations — Critical Accounting Policies — Reserves for unpaid losses and LAE on this Annual Report on Form 10-K.Report. However, there is no precise method for evaluating the impact of any specific factor on the adequacy of reserves and actual results are likely to differ from original estimates, perhaps materially. Some of our reserves were established for exposure to liabilities acquired through our acquisition of New York Marine and General Insurance Company, Inc., a specialty commercial insurance company, in 2010. These liabilities were not subject to our highly structured underwriting process, include asbestos, environmental and products liabilities and are subject to similar risks and uncertainties as P&C risks underwritten by us after the acquisition, including difficulties of estimating loss reserves, pricing risk and pricing reinsurance. The net loss reserves related to accident years 20102011 and prior were $54.6$75.8 million as of December 31, 20192020 or 4.1%5.3% of our total net loss reserves. If the actual amount of insured losses is greater than the amount we have reserved for these losses, our profitability could suffer.
Our risk management policies and procedures may prove to be ineffective and leave us exposed to unidentified or unanticipated risk, which could adversely affect our businesses or results of operations.
We have developed and continue to develop enterprise-wide risk management policies and procedures to mitigate risk and loss to which we are exposed. There are, however, inherent limitations to risk management strategies because there may exist, or develop in the future, risks that we have not appropriately anticipated or identified. If our risk management policies and procedures are ineffective, we may suffer unexpected losses and could be materially adversely affected. As our business changes and the niches in which we operate evolve, our risk management framework may not evolve at the same pace as those changes. As a result, there is a risk that new products or new business strategies may present risks that are not appropriately identified, monitored or managed. In times of market stress, unanticipated market movements or unanticipated claims experience, the effectiveness of our risk management strategies may be limited, resulting in losses to us. In addition, there can be no assurance that we can effectively review and monitor all risks or that all of our employees will follow our risk management policies and procedures.
Moreover, the National Association of Insurance Commissioners (the “NAIC”) and state legislatures and regulators have increased their focus on risks within an insurer’s holding company system that may pose enterprise risk to insurers. The NY DFS, the primary regulator of New York Marine and Gotham, has adopted regulations implementing a requirement under the New York Insurance Law for insurance holding companies to adopt a formal
27
enterprise risk management (“ERM”) function and to file an annual enterprise risk report. NY DFS regulation also requires domestic insurers to conduct an own risk and solvency assessment (“ORSA”) and to submit an ORSA summary report prepared in accordance with the NAIC’s ORSA Guidance Manual. In addition, the Company and Southwest Marine, whose primary regulator is the AZ DOI, are subject to similar ERM and ORSA requirements. We operate within an ERM framework designed to assess and monitor our risks. However, there can be no assurance that we can effectively review and monitor
32
all risks, or that all of our employees will operate within the ERM framework or that our ERM framework will result in us accurately identifying all risks and accurately limiting our exposures based on our assessments.
Technology breaches or failures of our or our business partners’ systems, including but not limited to cybersecurity incidents, could disrupt our operations and result in the loss of critical and confidential information, which could adversely impact our reputation and results of operations.
Global cybersecurity threats can range from uncoordinated individual attempts to gain unauthorized access to our information technology systems and those of our business partners or service providers to sophisticated and targeted measures known as advanced persistent threats. While we and our business partners and service providers employ measures to prevent, detect, address and mitigate these threats (including access controls, data encryption, vulnerability assessments, continuous monitoring of information technology networks and systems and maintenance of backup and protective systems), cybersecurity incidents, depending on their nature and scope, could potentially result in the misappropriation, destruction, corruption or unavailability of critical data and confidential or proprietary information (our own or that of third parties) and the disruption of business operations. Security breaches could expose us to litigation and potential liability. In addition, cyber incidents that impact the availability, reliability, speed, accuracy or other proper functioning of our technology systems could affect our operations. We may not have the resources or technical sophistication to anticipate or prevent every type of cyber-attack. A significant cybersecurity incident, including system failure, security breach, disruption by malware or other damage could interrupt or delay our operations, result in a violation of applicable privacy and other laws, damage our reputation, cause a loss of customers or give rise to monetary fines and other penalties, any or all of which could be material. It is possible that insurance coverage we have in place would not entirely protect us in the event that we experienced a cybersecurity incident, interruption or widespread failure of our information technology systems.
Adverse changes in the economy could lower the demand for our insurance products and could have an adverse effect on the revenue and profitability of our operations.
Factors such as business revenue, government spending, the volatility and strength of the capital markets and inflation can all affect the business and economic environment. These same factors affect our ability to generate revenue and profits. Insurance premiums in our markets are heavily dependent on variables such as our customer revenues, values transported, miles traveled and number of new projects initiated. In an economic downturn that is characterized by higher unemployment and reduced corporate revenues, the demand for insurance products is adversely affected. Adverse changes in the economy may lead our customers to have less need for insurance coverage, to cancel existing insurance policies, to modify coverage or to not renew with us, all of which affect our ability to generate revenue.
Access to capital and market liquidity may adversely affect our ability to take advantage of business opportunities as they arise and to fund our operations in a cost-effective manner.
Our ability to grow our business, either organically or through acquisitions, depends in part on our ability to access capital when needed. We cannot predict capital market liquidity or the availability of capital. We also cannot predict the extent and duration of future economic and market disruptions, the impact of government interventions into the market to address these disruptions and their combined impact on our industry, business and investment portfolios. If we need capital but cannot raise it, our business and future growth could be adversely affected. In addition, we cannot make any assurances that we will be able to refinance our debt, including our senior notes due November 2020, or obtain additional financing on terms acceptable to us, or at all. Our inability to refinance our indebtedness on commercially reasonable terms or at all could also adversely affect our business, financial condition and future growth.
28
We may not be able to effectively start up or integrate new product opportunities.
Our ability to grow our business depends, in part, on our creation, implementation and acquisition of new insurance products that are profitable and fit within our business model. New product launches as well as resources to integrate business acquisitions are subject to many obstacles, including ensuring we have sufficient business and systems processes, determining appropriate pricing, obtaining reinsurance, assessing opportunity costs and regulatory burdens and planning for internal infrastructure needs. If we cannot accurately assess and overcome these obstacles or we improperly implement new insurance products, our ability to grow profitably will be impaired.
33
Our results of operations and revenues may fluctuate as a result of many factors, including cyclical changes in the insurance industry.
The results of operations of companies in the insurance industry historically have been subject to significant fluctuations and uncertainties in demand, pricing and overall profitability, causing cyclical performance in the insurance industry. These cycles are characterized by periods of intense price competition due to excessive underwriting capacity as well as periods when shortages of capacity permit more favorable pricing. Among our competitive strengths have been our specialty product focus and our niche market strategy. In periods of intense competition, these strengths also expose us to actions by other, especially larger, insurance companies who seek to write additional premiums without appropriate regard for underwriting profitability. During weak markets characterized by lower prices, it may be difficult for us to grow or maintain premium volume levels without sacrificing underwriting profits. If we are not successful in maintaining rates or achieving rate increases, it may be difficult for us to improve or maintain underwriting profits or to grow or maintain premium volume levels. In addition, our overall profitability can be affected significantly by:
| rising levels of loss costs that we cannot anticipate at the time we price our coverages; |
| volatile and unpredictable developments, including man-made, weather-related and other natural catastrophes or terrorist attacks; |
| changes in the level of available reinsurance; |
| changes in the amount of losses resulting from new types of claims and new or changing judicial interpretations relating to the scope of insurers’ liabilities; and |
| the ability of our underwriters to accurately select and price risk and of our claim personnel to appropriately deliver fair outcomes. |
Furthermore, the demand for our insurance products across our customer segments can vary significantly, rising as the overall level of economic activity increases and falling as that activity decreases, causing our revenues to fluctuate. These fluctuations in results of operations and revenues may not reflect our long-term results and may cause the price of our securities to be volatile.
We compete with a large number of companies in the insurance industry for underwriting revenues.
We compete with a large number of other companies in our customer segments. During periods of intense competition for premium, we are exposed to the actions of other companies who may seek to write policies without the appropriate regard for risk and profitability. During these times, it is very difficult to grow or maintain premium volume without sacrificing underwriting discipline and income.
We face competition from a wide range of both from specialty insurance companies, underwriting agencies and intermediaries, as well as diversified financial services companies that are significantly larger than we are and that have significantly greater financial, marketing, management and other resources. Some of these competitors also have greater
29
market recognition and experience than we do. We may incur increased costs in competing for underwriting revenues. If we are unable to compete effectively in the markets in which we operate or expand our operations into new markets, our underwriting revenues may decline, as well as overall business results.
We focus on providing specialized products and services in our various niches, and we believe that the diversity and uniqueness of our business model inherently provides a certain degree of shelter from competition. However, as we continue to grow our market share within each niche, the risk of competition within that niche grows as our larger competitors tend to focus on obtaining business at scale (as opposed to at the individual customer level). We seek to mitigate this risk, and the risk of competition generally, in part by building contractual protections into our distributor relationships. For example, in most cases we retain control over our intellectual property and have the right either to
34
exclusively pursue our customers or to compete directly with our former MGU if they terminate their relationships with us. In each case, we maintain the right to compete more generally in the niche. However, there can be no assurance that our risk mitigation strategies will be effective.
A number of new, proposed or potential legislative or industry developments could further increase competition in our industry. These developments include:
| programs in which state-sponsored entities provide property insurance in catastrophe-prone areas or other “alternative markets” types of coverage; |
| changing practices, which may lead to greater competition in the insurance business; and |
| the emergence of insurtech companies and the development of new technologies, which may lead to disruption of current business models and the insurance value chain. |
New competition from these developments could cause the supply and/or demand for our insurance products to change, which could affect our ability to price our coverages at attractive rates and thereby adversely affect our underwriting results.
A downgrade in our Financial Strength Ratings (“FSRs”) from A.M. Best could negatively affect our results of operations.
FSRs are a critical factor in establishing the competitive position of insurance companies. Our insurance companies are rated for overall financial strength by A.M. Best. These FSRs reflect A.M. Best’s opinion of our financial strength, operating performance, strategic position and ability to meet our obligations to policyholders, and are not evaluations directed to investors. Our FSRs are subject to periodic review by such firms, and the criteria used in the rating methodologies is subject to change; as such, we cannot assure the continued maintenance of our current FSRs. All of our insurance subsidiaries’ FSRs were reviewed during 20192020 and were reaffirmed at a rating of “A-” (Excellent). In 2017, A.M. Best downgraded its “A” (Excellent) FSRs to “A-” (Excellent) for our insurance subsidiaries. Because FSRs have become an increasingly important factor in establishing the competitive position of insurance companies, if our FSRs are reduced from their current levels by A.M. Best, our competitive position in the industry, and therefore our business, could be adversely affected. A significant downgrade could result in a substantial loss of business, as policyholders might move to other companies with higher FSRs.
Our results of operations, liquidity, financial condition and FSRs are subject to the effects of natural and man-made catastrophic events.
Events such as hurricanes, windstorms, flooding, earthquakes, wildfires, solar storms, acts of terrorism, explosions and fires, cyber-crimes, product defects, mass torts and other catastrophes have adversely affected our
30
business in the past and could do so in the future. Such catastrophic events, and any relevant regulations, could expose us to:
| widespread claim costs associated with property and workers’ compensation claims; |
| losses resulting from a decline in the value of our invested assets; |
| losses resulting from actual policy experience that is adverse compared to the assumptions made in product pricing; |
| declines in value and/or losses with respect to companies and other entities whose securities we hold and counterparties with whom we transact business to whom we have credit exposure, including reinsurers, and declines in the value of investments; and |
| significant interruptions to our systems and operations. |
35
Natural and man-made catastrophic events are generally unpredictable. While we have structured our business and selected our niches in part to avoid catastrophic losses, our exposure to such losses depends on various factors, including the frequency and severity of the catastrophes, the rate of inflation and the value and geographic or other concentrations of insured companies and individuals. Vendor models and proprietary assumptions and processes that we use to manage catastrophe exposure may prove to be ineffective due to incorrect assumptions or estimates.
In addition, legislative and regulatory initiatives and court decisions following major catastrophes could require us to pay the insured beyond the provisions of the original insurance policy and may prohibit the application of a deductible, resulting in inflated catastrophe claims.
The effects of emerging claim and coverage issues on our business are uncertain.
As industry practices and economic, legal, judicial, social and other environmental conditions change, unexpected and unintended issues related to claims and coverage may emerge. These issues may adversely affect our business by either extending coverage beyond our underwriting intent or by increasing the number or size of claims. Examples of emerging claims and coverage issues include, but are not limited to:
| judicial expansion of policy coverage and the impact of new theories of liability; |
| plaintiffs targeting P&C insurers in purported class action litigation relating to claims-handling and other practices; |
| medical developments that link health issues to particular causes, resulting in liability claims; and |
| claims relating to unanticipated consequences of current or new technologies, including cyber-security related risks and claims relating to potentially changing climate conditions. |
In some instances, these emerging issues may not become apparent for some time after we have issued the affected insurance policies. As a result, the full extent of liability under our insurance policies may not be known until many years after the policies are issued.
In addition, the potential passage of new legislation designed to expand the right to sue, to remove limitations on recovery, to extend the statutes of limitations or otherwise to repeal or weaken tort reforms could have an adverse impact on our business.
31
The effects of these and other unforeseen emerging claim and coverage issues are difficult to predict and could harm our business and materially adversely affect our results of operations.
Concentration of our insurance and other risk exposures may adversely affect our results of operations.
We may be exposed to risks as a result of concentrations in our insurance policies. We manage these concentration risks by monitoring the accumulation of our exposures to factors such as exposure type, industry, geographic region, customer and other factors. We also seek to use reinsurance, hedging and other arrangements to limit or offset exposures that exceed the limits we wish to retain. In certain circumstances, however, these risk management arrangements may not be available on acceptable terms or may prove to be ineffective for certain exposures. Also, our exposure for certain single risk coverages and other coverages may be so large that losses could exceed our expectations and could have a potentially material adverse effect on our consolidated results of operations or result in additional statutory capital requirements for our subsidiaries.
36
Negative developments in the workers’ compensation insurance industry could adversely affect our financial condition and results of operations.
Although we engage in other businesses, approximately 18.6%8.9% of our GWP are currently attributable to workers’ compensation insurance policies providing both primary and excess coverage. As a result, negative developments in the economic, competitive or regulatory conditions affecting the workers’ compensation insurance industry could have an adverse effect on our financial condition and results of operations. In certain states in which we do business, insurance regulators set the premium rates we may charge, which has the potential to restrict our profits. In addition, if one of our larger markets were to enact legislation to increase the scope or amount of benefits for employees under workers’ compensation insurance policies without related premium increases or loss control measures, this could negatively affect our financial condition and results of operations.
Global climate change may in the future increase the frequency and severity of weather events and resulting losses, particularly to the extent our policies are concentrated in geographic areas where such events occur, may have an adverse effect on our business, results of operations and financial condition.
Scientific evidence indicates that manmade production of greenhouse gas has had, and will continue to have, an adverse effect on the global climate. There is a growing consensus today that climate change increases the frequency and severity of extreme weather events and, in recent years, the frequency of extreme weather events appears to have increased. We cannot predict whether or to what extent damage that may be caused by natural events, such as wild fires, severe tropical storms and hurricanes, will affect our ability to write new insurance policies and reinsurance contracts, but, to the extent our policies are concentrated in the specific geographic areas in which these events occur, the increased frequency and severity of such events and the total amount of our loss exposure in the impacted areas of such events may adversely affect our business, results of operations and financial condition. In addition, although we have historically had limited exposure to catastrophic risk, claims from catastrophe events could reduce our earnings and cause substantial volatility in our business, results of operations and financial condition for any period. However, assessing the risk of loss and damage associated with the adverse effects of climate change and the range of approaches to address loss and damage associated with the adverse effects of climate change, including impacts related to extreme weather events and slow onset events, remains a challenge and might adversely affect our business, results of operations and financial condition.
We may have exposure to losses from acts of terrorism as we are required by law to provide certain coverage for such losses.
U.S. insurers are required by state and federal law to offer coverage for acts of terrorism in certain commercial lines, including workers’ compensation. The Terrorism Risk Insurance Act, as extended by the Terrorism Risk Insurance Program Reauthorization Act of 2019 (“TRIPRA”) requires commercial property and casualty insurance companies to offer coverage for acts of terrorism, whether foreign or domestic, and established a federal assistance program through
32
the end of 2027 to help cover claims related to future terrorism-related losses. The likelihood and impact of any terrorist act is unpredictable, and the ultimate impact on us would depend upon the nature, extent, location and timing of such an act. Although we reinsure a portion of the terrorism risk we retain under TRIPRA, our terrorism reinsurance does not provide full coverage for an act stemming from nuclear, biological or chemical terrorism. To the extent an act of terrorism, whether a domestic or foreign act, is certified by the Secretary of Treasury, we may be covered under TRIPRA of our losses for certain P&C lines of insurance. However, any such coverage would be subject to a mandatory deductible based on 20% of earned premium for the prior year for the covered lines of commercial property and casualty insurance. Based on our 20192020 earned premiums, our aggregate deductible under TRIPRA during 20202021 is approximately $133.4$113.7 million. The federal government will then reimburse us for losses in excess of our deductible, 80 percent in 2020,2021, up to a total industry program limit of $100 billion.
37
Our ultimate financial obligations to the buyers of our U.K. operations may be greater than expected, which could adversely affect our profitability.
As part of the 2017 sale transaction to divest our U.K.-based Lloyd’s of London business, which was placed in run-off in June of 2017, we retained three ongoing financial obligations. We: (i) committed to fund Lloyd’s Syndicate 1110’s “Funds at Lloyd’s” requirements until June 30, 2020 (the “FAL Obligation”),; however, due to a contractual dispute with respect to the substituting the Funds at Lloyd’s, the FAL Obligation commitment did not terminate on June 30, 2020, (ii) entered a 100% Quota Share reinsurance agreement as reinsurer, covering U.S.-sourced business written by Lloyd’s Syndicate 1110, and (iii) entered into Aggregate Stop Loss and 100% Quota Share reinsurance agreements as reinsurer on U.K.-sourced business, with Lloyd’s Syndicate 1110 as our reinsured, the effect of which was that we absorb syndicate losses on U.K.-originated business above a threshold equivalent to the stated reserves at the time of the sale (the “U.K. Obligations”) and collateralize the reserves relating to such business.
We undertook each of these obligations with an estimated quantified exposure and an expectation that the exposure would decrease over time and based on our FAL Obligation contractually terminating on June 30, 2020, at which time the process of releasing our assets posted as Funds at Lloyd’s is to take place. The FAL Obligation was expected to terminate by June 30, 2020. However, the buyer disputed its contractual obligation with respect to substituting our Funds at Lloyd’s at that time. In February 2021, a U.K. court granted summary judgment in our favor requiring the buyer to substitute our Funds at Lloyd’s: however, such judgment is subject to appeal by the buyer. There is no assurance, however, that prior to that time the amount of the FAL Obligation will not increase by an amount greater than we expect or that the process of releasing those assets once our FAL Obligation terminates will not take longer than we expect. Similarly, there is no assurance that our ultimate exposure on the U.K. Obligations, will not be greater than expected due to more significant losses in the U.K. business. The impact of such an increase, or a dispute with Lloyd’s Syndicate 1110 over the calculation of that amount or on other matters, could cause our exposure under the U.K. Obligations to be greater than expected or the payment/release of collateral to us to occur later or in an amount that is lower than expected. The process of establishing reserves and related LAE is based on historical information and on estimates of future trends that may affect the frequency and severity of claims that may be reported in the future. This process assumes that past experience, adjusted for the effects of current developments and anticipated trends, is an appropriate basis for predicting future events. It also assumes that adequate historical or other data exists upon which to make these judgments. However, there is no precise method for evaluating the impact of any specific factor on the adequacy of reserves or other estimates, and actual results are likely to differ from original estimates, perhaps materially. If the actual time periods and amounts of losses are greater than the amounts we have reserved for and expect, our profitability could be adversely affected. To be updated.
The failure of any of the loss limitation methods we employ could have a material adverse effect on our financial condition and results of operations.
We seek to limit our loss exposure in a variety of ways, including adhering to maximum limitations on policies written in defined geographical zones, limiting niche size for each customer, establishing per-risk and per-occurrence limitations for each event, employing coverage restrictions and generally following prudent underwriting guidelines for each niche written. We also seek to limit our loss exposure through geographic and market niche diversification. Underwriting is a matter of judgment, involving assumptions about matters that are inherently unpredictable and beyond our control, and for which historical experience and probability analysis may not provide sufficient guidance. One or more future events could result in claims that substantially exceed our expectations, which could have a potentially material adverse effect on our financial condition and results of operations.
33
In addition, we seek to limit loss exposures by policy terms, exclusion from coverage and choice of legal forum. However, disputes relating to coverage and choice of legal forum also arise. As a result, various provisions of our policies, such as choice of legal forum, limitations or exclusions from coverage may not be enforceable in the manner we intend, or at all, and some or all of our loss limitation methods may prove ineffective.
38
Pricing for our products is subject to our ability to adequately assess risks and estimate losses, including the models that we use to do so. Given the inherent uncertainty of models, the usefulness of such models as a tool to evaluate risks is subject to a high degree of uncertainty that could result in actual losses that are materially different than our estimates, which may adversely affect our financial results.
We seek to price our insurance products such that insurance premiums, policy fees and charges, and future net investment income earned on revenues received will result in an acceptable profit in excess of expenses and the cost of paying claims. Our business is dependent on our ability to price our products effectively and charge appropriate premiums. Pricing adequacy depends on a number of factors and assumptions, including proper evaluation of insurance risks, our expense levels, net investment income realized, our response to rate actions taken by competitors, legal and regulatory developments and the ability to obtain regulatory approval for rate changes. Inadequate pricing could materially and adversely affect our financial condition and results of operations.
In addition, we rely on estimates of loss for certain events that are generated by computer-run models. We use these models to help us control risk accumulation, inform management and other stakeholders of capital requirements and to improve the risk-adjusted return profile or minimize the amount of capital required to cover the risks in each of our written policies. However, given the inherent uncertainty of modeling techniques and the application of these techniques, these models and databases may not accurately address a variety of matters which might affect certain of our policies.
Small changes in assumptions, which depend heavily on our expertise, judgment and foresight, can have a significant impact on modeled outputs. For example, although we have limited catastrophic loss exposure, we use catastrophe models that simulate loss estimates based on a set of assumptions. These assumptions address a number of factors that impact loss potential. We run many model simulations in order to understand the impact of these assumptions on a catastrophe’s loss potential, but there can be no assurance that our models will accurately predict catastrophic loss levels.
As a result of these factors, our reliance on estimates, models, data, assumptions and scenarios used to evaluate our entire risk portfolio may not produce accurate predictions. Consequently, we could incur losses both in the risks we underwrite and to the value of our investment portfolio, which could materially and adversely affect our financial condition and results of operations.
Reinsurance may not be available or affordable and may not be adequate to protect us against losses, which could be material.
Our subsidiaries are major purchasers of reinsurance and we use reinsurance as part of our overall risk management strategy. While reinsurance does not discharge our subsidiaries from their obligation to pay claims for losses insured under our policies, it does make the reinsurer liable to them for the reinsured portion of the risk. For this reason, reinsurance is an important tool to manage transaction and insurance risk retention and to mitigate losses from catastrophes. Market conditions beyond our control may impact the availability and cost of reinsurance and could have a material adverse effect on our business, financial condition and results of operations. For example, reinsurance may be more difficult or costly to obtain after a year with a large number of major catastrophes. We may, at certain times, be forced to incur additional costs for reinsurance or may be unable to obtain sufficient reinsurance on acceptable terms. In the latter case, we would have to accept an increase in exposure to risk, reduce the amount of business written by our insurance subsidiaries or seek alternatives in line with our risk limits, all of which could materially and adversely affect our business, financial condition and results of operations.
34
Additionally, the use of reinsurance placed in the capital markets, may not provide the same levels of protection as traditional reinsurance transactions. Any disruption, volatility and uncertainty in these markets, such as following a major catastrophic event, may limit our ability to access such markets on terms favorable to us or at all. Also, to the extent that we intend to use structures based on an industry loss index or other non-indemnity trigger rather than on actual losses incurred by us, we could be subject to residual risk.
39
Retentions in various lines of business expose us to potential losses.
We retain risk for our own account on business underwritten by our insurance subsidiaries. The determination to reduce the amount of reinsurance we purchase, or not to purchase reinsurance for a particular risk, customer segment or niche is based on a variety of factors, including market conditions, pricing, availability of reinsurance, our capital levels and our loss history. Such determinations increase our financial exposure to losses associated with such risks, customer segments or niches and, in the event of significant losses associated with such risks, customer segments or niches, could have a material adverse effect on our financial condition, liquidity and results of operations.
Our reinsurers may not pay on losses in a timely fashion, or at all, which could adversely affect our financial condition, liquidity and results of operations.
We purchase reinsurance to transfer part of the risk we have assumed (known as ceding) to a reinsurance company in exchange for part of the premium we receive in connection with the risk. Although reinsurance makes the reinsurer liable to us to the extent the risk is transferred or ceded to the reinsurer, it does not relieve us (the reinsured) of our liability to our policyholders. Accordingly, we are exposed to credit risk with respect to our insurance subsidiaries’ reinsurers to the extent the reinsurance receivable is not secured by collateral or does not benefit from other credit enhancements. We also bear the risk that a reinsurer may be unwilling to pay amounts we have recorded as reinsurance recoverable for any reason, including thatthat: (i) the terms of the reinsurance contract do not reflect the intent of the parties of the contract or there is a disagreement between the parties as to their intent,intent; (ii) the terms of the contract cannot be legally enforced,enforced; (iii) the terms of the contract are interpreted by a court or arbitration panel differently than intended,intended; (iv) the reinsurance transaction performs differently than we anticipated due to a flawed design of the reinsurance structure, terms or conditions,conditions; or (v) a change in laws and regulations, or in the interpretation of the laws and regulations, materially affects a reinsurance transaction. The insolvency of one or more of our reinsurers, or inability or unwillingness to make timely payments under the terms of our contracts, could have a potentially material adverse effect on our financial condition, liquidity and results of operations.
Our investment results and, therefore, our financial condition may be affected by changes in the business, financial condition or results of operations of the entities in which we invest, as well as changes in interest rates, government monetary policies, general economic conditions, liquidity and overall market conditions.
We invest the premiums we receive from customers until they are needed to pay expenses or policyholder claims. Income from these investments remaining after paying expenses and claims, remain invested and are included in retained earnings. A substantial portion of our investment portfolio is managed by Goldman Sachs Asset Management, L.P. (“GSAM”), and effective as of January 1, 2020, we have engaged New England Asset Management (“NEAM”) to additionally manage a portion of our investment portfolio. Both GSAM and NEAM manage their respective portions of our portfolio pursuant to our investment guidelines. Although these guidelines stress diversification and capital preservation, our investments are subject to a variety of risks and the value of our investment portfolio can fluctuate as a result of changes in the business, financial condition or results of operations of the entities in which we invest. In addition, fluctuations can result from changes in interest rates, credit risk, government monetary policies, liquidity of holdings and general economic conditions. We attempt to mitigate our interest rate and credit risks by having investment guidelines that are designed to result in a well-diversified portfolio of high-quality securities with varied maturities. These fluctuations may negatively impact our financial condition. However, we attempt to manage this risk through our investment guidelines, which provide specific requirements related to asset allocation, duration and security selection.
35
The historical performance of our investment portfolio should not be considered as indicative of the future results of our investment portfolio, our future results or any returns expected on our common stock.
Our investment portfolio’s returns have benefitted historically from investment opportunities and general market conditions that currently may not exist and may not repeat themselves, and there can be no assurance that we will be able to avail ourselves of profitable investment opportunities in the future. Furthermore, the historical returns of our investments
40
are not directly linked to our future results or returns on our common stock, which are affected by various factors, one of which is the value of our investment portfolio.
A significant amount of our assets is invested in marketable securities and subject to market fluctuations.
Our investment portfolio consists almost entirely of debt securities and credit-focused alternative investments. As of December 31, 2019,2020, our investment in marketable securities was approximately $2.2$2.4 billion, including cash and cash equivalents. As of that date, our portfolio of securities consisted of the following types of securities: corporate securities (61.0%(57.2%); mortgage-backed securities (14.3%(15.8%); collateralized loan obligations (8.2%(5.7%); U.S. government securities (2.3%(2.1%); asset-backed securities (3.4%(2.3%); limited partnerships (3.0%and limited liability companies (3.7%); short-term investments (2.0%(0.0%); cash and cash equivalents (1.3%(0.8%); commercial levered loans (0.6%(0.5%); state and municipal securities (3.6%(8.5%); government agency securities (1.3%): non-redeemable preferred stock securities (0.3%); bond exchange-traded funds (1.8%). As of December 31, 2019,2020, our portfolio included investments in funds managed by Pacific Investment Management Company LLC, Blackrock, Goldman Sachs, Barings LLC, Guggenheim Partners, MetLife, Voya Financial and Guggenheim Partners.New England Asset Management.
The fair value of these assets and the investment income from these assets fluctuate depending on general economic and market conditions. The fair value of securities generally decreases as interest rates rise. If significant inflation or an increase in interest rates were to occur, the fair value of our securities would be negatively affected. Conversely, if interest rates decline, investment income earned from future investments in securities will be lower. Some securities, such as mortgage-backed and other asset-backed securities, also carry prepayment risk as a result of interest rate fluctuations. Additionally, given the current extended period of low interest rates, we may not be able to successfully reinvest the proceeds from maturing securities at yields commensurate with our target performance goals.
The value of investments in securities is subject to impairment as a result of deterioration in the creditworthiness of the issuer, default by the issuer in the performance of its obligations in respect of the securities and/or increases in market interest rates. To a large degree, the credit risk we face is a function of the economy; accordingly, we face a greater risk in an economic downturn or recession. During periods of market disruption, it may be difficult to value certain of our securities, particularly if trading becomes less frequent and/or market data becomes less observable. There may be certain asset classes that were in active markets with significant observable data that become illiquid due to the current financial environment. In such cases, more securities may require additional subjectivity and management judgment.
Although the historical rates of default on state and municipal securities have been relatively low, our state and municipal securities could be subject to a higher risk of default or impairment due to declining municipal tax bases and revenue. Many states and municipalities operate under deficits or projected deficits, the severity and duration of which could have an adverse impact on both the valuation of our state and municipal securities and the issuer’s ability to perform its obligations thereunder. Additionally, our investments are subject to losses as a result of a general decrease in commercial and economic activity for an industry sector in which we invest, as well as risks inherent in particular securities.
Although we attempt to manage these risks through the use of investment guidelines and other oversight mechanisms and by diversifying our portfolio and emphasizing preservation of principal, our efforts may not be successful. Impairments, defaults and/or rate increases could reduce our net investment income and net realized investment gains or result in investment losses. Investment returns are currently, and will likely continue to remain, under pressure due to the continued low inflation, actions by the Federal Reserve, economic uncertainty, more generally, and the shape of the yield curve. As a result, our exposure to the risks described above could materially and adversely affect our results of operations, liquidity and financial condition.
3641
Changes in the method for determining the London Interbank Offered Rate (“LIBOR”) and the potential replacement of LIBOR may affect our cost of capital and net investment income.
As a result of concerns about the accuracy of the calculation of LIBOR, a number of British Bankers’ Association (the “BBA”) member banks entered into settlements with certain regulators and law enforcement agencies with respect to the alleged manipulation of LIBOR. Actions by the BBA, regulators or law enforcement agencies as a result of these or future events may result in changes to the manner in which LIBOR is determined or its discontinuation.
On July 27, 2017, the Chief Executive of the U.K. Financial Conduct Authority (the “FCA”), which regulates LIBOR, announced that the FCA will no longer persuade or compel banks to submit rates for the calculation of the LIBOR benchmark after 2021. This announcement indicates that the continuation of LIBOR on the current basis cannot and will not be guaranteed after 2021, and it appears likely that LIBOR will be discontinued or modified by 2021.
Potential changes or uncertainty related to such potential changes or discontinuation may adversely affect the market for securities that reference LIBOR. In addition, changes or reforms to the determination or supervision of LIBOR may result in a sudden or prolonged increase or decrease in reported LIBOR, which could have an adverse impact on the market for securities that reference LIBOR or the value of our investment portfolio.
Our business is dependent on the efforts of our principal executive officers.
Our success is dependent on the efforts of our principal executive officers because of their industry expertise, knowledge of our markets and relationships with our distributors. Should any of these executive officers cease working for us, we may be unable to find acceptable replacements with comparable skills and experience in the specialty insurance industry and customer segments that we target, and our business may be adversely affected. We do not currently maintain life insurance policies with respect to our executive officers or other employees.
Effective as of May 1, 2019, Lawrence Hannon succeeded Joseph J. Beneducci as Chief Executive Officer of the Company. Mr. Beneducci, who iswas a founding member of the Company,, took over the role of Executive Chairman of the Company until his resignation, effective February 1, 2020. In connection with this transition, on May 3, 2019, the Company and Mr. Beneducci entered into a Transition and Separation Agreement pursuant to which, among other things, Mr. Beneducci agreed to provide transition services to us as an employee, including preparing for our IPO and facilitating an orderly transition of the Chief Executive Officer role. On January 23, 2020 we entered into an amendment to Mr. Beneducci’s Transition and Separation Agreement pursuant to which Mr. Beneducci will beis entitled to certain severance payments and benefits described in Item 11. Executive Compensation — Narrative Disclosure to Summary Compensation Table — Employment Agreements — Mr. Beneducci on this Annual Report on Form 10-K.benefits.
We may be unable to attract and retain qualified key employees.
We depend on our ability to attract and retain qualified executive officers, experienced underwriters and other skilled employees who are knowledgeable about our business. Providing suitable succession planning for such positions is also important. If we cannot attract or retain top-performing executive officers, underwriters and other employees, if the quality of their performance decreases or if we fail to implement succession plans for our key staff, we may be unable to maintain our current competitive position in the niches in which we operate or to expand our operations into new customer segments and niches.
Third-party vendors we rely upon to provide certain business and administrative services on our behalf may not perform as anticipated, which could have an adverse effect on our business and results of operations.
We have taken action to reduce coordination costs and take advantage of economies of scale by transitioning multiple functions and services to a small number of third-party providers. We periodically negotiate provisions and renewals of these relationships, and there can be no assurance that such terms will remain acceptable to us or such third
37
parties. If such third-party providers experience disruptions or do not perform as anticipated, or we experience problems with a transition to a third-party provider, we may experience operational difficulties, an inability to meet obligations (including,
42
(including, but not limited to, policyholder obligations), a loss of business and increased costs, or suffer other negative consequences, all of which may have a material adverse effect on our business and results of operations.
Employee and third-party error and misconduct may be difficult to detect and prevent and may result in significant losses.
There have been a number of cases involving fraud or other misconduct by employees in the financial services industry in recent years and we run the risk that employee or agent misconduct could occur. Instances of fraud, illegal acts, errors, failure to document transactions properly or to obtain proper authorization, misuse of customer or proprietary information, or failure to comply with regulatory requirements or our policies may result in losses and/or reputational damage. In the past, our audits and procedures have led us to identify an incident of fraud by one of our agents, which resulted in enhancements to our monitoring and audit procedures and no other employee or agent fraud has been identified to date. Nevertheless, it is not always possible to deter or prevent misconduct, and the controls that we have in place to prevent and detect this activity may not be effective in all cases.
Any significant interruption in the operation of our facilities, systems and business functions could adversely affect our results of operations.
We rely on multiple computer systems to interact with customers, issue policies, pay claims, run modeling functions, assess insurance risks and complete various important internal processes including accounting and bookkeeping. Our business is highly dependent on our ability to access these systems to perform necessary business functions. Additionally, some of these systems may include or rely upon third-party systems not located on our premises. Any of these systems may be exposed to unplanned interruption, unreliability or intrusion from a variety of causes, including among others, storms and other natural disasters, terrorist attacks, utility outages, security breaches or complications encountered as existing systems are replaced or upgraded.
Any such issues could materially impact our company including the impairment of information availability, compromise of system integrity or accuracy, misappropriation of confidential information, reduction of our volume of transactions and interruption of our general business. Although we believe our computer systems are securely protected and continue to take steps to ensure they are protected against such risks, we cannot guarantee that such problems will never occur. If they do, interruption to our business and damage to our reputation, and related costs, could be significant, which could have a material adverse effect on our results of operations and cause losses.
Increasing regulatory focus on privacy issues and expanding laws could affect our business model and expose us to increased liability.
The regulatory environment surrounding information security and privacy is increasingly demanding. We are subject to numerous U.S. federal and state laws and non-U.S. regulations governing the protection of personal and confidential information of our customers or employees. On March 1, 2017, new cybersecurity rules took effect for financial institutions, insurers and certain other companies, like us, supervised by the NY DFS (the “NY DFS Cybersecurity Regulation”). The NY DFS Cybersecurity Regulation imposes significant new regulatory burdens intended to protect the confidentiality, integrity and availability of information systems. For additional information, see “Regulation — Cybersecurity Regulation”.
We will incur increased costs as a result of operating as a public company, and operating as a public company will place additional demands on our management.
As a public company, and particularly after we are no longer an emerging growth company, we will incur significant legal, accounting and other expenses that we did not incur as a private company. In addition, the Sarbanes-Oxley Act of 2002 (“Sarbanes-Oxley”) and rules subsequently implemented by the U.S. Securities and Exchange Commission (“SEC”) and the New York Stock Exchange (“NYSE”) have imposed various requirements on public
38
companies, including establishment and maintenance of effective disclosure and financial controls and corporate governance practices. Compliance with these requirements will place significant additional demands on our management
43
and will require us to enhance certain internal functions, such as investor relations, legal, financial reporting and corporate communications. Accordingly, these rules and regulations will increase our legal and financial compliance costs and will make some activities more time-consuming and costly. For example, we expect that these rules and regulations may make it more difficult and more expensive for us to obtain director and officer liability insurance.
Pursuant to Section 404(b) (“Section 404”) of Sarbanes-Oxley, we will beare required to furnish a report by our management on our internal control over financial reporting, including, once we are no longer an emerging growth company, an attestation report on internal control over financial reporting issued by our independent registered public accounting firm. To achieve compliance with Section 404 within the prescribed period, we will be engaged in a process to document and evaluate our internal control over financial reporting, which iswas both costly and time-consuming. In this regard, we will need to continue to dedicate internal resources, engage outside consultants and adopt a detailed work plan to assess and document the adequacy of internal control over financial reporting, continue steps to improve control processes, validate through testing that controls are functioning as documented and implement a continuous reporting and improvement process for internal control over financial reporting. Despite our efforts, there is a risk that neither we nor our independent registered public accounting firm will not be able to conclude within the prescribed timeframe that our internal control over financial reporting is effective as required by Section 404. This could result in an adverse reaction in the financial markets due to a loss of confidence in the reliability of our financial statements.
Any failure to protect our intellectual property rights could impair our intellectual property, proprietary technology platform and brand. In addition, we may be sued by third parties for alleged infringement of their proprietary rights.
Our success and ability to compete depend in part on our intellectual property, which includes our rights in our proprietary technology platform and our brand. We primarily rely on copyright, trade secret and trademark laws, and confidentiality or license agreements with our employees, customers, service providers, partners and others to protect our intellectual property rights. However, the steps we take to protect our intellectual property may be inadequate. Litigation brought to protect and enforce our intellectual property rights could be costly, time-consuming and distracting to management and could result in the impairment or loss of portions of our intellectual property. Additionally, our efforts to enforce our intellectual property rights may be met with defenses, counterclaims and countersuits attacking the validity and enforceability and scope of our intellectual property rights. Our failure to secure, protect and enforce our intellectual property rights could adversely affect our brand and adversely affect our business.
Our success depends also in part on our not infringing on the intellectual property rights of others. In the future, third parties may claim that we are infringing on their intellectual property rights, and we may be found to be infringing on such rights. Any claims or litigation could cause us to incur significant expenses and, if successfully asserted against us, could require that we pay substantial damages or ongoing royalty payments, prevent us from offering our products and services, or require that we comply with other unfavorable terms. Even if we were to prevail in such a dispute, any litigation could be costly and time-consuming and divert the attention of our management and key personnel from our business operations.
Changes in accounting practices and future pronouncements may materially affect our reported financial results.
Developments in accounting practices may require us to incur considerable additional expenses to comply, particularly if we are required to prepare information relating to prior periods for comparative purposes or to apply the new requirements retroactively. The impact of changes in current accounting practices and future pronouncements cannot be predicted but may affect the calculation of net income, stockholders’ equity and other relevant financial statement line items.
We are required to comply with statutory accounting principles (“SAP”). SAP and various components of SAP are subject to constant review by the NAIC and its task forces and committees, as well as state insurance departments, in an effort to address emerging issues and otherwise improve financial reporting. Various proposals are pending before
39
committees and task forces of the NAIC, some of which, if enacted, could have negative effects on insurance industry
44
participants. The NAIC continuously examines existing laws and regulations. We cannot predict whether or in what form such reforms will be enacted and, if so, whether the enacted reforms will positively or negatively affect us.
Our failure to accurately and timely pay claims could materially and adversely affect our business, financial condition, results of operations and prospects.
We must accurately and timely evaluate and pay claims that are made under our policies. Many factors affect our ability to pay claims accurately and timely, including the training and experience of our claims staff, our claims department’s culture and the effectiveness of our management, our ability to develop or select and implement appropriate procedures and systems to support our claims functions and other factors. Our failure to accurately and timely pay claims could lead to regulatory and administrative actions or material litigation, undermine our reputation in the marketplace and materially and adversely affect our business, financial condition, results of operations and prospects.
In addition, if we do not train new claims staff effectively or if we lose a significant number of experienced claims staff, our claims department’s ability to handle an increasing workload could be adversely affected. In addition to potentially requiring that growth be slowed in the affected markets, our business could suffer from decreased quality of claims work which, in turn, could adversely affect our operating margins.
If actual renewals of our existing contracts do not meet expectations, our written premiums in future years and our future results of operations could be materially adversely affected.
Many of our contracts are written for a one-year term. In our financial forecasting process, we make assumptions about the rates of renewal of our prior year’s contracts. The insurance and reinsurance industries have historically been cyclical businesses with intense competition, often based on price. If actual renewals do not meet expectations or if we choose not to write a renewal because of pricing conditions, our written premiums in future years and our future operations would be materially adversely affected.
Legal and Regulatory Risks
We are subject to extensive governmental regulation, which may adversely affect our ability to achieve our business objectives. Moreover, if we fail to comply with these regulations, we may be subject to penalties, including fines and suspensions, which may adversely affect our financial condition, results of operations and reputation.
Most insurance regulations are designed to protect the interests of policyholders rather than stockholders and other investors. These regulations, generally administered by a department of insurance in each state and territory in which we do business, relate to, among other things:
| approval of policy forms and premium rates; |
| standards of solvency, including risk-based capital measurements; |
| licensing of insurers; |
| restrictions on agreements with our large revenue-producing agents; |
| cancellation and non-renewal of policies; |
| restrictions on the nature, quality and concentration of investments; |
| restrictions on the ability of our insurance subsidiaries to pay dividends to us; |
| restrictions on transactions between our insurance subsidiaries and their affiliates; |
4045
| restrictions on the size of risks insurable under a single policy; |
| requiring deposits for the benefit of policyholders; |
| requiring certain methods of accounting; |
| periodic examinations of our operations and finances; |
| prescribing the form and content of records of financial condition required to be filed; and |
| requiring reserves for unearned premium, losses and other purposes. |
State insurance departments also conduct periodic examinations of the conduct and affairs of insurance companies and require the filing of annual, quarterly and other reports relating to financial condition, holding company issues, ERM and ORSA and other matters. These regulatory requirements could adversely affect or inhibit our ability to achieve some or all of our business objectives, including profitable operations in our various customer segments.
In addition, regulatory authorities have relatively broad discretion to deny or revoke licenses for various reasons, including the violation of regulations. In some instances, we follow practices based on our interpretations of regulations or practices that we believe may be generally followed by the industry. These practices may turn out to be different from the interpretations of regulatory authorities. If we do not have the requisite licenses and approvals or do not comply with applicable regulatory requirements, insurance regulatory authorities could fine us, preclude or temporarily suspend us from carrying on some or all of our activities in certain jurisdictions or otherwise penalize us. This could adversely affect our ability to operate our business. Further, changes in the laws and regulations applicable to the insurance industry or interpretations by regulatory authorities could adversely affect our ability to operate our business as currently conducted and in accordance with our business objectives.
In addition to regulations specific to the insurance industry, including the insurance laws of our principal state regulators (the NY DFS and AZ DOI), as a public company we will also be subject to the rules and regulations of the SEC and the NYSE, each of which regulate many areas such as financial and business disclosures, corporate governance and stockholder matters. Among other laws, we are subject to laws relating to federal trade restrictions, privacy/data security and terrorism risk insurance laws.
In mid-2019, we were provided with copies of three anonymous letters addressing essentially the same subject matter and strongly indicative of a single source. These letters contained allegations relating to our underwriting, pricing and reserving practices generally in connection with a single segment of our business. At this time, we cannot predict whether the SEC, state insurance regulators or other regulators will take any actions or what the impact of such actions could be. The audit committee of the Company,, with the assistance of our internal audit and internal legal personnel and outside counsel, has reviewed these matters carefully. Based on that review process, we have concluded that the allegations are not credible and accordingly do not present any issue material to our business practices, financial statements or disclosures.
We monitor these laws, regulations and rules on an ongoing basis to ensure compliance and make appropriate changes as necessary. Implementing such changes may require adjustments to our business methods, increases to our costs and other changes that could cause us to be less competitive in our industry. For further information on the regulation of our business, see “Regulation”.
New regulations may affect our business, financial condition, results of operations and ability to compete effectively.
Legislators and regulators may periodically consider various proposals that may affect our business practices and product designs, how we sell or service certain products we offer or the profitability of our business. We continually
4146
monitor such proposals and assess how they might apply to us or our competitors or how they could impact our business, financial condition, results of operations and ability to compete effectively.
We are an insurance holding company and our ability to receive dividends from our insurance subsidiaries is subject to regulatory constraints.
We are a holding company and, as such, we have no direct operations of our own. We do not expect to have any significant operations or assets other than our ownership of the shares of our operating subsidiaries. Unrestricted dividends payable from our insurance subsidiaries without the prior approval of applicable regulators are limited to the lesser of 10% of each of New York Marine’s or Gotham’s surplus as shown on the last statutory financial statement on file with the NY DFS or 100% of adjusted net investment income during the applicable twelve month period (where adjusted net investment income equals the net investment income for the twelve month period prior to the declaration or payment of the dividend plus the excess of net investment income over dividends paid in the two years prior thereto); and in Arizona, the greater of 10% of Southwest Marine’s surplus as of the immediately preceding December 31 or Southwest Marine’s net investment income for the period ending the immediately prior December 31. Dividends and other permitted payments from our operating subsidiaries are expected to be a source of funds to meet ongoing cash requirements, including debt service payments and other expenses. As of December 31, 2019,2020, the maximum amount of unrestricted dividends that our insurance subsidiaries could pay to us without approval was $54.7$66.8 million. There can be no assurances that our insurance subsidiaries will be able to pay dividends in the future, and the limitations of such dividends could adversely affect the Company’sCompany’s liquidity or financial condition.
We could be adversely affected by recent and future changes in U.S. federal income tax laws.
Recent tax legislation (Public Law 115-97), commonly referred to as the Tax Cuts and Jobs Act (“TCJA”), which was signed into law on December 22, 2017, fundamentally overhauls the U.S. tax system by, among other things, reducing the U.S. corporate income tax rate to 21%, repealing the corporate alternative minimum tax, limiting the deductibility of business interest expense, introducing a base erosion and anti-avoidance tax aimed at cross-border deductible payments to related foreign persons, moving closer to a territorial system of taxing earnings generated through foreign subsidiaries and imposing a one-time deemed repatriation tax on certain post-1986 undistributed earnings of foreign subsidiaries. In the context of the taxation of U.S. property and casualty insurance companies such as us, the TCJA modifies the loss reserve discounting rules and the proration rules that apply to reduce reserve deductions to reflect the lower corporate income tax rate. In addition, it is possible that other legislation could be introduced and enacted by the current Congress or future Congresses that could have an adverse impact on us. New regulations or pronouncements interpreting or clarifying provisions of the TCJA may be forthcoming. We cannot predict if, when or in what form such regulations or pronouncements may be provided or finalized, whether such guidance will have a retroactive effect or their potential impact on us.
We may suffer losses from litigation, which could adversely affect our business and financial condition.
As is typical in our industry, we continually face risks associated with litigation of various types, including general commercial and corporate litigation, and disputes relating to bad faith allegations which could result in us incurring losses in excess of policy limits. We are party to a variety of litigation matters throughout the year, mostly with respect to claims. Litigation is subject to inherent uncertainties, and if there were an outcome unfavorable to us, there exists the possibility of a material adverse impact on our results of operations and financial position in the period in which the outcome occurs. Even if an unfavorable outcome does not materialize, we still may face substantial expense and disruption associated with the litigation.
We are subject to banking regulations that may limit our business activities.
Goldman Sachs, affiliates of which own approximately 39.5%39.0% of the voting and economic interest in our business as of December 31, 2019,2020, is regulated as a bank holding company that has elected to be treated as a financial holding company under the Bank Holding Company Act of 1956, as amended (the “BHC Act”). The BHC Act imposes regulations
4247
regulations and requirements on Goldman Sachs and on any company that is deemed to be “controlled” by Goldman Sachs for purposes of the BHC Act and the regulations of the Board of Governors of the Federal Reserve System (the “Federal Reserve”) promulgated thereunder. Due to the size of its voting and economic interest in us, we are deemed to be controlled by Goldman Sachs for purposes of the BHC Act and, therefore, are considered to be a “subsidiary” of Goldman Sachs under the BHC Act. We will remain subject to this regulatory regime until Goldman Sachs is no longer deemed to control us for purposes of the BHC Act, which we do not have the ability to control and which will not occur until Goldman Sachs has significantly reduced its voting and economic interest in us. Restrictions placed on Goldman Sachs as a result of supervisory or enforcement actions under the BHC Act or otherwise may restrict us or our activities in certain circumstances, even if these actions are unrelated to our conduct or business. The Federal Reserve could exercise its power to restrict us from engaging in any activity that, in the Federal Reserve’s opinion, is unauthorized for us or constitutes an unsafe or unsound business practice. Although to date none of these restrictions or limitations have adversely affected our business, to the extent that the Federal Reserve’s regulations impose limitations on our business, we may be at a competitive disadvantage to those of our competitors that are not subject to such regulations.
As a subsidiary of a bank holding company, we are subject to examination by the Federal Reserve and could be required to provide information and reports for use by the Federal Reserve under the BHC Act. The Federal Reserve may also impose substantial fines and other penalties for violations of applicable banking laws, regulations and orders. In addition, as a subsidiary of Goldman Sachs, we are considered a “banking entity” and subject to the restrictions of Section 13 of the BHC Act, otherwise known as the “Volcker Rule”. The Volcker Rule prohibits banking entities from engaging in proprietary trading and from acquiring or retaining any ownership interest in, or sponsoring, a covered fund (which includes most private equity funds and hedge funds), subject to satisfying certain conditions, and, in certain circumstances, from engaging in credit related and other transactions with such funds. However, the Volcker Rule exempts from this prohibition regulated insurance companies directly engaged in the business of insurance where such investments are made for the general account of the company or by affiliates, subject to certain conditions. As we are a regulated insurance company whose investments are made for our general account, this exemption has not affected our investment approach. Changes in the provisions of the BHC Act that are made while we still qualify as a banking entity could alter our ability to invest, potentially impacting our profitability.
We have agreed to certain covenants in the Stockholders’ Agreement (as later defined) for the benefit of Goldman Sachs that are intended to facilitate its compliance with the BHC Act, but that may impose certain obligations on us. In particular, Goldman Sachs has rights to conduct audits on, and access certain of, our information, and we are obligated to establish (and have established) policies and procedures for compliance with law that are acceptable in form and substance to Goldman Sachs. These covenants will remain in effect as long as the Federal Reserve deems us to be a “subsidiary” of Goldman Sachs under the BHC Act.
Risks Related to Our Status as an Emerging Growth Company
We are an emerging growth company within the meaning of the Securities Act of 1933, as amended (the “Securities Act”) and because we have decided to take advantage of certain exemptions from various reporting and other requirements applicable to emerging growth companies, our common stock could be less attractive to investors.
For as long as we remain an “emerging growth company”, as defined in the Jumpstart Our Business Startups Act of 2012, as amended, we will have the option to take advantage of certain exemptions from various reporting and other requirements that are applicable to other public companies that are not emerging growth companies, including reduced disclosure obligations regarding executive compensation in our registration statements, periodic reports and proxy statements, not being required to comply with the auditor attestation requirements of Section 404 being permitted to have an extended transition period for adopting any new or revised accounting standards that may be issued by the Financial Accounting Standards Board (“FASB”) or the SEC, and exemptions from the requirements of holding a nonbinding advisory vote on executive compensation and stockholder approval of any golden parachute payments not previously approved.
4348
We will remain an emerging growth company until the earliest ofof: (i) the end of the fiscal year during which we have total annual gross revenues of $1.07 billion or more; (ii) the date on which we have, during the previous three-year period, issued more than $1.0 billion in non-convertible debt; (iii) the date we qualify as a “large accelerated filer”, which requires thatthat: (A) the market value of our equity securities that are held by non-affiliates exceeds $700 million as of June 30 of that year,year; (B) we have been a public reporting company under the Securities Exchange Act of 1934, as amended (“Exchange Act”) for at least twelve calendar monthsmonths; and (C) we have filed at least one annual report on Annual Report on Form 10-K; and (iv) the end of the fiscal year following the fifth anniversary of the completion of our initial public offering.
We expect to continue to avail ourselves of the emerging growth company exemptions described above. In addition, we may but do not expect to avail ourselves of the extended transition period for complying with new or revised accounting standards. As a result, the information that we provide to stockholders will be less comprehensive than what you might receive from other public companies.
Because we have elected to use the extended transition period for complying with new or revised accounting standards for an “emerging growth company” our financial statements may not be comparable to companies that comply with these accounting standards as of the public company effective dates.
We have elected to use the extended transition period for complying with new or revised accounting standards under Section 7(a)(2)(B) of the Securities Act. This election allows us to delay the adoption of new or revised accounting standards that have different effective dates for public and private companies until those standards apply to private companies. As a result of this election, our financial statements may not be comparable to companies that comply with these accounting standards as of the public company effective dates. Consequently, our financial statements may not be comparable to companies that comply with public company effective dates. Because our financial statements may not be comparable to companies that comply with public company effective dates, investors may have difficulty evaluating or comparing our business, performance or prospects in comparison to other public companies, which may have a negative impact on the value and liquidity of our common stock. We cannot predict if investors will find our common stock less attractive because we plan to rely on this exemption. If some investors find our common stock less attractive as a result, there may be a less active trading market for our common stock and our stock price may be more volatile.
Risks Related to Our Common Stock
If securities analysts do not publish research or reports about our business or our industry or if they issue unfavorable commentary or issue negative recommendations with respect to our common stock, the price of our common stock could decline.
The trading market for our common stock may be influenced by the research and reports that equity research and other securities analysts publish about us, our business and our industry. We do not have control over these analysts and we may be unable or slow to attract research coverage. One or more analysts could issue negative recommendations with respect to our common stock or publish other unfavorable commentary or cease publishing reports about us, our business or our industry. If one or more of these analysts cease coverage of us, we could lose visibility in the market. As a result of one or more of these factors, the market price of our common stock price could decline rapidly and our common stock trading volume could be adversely affected.
The price of our common stock may be volatile and may be affected by market conditions beyond our control.
Some factors that may cause the market price of our common stock to fluctuate, in addition to the other risks mentioned in this section of the Annual Report, are:
| our operating and financial performance and prospects; |
44
| our announcements or our competitors’ announcements regarding new products or services, enhancements, significant contracts, acquisitions or strategic investments; |
49
| changes in earnings estimates or recommendations by securities analysts who cover our common stock; |
| fluctuations in our quarterly financial results or earnings guidance or the quarterly financial results or earnings guidance of companies perceived to be similar to us; |
| changes in our capital structure, such as future issuances of securities, sales of large blocks of common stock by our stockholders, including our principal stockholders, or the incurrence of additional debt; |
| departure of key personnel; |
| reputational issues; |
| changes in general economic and market conditions; |
| changes in industry conditions or perceptions or changes in the market outlook for the insurance industry; and |
| changes in applicable laws, rules or regulations, regulatory actions affecting us and other dynamics. |
The stock market has experienced extreme price and volume fluctuations in recent years. The market prices of securities of insurance companies have experienced fluctuations that often have been unrelated or disproportionate to the operating results of these companies. These market fluctuations could result in extreme volatility in the price of shares of our common stock, which could cause a decline in the value of your investment. You should also be aware that price volatility may be greater if the public float and trading volume of shares of our common stock is low.
Our principal stockholders have significant influence over us, and their interests could conflict with those of our other stockholders.
Our principal stockholders hold approximately 77.5%76.4% of our common stock as of December 31, 2019.2020. As a result, our principal stockholders are able to influence matters requiring approval by our stockholders, including the election of directors and the approval of mergers or other extraordinary transactions. Our principal stockholders may also have interests that differ from our other stockholders and may vote in a way with which our other stockholders disagree and which may be adverse to the interests of our other stockholders. The concentration of ownership may also have the effect of delaying, preventing or deterring a change of control of the Company, could deprive our stockholders of an opportunity to receive a premium for their common stock as part of a sale of our Company and might ultimately affect the market price of our common stock.
In connection with our IPO we entered into a stockholders’ agreement with the principal stockholders (the “Stockholders’ Agreement”) that governs the relationship between us and the principal stockholders. The Stockholders’ Agreement provides, among other things, that two directors shall be designated for election to the Board of Directors by ProSight Parallel Investment LLC and ProSight Investment LLC (“PI”) ( collectively the “GS Investors”) and two directors shall be designated for election to the Board of Directors by ProSight TPG, L.P., TPG PS 1, L.P., TPG PS 2, L.P., TPG PS 3, L.P. and TPG PS 4, L.P. (collectively, the “TPG Investors”). These designation rights will diminish if either principal stockholder transfers more than a specified percentage of its ownership interest in the Company.Company. Our Board of Directors currently consists of ten directors. See Item 13 “Certain Relationships and Related Party Transaction — Relationship with the Principal Stockholders — Stockholders’ Agreement”. on this Annual Report.
45
As long as our principal stockholders own a majority of our common stock, we may rely on certain exemptions from the corporate governance requirements of the NYSE available for “controlled companies”.
We are a “controlled company” within the meaning of the corporate governance listing requirements of the NYSE because our principal stockholders own more than 50% of our outstanding common stock. A controlled company
50
may elect not to comply with certain corporate governance requirements of the NYSE. Accordingly, our Board of Directors will not be required to have a majority of independent directors and our Compensation Committee and Nominating and Governance Committee will not be required to meet the director independence requirements to which we would otherwise be subject until such time as we cease to be a “controlled company.” Notwithstanding this exemption, our Board of Directors, Compensation Committee and Nominating and Governance Committee currently meet the director independence requirements under the NYSE rules. If we elect to rely on “controlled company” exemptions, you will not have certain of the protections afforded to stockholders of companies that are subject to all of the corporate governance requirements of the NYSE.
Our principal stockholders could sell their interests in us to a third party in a private transaction, which may not lead to your realization of any change-of-control premium on shares of our common stock and would subject us to the influence of a presently unknown third party.
Our principal stockholders beneficially own a large percentage of our common stock. Our principal stockholders will have the ability, should they choose to do so, to sell some or all of their shares of our common stock in a privately negotiated transaction, which, if sufficient in size, could result in another party gaining significant influence over our Company.
The ability of our principal stockholders to sell their shares of our common stock privately, with no requirement for a concurrent offer to be made to acquire all of the shares of our outstanding common stock that will be publicly traded hereafter, could prevent you from realizing any change-of-control premium on your shares of our common stock that may accrue to our principal stockholders upon their private sales of our common stock.
Future sales of a substantial number of shares of our common stock may depress the price of our shares.
���
If our stockholders sell a large number of shares of our common stock, or if we issue a large number of shares of our common stock in connection with future acquisitions, financings, or other circumstances, the market price of shares of our common stock could decline significantly. Moreover, the perception in the public market that our stockholders might sell shares of our common stock could depress the market price of those shares. In addition, sales of a substantial number of shares of our common stock by our principal stockholders could adversely affect the market price of our common stock.
As of December 31, 2019,2020, we had 43,058,26643,657,099 outstanding shares of common stock.stock (including restricted share awards (“RSAs”) and performance-vesting share awards (“PSAs”)). Of these outstanding shares, all of the 9,035,7159,413,616 shares sold in the IPO are freely tradable without restriction under the Securities Act except for any shares held by our “affiliates”, as defined in Rule 144 under the Securities Act, including our principal stockholders.
In July 2019, we filed a registration statement on Form S-8 under the Securities Act to register the shares of common stock to be issued under our equity compensation plans and, as a result, all shares of common stock acquired upon conversion of equity awards granted under our plans are also freely tradable under the Securities Act, unless purchased by our affiliates. As of December 31, 2019, 2,191,6172020, 1,407,803 shares of our common stock are reserved for future issuances under the 2019 equity incentive plan adopted in connection with the IPO.IPO and 987,047 shares of our common stock are reserved for future issuances under the 2019 ESPP.
We do not anticipate declaring or paying regular dividends on our common stock in the near term, and our indebtedness could limit our ability to pay dividends on our common stock.
We do not currently anticipate declaring or paying regular cash dividends on our common stock in the near term. We currently intend to use our future earnings, if any, to pay debt obligations, to fund our growth and develop our
46
business and for general corporate purposes (which may include capital contributions to our insurance subsidiaries in conjunction with future growth of premiums written). Therefore, you are not likely to receive any dividends on your common stock in the near term, and the success of an investment in shares of our common stock will depend upon any future appreciation in their value. There is no guarantee that shares of our common stock will appreciate in value or even maintain the price
51
at which they are initially offered. Any future declaration and payment of dividends or other distributions of capital will be at the discretion of the Board of Directors and the payment of any future dividends or other distributions of capital will depend on many factors, including our financial condition, earnings, cash needs, regulatory constraints, capital requirements (including requirements of our subsidiaries) and any other factors that the Board of Directors deems relevant in making such a determination. In addition, the terms of the agreements governing the debt we incurred, or debt that we may incur, may limit or prohibit the payment of dividends. For more information, see “Dividends.” There can be no assurance that we will establish a dividend policy or pay dividends in the future or continue to pay any dividend if we do commence paying dividends pursuant to a dividend policy or otherwise.
Our amended and restated certificate of incorporation provides that the Court of Chancery of the State of Delaware is the exclusive forum for substantially all disputes between us and our stockholders, which could limit our stockholders’ ability to obtain a favorable judicial forum for disputes with us or our directors, officers or employees.
Our amended and restated certificate of incorporation provides that the Court of Chancery of the State of Delaware is the exclusive forum for any derivative action or proceeding brought on our behalf, any action asserting a breach of fiduciary duty, any action asserting a claim against us arising pursuant to the Delaware General Corporation Law (the “DGCL”) or any action asserting a claim against us that is governed by the internal affairs doctrine. Unless the Corporation consents in writing to the selection of an alternative forum, the exclusive forum for any action under the Securities Act or the Exchange Act shall be either the Court of Chancery of the State of Delaware or the federal district court for the District of Delaware. This exclusive forum provision will not apply to claims which are vested in the exclusive jurisdiction of a court or forum other than the Court of Chancery of the State of Delaware, for which the Court of Chancery of the State of Delaware does not have subject matter jurisdiction or, in the case of an action under the Securities Act or the Exchange Act, for which neither the Court of Chancery of the State of Delaware nor the federal district court for the District of Delaware has subject matter jurisdiction. This choice of forum provision may limit a stockholder’s ability to bring a claim in a judicial forum that the stockholder finds favorable for disputes with us or our directors, officers or other employees and may discourage these types of lawsuits. Alternatively, if a court were to find the choice of forum provision contained in our amended and restated certificate of incorporation to be inapplicable or unenforceable with respect to one or more of the specified types of actions or proceedings, we may incur additional costs associated with resolving such action in other jurisdictions, which could harm our business, financial condition and results of operations. For example, the Court of Chancery of the State of Delaware recently determined that a provision stating that federal district courts are the exclusive forum for resolving any complaint asserting a cause of action arising under the Securities Act is not enforceable. This decision may be reviewed and ultimately overturned by the Delaware Supreme Court.
Provisions in our amended and restated certificate of incorporation and amended and restated bylaws, of Delaware corporate and of state insurance laws, may prevent or delay an acquisition of us, which could decrease the trading price of our common stock.
Provisions of our amended and restated certificate of incorporation and amended and restated bylaws and of state law may delay, deter, prevent or render more difficult a takeover attempt that our stockholders might consider in their best interests. For example, such provisions or laws may prevent our stockholders from receiving the benefit from any premium to the market price of our common stock offered by a bidder in a takeover context. Even in the absence of a takeover attempt, the existence of these provisions may adversely affect the prevailing market price of our common stock if they are viewed as discouraging takeover attempts in the future.
47
Certain provisions of our amended and restated certificate of incorporation and amended and restated bylaws may have anti-takeover effects and may delay, deter or prevent a takeover attempt that our stockholders might consider in their best interests. The provisions provide for, among others:
| the ability of our Board of Directors to issue one or more series of preferred stock; |
| the filling of any vacancies on our Board of Directors by the affirmative vote of a majority of the remaining directors, even if less than a quorum, or by a sole remaining director or by the stockholders; provided, |
52
| however, that after the first time when the principal stockholders cease to beneficially own, in the aggregate, at least 50% of our outstanding common stock, any vacancy occurring in the Board of Directors may only be filled by a majority of the directors then in office, although less than a quorum, or by a sole remaining director (and not by the stockholders); |
| certain limitations on convening special stockholder meetings; |
| advance notice for nominations of directors by stockholders and for stockholders to include matters to be considered at our annual meetings; and stockholder action by written consent only until the first time when the principal stockholders cease to beneficially own, in the aggregate, 50% or greater of our outstanding common stock. |
Section 203 of the DGCL may affect the ability of an “interested stockholder” to engage in certain business combinations, including mergers, consolidations or acquisitions of additional shares, for a period of three years following the time that the stockholder becomes an “interested stockholder.” An “interested stockholder” is defined to include persons owning directly or indirectly 15% or more of the outstanding voting stock of a corporation.
The insurance laws and regulations of the various states in which our insurance subsidiaries are organized may delay or impede a business combination involving the Company. State insurance laws generally prohibit an entity from acquiring control of an insurance company without the prior approval of the domestic insurance regulator. Under most states’ statutes, an entity is presumed to have control of an insurance company if it owns, directly or indirectly, 10% or more of the voting stock of that insurance company or its parent company. These regulatory restrictions may delay, deter or prevent a potential merger or sale of our company, even if our Board of Directors decides that it is in the best interests of stockholders for us to merge or be sold. These restrictions also may delay sales by us or acquisitions by third parties of our insurance subsidiaries.
These anti-takeover provisions and laws may delay, deter or prevent a takeover attempt that our stockholders might consider in their best interests. As a result, our stockholders may be limited in their ability to obtain a premium for their shares.shares.
Item 1B. Unresolved Staff Comments
None.
Our corporate headquarters are located in Morristown, New Jersey on a site of approximately 95,000 rentable square feet leased by us. The term of that lease expires on January 31, 2022. We lease a total of sixfive additional offices located in California, Georgia, New York, Florida and London. The office in London is subleased to a third party. We do not own any real property. We believe that our facilities are adequate for our current needs.
In the ordinary course of conducting business, we are named as defendants in various legal proceedings. Most of these proceedings are claims litigation involving our insurance subsidiaries as either: (i) liability insurers defending or
48
providing indemnity for third-party claims brought against our customers; or (ii) insurers defending first-party coverage claims brought against them. We account for such activity through the establishment of unpaid loss and loss expense reserves. We expect that any potential ultimate liability in such ordinary course claims litigation will not be material to our consolidated financial condition, results of operations, or cash flows after consideration of provisions made for potential losses and costs of defense.
53
As of December 31, 2019,2020, we do not believe the Company or any of the insurance subsidiaries was a defendant in any legal action that could have a material adverse effect on our consolidated financial condition, results of operations, or cash flows.
Item 4. Mine Safety Disclosures
Not applicable.
PART II
Item 5. Market for Registrant’s Common Equity, Related Stockholder Matters and Issuer Purchases of Equity Securities
Market Information
Our common stock is traded on the New York Stock Exchange under the symbol “PROS”, and began trading on July 25, 2019.
Holders
We had 2732 stockholders of record of our common stock as of February 21, 2020,19, 2021, according to the records maintained by our transfer agent. This stockholder figure does not include the number of holders whose shares are held of record by banks, brokers and other financial institutions.
Dividends
We do not currently anticipate declaring or paying regular cash dividends on our common stock in the near term. Any future declaration and payment of dividends or other distributions of capital will be at the discretion of the Board of Directors and will depend on our financial condition, earnings, cash needs, regulatory constraints, capital requirements (including requirements of our subsidiaries) and any other factors that the Board of Directors deems relevant in making such a determination. In addition, the terms of the agreements governing the debt we have incurred or may incur may limit or prohibit the payment of dividends. Therefore, there can be no assurance that we will pay any dividends to holders of our common stock, or as to the amount of any such dividends.
Delaware law requires that dividends be paid only out of “surplus,” which is defined as the fair market value of our net assets, minus our stated capital; or out of the current or the immediately preceding year’s earnings. We are a holding company, and we have no direct operations. All of our business operations are conducted through our subsidiaries. The states in which our insurance subsidiaries are domiciled impose certain restrictions on our insurance subsidiaries’ ability to pay dividends to us. These restrictions are based in part on the prior year’s statutory income and surplus. Such restrictions, or any future restrictions adopted by the states in which our insurance subsidiaries are domiciled, could have the effect, under certain circumstances, of significantly reducing dividends or other amounts payable to us by our subsidiaries without affirmative approval of state regulatory authorities. See “Risk Factors — Legal and Regulatory Risks — We are an insurance holding company and our ability to receive dividends from our insurance subsidiaries is subject to regulatory constraints.”
49
Performance Graph
This performance graph shall not be deemed “filed” for purposes of Section 18 of the Exchange Act or otherwise subject to the liabilities under that section, and shall not be deemed to be incorporated by reference into any of our filings under the Securities Act or the Exchange Act, except as shall be expressly set forth by specific reference in such filing.
The following chart, depicts our performance for the period beginning July 25, 2019 and ending December 31, 2019,2020, as measured by total stockholder return on our common stock compared with the total return of the S&P 500 Index
54
and the S&P 500 Property & Casualty Insurance Index. The chart plots the change in value of an initial $100 investment over the indicated time period, assuming all dividends are reinvested. The stock price performance shown is not intended to predict or be indicative of future performance.
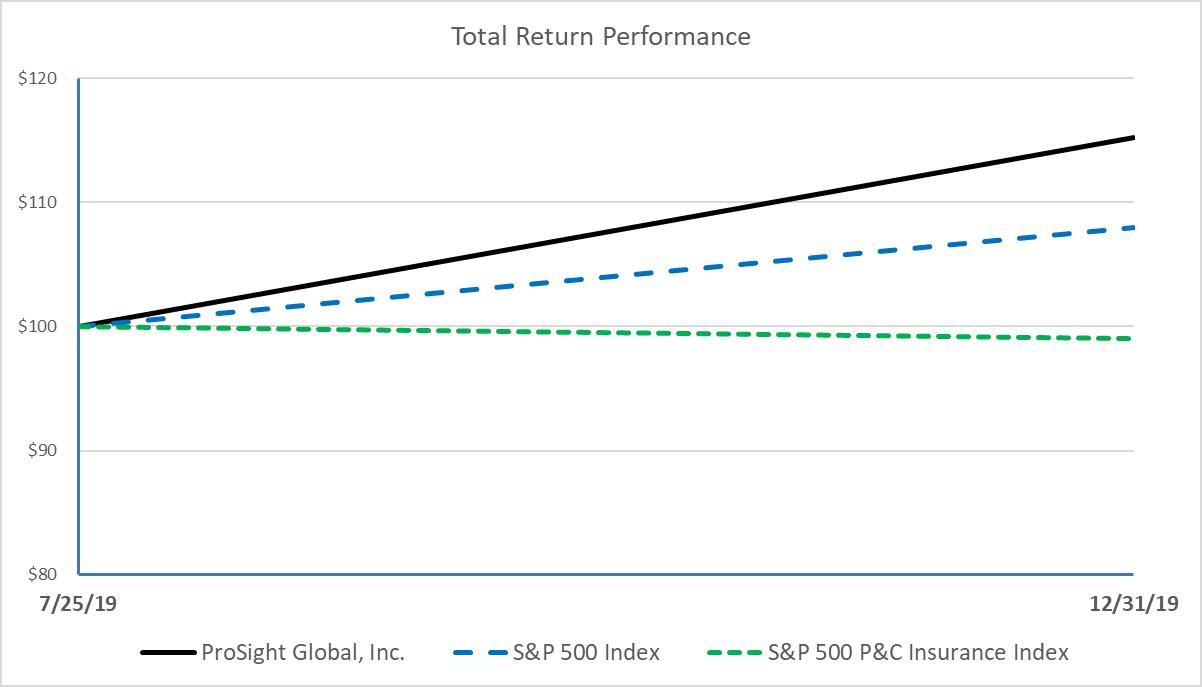
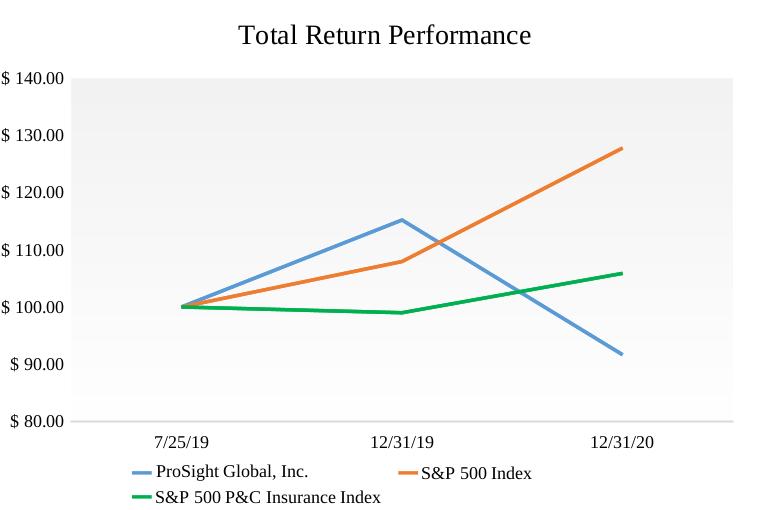
|
|
|
|
|
|
|
|
| July 25, 2019 |
| December 31, 2019 | ||
ProSight Global, Inc. |
| $ | 100.00 |
| $ | 115.21 |
S&P 500 Index – total return |
| $ | 100.00 |
| $ | 107.95 |
S&P P&C Insurance Index – total return |
| $ | 100.00 |
| $ | 98.99 |
Use of proceeds from sale of registered equity securities
| | | | | | |
| July 25, 2019 | December 31, 2019 | December 31, 2020 | |||
ProSight Global, Inc. | $ | 100.00 | $ | 115.21 | $ | 91.64 |
S&P 500 Index – total return | $ | 100.00 | $ | 107.95 | $ | 127.81 |
S&P P&C Insurance Index – total return | $ | 100.00 | $ | 98.99 | $ | 105.88 |
On July 29, 2019, we closed our initial public offering of 7,857,145 shares of common stock, including the issuance and sale by the Company of 4,285,715 shares of common stock and the sale by the selling stockholders of 3,571,430 shares of common stock. On August 15, 2019, the selling stockholders completed the sale of 1,178,570 shares of common stock pursuant to the underwriters’ exercise of their over-allotment option granted in connection with the initial public offering.
The offer and sale of all of the shares in the initial public offering (including pursuant to the underwriters’ overallotment option) were registered under the Securities Act pursuant to a registration statement on Form S-1 (File No. 333-232440), which was declared effective by the SEC on July 24, 2019. Goldman Sachs & Co. LLC and Barclays acted as the lead underwriters. The public offering price of the shares sold in the offering was $14.00 per share. The total gross proceeds from the offering to us were approximately $60.0 million. After deducting underwriting discounts and
50
commissions of approximately $3.9 million and offering expenses payable by us of approximately $5.3 million, we received approximately $50.8 million. We did not receive any of the proceeds from the sale of the shares of common stock sold by the selling stockholders in the initial public offering or pursuant to the underwriters’ exercise of the overallotment option. There has been no material change in the planned use of proceeds from our initial public offering as described in our final prospectus (dated July 24, 2019) filed with the SEC on July 25, 2019 pursuant to Rule 424(b) of the Securities Act.
Item 6. Selected Financial Data
The following tables present our selected consolidated financial data as of the dates and for the periods indicated. The selected consolidated financial data as of and for the periods presented December 31, 2020, 2019, 2018, 2017 2016 and 20152016 are derived from our audited consolidated financial statements and the accompanying notes for those years.
The historical results presented below are not necessarily indicative of financial results to be achieved in future periods.
The income statement information and related underwriting and other ratios presented below are for our continuing operations. The financial results of the U.K.-produced business are presented as discontinued operations in our consolidated financial statements and are excluded from the income statement information below. The selected balance sheet information also excludes specific assets and liabilities related to our discontinued operations. The assets and
55
liabilities of the discontinued operations are only included in total assets, total liabilities and total stockholder’s equity. The selected consolidated financial data should be read together with “Management’s Discussion and Analysis of
Financial Condition and Results of Operations” and our consolidated financial statements and the related notes included elsewhere in this Annual Report on Form 10-K.
|
|
|
|
|
|
|
|
|
|
|
|
|
|
| ||||||||||||||||
|
| Years Ended December 31 | ||||||||||||||||||||||||||||
|
|
| 2019 |
|
| 2018 |
|
| 2017 |
|
| 2016 |
|
| 2015 | |||||||||||||||
| | | | | | | | | | | | | | | ||||||||||||||||
| | Years Ended December 31 | ||||||||||||||||||||||||||||
| | | 2020 | | | 2019 | | | 2018 | | | 2017 | | | 2016 | |||||||||||||||
($ in thousands, except for per share data) |
|
|
|
|
|
|
|
|
|
|
|
|
|
| | | | | | | | | | | | | | | ||
Revenues: |
|
|
|
|
|
|
|
|
|
|
|
|
|
| | | | | | | | | | | | | | | ||
Gross written premiums(1) |
| $ | 968,011 |
| $ | 895,112 |
| $ | 836,334 |
| $ | 771,995 |
| $ | 772,136 | | $ | 817,090 | | $ | 968,011 | | $ | 895,112 | | $ | 836,334 | | $ | 771,995 |
Ceded written premiums |
|
| (115,871) |
|
| (45,038) |
|
| (276,048) |
|
| (85,312) |
|
| (93,956) | | | (122,912) | | | (115,871) | | | (45,038) | | | (276,048) | | | (85,312) |
Net written premiums |
| $ | 852,140 |
| $ | 850,074 |
| $ | 560,286 |
| $ | 686,683 |
| $ | 678,180 | | $ | 694,178 | | $ | 852,140 | | $ | 850,074 | | $ | 560,286 | | $ | 686,683 |
Net earned premiums |
| $ | 807,854 |
| $ | 730,785 |
| $ | 609,786 |
| $ | 675,778 |
| $ | 648,876 | | $ | 737,755 | | $ | 807,854 | | $ | 730,785 | | $ | 609,786 | | $ | 675,778 |
Net investment income |
|
| 68,897 |
|
| 55,971 |
|
| 36,196 |
| 28,052 |
|
| 25,606 | | | 73,021 | | | 68,897 | | | 55,971 | | 36,196 | | | 28,052 | ||
Realized investment gains (losses), net |
|
| 770 |
|
| (1,557) |
|
| 4,204 |
| (6,147) |
|
| 8,607 | | | 4,980 | | | 770 | | | (1,557) | | 4,204 | | | (6,147) | ||
Other income |
|
| 538 |
|
| 673 |
|
| 853 |
|
| 1,057 |
|
| 4,949 | | | 351 | | | 538 | | | 673 | | | 853 | | | 1,057 |
Total revenues |
| $ | 878,059 |
| $ | 785,872 |
| $ | 651,039 |
| $ | 698,740 |
| $ | 688,038 | | $ | 816,107 | | $ | 878,059 | | $ | 785,872 | | $ | 651,039 | | $ | 698,740 |
Expenses: |
|
|
|
|
|
|
|
|
|
|
|
|
|
| | | | | | | | | | | | | | | ||
Losses and LAE |
| $ | 501,025 |
| $ | 434,830 |
| $ | 393,741 |
| $ | 489,464 |
| $ | 445,244 | | $ | 472,671 | | $ | 501,025 | | $ | 434,830 | | $ | 393,741 | | $ | 489,464 |
Underwriting, acquisition and insurance expenses |
|
| 290,457 |
|
| 271,547 |
|
| 213,844 |
| 241,873 |
|
| 233,491 | | | 272,844 | | | 290,457 | | | 271,547 | | 213,844 | | | 241,873 | ||
Interest and other expenses |
|
| 28,946 |
|
| 12,377 |
|
| 12,125 |
|
| 12,125 |
|
| 18,202 | | | 32,102 | | | 28,946 | | | 12,377 | | | 12,125 | | | 12,125 |
Total expenses |
| $ | 820,428 |
| $ | 718,754 |
| $ | 619,710 |
| $ | 743,462 |
| $ | 696,937 | | $ | 777,617 | | $ | 820,428 | | $ | 718,754 | | $ | 619,710 | | $ | 743,462 |
Income (loss) before taxes |
|
| 57,631 |
|
| 67,118 |
|
| 31,329 |
| (44,722) |
|
| (8,900) | | | 38,490 | | | 57,631 | | | 67,118 | | 31,329 | | | (44,722) | ||
Income tax expense (benefit) |
|
| 12,137 |
|
| 13,389 |
|
| 38,233 |
|
| (23,988) |
|
| (7,321) | | | 10,740 | | | 12,137 | | | 13,389 | | | 38,233 | | | (23,988) |
Net income (loss) from continuing operations |
| $ | 45,494 |
| $ | 53,729 |
| $ | (6,904) |
| $ | (20,734) |
| $ | (1,579) | | $ | 27,750 | | $ | 45,494 | | $ | 53,729 | | $ | (6,904) | | $ | (20,734) |
Underwriting income (loss)(2) |
| $ | 16,372 |
| $ | 24,409 |
| $ | 2,201 |
| $ | (55,559) |
| $ | (29,859) | |||||||||||||||
Underwriting (loss) income(2) | | $ | (7,760) | | $ | 16,372 | | $ | 24,409 | | $ | 2,201 | | $ | (55,559) | |||||||||||||||
Adjusted operating income (loss)(3) |
| $ | 57,636 |
| $ | 55,286 |
| $ | 13,992 |
| $ | (14,587) |
| $ | (10,186) | | $ | 40,328 | | $ | 57,636 | | $ | 55,286 | | $ | 13,992 | | $ | (14,587) |
| | | | | | | | | | | | | | | |
| | Years Ended December 31 | |||||||||||||
| | | 2020 | | | 2019 | | | 2018 | | | 2017 | | | 2016 |
| | | | | | | | | | | | | | | |
Per share of common stock data: | | | | | | | | | | | | | | | |
Basic earnings per share: | | | | | | | | | | | | | | | |
Common stock | | $ | 0.63 | | $ | 1.11 | | $ | 1.39 | | $ | (0.18) | | $ | (0.59) |
Diluted earnings per share: | | | | | | | | | | | | | | | |
Common stock | | $ | 0.63 | | $ | 1.10 | | $ | 1.36 | | $ | (0.18) | | $ | (0.59) |
Basic adjusted operating earnings per share: | | | | | | | | | | | | | | | |
Common stock | | $ | 0.92 | | $ | 1.40 | | $ | 1.43 | | $ | 0.37 | | $ | (0.41) |
Diluted adjusted operating earnings per share: | | | | | | | | | | | | | | | |
Common stock | | $ | 0.91 | | $ | 1.39 | | $ | 1.40 | | $ | 0.37 | | $ | (0.41) |
5156
|
|
|
|
|
|
|
|
|
|
|
|
|
|
|
|
|
| Years Ended December 31 | |||||||||||||
|
|
| 2019 |
|
| 2018 |
|
| 2017 |
|
| 2016 |
|
| 2015 |
|
|
|
|
|
|
|
|
|
|
|
|
|
|
|
|
Per share of common stock data: |
|
|
|
|
|
|
|
|
|
|
|
|
|
|
|
Basic earnings per share: |
|
|
|
|
|
|
|
|
|
|
|
|
|
|
|
Common stock |
| $ | 1.11 |
| $ | 1.39 |
| $ | (0.18) |
| $ | (0.59) |
| $ | (0.04) |
Diluted earnings per share: |
|
|
|
|
|
|
|
|
|
|
|
|
|
|
|
Common stock |
| $ | 1.10 |
| $ | 1.36 |
| $ | (0.18) |
| $ | (0.59) |
| $ | (0.04) |
Basic adjusted operating earnings per share: |
|
|
|
|
|
|
|
|
|
|
|
|
|
|
|
Common stock |
| $ | 1.40 |
| $ | 1.43 |
| $ | 0.37 |
| $ | (0.41) |
| $ | (0.29) |
Diluted adjusted operating earnings per share: |
|
|
|
|
|
|
|
|
|
|
|
|
|
|
|
Common stock |
| $ | 1.39 |
| $ | 1.40 |
| $ | 0.37 |
| $ | (0.41) |
| $ | (0.29) |
| | | | | | | | | | | | | | | |
| | Years Ended December 31 | |||||||||||||
| | | 2020 | | | 2019 | | | 2018 | | | 2017 | | | 2016 |
Underwriting and other ratios: | | | | | | | | | | | | | | | |
Loss and LAE ratio(4) | | | 64.1% | | | 62.0% | | | 59.5% | | | 64.6% | | | 72.4% |
Loss and LAE | | | | | | | | | | | | | | | |
Loss and LAE ratio – excluding catastrophe | | | 61.6% | | | 61.6% | | | 59.0% | | | 63.1% | | | 71.2% |
Loss and LAE ratio – catastrophe | | | 2.5% | | | 0.4% | | | 0.5% | | | 1.5% | | | 1.2% |
Expense ratio(5) | | | 37.0% | | | 36.0% | | | 37.2% | | | 35.1% | | | 35.8% |
Combined ratio(6) | | | 101.1% | | | 98.0% | | | 96.7% | | | 99.7% | | | 108.2% |
Adjusted loss and LAE ratio(7) | | | 64.1% | | | 61.4% | | | 59.6% | | | 63.9% | | | 72.4% |
Adjusted loss and LAE | | | | | | | | | | | | | | | |
Adjusted loss and LAE ratio – excluding catastrophe | | | 61.6% | | | 61.0% | | | 59.1% | | | 62.6% | | | 71.2% |
Adjusted loss and LAE ratio – catastrophe | | | 2.5% | | | 0.4% | | | 0.5% | | | 1.3% | | | 1.2% |
Adjusted expense ratio(7) | | | 37.0% | | | 36.6% | | | 37.0% | | | 34.9% | | | 35.8% |
Adjusted combined ratio(7) | | | 101.1% | | | 98.0% | | | 96.6% | | | 98.8% | | | 108.2% |
Adjusted operating return on equity(8) | | | 6.9% | | | 12.4% | | | 14.4% | | | 3.7% | | | (3.6)% |
Return on equity(9) | | | 4.8% | | | 9.8% | | | 14.0% | | | (1.8)% | | | (5.1)% |
|
|
|
|
|
|
|
|
|
|
|
|
|
|
|
|
|
| Years Ended December 31 | |||||||||||||
|
|
| 2019 |
|
| 2018 |
|
| 2017 |
|
| 2016 |
|
| 2015 |
Underwriting and other ratios: |
|
|
|
|
|
|
|
|
|
|
|
|
|
|
|
Loss and LAE ratio(4) |
|
| 62.0% |
|
| 59.5% |
|
| 64.6% |
|
| 72.4% |
|
| 68.6% |
Loss and LAE |
|
|
|
|
|
|
|
|
|
|
|
|
|
|
|
ratio – excluding catastrophe |
|
| 61.6% |
|
| 59.0% |
|
| 63.1% |
|
| 71.2% |
|
| 68.0% |
Loss and LAE ratio – catastrophe |
|
| 0.4% |
|
| 0.5% |
|
| 1.5% |
|
| 1.2% |
|
| 0.6% |
Expense ratio(5) |
|
| 36.0% |
|
| 37.2% |
|
| 35.1% |
|
| 35.8% |
|
| 36.0% |
Combined ratio(6) |
|
| 98.0% |
|
| 96.7% |
|
| 99.7% |
|
| 108.2% |
|
| 104.6% |
Adjusted loss and LAE ratio(7) |
|
| 61.4% |
|
| 59.6% |
|
| 63.9% |
|
| 72.4% |
|
| 68.6% |
Adjusted loss and LAE |
|
|
|
|
|
|
|
|
|
|
|
|
|
|
|
ratio – excluding catastrophe |
|
| 61.0% |
|
| 59.1% |
|
| 62.6% |
|
| 71.2% |
|
| 68.0% |
Adjusted loss and LAE ratio – catastrophe |
|
| 0.4% |
|
| 0.5% |
|
| 1.3% |
|
| 1.2% |
|
| 0.6% |
Adjusted expense ratio(7) |
|
| 36.6% |
|
| 37.0% |
|
| 34.9% |
|
| 35.8% |
|
| 36.0% |
Adjusted combined ratio(7) |
|
| 98.0% |
|
| 96.6% |
|
| 98.8% |
|
| 108.2% |
|
| 104.6% |
Adjusted operating return on equity(8) |
|
| 12.4% |
|
| 14.4% |
|
| 3.7% |
|
| (3.6%) |
|
| (2.2%) |
Return on equity(9) |
|
| 9.8% |
|
| 14.0% |
|
| (1.8%) |
|
| (5.1%) |
|
| (0.3%) |
|
|
|
|
|
|
|
|
|
|
|
|
|
|
|
| December 31 | |||||||||||||
($ in thousands) |
| 2019 |
|
| 2018 |
|
| 2017 |
|
| 2016 |
|
| 2015 |
Select balance sheet data: |
|
|
|
|
|
|
|
|
|
|
|
|
|
|
Total cash and investments | $ | 2,192,781 |
| $ | 1,830,290 |
| $ | 1,632,629 |
| $ | 1,405,585 |
| $ | 1,262,072 |
Premiums and other receivables, net |
| 190,004 |
|
| 200,347 |
|
| 184,334 |
|
| 168,378 |
|
| 161,705 |
Reinsurance receivables paid and unpaid, net |
| 197,433 |
|
| 197,723 |
|
| 218,376 |
|
| 205,527 |
|
| 161,295 |
Goodwill and net intangible assets |
| 29,189 |
|
| 29,219 |
|
| 29,249 |
|
| 29,745 |
|
| 30,287 |
Total assets | $ | 2,877,234 |
| $ | 2,577,106 |
| $ | 2,409,452 |
| $ | 2,251,502 |
| $ | 2,138,205 |
Reserve for unpaid losses and LAE | $ | 1,521,648 |
| $ | 1,396,812 |
| $ | 1,258,237 |
| $ | 1,166,619 |
| $ | 983,155 |
Reserve for unearned premiums |
| 483,223 |
|
| 435,933 |
|
| 395,432 |
|
| 354,828 |
|
| 344,678 |
Notes payable, net of debt issuance costs |
| 164,693 |
|
| 182,355 |
|
| 164,017 |
|
| 163,678 |
|
| 163,340 |
Total liabilities | $ | 2,334,203 |
| $ | 2,187,276 |
| $ | 2,033,469 |
| $ | 1,870,849 |
| $ | 1,700,841 |
Total stockholders’ equity | $ | 543,031 |
| $ | 389,830 |
| $ | 375,983 |
| $ | 380,654 |
| $ | 437,365 |
Other data: |
|
|
|
|
|
|
|
|
|
|
|
|
|
|
Debt to total capitalization ratio(10) |
| 23.3% |
|
| 31.9% |
|
| 30.4% |
|
| 30.1% |
|
| 27.2% |
Statutory capital and surplus(11) | $ | 568,777 |
| $ | 473,575 |
| $ | 433,946 |
| $ | 355,366 |
| $ | 379,231 |
52
| | | | | | | | | | | | | | |
| December 31 | |||||||||||||
($ in thousands) | | 2020 | | | 2019 | | | 2018 | | | 2017 | | | 2016 |
Select balance sheet data: | | | | | | | | | | | | | | |
Total cash and investments | $ | 2,440,521 | | $ | 2,192,781 | | $ | 1,830,290 | | $ | 1,632,629 | | $ | 1,405,585 |
Premiums and other receivables, net | | 146,243 | | | 190,004 | | | 200,347 | | | 184,334 | | | 168,378 |
Reinsurance receivables paid and unpaid, net | | 181,003 | | | 197,433 | | | 197,723 | | | 218,376 | | | 205,527 |
Goodwill and net intangible assets | | 17,248 | | | 29,189 | | | 29,219 | | | 29,249 | | | 29,745 |
Total assets | $ | 3,050,712 | | $ | 2,877,234 | | $ | 2,577,106 | | $ | 2,409,452 | | $ | 2,251,502 |
Reserve for unpaid losses and LAE | $ | 1,602,902 | | $ | 1,521,648 | | $ | 1,396,812 | | $ | 1,258,237 | | $ | 1,166,619 |
Reserve for unearned premiums | | 448,676 | | | 483,223 | | | 435,933 | | | 395,432 | | | 354,828 |
Notes payable, net of debt issuance costs | | 203,267 | | | 164,693 | | | 182,355 | | | 164,017 | | | 163,678 |
Secured loan payable, net of issuance costs | | 22,668 | | | — | | | — | | | — | | | — |
Total liabilities | $ | 2,426,744 | | $ | 2,334,203 | | $ | 2,187,276 | | $ | 2,033,469 | | $ | 1,870,849 |
Total stockholders’ equity | $ | 623,968 | | $ | 543,031 | | $ | 389,830 | | $ | 375,983 | | $ | 380,654 |
Other data: | | | | | | | | | | | | | | |
Debt to total capitalization ratio(10) | | 26.6% | | | 23.3% | | | 31.9% | | | 30.4% | | | 30.1% |
Statutory capital and surplus(11) | $ | 668,060 | | $ | 568,777 | | $ | 473,575 | | $ | 433,946 | | $ | 355,366 |
| (1) |
| Gross written premiums (“GWP”) includes business from certain niches that are no longer part of our ongoing business. |
|
|
|
|
|
|
|
|
|
|
|
|
|
|
|
| Years Ended December 31 | |||||||||||||
($ in thousands) |
| 2019 |
|
| 2018 |
|
| 2017 |
|
| 2016 |
|
| 2015 |
Construction | $ | 117,918 |
| $ | 101,946 |
| $ | 73,378 |
| $ | 54,983 |
| $ | 37,887 |
Consumer Services |
| 133,682 |
|
| 107,086 |
|
| 94,384 |
|
| 95,005 |
|
| 87,112 |
Marine and Energy |
| 94,071 |
|
| 82,978 |
|
| 79,238 |
|
| 66,215 |
|
| 80,746 |
Media and Entertainment |
| 124,950 |
|
| 119,926 |
|
| 114,442 |
|
| 103,693 |
|
| 79,581 |
Professional Services |
| 119,326 |
|
| 110,546 |
|
| 112,575 |
|
| 79,793 |
|
| 71,187 |
Real Estate |
| 167,635 |
|
| 132,652 |
|
| 132,029 |
|
| 102,134 |
|
| 81,533 |
Sports |
| 30,079 |
|
| 23,590 |
|
| 22,224 |
|
| 17,761 |
|
| 15,974 |
Transportation |
| 112,191 |
|
| 92,169 |
|
| 85,079 |
|
| 90,215 |
|
| 116,126 |
Customer segments subtotal |
| 899,852 |
|
| 770,893 |
|
| 713,349 |
|
| 609,799 |
|
| 570,146 |
Other |
| 68,159 |
|
| 124,219 |
|
| 122,985 |
|
| 162,196 |
|
| 201,990 |
Total | $ | 968,011 |
| $ | 895,112 |
| $ | 836,334 |
| $ | 771,995 |
| $ | 772,136 |
57
| | | | | | | | | | | | | | |
| Years Ended December 31 | |||||||||||||
($ in thousands) | | 2020 | | | 2019 | | | 2018 | | | 2017 | | | 2016 |
Construction | $ | 109,955 | | $ | 117,918 | | $ | 101,946 | | $ | 73,378 | | $ | 54,983 |
Consumer Services | | 123,011 | | | 133,682 | | | 107,086 | | | 94,384 | | | 95,005 |
Marine and Energy | | 110,228 | | | 94,700 | | | 83,104 | | | 79,238 | | | 66,215 |
Media and Entertainment | | 88,788 | | | 124,950 | | | 119,926 | | | 114,442 | | | 103,693 |
Professional Services | | 130,893 | | | 119,326 | | | 110,546 | | | 112,575 | | | 79,793 |
Real Estate | | 159,166 | | | 167,635 | | | 132,652 | | | 132,029 | | | 102,134 |
Sports | | 23,337 | | | 30,079 | | | 23,590 | | | 22,224 | | | 17,761 |
Transportation | | 64,559 | | | 112,191 | | | 92,169 | | | 85,079 | | | 90,215 |
Customer segments subtotal | | 809,937 | | | 900,481 | | | 771,019 | | | 713,349 | | | 609,799 |
Other | | 7,153 | | | 67,530 | | | 124,093 | | | 122,985 | | | 162,196 |
Total | $ | 817,090 | | $ | 968,011 | | $ | 895,112 | | $ | 836,334 | | $ | 771,995 |
| (2) |
| Underwriting (loss) income is a non-GAAP financial measure. We calculate underwriting income by subtracting losses and loss adjustment expenses (“LAE”) and underwriting, acquisition and insurance expenses from net earned premiums. See “Management’s Discussion and Analysis of Financial Condition and Results of Operations — Reconciliation of Non-GAAP Financial Measures” for a reconciliation of net income in accordance with GAAP to underwriting income. |
| (3) |
| Adjusted operating income (loss) is a non-GAAP financial measure. We calculate adjusted operating income as net income, excluding net realized investment gains (losses), |
| (4) |
| The loss and LAE ratio is the ratio, expressed as a percentage, of losses and LAE, allocated and unallocated, to net earned premiums, net of the effects of reinsurance. For the years ended December 31, |
| (5) |
| The expense ratio is the ratio, expressed as a percentage, of underwriting, acquisition and insurance expenses to net earned premiums. |
| (6) |
| The combined ratio is the sum of the loss and LAE ratio and the expense ratio. A combined ratio under 100% generally indicates an underwriting profit. A combined ratio over 100% generally indicates an underwriting loss. |
| (7) |
| Adjusted loss and LAE ratio, adjusted expense ratio and adjusted combined ratio are non-GAAP financial measures. See “Management’s Discussion and Analysis of Financial Condition and Results of Operations — Factors Affecting Our Results of Operations — The WAQS.” |
| (8) |
| Adjusted operating return on equity is a non-GAAP financial measure. Adjusted operating return on equity is adjusted operating income expressed on an annualized basis as a percentage of average beginning and ending stockholders’ equity during the period. See “Management’s Discussion and Analysis of Financial Condition and Results of Operations — Reconciliation of Non-GAAP Financial Measures” for a reconciliation of net income in accordance with GAAP to adjusted operating income. |
| (9) |
| Return on equity represents net income expressed on an annualized basis as a percentage of average beginning and ending stockholders’ equity during the period. |
| (10) |
| Debt to total capitalization ratio is the ratio, expressed as a percentage, of total indebtedness for borrowed money to the sum of total indebtedness for borrowed money and stockholders’ equity. |
| (11) |
| For our insurance subsidiaries, the statutory capital and surplus represents the excess of assets over liabilities as determined in accordance with statutory accounting principles as determined by the NAIC. |
5358
Our inception to date business portfolio for years 2011 through 2020 including exited niches is as follows:
| | | | | | |
| | | | | Loss & | |
($ in millions) | | | GWP | | LAE Ratio | |
Inception to date GWP 2011 – 2020 | | $ | 6,817.3 | | 63.8 | % |
Exited for financial performance(a) | | | 311.6 | | 104.6 | % |
Exited for strategic reasons(a) | | | 749.7 | | 55.7 | % |
Ongoing U.S. business | | $ | 5,756.0 | | 62.4 | % |
| (a) |
|
|
|
|
|
|
|
|
|
|
|
|
|
| Loss & |
|
($ in millions) |
|
| GWP |
| LAE Ratio |
|
Inception to date GWP 2011 – 2019 |
| $ | 6,000.2 |
| 63.8 | % |
Exited for financial performance(a) |
|
| 311.6 |
| 105.3 | % |
Exited for strategic reasons(a) |
|
| 739.4 |
| 58.5 | % |
Ongoing U.S. business |
| $ | 4,949.2 |
| 61.5 | % |
| Exited niches excluding excess workers’ compensation accounted for |
5459
Item 7. Management’s Discussion and Analysis of Financial Condition and Results of Operations
This Management’s Discussion and Analysis of Financial Condition and Results of Operations should be read in conjunction with the audited consolidated financial statements and the notes thereto included elsewhere in this Annual Report on Form 10-K. Certain restatements have been made to historical information to give effect to the IPO merger, in which ProSight Global Holdings Limited merged with and into the Company, and related transactions. SeeNote 1 – Background in the notes to the consolidated financial statements included elsewhere in this Annual Report on Form 10-K. This discussion contains forward-looking statements that reflect our plans, estimates and beliefs, and involve risks and uncertainties. Our actual results and the timing of certain events could differ materially from those anticipated in these forward-looking statements as a result of several factors, including those discussed in the section titled “Risk factors” included under Part I, Item 1A and elsewhere in this Annual Report on this Form 10-K. See “Special Note Regarding Forward-Looking Statements.”
This section of this Annual Report on Form 10-K generally discusses 2020 and 2019 items and year-to-year comparisons between 2020 and 2019. Discussions of 2018 items and year-to-year comparisons between 2019 and 2018 that are not included in this Annual Report on Form 10-K can be found in “Management’s Discussion and Analysis of Financial Condition and Results of Operations” in Part II, Item 7 of the Company’s Annual Report on Form 10-K for the fiscal year ended December 31, 2019.
References to the "Company," "ProSight," "we," "us," and "our" are to ProSight Global, Inc. and its consolidated subsidiaries unless the context otherwise requires. References to “insurance subsidiaries” are to New York Marine and General Insurance Company (“New York Marine”), Gotham Insurance Company (“Gotham”) and Southwest Marine and General Insurance Company (“Southwest Marine”) unless the context otherwise requires.
Special Note Regarding Forward-Looking Statements
This Management’s Discussion and Analysis of Financial Condition and Results of Operations includes certain forward-looking statements that are subject to risks, uncertainties and other factors described in “Risk Factors” in this Annual Report. Our actual results could differ materially from those anticipated in these forward-looking statements as a result of many factors. Forward-looking statements include statements relating to future developments in our business or expectations for our future financial performance and any statement not involving a historical fact. Forward-looking statements use words such as “anticipate,” “believe,” “estimate,” “expect,” “intend,” “plan,” “should,” “seek,” and other words and terms of similar meaning. Forward-looking statements in this Annual Report include, but are not limited to, statements about:
| ● | our strategies to continue our growth trajectory, expand our distribution network and maintain underwriting profitability; |
| ● | the impact of coronavirus disease 2019 (“COVID-19”) and related economic conditions and governmental actions, including the Company's assessment of the vulnerability of certain categories of investments to the economic disruptions associated with COVID-19; |
| ● | future growth in existing niches or by entering into new niches; |
| ● | our loss expectations and expectation to decrease our loss ratio; |
| ● | our expectations with respect to the ultimate financial obligations to the buyers of our United Kingdom (“U.K.”) operations; and |
| ● | statements we make relating to the proposed merger. |
Forward-looking statements are subject to known and unknown risks and uncertainties, many of which may be beyond our control. We caution you that forward-looking statements are not guarantees of future performance or outcomes and that actual performance and outcomes may differ materially from those made in or suggested by the forward-looking
60
statements contained in this Annual Report. In addition, even if our results of operations, financial condition and cash flows, and the development of the market in which we operate, are consistent with the forward-looking statements contained in this Annual Report, those results or developments may not be indicative of results or developments in subsequent periods. New factors emerge from time to time that may cause our business not to develop as we expect, and it is not possible for us to predict all of them. Factors that could cause actual results and outcomes to differ from those reflected in forward-looking statements include:
| ● | risks relating to our ability to obtain regulatory approvals of the proposed merger, including the timing, terms and conditions of any such approvals, which could affect our ability to complete the proposed merger; |
| ● | the occurrence of any event, change or other circumstances that could give rise to the termination of the Merger Agreement, including a termination of the Merger Agreement under circumstances that could require us to pay a termination fee; |
| ● | the risk that the parties to the proposed merger may not be able to satisfy the conditions of the proposed merger in a timely manner or at all; |
| ● | risks related to disruption of management time from ongoing business operations due to the proposed merger; |
| ● | risk that the proposed merger could have an adverse effect on our ability to retain and hire key personnel and maintain relationships with our customers, agents or business counterparties, and on our operating results and businesses generally; |
| ● | the outcome of any potential legal proceedings that may be instituted against us; |
| ● | the performance of and our relationship with third-party agents and vendors we rely upon to distribute certain business on our behalf; |
| ● | the adequacy of our loss reserves, including as a result of changes in the legal, regulatory, and economic environments in which the Company operates or the impacts of COVID-19; |
| ● | the direct and indirect impacts of COVID-19 and related risks such as governmental responses and economic contraction, including on the Company’s investments and business operations, its distribution or other key partners and its customers; |
| ● | the effects of uncertain emerging claim and coverage issues on the Company’s business, and court decisions or legislative or regulatory changes that take place after the Company issues its policies, including those taken in response to COVID-19 (such as effectively expanding workers’ compensation coverage by instituting presumptions of compensability of claims for certain types of workers or requiring insurers to cover business interruption claims irrespective of terms, exclusions or other conditions included in the policies that would otherwise preclude coverage); |
| ● | the effectiveness of our risk management policies and procedures; |
| ● | potential technology breaches or failure of our or our business partners’ systems; |
| ● | adverse changes in the economy which could lower the demand for our insurance products; |
| ● | our ability to effectively start up or integrate new product opportunities; |
| ● | cyclical changes in the insurance industry; |
| ● | the effects of natural and man-made catastrophic events; |
| ● | our ability to adequately assess risks and estimate losses; |
| ● | the availability and affordability of reinsurance; |
| ● | changes in interest rates, government monetary policies, general economic conditions, liquidity and overall market conditions; |
| ● | changes in the business, financial condition or results of operations of the entities in which we invest; |
| ● | increased costs as a result of operating as a public company, and time our management will be required to devote to new compliance initiatives; |
| ● | our ability to protect intellectual property rights; |
| ● | the impact of government regulation, including the impact of restrictions on our business activities under the Bank Holding Company (“BHC”) Act; |
| ● | our status as an emerging growth company; |
| ● | the absence of a previous public market for shares of our common stock; and |
| ● | potential conflicts of interests with our principal stockholders. |
We discuss many of these risks in greater detail under the section titled Item 1A. “Risk Factors” of this Annual Report. Given these uncertainties, you should not place undue reliance on these forward-looking statements. We qualify all of the forward-looking statements in this Annual Report by these cautionary statements. Except as required by law, we undertake no obligation to publicly update any forward-looking statements, whether as a result of new information, future events or otherwise.
Merger Agreement
On January 15, 2021, we announced that we had entered into an agreement and plan of merger (the “Merger Agreement”) with Pedal Parent Inc., a Delaware corporation (“Parent”), owned by affiliates of TowerBrook Capital Partners L.P. and Further Global Capital Management, and Pedal Merger Sub, Inc., pursuant to which, subject to the terms and conditions of the Merger Agreement, Pedal Merger Sub, Inc. would merge with and into the Company (the “proposed merger”), with the Company surviving as a wholly owned subsidiary of Parent. For a further discussion of the proposed merger, see Item 1. “Business” and Note 22. “Subsequent Events” to our consolidated financial statements on this Annual Report.
Overview
We are an entrepreneurial specialty insurance company that since our founding in 2009 has built products, services and solutions with the goal of significantly improving the experience and value proposition for our customers. We founded ProSight, with capital commitments from affiliates of each of The Goldman Sachs Group, Inc. (“Goldman Sachs”) and TPG Global, LLC (“TPG”) as a different type of insurer that leverages customized technology infrastructure, underwriting expertise and unique niche focus to develop products, services and solutions that deliver distinct value to customers in the manner they prefer.
Our Company is led by a highly experienced and entrepreneurial team with decades of insurance leadership experience at ProSight and other leading insurers. We write property and casualty insurance with a focus on underwriting specialty risks by partnering with a select number of distributors, often on an exclusive basis. We have a diverse business mix covering specialty niches within thecurrently write insurance coverage in eight customer segments across a broad range of specialty lines of business. Our customer segments currently include: Media and Entertainment, Real Estate, Professional Services, Transportation, Construction, Consumer Services, Marine and Energy, and Sports. Within each customer segment, we have multiple niches which represent similar groups of customers. We believe having deep expertise in these niches across our organization is critical and therefore, we have aligned various functional areas at the niche level, including underwriting, operations and claims. We focus on small and medium-sized customers, a market segment which we operate.believe has been, and will continue to be, less affected by intense competitive dynamics of the broader property and casualty insurance industry. Over time, the composition of business within our customer segments evolves as we identify certain niches that present opportunities to develop distinct customer solutions with attractive profit potential and others
62
that were at one time attractive but may become less so. We are focused on delivering consistent underwriting profitability with low volatility of underwriting results. We market and distribute our insurance product offerings in all 50 states on both an admitted and non-admitted basis. We are focused on delivering consistent underwriting profitability with low volatility of underwriting results.
In November of 2011, we formed a Bermuda holding company structure and acquired several entities in the U.K. to build our own Lloyd’s syndicate. Our principal objective was to achieve greater capital and tax efficiency for our growing U.S. niche business. We also considered opportunities to use this as a platform to extend our niche strategy to the U.K. and Europe. By 2015, however, we determined that we would not be able to profitably achieve our objectives due to two principal factors. Firstly, a significant driver of the success of our U.S. sourced business is the extensive control and oversight of our niche specialized internal and external underwriters. In contrast, in the UK, the regulatory framework required us to operate the syndicate as an independent entity, largely excluded from oversight by the U.S. management team. As a result, our Group Chief Underwriting Officer could not serve on the board of directors of the U.K. entities nor have final underwriting authority for non-U.S. sourced business. In addition, given the growing predominance of the U.S. underwritten business in the syndicate, the syndicate was required to develop an organic and independent growth strategy for U.K. sourced business. The independently underwritten U.K. business did not execute upon our niche strategy, and generated unacceptable loss ratios and acquisition costs. Secondly, while we had success in writing and reinsuring profitable U.S. sourced business into our syndicate, the U.S. business had become a disproportionately high percentage of the total syndicate book, and therefore our U.S. underwriting entity was treated as an independent Lloyd’s coverholder. As such, we were required to deploy redundant control and underwriting resources in the U.K. to oversee our U.S. book. This resulted in an unacceptable increase in the syndicate expense ratio. Given the uneconomic loss and expense costs associated with operating in Lloyd’s, in 2015 we began evaluating an exit from the Lloyd’s market and the repatriation of our U.S. business. The exit timeframes were extended due to capital constraints in our U.S. underwriting entity and protracted exit negotiations. In 2017, we entered into a two-phase sale transaction, which closed in October 2017 and March 2018. Accordingly, the financial results of the U.K. produced business are presented as discontinued operations in our consolidated financial statements. The financial results within the following discussion and analysis are attributable to our continuing operations.
55
Initial Public Offering
On July 29, 2019, the Company completed its initial public offering (“IPO”) with the sale of 7,857,145 shares of the Company’s common stock, including the issuance and sale by the Company of 4,285,715 shares of the Company’s common stock and the sale by ProSight Parallel Investment LLC and ProSight Investment LLC (“PI”) (collectively, the “GS Investors”) and ProSight TPG, L.P., TPG PS 1, L.P., TPG PS 2, L.P., TPG PS 3, L.P. and TPG PS 4, L.P. (collectively the “TPG Investors” and together with the GS Investors, the “Principal Stockholders”) of 3,571,430 shares of the Company’s common stock.
Shares of the Company’s common stock were initially offered to the public by the underwriters in the IPO at a per-share price of $14.00. The Company did not receive any of the proceeds from the sale of the shares of the Company’s common stock sold by the Principal Stockholders in the IPO. Following the IPO, the GS Investors held approximately 40.9% of the Company’s outstanding common stock and the TPG Investors held approximately 39.4% of the Company’s outstanding common stock.
On August 15, 2019 the Principal Stockholders completed the sale of 1,178,570 shares of the Company’s common stock at a price of $14.00 per share less the underwriting discount pursuant to the underwriters’ exercise of their over-allotment option granted in connection with the IPO. The Company did not receive any of the proceeds from the sale of the shares of common stock of the Company sold by the Principal Stockholders in this offering. Following this offering, the GS Investors held approximately 39.5% of the Company’s outstanding common stock and the TPG Investors held approximately 38.0% of the Company’s outstanding common stock.
The offer and sale of all shares sold in the IPO, including those sold in connection with the underwriters’ exercise of their over-allotment option, were registered pursuant to a registration statement filed on Form S-1, which the Securities and Exchange Commission (“SEC”) declared effective on July 24, 2019. After deducting underwriting discounts and commissions and estimated offering expenses (including expenses related to the offering pursuant to the underwriters’ exercise of their overallotment option), the net proceeds to the Company from the IPO were approximately $50.8 million.
Our Business
We currently write insurance coverage in eight customer segments across a broad range of specialty lines of business. Our customer segments currently include: Media and Entertainment, Real Estate, Professional Services, Transportation, Construction, Consumer Services, Marine and Energy and Sports. Within each customer segment, we have multiple niches which represent similar groups of customers. For a description of niches served in each of these customer segments, see “Business — Our Customer Segments and Niches.” We believe having deep expertise in these niches across our organization is critical and therefore, we have aligned various functional areas at the niche level, including underwriting, operations and claims. We focus on small- and medium-sized customers, a market segment which we believe has been, and will continue to be, less affected by intense competitive dynamics of the broader property and casualty insurance industry. Over time, the composition of business within our customer segments evolves as we identify certain niches that present opportunities to develop distinct customer solutions with attractive profit potential and others that were at one time attractive but may become less so.
The tables below set forth the gross written premiums (“GWP”), gross written commission ratios, and gross loss and allocated loss adjustment expense (“ALAE”) ratios by customer segment for the years ended December 31, 2020, 2019, 2018, and 2017.2018. We have one reportable segment, Specialty Insurance. “Other” includes GWP fromfrom: (i) primary and excess workers’ compensation coverage for exited Self-Insured Groups,Groups; (ii) niches exited prior to 2018, many with a concentration in commercial auto, auto; (iii) certain fronting arrangements in which all premium written is ceded to a third party (iv) participation in industry pools,pools; and (v)(iv) emerging new business.
5663
GWP
|
|
|
|
|
|
|
|
|
|
|
|
|
|
| ||||||||||||||
|
| Years Ended December 31 |
| |||||||||||||||||||||||||
| | | | | | | | | | | | | | | ||||||||||||||
| | Years Ended December 31 | | |||||||||||||||||||||||||
($ in millions) |
|
|
|
|
|
|
| % Change |
| % Change |
|
| |
| |
| |
| % Change |
| % Change | | ||||||
Customer Segment |
| 2019 |
| 2018 |
| 2017 |
| 2019 vs. 2018 |
| 2018 vs. 2017 |
| | 2020 | | 2019 | | 2018 | | 2020 vs. 2019 | | 2019 vs. 2018 | | ||||||
Construction |
| $ | 117.9 |
| $ | 101.9 |
| $ | 73.4 |
| 15.7 | % | 38.8 | % | | $ | 110.0 | | $ | 117.9 | | $ | 101.9 | | (6.7) | % | 15.7 | % |
Consumer Services |
|
| 133.7 |
|
| 107.1 |
|
| 94.4 |
| 24.8 |
| 13.5 |
| |
| 123.0 | |
| 133.7 |
| | 107.1 |
| (8.0) |
| 24.8 | |
Marine and Energy |
|
| 94.1 |
|
| 83.0 |
|
| 79.2 |
| 13.4 |
| 4.8 |
| |
| 110.2 | |
| 94.7 |
| | 83.1 |
| 16.4 |
| 14.0 | |
Media and Entertainment |
|
| 124.9 |
|
| 119.9 |
|
| 114.4 |
| 4.2 |
| 4.8 |
| |
| 88.8 | |
| 124.9 |
| | 119.9 |
| (28.9) |
| 4.2 | |
Professional Services |
|
| 119.3 |
|
| 110.5 |
|
| 112.6 |
| 8.0 |
| (1.9) |
| |
| 130.9 | |
| 119.3 |
| | 110.5 |
| 9.7 |
| 8.0 | |
Real Estate |
|
| 167.6 |
|
| 132.7 |
|
| 132.0 |
| 26.3 |
| 0.5 |
| |
| 159.2 | |
| 167.6 |
| | 132.7 |
| (5.0) |
| 26.3 | |
Sports |
|
| 30.1 |
|
| 23.6 |
|
| 22.2 |
| 27.5 |
| 6.3 |
| | | 23.3 | | | 30.1 | | | 23.6 | | (22.6) | | 27.5 | |
Transportation |
|
| 112.2 |
|
| 92.2 |
|
| 85.1 |
| 21.7 |
| 8.3 |
| |
| 64.6 | |
| 112.2 |
| | 92.2 |
| (42.4) |
| 21.7 | |
Customer segments subtotal |
|
| 899.8 |
|
| 770.9 |
|
| 713.3 |
| 16.7 |
| 8.1 |
| | | 810.0 | | | 900.4 |
| | 771.0 | | (10.0) | | 16.8 | |
Other |
|
| 68.2 |
|
| 124.2 |
|
| 123.0 |
| (45.1) |
| 1.0 |
| |
| 7.1 | |
| 67.6 |
| | 124.1 |
| (89.5) | | (45.5) | |
Total |
| $ | 968.0 |
| $ | 895.1 |
| $ | 836.3 |
| 8.1 | % | 7.0 | % | | $ | 817.1 | | $ | 968.0 |
| $ | 895.1 | | (15.6) | % | 8.1 | % |
Gross Written Commission Ratio
|
|
|
|
|
|
|
|
|
|
|
| |||||||||||
|
| Years Ended December 31 |
| |||||||||||||||||||
|
|
|
|
|
|
|
| % Change |
| % Change |
| |||||||||||
| | | | | | | | | | | | |||||||||||
| | Years Ended December 31 | | |||||||||||||||||||
| | | | | | | | % Change |
| % Change | | |||||||||||
Customer Segment |
| 2019 |
| 2018 |
| 2017 |
| 2019 vs. 2018 |
| 2018 vs. 2017 |
|
| 2020 |
| 2019 |
| 2018 |
| 2020 vs. 2019 | | 2019 vs. 2018 | |
Construction |
| 20.3 | % | 20.7 | % | 21.0 | % | (0.4) | % | (0.3) | % |
| 20.2 | % | 20.3 | % | 20.7 | % | (0.1) | % | (0.4) | % |
Consumer Services |
| 18.1 |
| 17.1 |
| 17.1 |
| 1.0 |
| — |
|
| 21.5 | | 18.1 | | 17.1 | | 3.4 | | 1.0 | |
Marine and Energy |
| 18.5 |
| 17.9 |
| 17.1 |
| 0.6 |
| 0.8 |
|
| 19.7 | | 18.5 | | 17.9 | | 1.2 | | 0.6 | |
Media and Entertainment |
| 16.9 |
| 16.6 |
| 16.6 |
| 0.3 |
| — |
|
| 17.4 | | 16.9 | | 16.6 | | 0.5 | | 0.3 | |
Professional Services |
| 22.9 |
| 23.0 |
| 22.5 |
| (0.1) |
| 0.5 |
|
| 23.2 | | 22.9 | | 23.0 | | 0.3 | | (0.1) | |
Real Estate |
| 21.2 |
| 21.1 |
| 20.6 |
| 0.1 |
| 0.5 |
|
| 20.6 | | 21.2 | | 21.1 | | (0.6) | | 0.1 | |
Sports |
| 23.0 |
| 22.7 |
| 22.2 |
| 0.3 |
| 0.5 |
| | 22.7 | | 23.0 | | 22.7 | | (0.3) | | 0.3 | |
Transportation |
| 14.1 |
| 14.5 |
| 15.4 |
| (0.4) |
| (0.9) |
|
| 13.5 | | 14.1 | | 14.5 | | (0.6) | | (0.4) | |
All customer segments |
| 19.1 |
| 19.0 |
| 18.9 |
| 0.1 |
| 0.1 |
|
| 20.1 | | 19.1 | | 19.0 | | 1.0 | | 0.1 | |
Other |
| 16.6 |
| 18.1 |
| 18.1 |
| (1.5) |
| — |
|
| 17.8 | | 16.6 | | 18.1 | | 1.2 | | (1.5) | |
Total |
| 18.9 | % | 18.9 | % | 18.8 | % | — | % | 0.1 | % |
| 20.1 | % | 18.9 | % | 18.9 | % | 1.2 | % | — | % |
Gross Loss and ALAE Ratio, excluding Unallocated Loss Adjustment Expense (“ULAE”) Ratio
|
|
|
|
|
|
|
|
|
|
|
| |||||||||||
|
| Years Ended December 31 |
| |||||||||||||||||||
|
|
|
|
|
|
|
| % Change |
| % Change |
| |||||||||||
| | | | | | | | | | | | |||||||||||
| | Years Ended December 31 | | |||||||||||||||||||
|
| |
| |
| |
| % Change |
| % Change | | |||||||||||
Customer Segment |
| 2019 |
| 2018 |
| 2017 |
| 2019 vs. 2018 |
| 2018 vs. 2017 |
| | 2020 | | 2019 | | 2018 | | 2020 vs. 2019 | | 2019 vs. 2018 | |
Construction |
| 58.0 | % | 56.1 | % | 50.3 | % | 1.9 | % | 5.8 | % |
| 58.9 | % | 58.0 | % | 56.1 | % | 0.9 | % | 1.9 | % |
Consumer Services |
| 65.5 |
| 58.0 |
| 48.6 |
| 7.5 |
| 9.4 |
|
| 77.0 | | 65.5 | | 58.0 | | 11.5 | | 7.5 | |
Marine and Energy |
| 52.0 |
| 32.4 |
| 57.7 |
| 19.6 |
| (25.3) |
|
| 57.4 | | 52.0 | | 32.4 | | 5.4 | | 19.6 | |
Media and Entertainment |
| 45.8 |
| 54.8 |
| 62.5 |
| (9.0) |
| (7.7) |
|
| 38.4 | | 45.8 | | 54.8 | | (7.4) | | (9.0) | |
Professional Services |
| 47.5 |
| 37.6 |
| 41.4 |
| 9.9 |
| (3.8) |
|
| 58.0 | | 47.5 | | 37.6 | | 10.5 | | 9.9 | |
Real Estate |
| 65.2 |
| 60.6 |
| 58.5 |
| 4.6 |
| 2.1 |
|
| 104.1 | | 65.2 | | 60.6 | | 38.9 | | 4.6 | |
Sports |
| 39.0 |
| 61.7 |
| 59.8 |
| (22.7) |
| 1.9 |
| | 55.1 | | 39.0 | | 61.7 | | 16.1 | | (22.7) | |
Transportation |
| 69.0 |
| 62.9 |
| 85.5 |
| 6.1 |
| (22.6) |
|
| 57.3 | | 69.0 | | 62.9 | | (11.7) | | 6.1 | |
All customer segments |
| 57.2 |
| 52.6 |
| 58.0 |
| 4.6 |
| (5.4) |
|
| 67.3 | | 57.2 | | 52.6 | | 10.1 | | 4.6 | |
Other |
| 87.9 |
| 59.8 |
| 66.3 |
| 28.1 |
| (6.5) |
|
| (351.6) | | 87.9 | | 59.8 | | (439.5) | | 28.1 | |
Total |
| 60.4 | % | 53.6 | % | 59.4 | % | 6.8 | % | (5.8) | % |
| 64.9 | % | 60.4 | % | 53.6 | % | 4.5 | % | 6.8 | % |
5764
Components of Our Results of Operations
Gross written and earned premiums
GWP are the amounts received or to be received for insurance policies written by us during a specific period of time without reduction for policy acquisition costs, reinsurance costs or other deductions. The volume of our GWP in any given period is generally influenced by:
| Expansion or retraction of business within existing niches; |
| Entrance into new customer segments or niches; |
| Exit from customer segments or niches; |
| Average size and premium rate of newly issued and renewed policies; and |
| The amount of policy endorsements, audit premiums, and cancellations. |
We earn insurance premiums on a pro rata basis over the term of the policy. Our insurance policies generally have a term of one year. Net earned premiums represent the earned portion of our GWP, less that portion of our GWP that is earned and ceded to third-party reinsurers under our reinsurance agreements.
Ceded written and earned premiums
Ceded written premiums are the amount of GWP ceded to reinsurers. We actively use ceded reinsurance across our book of business to reduce our overall risk position and to protect our capital. Ceded written premiums are earned over the reinsurance contract period in proportion to the period of risk covered and the underlying policies. The volume of our ceded written premiums is impacted by the level of our GWP and any decision we make to increase or decrease retention levels.
Net investment income
We earn investment income on our portfolio of cash and invested assets. Our cash and invested assets are primarily comprised of debt securities, and may also include cash and cash equivalents, short-term investments, and alternative investments. The principal factors that influence net investment income are the size of our investment portfolio and the yield on that portfolio. As measured by amortized cost (which excludes changes in fair value, such as changes in interest rates and credit spreads), the size of our investment portfolio is mainly a function of our invested equity capital along with premiums we receive from our insureds less payments on policyholder claims and operating expenses.
Realized investment gains and losses
Realized investment gains and losses are a function of the difference between the amount received by us on the sale of a security and the security’s amortized cost, as well as any “other-than-temporary” impairmentschange in current expected credit loss allowance for available-for-sale fixed maturity securities recognized in earnings.
Losses and Loss Adjustment Expenses (“LAE”)
Losses and LAE are a function of the amount and type of insurance contracts we write, the loss experience associated with the underlying coverage, and the expenses incurred in the handling of the losses. In general, our losses and LAE are affected by:
| Frequency of claims associated with the particular types of insurance contracts that we write; |
5865
| Trends in the average size of losses incurred on a particular type of business; |
| Mix of business written by us; |
| Changes in the legal or regulatory environment related to the business we write; |
| Trends in legal defense costs; |
| Wage inflation; and |
| Inflation in medical costs. |
Losses and LAE are based on an actuarial analysis of the paid and estimated outstanding losses, including losses incurred during the period and changes in estimates from prior periods. Losses and LAE may be paid out over a number of years.
Underwriting, acquisition and insurance expenses
Underwriting, acquisition and insurance expenses include policy acquisition costs and other underwriting expenses. Policy acquisition costs are principally comprised of the commissions we pay our distribution partners and ceding commissions we receive on business ceded under certain reinsurance contracts, as well as taxes we pay to the states in which we write business, generally based on premium volume. Policy acquisition costs that are directly related to the successful acquisition of those policies are deferred. The amortization of such policy acquisition costs is charged to expense in proportion to premium earned over the policy life. Other underwriting expenses represent the general and administrative expenses of our insurance business including employment costs, telecommunication and technology costs, the costs of our leases, and legal and auditing fees.
Income tax expense
Substantially all of our income tax expense relates to U.S. federal income taxes. Our insurance companies are generally not subject to income taxes in the states in which they operate; however, our non-insurance subsidiaries are subject to state income taxes. The amount of income tax expense or benefit recorded in future periods will depend on the jurisdictions in which we operate and the tax laws and regulations in effect. Among other things, the Tax Cuts and Jobs Act (“TCJA”) lowered the U.S. federal corporate tax rate from 35% to 21% starting January 1, 2018. Our income tax expense for periods beginning in 2018 is based on the U.S. federal corporate income tax rate of 21%.
Key Metrics
We discuss certain key metrics, described below, which provide useful information about our business and the operational factors underlying our financial performance.
Net income is the amount of profit or loss remaining after deducting all incurred expenses, including income taxes, from the total earned revenues for an accounting period.
Underwriting (loss) income is calculated by subtracting losses and LAE and underwriting, acquisition and insurance expenses from net earned premiums.
Adjusted operating income is net income excluding net realized investment gains and losses, impairment of goodwill and expenses relating to various transactions that we consider to be unique and non-recurring in nature (net of estimated tax impact), and excluding the income tax expense resulting from implementation of TCJA. .
Loss and LAE ratio, expressed as a percentage, is the ratio of losses and LAE, allocated and unallocated, to net earned premiums, net of the effects of reinsurance.
5966
Expense ratio, expressed as a percentage, is the ratio of underwriting, acquisition and insurance expenses to net earned premiums.
Combined ratio is the sum of the loss and LAE ratio and the expense ratio. A combined ratio under 100% indicates an underwriting profit. A combined ratio over 100% indicates an underwriting loss.
Adjusted loss and LAE ratio is the loss and LAE ratio excluding the effects of the WAQS (as defined below).
Adjusted expense ratio is the expense ratio excluding the effects of the WAQS.
Adjusted combined ratio is the combined ratio excluding the effects of the WAQS.
Return on equity is net income expressed on an annualized basis as a percentage of average beginning and ending stockholders’ equity during the period.
Adjusted operating return on equity is adjusted operating income expressed on an annualized basis as a percentage of average beginning and ending stockholders’ equity during the period.
Net retention ratio is the ratio of net written premiums to GWP.
Underwriting income, adjusted operating income, adjusted loss and LAE ratio, adjusted expense ratio, adjusted combined ratio and adjusted operating return on equity are non-generally accepted accounting principles (“GAAP”) financial measures. See “— Reconciliation of Non-GAAP Financial Measures” for a reconciliation of net income in accordance with GAAP to underwriting income and adjusted operating income. See “— Factors Affecting Our Results of Operations — The WAQS” for additional detail on the impact of the WAQS on our results of operations.
Factors Affecting Our Results of Operations
The WAQS
In connection with the divestment of our U.K. business, New York Marine as reinsured entered into the whole account quota share reinsurance agreements (the “WAQS”) with third party reinsurers to maintain reasonable underwriting leverage within New York Marine and its subsidiary insurance companies during a transition period following the U.K. divestment. The effective date of the WAQS was April 1, 2017. The reinsurers’ ceding participation is an aggregate 26.0%. A provisional ceding commission of 30.0% to 30.5% is received as a reduction in the amount of ceded premium. Subject to limits, these ceding commissions will vary in subsequent periods based on contractual ultimate loss ratios. During 2018 and following the transition of the U.S. business back to New York Marine, the WAQS were terminated. Previously ceded written and unearned premium, net of the ceding commission, was reversed. Loss reserves on premium earned prior to the cut-off termination remain ceded loss reserves. TheThere were no ceded loss reserves under the WAQS wereas of December 31, 2020 and $33.1 million and $43.7 million as of December 31, 2019 and December 31, 2018, respectively.2019. Loss reserve development on the reserves ceded under the WAQS is included in continuing operations.
The effect of the WAQS on our results of operations is primarily reflected in our ceded written premiums, losses and LAE, as well as our underwriting, acquisition and insurance expenses.
For the year ended December 31, 2020 there was no impact of WAQS on underwriting results or ratios.
6067
The following tables summarize the effect of the WAQS on our underwriting (loss) income for the years ended December 31, 2020, 2019 2018 and 2017:2018:
| | | | | | | | | | | | | | | | | | | | | | | | | | | | |
| | Year Ended December 31, 2020 | | Year Ended December 31, 2019 | | Year Ended December 31, 2018 | | |||||||||||||||||||||
|
| Including |
| Effect of |
| Excluding |
| Including |
| Effect of |
| Excluding |
| Including |
| Effect of |
| Excluding | | |||||||||
($ in thousands) | | WAQS | | WAQS | | WAQS | | WAQS | | WAQS | | WAQS |
| WAQS | | WAQS | | WAQS | | |||||||||
GWP | | $ | 817,090 | | $ | — | | $ | 817,090 | | $ | 968,011 | | $ | — | | $ | 968,011 | | $ | 895,112 | | $ | — | | $ | 895,112 | |
Ceded written premiums | |
| (122,912) | |
| — | |
| (122,912) | |
| (115,871) | |
| 3 | |
| (115,874) | |
| (45,038) | |
| 58,857 | |
| (103,895) | |
Net written premiums | | $ | 694,178 | | $ | — | | $ | 694,178 | | $ | 852,140 | | $ | 3 | | $ | 852,137 | | $ | 850,074 | | $ | 58,857 | | $ | 791,217 | |
Net retention(1) | |
| 85.0 | % |
| — | |
| 85.0 | % |
| 88.0 | % |
| — | |
| 88.0 | % |
| 95.0 | % |
| — | |
| 88.4 | % |
Net earned premiums | | $ | 737,755 | | $ | — | | $ | 737,755 | | $ | 807,854 | | $ | 3 | | $ | 807,851 | | $ | 730,785 | | $ | (14,560) | | $ | 745,345 | |
Losses and LAE | |
| 472,671 | |
| — | |
| 472,671 | |
| 501,025 | |
| 4,746 | |
| 496,279 | |
| 434,830 | |
| (9,514) | |
| 444,344 | |
Underwriting, acquisition and insurance expenses | |
| 272,844 | |
| — | |
| 272,844 | |
| 290,457 | |
| (4,743) | |
| 295,200 | |
| 271,547 | |
| (3,955) | |
| 275,502 | |
Underwriting (loss) income(2) | | $ | (7,760) | | $ | — | | $ | (7,760) | | $ | 16,372 | | $ | — | | $ | 16,372 | | $ | 24,409 | | $ | (1,091) | | $ | 25,499 | |
Loss and LAE ratio | |
| 64.1 | % |
| — | % |
| — | |
| 62.0 | % |
| — | % |
| — | |
| 59.5 | % |
| 65.3 | % |
| — | |
Expense ratio | |
| 37.0 | % |
| — | % |
| — | |
| 36.0 | % |
| — | % |
| — | |
| 37.2 | % |
| 27.2 | % |
| — | |
Combined ratio | |
| 101.1 | % |
| — | % |
| — | |
| 98.0 | % |
| — | % |
| — | |
| 96.7 | % |
| 92.5 | % |
| — | |
Adjusted loss and LAE ratio(3) | |
| — | |
| — | |
| 64.1 | % |
| — | |
| — | |
| 61.4 | % |
| — | |
| — | |
| 59.6 | % |
Adjusted expense ratio(3) | |
| — | |
| — | |
| 37.0 | % |
| — | |
| — | |
| 36.6 | % |
| — | |
| — | |
| 37.0 | % |
Adjusted combined ratio(3) | |
| — | |
| — | |
| 101.1 | % |
| — | |
| — | |
| 98.0 | % |
| — | |
| — | |
| 96.6 | % |
|
|
|
|
|
|
|
|
|
|
|
|
|
|
|
|
|
|
|
|
|
|
|
|
|
|
|
|
|
|
| Year Ended December 31, 2019 |
| Year Ended December 31, 2018 |
| Year Ended December 31, 2017 |
| |||||||||||||||||||||
|
| Including |
| Effect of |
| Excluding |
| Including |
| Effect of |
| Excluding |
| Including |
| Effect of |
| Excluding |
| |||||||||
($ in thousands) |
| WAQS |
| WAQS |
| WAQS |
| WAQS |
| WAQS |
| WAQS |
| WAQS |
| WAQS |
| WAQS |
| |||||||||
GWP |
| $ | 968,011 |
| $ | — |
| $ | 968,011 |
| $ | 895,112 |
| $ | — |
| $ | 895,112 |
| $ | 836,334 |
| $ | — |
| $ | 836,334 |
|
Ceded written premiums |
|
| (115,871) |
|
| 3 |
|
| (115,874) |
|
| (45,038) |
|
| 58,857 |
|
| (103,895) |
|
| (276,048) |
|
| (160,779) |
|
| (115,269) |
|
Net written premiums |
| $ | 852,140 |
| $ | 3 |
| $ | 852,137 |
| $ | 850,074 |
| $ | 58,857 |
| $ | 791,217 |
| $ | 560,286 |
| $ | (160,779) |
| $ | 721,065 |
|
Net retention(1) |
|
| 88.0 | % |
| — |
|
| 88.0 | % |
| 95.0 | % |
| — |
|
| 88.4 | % |
| 67.0 | % |
| — |
|
| 86.2 | % |
Net earned premiums |
| $ | 807,854 |
| $ | 3 |
| $ | 807,851 |
| $ | 730,785 |
| $ | (14,560) |
| $ | 745,345 |
| $ | 609,786 |
| $ | (87,362) |
| $ | 697,148 |
|
Losses and LAE |
|
| 501,025 |
|
| 4,746 |
|
| 496,279 |
|
| 434,830 |
|
| (9,514) |
|
| 444,344 |
|
| 393,741 |
|
| (51,897) |
|
| 445,638 |
|
Underwriting, acquisition and insurance expenses |
|
| 290,457 |
|
| (4,743) |
|
| 295,200 |
|
| 271,547 |
|
| (3,955) |
|
| 275,502 |
|
| 213,844 |
|
| (29,560) |
|
| 243,404 |
|
Underwriting income (loss)(2) |
| $ | 16,372 |
| $ | — |
| $ | 16,372 |
| $ | 24,409 |
| $ | (1,091) |
| $ | 25,499 |
| $ | 2,201 |
| $ | (5,905) |
| $ | 8,106 |
|
Loss and LAE ratio |
|
| 62.0 | % |
| — | % |
| — |
|
| 59.5 | % |
| 65.3 | % |
| — |
|
| 64.6 | % |
| 59.4 | % |
| — |
|
Expense ratio |
|
| 36.0 | % |
| — | % |
| — |
|
| 37.2 | % |
| 27.2 | % |
| — |
|
| 35.1 | % |
| 33.8 | % |
| — |
|
Combined ratio |
|
| 98.0 | % |
| — | % |
| — |
|
| 96.7 | % |
| 92.5 | % |
| — |
|
| 99.7 | % |
| 93.2 | % |
| — |
|
Adjusted loss and LAE ratio(3) |
|
| — |
|
| — |
|
| 61.4 | % |
| — |
|
| — |
|
| 59.6 | % |
| — |
|
| — |
|
| 63.9 | % |
Adjusted expense ratio(3) |
|
| — |
|
| — |
|
| 36.6 | % |
| — |
|
| — |
|
| 37.0 | % |
| — |
|
| — |
|
| 34.9 | % |
Adjusted combined ratio(3) |
|
| — |
|
| — |
|
| 98.0 | % |
| — |
|
| — |
|
| 96.6 | % |
| — |
|
| — |
|
| 98.8 | % |
| (1) |
| Net retention is a non-GAAP measure. We define net retention as the ratio of net written premiums to |
| (2) |
| Underwriting (loss) income is a non-GAAP financial measure. See “Reconciliation of Non-GAAP Financial |
| (3) |
| Adjusted loss and LAE ratio, adjusted expense ratio and adjusted combined ratio are non-GAAP financial measures. We define adjusted loss and LAE ratio, adjusted expense ratio and adjusted combined ratio as the corresponding ratio excluding the effects of the WAQS. We use these adjusted ratios as internal performance measures in the management of our operations because we believe they give our management and other users of our financial information useful insight into our results of operations and our underlying business performance. Our adjusted loss and LAE ratio, adjusted expense ratio and adjusted combined ratio should not be viewed as substitutes for our loss and LAE ratio, expense ratio and combined ratio, respectively. |
Our results of operations may be difficult to compare from year to year due to the origination and termination of the WAQS. While there was no impact of WAQS on underwriting results or ratios for the year ended December 31, 2020, the impact of WAQS on prior periods is shown above. In light of the impact of the WAQS on our results of operations for prior periods, we internally evaluated our financial performance both including and excluding the effectseffect of the WAQS.
6168
Results of Operations
Year Ended December 31, 20192020 Compared to Year Ended December 31, 20182019
| | | | | | | | | | | | |
| | Years Ended December 31 | | Change |
| |||||||
($ in thousands) |
| 2020 |
| 2019 |
| $ |
| Percent | | |||
GWP | | $ | 817,090 | | $ | 968,011 | | $ | (150,921) | | (15.6) | % |
Ceded written premiums | |
| (122,912) | |
| (115,871) | |
| (7,041) | | 6.1 | |
Net written premiums | | $ | 694,178 | | $ | 852,140 | | $ | (157,962) | | (18.5) | % |
| | | | | | | | | | | | |
Net earned premiums | | $ | 737,755 | | $ | 807,854 | | $ | (70,099) | | (8.7) | % |
Net losses and LAE incurred | |
| 472,671 | |
| 501,025 | |
| (28,354) | | (5.7) | |
Underwriting, acquisition and insurance expenses | |
| 272,844 | |
| 290,457 | |
| (17,613) | | (6.1) | |
Underwriting (loss) income(1) | |
| (7,760) | |
| 16,372 | |
| (24,132) | | (147.4) | |
Interest and other expenses, net | |
| 31,751 | |
| 28,408 | |
| 3,343 | | 11.8 | |
Net investment income | |
| 73,021 | |
| 68,897 | |
| 4,124 | | 6.0 | |
Realized investment gains, net | |
| 4,980 | |
| 770 | |
| 4,210 | | 546.8 | |
Income before taxes | |
| 38,490 | |
| 57,631 | |
| (19,141) | | (33.2) | |
Income tax expense | |
| 10,740 | |
| 12,137 | |
| (1,397) | | (11.5) | |
Net income from continuing operations | | $ | 27,750 | | $ | 45,494 | | $ | (17,744) | | (39.0) | % |
Adjusted operating income(1) | | $ | 40,328 | | $ | 57,636 | | $ | (17,308) | | (30.0) | % |
| | | | | | | | | | | | |
Adjusted operating return on equity(1) | | | 6.9 | % |
| 12.4 | % | | | | | |
Return on equity | | | 4.8 | % |
| 9.8 | % | | | | | |
| | | | | | | | | | | | |
Loss and LAE ratio: | | | 64.1 | % |
| 62.0 | % | | | | | |
Loss and LAE ratio – excluding catastrophe(2) | | | 61.6 | % |
| 61.6 | % | | | | | |
Loss and LAE ratio – catastrophe | | | 2.5 | % |
| 0.4 | % | | | | | |
Expense ratio | | | 37.0 | % |
| 36.0 | % | | | | | |
Combined ratio | | | 101.1 | % |
| 98.0 | % | | | | | |
| | | | | | | | | | | | |
Adjusted loss and LAE ratio(3) | | | 64.1 | % |
| 61.4 | % | | | | | |
Adjusted loss and LAE ratio – excluding catastrophe(2) | | | 61.6 | % |
| 61.0 | % | | | | | |
Adjusted loss and LAE ratio – catastrophe | | | 2.5 | % |
| 0.4 | % | | | | | |
Adjusted expense ratio(3) | | | 37.0 | % |
| 36.6 | % | | | | | |
Adjusted combined ratio(3) | | | 101.1 | % |
| 98.0 | % | | | | | |
|
|
|
|
|
|
|
|
|
|
|
|
|
|
| Years Ended December 31 |
| Change |
| |||||||
($ in thousands) |
| 2019 |
| 2018 |
| $ |
| Percent |
| |||
GWP |
| $ | 968,011 |
| $ | 895,112 |
| $ | 72,899 |
| 8.1 | % |
Ceded written premiums |
|
| (115,871) |
|
| (45,038) |
|
| (70,833) |
| 157.3 |
|
Net written premiums |
| $ | 852,140 |
| $ | 850,074 |
| $ | 2,066 |
| 0.2 | % |
|
|
|
|
|
|
|
|
|
|
|
|
|
Net earned premiums |
| $ | 807,854 |
| $ | 730,785 |
| $ | 77,069 |
| 10.5 |
|
Losses and LAE |
|
| 501,025 |
|
| 434,830 |
|
| 66,195 |
| 15.2 |
|
Underwriting, acquisition and insurance expenses |
|
| 290,457 |
|
| 271,547 |
|
| 18,910 |
| 7.0 |
|
Underwriting income(1) |
|
| 16,372 |
|
| 24,409 |
|
| (8,037) |
| (32.9) |
|
Interest and other expenses, net |
|
| 28,408 |
|
| 11,704 |
|
| 16,704 |
| 142.7 |
|
Net investment income |
|
| 68,897 |
|
| 55,971 |
|
| 12,926 |
| 23.1 |
|
Realized investment gains (losses), net |
|
| 770 |
|
| (1,557) |
|
| 2,327 |
| (149.5) |
|
Income before taxes |
|
| 57,631 |
|
| 67,118 |
|
| (9,488) |
| (14.1) |
|
Income tax expense |
|
| 12,137 |
|
| 13,389 |
|
| (1,252) |
| (9.4) |
|
Net income from continuing operations |
| $ | 45,494 |
| $ | 53,729 |
| $ | (8,236) |
| (15.3) | % |
Adjusted operating income(1) |
| $ | 57,636 |
| $ | 55,286 |
| $ | 2,350 |
| 4.3 | % |
|
|
|
|
|
|
|
|
|
|
|
|
|
Adjusted operating return on equity(1) |
|
| 12.4 | % |
| 14.4 | % |
|
|
|
|
|
Return on equity |
|
| 9.8 | % |
| 14.0 | % |
|
|
|
|
|
|
|
|
|
|
|
|
|
|
|
|
|
|
Loss and LAE ratio: |
|
| 62.0 | % |
| 59.5 | % |
|
|
|
|
|
Loss and LAE ratio – excluding catastrophe |
|
| 61.6 | % |
| 59.0 | % |
|
|
|
|
|
Loss and LAE ratio – catastrophe |
|
| 0.4 | % |
| 0.5 | % |
|
|
|
|
|
Expense ratio |
|
| 36.0 | % |
| 37.2 | % |
|
|
|
|
|
Combined ratio |
|
| 98.0 | % |
| 96.7 | % |
|
|
|
|
|
|
|
|
|
|
|
|
|
|
|
|
|
|
Adjusted loss and LAE ratio(2) |
|
| 61.4 | % |
| 59.6 | % |
|
|
|
|
|
Adjusted loss and LAE ratio – excluding catastrophe |
|
| 61.0 | % |
| 59.1 | % |
|
|
|
|
|
Adjusted loss and LAE ratio – catastrophe |
|
| 0.4 | % |
| 0.5 | % |
|
|
|
|
|
Adjusted expense ratio(2) |
|
| 36.6 | % |
| 37.0 | % |
|
|
|
|
|
Adjusted combined ratio(2) |
|
| 98.0 | % |
| 96.6 | % |
|
|
|
|
|
| (1) |
| Underwriting (loss) income, adjusted operating income and adjusted operating return on equity are non-GAAP financial measures. See |
| (2) |
|
| (3) | Adjusted loss and LAE ratio, adjusted expense ratio and adjusted combined ratio are non-GAAP financial measures. We define adjusted loss and LAE ratio, adjusted expense ratio and adjusted combined ratio as the corresponding ratio excluding the effects of the WAQS. For additional detail on the impact of the WAQS on our results of operations see |
Net Income from Continuing Operations
Net income from continuing operations was $27.8 million for the year ended December 31, 2020 compared to $45.5 million for the year ended December 31, 2019, compareda decrease of $17.7 million, or 39.0%. The decrease in net income from continuing operations is driven by a reduction in net earned premium due to $53.7the contraction of gross written premium and reduced insured exposures resulting from the economic downturn caused by the COVID-19 pandemic, combined with a higher net loss ratio due to catastrophe losses in the third quarter.
69
Premiums
GWP were $817.1 million for the year ended December 31, 2018, a decrease of $8.2 million, or 15.3%. The decrease in net income primarily resulted from an increase in interest and other expenses of $16.7 million, and a decrease in underwriting income of $8.0 million, partially offset by an increase in net investment income of $12.9 million.
62
Premiums
GWP were2020 compared to $968.0 million for the year ended December 31, 2019, compared to $895.1 million for the year ended December 31, 2018, an increasea decrease of $72.9$150.9 million, or 8.1%15.6%.
The following table presents the GWP by customer segment for the years ended December 31, 20192020 and 2018:2019:
|
|
|
|
|
|
|
|
|
| |||||||||
| | | | | | | | | | |||||||||
($ in millions) |
| Years Ended December 31 |
| | Years Ended December 31 | | ||||||||||||
Customer Segment |
| 2019 |
| 2018 |
| % Change |
|
| 2020 |
| 2019 |
| % Change | | ||||
Construction |
| $ | 117.9 |
| $ | 101.9 |
| 15.7 | % | | $ | 110.0 | | $ | 117.9 |
| (6.7) | % |
Consumer Services |
|
| 133.7 |
|
| 107.1 |
| 24.8 |
| |
| 123.0 | |
| 133.7 |
| (8.0) | |
Marine and Energy |
|
| 94.1 |
|
| 83.0 |
| 13.4 |
| |
| 110.2 | |
| 94.7 |
| 16.4 | |
Media and Entertainment |
|
| 124.9 |
|
| 119.9 |
| 4.2 |
| |
| 88.8 | |
| 124.9 |
| (28.9) | |
Professional Services |
|
| 119.3 |
|
| 110.5 |
| 8.0 |
| |
| 130.9 | |
| 119.3 |
| 9.7 | |
Real Estate |
|
| 167.6 |
|
| 132.7 |
| 26.3 |
| |
| 159.2 | |
| 167.6 |
| (5.0) | |
Sports |
|
| 30.1 |
|
| 23.6 |
| 27.5 |
| | | 23.3 | | | 30.1 | | (22.6) | |
Transportation |
|
| 112.2 |
|
| 92.2 |
| 21.7 |
| |
| 64.6 | |
| 112.2 |
| (42.4) | |
Customer segments subtotal |
|
| 899.8 |
|
| 770.9 |
| 16.7 |
| | | 810.0 | | | 900.4 |
| (10.0) | |
Other |
|
| 68.2 |
|
| 124.2 |
| (45.1) |
| |
| 7.1 | |
| 67.6 |
| (89.5) | |
Total |
| $ | 968.0 |
| $ | 895.1 |
| 8.1 | % | | $ | 817.1 | | $ | 968.0 |
| (15.6) | % |
Premium growthGross written premium contraction in 20192020 was primarily driven by decreased new business and increased renewalsreduced insureds exposures within previously existing niches combined with entry into new niches, primarily within Real Estate, Consumer Servicesthe Transportation and Transportation customer segments. Excluding the decline of GWP within “Other,” premiums for the year ended December 31, 2019 increased 16.7% comparedMedia & Entertainment due to the year ended December 31, 2018.economic downturn from the COVID-19 pandemic.
The changes in GWP were most notable in the following customer segments and niches:
|
|
| ● | Media and Entertainment GWP decreased by 28.9% to $88.8 million for the year ended December 31, 2020 compared to $124.9 million for the year ended December 31, 2019. The premium contraction is driven by $11.2 million of exposure reductions, $9.2 million of declines in renewal business and $6.5 million of reduced new business opportunities in the Live Entertainment and Film niches primarily due to |
| Consumer Services GWP |
| ● | Marine and Energy GWP increased by 16.4% to $110.2 million for the year ended December 31, |
|
|
| ● | Professional Services GWP increased by 9.7% to |
Net written premiums increaseddecreased by $2.1$158.0 million, or 0.2%18.5%, to $694.2 million for the year ended December 31, 2020 from $852.1 million for the year ended December 31, 20192019. The decrease in net written premiums was due to a
70
reduction in gross written premiums due to the economic downturn from $850.1the COVID-19 pandemic as well as the exit of monoline workers’ compensation.
Net earned premiums decreased by $70.1 million, or 8.7%, to $737.8 million for the year ended December 31, 2018. The increase in net written premiums was due to an increase in gross written premiums of $72.9 million, partially offset by an increase in ceded written premium of $70.8 million, an increase of 157.3%2020 from the year ended December 31, 2018, primarily due to the termination of the WAQS.
63
The termination of the WAQS resulted in a reversal of $58.9 million of ceded premiums for the year ended December 31, 2018. Our net retention ratio excluding the WAQS was 88.0% and 88.4% for the years ended December 31, 2019 and 2018, respectively.
Net earned premiums increased by $77.1 million, or 10.5%, to $807.9 million for the year ended December 31, 2019. The decrease in net earned premiums directly related to contraction of net written premiums.
Loss and LAE Ratio
Our loss and LAE ratio was 64.1% for the year ended December 31, 2020 compared to 62.0% for the year ended December 31, 2019. During the year ended December 31, 2020 the Company’s reserve for unpaid losses and loss adjustment expenses for accident years 2019 and prior developed unfavorably by $0.7 million driven by unfavorable development of $21.8 million in General Liability, $16.8 million unfavorable development in Commercial Multiple Peril and $8.1 million unfavorable development in Commercial Auto, partially offset by $36.5 million of favorable development in Workers’ Compensation and $9.5 million of favorable development in All Other lines. In addition, the Company incurred $15.2 million of losses and loss adjustment expenses related to premium adjustments earned during the year ended December 31, 2020, attributable to accident years 2019 and 2018. The unfavorable development in General Liability, Commercial Multiple Peril and Commercial Auto related to 2013 through 2017 accident years due largely to increased severities in runoff components. The favorable development in Workers’ Compensation derived from $730.8lower than expected claims severity across all customer segments primarily in accident years 2015 through 2018. The favorable development in All Other lines was driven mostly by Ocean Marine.
Catastrophe losses of $14.3 million for the year ended December 31, 2018. The increase in net earned premiums was directly related2020 were driven primarily by Hurricane Laura and the Oregon wildfires, adding 2.0 points to the growth in written premiums. Excluding the effectscurrent accident year loss ratio compared to $3.0 million of the WAQS, net earned premiumscatastrophe losses for the year ended December 31, 2019 were $807.92019. The Company also incurred $6.1 million comparedof reinsurance reinstatement premiums, related to $745.3 millioncatastrophe losses during the period, which increased the loss ratio by 0.5 points for the year ended December 31, 2018, an increase of 8.4%.
Loss and LAE ratio
Our2020. The loss and LAE ratio, excluding catastrophe losses and related items was 62.0%61.6% for the year ended December 31, 2019 compared to 59.5% for the year ended December 31, 2018. The increase is primarily due to an increase in the current accident year (excluding catastrophe losses) ratio combined with an unfavorable change in prior period development. For the year ended December 31, 2019 the current accident year (excluding catastrophe losses) was 61.2%, compared to 59.7% for the year ended December 31, 2018. For the year ended December 31, 2019, before adjusting for the WAQS, we incurred unfavorable prior period development of $3.2 million as compared to favorable development of $5.0 million for the year ended December 31, 2018. After adjusting for the WAQS, we incurred favorable development in both 2019 and 2018.
Included within our 62.0% loss and LAE ratio for the year ended December 31, 2019 is $0.4% of catastrophe losses, a decrease of 0.1%, from $3.6 million, or 0.5% for the year ended December 31, 2018. Catastrophe losses for the years ended December 31, 2019 related to a midwestern tornado and 2018 was primarily California wildfires.2020.
The following tables summarize the effect of the factors indicated above on the loss and LAE ratios and adjusted loss and LAE ratios for the years ended December 31, 20192020 and 2018:2019:
| | | | | | | | | | | |
| | Years Ended December 31 | | ||||||||
| | 2020 | | 2019 | | ||||||
| | | | % of Earned | | | | % of Earned | | ||
($ in thousands) |
| Losses and LAE |
| Premiums |
| Losses and LAE |
| Premiums | | ||
Loss and LAE: | | | | |
| | |
| |
| |
Current accident year – excluding catastrophe (1) | | $ | 457,647 | | 61.5 | % | $ | 494,871 | | 61.2 | % |
Current accident year – catastrophe losses (2) | |
| 14,314 | | 2.5 | |
| 3,000 | | 0.4 | |
Effect of prior year development | |
| 710 | | 0.1 | |
| 3,154 | | 0.4 | |
Total | | $ | 472,671 | | 64.1 | % | $ | 501,025 | | 62.0 | % |
|
|
|
|
|
|
|
|
|
|
|
| |||||||||||
|
| Years Ended December 31 |
| |||||||||||||||||||
|
| 2019 |
| 2018 |
| |||||||||||||||||
|
|
|
| % of Earned |
|
|
| % of Earned |
| |||||||||||||
| | | | | | | | | | | | |||||||||||
| | Years Ended December 31 | | |||||||||||||||||||
| | 2020 | | 2019 | | |||||||||||||||||
| | | | | % of Earned | | | | | % of Earned | | |||||||||||
($ in thousands) |
| Losses and LAE |
| Premiums |
| Losses and LAE |
| Premiums |
|
| Losses and LAE |
| Premiums |
| Losses and LAE |
| Premiums | | ||||
Loss and LAE: |
|
|
|
|
|
|
|
|
|
|
| |||||||||||
Adjusted loss and LAE: | | |
| |
| | |
| |
| | |||||||||||
Current accident year – excluding catastrophe |
| $ | 494,871 |
| 61.2 | % | $ | 436,287 |
| 59.7 | % | | $ | 457,647 | | 61.5 | % | $ | 494,871 | | 61.2 | % |
Current accident year – catastrophe losses |
|
| 3,000 |
| 0.4 |
|
| 3,560 |
| 0.5 |
| |
| 14,314 | | 2.5 | |
| 3,000 | | 0.4 | |
Effect of prior year development |
|
| 3,154 |
| 0.4 |
|
| (5,017) |
| (0.7) |
| |
| 710 | | 0.1 | |
| (1,592) | | (0.2) | |
Total |
| $ | 501,025 |
| 62.0 | % | $ | 434,830 |
| 59.5 | % | | $ | 472,671 | | 64.1 | % | $ | 496,279 | | 61.4 | % |
|
|
|
|
|
|
|
|
|
|
|
|
|
| Years Ended December 31 |
| ||||||||
|
| 2019 |
| 2018 |
| ||||||
|
|
|
|
| % of Earned |
|
|
|
| % of Earned |
|
($ in thousands) |
| Losses and LAE |
| Premiums |
| Losses and LAE |
| Premiums |
| ||
Adjusted loss and LAE: |
|
|
|
|
|
|
|
|
|
|
|
Current accident year – excluding catastrophe |
| $ | 494,871 |
| 61.2 | % | $ | 445,801 |
| 59.8 | % |
Current accident year – catastrophe losses |
|
| 3,000 |
| 0.4 |
|
| 3,560 |
| 0.5 |
|
Effect of prior year development |
|
| (1,592) |
| (0.2) |
|
| (5,017) |
| (0.7) |
|
Total |
| $ | 496,279 |
| 61.4 | % | $ | 444,344 |
| 59.6 | % |
| (1) | Earned premiums are adjusted to exclude the impact of reinsurance reinstatement premiums related to catastrophe losses incurred during the period. |
6471
| (2) | Catastrophe losses are any one claim, or group of claims, equal or greater than $1.0 million related to a single PCS designated catastrophe event. PCS is Property Claim Services, a Verisk company. PCS has defined catastrophes in the United States, Puerto Rico, and the U.S. Virgin Islands as events that cause $25.0 million or more in direct insured losses to property and affect a significant number of policyholders and insurers. |
The following table presents the loss and LAE ratio before and after the effects of reinsurance, for the years ended December 31, 20192020 and 2018:2019:
|
|
|
|
|
|
|
| |||||||
|
| Years Ended December 31 |
|
|
| |||||||||
|
| 2019 |
| 2018 |
| % Change |
| |||||||
| | | | | | | | |||||||
| | Years Ended December 31 | | |
| |||||||||
|
| 2020 |
| 2019 |
| % Change |
| |||||||
Loss and LAE Ratio: |
|
|
|
|
|
|
|
|
|
|
|
|
| |
Gross loss and ALAE |
| 60.4 | % | 53.6 | % | 6.8 | % |
| 64.7 | % | 60.4 | % | 4.3 | % |
ULAE |
| 1.8 |
| 2.9 |
| (1.1) |
|
| 1.0 | | 1.8 | | (0.8) | |
Gross loss and LAE ratio |
| 62.2 |
| 56.5 |
| 5.7 |
|
| 65.7 | | 62.2 | | 3.5 | |
Effect of ceded reinsurance |
| (0.2) |
| 3.0 |
| (3.2) |
|
| (1.6) | | (0.2) | | (1.4) | |
Loss and LAE ratio |
| 62.0 |
| 59.5 |
| 2.5 |
|
| 64.1 | | 62.0 | | 2.1 | |
Effect of WAQS |
| (0.6) |
| 0.1 |
| (0.7) |
|
| — | | (0.6) | | 0.6 | |
Adjusted loss and LAE ratio |
| 61.4 | % | 59.6 | % | 1.8 | % |
| 64.1 | % | 61.4 | % | 2.7 | % |
Expense ratioRatio
Our expense ratio was 37.0% for the year ended December 31, 2020 compared to 36.0% for the year ended December 31, 2019 compared to 37.2% for the year ended December 31, 2018.2019. This reductionincrease is primarilydriven by contraction of net earned premium due to the increase in net earned premiums exceedingimpact of the increase in underwriting and insurance expenses combined with a slight reduction ineconomic downturn from the net policy acquisition expense ratio.COVID-19 pandemic on GWP.
The following table summarizes the components of the expense ratio for the years ended December 31, 20192020 and 2018:2019:
| | | | | | | | | | | |
| | Years Ended December 31 | | ||||||||
| | 2020 | | 2019 | | ||||||
| | | | | % of Earned | | | | | % of Earned | |
($ in thousands) |
| Expenses |
| Premiums |
| Expenses |
| Premiums | | ||
Underwriting, acquisition and insurance expenses: | | |
| |
| | |
| |
| |
Policy acquisition expenses, net of ceded reinsurance | | $ | 172,426 | | 23.4 | % | $ | 189,514 | | 23.5 | % |
Underwriting and insurance expenses | |
| 100,418 | | 13.6 | |
| 105,686 | | 13.1 | |
Underwriting, acquisition and insurance expenses(1) | |
| 272,844 | | 37.0 | |
| 295,200 | | 36.6 | |
Effect of WAQS | |
| — | | - | |
| (4,743) | | (0.6) | |
Total underwriting, acquisition and insurance expenses | | $ | 272,844 | | 37.0 | % | $ | 290,457 | | 36.0 | % |
|
|
|
|
|
|
|
|
|
|
|
|
|
| Years Ended December 31 |
| ||||||||
|
| 2019 |
| 2018 |
| ||||||
|
|
|
|
| % of Earned |
|
|
|
| % of Earned |
|
($ in thousands) |
| Expenses |
| Premiums |
| Expenses |
| Premiums |
| ||
Underwriting, acquisition and insurance expenses: |
|
|
|
|
|
|
|
|
|
|
|
Policy acquisition expenses, net of ceded reinsurance |
| $ | 189,514 |
| 23.5 | % | $ | 175,384 |
| 23.6 | % |
Underwriting and insurance expenses |
|
| 105,686 |
| 13.1 |
|
| 100,118 |
| 13.4 |
|
Underwriting, acquisition and insurance expenses(1) |
|
| 295,200 |
| 36.6 |
|
| 275,502 |
| 37.0 |
|
Effect of WAQS |
|
| (4,743) |
| (0.6) |
|
| (3,955) |
| 0.2 |
|
Total underwriting, acquisition and insurance expenses |
| $ | 290,457 |
| 36.0 | % | $ | 271,547 |
| 37.2 | % |
| (1) |
| Underwriting, acquisition and insurance expenses is calculated based on the net earned premiums excluding the effects of the WAQS for the years ended December 31, |
Underwriting income(Loss) Income
Underwriting loss was $7.8 million for the year ended December 31, 2020 compared to an underwriting income Combined Ratio Our combined ratio was 101.1% for the year ended December 31, 2020 compared to wasof $16.4 million for the year ended December 31, 2019, a decrease of $24.2 million, or 147.4%. The decrease is driven by a reduction in net earned premium due to the contraction of gross written premium and reduced insured exposures resulting from the economic downturn caused by the COVID-19 pandemic, combined with a higher net loss ratio due to catastrophe losses in the third quarter.$24.498.0% for the year ended December 31, 2019. Our adjusted combined ratio was 101.1% for the year ended December 31, 2020 compared to 98.0% for the year ended December 31, 2019.
72
Investing Results
Our net investment income increased by 6.0% to $73.0 million for the year ended December 31, 2018, a decrease of $8.0 million, or 32.9%. Excluding the WAQS, underwriting income was $16.4 million for the year ended December 31, 2019, compared to $25.5 million for the year ended December 31, 2018. The change in underwriting income for the year ended December 31, 2019 compared to 2018 was due to an increase in the loss and LAE ratio, partially offset by a decrease in the expense ratio.
Combined ratio
Our combined ratio was 98.0% for the year ended December 31, 2019 compared to 96.7% for the year ended December 31, 2018. Our adjusted combined ratio was 98.0% for the year ended December 31, 2019 compared to 96.6% for the year ended December 31, 2018.
65
Investing results
Our net investment income increased by 23.1% to2020 from $68.9 million for the year ended December 31, 2019 from $56.0 million for the year ended December 31, 2018.2019. Our average invested assets increased 15.3%11.6% from $1.7 billion for the year ended December 31, 2018, to $2.0 billion for the year ended December 31, 2019.2019, to $2.2 billion for the year ended December 31, 2020. Net investment yield increaseddecreased by 0.20.1 percentage points, to 3.3% as of December 31, 2020 compared to 3.4% as of December 31, 2019 compared to 3.2% as of December 31, 2018.2019. Gross investment income increased by $13.1$5.3 million to $76.5 million for the year ended December 31, 2020 compared to $71.2 million for the year ended December 31, 2019 compared to $58.1 million for the year ended December 31, 2018.2019.
Realized investment gains, (losses), net increased by $2.3$4.2 million due to non-recurring realized gains on the sale of certain securities as part of the repositioning of the investment portfolio, calls, and corporate actions during a favorable price environment for the year ended December 31, 2019.2020.
The following table summarizes the components of net investment income and realized investment gains, (losses), net for the years ended December 31, 20192020 and 2018:2019:
|
|
|
|
|
|
|
|
|
| |||||||||
|
| Years Ended December 31 |
|
|
| |||||||||||||
| | | | | | | | | | |||||||||
| | Years Ended December 31 | | | | |||||||||||||
($ in thousands) |
| 2019 |
| 2018 |
| $ Change |
| 2020 |
| 2019 |
| $ Change | ||||||
Interest from securities |
| $ | 66,975 |
| $ | 55,765 |
| $ | 11,210 | |||||||||
Fixed maturity securities | | $ | 62,621 | | $ | 66,975 | | $ | (4,354) | |||||||||
Other investments |
|
| 4,224 |
|
| 2,371 |
|
| 1,853 | | | 13,863 | | | 4,224 | | | 9,639 |
Gross investment income |
|
| 71,199 |
|
| 58,136 |
|
| 13,063 | | | 76,484 | | | 71,199 | | | 5,285 |
Investment expenses |
|
| (2,302) |
|
| (2,165) |
|
| (137) | | | (3,463) | | | (2,302) | | | (1,161) |
Net investment income |
|
| 68,897 |
|
| 55,971 |
|
| 12,926 | | | 73,021 | | | 68,897 | | | 4,124 |
Realized investment gains (losses), net |
|
| 770 |
|
| (1,557) |
|
| 2,327 | |||||||||
Realized investment gains, net | | | 4,980 | | | 770 | | | 4,210 | |||||||||
Total |
| $ | 69,667 |
| $ | 54,414 |
| $ | 15,253 | | $ | 78,001 | | $ | 69,667 | | $ | 8,334 |
Average invested assets at book value |
| $ | 2,009,083 |
| $ | 1,742,530 |
| $ | 266,553 | | $ | 2,242,855 | | $ | 2,009,083 | | $ | 233,772 |
The weighted average duration of our fixed income portfolio, including cash equivalents, was 4.8 years at December 31, 2020 and 3.4 years at December 31, 2019 and 2.9 years at December 31, 2018.2019.
Interest and other expenses, netOther Expenses, Net
Our interest and other expenses, net increased by $16.7$3.3 million to $31.8 million for the year ended December 31, 2020 compared to $28.4 million for the year ended December 31, 2019 compared2019. The increase is primarily driven by the impairment of goodwill in the fourth quarter of $11.9 million in relation to $11.7 million for the year ended December 31, 2018. Included in interest and other expenses in 2019 is $12.1 millionacquisition of interest expenses primarily related to senior debt obligations, $8.0 millionthe Company announced on January 15, 2021, partially offset by a decline of non-recurring expenses related to the transition of our former CEO and $7.1 million of expenses related to the vesting of restricted stock units granted duringat the IPO.IPO in 2019.
Income Tax Expense
Our effective tax expense
Ourrate for the years ended December 31, 2020 and 2019 was 27.9% and 21.1%, respectively. The increase in the effective tax rate for the year ended December 31, 2020 compared to the same period in 2019 was 21.1% comparedprimarily due to 20.0% forlack of tax benefit from the year ended December 31, 2018. On December 22, 2017,goodwill impairment. Excluding the TCJA was signed into law, which reducedgoodwill impairment, the Company’s statutory corporateeffective tax rate from 35% to 21% beginning with the 2018 tax year.was 21.4%.
Our income tax expense was $12.1$10.7 million and $13.4$12.1 million for the years ended December 31, 2020 and 2019, respectively. The decrease is primarily due to the decrease in income before income taxes compared to the same period in 2019.
On March 27, 2020, the President of the United States signed into law the Coronavirus Aid, Relief, and 2018.Economic Security Act (the “CARES Act”). The CARES Act, among other things, includes certain income tax provisions for individuals and corporations; however, these benefits do not impact the Company’s current tax provision.
73
Adjusted operating incomeOperating Income
Adjusted operating income was $40.3 million for the year ended December 31, 2020, a decrease of $17.3 million, or 30.0% from the adjusted operating income of $57.6 million for the year ended December 31, 2019, an increase of $2.4 million, or 4.3% fromprimarily due to the adjusted operatingreduction in underwriting income of $55.3 million for the year ended December 31, 2018.
66
partially offset by increased net investment income.
Adjusted operating returnOperating Return on equityEquity
Our adjusted operating return on equity was 6.9% for the year ended December 31, 2020, a decrease of 5.5% from 12.4% for the year ended December 31, 2019, a decrease of 2.0% percentage points from 14.4% for the year ended December 31, 2018.
Year Ended December 31, 2018 Compared to Year Ended December 31, 2017
The following table summarizes the results of continuing operations for the years ended December 31, 2018 and 2017:
|
|
|
|
|
|
|
|
|
|
|
|
|
|
| Years Ended December 31 |
| Change |
| |||||||
($ in thousands) |
| 2018 |
| 2017 |
| $ |
| Percent |
| |||
GWP |
| $ | 895,112 |
| $ | 836,334 |
| $ | 58,778 |
| 7.0 | % |
Ceded written premiums |
|
| (45,038) |
|
| (276,048) |
|
| 231,010 |
| (83.7) |
|
Net written premiums |
| $ | 850,074 |
| $ | 560,286 |
| $ | 289,788 |
| 51.7 | % |
|
|
|
|
|
|
|
|
|
|
|
|
|
Net earned premiums |
| $ | 730,785 |
| $ | 609,786 |
| $ | 120,999 |
| 19.8 |
|
Losses and LAE |
|
| 434,830 |
|
| 393,741 |
|
| 41,089 |
| 10.4 |
|
Underwriting, acquisition and insurance expenses |
|
| 271,547 |
|
| 213,844 |
|
| 57,703 |
| 27.0 |
|
Underwriting income(1) |
|
| 24,409 |
|
| 2,201 |
|
| 22,208 |
| 1,009.0 |
|
Interest and other expenses, net |
|
| 11,704 |
|
| 11,272 |
|
| 432 |
| 3.8 |
|
Net investment income |
|
| 55,971 |
|
| 36,196 |
|
| 19,775 |
| 54.6 |
|
Realized investment (losses) gains, net |
|
| (1,557) |
|
| 4,204 |
|
| (5,761) |
| (137.0) |
|
Income before taxes |
|
| 67,118 |
|
| 31,329 |
|
| 35,789 |
| 114.2 |
|
Income tax expense |
|
| 13,389 |
|
| 38,233 |
|
| (24,844) |
| (65.0) |
|
Net income (loss) from continuing operations |
| $ | 53,729 |
| $ | (6,904) |
| $ | 60,633 |
| (878.2) | % |
Adjusted operating income(1) |
| $ | 55,286 |
| $ | 13,992 |
| $ | 41,294 |
| 295.1 | % |
|
|
|
|
|
|
|
|
|
|
|
|
|
|
| Years Ended December 31 |
|
|
| |||||||
($ in thousands) |
| 2018 |
| 2017 |
|
|
|
|
| |||
Adjusted operating return on equity(1) |
|
| 14.4 | % |
| 3.7 | % |
|
|
|
|
|
Return on equity |
|
| 14.0 | % |
| (1.8) | % |
|
|
|
|
|
|
|
|
|
|
|
|
|
|
|
|
|
|
Loss and LAE ratio: |
|
| 59.5 | % |
| 64.6 | % |
|
|
|
|
|
Loss and LAE ratio – excluding catastrophe |
|
| 59.0 | % |
| 63.1 | % |
|
|
|
|
|
Loss and LAE ratio – catastrophe |
|
| 0.5 | % |
| 1.5 | % |
|
|
|
|
|
Expense ratio |
|
| 37.2 | % |
| 35.1 | % |
|
|
|
|
|
Combined ratio |
|
| 96.7 | % |
| 99.7 | % |
|
|
|
|
|
|
|
|
|
|
|
|
|
|
|
|
|
|
Adjusted loss and LAE ratio(2) |
|
| 59.6 | % |
| 63.9 | % |
|
|
|
|
|
Adjusted loss and LAE ratio – excluding catastrophe |
|
| 59.1 | % |
| 62.6 | % |
|
|
|
|
|
Adjusted loss and LAE ratio – catastrophe |
|
| 0.5 | % |
| 1.3 | % |
|
|
|
|
|
Adjusted expense ratio(2) |
|
| 37.0 | % |
| 34.9 | % |
|
|
|
|
|
Adjusted combined ratio(2) |
|
| 96.6 | % |
| 98.8 | % |
|
|
|
|
|
|
|
|
|
67
Net Income (Loss)
Net income was $53.7 million for the year ended December 31, 2018 compared to a net loss of $6.9 million for the year ended December 31, 2017, an increase of $60.6 million, or 878.2%. The increase in net income primarily resulted from an increase in underwriting income of $22.2 million, a $19.8 million increase in net investment income, and a decrease in income tax expense of $24.8 million.
Premiums
GWP were $895.1 million for the year ended December 31, 2018 compared to $836.3 million for the year ended December 31, 2017, an increase of $58.8 million, or 7.0%.
The following table presents the GWP by customer segment for the years ended December 31, 2018 and 2017:
|
|
|
|
|
|
|
|
|
|
($ in millions) |
| Years Ended December 31 |
| ||||||
Customer Segment |
| 2018 |
| 2017 |
| % Change |
| ||
Construction |
| $ | 101.9 |
| $ | 73.4 |
| 38.8 | % |
Consumer Services |
|
| 107.1 |
|
| 94.4 |
| 13.5 |
|
Marine and Energy |
|
| 83.0 |
|
| 79.2 |
| 4.8 |
|
Media and Entertainment |
|
| 119.9 |
|
| 114.4 |
| 4.8 |
|
Professional Services |
|
| 110.5 |
|
| 112.6 |
| (1.9) |
|
Real Estate |
|
| 132.7 |
|
| 132.0 |
| 0.5 |
|
Sports |
|
| 23.6 |
|
| 22.2 |
| 6.3 |
|
Transportation |
|
| 92.2 |
|
| 85.1 |
| 8.3 |
|
Customer segments subtotal |
|
| 770.9 |
|
| 713.3 |
| 8.1 |
|
Other |
|
| 124.2 |
|
| 123.0 |
| 1.0 |
|
Total |
| $ | 895.1 |
| $ | 836.3 |
| 7.0 | % |
Premium growth in 2018 was primarily driven by the expansion of our business within the existing niches, including expanded product offerings. Excluding the decline of GWP within “Other,” premiums for the year ended December 31, 2018 increased 8.1% compared to the year ended December 31, 2017.
The changes in GWP were most notable in the following customer segments and niches:
|
|
|
|
68
|
|
Net written premiums increased by $289.8 million, or 51.7%, to $850.1 million for the year ended December 31, 2018 from $560.3 million for the year ended December 31, 2017. The increase in net written premiums was directly related to a reduction in ceded written premiums of $231.0 million, a decrease of 83.7% from the year ended December 31, 2017, due to the termination of the WAQS. Excluding the effects of the WAQS, net written premiums for the year ended December 31, 2018 were $791.2 million, an increase of 9.7%, from the year ended December 31, 2017. Our net retention ratio excluding the WAQS was 88.4% and 86.2% for the years ended December 31, 2018 and 2017, respectively.
Net earned premiums increased by $121.0 million, or 19.8%, to $730.8 million for the year ended December 31, 2018 from $609.8 million for the year ended December 31, 2017. The increase in net earned premiums was directly related to the growth in written premiums and a reduction in ceded earned premiums due to the impact of the WAQS of $72.8 million, a decrease of 83.3% from the year ended December 31, 2017. Excluding the effects of the WAQS, net earned premiums for the year ended December 31, 2018 were $745.3 million, an increase of 6.9% from the year ended December 31, 2017.
Loss and LAE ratio
Our loss and LAE ratio was 59.5% for the year ended December 31, 2018 compared to 64.6% for the year ended December 31, 2017. The improvement is due to a change in prior period development. For the year ended December 31, 2018, we incurred favorable prior period development of $5.0 million as compared to unfavorable development of $20.3 million for the year ended December 31, 2017.
Included within our 59.5% loss and LAE ratio for the year ended December 31, 2018 is 0.5% of catastrophe losses primarily from the California wildfires. This is a decrease of 1.0% of losses for the year ended December 31, 2018, from 1.5% for the year ended December 31, 2017.
The following tables summarize the effect of the factors indicated above on the loss and LAE ratios and adjusted loss and LAE ratios for the years ended December 31, 2018 and 2017:
|
|
|
|
|
|
|
|
|
|
|
|
|
| Years Ended December 31 |
| ||||||||
|
| 2018 |
| 2017 |
| ||||||
|
|
|
| % of Earned |
|
|
| % of Earned |
| ||
($ in thousands) |
| Losses and LAE |
| Premiums |
| Losses and LAE |
| Premiums |
| ||
Loss and LAE: |
|
|
|
|
|
|
|
|
|
|
|
Current accident year – excluding catastrophe |
| $ | 436,287 |
| 59.7 | % | $ | 364,557 |
| 59.8 | % |
Current accident year – catastrophe losses |
|
| 3,560 |
| 0.5 |
|
| 8,865 |
| 1.5 |
|
Effect of prior year development |
|
| (5,017) |
| (0.7) |
|
| 20,319 |
| 3.3 |
|
Total |
| $ | 434,830 |
| 59.5 | % | $ | 393,741 |
| 64.6 | % |
69
|
|
|
|
|
|
|
|
|
|
|
|
|
| Years Ended December 31 |
| ||||||||
|
| 2018 |
| 2017 |
| ||||||
|
|
|
|
| % of Earned |
|
|
|
| % of Earned |
|
($ in thousands) |
| Losses and LAE |
| Premiums |
| Losses and LAE |
| Premiums |
| ||
Adjusted loss and LAE: |
|
|
|
|
|
|
|
|
|
|
|
Current accident year – excluding catastrophe |
| $ | 445,801 |
| 59.8 | % | $ | 416,454 |
| 59.7 | % |
Current accident year – catastrophe losses |
|
| 3,560 |
| 0.5 |
|
| 8,865 |
| 1.3 |
|
Effect of prior year development |
|
| (5,017) |
| (0.7) |
|
| 20,319 |
| 2.9 |
|
Total |
| $ | 444,344 |
| 59.6 | % | $ | 445,638 |
| 63.9 | % |
The following table presents the loss and LAE ratio before and after the effects of reinsurance, for the years ended December 31, 2018 and 2017:
|
|
|
|
|
|
|
|
|
| Years Ended December 31 |
|
|
| ||
|
| 2018 |
| 2017 |
| % Change |
|
Loss and LAE Ratio: |
|
|
|
|
|
|
|
Gross Loss and ALAE |
| 53.6 | % | 59.4 | % | (5.8) | % |
ULAE |
| 2.9 |
| 2.5 |
| 0.4 |
|
Gross loss and LAE ratio |
| 56.5 |
| 61.9 |
| (5.4) |
|
Effect of ceded reinsurance |
| 3.0 |
| 2.7 |
| 0.3 |
|
Loss and LAE ratio |
| 59.5 |
| 64.6 |
| (5.1) |
|
Effect of WAQS |
| 0.1 |
| (0.7) |
| (0.8) |
|
Adjusted loss and LAE ratio |
| 59.6 | % | 63.9 | % | (4.3) | % |
Expense ratio
Our expense ratio was 37.2% for the year ended December 31, 2018 compared to 35.1% for the year ended December 31, 2017. This is primarily due to non-recurring expense items including the net benefit of litigation recoveries in 2017 of $4.6 million and cost of additional short-term incentive compensation expense of $6.8 million in 2018.
The following table summarizes the components of the expense ratio for the years ended December 31, 2018 and 2017:
|
|
|
|
|
|
|
|
|
|
|
|
|
| Years Ended December 31 |
| ||||||||
|
| 2018 |
| 2017 |
| ||||||
|
|
|
|
| % of Earned |
|
|
|
| % of Earned |
|
($ in thousands) |
| Expenses |
| Premiums |
| Expenses |
| Premiums |
| ||
Underwriting, acquisition and insurance expenses: |
|
|
|
|
|
|
|
|
|
|
|
Policy acquisition expenses, net of ceded reinsurance |
| $ | 175,384 |
| 23.6 | % | $ | 155,583 |
| 22.3 | % |
Underwriting and insurance expenses |
|
| 100,118 |
| 13.4 |
|
| 87,821 |
| 12.6 |
|
Underwriting, acquisition, and insurance expenses(1) |
|
| 275,502 |
| 37.0 |
|
| 243,404 |
| 34.9 |
|
Effect of WAQS |
|
| (3,955) |
| 0.2 |
|
| (29,560) |
| 0.2 |
|
Total underwriting, acquisition and insurance expenses |
| $ | 271,547 |
| 37.2 | % | $ | 213,844 |
| 35.1 | % |
|
|
Underwriting income
Underwriting income was $24.4 million for the year ended December 31, 2018 compared to an underwriting loss of $2.2 million for the year ended December 31, 2017, an increase of $22.2 million, or 1,009.0%. Excluding the WAQS, underwriting income was $25.5 million for the year ended December 31, 2018, compared to underwriting income of $8.1 million for the year ended December 31, 2017.
70
Combined ratio
Our combined ratio was 96.7% for the year ended December 31, 2018 compared to 99.7% for the year ended December 31, 2017. Our adjusted combined ratio was 96.6% for the year ended December 31, 2018 compared to 98.8% for the year ended December 31, 2017.
Investing results
Our net investment income increased by 54.6% to $56.0 million for the year ended December 31, 2018 from $36.2 million for the year ended December 31, 2017. In connection with our divestment of the U.K. business, we repositioned the portfolio to align the assets returned from the U.K. with our U.S. investment strategy and generate an increased yield. We also identified certain alternative investment opportunities which further diversified our portfolio and enhanced yield. Gross investment yield increased by 0.9 percentage points, to 3.4% as of December 31, 2018 compared to 2.5% as of December 31, 2017. Gross investment income increased by $20.0 million to $58.1 million for the year ended December 31, 2018 compared to $38.1 million for the year ended December 31, 2017.
Realized investment (losses) gains, net decreased by $5.8 million or 137.0% due to non-recurring realized gains on the sale of certain securities as part of the repositioning of the investment portfolio in 2017 and $1.5 million of other-than- temporary impairments for the year ended December 31, 2018.
The following table summarizes the components of net investment income and realized investment (losses) gains, net for the years ended December 31, 2018 and 2017:
|
|
|
|
|
|
|
|
|
|
|
| Years Ended December 31 |
|
|
| ||||
($ in thousands) |
| 2018 |
| 2017 |
| $ Change | |||
Interest from securities |
| $ | 55,765 |
| $ | 33,467 |
| $ | 22,298 |
Other investments |
|
| 2,371 |
|
| 4,609 |
|
| (2,238) |
Gross investment income |
|
| 58,136 |
|
| 38,076 |
|
| 20,060 |
Investment expenses |
|
| (2,165) |
|
| (1,880) |
|
| (285) |
Net investment income |
|
| 55,971 |
|
| 36,196 |
|
| 19,775 |
Realized investment (losses) gains, net |
|
| (1,557) |
|
| 4,204 |
|
| (5,761) |
Total |
| $ | 54,414 |
| $ | 40,400 |
| $ | 14,014 |
Average cash and invested assets |
| $ | 1,731,460 |
| $ | 1,519,107 |
| $ | 212,353 |
The weighted average duration of our fixed income portfolio, including cash equivalents, was 2.9 years at December 31, 2018 and 3.9 years at December 31, 2017.
Interest and other expenses, net
Our interest and other expenses, net increased by $0.4 million to $11.7 million for the year ended December 31, 2018 compared to $11.3 million for the year ended December 31, 2017.
Income tax expense
Our effective tax rate for the year ended December 31, 2018 was 20.0% compared to 122.0% for the year ended December 31, 2017. On December 22, 2017, the TCJA was signed into law, which reduced the Company’s statutory corporate tax rate from 35% to 21% beginning with the 2018 tax year. The Company revalued its 2017 deferred tax assets and liabilities in response to this reduction which resulted in a $25.1 million charge to income in 2017.
Our income tax expense was $13.4 million and $38.2 million for the years ended December 31, 2018 and 2017.
71
Adjusted operating income
Adjusted operating income was $55.3 million for the year ended December 31, 2018, an increase of $41.3 million, or 295.1% from the adjusted operating income of $14.0 million forcombined with the year ended December 31, 2017.increase in average book value.
Adjusted operating return on equity
Our adjusted operating return on equity was 14.4% for the year ended December 31, 2018, an increase of 10.7 percentage points from 3.7% for the year ended December 31, 2017.
Liquidity and Capital Resources
Sources and Uses of Funds
We are organized as a holding company with our operations primarily conducted by our wholly-ownedwholly owned insurance subsidiaries, New York Marine and Gotham, which are domiciled in New York, and Southwest Marine, which is domiciled in Arizona. Accordingly, the holding company may receive cash through;through: (i) loans from banks; (ii) draws on a revolving loan agreement; (iii) issuance of equity and debt securities; (iv) corporate service fees from our operating subsidiaries; (v) payments from our subsidiaries pursuant to our consolidated tax allocation agreement and other transactions; and (vi) subject to certain limitations discussed below, dividends from our insurance subsidiaries. We also may use the proceeds from these sources to contribute funds to the insurance subsidiaries in order to support premium growth, reduce our reliance on reinsurance, and pay dividends and taxes and for other business purposes.
We receive corporate service fees from the operating subsidiaries to reimburse us for most of the operating expenses that we incur. These reimbursements areReimbursement of expenses through corporate service fees is based on the actual costs that we expect to incur with no mark-up above our expected costs.
We fileOur $140.0 million aggregate principal amount of 7.5% Senior Unsecured Notes and $25.0 million aggregate principal amount of 6.5% Senior Notes (collectively, the “Notes”) matured in November 2020. In June 2020, we entered into a consolidated U.S. federal income tax returncredit agreement (the “Credit Agreement”) with our subsidiaries,certain lenders and under our corporate tax allocation agreement, each participant is charged or refunded taxes accordingTruist Bank, N.A., as administrative agent (“Truist”), providing for a $165.0 million delayed draw term loan facility (the “Term Loan Facility”). The Company used the Term Loan Facility proceeds to the amount that the participant would have paid or received had it filed on a separate return basis with the Internal Revenue Service (“IRS”).
State insurance laws restrict the abilityrepay $165.0 million in complete satisfaction of the insurance subsidiaries to declare stockholder dividends without prior regulatory approval. State insurance regulators require insurance companies to maintain specified levels of statutory capitaloutstanding debt under the Notes. (see “— Credit Agreement” and surplus. No insurance subsidiary may declare or distribute any dividend to stockholders which, together with all dividends declared or distributed by it during the preceding twelve months, exceeds the lesser of ten percent of its surplus to policyholders or 100 percent of adjusted net investment income. The maximum amount of dividends the insurance subsidiaries can pay us during 2020 without regulatory approval is $54.7 million. Insurance regulators have broad powers to ensure that statutory surplus remains at adequate levels, and there is no assurance that dividends of the maximum amount calculated under any applicable formula would be permitted. In the future, state insurance regulatory authorities that have jurisdiction over the payment of dividends by the insurance subsidiaries may adopt statutory provisions more restrictive than those currently in effect. The insurance subsidiaries did not pay any dividends to us during 2019, 2018 or 2017.“—Senior Debt).
Management believes that the Company has sufficient liquidity available to meet its operating cash needs and obligations and committed capital expenditures for the next 12 months.
Cash Flows
OurThe most significant source of cash for our operating subsidiaries is from premiums received from our insureds, which, for most policies, we receive at the beginning of the coverage period, and net of the related commission amount for the policies. Our most significant cash outflow is for claims that arise when a policyholder incurs an insured loss. Because the payment of claims occurs after the receipt of the premium, often years later, we invest the cash in various investment securities that generally earn interest and dividends. We also use cash to pay for operating expenses such as salaries, rent and taxes and capital expenditures such as technology systems. Because the payment of claims occurs well after the receipt of the premium, we invest the cash in various investment securities that generally earn interest and dividends. The operating subsidiaries’ investment portfolios represent an additional source of liquidity that could be accessed if needed. As described under “—Reinsurance” below, we use reinsurance to
72
manage the risk that we take on our policies. We cede, or pay out, part of the premiums we receive to our reinsurers and collect cash back when losses subject to our reinsurance coverage are paid.
Our total assets and liabilities increased in the years ended December 31, 2019, 2018 and 2017, reflecting the underlying increase in premiums and related loss reserves and unearned premiums. The casualty-focused nature of our products, and limited property exposures, enabledtypically allow us to generate significant operating cash flow generation. The timing of our cash flows from operating activities can vary among periods due to the timing by which payments are made or received.flow. Some of our payments and receipts, including loss settlements and subsequent reinsurance receipts, can be significant, and as a result their timing can influence cash flows from operating activities in any given
74
period. Management believes that cash receipts from premiums, proceeds from investment sales and maturities, and investment income are sufficient to cover cash outflows in the foreseeable future.
Our cash flows for the years ended December 31, 2020, 2019 and 2018 were:
| | | | | | | | | |
| | Years Ended December 31 | |||||||
|
| 2020 |
| 2019 |
| 2018 | |||
($ in thousands) | | | |||||||
Cash and cash equivalents provided by (used in): | | | | | | | | | |
Operating activities | | $ | 116,390 |
| $ | 253,296 |
| $ | 231,692 |
Investing activities | | | (179,866) |
| | (288,616) |
| | (297,952) |
Financing activities | | | 57,106 |
| | 32,138 |
| | 18,000 |
Net change in cash and cash equivalents | | $ | (6,370) | | $ | (3,182) | | $ | (48,260) |
The decrease in cash provided by operating activities for the year ended December 31, 2020, compared to the year ended December 31, 2019, was largely driven by timing of claim payments and 2017 were:
|
|
|
|
|
|
|
|
|
|
|
| Years Ended December 31 | |||||||
|
| 2019 |
| 2018 |
| 2017 | |||
($ in thousands) |
|
| |||||||
Cash and cash equivalents provided by (used in): |
|
|
|
|
|
|
|
|
|
Operating activities |
| $ | 253,296 |
| $ | 231,692 |
| $ | 73,870 |
Investing activities |
|
| (288,616) |
|
| (297,952) |
|
| (160,473) |
Financing activities |
|
| 32,138 |
|
| 18,000 |
|
| 50,000 |
Change in cash and cash equivalents |
| $ | (3,182) |
| $ | (48,260) |
| $ | (36,603) |
premium collection declines due to COVID-19. Cash used in investing activities is primarily funded by cash flow from operations. The decrease in cash used in investing activities for the year ended December 31, 2020, compared to the year ended December 31, 2019, primarily reflected the amount of operating funds available for investment in the year.
The increase in cash provided by operatingfinancing activities in 2019, 2018 and 2017 was due primarilyfor the year ended December 31, 2020, compared to the timing of premium receipts, claim payments and reinsurance activity. Cash flows from operations in each of the past three years were used primarily to fund investing activities.
For the year ended December 31, 2019, net cash used in investing activities was $288.6 million, a decrease of $9.3 million from 2018, and primarily reflected purchases of fixed income securities.
For the year ended December 31, 2019, net cash provided by financing activities was $32.1 million, primarily reflecting netdue to proceeds from the Revolving Credit Facility of $42.0 million and the issuance of the $24.9 million secured loan in 2020, compared to $50.9 million of proceeds related to the IPO and payment ofoffset by the $18.0 million on our credit facility. A significant portionutilized to pay down the Citizens Revolving Credit agreement in 2019. The Term Loan Facility proceeds of the funds$165.0 million received from the IPO were ultimately contributed to our insurance subsidiary, New York Marine, and additional amountsin November 2020 were used to repay all outstanding debt under the maturing Notes.
Credit Agreement
On June 12, 2020 (the “Effective Date”), we entered into a credit agreement (the “Credit Agreement”) with certain lenders and Truist Bank, N.A., as administrative agent (“Truist”), providing for a $165.0 million delayed draw term loan facility (the “Term Loan Facility”). Borrowings under the Term Loan Facility were used to refinance the Notes at maturity. The Credit Agreement includes a letter of credit sub-limit of up to $5.0 million and a swingline loan sub-limit of up to $5.0 million. Further, the Credit Agreement provided for an uncommitted revolving loan facility (the “Revolving Credit Facility”) in an initial aggregate amount of $35.0 million, which subsequently became committed and increased to an aggregate of $65.0 million pursuant to the Incremental Agreement (defined below). At our option, borrowings under the Term Loan Facility and the Revolving Credit Facility would be (i) a “Base Rate Borrowing” which would bear interest at the Base Rate (as defined below) plus the Applicable Margin (as described below), or (ii) an “Eurodollar Borrowing” which would bear interest at the Adjusted LIBO Rate (defined as reserve-adjusted LIBOR, subject to a floor of 0.75%), for periods of one, two, three or six months, plus the Applicable Margin. The Base Rate is the highest of (a) the rate of interest announced publicly by Truist as its prime lending rate, (b) 0.5% above the federal funds rate, (c) the Adjusted LIBO Rate determined on a daily basis for a one-month period (subject to a floor of 0.75%) plus 1.00%, and (d) zero percent. The Applicable Margin for a Eurodollar Borrowing will range from 2.00% to 3.25% per annum based upon ProSight’s Debt to Capitalization Ratio (as defined in the Credit Agreement) in effect on such date. The initial Applicable Margin for Base Rate Borrowings is 100 basis points lower than the Applicable Margin for Eurodollar Borrowings. The Applicable Margin at the Effective date for Eurodollar Borrowings was 3.00% and this rate was in effect as of the date of filing of this Annual Report. Following such date, the Applicable Margin will be determined as set forth above.
We agreed to pay a ticking fee with respect to the undrawn portion of the commitments for the Term Loan Facility, ranging from 0.20% to 0.30% per annum based upon our Debt to Capitalization Ratio (as defined in the Credit Agreement) in effect on such date. We also agreed to pay a commitment fee on the unused portion of the Revolving Credit Facility, ranging from 0.20% to 0.30% at the Effective Date. We ceased payment of the ticking fee upon the drawdown of the Term Loan Facility in November 2020. We continue to pay the commitment fee of 0.30% on the unused portion of the Revolving
75
Credit Facility as of the filing date of this Annual Report. Following such date, the commitment fee will be determined as set forth above.
The Credit Agreement includes certain covenants, including restrictions on the disposition of assets, restrictions on the incurrence of liens and indebtedness, limits on making restricted payments and requirements to maintain specified capitalization levels.
As a condition precedent to entry into the Credit Agreement, we terminated our amended and restated revolving loan agreement, dated as of March 15, 2019, with Citizens Bank, N.A. (“Citizens”), which had previously provided for a $50.0 million revolving credit facility. No amounts were outstanding under this facility at termination.
Revolving Credit Facility
On June 30, 2020, we entered into an incremental facility agreement and amendment (the “Incremental Agreement”) with certain lenders and Truist as administrative agent. The Incremental Agreement supplemented the Credit Agreement by obtaining from lenders commitments with respect to the Revolving Credit Facility provided for under the Credit Agreement, and increasing the Revolving Credit Facility from $35.0 million as stated in the Credit Agreement to an aggregate amount of $65.0 million.
The Revolving Credit Facility may be used for general corporate purposes, including, without limitation, to support business growth and to provide additional liquidity if needed. On July 14, 2020, the Company drew down $5.0 million on the Revolving Credit Facility and on August 3, 2020, the Company drew down an additional $30.0 million, primarily to make capital contributions to its insurance subsidiaries. On November 25,2020, the Company drew down an additional $7.0 million on the Revolving Credit Facility, primarily to make interest payments on its Senior Unsecured Notes due November 2020 and for additional liquidity needs. As of the date of this filing, there is $42.0 million outstanding under the Revolving Credit Facility.
Master Lease Agreement
On June 26, 2020, we sold certain assets, in exchange for approximately $24.9 million of proceeds and agreed to lease such assets back from Citizens in exchange for monthly payments bearing interest at 4.83%. The lease expires on July 1, 2025, on which date we will repurchase the assets from Citizens for one dollar. This transaction is treated as a secured loan payable under U.S. GAAP. For a discussion of the secured loan payable, see Note 14. Debt – Secured Loan Payable.
Revolving Loan Agreement
On January 29, 2018, ProSight entered into a revolving loan agreement with certain lenders and Citizens Bank, N.A., as agent, providing for a revolving loan facility of up to $25.0 million. On March 15, 2019, the Company entered into an amended and restated revolving loan agreement, which increased the facility to $50.0 million (as amended,million. As previously noted, we terminated this revolving loan agreement as a condition precedent to entry into the “revolving facility”). The maturity date of the revolvingCredit Agreement in June 2020. No amounts were outstanding under this facility is the earlier of (i) March 15, 2022, or (ii) 91 days before the maturity of the senior notes due November 2020 or, if such senior notes are amended or replaced, 91 days before the maturity of such amendment or replacement.
Borrowings under the revolving facility accrue interest, at our option, at a rate equal to either; (a) a base rate determined by reference to the highest of; (i) the administrative agent’s prime lending rate; (ii) the federal funds effective rate plus 0.50%; and (iii) the LIBOR rate for a one-month interest period plus 1.00%, in each case plus 2.00% or (b) the LIBOR rate for the interest period relevant to such borrowing plus the applicable margin. The applicable margins range from 1.75% to 3.00% based on our financial strength ratings and credit ratings. In addition, the revolving facility provides for a fee ranging from 0.20% to 0.75%, also based on our financial strength ratings and credit ratings, on the amount of undrawn commitments thereunder.termination.
The revolving facility provides for mandatory prepayment of outstanding loans upon the occurrence of certain change of control events that result in a downgrade of the ratings assigned to the notes described below. The revolving
73
facility also permits us, at any time or from time to time, to voluntarily prepay loans. The revolving facility includes certain covenants, including restrictions on the disposition of assets, restrictions on the incurrence of liens and indebtedness, restrictions on making restricted payments and requirements to maintain specified liquidity levels.
On August 8, 2019, the Company used IPO proceeds to repay $18.0 million in complete satisfaction of the outstanding debt under the revolving facility. As of December 31, 2019, there were no amounts outstanding and the revolving facility had a borrowing capacity of $50.0 million.
Senior Debt
In November 2013, ProSight issued $140.0 million of 7.5% Senior Unsecured Notes due November 2020 and in January 2015, issued an additional $25.0 million of 6.5% Senior Notes due November 2020. The notes provideprovided for semi-annual interest payments and maturematured on November 26, 2020. We may prepay the notes in whole or in part (provided that at least 10% of the outstanding amount of the applicable series of notes is so prepaid), at any time or from time to time, at 100% of the principal amount of the notes prepaid plus a make-whole amount, as set forth in the documents governing the notes (the “Note Purchase Agreements”), plus accrued and unpaid interest on the principal amount of the notes being prepaid to, but excluding, the prepayment date. The Note Purchase Agreements requirerequired us, upon the occurrence of certain change of control events that result in a downgrade of the ratings assigned to the notes, to offer to each holder to prepay such holder’s notes at a price equal to 100% of the principal amount thereof plus any accrued interest. The Note Purchase Agreements also includeincluded certain covenants that restrict our ability to incur indebtedness, make restricted payments, incur liens, and require that we maintain specified liquidity levels.
76
On November 25, 2020, the Company used the Term Loan Facility proceeds to repay $165.0 million in complete satisfaction of the outstanding debt under the 7.5% Senior Unsecured Notes due November 2020 and the 6.5% Senior Notes due November 2020.
Interest payments of $12.1 million per annum were made on these Senior Unsecured Notes in each of the years ended December 31, 2020, 2019 2018 and 2017.2018.
Reinsurance
We actively use ceded reinsurance across our book of business to reduce our overall risk position and to protect our capital. Reinsurance involves a primary insurance company transferring, or “ceding”, a portion of its premium and losses in order to limit its exposure. The ceding of liability to a reinsurer does not relieve the obligation of the primary insurance to the policyholder. The primary insurer remains liable for the entire loss if the reinsurer fails to meet its obligations under the reinsurance agreement. Our reinsurance isagreements are primarily contracted under excess of loss agreements. In excess of loss reinsurance, the reinsurer agrees to assume all or a portion of the ceding company’s losses, in excess of a specified amount. In excess of loss reinsurance, the premium payable to the reinsurer is negotiated by the parties based on their assessment of the amount of risk being ceded to the reinsurer because the reinsurer does not share proportionately in the ceding company’s losses.
We use quota share and facultative reinsurance in selected niches, on a limited basis.reinsurance. In quota share reinsurance, the reinsurer agrees to assume a specified percentage of the ceding company’s losses arising out of a defined class of business in exchange for a corresponding percentage of premiums, net of a ceding commission. Facultative coverage refers to a reinsurance contract on individual risks as opposed to a group or class of business. It is used for a variety of reasons, including supplementing the limits provided by the treaty coverage or covering risks or perils excluded from treaty reinsurance.
Our largest quota share reinsurance agreements were the WAQS. In connection with the divestment of our U.K. business, New York Marine as reinsured entered into the WAQS with third party reinsurers to maintain reasonable underwriting leverage within New York Marine and its subsidiary insurance companies during a transition period following the U.K. divestment. During 2018, and following the transition of the U.S. business back to New York Marine, the WAQS were terminated.
74
Effective January 1, 2020, the WAQS were commuted.
The following is a summary of our significant in-force excess of loss reinsurance programs as of December 31, 2019:2020:
| | |
Line of Business Covered | Summary Reinsurance Coverage | |
Property - per risk |
| $37.0 million excess of $3.0 million |
Property - catastrophe |
| $195.0 million excess of $5.0 million |
Casualty |
|
|
Primary Workers' Compensation |
| $37.0 million excess of $3.0 million |
|
| |
Marine | | $42.5 million excess of $2.5 million |
Custom Bonds |
| $38.0 million excess of $2.0 million |
(1) | Our excess of loss reinsurance reduces the financial impact of a loss occurrence. Our excess of loss reinsurance includes reinstatement provisions, inuring relationships, and other clauses that may impact the amount recovered on a loss occurrence. |
At each annual renewal, we consider any plans to change the underlying insurance coverage we offer, as well as updated loss activity, the level of our capital and surplus, changes in our risk appetite and the cost and availability of reinsurance treaties.
For the years ended December 31, 2019, 2018 and 2017, property insurance represented 13.0%, 12.2% and 10.8%, respectively,77
We purchased adverse development reinsurance contracts (together, the “ADC”) in 2018, 2017 and 2016 that limit the amount of future development on primary and excess workers’ compensation reserves reported for accident years 2017 and prior. The expected cost of the ADC contract is fully expensed at the inception of the contract. As of December 31, 2018, there have been no losses ceded to the ADC.
Reinsurance contracts do not relieve us from our obligations to policyholders. Failure of the reinsurer to honor its obligations could result in losses to us, and therefore, we establish allowances for amounts considered uncollectible. AtThe allowance related to credit default with respect to our reinsurance assets as of December 30, 2020 and December 31, 2019, 2018 and 2017, the allowance for uncollectible reinsurance was $10.9 million, $10.0$0.7 million and $7.0$0.5 million respectively. AsIn formulating our reinsurance programs, we are selective in our choice of December 31, 2019, 84.8%reinsurers and we consider numerous factors, the most important of which are the financial stability of the reinsurer, its history of responding to claims and its overall reputation. In an effort to minimize our exposure to the insolvency of our reinsurance recoverables were with reinsurers, with A.M. Bestwe review the financial strength ratingscondition of “A-” (Excellent) or better. The remaining 15.2%, or $29.5 million,each reinsurer annually. In addition, we continually monitor for rating downgrades involving any of our reinsurance recoverables were with non-rated reinsurers, including $26.7 million from a fronting reinsurance arrangement with an authorized self-insurer from our Excess Workers’ Compensation niche, the Alabama Truckers Association, and fully collateralized through funds held and letters of credit. At December 31, 2019, 2018 and 2017, the net reinsurance receivable (defined as the sum of paid and unpaid reinsurance recoverables and ceded unearned premiums, less reinsurance payables) from our top three reinsurers represented 46.5%, 46.7% and 55.7%, respectively, of the total balance.reinsurers.
Ratings
ProSight and its insurance subsidiaries have a financial strength rating of “A-” (Excellent) from A.M. Best. A.M. Best assigns 16 ratings to insurance companies, which currently range from “A++” (Superior) to “F” (In Liquidation). The “A-” (Excellent) rating is assigned to insurers that have, in A.M. Best’s opinion, an excellent ability to meet their ongoing obligations to policyholders. This rating is intended to provide an independent opinion of an insurer’s ability to meet its obligation to policyholders and is not an evaluation directed at investors. See also Item 1A. “Risk
75
Factors — Factors—Risks Related to Our Business” on this Annual Report on Form 10-K. Business—A declinedowngrade in our financial strength rating may adverselyFinancial Strength Ratings (“FSRs”) from A.M. Best could negatively affect the amountour results of business we write.operations.”
The financial strength ratings assigned by A.M. Best have an impact on the ability of the insurance subsidiaries to attract and retain our distribution partners and on the risk profiles of the submissions for insurance that the insurance subsidiaries receive. The “A-” (Excellent) rating affirmed by A.M. Best on November 22, 2019,December 17, 2020 is consistent with our business plan and allows us to actively pursue relationships with the distribution partners identified in our marketing plan.
Contractual Obligations and Commitments
The following table illustrates our contractual obligations and commercial commitments by due date as of December 31, 2019:2020:
|
|
|
|
|
|
|
|
|
|
|
|
|
|
|
| |||||||||||||||
|
| Expected Payments | ||||||||||||||||||||||||||||
|
|
|
| One Year to |
| Three Years to |
|
|
|
| ||||||||||||||||||||
|
| Less Than |
| Less Than |
| Less Than |
| More Than |
|
|
| |||||||||||||||||||
| | | | | | | | | | | | | | | | |||||||||||||||
| | Expected Payments | ||||||||||||||||||||||||||||
|
| |
| One Year to |
| Three Years to |
| |
| | ||||||||||||||||||||
| | Less Than | | Less Than | | Less Than | | More Than | | | | |||||||||||||||||||
| | One Year | | Three Years | | Five Years | | Five Years | | Total | ||||||||||||||||||||
|
| One Year |
| Three Years |
| Five Years |
| Five Years |
| Total | ||||||||||||||||||||
($ in thousands) |
|
| | | ||||||||||||||||||||||||||
Gross reserves for losses and LAE |
| $ | 350,137 |
| $ | 465,961 |
| $ | 257,941 |
| $ | 447,609 |
| $ | 1,521,648 | | $ | 383,870 | | $ | 502,524 | | $ | 273,535 | | $ | 442,973 | | $ | 1,602,902 |
Senior debt and credit agreements(1) |
|
| 165,000 |
|
| — |
|
| — |
|
| — |
|
| 165,000 | | | — | | | 207,000 | |
| — | |
| — | | | 207,000 |
Interest on senior debt and credit agreements(2) |
|
| 11,462 |
|
| 211 |
|
| — |
|
| — |
|
| 11,673 | | | 7,852 | | | 11,725 | | | — | | | — | | | 19,577 |
Secured loan payable(3) | | | 4,241 | | | 9,934 | | | 8,575 | | | — | | | 22,750 | |||||||||||||||
Interest on secured loan payable(4) | | | 926 | | | 1,341 | | | 351 | | | — | | | 2,618 | |||||||||||||||
Operating lease obligations |
|
| 4,243 |
|
| 5,242 |
|
| 1,170 |
|
| 342 |
|
| 10,997 | | | 3,527 | | | 1,427 | | | 808 | | | — | | | 5,762 |
Total |
| $ | 530,842 |
| $ | 471,414 |
| $ | 259,111 |
| $ | 447,951 |
| $ | 1,709,318 | | $ | 400,416 | | $ | 733,951 | | $ | 283,269 | | $ | 442,973 | | $ | 1,860,609 |
| (1) |
| Amounts represent the principal balance and are not necessarily the carrying value of the Company’s debt on the balance sheet, which includes unamortized debt issuance costs. |
| (2) |
| Amounts represent anticipated cash interest payments and commitment fees related to the Company’s senior debt and credit agreements. |
| (3) | Amounts represent the principal balance and are not necessarily the carrying value of the Company’s debt on the balance sheet, which includes unamortized issuance costs. |
| (4) | Amounts represent anticipated cash interest payments related to the Company’s secured loan payable. |
Reserves for losses and LAE represent our best estimate of the ultimate cost of settling reported and unreported claims and related expenses. Estimating reserves for losses and LAE is based on various complex and subjective judgments. Actual losses and settlement expenses paid may deviate, perhaps substantially, from the reserve estimates reflected in our financial statements. Similarly, the timing for payment of our estimated losses is not fixed and is not
78
determinable on an individual or aggregate basis. The assumptions used in estimating the payments due by period are based on industry and peer group claims payment experience. Due to the uncertainty inherent in the process of estimating the timing of such payments, there is a risk that the amounts paid in any period will be significantly different than the amounts disclosed above. Amounts disclosed above are gross of anticipated amounts recoverable from reinsurers. Reinsurance balances recoverable on reserves for losses and LAE are reported separately as assets, instead of being netted with the related liabilities, since reinsurance does not discharge us of our liability to policyholders. Reinsurance balances recoverable on reserves for paid and unpaid losses and LAE totaled $181.0 million, $197.4 million $197.7 million and $218.4$197.7 million at December 31, 2020, 2019 2018 and 2017,2018, respectively. These recoverable balances include $33.1$0.0 million and $43.7$33.1 million related to the WAQS at December 31, 2020 and 2019, and 2018, respectively.
Financial Condition
Stockholders’ equity
At December 31, 2019,2020, total stockholders’ equity was $543.0$624.0 million and tangible stockholders’ equity was $513.8$606.7 million compared to total stockholders’ equity of $389.8$543.0 million and tangible stockholders’ equity of $360.6$513.8 million at December 31, 2018.2019. The increase in both total and tangible stockholders’ equity was primarily due to net income of $38.9$22.2 million and net increase in accumulated other comprehensive income of $59.8 million, and proceeds from common stock sold in the initial public offering of $50.8$51.7 million for the year ended December 31, 2019.
76
At December 31, 2018, total stockholders’ equity was $389.8 million and tangible stockholders’ equity was $360.6 million compared to total stockholders’ equity of $376.0 million and tangible stockholders’ equity of $346.7 million at December 31, 2017. The increase in both total and tangible stockholders’ equity was primarily due to net income of $54.5 million and partially offset by the increase in unrealized losses of $42.7 million related to available-for-sale securities, net of taxes for the year ended December 31, 2018.2020.
Tangible stockholders’ equity is a non-GAAP financial measure. We define tangible stockholders’ equity as stockholders’ equity less goodwill and net intangible assets. Our definition of tangible stockholders’ equity may not be comparable to that of other companies, and it should not be viewed as a substitute for stockholders’ equity calculated in accordance with GAAP. We use tangible stockholders’ equity internally to evaluate the strength of our balance sheet and to compare returns relative to this measure.
Stockholders’ equity at December 31, 2020, 2019 2018 and 2017,2018, reconciles to tangible stockholders’ equity as follows:
|
|
|
|
|
|
|
|
|
| |||||||||
|
| December 31 | ||||||||||||||||
| | | | | | | | | | |||||||||
|
| December 31 | ||||||||||||||||
| | 2020 |
| 2019 |
| 2018 | ||||||||||||
|
| 2019 |
| 2018 |
| 2017 | ||||||||||||
($ in thousands) |
|
| | | ||||||||||||||
Stockholders’ equity |
| $ | 543,031 |
| $ | 389,830 |
| $ | 375,983 |
| $ | 623,968 | | $ | 543,031 | | $ | 389,830 |
Less: intangible assets |
|
| 29,189 |
|
| 29,219 |
|
| 29,249 | |||||||||
Less: goodwill and net intangible assets |
|
| 17,248 | |
| 29,189 | |
| 29,219 | |||||||||
Tangible stockholders’ equity |
| $ | 513,842 |
| $ | 360,611 |
| $ | 346,734 |
| $ | 606,720 | | $ | 513,842 | | $ | 360,611 |
Book value per share |
| $ | 12.61 |
| $ | 10.03 |
| $ | 9.71 | | $ | 14.37 | | $ | 12.61 | | $ | 10.03 |
Tangible book value per share |
| $ | 11.93 |
| $ | 9.28 |
| $ | 8.95 |
| $ | 13.97 | | $ | 11.93 | | $ | 9.28 |
Equity-based compensation
2019 Equity Incentive Plan
In connection with, and prior to the completion of the IPO, the Company’s Amended and Restated 2010 Equity Incentive Plan (the “2010 Plan”) was terminated. Immediately prior toterminated, and the merger, P Shares granted underCompany adopted a new plan, the 2010 Plan prior to the IPO, were cancelled, and all outstanding RSUs granted under the 2010 Plan were converted into RSUs based on the shares of common stock of the Company.
On July 24, 2019, the Company’s 2019 Equity Incentive Plan (the “2019 Plan”)
On July 24, 2019, the 2019 Plan became effective immediately prior to the effectiveness of the registration statement filed in connection with the IPO. The 2019 Plan provides for the grant of stock options, stock appreciation rights, restricted stock,share awards (“RSAs”), RSUs, dividend equivalent rights, performance-based shares, andperformance-vesting share awards (“PSAs”) or other cash‑basedequity-based or share‑basedequity-related awards.
The 2019 Plan is administered by the compensation committee of the Company’s Board of Directors. Subject to the provisions of the 2019 Plan, the compensation committee determines in its discretion, the persons to whom and the
79
times at which awards are granted, the size of awards (subject to certain limitations set forth in the compensation committee charter) and the terms and conditions of awards.
A total of 4,500,000 shares of common stock are initially authorized and reserved for issuance under the 2019 Plan, including shares underlying RSUs granted under the 2010 Plan.
The following is a summary of the post-offeringequity-based compensation included in the 2019 Plan, including the number of common stock shares granted to each award mentioned below:award:
(i) | Annual long-term equity incentive plan awards (“Annual LTIP Awards”): Annual LTIP Awards in 2019 included time-vesting RSUs and performance-vesting RSUs (“PSUs). Annual LTIP Awards in 2020 included RSUs, PSUs, RSAs, and PSAs. |
RSUs vest annually over three years subject to continued employment through each such date. 142,739 and 90,559 time-vesting RSUs were granted in 2020 and 2019 and the fair value of the awards on grant date was $1.8 million and $1.3 million, respectively.
RSAs vest annually over three years subject to continued employment through each such date. 110,466 time-vesting RSAs were granted in 2020 and the fair value of the awards on grant date was $1.5 million.
PSUs vest based on the average book value per share growth over a three-year performance period and cliff vest on the third anniversary of the grant date to the extent performance metrics are met, subject to continued service. 123,016 and 90,559 PSUs were granted in 2020 and 2019 and the fair value of the awards on grant date was $1.6 million and $1.3 million, respectively.
PSAs vest based on the average book value per share growth over a three-year performance period and cliff vest on the third anniversary of the grant date to the extent performance metrics are met, subject to continued service. 110,466 PSAs were granted in 2020 and the fair value of the awards on grant date was $1.5 million.
| Supplemental RSUs: 1,267,912 supplemental RSU awards, |
77
|
|
(iii) | Founders grant awards:250,000 founders grant awards in the form of time-vesting RSUs |
(iv) | Non-employee Director RSUs: In 2020, 106,460 RSUs with a fair value of $0.9 million were granted to non-employee directors. In 2019, 33,839 |
(v) | Pre-IPO RSUs:668,170 RSUs initially granted under the 2010 Plan |
Stock-based compensation expense was $8.9 million, $8.6 million $0.9 million and $1.5$0.9 million for the years ended December 31, 2020, 2019 and 2018, and 2017, respectively.The tax benefit recognized for the same was $1.9 million, $1.8 million $0.2 million and $0.5$0.2 million for the years ended December 31, 2020, 2019 and 2018, and 2017, respectively.
Vested RSUs awaiting conversion into common stock were 489,439 for the year ended December 31, 2020, 906,182 for the year ended December 31, 2019 and 548,292 for the year ended December 31, 2018 and 517,446 for the year ended December 31, 2017, respectively.2018.
The Company began recognizing stock-based compensation expense relating to its 2019 Plan upon its inception and initial stock grants in July 2019. All stock-based compensation expense recognized during the year ended December 31, 2019 relates to the 2019 Plan except $0.1 million
80
The following table summarizes RSUequity award transactions for the 2019 Plan for the years ended December 31, 20192020 and 2018:2019:
|
|
|
|
|
| |||||
|
|
|
|
| ||||||
|
|
|
| Weighted | ||||||
|
|
|
| Average Grant | ||||||
|
| Number of |
| Date Fair Value | ||||||
|
| Shares |
| Per Share | ||||||
Unvested at December 31, 2017 |
| 180,647 |
| $ | 11.25 | |||||
Granted in 2018 |
| 13,992 |
|
| 18.67 | |||||
Vested in 2018 |
| (136,855) |
|
| 11.30 | |||||
Forfeited in 2018 |
| (2,520) |
|
| 11.09 | |||||
| | | | | | |||||
|
| |
| | ||||||
|
| |
| Weighted | ||||||
| | | | Average Grant | ||||||
| | Number of | | Date Fair Value | ||||||
| | Shares | | Per Share | ||||||
Unvested at December 31, 2018 |
| 55,264 |
|
| 11.09 |
| 55,264 | | $ | 11.09 |
Granted in 2019 |
| 1,732,869 |
|
| 14.00 |
| 1,732,869 | |
| 14.00 |
Vested in 2019 |
| (406,081) |
|
| 13.61 |
| (406,081) | |
| 13.61 |
Forfeited in 2019 |
| (92,656) |
|
| 14.00 |
| (92,656) | |
| 14.00 |
Unvested at December 31, 2019 |
| 1,289,396 |
| $ | 14.00 |
| 1,289,396 | |
| 14.00 |
Granted in 2020 |
| 593,147 | |
| 12.30 | |||||
Vested in 2020 |
| (134,001) | |
| 9.96 | |||||
Forfeited in 2020 |
| (43,101) | |
| 13.58 | |||||
Unvested at December 31, 2020 |
| 1,705,441 | | $ | 13.46 | |||||
As of December 31, 2019,2020, The Company had approximately $14.5$11.8 million of total unrecognized stock-based compensation expense related to the RSUsequity awards expected to be recognized over a weighted-average period of 2.41.6 years.
2019 Employee Stock Purchase Plan
On July 24, 2019, the 2019 Employee Stock Purchase Plan (the “2019 ESPP”) became effective immediately prior to the effectiveness of the registration statement filed in connection with the IPO. A total of 1,000,000 shares of the Company’s common stock are reserved and available for sale under the 2019 ESPP.
The compensation committee of the Board of Directors administers the 2019 ESPP and havehas full authority to interpret the terms of the 2019 ESPP.
78
There was no expense recognized related to the The 2019 ESPP foris a shareholder-approved plan under which substantially all employees may purchase the year ended December 31, 2019.Company’s common stock through payroll deductions at a price equal to 90% of the fair market value of the stock on the purchase date at the end of the offering period. An employee’s payroll deductions under the Purchase Plan are limited to 15% of the employee’s compensation and employees may not purchase more than $25,000 of stock during any calendar year.
Dividend declarations
We did not declare any dividends in the years ended December 31, 2020, 2019 2018 and 2017.2018.
Investment portfolio
Our cash and invested assets consist of debt securities, cash and cash equivalents, short-term investments and alternative investments.
At December 31, 2019,2020, the majority of the portfolio, or $2.0$2.2 billion, was comprised of securities that are classified as available-for-sale and carried at fair value with unrealized gains and losses on these securities, net of applicable taxes, reported as a separate component of accumulated other comprehensive income. Also included in our investments were $216.2$348.3 million of alternative investments carried at fair value. Our securities, including cash equivalents, had a weighted average duration of 3.44.8 years and an average rating of “A” at December 31, 2019. 2020.
81
At December 31, 20192020 and 2018,2019, the amortized cost and fair value on fixed-maturity securities were as follows:
|
|
|
|
|
|
|
|
|
|
|
|
|
|
|
|
|
| |||||||||||||||||
|
| December 31, 2019 |
| December 31, 2018 |
| |||||||||||||||||||||||||||||
|
|
|
| Estimated |
| % of Total |
|
|
| Estimated |
| % of Total |
| |||||||||||||||||||||
| | | | | | | | | | | | | | | | | | |||||||||||||||||
| | December 31, 2020 | | December 31, 2019 |
| |||||||||||||||||||||||||||||
| | | | Estimated | | % of Total | | | | Estimated | | % of Total |
| |||||||||||||||||||||
|
| Amortized Cost |
| Fair Value |
| Fair Value |
| Amortized Cost |
| Fair Value |
| Fair Value |
| |||||||||||||||||||||
|
| Amortized Cost |
| Fair Value |
| Fair Value |
| Amortized Cost |
| Fair Value |
| Fair Value |
| |||||||||||||||||||||
($ in thousands) |
|
|
|
|
| | | | |
| ||||||||||||||||||||||||
Fixed rate securities |
| $ | 1,137,121 |
| $ | 1,166,800 |
| 53.2 | % | $ | 1,045,990 |
| $ | 1,010,781 |
| 55.2 | % | |||||||||||||||||
Floating rate securities |
|
| 711,843 |
|
| 724,348 |
| 33.1 |
|
| 554,626 |
|
| 556,104 |
| 30.4 |
| |||||||||||||||||
Fixed and floating rate securities |
| $ | 1,905,891 |
| $ | 2,008,210 |
| 82.3 | % | $ | 1,848,964 |
| $ | 1,891,148 |
| 86.3 | % | |||||||||||||||||
Alternatives available-for-sale |
|
| 150,439 |
|
| 149,534 |
| 6.8 |
|
| 129,139 |
|
| 126,497 |
| 6.9 |
|
|
| 253,852 |
|
| 257,847 |
| 10.6 | |
| 150,439 |
|
| 149,534 |
| 6.8 | |
Total bonds |
|
| 1,999,403 |
|
| 2,040,682 |
| 93.1 | % |
| 1,729,755 |
|
| 1,693,382 |
| 92.5 | % | |||||||||||||||||
Total fixed maturity securities |
|
| 2,159,743 |
|
| 2,266,057 |
| 92.9 | |
| 1,999,403 |
|
| 2,040,682 |
| 93.1 | | |||||||||||||||||
Other investments: |
|
|
|
|
|
|
|
|
|
|
|
|
|
|
|
|
|
|
| | | | | | | |
| |
|
| |
|
| |
Commercial levered loans |
|
| 14,069 |
|
| 13,950 |
| 0.6 | % |
| 16,915 |
|
| 15,858 |
| 1.0 | % |
|
| 12,308 |
|
| 12,180 |
| 0.5 | |
| 14,069 |
|
| 13,950 |
| 0.6 | |
Limited partnerships |
|
| 66,660 |
|
| 66,660 |
| 3.0 |
|
| 53,432 |
|
| 53,432 |
| 2.9 |
| |||||||||||||||||
Bond exchange-traded funds | | | 44,679 | | | 44,882 | | 1.8 | | | — | | | — | | — | | |||||||||||||||||
Non-redeemable preferred stock securities | | | 6,541 | | | 7,049 | | 0.3 | | | — | | | — | | — | | |||||||||||||||||
Limited partnerships and limited liability companies |
|
| 90,468 |
|
| 90,468 |
| 3.7 | |
| 66,660 |
|
| 66,660 |
| 3.0 | | |||||||||||||||||
Short-term investments |
|
| 43,873 |
|
| 43,873 |
| 2.0 |
|
| 36,661 |
|
| 36,661 |
| 2.0 |
|
|
| 154 |
|
| 154 |
| 0.0 | |
| 43,873 |
|
| 43,873 |
| 2.0 | |
Cash and cash equivalents |
|
| 27,497 |
|
| 27,497 |
| 1.3 |
|
| 29,900 |
|
| 29,900 |
| 1.6 |
| |||||||||||||||||
Total other investments |
|
| 152,099 |
|
| 151,980 |
| 6.9 | % |
| 136,908 |
|
| 135,851 |
| 7.5 | % |
|
| 154,150 |
|
| 154,733 |
| 6.3 | |
| 124,602 |
|
| 124,483 |
| 5.6 | |
Total investments |
| $ | 2,151,502 |
| $ | 2,192,662 |
| 100.0 | % | $ | 1,866,663 |
| $ | 1,829,233 |
| 100.0 | % |
| | 2,313,893 |
| | 2,420,790 |
| 99.2 | | | 2,124,005 |
| | 2,165,165 |
| 98.7 | |
Cash, cash equivalents, and restricted cash | | | 19,603 | | | 19,603 | | 0.8 | | | 27,497 | | | 27,497 | | 1.3 | | |||||||||||||||||
Total | | $ | 2,333,496 | | $ | 2,440,393 | | 100.0 | % | $ | 2,151,502 | | $ | 2,192,662 | | 100.0 | % | |||||||||||||||||
The table below presents the credit quality of total bondsfixed maturity securities at December 31, 20192020 and 2018,2019, as rated by Standard & Poor’s Financial Services, LLC (“Standard & Poor’s”) or Equivalent Designation:
| | | | | | | | | | | |
| | December 31, 2020 | | December 31, 2019 |
| ||||||
| | Estimated | | % of Total | | Estimated | | % of Total | | ||
Standard & Poor’s or Equivalent Designation |
| Fair Value |
| Fair Value |
| Fair Value |
| Fair Value |
| ||
($ in thousands) | | | | |
| ||||||
AAA |
| $ | 192,038 |
| 8.5 | % | $ | 219,696 |
| 10.8 | % |
AA |
|
| 543,875 |
| 24.0 | |
| 356,924 |
| 17.5 | |
A |
|
| 679,409 |
| 30.0 | |
| 719,394 |
| 35.3 | |
BBB |
|
| 662,816 |
| 29.2 | |
| 563,680 |
| 27.6 | |
Below BBB/Not rated |
|
| 187,919 |
| 8.3 | |
| 180,988 |
| 8.9 | |
Total |
| $ | 2,266,057 |
| 100.0 | % | $ | 2,040,682 |
| 100.0 | % |
|
|
|
|
|
|
|
|
|
|
|
|
|
| December 31, 2019 |
| December 31, 2018 |
| ||||||
|
| Estimated |
| % of Total |
| Estimated |
| % of Total |
| ||
Standard & Poor’s or Equivalent Designation |
| Fair Value |
| Fair Value |
| Fair Value |
| Fair Value |
| ||
($ in thousands) |
|
|
|
|
| ||||||
AAA |
| $ | 219,696 |
| 10.8 | % | $ | 172,575 |
| 10.2 | % |
AA |
|
| 356,924 |
| 17.5 |
|
| 295,704 |
| 17.4 |
|
A |
|
| 719,394 |
| 35.2 |
|
| 570,846 |
| 33.7 |
|
BBB |
|
| 563,680 |
| 27.6 |
|
| 493,900 |
| 29.2 |
|
Below BBB/Not rated |
|
| 180,988 |
| 8.9 |
|
| 160,357 |
| 9.5 |
|
Total |
| $ | 2,040,682 |
| 100.0 | % | $ | 1,693,382 |
| 100.0 | % |
The table below presents the credit quality of total fixed maturity securities at December 31, 2020 and 2019, either rated below BBB or not rated by Standard & Poor’s and their National Association of Insurance Commissioners (“NAIC”) designation:
| | | | | | | | | | | | | | | | | | | | | |
| | | December 31, 2020 | ||||||||||||||||||
| | | NAIC Designation (Estimated Fair Value) | ||||||||||||||||||
Standard & Poor’s or Equivalent Designation | | | 1 | | | 2 | | | 3 | | | 4 | | | 5 | | | 6 | | | Total |
($ in thousands) | | | | | | | | | | | | | | | | | | | | | |
BB | | $ | 4,402 | | $ | 31,031 | | $ | 52,667 | | $ | 874 | | $ | 482 | | $ | - | | $ | 89,456 |
B | | | 5,081 | | | 510 | | | 3,779 | | | 6,574 | | | - | | | - | | | 15,944 |
CCC | | | 32,089 | | | - | | | 681 | | | 237 | | | 2,408 | | | - | | | 35,416 |
CC or lower | | | 24,138 | | | - | | | - | | | 187 | | | - | | | 22,779 | | | 47,103 |
Total | | $ | 65,710 | | $ | 31,541 | | $ | 57,127 | | $ | 7,872 | | $ | 2,890 | | $ | 22,779 | | $ | 187,919 |
7982
| | | | | | | | | | | | | | | | | | | | | |
| | | December 31, 2019 | ||||||||||||||||||
| | | NAIC Designation (Estimated Fair Value) | ||||||||||||||||||
Standard & Poor’s or Equivalent Designation | | | 1 | | | 2 | | | 3 | | | 4 | | | 5 | | | 6 | | | Total |
($ in thousands) | | | | | | | | | | | | | | | | | | | | | |
BB | | $ | 11,533 | | $ | - | | $ | 60,917 | | $ | 2,516 | | $ | - | | $ | - | | $ | 74,966 |
B | | | 698 | | | - | | | 111 | | | 12,691 | | | - | | | - | | | 13,500 |
CCC | | | 33,893 | | | - | | | - | | | - | | | - | | | - | | | 33,893 |
CC or lower | | | 35,590 | | | 32 | | | - | | | - | | | - | | | 23,007 | | | 58,629 |
Total | | $ | 81,714 | | $ | 32 | | $ | 61,028 | | $ | 15,207 | | $ | - | | $ | 23,007 | | $ | 180,988 |
The amortized cost and fair value of our available-for-sale investments in fixed maturity securities presented by contractual maturity as of December 31, 20192020 and 2018,2019, were as follows:
|
|
|
|
|
|
|
|
|
|
|
|
|
|
|
|
|
| |||||||||||||||||
|
| December 31, 2019 |
| December 31, 2018 |
| |||||||||||||||||||||||||||||
|
| Amortized |
| Estimated |
| % of Total |
| Amortized |
| Estimated |
| % of Total |
| |||||||||||||||||||||
| | | | | | | | | | | | | | | | | | |||||||||||||||||
| | December 31, 2020 | | December 31, 2019 |
| |||||||||||||||||||||||||||||
|
| Amortized |
| Estimated |
| % of Total |
| Amortized |
| Estimated |
| % of Total |
| |||||||||||||||||||||
| | Cost | | Fair Value | | Fair Value | | Cost | | Fair Value | | Fair Value |
| |||||||||||||||||||||
|
| Cost |
| Fair Value |
| Fair Value |
| Cost |
| Fair Value |
| Fair Value |
| |||||||||||||||||||||
($ in thousands) |
|
|
|
|
| | | | | | ||||||||||||||||||||||||
Due in one year or less |
| $ | 99,035 |
| $ | 99,326 |
| 4.9 | % | $ | 82,048 |
| $ | 81,553 |
| 4.8 | % |
| $ | 103,243 |
| $ | 104,316 |
| 4.6 | % | $ | 99,035 | | $ | 99,326 |
| 4.9 | % |
Due after one year through five years |
|
| 679,649 |
|
| 692,219 |
| 33.9 |
|
| 613,707 |
|
| 602,223 |
| 35.6 |
|
|
| 628,897 |
|
| 657,996 |
| 29.1 | |
| 679,649 | |
| 692,219 |
| 33.9 | |
Due after five years through ten years |
|
| 507,803 |
|
| 523,276 |
| 25.6 |
|
| 552,061 |
|
| 529,257 |
| 31.2 |
|
|
| 522,749 |
|
| 561,775 |
| 24.8 | |
| 507,803 | |
| 523,276 |
| 25.6 | |
Due after ten years |
|
| 157,628 |
|
| 160,322 |
| 7.9 |
|
| 81,993 |
|
| 75,810 |
| 4.5 |
|
|
| 311,799 |
|
| 332,195 |
| 14.7 | |
| 157,628 | |
| 160,322 |
| 7.9 | |
Government agency securities | | | 30,446 | | | 31,007 | | 1.4 | | | — | | | — | | — | | |||||||||||||||||
Asset-backed securities |
|
| 73,068 |
|
| 73,582 |
| 3.6 |
|
| 82,603 |
|
| 83,581 |
| 4.9 |
|
|
| 54,989 |
|
| 55,258 |
| 2.4 | |
| 73,068 | |
| 73,582 |
| 3.6 | |
Collateralized loan obligations |
|
| 181,704 |
|
| 179,549 |
| 8.8 |
|
| 161,421 |
|
| 156,913 |
| 9.3 |
|
|
| 140,615 |
|
| 139,126 |
| 6.1 | |
| 181,704 | |
| 179,549 |
| 8.8 | |
Commercial mortgage backed securities |
|
| 95,810 |
|
| 97,526 |
| 4.8 |
|
| 55,980 |
|
| 53,843 |
| 3.2 |
|
|
| 111,313 |
|
| 117,960 |
| 5.2 | |
| 95,810 | |
| 97,526 |
| 4.8 | |
Residential mortgage backed securities– non-agency |
|
| 62,343 |
|
| 71,610 |
| 3.5 |
|
| 68,594 |
|
| 79,551 |
| 4.7 |
|
|
| 109,110 |
|
| 116,136 |
| 5.1 | |
| 62,343 | |
| 71,610 |
| 3.5 | |
Residential mortgage backed securities – agency |
|
| 142,363 |
|
| 143,272 |
| 7.0 |
|
| 31,348 |
|
| 30,651 |
| 1.8 |
|
|
| 146,582 |
|
| 150,288 |
| 6.6 | |
| 142,363 | |
| 143,272 |
| 7.0 | |
Total fixed maturities |
| $ | 1,999,403 |
| $ | 2,040,682 |
| 100.0 | % | $ | 1,729,755 |
| $ | 1,693,382 |
| 100.0 | % | |||||||||||||||||
Total fixed maturity securities |
| $ | 2,159,743 |
| $ | 2,266,057 |
| 100.0 | % | $ | 1,999,403 | | $ | 2,040,682 |
| 100.0 | % | |||||||||||||||||
Expected maturities may differ from contractual maturities because borrowers may have the right to call or prepay obligations with or without call or prepayment penalties, and the lenders may have the right to put the securities back to the borrower.
Restricted investments
In order to conduct business in certain states, we are required to maintain letters of credit or assets on deposit to support state-mandated insurance regulatory requirements and to comply with certain third-party agreements. Assets held on deposit or in trust accounts are primarily in the form of cash or certain high-grade securities.
The fair value of our restricted assets was $577.9$489.8 million at December 31, 2019.2020. This includes $127.2$76.9 million of funds in trust for the mutual benefit of our insurance companies due to participation in our intercompany policypooling agreement. Restricted investments increased 5.6%decreased 15.2%, or $30.8$88.1 million, when compared to December 31, 20182019 primarily due to the closure of three collateral trust accounts in the third and fourth quarter, offset by an increase in reinsurance collateral and state deposits, and market appreciation from fixed income securities.maturity securities during the year.
83
Off-balance sheet arrangements
We do not have any material off-balance sheet arrangements as of December 31, 2019.2020.
As part of the 2017 sale transaction to divest our U.K. business, we entered into Aggregate Stop-Loss and 100% Quota Share reinsurance agreements as reinsurer, with Lloyd’s Syndicate 1110 as our reinsured and committed to fund Lloyd’s Syndicate 1110’s “Funds atAt Lloyd’s” requirements until June 30, 2020, though such Funds at Lloyd’s obligations would effectively terminate when the 2017 Year of Account completes a “Reinsurance to Close” transaction, which is expected by March 2020. We entered into a Letter of Credit facility arranged to fulfill a portion of these requirements. The facility has a principal amount of $23.2£17.7 million and contains certain covenants that require us, among other items, to maintain a minimum net worth, to remain within maximum leverage ratios, meet a minimum risk-based capitalRBC ratio and maintain specified liquidity levels. The requirement for us to provide the Funds At Lloyd’s were expected to terminate by June 30, 2020. However, the buyer disputed its contractual obligation with respect to substituting our Funds At Lloyd’s at that time. In February 2021, a U.K. court granted summary judgment in our favor requiring the buyer to substitute our Funds At Lloyds; however, such judgment is subject to appeal by the buyer.
80
Reconciliation of Non-GAAP Financial Measures
Reconciliation of underwriting income
Underwriting (loss) income is a non-GAAP financial measure that we believe is useful in evaluating our underwriting performance without regard to investment income. Underwriting (loss) income represents the pre-tax profitability of our insurance operations and is derived by subtracting losses and LAE and underwriting, acquisition and insurance expenses from net earned premiums. We use underwriting (loss) income as an internal performance measure in the management of our operations because we believe it gives us and users of our financial information useful insight into our results of operations and our underlying business performance. Underwriting (loss) income should not be considered in isolation or viewed as a substitute for net income calculated in accordance with GAAP, and other companies may calculate underwriting (loss) income differently.
Net income from continuing operations for the years ended December 31, 2020, 2019 2018 and 2017,2018, reconciles to underwriting (loss) income as follows:
|
|
|
|
|
|
|
|
|
| |||||||||
|
| Years Ended December 31 | ||||||||||||||||
| | | | | | | | | | |||||||||
|
| Years Ended December 31 | ||||||||||||||||
($ in thousands) |
| 2019 |
| 2018 |
| 2017 |
| 2020 |
| 2019 | | 2018 | ||||||
Net income (loss) from continuing operations |
| $ | 45,494 |
| $ | 53,729 |
| $ | (6,904) | |||||||||
Net income from continuing operations | | $ | 27,750 | | $ | 45,494 | | $ | 53,729 | |||||||||
Income tax expense |
|
| 12,137 |
|
| 13,389 |
|
| 38,233 |
| | 10,740 |
| | 12,137 | | | 13,389 |
Income from continuing operations before taxes |
|
| 57,631 |
|
| 67,118 |
|
| 31,329 |
| | 38,490 |
|
| 57,631 | |
| 67,118 |
Net investment income |
|
| (68,897) |
|
| (55,971) |
|
| (36,196) |
|
| 73,021 |
|
| 68,897 | |
| 55,971 |
Realized investment gains (losses), net |
|
| 770 |
|
| (1,557) |
|
| 4,204 |
|
| 4,980 |
|
| 770 | |
| (1,557) |
Interest and other expense, net |
|
| 28,408 |
|
| 11,704 |
|
| 11,272 |
|
| 31,751 |
|
| 28,408 | |
| 11,704 |
Underwriting income |
| $ | 16,372 |
| $ | 24,409 |
| $ | 2,201 | |||||||||
Underwriting (loss) income |
| $ | (7,760) |
| $ | 16,372 | | $ | 24,409 | |||||||||
Reconciliation of adjusted operating income
Adjusted operating income is a non-GAAP financial measure that we use as an internal performance measure in the management of our operations because we believe it gives our management and other users of our financial information useful insight into our results of operations and underlying business performance, by excluding items that are not part of our underlying profitability drivers or likely to re-occur in the foreseeable future. Adjusted operating income should not be considered in isolation or viewed as a substitute for our net income calculated in accordance with GAAP. Other companies may calculate adjusted operating income differently.
Adjusted operating84
Net income from continuing operations for the years ended December 31, 2020, 2019 2018 and 2017,2018, reconciles to netadjusted operating income from continuing operations as follows:
|
|
|
|
|
|
|
|
|
| |||||||||
|
| Years Ended December 31 | ||||||||||||||||
| | | | | | | | | | |||||||||
| | Years Ended December 31 | ||||||||||||||||
($ in thousands) |
| 2019 |
| 2018 |
| 2017 |
| 2020 |
| 2019 |
| 2018 | ||||||
Net income (loss) from continuing operations |
| $ | 45,494 |
| $ | 53,729 |
| $ | (6,904) | |||||||||
Net income from continuing operations | | $ | 27,750 | | $ | 45,494 | | $ | 53,729 | |||||||||
Income tax expense |
|
| 12,137 |
|
| 13,389 |
|
| 38,233 | | | 10,740 | | | 12,137 | | | 13,389 |
Income from continuing operations before taxes |
|
| 57,631 |
|
| 67,118 |
|
| 31,329 | |
| 38,490 | |
| 57,631 | | | 67,118 |
Other expense |
|
| 16,151 |
|
| — |
|
| — | | | 17,739 | | | 16,151 | | | — |
Realized investment (gains) losses, net |
|
| (770) |
|
| 1,557 |
|
| (4,204) | |
| (4,980) | |
| (770) | | | 1,557 |
Adjusted operating income before taxes |
|
| 73,012 |
|
| 68,675 |
|
| 27,125 | |
| 51,249 |
|
| 73,012 |
| | 68,675 |
Less: income tax expense on adjusted operating income |
|
| 15,376 |
|
| 13,389 |
|
| 13,133 | | | 10,921 | | | 15,376 | | | 13,389 |
Adjusted operating income |
| $ | 57,636 |
| $ | 55,286 |
| $ | 13,992 |
| $ | 40,328 |
| $ | 57,636 | | $ | 55,286 |
Critical Accounting Estimates
We identified the accounting estimates which are critical to the understanding of our financial position and results of operations. Critical accounting estimates are defined as those estimates that are both important to the portrayal of our financial condition and results of operations and require us to exercise significant judgment. We use significant
81
judgment concerning future results and developments in applying these critical accounting estimates and in preparing our consolidated financial statements. These judgments and estimates affect our reported amounts of assets, liabilities, revenues and expenses and the disclosure of our material contingent assets and liabilities. Actual results may differ materially from the estimates and assumptions used in preparing the consolidated financial statements. We evaluate our estimates regularly using information that we believe to be relevant. For a detailed discussion of our accounting policies, see Note 2. Summary of Significant Accounting Policies in Item 8. Financial Statement and Supplementary Data on this Annual Report on Form 10-K.
Reserves for unpaid losses and LAE
The reserves for unpaid losses and LAE are the largest and most complex estimate in our consolidated balance sheets. The reserves for unpaid losses and LAE represent our estimated ultimate cost of all unreported and reported but unpaid insured claims and the cost to adjust these losses that have occurred as of or before the balance sheet date. The loss reserves are not discounted, with the exception of certain workers’ compensation claims loss reserves. The amounts of discount related to workers’ compensation reserves were $48.2 million, $47.4 million $37.0 million and $34.2$37.0 million at December 31, 2020, 2019 2018 and 2017,2018, respectively.
Those estimates are based on our historical information blended with industry and peer group information and our estimates of future trends in variable factors such as loss severity, loss frequency and other factors such as inflation. We review our estimates quarterly and adjust them as necessary as experience develops or as new information becomes known to us. Even after such adjustments, ultimate liability may exceed or be less than the revised estimates. Accordingly, the ultimate settlement of losses and LAE may vary significantly from the estimate included in our consolidated financial statements.
We categorize our reserves for unpaid losses and LAE into two types: case reserves and incurred but not reported (“IBNR”). Our gross reserves for losses and LAE at December 31, 2020 were $1.6 billion, and of this amount, 69.0% related to IBNR. Our net reserves for losses and LAE at December 31, 2020 were $1.4 billion, and of this amount, 69.1% related to IBNR.
Our gross reserves for losses and LAE at December 31, 2019 were $1.5 billion, and of this amount, 70.6% related to IBNR. Our net reserves for losses and LAE at December 31, 2019 were $1.3 billion, and of this amount, 69.4% related to IBNR.
85
Our gross reserves for losses and LAE at December 31, 2018 were $1.4 billion, and of this amount, 69.8% related to IBNR. Our net reserves for losses and LAE at December 31, 2018 were $1.2 billion, and of this amount, 67.8% related to IBNR.
Our gross reserves for losses and LAE at December 31, 2017 were $1.3 billion, and of this amount, 65.5% related to IBNR. Our net reserves for losses and LAE at December 31, 2017 were $1.1 billion, and of this amount, 63.6% related to IBNR.
The following tables present our gross and net reserves for unpaid losses and LAE at December 31, 2020, 2019, 2018, and 2017:2018:
|
|
|
|
|
|
|
|
|
|
|
| |||||||||||
|
| December 31, 2019 |
| |||||||||||||||||||
| | | | | | | | | | | | |||||||||||
| | December 31, 2020 |
| |||||||||||||||||||
|
| Gross |
| % of Total |
| Net |
| % of Total |
| |||||||||||||
|
| Gross |
| % of Total |
| Net |
| % of Total |
| |||||||||||||
($ in thousands) |
|
|
| | |
| ||||||||||||||||
Case reserves |
| $ | 447,736 |
| 29.4 | % | $ | 406,375 |
| 30.6 | % | | $ | 497,426 |
| 31.0 | % | $ | 442,469 |
| 30.9 | % |
IBNR |
|
| 1,073,912 |
| 70.6 |
|
| 921,321 |
| 69.4 |
| |
| 1,105,476 |
| 69.0 | |
| 989,912 |
| 69.1 | |
Total |
| $ | 1,521,648 |
| 100.0 | % | $ | 1,327,696 |
| 100.0 | % | | $ | 1,602,902 |
| 100.0 | % | $ | 1,432,380 |
| 100.0 | % |
|
|
|
|
|
|
|
|
|
|
|
| |||||||||||
|
| December 31, 2018 |
| |||||||||||||||||||
| | | | | | | | | | | | |||||||||||
| | December 31, 2019 |
| |||||||||||||||||||
|
| Gross |
| % of Total |
| Net |
| % of Total |
| |||||||||||||
|
| Gross |
| % of Total |
| Net |
| % of Total |
| |||||||||||||
($ in thousands) |
|
|
| | |
| ||||||||||||||||
Case reserves |
| $ | 422,231 |
| 30.2 | % | $ | 390,025 |
| 32.2 | % | | $ | 447,736 |
| 29.4 | % | $ | 406,375 |
| 30.6 | % |
IBNR |
|
| 974,581 |
| 69.8 |
|
| 821,492 |
| 67.8 |
| |
| 1,073,912 |
| 70.6 | |
| 921,321 |
| 69.4 | |
Total |
| $ | 1,396,812 |
| 100.0 | % | $ | 1,211,517 |
| 100.0 | % | | $ | 1,521,648 |
| 100.0 | % | $ | 1,327,696 |
| 100.0 | % |
| | | | | | | | | | | |
| | December 31, 2018 |
| ||||||||
|
| Gross |
| % of Total |
| Net |
| % of Total |
| ||
($ in thousands) | | |
| ||||||||
Case reserves | | $ | 422,231 |
| 30.2 | % | $ | 390,025 |
| 32.2 | % |
IBNR | |
| 974,581 |
| 69.8 | |
| 821,492 |
| 67.8 | |
Total | | $ | 1,396,812 |
| 100.0 | % | $ | 1,211,517 |
| 100.0 | % |
82
|
|
|
|
|
|
|
|
|
|
|
|
|
| December 31, 2017 |
| ||||||||
|
| Gross |
| % of Total |
| Net |
| % of Total |
| ||
($ in thousands) |
|
|
| ||||||||
Case reserves |
| $ | 434,478 |
| 34.5 | % | $ | 384,426 |
| 36.4 | % |
IBNR |
|
| 823,759 |
| 65.5 |
|
| 672,655 |
| 63.6 |
|
Total |
| $ | 1,258,237 |
| 100.0 | % | $ | 1,057,081 |
| 100.0 | % |
Case reserves are established for individual claims that have been reported to us. We are notified of losses by our insureds or their brokers. Based on the information provided, we establish case reserves by estimating the ultimate losses from the claim, including defense costs associated with the ultimate settlement of the claim. Our claims department personnel use their knowledge of the specific claim along with advice from internal and external experts, including underwriters and legal counsel, to estimate the expected ultimate losses. We utilize the services of two Third Party Administrators (“TPAs”) to assist in the adjustment of workers’ compensation claims and one TPA to assist in the adjustment of builders’ risk claims within the Real Estate customer segment. Our TPAs are not affiliated with our distribution partners. Other than in limited cases, our managing general underwriters (“MGUs”) do not handle claims. Our internal claims managers oversee TPA and MGU claims-related activities and monitor their individual claim handling activities to prescribed ProSight standards.
Our IBNR reserves are developed in accordance with Actuarial Standards of Practice promulgated by the American Academy of Actuaries. Our reserve review utilizes several accepted loss reserving methods to arrive at our best estimate of loss reserves. We give consideration to the relative strengths and weaknesses of each of the methods in deriving our actuarial best estimate of the liabilities. Where we have limited years of loss experience compared to the period over which we expect losses to be reported, we use industry and/or peer-group data in addition to our own data as a basis for selecting the parameters underlying our reserving methods. We monitor loss emergence monthly. We carefully consider other internal or external factors such as underwriting, claims handling, economic, or environmental changes that could adversely affect the accuracy of the assumptions underlying our standard actuarial methods and when necessary we will adjust these assumptions, methods, and/or procedures to ensure that they appropriately reflect these changing conditions. The average duration of loss reserves is 5.25.6 years, as of December 31, 2019.2020.
Our Reserve Committee includes our Chief Actuary, Chief Executive Officer, Chief Financial Officer, Chief Underwriting and Risk Officer, and Chief Claims Officer. The Reserve Committee meets quarterly to review the actuarial reserving recommendations made by the Chief Actuary. In establishing the actuarial recommendation for the reserves for losses and LAE, our actuary’s estimate of the current Initial Expected Loss Ratio (“IELR”) is derived from the pricing IELR at the niche level, policy year, and reserving group. Our reserve estimate is derived from our proprietary reserving
86
model that calculates a point estimate for our ultimate losses. Although we believe that our assumptions and methodology are reasonable, our ultimate payments may vary, potentially materially, from the estimates we have made.
In addition, we retain an independent external actuarial firm to perform an annual loss reserve analysis. The independent actuarial firm is not involved in the establishment and recording of our loss reserve. The independent actuarial firm prepares its own estimate of our reserves for loss and LAE, and we review their estimate to the reserves for losses and LAE reviewed and approved by the Reserve Committee.
The table below quantifies the impact of potential reserve deviations from our carried reserve at December 31, 2019.2020. We applied sensitivity factors to incurred losses for the three most recent accident years and to the carried reserve for all prior accident years combined. In the selection of the volatility factors, we have considered the potential impact of changes in current loss trends, pricing trends, and other actuarial reserving assumptions. The aggregate development depicted in the sensitivity analysis is consistent with the average development in recent calendar periods and a
83
reasonable depiction of the potential volatility of the reserve estimates for the current calendar period. We believe that potential changes such as these would not have a material impact on our liquidity.
| | | | | | | | | | | | | | | | |
| | | | | | December 31, 2020 | | Potential Impact on 2020 | ||||||||
|
| |
| Net Ultimate Loss |
| Net Ultimate |
| | |
| |
| | | ||
| | Accident | | and ALAE | | Incurred Losses | | Net Loss and | | Pre-tax | | Stockholders' | ||||
Sensitivity | | Year | | Sensitivity Factor | | and ALAE | | ALAE Reserve | | income | | Equity(1) | ||||
($ in thousands) | | | ||||||||||||||
Sample increases |
| 2020 |
| 4.0 | % | $ | 430,179 | | $ | 363,953 | | $ | (17,207) | | $ | (13,594) |
|
| 2019 |
| 3.0 | % |
| 460,080 | |
| 305,838 | |
| (13,802) | |
| (10,904) |
|
| 2018 |
| 2.0 | % |
| 403,545 | |
| 239,667 | |
| (8,071) | |
| (6,376) |
|
| Prior |
| 1.0 | % | | | |
| 516,967 | |
| (5,170) | |
| (4,084) |
Sample decreases |
| 2020 |
| (4.0) | % |
| 430,179 | | $ | 363,953 | | $ | 17,207 | | $ | 13,594 |
|
| 2019 |
| (3.0) | % |
| 460,080 | |
| 305,838 | |
| 13,802 | |
| 10,904 |
|
| 2018 |
| (2.0) | % |
| 403,545 | |
| 239,667 | |
| 8,071 | |
| 6,376 |
|
| Prior |
| (1.0) | % | | | |
| 516,967 | |
| 5,170 | |
| 4,084 |
|
|
|
|
|
|
|
|
|
|
|
|
|
|
|
|
|
|
|
|
|
|
| December 31, 2019 |
| Potential Impact on 2019 | ||||||||
|
|
|
| Net Ultimate Loss |
| Net Ultimate |
|
|
|
|
|
|
|
| ||
|
| Accident |
| and ALAE |
| Incurred Losses |
| Net Loss and | �� | Pre-tax |
| Stockholders' | ||||
Sensitivity |
| Year |
| Sensitivity Factor |
| and ALAE |
| ALAE Reserve |
| income |
| Equity(1) | ||||
($ in thousands) |
|
| ||||||||||||||
Sample increases |
| 2019 |
| 4.0 | % | $ | 457,973 |
| $ | 391,451 |
| $ | (18,319) |
| $ | (14,472) |
|
| 2018 |
| 3.0 | % |
| 406,199 |
|
| 293,310 |
|
| (12,186) |
|
| (9,627) |
|
| 2017 |
| 2.0 | % |
| 339,505 |
|
| 175,568 |
|
| (6,790) |
|
| (5,364) |
|
| Prior |
| 1.0 | % |
|
|
|
| 453,128 |
|
| (4,531) |
|
| (3,580) |
Sample decreases |
| 2019 |
| (4.0) | % |
| 457,973 |
| $ | 391,451 |
| $ | 18,319 |
| $ | 14,472 |
|
| 2018 |
| (3.0) | % |
| 406,199 |
|
| 293,310 |
|
| 12,186 |
|
| 9,627 |
|
| 2017 |
| (2.0) | % |
| 339,505 |
|
| 175,568 |
|
| 6,790 |
|
| 5,364 |
|
| Prior |
| (1.0) | % |
|
|
|
| 453,128 |
|
| 4,531 |
|
| 3,580 |
| (1) |
| In |
Reserve development
The amount by which estimated losses differ from those originally reported for a period is known as “development.” Development is unfavorable when the losses ultimately settle for more than the amount reserved or subsequent estimates indicate a basis for reserve increases on unresolved claims. Development is favorable when losses ultimately settle for less than the amount reserved or subsequent estimates indicate a basis for reducing loss reserves on unresolved claims. We reflect favorable or unfavorable development of loss reserves in the results of operations in the period the estimates are changed.
During the year ended December 31, 2020 the Company’s reserve for unpaid losses and loss adjustment expenses for accident years 2019 and prior developed unfavorably by $0.7 million driven by unfavorable development of $21.8 million in General Liability, $16.8 million unfavorable development in Commercial Multiple Peril and $8.1 million unfavorable development in Commercial Auto, partially offset by $36.5 million of favorable development in Workers’ Compensation and $9.5 million of favorable development in All Other lines. In addition, the Company incurred $15.2 million of losses and loss adjustment expenses related to premium adjustments earned during the year ended December 31, 2020, attributable to accident years 2019 and 2018. The unfavorable development in General Liability, Commercial Multiple Peril and Commercial Auto related to 2013 through 2017 accident years due largely to increased severities in runoff components. The favorable development in Workers’ Compensation derived from lower than expected claims severity across all customer segments primarily in accident years 2015 through 2018. The favorable development in All Other lines was driven mostly by Ocean Marine.
87
During the year ended December 31, 2019 our reserve for unpaid losses and loss adjustment expenses for accident years 2018 and prior developed unfavorably by $3.2 million driven primarily by unfavorable development of $16.4 million in Commercial Multiple Peril and $11.3 million in General Liability, partially offset by favorable development of $22.8 million in Workers’ Compensation. The unfavorable development in Commercial Multiple Peril was primarily from the Media and Entertainment customer segment in accident years 2013 through 2016 from a longer development trend than that underlying the historical performance of premises liability. The unfavorable development in General Liability primarily related to 2013 through 2016 accident years due to increased severities in the Real Estate customer segment and run off components within the Other customer segment. The favorable development in Workers Compensation derived from lower than expected claims severity across all customer segments primarily in accident years 2013 through 2015 and accident year 2017. In addition, the Company incurred $14.9 million of loss and loss adjustment expenses related to premium earned during the year ended December 31, 2019, attributable to accident year 2018.
During the year ended December 31, 2018, our reserve for unpaid losses and loss adjustment expenses for accident years 2017 and prior developed favorably by $5.0 million. Favorable development of $5.0 million for the year ended December 31, 2018, was driven primarily by favorable development of $14.4 million in Workers’ Compensation, $15.6 million in Commercial Auto and $4.1 million from Marine Liability within the All Other Lines category, partially offset by $16.5 million adverse development in General Liability and $12.2 million adverse development in Commercial Multiple Peril. Lower than expected claim severity was the main driver of the favorable development in Workers’ Compensation of which $6.2 million came from 2014, 2015 and 2016 accident years in primary Workers’ Compensation and $8.2 million came from 2014 and 2015 accident years in excess Workers’ Compensation. Favorable development in Commercial Auto was driven mainly by the 2013, 2015 and 2016 accident years where severity trends of the previous two calendar year periods improved during 2018 across multiple niches. Marine Liability is a low frequency, high severity line of business and as a result, development often varies significantly from the average expectation. The $16.5 million adverse development in General Liability primarily related to 2013, 2014 and 2015 accident years due to increased severities in the Construction customer segment from reduced effectiveness of risk transfer from our general
84
contractor insureds to subcontractors. The $12.2 million in adverse development in Commercial Multiple Peril is primarily from the Media and Entertainment customer segment driven by a longer development trend than that underlying the historic performance of premises liability.
During the year ended December 31, 2017, our reserve for unpaid losses and loss adjustment expenses for accident years 2016 and prior developed adversely by $20.3 million. Adverse development of $20.3 million was driven primarily by unfavorable development of $33.2 million in Commercial Auto which consisted of several niches that are now terminated. Adverse development in Commercial Auto was driven primarily by higher than expected frequency and severity. The Commercial Auto experience were likely a result of industry trends such as an improving economy resulting in more drivers on the roads, the hiring of less experienced drivers, the use of personal technology while in transit and litigation of bodily-injury claims, which resulted in unexpected adverse experience from historical performance patterns. The adverse development was offset by favorable development in Workers’ Compensation of $12.4 million due to lower than expected claim severity for accident years 2016 and prior, including a decline in the frequency of large loss activity.
Investments
Fair value measurements
The Company has established a framework for valuing financial assets and financial liabilities. The framework is based on a hierarchy of inputs used in valuation and gives the highest priority to quoted prices in active markets and requires that observable inputs be used in the valuations when available. The disclosure of fair value estimates in the hierarchy is based on whether the significant inputs into the valuation are observable. In determining the level of the hierarchy in which the estimate is disclosed, the highest priority is given to unadjusted quoted prices in active markets and the lowest priority to unobservable inputs that reflect the Company’s significant market assumptions. The standard describes three levels of inputs that may be used to measure fair value and categorize the assets and liabilities within the hierarchy:
Level 1 — Fair value is based on unadjusted quoted prices in active markets that are accessible to the Company for identical assets or liabilities. These prices generally provide the most reliable evidence and are used to measure fair value whenever available. Active markets are defined as having the following for the measured asset/liability: (i) many transactions,transactions; (ii) current prices,prices; (iii) price quotes not varying substantially among market makers,makers; (iv) narrow bid/ask spreadsspreads; and (v) most information publicly available.
Level 2 — Fair value is based on significant inputs, other than Level 1 inputs, that are observable for the asset or liability, either directly or indirectly, for substantially the full term of the asset through corroboration with observable market data. Level 2 inputs include quoted market prices in active markets for similar assets, nonbinding quotes in markets that are not active for identical or similar assets and other market observable inputs (e.g., interest rates, yield curves, prepayment speeds, default rates, loss severities, etc.).
88
Level 3 — Fair value is based on at least one or more significant unobservable inputs that are supported by little or no market activity for the asset. These inputs reflect the Company’s understanding about the assumptions market.
The Company generally obtains valuations from third-party pricing services and/or security dealers for identical or comparable assets or liabilities by obtaining nonbinding broker quotes (when pricing service information is not available) in order to determine an estimate of fair value. The Company bases all of its estimates of fair value for assets on the bid price as it represents what a third-party market participant would be willing to pay in an arm’s-length transaction.
ImpairmentCredit Losses
Management reviewsThe Company analyzes fixed incomematurity securities in an unrealized loss position for other-than-temporary impairments (“OTTI”) based upon quantitative and qualitative criteria that include, butcredit losses if they meet the following criteria: (i) they are not limited to, downgradestrading in rating agency levels for securities,
85
the duration and extent of declines in fair valueissuer of the security belowto make scheduled interest or principal payments; (iii) there have been negative credit events with respect to the issuer; or (iv) there have been negative current events surrounding an issuer or the environment in which an issuer operates
For fixed maturity securities in an unrealized loss position that require a credit loss analysis, the Company estimates a present value of expected cash flows. If the results of the cash flow analysis indicate that the Company will not recover the full amount of its cost or amortized cost interest rate trends,basis, the Company’s intent to sell or hold the security, market conditions, and the regulatory environmentCompany records a credit loss for the security’s issuer.
The Company may also considerexcess of amortized cost over the present value of expected cash flow models and matrix analysesflows, not to exceed the unrealized loss. Changes in connection with its OTTI evaluation. The Company will recordthe credit impairment inloss allowance are recognized through realized investment gains, net on the consolidated statements of operations and comprehensive income (loss) when the present value of cash flows expected to be collected from the debt security is less than the amortized cost basis of the security. In addition, any portion of such decline to arise from factors other than credit is recorded as a component of other comprehensive income (“OCI”).operations.
Deferred income taxes
We record deferred income taxes as assets or liabilities on our balance sheet to reflect the net tax effect of the temporary differences between the carrying amount of assets and liabilities for financial reporting purposes and their respective tax bases. Deferred tax assets and liabilities are measured by applying enacted tax rates in effect for the years in which such differences are expected to reverse. Our deferred tax assets result from temporary differences primarily attributable to loss reserves, unearned premium reserves and net adjusted operating losses from prior periods. Our deferred tax liabilities result primarily from unrealized gains in the investment portfolio and deferred acquisition costs. We review the need for a valuation allowance related to our deferred tax assets each quarter. We reduce our deferred tax assets by a valuation allowance when we determine that it is more likely than not that some portion or all of the deferred tax assets will not be realized. The assessment of whether or not a valuation allowance is needed requires us to use significant judgment. See Note 12 Income Taxes in Item 8. Financial Statements and Supplementary Data on this Annual Report on Form 10-K for further discussion regarding our deferred tax assets and liabilities.
On December 22, 2017, the President of the United States signed into law the TCJA. The legislationTCJA, which significantly changeschanged U.S. tax law by, among other things, lowering corporate income tax rates from 35% to 21%, effective January 1, 2018. U.S. GAAP requires companies to recognize the effect of tax law changes in the period of enactment..
The SEC staff issued Staff Accounting Bulletin No. 118 (“SAB 118”) to address the application of U.S. GAAP in situations when a registrant does not have the necessary information available, prepared, or analyzed (including computations) in reasonable detail to complete the accounting for certain income tax effects of the TCJA. The TCJA did not specify the application of certain elements of the legislation and the U.S. Treasury has yet to issue interpretive guidance to specify the loss payment patterns and the corporate bond yield curve under the new law for 2018. The Company has recognized a provisional tax impact of $9.0$6.1 million related to the transition adjustment for loss discounting which has been included in its components of deferred tax assets and liabilities as part of its consolidated financial statements for the year ended December 31, 2017.2020. The ultimate impact may differ from these provisional amounts due to, among other things, additional analysis, changes in interpretations and assumptions the Company has made, additional regulatory guidance that may be issued, and actions the Company may take as a result of the TCJA. The accounting is expected to be complete when the U.S. Treasury issues further guidance.
Reinsurance
The Company’s insurance subsidiaries participate in various reinsurance agreements. The Company uses various types of reinsurance, including quota share, excess of loss and facultative agreements, to spread the risk of loss among several reinsurers and to limit its exposure from losses on any one occurrence. Any recoverable due from reinsurers is
89
recorded in the period in which the related gross liability is established. Reinsurance reinstatement premiums are incurred by the Company based upon the provisions of the reinsurance contracts. In the event of a loss, the Company may be obligated to pay additional reinstatement premiums under its excess of loss reinsurance treaties. In such instances, the respective reinstatement premium is expensed immediately. The Company accounts for reinsurance receivables and prepaid reinsurance premiums as assets. The Company maintains an allowance for doubtful accounts, which includes amounts in dispute, amounts due from insolvent or financially impaired companies and other balances deemed uncollectible. Management continually reviews and updates such estimates. Profit commission revenue derived from reinsurance transactions is recognized when such amounts become earned as provided in the treaties with the respective reinsurers.
86
Item 7A. Quantitative and Qualitative Disclosures About Market Risk
Market risk is the risk of economic losses due to adverse changes in the estimated fair value of a financial instrument as the result of changes in interest rates, equity prices, foreign currency exchange rates and commodity prices. The primary components of market risk affecting us are credit risk and interest rate risk. We do not have significant exposure to equity risk, foreign currency exchange rate risk or commodity risk.
Credit risk
Credit risk is the potential loss resulting from adverse changes in an issuer’s ability to repay its debt obligations. We have exposure to credit risk as a holder of debt instruments. Our risk management strategy and investment approach is to primarily invest in debt instruments of high credit quality issuers and to limit the amount of credit exposure with respect to particular ratings categories and any one issuer. At December 31, 2019,2020, our securities portfolio had an average rating of “A” with approximately 63.6%62.5% of securities in that portfolio rated “A” or better by at least one nationally recognized rating organization. Our policy is to invest in investment-grade securities and to limit investments in fixed maturities that are unrated or rated below investment-grade. At December 31, 2019,2020, approximately 8.9%8.3% of our securities portfolio was unrated or rated below investment-grade. We monitor the financial condition of all of the issuers of securities in our portfolio.
In addition, we are subject to credit risk with respect to our third-party reinsurers. Although our third-party reinsurers are obligated to reimburse us to the extent we cede risk to them, we are ultimately liable to our policyholders on all risks we have ceded. As a result, reinsurance contracts do not limit our ultimate obligations to pay claims covered under the insurance policies we issue and we might not collect amounts recoverable from our reinsurers. We address this credit risk by selecting reinsurers that generally have an A.M. Best rating of “A-” (Excellent) or better at the time we enter into the agreement and by performing, along with our reinsurance broker, periodic credit reviews of our reinsurers. If one of our reinsurers suffers a credit downgrade, we may consider various options to lessen the risk of asset impairment, including commutation, novation and letters of credit.
Interest rate risk
Interest rate risk is the risk that we will incur economic losses due to adverse changes in interest rates. The primary market risk to our investment portfolio is interest rate risk associated with investments in securities. Fluctuations in interest rates have a direct effect on the market valuation of these securities. When market interest rates rise, the fair value of our securities decreases. Conversely, as interest rates fall, the fair value of our securities increases. We manage this interest rate risk by investing in securities with varied maturity dates and by managing the duration of our investment portfolio in directional relation to the duration of our reserves. Expressed in years, duration is the weighted average payment period of cash flows, where the weighting is based on the present value of the cash flows. We set duration targets for our fixed income investment portfolios after consideration of the estimated duration of our liabilities and other factors. The effective weighted average duration of the portfolio, including cash equivalents, was 3.44.8 years as of December 31, 2019.
2020.
8790
We had securities that were subject to interest rate risk with a fair value of $2.3 billion at December 31, 2020 and $2.0 billion at December 31, 2019 and $1.7 billion at December 31, 2018.2019. The table below illustrates the sensitivity of the fair value of our securities to selected hypothetical changes in interest rates as of December 31, 20192020 and 2018.2019.
| | | | | | | | | | | | | | | | | | |||||||||||||||||
|
| December 31, 2020 |
| December 31, 2019 |
| |||||||||||||||||||||||||||||
| | | | | | Estimated % | | | | | | Estimated % | | |||||||||||||||||||||
| | | | Estimated | | Increase | | | | Estimated | | Increase |
| |||||||||||||||||||||
| | Estimated | | Change in | | (Decrease) in | | Estimated | | Change in | | (Decrease) in |
| |||||||||||||||||||||
|
| Fair Value |
| Fair Value |
| Fair Value |
| Fair Value |
| Fair Value |
| Fair Value |
| |||||||||||||||||||||
|
|
|
|
|
|
|
|
|
|
|
|
|
|
|
|
|
| |||||||||||||||||
|
| December 31, 2019 |
| December 31, 2018 |
| |||||||||||||||||||||||||||||
|
|
|
|
|
| Estimated % |
|
|
|
|
| Estimated % |
| |||||||||||||||||||||
|
|
|
| Estimated |
| Increase |
|
|
| Estimated |
| Increase |
| |||||||||||||||||||||
|
| Estimated |
| Change in |
| (Decrease) in |
| Estimated |
| Change in |
| (Decrease) in |
| |||||||||||||||||||||
|
| Fair Value |
| Fair Value |
| Fair Value |
| Fair Value |
| Fair Value |
| Fair Value |
| |||||||||||||||||||||
|
| ($ in thousands) |
| |||||||||||||||||||||||||||||||
($ in thousands) | | |
| |||||||||||||||||||||||||||||||
200 basis points increase |
| $ | 1,908,854 |
| $ | (131,828) |
| (6.7) | % | $ | 1,600,239 |
| $ | (93,143) |
| (5.5) | % | | $ | 2,068,910 | | $ | (197,147) |
| (8.7) | % | $ | 1,908,854 | | $ | (131,828) |
| (6.7) | % |
100 basis points increase |
| $ | 1,972,728 |
| $ | (67,954) |
| (3.3) | % | $ | 1,645,364 |
| $ | (48,018) |
| (2.8) | % | | $ | 2,162,952 | | $ | (103,105) |
| (4.6) | % | $ | 1,972,728 | | $ | (67,954) |
| (3.3) | % |
No change |
| $ | 2,040,682 |
|
| — |
| — |
| $ | 1,693,382 |
|
| — |
| — |
| | $ | 2,266,057 | |
| — |
| — | | $ | 2,040,682 | |
| — |
| — | |
100 basis points decrease |
| $ | 2,112,719 |
| $ | 72,037 |
| 3.5 | % | $ | 1,744,292 |
| $ | 50,910 |
| 3.0 | % | | $ | 2,378,227 | | $ | 112,170 |
| 5.0 | % | $ | 2,112,719 | | $ | 72,037 |
| 3.5 | % |
200 basis points decrease |
| $ | 2,188,836 |
| $ | 148,154 |
| 7.3 | % | $ | 1,798,095 |
| $ | 104,713 |
| 6.2 | % | | $ | 2,499,461 | | $ | 233,404 |
| 10.3 | % | $ | 2,188,836 | | $ | 148,154 |
| 7.3 | % |
Changes in interest rates will have an immediate effect on comprehensive income and stockholders’ equity but will not ordinarily have an immediate effect on net income. Actual results may differ from the hypothetical change in market rates assumed in the table above. This sensitivity analysis does not reflect the results of any action that we may take to mitigate such hypothetical losses in fair value.
8891
8992
Report of Independent Registered Public Accounting Firm
To the Stockholders and the Board of Directors of
ProSight Global, Inc.:
Opinion on the Financial Statements
We have audited the accompanying consolidated balance sheets of ProSight Global, Inc. and Subsidiaries (the Company) as of December 31, 20192020 and 2018,2019, the related consolidated statements of operations, comprehensive income (loss), stockholders’ equity and cash flows for each of the three years in the period ended December 31, 2019,2020, and the related notes and financial statement schedules listed in the Index at Item 15 (collectively referred to as the "consolidated“consolidated financial statements"statements”). In our opinion, the consolidated financial statements present fairly, in all material respects, the financial position of the Company at December 31, 20192020 and 2018,2019, and the results of its operations and its cash flows for each of the three years in the period ended December 31, 2019,2020, in conformity with U.S. generally accepted accounting principles.
Basis for Opinion
These financial statements are the responsibility of the Company’sCompany's management. Our responsibility is to express an opinion on the Company’s financial statements based on our audits. We are a public accounting firm registered with the Public Company Accounting Oversight Board (United States) (PCAOB) and are required to be independent with respect to the Company in accordance with the U.S. federal securities laws and the applicable rules and regulations of the Securities and Exchange Commission and the PCAOB.
We conducted our audits in accordance with the standards of the PCAOB. Those standards require that we plan and perform the audit to obtain reasonable assurance about whether the financial statements are free of material misstatement, whether due to error or fraud. The Company is not required to have, nor were we engaged to perform, an audit of its internal control over financial reporting. As part of our audits we are required to obtain an understanding of internal control over financial reporting but not for the purpose of expressing an opinion on the effectiveness of the Company’s internal control over financial reporting. Accordingly, we express no such opinion.
Our audits included performing procedures to assess the risks of material misstatement of the financial statements, whether due to error or fraud, and performing procedures that respond to those risks. Such procedures included examining, on a test basis, evidence regarding the amounts and disclosures in the financial statements. Our audits also included evaluating the accounting principles used and significant estimates made by management, as well as evaluating the overall presentation of the financial statements. We believe that our audits provide a reasonable basis for our opinion.
/s/ Ernst & Young LLP
We have served as the Company’s auditor since 2013.
New York, New York
February 24, 202023, 2021
9093
ProSight Global, Inc. and Subsidiaries
Consolidated Balance Sheets
|
|
|
|
|
|
|
|
| December 31 | ||||
($ in thousands except per share amounts) |
| 2019 |
| 2018 | ||
Assets |
|
|
|
|
| |
Investments: |
|
|
|
|
|
|
Fixed income securities, available-for-sale at fair value (amortized cost $1,999,403 in 2019 and $1,729,755 in 2018) |
| $ | 2,040,682 |
| $ | 1,693,382 |
Commercial levered loans at amortized cost (fair value $13,950 in 2019 and $15,858 in 2018) |
|
| 14,069 |
|
| 16,915 |
Limited partnerships and limited liability companies at fair value (cost $62,226 in 2019 and $51,903 in 2018) |
|
| 66,660 |
|
| 53,432 |
Short-term investments |
|
| 43,873 |
|
| 36,661 |
Total investments |
|
| 2,165,284 |
|
| 1,800,390 |
Cash and cash equivalents |
|
| 17,284 |
|
| 22,279 |
Restricted cash |
|
| 10,213 |
|
| 7,621 |
Accrued investment income |
|
| 13,610 |
|
| 12,279 |
Premiums and other receivables, net |
|
| 190,004 |
|
| 200,347 |
Receivable from reinsurers on paid losses |
|
| 3,481 |
|
| 12,428 |
Reinsurance receivables on unpaid losses |
|
| 193,952 |
|
| 185,295 |
Deferred policy acquisition costs |
|
| 98,812 |
|
| 93,613 |
Prepaid reinsurance premiums |
|
| 42,861 |
|
| 44,626 |
Net deferred income taxes |
|
| 4,803 |
|
| 33,239 |
Goodwill and net intangible assets |
|
| 29,189 |
|
| 29,219 |
Fixed assets and capitalized software, net |
|
| 37,167 |
|
| 39,001 |
Funds withheld related to sale of affiliate |
|
| 19,453 |
|
| 19,397 |
Other assets |
|
| 29,537 |
|
| 57,653 |
Assets of discontinued operations |
|
| 21,584 |
|
| 19,719 |
Total assets |
| $ | 2,877,234 |
| $ | 2,577,106 |
|
|
|
|
|
|
|
Liabilities |
|
|
|
|
|
|
Reserve for unpaid losses and loss adjustment expenses |
| $ | 1,521,648 |
| $ | 1,396,812 |
Reserve for unearned premiums |
|
| 483,223 |
|
| 435,933 |
Ceded reinsurance payable |
|
| 17,768 |
|
| 13,281 |
Notes payable, net of debt issuance costs |
|
| 164,693 |
|
| 182,355 |
Funds held under reinsurance agreements |
|
| 58,855 |
|
| 63,165 |
Other liabilities |
|
| 56,438 |
|
| 73,474 |
Liabilities of discontinued operations |
|
| 31,578 |
|
| 22,256 |
Total liabilities |
|
| 2,334,203 |
|
| 2,187,276 |
|
|
|
|
|
|
|
Stockholders’ equity |
|
|
|
|
|
|
Preferred stock, $0.01 par value; 50,000,000 shares authorized; no shares issued or outstanding |
|
| — |
|
| — |
Common stock, $0.01 par value; 200,000,000 shares authorized; 43,071,186 and 38,864,289 shares issued, 43,058,266 and 38,851,369 shares outstanding in 2019 and 2018, respectively |
|
| 431 |
|
| 389 |
Paid-in capital |
|
| 661,761 |
|
| 607,260 |
Accumulated other comprehensive income (loss) |
|
| 37,453 |
|
| (22,315) |
Retained deficit |
|
| (156,414) |
|
| (195,304) |
Treasury shares - at cost (12,920 shares) |
|
| (200) |
|
| (200) |
Total stockholders' equity |
|
| 543,031 |
|
| 389,830 |
Total liabilities and stockholders' equity |
| $ | 2,877,234 |
| $ | 2,577,106 |
| | | | | | |
| | December 31 | ||||
($ in thousands except share amounts) | | 2020 | | 2019 | ||
Assets |
| | |
| | |
Investments: |
| |
|
| |
|
Fixed maturity securities, available-for-sale at fair value (amortized cost $2,159,743 in 2020 and $1,999,403 in 2019, allowance for credit losses $(1,457) in 2020 and $0 in 2019) |
| $ | 2,266,057 | | $ | 2,040,682 |
Commercial levered loans at amortized cost (fair value $12,180 in 2020 and $13,950 in 2019) |
|
| 12,308 | |
| 14,069 |
Non-redeemable preferred stock securities at fair value (cost $6,541 in 2020 and $0 in 2019) | | | 7,049 | | | — |
Bond exchange-traded funds at fair value (cost $44,679 in 2020 and $0 in 2019) | | | 44,882 | | | — |
Limited partnerships and limited liability companies at fair value (cost $74,268 in 2020 and $62,226 in 2019) |
|
| 90,468 | |
| 66,660 |
Short-term investments |
|
| 154 | |
| 43,873 |
Total investments |
|
| 2,420,918 | |
| 2,165,284 |
Cash and cash equivalents |
|
| 12,078 | |
| 17,284 |
Restricted cash | |
| 7,525 | |
| 10,213 |
Accrued investment income |
|
| 13,693 | |
| 13,610 |
Premiums and other receivables, net |
|
| 146,243 | |
| 190,004 |
Receivable from reinsurers on paid losses, net |
|
| 10,481 | |
| 3,481 |
Reinsurance receivables on unpaid losses, net |
|
| 170,522 | |
| 193,952 |
Deferred policy acquisition costs |
|
| 94,437 | |
| 98,812 |
Prepaid reinsurance premiums |
|
| 56,787 | |
| 42,861 |
Net deferred income taxes |
|
| — | |
| 4,803 |
Goodwill and net intangible assets |
|
| 17,248 | |
| 29,189 |
Fixed assets and capitalized software, net |
|
| 33,896 | |
| 37,167 |
Funds withheld related to sale of affiliate |
|
| 19,534 | |
| 19,453 |
Other assets |
|
| 25,996 | |
| 29,537 |
Assets of discontinued operations |
|
| 21,354 | |
| 21,584 |
Total assets | �� | $ | 3,050,712 | | $ | 2,877,234 |
| | | | | | |
Liabilities |
|
|
| |
|
|
Reserve for unpaid losses and loss adjustment expenses |
| $ | 1,602,902 | | $ | 1,521,648 |
Reserve for unearned premiums |
|
| 448,676 | |
| 483,223 |
Ceded reinsurance payable |
|
| 38,152 | |
| 17,768 |
Notes payable, net of debt issuance costs |
|
| 203,267 | |
| 164,693 |
Secured loan payable, net of issuance costs | | | 22,668 | | | — |
Funds held under reinsurance agreements |
|
| 23,179 | |
| 58,855 |
Net deferred income taxes | | | 10,137 | | | — |
Other liabilities |
|
| 40,034 | |
| 56,438 |
Liabilities of discontinued operations |
|
| 37,729 | |
| 31,578 |
Total liabilities |
|
| 2,426,744 | |
| 2,334,203 |
| | | | | | |
Stockholders’ equity |
|
|
| |
|
|
Preferred stock, $0.01 par value; 50,000,000 shares authorized; 0 shares issued or outstanding | | | — | | | — |
Common stock, $0.01 par value; 200,000,000 shares authorized; 43,449,087 and 43,071,186 shares issued; 43,436,167 and 43,058,266 shares outstanding in 2020 and 2019, respectively |
|
| 434 | |
| 431 |
Paid-in capital |
|
| 668,798 | |
| 661,761 |
Accumulated other comprehensive income |
|
| 89,122 | |
| 37,453 |
Retained deficit |
|
| (134,186) | |
| (156,414) |
Treasury shares - at cost (12,920 shares) |
|
| (200) | |
| (200) |
Total stockholders' equity |
|
| 623,968 | |
| 543,031 |
Total liabilities and stockholders' equity |
| $ | 3,050,712 | | $ | 2,877,234 |
See accompanying notes to consolidated financial statements.
9194
ProSight Global, Inc. and Subsidiaries
Consolidated Statements of Operations
|
|
|
|
|
|
|
|
|
|
|
| Years Ended December 31 | |||||||
($ in thousands except per share amounts) |
| 2019 |
| 2018 |
| 2017 | |||
|
|
|
|
|
|
|
| ||
Gross written premiums |
| $ | 968,011 |
| $ | 895,112 |
| $ | 836,334 |
Net earned premiums |
|
| 807,854 |
|
| 730,785 |
|
| 609,786 |
Net investment income |
|
| 68,897 |
|
| 55,971 |
|
| 36,196 |
Realized investment gains (losses), net |
|
| 770 |
|
| (1,557) |
|
| 4,204 |
Other income |
|
| 538 |
|
| 673 |
|
| 853 |
Total revenues |
|
| 878,059 |
|
| 785,872 |
|
| 651,039 |
|
|
|
|
|
|
|
|
|
|
Expenses: |
|
|
|
|
|
|
|
|
|
Net losses and loss adjustment expenses incurred |
|
| 501,025 |
|
| 434,830 |
|
| 393,741 |
Policy acquisition expenses |
|
| 184,771 |
|
| 171,429 |
|
| 126,023 |
General and administrative expenses |
|
| 105,686 |
|
| 100,118 |
|
| 87,821 |
Interest expense |
|
| 12,795 |
|
| 12,377 |
|
| 12,125 |
Other expense |
|
| 16,151 |
|
| — |
|
| — |
Total expenses |
|
| 820,428 |
|
| 718,754 |
|
| 619,710 |
Income from continuing operations before income taxes |
|
| 57,631 |
|
| 67,118 |
|
| 31,329 |
|
|
|
|
|
|
|
|
|
|
Income tax provision: |
|
|
|
|
|
|
|
|
|
Current |
|
| (185) |
|
| (853) |
|
| 864 |
Deferred |
|
| 12,322 |
|
| 14,242 |
|
| 37,369 |
Total income tax expense |
|
| 12,137 |
|
| 13,389 |
|
| 38,233 |
Income (loss) from continuing operations |
|
| 45,494 |
|
| 53,729 |
|
| (6,904) |
|
|
|
|
|
|
|
|
|
|
Discontinued operations: |
|
|
|
|
|
|
|
|
|
Loss from discontinued operations before income taxes |
|
| (8,718) |
|
| (560) |
|
| (37,768) |
Income tax benefit |
|
| (2,114) |
|
| (1,374) |
|
| (679) |
(Loss) income from discontinued operations |
|
| (6,604) |
|
| 814 |
|
| (37,089) |
|
|
|
|
|
|
|
|
|
|
Net income (loss) |
| $ | 38,890 |
| $ | 54,543 |
| $ | (43,993) |
|
|
|
|
|
|
|
|
|
|
Earnings per share - basic: |
|
|
|
|
|
|
|
|
|
Net income (loss) from continuing operations |
| $ | 1.11 |
| $ | 1.39 |
| $ | (0.18) |
Net income (loss) |
| $ | 0.95 |
| $ | 1.41 |
| $ | (1.17) |
|
|
|
|
|
|
|
|
|
|
Earnings per share - diluted: |
|
|
|
|
|
|
|
|
|
Net income (loss) from continuing operations |
| $ | 1.10 |
| $ | 1.36 |
| $ | (0.18) |
Net income (loss) |
| $ | 0.94 |
| $ | 1.38 |
| $ | (1.17) |
| | | | | | | | | |
| | Years Ended December 31 | |||||||
($ in thousands except per share amounts) |
| 2020 |
| 2019 |
| 2018 | |||
| | | | | | | | ||
Gross written premiums | | $ | 817,090 | | $ | 968,011 | | $ | 895,112 |
Net earned premiums | |
| 737,755 | |
| 807,854 | |
| 730,785 |
Net investment income | |
| 73,021 | |
| 68,897 | |
| 55,971 |
Realized investment gains (losses), net | |
| 4,980 | |
| 770 | |
| (1,557) |
Other income | |
| 351 | |
| 538 | |
| 673 |
Total revenues | |
| 816,107 | |
| 878,059 | |
| 785,872 |
| | | | | | | | | |
Expenses: | |
|
| |
|
| |
|
|
Net losses and loss adjustment expenses incurred | |
| 472,671 | |
| 501,025 | |
| 434,830 |
Policy acquisition expenses | |
| 172,426 | |
| 184,771 | |
| 171,429 |
General and administrative expenses | |
| 100,418 | |
| 105,686 | |
| 100,118 |
Interest expense | |
| 14,363 | |
| 12,795 | |
| 12,377 |
Other expense | | | 17,739 | | | 16,151 | | | — |
Total expenses | |
| 777,617 | |
| 820,428 | |
| 718,754 |
Income from continuing operations before income taxes | |
| 38,490 | |
| 57,631 | |
| 67,118 |
| | | | | | | | | |
Income tax provision: | |
|
| |
|
| |
|
|
Current | |
| 4,492 | |
| (185) | |
| (853) |
Deferred | |
| 6,248 | |
| 12,322 | |
| 14,242 |
Total income tax expense | |
| 10,740 | |
| 12,137 | |
| 13,389 |
Net income from continuing operations | |
| 27,750 | |
| 45,494 | |
| 53,729 |
| | | | | | | | | |
Discontinued operations: | |
| | |
| | |
|
|
Loss from discontinued operations before income taxes | | | (7,583) | | | (8,718) | | | (560) |
Income tax benefit | | | (2,061) | | | (2,114) | | | (1,374) |
Net (loss) income from discontinued operations | |
| (5,522) | |
| (6,604) | |
| 814 |
| | | | | | | | | |
Net income | | $ | 22,228 | | $ | 38,890 | | $ | 54,543 |
| | | | | | | | | |
Earnings per share - basic: | |
|
| |
|
| |
|
|
Net income from continuing operations | | $ | 0.63 | | $ | 1.11 | | $ | 1.39 |
Net income | | $ | 0.51 | | $ | 0.95 | | $ | 1.41 |
| | | | | | | | | |
Earnings per share - diluted: | |
|
| |
|
| |
|
|
Net income from continuing operations | | $ | 0.63 | | $ | 1.10 | | $ | 1.36 |
Net income | | $ | 0.50 | | $ | 0.94 | | $ | 1.38 |
See accompanying notes to consolidated financial statements.
9295
ProSight Global, Inc. and Subsidiaries
Consolidated Statements of Comprehensive Income (Loss)
|
|
|
|
|
|
|
|
|
|
|
| Years Ended December 31 | |||||||
($ in thousands) |
| 2019 |
| 2018 |
| 2017 | |||
Net income (loss) |
| $ | 38,890 |
| $ | 54,543 |
| $ | (43,993) |
Other comprehensive income (loss), net of taxes: |
|
|
|
|
|
|
|
|
|
Change in unrealized holding gains (losses) on securities, net of deferred tax expense (benefit) of $16,277 in 2019, $(10,842) in 2018 and $1,442 in 2017 |
|
| 61,643 |
|
| (42,740) |
|
| (1,357) |
Foreign currency translation adjustment |
|
| — |
|
| — |
|
| 6,881 |
Less reclassification adjustment for gains (losses) included in net income (loss) net of tax expense (benefit) of $162 in 2019, $(429) in 2018 and $1,471 in 2017 |
|
| 1,875 |
|
| (1,128) |
|
| 17,292 |
Other comprehensive income (loss) |
|
| 59,768 |
|
| (41,612) |
|
| (11,768) |
Comprehensive income (loss) |
| $ | 98,658 |
| $ | 12,931 |
| $ | (55,761) |
| | | | | | | | | |
|
| Years Ended December 31 | |||||||
($ in thousands) |
| 2020 |
| 2019 |
| 2018 | |||
Net income | | $ | 22,228 | | $ | 38,890 | | $ | 54,543 |
Other comprehensive income (loss), net of taxes: | |
|
| |
|
| |
|
|
Change in unrealized holding gains (losses) on securities, net of deferred tax expense (benefit) of $15,009 in 2020, $16,277 in 2019 and $(10,842) in 2018 | |
| 56,863 | |
| 61,643 | |
| (42,740) |
Less reclassification adjustment for gains (losses) included in net income net of tax expense (benefit) of $1,352 in 2020, $162 in 2019 and $(429) in 2018 | |
| 6,345 | |
| 1,875 | |
| (1,128) |
Less reclassification adjustment for credit losses included in net income net of tax benefit of $(306) in 2020, $0 in 2019 and $0 in 2018 | | | (1,151) | | | — | | | — |
Other comprehensive income (loss) | |
| 51,669 | |
| 59,768 | |
| (41,612) |
Comprehensive income | | $ | 73,897 | | $ | 98,658 | | $ | 12,931 |
See accompanying notes to consolidated financial statements.
9396
ProSight Global, Inc. and Subsidiaries
Consolidated Statements of Changes in Stockholders’ Equity
|
|
|
|
|
|
|
|
|
|
|
|
|
|
|
|
|
|
|
|
|
|
|
|
|
|
|
|
|
|
|
|
| Accumulated |
|
|
|
|
|
|
|
|
| |
|
|
|
|
|
|
|
| Other |
|
|
|
|
|
|
| ||||||
|
| Preferred |
| Common |
| Paid-In |
| Comprehensive |
| Retained |
| Treasury |
|
|
| ||||||
($ in thousands) |
| Stock |
| Stock |
| Capital |
| Income (Loss) |
| Deficit |
| Shares |
| Total | |||||||
December 31, 2016 |
| $ | — |
| $ | 355 |
| $ | 555,289 |
| $ | 29,482 |
| $ | (204,271) |
| $ | (200) |
| $ | 380,655 |
Shares issued |
|
|
|
|
| 32 |
|
| — |
|
| — |
|
| — |
|
| — |
|
| 32 |
Stock based employee compensation plan |
|
| — |
|
| — |
|
| 1,089 |
|
| — |
|
| — |
|
| — |
|
| 1,089 |
Capital contributions |
|
| — |
|
| — |
|
| 49,968 |
|
| — |
|
| — |
|
| — |
|
| 49,968 |
Net unrealized loss on investment securities, net of deferred tax benefit of $(29) |
|
| — |
|
| — |
|
| — |
|
| (18,649) |
|
| — |
|
| — |
|
| (18,649) |
Foreign currency translation |
|
|
|
|
| — |
|
| — |
|
| 6,881 |
|
| — |
|
| — |
|
| 6,881 |
Reclassification of stranded deferred taxes |
|
|
|
|
| — |
|
| — |
|
| 1,583 |
|
| (1,583) |
|
| — |
|
| — |
Net loss |
|
| — |
|
| — |
|
| — |
|
| — |
|
| (43,993) |
|
| — |
|
| (43,993) |
December 31, 2017 |
| $ | — |
| $ | 387 |
| $ | 606,346 |
| $ | 19,297 |
| $ | (249,847) |
| $ | (200) |
| $ | 375,983 |
Shares issued |
|
| — |
|
| 2 |
|
| (2) |
|
| — |
|
| — |
|
| — |
|
| — |
Stock based employee compensation plan |
|
| — |
|
| — |
|
| 916 |
|
| — |
|
| — |
|
| — |
|
| 916 |
Net unrealized loss on investment securities, net of deferred tax benefit of $(10,413) |
|
| — |
|
| — |
|
| — |
|
| (41,612) |
|
| — |
|
| — |
|
| (41,612) |
Net income |
|
| — |
|
| — |
|
| — |
|
| — |
|
| 54,543 |
|
| — |
|
| 54,543 |
December 31, 2018 |
| $ | — |
| $ | 389 |
| $ | 607,260 |
| $ | (22,315) |
| $ | (195,304) |
| $ | (200) |
| $ | 389,830 |
Stock based employee compensation plan |
|
| — |
|
| 1 |
|
| 8,578 |
|
| — |
|
| — |
|
| — |
|
| 8,579 |
Shares cancelled |
|
| — |
|
| (1) |
|
| 1 |
|
| — |
|
| — |
|
| — |
|
| — |
Retirement of common stock (tax payments on equity compensation) |
|
| — |
|
| — |
|
| (740) |
|
| — |
|
| — |
|
| — |
|
| (740) |
Net unrealized gain on investment securities, net of deferred tax expense of $16,115 |
|
| — |
|
| — |
|
| — |
|
| 59,768 |
|
| — |
|
| — |
|
| 59,768 |
Equity distribution |
|
| — |
|
| — |
|
| (4,174) |
|
| — |
|
| — |
|
| — |
|
| (4,174) |
Proceeds from common stock sold in initial public offering, net of offering costs |
|
| — |
|
| 42 |
|
| 50,836 |
|
| — |
|
| — |
|
| — |
|
| 50,878 |
Net income |
|
| — |
|
| — |
|
| — |
|
| — |
|
| 38,890 |
|
| — |
|
| 38,890 |
December 31, 2019 |
| $ | — |
| $ | 431 |
| $ | 661,761 |
| $ | 37,453 |
| $ | (156,414) |
| $ | (200) |
| $ | 543,031 |
| | | | | | | | | | | | | | | | | | | | | |
|
| | |
| | |
| | |
| Accumulated |
| | |
| | |
| | | |
| | | | | | | | Other | | | | | | | | ||||||
| | Preferred | | Common | | Paid-In | | Comprehensive | | Retained | | Treasury | | | | ||||||
($ in thousands) | | Stock | | Stock | | Capital | | Income (Loss) | | Deficit | | Shares | | Total | |||||||
December 31, 2017 | | $ | — | | $ | 387 | | $ | 606,346 | | $ | 19,297 | | $ | (249,847) | | $ | (200) | | $ | 375,983 |
Shares issued | | | — | | | 2 | | | (2) | | | — | | | — | | | — | | | — |
Stock based employee compensation plan | | | — | | | — | | | 916 | | | — | | | — | | | — | | | 916 |
Net unrealized loss on investment securities, net of deferred tax benefit of $(10,413) | | | — | | | — | | | — | | | (41,612) | | | — | | | — | | | (41,612) |
Net income | | | — | | | — | | | — | | | — | | | 54,543 | | | — | | | 54,543 |
December 31, 2018 | | $ | — | | $ | 389 | | $ | 607,260 | | $ | (22,315) | | $ | (195,304) | | $ | (200) | | $ | 389,830 |
Stock based employee compensation plan | | | — | | | 1 | | | 8,578 | | | — | | | — | | | — | | | 8,579 |
Shares cancelled | | | — | | | (1) | | | 1 | | | — | | | — | | | — | | | — |
Net unrealized gain on investment securities, net of deferred tax expense of $16,115 | | | — | | | — | | | — | | | 59,768 | | | — | | | — | | | 59,768 |
Retirement of common stock (tax payments on equity compensation) | | | — | | | — | | | (740) | | | — | | | — | | | — | | | (740) |
Equity distribution | | | — | | | — | | | (4,174) | | | — | | | — | | | — | | | (4,174) |
Proceeds from common stock sold in initial public offering, net of offering costs | | | — | | | 42 | | | 50,836 | | | — | | | — | | | — | | | 50,878 |
Net income | | | — | | | — | | | — | | | — | | | 38,890 | | | — | | | 38,890 |
December 31, 2019 | | $ | — | | $ | 431 | | $ | 661,761 | | $ | 37,453 | | $ | (156,414) | | $ | (200) | | $ | 543,031 |
Stock based employee compensation plan | | | — | | | 3 | | | 8,848 | | | — | | | — | | | — | | | 8,851 |
Stock purchase plan | | | — | | | — | | | 165 | | | — | | | — | | | — | | | 165 |
Net unrealized gain on investment securities, net of deferred tax expense of $13,963 | | | — | | | — | | | — | | | 51,669 | | | — | | | — | | | 51,669 |
Retirement of common stock (tax payments on equity compensation) | | | — | | | — | | | (2,578) | | | — | | | — | | | — | | | (2,578) |
Tax benefit on payments related to offering costs | | | — | | | — | | | 602 | | | — | | | — | | | — | | | 602 |
Net income | | | — | | | — | | | — | | | — | | | 22,228 | | | — | | | 22,228 |
December 31, 2020 | | $ | — | | $ | 434 | | $ | 668,798 | | $ | 89,122 | | $ | (134,186) | | $ | (200) | | $ | 623,968 |
See accompanying notes to consolidated financial statements.
9497
ProSight Global, Inc. and Subsidiaries
Consolidated Statements of Cash Flows
|
|
|
|
|
|
|
|
|
|
|
| Years Ended December 31 | |||||||
($ in thousands) |
| 2019 |
| 2018 |
| 2017 | |||
Operating activities |
|
|
|
|
|
|
|
| |
Net income (loss) from continuing operations |
| $ | 45,494 |
| $ | 53,729 |
| $ | (6,904) |
Net (loss) income from discontinued operations |
|
| (6,604) |
|
| 814 |
|
| (37,089) |
Net income (loss) |
|
| 38,890 |
|
| 54,543 |
|
| (43,993) |
|
|
|
|
|
|
|
|
|
|
Adjustments to reconcile net income (loss) to net cash provided by operating activities: |
|
|
|
|
|
|
|
|
|
Provision for deferred taxes |
|
| 12,322 |
|
| 14,242 |
|
| 37,369 |
Realized investment (gains) losses, net |
|
| (770) |
|
| 1,557 |
|
| (4,204) |
Net limited partnerships gains |
|
| (3,101) |
|
| (1,081) |
|
| (3,240) |
Net accretion from bonds and commercial loans |
|
| (2,622) |
|
| (6,083) |
|
| (2,364) |
Depreciation and amortization |
|
| 8,737 |
|
| 7,351 |
|
| 7,615 |
Stock based compensation |
|
| 8,578 |
|
| 916 |
|
| 1,089 |
|
|
|
|
|
|
|
|
|
|
Changes in: |
|
|
|
|
|
|
|
|
|
Premiums and other receivables |
|
| 10,343 |
|
| (16,013) |
|
| (15,956) |
Receivable from reinsurers on paid losses and reinsurance receivable from unpaid losses |
|
| 290 |
|
| 20,653 |
|
| (12,849) |
Ceded reinsurance payable |
|
| 4,487 |
|
| (5,167) |
|
| 15,632 |
Accrued investment income |
|
| (1,331) |
|
| (2,870) |
|
| (4,056) |
Deferred policy acquisition costs |
|
| (5,199) |
|
| (32,854) |
|
| 15,813 |
Prepaid reinsurance premiums |
|
| 1,765 |
|
| 78,324 |
|
| (92,054) |
Unpaid losses and loss adjustment expenses |
|
| 124,836 |
|
| 138,575 |
|
| 91,618 |
Reserve for unearned premiums |
|
| 47,290 |
|
| 40,501 |
|
| 40,603 |
Funds withheld related to sale of affiliate |
|
| (56) |
|
| 7,376 |
|
| (26,988) |
Funds held under reinsurance agreements |
|
| (4,310) |
|
| (49,095) |
|
| 91,671 |
Other assets |
|
| 23,938 |
|
| (15,092) |
|
| (8,992) |
Other liabilities |
|
| (17,036) |
|
| (2,377) |
|
| 48,463 |
Total adjustments |
|
| 208,161 |
|
| 178,863 |
|
| 179,170 |
Net cash provided by operating activities - continuing operations |
|
| 253,655 |
|
| 232,592 |
|
| 172,266 |
Net cash used in operating activities - discontinued operations |
|
| (359) |
|
| (900) |
|
| (98,396) |
Net cash provided by operating activities |
|
| 253,296 |
|
| 231,692 |
|
| 73,870 |
|
|
|
|
|
|
|
|
|
|
Investing activities |
|
|
|
|
|
|
|
|
|
Purchases of available-for-sale fixed income securities |
|
| (570,726) |
|
| (509,970) |
|
| (1,236,581) |
Sales of available-for-sale fixed income securities |
|
| 145,053 |
|
| 173,768 |
|
| 719,916 |
Redemptions of available-for-sale fixed income securities |
|
| 157,860 |
|
| 81,417 |
|
| 257,102 |
Purchases of commercial levered loans |
|
| — |
|
| (7,101) |
|
| (3,150) |
Redemptions of commercial levered loans |
|
| 2,815 |
|
| 14,698 |
|
| 8,858 |
Purchases of limited partnerships |
|
| (15,407) |
|
| (33,580) |
|
| (45,251) |
Distributions and redemptions from limited partnerships |
|
| 5,280 |
|
| 22,832 |
|
| 40,270 |
Purchases of short-term investments |
|
| (358,296) |
|
| (172,787) |
|
| (180,400) |
Sales of short-term investments |
|
| 351,761 |
|
| 140,623 |
|
| 238,291 |
Acquisition of fixed assets and capitalized software |
|
| (6,535) |
|
| (8,489) |
|
| (11,884) |
Net cash used in investing activities - continuing operations |
|
| (288,195) |
|
| (298,589) |
|
| (212,829) |
Net cash (used in) provided by investing activities - discontinued operations |
|
| (421) |
|
| 637 |
|
| 52,356 |
Net cash used in investing activities |
|
| (288,616) |
|
| (297,952) |
|
| (160,473) |
|
|
|
|
|
|
|
|
|
|
Financing activities |
|
|
|
|
|
|
|
|
|
Proceeds from notes payable |
|
| — |
|
| 18,000 |
|
| — |
Repayment of notes payable |
|
| (18,000) |
|
| — |
|
| — |
Tax withholding on stock compensation awards |
|
| (740) |
|
| — |
|
| — |
Proceeds from shares issued |
|
| 50,878 |
|
| — |
|
| 32 |
Capital contributions |
|
| — |
|
| — |
|
| 49,968 |
Net cash provided by financing activities |
|
| 32,138 |
|
| 18,000 |
|
| 50,000 |
Net change in cash and cash equivalents |
|
| (3,182) |
|
| (48,260) |
|
| (36,603) |
Cash, cash equivalents and restricted cash at beginning of year - continuing operations |
|
| 29,900 |
|
| 77,872 |
|
| 75,211 |
Cash, cash equivalents and restricted cash at beginning of year - discontinued operations |
|
| 1,034 |
|
| 1,322 |
|
| 40,586 |
Less: cash, cash equivalents and restricted cash at end of year - discontinued operations |
|
| (255) |
|
| (1,034) |
|
| (1,322) |
Cash, cash equivalents and restricted cash at end of year |
| $ | 27,497 |
| $ | 29,900 |
| $ | 77,872 |
| | | | | | | | | |
| | Years Ended December 31 | |||||||
($ in thousands) |
| 2020 |
| 2019 |
| 2018 | |||
Operating activities |
| |
|
| |
|
| | |
Net income from continuing operations | | $ | 27,750 |
| $ | 45,494 | | $ | 53,729 |
Net (loss) income from discontinued operations | |
| (5,522) |
|
| (6,604) | |
| 814 |
Net income | |
| 22,228 |
|
| 38,890 | |
| 54,543 |
| | | | | | | | | |
Adjustments to reconcile net income to net cash provided by operating activities: | |
|
|
|
|
| |
|
|
Provision for deferred taxes | |
| 6,248 |
|
| 12,322 | |
| 14,242 |
Realized investment (gains) losses, net | |
| (4,980) |
|
| (770) | |
| 1,557 |
Net limited partnerships and limited liability companies gains | |
| (11,690) |
|
| (3,101) | |
| (1,081) |
Net amortization (accretion) from bonds and commercial loans | |
| 3,247 |
|
| (2,622) | |
| (6,083) |
Net change in fair value of equity securities | | | (526) | | | — | | | — |
Depreciation and amortization | |
| 9,313 |
|
| 8,737 | |
| 7,351 |
Amortization of debt issuance costs | | | 1,249 | | | — | | | — |
Impairment of goodwill | | | 11,911 | | | — | | | — |
Stock-based compensation | |
| 8,851 |
|
| 8,578 | |
| 916 |
| | | | | | | | | |
Changes in: | |
|
|
|
|
| |
|
|
Premiums and other receivables, net | |
| 43,761 |
|
| 10,343 | |
| (16,013) |
Receivable from reinsurers on paid losses and reinsurance receivable on unpaid losses | |
| 16,430 |
|
| 290 | |
| 20,653 |
Ceded reinsurance payable | |
| 20,384 |
|
| 4,487 | |
| (5,167) |
Accrued investment income | |
| (83) |
|
| (1,331) | |
| (2,870) |
Deferred policy acquisition costs | |
| 4,375 |
|
| (5,199) | |
| (32,854) |
Prepaid reinsurance premiums | |
| (13,926) |
|
| 1,765 | |
| 78,324 |
Reserve for unpaid losses and loss adjustment expenses | |
| 81,254 |
|
| 124,836 | |
| 138,575 |
Reserve for unearned premiums | |
| (34,547) |
|
| 47,290 | |
| 40,501 |
Funds withheld related to sale of affiliate | |
| (81) |
|
| (56) | |
| 7,376 |
Funds held under reinsurance agreements | |
| (35,676) |
|
| (4,310) | |
| (49,095) |
Other assets | | | (649) | | | 23,938 | | | (15,092) |
Other liabilities | |
| (16,405) |
|
| (17,036) | |
| (2,377) |
Total adjustments | |
| 88,460 |
|
| 208,161 | |
| 178,863 |
Net cash provided by operating activities - continuing operations | |
| 116,210 |
|
| 253,655 | |
| 232,592 |
Net cash provided by (used in) operating activities - discontinued operations | |
| 180 |
|
| (359) | |
| (900) |
Net cash provided by operating activities | |
| 116,390 |
|
| 253,296 | |
| 231,692 |
| | | | | | | | | |
Investing activities |
| |
|
| |
|
| |
|
Purchases of available-for-sale fixed maturity securities |
| | (716,057) |
| | (570,726) |
| | (509,970) |
Sales of available-for-sale fixed maturity securities |
| | 297,506 |
| | 145,053 |
| | 173,768 |
Redemptions of available-for-sale fixed maturity securities |
| | 261,239 |
| | 157,860 |
| | 81,417 |
Purchases of non-redeemable preferred stock securities | | | (13,070) | | | — | | | — |
Sales of non-redeemable preferred stock securities | | | 6,400 | | | — | | | — |
Purchases of bond exchange-traded funds | | | (59,069) | | | — | | | — |
Sales of bond exchange-traded funds | | | 14,333 | | | — | | | — |
Purchases of commercial levered loans |
| | — |
| | — |
| | (7,101) |
Redemptions of commercial levered loans |
| | 1,769 |
| | 2,815 |
| | 14,698 |
Purchases of limited partnerships |
| | (15,460) |
| | (15,407) |
| | (33,580) |
Distributions and redemptions from limited partnerships |
| | 3,342 |
| | 5,280 |
| | 22,832 |
Purchases of short-term investments |
| | (34,492) |
| | (358,296) |
| | (172,787) |
Sales of short-term investments |
| | 78,362 |
| | 351,761 |
| | 140,623 |
Acquisition of fixed assets and capitalized software |
| | (6,013) |
| | (6,535) |
| | (8,489) |
Net cash used in investing activities - continuing operations |
| | (181,210) |
| | (288,195) |
| | (298,589) |
Net cash provided by (used in) investing activities - discontinued operations |
| | 1,344 |
| | (421) |
| | 637 |
Net cash used in investing activities |
| | (179,866) |
| | (288,616) |
| | (297,952) |
| | | | | | | | | |
Financing activities |
| |
|
| |
|
| |
|
Proceeds from notes payable, net of debt issuance costs | | | 201,909 | | | — | | | 18,000 |
Repayment of notes payable | | | (165,000) | | | (18,000) | | | — |
Proceeds from secured loan payable, net of debt issuance costs | | | 22,659 | | | — | | | — |
Payments related to offering costs | | | (49) | | | — | | | — |
Proceeds from shares issued | | | — | | | 50,878 | | | — |
Proceeds from stock purchase plan | | | 165 | | | — | | | — |
Tax withholding on stock compensation awards | | | (2,578) | | | (740) | | | — |
Net cash provided by financing activities |
| | 57,106 |
| | 32,138 |
| | 18,000 |
Net change in cash and cash equivalents |
| | (6,370) |
| | (3,182) |
| | (48,260) |
Cash, cash equivalents and restricted cash at beginning of year - continuing operations |
| | 27,497 |
| | 29,900 |
| | 77,872 |
Cash, cash equivalents and restricted cash at beginning of year - discontinued operations |
| | 255 |
| | 1,034 |
| | 1,322 |
Less: cash, cash equivalents and restricted cash at end of year - discontinued operations |
| | (1,779) |
| | (255) |
| | (1,034) |
Cash, cash equivalents and restricted cash at end of year - continuing operations | | $ | 19,603 |
| $ | 27,497 | | $ | 29,900 |
See accompanying notes to consolidated financial statements.
9598
ProSight Global, Inc. and its subsidiaries (the “Company”) was founded in 2009 by members of the current management team and secured capital commitments from affiliates of each of The Goldman Sachs Group, Inc. (“Goldman Sachs”) and TPG Global, LLC (“TPG”). The Company established its insurance operating platform and acquired its insurance subsidiaries through the acquisition of NYMAGIC, Inc. in 2010.
The Company was incorporated in Delaware in 2010 and is owned by ProSight Investment LLC (“PI”), ProSight Parallel Investment LLC (“PPI”), and ProSight TPG, LP (“PT”). PI and PPI are wholly-owned by ProSight Equity Management Inc., which is held as an investment within the GS Capital Partners VI funds. PT is held as an investment within TPG Partners VI, LP. The Company is the parent of ProSight Specialty Insurance Group, Inc. (“PSIG”). PSIG conducts its specialty insurance business through three insurance subsidiaries: New York Marine and General Insurance Company (“New York Marine”), Gotham Insurance Company (“Gotham”), and Southwest Marine and General Insurance Company (“Southwest Marine”). On October 1, 2016, ProSight Specialty Insurance Solutions, LLC (“PSIS”) became a direct subsidiary of PSIG. Effective April 19, 2018, PSIS changed its name to ProSight Specialty Insurance Brokerage, LLC (“PSIB”). The Company is also the parent of ProSight Specialty Management Company (“PSMC”), which manages a risk-sharing pool of the Company’s subsidiaries, and ProSight Specialty Bermuda Ltd. (“PSBL”).
The Company focuses on producing insurance business in specialized niche markets with selective distribution networks possessing unique expertise. The Company’s major customer segments are Construction, Consumer Services, Marine and Energy, Media and Entertainment, Professional Services, Real Estate, Sports, and Transportation.
Reorganization
Prior to July 25, 2019, the Company was a wholly-owned subsidiary of ProSight Global Holdings Limited (“PGHL”), a Bermuda holding company. Effective July 25, 2019, prior to the completion of the Company’s initial public offering (“IPO”), PGHL merged with and into the Company, with the Company surviving the merger (the “merger”“IPO merger”). The prior holders of PGHL’s equity interests then outstanding received, as merger consideration, the right to receive 6.46 shares of the Company’s common stock for each such outstanding PGHL equity interest. The total merger consideration was 38,851,369 shares of the Company’s common stock, which then comprised 100% of the shares of the Company’s outstanding common stock.
As a result of the IPO merger, the assets and liabilities of the Company include, effective July 25, 2019, the assets and liabilities of PGHL. In addition, on July 24, 2019, in connection with the IPO merger, the Company’s duly adopted amended and restated certificate of incorporation (the “Certificate of Incorporation”) became effective, providing for, among other things, the authorization of 200,000,000 shares of common stock and 50,000,000 shares of preferred stock. The consolidated financial statements, related notes and schedules have been restated for all historical periods prior to and including June 30, 2019, presented to give effect to the IPO merger and related conversion of shares, including reclassifying an amount equal to the change in value of common stock to additional paid-in capital, as well as the effectiveness of the Certificate of Incorporation.
Prior to the IPO merger, PGHL’s subsidiaries ProSight Specialty International Holdings Limited (“PSIH”) and ProSight Specialty European Holdings Limited (“PSEH”) were merged with and into ProSight Global, Inc., effective February 5, 2019. Additionally, effective February 5, 2019, PSBL became a wholly-owned subsidiary of the Company. Prior to February 5, 2019, PSBL was a wholly-owned subsidiary of PSEH.
96
Initial Public Offering
On July 29, 2019, the Company completed its IPO with the sale of 7,857,145 shares of the Company’s common stock, including the issuance and sale by the Company of 4,285,715 shares of the Company’s common stock and the sale
99
by PI and PPI (collectively, the “GS Investors”) and PT, TPG PS 1, L.P., TPG PS 2, L.P., TPG PS 3, L.P. and TPG PS 4, L.P. (collectively the “TPG Investors” and together with the GS Investors, the “Principal Stockholders”) of 3,571,430 shares of the Company’s common stock.
Shares of the Company’s common stock were initially offered to the public by the underwriters in the IPO at a per-share price of $14.00. After deducting underwriting discounts and commissions and estimated offering expenses, the net proceeds to the Company from the IPO were approximately $50.8 million. The Company did not receive any of the proceeds from the sale of the shares of the Company’s common stock sold by the Principal Stockholders in the IPO. Following the IPO, the GS Investors held approximately 40.9% of the Company’s outstanding common stock and the TPG Investors held approximately 39.4% of the Company’s outstanding common stock.
On August 15, 2019 the Principal Stockholders completed the sale of 1,178,570 shares of the Company’s common stock at a price of $14.00 per share less the underwriting discount pursuant to the underwriters’ exercise of their over-allotment option granted in connection with the IPO. The offering was registered pursuant to the registration statement on Form S-1, which the SEC declared effective on July 24, 2019. The Company did not receive any of the proceeds from the sale of the shares of common stock of the Company sold by the Principal Stockholders in this offering. Following this offering, the GS Investors held approximately 39.5% of the Company’s outstanding common stock and the TPG Investors held approximately 38.0% of the Company’s outstanding common stock.
2. Summary of Significant Accounting Policies
Basis of Reporting and Use of Estimates
The accompanying consolidated financial statements have been prepared in conformity with U.S. generally accepted accounting principles (“GAAP”).
The preparation of the consolidated financial statements in conformity with GAAP requires management to make estimates and assumptions that affect the reported financial statement balances, as well as disclosure of contingent assets and liabilities. Actual results could differ from those estimates.
Consolidation
Unless otherwise noted, the consolidated financial statements include the accounts of the Company and its subsidiaries after elimination of intercompany balances and transactions, and relate to continuing operations. Discontinued operations are reported separately.
Investments
Investment transactions are recorded on their trade date with balances pending settlement included in the consolidated balance sheets as a receivable for investments disposed of or payable for investments securities acquired and reported within other assets or other liabilities respectively.
Realized investment gains and losses are determined on the basis of first-in, first-out.
97
Fixed IncomeMaturity Securities
Fixed incomematurity securities may include U.S. treasury securities, government agency securities, municipal debt obligations, residential mortgage backed securities (“RMBS”), commercial mortgage backed securities (“CMBS”), collateralized loan obligations (“CLO”), asset backed securities (“ABS”) and corporate debt securities.
100
Fixed incomematurity securities categorized as available-for-sale (“AFS”) are reported at estimated fair value and include those fixed income investments where the Company’s intent to carry such investments to maturity may be affected in future periods by changes in market interest rates, tax position or credit quality. Unrealized gains and losses, net of related deferred income taxes, on AFS securities are reflected in accumulated other comprehensive income (loss) (“AOCI”) in stockholders’ equity.
The cost of fixed incomematurity securities is adjusted for the amortization of any purchase premiums and the accretion of purchase discounts from the time of purchase of the security to its sale or maturity. This amortization of premium and accretion of discount is recorded in net investment income in the consolidated statements of operations. Any realized gains or losses resulting from the sale of securities are recognized in realized investment gains (losses), net in the consolidated statements of operations.
Non-Redeemable Preferred Stock Securities
Non-redeemable preferred stock securities with readily determinable fair values are recorded at fair value. Changes in fair value of such investments are recorded in the consolidated statements of operations within net investment income.
Bond Exchange-Traded Funds
Bond exchange-traded funds with readily determinable fair values are recorded at fair value. Changes in fair value of such investments are recorded in the consolidated statements of operations within net investment income.
Commercial Levered Loans
The Company’s investment portfolio includes commercial levered loans, which are classified as held-for-investment and are reported at amortized cost.
Investments in Limited Partnerships and Limited Liability Companies
The Company has elected to carry investments in limited partnerships and limited liability companies at fair value. Interest income, dividend income and movements in fair value respective to cost basis are recorded as investment income. The fair values are obtained from statements of net asset value made available by the respective limited partnerships and limited liability companies.
Short-Term Investments
Short-term investments, which have maturities of one year or less at acquisition, are carried at amortized cost, which approximates fair value.
Cash and Cash Equivalents
Cash and cash equivalents include cash on deposit with banks and treasury bills with maturities of less than 90 days at acquisition. The Company considers all highly liquid debt instruments with maturities of three months or less at acquisition to be cash equivalents. Restricted cash consists of escrow funds, trust funds and collateral related to funds withheld.
Other-Than-Temporary Impairments
Management reviews fixed income securities for other-than-temporary impairments (“OTTI”) based upon quantitative and qualitative criteria that include, but are not limited to, downgrades in rating agency levels for securities, the duration and extent of declines in fair value of the security below its cost or amortized cost, interest rate trends, the Company’s intent to sell or hold the security, market conditions, and the regulatory environment for the security’s issuer.
98101
Credit Losses
The Company may also consideranalyzes fixed maturity securities in an unrealized loss position for credit losses if they meet the following criteria: (i) they are trading in a significant loss position; (ii) failure of the issuer of the security to make scheduled interest or principal payments; (iii) there have been negative credit events with respect to the issuer; or (iv) there have been negative current events surrounding an issuer or the environment in which an issuer operates.
For fixed maturity securities in an unrealized loss position that require a credit loss analysis, the Company estimates a present value of expected cash flows. If the results of the cash flow models and matrix analyses in connection with its OTTI evaluation. Theanalysis indicate that the Company will recordnot recover the full amount of its amortized cost basis, the Company records a credit impairmentloss for the excess of amortized cost over the present value of expected cash flows, not to exceed the unrealized loss. Changes in the credit loss allowance are recognized through realized investment gains, net on the consolidated statements of operations when the present value of cash flows expected to be collected from the debt security is less than the amortized cost basis of the security. In addition, any portion of such decline to arise from factors other than credit is recorded as a component of other comprehensive income (“OCI”).operations.
Fair Values of Financial Instruments
For fixed incomematurity securities, quoted prices in active markets are used to determine the fair value. When such information is not available, as in the case of securities that are not publicly traded, other valuation techniques are employed. These valuation techniques may include, but are not limited to, using third-party pricing sources (dealer marks), identifying comparable securities with quoted market prices and using internally prepared valuations based on certain modeling and pricing methods. For limited partnerships and limited liability companies, the Company utilizes statements of net asset value made available by the respective limited partnerships and limited liability companies. For notes payable, the Company takes into consideration, the interest-rate environment for benchmark interest rates, credit spreads for similar securities, as well as the Company’s rating and financial performance to calculate the fair value.
Premium Recognition
Premiums are reflected in income on a monthly pro rata basis over the terms of the respective policies. Accordingly, unearned premium reserves are established for the portion of premiums written applicable to unexpired policies in force. The Company has provided an allowance for uncollectible premiumscredit loss for premium receivable is an assessment of $5.1 millionultimate non-collectability based on historical experience applicable to the respective current collection action status, age of the amount outstanding and $4.8 million as of December 31, 2019 and 2018, respectively.expected collection costs.
Policy Acquisition Cost Recognition
Policy acquisition costs related to unearned premiums that vary with, and are directly related to, the production of such premiums are deferred. Furthermore, such deferred costs: (i) represent only incremental, direct costs associated with the successful acquisition of a new or renewal insurance contract; (ii) are essential to the contract transaction; (iii) would not have been incurred had the contract transaction not occurred; and (iv) are related directly to the acquisition activities involving underwriting, policy issuance and processing. Policy acquisition costs, such as brokerage commissions and premium taxes, and other expenses related to the underwriting process, including their employees’ compensation and benefits, are amortized to expense as the related premiums are earned.
Accounting guidance requires a premium deficiency analysis to be performed at the level an entity acquires, services, and measures the profitability of its insurance contracts. Currently, the Company determines the sufficiency of unearned premium net of deferred policy acquisition costs against expected levels of losses and loss adjustment expenses by line of business. The determination anticipates investment income. To the extent carried unearned premium net of deferred policy acquisition cost is viewed as deficient, the respective deferred policy acquisition cost is first reduced and, if needed, a separate deficiency reserve is established.
102
Reinsurance
The Company’s insurance subsidiaries participate in various reinsurance agreements on both an assumed and ceded basis. The Company uses various types of reinsurance, including quota share, excess of loss and facultative agreements, to spread the risk of loss among several reinsurers and to limit its exposure from losses on any one occurrence. Any recoverable due from reinsurers is recorded in the period in which the related gross liability is established.
99
Reinsurance reinstatement premiums are incurred by the Company based upon the provisions of the reinsurance contracts. In the event of a loss, the Company may be obligated to pay additional reinstatement premiums under its excess of loss reinsurance treaties. In such instances, the respective reinstatement premium is expensed immediately.
The Company accounts for reinsurance receivables and prepaid reinsurance premiums as assets.
The Company maintains ana reinsurance receivable allowance for doubtful accounts, which includes amounts in dispute, amounts due from insolvent or financially impaired companiescredit losses based on sources of credit ratings of reinsurers and other balances deemed uncollectible. Management continually reviewsapplies probabilities of default and updates such estimates.loss given default to the total uncollateralized exposure including incurred but not reported (“IBNR”) by rating class.
Profit commission revenue derived from reinsurance transactions is recognized when such amounts become earned as provided in the treaties with the respective reinsurers.
Depreciation
Property, equipment, and leasehold improvements are depreciated over their estimated useful lives, which are approximately three to seven years. Costs incurred in developing or obtaining software are capitalized and depreciated on a straight-line basis over their estimated useful lives, which are approximately three to seven years.
Capitalized software as of December 31, 20192020 and 2018,2019, had unamortized balances of $33.8$31.4 million and $35.0$33.8 million, respectively. Depreciation on capitalized software commences once the software is placed into service. The Company recorded depreciation expense of $7.9 million, $7.0 million $5.8 million and $5.4$5.8 million for the years ended 2020, 2019 2018 and 2017,2018, respectively.
Other depreciable assets, primarily leasehold improvements, as of December 31, 20192020 and 2018,2019, had unamortized balances of $3.3$2.4 million and $3.8$3.3 million, respectively. The Company recorded depreciation expense of $1.1 million and $1.2 million and $1.5 million, and $1.7 million, for the years ended 2020, 2019 and 2018, and 2017, respectively.
Income Taxes
The Company’s U.S. subsidiaries file a consolidated federal income tax return in the U.S.
The Company provides deferred income taxes on temporary differences between the financial reporting basis and the tax basis of the Company’s assets and liabilities based upon enacted tax rates. The effect of a change in tax rates is recognized in income in the period of change. The Company provides for a valuation allowance on certain deferred tax assets primarily as a result of the uncertainty that the Company can fully utilize all deferred taxes that arose from net operating losses (NOL)(“NOLs”) incurred. This uncertainty stems from issues relating to the current economic conditions and limitations on the period that such losses can be carried forward prior to expiring. To the extent the Company generates future operating income to offset these losses, it may recover some or the entire amount of the deferred income taxes associated with temporary differences.
On December 22, 2017, the Tax Cuts and Jobs Act (“Tax Reform”) was enacted which reduced the corporate tax rate from 35% to 21% effective January 1, 2018. This resulted in a re-measurement of the Company’s net deferred taxes
103
to reflect the new rate at which the deferred items will be realized. The re-measurement of the net deferred tax asset as another income tax expense resulted in tax effects of items within AOCI, which did not reflect the current enacted tax rate. As a result, the Company elected to early adopt Accounting Standards Update 2018-02 (“ASU 2018-02”), Income Statement — Reporting Comprehensive Income at December 31, 2017, by making a one-time adjustment of $1.6 million to reclassify the stranded tax effects from accumulated other comprehensive income to retained earnings, that was associated with net unrealized gains on our investment portfolio resulting from the enactment of Tax Reform.
100
TableOn March 27, 2020, the President of Contents
ProSight Global, Inc.the United States signed into law the Coronavirus Aid, Relief, and Subsidiaries
Economic Security Act (the “CARES Act”). The CARES Act, among other things, includes certain income tax provisions for individuals and corporations; however, these benefits do not impact the Company’s current tax provision.
Losses and Loss Adjustment Expenses
Losses and loss adjustment expenses are a function of the amount and type of insurance contracts the Company writes, the loss experience associated with the underlying coverage, and the expenses incurred in the handling of the losses. In general, the Company’s losses and loss adjustment expenses are affected by the frequency of claims associated with the particular types of insurance contracts, trends in the average size of losses incurred on a particular type of business, mix of business, changes in the legal or regulatory environment related to the business, trends in legal defense costs, wage inflation, and inflation in medical costs.
The reserve for loss and loss adjustment expenses includes a provision for both reported claims (case reserves) and incurred but not reported claims (“IBNR”).IBNR. IBNR estimates are generally calculated by first projecting the ultimate cost of all losses that have occurred (expected losses), and then subtracting paid losses, case reserves, and loss expenses. The reserve for loss and loss adjustment expenses represents management’s best estimate of unpaid losses and loss adjustment expenses using individual case-basis valuations and statistical analysis that is not discounted, with the exception of certain workers’ compensation claims. Workers’ compensation reserves for policy years between 2007 and 20192020 were discounted at discount rates between 2.85%2.04% and 5.00%, for the years ended December��31, 2019 and 2018, respectively.. Carried discounted reserves on these workers’ compensation claims, net of reinsurance, were $116.9$122.1 million and $96.3$116.9 million at December 31, 20192020 and 2018,2019, respectively. The amount of discount related to workers’ compensation reserves were $47.4was $48.2 million and $37.0$47.4 million at December 31, 20192020 and 2018,2019, respectively.
The Company’s loss reserve review processes use actuarial methods that may vary by line of business. The actuarial methods used include the following methods:
| Reported Loss Development Method: a reported loss development pattern is calculated based on historical loss development data, and this pattern is then used to project the latest evaluation of cumulative reported losses for each accident year or underwriting year, as appropriate, to ultimate levels; |
| Paid Development Method: a paid loss development pattern is calculated based on historical paid loss development data, and this pattern is then used to project the latest evaluation of cumulative paid losses for each accident year or underwriting year, as appropriate, to ultimate levels; |
| Expected Loss Ratio Method: expected loss ratios are applied to premiums earned, based on actuarial pricing expectation, or historical insurance industry results when company experience is deemed not to be sufficient; and |
| Bornhuetter-Ferguson Method: the results from the Expected Loss Ratio Method are essentially blended with either the Reported Loss Development Method or the Paid Development Method. |
104
Although considerable variability is inherent in the estimates of reserves for losses and loss adjustment expenses, management believes the reserve is adequate. The estimates are continually reviewed and adjusted as necessary as experience develops or new information becomes known. Such adjustments are included in current operations.
Share-Based Compensation
Entities are required to measure compensation cost for awards of equity instruments to employees based on the grant-date fair value of those awards and recognize compensation expense over the service period that the awards are expected to vest. The Company records compensation costs on a straight-line basis over the vesting period of all awards except when an award requires accelerated recognition. The Company does not apply a forfeiture rate to unvested awards and accounts for forfeitures as they occur. Stock-based compensation expense related to long-term incentive
101
awards and director restricted stock units (“RSUs”) are included in general and administrative expenses in the Company’s consolidated statements of operations. Stock-based compensation expense related to supplemental RSUs and founders grant awards are included in other expenses in the Company’s consolidated statements of operations.
Goodwill and Net Intangible Assets
Goodwill represents the excess of the cost of acquiring a business enterprise over the fair value of the net assets acquired. Goodwill is deemed to have an indefinite life and is not amortized, but rather tested annually, in the fourth quarter, for impairment. A quantitative goodwill impairment analysis is performed if an annual qualitative analysis indicates that it is more likely than not that the fair value of a reporting unit is less than its carrying amount.
Finite-lived intangible assets are amortized over their estimated useful lives. Indefinite-lived other intangible assets are tested for impairment annually, in the fourth quarter, or when certain triggering events require such tests.
Earnings Per Share
Basic earnings per share of common stock is based on the weighted-average number of shares of outstanding common stock, par value $0.01 per share, of the Company (“Common Stock”) during the period, and vested RSUs. Vested RSUs awaiting conversion into common stock were 489,439 for the year ended December 31, 2020, 906,182 for the year ended December 31, 2019 and 548,292 for the year ended December 31, 2018 and 517,446 for the year ended December 31, 2017.2018. Diluted earnings per share of Common Stock are based on those shares used to calculate basic earnings per share of Common Stock plus the dilutive effect of unvested stock-based compensation awards. Basic and diluted earnings per share are calculated by dividing net income by the applicable weighted-average number of shares outstanding during the period. The Company did not0t declare any stock dividends for the years ended December 31, 2020, 2019 2018 and 2017.2018.
Reclassifications
All share and per share amounts in the financial statements, related notes and schedules have been restated for all historical periods prior to and including June 30, 2019, presented to give effect to the merger and related conversion of shares, including reclassifying an amount equal to the change in value of common stock to additional paid-in capital, as well as the effectiveness of the Certificate of Incorporation.
From time to time we reallocate existing niches to new or different customer segments in order to align them more efficiently, for reasons that may include the evolution of business or customers in that niche, the establishment or discontinuance of related niches, changes in responsibilities of our management team handling the segments, among others. All historical customer segment information is presented in accordance with the current composition of our customer segments and such reallocation of premium amounts, and as a result some customer segment information may differ from amounts previously reported inin Note 18. Segments.
105
3. Recently Adopted Accounting Standards
Accounting Guidance Adopted
In OctoberFebruary 2016, the FASBFinancial Accounting Standards Board (“FASB”) issued Accounting Standards Update (“ASU”) 2016-02, Leases (“ASU 2016‑16, Income Taxes, Intra-Entity Transfers2016-02”)to improve the financial reporting of Assets Other Than Inventory.leasing transactions. Under this ASU, 2016‑16 requireslessees will recognize a right-of-use asset and corresponding liability on the balance sheet for all leases, except for leases covering a period of fewer than 12 months. The liability is to be measured as the present value of the future minimum lease payments taking into account renewal options, if applicable, plus initial incremental direct costs such as commissions. The minimum payments are discounted using the rate implicit in the lease or, if not known, the lessee’s incremental borrowing rate. The lessee’s income statement treatment for leases will vary depending on the nature of the lease. A financing type lease is present when, among other matters, the asset is being leased for a substantial portion of its economic life or has an entity to recognizeend-of-term title transfer or a bargain purchase option as in today’s practice. The payment of the liability set up for such leases will be apportioned between interest and principal; the right-of use asset will be generally amortized on a straight-line basis. If the lease does not qualify as a financing type lease, it will be accounted for on the income tax consequencesstatement as rent on a straight-line basis. ASU 2016-02 requires the application of an intra-entity transfer of an asset other than inventory when the transfer occurs, rather than when the asset has been sold to an outside party. ASU 2016‑16 should be applied on a modified retrospective basis through a cumulative-effect adjustment directly to retained earningsapproach for leases existing at, or entered into after, the beginning of the earliest comparative period presented in the financial statements.
The Company adopted ASU 2016-02 in the first quarter of 2020, and as part of its implementation, elected the modified retrospective method approach at the beginning of the period of adoption. Foradoption and did not retrospectively adjust prior periods presented. The Company elected to not separate lease components from non-lease components (such as office cleanings, security and maintenance services provided by the Company’s lessors for certain of its leases). The Company also elected the package of practical expedients under the transition guidance, which allowed the Company to not reevaluate existing lease classifications, among others. As of January 1, 2020, the Company’s adoption of this guidance resulted in recognition of a right-of-use asset of $5.6 million and a corresponding lease liability of $6.3 million in continuing operations, and a right-of-use asset of $2.5 million and a corresponding lease liability of $3.0 million in discontinued operations. The adoption of this guidance did not have a material impact on the Company’s retained earnings. See Note 15. Leases for further information on the Company’s leases.
In June 2016, the FASB issued ASU 2016‑162016-13, Financial Instruments — Credit Losses, Measurement of Credit Losses on Financial Instruments (“ASU 2016-13”). ASU 2016-13 will change the way entities recognize impairment of financial assets by requiring immediate recognition of estimated credit losses expected to occur over the remaining life of many financial assets, including, among others, held-to-maturity debt securities, trade receivables, and reinsurance receivables. ASU 2016-13 requires a valuation allowance to be calculated on these financial assets and that they be presented on the financial statements net of the valuation allowance. The valuation allowance is effectivea measurement of expected losses that is based on relevant information about past events, including historical experience, current conditions, and reasonable and supportable forecasts that affect the collectability of the reported amount. This methodology is referred to as the current expected credit loss model. The Company adopted ASU 2016-13 in the first quarter of 2020 using a modified retrospective approach. As of January 1, 2020, the Company’s adoption of this guidance did not have a material impact on the Company’s retained earnings.
In August 2018, the FASB issued ASU 2018-13, Fair Value Measurement: Disclosure Framework - Changes to the Disclosure Requirements for annual periods beginning after December 15, 2018Fair Value Measurement (“ASU 2018-13”). ASU 2018-13 modifies the disclosure requirements for fair value measurements. The modifications removed the following disclosure requirements: (i) the amount of, and interim periods within annual periods beginning after December 15, 2019.reasons for, transfers between Level 1 and Level 2 of the fair value hierarchy; (ii) the policy for timing of transfers between levels; and (iii) the valuation processes for Level 3 fair value measurements. This ASU 2016‑16added the following disclosure requirements: (i) the changes in unrealized gains and losses for the period included in other comprehensive income for recurring Level 3 fair value measurements held at the end of the reporting period; and (ii) the range and weighted average of significant unobservable inputs used to develop Level 3 fair value measurements. The Company adopted ASU 2018-13 in the first quarter of 2020 using a retrospective approach and as the requirements of this
106
literature are disclosure only, ASU 2018-13 did not have an impact on the Company’s financial condition or results of operations.
In March 2017, the FASB issued ASU 2017-08, Premium Amortization on Purchased Callable Debt Securities (“ASU 2017-08”). ASU 2017-08 shortens the amortization period of the premium for certain callable debt securities, from the contractual maturity date to the earliest call date. ASU 2017-08 is effective for public entities for annual periods beginning after December 15, 2017,2018, including interim periods
102
within those annual periods. Theperiods, with early adoption permitted. For the Company, adopted ASU 2016‑16 in the fourth quarter of2017-08 is effective for annual periods beginning after December 15, 2019 and itinterim periods within annual periods beginning after December 15, 2020. The Company’s adoption of this guidance did not have a material impact on its financial condition andor results of operations.
In January 2016,2017, the FASB issued ASU 2016‑01, Financial Instruments — Overall, Recognition2017-04, Intangibles – Goodwill and Measurement of Financial Assets and Financial LiabilitiesOther (Topic 350) (“ASU 2017-04”). ASU 2016‑01 provides guidance to improve certain aspects of recognition, measurement, presentation, and disclosure of financial instruments. Specifically2017-04 modifies the guidance: (i) requires equity investments to be measured at fair value with changes in fair value recognized in earnings; (ii) simplifies thegoodwill impairment assessment of equity investments without readily determinable fair valuestest by requiring a qualitative assessment to identify impairment; (iii) eliminates the requirement to disclose the methods and significant assumptions used to estimate the fair value that is required to be disclosed for financial instruments measured at amortized cost; (iv) requires the use of the exit price notion when measuringeliminating Step 2. An entity should perform its annual, or interim, goodwill impairment test by comparing the fair value of financial instrumentsa reporting unit with its carrying amount. An entity should recognize an impairment charge for disclosure purposes; and (v) clarifies that the need for a valuation allowance on a deferred tax asset related to an AFS securityamount by which the carrying amount exceeds the reporting unit’s fair value, however the loss recognized should be evaluated with other deferred tax assets. The Company shall applynot exceed the total amount of goodwill. ASU 2016‑01 by means of a cumulative-effect adjustment to the balance sheet as of the beginning of the fiscal year of adoption. ASU 2016‑012017-04 is effective for public entities for the annual periodsor any interim goodwill impairment tests in fiscal years beginning after December 15, 2017, including interim periods within those annual periods.2019, with early adoption permitted. For the Company, ASU 2016‑012017-04 is effective for its annual periods beginning after December 15, 2018 andor any interim periods within annual periodsgoodwill impairment tests beginning after December 15, 2019. The Company adopted ASU 2016-01 in the fourth quarterCompany’s adoption of 2019 and itthis guidance did not have a material impact on its financial condition andor results of operations.
Accounting Guidance Not Yet Adopted
In February 2016, the FASB issued ASU 2016‑02, Leases to improve the financial reporting of leasing transactions. Under this ASU, lessees will recognize a right-of-use asset and corresponding liability on the balance sheet for all leases, except for leases covering a period of fewer than 12 months. The liability is to be measured as the present value of the future minimum lease payments taking into account renewal options if applicable plus initial incremental direct costs such as commissions. The minimum payments are discounted using the rate implicit in the lease or, if not known, the lessee’s incremental borrowing rate. The lessee’s income statement treatment for leases will vary depending on the nature of what is being leased. A financing type lease is present when, among other matters, the asset is being leased for a substantial portion of its economic life or has an end-of-term title transfer or a bargain purchase option as in today’s practice. The payment of the liability set up for such leases will be apportioned between interest and principal; the right-of use asset will be generally amortized on a straight-line basis. If the lease does not qualify as a financing type lease, it will be accounted for on the income statement as rent on a straight-line basis. ASU 2016‑02 requires the application of a modified retrospective approach for leases existing at, or entered into after, the beginning of the earliest comparative period presented in the financial statements. ASU 2016‑02 is effective for public entities for annual periods beginning after December 15, 2018, including interim periods within those annual periods with early adoption permitted. For the Company, ASU 2016‑02 is effective for annual periods beginning after December 15, 2019 and interim periods within annual periods beginning after December 15, 2020. The Company will adopt ASU 2016‑02 in the first quarter of 2020, and expects to recognize, at adoption, a right-of-use asset of $6.8 million and a corresponding lease liability of $6.8 million in continuing operations. The Company expects to recognize, at adoption, a right-of-use asset of $2.6 million and a corresponding lease liability of $2.6 million in discontinued operations.
In June 2016, the FASB issued ASU 2016‑13, Financial Instruments — Credit Losses, Measurement of Credit Losses on Financial Instruments. ASU 2016‑13 will change the way entities recognize impairment of financial assets by requiring immediate recognition of estimated credit losses expected to occur over the remaining life of many financial assets, including, among others, held-to-maturity debt securities, trade receivables, and reinsurance receivables. ASU 2016‑13 requires a valuation allowance to be calculated on these financial assets and that they be presented on the financial statements net of the valuation allowance. The valuation allowance is a measurement of expected losses that is based on relevant information about past events, including historical experience, current conditions, and reasonable and supportable forecasts that affect the collectability of the reported amount. This methodology is referred to as the current expected credit loss model. ASU 2016‑13 is effective for public entities for annual periods beginning after December 15,
103
2019, including interim periods within those annual periods with early adoption permitted. For the Company, ASU 2016‑13 is effective for annual periods beginning after December 15, 2022 including interim periods within these annual periods. The Company will adopt ASU 2016-13 in the first quarter of 2020 and does not currently believe that the implementation will have a material impact to the Company’s financial condition or results of operations.
In August 2018, the FASB issued ASU 2018‑13, Fair Value Measurement: Disclosure Framework — Changes to the Disclosure Requirements for Fair Value Measurement. ASU 2018‑13 modifies the disclosure requirements for fair value measurements. The modifications removed the following disclosure requirements: (i) the amount of, and reasons for, transfers between Level 1 and Level 2 of the fair value hierarchy; (ii) the policy for timing of transfers between levels; and (iii) the valuation processes for Level 3 fair value measurements. This ASU added the following disclosure requirements: (i) the changes in unrealized gains and losses for the period included in other comprehensive income for recurring Level 3 fair value measurements held at the end of the reporting period; and (ii) the range and weighted average of significant observable inputs used to develop Level 3 fair value measurements. This update shall be applied retrospectively and is effective for all entities annual and interim periods beginning after December 15, 2019, with early adoption permitted. As the requirements of this literature are disclosure only, ASU 2018‑13 will not impact the Company’s financial condition or results of operations.
In August 2018, the FASB issued ASU 2018‑15, 2018-15, Intangibles — Goodwill and Other — Internal-Use Software: Customer’s Accounting for Implementation Costs Incurred in a Cloud Computing Arrangement That Is a Service Contract (“ASU 2018-15”). ASU 2018‑152018-15 aligns the requirements for capitalizing implementation costs incurred in a hosting arrangement that is a service contract with the requirements for capitalizing implementation costs incurred to develop or obtain internal-use software. ASU 2018‑152018-15 provides the option to apply prospectively to costs for activities performed on or after the date that the entity first adopts or retrospectively in accordance with guidance on accounting changes. This update ASU 2018-15 is effective for public entities for annual and interim periods beginning after December 15, 2019, including interim periods within those annual periods, with early adoption permitted. For the Company, ASU 2018‑152018-15 is effective for annual periods beginning after December 15, 2020 and interim periods within annual periods beginning after December 15, 2021. The Company will adopt ASU 2018-15 in the first quarter of 2021 and does not currently believe that the implementation will have a material impact to the Company’s financial condition or results of operations.
In December 2019, the FASB issued ASU 2019-12, Income Taxes - Simplifying the Accounting for Income Taxes (“ASU 2019-12”). Among other items, the amendments in ASU 2019-12 simplify the accounting treatment of tax law changes and year-to-date losses in interim periods. An entity generally recognizes the effects of a change in tax law in the period of enactment; however, there is an exception for tax laws with delayed effective dates. Under current guidance, an entity may not adjust its annual effective tax rate for a tax law change until the period in which the law is effective. This exception was removed under ASU 2019-12, thereby providing that all effects of a tax law change are recognized in the period of enactment, including adjustment of the estimated annual effective tax rate. Regarding year-to-date losses in interim periods, an entity is required to estimate its annual effective tax rate for the full fiscal year at the end of each interim period and use that rate to calculate its income taxes on a year-to-date basis. However, current guidance provides an exception that when a loss in an interim period exceeds the anticipate loss for the year, the income tax benefit is limited to the amount that would be recognized if the year-to-date loss were the anticipated loss for the full year. ASU 2019-12 removes this exception and provides that in this situation, an entity would compute its income tax benefit at each interim period based on its estimated annual effective tax rate. ASU 2019-12 is effective for public entities for annual periods beginning after December 15, 2020, including interim periods within those annual periods, with early adoption permitted. For the Company, ASU 2019-12 is effective for annual periods beginning after December 15, 2021 and interim periods
107
within annual periods beginning after December 15, 2021. The Company is currently evaluating the impact of this guidance on its financial condition or results of operations.
In January 2020, the FASB issued ASU 2020-01, Investments – Equity Securities (Topic 321), Investments – Equity Method and Joint Ventures (Topic 323), and Derivatives and Hedging (Topic 815) (“ASU 2020-01”). ASU 2020-01 will clarify certain interactions between the guidance to account for certain equity securities under Topic 321, the guidance to account for investments under the equity method of accounting in Topic 323, and the guidance in Topic 815, which could change how an entity accounts for an equity security under the measurement alternative or a forward contract or exercise of the purchased option, would be accounted for under the equity method of accounting or the fair value option in accordance with Topic 825, Financial Instruments. ASU 2020-01 is effective for public entities for annual periods beginning after December 15, 2020, including interim periods within those annual periods, with early adoption permitted. For the Company, ASU 2020-01 is effective for annual periods beginning after December 15, 2021 and interim periods within annual periods beginning after December 15, 2021. The Company is currently evaluating the impact of this guidance on its financial condition or results of operations.
In March 2020, the FASB issued ASU 2020-04, Reference Rate Reform (Topic 848) – Facilitation of the Effects of Reference Rate Reform on Financial Reporting (“ASU 2020-04”), which provides optional expedients and exceptions to the guidance in GAAP on contract modifications and hedge accounting to ease the financial reporting burdens related to the expected market transition away from the London Interbank Offered Rate ("LIBOR") and other interbank offered rates to alternative reference rates. Companies can elect to adopt ASU 2020-04 as of the beginning of the interim period that includes March 2020, or any date thereafter through December 31, 2022. The Company is currently evaluating the impact of this guidance on its financial condition and results of operations.
4. Statements of Cash Flow
Supplemental cash flow information for the years ended December 31, 2020, 2019 2018 and 2017,2018, is as follows:
|
|
|
|
|
|
|
|
|
|
|
| December 31 | |||||||
($ in thousands) |
| 2019 |
| 2018 |
| 2017 | |||
Cash paid (received) during the period for: |
|
|
|
|
|
|
|
|
|
Interest |
| $ | 12,865 |
| $ | 12,377 |
| $ | 12,125 |
Federal income tax |
|
| (780) |
|
| 135 |
|
| 227 |
| | | | | | | | | |
| | December 31 | |||||||
($ in thousands) |
| 2020 |
| 2019 |
| 2018 | |||
Cash paid (received) during the period for: |
| |
|
| |
| | |
|
Interest | | $ | 12,915 | | $ | 12,865 | | $ | 12,377 |
Federal income tax | | $ | 5,553 | | $ | (780) |
| $ | 135 |
Non-cash activity: | | | | | | | | | |
Operating lease right-of-use assets due to the adoption of ASU 2016-02 - continuing operations | | $ | 2,794 | | $ | — | | $ | — |
Operating lease right-of-use assets due to the adoption of ASU 2016-02 - discontinued operations | | $ | 2,173 | | $ | — | | $ | — |
Operating lease liabilities due to the adoption of ASU 2016-02 - continuing operations | | $ | 3,099 | | $ | — | | $ | — |
Operating lease liabilities due to the adoption of ASU 2016-02 - discontinued operations | | $ | 2,508 | | $ | — | | $ | — |
Tax benefit on payments related to offering costs | | $ | 635 | | $ | — | | $ | — |
In 2019,2020, there was a conversion of 59,169364,948 RSUs into common shares accounted for as a non-cash transaction.transaction.
5. Goodwill and Net Intangibles Assets
On November 23, 2010, the Company acquired 100% of NYMAGIC, Inc.’s outstanding common stock for a cash price of $25.75 per share or approximately $231.9 million. The acquisition of NYMAGIC, Inc. provided a platform for which the Company could issue insurance policies. The fair value of net assets acquired amounted to $220.0 million after
108
fair value adjustments of $9.5 million. The cash purchase price paid in excess of the fair value of net assets acquired was equal to goodwill of $11.9 million.
Intangible assets acquired include the value of licenses, trade names, agency relationships, non-compete agreements, renewal rights, and valuation of business acquired. Intangible assets acquired included $17.1 million, which
104
are not subject to amortization, and $13.6 million that amortizes over a period of 2 to 15 years. Of the $13.6 million intangible assets acquired, $0.2$0.1 million remain to be amortized at December 31, 2019.2020.
Goodwill and other intangible assets not subject to amortization are tested for impairment annually, in the fourth quarter. As of December 31, 2019,2020, there was no0 impairment of goodwill or other intangible assets not subject to amortization.
|
|
|
|
|
|
|
|
|
|
($ in thousands) |
| Goodwill |
| Other Intangibles |
| Total | |||
December 31, 2017 |
| $ | 11,911 |
| $ | 17,338 |
| $ | 29,249 |
Amortization |
|
| — |
|
| 30 |
|
| 30 |
December 31, 2018 |
| $ | 11,911 |
| $ | 17,308 |
| $ | 29,219 |
Amortization |
|
| — |
|
| 30 |
|
| 30 |
December 31, 2019 |
| $ | 11,911 |
| $ | 17,278 |
| $ | 29,189 |
On January 14, 2021, the Company entered into an Agreement and Plan of Merger (the “Merger Agreement”) under the terms of which all outstanding shares of common stock of the Company would be acquired in an all-cash transaction valued at approximately $586.0 million. Using the market approach, the fair value of the Company was determined to be less than its carrying amount. As the difference between the Company’s carrying amount and its fair value was greater than the carrying amount of goodwill, the Company recognized an impairment charge of $11.9 million within other expense in the Company’s consolidated statements of operations for the year ended December 31, 2020 equal to the total carrying amount of goodwill. For a further discussion of the proposed merger and the Merger Agreement, see Item 1. “Business” and Note 22. “Subsequent Events” to our consolidated financial statements on this Annual Report.
| | | | | | | | | |
($ in thousands) |
| Goodwill |
| Other Intangibles |
| Total | |||
December 31, 2018 | | $ | 11,911 | | $ | 17,308 | | $ | 29,219 |
Amortization | |
| — | |
| 30 | |
| 30 |
December 31, 2019 | | $ | 11,911 | | $ | 17,278 | | $ | 29,189 |
Amortization | |
| — | |
| 30 | |
| 30 |
Impairment | | | 11,911 | | | — | | | 11,911 |
December 31, 2020 | | $ | — | | $ | 17,248 | | $ | 17,248 |
The status of the goodwill and net intangible assets is presented in the following tables:
| | | | | | | | | | | | | | |
|
| | |
| Accumulated |
| | | | |
|
| ||
($ in thousands) | | Gross | | Amortization | | Impairment | | Net | | Useful Life | ||||
December 31, 2020 |
| |
|
| |
|
| |
| | |
| |
|
Goodwill | | $ | 11,911 | | $ | — | | $ | (11,911) | | $ | — | | Indefinite |
State licenses | |
| 17,100 | |
| — | |
| — | |
| 17,100 | | Indefinite |
Other | |
| 178 | |
| (30) | |
| — | |
| 148 | | 15 years |
Net balance | | $ | 29,189 | | $ | (30) | | $ | (11,911) | | $ | 17,248 | |
|
December 31, 2019 | |
|
| |
|
| |
|
| |
|
| |
|
Goodwill | | $ | 11,911 | | $ | — | | $ | — | | $ | 11,911 | | Indefinite |
State licenses | |
| 17,100 | |
| — | |
| — | |
| 17,100 | | Indefinite |
Other | |
| 208 | |
| (30) | |
| — | |
| 178 | | Varies up to 15 years |
Net balance | | $ | 29,219 | | $ | (30) | | $ | — | | $ | 29,189 | |
|
|
|
|
|
|
|
|
|
|
|
|
|
|
|
|
|
| Accumulated |
|
|
|
|
| |
($ in thousands) |
| Gross |
| Amortization |
| Net |
| Useful Life | |||
December 31, 2019 |
|
|
|
|
|
|
|
|
|
|
|
Goodwill |
| $ | 11,911 |
| $ | — |
| $ | 11,911 |
| Indefinite |
State licenses |
|
| 17,100 |
|
| — |
|
| 17,100 |
| Indefinite |
Other |
|
| 208 |
|
| (30) |
|
| 178 |
| 15 years |
Net balance |
| $ | 29,219 |
| $ | (30) |
| $ | 29,189 |
|
|
December 31, 2018 |
|
|
|
|
|
|
|
|
|
|
|
Goodwill |
| $ | 11,911 |
| $ | — |
| $ | 11,911 |
| Indefinite |
State licenses |
|
| 17,100 |
|
| — |
|
| 17,100 |
| Indefinite |
Other |
|
| 2,452 |
|
| (2,244) |
|
| 208 |
| Varies up to 15 years |
Net balance |
| $ | 31,463 |
| $ | (2,244) |
| $ | 29,219 |
|
|
109
The estimated amortization of intangible assets for the next five years is as follows:
|
|
|
|
($ in thousands) |
|
|
|
2020 |
| $ | 30 |
2021 |
|
| 30 |
2022 |
|
| 30 |
2023 |
|
| 30 |
2024 |
|
| 30 |
|
| $ | 150 |
| | | |
($ in thousands) | | | |
2021 |
| $ | 30 |
2022 | |
| 30 |
2023 | |
| 30 |
2024 | |
| 30 |
2025 | |
| 28 |
| | $ | 148 |
6. Discontinued Operations
Prior to April 1, 2017, the Company also conducted business in the United Kingdom (“U.K.”) through certain subsidiaries of PSIH, which was incorporated in 2011 as a Bermuda holding company.
PSIH acquired several entities in the U.K. in order to build Lloyd’s Syndicate 1110 (“Syndicate”). The Company changed its strategic direction with respect to its U.K. operations and placed the Syndicate into run-off. The Company then entered into a two-phase sale transaction to exit its U.K. operations, which closed in October 2017 and March 2018. There was no0 gain or loss recognized from the sale of the U.K. operations.
105
In terms of the sale agreement, the Company will continue to meet Funds at Lloyd’s (“FAL”) obligations with respect to the Syndicate. In that regard, at December 31, 2019,2020, the Company deposited cash and securitieshas placed collateral of $10.4 million and arranged for placement $23.2$35.2 million in the form of cash, securities and Letters of Credit and securities.Credit.
As part of the Company’s exit from the insurance market in U.K., all of the Syndicate’s reinsurance of the Company’s U.S. based insurance companies was commuted, and business sourced by PSIB to the Syndicate was reinsured back to the Company’s U.S. based insurance subsidiaries via 100% quota share reinsurance provided by New York Marine.
In connection with the above sale, the Company provided Aggregate Stop Loss reinsurance protection for development of the Syndicate covered reserves for which the Company has a liability of $24.0$32.0 million and $13.3$24.0 million as of December 31, 2020 and 2019, and 2018, respectively. Additionally and also effective April 1, 2017, the Company assumed fully future and in force obligations of the Syndicate with respect to business underwritten by the Company’s U.S. based operations on Syndicate paper.
Prior to its exit from the U.K. insurance market, the Company assigned functional currencies to its foreign operations, which are generally the currencies of the local operating environment. Foreign currency amounts are remeasured to the functional currency, and the resulting foreign exchange gains or losses are reflected in earnings, except for foreign currency translation differences that arise in conjunction with the recognition of unrealized gains or losses on AFS investments which are recognized in OCI. Functional currency amounts are then translated into U.S. dollars. The foreign currency remeasurement and translation are calculated using current exchange rates for items reported in the balance sheets and average exchange rates for items recorded in earnings. The resulting foreign currency translation gain or loss during the year, is a component of OCI. A foreign transaction gain of $4.6 million was recorded for the year ended December 31, 2017. These amounts are included in the net loss from discontinued operations in the consolidated statements of operations for the year ended December 31, 2017.
Loss from discontinued operations, net of taxes in its consolidated statements of operations are comprised of the following:
|
|
|
|
|
|
|
|
|
|
|
| Years Ended December 31 | |||||||
($ in thousands) |
| 2019 |
| 2018 |
| 2017 | |||
Revenues |
|
|
|
|
|
|
|
|
|
Net earned premiums |
| $ | 611 |
| $ | 1,173 |
| $ | 49,233 |
Net investment income |
|
| 142 |
|
| 514 |
|
| 2,717 |
Realized investment gains, net |
|
| 1,267 |
|
| 830 |
|
| 14,329 |
Other income |
|
| — |
|
| 338 |
|
| — |
Total revenue |
|
| 2,020 |
|
| 2,855 |
|
| 66,279 |
|
|
|
|
|
|
|
|
|
|
Expenses |
|
|
|
|
|
|
|
|
|
Net losses and loss adjustment expenses incurred |
|
| 10,463 |
|
| 11,197 |
|
| 50,787 |
Policy acquisition expenses |
|
| 218 |
|
| 401 |
|
| 9,544 |
General and administrative expenses |
|
| 57 |
|
| (8,401) |
|
| 27,533 |
Interest expense |
|
| — |
|
| 218 |
|
| 1,648 |
Foreign exchange gains |
|
| — |
|
| — |
|
| (4,570) |
Other expense |
|
| — |
|
| — |
|
| 19,105 |
Total expenses |
|
| 10,738 |
|
| 3,415 |
|
| 104,047 |
Loss from discontinued operations before income taxes |
|
| (8,718) |
|
| (560) |
|
| (37,768) |
Income tax benefit |
|
| (2,114) |
|
| (1,374) |
|
| (679) |
Net (loss) income from discontinued operations |
| $ | (6,604) |
| $ | 814 |
| $ | (37,089) |
106110
| | | | | | | | | |
| | Years Ended December 31 | |||||||
($ in thousands) |
| 2020 |
| 2019 |
| 2018 | |||
Revenues | | | | | | | | | |
Net earned premiums | | $ | 295 |
| $ | 611 | | $ | 1,173 |
Net investment income | |
| 73 |
|
| 142 | |
| 514 |
Realized investment gains, net | |
| 1,260 |
|
| 1,267 | |
| 830 |
Other income | | | — | | | — | | | 338 |
Total revenues | |
| 1,628 |
|
| 2,020 | |
| 2,855 |
| | | | | | | | | |
Expenses | |
|
|
|
|
| |
|
|
Net losses and loss adjustment expenses incurred | |
| 8,295 |
|
| 10,463 | |
| 11,197 |
Policy acquisition expenses | |
| 93 |
|
| 218 | |
| 401 |
General and administrative expenses | |
| 823 |
|
| 57 | |
| (8,401) |
Interest expense | | | — | | | — | | | 218 |
Total expenses | |
| 9,211 |
|
| 10,738 | |
| 3,415 |
Loss from discontinued operations before income taxes | |
| (7,583) |
|
| (8,718) | |
| (560) |
Income tax benefit | |
| (2,061) |
|
| (2,114) | |
| (1,374) |
Net (loss) income from discontinued operations | | $ | (5,522) |
| $ | (6,604) | | $ | 814 |
The following represents the carrying amounts of assets and liabilities associated with the exit from the insurance market in the U.K. reported as discontinued operations in its consolidated balance sheets:
|
|
|
|
|
|
|
|
| December 31 | ||||
($ in thousands) |
| 2019 |
| 2018 | ||
Assets |
|
|
|
|
|
|
Total cash and investments |
| $ | 10,428 |
| $ | 10,436 |
Other assets |
|
| 11,156 |
|
| 9,283 |
Total assets |
| $ | 21,584 |
| $ | 19,719 |
|
|
|
|
|
|
|
Liabilities |
|
|
|
|
|
|
Unpaid losses and loss adjustment expenses |
| $ | 24,169 |
| $ | 14,030 |
Other liabilities |
|
| 7,409 |
|
| 8,226 |
Total liabilities |
| $ | 31,578 |
| $ | 22,256 |
| | | | | | |
|
| December 31 | ||||
($ in thousands) | | 2020 | | 2019 | ||
Assets | | | | | | |
Cash and investments | | $ | 10,939 | | $ | 10,428 |
Other assets | |
| 10,415 | |
| 11,156 |
Total assets | | $ | 21,354 | | $ | 21,584 |
| | | | | | |
Liabilities | |
|
| |
|
|
Reserve for unpaid losses and loss adjustment expenses | | $ | 32,414 | | $ | 24,169 |
Other liabilities | |
| 5,315 | |
| 7,409 |
Total liabilities | | $ | 37,729 | | $ | 31,578 |
7. Investments
The Company’s investment portfolio consists of fixed maturity securities, commercial levered loans, limited partnerships and limited liability companies, non-redeemable preferred stock securities, bond exchange-traded funds, and short-term investments. Fixed incomematurity securities may include U.S. Treasury securities, government agency securities, municipal debt obligations, RMBS, CMBS, CLO, ABSresidential mortgage-backed securities, commercial mortgage-backed securities, collateralized loan obligations, asset-backed securities and corporate debt securities. Corporate debt securities may include investment grade and below investment grade bonds, bank loan investments and redeemable preferred stock securities. The Company has designated its investments in fixed maturity securities as available-for-sale securities.
111
(a) A summary of the Company’s investment components is presented below:
|
|
|
|
|
|
|
|
|
|
|
|
|
| December 31 |
| ||||||||
($ in thousands) |
| 2019 |
| 2018 |
| ||||||
Fixed income securities, AFS (fair value): |
|
|
|
|
|
|
|
|
|
|
|
U.S. Treasury securities |
| $ | 49,985 |
| 2.3 | % | $ | 90,328 |
| 5.0 | % |
Government agency securities |
|
| 6,531 |
| 0.3 | % |
| - |
| ‐ | % |
Corporate debt securities |
|
| 1,338,812 |
| 61.8 | % |
| 1,192,430 |
| 66.3 | % |
Municipal debt obligations |
|
| 79,815 |
| 3.7 | % |
| 6,085 |
| 0.3 | % |
ABS |
|
| 73,582 |
| 3.4 | % |
| 83,581 |
| 4.7 | % |
CLO |
|
| 179,549 |
| 8.3 | % |
| 156,913 |
| 8.7 | % |
CMBS |
|
| 97,526 |
| 4.5 | % |
| 53,843 |
| 3.0 | % |
RMBS – non-agency |
|
| 71,610 |
| 3.3 | % |
| 79,551 |
| 4.4 | % |
RMBS – agency |
|
| 143,272 |
| 6.6 | % |
| 30,651 |
| 1.7 | % |
Total fixed income securities, AFS |
|
| 2,040,682 |
| 94.2 | % |
| 1,693,382 |
| 94.1 | % |
Short-term investments |
|
| 43,873 |
| 2.0 | % |
| 36,661 |
| 2.0 | % |
Commercial levered loans (amortized cost) |
|
| 14,069 |
| 0.7 | % |
| 16,915 |
| 0.9 | % |
Limited partnerships and limited liability companies (fair value) |
|
| 66,660 |
| 3.1 | % |
| 53,432 |
| 3.0 | % |
Total investments |
| $ | 2,165,284 |
| 100.0 | % | $ | 1,800,390 |
| 100.0 | % |
| | | | | | | | | | | |
| | December 31 | | ||||||||
($ in thousands) |
| 2020 | | 2019 | | ||||||
Fixed maturity securities, AFS (fair value): |
| | |
| |
| | |
| | |
U.S. Treasury securities | | $ | 52,157 | | 2.2 | % | $ | 49,985 | | 2.3 | % |
Government agency securities | | | 31,007 | | 1.3 | | | 6,531 | | 0.3 | |
Corporate debt securities | | | 1,397,031 | | 57.7 | | | 1,338,812 | | 61.8 | |
Municipal debt obligations | | | 207,094 | | 8.5 | | | 79,815 | | 3.7 | |
ABS | | | 55,258 | | 2.3 | | | 73,582 | | 3.4 | |
CLO | | | 139,126 | | 5.7 | | | 179,549 | | 8.3 | |
CMBS | | | 117,960 | | 4.9 | | | 97,526 | | 4.5 | |
RMBS – non-agency | | | 116,136 | | 4.8 | | | 71,610 | | 3.3 | |
RMBS – agency | | | 150,288 | | 6.2 | | | 143,272 | | 6.6 | |
Total fixed maturity securities, AFS | | | 2,266,057 | | 93.6 | | | 2,040,682 | | 94.2 | |
Short-term investments | | | 154 | | 0.0 | | | 43,873 | | 2.0 | |
Commercial levered loans (amortized cost) | | | 12,308 | | 0.5 | | | 14,069 | | 0.7 | |
Non-redeemable preferred stock securities | | | 7,049 | | 0.3 | | | — | | — | |
Bond exchange-traded funds | | | 44,882 | | 1.9 | | | — | | — | |
Limited partnerships and limited liability companies (fair value) | | | 90,468 | | 3.7 | | | 66,660 | | 3.1 | |
Total investments | | $ | 2,420,918 | | 100.0 | % | $ | 2,165,284 | | 100.0 | % |
At December 31, 2020 and 2019, 91.7% and 2018, 91.1% and 85.0% of the fair value of the Company’s fixed incomematurity portfolios were considered investment grade, respectively. The Company held approximately $181.0$187.9 million and $259.3$181.0 million in fixed incomematurity securities that were below investment grade as of December 31, 2020 and 2019, and 2018, respectively.
107112
(b) The gross unrealized gains and losses on AFSfixed maturity securities included in assets from continuing operations at December 31, 2020, are as follows:
| | | | | | | | | | | | | | | |
|
| Cost/ |
| | | Gross |
| Gross |
| | | ||||
| | Amortized | | Credit Loss | | Unrealized | | Unrealized | | Fair | |||||
($ in thousands) | | Cost | | Allowance | | Gains | | Losses | | Value | |||||
Fixed maturity securities: | | | | | | | | | | | | | | | |
U.S. Treasury securities |
| $ | 50,248 |
| $ | — | | $ | 1,909 |
| $ | — |
| $ | 52,157 |
Government agency securities | | | 30,446 | | | — | | | 561 | | | — | | | 31,007 |
Corporate debt securities |
| | 1,317,667 |
| | (598) | | | 86,447 |
| | (6,485) |
| | 1,397,031 |
Municipal debt obligations |
| | 198,773 |
| | — | | | 8,437 |
| | (116) |
| | 207,094 |
ABS |
| | 54,989 |
| | — | | | 696 |
| | (427) |
| | 55,258 |
CLO |
| | 140,615 |
| | — | | | 154 |
| | (1,643) |
| | 139,126 |
CMBS |
| | 111,313 |
| | — | | | 7,008 |
| | (361) |
| | 117,960 |
RMBS - non-agency |
| | 109,110 |
| | (859) | | | 8,619 |
| | (734) |
| | 116,136 |
RMBS - agency |
| | 146,582 |
| | — | | | 3,721 |
| | (15) |
| | 150,288 |
Total fixed maturity securities | | $ | 2,159,743 | | $ | (1,457) | | $ | 117,552 |
| $ | (9,781) | | $ | 2,266,057 |
The gross unrealized gains and losses on fixed maturity securities included in assets from continuing operations at December 31, 2019, are as follows:
|
|
|
|
|
|
|
|
|
|
|
|
| ||||||||||||
|
| Cost/ |
| Gross |
| Gross |
|
|
| |||||||||||||||
|
| Amortized |
| Unrealized |
| Unrealized |
| Fair | ||||||||||||||||
| | | | | | | | | | | | | ||||||||||||
|
| Cost/ |
| Gross |
| Gross |
| | | |||||||||||||||
| | Amortized | | Unrealized | | Unrealized | | Fair | ||||||||||||||||
($ in thousands) |
| Cost |
| Gains |
| Losses |
| Value | | Cost | | Gains | | Losses | | Value | ||||||||
Fixed income securities: |
|
|
|
|
|
|
|
|
|
|
|
| ||||||||||||
Fixed maturity securities: | | | | | | | | | | | | | ||||||||||||
U.S. Treasury securities |
| $ | 49,161 |
| $ | 838 |
| $ | (14) |
| $ | 49,985 |
| $ | 49,161 |
| $ | 838 |
| $ | (14) |
| $ | 49,985 |
Government agency securities |
|
| 6,522 |
|
| 23 |
|
| (14) |
|
| 6,531 | | | 6,522 | | | 23 | | | (14) | | | 6,531 |
Corporate debt securities |
|
| 1,308,094 |
|
| 33,743 |
|
| (3,025) |
|
| 1,338,812 |
| | 1,308,094 |
| | 33,743 |
| | (3,025) |
| | 1,338,812 |
Municipal debt obligations |
|
| 80,338 |
|
| 243 |
|
| (766) |
|
| 79,815 |
| | 80,338 |
| | 243 |
| | (766) |
| | 79,815 |
ABS |
|
| 73,068 |
|
| 854 |
|
| (340) |
|
| 73,582 |
| | 73,068 |
| | 854 |
| | (340) |
| | 73,582 |
CLO |
|
| 181,704 |
|
| 125 |
|
| (2,280) |
|
| 179,549 |
| | 181,704 |
| | 125 |
| | (2,280) |
| | 179,549 |
CMBS |
|
| 95,810 |
|
| 1,863 |
|
| (147) |
|
| 97,526 |
| | 95,810 |
| | 1,863 |
| | (147) |
| | 97,526 |
RMBS - non-agency |
|
| 62,343 |
|
| 9,458 |
|
| (191) |
|
| 71,610 |
| | 62,343 |
| | 9,458 |
| | (191) |
| | 71,610 |
RMBS - agency |
|
| 142,363 |
|
| 1,256 |
|
| (347) |
|
| 143,272 |
| | 142,363 |
| | 1,256 |
| | (347) |
| | 143,272 |
Total fixed income securities |
| $ | 1,999,403 |
| $ | 48,403 |
| $ | (7,124) |
| $ | 2,040,682 | ||||||||||||
Total fixed maturity securities | | $ | 1,999,403 |
| $ | 48,403 |
| $ | (7,124) |
| $ | 2,040,682 | ||||||||||||
The gross unrealized gains and losses on AFS securities included in assets from continuing operations at December 31, 2018, are as follows:
|
|
|
|
|
|
|
|
|
|
|
|
|
|
| Cost/ |
| Gross |
| Gross |
|
|
| |||
|
| Amortized |
| Unrealized |
| Unrealized |
| Fair | ||||
($ in thousands) |
| Cost |
| Gains |
| Losses |
| Value | ||||
Fixed income securities: |
|
|
|
|
|
|
|
|
|
|
|
|
U.S. Treasury securities |
| $ | 92,219 |
| $ | 126 |
| $ | (2,017) |
| $ | 90,328 |
Corporate debt securities |
|
| 1,231,352 |
|
| 1,216 |
|
| (40,138) |
|
| 1,192,430 |
Municipal debt obligations |
|
| 6,238 |
|
| — |
|
| (153) |
|
| 6,085 |
ABS |
|
| 82,603 |
|
| 1,095 |
|
| (117) |
|
| 83,581 |
CLO |
|
| 161,421 |
|
| 160 |
|
| (4,668) |
|
| 156,913 |
CMBS |
|
| 55,980 |
|
| — |
|
| (2,137) |
|
| 53,843 |
RMBS - non-agency |
|
| 68,594 |
|
| 11,078 |
|
| (121) |
|
| 79,551 |
RMBS - agency |
|
| 31,348 |
|
| — |
|
| (697) |
|
| 30,651 |
Total fixed income securities |
| $ | 1,729,755 |
| $ | 13,675 |
| $ | (50,048) |
| $ | 1,693,382 |
108113
(c) The following table summarizes allthe fair values and gross unrealized losses for fixed maturity securities in an unrealized loss position at December 31, 2020, grouped by asset class and by duration of time in a continuous unrealized loss position:
| | | | | | | | | | | | | | | | | | |
| | Less Than 12 Months | | Greater Than 12 Months | | Total | ||||||||||||
|
| | |
| | |
| | |
| | |
| | |
| Total | |
| | Fair | | Unrealized | | Fair | | Unrealized | | Total | | Unrealized | ||||||
($ in thousands) | | Value | | Losses | | Value | | Losses | | Fair Value | | Losses | ||||||
Corporate debt securities |
| $ | 36,450 | | $ | (740) |
| $ | 101,628 |
| $ | (5,745) |
| $ | 138,078 |
| $ | (6,485) |
Municipal debt obligations |
| | 12,211 | |
| (73) |
| | 3,344 |
| | (43) |
| | 15,555 |
| | (116) |
ABS |
| | 9,121 | |
| (364) |
| | 9,461 |
| | (63) |
| | 18,582 |
| | (427) |
CLO |
| | 29,909 | |
| (215) |
| | 82,758 |
| | (1,428) |
| | 112,667 |
| | (1,643) |
CMBS |
| | 17,559 | |
| (348) |
| | 800 |
| | (13) |
| | 18,359 |
| | (361) |
RMBS - non-agency |
| | 11,759 | |
| (249) |
| | 6,723 |
| | (485) |
| | 18,482 |
| | (734) |
RMBS - agency |
| | 2,467 | |
| (15) |
| | — |
| | — |
| | 2,467 |
| | (15) |
Total fixed maturity securities |
| $ | 119,476 | | $ | (2,004) | | $ | 204,714 | | $ | (7,777) | | $ | 324,190 | | $ | (9,781) |
The following table summarizes the fair values and gross unrealized losses for fixed maturity securities in an unrealized loss position at December 31, 2019, the fair value and gross unrealized lossgrouped by asset class and by lengthduration of time those securities have been in a continuous unrealized loss position:
|
|
|
|
|
|
|
|
|
|
|
|
|
|
|
|
|
|
| ||||||||||||||||||
|
| Less Than 12 Months |
| Greater Than 12 Months |
| Total | ||||||||||||||||||||||||||||||
|
|
|
|
|
|
|
|
|
|
|
|
|
|
|
|
| Total | |||||||||||||||||||
|
| Fair |
| Unrealized |
| Fair |
| Unrealized |
| Total |
| Unrealized | ||||||||||||||||||||||||
| | | | | | | | | | | | | | | | | | | ||||||||||||||||||
| | Less Than 12 Months | | Greater Than 12 Months | | Total | ||||||||||||||||||||||||||||||
|
| | |
| | |
| | |
| | |
| | |
| Total | |||||||||||||||||||
| | Fair | | Unrealized | | Fair | | Unrealized | | Total | | Unrealized | ||||||||||||||||||||||||
($ in thousands) |
| Value |
| Losses |
| Value |
| Losses |
| Fair Value |
| Losses | | Value | | Losses | | Value | | Losses | | Fair Value | | Losses | ||||||||||||
U.S. Treasury securities |
| $ | — |
| $ | — |
| $ | 7,469 |
| $ | (14) |
| $ | 7,469 |
| $ | (14) | | $ | — | | $ | — |
| $ | 7,469 |
| $ | (14) |
| $ | 7,469 |
| $ | (14) |
Government agency securities |
|
| 3,192 |
|
| (14) |
|
| — |
|
| — |
|
| 3,192 |
|
| (14) | | | 3,192 | | | (14) | | | — | | | — | | | 3,192 |
| | (14) |
Corporate debt securities |
|
| 133,341 |
|
| (2,509) |
|
| 50,695 |
|
| (516) |
|
| 184,036 |
|
| (3,025) | |
| 133,341 | |
| (2,509) |
| | 50,695 |
| | (516) |
| | 184,036 |
| | (3,025) |
Municipal debt obligations |
|
| 66,355 |
|
| (766) |
|
| — |
|
| — |
|
| 66,355 |
|
| (766) | |
| 66,355 | |
| (766) |
| | — |
| | — |
| | 66,355 |
| | (766) |
ABS |
|
| 27,884 |
|
| (175) |
|
| 11,165 |
|
| (165) |
|
| 39,049 |
|
| (340) | |
| 27,884 | |
| (175) |
| | 11,165 |
| | (165) |
| | 39,049 |
| | (340) |
CLO |
|
| 28,485 |
|
| (338) |
|
| 110,825 |
|
| (1,942) |
|
| 139,310 |
|
| (2,280) | |
| 28,485 | |
| (338) |
| | 110,825 |
| | (1,942) |
| | 139,310 |
| | (2,280) |
CMBS |
|
| 18,307 |
|
| (102) |
|
| 6,053 |
|
| (45) |
|
| 24,360 |
|
| (147) | |
| 18,307 | |
| (102) |
| | 6,053 |
| | (45) |
| | 24,360 |
| | (147) |
RMBS - non-agency |
|
| 2,173 |
|
| (14) |
|
| 2,418 |
|
| (177) |
|
| 4,591 |
|
| (191) | |
| 2,173 | |
| (14) |
| | 2,418 |
| | (177) |
| | 4,591 |
| | (191) |
RMBS - agency |
|
| 10,450 |
|
| (12) |
|
| 12,367 |
|
| (335) |
|
| 22,817 |
|
| (347) | |
| 10,450 | |
| (12) |
| | 12,367 |
| | (335) |
| | 22,817 |
| | (347) |
Total |
| $ | 290,187 |
| $ | (3,930) |
| $ | 200,992 |
| $ | (3,194) |
| $ | 491,179 |
| $ | (7,124) | ||||||||||||||||||
Total fixed maturity securities | | $ | 290,187 | | $ | (3,930) | | $ | 200,992 | | $ | (3,194) | | $ | 491,179 | | $ | (7,124) | ||||||||||||||||||
The following table summarizes all securities in an unrealized loss position at December 31, 2018, the fair value and gross unrealized loss by asset class and by length of time those securities have been in a loss position:
|
|
|
|
|
|
|
|
|
|
|
|
|
|
|
|
|
|
|
|
| Less Than 12 Months |
| Greater Than 12 Months |
| Total | ||||||||||||
|
|
|
|
|
|
|
|
|
|
|
|
|
|
|
|
| Total | |
|
| Fair |
| Unrealized |
| Fair |
| Unrealized |
| Total |
| Unrealized | ||||||
($ in thousands) |
| Value |
| Losses |
| Value |
| Losses |
| Fair Value |
| Losses | ||||||
U.S. Treasury securities |
| $ | 8,263 |
| $ | (82) |
| $ | 69,727 |
| $ | (1,935) |
| $ | 77,990 |
| $ | (2,017) |
Corporate debt securities |
|
| 393,931 |
|
| (10,241) |
|
| 710,482 |
|
| (29,897) |
|
| 1,104,413 |
|
| (40,138) |
Municipal debt obligations |
|
| — |
|
| — |
|
| 6,085 |
|
| (153) |
|
| 6,085 |
|
| (153) |
ABS |
|
| 25,258 |
|
| (61) |
|
| 4,249 |
|
| (56) |
|
| 29,507 |
|
| (117) |
CLO |
|
| 146,004 |
|
| (4,668) |
|
| — |
|
| — |
|
| 146,004 |
|
| (4,668) |
CMBS |
|
| — |
|
| — |
|
| 53,843 |
|
| (2,137) |
|
| 53,843 |
|
| (2,137) |
RMBS - non-agency |
|
| 529 |
|
| (13) |
|
| 2,449 |
|
| (108) |
|
| 2,978 |
|
| (121) |
RMBS - agency |
|
| 27,150 |
|
| (513) |
|
| 3,502 |
|
| (184) |
|
| 30,652 |
|
| (697) |
Total |
| $ | 601,135 |
| $ | (15,578) |
| $ | 850,337 |
| $ | (34,470) |
| $ | 1,451,472 |
| $ | (50,048) |
(d) The Company was holding 212 and 313 and 708 fixed incomematurity securities that were in an unrealized loss position at December 31, 20192020 and 2018,2019, respectively. The Company believes these unrealized losses are temporary, as they resulted from changes in market conditions, including interest rates or sector spreads, and aredoes not considered to be credit risk related. OTTI charges are recognized as a realized loss to the extent that they are credit related, unless the Company has the intentintend to sell the security orinvestments and it is more-likely-thannot more likely than not that the Company will be required to sell the security. In those circumstances,investments before recovery of their amortized cost bases, which may be maturity.
The Company analyzes fixed maturity securities in an unrealized loss position for credit losses if they meet the following criteria: (i) they are trading in a significant loss position, (ii) failure of the issuer of the security is written down to fairmake scheduled interest or principal payments, (iii) there have been negative credit events with respect to the issuer, or (iv) there have been negative current events surrounding an issuer or the environment in which an issuer operates.
For fixed maturity securities in an unrealized loss position that require a credit loss analysis, the Company estimates a present value withof expected cash flows. If the entireresults of the cash flow analysis indicate that the Company will not recover the full amount of its amortized cost basis, the write-down chargedCompany records a credit loss for the excess of amortized cost over the present value of expected cash flows, not to earnings as a componentexceed the unrealized loss. Changes in the credit loss allowance are
114
recognized through realized losses.investment gains, net on the consolidated statements of operations. The Company did not record any OTTI chargescredit loss allowance expense for fixed maturity securities was $1.5 million for the year ended December 31, 2019 and $1.5 million2020.
The following table is a rollforward of OTTI chargesthe credit loss allowance for the year ended December 31, 2018, respectively, in the consolidated statements of operations.fixed maturity securities:
(d)
| | | | | | | | | | | | | | | | | | |
| | December 31, | | Additions | | Reduction | | Reduction | | Change in Securities | | December 31, | ||||||
($ in thousands) | | 2019 | | New Securities | | Sales | | Intent to Sell | | with Previous Allowance | | 2020 | ||||||
Fixed maturity securities: | | | | | | | | | | | | | | | | | | |
Corporate debt securities |
| $ | — |
| $ | 1,166 |
| $ | (121) | | $ | — | | $ | (447) | | $ | 598 |
ABS |
| | — |
| | 180 |
| | (3) | | | — | | | (177) | | | — |
CLO | | | — |
| | 6 |
| | — | | | — | | | (6) | | | — |
RMBS - non-agency | | | — | | | 1,151 | | | (111) | | | — | | | (181) | | | 859 |
Total fixed maturity securities allowance |
| $ | — |
| $ | 2,503 |
| $ | (235) | | $ | — | | $ | (811) | | $ | 1,457 |
(e) The amortized cost and fair value of fixed incomematurity securities, which excludes the Company’s structured securities portfolio, at December 31, 2019,2020, by contractual maturity are shown below. Expected maturities will differ
109
from contractual maturities, because borrowers may have the right to call or prepay obligations with or without call or prepayment penalties.
|
|
|
|
|
|
|
|
| December 31, 2019 | ||||
|
| Amortized |
| Fair | ||
($ in thousands) |
| Cost |
| Value | ||
Due in one year or less |
| $ | 99,035 |
| $ | 99,326 |
Due after one through five years |
|
| 679,649 |
|
| 692,219 |
Due after five through ten years |
|
| 507,803 |
|
| 523,276 |
Due after ten years |
|
| 157,628 |
|
| 160,322 |
|
|
| 1,444,115 |
|
| 1,475,143 |
Structured securities: |
|
|
|
|
|
|
ABS |
|
| 73,068 |
|
| 73,582 |
CLO |
|
| 181,704 |
|
| 179,549 |
CMBS |
|
| 95,810 |
|
| 97,526 |
RMBS - non-agency |
|
| 62,343 |
|
| 71,610 |
RMBS - agency |
|
| 142,363 |
|
| 143,272 |
Totals |
| $ | 1,999,403 |
| $ | 2,040,682 |
| | | | | | |
| | December 31, 2020 | ||||
| | Amortized | | Fair | ||
($ in thousands) |
| Cost |
| Value | ||
Due in one year or less | | $ | 103,243 |
| $ | 104,316 |
Due after one through five years | |
| 628,897 |
|
| 657,996 |
Due after five through ten years | |
| 522,749 |
|
| 561,775 |
Due after ten years | |
| 311,799 |
|
| 332,195 |
| |
| 1,566,688 |
|
| 1,656,282 |
Structured securities: | |
| | | | |
Government agency securities | | | 30,446 | | | 31,007 |
ABS | |
| 54,989 |
|
| 55,258 |
CLO | |
| 140,615 |
|
| 139,126 |
CMBS | |
| 111,313 |
|
| 117,960 |
RMBS - non-agency | |
| 109,110 |
|
| 116,136 |
RMBS - agency | |
| 146,582 |
|
| 150,288 |
Total fixed maturity securities | | $ | 2,159,743 |
| $ | 2,266,057 |
The Company did not have any non-income producing fixed incomematurity investments for the years ended December 31, 20192020 or 2018,2019, respectively.
(e)(f) The Company elected to account forrecords its investments in limited partnership and limited liability companies using net asset value, which the Company has determined to be the best indicator of fair value for these investments. At December 31, 2020 and 2019, the fair value of limited partnerships and limited liability companies was $90.5 million and $66.7 million, and $53.4 million at December 31, 2019 and 2018, respectively, at fair value.respectively. Changes in fair value of such investments are recorded in the consolidated statements of operations within net investment income. The largest investment within the portfolio is the Pacific Investment Management Company LLC Tactical Opportunities fund, which is carried at $36.6$46.6 million at December 31, 2019.2020.
The carrying values used for investmentinvestments in limited partnerships and limited liability companies generally are established on the basis of the current valuations provided monthly or quarterly by the managers of such investments. These valuations are determined based upon the valuation criteria established by the governing documents of such investments or utilized in
115
the normal course of such manager’s business, which are reflective of fair value. Such valuations may differ significantly from the values that would have been used had available markets for these investments existed and the differences could be material.
The Company’s strategies for its investments in limited partnerships and limited liability companies include investmentsinvestment funds that employ diverse and fundamentally driven approachapproaches to investing which includesinclude effective risk management, hedging strategies and leverage. The portfolio of investments in limited partnerships and limited liability companies consists of common stocks, real estate assets, options, swaps, derivative instruments and other structured products.
The limited partnerships and limited liability companies in which the Company invests sometimes impose limitations on the timing of withdrawals from the funds. The Company’s inability to withdraw its investment quickly from a particular limited partnership or a limited liability company that is performing poorly could result in losses and may affect liquidity. All of the Company’s limited partnerships and limited liability companies have timing limitations. Most limited partnerships and limited liability companies require a 90‑day90-day notice period in order to withdraw funds. Some limited partnerships and limited liability companies may require a withdrawal only at the end of their fiscal year. The Company may also be subject to withdrawal fees in the event the limited partnerships and limited liability companies is sold within a minimum holding period, which may be up to one year. Many limited partnerships and limited liability companies have invoked gated provisions that allow the fund to disperse redemption proceeds to
110
investors over an extended period. The Company is subject to such restrictions, which may delay the receipt of proceeds from limited partnerships and limited liability companies.
(f)(g) The Company invests in commercial loans, which are private placements. Loans are reported at the principal amount outstanding, reduced by unearned discounts, net deferred loan fees, and an allowance for loan losses.credit losses on loans. Interest on loans is calculated using the simple interest method on the daily principal amount outstanding. TheThere was 0 allowance for loancredit losses related to impairedon loans is determined based on the difference of the carrying value of loans and the present value of expected cash flows discounted at the loan’s effective interest rate or, as a practical expedient, the loan’s observable market price. There was no allowance for loan losses at December 31, 20192020 and 2018,2019, respectively.
(g)(h) Proceeds from sales and redemptions in AFS securities totaled $558.7 million, $302.9 million $255.2 million and $977.0$255.2 million for the years ended December 31, 2020, 2019 2018 and 20172018 respectively. Gross realized gains from sales and redemptions in AFS securities totaled $7.3 million, $1.4 million, $0.6 million, and $5.8$0.6 million for the years ended December 31, 2020, 2019 2018 and 2017,2018, respectively. Gross realized losses from sales and redemptions of AFS investments totaled $0.9 million, $0.7 million $2.2 million and $1.6$2.2 million for the years ended December 31, 2020, 2019 2018 and 2017,2018, respectively.
(h)(i) Net investment income included in net income (loss) from continuing operations in the consolidated statements of operations from each major category of investments for the years ended December 31, 2020, 2019 2018 and 2017,2018, is as follows:
|
|
|
|
|
|
|
|
|
|
($ in thousands) |
| 2019 |
| 2018 |
| 2017 | |||
Fixed income securities |
| $ | 66,975 |
| $ | 55,765 |
| $ | 33,467 |
Commercial levered loans |
|
| 765 |
|
| 1,114 |
|
| 1,153 |
Net limited partnerships gains |
|
| 3,101 |
|
| 1,081 |
|
| 3,240 |
Other |
|
| 358 |
|
| 176 |
|
| 216 |
Total investment income |
|
| 71,199 |
|
| 58,136 |
|
| 38,076 |
Less: investment income attributable to funds withheld liabilities |
|
| (655) |
|
| (912) |
|
| — |
Less: expenses |
|
| (1,647) |
|
| (1,253) |
|
| (1,880) |
Net investment income |
| $ | 68,897 |
| $ | 55,971 |
| $ | 36,196 |
| | | | | | | | | |
($ in thousands) |
| 2020 |
| 2019 |
| 2018 | |||
Fixed maturity securities |
| $ | 62,621 |
| $ | 66,975 | | $ | 55,765 |
Net limited partnerships and limited liability companies gains |
| | 11,690 |
| | 3,101 | | | 1,081 |
Other |
| | 2,173 |
| | 1,123 | | | 1,290 |
Gross investment income |
| | 76,484 |
| | 71,199 | | | 58,136 |
Less: investment income attributable to funds withheld liabilities | | | (250) | | | (655) | | | (912) |
Less: expenses |
| | (3,213) |
| | (1,647) | | | (1,253) |
Net investment income | | $ | 73,021 |
| $ | 68,897 | | $ | 55,971 |
(i)(j) Included in investments at December 31, 20192020 and 2018,2019, are securities required to be held by the Company (or those that are on deposit) with various regulatory authorities as required by law with a fair value of $233.4 million and $210.8 million, respectively. Fair value and $188.6carrying value of assets in the amount of $256.4 million respectively.and $241.0 million,
116
respectively, were on deposit in collateral agreements at December 31, 2020. Fair value and carrying value of assets in the amount of $367.1 million and $352.0 million, respectively, were on deposit in collateral agreements at December 31, 2019. Fair value and carrying value of assets in the amount of $358.5 million and $368.0 million, respectively, were on deposit in collateral agreements at December 31, 2018.
(j)(k) The investment portfolio has exposure to market risks, which include the effect of adverse changes in interest rates, credit quality, limited partnership value and illiquid securities, including commercial loan values, on the portfolio. Interest rate risk includes the changes in the fair value of fixed maturities based upon changes in interest rates. Credit quality risk includes the risk of default by issuers of debt securities. Risks from investments in limited partnerships and limited liability companies and illiquid securities risks include the potential loss from the diminution in the value of the underlying investment of the limited partnerships and limited liability companies and the potential loss from changes in the fair value of commercial loans.
(l) Non-redeemable preferred stock securities with readily determinable fair values are recorded at fair value. Changes in fair value of such investments are recorded in the consolidated statements of operations within net investment income.
The change in fair value recognized in income on non-redeemable preferred stock securities for the year ended December 31, 2020 was a gain of $0.4 million. The gain consisted of an unrealized gain on non-redeemable preferred stock securities of $0.5 million and a loss recognized on the sale of non-redeemable preferred stock securities of $0.1 million.
(m) Bond exchange-traded funds with readily determinable fair values are recorded at fair value. Changes in fair value of such investments are recorded in the consolidated statements of operations within net investment income.
The change in fair value recognized in income on bond exchange-traded funds for the year ended December 31, 2020 was a gain of $0.1 million. The gain consisted of an unrealized gain on bond exchange-traded funds securities of $0.2 million and a loss recognized on the sale of bond exchange-traded funds of $0.1 million.
8. Fair Value Measurements
The Company has established a framework for valuing financial assets and financial liabilities. The framework is based on a hierarchy of inputs used in valuation and gives the highest priority to quoted prices in active markets and
111
requires that observable inputs be used in the valuations when available. The disclosure of fair value estimates in the hierarchy is based on whether the significant inputs into the valuation are observable. In determining the level of the hierarchy in which the estimate is disclosed, the highest priority is given to unadjusted quoted prices in active markets and the lowest priority to unobservable inputs that reflect the Company’s significant market assumptions. The standard describes three levels of inputs that may be used to measure fair value and categorize the assets and liabilities within the hierarchy:
Level 1 — Fair value is based on unadjusted quoted prices in active markets that are accessible to the Company for identical assets or liabilities. These prices generally provide the most reliable evidence and are used to measure fair value whenever available. Active markets are defined as having the following for the measured asset/liability: (i) many transactions, (ii) current prices, (iii) price quotes not varying substantially among market makers, (iv) narrow bid/ask spreads and (v) most information publicly available.
As of December 31, 2019 and 2018, the Company does not hold anyThe Company’s Level 1 securities.assets include bond exchange-traded funds.
Level 2 — Fair value is based on significant inputs, other than Level 1 inputs, that are observable for the asset or liability, either directly or indirectly, for substantially the full term of the asset through corroboration with observable market data. Level 2 inputs include quoted market prices in active markets for similar assets,
117
nonbinding quotes in markets that are not active for identical or similar assets and other market observable inputs (e.g., interest rates, yield curves, prepayment speeds, default rates, loss severities, etc.).
The Company’s Level 2 assets include U.S. Treasury securities, government agency securities, municipal debt obligations, RMBS, CMBS, CLO, ABS, and corporate debt securities, and non-redeemable preferred stock securities.
The Company generally obtains valuations from third-party pricing services and/or security dealers for identical or comparable assets or liabilities by obtaining nonbinding broker quotes (when pricing service information is not available) in order to determine an estimate of fair value. The Company bases all of its estimates of fair value for assets on the bid price as it represents what a third-party market participant would be willing to pay in an arm’s-length transaction.
Level 3 — Fair value is based on at least one or more significant unobservable inputs that are supported by little or no market activity for the asset. These inputs reflect the Company’s understanding about the assumptions market participants would use in pricing the asset or liability.
The Company’s Level 3 assets include its investments in certain corporate debt securities, certain non-redeemable preferred stock securities and commercial levered loans as they are illiquid and trade in inactive markets. These markets are considered inactive as a result of the low level of trades of such investments. Commercial levered loans are also not considered within the Level 3 tabular disclosure, because they are in the “held for investment” category and are also not measured at fair value on a recurring basis.
The corporate debt securities and non-redeemable preferred stock securities classified under Level 3 in the fair value hierarchy are either provided to the Company by an independent valuation service provider which use bothor calculated by the Company. For certain securities, the Company uses observable and unobservable inputs such as readily available indices as well as change in the calculation of fair value.estimated fund returns provided by third party investment managers. Unobservable inputs, significant to the measurement and valuation of the corporate debt securities are assumptions about prepayment speed, default rates and reinvestment parameters.recovery rates. Significant changes to any of these inputs, or combination of inputs, could significantly change the fair value measurement for these securities when using the income approach.
The primary pricing sources for the Company’s investments in commercial levered loans are reviewed for reasonableness, based on the Company’s understanding of the respective market. Prices may then be determined using
118
valuation methodologies such as discounted cash flow models, as well as matrix pricing analyses performed on nonbinding quotes from brokers or other market makers.
112
The following are the major categories of assets measured at fair value on a recurring basis at December 31, 20192020 and 2018,2019, using quoted prices in active markets for identical assets (Level 1), significant other observable inputs (Level 2), and significant unobservable inputs (Level 3):
|
|
|
|
|
|
|
|
|
|
|
|
|
|
| December 31, 2019 | ||||||||||
|
|
|
| Significant |
|
|
|
|
|
| ||
|
| Quoted Prices in |
| Other |
| Significant |
|
|
| |||
|
| Active Markets for |
| Observable |
| Unobservable |
|
|
| |||
|
| Identical Assets |
| Inputs |
| Inputs |
|
|
| |||
($ in thousands) |
| (Level 1) |
| (Level 2) |
| (Level 3) |
| Total | ||||
Fixed income securities: |
|
|
|
|
|
|
|
|
|
|
|
|
U.S. Treasury securities |
| $ | — |
| $ | 49,985 |
| $ | — |
| $ | 49,985 |
Government agency securities |
|
| — |
|
| 6,531 |
|
| — |
|
| 6,531 |
Corporate debt securities |
|
| — |
|
| 1,189,181 |
|
| 149,631 |
|
| 1,338,812 |
Municipal debt obligations |
|
| — |
|
| 79,815 |
|
| — |
|
| 79,815 |
ABS |
|
| — |
|
| 73,582 |
|
| — |
|
| 73,582 |
CLO |
|
| — |
|
| 179,549 |
|
| — |
|
| 179,549 |
CMBS |
|
| — |
|
| 97,526 |
|
| — |
|
| 97,526 |
RMBS - non agency |
|
| — |
|
| 71,610 |
|
| — |
|
| 71,610 |
RMBS - agency |
|
| — |
|
| 143,272 |
|
| — |
|
| 143,272 |
Total fixed income securities |
| $ | — |
| $ | 1,891,051 |
| $ | 149,631 |
|
| 2,040,682 |
|
|
|
|
|
|
|
|
|
|
|
|
|
Investments measured at net asset value: |
|
|
|
|
|
|
|
|
|
|
|
|
Limited partnerships and limited liability companies |
|
|
|
|
|
|
|
|
|
|
| 66,660 |
Total assets at fair value |
|
|
|
|
|
|
|
|
|
| $ | 2,107,342 |
|
|
|
|
|
|
|
|
|
|
|
|
| ||||||||||||
|
| December 31, 2018 | ||||||||||||||||||||||
|
|
|
| Significant |
|
|
|
|
|
| ||||||||||||||
|
| Quoted Prices in |
| Other |
| Significant |
|
|
| |||||||||||||||
|
| Active Markets for |
| Observable |
| Unobservable |
|
|
| |||||||||||||||
|
| Identical Assets |
| Inputs |
| Inputs |
|
|
| |||||||||||||||
| | | | | | | | | | | | | ||||||||||||
| | December 31, 2020 | ||||||||||||||||||||||
| | | | Significant | | | | | | | ||||||||||||||
| | Quoted Prices in | | Other | | Significant | | | | |||||||||||||||
| | Active Markets for | | Observable | | Unobservable | | | | |||||||||||||||
| | Identical Assets | | Inputs | | Inputs | | | | |||||||||||||||
($ in thousands) |
| (Level 1) |
| (Level 2) |
| (Level 3) |
| Total |
| (Level 1) |
| (Level 2) |
| (Level 3) |
| Total | ||||||||
Fixed income securities: |
|
|
|
|
|
|
|
|
|
|
|
| ||||||||||||
Fixed maturity securities: |
| |
|
| |
|
| |
|
| |
| ||||||||||||
U.S. Treasury securities |
| $ | — |
| $ | 90,328 |
| $ | — |
| $ | 90,328 | | $ | — |
| $ | 52,157 |
| $ | — |
| $ | 52,157 |
Government agency securities | | | — | | | 31,007 | | | — | | | 31,007 | ||||||||||||
Corporate debt securities |
|
| — |
|
| 1,065,933 |
|
| 126,497 |
|
| 1,192,430 | |
| — |
| | 1,139,066 |
| | 257,965 |
| | 1,397,031 |
Municipal debt obligations |
|
| — |
|
| 6,085 |
|
| — |
|
| 6,085 | |
| — |
| | 207,094 |
| | — |
| | 207,094 |
ABS |
|
| — |
|
| 83,581 |
|
| — |
|
| 83,581 | |
| — |
| | 55,258 |
| | — |
| | 55,258 |
CLO |
|
| — |
|
| 156,913 |
|
| — |
|
| 156,913 | |
| — |
| | 139,126 |
| | — |
| | 139,126 |
CMBS |
|
| — |
|
| 53,843 |
|
| — |
|
| 53,843 | |
| — |
| | 117,960 |
| | — |
| | 117,960 |
RMBS - non agency |
|
| — |
|
| 79,551 |
|
| — |
|
| 79,551 | |
| — |
| | 116,136 |
| | — |
| | 116,136 |
RMBS - agency |
|
| — |
|
| 30,651 |
|
| — |
|
| 30,651 | |
| — |
| | 150,288 |
| | — |
| | 150,288 |
Total fixed income securities |
| $ | — |
| $ | 1,566,885 |
| $ | 126,497 |
|
| 1,693,382 | ||||||||||||
|
|
|
|
|
|
|
|
|
|
|
|
| ||||||||||||
Total fixed maturity securities | | | — |
| | 2,008,092 |
| | 257,965 |
| | 2,266,057 | ||||||||||||
Non-redeemable preferred stock securities | | | — |
| | 5,649 |
| | 1,400 |
| | 7,049 | ||||||||||||
Bond exchange-traded funds | | | 44,882 |
| | — |
| | — |
| | 44,882 | ||||||||||||
Total categorized | | $ | 44,882 | | $ | 2,013,741 | | $ | 259,365 | | | 2,317,988 | ||||||||||||
| | | | | | | | | | | | | ||||||||||||
Investments measured at net asset value: |
|
|
|
|
|
|
|
|
|
|
|
| |
|
|
| |
|
| |
|
| |
|
Limited partnerships and limited liability companies |
|
|
|
|
|
|
|
|
|
|
| 53,432 | |
| | | | | | | |
| | 90,468 |
Total assets at fair value |
|
|
|
|
|
|
|
|
|
| $ | 1,746,814 | ||||||||||||
Total of invested assets carried at fair value | |
| | | | | | | |
| $ | 2,408,456 | ||||||||||||
There were no transfers between Levels 1 and 2 for the years ended December 31, 2019 and 2018.
In 2018, securities in the amount of $126.5 million were transferred from Level 2 into Level 3 as it was determined that these securities trade in inactive markets.
113119
| | | | | | | | | | | | |
| | December 31, 2019 | ||||||||||
| | | | Significant | | | | | | | ||
| | Quoted Prices in | | Other | | Significant | | | | |||
| | Active Markets for | | Observable | | Unobservable | | | | |||
| | Identical Assets | | Inputs | | Inputs | | | | |||
($ in thousands) |
| (Level 1) |
| (Level 2) |
| (Level 3) |
| Total | ||||
Fixed maturity securities: | | | | | | | | | | | | |
U.S. Treasury securities | | $ | — |
| $ | 49,985 |
| $ | — |
| $ | 49,985 |
Government agency securities | | | — | | | 6,531 | | | — | | | 6,531 |
Corporate debt securities | |
| — |
| | 1,189,181 |
| | 149,631 | | | 1,338,812 |
Municipal debt obligations | |
| — |
| | 79,815 |
| | — |
| | 79,815 |
ABS | |
| — |
| | 73,582 |
| | — |
| | 73,582 |
CLO | |
| — |
| | 179,549 |
| | — |
| | 179,549 |
CMBS | |
| — |
| | 97,526 |
| | — |
| | 97,526 |
RMBS - non agency | |
| — |
| | 71,610 |
| | — |
| | 71,610 |
RMBS - agency | |
| — |
| | 143,272 |
| | — |
| | 143,272 |
Total categorized | | $ | — |
| $ | 1,891,051 |
| $ | 149,631 |
| | 2,040,682 |
| | | | | | | | | | | | |
Investments measured at net asset value: | |
| | | | | | | | | | |
Limited partnerships and limited liability companies | | |
|
| |
|
| |
|
| | 66,660 |
Total of invested assets carried at fair value | | | | | | | | | |
| $ | 2,107,342 |
Management believes that the use of the fair value option as specified in Accounting Standards Codification No. 825, Financial Instruments (ASC 825) to record limited partnerships is consistent with its objective for such investments. As such, the entire limited partnership portfolio of $66.7 million and $53.4 million at December 31, 2019 and 2018, was recorded using net asset value, which the Company has determined to be the best indicator of fair value for these investments.
The following tables disclose the carrying value and fair value of financial instruments that are not recognized or are not carried at fair value in the consolidated balance sheets as of December 31, 20192020 and 2018:
|
|
|
|
|
|
|
|
|
|
|
|
|
|
|
|
|
| December 31, 2019 | |||||||||||||
|
| Carrying |
| Fair Value | |||||||||||
($ in thousands) |
| Value |
| Total |
| Level 1 |
| Level 2 |
| Level 3 | |||||
Assets |
|
|
|
|
|
|
|
|
|
|
|
|
|
|
|
Commercial levered loans |
| $ | 14,069 |
| $ | 13,950 |
| $ | — |
| $ | — |
| $ | 13,950 |
|
|
|
|
|
|
|
|
|
|
|
|
|
|
|
|
Liabilities |
|
|
|
|
|
|
|
|
|
|
|
|
|
|
|
Notes payable |
|
| 165,000 |
|
| 167,507 |
|
| — |
|
| 167,507 |
|
| — |
Unamortized debt issuance costs |
|
| (307) |
|
|
|
|
|
|
|
|
|
|
|
|
Total notes payable |
| $ | 164,693 |
|
|
|
|
|
|
|
|
|
|
|
|
|
|
|
|
|
|
|
|
|
|
|
|
|
|
|
|
|
| December 31, 2018 | |||||||||||||
|
| Carrying |
| Fair Value | |||||||||||
($ in thousands) |
| Value |
| Total |
| Level 1 |
| Level 2 |
| Level 3 | |||||
Assets |
|
|
|
|
|
|
|
|
|
|
|
|
|
|
|
Commercial levered loans |
| $ | 16,915 |
| $ | 15,858 |
| $ | — |
| $ | — |
| $ | 15,858 |
|
|
|
|
|
|
|
|
|
|
|
|
|
|
|
|
Liabilities |
|
|
|
|
|
|
|
|
|
|
|
|
|
|
|
Notes payable |
|
| 183,000 |
|
| 183,999 |
|
| — |
|
| 183,999 |
|
| — |
Unamortized debt issuance costs |
|
| (645) |
|
|
|
|
|
|
|
|
|
|
|
|
Total notes payable |
| $ | 182,355 |
|
|
|
|
|
|
|
|
|
|
|
|
2019:
| | | | | | | | | | | | | | | |
| | December 31, 2020 | |||||||||||||
| | Carrying | | Fair Value | |||||||||||
($ in thousands) |
| Value |
| Total |
| Level 1 |
| Level 2 |
| Level 3 | |||||
Assets |
| |
|
| |
|
| |
|
| |
|
| |
|
Commercial levered loans | | $ | 12,308 |
| $ | 12,180 |
| $ | — |
| $ | — |
| $ | 12,180 |
| | | | | | | | | | | | | | | |
Liabilities | |
|
|
| |
|
| |
|
| |
|
| |
|
Notes payable | |
| 207,000 |
| | 207,537 |
| | — |
| | 207,537 |
| | — |
Unamortized debt issuance costs | |
| (3,733) |
| | | | | | | | | | | |
Notes payable, net of debt issuance costs | | $ | 203,267 |
| | | | | | | | | | | |
| | | | | | | | | | | | | | | |
Secured loan payable | |
| 22,750 |
| | 23,265 |
| | — |
| | 23,265 |
| | — |
Unamortized debt issuance costs | |
| (82) |
| | | | | | | | | | | |
Secured loan payable, net of debt issuance costs | | $ | 22,668 |
| | | | | | | | | | | |
| | | | | | | | | | | | | | | |
| | December 31, 2019 | |||||||||||||
| | Carrying | | Fair Value | |||||||||||
($ in thousands) |
| Value |
| Total |
| Level 1 |
| Level 2 |
| Level 3 | |||||
Assets |
| |
|
| |
|
| |
|
| |
|
| |
|
Commercial levered loans | | $ | 14,069 |
| $ | 13,950 |
| $ | — |
| $ | — |
| $ | 13,950 |
| | | | | | | | | | | | | | | |
Liabilities | |
|
|
| |
|
| |
|
| |
|
| |
|
Notes payable | |
| 165,000 |
| | 167,507 |
| | — |
| | 167,507 |
| | — |
Unamortized debt issuance costs | |
| (307) |
| | | | | | | | | | | |
Notes payable, net of debt issuance costs | | $ | 164,693 |
| | | | | | | | | | | |
120
The fair value of the notes payable at December 31, 2020, approximated a price equal to $207.5 million or 100.3% of the par value. The fair value of the secured loan payable at December 31, 2020, approximated a price equal to $23.3 million or 102.3% of the par value. The fair value of the notes payable at December 31, 2019, approximated a price equal to $167.5 million or 101.5% of the par value. The fair value of the notes payable at December 31, 2018, approximated a price equal to $184.0 million or 100.5% of the par value.
114
The following table provides a summary of the changes in the fair value of securities measured using Level 3 inputs:
|
|
|
|
|
| Level 3 | |
|
| Corporate Debt | |
($ in thousands) |
| Securities | |
Fair value, December 31, 2017 |
| $ | — |
Total net (losses) gains for the period included in: |
|
|
|
OCI |
|
| 764 |
Net realized loss |
|
| (9) |
Purchases |
|
| 9,492 |
Sales |
|
| — |
Issuances |
|
| — |
Settlements |
|
| (2,754) |
Transfers into Level 3 |
|
| 119,004 |
Transfers out of Level 3 |
|
| — |
Fair value, December 31, 2018 |
|
| 126,497 |
Total net (losses) gains for the period included in: |
|
|
|
OCI |
|
| 3,011 |
Net realized loss |
|
| (5) |
Purchases |
|
| 23,905 |
Sales |
|
| — |
Issuances |
|
| — |
Settlements |
|
| (3,777) |
Transfers into Level 3 |
|
| — |
Transfers out of Level 3 |
|
| — |
Fair value, December 31, 2019 |
| $ | 149,631 |
inputs during the years ended December 31, 2020 and 2019:
| | | | | | | | | |
| | | | Non-Redeemable | | | |||
| | Corporate Debt | | Preferred Stock | | Level 3 | |||
($ in thousands) | | Securities | | Securities | | Total | |||
Fair value, December 31, 2018 | | $ | 126,497 | | $ | — | | $ | 126,497 |
Total net gains (losses) for the period included in: | | | | | | | | | |
Other comprehensive income | | | 3,011 | | | — | | | 3,011 |
Net realized loss | | | (5) | | | — | | | (5) |
Purchases | | | 23,905 | | | — | | | 23,905 |
Sales | | | — | | | — | | | — |
Issuances | | | — | | | — | | | — |
Settlements | | | (3,777) | | | — | | | (3,777) |
Transfers into Level 3 | | | — | | | — | | | — |
Transfers out of Level 3 | | | — | | | — | | | — |
Fair value, December 31, 2019 | | | 149,631 | | | — | | | 149,631 |
Total net gains (losses) for the period included in: |
| |
| | |
| | |
|
Other comprehensive income | | | 6,241 | | | — | | | 6,241 |
Net realized loss | |
| (5) | |
| — | |
| (5) |
Purchases | |
| 107,197 | |
| 1,400 | |
| 108,597 |
Sales | |
| — | |
| — | |
| — |
Issuances | |
| — | |
| — | |
| — |
Settlements | |
| (5,099) | |
| — | |
| (5,099) |
Transfers into Level 3 | |
| — | |
| — | |
| — |
Transfers out of Level 3 | |
| — | |
| — | |
| — |
Fair value, December 31, 2020 | | $ | 257,965 | | $ | 1,400 | | $ | 259,365 |
121
9. Accumulated Other Comprehensive Income (Loss)
The following table summarizes the components of AOCI:
|
|
|
|
|
|
|
|
|
|
($ in thousands) |
| Gross |
| Tax |
| Net | |||
December 31, 2016 |
| $ | 30,630 |
| $ | 1,148 |
| $ | 29,482 |
Unrealized holding gains (losses) on fixed income securities |
|
| 3,517 |
|
| 4,874 |
|
| (1,357) |
Cumulative translation adjustment |
|
| 6,881 |
|
| — |
|
| 6,881 |
Amounts reclassified into net loss |
|
| 18,763 |
|
| 1,471 |
|
| 17,292 |
Other comprehensive (loss) income |
|
| (8,365) |
|
| 3,403 |
|
| (11,768) |
Reclassification of stranded deferred taxes |
|
| — |
|
| (1,583) |
|
| 1,583 |
December 31, 2017 |
|
| 22,265 |
|
| 2,968 |
|
| 19,297 |
Unrealized holding losses on fixed income securities |
|
| (53,582) |
|
| (10,842) |
|
| (42,740) |
Amounts reclassified into net income |
|
| (1,557) |
|
| (429) |
|
| (1,128) |
Other comprehensive loss |
|
| (52,025) |
|
| (10,413) |
|
| (41,612) |
December 31, 2018 |
|
| (29,760) |
|
| (7,445) |
|
| (22,315) |
Unrealized holding gains on fixed income securities |
|
| 77,920 |
|
| 16,277 |
|
| 61,643 |
Amounts reclassified into net income |
|
| 2,037 |
|
| 162 |
|
| 1,875 |
Other comprehensive income |
|
| 75,883 |
|
| 16,115 |
|
| 59,768 |
December 31, 2019 |
| $ | 46,123 |
| $ | 8,670 |
| $ | 37,453 |
AOCI for the years ended December 31, 2020, 2019 and 2018:
| | | | | | | | | |
($ in thousands) |
| Gross |
| Tax |
| Net | |||
December 31, 2017 | | $ | 22,265 | | $ | 2,968 | | $ | 19,297 |
Unrealized holding losses on fixed maturity securities | | | (53,582) | | | (10,842) | | | (42,740) |
Amounts reclassified into net income | | | (1,557) | | | (429) | | | (1,128) |
Other comprehensive loss | | | (52,025) | | | (10,413) | | | (41,612) |
December 31, 2018 | | | (29,760) | | | (7,445) | | | (22,315) |
Unrealized holding gains on fixed maturity securities | | | 77,920 |
| | 16,277 |
| | 61,643 |
Amounts reclassified into net income | | | 2,037 |
| | 162 |
| | 1,875 |
Other comprehensive income | | | 75,883 |
| | 16,115 |
| | 59,768 |
December 31, 2019 |
| | 46,123 |
| | 8,670 |
| | 37,453 |
Unrealized holding gains on fixed maturity securities |
| | 71,872 |
| | 15,009 |
| | 56,863 |
Amounts reclassified into net income |
| | 7,697 |
| | 1,352 |
| | 6,345 |
Amounts reclassified as credit losses | | | (1,457) | | | (306) | | | (1,151) |
Other comprehensive income |
| | 65,632 |
| | 13,963 |
| | 51,669 |
December 31, 2020 |
| $ | 111,755 |
| $ | 22,633 |
| $ | 89,122 |
115
The following table presents reclassifications out of AOCI attributable to the Company during the years ended December 31, 2020, 2019 2018 and 2017:
|
|
|
|
|
|
|
|
|
|
|
|
|
| Line in Consolidated |
|
| |||||||
($ in thousands) |
| Statements of Operations |
| 2019 |
| 2018 |
| 2017 | |||
AOCI |
|
|
|
|
|
|
|
|
|
|
|
Unrealized gains on securities |
| Realized investment gains (losses), net |
| $ | 2,037 |
| $ | (1,557) |
| $ | 18,763 |
|
| Income tax expense (benefit) |
|
| 162 |
|
| (429) |
|
| 1,471 |
Total reclassifications |
|
|
| $ | 1,875 |
| $ | (1,128) |
| $ | 17,292 |
2018:
| | | | | | | | | | | |
| | Line in Consolidated | | | |||||||
($ in thousands) |
| Statements of Operations |
| 2020 |
| 2019 |
| 2018 | |||
AOCI |
|
| |
| | |
|
| |
| |
Unrealized gains (losses) on securities |
| Realized investment gains (losses), net | | $ | 7,697 | | $ | 2,037 | | $ | (1,557) |
|
| Income tax expense | | | 1,352 | | | 162 | | | (429) |
Reclassification adjustment for credit losses included in net income | | Realized investment gains (losses), net | | | (1,457) | | | — | | | — |
| | Income tax expense | | | (306) | | | — | | | — |
Total reclassifications |
| | | $ | 5,194 | | $ | 1,875 | | $ | (1,128) |
10. Related-Party Information
Loans to Executives and Equity Distribution
The Company made loans of $4.2$4.2 million to certain executive officers, including the CEO. Most of the loans were made in connection with the settlement of RSUs and related tax withholding.withholding. On March 15, 2019, all such loans were deemed repaid. On the same date, a special equity distribution of $4.2 million was made by the Company to the same executive officers, which was accounted for as a non-cash transaction on the Company’s consolidated balance sheets.
Transition and Separation Agreement
On May 3, 2019, the Company entered into a Transition and Separation Agreement (the “Separation Agreement”) with its former Chief Executive Officer (the “former CEO”). Under the Separation Agreement, the former CEO and the Company agreed to a general release of claims and his compliance with the restrictive covenants. The Company recorded an expense of $0.3 million and $8.0 million for the years ended December 31, 2020 and 2019, respectively, within Other Expenseother expense in the consolidated statements of operations for the year ended December 31, 2019 relating to the severance payments and benefits payable to the former
122
CEO. Per the terms of the Separation Agreement, the former CEO’s profit interests (“P Shares”) were forfeited and outstanding RSUs are treated in accordance with the terms of the applicable award agreements. Additionally, the Company cancelled 137,987 shares of common stock in July 2019 with no consideration as per the terms of the Separation Agreement.
On January 23, 2020, the Company and the former CEO entered into an amendment to the Separation Agreement, which, among other things, provides that effective as of February 1, 2020, the former CEO resigned from his position as Executive Chairman of the Company.
Additionally, the Company entered into a niche management agreement with an independent agency founded by the former CEO. The Company recorded an expense of $0.6 million for the year ended December 31, 2020.
Investment Advisory Agreements with GSAM
TheA portion of the Company’s investment portfolio is managed by Goldman Sachs Asset Management, a related party. The Company is an investee of PI, which is held as an investment within GS Capital Partners VI funds. Related fees paid were $1.2 million, $1.3 million and $1.1 million in 2020, 2019 and $1.7 million in 2019, 2018 and 2017 respectively.
11. Insurance Operations
Reinsurance Transactions
The Company’s reinsurance agreements do not relieve its direct obligations to insureds. Thus, a credit exposure exists to the extent that any reinsurer fails to meet its obligations to the Company.
The reinsurers with the three3 largest uncollateralized obligations to the Company at December 31, 2019,2020, were the Swiss Reinsurance America Corporation, Munich Reinsurance America Inc. and Harco National Insurance Company, which represented 31.3%26.0%, 14.2%8.0% and 9.0%8.4%, respectively, of the Company’s reinsurance recoverables, net of funds held and collateral. Swiss Reinsurance America Corporation and Munich Reinsurance America Inc. and are rated A+ (Superior) by A.M. Best Company. Harco National Insurance Company is rated A- (Excellent) by A.M. Best Company.
116
Collateral for reinsurance receivables is generally only pursued by the Company when the reinsurer’s status with the regulators of the Company’s domicile would not otherwise permit credit for reinsurance for regulatory reporting purposes.
Reinsurance receivables included an allowance for uncollectible reinsurance receivables of $10.9 million and $10.0 million, for the years ended December 31, 2019 and 2018, respectively.
In connection with the divestment of the Company’s U.K. business, New York Marine as reinsured entered into whole account quota share agreements (“WAQS”) with third party reinsurers to maintain reasonable underwriting leverage within New York Marine and its subsidiary insurance companies during a transition period following the U.K. divestment.
The effective date of the WAQS was April 1, 2017. The reinsurers’ ceding participation is an aggregate 26.0%. A provisional ceding commission of 30.0% to 30.5% is received as a reduction in the amount of ceded premium. Subject to limits, these ceding commissions will vary in subsequent periods based on contractual ultimate loss ratios.
During 2018 and following the transition of the U.S. business back to New York Marine, the WAQS were terminated. To the extent of unearned premium at the time of termination, ceded written premiums, net of the ceding commission, was returned. Reserve for unpaid losses and loss adjustment expenses on premium earned prior to the cut-off termination remained in reinsurance receivables on unpaid losses on the consolidated balance sheets. The reinsurance receivables on unpaid losses under the WAQS were $33.1$0.0 million and $43.7$33.1 million as of December 31, 20192020 and 2018, respectively.2019. In January 2020, the WAQS were commuted at no gain or loss to the Company. Loss reserve development on the reserves ceded under the WAQS is included in continuing operations.
123
For the years ended December 31, 2020, 2019 and 2018 under the WAQS the Company recorded the following:
|
|
|
|
|
|
|
|
| ||||||||||
| | | | | | | | | ||||||||||
($ in thousands) |
| 2019 |
| 2018 |
| 2017 |
| 2020 |
| 2019 | | 2018 | ||||||
(Return of ceded prepaid) ceded written premium |
| $ | (3) |
| $ | (58,857) |
| $ | 160,779 |
| $ | — |
| $ | (3) | | $ | (58,857) |
Ceded earned premium |
|
| (3) |
|
| 14,560 |
|
| 87,362 |
| | — |
| | (3) | | | 14,560 |
(Increase) reduction to net loss and loss adjustment expenses incurred |
|
| (4,746) |
|
| 9,514 |
|
| 51,897 |
| | — |
| | (4,746) | | | 9,514 |
Reduction to policy acquisition expenses |
|
| 4,743 |
|
| 3,955 |
|
| 29,560 |
| | — |
| | 4,743 | | | 3,955 |
Reduction to pre-tax income |
| $ | — |
| $ | 1,091 |
| $ | 5,905 | | $ | — |
| $ | — | | $ | 1,091 |
117
Total reinsurance ceded and assumed relating to premiums written, earned premiums and net losses and loss adjustment expenses incurred for the years ended December 31, 2020, 2019 2018 and 20172018 are as follows:
|
|
|
|
|
|
|
|
|
| |||||||||
| | | | | | | | | | |||||||||
($ in thousands) |
| 2019 |
| 2018 |
| 2017 |
| 2020 |
| 2019 |
| 2018 | ||||||
Written premiums |
|
|
|
|
|
|
|
|
|
| |
|
| |
| | |
|
Direct written premiums |
| $ | 964,512 |
| $ | 889,526 |
| $ | 833,536 |
| $ | 814,266 | | $ | 964,512 | | $ | 889,526 |
Assumed from other companies |
|
| 3,499 |
|
| 5,586 |
|
| 2,798 |
| | 2,824 | | | 3,499 | | | 5,586 |
Ceded to other companies |
|
| 115,871 |
|
| 45,038 |
|
| 276,048 |
| | 122,912 | | | 115,871 | | | 45,038 |
Net written premiums |
| $ | 852,140 |
| $ | 850,074 |
| $ | 560,286 | | $ | 694,178 |
| $ | 852,140 | | $ | 850,074 |
|
|
|
|
|
|
|
|
|
| |||||||||
| | | | | | | | | | |||||||||
Earned premiums |
|
|
|
|
|
|
|
|
| |
|
|
|
|
| |
|
|
Direct earned premiums |
| $ | 918,718 |
| $ | 844,234 |
| $ | 788,862 | | $ | 846,749 |
| $ | 918,718 | | $ | 844,234 |
Assumed from other companies |
|
| 3,887 |
|
| 10,266 |
|
| 2,477 | |
| 3,017 |
|
| 3,887 | |
| 10,266 |
Ceded to other companies |
|
| 114,751 |
|
| 123,715 |
|
| 181,553 | |
| 112,011 |
|
| 114,751 | |
| 123,715 |
Net earned premiums |
| $ | 807,854 |
| $ | 730,785 |
| $ | 609,786 | | $ | 737,755 |
| $ | 807,854 | | $ | 730,785 |
Percent of amount assumed to net |
|
| 0.5% |
|
| 1.4% |
|
| 0.4% | |
| 0.4% | | | 0.5% | |
| 1.4% |
|
|
|
|
|
|
|
|
|
| |||||||||
| | | | | | | | | | |||||||||
Losses and loss adjustment expenses incurred |
|
|
|
|
|
|
|
|
| |
|
|
|
|
| |
|
|
Direct net losses and loss adjustment expenses incurred |
| $ | 556,051 |
| $ | 485,770 |
| $ | 483,209 | | $ | 553,967 |
| $ | 556,051 | | $ | 485,770 |
Assumed from other companies |
|
| 9,298 |
|
| (3,209) |
|
| 720 | |
| 8,862 |
|
| 9,298 | |
| (3,209) |
Ceded to other companies |
|
| 64,324 |
|
| 47,731 |
|
| 90,188 | |
| 90,158 |
|
| 64,324 | |
| 47,731 |
Net losses and loss adjustment expenses incurred |
| $ | 501,025 |
| $ | 434,830 |
| $ | 393,741 | | $ | 472,671 |
| $ | 501,025 | | $ | 434,830 |
In 2016, the Company entered a retroactive reinsurance agreement with an authorized reinsurer covering accident year 2015 and prior Primary and Excess Workers’ Compensation net losses and loss adjustment expenses incurred. Subject carried reserves at the January 1, 2016 effective date were $306.4 million. The reinsurance provides $100.0 million limit on respective paid losses excess of $315.0 million retention. The reinsurance cover has a retrospective rating feature of $47.6 million of additional premium accumulating at approximately 3% per annum. This amount is 100% recoverable to the Company to the extent losses do not exceed the retention. At December 31, 2019,2020, the Company’s estimate of respective loss development remains below the retention.
In 2017, the Company entered into a retroactive reinsurance agreement for the 2016 accident year. Subject carried reserves at the January 1, 2017 effective date were $96.5 million. The reinsurer provides a $35.0 million limit on respective paid losses in excess of $106.5 million. The reinsurance cover has a retrospective rating feature of $18.0 million of premium accumulating at approximately 4% per annum. These amounts are 100% recoverable to the Company to the extent losses do not exceed the retention. At December 31, 2019,2020, the Company’s estimate of respective loss development remains below the retention and the adjustable premium is accrued as fully recoverable.
In 2018, the Company entered into a retroactive reinsurance agreement for the 2017 accident year. Subject carried reserves at the January 1, 2018 effective date were $107.8 million. The reinsurer provides a $40.0 million limit on
124
respective paid losses in excess of $119.3 million. The reinsurance cover has a retrospective rating feature of $21.0 million of premium accumulating at approximately 4% per annum. These are 100% recoverable to the Company to the extent losses do not exceed the retention. At December 31, 2019,2020, the Company’s estimate of respective loss development remains below the retention and the adjustable premium is accrued as fully recoverable.
Allowance for Credit Losses
The following table is rollforward of the receivable allowance balances related to the risk of credit default as of December 31, 2020:
| | | | | | | | | | | | | | | |
($ in thousands) | | | | | | | | | | | | | | | |
Year Ended December 31, 2020 | | December 31, 2019 | | Current Provision | | Write-offs | | Recoveries | | December 31, 2020 | |||||
Premium receivable |
| $ | 5,056 |
| $ | 2,642 | | $ | (841) | | $ | 60 | | $ | 6,917 |
Reinsurance receivable on paid and unpaid losses |
| | 505 |
| | 201 | | | — | | | — | | | 706 |
Total receivable allowance |
| $ | 5,561 |
| $ | 2,843 | | $ | (841) | | $ | 60 | | $ | 7,623 |
The majority of the allowance for credit loss for premium receivables relates to audit premium on workers’ compensation coverages assessed during or after the period of coverage whereby there is limited ability to cancel or limit coverage. In the final collection action at the insured level, collection agencies are typically engaged. The amount with collection agencies as of December 31, 2020 was $6.9 million.
The reinsurance receivable allowance for credit loss is based on the credit ratings of reinsurers. Uncollateralized exposure on unrated or counterparties rated below investment grade at December 31, 2020 is $3.7 million. At December 31, 2020, 97.4% of uncollateralized exposures are rated above investment grade.
Distribution Partners
The Company negotiates with distribution partners to write direct premium on behalf of the Company’s affiliates. In January 2019, a distribution partner of the Company was acquired by a third-party insurance carrier. The Company has sourced 7.1% and 13.5% of direct premium from this distribution partner as of December 31, 2019 and
118
2018, respectively. The Company does not anticipatereceived any future premiums from this distribution partner other than audit premiums after the first quarter of 2019.
The three3 distribution partners contributing the largest amounts of direct written premium (excluding the former distribution partner above)partner) totaled $275.0 million, $267.8 million $240.7 million and $235.0$240.7 million for the years ended December 31, 2020, 2019 and 2018, respectively.
125
ProSight Global, Inc. and 2017 respectively.Subsidiaries
Notes to Consolidated Financial Statements
Unpaid Losses
Unpaid losses are based on individual case estimates for losses reported and include a provision for incurred but not reported and for losses and loss adjustment expenses. The following table provides a roll forward of the Company’s reserve for unpaid losses and loss adjustment expenses:
|
|
|
|
|
|
|
|
|
| |||||||||
| | | | | | | | | | |||||||||
($ in thousands) |
| 2019 |
| 2018 |
| 2017 |
| 2020 |
| 2019 |
| 2018 | ||||||
Gross reserve for unpaid losses and loss expenses, at beginning of year |
| $ | 1,396,812 |
| $ | 1,258,237 |
| $ | 1,166,619 | | $ | 1,521,648 | | $ | 1,396,812 | | $ | 1,258,237 |
Ceded reserve for unpaid losses and loss expenses, at beginning of year |
|
| 185,295 |
|
| 201,156 |
|
| 176,651 | | | 193,952 | | | 185,295 | | | 201,156 |
Net reserve for unpaid losses and loss expenses, at beginning of year |
|
| 1,211,517 |
|
| 1,057,081 |
|
| 989,968 | | | 1,327,696 | | | 1,211,517 | | | 1,057,081 |
Add: |
|
|
|
|
|
|
|
|
| | |
| | |
| | |
|
Incurred losses and loss expenses occurring in the: |
|
|
|
|
|
|
|
|
| | |
| | |
| | |
|
Current year |
|
| 482,989 |
|
| 439,847 |
|
| 373,423 | | | 456,724 | | | 482,989 | | | 439,847 |
Prior years |
|
| 3,154 |
|
| (5,017) |
|
| 20,318 | | | 710 | | | 3,154 | | | (5,017) |
Prior years attributable to adjusted premium |
|
| 14,882 |
|
| — |
|
| — | | | 15,237 | | | 14,882 | | | — |
Total net losses and loss adjustment expenses incurred |
|
| 501,025 |
|
| 434,830 |
|
| 393,741 | | | 472,671 | | | 501,025 | | | 434,830 |
Less: |
|
|
|
|
|
|
|
|
| | |
| | |
| | |
|
Paid losses and loss expenses for claims occurring in the: |
|
|
|
|
|
|
|
|
| | |
| | |
| | |
|
Current year |
|
| 66,522 |
|
| 47,734 |
|
| 54,026 | | | 47,937 | | | 66,522 | | | 47,734 |
Prior years |
|
| 318,324 |
|
| 232,660 |
|
| 272,602 | | | 320,050 | | | 318,324 | | | 232,660 |
Total paid losses and loss expenses for claims |
|
| 384,846 |
|
| 280,394 |
|
| 326,628 | | | 367,987 | | | 384,846 | | | 280,394 |
Net reserve for unpaid losses and loss expenses, at end of year |
|
| 1,327,696 |
|
| 1,211,517 |
|
| 1,057,081 | | | 1,432,380 | | | 1,327,696 | | | 1,211,517 |
Ceded reserve for unpaid losses and loss expenses, at end of year |
|
| 193,952 |
|
| 185,295 |
|
| 201,156 | | | 170,522 | | | 193,952 | | | 185,295 |
Gross reserve for unpaid losses and loss expenses, at end of year |
| $ | 1,521,648 |
| $ | 1,396,812 |
| $ | 1,258,237 | | $ | 1,602,902 | | $ | 1,521,648 | | $ | 1,396,812 |
During the year ended December 31, 2020 the Company’s reserve for unpaid losses and loss adjustment expenses for accident years 2019 and prior developed unfavorably by $0.7 million driven by unfavorable development of $21.8 million in General Liability, $16.8 million unfavorable development in Commercial Multiple Peril and $8.1 million unfavorable development in Commercial Auto, partially offset by $36.5 million of favorable development in Workers’ Compensation and $9.5 million of favorable development in All Other lines. In addition, the Company incurred $15.2 million of losses and loss adjustment expenses related to premium adjustments earned during the year ended December 31, 2020, attributable to accident years 2019 and 2018. The unfavorable development in General Liability, Commercial Multiple Peril and Commercial Auto related to 2013 through 2017 accident years due largely to increased severities in runoff components. The favorable development in Workers’ Compensation derived from lower than expected claims severity across all customer segments primarily in accident years 2015 through 2018. The favorable development in All Other lines was driven mostly by Ocean Marine.
During the year ended December 31, 2019 the Company’s reserve for unpaid losses and loss adjustment expenses for accident years 2018 and prior developed unfavorably by $3.2 million driven primarily by unfavorable development of $16.4 million in Commercial Multiple Peril, $11.3 million in General Liability, partially offset by favorable development of $22.8 million in Workers’ Compensation. The unfavorable development in Commercial Multiple Peril was primarily from the Media and Entertainment customer segment in accident years 2013 through 2016 from a longer development trend than that underlying the historical performance of premises liability. The unfavorable development in General Liability primarily related to 2013 through 2016 accident years due to increased severities in the Real Estate customer segment and run off components within the Other customer segment. The favorable development in Workers’ Compensation derived from lower than expected claims severity across all customer segments primarily in accident years 2013 through 2015 and accident year 2017. In addition, the Company incurred $14.9 million of losslosses and loss adjustment expenses related to premium earned during the year ended December 31, 2019, attributable to accident year 2018.
126
During the year ended December 31, 2018, the Company’s reserve for unpaid losses and loss adjustment expenses for accident years 2017 and prior developed favorably by $5.0 million. Favorable development of $5.0 million for the year ended December 31, 2018, was driven primarily by favorable development of $14.4 million in Workers’ Compensation, $15.6 million in Commercial Auto and $4.1 million from Marine Liability within the All Other lines category, partially offset by $16.5 million adverse development in General Liability and $12.2 million adverse development in Commercial Multiple Peril. Lower than expected claim severity was the main driver of the favorable development in Workers’ Compensation of which $6.2 million came from 2014, 2015 and 2016 accident years in
119
primary Workers’ Compensation and $8.2 million came from 2014 and 2015 accident years in excess Workers’ Compensation. Favorable development in Commercial Auto was driven mainly by the 2013, 2015 and 2016 accident years where severity trends of the previous two calendar year periods improved during 2018 across multiple niches. Marine Liability is a low frequency, high severity line of business and as a result, development often varies significantly from the average expectation. The $16.5 million adverse development in General Liability primarily related to 2013, 2014 and 2015 accident years due to increased severities in the Construction customer segment from reduced effectiveness of risk transfer from our general contractor insureds to subcontractors. The $12.2 million in adverse development in Commercial Multiple Peril is primarily from the Media and Entertainment customer segment driven by a longer development trend than that underlying the historic performance of premises liability.
During the year ended December 31, 2017, the Company’s reserve for unpaid losses and loss adjustment expenses for accident years 2016 and prior developed adversely by $20.3 million. Adverse development of $20.3 million was driven primarily by $33.2 million in Commercial Auto which consisted of several niches that are now terminated. Adverse development in Commercial Auto was driven primarily by higher than expected frequency and severity. The Commercial Auto experience were likely a result of industry trends such as an improving economy resulting in more drivers on the roads, the hiring of less experienced drivers, the use of personal technology while in transit and litigation of bodily-injury claims, which resulted in unexpected adverse experience from historical performance patterns. The adverse development was offset by favorable development in Workers’ Compensation of $12.4 million due to lower than expected claim severity for accident years 2016 and prior, including a decline in the frequency of large loss activity.
Incurred and Paid Claims Development
The following information presented summarizes incurred and paid claims development as of December 31, 2019,2020, net of reinsurance, as well as cumulative claim frequency and the total of IBNR. IBNR anticipates both the development of existing claims and emergence of any new claims. The information about incurred and paid claims development for accident years 20102011 through 20182019 is unaudited and is presented as supplementary information. Information is also included for the portion of the reserve for unpaid losses and loss adjustment expenses, net of reinsurance that related to IBNR and the cumulative number of reported insurance claims. Claims are counted at the occurrence (e.g. date of the accident), line of business which is in accordance with the Company’s statutory filings, and policy level. For example, if a single occurrence (e.g. an auto accident) leads to a claim under an auto and an associated umbrella policy, they are each counted separately. Conversely, multiple claimants under the same occurrence/line/policy would contribute only a single count. The claim counts provided are on an accident year basis. A claim is considered reported when a reserve is established or a payment is made. Therefore, claims closed without payment are included in the claim counts as long as there was an associated case reserve at some point in its life cycle. The following tables are in thousands except claim counts.
120127
| | | | | | | | | | | | | | | | | | | | | | | | | | | | | | | | | | | |
All Lines - Incurred | |||||||||||||||||||||||||||||||||||
| | Unaudited | | | | | IBNR as of | | Cumulative | ||||||||||||||||||||||||||
| | For the Years Ended | | December 31, | | Claim | |||||||||||||||||||||||||||||
Accident Year |
| 2011 |
| 2012 |
| 2013 |
| 2014 |
| 2015 |
| 2016 |
| 2017 |
| 2018 |
| 2019 |
| 2020 |
| 2020 |
| Counts | |||||||||||
Prior |
| | | | | | | | | | | | | | | | | | | | | | | | | | | | |
|
| $ | 23,493 |
|
|
2011 | | $ | 115,644 | | $ | 128,879 | | $ | 126,752 | | $ | 122,773 | | $ | 124,543 |
| $ | 131,081 |
| $ | 124,798 |
| $ | 131,385 | | $ | 131,360 | | $ | 131,113 | | | 6,974 |
| 4,421 |
2012 | |
|
| |
| 137,380 | |
| 157,477 | |
| 157,985 | |
| 165,015 | |
| 165,889 | |
| 156,355 | |
| 159,120 | |
| 158,523 | |
| 164,197 | |
| 4,031 |
| 6,633 |
2013 | |
|
| |
|
| |
| 210,368 | |
| 222,277 | |
| 232,660 | |
| 251,353 | |
| 243,567 | |
| 237,900 | |
| 249,802 | |
| 252,393 | |
| 13,838 |
| 13,246 |
2014 | |
|
| |
|
| |
|
| |
| 286,842 | |
| 312,987 | |
| 323,792 | |
| 333,865 | |
| 342,788 | |
| 356,733 | |
| 367,034 | |
| 26,909 |
| 16,350 |
2015 | |
|
| |
|
| |
|
| |
|
| |
| 384,269 | |
| 407,279 | |
| 407,427 | |
| 395,751 | |
| 430,942 | |
| 433,918 | |
| 34,523 |
| 20,896 |
2016 | |
|
| |
|
| |
|
| |
|
| |
|
| |
| 390,430 | |
| 423,538 | |
| 406,204 | |
| 416,266 | |
| 416,317 | |
| 47,411 |
| 20,124 |
2017 | |
|
| |
|
| |
|
| |
|
| |
|
| |
|
| |
| 354,948 | |
| 361,299 | |
| 339,505 | |
| 354,402 | |
| 110,963 |
| 18,763 |
2018 | |
|
| |
|
| |
|
| |
|
| |
|
| |
|
| |
|
| |
| 422,104 | |
| 406,199 | |
| 403,545 | |
| 172,717 |
| 19,252 |
2019 | |
|
| |
|
| |
|
| |
|
| |
|
| |
|
| |
|
| |
|
| |
| 457,973 | |
| 460,080 | |
| 231,758 |
| 21,018 |
2020 | |
|
| |
|
| |
|
| |
|
| |
|
| |
|
| |
|
| |
|
| |
|
| |
| 430,179 | |
| 303,172 |
| 12,264 |
| | | | | | | | | | | | | | | | | | | | | | | | | | | | | $ | 3,413,178 | | $ | 975,789 | | |
| | | | | | | | | | | | | | | | | | | | | | | | | | | | | | | | | | | |
All Lines – Paid | | | | | | ||||||||||||||||||||||||||||||
| | Unaudited | | | | | | | | | |||||||||||||||||||||||||
| | For the Years Ended | | | | | | ||||||||||||||||||||||||||||
Accident Year |
| 2011 |
| 2012 |
| 2013 |
| 2014 |
| 2015 |
| 2016 |
| 2017 |
| 2018 |
| 2019 |
| 2020 |
| | |
| | ||||||||||
2011 | | $ | 14,796 | | $ | 51,006 | | $ | 65,103 | | $ | 76,731 | | $ | 88,243 | | $ | 98,411 | | $ | 105,584 | | $ | 109,007 | | $ | 111,247 | | $ | 110,798 | | | | | |
2012 | | | | |
| 16,619 | |
| 48,276 | |
| 73,249 | |
| 98,960 | |
| 119,374 | |
| 130,200 | |
| 136,909 | |
| 139,793 | |
| 148,826 | | | | | |
2013 | | | | | | | |
| 27,465 | |
| 74,012 | |
| 115,396 | |
| 158,978 | |
| 181,989 | |
| 192,476 | |
| 214,863 | |
| 221,768 | | | | | |
2014 | | | | | | | | | | |
| 44,738 | |
| 111,919 | |
| 166,907 | |
| 217,986 | |
| 250,928 | |
| 280,933 | |
| 305,157 | | | | | |
2015 | | | | | | | | | | | | | |
| 75,043 | |
| 159,708 | |
| 234,756 | |
| 281,637 | |
| 331,748 | |
| 360,249 | | | | | |
2016 | | | | | | | | | | | | | | | | |
| 78,271 | |
| 150,198 | |
| 204,589 | |
| 266,496 | |
| 316,092 | | | | | |
2017 | | | | | | | | | | | | | | | | | | | |
| 54,026 | |
| 116,204 | |
| 163,937 | |
| 194,952 | | | | | |
2018 | | | | | | | | | | | | | | | | | | | | | | |
| 45,012 | |
| 112,889 | |
| 163,878 | | | | | |
2019 | | | | | | | | | | | | | | | | | | | | | | | | | |
| 66,522 | |
| 154,243 | | | | | |
2020 | | | | | | | | | | | | | | | | | | | | | | | | | | | | |
| 66,226 | | | | | |
| | | | | | | | | | | | | | | | | | | | | | | | | | | | |
| 2,042,189 | | | | | |
| | | | | | | | | | | | | | | | | | Incurred less paid | |
| 1,370,989 | | | | | | |||||||||
| | | | | | | | | | | | | | | | | | Reserves 2010 and prior | |
| 55,436 | | | | | | |||||||||
| | | | | | | | | | | | | | | | | | Other(1) | |
| 5,955 | | | | | | |||||||||
| | | | | | | | | | | | | | | | | | Total net reserve for unpaid losses and loss adjustment expenses | | $ | 1,432,380 | | | | | | |||||||||
|
|
|
|
|
|
|
|
|
|
|
|
|
|
|
|
|
|
|
|
|
|
|
|
|
|
|
|
|
|
|
|
|
|
|
|
All Lines - Incurred | |||||||||||||||||||||||||||||||||||
|
| Unaudited |
|
|
|
| IBNR as of |
| Cumulative | ||||||||||||||||||||||||||
|
| For the Years Ended |
| December 31, |
| Claim | |||||||||||||||||||||||||||||
Accident Year |
| 2010 |
| 2011 |
| 2012 |
| 2013 |
| 2014 |
| 2015 |
| 2016 |
| 2017 |
| 2018 |
| 2019 |
| 2019 |
| Counts | |||||||||||
Prior |
|
|
|
|
|
|
|
|
|
|
|
|
|
|
|
|
|
|
|
|
|
|
|
|
|
|
|
|
|
|
| $ | 15,481 |
|
|
2010 |
| $ | 131,617 |
| $ | 137,994 |
| $ | 134,941 |
| $ | 134,307 |
| $ | 136,115 |
| $ | 143,344 |
| $ | 152,840 |
| $ | 145,444 |
| $ | 148,117 |
| $ | 150,543 |
|
| 3,108 |
| 3,926 |
2011 |
|
|
|
|
| 115,644 |
|
| 128,879 |
|
| 126,752 |
|
| 122,773 |
|
| 124,543 |
|
| 131,081 |
|
| 124,798 |
|
| 131,385 |
|
| 131,360 |
|
| 3,772 |
| 4,419 |
2012 |
|
|
|
|
|
|
|
| 137,380 |
|
| 157,477 |
|
| 157,985 |
|
| 165,015 |
|
| 165,889 |
|
| 156,355 |
|
| 159,120 |
|
| 158,523 |
|
| 6,491 |
| 6,622 |
2013 |
|
|
|
|
|
|
|
|
|
|
| 210,368 |
|
| 222,277 |
|
| 232,660 |
|
| 251,353 |
|
| 243,567 |
|
| 237,900 |
|
| 249,802 |
|
| 16,133 |
| 13,229 |
2014 |
|
|
|
|
|
|
|
|
|
|
|
|
|
| 286,842 |
|
| 312,987 |
|
| 323,792 |
|
| 333,865 |
|
| 342,788 |
|
| 356,733 |
|
| 30,978 |
| 16,333 |
2015 |
|
|
|
|
|
|
|
|
|
|
|
|
|
|
|
|
| 384,269 |
|
| 407,279 |
|
| 407,427 |
|
| 395,751 |
|
| 430,942 |
|
| 44,665 |
| 20,869 |
2016 |
|
|
|
|
|
|
|
|
|
|
|
|
|
|
|
|
|
|
|
| 390,430 |
|
| 423,538 |
|
| 406,204 |
|
| 416,266 |
|
| 93,163 |
| 20,049 |
2017 |
|
|
|
|
|
|
|
|
|
|
|
|
|
|
|
|
|
|
|
|
|
|
| 354,948 |
|
| 361,299 |
|
| 339,505 |
|
| 127,760 |
| 18,582 |
2018 |
|
|
|
|
|
|
|
|
|
|
|
|
|
|
|
|
|
|
|
|
|
|
|
|
|
| 422,104 |
|
| 406,199 |
|
| 233,890 |
| 18,720 |
2019 |
|
|
|
|
|
|
|
|
|
|
|
|
|
|
|
|
|
|
|
|
|
|
|
|
|
|
|
|
| 457,973 |
|
| 330,679 |
| 17,591 |
|
|
|
|
|
|
|
|
|
|
|
|
|
|
|
|
|
|
|
|
|
|
|
|
|
|
|
|
| $ | 3,097,846 |
| $ | 906,120 |
|
|
|
|
|
|
|
|
|
|
|
|
|
|
|
|
|
|
|
|
|
|
|
|
|
|
|
|
|
|
|
|
|
|
|
|
|
|
All Lines – Paid |
|
|
|
|
| ||||||||||||||||||||||||||||||
|
| Unaudited |
|
|
|
|
|
|
|
| |||||||||||||||||||||||||
|
| For the Years Ended |
|
|
|
|
| ||||||||||||||||||||||||||||
Accident Year |
| 2010 |
| 2011 |
| 2012 |
| 2013 |
| 2014 |
| 2015 |
| 2016 |
| 2017 |
| 2018 |
| 2019 |
|
|
|
|
| ||||||||||
2010 |
| $ | 11,912 |
| $ | 38,723 |
| $ | 72,312 |
| $ | 85,754 |
| $ | 102,016 |
| $ | 114,140 |
| $ | 125,646 |
| $ | 132,525 |
| $ | 137,470 |
| $ | 140,927 |
|
|
|
|
|
2011 |
|
|
|
|
| 14,796 |
|
| 51,006 |
|
| 65,103 |
|
| 76,731 |
|
| 88,243 |
|
| 98,411 |
|
| 105,584 |
|
| 109,007 |
|
| 111,247 |
|
|
|
|
|
2012 |
|
|
|
|
|
|
|
| 16,619 |
|
| 48,276 |
|
| 73,249 |
|
| 98,960 |
|
| 119,374 |
|
| 130,200 |
|
| 136,909 |
|
| 139,793 |
|
|
|
|
|
2013 |
|
|
|
|
|
|
|
|
|
|
| 27,465 |
|
| 74,012 |
|
| 115,396 |
|
| 158,978 |
|
| 181,989 |
|
| 192,476 |
|
| 214,863 |
|
|
|
|
|
2014 |
|
|
|
|
|
|
|
|
|
|
|
|
|
| 44,738 |
|
| 111,919 |
|
| 166,907 |
|
| 217,986 |
|
| 250,928 |
|
| 280,933 |
|
|
|
|
|
2015 |
|
|
|
|
|
|
|
|
|
|
|
|
|
|
|
|
| 75,043 |
|
| 159,708 |
|
| 234,756 |
|
| 281,637 |
|
| 331,748 |
|
|
|
|
|
2016 |
|
|
|
|
|
|
|
|
|
|
|
|
|
|
|
|
|
|
|
| 78,271 |
|
| 150,198 |
|
| 204,589 |
|
| 266,496 |
|
|
|
|
|
2017 |
|
|
|
|
|
|
|
|
|
|
|
|
|
|
|
|
|
|
|
|
|
|
| 54,026 |
|
| 116,204 |
|
| 163,937 |
|
|
|
|
|
2018 |
|
|
|
|
|
|
|
|
|
|
|
|
|
|
|
|
|
|
|
|
|
|
|
|
|
| 45,012 |
|
| 112,889 |
|
|
|
|
|
2019 |
|
|
|
|
|
|
|
|
|
|
|
|
|
|
|
|
|
|
|
|
|
|
|
|
|
|
|
|
| 66,522 |
|
|
|
|
|
|
|
|
|
|
|
|
|
|
|
|
|
|
|
|
|
|
|
|
|
|
|
|
|
|
|
|
|
|
| 1,829,355 |
|
|
|
|
|
|
|
|
|
|
|
|
|
|
|
|
|
|
|
|
|
|
| Incurred less paid |
|
| 1,268,491 |
|
|
|
|
| |||||||||
|
|
|
|
|
|
|
|
|
|
|
|
|
|
|
|
|
| Reserves 2009 and prior |
|
| 44,965 |
|
|
|
|
| |||||||||
|
|
|
|
|
|
|
|
|
|
|
|
|
|
|
|
|
| Other(1) |
|
| 14,240 |
|
|
|
|
| |||||||||
|
|
|
|
|
|
|
|
|
|
|
|
|
|
|
|
|
| Total net reserve for unpaid losses and loss adjustment expenses |
| $ | 1,327,696 |
|
|
|
|
| |||||||||
| (1) |
| Other category represents unallocated loss adjustment expense |
The following table presents the historical average annual percentage payout of incurred claims, net of reinsurance, as of December 31, 2019:2020:
|
|
|
|
|
|
|
|
|
|
|
|
|
|
|
|
|
|
|
| |||||||||||||||||||
| | | | | | | | | | | | | | | | | | | | |||||||||||||||||||
Year 1 |
| Year 2 |
| Year 3 |
| Year 4 |
| Year 5 |
| Year 6 |
| Year 7 |
| Year 8 |
| Year 9 |
| Year 10 |
|
| Year 2 |
| Year 3 |
| Year 4 |
| Year 5 |
| Year 6 |
| Year 7 |
| Year 8 |
| Year 9 |
| Year 10 |
|
14 | % | 19 | % | 15 | % | 13 | % | 10 | % | 7 | % | 7 | % | 3 | % | 3 | % | 2 | % | % | 19 | % | 14 | % | 13 | % | 11 | % | 7 | % | 7 | % | 2 | % | 4 | % | — | % |
121128
Commercial Auto
The following tables represent information on the Company’s unpaid losses and loss adjustment expenses incurred and cumulative paid losses, since 20102011 for Commercial Auto line, in thousands except claim counts:
| | | | | | | | | | | | | | | | | | | | | | | | | | | | | | | | | | | | |||||||||||||||||||||||||||||||||||
Commercial Auto-Incurred | Commercial Auto-Incurred | |||||||||||||||||||||||||||||||||||||||||||||||||||||||||||||||||||||
| | Unaudited | | | | | IBNR as of | | Cumulative | |||||||||||||||||||||||||||||||||||||||||||||||||||||||||||||
|
|
|
|
|
|
|
|
|
|
|
|
|
|
|
|
|
|
|
|
|
|
|
|
|
|
|
|
|
|
|
|
|
|
|
| |||||||||||||||||||||||||||||||||||
Commercial Auto-Incurred | ||||||||||||||||||||||||||||||||||||||||||||||||||||||||||||||||||||||
|
| Unaudited |
|
|
|
| IBNR as of |
| Cumulative | |||||||||||||||||||||||||||||||||||||||||||||||||||||||||||||
|
| For the Years Ended |
| December 31, |
| Claim | ||||||||||||||||||||||||||||||||||||||||||||||||||||||||||||||||
| | For the Years Ended | | December 31, | | Claim | ||||||||||||||||||||||||||||||||||||||||||||||||||||||||||||||||
Accident Year |
| 2010 |
| 2011 |
| 2012 |
| 2013 |
| 2014 |
| 2015 |
| 2016 |
| 2017 |
| 2018 |
| 2019 |
| 2019 |
| Counts |
| 2011 |
| 2012 |
| 2013 |
| 2014 |
| 2015 |
| 2016 |
| 2017 |
| 2018 |
| 2019 |
| 2020 |
| 2020 |
| Counts | ||||||||||||||||||||||
Prior |
|
|
|
|
|
|
|
|
|
|
|
|
|
|
|
|
|
|
|
|
|
|
|
|
|
|
|
|
|
|
|
|
|
|
| | | | | | | | | | | | | | | | | | | | | | | | | | | | | | | | | | | |
2010 |
| $ | 13,046 |
| $ | 17,710 |
| $ | 18,011 |
| $ | 17,334 |
| $ | 18,717 |
| $ | 18,688 |
| $ | 19,046 |
| $ | 19,437 |
| $ | 19,280 |
| $ | 19,282 |
| $ | — |
| 874 | |||||||||||||||||||||||||||||||||||
2011 |
|
|
|
|
| 13,864 |
|
| 13,462 |
|
| 11,260 |
|
| 11,231 |
|
| 12,547 |
|
| 12,547 |
|
| 12,508 |
|
| 12,476 |
|
| 12,476 |
|
| — |
| 1,219 | | $ | 13,864 | | $ | 13,462 | | $ | 11,260 | | $ | 11,231 | | $ | 12,547 | | $ | 12,547 | | $ | 12,508 | | $ | 12,476 | | $ | 12,476 | | $ | 12,755 | | $ | — |
| 1,219 |
2012 |
|
|
|
|
|
|
|
| 21,101 |
|
| 29,959 |
|
| 36,319 |
|
| 43,031 |
|
| 42,028 |
|
| 41,479 |
|
| 41,572 |
|
| 39,231 |
|
| 444 |
| 1,746 | | | | |
| 21,101 | |
| 29,959 | |
| 36,319 | |
| 43,031 | |
| 42,028 | |
| 41,479 | |
| 41,572 | |
| 39,231 | |
| 40,112 | |
| — |
| 1,746 |
2013 |
|
|
|
|
|
|
|
|
|
|
| 47,191 |
|
| 50,752 |
|
| 63,764 |
|
| 77,570 |
|
| 76,768 |
|
| 72,265 |
|
| 81,422 |
|
| 993 |
| 6,224 | | | | | | | |
| 47,191 | |
| 50,752 | |
| 63,764 | |
| 77,570 | |
| 76,768 | |
| 72,265 | |
| 81,422 | |
| 82,221 | |
| 295 |
| 6,225 |
2014 |
|
|
|
|
|
|
|
|
|
|
|
|
|
| 74,185 |
|
| 95,283 |
|
| 105,528 |
|
| 112,157 |
|
| 113,747 |
|
| 113,790 |
|
| 843 |
| 8,231 | | | | | | | | | | |
| 74,185 | |
| 95,283 | |
| 105,528 | |
| 112,157 | |
| 113,747 | |
| 113,790 | |
| 115,781 | |
| 735 |
| 8,232 |
2015 |
|
|
|
|
|
|
|
|
|
|
|
|
|
|
|
|
| 120,137 |
|
| 139,415 |
|
| 152,268 |
|
| 146,757 |
|
| 155,266 |
|
| 1,981 |
| 11,153 | | | | | | | | | | | | | |
| 120,137 | |
| 139,415 | |
| 152,268 | |
| 146,757 | |
| 155,266 | |
| 158,586 | |
| 1,789 |
| 11,156 |
2016 |
|
|
|
|
|
|
|
|
|
|
|
|
|
|
|
|
|
|
|
| 114,568 |
|
| 124,760 |
|
| 119,931 |
|
| 124,166 |
|
| 6,229 |
| 9,642 | | | | | | | | | | | | | | | | |
| 114,568 | |
| 124,760 | |
| 119,931 | |
| 124,166 | |
| 129,184 | |
| 3,616 |
| 9,651 |
2017 |
|
|
|
|
|
|
|
|
|
|
|
|
|
|
|
|
|
|
|
|
|
|
| 81,986 |
|
| 79,156 |
|
| 71,068 |
|
| 12,343 |
| 7,061 | | | | | | | | | | | | | | | | | | | |
| 81,986 | |
| 79,156 | |
| 71,068 | |
| 71,849 | |
| 6,510 |
| 7,073 |
2018 |
|
|
|
|
|
|
|
|
|
|
|
|
|
|
|
|
|
|
|
|
|
|
|
|
|
| 87,993 |
|
| 78,777 |
|
| 28,210 |
| 7,146 | | | | | | | | | | | | | | | | | | | | | | |
| 87,993 | |
| 78,777 | |
| 82,562 | |
| 14,403 |
| 7,216 |
2019 |
|
|
|
|
|
|
|
|
|
|
|
|
|
|
|
|
|
|
|
|
|
|
|
|
|
|
|
|
| 115,393 |
|
| 72,508 |
| 8,141 | | | | | | | | | | | | | | | | | | | | | | | | | |
| 115,393 | |
| 109,586 | |
| 33,811 |
| 9,211 |
2020 | | | | | | | | | | | | | | | | | | | | | | | | | | | | |
| 98,045 | |
| 62,409 |
| 5,403 | |||||||||||||||||||||||||||||||||||
| | | | | | | | | | | | | | | | | | | | | | | | | | | | | $ | 900,681 | | $ | 123,568 | | | |||||||||||||||||||||||||||||||||||
| | | | | | | | | | | | | | | | | | | | | | | | | | | | | | | | | | | | |||||||||||||||||||||||||||||||||||
|
| Commercial Auto – Paid | | | | | | | | | ||||||||||||||||||||||||||||||||||||||||||||||||||||||||||||
| | Unaudited | | | | | | | | | ||||||||||||||||||||||||||||||||||||||||||||||||||||||||||||
|
|
|
|
|
|
|
|
|
|
|
|
|
|
|
|
|
|
|
|
|
|
|
|
|
|
|
|
| $ | 810,871 |
| $ | 123,551 |
|
| |||||||||||||||||||||||||||||||||||
|
|
|
|
|
|
|
|
|
|
|
|
|
|
|
|
|
|
|
|
|
|
|
|
|
|
|
|
|
|
|
|
|
|
|
| |||||||||||||||||||||||||||||||||||
|
| Commercial Auto – Paid |
|
|
|
|
|
|
|
| ||||||||||||||||||||||||||||||||||||||||||||||||||||||||||||
|
| Unaudited |
|
|
|
|
|
|
|
| ||||||||||||||||||||||||||||||||||||||||||||||||||||||||||||
|
| For the Years Ended |
|
|
|
|
| |||||||||||||||||||||||||||||||||||||||||||||||||||||||||||||||
| | For the Years Ended | | | | | | |||||||||||||||||||||||||||||||||||||||||||||||||||||||||||||||
Accident Year |
| 2010 |
| 2011 |
| 2012 |
| 2013 |
| 2014 |
| 2015 |
| 2016 |
| 2017 |
| 2018 |
| 2019 |
|
|
|
|
|
| 2011 |
| 2012 |
| 2013 |
| 2014 |
| 2015 |
| 2016 |
| 2017 |
| 2018 |
| 2019 |
| 2020 | | | | | | ||||||||||||||||||||
2010 |
| $ | 3,105 |
| $ | 7,866 |
| $ | 12,346 |
| $ | 13,723 |
| $ | 17,275 |
| $ | 17,829 |
| $ | 18,074 |
| $ | 19,098 |
| $ | 19,138 |
| $ | 19,162 |
|
|
|
|
| |||||||||||||||||||||||||||||||||||
2011 |
|
|
|
|
| 4,717 |
|
| 7,791 |
|
| 7,250 |
|
| 9,111 |
|
| 11,587 |
|
| 12,005 |
|
| 12,123 |
|
| 12,117 |
|
| 12,128 |
|
|
|
|
| | $ | 4,717 | | $ | 7,791 | | $ | 7,250 | | $ | 9,111 | | $ | 11,587 | | $ | 12,005 | | $ | 12,123 | | $ | 12,117 | | $ | 12,128 | | $ | 12,754 | | | | | |
2012 |
|
|
|
|
|
|
|
| 6,660 |
|
| 15,397 |
|
| 25,280 |
|
| 33,248 |
|
| 39,680 |
|
| 40,852 |
|
| 41,305 |
|
| 38,657 |
|
|
|
|
| |
| | |
| 6,660 | |
| 15,397 | |
| 25,280 | |
| 33,248 | |
| 39,680 | |
| 40,852 | |
| 41,305 | |
| 38,657 | |
| 40,090 | | | | | |
2013 |
|
|
|
|
|
|
|
|
|
|
| 13,015 |
|
| 26,773 |
|
| 43,403 |
|
| 64,073 |
|
| 72,906 |
|
| 71,010 |
|
| 79,066 |
|
|
|
|
| |
|
| |
| | |
| 13,015 | |
| 26,773 | |
| 43,403 | |
| 64,073 | |
| 72,906 | |
| 71,010 | |
| 79,066 | |
| 79,556 | | | | | |
2014 |
|
|
|
|
|
|
|
|
|
|
|
|
|
| 21,692 |
|
| 52,048 |
|
| 74,431 |
|
| 96,385 |
|
| 108,102 |
|
| 110,883 |
|
|
|
|
| |
|
| |
|
| |
| | |
| 21,692 | |
| 52,048 | |
| 74,431 | |
| 96,385 | |
| 108,102 | |
| 110,883 | |
| 113,915 | | | | | |
2015 |
|
|
|
|
|
|
|
|
|
|
|
|
|
|
|
|
| 37,964 |
|
| 74,524 |
|
| 107,063 |
|
| 126,831 |
|
| 142,806 |
|
|
|
|
| |
|
| |
|
| |
|
| |
| | |
| 37,964 | |
| 74,524 | |
| 107,063 | |
| 126,831 | |
| 142,806 | |
| 149,411 | | | | | |
2016 |
|
|
|
|
|
|
|
|
|
|
|
|
|
|
|
|
|
|
|
| 39,580 |
|
| 63,123 |
|
| 83,161 |
|
| 102,003 |
|
|
|
|
| |
|
| |
|
| |
|
| |
|
| |
| | |
| 39,580 | |
| 63,123 | |
| 83,161 | |
| 102,003 | |
| 118,545 | | | | | |
2017 |
|
|
|
|
|
|
|
|
|
|
|
|
|
|
|
|
|
|
|
|
|
|
| 19,950 |
|
| 34,659 |
|
| 47,199 |
|
|
|
|
| |
|
| |
|
| |
|
| |
|
| |
|
| |
| | |
| 19,950 | |
| 34,659 | |
| 47,199 | |
| 58,538 | | | | | |
2018 |
|
|
|
|
|
|
|
|
|
|
|
|
|
|
|
|
|
|
|
|
|
|
|
|
|
| 16,709 |
|
| 32,698 |
|
|
|
|
| |
|
| |
|
| |
|
| |
|
| |
|
| |
|
| |
| | |
| 16,709 | |
| 32,698 | |
| 52,510 | | | | | |
2019 |
|
|
|
|
|
|
|
|
|
|
|
|
|
|
|
|
|
|
|
|
|
|
|
|
|
|
|
|
| 22,082 |
|
|
|
|
| |
|
| |
|
| |
|
| |
|
| |
|
| |
|
| |
|
| |
| | |
| 22,082 | |
| 51,448 | | | | | |
|
|
|
|
|
|
|
|
|
|
|
|
|
|
|
|
|
|
|
|
|
|
|
|
|
|
|
|
|
| 606,684 |
|
|
|
|
| |||||||||||||||||||||||||||||||||||
|
|
|
|
|
|
|
|
|
|
|
|
|
|
|
|
|
|
|
|
| Incurred less paid |
|
| $ | 204,187 |
|
|
|
|
| ||||||||||||||||||||||||||||||||||||||||
2020 | |
|
| |
|
| |
|
| |
|
| |
|
| |
|
| |
|
| |
|
| |
| | |
| 17,198 | | | | | | |||||||||||||||||||||||||||||||||||
| | | | | | | | | | | | | | | | | | | | | | | | | | | | |
| 693,965 | | | | | | |||||||||||||||||||||||||||||||||||
| | | | | | | | | | | | | | | | | | | | | Incurred less paid | | | $ | 206,716 | | | | | | ||||||||||||||||||||||||||||||||||||||||
The following table presents the historical average annual percentage payout of incurred claims, net of reinsurance, as of December 31, 2019:2020:
|
|
|
|
|
|
|
|
|
|
|
|
|
|
|
|
|
|
|
| |||||||||||||||||||
| | | | | | | | | | | | | | | | | | | | |||||||||||||||||||
Year 1 |
| Year 2 |
| Year 3 |
| Year 4 |
| Year 5 |
| Year 6 |
| Year 7 |
| Year 8 |
| Year 9 |
| Year 10 |
|
| Year 2 |
| Year 3 |
| Year 4 |
| Year 5 |
| Year 6 |
| Year 7 |
| Year 8 |
| Year 9 |
| Year 10 |
|
23 | % | 22 | % | 19 | % | 17 | % | 12 | % | 1 | % | 6 | % | (2) | % | — | % | — | % | |||||||||||||||||||
22 | % | 22 | % | 19 | % | 17 | % | 12 | % | 2 | % | 5 | % | (2) | % | 3 | % | 5 | % | |||||||||||||||||||
122129
General Liability
The following tables represent information on unpaid losses and loss adjustment expenses incurred and cumulative paid losses, since 2011 for the Company’s General Liability line, in thousands except claim counts:
| | | | | | | | | | | | | | | | | | | | | | | | | | | | | | | | | | | |
General Liability – Incurred | |||||||||||||||||||||||||||||||||||
| | Unaudited | | | | | IBNR as of | | Cumulative | ||||||||||||||||||||||||||
| | For the Years Ended | | December 31, | | Claim | |||||||||||||||||||||||||||||
Accident Year |
| 2011 |
| 2012 |
| 2013 |
| 2014 |
| 2015 |
| 2016 |
| 2017 |
| 2018 |
| 2019 |
| 2020 |
| 2020 |
| Counts | |||||||||||
Prior | | | | | | | | | | | | | | | | | | | | | | | | | | | | | | | | $ | 6,356 | | |
2011 | | $ | 45,894 | | $ | 58,633 | | $ | 61,398 | | $ | 60,375 | | $ | 63,264 | | $ | 67,791 | | $ | 62,127 | | $ | 66,641 | | $ | 64,682 | | $ | 64,241 | | | 524 |
| 1,533 |
2012 | |
|
| |
| 42,685 | |
| 43,677 | |
| 38,288 | |
| 42,401 | |
| 45,771 | |
| 46,312 | |
| 48,096 | |
| 50,509 | | | 51,503 | |
| 1,292 |
| 1,488 |
2013 | |
|
| |
|
| |
| 48,466 | |
| 61,785 | |
| 62,618 | |
| 70,459 | |
| 60,613 | |
| 61,796 | |
| 69,565 | | | 69,835 | |
| 5,375 |
| 2,615 |
2014 | |
|
| |
|
| |
|
| |
| 70,878 | |
| 77,255 | |
| 78,801 | |
| 93,468 | |
| 104,281 | |
| 114,976 | | | 120,427 | |
| 11,986 |
| 3,103 |
2015 | |
|
| |
|
| |
|
| |
|
| |
| 80,225 | |
| 80,411 | |
| 78,163 | |
| 80,514 | |
| 93,808 | | | 98,153 | |
| 14,628 |
| 3,018 |
2016 | |
|
| |
|
| |
|
| |
|
| |
|
| |
| 93,737 | |
| 101,479 | |
| 92,401 | |
| 91,228 | | | 98,812 | |
| 20,493 |
| 2,898 |
2017 | |
|
| |
|
| |
|
| |
|
| |
|
| |
|
| |
| 99,845 | |
| 100,306 | |
| 94,554 | | | 107,430 | |
| 44,829 |
| 2,992 |
2018 | |
|
| |
|
| |
|
| |
|
| |
|
| |
|
| |
|
| |
| 142,486 | |
| 137,525 | | | 137,672 | |
| 79,149 |
| 3,113 |
2019 | |
| | | | | | | | | | | | | | | | | | | | | | | |
| 153,650 | | | 159,357 | |
| 116,813 |
| 2,893 |
2020 | |
| | | | | | | | | | | | | | | | | | | | | | | | | | | | 164,875 | |
| 149,052 |
| 2,076 |
| | | | | | | | | | | | | | | | | | | | | | | | | | | | | $ | 1,072,305 | | $ | 450,497 | | |
| | | | | | | | | | | | | | | | | | | | | | | | | | | | | | | | | | | |
| | General Liability – Paid | | | | | | ||||||||||||||||||||||||||||
| | Unaudited | | | | | | | | | |||||||||||||||||||||||||
| | For the Years Ended | | | | | | ||||||||||||||||||||||||||||
Accident Year |
| 2011 |
| 2012 |
| 2013 |
| 2014 |
| 2015 |
| 2016 |
| 2017 |
| 2018 |
| 2019 |
| 2020 | | | | | | ||||||||||
2011 | | $ | 5,009 | | $ | 18,912 | | $ | 30,123 | | $ | 37,344 | | $ | 44,166 | | $ | 50,136 | | $ | 54,250 | | $ | 56,659 | | $ | 57,932 | | $ | 59,367 | | | | | |
2012 | |
|
| |
| 945 | |
| 8,844 | |
| 14,751 | |
| 24,257 | |
| 32,585 | |
| 36,521 | |
| 40,754 | |
| 45,509 | | | 48,297 | | | | | |
2013 | |
|
| |
|
| |
| 1,930 | |
| 10,941 | |
| 22,152 | |
| 36,493 | |
| 46,821 | |
| 55,148 | |
| 66,439 | | | 69,798 | | | | | |
2014 | |
|
| |
|
| |
|
| |
| 5,456 | |
| 14,032 | |
| 28,581 | |
| 41,079 | |
| 53,712 | |
| 73,491 | | | 84,494 | | | | | |
2015 | |
|
| |
|
| |
|
| |
|
| |
| 5,404 | |
| 14,720 | |
| 25,931 | |
| 39,407 | |
| 61,168 | | | 75,037 | | | | | |
2016 | |
|
| |
|
| |
|
| |
|
| |
|
| |
| 3,547 | |
| 13,873 | |
| 25,223 | |
| 47,333 | | | 63,646 | | | | | |
2017 | |
|
| |
|
| |
|
| |
|
| |
|
| |
|
| |
| 2,596 | |
| 11,279 | |
| 26,354 | | | 40,828 | | | | | |
2018 | |
|
| |
|
| |
|
| |
|
| |
|
| |
|
| |
|
| |
| 2,223 | |
| 15,625 | | | 31,347 | | | | | |
2019 | |
| | | | | | | | | | | | | | | | | | | | | | | |
| 3,487 | | | 18,404 | | | | | |
2020 | |
| | | | | | | | | | | | | | | | | | | | | | | | | | | | 2,276 | | | | | |
| | | | | | | | | | | | | | | | | | | | | | | | | | | | |
| 493,494 | | | | | |
| | | | | | | | | | | | | | | | | Incurred less paid | | | | | $ | 578,811 | | | | | | |||||||
The following table presents the historical average annual percentage payout of incurred claims, net of reinsurance, as of December 31, 2020:
| | | | | | | | | | | | | | | | | | | |
Year 1 |
| Year 2 |
| Year 3 |
| Year 4 |
| Year 5 |
| Year 6 |
| Year 7 |
| Year 8 |
| Year 9 |
| Year 10 |
|
3 | % | 11 | % | 13 | % | 15 | % | 15 | % | 13 | % | 10 | % | 6 | % | 4 | % | 2 | % |
130
Workers’ Compensation
The following tables represent information on unpaid losses and loss adjustment expenses incurred and cumulative paid losses, since 2011 for the Company’s Workers’ Compensation line, in thousands except claim counts:
| | | | | | | | | | | | | | | | | | | | | | | | | | | | | | | | | | | |
Workers’ Compensation – Incurred | |||||||||||||||||||||||||||||||||||
| | Unaudited | | | | | IBNR as of | | Cumulative | ||||||||||||||||||||||||||
| | For the Years Ended | | December 31, | | Claim | |||||||||||||||||||||||||||||
Accident Year |
| 2011 |
| 2012 |
| 2013 |
| 2014 |
| 2015 |
| 2016 |
| 2017 |
| 2018 |
| 2019 |
| 2020 |
| 2020 |
| Counts | |||||||||||
Prior | | | | | | | | | | | | | | | | | | | | | | | | | | | | | | | | $ | 13,370 | | |
2011 | | $ | 28,987 | | $ | 22,186 | | $ | 23,576 | | $ | 21,411 | | $ | 19,489 | | $ | 21,943 | | $ | 18,986 | | $ | 21,247 | | $ | 23,750 | | $ | 26,870 | | | 6,450 |
| 203 |
2012 | | | | | | 46,503 | |
| 51,724 | |
| 53,038 | |
| 48,983 | |
| 47,373 | |
| 38,501 | |
| 38,835 | |
| 38,919 | |
| 39,689 | |
| 2,739 |
| 1,776 |
2013 | | | | | | | | | 76,844 | |
| 71,683 | |
| 70,939 | |
| 68,109 | |
| 71,532 | |
| 69,729 | |
| 64,727 | |
| 66,457 | |
| 8,150 |
| 2,702 |
2014 | | | | | | | | | | | | 88,181 | |
| 81,628 | |
| 83,543 | |
| 74,134 | |
| 69,886 | |
| 67,784 | |
| 69,102 | |
| 12,909 |
| 2,682 |
2015 | | | | | | | | | | | | | | | 101,762 | |
| 101,410 | |
| 89,383 | |
| 82,212 | |
| 87,570 | |
| 81,504 | |
| 13,798 |
| 3,891 |
2016 | | | | | | | | | | | | | | | | | | 99,292 | |
| 109,623 | |
| 103,382 | |
| 102,716 | |
| 85,553 | |
| 14,347 |
| 4,373 |
2017 | | | | | | | | | | | | | | | | | | | | | 102,250 | |
| 101,691 | |
| 93,134 | |
| 85,197 | |
| 45,929 |
| 4,698 |
2018 | | | | | | | | | | | | | | | | | | | | | | |
| 116,278 | |
| 118,973 | |
| 116,178 | |
| 62,582 |
| 5,157 |
2019 | | | | | | | | | | | | | | | | | | | | | | | | | |
| 97,485 | |
| 94,627 | |
| 52,783 |
| 5,081 |
2020 | | | | | | | | | | | | | | | | | | | | | | | | | | | | |
| 45,460 | |
| 31,863 |
| 1,853 |
| | | | | | | | | | | | | | | | | | | | | | | | | | | | | $ | 710,637 | | $ | 264,920 | | |
| | | | | | | | | | | | | | | | | | | | | | | | | | | | | | | | | | | |
| | Workers’ Compensation – Paid | | | | | | ||||||||||||||||||||||||||||
| | Unaudited | | | | | | | | | |||||||||||||||||||||||||
| | For the Years Ended | | | | | | ||||||||||||||||||||||||||||
Accident Year |
| 2011 |
| 2012 |
| 2013 |
| 2014 |
| 2015 |
| 2016 |
| 2017 |
| 2018 |
| 2019 |
| 2020 | | | | | | ||||||||||
2011 | | $ | 473 | | $ | 4,148 | | $ | 5,127 | | $ | 5,503 | | $ | 7,239 | | $ | 8,662 | | $ | 8,978 | | $ | 9,971 | | $ | 10,841 | | $ | 11,525 | | | | | |
2012 | | | | | | 2,381 | |
| 5,481 | |
| 10,598 | |
| 14,634 | |
| 18,468 | |
| 23,694 | |
| 25,495 | |
| 26,237 | |
| 27,785 | | | | | |
2013 | | | | | | | | | 2,639 | |
| 12,579 | |
| 20,520 | |
| 26,088 | |
| 29,036 | |
| 32,962 | |
| 35,793 | |
| 38,745 | | | | | |
2014 | | | | | | | | | | | | 4,644 | |
| 14,901 | |
| 24,411 | |
| 35,131 | |
| 39,846 | |
| 42,423 | |
| 49,285 | | | | | |
2015 | | | | | | | | | | | | | | | 6,504 | |
| 18,434 | |
| 27,423 | |
| 33,543 | |
| 38,061 | |
| 42,790 | | | | | |
2016 | | | | | | | | | | | | | | | | | | 10,891 | |
| 24,557 | |
| 35,385 | |
| 43,171 | |
| 48,867 | | | | | |
2017 | | | | | | | | | | | | | | | | | | | | | 8,631 | |
| 22,462 | |
| 30,776 | |
| 27,305 | | | | | |
2018 | | | | | | | | | | | | | | | | | | | | | | |
| 9,563 | |
| 29,008 | |
| 37,098 | | | | | |
2019 | | | | | | | | | | | | | | | | | | | | | | | | | |
| 9,745 | |
| 26,871 | | | | | |
2020 | | | | | | | | | | | | | | | | | | | | | | | | | | | | |
| 7,219 | | | | | |
| | | | | | | | | | | | | | | | | | | | | | | | | | | | |
| 317,490 | | | | | |
| | | | | | | | | | | | | | | | |
| | | Incurred less paid | | | | | $ | 393,147 | | | | | | ||||
The following table presents the historical average annual percentage payout of incurred claims, net of reinsurance, as of December 31, 2020:
| | | | | | | | | | | | | | | | | | | |
Year 1 |
| Year 2 |
| Year 3 |
| Year 4 |
| Year 5 |
| Year 6 |
| Year 7 |
| Year 8 |
| Year 9 |
| Year 10 |
|
9 | % | 15 | % | 10 | % | 7 | % | 6 | % | 6 | % | 6 | % | 4 | % | 4 | % | 3 | % |
131
Commercial Multiple Peril
The following tables represent information on unpaid losses and loss adjustment expenses incurred and cumulative paid losses, since 2011 for the Company’s Commercial Multiple Peril line, in thousands except claim counts:
| | | | | | | | | | | | | | | | | | | | | | | | | | | | | | | | | |
Commercial Multiple Peril – Incurred | |||||||||||||||||||||||||||||||||
| | Unaudited | | | | | IBNR as of | | Cumulative | ||||||||||||||||||||||||
| | For the Years Ended | | December 31, | | Claim | |||||||||||||||||||||||||||
Accident Year |
| 2011 |
| 2012 |
| 2013 |
| 2014 |
| 2015 |
| 2016 |
| 2017 |
| 2018 |
| 2019 |
| 2020 |
| 2020 |
| Counts | |||||||||
Prior | | | | | | | | | | | | | | | | | | | | | | | | | | | | | | | | | |
2011 | $ | — | $ | — | | $ | 11 | | $ | 7 | | $ | 6 | | $ | 6 | | $ | 2 | | $ | 2 | | $ | 2 | | $ | 2 | | $ | — | | — |
2012 | | | | 96 | | | 94 | | | 73 | | | 49 | | | 39 | | | 813 | | | 813 | | | 813 | | | 813 | | | — | | 5 |
2013 |
| | | | | | 968 | |
| 1,065 | |
| 1,051 | |
| 1,442 | |
| 8,226 | |
| 8,250 | |
| 8,198 | | | 8,286 | | | 2 |
| 54 |
2014 | | | | | | | | | | 13,037 | |
| 15,884 | |
| 16,448 | |
| 25,915 | |
| 27,126 | |
| 30,172 | |
| 31,876 | |
| 1,067 |
| 615 |
2015 | | | | | | | | | | | | | 27,876 | |
| 27,542 | |
| 17,952 | |
| 18,345 | |
| 24,144 | |
| 24,637 | |
| 3,462 |
| 1,017 |
2016 | | | | | | | | | | | | | | | | 34,010 | |
| 30,379 | |
| 34,883 | |
| 44,758 | |
| 48,370 | |
| 8,071 |
| 1,203 |
2017 | | | | | | | | | | | | | | | | | | | 37,760 | |
| 44,044 | |
| 44,260 | |
| 56,196 | |
| 12,530 |
| 1,455 |
2018 | | | | | | | | | | | | | | | | | | | | | | 39,507 | |
| 37,015 | |
| 35,681 | |
| 14,143 |
| 1,237 |
2019 | | | | | | | | | | | | | | | | | | | | | | | | | 36,895 | |
| 38,194 | |
| 19,552 |
| 1,151 |
2020 | | | | | | | | | | | | | | | | | | | | | | | | | | |
| 47,101 | |
| 25,682 |
| 906 |
| | | | | | | | | | | | | | | | | | | | | | | | | | | $ | 291,156 | | $ | 84,509 | | |
| | | | | | | | | | | | | | | | | | | | | | | | | | | | | | | | | |
Commercial Multiple Peril – Paid | | | | | | ||||||||||||||||||||||||||||
| | Unaudited | | | | | | | | | |||||||||||||||||||||||
| | For the Years Ended | | | | | | ||||||||||||||||||||||||||
Accident Year |
| 2011 |
| 2012 |
| 2013 |
| 2014 |
| 2015 |
| 2016 |
| 2017 |
| 2018 |
| 2019 |
| 2020 | | | | | | ||||||||
2011 | $ | — | $ | — | | $ | — | | $ | — | | $ | — | | $ | — | | $ | 2 | | $ | 2 | | $ | 2 | | $ | 2 | | | | | |
2012 | | | | — | | | — | | | 1 | | | 1 | | | 2 | | | 813 | | | 813 | | | 813 | | | 813 | | | | | |
2013 | | | | | | | 43 | |
| 192 | |
| 312 | |
| 754 | |
| 8,083 | |
| 8,149 | |
| 8,157 | |
| 8,265 | | | | | |
2014 | | | | | | | | | | 1,795 | |
| 4,271 | |
| 7,358 | |
| 20,545 | |
| 22,880 | |
| 26,366 | |
| 27,666 | | | | | |
2015 | | | | | | | | | | | | | 6,879 | |
| 14,751 | |
| 8,949 | |
| 14,293 | |
| 20,676 | |
| 22,552 | | | | | |
2016 | | | | | | | | | | | | | | | | 4,974 | |
| 7,028 | |
| 16,715 | |
| 27,870 | |
| 36,813 | | | | | |
2017 | | | | | | | | | | | | | | | | | | | 7,270 | |
| 19,733 | |
| 27,816 | |
| 36,941 | | | | | |
2018 | | | | | | | | | | | | | | | | | | | | | | 5,323 | |
| 11,953 | |
| 16,420 | | | | | |
2019 | | | | | | | | | | | | | | | | | | | | | | | |
| 5,940 | |
| 12,857 | | | | | |
2020 | | | | | | | | | | | | | | | | | | | | | | | | | | | | 13,054 | | | | | |
| | | | | | | | | | | | | | | | | | | | | | | | | | |
| 175,383 | | | | | |
| | | | | | | | | | | | | | | | | | Incurred less paid | | | | | $ | 115,773 | | | | | | ||||
The following table presents the historical average annual percentage payout of incurred claims, net of reinsurance, as of December 31, 2020:
| | | | | | | | | | | | | | | | | | | |
Year 1 |
| Year 2 |
| Year 3 |
| Year 4 |
| Year 5 |
| Year 6 |
| Year 7 |
| Year 8 |
| Year 9 |
| Year 10 |
|
16 | % | 16 | % | 10 | % | 23 | % | 22 | % | 10 | % | 3 | % | 1 | % | — | % | — | % |
132
All Other
The following tables represent information on unpaid losses and loss adjustment expenses incurred and cumulative paid losses, since 2011 for the Company’s All Other lines in thousands except claim counts:
| | | | | | | | | | | | | | | | | | | | | | | | | | | | | | | | | | | |
All Other Lines – Incurred | |||||||||||||||||||||||||||||||||||
| | Unaudited | | | | | IBNR as of | | Cumulative | ||||||||||||||||||||||||||
| | For the Years Ended | | December 31, | | Claim | |||||||||||||||||||||||||||||
Accident Year |
| 2011 |
| 2012 |
| 2013 |
| 2014 |
| 2015 |
| 2016 |
| 2017 |
| 2018 |
| 2019 |
| 2020 |
| 2020 |
| Counts | |||||||||||
Prior | | | | | | | | | | | | | | | | | | | | | | | | | | | | | | | | $ | 3,767 | | |
2011 | | $ | 26,899 | | $ | 34,597 | | $ | 30,507 | | $ | 29,749 | | $ | 29,238 | | $ | 28,794 | | $ | 31,176 | | $ | 31,018 | | $ | 30,450 | | $ | 27,245 | | | — |
| 1,466 |
2012 | |
|
| |
| 26,995 | |
| 32,022 | |
| 30,266 | |
| 30,551 | |
| 30,678 | |
| 29,250 | |
| 29,803 | |
| 29,051 | |
| 32,080 | |
| — |
| 1,618 |
2013 | |
|
| |
|
| |
| 36,900 | |
| 36,992 | |
| 34,287 | |
| 33,773 | |
| 26,428 | |
| 25,859 | |
| 25,890 | |
| 25,594 | |
| 16 |
| 1,650 |
2014 | |
|
| |
|
| |
|
| |
| 40,562 | |
| 42,938 | |
| 39,473 | |
| 28,192 | |
| 27,749 | |
| 30,011 | |
| 29,848 | |
| 212 |
| 1,718 |
2015 | |
|
| |
|
| |
|
| |
|
| |
| 54,269 | |
| 58,501 | |
| 69,660 | |
| 67,924 | |
| 70,154 | |
| 71,038 | |
| 846 |
| 1,814 |
2016 | |
|
| |
|
| |
|
| |
|
| |
|
| |
| 48,824 | |
| 57,296 | |
| 55,607 | |
| 53,398 | |
| 54,398 | |
| 884 |
| 1,999 |
2017 | |
|
| |
|
| |
|
| |
|
| |
|
| |
|
| |
| 33,108 | |
| 36,102 | |
| 36,489 | |
| 33,730 | |
| 1,165 |
| 2,545 |
2018 | |
|
| |
|
| |
|
| |
|
| |
|
| |
|
| |
|
| |
| 35,839 | |
| 33,909 | |
| 31,452 | |
| 2,440 |
| 2,529 |
2019 | |
| | | | | | | | | | | | | | | | | | | | | | | |
| 54,550 | |
| 58,316 | |
| 8,799 |
| 2,682 |
2020 | |
| | | | | | | | | | | | | | | | | | | | | | | | | | |
| 74,698 | |
| 34,166 |
| 2,026 |
| | | | | | | | | | | | | | | | | | | | | | | | | | | | | $ | 438,399 | | $ | 52,295 | | |
| | | | | | | | | | | | | | | | | | | | | | | | | | | | | | | | | | | |
All Other Lines – Paid | | | | | | ||||||||||||||||||||||||||||||
| | Unaudited | | | | | | | | | |||||||||||||||||||||||||
| | For the Years Ended | | | | | | ||||||||||||||||||||||||||||
Accident Year |
| 2011 |
| 2012 |
| 2013 |
| 2014 |
| 2015 |
| 2016 |
| 2017 |
| 2018 |
| 2019 |
| 2020 | | | | | | ||||||||||
2011 | | $ | 4,597 | | $ | 20,155 | | $ | 22,603 | | $ | 24,773 | | $ | 25,251 | | $ | 27,608 | | $ | 30,231 | | $ | 30,259 | | $ | 30,344 | | $ | 27,150 | | | | | |
2012 | | | | | | 6,634 | |
| 18,554 | |
| 22,619 | |
| 26,821 | |
| 28,639 | |
| 28,319 | |
| 28,542 | |
| 28,577 | |
| 31,841 | | | | | |
2013 | | | | | | | | | 9,838 | |
| 23,526 | |
| 29,009 | |
| 31,569 | |
| 25,144 | |
| 25,206 | |
| 25,408 | |
| 25,404 | | | | | |
2014 | | | | | | | | | | | | 11,150 | |
| 26,667 | |
| 32,126 | |
| 24,846 | |
| 26,388 | |
| 27,770 | |
| 29,797 | | | | | |
2015 | | | | | | | | | | | | | | | 18,292 | |
| 37,279 | |
| 65,390 | |
| 67,563 | |
| 69,037 | |
| 70,459 | | | | | |
2016 | | | | | | | | | | | | | | | | | | 19,279 | |
| 41,618 | |
| 44,104 | |
| 46,119 | |
| 48,221 | | | | | |
2017 | | | | | | | | | | | | | | | | | | | | | 15,580 | |
| 28,070 | |
| 31,792 | |
| 31,340 | | | | | |
2018 | | | | | | | | | | | | | | | | | | | | | | | | 11,194 | |
| 23,605 | |
| 26,503 | | | | | |
2019 | | | | | | | | | | | | | | | | | | | | | | | | | |
| 25,268 | |
| 44,663 | | | | | |
2020 | | | | | | | | | | | | | | | | | | | | | | | | | | | | |
| 26,479 | | | | | |
| | | | | | | | | | | | | | | | | | | | | | | | | | | | |
| 361,857 | | | | | |
| | | | | | | | | | | | | | | | | | | | | Incurred less paid | |
| | | $ | 76,542 | | | | | | |||
The following table presents the historical average annual percentage payout of incurred claims, net of reinsurance, as of December 31, 2020:
| | | | | | | | | | | | | | | | | | | |
Year 1 |
| Year 2 |
| Year 3 |
| Year 4 |
| Year 5 |
| Year 6 |
| Year 7 |
| Year 8 |
| Year 9 |
| Year 10 |
|
34 | % | 39 | % | 18 | % | 2 | % | — | % | 3 | % | 4 | % | — | % | 6 | % | (12) | % |
The Company participated in an insurance pool in both the issuance of umbrella casualty insurance and ocean marine liability insurance during the period from 1978 to 1996. Depending on the underwriting year, the insurance pools’ net retention per occurrence after applicable reinsurance ranged from $250,000 to $2,000,000. The Company’s effective pool participation on such risks varied from 11% in 1978 to 59% in 1985, which exposed the Company to asbestos and environmental losses. Subsequent to this period, the pools substantially reduced their umbrella writings and coverage was provided to smaller insureds.
The Company’s asbestos and environmental related losses were as follows:
| | | | | | | | | |
| | December 31, 2020 | |||||||
($ in thousands) |
| Gross |
| Ceded |
| Net | |||
Balance at beginning of year | | $ | 12,810 | | $ | 4,518 | | $ | 8,292 |
Incurred losses and loss adjustment expense | |
| 175 | |
| 36 | |
| 139 |
Payments for losses and loss adjustment expenses | |
| 300 | |
| 84 | |
| 216 |
Balance at end of year | | $ | 12,685 | | $ | 4,470 | | $ | 8,215 |
133
| | | | | | | | | |
| | December 31, 2019 | |||||||
($ in thousands) |
| Gross |
| Ceded |
| Net | |||
Balance at beginning of year | | $ | 14,262 | | $ | 6,016 | | $ | 8,246 |
Incurred losses and loss adjustment expense | |
| 430 | |
| 66 | |
| 364 |
Payments for losses and loss adjustment expenses | |
| 1,882 | |
| 1,564 | |
| 318 |
Balance at end of year | | $ | 12,810 | | $ | 4,518 | | $ | 8,292 |
Additionally, the Company has assumed asbestos and environmental reserves on a retroactive basis from prior members of the pool. The gross liability related to the same was $7.9 million and $8.4 million as of December 31, 2020 and 2019 respectively.
The Company believes that the uncertainty surrounding asbestos and environmental exposures, including issues as to insureds’ liabilities, ascertainment of loss date, definitions of occurrence, scope of coverage, policy limits and application and interpretation of policy terms, including exclusions, all affect the estimation of ultimate losses. Under such circumstances, it is difficult to determine the ultimate loss for asbestos and environmental-related claims. Given the uncertainty in this area, losses from asbestos and environmental-related claims may develop adversely and accordingly, management is unable to estimate the range of possible loss that could arise from asbestos and environmental-related claims. However, the Company’s net unpaid reserves for loss and loss adjustment expenses, in the aggregate, as of December 31, 2020, represent management’s best estimate.
Salvage and Subrogation
Estimates of salvage and subrogation recoverable on paid and unpaid losses have been recorded as a reduction of unpaid losses and amounted to $52.1 million and $27.5 million at December 31, 2020 and 2019, respectively.
Deferred Policy Acquisition Costs
The following table presents a roll forward of the deferred policy acquisition costs and are net of reinsurance:
| | | |
($ in thousands) |
| | |
December 31, 2018 | | $ | 93,613 |
Acquisition costs deferred | |
| 189,970 |
Acquisition costs expensed | |
| (184,771) |
December 31, 2019 | |
| 98,812 |
Acquisition costs deferred | |
| 168,051 |
Acquisition costs expensed | |
| (172,426) |
December 31, 2020 | | $ | 94,437 |
12. Income Taxes
The Company is subject to the tax laws and regulations of the United States and various state jurisdictions. The Company files a consolidated federal tax return.
The Company has 1 non-U.S. subsidiary, PSBL, which has received an undertaking from the Minister of Finance in Bermuda that would exempt such company from Bermudian taxation until March 2035. As part of the 2019 restructuring, PSBL became a direct subsidiary of the Company and is subject to U.S. tax on its income.
PSIH acquired several entities in the U.K. in order to build the Syndicate. The Company changed its strategic direction with respect to its U.K. operations and placed the Syndicate into run-off, and then entered into a two-phase sale transaction to exit its U.K. operations, which closed in October 2017 and March 2018. There was 0 gain or loss recognized
134
from the sale of the U.K. operations. Additionally, there were 0 U.K. income taxes paid or recovered for the year ended December 31, 2018.
As discussed in Note. 1 Background, PSIH and PSEH were merged into the Company and PSBL became a direct subsidiary of the Company. The transactions were considered a tax-free contribution of capital from PGHL to the Company. Additionally, PGHL was merged into the Company and resulted in no tax effect in 2019, since the assets transferred were exchanged for common stock of the Company.
The components of deferred tax assets and liabilities as of December 31, 2020 and 2019, are as follows:
| | | | | | |
| | December 31 | ||||
($ in thousands) |
| 2020 |
| 2019 | ||
Deferred tax assets: | | |
| | |
|
Loss reserves | | $ | 14,568 | | $ | 13,289 |
Loss reserves transitional adjustment | |
| 6,104 | |
| 6,104 |
Unearned premiums | |
| 15,250 | |
| 16,785 |
Net operating loss carry forwards – state and local | |
| 17,444 | |
| 17,008 |
Net operating loss carry forwards – federal | |
| 646 | |
| 357 |
Capital loss carry forwards – federal | |
| 145 | |
| 1,519 |
Bad debt reserve | |
| 3,019 | |
| 3,229 |
Impairments | |
| 987 | |
| 517 |
Deferred compensation | |
| 5,268 | |
| 5,659 |
Amortization of intangibles | |
| 578 | |
| 695 |
Limited partnership income | | | 334 | | | 2,566 |
Lease liabilities | | | 602 | | | — |
Other | |
| 2,405 | |
| 3,151 |
Total deferred tax assets | |
| 67,350 | |
| 70,879 |
Less: valuation allowance | |
| (18,081) | |
| (17,604) |
Deferred tax assets, net of allowance | |
| 49,269 | |
| 53,275 |
Deferred tax liabilities: | |
|
| |
|
|
Deferred policy acquisition costs | |
| 19,856 | |
| 20,693 |
Loss reserve transitional adjustment | |
| 3,815 | |
| 4,578 |
Fair value adjustments | |
| 3,622 | |
| 3,628 |
Lease right-of-use assets | | | 587 | | | — |
Unrealized appreciation of investments | |
| 22,632 | |
| 8,669 |
Other | |
| 8,894 | |
| 10,904 |
Total deferred tax liabilities | |
| 59,406 | |
| 48,472 |
Net deferred income taxes | | $ | (10,137) | | $ | 4,803 |
On December 22, 2017, Tax Reform was signed into law, which among other implications, reduced the Company’s statutory corporate tax rate from 35% to 21% beginning with the 2018 tax year.
The Company has recorded a $6.1 million increase to its deferred tax asset related to the change in methodology for loss reserves as a result of Tax Reform. An offsetting deferred tax liability was also recorded at December 31, 2017, which is amortized into income over 8 years. The deferred tax liability as of December 31, 2020 is $3.8 million.
On March 27, 2020, the President of the United States signed into law the Coronavirus Aid, Relief, and Economic Security Act (the “CARES Act”). The CARES Act, among other things, includes certain income tax provisions for individuals and corporations; however, these benefits do not impact the Company’s current tax provision.
135
At December 31, 2020 and 2019, the U.S. federal NOLs that can be carried forward are $0.6 million and $0.4 million, respectively. As a result of the Company being able to fully utilize the remaining federal NOL after the valuation allowance, NOLs of $3.1 million, which were a component of discontinued operations, were reclassed to continuing operations as of December 31, 2020.
At December 31, 2020 and 2019, the state and local tax benefit of NOLs that can be carried forward are $17.4 million and $17.0 million, respectively, which is included in the state and local deferred tax asset. There were $0.1 million and $1.5 million of realized capital loss benefits that can be carried forward for the years ended December 31, 2020 and 2019, respectively. The range of years in which the federal NOLs can be brought forward against future tax liabilities is from 2020 through 2030.
The table below shows the tax benefit of the U.S. federal NOLs generated by year and expiration date:
| | | | | |
($ in thousands) |
| Amount |
| Expires | |
2010 | | $ | 646 |
| 2030 |
Total | | $ | 646 |
|
|
The Company’s valuation allowance account with respect to the deferred tax asset and the change in the account is as follows:
| | | | | | |
($ in thousands) |
| 2020 |
| 2019 | ||
Balance, beginning of year | | $ | 17,604 | | $ | 16,962 |
Change in valuation allowance | |
| 477 | |
| 642 |
Balance, end of year | | $ | 18,081 | | $ | 17,604 |
As of December 31, 2020, the Company’s valuation allowance of $18.1 million is attributable to the uncertainty in the realization of certain deferred tax assets attributable to U.S. federal and state NOLs.
The Company files tax returns subject to the tax regulations of federal, state and local tax authorities. A tax benefit taken in the tax return but not in the financial statements is known as an “unrecognized tax benefit.” A reconciliation of the beginning and ending amount of unrecognized tax benefits is as follows:
| | | | | | |
($ in thousands) |
| 2020 |
| 2019 | ||
Balance, beginning of year | | $ | 438 | | $ | 528 |
Additions for tax positions of prior years | |
| 34 | |
| 260 |
Reductions for tax positions of prior years | |
| (379) | |
| (350) |
Balance, end of year | | $ | 93 | | $ | 438 |
As of December 31, 2020, the Company recorded insignificant amount of interest and penalties and reduced its positions by $0.3 million as a result of an audit settlement.
136
The income tax provisions differ from the amounts computed by applying the federal statutory rate to the income before income taxes due to the following:
| | | | | | | | | |
($ in thousands) |
| 2020 |
| 2019 |
| 2018 | |||
Expected tax expense at statutory rates in taxable jurisdictions | | $ | 8,083 | | $ | 12,103 | | $ | 13,896 |
Tax-exempt interest | |
| (9) | |
| — | |
| (46) |
State taxes | |
| (377) | |
| (629) | |
| (10,746) |
Valuation allowance | |
| 477 | |
| 642 | |
| 10,451 |
Effect of provision to tax return filing adjustments | |
| — | |
| 42 | |
| — |
Goodwill impairment | |
| 2,501 | |
| — | |
| — |
Other | |
| 65 | |
| (21) | |
| (166) |
Total income tax expense | | $ | 10,740 | | $ | 12,137 | | $ | 13,389 |
The jurisdictions contributing to taxation of the Company are calculated using the U.S. rate of 21%. The income tax benefit differs from the amounts computed due to changes in the valuation allowance, prior period adjustments and the effect of Tax Reform.
There were $5.6 million and $0.1 million of U.S. income taxes paid for the years ended December 31, 2020 and 2018, respectively. There were $0.8 million of U.S. income taxes received for the year ended December 31, 2019. The U.S. federal income tax recoverable included in other assets amounted to $1.6 million, $0.2 million and $0.8 million for the years ended December 31, 2020, 2019 and 2018, respectively.
The Company files a consolidated federal income tax return with PSBL. Beginning November 23, 2010, pursuant to the terms of a tax-sharing agreement, which provides that the consolidated tax liability is allocated among affiliates based on separate return calculations and tax attributes utilized within the consolidated group and are reimbursed to the affiliate that generated them. Intercompany tax balances are settled annually.
The Company’s U.S. domestic entities are subject to federal and state examinations by tax authorities for tax year 2015 and subsequent and for the tax year 2009 and subsequent for examinations by local tax authorities. Currently, the Company’s non-insurance subsidiaries are under an income tax examination in New York State for tax years 2015 through 2018.
Section 382 of the Internal Revenue Code (“Section 382”) contains rules that limit the ability of a corporation that experiences an “ownership change” to utilize its net operating and capital loss carry forwards and certain built-in losses recognized in periods following the ownership change. An ownership change is generally any change in ownership of more than 50-percentage points of a corporation’s stock over a three-year period. These rules generally operate by focusing on ownership changes among stockholders owning directly or indirectly 5% or more of the stock of a corporation or any change in ownership arising from a new issuance of stock by the corporation. If a Section 382 limitation were to manifest, a portion of the tax losses could be deferred or could expire before the Company would be able to use them to offset positive taxable income in current or future tax periods. The Company’s inability to utilize tax losses could have a negative impact on the Company’s financial position and results of operations. This limitation is generally determined by multiplying the value of the entity as of the ownership change date by the applicable long-term tax-exempt rate.
On November 23, 2010, the Company acquired 100% of PSIG (formerly NYMAGIC, Inc.) outstanding common stock for a cash price of $25.75 per share or approximately $231.9 million; as a result, the Company experienced an ownership change for purposes of Section 382. As a result of this ownership change, the Company’s ability to utilize the NOL that existed as of November 23, 2010, is limited to approximately $9.0 million annually. As of December 31, 2020, a valuation allowance of $0.6 million has been recorded as a result of the NOL limitation.
137
On July 25, 2019, the Company merged with PGHL and the holders of PGHL equity interests received 6.46 shares of the Company’s common stock. The total merger consideration was 38,851,369 shares of the Company’s common stock which was 100% of the Company’s outstanding common stock. The Company did not experience an ownership change under Section 382. On July 29, 2019, the Company completed its IPO. The principal stockholders retained 80.3% of the Company’s outstanding common stock which did not result in an ownership change of 50% or more under Section 382.
On August 15, 2019 the Principal Stockholders completed the sale of 1,178,570 shares of the Company’s outstanding common stock and retained 77.5% of the outstanding common stock. The transaction did not result in an ownership change under Section 382.
13. Statutory Financial Information
The Company’s insurance subsidiaries are limited under state insurance laws, in the amount of ordinary dividends they may pay without regulatory approval. As of December 31, 2020, the maximum dividend that can be paid from the Company’s U.S. insurance subsidiaries to the Company without prior approval from the New York State Department of Financial Services is $66.8 million. Factors affecting the ability to pay dividends include levels of investment income in recent years and the Company’s statutory surplus position of the Company. Combined statutory net income and surplus of the Company’s domestic insurance subsidiaries as reported in the Combined Annual Statement were as follows:
| | | | | | | | | |
($ in thousands) |
| 2020 |
| 2019 |
| 2018 | |||
Combined statutory net income | | $ | 37,533 | | $ | 55,681 | | $ | 33,147 |
Combined statutory surplus | | $ | 668,060 | | $ | 568,777 | | $ | 473,575 |
The U.S. insurance company subsidiaries file statutory financial statements with each state in the format specified by the National Association of Insurance Commissioners (“NAIC”). The NAIC provides accounting guidelines for companies to file statutory financial statements and provides minimum solvency standards for all companies in the form of risk–based capital requirements. The policyholders’ surplus of each of the domestic insurance companies is above the minimum amount required by the NAIC. The actual statutory capital and surplus of the Company’s insurance subsidiaries was significantly above the amount of statutory capital and surplus necessary to satisfy regulatory requirements.
14. Debt
In November 2013, the Company issued $140.0 million of 7.5% senior unsecured notes (“Senior Unsecured Notes”) due November 2020 and provided for semi-annual interest payments. The Company repaid the Senior Unsecured Notes in its entirety on November 25, 2020.
In January 2015, the Company issued an additional $25.0 million 6.5% senior notes (“Senior Notes”) due November 2020 and provided for semi-annual interest payments. The Company repaid the Senior Notes in its entirety on November 25, 2020.
Termination of the Prior Credit Agreement
The Company, as borrower, was a party to a revolving loan agreement (the “Prior Credit Agreement”) dated January 29, 2018 and amended on March 15, 2019, for $50.0 million which was scheduled to mature on the earlier of (i) March 15, 2022, or (ii) 91 days before maturity of the Company’s 7.5% Senior Unsecured Notes due November 2020 and the Company’s 6.5% Senior Unsecured Notes due November 2020 (collectively, the “Notes”) or, if the Notes are amended or replaced, 91 days before the maturity of such amendment or replacement. The Company exercised its termination rights under the Prior Credit Agreement on June 12, 2020. There were 0 borrowings under the Prior Credit Agreement on the date of termination.
138
Credit Agreement
On June 12, 2020, the Company entered into a credit agreement (the “Credit Agreement”) with third-party lenders and an administrative agent. The Credit Agreement, which matures on June 11, 2023, provides for (i) a delayed draw term loan facility in the aggregate principal amount of up to $165.0 million (the “Term Loan Facility”), and (ii) an uncommitted revolving credit facility of up to $35.0 million (the “Revolving Credit Facility”), for which commitments had not been obtained as of the closing date.
Interest on borrowings under the Term Loan Facility and the Revolving Credit Facility are calculated at each drawdown date based on variable rates described in the Credit Agreement.
On November 25, 2020, the Company drew down $165.0 million under the Term Loan Facility and used the proceeds to fully redeem the Senior Unsecured Notes and Senior Notes.
Debt issuance costs of $4.6 million related to the Credit Agreement were incurred and are being amortized over the life of the loan.
Incremental Facility Agreement
On June 30, 2020, the Company entered into an Incremental Facility Agreement and Amendment (the “Agreement”), in the aggregate amount of $65.0 million, subject to the terms of the Credit Agreement. The Agreement had lenders commit to the previously uncommitted Revolving Credit Facility, and increased the available amount from the $35.0 million noted above to an aggregate of $65.0 million. Debt issuance costs of $0.5 million related to the Agreement were incurred and are being amortized over the life of the agreement.
On July 14, 2020, the Company drew down $5.0 million on the Revolving Credit Facility and on August 3, 2020, the Company drew down an additional $30.0 million, primarily to make capital contributions to its insurance subsidiaries. On November 25, 2020, the Company drew down $7.0 million, and used the proceeds to make interest payments on the Unsecured Senior Notes and Senior Notes.
Secured Loan Payable
In June 2020, the Company entered into a $24.9 million lease transaction that for accounting purposes is treated as a loan secured by a portion of the Company’s fixed assets and capitalized software, payable at 4.83% interest with a maturity date of July 1, 2025 and providing for monthly interest and principal payments.
Interest Expense and Amortization Related to Debt Issuance Costs
Interest expense was $13.1 million, $12.8 million and $12.3 million for the years ended December 31, 2020, 2019 and 2018, respectively. Amortization expense related to debt issuance costs was $1.2 million, $0.3 million and $0.3 million for the years ended December 31, 2020, 2019 and 2018, respectively.
15. Commitments and Contingencies
Leases
The Company determines if an arrangement is a lease on the commencement date of the contract. The right-of-use assets represent the Company’s right to use an underlying asset for the lease term and lease liabilities represent our obligation to make lease payments arising from the lease. The right-of-use assets and lease liabilities are measured by the present value of the future minimum lease payments over the lease term. The Company uses the rate implicit in the lease
139
whenever that rate is readily determinable. If the rate implicit in the lease is not readily determinable, the Company uses its incremental borrowing rate. The right-of-use asset is then adjusted to exclude lease incentives. Certain leases may contain rental escalation, renewal options and/or termination options that are factored into our determination of lease payments when appropriate. Variable lease payment amounts that cannot be determined at the commencement of the lease are not included in the right-to-use assets or lease liabilities. Leases covering a period of fewer than 12 months are not recorded on the Company’s consolidated balance sheets. Rent expense is calculated using the straight-line method.
The Company leases certain facilities and equipment under non-cancelable lease agreements that expire at various dates through 2025, which are generally renewed or replaced by similar leases. The lease agreements do not contain any material restrictive covenants, do not contain any conditions of residual value guarantees and are substantially all considered to be operating leases. The Company’s leases relate to office facilities in New Jersey, California, Florida, Georgia and the U.K. The weighted average lease term was 2.7 years and the weighted average discount rate was 2.0%.
Rent expense for the years ended December 31, 2020, 2019 and 2018 was $3.0 million, $3.3 million and $3.1 million, respectively. The operating leases also include provisions for additional payments based on certain annual cost increases. The following table presents the Company’s lease liabilities and right-of-use assets related to operating leases as of December 31, 2020:
| | | |
($ in thousands) |
| December 31, 2020 | |
One year or less | | $ | 2,922 |
More than one year to two years | |
| 214 |
More than two years to three years | |
| — |
More than three years to four years | | | — |
More than four years to five years | | | — |
More than five years | |
| — |
Total undiscounted future minimum lease payments | |
| 3,136 |
Less: difference between lease payments and discounted lease liabilities | |
| 37 |
Lease liabilities | | $ | 3,099 |
| | | |
Right-of-use assets | | $ | 2,794 |
Prepaid lease assets, net of lease allowances and incentives | |
| 305 |
Total | | $ | 3,099 |
The right-of-use assets are reported as a component of other assets and the lease liabilities are reported as a component of other liabilities on the Company’s consolidated balance sheets.
The lease of the U.K. office had rent expense of $0.5 million for the years ended December 31, 2020, 2019 and 2018, and sublease income of $0.7 million, $0.6 million and $0.1 million for the years ended December 31, 2020, 2019 and 2018, respectively. These amounts are included in discontinued operations.
Fiduciary Funds
The Company’s insurance agency subsidiary maintains separate underwriting accounts, which record all of the underlying insurance transactions of the insurance pools that it manages. These transactions primarily include collecting premiums from the insureds, collecting paid receivables from reinsurers, paying claims as losses become payable, paying reinsurance premiums to reinsurers, and remitting net account balances to member insurance companies in the pools that PSMC manages. Unremitted amounts to members of the insurance pools are held in a fiduciary capacity and interest income earned on such funds inures to the benefit of the members of the insurance pools based on their pro rata participation in the pools.
140
Additionally, the Company’s insurance agency subsidiary, in its contractual role as escrow agent, receives and disburses bond funds for entertainment film projects for its insureds.
A summary of the fiduciary and pools’ underwriting accounts as of December 31, 2020 and 2019, is as follows:
| | | | | | |
($ in thousands) |
| 2020 |
| 2019 | ||
Assets held on behalf of unaffiliated pool members | | $ | 1,495 | | $ | 10,522 |
Escrow bond arrangements | |
| 571 | |
| 1,014 |
Total | | $ | 2,066 | | $ | 11,536 |
The remaining 2 unaffiliated pool members withdrew from the pools in 1994 and 1996, respectively, and retained liability for their effective pool participation for all loss reserves, including IBNR losses and unearned premium reserves attributable to policies effective prior to their withdrawal from the pools. The Company is committed to manage this pool until expiration without further compensation.
In the event that all or any of the pool companies are unable to meet their obligations to the pools, the remaining companies would be liable for such defaulted amounts on a pro rata pool participation basis.
The Company is not aware of any uncertainties that could result in any possible defaults by either of the 2 unaffiliated pool members with respect to their pool obligations, which might impact liquidity or results of operations of the Company, but there can be no assurance that such events will not occur in the future.
Unfunded Investment Commitments
For the year ended December 31, 2020 the Company had $18.2 million in unfunded commitments related to limited partnerships and a fixed maturity security.
16. Share-Based Compensation
Share-Based Plans
2019 Equity Incentive Plan
In connection with, and prior to the completion of the IPO, the Company’s Amended and Restated 2010 Equity Incentive Plan (the “2010 Plan”) was terminated, and the Company adopted a new plan, the 2019 Equity Incentive Plan (the “2019 Plan”)
On July 24, 2019, the 2019 Plan became effective immediately prior to the effectiveness of the registration statement filed in connection with the IPO. The 2019 Plan provides for the grant of stock options, stock appreciation rights, restricted share awards (“RSAs”), RSUs, dividend equivalent rights, performance-based shares, performance-vesting share awards (“PSAs”) or other equity-based or equity-related awards.
The 2019 Plan is administered by the compensation committee of the Company’s Board of Directors. Subject to the provisions of the 2019 Plan, the compensation committee determines in its discretion, the persons to whom and the times at which awards are granted, the size of awards (subject to certain limitations set forth in the compensation committee charter) and the terms and conditions of awards.
A total of 4,500,000 shares of common stock are initially authorized and reserved for issuance under the 2019 Plan, including shares underlying RSUs granted under the 2010 Plan.
141
The following is a summary of the equity-based compensation included in the 2019 Plan, including the number of common stock shares granted to each award:
| (i) | Annual long-term equity incentive plan awards (“Annual LTIP Awards”): Annual LTIP Awards in 2019 included time-vesting RSUs and performance-vesting RSUs (“PSUs). Annual LTIP Awards in 2020 included RSUs, PSUs, RSAs, and PSAs. |
RSUs vest annually over three years subject to continued employment through each such date. 142,739 and 90,559 time-vesting RSUs were granted in 2020 and 2019 and the fair value of the awards on grant date was $1.8 million and $1.3 million, respectively.
RSAs vest annually over three years subject to continued employment through each such date. 110,466 time-vesting RSAs were granted in 2020 and the fair value of the awards on grant date was $1.5 million.
PSUs vest based on the average book value per share growth over a three-year performance period and cliff vest on the third anniversary of the grant date to the extent performance metrics are met, subject to continued service. 123,016 and 90,559 PSUs were granted in 2020 and 2019 and the fair value of the awards on grant date was $1.6 million and $1.3 million, respectively.
PSAs vest based on the average book value per share growth over a three-year performance period and cliff vest on the third anniversary of the grant date to the extent performance metrics are met, subject to continued service. 110,466 PSAs were granted in 2020 and the fair value of the awards on grant date was $1.5 million.
| (ii) | Supplemental RSUs: 1,267,912 supplemental RSU awards, 100% of which are time-vesting RSUs, were granted to management on July 25, 2019 in connection with the IPO and are subject to vesting as follows: 25% vested at grant date, 25% will vest on the second anniversary of the grant date, subject to continued service and 50% will vest on the third anniversary of the grant date, subject to continued service. The fair value of the supplemental RSUs at grant date was $17.8 million. |
| (iii) | Founders grant awards: 250,000 founders grant awards in the form of time-vesting RSUs were granted on July 25, 2019. The fair value of the grants was $3.5 million and will cliff vest on the third anniversary of the grant date. |
| (iv) | Non-employee Director RSUs: In 2020, 106,460 RSUs with a fair value of $0.9 million were granted to non-employee directors. In 2019, 33,839 RSUs, 26,399 of which were granted on July 25, 2019 and 7,440 of which were granted on November 15, 2019, with a fair value of $0.5 million were granted to non-employee directors. These awards were fully vested on grant date. |
| (v) | Pre-IPO RSUs: 668,170 RSUs initially granted under the 2010 Plan were converted into RSUs based on shares of the Company’s common stock upon the consummation of the IPO merger of PGHL into PGI. |
Stock-based compensation expense was $8.9 million, $8.6 million and $0.9 million for the years ended December 31, 2020, 2019 and 2018, respectively. The tax benefit recognized for the same was $1.9 million, $1.8 million and $0.2 million for the years ended December 31, 2020, 2019 and 2018, respectively.
Vested RSUs awaiting conversion into common stock were 489,439 for the year ended December 31, 2020, 906,182 for the year ended December 31, 2019 and 548,292 for the year ended December 31, 2018.
The Company began recognizing stock-based compensation expense relating to its 2019 Plan upon its inception and initial stock grants in July 2019.
142
The following table summarizes equity award transactions for the 2019 Plan for the years ended December 31, 2020 and 2019:
| | | | | |
| | | | Weighted | |
| | Number of | | Average Grant Date | |
|
| Shares |
| Fair Value Per Share | |
Unvested at December 31, 2018 |
| 55,264 | | $ | 11.09 |
Granted in 2019 |
| 1,732,869 | |
| 14.00 |
Vested in 2019 |
| (406,081) | |
| 13.61 |
Forfeited in 2019 |
| (92,656) | |
| 14.00 |
Unvested at December 31, 2019 |
| 1,289,396 | | | 14.00 |
Granted in 2020 |
| 593,147 | |
| 12.30 |
Vested in 2020 |
| (134,001) | |
| 9.96 |
Forfeited in 2020 |
| (43,101) | |
| 13.58 |
Unvested at December 31, 2020 |
| 1,705,441 | | $ | 13.46 |
As of December 31, 2020, The Company had approximately $11.8 million of total unrecognized stock-based compensation expense related to the equity awards expected to be recognized over a weighted-average period of 1.6 years.
2019 Employee Stock Purchase Plan
On July 24, 2019, the 2019 Employee Stock Purchase Plan (the “2019 ESPP”) became effective immediately prior to the effectiveness of the registration statement filed in connection with the IPO. A total of 1,000,000 shares of the Company’s common stock are reserved and available for sale under the 2019 ESPP.
The compensation committee of the Board of Directors administers the 2019 ESPP and has full authority to interpret the terms of the 2019 ESPP. The 2019 ESPP is a shareholder-approved plan under which substantially all employees may purchase the Company’s common stock through payroll deductions at a price equal to 90% of the fair market value of the stock on the purchase date at the end of the offering period. An employee’s payroll deductions under the Purchase Plan are limited to 15% of the employee’s compensation and employees may not purchase more than $25,000 of stock during any calendar year.
17. Retirement Plans
For the benefit of its U.S.-based employees who meet certain service and age requirements, the Company offers a voluntary defined contribution 401(k) plan, a tax-qualified retirement plan subject to the Employee Retirement Income Security Act of 1974. The Company has elected to make matching contributions to eligible participants in an amount equal to 100% subject to a maximum of 6% of eligible compensation contributed to the plan as deferral contributions. Expense recorded for this plan was $2.2 million, $1.8 million and $2.1 million for the years ended December 31, 2020, 2019 and 2018, respectively.
18. Segment Information
The Company has 1 reportable segment, Specialty Insurance segment, which primarily offers property and casualty insurance products through its customers segments that include Construction, Consumer Services, Marine and Energy, Media and Entertainment, Professional Services, Real Estate, Sports, and Transportation. The primary criteria to determine the Company’s reportable segment is based on the fact that the Company’s senior management reviews, assesses and allocates resources both on a financial and personnel basis on an entity-wide level.
143
The following table provides a summary of the Company’s gross written premiums by customer segments within our Specialty Insurance segment. “Other” includes gross written premiums from: (i) primary and excess workers’ compensation coverage for exited Self-Insured Groups; (ii) niches exited prior to 2018, many with a concentration in commercial auto; (iii) participation in industry pools; and (iv) emerging new business.
| | | | | | | | | | | | | | | | |
|
| Years Ended December 31 | | |||||||||||||
($ in thousands) |
| 2020 |
| 2019 |
| 2018 | | |||||||||
Customer segment |
| | |
|
|
| |
|
|
|
| |
|
|
| |
Construction | | $ | 109,955 |
| 13.5 | % | $ | 117,918 |
| 12.2 | % | $ | 101,946 |
| 11.4 | % |
Consumer Services | |
| 123,011 |
| 15.0 | |
| 133,682 |
| 13.8 | |
| 107,086 |
| 12.0 | |
Marine and Energy | |
| 110,228 |
| 13.5 | |
| 94,700 |
| 9.8 | |
| 83,104 |
| 9.3 | |
Media and Entertainment | |
| 88,788 |
| 10.9 | |
| 124,950 |
| 12.9 | |
| 119,926 |
| 13.4 | |
Professional Services | |
| 130,893 |
| 16.0 | |
| 119,326 |
| 12.3 | |
| 110,546 |
| 12.3 | |
Real Estate | |
| 159,166 |
| 19.5 | |
| 167,635 |
| 17.3 | |
| 132,652 |
| 14.8 | |
Sports | | | 23,337 | | 2.8 | | | 30,079 | | 3.1 | | | 23,590 | | 2.6 | |
Transportation | | | 64,559 | | 7.9 | | | 112,191 | | 11.6 | | | 92,169 | | 10.3 | |
Customer segment subtotal | |
| 809,937 |
| 99.1 | |
| 900,481 |
| 93.0 | |
| 771,019 |
| 86.1 | |
Other | |
| 7,153 |
| 0.9 | |
| 67,530 |
| 7.0 | |
| 124,093 |
| 13.9 | |
Specialty Insurance total | | $ | 817,090 |
| 100.0 | % | $ | 968,011 |
| 100.0 | % | $ | 895,112 |
| 100.0 | % |
The following table provides a summary of the Company’s gross written premiums by line of business within our Specialty Insurance segment.
| | | | | | | | | | | | | | | | | |||||||||||||||||||||||||||||||||||||||||||||||||||||||||||||||||||||||||||||||||||||||||||||||||||||||||||||||||||||||||||||||||||||||||||||||||||||||||||||||||||||||||||||||||||||||||||||||||||||||||||||||||||||||||||||||||||||||||||||||||||||||||||||||||||||||||||||||||||||||||||||||||||||||||||||||||||||||||||||||||||||||||||||||||||||||||||||||||||||||||||||||||||||||||||||||||||||||||||||||||||||||||||||||||||||||||||||||||||||||||||||||||||||||||||||||||||||||||||||||||||||||||||||||||||||||||||||||||||||||||||||||||||||||||||||||||||||||||||||||||||||||||||||||||||||||||||||||||||||||||||||||||||||||||||||||||||||||||||||||||||||||||||||||||||||||||||||||||||||||||||||||||||||||||||||||||||||||||||||||||||||||||||||||||||||||||||||||||||||||||||||||||||||||||||||||||||||||||||||||||||||||||||||||||||||||||||||||||||||||||||||||||||||||||||||||||||||||||||||||||||||||||||||||||||||||||||||||||||||||||||||||||||||||||||||||||||||||||||||||||||||||||||||||||||||||
| | Years Ended December 31 | | ||||||||||||||||||||||||||||||||||||||||||||||||||||||||||||||||||||||||||||||||||||||||||||||||||||||||||||||||||||||||||||||||||||||||||||||||||||||||||||||||||||||||||||||||||||||||||||||||||||||||||||||||||||||||||||||||||||||||||||||||||||||||||||||||||||||||||||||||||||||||||||||||||||||||||||||||||||||||||||||||||||||||||||||||||||||||||||||||||||||||||||||||||||||||||||||||||||||||||||||||||||||||||||||||||||||||||||||||||||||||||||||||||||||||||||||||||||||||||||||||||||||||||||||||||||||||||||||||||||||||||||||||||||||||||||||||||||||||||||||||||||||||||||||||||||||||||||||||||||||||||||||||||||||||||||||||||||||||||||||||||||||||||||||||||||||||||||||||||||||||||||||||||||||||||||||||||||||||||||||||||||||||||||||||||||||||||||||||||||||||||||||||||||||||||||||||||||||||||||||||||||||||||||||||||||||||||||||||||||||||||||||||||||||||||||||||||||||||||||||||||||||||||||||||||||||||||||||||||||||||||||||||||||||||||||||||||||||||||||||||||||||||||||||||||||||||||||||||||||
($ in thousands) |
| 2020 |
| 2019 |
| 2018 | | ||||||||||||||||||||||||||||||||||||||||||||||||||||||||||||||||||||||||||||||||||||||||||||||||||||||||||||||||||||||||||||||||||||||||||||||||||||||||||||||||||||||||||||||||||||||||||||||||||||||||||||||||||||||||||||||||||||||||||||||||||||||||||||||||||||||||||||||||||||||||||||||||||||||||||||||||||||||||||||||||||||||||||||||||||||||||||||||||||||||||||||||||||||||||||||||||||||||||||||||||||||||||||||||||||||||||||||||||||||||||||||||||||||||||||||||||||||||||||||||||||||||||||||||||||||||||||||||||||||||||||||||||||||||||||||||||||||||||||||||||||||||||||||||||||||||||||||||||||||||||||||||||||||||||||||||||||||||||||||||||||||||||||||||||||||||||||||||||||||||||||||||||||||||||||||||||||||||||||||||||||||||||||||||||||||||||||||||||||||||||||||||||||||||||||||||||||||||||||||||||||||||||||||||||||||||||||||||||||||||||||||||||||||||||||||||||||||||||||||||||||||||||||||||||||||||||||||||||||||||||||||||||||||||||||||||||||||||||||||||||||||||||||||||||||||||||||||||||
Line of business |
| | |
|
|
| |
|
|
|
| |
|
|
| | |||||||||||||||||||||||||||||||||||||||||||||||||||||||||||||||||||||||||||||||||||||||||||||||||||||||||||||||||||||||||||||||||||||||||||||||||||||||||||||||||||||||||||||||||||||||||||||||||||||||||||||||||||||||||||||||||||||||||||||||||||||||||||||||||||||||||||||||||||||||||||||||||||||||||||||||||||||||||||||||||||||||||||||||||||||||||||||||||||||||||||||||||||||||||||||||||||||||||||||||||||||||||||||||||||||||||||||||||||||||||||||||||||||||||||||||||||||||||||||||||||||||||||||||||||||||||||||||||||||||||||||||||||||||||||||||||||||||||||||||||||||||||||||||||||||||||||||||||||||||||||||||||||||||||||||||||||||||||||||||||||||||||||||||||||||||||||||||||||||||||||||||||||||||||||||||||||||||||||||||||||||||||||||||||||||||||||||||||||||||||||||||||||||||||||||||||||||||||||||||||||||||||||||||||||||||||||||||||||||||||||||||||||||||||||||||||||||||||||||||||||||||||||||||||||||||||||||||||||||||||||||||||||||||||||||||||||||||||||||||||||||||||||||||||||||||
Commercial Auto | | $ | 167,219 | | 20.5 | % | $ | 205,303 | | 21.2 | % | $ | 151,612 | | 16.9 | % | |||||||||||||||||||||||||||||||||||||||||||||||||||||||||||||||||||||||||||||||||||||||||||||||||||||||||||||||||||||||||||||||||||||||||||||||||||||||||||||||||||||||||||||||||||||||||||||||||||||||||||||||||||||||||||||||||||||||||||||||||||||||||||||||||||||||||||||||||||||||||||||||||||||||||||||||||||||||||||||||||||||||||||||||||||||||||||||||||||||||||||||||||||||||||||||||||||||||||||||||||||||||||||||||||||||||||||||||||||||||||||||||||||||||||||||||||||||||||||||||||||||||||||||||||||||||||||||||||||||||||||||||||||||||||||||||||||||||||||||||||||||||||||||||||||||||||||||||||||||||||||||||||||||||||||||||||||||||||||||||||||||||||||||||||||||||||||||||||||||||||||||||||||||||||||||||||||||||||||||||||||||||||||||||||||||||||||||||||||||||||||||||||||||||||||||||||||||||||||||||||||||||||||||||||||||||||||||||||||||||||||||||||||||||||||||||||||||||||||||||||||||||||||||||||||||||||||||||||||||||||||||||||||||||||||||||||||||||||||||||||||||||||||||||||||||||
General Liability |
|
| 335,864 |
|
| |
| 335,197 |
| 34.6 | |
|
|
| | ||||||||||||||||||||||||||||||||||||||||||||||||||||||||||||||||||||||||||||||||||||||||||||||||||||||||||||||||||||||||||||||||||||||||||||||||||||||||||||||||||||||||||||||||||||||||||||||||||||||||||||||||||||||||||||||||||||||||||||||||||||||||||||||||||||||||||||||||||||||||||||||||||||||||||||||||||||||||||||||||||||||||||||||||||||||||||||||||||||||||||||||||||||||||||||||||||||||||||||||||||||||||||||||||||||||||||||||||||||||||||||||||||||||||||||||||||||||||||||||||||||||||||||||||||||||||||||||||||||||||||||||||||||||||||||||||||||||||||||||||||||||||||||||||||||||||||||||||||||||||||||||||||||||||||||||||||||||||||||||||||||||||||||||||||||||||||||||||||||||||||||||||||||||||||||||||||||||||||||||||||||||||||||||||||||||||||||||||||||||||||||||||||||||||||||||||||||||||||||||||||||||||||||||||||||||||||||||||||||||||||||||||||||||||||||||||||||||||||||||||||||||||||||||||||||||||||||||||||||||||||||||||||||||||||||||||||||||||||||||||||||||||||||||||||||||||
Workers’ Compensation |
|
| 72,352 |
|
| |
| 179,432 |
| 18.6 | |
|
|
| | ||||||||||||||||||||||||||||||||||||||||||||||||||||||||||||||||||||||||||||||||||||||||||||||||||||||||||||||||||||||||||||||||||||||||||||||||||||||||||||||||||||||||||||||||||||||||||||||||||||||||||||||||||||||||||||||||||||||||||||||||||||||||||||||||||||||||||||||||||||||||||||||||||||||||||||||||||||||||||||||||||||||||||||||||||||||||||||||||||||||||||||||||||||||||||||||||||||||||||||||||||||||||||||||||||||||||||||||||||||||||||||||||||||||||||||||||||||||||||||||||||||||||||||||||||||||||||||||||||||||||||||||||||||||||||||||||||||||||||||||||||||||||||||||||||||||||||||||||||||||||||||||||||||||||||||||||||||||||||||||||||||||||||||||||||||||||||||||||||||||||||||||||||||||||||||||||||||||||||||||||||||||||||||||||||||||||||||||||||||||||||||||||||||||||||||||||||||||||||||||||||||||||||||||||||||||||||||||||||||||||||||||||||||||||||||||||||||||||||||||||||||||||||||||||||||||||||||||||||||||||||||||||||||||||||||||||||||||||||||||||||||||||||||||||||||||||
2019 Equity Incentive Plan In connection with, and prior to the completion of the IPO, the Company’s Amended and Restated 2010 Equity Incentive Plan (the “2010 Plan”) was terminated, and the Company adopted a new plan, the 2019 Equity Incentive Plan (the “2019 Plan”) On July 24, 2019, the 2019 Plan became effective immediately prior to the effectiveness of the registration statement filed in connection with the IPO. The 2019 Plan provides for the grant of stock options, stock appreciation rights, restricted share awards (“RSAs”), RSUs, dividend equivalent rights, performance-based shares, performance-vesting share awards (“PSAs”) or other equity-based or equity-related awards. The
2019 Plan, including shares underlying RSUs granted under the 2010 Plan.
The following
RSUs vest annually over three years subject to continued employment through each such date. 142,739 and 90,559 time-vesting RSUs were granted in 2020 and 2019 and the fair value of the awards on RSAs vest annually over three years subject to continued employment through each such date. 110,466 time-vesting RSAs were granted in 2020 and
PSAs vest based on the average book value per share growth over a three-year performance period and cliff vest on the third anniversary of
Vested RSUs awaiting conversion into common stock were 489,439 for the year ended December 31, 2020, 906,182 for the year ended December 31, 2019 and The Company
July 2019.
The following table summarizes equity award transactions for the 2019 Plan for the years ended December 31, 2020 and 2019:
As of December 31, 2020, The Company had approximately $11.8 million of total unrecognized stock-based compensation expense related to the equity awards expected to be recognized over a weighted-average period of 1.6 years. 2019 Employee Stock Purchase Plan On July The compensation committee of the Board of Directors administers the 2019 ESPP and has full authority to interpret the terms of the 2019 ESPP. The 2019 ESPP is a shareholder-approved plan under which substantially all employees may purchase the Company’s 17. Retirement Plans For the benefit of its U.S.-based employees who meet certain service and age requirements, the Company offers a voluntary defined contribution 401(k) plan, a tax-qualified retirement plan subject to the Employee Retirement Income Security Act of 1974. The Company 18. Segment Information The Company
entity-wide level.
The
The
Severance and Change in Control Benefits Each of Messrs. Hannon, Piszel and Bailey is a party to a 161 In the event of the executive’s termination of employment by the Company without “cause” (including due to the non-renewal of the term by the Company) or a resignation by the executive for “good reason” (each term as defined in the In the event of the executive’s termination of employment due to his death or “disability” (as defined in the Upon a termination of employment due to the non-renewal of the term by the executive, the executive will be entitled to receive a pro-rated annual bonus for the year of termination based on actual performance. In addition, the terms of each of Messrs. Hannon’s, Piszel’s and Bailey’s outstanding equity awards provide for accelerated vesting on certain qualifying terminations of employment as follows:
Director Compensation The following table sets forth information regarding compensation of our non-employee directors during the year ended December 31,
163 compensation for their services to the Board in an amount equal to $125,000 per year, 50% of which will be paid in cash and 50% of which will be in the form of an annual grant of RSUs with a grant date value equal to $62,500. Post-IPO director RSUs are fully vested on grant and payable upon the first to occur of a separation of service and a change in control (as defined in the 2019 Plan). Item 12. Security Ownership of Certain Beneficial Owners and Management and Related Stockholder The following table presents information regarding the beneficial ownership of the shares of our common stock as of February
Beneficial ownership is determined according to the rules of the SEC and generally means that a person has beneficial ownership of a security if he, she or it possesses sole or shared voting or investment power of that security, or has the right to acquire beneficial ownership of that security within 60 days. Except as indicated by the footnotes below, we believe, based on the information furnished to us, that the persons named in the table below have or will have sole voting and investment power with respect to all shares of common stock shown that they beneficially own, subject to community property laws where applicable. The information does not necessarily indicate beneficial ownership for any other purpose, including for purposes of Sections 13(d) and 13(g) of the Securities Act. Our calculation of the percentage of beneficial ownership is based on Common stock subject to vested RSUs or RSUs that will vest within 60 days of February
ownership of any group of which the holder is a member but is not deemed outstanding for computing the percentage of any other person. 164 Except as otherwise indicated, the address for each stockholder listed below is c/o ProSight Global, Inc., 412 Mt. Kemble Avenue, Suite 300, Morristown, NJ 07960.
* Less than one percent
165
Equity Compensation Plan Information The following table presents information as of December 31,
Item 13. Certain Relationships and Related Transactions, and Director Independence Stockholders’ Agreement The Company and, the principal stockholders’ are parties to a stockholders’ agreement, dated July 29, 2019 (the “Stockholders’ Agreement”). The Stockholders’ Agreement governs the relationship between us and the principal stockholders, including matters related to our corporate governance, rights to designate directors and additional matters. The Stockholders’ Agreement, among other things, provides that two directors shall be designated for election to the Board of Directors by the GS Investors and two directors shall be designated for election to the Board of Directors by the TPG Investors, in each case so long as such principal stockholder has not transferred more than 75% of its respective initial ownership interest in the Company (such “initial ownership interest” being the number of shares of our common stock held by each principal stockholder, respectively, immediately following the IPO merger of PGHL with and into the Company and prior to the IPO). If either principal stockholder transfers more than 75% of its respective initial ownership interest in the Company, then such principal stockholder shall only be entitled to designate for election one director; and if either principal stockholder transfers more than 90% of its respective initial ownership interest in the Company, then such principal stockholder shall not be entitled to designate any directors for election. Messrs. Arnold and Helgason currently serve as the designees of the GS Investors and Messrs. Leathers and Schifter currently serve as the designees of the TPG Investors. The Stockholders’ Agreement further provides that, at all times, our Board of Directors shall include at least four directors who are unaffiliated with the principal stockholders or the Company (except in their capacity as directors) and who shall also qualify as independent under the NYSE listing rules. The size of our Board of Directors is currently ten directors. Additionally, because of Goldman Sachs’ status as a bank holding company and election to be treated as a financial holding company under the Bank Holding Company (“BHC”) Act, the Stockholders’ Agreement provides that we are subject to certain covenants for the benefit of Goldman Sachs that are intended to facilitate compliance with the BHC Act. In particular, Goldman Sachs has rights to conduct audits on, and access certain of, our information and has certain rights to review the policies and procedures that we implement to comply with the laws and regulations that relate to our activities. In addition, we are obligated to provide Goldman Sachs with notice of certain events and business activities and cooperate with Goldman Sachs to mitigate potential adverse consequences resulting therefrom, as well as seek consent from them prior to expanding the nature of certain of our activities. These covenants will remain in effect as long as the Federal Reserve deems us to be a “subsidiary” of Goldman Sachs under the BHC Act.
Registration Rights Agreement In connection with the IPO, the Company entered into a registration rights agreement, dated July 29, 2019 (the “Registration Rights Agreement”), with the principal stockholders and certain members of our management who owned certain equity interests of PGHL prior to the IPO. Pursuant to the Registration Rights Agreement, the principal stockholders can require us to file one or more registration statements, including a “shelf” registration statement on Form S-3, if and when we become eligible to use such form, with the SEC covering the public resale of registrable securities beneficially owned by the principal stockholders. In addition, the principal stockholders have certain “piggyback” registration rights, pursuant to which they are entitled to register the resale of their registrable securities alongside certain offerings of securities that we may undertake, subject to “cutback” in certain such cases. These registration rights are transferable by the principal stockholders, subject to certain limitations. We will be responsible for the expenses associated with any sale under the agreement by the principal stockholders or management investors, except for underwriting discounts, selling commissions and transfer taxes applicable to such sale. The registration rights agreement will terminate at such time as no registrable securities remain outstanding. Niche Management Agreement with Altruis Group On February 4, 2020, we entered into a niche management agreement (the “NMA”) with Altruis Group, LLC (“Altruis”), an independent agency being launched by Mr. Beneducci, our former Executive Chairman. Pursuant to the NMA, Altruis will be an exclusive distribution partner of the Company in new customer niches where the Company supports captives. The specific services provided by Altruis and the fees payable to Altruis for such service will be determined on a transaction-by-transaction basis. Historical Related Party Transactions Investment Advisory Agreements with GSAM On February 8, 2011, we entered into four individual discretionary advisory agreements through PSIG and each of our insurance subsidiaries with Goldman Sachs Asset Management, L.P. (“GSAM”), an affiliate of Goldman Sachs, whose affiliates are among our principal stockholders, pursuant to which GSAM was appointed an investment adviser, operating within our stated investment guidelines, for accounts representing a certain portion of our assets. Under the four discretionary advisory agreements, GSAM receives annual fees, calculated based upon the aggregate account balances of PSIG and our insurance subsidiaries. In the year ended December 31, Loans to Executive Officers and Directors We have made loans to certain executive officers, including the CEO, most of which loans were made in connection with the settlement of RSUs and related tax withholding. See Item 8. Note 10., “Related-Party Information” in our consolidated financial statements included elsewhere in this Annual Report on Form 10-K. On March 15, 2019, all such loans were repaid. Policy on Related Party Transactions Our Board of Directors adopted a written related party transaction approval policy pursuant to which an independent committee, which may be a standing or ad hoc committee comprised of at least three independent directors,
of our Board of Directors will review and approve or take such other action as it may deem appropriate with respect to the following transactions:
This policy sets forth factors to be considered by an independent committee in determining whether to approve any such transaction, including the nature of our involvement in the transaction, whether we have demonstrable business reasons to enter into the transaction, whether the transaction would impair the independence of a director and whether the proposed transaction involves any potential reputational or other risk issues. To simplify the administration of the approval process under this policy, an independent committee may, where appropriate, establish guidelines for certain types of related party transactions or designate certain types of such transactions that will be deemed pre-approved. This policy also provides that the following transactions are deemed pre-approved:
If our Board of Directors appoints an ad hoc independent committee to review and take action with regard to any one or more related party transactions, it has designated an independent director as its “lead director,” and he or she will be a member and the chairperson of the independent committee. A director on any committee considering a related party transaction who has an interest in the transaction will not participate in the consideration of that transaction unless requested by the chairperson of the committee. This policy does not apply to the implementation or administration of the Stockholders’ Agreement and Registration Rights Agreement with the principal stockholders. Our directors who are also officers of a principal stockholder may participate in the negotiation, execution, implementation, amendment, modification, or termination of these agreements, as well as in any resolution of disputes thereunder, on behalf of either or both of us and the applicable principal stockholder, in each case under the direction of an independent committee or the comparable committee of the board of directors of such principal stockholder. Our amended and restated certificate of incorporation contains limitations on the obligations of our directors who have certain relationships with a principal stockholder with respect to certain corporate opportunities.
Certain Provisions of our Amended and Restated Certificate of Incorporation Conflicts of Interest The Delaware General Corporation Law (the “DGCL”) permits corporations to adopt provisions renouncing any interest or expectancy in certain opportunities that are presented to the corporation or its officers, directors or stockholders. 169 Our amended and restated certificate of incorporation renounces, to the maximum extent permitted from time to time by law, any interest or expectancy that we have in, or right to be offered an opportunity to participate in, specified business opportunities that are from time to time presented to our officers, directors or stockholders or their respective affiliates, other than those officers, directors, stockholders or affiliates who are our or our subsidiaries’ employees. Our amended and restated certificate of incorporation provides that, to the fullest extent permitted by law, each of the principal stockholders or any of their affiliates or any director who is not employed by us or his or her affiliates will have no duty to refrain from (i) engaging in a corporate opportunity in the same or similar lines of business in which we or our affiliates now engage or propose to engage or (ii) otherwise competing with us or our affiliates. In addition, to the fullest extent permitted by law, in the event that the principal stockholders or any non-employee director acquires knowledge of a potential transaction or other business opportunity which may be a corporate opportunity for themselves or himself or their or his affiliates or for us or our affiliates, such person will have no duty to communicate or offer such transaction or business opportunity to us or any of our affiliates and they may take any such opportunity for themselves or offer it to another person or entity. Our amended and restated certificate of incorporation does not renounce our interest in any business opportunity that is expressly offered to a non-employee director solely in his or her capacity as a director or officer of the Company. To the fullest extent permitted by law, no business opportunity will be deemed to be a potential corporate opportunity for us unless we would be permitted to undertake the opportunity under our amended and restated certificate of incorporation, we have sufficient financial resources to undertake the opportunity and the opportunity would be in line with our business. Limitation of Liability and Indemnification of Directors and Officers Our amended and restated certificate of incorporation includes provisions that limit the personal liability of our directors for monetary damages for breach of their fiduciary duties as directors, except to the extent that such limitation is not permitted under the DGCL. Such limitation shall not apply, except to the extent permitted by the DGCL, to (i) any breach of a director’s duty of loyalty to us or our stockholders, (ii) acts or omissions not in good faith or that involve intentional misconduct or a knowing violation of law, (iii) any unlawful payment of a dividend or unlawful stock repurchase or redemption, as provided in Section 174 of the DGCL, or (iv) any transaction from which the director derived an improper personal benefit. These provisions will have no effect on the availability of equitable remedies such as an injunction or rescission based on a director’s breach of his or her duty of care. Our amended and restated certificate of incorporation and our bylaws provide for indemnification, to the fullest extent permitted by the DGCL, of any person made or threatened to be made a party to any action, suit or proceeding by reason of the fact that such person is or was a director, officer, employee or agent of the Company, or, at the request of the Company, serves or served as a director, officer, employee or agent of another corporation, partnership, joint venture, trust or any other enterprise, against all expenses, judgments, fines, amounts paid in settlement and other losses actually and reasonably incurred in connection with the defense or settlement of such action, suit or proceeding. In addition, we entered into indemnification agreements with each of our executive officers and directors pursuant to which we agreed to indemnify each such executive officer and director to the fullest extent permitted by the DGCL. Insofar as indemnification for liabilities arising under the Securities Act may be permitted to directors, officers or persons controlling the Company pursuant to the foregoing provisions, the Company has been informed that in the opinion of the SEC such indemnification is against public policy as expressed in the Act and is therefore unenforceable. Director Independence See Part III, Item 10. Directors, Executive Officers and Corporate Governance — Board Committees and Corporate Governance in this Annual Report on Form 10-K.
Item 14. Principal Accounting Fees and Services Fees to Independent Registered Public Accounting Firm The following is a summary of the fees billed to us by Ernst & Young LLP for professional services rendered in the years ended December 31,
Audit Fees. This category includes the audit of our annual consolidated financial statements, reviews of our financial statements included in our Form 10-Qs and services that are normally provided by our independent registered public accounting firm in connection with its engagements for those years. This category also includes issuance of consents and comfort letters, advice on audit and accounting matters that arose during, or as a result of, the audit or the review of our interim financial statements. Audit-Related Fees. This category consists of assurance and related services by our independent registered public accounting firm that are reasonably related to the performance of the audit or review of our financial statements and are not reported above under “Audit Fees.” Tax Fees. This category typically consists of professional services rendered by our independent registered public accounting firm for tax compliance and tax advice. Other. This category includes aggregate fees billed in each of the last two fiscal years for products and services provided by the Ernst & Young LLP, other than the services reported in the categories above. Pre-Approval Policies and Procedures Our audit committee has established a policy governing our use of the services of our independent registered public accounting firm. Under the policy, our audit committee is required to pre-approve all audit and permitted non-audit and tax services performed by our independent registered public accounting firm in order to ensure that the provision of such services does not impair such accounting firm’s independence. All fees paid to Ernst & Young LLP for our fiscal years ended December 31, PART IV Item 15. Exhibits and Financial Statement Schedules INDEX TO FINANCIAL STATEMENT SCHEDULES
Schedules other than those listed are omitted for the reason that they are not required, are not applicable or that equivalent information has been included in the financial statements, and notes thereto, or elsewhere herein.
Schedule II ProSight Global, Inc. Condensed Financial Information of Registrant Balance Sheets
Schedule II ProSight Global, Inc. Condensed Financial Information of Registrant Statements of Operations
Schedule II ProSight Global, Inc. Condensed Financial Information of Registrant Statements of Cash Flows
Schedule V ProSight Global, Inc. Allowance for Uncollectible Premiums and Reinsurance Recoverables
Exhibit Index
| |||||||||||||||||||||||||||||||||||||||||||||||||||||||||||||||||||||||||||||||||||||||||||||||||||||||||||||||||||||||||||||||||||||||||||||||||||||||||||||||||||||||||||||||||||||||||||||||||||||||||||||||||||||||||||||||||||||||||||||||||||||||||||||||||||||||||||||||||||||||||||||||||||||||||||||||||||||||||||||||||||||||||||||||||||||||||||||||||||||||||||||||||||||||||||||||||||||||||||||||||||||||||||||||||||||||||||||||||||||||||||||||||||||||||||||||||||||||||||||||||||||||||||||||||||||||||||||||||||||||||||||||||||||||||||||||||||||||||||||||||||||||||||||||||||||||||||||||||||||||||||||||||||||||||||||||||||||||||||||||||||||||||||||||||||||||||||||||||||||||||||||||||||||||||||||||||||||||||||||||||||||||||||||||||||||||||||||||||||||||||||||||||||||||||||||||||||||||||||||||||||||||||||||||||||||||||||||||||||||||||||||||||||||||||||||||||||||||||||||||||||||||||||||||||||||||||||||||||||||||||||||||||||||||||||||||||||||||||||||||||||||||||||||||||||||||||||||||||||||||