| | | | | Large accelerated filer ☒ | Accelerated filer ☐ | Non-accelerated filer ☐ | Smaller reporting company ☐ | Emerging growth company ☐ |
If an emerging growth company, indicate by check mark if the registrant has elected not to use the extended transition period for complying with any new or revised financial accounting standards provided pursuant to Section 13(a) of the Exchange Act. ☐ Indicate by check mark whether the registrant has filed a report on and attestation to its management’s assessment of the effectiveness of its internal control over financial reporting under Section 404(b) of the Sarbanes-Oxley Act (15 U.S.C. 7262(b)) by the registered public accounting firm that prepared or issued its audit report. ☒ If securities are registered pursuant to Section 12(b) of the Act, indicate by check mark whether the financial statements of the registrant included in the filing reflect the correction of an error to previously issued financial statements. ☐ Indicate by check mark whether any of those error corrections are restatements that required a recovery analysis of incentive-based compensation received by any of the registrant’s executive officers during the relevant recovery period pursuant to §240.10D-1(b). ☐ Indicate by check mark whether the registrant is a shell company (as defined in Rule 12b-2 of the Exchange Act). Yes ☐ No ☒ As of February 21, 2020,13, 2023, there were outstanding 38,788,65239,684,473 shares of Common Stock par value $.69-4/9 per share, and 26,253,04928,606,918 shares of Class B Common Stock par value $.69-4/9 per share. As of June 30, 20192022 the aggregate market value of the Common Stock (based upon the closing price of the stock on the New York Stock Exchange on such date) held by non-affiliates was approximately $651,380,000.$611,433,000. Class B Common Stock is not traded on any exchange, is restricted as to transfer or other disposition, but is convertible into Common Stock on a share-for-share basis. Upon such conversion, the resulting shares of Common Stock are freely transferable and publicly traded. Assuming all 26,301,60228,622,730 shares of outstanding Class B Common Stock were converted into Common Stock, the aggregate market value of Common Stock held by non-affiliates on June 30, 20192021 (based upon the closing price of the stock on the New York Stock Exchange on such date) would have been approximately $815,198,000.$768,227,000. Determination of stock ownership by non-affiliates was made solely for the purpose of this requirement, and the Registrant is not bound by these determinations for any other purpose. DOCUMENTS INCORPORATED BY REFERENCE Portions of the Company’s Definitive Proxy Statement for the Company’s Annual Meeting of Shareholders (the “2020 Proxy“Proxy Statement”) scheduled to be held on May 4, 20201, 2023 are incorporated by reference in Part III of this report. Forward-Looking Information From time to time, in the Company’s statements and written reports, including this report, the Company discusses its expectations regarding future performance by making certain “forward-looking statements” within the meaning of the Private Securities Litigation Reform Act of 1995. Forward-looking statements can be identified by the use of words such as “anticipate,” “believe,” “expect,” “intend,” “estimate,” “project,” and other words of similar meaning in connection with a discussion of future operating or financial performance and are subject to certain factors, risks, trends and uncertainties that could cause actual results and achievements to differ materially from those expressed in the forward-looking statements. These forward-looking statements are based on currently available competitive, financial and economic data and management’s views and assumptions regarding future events. Such forward-looking statements are inherently uncertain, and actual results may differ materially from those expressed or implied herein. Consequently, the Company wishes to caution readers not to place undue reliance on any forward-looking statements. Factors, among others, which could cause the Company’s future results to differ materially from the forward-looking statements, expectations and assumptions expressed or implied herein include general factors, such as economic conditions, political developments, currency exchange rates, interest and inflation rates, accounting standards, taxes, and laws and regulations affecting the Company in markets where it competes and those factors described in Item 1A “Risk Factors” and elsewhere in this Form 10-K and in other Company filings with the Securities and Exchange Commission. The Company does not undertake to update any of these forward-looking statements. PART I ITEM 1. Business. Tootsie Roll Industries, Inc. and its consolidated subsidiaries (the “Company”) have been engaged in the manufacture and sale of confectionery products for over 100 years. This is the only industry segment in which the Company operates and is its only line of business. The majority of the Company’s products are sold under the registered trademarks TOOTSIE ROLL, TOOTSIE FRUIT ROLLS, FROOTIES, TOOTSIE POPS, TOOTSIE MINI POPS, CHILD’S PLAY, CARAMEL APPLE POPS, CHARMS, BLOW-POP, CHARMS MINI POPS, CELLA’S, DOTS, JUNIOR MINTS, CHARLESTON CHEW, SUGAR DADDY, SUGAR BABIES, ANDES, FLUFFY STUFF, DUBBLE BUBBLE, RAZZLES, CRY BABY, NIK-L-NIP, and TUTSI POP (Mexico). The Company’s products are marketed in a variety of packages designed to be suitable for display and sale in different types of retail outlets. They are sold through approximately 30 candyfood and grocery brokers andor directly by the Company itself to approximately 2,000 customers throughout the United States.States, Canada and Mexico. These customers include wholesale distributors of candy, food and groceries, supermarkets, variety stores, dollar stores, chain grocers, drug chains, discount chains, cooperative grocery associations, mass merchandisers, warehouse and membership club stores, vending machine operators, e-commerce merchants, the U.S. military and fund-raising charitable organizations. The Company’s principal markets are in the United States, Canada and Mexico. The majority of production from the Company’s Canadian plants is sold in the United States. The majority of production from the Company’s Mexican plant is sold in Mexico. The domestic confectionery business is highly competitive. The Company competes primarily with other manufacturers of confectionery products sold to the above mentioned customers. Although accurate statistics are not available, the Company believes it is among the ten largest domestic manufacturers in this field. In the markets in which the Company competes, the main forms of competition comprise brand recognition, as well as competition for retail shelf space and a fair price for the Company’s products at various retail price points. The Company did not have a materialCompany’s backlog of firm orders atas of December 31, 2022 was approximately $16 million and is consistent with the end of the calendar years 2019 or 2018.prior year. The Company has historically hedged certain of its future sugar and corn syrup needs with derivatives at such times that it believes that the forward markets are favorable. The Company’s decision to hedge its major ingredient requirements is dependent on the Company’s evaluation of forward commodity markets and their comparison to vendor quotations, if to vendor quotations, if available, and/or historical costs. The Company has historically hedged some of these major ingredients with derivatives, primarilygenerally entered into commodity futures contracts before the commencement of the next calendar year to better ascertain the need formanage product pricing changes or product weight decline (indirect price change) adjustments to its product sales portfolio and better manage ingredient costs. The Company will generally purchase forward derivative contracts (i.e., “long” position) in selected future months that correspond to the Company’s estimated procurement and usage needs of the respective commodity in the respective forward periods.
From time to time, the Company will increase its sales prices to recover higher input costs, primarily ingredients, packaging materials, and freight and delivery. The Company may also changeschange the size and weight of certain of its products in response to significant changes in ingredient and other input costs. The Company does not hold any material patents, licenses, franchises or concessions. The Company’s major trademarks are registered in the United States, Canada, Mexico and in many other countries. Continued trademark protection is of material importance to the Company’s business as a whole. Although the Company does research and develops new products and product line extensions for existing brands, it also improves the quality of existing products, improves and modernizes production processes, and develops and implements new technologies to enhance the quality and reduce the costs of products.products in order to provide value to its consumers. The Company does not expend material amounts of money on research or development activities. The manufacture and sale of consumer food products is highly regulated. In the United States, the Company’s activities are subject to regulation by various government agencies, including the Food and Drug Administration, the Department of Agriculture, the Federal Trade Commission, the Department of Commerce and the Environmental Protection Agency, as well as various state and local agencies. Similar agencies also regulate the businesses outside of the United States. The Company maintains quality assurance, food safety and other programs to help ensure that all products the Company manufactures and distributes are safe and of high quality and comply with all applicable laws and regulations. The Company’s compliance with federal, state and local regulations which have been enacted or adopted regulating the discharge of materials into the environment, or otherwise relating to the protection of the environment, has not had a material effect on the capital expenditures, earnings or competitive position of the Company nor does the Company anticipate any such material effects from presently enacted or adopted regulations. The Company employs approximately 2,000 persons.
2,300 full-time persons at all locations. Our business has seasonality which results in bringing on some additional employees to meet seasonal production demands principally in advance of the Halloween selling season in the third quarter each year. The Company has found that itsexperiences a relatively consistent sales normally maintain a consistent level throughout the year except for a substantialan increase in the third quarter which reflects pre-Halloween and back-to-school sales. In anticipation of this highseasonal sales period, the Company generally begins building inventories, and its seasonal workforce, in the second and third quarter of each year. Although Halloween is the most significant season in sales and related production, other seasons, including Christmas, Valentines, and Easter also have some impact on workforce levels. The Company’s union labor agreement at its Chicago plant was executed in 2018 and expired in September 2022. The Company historically offers extended credit terms for sales made under seasonal sales programs, including Halloween. Each year, after accounts receivables relatedand the union have agreed to third quarter sales have been collected,continue the Company invests such funds in various marketable securities.existing contract on a month to month basis while negotiations continue (see also risk factor below), which is consistent with past contract negotiation timelines. Sales revenuesWe believe our employees are among our most important resources and are critical to our continued success. We focus significant attention on attracting and retaining talented and experienced individuals to manage and support our operations. We pay our employees competitively and offer a broad range of company-paid benefits, which we believe are competitive with others in our industry. Our management teams and all of our employees are expected to exhibit and promote honest, ethical and respectful conduct in the workplace. All of our employees must adhere to a code of conduct that sets standards for appropriate behavior. A copy of our code of conduct can be found on our website, Tootsie.com. We have prioritized the safety of our employees and therefore implemented safety protocols during 2020 and continuing into 2023, to respond to the Covid-19 pandemic as needed.
Our net product sales from Wal-Mart Stores, Inc. aggregated approximately 24.2%23.0%, 24.1%22.7%, and 24.0%23.5% of net product sales during the years ended December 31, 2019, 20182022, 2021 and 2017,2020, respectively. Sales revenuesOur net sales from Dollar Tree, Inc. (which includes net sales from Family Dollar which was acquiredis owned by Dollar Tree) aggregated approximately 11.3%12.4%, 11.2%12.1%, and 10.9%11.7% of net product sales during the years ended December 31, 2019, 20182022, 2021 and 2017,2020, respectively. Some of the aforementioned sales to Wal-Mart and Dollar Tree arewere sold to McLane Company, a large national grocery wholesaler, which services and delivers certain of the Company’s products to Wal-Mart, Dollar Tree and other retailers in the U.S.A. Net product sales revenues from McLane, which includes these Wal-Mart and Dollar Tree sales as well as sales and deliveries to other Company customers, were 17.7%20.4% in 20192022 and 17.4%21.0% in 20182021 and 16.9%22.1% in 2017.2020. At December 31, 20192022 and 2018,2021, the Company’s three largest customers discussed above accounted for approximately 30%39% and 31%36% of total accounts receivable, respectively. Although no customer, other than McLane Company, Inc., Wal-Mart Stores, Inc. and Dollar Tree, accounted for more than 10% of net product sales, the loss of one or more significant customers could have a material adverse effect on the Company’s business. The Company historically offers extended credit terms for sales made under seasonal sales programs, including Halloween. Each year, after accounts receivables related to third quarter sales have been collected, the Company invests such funds in various marketable securities. For a summary of sales and long-lived assets of the Company by geographic area see Note 98 of the “NotesNotes to Consolidated Financial Statements”Statements which is incorporated herein by reference. Information regarding the Company’s Form 10-K, Form 10-Q, current reports on Form 8-K, and any amendments to these reports, will be made available, free of charge, upon written request to Tootsie Roll Industries, Inc., 7401 South Cicero Avenue, Chicago, Illinois 60629, Attention: Barry Bowen, Treasurer and Assistant Secretary. The Company does not make all such reports available on its website at www.tootsie.com because it believes that they are readily available from the Securities Exchange Commission at www.sec.gov, and because the Company provides them free of charge upon request. The information on our website is not incorporated into this Annual Report on Form 10-K. Interested parties, including shareholders, may communicate to the Board of Directors or any individual director in writing, by regular mail, addressed to the Board of Directors or an individual director, in care of Tootsie Roll Industries, Inc., 7401 South Cicero Avenue, Chicago, Illinois 60629, Attention: Ellen R. Gordon, Chairman and Chief Executive Officer. If an interested party wishes to communicate directly with the Company’s non-employee directors, it should be noted on the cover of the communication. ITEM 1A. Risk Factors. Significant factors that could impact the Company’s financial condition or results of operations include, without limitation, the following: Risk factors which we believe affect all competitors in our industry | ● | Our business and financial results may be negatively impacted by changes in confectionary trade practices and consumer patterns, or operational challenges associated with the actual or perceived effects of a disease or pandemic outbreak, such as the Covid-19 pandemic including variants and sub variants, and other public health concerns, consumer spending levels, shopping habits and behaviors (including changes in impulse purchase behaviors), consumer activities, work routines, events and traditions where confectionary products are consumed, the availability of our products at retail, including at large retail customers, and our ability to manufacture and distribute products to our customers and consumers in an effective and efficient manner. Government mandates to “shelter in place” or “closing of the economy”, public health guidelines, or fear of exposure or actual effects of a disease or pandemic, such as the Covid-19 pandemic, could negatively impact our overall business and financial results. Specific factors that may impact our operations, some of which have had, and in the future could have, an unfavorable impact on our operations as a result of Covid-19, include, but are not limited to: |
a. Significant reductions in demand for one or more of our products - Changes in demand may be caused by, among other things, the temporary inability of consumers to purchase our products due to illness, quarantine, travel restrictions, financial hardship, “shelter in place” directives, or overall fear to return to past behaviors. Shifts in demand for one or more of our products, changes in trade and distribution patterns, or changes in consumer buying habits, if prolonged, could negatively impact our results. b. The inability to meet our customers’ needs and achieve efficient production of finished products - Disruptions in our manufacturing operations or supply chain delivery disruptions caused by the loss or disruption of essential manufacturing ingredients, materials, supplies and services, transportation resources, workforce availability, or other manufacturing and distribution capability could have significant adverse effects on our business and financial results. c. Significant adverse changes in the political conditions and government mandates or directives - In markets in which we manufacture, sell or distribute our products, governmental or regulatory actions in response to pandemics, including Covid-19, closures or other restrictions such as quarantine or travel restrictions, that limit or close our manufacturing, distribution or office facilities, or otherwise prevent our third-party suppliers, sales brokers, or customers from achieving the level of operations necessary for the production, distribution, sale, and support of our products, could negatively impact our results. d. Risk related to Halloween and other seasonal sales - The Company’s net product sales are highest during the Halloween season which have historically comprised approximately 50% of third quarter domestic net product sales. Changes in consumer behavior, traditions, behaviors, and interest in Halloween activities and events, or changes mandated or recommended by government or health officials, as well as negative media coverage, could significantly affect the Company’s seasonal sales. e. Risks relating to potential employer liability - The effects of Covid-19 relating to employer liability remains uncertain, and if it is determined that employers are to have liability for employee or other matters related to Covid-19, this could have significant adverse effects on our financial results. | ● | Risk of changes in the price and availability of ingredients and raw materials - The principal ingredients used by the Company are subject to price volatility. Although the Company engages in commodity hedging transactions and annual supply agreements as well as leveraging the high volume of its annual purchases, the Company may experience price increases in certain ingredients, packaging materials, operating supplies, services, and wages and benefits, including the effects of higher inflation, that it may not be able to offset, which could have an adverse impact on the Company’s results of operations and financial condition. In addition, although the Company has historically been able to procure sufficient supplies of its ingredients, packaging materials, and other supplies, supply chain disruptions and market conditions could change such that adequate suppliesmaterials might not be available or only become available at substantially higher costs. Adverse weather patterns, including the effects of climate change or supply interruptions, could also significantly affect the cost and availability of ingredients.ingredients and other needed materials to manufacture products for sale. |
| ● | Risk of changes in product performance and competition - The Company competes with other well-established manufacturers of confectionery products. A failure of new or existing products to be favorably received, a failure to retain preferred shelf space at retail or a failure to sufficiently counter aggressive promotional and price competition could have an adverse impact on the Company’s results of operations and financial condition. |
| ● | Risk of discounting and other competitive actions - Discounting and pricing pressure by the Company’s retail customers including the effects of import tariffs, and other competitive actions could make it more difficult for the Company to maintain its operating margins. Actions taken by major customers and competitors may make shelf space less available for the confectionery product category or some of the Company’s products. |
| ● | Risk of pricing actions - Inherent risks in the marketplace, including uncertainties about trade and consumer acceptance of pricing actions, including related trade discounts, or product weight changes (indirect price increases), could make it more difficult for the Company to maintain its sales and operating margins. Higher costs for ingredients and materials, and other input costs may be difficult to pass onto customers and |
| | consumers of Company products through price increases, and therefore may adversely affect the Company’s profit margins. |
| ● | Risk related to seasonality of sales - The Company’s sales are highest during the Halloween season.season, although Christmas, Easter and Valentine’s Day are also key seasons for the Company. Circumstances surrounding Halloween, such as, widespread adverse weather or other widespread events that affect consumer behavior and related media coverage at that time of year or general changes in consumer interest in Halloween, could significantly affect the Company’s sales. |
| ● | Risk of dependence on large customers - The Company’s largest customers, Wal-Mart Stores, Inc., Dollar Tree, and the McLane Company accounted for approximately 37.1% of net product sales in 2019, and other large national chains are also material to the Company’s sales. The loss of any of these customers, or one or more other large customers, or a material decrease in purchases by one or more large customers, could result in decreased sales and adversely impact the Company’s results of operations and financial condition. |
| ● | Risk of changes in consumer preferences and tastes - Failure to adequately anticipate and react to changing demographics, consumer trends, consumer health concerns and product preferences, including product ingredients and packaging materials, could have an adverse impact on the Company’s results of operations and financial condition. |
| ● | Risk of economic conditions on consumer purchases - The Company’s sales are impacted by consumer spending levels and impulse purchases which are affected by general macroeconomic conditions, consumer confidence, employment levels, disposable income, inflation, availability of consumer credit and interest rates on that credit, consumer debt levels, energy costs and other factors. Volatility in food and energy costs, rising unemployment and/or underemployment, declines in personal spending, recessionary economic conditions or other adverse market conditions, could adversely impact the Company’s revenues, profitability and financial condition. |
| ● | Risks related to environmental matters - The Company’s operations are not particularly impactful on the environment, but increased government environmental regulation or legislation including various “green” initiatives could adversely impact the Company’s profitability. |
| ● | Risks relating to participation in the multi-employer pension plan for certain Company union employees - As outlined in the Notes to the Consolidated Financial Statements and discussed in the Management’s Discussion and Analysis , the Company participates in a multi-employer pension plan (Plan) which is currently in “critical and declining status”, as defined by applicable law. A designation of “critical and declining status” implies that the Plan is expected to become insolvent within the next 20 years. Under terms of a rehabilitation plan, the Company is to be assessed 5% annual compounded surcharges on its contributions to the Plan until such time as the Plan emerges from critical status. Should the Company withdraw from the Plan, it would be subject to a significant withdrawal liability which is discussed in Note 7 of the Company’s Notes to Consolidated Financial Statements and Management’s Discussion and Analysis. The Company is currently unable to determine the ultimate outcome of this matter and therefore, is unable to determine the effects on its consolidated financial statements, but, the ultimate outcome could be material to its consolidated results of operations in one or more future periods. |
| ● | Risk of new governmental laws and regulations - Governmental laws and regulations, including those that affect food advertising and marketing to children, use of certain ingredients in products, new labeling requirements, income and other taxes and tariffs, including the effects of changes to international trade agreements, new taxes targeted toward confectionery products and the environment, both in and outside the U.S.A., are subject to change over time, which could adversely impact the Company’s results of operations and ability to compete in domestic or foreign marketplaces. |
| ● | Risk of labor stoppages - To the extent the Company experiences any significant labor stoppages and disputes, labor organizing efforts, strikes or possible labor shortages, could negatively affect overall operations including production or shipments of finished product to customers. The Company’s union labor agreement at its Chicago plant was executed in 2018 and will continue through September 2022. |
| ● | Risk of impairment of goodwill or indefinite-lived intangible assets - In accordance with authoritative guidance, goodwill and indefinite-lived intangible assets are not amortized but are subject to an impairment evaluation annually or more frequently upon the occurrence of a triggering event. Other long-lived assets are likewise tested for impairment upon the occurrence of a triggering event. Such evaluations are based on assumptions and variables including sales growth, profit margins and discount rates. Adverse changes in any of these variables could affect the carrying value of these intangible assets and the Company’s reported profitability. |
| ● | Risk of the cost of energy increasing and overall inflation - Higher energy costs as well as overall inflation would likely result in higher plant overhead, distribution, freight and delivery, and other operating costs. The Company may not be able to offset these cost increases or pass such cost increases onto customers in the form of price increases, which could have an adverse impact on the Company’s results of operations and financial condition. In addition, higher energy costs also adversely affect the cost of many resins which are used as a foundation material for many of our packaging materials. |
| ● | Risk of a product recall - Issues related to the quality and safety of the Company’s products could result in a voluntary or involuntary large-scale product recall. Costs associated with a product recall and related litigation or fines, and marketing costs relating to the re-launch of such products or brands, could negatively affect operating results. In addition, negative publicity associated with this type of event, including a product recall relating to product contamination or product tampering, whether valid or not, could negatively impact future demand for the Company’s products. |
| ● | Risk of operational interruptions relating to computer software or hardware failures, including cyber-attacks - The Company is reliant on computer systems to operate its business and supply chain. Software failure or corruption, including cyber-based attacks or network security breaches, or catastrophic hardware or software |
| | failures or other disasters could disrupt communications, supply chain planning and activities relating to sales demand forecasts, materials procurement, production and inventory planning, customer orders, shipments, and collections, and financial and accounting, all of which could negatively impact sales and profits. |
| ● | Risk of releasing sensitive information - Although the Company does not believe that it maintains a large amount of sensitive data, a system breach, whether inadvertent or perpetrated by hackers, could result in identity theft, ransomware and/or a disruption in operations which could expose the Company to financial costs and adversely affect profitability. |
| ● | Disruption to the Company’s supply chain could impair the Company’s ability to produce or deliver its finished products, resulting in a negative impact on operating results - Disruption to the manufacturing operations or supply chain, some of which are discussed above, could result from, but are not limited to adverse tariffs which could effectively limit supply or make supply more costly, natural disasters, pandemics, weather, fire or explosion, earthquakes, terrorism or other acts of violence, unavailability of ingredients or packaging materials which could result if our suppliers are unable to obtain certain raw materials or make timely deliveries, labor strikes or other labor activities, labor shortages to meet higher demand for Company products, including the staffing of seasonal labor needs, logistical delays including materials from foreign locations, operational and/or financial instability of key suppliers, and other vendors or service providers. Although precautions are taken to mitigate the impact of possible disruptions, if the Company is unable, or if it is not financially feasible to effectively mitigate the likelihood or potential impact of such disruptive events, the Company’s results of operations and financial condition could be negatively impacted. |
| ● | Risks associated with climate change and other environmental impacts and regulations, and increased focus and evolving views of our customers and consumers of our products could negatively affect our business and operations -Climate-related changes can increase variability in, or otherwise impact, natural disasters, including weather patterns, with the potential for increased frequency and severity of significant weather events, natural hazards, rising mean temperature and sea levels, and long-term changes in precipitation patterns. Climate change or weather-related disruptions to agricultural crop yields and our supply chain can impact the availability and cost of materials needed for manufacturing and could increase commodity prices and our operating costs. Increased focus on climate change has led to legislative and regulatory efforts to combat both potential causes and adverse impacts of climate change, including regulation of greenhouse gas (GHG) emissions. New or increasing laws and regulations related to GHG emissions and other climate change related concerns may adversely affect us, our suppliers and our customers, and may require additional capital investments. Our global supply chain faces similar challenges as our products rely on agricultural ingredients some of which are sourced from a global supply chain. Climate change poses a significant and increasing risk to global food production systems and to the safety and resilience of the communities where we source certain of our ingredients. Additionally, any non-compliance with legislative and regulatory requirements could negatively impact our reputation and ability to do business. Customers, consumers, and government regulators have increasingly focused on the environmental or sustainability practices of companies. New legislation or an enforcement action in this area could harm our reputation and financial results. |
Risk factors which we believe are principally specific to our Company (although some may apply to varying degrees to competitors in our industry) | ● | Risks relating to participation in the multi-employer pension plan for certain Company union employees - As outlined in the Note 7 of the Company’s Notes to Consolidated Financial Statements and discussed in the Management’s Discussion and Analysis, the Company participates in a multi-employer pension plan (Plan) which is currently in “critical and declining status”, as defined by applicable law. A designation of “critical and declining status” implies that the Plan is expected to become insolvent within the next 20 years. Should the Company withdraw from the Plan, it would be subject to a significant withdrawal liability which is discussed in Note 7 of the Company’s Notes to Consolidated Financial Statements and Management’s Discussion and Analysis. The Company is currently unable to determine the ultimate outcome of this matter |
| | and therefore, is unable to determine the effects on its consolidated financial statements, but the ultimate outcome could be material to its consolidated results of operations in one or more future periods. |
| ● | Risk of impairment of goodwill or indefinite-lived intangible assets - In accordance with authoritative guidance, goodwill and indefinite-lived intangible assets are not amortized but are subject to an impairment evaluation annually or more frequently upon the occurrence of a triggering event. Other long-lived assets are likewise tested for impairment upon the occurrence of a triggering event. Such evaluations are based on assumptions and variables including sales growth, profit margins and discount rates. Adverse changes in any of these variables could affect the carrying value of these intangible assets and the Company’s reported profitability. |
| ● | Risk of production interruptions - The majority of the Company’s products are manufactured in a single production facility on specialized equipment. In the event of a disaster, such as a fire or earthquake, at a specific plant location, or other disruption, including labor shortages, it would be difficult to transfer production to other facilities or a new location in a timely manner, which could result in loss of market share for the affected products. In addition, from time to time, the Company upgrades or replaces this specialized equipment. In many cases these are integrated and complex installations. A failure or delay in implementing such an installation could impact the availability of one or more of the Company’s products which would have an adverse impact on sales and profits. |
| ● | Risk related to international operations - To the extent there are political leadership or legislative changes, social and/or political unrest, civil war, pandemics such as the Coronavirus, terrorism or significant economic or social instability in the countries in which the Company operates, the results of the Company’s business in such countries could be adversely impacted. Currency exchange rate fluctuations between the U.S. dollar and foreign currencies could also have an adverse impact on the Company’s results of operations and financial condition. The Company’s principal markets are the U.S.A., Canada, and Mexico. |
| ● | Risk related to investments in marketable securities - The Company invests its surplus cash in a diversified portfolio of highly rated marketable securities, includingprincipally corporate and tax exempt municipal bonds, with maturities generally of generally upthree to three years, and variable rate demand notes with weekly resets of interest rates and “puts’ to redeem the investment each week. Nonetheless, suchfive years. Such investments could become impaired in the event of certain adverse economic and/or geopolitical events which, if severe, would adversely affect the Company’s financial condition. |
| ● | DisruptionRisk of further losses in Spain - The Company has continued to restructure its Spanish subsidiary and is exploring a variety of programs to increase sales and profitability. Nonetheless, if our efforts are not successful, additional losses and impairments may be reported in the future. See also Management’s Discussion and Analysis. |
| ● | Risk of dependence on large customers - The Company’s largest customers, McLane Company, Wal-Mart and Dollar Tree, accounted for approximately 37% of net product sales in 2022, and other large national chains are also material to the Company’s supply chain could impair the Company’s ability to producesales. The loss of any of these customers, or deliver its finished products, resultingone or more other large customers, or a material decrease in a negative impact on operating results - Disruption to the manufacturing operationspurchases by one or supply chain, some of which are discussed above,more large customers, could result from, but are not limited to adverse tariffs which could effectively limit supply or make supply more costly, natural disasters, pandemics, weather, fire or explosion, earthquakes, terrorism or other acts of violence, unavailability of ingredients or packaging materials, labor strikes or other labor activities, operational and/or financial instability of key suppliers,in decreased sales and other vendors or service providers. Although precautions are taken to mitigate theadversely impact of possible disruptions, if the Company is unable, or if it is not financially feasible to effectively mitigate the likelihood or potential impact of such disruptive events, the Company’s results of operations and financial condition could be negatively impacted.condition. |
| ● | Risk related to acquisitions - From time to time, the Company has purchased other confectionery companies or brands. These acquisitions generally come at a high multiple of earnings and are justified based on various |
| | assumptions related to sales growth, and operating margins. Were the Company to make another acquisition and be unable to achieve the assumed sales and operating margins, it could have an adverse impact on future sales and profits. In addition, it could become necessary to record an impairment which would have a further adverse impact on reported profits. |
| ● | Risk of further losses in Spain - The Company has restructured its Spanish subsidiary and is exploring a variety of programs to increase sales and profitability. These efforts thus far are resulting in reductions in operating losses, and our efforts are continuing. Nonetheless, if our efforts are not successful, additional losses and impairments may be reported from in the future. See also Management’s Discussion and Analysis. |
| ● | Risk of “slack fill” or other product label litigation - The Company, as well as other confectionery and food companies, have experienced a number of plaintiff claims that certain products are sold in boxes that are not completely full, and therefore such “slack filled” products are misleading, and even deceptive, to the consumer. Although the Company believes that these claims and other product labeling claims are without merit and has generally been successful in litigation and court decrees, the Company could be exposed to significant legal fees to defend its position, and in the event that it is not successful, could be subject to fines and costs of settlement, including class action settlements. |
| ● | Risk related to international operations - To the extent there are political leadership or legislative changes, social and/or political unrest, civil war, pandemics such as the Coronavirus, terrorism or significant economic or social instability in the countries in which the Company operates, the results of the Company’s business |
| | in such countries could be adversely impacted. Currency exchange rate fluctuations between the U.S. dollar and foreign currencies could also have an adverse impact on the Company’s results of operations and financial condition. The Company’s principal markets are the U.S.A., Canada, and Mexico. |
| ● | Risk of union labor stoppages, slowdowns or strikes- The Company’s union labor agreement at its Chicago plant was executed in 2018 and expired in September 2022. The Company has been in negotiations with the union, and the parties agreed to extend the prior contract on a month-to-month basis and continue negotiations in good faith. These post-contract negotiations are consistent with past contract negotiations and timelines. In the event that the parties are unable to reach an agreement, a work stoppage or strike could result at the Company’s Chicago manufacturing plant and distribution center which could have a material effects on the Company’s sales and profits. |
| ● | The Company is a controlled company due to the common stock holdings of the Gordon family - The Gordon family’s share ownership represents a majority of the combined voting power of all classes of the Company’s common stock as of December 31, 2019.2022. As a result, the Gordon family has the power to elect the Company’s directors and approve actions requiring the approval of the shareholders of the Company. |
The factors identified above are believed to be significant factors, but not necessarily all of the significant factors, that could impact the Company’s business. Unpredictable or unknown factors could also have material effects on the Company. Additional significant factors that may affect the Company’s operations, performance and business results include the risks and uncertainties listed from time to time in filings with the Securities and Exchange Commission and the risk factors or uncertainties listed herein or listed in any document incorporated by reference herein. ITEM 1B. Unresolved Staff Comments. None. ITEM 2. Properties. The Company owns its principal manufacturing, warehousing and distribution, and offices facilities which are locatedoffice facilities. The Company’s largest operating facility in Chicago, Illinois also serves as the Corporate headquarters. The Company also owns domestic manufacturing, warehousing and distribution facilities in a building consisting of approximately 2,354,000 square feet.Tennessee (Covington), Massachusetts (Cambridge), and Wisconsin (Delavan) and international manufacturing facilities in Mexico (Mexico City), Spain (Barcelona) and two in Canada (Concord, Ontario). In addition, the Company leases manufacturing and warehousing facilities at a second location in Chicago which comprises 137,000 square feet.Chicago. The lease is renewable by the Company every five years through June 2041.
The Company’s other principal manufacturing, warehousing and distribution facilities, all of which are owned, are:
| | | | Location
|
| Square Feet (a)
|
|
|
|
|
| Covington, Tennessee
| | 685,000
|
| Cambridge, Massachusetts
| | 142,000
|
| Delavan, Wisconsin
| | 162,000
|
| Concord, Ontario, Canada
| | 280,500
| (b)
| Hazleton, Pennsylvania
| | 240,000
| (c)
| Mexico City, Mexico
| | 90,000
|
| Barcelona, Spain
|
| 93,000
| (d)
|
(a)Square footage is approximate and includes production, warehousing and office space.
(b)Two facilities; a third owned facility, comprising 225,000 square feet of warehousing space, and which is excluded from the reported totals above, is leased to a third party.
(c)Warehousing only.
(d)Excludes 9,500 square feet of unused office space in a separate facility which is leased to a third party.
The Company owns substantially all of the production machinery and equipment located in its plants, warehouses and distribution centers. The Company also holds four commercial real estate properties for investment which were acquired with the proceeds from a sale of surplus real estate in 2005.2005 as well as two warehouse facilities (in Concord, Ontario, Canada, and Hazelton, Pennsylvania, U.S.A.) that are currently leased to third parties. ITEM 3. Legal Proceedings. In the ordinary course of business, the Company is, from time to time, subject to a variety of active or threatened legal proceedings and claims. While it is not possible to predict the outcome of such matters with certainty, in the Company’s opinion, both individually and in the aggregate, they are not expected to have a material effect on the Company’s financial condition, results of operations or cash flows. ADDITIONAL ITEM. Executive Officers of the Registrant. See the information on Executive Officers set forth in the table in Part III, Item 10. ITEM 4. Mine Safety Disclosures. None. PART II ITEM 5. Market for Registrant’s Common Equity, Related Stockholder Matters and Issuer Purchases of Equity Securities. The Company’s common stock is traded on the New York Stock Exchange. The Company’s Class B common stock is subject to restrictions on transferability. The Class B common stock is convertible at the option of the holder into shares of common stock on a share-for-share basis. As of February 28, 202013, 2023 there were approximately 2,5002,300 and 1,000800 registered holders of record of common and Class B common stock, respectively. In addition, the Company estimates that as of February 28, 202013, 2023 there were 17,500124,500 and 1,000 beneficial holders of common and Class B common stock, respectively. The following table sets forth information about the shares of its common stock the Company purchased on the open market during the fiscal quarter ended December 31, 2019:
Issuer Purchases of Equity Securities
| | | | | | | | | | | | | | | | | | Total Number of | | Maximum Number (or | | | | Total | | Average | | Shares Purchased | | Approximate Dollar Value) | | | | Number | | Price | | as Part of Publicly | | of Shares that May Yet | | | | of Shares | | Paid per | | Announced Plans | | be Purchased Under the | | Period | | Purchased | | Share | | or Programs | | Plans or Programs | | | | | | | | | | | | | Oct 1 to Oct 31 | | 118,083 | | $ | 35.52 | | Not Applicable | | Not Applicable | | Nov 1 to Nov 30 | | 78,404 | | | 34.19 | | Not Applicable | | Not Applicable | | Dec 1 to Dec 31 | | — | | | — | | Not Applicable | | Not Applicable | | Total | | 196,487 | | $ | 34.99 | | | | | |
While the Company does not have a formal or publicly announceddividend policy, but has historically issued quarterly dividends and in 2022 issued a quarterly dividend of $0.09 per share. The Company commonhas also historically distributed an annual 3% stock purchase program,dividend. While the Company repurchases its commonplans to continue to issue quarterly cash dividends and the annual stock ondividend there can be no assurance that it will continue to do so in the open market from time to time as authorized by the Board of Directors.future.
Quarterly Stock Prices and Dividends
The high and low quarterly prices for the Company’s common stock, as reported on the New York Stock Exchange and quarterly dividends in 2019 and 2018 were:
| | | | | | | | | | | | | | | | | | | | | | | | | | | 2019 | | 2018 | | | 4th | | 3rd | | 2nd | | 1st | | 4th | | 3rd | | 2nd | | 1st | | | | Quarter | | | Quarter | | | Quarter | | | Quarter | | | Quarter | | | Quarter | | | Quarter | | | Quarter | | | | | | | | | | | | | | | | | | | | | | | | | | High | | $ | 36.93 | | $ | 38.44 | | $ | 40.43 | | $ | 37.80 | | $ | 35.71 | | $ | 32.35 | | $ | 31.45 | | $ | 36.20 | Low | | | 33.33 | | | 35.24 | | | 36.48 | | | 31.57 | | | 28.41 | | | 28.55 | | | 27.75 | | | 28.75 | Dividends per share | | | 0.09 | | | 0.09 | | | 0.09 | | | 0.09 | | | 0.09 | | | 0.09 | | | 0.09 | | | 0.09 |
NOTE: In addition to the above cash dividends, a 3% stock dividend was issued on April 5, 2019 and April 6, 2018.
Performance Graph The following performance graph compares the cumulative total shareholder return on the Company’s common stock for a five-year period (December 31, 20142017 to December 31, 2019)2022) with the cumulative total return of Standard & Poor’s 500 Stock Index (“S&P 500”) and the Dow Jones Industry Food Index (“Peer Group,” which includes the Company), assuming (i) $100 invested on December 31 of the first year of the chart in each of the Company’s common stock, S&P 500 and the Dow Jones Industry Food Index and (ii) the reinvestment of cash and stock dividends. 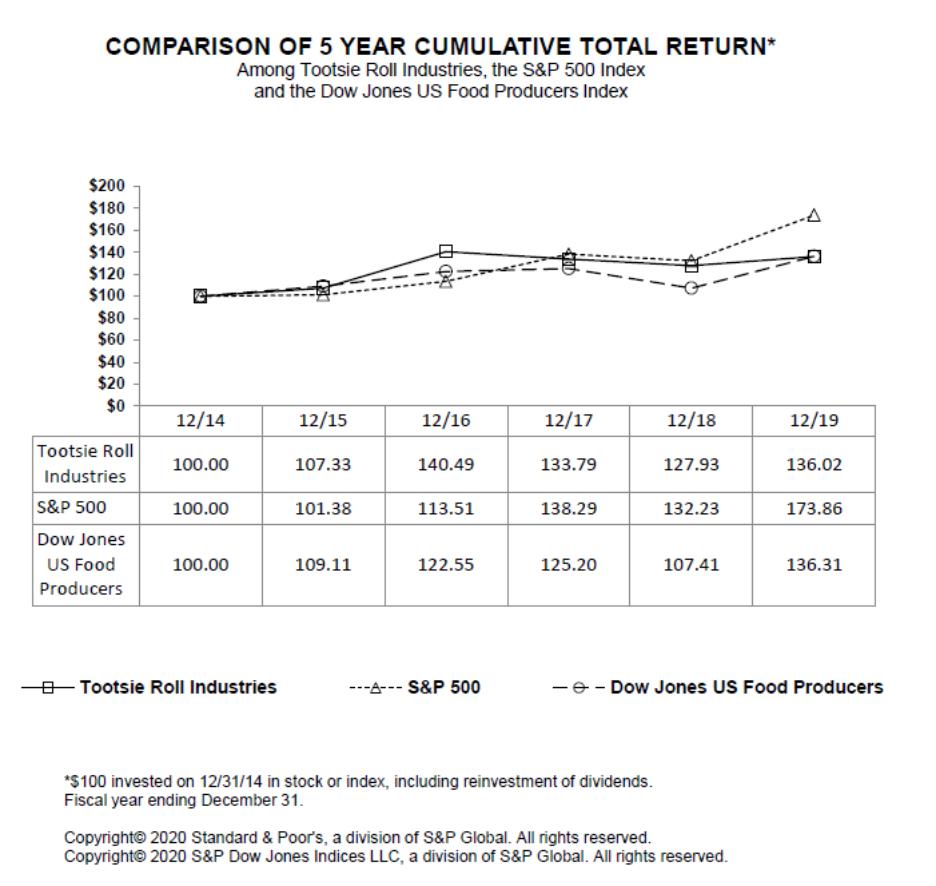 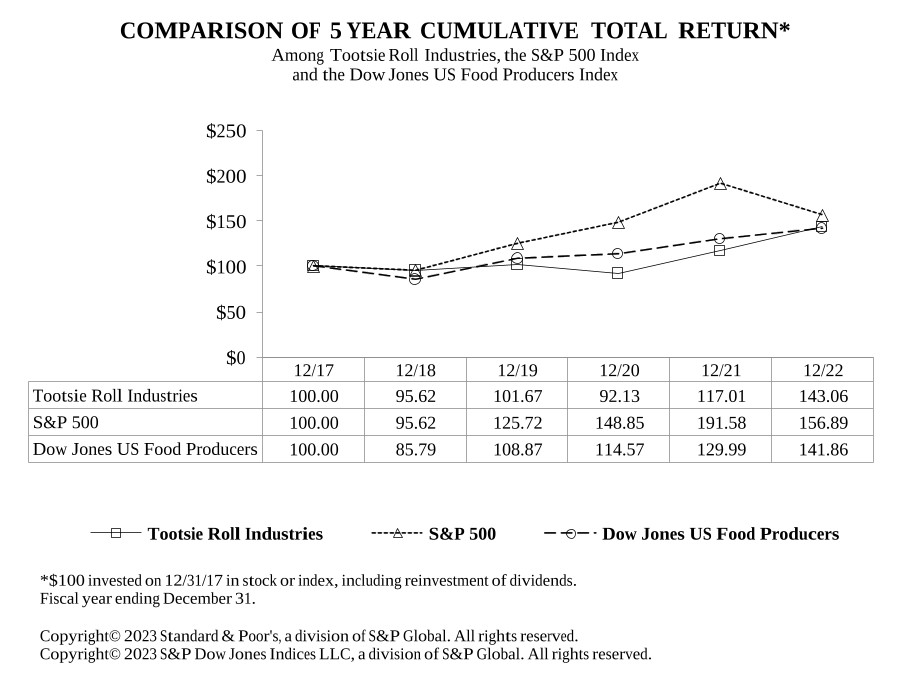
ITEM 6. Selected Financial Data.
Five Year Summary of Earnings and Financial Highlights
(Thousands of dollars except per share, percentage and ratio figures)
| | | | | | | | | | | | | | | | | | | 2019 | | 2018 | | 2017 | | 2016 | | 2015 | | Sales and Earnings Data | | | | | | | | | | | | | | | | | Net product sales | | $ | 523,616 | | $ | 515,251 | | $ | 515,674 | | $ | 517,373 | | $ | 536,692 | | Product gross margin | | | 194,514 | | | 185,371 | | | 189,263 | | | 196,504 | | | 196,118 | | Interest expense | | | 220 | | | 181 | | | 144 | | | 105 | | | 76 | | Provision for income taxes | | | 20,565 | | | 16,401 | | | 3,907 | | | 30,593 | | | 26,451 | | Net earnings attributable to Tootsie Roll Industries, Inc. | | | 64,920 | | | 56,893 | | | 80,864 | (2) | | 67,510 | | | 66,089 | | % of net product sales | | | 12.4 | % | | 11.0 | % | | 15.7 | % | | 13.0 | % | | 12.3 | % | % of shareholders’ equity | | | 8.5 | % | | 7.6 | % | | 11.0 | % | | 9.5 | % | | 9.5 | % | Per Common Share Data (1) | | | | | | | | | | | | | | | | | Net earnings attributable to Tootsie Roll Industries, Inc. | | $ | 0.99 | | $ | 0.86 | | $ | 1.21 | (2) | $ | 0.99 | | $ | 0.96 | | Cash dividends declared | | | 0.36 | | | 0.36 | | | 0.36 | | | 0.36 | | | 0.35 | | Stock dividends | | | 3 | % | | 3 | % | | 3 | % | | 3 | % | | 3 | % | Additional Financial Data (1) | | | | | | | | | | | | | | | | | Working capital | | $ | 273,786 | | $ | 242,655 | | $ | 207,132 | | $ | 235,739 | | $ | 221,744 | | Net cash provided by operating activities | | | 100,221 | | | 100,929 | | | 42,973 | | | 98,550 | | | 91,073 | | Net cash provided by (used in) investing activities | | | (15,009) | | | (44,510) | | | (9,320) | | | (51,884) | | | (9,672) | | Net cash used in financing activities | | | (57,187) | | | (42,353) | | | (56,881) | | | (51,387) | | | (53,912) | | Property, plant & equipment additions | | | 20,258 | | | 27,612 | | | 16,673 | | | 16,090 | | | 15,534 | | Net property, plant & equipment | | | 188,455 | | | 186,101 | | | 178,972 | | | 180,905 | | | 184,586 | | Total assets | | | 977,864 | | | 947,361 | | | 930,946 | | | 920,101 | | | 908,983 | | Long-term debt | | | 7,500 | | | 7,500 | | | 7,500 | | | 7,500 | | | 7,500 | | Total Tootsie Roll Industries, Inc. shareholders’ equity | | | 759,854 | | | 750,622 | | | 733,840 | | | 711,364 | | | 698,183 | | Average shares outstanding | | | 65,474 | | | 66,130 | | | 66,962 | | | 67,869 | | | 68,886 | |
(1) | Per common share data and average shares outstanding adjusted for annual 3% stock dividends. |
(2) | The 2017 net earnings and earnings per share includes $20,318 or $0.32 per share relating to a favorable accounting adjustment to revalue the Company’s deferred income tax liabilities resulting from the enactment of the U.S. Tax Cuts and Jobs Act in December 2017. |
ITEM 6. [RESERVED] ITEM 7. Management’s Discussion and Analysis of Financial Condition and Results of Operations. (Thousands of dollars except per share, percentage and ratio figures) The following discussion should be read in conjunction with the other sections of this report, including the consolidated financial statements and related notes contained in Item 8 of this Form 10-K. This section of this Form 10-K generally discusses the twelve months ended December 31, 2022 as compared to the same period of 2021. Discussions comparing the results of the twelve months ended December 31, 2021 as compared to same period of 2020 can be found in “Management’s Discussion and Analysis of Financial Condition and Results of Operations” in Part II, Item 7 of the Form 10-K for the year ended December 31, 2021. FINANCIAL REVIEW This financial review discusses the Company’s financial condition, results of operations, liquidity and capital resources, significant accounting policies and estimates, new accounting pronouncements, market risks and other matters. It should be read in conjunction with the Consolidated Financial Statements and related Notes that follow this discussion. FINANCIAL CONDITION The Company’s overall financial position remains strong given that aggregate cash, cash equivalents and investments is $392,435$396,926 at December 31, 2019,2022, including $76,183$71,208 in trading securities discussed below. Cash flows from 20192022 operating activities totaled $100,221$72,051 compared to $100,929$85,298 in 2018,2021, and are discussed in the section entitled Liquidity and Capital Resources. During 2019,2022, the Company paid cash dividends of $23,460,$24,629, purchased and retired $34,116$31,910 of its outstanding shares, and made capital expenditures of $20,258.$23,356. The Company’s net working capital was $273,786$218,894 at December 31, 20192022 compared to $242,655$188,333 at December 31, 20182021. This increase principally reflects the effects of increased short-term investments and inventories which reflects higher aggregate cash, cash equivalents and short-term investments.is discussed below. As of December 31, 2019,2022, the Company’s total cash, cash equivalents and investments, including all long-term investments, in marketable securities, was $392,435$396,926 compared to $356,448$436,983 at December 31, 2018, an increase2021, a decrease of $35,987.$40,057. See Liquidity And Capital Resources section below for discussion. The aforementioned includes $76,183$71,208 and $62,260$89,736 of investments in trading securities as of December 31, 20192022 and 2018,2021, respectively. The Company invests in trading securities to provide an economic hedge for its deferred compensation liabilities, as further discussed herein and in Note 79 of the Company’s Notes to Consolidated Financial Statements. Shareholders’ equity increased from $750,622$769,042 at December 31, 20182021 to $759,854$783,171 as of December 31, 2019,2022, which principally reflects 20192022 net earnings of $64,920,$75,937, less cash dividends of $23,460$24,629 and share repurchases of $34,116.$31,910. The Company has a relatively straight-forward financial structure and has historically maintained a conservative financial position. The Company has no special financing arrangements or “off-balance sheet” special purpose entities. Cash flows from operations plus maturities of short-term investments are expected to be adequate to meet the Company’s overall financing needs, including capital expenditures, in 2020.2023. Periodically, the Company considers possible acquisitions, and if the Company were to pursue and complete such an acquisition, that could result in bank borrowings or other financing. RESULTS OF OPERATIONS 20192022 vs. 20182021
Twelve months 20192022 consolidated net product sales were $523,616$681,440 compared to $515,251$566,043 in twelve months 2018,2021, an increase of $8,365$115,397 or 1.6%20.4%. Fourth quarter 20192022 net product sales were $134,663$188,180 compared to $127,264$166,598 in fourth quarter 2018,2021, an increase of $7,399$21,582, or 5.8%13.0%. Successful marketing andThe sales programs contributed to the increasesgrowth in sales for both fourth quarter and twelve months 2019 compared2022 was driven by an overall increase in demand and higher sales price realization. Effective sales and marketing programs, including Halloween and other seasonal sales programs, contributed to higher sales volumes in fourth quarter and twelve months 2022. Consumers returned to more activities and lifestyles during 2021 and throughout 2022 that they experienced prior to the corresponding periodsCovid-19 pandemic. These activities include planned purchases of the Company’s products for “sharing” and “give-a-way” occasions. Many of the Company’s products are consumed at group events, outings, and other gatherings, including Halloween events, which had been curtailed or in some cases eliminated in response to the prior year. Fourth quarter 2019Covid-19 pandemic. Twelve months 2022 sales also benefited from the timing of sales between the third and fourth quarters of 2019, however, foreign currency translation had some adverse effects on consolidated sales for theexceeded twelve months 2019 period comparedsales by 30% which provides a sales comparison prior to 2018.the pandemic. Product cost of goods sold were $329,102$452,552 in 20192022 compared to $329,880$370,105 in 2018, a decrease2021, an increase of $778$82,447 or 0.2%22.2%. Product cost of goods sold includes $408$(893) and $(39)$687 in certain deferred compensation (credits) expenses (credits) in 20192022 and 2018,2021, respectively. These deferred compensation expenses principally result from changes in the market value of investments and investment income from trading securities relating to compensation deferred in previous years and are not reflective of current operating results. Adjusting for the aforementioned, product cost of goods sold decreasedincreased from $329,919$369,418 in 2018 to $328,694 in 2019, a decrease of $1,225$84,027 or 0.4%22.7%. As a percent of net product sales, these adjusted costs decreasedincreased from 64.0%65.3% in 20182021 to 62.8%66.5% in 2019,2022, a 1.3 favorable1.2 unfavorable percentage point change.
Fourth quarter and twelve months 20192022 gross profit margins were adversely affected by increasing costs for ingredients, packaging materials, and certain manufacturing supplies and services. Fourth quarter and twelve months product cost of goods sold compared to the corresponding prior year periods, were also adversely impacted by inefficiencies caused by higher than expected sales demand, supply chain challenges and resultingdisruptions, longer supplier lead times, and some labor shortages. We also incurred additional costs, including overtime and extended operating shifts for plant manufacturing, to meet this higher demand in 2022. These factors resulted in additional costs related to our efforts to meet this higher demand. Certain cost and expense reductions, including Company initiatives to reduce costs did provide some benefit to 2022 gross profit margins. Although higher fourth quarter and twelve months 2022 sales, including sales price increases, contributed to improved net earnings compared to the corresponding prior year periods in 2021, significantly higher input costs substantially offset the benefits of these higher sales. Fourth quarter and twelve months 2022 gross profit margins benefitedand net earnings were adversely affected by significantly higher costs for ingredients, packaging materials, freight and delivery, and many manufacturing supplies and services. Our input unit costs moved significantly higher in 2022 compared to 2021 as most of our supply contracts for ingredients, packaging materials and manufacturing supplies and services expired at the end of 2021 and new supply agreements at higher prices became effective in early 2022. In certain instances, we expanded our annual commitments for some ingredients from our suppliers in 2022 to meet higher demand. However, certain markets were very tight and this incremental expansion resulted in even higher unit costs for these additional materials. Supplier and transportation delays also caused us to purchase some limited quantities of ingredients in the spot market which were at substantially higher unit costs than our contracted prices. Supply chain challenges and limited availability of certain ingredients and materials, as well as generally higher commodity markets, drove up our unit costs for many key ingredients and materials in 2022. The adverse effects of higher energy costs, including higher diesel fuel surcharges, have added to our input costs on both customer and supplier freight and delivery in 2022. These higher energy costs have also increased salesour costs for utilities to operate our manufacturing plants in 2022. Based on our 2023 supply contracts, we expect even higher unit costs for most ingredients and materials in 2023. The Company uses the Last-In-First-Out (LIFO) method of accounting for inventory and costs of goods sold which results in lower current income taxes during such periods of increasing costs and higher price realization which allowedinflation, but this method does charge the Companymost current costs to recover some margin decline resulting from increases in certain input costs in recent years. Plant efficiencies driven by capital investments and ongoing cost containment programs contributed to the above discussed decreases in adjusted cost of goods sold and thereby accelerates the realization of these higher costs. Our supply chain was extremely challenging in 2019. Prior year 2018 gross margin was adversely affected by the implementation2022, as our supplier lead times expanded greatly and start-up of new manufacturing packaging lines and resulting operational inefficiencies, as well as unfavorable experience from self-insurance programs. The Company is continuing its investments in its plant manufacturing operationssome suppliers were unable to meet new consumersome promised delivery dates. In some cases, we were unable to secure timely delivery of additional ingredients and packaging materials to meet our higher demand in 2022, and therefore had to limit our customer demands, achieve quality improvements, provide genuine valuesales order volumes of some products. We are continuing to consumers,focus on the supply chain and increase operational efficiencies.possible delays and disruptions, but this area continues to have much less predictability compared to past history. Although the supply chain continues to improve, it is possible that supply chain disruptions could result in the temporary shut-down of one or more manufacturing lines resulting in lost sales and profits in 2023. Labor shortages at some of our manufacturing plant locations also contributed to some production limitations and lost sales in 2022. We believe that these labor shortages will continue to have some adverse impact on the fulfillment of customer orders in 2023 and may limit our growth opportunities for certain products in 2023. Nonetheless, we were able to meet substantially all of our labor needs in 2022, including for our seasonal increases in production. However, the tight labor market has created much more uncertainty than in the past. Selling, marketing and administrative expenses were $127,802$121,976 in 20192022 compared to $117,691$132,108 in 2018, an increase2021, a decrease of $10,111$10,132 or 8.6%7.7%. Selling, marketing and administrative expenses include $10,884$(16,370) and $(1,064)$13,521 in certain deferred compensation (credits) expenses (credits) in 20192022 and 2018,2021, respectively. These deferred compensation (credits) expenses principally result from changes in the market value of investments and investment income from trading securities relating to compensation deferred in previous years and are not reflective of current operating results. Adjusting for the aforementioned, selling, marketing and administrative expenses decreasedincreased from $118,755$118,587 in 20182021 to $116,918$138,346 in 2019, a decrease2022, an increase of $1,837$19,759 or 1.5%16.7%. AsThis increase was principally driven by the increase in certain variable expenses, primarily freight and delivery and direct selling expenses, relating to the increase in sales as discussed above. However, as a percent of net product sales, these adjusted expenses decreased from 23.0%21.0% of net product sales in 20182021 to 22.3%20.3% of net product sales in 2019,2022, a 0.7 favorable percentage point change. Higher price realization, lower general and administrative expenses, primarily legal and professional fees, and lower freight and delivery unit costs were the principal drivers in these favorable reductions, including reductions as a percentage of sales, in selling, marketing and administrative expenses in fourth quarter and twelve months 2019. Selling, marketing and administrative expenses include freight, delivery and warehousing expenses. These expenses decreasedincreased from $49,527$55,289 in 20182021 to $49,288$67,342 in 2019, a decrease2022, an increase of $239$12,053 or 0.5%21.8%. As a percent of net product sales, these adjusted expenses decreasedincreased from 9.6%9.8% in 20182021 to 9.4%9.9% in 2019,2022, a 0.2 favorable0.1 unfavorable percentage point change. During 2019,Increasing energy costs and related effects on fuel surcharges, and the Company implemented additionaladverse effects of the continuing shortage of over-the-road drivers and high demand for carriers, were the principal drivers of these higher freight and delivery computer systemsexpenses in 2022 compared to 2021. In response to these higher input costs many companies in the consumer products industry have increased selling prices throughout 2021 and carrier selection processes, including enhanced competitive bidding, which facilitated this favorable unit cost reduction2022. We have followed with price increases as well with the objective of improving sales price realization and restoring some of our margin declines. Price increases were phased in principally beginning in second half 2021 and continued throughout 2022 and into 2023. The improvement in fourth quarter 2022 margins and twelve months 2019.net earnings reflects the cumulative benefits of this higher price realization. Although our price increases have generally reflected the overall price increases in our industry, they have not as yet resulted in fully restoring our margins to historical levels. The Company believes that we should be able to make more progress in restoring our margins in 2023 when all of our price increases take full effect. However, continuing increases in input costs and overall high inflation may not allow us to fully restore our margins to historical levels prior to the pandemic. Although the Company continues to monitor these higher input costs and price increases in the industry, we are mindful of the effects and limits of passing on all of the above discussed higher input costs to consumers of our products. The Company has foreign operating businesses in Mexico, Canada and Spain, and exports products to many foreign markets. Such foreign sales were $44,826 and comprised 8.6%The Company’s Spanish subsidiary (97% owned by the Company) incurred an operating loss of the Company’s consolidated net product sales$1,430 in 2019. In fourth quarter 2019 and 2018, the Company recorded a pre-tax impairment charge of $377 and $1,125, respectively, relating2022 compared to its Spanish operations. The Company had a 97% ownership of a Spanish company at both December 31, 2019 and 2018. During 2019 and 2018, this Spanish subsidiary incurred operating losses of $1,102 and $2,840, respectively, and the Company provided approximately $1,399 and $4,484, respectively, of additional cash to finance these losses and certain capital expenditures.$598 loss in 2021. Company management expects the competitive and business challenges in Spain to continue, but expects continued reductionhowever, Company management believes that we will make progress on reducing this operating loss in operating losses in 2020 compared to 2019.2023. Nonetheless, management believes that operating losses maywill likely continue beyond 20192023 and that these future losses, mayas well as some capital expenditures, will likely require some additional cash financing. The Company believes that the carrying values of its goodwill and trademarks have indefinite lives as they are expected to generate cash flows indefinitely. In accordance with current accounting guidance, these indefinite-lived intangible assets are assessed at least annually for impairment as of December 31 or whenever events or circumstances indicate that the carrying values may not be recoverable from future cash flows. No impairments were recorded in 2019, 20182022, 2021 or 2017.2020. Current accounting guidance provides entities an option of performing a qualitative assessment (a "step-zero" test) before performing a quantitative analysis. If the entity determines, on the basis of certain qualitative factors, that it is more-likely-than-not that the intangibles (goodwill and certain trademarks) are not impaired, the entity would not need to proceed to the two step impairment testing process (quantitative analysis) as prescribed in the guidance. During fourth quarter 20192022 (and fourth quarter 2018)quarters 2021 and 2020), the Company performed a “step zero” test of its goodwill and certain trademarks, and concluded that there was no impairment based on this guidance. For the fair value assessment of certain trademarks where the “step-zero” analysis was not considered appropriate, impairment testing was performed in fourth quarter 20192022 (and fourth quarter 2018)quarters 2021 and 2020) using discounted cash flows and estimated royalty rates. For these trademarks, holding all other assumptions constant at the test date, a 100 basis point increase in the discount rate or a 100 basis point decrease in the royalty rate would reduce the fair value of these trademarks by approximately 16%13% and 10%, respectively. Individually, a 100 basis point increase in the discount rate may result in potential impairment of up to $2 million. Aor a 100 basis point decrease in the royalty rate would not result in a potential impairment as of December 31, 2019.2022. Earnings from operations were $69,214$110,755 in 20192022 compared to $70,482$67,133 in 2018, a decrease2021, an increase of $1,268.$43,622. Earnings from operations include $11,292$(17,263) and $(1,103)$14,208 in certain deferred compensation (credits) expense (credits) in 20192022 and 2018,2021, respectively, which are discussed above. Adjusting for these deferred compensation expenses, adjusted earnings from operations increased from $69,379$81,341 in 20182021 to $80,506$93,492 in 2019,2022, an increase of $11,127$12,151 or 16.0%14.9%. Fourth quarter and twelve months results benefitted fromThe above discussed increase in net product sales was the principal driver of higher operating earnings in 2022 compared to 2021. Although higher 2022 sales contributed to improved operating earnings compared to the corresponding prior year periods, higher input costs mitigated much of the benefits of increased sales and higher price realization as well as reductions in certain costs and expenses discussed above.sales. Management believes the comparisons presented in the preceding paragraphs, after adjusting for changes in deferred compensation, are more reflective of the underlying operations of the Company. Other income (expense), net was $16,190$(12,614) in 20192022 compared to $2,724$18,596 in 2018, an increase2021, a decrease of $13,466.$31,210. Other income, net principally reflects $11,292$(17,263) and $(1,103)$14,207 of aggregate net (losses) gains (losses) and investment income on trading securities in 20192022 and 2018,2021, respectively. These trading securities provide an economic hedge of the Company’s deferred compensation liabilities; and the related net (losses) gains (losses) and investment income were offset by a like amount of (credit) expense in aggregate product cost of goods sold and selling, marketing, and administrative expenses in the respective years as discussed above. Other income (expense), net includes investment income on available for sale securities of $4,423$2,641 and $3,535$2,740 in 20192022 and 2018,2021, respectively. Other income, net also includes foreign exchange gains (losses) of $(533)$1,307 and $(659)$667 in 20192022 and 2018,2021, respectively. The Company’s effective income tax rate was 27.9%rates were 21.2% and 23.5%25.7% in fourth quarter 20192022 and 2018,2021, respectively, and 24.1%22.7% and 22.4%23.8% in twelve months 20192022 and 2018, respectively.2021, respectively The increasedecrease in the effective tax rates for the fourth quarter and twelve months 2019in 2022 generally reflects higher state income taxes, including increases in reserves for uncertain state tax benefits, and increases in valuation allowanceslower rates for state and international income tax credit carry-forwards which are not likely to be fully realized in the future.provisions. A reconciliation of the differences between the U.S. statutory rate and these effective tax rates is provided in Note 4 of the Company’s Notes to Consolidated Financial Statements. At December 31, 2019 and 2018, the Company’s deferred tax assets include $617 and $1,844 of income tax benefits relating to its Canadian subsidiary tax loss carry-forwards. The Company expects to fully utilize this deferred tax asset in 2020 (expiration dates are 2029 through 2031). The Company utilized $1,227 and $1,896 of these Canadian tax carry-forward benefits in 2019 and 2018, respectively. The Company has concluded that it is more-likely-than-not that it would realize these deferred tax assets relating to its Canadian tax loss carry-forwards because it is expected that sufficient levels of taxable income will be generated during the carry-forward periods. The Company has provided a full valuation allowance on its Spanish subsidiaries’ tax loss carry-forward benefits of $3,967$4,497 and $3,651$4,376 as of December 31, 20192022 and 2018,2021, respectively, because the Company has concluded that it is not more-likely-than-not that these losses will be utilized before their expiration dates. The Spanish subsidiary has a history of net operating losses and it is not known when and if they will generate taxable income in the future.
U.S. tax reform (US Tax Cuts and Jobs Act enacted in December 2017) included a one-time toll charge resulting from the mandatory deemed repatriation of undistributed foreign earnings and profits. The Company determined that there were no net undistributed foreign earnings and profits subject to this toll charge. U.S. tax reform also changed the United States approach to the taxation of foreign earnings to a territorial system by providing a one hundred percent dividends received deduction for certain qualified dividends received from foreign subsidiaries. These provisions of the U.S. tax reform significantly impact the accounting for the undistributed earnings of foreign subsidiaries, and as a result the Company distributed $8,200 of the earnings held in excess cash by its foreign subsidiaries in 2019.subsidiaries. The tax costs associated with a future distribution, including foreign withholding taxes, are not material to the Company’s financial statements. After carefully considering these facts, the Company determined that it would not be asserting permanent reinvestment of all of its foreign subsidiaries earnings as of December 31, 2017, and the Company continuescontinued to maketake this assertion.position as of December 31, 2022.
Net earnings attributable to Tootsie Roll Industries, Inc. were $14,555$75,937 in fourth quarter 20192022 compared to $12,175$65,326 in fourth quarter 2018,2021, and net earnings per share were $0.22$1.10 and $0.18$0.94 in fourth quarter 20192022 and 2018, respectively. Twelve months 2019 net earnings were $64,920 compared to $56,893 in twelve months 2018, and net earnings2021, respectively, an increase of $0.16 per share were $0.99 and $0.86 in twelve months 2018 and 2017, respectively.or 17.0%. Earnings per share in 20192022 benefited from the reduction in average shares outstanding resulting from purchases of the Company’s common stock in the open market by the Company. Average shares outstanding decreased from 66,13069,438 in 20182021 to 65,47468,829 in 20192022 which reflects share repurchases of $34,116$31,910 during 2019.2022. Fourth quarter 2022 and 2021 net earnings attributable to Tootsie Roll Industries, Inc. were $25,344 and $20,032, respectively, and net earnings per share were $0.37 and $0.29, respectively, an increase of $0.08 per share or 27.6%. The improvement in fourth quarter 2022 margins and net earnings reflects the cumulative benefits of this higher price realization and higher sales as discussed above. Beginning in 2012, the Company has received periodic notices from the Bakery and Confectionery Tobacco WorkersUnion and Grain MillersIndustry International Union Pension PlanFund (Plan), a multi-employer defined benefit pension plan for certain Company union employees, that the Plan’s actuary certified the Plan to be in “critical status”, the “Red Zone”, as defined by the Pension Protection Act (PPA) and the Pension Benefit Guaranty Corporation (PBGC); and that a plan of rehabilitation was adopted by the trustees of the Plan in 2012. During 2015, the Company received notices that theThe Plan’s status was changed to “critical and declining status”, as defined by the PPA and PBGC, for the plan year beginning January 1, 2015, and that the Plan was projected to have an accumulated funding deficiency for the 2017 through 2024 plan years. A designation of “critical and declining status” implies that the Plan is expected to become insolvent in the next 20 years. The Company has continued to receive annual notices each year (2016 to 2019)2022) that this Plan remains in “critical and declining status” and is projected to become insolvent within the next 20 years. These notices have also advised that the Plan trustees were considering the reduction or elimination of certain retirement benefits and may seek assistance from the PBGC. Plans in “critical and declining status” may elect to suspend (temporarily or permanently) some benefits payable to all categories of participants, including retired participants, except retirees that are disabled or over the age of 80. Suspensions must be equally distributed and cannot drop below 110% of what would otherwise be guaranteed by the PBGC. Based on these updated notices, the Plan’s funded percentage (plan investment assets as a percentage of plan liabilities), as defined, were 51.6%48.5%, 54.7%48.3%, and 57.0%50.4% as of the most recent valuation dates available, January 1, 2018, 2017,2021, 2020, and 2016,2019, respectively (these valuation dates are as of the beginning of each Plan year). The Plan has recently advised that the all Plan information discussed herein, including the Company’s withdrawal liability, is the most current available information, and that more current information should be available in second quarter 2023. These funded percentages are based on actuarial values, as defined, and do not reflect the actual market value of Plan investments as of these dates. If the market value of investments had been used as of January 1, 20192021 the funded percentage would be 54.2%52.8% (not 51.6%48.5%). As of the January 1, 20182021 valuation date (most recent valuation available), only 18%15% of Plan participants were current active employees, 52%54% were retired or separated from service and receiving benefits, and 30%31% were retired or separated from service and entitled to future benefits. The number of current active employee Plan participants as of January 1, 20182021 fell 3%6% from the previous year and 11%22% over the past twothree years. When compared to the Plan valuation date of January 1, 2011 (seven years earlier)(just prior to the Plan being certified to be in “critical status”), current active employee participants have declined 39%52%, whereas participants who were retired or separated from service and receiving benefits increased 6%3% and participants who were retired or separated from service and entitled to future benefits increased 9%10%. The Company understands that the Plan is continuing to explore additional restructuring measures which include incentives to participating employers in exchange for providing additional future cash contributions as well as suspension of certain retirement benefits. The Company has been advised that its withdrawal liability would have been $99,800, $81,600,$104,300, $99,300 and $82,200$99,800 if it had withdrawn from the Plan during 2021, 2020 and 2019, 2018 and 2017, respectively. The increase from 2018 to 2019 was mainly attributable to a decreaseAs discussed above, the Plan has advised the Company that more current information, including an update on the Company’s withdrawal, should be available in the Plan’s assets during 2018, net of market returns, and the withdrawal of a large contributing employer where their actual withdrawal payments (likely over 20 years as discussed below) are not enough to fully fund their actual withdrawal liability.second quarter 2023. The Company’s relative share of the Plan’s contribution base, driven by employer withdrawals, has increased for the last several years, and management believes that this trend, could continue indefinitely which will continue to add upward pressure on the Company’s withdrawal liability. Based on the above, including the Company’s increase in such union labor hours to meet its higher 2022 demand and the Plan’s projected insolvency in the year 2030,next 20 years, management believes that the Company’s withdrawal liability could increase further in future years. Based on the Company’s updatedmost recent actuarial studyestimates using the information provided by the Plan with respect to the 2021 withdrawal liability and certain provisions in ERISA and the lawlaws relating to withdrawal liability payments, management believes that the Company’s liability had the Company withdrawn in 2022 would likely be limited to twenty annual payments of $3,045$2,714 which have a present value in the range of $35,700$31,851 to $46,700$43,741 depending on the interest rate used to discount these payments. While the Company’s actuarial consultant doesdid not believe that the Plan will suffer a future mass withdrawal (as defined) of participating employers, in the event of a mass withdrawal, the Company’s annual withdrawal payments would theoretically be payable in perpetuity. Based on the Company’s updatedsame actuarial study,estimates, the present value of such perpetuities had a mass withdrawal occurred in 2022 is in the range of $49,900$44,472 to $104,500$115,808 and would apply in the unlikely event that substantially all employers withdraw from the Plan. The aforementioned is based on a range of valuations and interest rates which the Company’s actuary has advised is provided under the statute. Should the Company actually withdraw from the Plan at a future date, a withdrawal liability, which could be higher than the above discussed amounts, could be payable to the Plan. The Company and the union concluded a neware currently in labor contract negotiations following the expiration of the existing agreement in 2018September 2022. The parties are continuing to operate under extensions of the expired labor agreement which requires the Company’s continued participation in this Plan through September 2022.Plan. The amended rehabilitation plan, which also continues, requires that employer contributions include 5% compounded annual surcharge increases each year for an unspecified period of time beginning in 2012 as well as certain plan benefit reductions. The Company’s pension expense for this Plan for 2019, 20182022, 2021 and 20172020 was $2,961, $2,836$3,510, $3,156 and $2,617,$2,866, respectively. The aforementioned expense includes surcharges of $948, $811$1,237, $1,112 and $656$1,010 in 2019, 20182022, 2021 and 2017,2020, respectively, as required under the amended rehabilitation plan. In fourth quarter 2020, the Plan Trustees advised the Company that the surcharges would no longer increase annually and therefore be “frozen” at the rates and amounts in effect as of December 31, 2020 provided that the local bargaining union and the Company executed a formal consent agreement by March 31, 2021. The Trustees advised that they have concluded that continuing increases in surcharges would likely have a long-term adverse effect on the solvency of the Plan. The Trustees concluded that further increases would result in increasing financial hardships and withdrawals of participating employers, and that this change will not have a material effect on the Plan’s insolvency date. In first quarter 2021, the local bargaining union and the Company executed this agreement which resulted in the “freezing” of such surcharges as of December 31, 2020. The Plan advised the Company that it will be applying for benefits available to financial troubled plans under the American Rescue Plan Act of 2021. Company management understands that the U.S Congress and the U.S Senate have proposed variousthis legislation including the “Butch Lewis Act,” that would provide varying degrees offinancial assistance from the PBGC to troubledshore up financially distressed multi-employer plans similar to this Plan, including long-term lowensure that they can remain solvent and continue to pay benefits to retirees through 2051 without any reduction in retiree benefits. The PBGC final ruling lifts certain investment restrictions imposed by the interim rule and now allows for a split interest loansrate structure between existing assets and assets acquired with PBGC assistance that should substantially increase the amount of financial assistance available to troubled multi-employer plans. Certain provisions proposed would change the Plan. While the Plan’s future solvency will depend significantly on future investment experience and contribution levels even if financial assistance is awarded, many plans previously projected to go insolvent prior to 2051 are now projected to go insolvent closer to, or even beyond 2051, as a result of the final rule. The Company’s actuary advised that the regulations under the aforementioned PBGC financial assistance could result in a higher withdrawal liability rules which could increase the Company’s obligation in the event that the Company withdrew form this Plan, resulting in higher annual payment amounts and payments for a longer period of time in excess of the maximum twenty year period discussed above.even with PBGC financial assistance. The Company is currently unable to determine the ultimate outcome of the above discussed multi-employer union pension matter and therefore is unable to determine the effects on its consolidated financial statements, but the ultimate outcome could be material to its consolidated results of operations or cash flows in one or more future periods. See also Note 7 inof the Company’s Note to Consolidated Financial Statements on Form 10-K for the year ended December 31, 2019.
2018 vs. 20172022.
Twelve months 2018 consolidated net sales were $515,251 compared to $515,674 in twelve months 2017, a decrease of $423 or 0.1%. Fourth quarter 2018 net sales were $127,264 compared to $125,179 in fourth quarter 2017, an increase of $2,085 or 1.7%. Fourth quarter 2018 sales reflects an increase of 3.4% in U.S. salesAs discussed in the quarter, however, foreign sales declinedRisk Factors section above, the Company’s union contract at its Chicago manufacturing and distribution center is expired in fourth quarter 2018. The timing of certain foreign sales between thirdSeptember 2022, and fourth quarterthe pre-existing contract continues to be extended on a month-to-month basis while negotiations continue. Company management believes that progress in these negotiations is continuing and we are cautiously optimistic that a new contract will be concluded in the comparative 2018 and 2017 periods adversely affected fourth quarter consolidated 2018 sales. Unfavorable translationfirst half of foreign sales, primarily Mexico, also contributed to lower sales in fourth quarter and twelve months 2018 compared to the prior year corresponding period. The Company’s unit selling prices and price realization in 2018 was consistent with 2017. Because of increased pricing pressures and cost increases facing the confectionery industry, companies2023. Nonetheless, as outlined in the confectionery industryRisk Factors above, a work stoppage, slow-down, disruption or strike could develop if the parties are taking pricing actions to recover many ofnot successful in these negotiations which could have a material effect on the same input cost increases that we haveCompany’s sales and continue to experience which are discussed below, including higher freight and delivery expenses. In particular, the Company has taken selective price increases, effective at the beginning of 2019, to recover these same input cost increases.profits.
Product cost of goods sold were $329,880 in 2018 compared to $326,411 in 2017, an increase of $3,469 or 1.1%. Product cost of goods sold includes $(39) and $1,953 in certain deferred compensation expenses (credits) in 2018 and 2017, respectively. These deferred compensation expenses principally result from changes in the market value of investments and investment income from trading securities relating to compensation deferred in previous years and are not reflective of current operating results. Adjusting for the aforementioned, product cost of goods sold increased from $324,458 in 2017 to $329,919 in 2018, an increase of $5,461 or 1.7%. As a percent of net product sales, these adjusted costs increased from 62.9% in 2017 to 64.0% in 2018, a 1.1 unfavorable percentage point change. Although costs for key ingredients were more favorable in 2018 compared to 2017, higher manufacturing costs for wages, salaries and benefits and plant overhead operations contributed to higher product cost of goods sold in 2018 compared to 2017. Increases in employee healthcare and other benefit costs, principally resulting from unfavorable experience under our self-insurance programs, adversely affected gross profit margins in 2018 compared to 2017. Costs relating to quality improvements in product packaging and start-up of new manufacturing packaging lines being phased into service during 2018 also had an unfavorable impact on twelve months 2018 gross profit margins when compared to 2017. The above discussed cost factors also affected fourth quarter 2018 gross profit margins compared to fourth quarter 2017.
Selling, marketing and administrative expenses were $117,691 in 2018 compared to $121,484 in 2017, a decrease of $3,793 or 3.1%. Selling, marketing and administrative expenses include $(1,064) and $8,024 in certain deferred compensation expenses (credits) in 2018 and 2017, respectively. These deferred compensation expenses principally result from changes in the market value of investments and investment income from trading securities relating to compensation deferred in previous years and are not reflective of current operating results. Adjusting for the aforementioned, selling, marketing and administrative expenses increased from $113,460 in 2017 to $118,755 in 2018, an increase of $5,295 or 4.7%. As a percent of net product sales, these adjusted expenses increased from 22.0% of net product sales in 2017 to 23.1% of net product sales in 2018, a 1.1 unfavorable percentage point change.
Selling, marketing and administrative expenses include freight, delivery and warehousing expenses. These expenses increased from $44,082 in 2017 to $49,527 in 2018, an increase of $5,445 or 12.4%. As a percent of net product sales, these adjusted expenses increased from 8.6% in 2017 to 9.6% in 2018, a 1.0 unfavorable percentage point change. These expenses principally reflect higher freight rates driven by the continuing imbalance between supply and demand for over-the-road truck delivery as well as higher fuel costs. Freight and delivery expenses began their significant acceleration in fourth quarter 2017, and therefore, this impact was less significant in the comparative fourth quarters of 2018 and 2017, than for the twelve months 2018 and 2017. Higher legal and professional fees also contributed to this increase in selling, marketing and administrative expenses in both fourth quarter and twelve months 2018.
The Company has foreign operating businesses in Mexico, Canada and Spain, and exports products to many foreign markets. Such foreign sales were $43,690 and comprised 8.5% of the Company’s consolidated net product sales in 2018. In fourth quarter 2018 and 2017, the Company recorded a pre-tax impairment charge of $1,125 and $2,371, respectively, relating to its Spanish operations. The Company had a 97% ownership of a Spanish company at both December 31, 2018 and 2017. During 2018 and 2017, this Spanish subsidiary incurred operating losses of $2,840 and $3,212, respectively,
and the Company provided approximately $4,484 and $2,734, respectively, of additional cash to finance these losses and certain capital expenditures.
Earnings from operations were $70,482 in 2018 compared to $70,422 in 2017, an increase of $60. Earnings from operations include $(1,103) and $9,977 in certain deferred compensation expense (credits) in 2018 and 2017, respectively, which are discussed above. Adjusting for these deferred compensation expenses, adjusted earnings from operations decreased from $80,399 in 2017 to $69,379 in 2018, a decrease of $11,020 or 13.7%. Twelve months and fourth quarter results were adversely affected primarily by higher costs and expenses for freight and delivery and manufacturing operations as discussed above.
Management believes the comparisons presented in the preceding paragraphs, after adjusting for changes in deferred compensation, are more reflective of the underlying operations of the Company.
Other income, net was $2,724 in 2018 compared to $14,139 in 2017, a decrease of $11,415. Other income, net principally reflects $(1,103) and $9,977 of aggregate net gains (losses) and investment income on trading securities in 2018 and 2017, respectively. These trading securities provide an economic hedge of the Company’s deferred compensation liabilities; and the related net gains (losses) and investment income were offset by a like amount of expense in aggregate product cost of goods sold and selling, marketing, and administrative expenses in the respective years as discussed above. Other income, net includes investment income on available for sale securities of $3,535 and $2,851 in 2018 and 2017, respectively. Other income, net also includes foreign exchange gains (losses) of $(659) and $259 in 2018 and 2017, respectively.
Fourth quarter and twelve months 2018 net earnings benefited from a lower U.S. federal income tax rate resulting from U.S. tax reform legislation enacted in December 2017. In connection with this tax reform legislation, the Company recorded a net tax benefit of $20,318, or $0.30 per share, during fourth quarter 2017. This benefit reflected the estimated accounting adjustment from the revaluation of the Company’s net deferred income tax liabilities as of December 31, 2017 to reflect the new lower U.S. corporate income tax rate. As a result of this tax legislative change, including the above discussed revaluation of deferred tax liabilities, the Company’s effective income tax rate was 23.5% in fourth quarter 2018 compared to negative 110.9%, a net tax credit, in fourth quarter 2017; and 22.4% in twelve months 2018 compared to 4.6% in twelve months 2017. A reconciliation of the differences between the U.S. statutory rate and these effective tax rates is provided in Note 4 of the Company’s Notes to Consolidated Financial Statements.
At December 31, 2018 and 2017, the Company’s deferred tax assets include $1,844 and $3,740 of income tax benefits relating to its Canadian subsidiary tax loss carry-forwards which the Company expects to realize before their expiration dates (2029 through 2031). The Company utilized $1,896 and $2,606 of these tax carry-forward benefits in 2018 and 2017, respectively. The Company has concluded that it is more-likely-than-not that it would realize these deferred tax assets relating to its Canadian tax loss carry-forwards because it is expected that sufficient levels of taxable income will be generated during the carry-forward periods. The Company has provided a full valuation allowance on its Spanish subsidiaries’ tax loss carry-forward benefits of $3,651 and $3,038 as of December 31, 2018 and 2017, respectively, because the Company has concluded that it is not more-likely-than-not that these losses will be utilized before their expiration dates. The Spanish subsidiary has a history of net operating losses and it is not known when and if they will generate taxable income in the future.
Based on SEC guidance in Staff Accounting Bulletin No. 118, the Company considered its accounting for the effects of U.S. tax reform to be provisional as of December 31, 2017 and through the first three quarters ended September 30, 2018 because the ultimate impact might have differed from these provisional amounts, due to, among other things, additional regulatory guidance from the Internal Revenue Service and state authorities. The accounting for Tax Cuts and Jobs Act was completed as of December 31, 2018 and there were no material adjustment to the previously recorded provisional amounts.
Net earnings attributable to Tootsie Roll Industries, Inc. were $12,175 in fourth quarter 2018 compared to $31,985 in fourth quarter 2017, and net earnings per share were $0.18 and $0.48 in fourth quarter 2018 and 2017, respectively. The prior year fourth quarter 2017 net earnings include a favorable deferred income tax accounting adjustment of $20,318 or $0.30 per share which is discussed above. Adjusting for the effects of this fourth quarter 2017 tax adjustment,
comparable net earnings per share were $0.18 in both 2018 and 2017. Twelve months 2018 net earnings were $56,893 compared to $80,864 in twelve months 2017, and net earnings per share were $.86 and $1.21 in twelve months 2018 and 2017, respectively. Adjusting for the effects of the 2017 tax adjustment discussed above, comparable net earnings per share were $0.86 and $0.91, a decrease of $0.05 or 5.5%. Earnings per share in 2018 benefited from the reduction in average shares outstanding resulting from purchases of the Company’s common stock in the open market by the Company. Average shares outstanding decreased from 66,962 in 2017 to 66,130 in 2018.
The Company has included the above non-GAAP discussion regarding the impacts of tax reform. The Company believes this discussion provides meaningful supplemental information to both management and investors that is indicative of the Company's core net results and facilitates comparison of net results across reporting periods. The Company uses this non-GAAP measure when evaluating its financial results as well as for internal evaluation and analysis purposes. This non-GAAP measure should not be viewed as a substitute for the Company's GAAP results.
LIQUIDITY AND CAPITAL RESOURCES Cash flows from operating activities were $100,221, $100,929$72,051, $85,298 and $42,973$74,710 in 2019, 20182022, 2021 and 2017,2020, respectively. The $708$13,247 decrease in cash flows from operating activities from 20182021 to 20192022 primarily reflects the timing of payments and refunds of income taxes, combined with increases in prepaid expensesinventories due to higher production, as well as an acceleration of the 2023 production plan, to meet demand and inventories,higher unit costs for materials, offset by a decreaseincreases in net earnings and accounts receivable as of December 31, 2019.due to increased sales. The $57,956$10,588 increase in cash flows from operating activities from 20172020 to 20182021 primarily reflects the timingincreases in net earnings as a result of paymentshigher sales revenue and refunds of income taxes, an increase in prepaid expenseshigher price realization as of December 31, 2017, and the decrease in deferred compensation payments in 2018.discussed above. The Company manages and controls a VEBA trust, to fund the estimated future costs of certain union employee health, welfare and other benefits. A contribution of $20,024$5,000 was made to this trust in 2017;2022; no contribution was made to the trust during 20182020 or 2019.2021. The Company uses these funds to pay the actual cost of such benefits over each union contract period. At December 31, 20192022 and 2018,2021, the VEBA trust held $12,085$3,879 and $15,921,$3,941, respectively, of aggregate cash and cash equivalents.equivalents, which the Company will use to pay certain union employee benefits through part or all of 2023. This asset value is included in prepaid expenses and long-term other assets in the Company’s Consolidated Statement of Financial Position. These assets arePosition and is categorized as Level 1 within the fair value hierarchy. Cash flows from investing activities reflect capital expenditures of $20,258, $27,612,$23,356, $31,426, and $16,673$17,970 in 2019, 20182022, 2021 and 2017,2020, respectively. The changes indecrease amounts from 20182021 to 20192022 principally reflect new manufacturing packaging lines in 2018 andreflects the timing of expenditures relating to other plant manufacturing capital projects. Company management has committed approximately $25,000 to aprojects, primarily for the rehabilitation upgrade and expansion of one of its manufacturing plants in the U.S.A. The Company spent approximately $5,000, $15,000, $6,000 and $2,000 in 2022, 2021, 2020 and 2019, respectively, for this plant rehabilitation upgrade and management’s projectedexpansion and expects additional cash outlays for this project are approximately $15,000to approximate $3,000 in 20202023. The Company is currently exploring plant expansions, including additional, and $8,000replacement of, certain processing and packaging lines at certain locations, to better meet its higher level of demand for certain products on a more timely and cost effective basis. The Company is currently studying this area and does not as yet have the estimated costs for this expansion but believes that this will take place over the next three years. However, the Company is planning on an additional $12,000 of capital expenditures in 2021.2023 for the first phase of this planned expansion. All capital expenditures have been and are expected to be funded from the Company’s cash flow from operations and internal sources including available for sale securities. Other than the bank loans and the related restricted cash of the Company’s Spanish subsidiary which are discussed in Note 1 of the Company’s Notes to Consolidated Financial Statements, the Company had no bank borrowings or repayments in 2017, 2018,2020, 2021, or 2019,2022, and had no outstanding bank borrowings as of December 31, 20182021 or 2019.2022. Nonetheless, the Company would consider bank borrowing or other financing in the event that a business acquisition is completed. Financing activities include Company common stock purchases and retirements of $34,116, $19,317,$31,910, $30,184, and $34,133$32,055 in 2019, 20182022, 2021 and 2017,2020, respectively. Cash dividends of $23,460, $22,978,$24,629, $24,136, and $22,621$23,810 were paid in 2019, 20182022, 2021 and 2017,2020, respectively. SIGNIFICANTCRITICAL ACCOUNTING POLICIES AND ESTIMATES
Preparation of the Company’s financial statements involves judgments and estimates due to uncertainties affecting the application of accounting policies, and the likelihood that different amounts would be reported under different conditions or using different assumptions. The Company bases its estimates on historical experience and other assumptions, as discussed herein, that it believes are reasonable. If actual amounts are ultimately different from previous estimates, the revisions are included in the Company’s results of operations for the period in which the actual amounts become known. The Company’s significant accounting policies are discussed in Note 1 of the Company’s Notes to Consolidated Financial Statements. Following is a summary and discussion of the more significant accounting policies and estimates which management believes to have a significant impact on the Company’s operating results, financial position, cash flows and footnote disclosure. Revenue recognition As more fullyfurther discussed in Note 1 of the Company’s Notes to Consolidated Financial Statements, the Company adoptedfollows the new accounting revenue recognition guidance (ASC 606) effective January 1, 2018. Asin ASC 606. ASC 606 requires adjustments for estimated customer cash discounts upon payment, discounts for price adjustments, product returns, allowances, and certain advertising and promotional costs, including consumer coupons, which are variable consideration and are recorded as a resultreduction of adoption,product sales revenue in the cumulative impactsame period the related product sales are recorded. Such estimates are calculated using historical averages adjusted for any expected changes due to retained earnings at January 1, 2018 was a net after-tax increase of $3,319 ($4,378 pre-tax). The adoption principally changed the timing of recognition of certain trade promotionscurrent business conditions and related adjustments thereto which affect net product sales. The comparative prior information has not been restated and continues to be reported under the accounting standards in effect for such period. The adoption of the new standard in 2018 did not have a material effect on 2018 and 2019 results, and management does not believe that it will have a material effect on results in future years.experience. Revenue for net product sales continues to beis recognized at a point in time when products are delivered to or picked up by the customer, as designated by customers’ purchase orders, as discussed in Note 1.1 of the Company’s Notes to Consolidated Financial Statements. Provisions for bad debts are recorded as selling, marketing and administrative expenses. Write-offs of bad debts did not exceed 0.1% of net product sales in each of 2019, 20182022, 2021 and 2017,2020, and accordingly, have not been significant to the Company’s financial position or results of operations. Intangible assets The Company’s intangible assets consist primarily of goodwill and acquired trademarks. In accordance with accounting guidance, goodwill and other indefinite-lived assets, trademarks, are not amortized, but are instead subjected to annual testing for impairment unless certain triggering events or circumstances are noted. The Company performs its annual impairment review and assessment as of December 31. All trademarks have been assessed by management to have indefinite lives because they are expected to generate cash flows indefinitely. The Company reviews and assesses certain trademarks (non-amortizable intangible assets) for impairment by comparing the fair value of each trademark with its carrying value. Current accounting guidance provides entities an option of performing a qualitative assessment (a "step-zero" test) before performing a quantitative analysis. If the entity determines, on the basis of certain qualitative factors, that it is more-likely-than-not that the intangibles (goodwill and certain trademarks) are not impaired, the entity would not need to proceed to the two step impairment testing process (quantitative analysis) as prescribed in the guidance. During fourth quarter 2019,2022, the Company performed a “step zero” test of its goodwill and certain trademarks, and concluded that there was no impairment based on this guidance. The Company determines the fair value of certain trademarks using discounted cash flows and estimates of royalty rates. If the carrying value exceeds fair value, such trademarks are considered impaired and isare reduced to fair value. The Company utilizes third-party professional valuation firms to assist in the determination of valuation of certain trademarks. Impairments have not generally been material to the Company’s historical operating results.
Cash flow projections require the Company to make assumptions and estimates regarding the Company’s future plans, including sales projections and profit margins, market based discount rates, competitive factors, and economic conditions; and the Company’s actual results and conditions may differ over time. A change in the assumptions relating to the impairment analysis including but not limited to a reduction in projected cash flows, the use of a different discount rate to discount future cash flows or a different royalty rate applied to such trademarks, could cause impairment in the future. Customer incentive programs, advertising and marketing Advertising and marketing costs are recorded in the period to which such costs relate. The Company does not defer the recognition of any amounts on its consolidated balance sheet with respect to such costs. Customer incentives and other trade promotional program costs includingand consumer coupon (price reduction) incentives are recorded in accordance with ASU 606 at the time of the Company’s sale based upon incentive program terms and historical utilization statistics, which are generally consistent from year to year. The liabilities associated with these programs are reviewed quarterly and adjusted if utilization rates differ from management’s original estimates. Such adjustments have not historically been material to the Company’s operating results. Split dollar officer life insurance20
The Company provides split dollar life insurance benefits to an executive officer and records an asset principally equal to the cumulative premiums paid. The Company will fully recover these premiums in future years under the termsTable of the plan. The Company retains a collateral assignment of the cash surrender values and policy death benefits payable to insure recovery of these premiums.Contents
Valuation of long-lived assets Long-lived assets, primarily property, plant and equipment, are reviewed for impairment as events or changes in business circumstances occur indicating that the carrying value of the asset may not be recoverable. The estimated cash flows produced by assets or asset groups, are compared to the asset carrying value to determine whether impairment exists. Such estimates involve considerable management judgment and are based upon assumptions about expected future operating performance. As a result, actual cash flows could differ from management’s estimates due to changes in business conditions, operating performance, and economic and competitive conditions. Such impairments have not historically been material to the Company’s operating results. Income taxes Deferred income taxes are recognized for future tax effects of temporary differences between financial and income tax reporting using tax rates in effect for the years in which the differences are expected to reverse. The Company records valuation allowances in situations where the realization of deferred tax assets, including those relating to net operating tax losses, is not more-likely-than-not; and the Company adjusts and releases such valuation allowances when realization becomes more-likely-than-not as defined by accounting guidance. The Company periodically reviews assumptions and estimates of the Company’s probable tax obligations and effects on its liability for uncertain tax positions, using informed judgment which may include the use of third-party consultants, advisors and legal counsel, as well as historical experience. Valuation of investments Investments primarily comprise high quality corporate and municipal (tax-free) bonds includingwhich are held to maturity, generally approximately three to five years. The Company uses a “ladder” approach to its maturities so that approximately 20% to 35% of the portfolio matures each year with the objective of achieving higher yields with minimum interest rate risk. The Company also invests in variable rate demand notes (generally long term bonds where interest rates are reset weekly, and provide a weekly “put” which allows the holder to also sell each week with no loss in principal), which. All investments are reviewed for impairment at each reporting period by comparing the carrying value or amortized cost to the fair market value. In the event that the Company determines that an investment security’s fair value is below carrying value or amortized cost,permanently impaired, the Company will record an other-than-temporarythe amount of the impairment attributable to credit factors in earnings as credit loss expense or, as applicable, a temporary impairment based on accounting guidance.reversal of that expense, with the amount attributable to non-credit factors in other comprehensive income, net of applicable taxes. The Company’s investment policy, which guides investment decisions, is focused on high quality investments which mitigates the risk of impairment. The Company does not invest in Level 3 securities, as defined, but may utilize third-party professional valuation firms as necessary to assist in the determination of the value of investments that utilize Level 3 inputs (as defined by guidance) should any of its investments be downgraded to Level 3. Other matters In the opinion of management, other than contracts for foreign currency forwards and raw materials, including currency and commodity hedges and outstanding purchase orders for packaging, ingredients, supplies, and operational services, and capital expenditures, all entered into in the ordinary course of business, the Company does not have any significant contractual obligations or future commitments. The Company’s outstanding contractual commitments as of December 31, 2019, all of which are generally normal and recurring in nature, are summarized in the chart which follows below. RECENT ACCOUNTING PRONOUNCEMENTS See Note 1 of the Company’s Notes to Consolidated Financial Statements. MARKET RISKS The Company is exposed to market risks related to commodity prices, interest rates, investments in marketable securities, equity price and foreign exchange. The Company’s ability to forecast the direction and scope of changes to its major input costs is impacted by significant potential volatility in crude oil and energy, sugar, corn, edible oils, cocoa and cocoa powder, and dairy products markets. The prices of these commodities are influenced by changes in global demand, changes in weather and crop yields, including the possible effects of climate change, changes in import tariffs and governments’ farm policies, including mandates for ethanol and bio-fuels, environmental matters, fluctuations in the U.S. dollar relative to dollar-denominated commodities in world markets, and in some cases, geo-political and military conflict risks. The Company believes that its competitors face the same or similar challenges. In order to address the impact of changes in input and other costs, the Company periodically reviews each item in its product portfolio to ascertain if price realization adjustments or other actions should be taken. These reviews include an evaluation of the risk factors relating to market place acceptance of such changes and their potential effect on future sales volumes. In addition, the estimated cost of packaging modifications associated with weight changes, if applicable, is evaluated. The Company also maintains ongoing cost reduction and productivity improvement programs under which cost savings initiatives are encouraged and progress monitored. The Company is not able to accurately predict the outcome of these cost savings initiatives and their effects on its future results. Commodity future and foreign currency forward contracts Commodity price risks relate to ingredients, primarily sugar, cocoa and cocoa powder, chocolate, corn syrup, dextrose, edible oils, milk, whey and gum base ingredients. The Company believes its competitors face similar risks, and the industry has historically adjusted prices, and/or product weights, to compensate for adverse fluctuations in commodity costs. The Company, as well as competitors in the confectionery industry, has historically taken actions, including higher price realization to mitigate rising input costs for ingredients, packaging, labor and fringe benefits, energy, and freight and delivery. Although management seeks to substantially recover cost increases over the long-term, there is risk that higher price realization cannot be fully passed on to customers and, to the extent they are passed on, they could adversely affect customer and consumer acceptance and resulting sales volume. The Company utilizes commodity futures contracts, as well as annual supply agreements, to hedge and plan for anticipated purchases of certain ingredients, including sugar, in order to mitigate commodity cost fluctuation. The Company also may purchase forward foreign exchange contracts to hedge its costs of manufacturing certain products in Canada for sale and distribution in the United States (U.S.A.), and periodically does so for purchases of equipment or raw materials from foreign suppliers. Such commodity futures and currency forward contracts are cash flow hedges and are effective as hedges as defined by accounting guidance. The unrealized gains and losses on such contracts are deferred as a component of accumulated other comprehensive loss (or gain) and are recognized as a component of product cost of goods sold when the related inventory is sold. The potential change in fair value of commodity and foreign currency derivative instruments held by the Company at December 31, 2019,2022, assuming a 10% change in the underlying contract price, was $1,268.$745. The analysis only includes commodity and foreign currency derivative instruments and, therefore, does not consider the offsetting effect of changes in the price of the underlying commodity or foreign currency. This amount is not significant compared with the net earnings and shareholders’ equity of the Company. Interest rates Interest rate risks primarily relate to the Company’s investments in marketable securities with maturitiesmaturity dates of generally up to three years. The majority of the Company’s investments, which are classified as available for sale, have historically been held until their maturity which is generally approximately three to five years, and approximately 20% to 35% of this investment portfolio matures each year. This “ladder” approach to investing limits the Company’s exposure to interest rate fluctuations. The Company also invests in variable rate demand notes which have interest rates whichthat are reset weekly and can be “put back” and sold each week through a remarketing agent, generally a large financial broker, which also substantially eliminates the Company’s exposure to interest rate fluctuations on the principal invested. The accompanying chart summarizes the maturities of the Company’s investments in debt securities at December 31, 2019.2022. | | | | Less than 1 year | | $ | 84,163 | 1 – 2 years | | | 47,940 | 2 – 3 years | | | 45,189 | Total | | $ | 177,292 |
| | | | Less than 1 year | | $ | 96,128 | 1 – 2 years | | | 90,550 | 2 – 3 years | | | 47,182 | 3 – 4 years | | | 38,588 | Total | | $ | 272,448 |
The Company’s outstanding debt at December 31, 20192022 and 20182021 was $7,500 in an industrial revenue bond in which interest rates reset each week based on the current market rate. Therefore, the Company does not believe that it has significant interest rate risk with respect to its interest bearing debt. Investment in marketable securities As stated above, the Company invests primarily in marketable securities includingwhich mature in three to five years and in variable rate demand notes (VRDNs). The VRDNs have weekly “puts” which are collateralized by bank letters of credit or other assets, and interest rates are reset weekly. Except for VRDN’s, the Company’s marketable securities are held to maturity with maturities generally not exceeding approximately three to five years. The Company utilizes professional money managers and maintains investment policy guidelines which emphasize high quality and liquidity in order to minimize the potential loss exposures that could result in the event of higher interest rates, a default or other adverse event. The Company continues to monitor these investments and markets, as well as its investment policies, however, the financial markets could experience unanticipated or unprecedented events as it did in 2008 and 2009, and future outcomes may be less predictable than in the past. Equity price Equity price risk relates to the Company’s investments in mutual funds which are principally used to fund and hedge the Company’s deferred compensation liabilities. These investments in mutual funds are classified as trading securities. Any change in the fair value of these trading securities is completely offset by a corresponding change in the respective hedged deferred compensation liability, and therefore, the Company does not believe that it has significant equity price risk with respect to these investments.
Foreign currency Foreign currency risk principally relates to the Company’s foreign operations in Canada, Mexico and Spain, as well as periodic purchase commitments of machinery and equipment from foreign sources, generally the European Union where the EUROEuro is the currency. Certain of the Company’s Canadian manufacturing costs, including local payroll and plant operations, and a portion of its packaging and ingredients are sourced in Canadian dollars. The Company may purchase Canadian forward contracts to receive Canadian dollars at a specified date in the future and uses its Canadian dollar collections on Canadian sales as a partial hedge of its overall Canadian manufacturing obligations sourced in Canadian dollars. The Company also periodically purchases and holds Canadian dollars to facilitate the risk management of these currency changes. From time to time, the Company may use foreign exchange forward contracts and derivative instruments to mitigate its exposure to foreign exchange risks, as well as those related to firm commitments to purchase equipment from foreign vendors. See Note 1110 of the Company’s Notes to Consolidated Financial Statements for outstanding foreign exchange forward contracts as of December 31, 2019.2022. Open Contractual Commitments as of December 31, 2019:
| | | | | | | | | | | | | | | | | | | | | | Less than | | 1 to 3 | | 3 to 5 | | More than | | Payable in | | Total | | 1 Year | | Years | | Years | | 5 Years | | Commodity hedges | | $ | 7,147 | | $ | 7,147 | | $ | — | | $ | — | | $ | — | | Foreign currency hedges | | | 5,533 | | | 5,533 | | | — | | | — | | | — | | Purchase obligations | | | 6,566 | | | 6,566 | | | — | | | — | | | — | | Interest bearing debt | | | 7,500 | | | — | | | — | | | — | | | 7,500 | | Operating leases | | | 1,592 | | | 884 | | | 708 | | | — | | | — | | Total | | $ | 28,338 | | $ | 20,130 | | $ | 708 | | $ | — | | $ | 7,500 | |
Note: Commodity hedges and foreign currency hedges reflect the amounts at which the Company will settle the related contracts. The above amounts exclude deferred income tax liabilities of $47,295, liabilities for uncertain tax positions of $4,240, postretirement health care benefits of $13,743 and noncurrent deferred compensation of $65,973 because the timing of payments relating to these items cannot be reasonably determined.
ITEM 7A. Quantitative and Qualitative Disclosures About Market Risk. The information required by this item is included under the caption “Market Risk” in Item 7 above. See also Note 1 of the Notes to Consolidated Financial Statements. ITEM 8. Financial Statements and Supplementary Data. Management’s Report on Internal Control Over Financial Reporting The management of Tootsie Roll Industries, Inc. is responsible for establishing and maintaining adequate internal control over financial reporting, as such term is defined in the Securities Exchange Act of 1934 (SEC) Rule 13a-15(f). Company management conducted an evaluation of the effectiveness of the Company’s internal control over financial reporting as of December 31, 20192022 as required by SEC Rule 13a-15(c). In making this assessment, the Company used the criteria established in Internal Control—Integrated Framework (2013) issued by the Committee of Sponsoring Organizations of the Treadway Commission (the COSO criteria). Based on the Company’s evaluation under the COSO criteria, Company management concluded that its internal control over financial reporting was effective as of December 31, 2019.2022. The effectiveness of the Company’s internal control over financial reporting as of December 31, 20192022 has been audited by Grant Thornton LLP (PCAOB ID: 248), an independent registered public accounting firm, as stated in their report which is included herein. REPORT OF INDEPENDENT REGISTERED PUBLIC ACCOUNTING FIRM Board of Directors and Shareholders Tootsie Roll Industries, Inc. Opinions on the financial statements and internal control over financial reporting
balance sheetsfinancial position of Tootsie Roll Industries, Inc. (a Virginia corporation) and subsidiaries (the “Company”) as of December 31, 20192022 and 2018,2021, and the related consolidated statements of comprehensive earnings, earnings and retained earnings, comprehensive income, changes in shareholders’ equity, and cash flows for each of the twothree years thenin the period ended December 31, 2022, and the related notes and financial statement scheduleschedule(s) included under Item 15(a) (collectively referred to as the “financial statements”). We also have audited the Company’s internal control over financial reporting as of December 31, 2019,2022, based on criteria established in the 2013 Internal Control—Integrated Framework issued by the Committee of Sponsoring Organizations of the Treadway Commission (“COSO”).
In our opinion, the financial statements referred to above present fairly, in all material respects, the financial position of the Company as of December 31, 20192022 and 2018,2021, and the results of its operations and its cash flows for each of the twothree years in the periodsperiod ended December 31, 2019 and 20182022 in conformity with accounting principles generally accepted in the United States of America. Also in our opinion, the Company maintained, in all material respects, effective internal control over financial reporting as of December 31, 2019,2022, based on criteria established in the 2013 Internal Control—Integrated Framework issued by COSO. Basis for opinions
We conducted our audits in accordance with the standards of the PCAOB. Those standards require that we plan and perform the audits to obtain reasonable assurance about whether the financial statements are free of material misstatement, whether due to error or fraud, and whether effective internal control over financial reporting was maintained in all material respects. Our audits of the financial statements included performing procedures to assess the risks of material misstatement of the financial statements, whether due to error or fraud, and performing procedures that respond to those risks. Such procedures included examining, on a test basis, evidence regarding the amounts and disclosures in the financial statements. Our audits also included evaluating the accounting principles used and significant estimates made by management, as well as evaluating the overall presentation of the financial statements. Our audit of internal control over financial reporting included obtaining an understanding of internal control over financial reporting, assessing the risk that a material weakness exists, and testing and evaluating the design and operating effectiveness of internal control based on the assessed risk. Our audits also included performing such other procedures as we considered necessary in the circumstances. We believe that our audits provide a reasonable basis for our opinions.
Definition and limitations of internal control over financial reporting
and that receipts and expenditures of the company are being made only in accordance with authorizations of management and directors of the company; and (3) provide reasonable assurance regarding prevention or timely detection of unauthorized acquisition, use, or disposition of the company’s assets that could have a material effect on the financial statements. Because of its inherent limitations, internal control over financial reporting may not prevent or detect misstatements. Also, projections of any evaluation of effectiveness to future periods are subject to the risk that controls may become inadequate because of changes in conditions, or that the degree of compliance with the policies or procedures may deteriorate. Critical audit matter
a critical audit mattermatters does not alter in any way our opinion on the financial statements, taken as a whole, and we are not, by communicating the critical audit matter below, providing a separate opinion on the critical audit matter or on the accounts or disclosures to which it relates.
Trademark Impairment Assessment
1312 to the consolidated financial statements, the Company’s consolidated trademark balance was $175 million at December 31, 2019,2022 which is allocated to the Company’s brands that were purchased. Indefinite-lived trademarks are tested for impairment at least annually. For several trademarks, a
Step 0 approach is used to test for impairment based on relevant qualitative factors, as outlined within ASCAccounting Standards Codifications (ASC) 350-20 and 350-30. For the fair value assessment of certain other trademarks where a Step 0 analysis was not considered appropriate, Step 1 impairment testing is performed annually using discounted cash flows, derived from projected revenue, operating margins and estimated discount rates. The determination of the fair value of the trademarks subjected to a Step 1 impairment test requires management to make significant estimates and assumptions related to forecasts of future revenues, operating margins and discount rates. As disclosed by management, changes in these assumptions could have a significant impact on either the fair value of the trademark, the amount of any trademark impairment charge, or both.
We identified the Step 1 trademark impairment assessment as a critical audit matter, as auditing management’s judgmentsjudgements regarding forecasts of future revenue, operating margin and discount rate involves a high degree of subjectivity. The primaryOur audit procedures we performedrelated to address this critical audit matter included:the Trademark Impairment Assessment included the following, among others:
| ● | Testing the operating effectiveness of controls relating to management’s impairment tests, including controls over the determination of the fair value of these specific trademarks. Through these tests, we evaluated management’s review controls over the financial projections, including reperformance and approval of the reasonableness of the key assumptions and inputs to the analysis, such as discount rates, growth rates, and key performance indicators such as sales forecast and operating margins. |
| ● | Testing management’s process for determining the fair value of the trademarks. We evaluated the reasonableness of management’s forecasts of future revenue and operating margin by comparing these forecasts to historical operating results for the Company’s similar existing platforms, andconsidered whether such assumptions were consistent with historical forecasts and operating results for the Company, as well as evidence obtained in other areas of the audit. Additionally, a sensitivity analysis was performed using a Capital Asset Pricing Model in order to ensureevaluate whether the assumptions used in management’s model fell within reasonable ranges based on third-party industry market data. |
| ● | Utilizing a valuation specialist to assist in evaluating the reasonableness of and testing the methodology used in the Company’s discounted cash flow model for the trademarks and certain significant assumptions, including the discount rate. |
/s/ GRANT THORNTON LLP
We have served as the Company’s auditor since 2018.
Chicago, Illinois February 28, 2020
March 1, 2023
Report of Independent Registered Public Accounting Firm
To the Board of Directors and Shareholders of Tootsie Roll Industries, Inc.:
Opinion on the Financial Statements
We have audited the consolidated statements of earnings and retained earnings, comprehensive earnings and cash flows of Tootsie Roll Industries, Inc. and its subsidiaries(the “Company”) for the year ended December 31, 2017,including the related notes and schedule of valuation and qualifying accounts for the year ended December 31, 2017 listed in the accompanying index appearing under Item 15 (a)(2) (collectively referred to as the “consolidated financial statements”). In our opinion, the consolidatedfinancial statements present fairly, in all material respects, the results of operations andcash flows of the Company for year ended December 31, 2017 in conformity with accounting principles generally accepted in the United States of America.
Basis for Opinion
These consolidated financial statements are the responsibility of the Company's management. Our responsibility is to express an opinion on the Company’s consolidated financial statements based on our audit. We are a public accounting firm registered with the Public Company Accounting Oversight Board (United States) (PCAOB) and are required to be independent with respect to the Company in accordance with the U.S. federal securities laws and the applicable rules and regulations of the Securities and Exchange Commission and the PCAOB.
We conducted our audit of these consolidatedfinancial statements in accordance with the standards of the PCAOB. Those standards require that we plan and perform the audit to obtain reasonable assurance about whether the consolidated financial statements are free of material misstatement, whether due to error or fraud.
Our audit included performing procedures to assess the risks of material misstatement of the consolidated financial statements, whether due to error or fraud, and performing procedures that respond to those risks. Such procedures included examining, on a test basis, evidence regarding the amounts and disclosures in the consolidatedfinancial statements. Our audit also included evaluating the accounting principles used and significant estimates made by management, as well as evaluating the overall presentation of the consolidatedfinancial statements. We believe that our audit provides a reasonable basis for our opinion.
/s/ PricewaterhouseCoopers LLP
Chicago, Illinois
March 1, 2018
We served as the Company's auditor from 1968 to 2018.
CONSOLIDATED STATEMENTS OF Earnings and Retained Earnings | | TOOTSIE ROLL INDUSTRIES, INC. AND SUBSIDIARIES | (in thousands except per share data) |
| | | | | | | | | | | | | | | | | | | | | | | For the year ended December 31, | | | For the year ended December 31, | | | | 2019 | | 2018 | | 2017 | | | 2022 | | 2021 | | 2020 | | Net product sales | | $ | 523,616 | | $ | 515,251 | | $ | 515,674 | | | $ | 681,440 | | $ | 566,043 | | $ | 467,427 | | Rental and royalty revenue | | | 3,497 | | | 3,669 | | | 3,615 | | | | 5,530 | | | 4,733 | | | 3,636 | | Total revenue | | | 527,113 | | | 518,920 | | | 519,289 | | | | 686,970 | | | 570,776 | | | 471,063 | | Product cost of goods sold | | | 329,102 | | | 329,880 | | | 326,411 | | | | 452,552 | | | 370,105 | | | 299,710 | | Rental and royalty cost | | | 995 | | | 867 | | | 972 | | | | 1,687 | | | 1,430 | | | 992 | | Total costs | | | 330,097 | | | 330,747 | | | 327,383 | | | | 454,239 | | | 371,535 | | | 300,702 | | Product gross margin | | | 194,514 | | | 185,371 | | | 189,263 | | | | 228,888 | | | 195,938 | | | 167,717 | | Rental and royalty gross margin | | | 2,502 | | | 2,802 | | | 2,643 | | | | 3,843 | | | 3,303 | | | 2,644 | | Total gross margin | | | 197,016 | | | 188,173 | | | 191,906 | | | | 232,731 | | | 199,241 | | | 170,361 | | Selling, marketing and administrative expenses | | | 127,802 | | | 117,691 | | | 121,484 | | | | 121,976 | | | 132,108 | | | 112,117 | | Earnings from operations | | | 69,214 | | | 70,482 | | | 70,422 | | | | 110,755 | | | 67,133 | | | 58,244 | | Other income, net | | | 16,190 | | | 2,724 | | | 14,139 | | | Other income (expense), net | | | | (12,614) | | | 18,596 | | | 18,018 | | Earnings before income taxes | | | 85,404 | | | 73,206 | | | 84,561 | | | | 98,141 | | | 85,729 | | | 76,262 | | Provision for income taxes | | | 20,565 | | | 16,401 | | | 3,907 | | | | 22,249 | | | 20,421 | | | 17,288 | | Net earnings | | | 64,839 | | | 56,805 | | | 80,654 | | | | 75,892 | | | 65,308 | | | 58,974 | | Less: net earnings (loss) attributable to noncontrolling interests | | | (81) | | | (88) | | | (210) | | | | (45) | | | (18) | | | (21) | | Net earnings attributable to Tootsie Roll Industries, Inc. | | $ | 64,920 | | $ | 56,893 | | $ | 80,864 | | | $ | 75,937 | | $ | 65,326 | | $ | 58,995 | | | | | | | | | | | | | | | | | | | | | | | Net earnings attributable to Tootsie Roll Industries, Inc. per share | | $ | 0.99 | | $ | 0.86 | | $ | 1.21 | | | $ | 1.10 | | $ | 0.94 | | $ | 0.84 | | Average number of shares outstanding | | | 65,474 | | | 66,130 | | | 66,962 | | | | 68,829 | | | 69,438 | | | 70,488 | | | | | | | | | | | | | | | | | | | | | | | Retained earnings at beginning of period | | $ | 33,767 | | $ | 57,225 | | $ | 43,833 | | | $ | 39,545 | | $ | 32,312 | | $ | 40,809 | | Net earnings attributable to Tootsie Roll Industries, Inc. | | | 64,920 | | | 56,893 | | | 80,864 | | | | 75,937 | | | 65,326 | | | 58,995 | | Adopted ASU's (See Note 1) | | | — | | | 2,726 | | | — | | | Cash dividends | | | (23,371) | | | (22,929) | | | (22,548) | | | | (24,571) | | | (24,061) | | | (23,739) | | Stock dividends | | | (34,507) | | | (60,148) | | | (44,924) | | | | (42,635) | | | (34,032) | | | (43,753) | | Retained earnings at end of period | | $ | 40,809 | | $ | 33,767 | | $ | 57,225 | | | $ | 48,276 | | $ | 39,545 | | $ | 32,312 | |
(The accompanying notes are an integral part of these statements.) CONSOLIDATED STATEMENTS OF Comprehensive Earnings | | TOOTSIE ROLL INDUSTRIES, INC. AND SUBSIDIARIES | (in thousands) |
| | | | | | | | | | | | | | | | | | | | | | | For the year ended December 31, | | | For the year ended December 31, | | | | 2019 | | 2018 | | 2017 | | | 2022 | | 2021 | | 2020 | | Net earnings | | $ | 64,839 | | $ | 56,805 | | $ | 80,654 | | | $ | 75,892 | | $ | 65,308 | | $ | 58,974 | | | | | | | | | | | | | | | | | | | | | | | Other comprehensive income (loss), before tax: | | | | | | | | | | | | | | | | | | | | | Foreign currency translation adjustments | | | 791 | | | 103 | | | 1,198 | | | | 1,087 | | | (301) | | | (1,213) | | | | | | | | | | | | | | | | | | | | | | | Pension and postretirement reclassification adjustments: | | | | | | | | | | | | | | | | | | | | | Unrealized gains (losses) for the period on postretirement and pension benefits | | | (1,230) | | | 1,558 | | | (1,009) | | | | 3,338 | | | 448 | | | 467 | | Less: reclassification adjustment for (gains) losses to net earnings | | | (1,522) | | | (1,324) | | | (1,462) | | | | (826) | | | (1,405) | | | (1,349) | | Unrealized gains (losses) on postretirement and pension benefits | | | (2,752) | | | 234 | | | (2,471) | | | | 2,512 | | | (957) | | | (882) | | | | | | | | | | | | | | | | | | | | | | | Investments: | | | | | | | | | | | | | | | | | | | | | Unrealized gains (losses) for the period on investments | | | 3,130 | | | (606) | | | (300) | | | | (9,909) | | | (4,227) | | | 1,463 | | Less: reclassification adjustment for (gains) losses to net earnings | | | 34 | | | — | | | — | | | | (16) | | | (96) | | | — | | Unrealized gains (losses) on investments | | | 3,164 | | | (606) | | | (300) | | | | (9,925) | | | (4,323) | | | 1,463 | | | | | | | | | | | | | | | | | | | | | | | Derivatives: | | | | | | | | | | | | | | | | | | | | | Unrealized gains (losses) for the period on derivatives | | | 451 | | | (2,734) | | | (1,410) | | | | (251) | | | 1,423 | | | 1,259 | | Less: reclassification adjustment for (gains) losses to net earnings | | | 677 | | | 1,630 | | | (107) | | | | (570) | | | (2,593) | | | 325 | | Unrealized gains (losses) on derivatives | | | 1,128 | | | (1,104) | | | (1,517) | | | | (821) | | | (1,170) | | | 1,584 | | | | | | | | | | | | | | | | | | | | | | | Total other comprehensive income (loss), before tax | | | 2,331 | | | (1,373) | | | (3,090) | | | | (7,147) | | | (6,751) | | | 952 | | Income tax benefit (expense) related to items of other comprehensive income | | | (354) | | | 349 | | | 1,545 | | | | 1,991 | | | 1,553 | | | (522) | | Total comprehensive earnings | | | 66,816 | | | 55,781 | | | 79,109 | | | | 70,736 | | | 60,110 | | | 59,404 | | Comprehensive earnings (loss) attributable to noncontrolling interests | | | (81) | | | (88) | | | (210) | | | | (45) | | | (18) | | | (21) | | Total comprehensive earnings attributable to Tootsie Roll Industries, Inc. | | $ | 66,897 | | $ | 55,869 | | $ | 79,319 | | | $ | 70,781 | | $ | 60,128 | | $ | 59,425 | |
(The accompanying notes are an integral part of these statements.) | | CONSOLIDATED STATEMENTS OF | | Financial Position | | TOOTSIE ROLL INDUSTRIES, INC. AND SUBSIDIARIES | (in thousands) |
Assets | | | | | | | | | | | | | | | | | December 31, | | | December 31, | | | | 2019 | | 2018 | | | 2022 | | 2021 | | CURRENT ASSETS: | | | | | | | | | | | | | | | Cash and cash equivalents | | $ | 138,960 | | $ | 110,899 | | | $ | 53,270 | | $ | 105,840 | | Restricted cash | | | 380 | | | 388 | | | | 365 | | | 386 | | Investments | | | 100,444 | | | 75,140 | | | | 96,128 | | | 39,968 | | Accounts receivable trade, less allowances of $1,949 and $1,820 | | | 45,044 | | | 49,777 | | | Accounts receivable trade, less allowances of $2,335 and $2,281 | | | | 58,556 | | | 54,921 | | Other receivables | | | 3,418 | | | 2,941 | | | | 4,299 | | | 3,920 | | Inventories: | | | | | | | | | | | | | | | Finished goods and work-in-process | | | 35,909 | | | 32,159 | | | | 43,595 | | | 31,431 | | Raw materials and supplies | | | 23,179 | | | 22,365 | | | | 40,671 | | | 24,074 | | Prepaid expenses | | | 5,996 | | | 10,377 | | | | 12,144 | | | 7,761 | | Total current assets | | | 353,330 | | | 304,046 | | | | 309,028 | | | 268,301 | | PROPERTY, PLANT AND EQUIPMENT, at cost: | | | | | | | | | | | | | | | Land | | | 21,740 | | | 21,726 | | | | 21,715 | | | 21,704 | | Buildings | | | 122,843 | | | 121,780 | | | | 142,462 | | | 130,158 | | Machinery and equipment | | | 416,625 | | | 401,037 | | | | 467,977 | | | 446,777 | | Construction in progress | | | 4,427 | | | 3,408 | | | | 4,325 | | | 15,344 | | Operating lease right-of-use assets | | | 1,580 | | | — | | | | 4,703 | | | 7,419 | | | | | 567,215 | | | 547,951 | | | | 641,182 | | | 621,402 | | Less — accumulated depreciation | | | 378,760 | | | 361,850 | | | | 429,139 | | | 412,496 | | Net property, plant and equipment | | | 188,455 | | | 186,101 | | | | 212,043 | | | 208,906 | | OTHER ASSETS: | | | | | | | | | | | | | | | Goodwill | | | 73,237 | | | 73,237 | | | | 73,237 | | | 73,237 | | Trademarks | | | 175,024 | | | 175,024 | | | | 175,024 | | | 175,024 | | Investments | | | 153,031 | | | 170,409 | | | | 247,528 | | | 291,175 | | Split dollar officer life insurance | | | 26,042 | | | 26,042 | | | Prepaid expenses and other assets | | | 8,056 | | | 11,980 | | | | 465 | | | 603 | | Deferred income taxes | | | 689 | | | 522 | | | | 1,454 | | | 1,372 | | Total other assets | | | 436,079 | | | 457,214 | | | | 497,708 | | | 541,411 | | Total assets | | $ | 977,864 | | $ | 947,361 | | | $ | 1,018,779 | | $ | 1,018,618 | |
(The accompanying notes are an integral part of these statements.) (in thousands except per share data) Liabilities and Shareholders’ Equity | | | | | | | | | | December 31, | | | | 2019 | | 2018 | | CURRENT LIABILITIES: | | | | | | | | Accounts payable | | $ | 12,720 | | $ | 11,817 | | Bank loans | | | 747 | | | 373 | | Dividends payable | | | 5,861 | | | 5,772 | | Accrued liabilities | | | 41,611 | | | 42,849 | | Postretirement health care benefits | | | 598 | | | 580 | | Operating lease liabilities | | | 1,062 | | | — | | Deferred compensation | | | 16,945 | | | — | | Total current liabilities | | | 79,544 | | | 61,391 | | NONCURRENT LIABILITIES: | | | | | | | | Deferred income taxes | | | 47,295 | | | 43,941 | | Postretirement health care benefits | | | 13,145 | | | 11,871 | | Industrial development bonds | | | 7,500 | | | 7,500 | | Liability for uncertain tax positions | | | 4,240 | | | 3,816 | | Operating lease liabilities | | | 518 | | | — | | Deferred compensation and other liabilities | | | 65,973 | | | 68,345 | | Total noncurrent liabilities | | | 138,671 | | | 135,473 | | TOOTSIE ROLL INDUSTRIES, INC. SHAREHOLDERS’ EQUITY: | | | | | | | | Common stock, $.69-4/9 par value — 120,000 shares authorized — 38,836 and 38,544, respectively, issued | | | 26,969 | | | 26,767 | | Class B common stock, $.69-4/9 par value — 40,000 shares authorized — 26,287 and 25,584, respectively, issued | | | 18,254 | | | 17,767 | | Capital in excess of par value | | | 696,059 | | | 696,535 | | Retained earnings | | | 40,809 | | | 33,767 | | Accumulated other comprehensive loss | | | (20,245) | | | (22,222) | | Treasury stock (at cost) — 90 shares and 88 shares, respectively | | | (1,992) | | | (1,992) | | Total Tootsie Roll Industries, Inc. shareholders’ equity | | | 759,854 | | | 750,622 | | Noncontrolling interests | | | (205) | | | (125) | | Total equity | | | 759,649 | | | 750,497 | | Total liabilities and shareholders' equity | | $ | 977,864 | | $ | 947,361 | |
| | | | | | | | | | December 31, | | | | 2022 | | 2021 | | CURRENT LIABILITIES: | | | | | | | | Accounts payable | | $ | 25,246 | | $ | 14,969 | | Bank loans | | | 1,051 | | | 939 | | Dividends payable | | | 6,154 | | | 6,042 | | Accrued liabilities | | | 54,444 | | | 53,896 | | Postretirement health care benefits | | | 658 | | | 616 | | Operating lease liabilities | | | 791 | | | 1,072 | | Income taxes payable | | | 1,790 | | | 2,434 | | Total current liabilities | | | 90,134 | | | 79,968 | | NONCURRENT LIABILITIES: | | | | | | | | Deferred income taxes | | | 45,005 | | | 45,461 | | Postretirement health care benefits | | | 9,303 | | | 12,619 | | Industrial development bonds | | | 7,500 | | | 7,500 | | Liability for uncertain tax positions | | | 3,747 | | | 3,415 | | Operating lease liabilities | | | 3,952 | | | 6,347 | | Deferred compensation and other liabilities | | | 76,256 | | | 94,511 | | Total noncurrent liabilities | | | 145,763 | | | 169,853 | | TOOTSIE ROLL INDUSTRIES, INC. SHAREHOLDERS’ EQUITY: | | | | | | | | Common stock, $.69-4/9 par value — 120,000 shares authorized — 39,721 and 39,344, respectively, issued | | | 27,584 | | | 27,322 | | Class B common stock, $.69-4/9 par value — 40,000 shares authorized — 28,607 and 27,793, respectively, issued | | | 19,866 | | | 19,300 | | Capital in excess of par value | | | 719,606 | | | 709,880 | | Retained earnings | | | 48,276 | | | 39,545 | | Accumulated other comprehensive loss | | | (30,169) | | | (25,013) | | Treasury stock (at cost) — 99 shares and 96 shares, respectively | | | (1,992) | | | (1,992) | | Total Tootsie Roll Industries, Inc. shareholders’ equity | | | 783,171 | | | 769,042 | | Noncontrolling interests | | | (289) | | | (245) | | Total equity | | | 782,882 | | | 768,797 | | Total liabilities and shareholders' equity | | $ | 1,018,779 | | $ | 1,018,618 | |
(The accompanying notes are an integral part of these statements.) | | | | | | | | | | | CONSOLIDATED STATEMENTS OF | | Cash Flows | | TOOTSIE ROLL INDUSTRIES, INC. AND SUBSIDIARIES | (in thousands) | | | | | | | | | | | |
| | | | | | | | | | | | | For the year ended December 31, | | | | 2019 | | 2018 | | 2017 | | CASH FLOWS FROM OPERATING ACTIVITIES: | | | | | | | | | | | Net earnings | | $ | 64,839 | | $ | 56,805 | | $ | 80,654 | | Adjustments to reconcile net earnings to net cash provided by operating activities: | | | | | | | | | | | Depreciation | | | 18,779 | | | 18,669 | | | 18,991 | | Deferred income taxes | | | 2,832 | | | 2,063 | | | (2,337) | | Impairment of majority-owned foreign subsidiaries | | | 377 | | | 1,126 | | | 2,371 | | Amortization of marketable security premiums | | | 1,282 | | | 1,755 | | | 2,386 | | Changes in operating assets and liabilities: | | | | | | | | | | | Accounts receivable | | | 5,086 | | | (2,445) | | | (4,012) | | Other receivables | | | (313) | | | 2,220 | | | (3,146) | | Inventories | | | (4,383) | | | 303 | | | 1,558 | | Prepaid expenses and other assets | | | 4,362 | | | 9,489 | | | (22,052) | | Accounts payable and accrued liabilities | | | 1,080 | | | 1,648 | | | (557) | | Income taxes payable | | | 4,336 | | | 7,953 | | | (11,899) | | Postretirement health care benefits | | | (1,478) | | | (2,484) | | | (1,192) | | Deferred compensation and other liabilities | | | 3,422 | | | 3,827 | | | (17,792) | | Net cash provided by operating activities | | | 100,221 | | | 100,929 | | | 42,973 | | CASH FLOWS FROM INVESTING ACTIVITIES: | | | | | | | | | | | Capital expenditures | | | (20,258) | | | (27,612) | | | (16,673) | | Purchases of trading securities | | | (3,427) | | | (4,378) | | | (5,089) | | Sales of trading securities | | | 795 | | | 1,255 | | | 22,396 | | Purchase of available for sale securities | | | (67,730) | | | (78,377) | | | (89,364) | | Sale and maturity of available for sale securities | | | 75,611 | | | 64,602 | | | 79,410 | | Net cash used in investing activities | | | (15,009) | | | (44,510) | | | (9,320) | | CASH FLOWS FROM FINANCING ACTIVITIES: | | | | | | | | | | | Shares purchased and retired | | | (34,116) | | | (19,317) | | | (34,133) | | Dividends paid in cash | | | (23,460) | | | (22,978) | | | (22,621) | | Proceeds from bank loans | | | 3,582 | | | 2,491 | | | 2,162 | | Repayment of bank loans | | | (3,193) | | | (2,549) | | | (2,289) | | Net cash used in financing activities | | | (57,187) | | | (42,353) | | | (56,881) | | Effect of exchange rate changes on cash | | | 28 | | | 501 | | | 421 | | Increase (decrease) in cash and cash equivalents | | | 28,053 | | | 14,567 | | | (22,807) | | Cash, cash equivalents and restricted cash at beginning of year | | | 111,287 | | | 96,720 | | | 119,527 | | Cash, cash equivalents and restricted cash at end of year | | $ | 139,340 | | $ | 111,287 | | $ | 96,720 | | | | | | | | | | | | | Supplemental cash flow information: | | | | | | | | | | | Income taxes paid | | $ | 13,858 | | $ | 5,676 | | $ | 18,854 | | Interest paid | | $ | 121 | | $ | 112 | | $ | 68 | | Stock dividend issued | | $ | 70,557 | | $ | 60,538 | | $ | 69,739 | |
| | | | | | | | | | | | | For the year ended December 31, | | | | 2022 | | 2021 | | 2020 | | CASH FLOWS FROM OPERATING ACTIVITIES: | | | | | | | | | | | Net earnings | | $ | 75,892 | | $ | 65,308 | | $ | 58,974 | | Adjustments to reconcile net earnings to net cash provided by operating activities: | | | | | | | | | | | Depreciation | | | 17,668 | | | 17,570 | | | 18,184 | | Deferred income taxes | | | 1,535 | | | (1,263) | | | (279) | | Amortization of marketable security premiums | | | 5,531 | | | 3,837 | | | 1,404 | | Changes in operating assets and liabilities: | | | | | | | | | | | Accounts receivable | | | (3,073) | | | (14,130) | | | 3,483 | | Other receivables | | | (1,020) | | | (706) | | | 636 | | Inventories | | | (28,415) | | | 3,940 | | | (770) | | Prepaid expenses and other assets | | | 49 | | | 2,622 | | | 2,961 | | Accounts payable and accrued liabilities | | | 10,329 | | | 10,010 | | | 3,849 | | Income taxes payable | | | (4,565) | | | (1,296) | | | 3,012 | | Postretirement health care benefits | | | (804) | | | (1,281) | | | (1,041) | | Deferred compensation and other liabilities | | | (1,076) | | | 687 | | | (15,703) | | Net cash provided by operating activities | | | 72,051 | | | 85,298 | | | 74,710 | | CASH FLOWS FROM INVESTING ACTIVITIES: | | | | | | | | | | | Capital expenditures | | | (23,356) | | | (31,426) | | | (17,970) | | Repayment of premiums on split dollar life insurance policies | | | — | | | 2,514 | | | 23,527 | | Purchases of trading securities | | | (1,543) | | | (2,668) | | | (3,183) | | Sales of trading securities | | | 2,806 | | | 968 | | | 18,058 | | Purchase of available for sale securities | | | (96,114) | | | (108,576) | | | (109,816) | | Sale and maturity of available for sale securities | | | 49,618 | | | 47,289 | | | 98,885 | | Net cash (used in) provided by investing activities | | | (68,589) | | | (91,899) | | | 9,501 | | CASH FLOWS FROM FINANCING ACTIVITIES: | | | | | | | | | | | Shares purchased and retired | | | (31,910) | | | (30,184) | | | (32,055) | | Dividends paid in cash | | | (24,629) | | | (24,136) | | | (23,810) | | Proceeds from bank loans | | | 3,989 | | | 3,792 | | | 3,902 | | Repayment of bank loans | | | (3,850) | | | (3,618) | | | (3,883) | | Net cash used in financing activities | | | (56,400) | | | (54,146) | | | (55,846) | | Effect of exchange rate changes on cash | | | 347 | | | (283) | | | (449) | | Increase (decrease) in cash and cash equivalents | | | (52,591) | | | (61,030) | | | 27,916 | | Cash, cash equivalents and restricted cash at beginning of year | | | 106,226 | | | 167,256 | | | 139,340 | | Cash, cash equivalents and restricted cash at end of year | | $ | 53,635 | | $ | 106,226 | | $ | 167,256 | | | | | | | | | | | | | Supplemental cash flow information: | | | | | | | | | | | Income taxes paid | | $ | 23,884 | | $ | 22,855 | | $ | 14,503 | | Interest paid | | $ | 78 | | $ | 6 | | $ | 57 | | Stock dividend issued | | $ | 70,242 | | $ | 64,667 | | $ | 63,402 | |
(The accompanying notes are an integral part of these statements.) Notes to Consolidated Financial Statements ($ in thousands except per share data) TOOTSIE ROLL INDUSTRIES, INC. AND SUBSIDIARIES NOTE 1—SIGNIFICANT ACCOUNTING POLICIES: Basis of consolidation: The consolidated financial statements include the accounts of Tootsie Roll Industries, Inc. and its wholly-owned and majority-owned subsidiaries (the Company), which are primarily engaged in the manufacture and sales of candy products. Non-controlling interests relating to majority-owned subsidiaries are reflected in the consolidated financial statements and all significant intercompany transactions have been eliminated. Certain amounts previously reported have been reclassified to conform to the current year presentation. These reclassifications had no effect on previously reported net earnings. The preparation of financial statements in conformity with generally accepted accounting principles in the United States of America requires management to make estimates and assumptions that affect the reported amounts of assets and liabilities and disclosure of contingent assets and liabilities at the date of the financial statements and the reported amounts of revenues and expenses during the reporting period. Actual results could differ from those estimates. Revenue recognition: The Company’s revenues, primarily net product sales, principally result from the sale of goods, reflect the consideration to which the Company expects to be entitled, generally based on customer purchase orders. The Company records revenue based on a five-step model in accordance with Accounting Standards Codification ("ASC") Topic 606 which became effective January, 1, 2018.606. Adjustments for estimated customer cash discounts upon payment, discounts for price adjustments, product returns, allowances, and certain advertising and promotional costs, including consumer coupons, are variable consideration and are recorded as a reduction of product sales revenue in the same period the related product sales are recorded. Such estimates are calculated using historical averages adjusted for any expected changes due to current business conditions and experience. A net product sale is recorded when the Company delivers the product to the customer, or in certain instances, the customer picks up the goods at the Company’s distribution center,centers, and thereby obtains control of such product. Amounts billed and due from our customers are classified as accounts receivables trade on the balance sheet and require payment on a short-term basis. Accounts receivable are unsecured. Shipping and handling costs of $49,288, $49,527,$67,342, $55,289, and $44,082$42,593 in 2019, 20182022, 2021 and 2017,2020, respectively, are included in selling, marketing and administrative expenses. A minor amount of royalty income (less than 0.2%0.1% of our consolidated net sales) is also recognized from sales-based licensing arrangements, pursuant to which revenue is recognized as the third-party licensee sales occur. Rental income (less than 1% of our consolidated net sales) is not considered revenue from contracts from customers. Leases: The Company identifies leases by evaluating ourits contracts to determine if the contract conveys the right to use an identified asset for a stated period of time in exchange for consideration. The Company considers whether it can control the underlying asset and has the right to obtain substantially all of the economic benefits or outputs from the asset. Leases with terms greater than 12 months are classified as either operating or finance leases at the commencement date. For these leases, we capitalizethe Company capitalized the present value of the minimum lease payments over the lease terms as a right-of-use asset with an offsetting lease liability. The discount rate used to calculate the present value of the minimum lease payments is typically ourthe Company’s incremental borrowing rate, as the rate implicit in the lease is generally not known or determinable. The lease term includes any noncancelable period for which we havethe Company has the right to use the asset. Currently, all capitalized leases are classified as operating leases and the Company records lease expense on a straight-line basis over the term of the lease.
Cash and cash equivalents: The Company considers short-term debt securities with an original maturity of three months or less to be cash equivalents. Substantially all cash and cash equivalents are held at a major U.S. money center bank or its foreign branches (Bank of America), or its investment broker affiliate (Merrill Lynch). The Company also holds certificates of deposit (CDs) of U.S. banks selected by this investment broker based on their financial ratings; substantially all such CDs are invested in separate individual banks which are generally not in excess of the Federal Deposit Insurance Corporation (FDIC) limit of $250 per bank. The cash in the Company's U.S. banks (primarily Bank of America) is not fully insured by the FDIC due to the statutory limit of $250. The Company had approximately $9,415$5,191 and $15,327$4,577 of cash inheld by it is foreign banks,subsidiaries, principally foreign branches of a U.S. bank (Bank of America), at December 31, 20192022 and 2018,2021, respectively. The Company's cash in its foreign bank accounts is also not fully insured. Investments: Investments consist of various marketable securities principally corporate bonds, with maturities of generally upfrom three to threefive years, and variable rate demand notes with interest rates that are generally reset weekly and the security can be “put” back and sold weekly. The Company classifies debt and equity securities as either available for sale or trading. Available for sale debt securities are not actively traded by the Company and are carried at fair value. The Company follows current fair value measurement guidance and unrealized gains and losses on these securities are excluded from earnings and are reported as a separate component of shareholders’ equity, net of applicable taxes, until realized or other-than-temporarily impaired. Trading securities related to deferred compensation arrangements are carried at fair value with gains or losses included in other income, net. The Company invests in trading securities to economically hedge changes in its deferred compensation liabilities. The Company regularly reviews its investments to determine whether a decline in fair value below the cost basis is other-than-temporary. If the decline in fair value is judgedless than carrying value and, when necessary, makes qualitative assessments considering impairment indicators to be other-than-temporary,evaluate whether investments are impaired. If impaired, the cost basis of the security is written down to fair value and the amount of the write-down is included in other income, net.value. Further information regarding the fair value of the Company’s investments is included in Note 109 of the Company’s Notes to Consolidated Financial Statements. Derivative instruments and hedging activities:
Authoritative guidance requires qualitative disclosures about objectives and strategies for using derivatives, quantitative disclosures about fair value amounts of derivative instruments and related gains and losses, and disclosures about credit-risk-related contingent features in derivative agreements.
From time to time, the Company enters into commodity futures and foreign currency forward contracts. Commodity futures are intended and are effective as hedges of market price risks associated with the anticipated purchase of certain raw materials (primarily sugar). Foreign currency forward contracts are intended and are effective as hedges of the Company’s exposure to the variability of cash flows, primarily related to the foreign exchange rate changes of products manufactured in Canada and sold in the United States, and periodic equipment purchases from foreign suppliers denominated in a foreign currency. The Company does not engage in trading or other speculative use of derivative instruments. Further information regarding derivative instruments and hedging activities is included in Note 1110 of the Company’s Notes to Consolidated Financial Statements. Inventories: Inventories are stated at lower of cost or net realizable value. The cost of substantially all of the Company’s inventories ($55,40977,083 and $50,338$51,355 at December 31, 20192022 and 2018,2021, respectively) has been determined by the last-in, first-out (LIFO) method. The excess of current cost over LIFO cost of inventories approximates $19,174$34,898 and $17,062$21,348 at December 31, 20192022 and 2018,2021, respectively. The cost of certain foreign inventories ($3,6797,183 and $4,186$4,150 at December 31, 20192022 and 2018,2021 respectively) has been determined by the first-in, first-out (FIFO) method. Rebates, discounts and other cash consideration received from vendors related to inventory purchases is reflected as a reduction in the cost of the related inventory item, and is, therefore, reflected in cost of sales when the related inventory item is sold. Property, plant and equipment: Depreciation is computed for financial reporting purposes by use of the straight-line method based on useful lives of 20 to 4050 years for buildings and 5 to 20 years for machinery and equipment. Depreciation expense was $18,779, $18,669$17,668, $17,570 and $18,991$18,184 in 2019, 20182022, 2021 and 2017,2020, respectively. Carrying value of long-lived assets: The Company reviews long-lived assets to determine if there are events or circumstances indicating that the amount of the asset reflected in the Company’s balance sheet may not be recoverable. When such indicators are present, the Company compares the carrying value of the long-lived asset, or asset group, to the future undiscounted cash flows of the underlying assets to determine if impairment exists. If applicable, an impairment charge would be recorded to write down the carrying value to its fair value. The determination of fair value involves the use of estimates of future cash flows that involve considerable management judgment and are based upon assumptions about expected future operating performance. The actual cash flows could differ from management’s estimates due to changes in business conditions, operating performance, and economic conditions. In fourth quarter 2019, 2018 and 2017, the Company recorded charges of $377, $1,125 and $2,371, respectively, relating to the impairment of assets of a foreign subsidiary which is included in selling, marketing and administrative expense. Except for the aforementioned, noNo impairment charges of long-lived assets were recorded by the Company during 2019, 20182022, 2021 or 2017.2020. Postretirement health care benefits: The Company provides certain postretirement health care benefits to a group of “grandfathered” corporate office and management employees. The cost of these postretirement benefits is accrued during the employees’ working careers. See Note 7 of the Company’s Notes to Consolidated Financial Statements for additional information. The Company also providesprovided split dollar life benefits to an executive officer. The Company recordsrecorded an asset equal to the cumulative insurance premiums paid that will be recovered upon the death of the covered executive officer or earlier under the terms of the plan. NaNDuring 2021, the Company received $2,514 of previously paid premiums on these insurance policies which was recorded as a reduction to this asset and has now fully recovered all the premiums under the terms of the plan. No premiums were paid in 2019, 20182022, 2021 or 2017.2020. Goodwill and indefinite-lived intangible assets: In accordance with authoritative guidance, goodwill and intangible assets with indefinite lives are not amortized, but rather reviewed and tested for impairment at least annually unless certain interim triggering events or circumstances require more frequent testing. All trademarks have been assessed by management to have indefinite lives because they are expected to generate cash flows indefinitely. Management believes that all assumptions used for the impairment review and testing are consistent with those utilized by market participants performing similar valuations. NaNNo impairments of intangibles, including trademarks and goodwill, were recorded in 2019, 20182022, 2021 or 2017.2020. Current accounting guidance provides entities an option of performing a qualitative assessment (a "step-zero" test) before performing a quantitative analysis. If the entity determines, on the basis of certain qualitative factors, that it is more-likely-than-not that the intangibles (goodwill and certain trademarks) are not impaired, the entity would not need to proceed to the two step impairment testing process (quantitative analysis) as prescribed in the guidance. During fourth quarter 2019,2022 and 2021, the Company performed a “step zero” test of its goodwill and certain trademarks, and concluded that there was no impairment based on this guidance. For the fair value assessment of certain trademarks where the “step-zero” analysis was not considered appropriate, impairment testing was performed in fourth quarter 2019 (and fourth quarter 2018)2022 and 2021 using discounted cash flows and estimated royalty rates. For these trademarks, holding all other assumptions constant at the test date in 2022, a 100 basis point increase in the discount rate or a 100 basis point decrease in the royalty rate would reduce the fair value of these trademarks by approximately 16%13% and 10%, respectively. Individually, a 100 basis point increase in the discount rate may result in potential impairment of up to $2 million. Aor a 100 basis point decrease in the royalty rate would not result in a potential impairment as of December 31, 2019.2022.
Income taxes: Deferred income taxes are recorded and recognized for future tax effects of temporary differences between financial and income tax reporting. The Company records valuation allowances in situations where the realization of deferred tax assets is not more-likely-than-not. The Company periodically reviews assumptions and estimates of the Company’s probable tax obligations and effects on its liability for uncertain tax positions, using informed judgment which may include the use of third-party consultants, advisors and legal counsel, as well as historical experience. Further information regarding U.S. tax reform (U.S. Tax Cuts and Jobs Act) and other income tax matters are included in Note 4 of the Company’s Notes to Consolidated Financial Statements. Foreign currency translation: The U.S. dollar is used as the functional currency where a substantial portion of the subsidiary’s business is indexed to the U.S. dollar or where its manufactured products are principally sold in the U.S. All other foreign subsidiaries use the local currency as their functional currency. Where the U.S. dollar is used as the functional currency, foreign currency remeasurements are recorded as a charge or credit to other income, net in the statement of earnings. Where the foreign local currency is used as the functional currency, translation adjustments are recorded as a separate component of accumulated other comprehensive income (loss). Restricted cash: Restricted cash comprises certain cash deposits of the Company’s majority-owned Spanish subsidiary with international banks that are pledged as collateral for letters of credit and bank borrowings. VEBA trust: The Company maintains a VEBA trust managed and controlled by the Company, to fund the estimated future costs of certain employee health, welfare and other benefits. The Company made a $20,024$5,000 contribution to the VEBA trust in 20172022 but 0no contributions were made to the trust in 20192021 or 2018.2020. The Company will becontinue using the VEBA trust funds to pay the actual cost of such benefits through 2022.most or possibly all of 2023. At December 31, 20192022 and 2018,2021, the VEBA trust held $12,085$3,879 and $15,921,$3,941, respectively, of aggregate cash and cash equivalents. This asset value is included in prepaid expenses and long-term other assets in the Company’s Consolidated Statement of Financial Position. These assets are categorized as Level 1 within the fair value hierarchy. Bank loans: Bank loans consist of short term (less than 120 days) borrowings by the Company’s Spanish subsidiary that are held by international banks. The weighted-average interest rate as of December 31, 20192022 and 20182021 was 3.0%3.1% and 2.0%3.1%, respectively. Comprehensive earnings: Comprehensive earnings include net earnings, foreign currency translation adjustments and unrealized gains/losses on commodity and/or foreign currency hedging contracts, available for sale securities and certain postretirement benefit obligations. Earnings per share: A dual presentation of basic and diluted earnings per share is not required due to the lack of potentially dilutive securities under the Company’s simple capital structure. Therefore, all earnings per share amounts represent basic earnings per share. The Class B common stock has essentially the same rights as common stock, except that each share of Class B common stock has 10ten votes per share (compared to 1one vote per share of common stock), is not traded on any exchange, is restricted as to transfer and is convertible on a share-for-share basis, at any time and at no cost to the holders, into shares of common stock which are traded on the New York Stock Exchange. Use of estimates: The preparation of consolidated financial statements in conformity with accounting principles generally accepted in the U.S. requires management to make estimates and assumptions that affect the amounts reported. Estimates are used when accounting for sales discounts, allowances and incentives, product liabilities, assets recorded at fair value, income taxes, depreciation, amortization, employee benefits, contingencies and intangible asset and liability valuations. Actual results may or may not differ from those estimates. Recently adopted accounting pronouncements: At the beginning of 2019, the Company adopted Accounting Standards Update No. 2016-02 (ASU 2016-02), Leases (Subtopic 842), which requires lessees to recognize all leases with a term greater than 12 months on the balance sheet as right-of-use assets and lease liabilities. Upon adoption, the impact was the recognition of $1,482 in right-of-use assets and lease liabilities for operating leases. Subsequent to adoption, the Company obtained $652 of right-of-use assets in exchange for $652 of lease liabilities held as operating leases. The Company adopted ASU 2016-02 utilizing the current-period adjustment method and did not recast comparative periods upon adoptionAs of the new standard. In addition, we elected certain practical expedients which permitted us to not reassess whether existing contracts are or contain leases, to not reassess the lease classification of any existing leases, to not reassess initial direct costs for any existing leases, and to not separate lease components for all classes of underlying assets. The adoptiondate of this ASU didreport, there are no recent accounting pronouncements that have not have a material impact on the Company’s consolidated financial statements.
In August 2017, the FASB issued ASU 2017-12, guidanceyet been adopted that amends hedge accounting. Under the new guidance, more hedging strategies are eligible for hedge accounting and the application of hedge accounting is simplified. The new guidance amends presentation and disclosure requirements, and how effectiveness is assessed. The guidance is effective for fiscal years beginning after December 15, 2018, and interim periods within those years. On January 1, 2019, the Company adopted ASU 2017-12. The adoption of this ASU did notManagement believes would have a material impact on the Company’s consolidated financial statements.
Recently issued accounting pronouncements - not yet adopted
In June 2016, the FASB issued ASU No. 2016-13, which replaces the current incurred loss impairment method with a new method that reflects expected credit losses. Under this new model an entity would recognize an impairment allowance equal to its current estimate of credit losses on financial assets measured at amortized cost. ASU 2016-13 is effective for public companies in fiscal years beginning after December 15, 2019, including interim periods within those fiscal years. Based on the Company's analysis, ASU 2016-13 did not have a material impact on the Company's results of operations and financial condition upon adoption on January 1, 2020.
NOTE 2—ACCRUED LIABILITIES: Accrued liabilities are comprised of the following: | | | | | | | | | | | | | | | | | December 31, | | | December 31, | | | | 2019 | | 2018 | | | 2022 | | 2021 | | Compensation | | $ | 10,575 | | $ | 10,034 | | | $ | 12,801 | | $ | 10,865 | | Other employee benefits | | | 7,509 | | | 7,947 | | | | 6,893 | | | 8,640 | | Taxes, other than income | | | 3,170 | | | 3,148 | | | | 4,078 | | | 3,574 | | Advertising and promotions | | | 14,421 | | | 15,125 | | | | 21,220 | | | 22,547 | | Other | | | 5,936 | | | 6,595 | | | | 9,452 | | | 8,270 | | | | $ | 41,611 | | $ | 42,849 | | | $ | 54,444 | | $ | 53,896 | |
NOTE 3—INDUSTRIAL DEVELOPMENT BONDS: Industrial development bonds are due in 2027. The average floating interest rate, which is reset weekly, was 1.6%1.3% and 1.5%0.7% in 20192022 and 2018,2021, respectively. See Note 109 of the Company’s Notes to Consolidated Financial Statements for fair value disclosures. NOTE 4—INCOME TAXES: The domestic and foreign components of pretax income are as follows: | | | | | | | | | | | | | | | | | | | | | | | 2019 | | 2018 | | 2017 | | | 2022 | | 2021 | | 2020 | | Domestic | | $ | 74,978 | | $ | 66,253 | | $ | 76,042 | | | $ | 84,286 | | $ | 77,434 | | $ | 69,211 | | Foreign | | | 10,426 | | | 6,953 | | | 8,519 | | | | 13,855 | | | 8,295 | | | 7,051 | | | | $ | 85,404 | | $ | 73,206 | | $ | 84,561 | | | $ | 98,141 | | $ | 85,729 | | $ | 76,262 | |
The provision for income taxes is comprised of the following: | | | | | | | | | | | | | | | | | | | | | | | 2019 | | 2018 | | 2017 | | | 2022 | | 2021 | | 2020 | | Current: | | | | | | | | | | | | | | | | | | | | | Federal | | $ | 15,133 | | $ | 12,414 | | $ | 6,019 | | | $ | 13,070 | | $ | 16,886 | | $ | 14,831 | | Foreign | | | | 4,110 | | | 1,983 | | | 1,029 | | State | | | 2,942 | | | 1,421 | | | 369 | | | | 2,605 | | | 2,822 | | | 1,763 | | | | | 18,075 | | | 13,835 | | | 6,388 | | | | 19,785 | | | 21,691 | | | 17,623 | | Deferred: | | | | | | | | | | | | | | | | | | | | | Federal | | | (543) | | | (577) | | | (7,191) | | | | 2,364 | | | (2,069) | | | (1,006) | | Foreign | | | 2,422 | | | 2,685 | | | 3,425 | | | | 81 | | | 39 | | | 1,316 | | State | | | 611 | | | 458 | | | 1,285 | | | | 19 | | | 760 | | | (645) | | | | | 2,490 | | | 2,566 | | | (2,481) | | | | 2,464 | | | (1,270) | | | (335) | | | | $ | 20,565 | | $ | 16,401 | | $ | 3,907 | | | $ | 22,249 | | $ | 20,421 | | $ | 17,288 | |
Significant components of the Company’s net deferred tax liability at year end were as follows: | | | | | | | | | | | | | | | | | December 31, | | | December 31, | | | | 2019 | | 2018 | | | 2022 | | 2021 | | Deferred tax assets: | | | | | | | | | | | | | | | Accrued customer promotions | | $ | 198 | | $ | 913 | | | $ | 1,269 | | $ | 2,107 | | Deferred compensation | | | 19,432 | | | 15,872 | | | | 17,533 | | | 22,311 | | Postretirement benefits | | | 3,439 | | | 3,119 | | | | 2,466 | | | 3,324 | | Other accrued expenses | | | 3,979 | | | 4,520 | | | | 7,744 | | | 5,158 | | Foreign subsidiary tax loss carry forward | | | 4,584 | | | 5,731 | | | | 4,650 | | | 4,497 | | Outside basis difference in foreign subsidiary | | | 365 | | | 273 | | | | 359 | | | 365 | | Unrealized capital losses | | | — | | | 472 | | | Capitalized research and development costs | | | | 2,049 | | | — | | Deductible state tax depreciation | | | 512 | | | 390 | | | | 893 | | | 736 | | Tax credit carry forward | | | 3,059 | | | 2,989 | | | | 2,047 | | | 2,517 | | | | | 35,568 | | | 34,279 | | | | 39,010 | | | 41,015 | | Valuation allowance | | | (4,985) | | | (3,892) | | | Valuation allowances | | | | (5,703) | | | (5,555) | | Total deferred tax assets | | $ | 30,583 | | $ | 30,387 | | | $ | 33,307 | | $ | 35,460 | | Deferred tax liabilities: | | | | | | | | | | | | | | | Depreciation | | $ | 23,375 | | $ | 21,637 | | | $ | 27,153 | | $ | 23,342 | | Deductible goodwill and trademarks | | | 36,591 | | | 35,037 | | | | 37,608 | | | 38,255 | | Accrued export company commissions | | | 4,367 | | | 4,211 | | | | 4,580 | | | 4,615 | | Employee benefit plans | | | 2,700 | | | 3,539 | | | | 395 | | | 525 | | Inventory reserves | | | 2,526 | | | 2,784 | | | | 934 | | | 2,532 | | Prepaid insurance | | | 710 | | | 735 | | | | 1,016 | | | 965 | | Unrealized capital gains | | | 1,362 | | | — | | | | (160) | | | 3,874 | | Deferred foreign exchange gain | | | 260 | | | 577 | | | | 119 | | | 132 | | Deferred gain on sale of real estate | | | 5,298 | | | 5,286 | | | | 5,213 | | | 5,309 | | Total deferred tax liabilities | | $ | 77,189 | | $ | 73,806 | | | $ | 76,858 | | $ | 79,549 | | Net deferred tax liability | | $ | 46,606 | | $ | 43,419 | | | $ | 43,551 | | $ | 44,089 | |
At December 31, 2019,2022, the Company has benefits related to state tax credit carry-forwards expiring by year as follows: $23 in 2019, $672 in 2020, $784 in 2021, $50 in 2028, $131$130 in 2029, $213$212 in 2030, $225 in 2031, $238 in 2032, $211 in 2033, $235 in 2034, $274 in 2035, $235 in 2036 and $205$237 in 2034.2037. The Company expects that not all the credits will be utilized before their expiration and has provided a valuation allowance for the expired amounts.estimated amounts that will expire. Such valuation allowances were $1,053 and $924 at December 31, 2022 and 2021, respectively. At December 31, 2019, the tax benefits of the Company’s Canadian subsidiary tax loss carry-forwards expiring by year are as follows: $617 in 2031.
At December 31, 2018,2022, the amounts of the Company’s Spanish subsidiary loss carry-forwards expiring by year are as follows: $282$270 in 2026, $60$57 in 2027, $179$171 in 2028, $102$98 in 2029, $310$296 in 2030, $412$394 in 2031, $311$297 in 2032, $125$120 in 2033, $434$415 in 2034, $548$524 in 2035, $797$761 in 2036, $388 in 2037, $186 in 2038, $151 in 2039 and $407$369 in 2037.2040. A full valuation allowance has been provided for all of these Spanish loss carry-forwards as the Company expects that the losses will not be utilized before their expiration.
The effective income tax rate differs from the statutory rate as follows: | | | | | | | | | | 2022 | | 2021 | | 2020 | | U.S. statutory rate | | 21.0 | % | 21.0 | % | 21.0 | % | State income taxes, net | | 2.3 | | 2.4 | | 2.1 | | Foreign income tax rates | | 1.0 | | 0.2 | | 1.0 | | Income tax credits and adjustments | | (0.8) | | (0.6) | | (1.4) | | Adjustment of deferred tax balances | | (0.7) | | 0.6 | | (0.2) | | Reserve for uncertain tax benefits | | 0.3 | | — | | (0.8) | | Other, net | | (0.4) | | 0.2 | | 1.0 | | Effective income tax rate | | 22.7 | % | 23.8 | % | 22.7 | % |
The effective income tax rate differs from the statutory rate as follows:
| | | | | | | | | | 2019 | | 2018 | | 2017 | | U.S. statutory rate | | 21.0 | % | 21.0 | % | 35.0 | % | State income taxes, net | | 0.5 | | 0.5 | | 1.6 | | Exempt municipal bond interest | | (0.1) | | (0.1) | | (0.1) | | Foreign tax rates | | 1.4 | | 2.1 | | 0.5 | | Qualified domestic production activities deduction | | — | | — | | (0.8) | | Tax credits receivable | | 0.5 | | — | | (1.4) | | Adjustment of deferred tax balances | | 0.2 | | 0.1 | | (24.2) | | Reserve for uncertain tax benefits | | 0.4 | | (1.0) | | (0.3) | | Worthless stock deduction | | — | | — | | (3.8) | | Other, net | | 0.2 | | (0.2) | | (1.9) | | Effective income tax rate | | 24.1 | % | 22.4 | % | 4.6 | % |
The Company’s 2017 effective tax rate reflectsAs a deferred tax benefitresult of $20,318 resulting from the revaluation of its net deferred tax liability related to the reduction of the U.S. corporate income tax rate to 21% for tax years beginning after December 31, 2017 under the 2017 Tax Cuts and Jobs Act, as required by accounting guidance.
The 2017 Tax Cuts and Jobs Act changed the United States approach to the taxation of foreign earnings to a territorial system by providing a one hundred percent dividends received deduction for certain qualified dividends received from foreign subsidiaries. This provision of the Act significantly impacts the accounting for the undistributed earnings of foreign subsidiaries and as a result the Company intends to distribute the earnings of its foreign subsidiaries. The costs associated with a future distribution aredoes not material to the Company’s financial statements. After carefully considering these facts, the Company has determined that effective December 31, 2017, it will not be assertingassert permanent reinvestment of its foreign subsidiaries earnings.
At December 31, 20192022 and 2018,2021, the Company had unrecognized tax benefits of $3,678$3,392 and $3,339,$3,133, respectively. Included in this balance is $2,012$1,734 and $1,765,$1,547, respectively, of unrecognized tax benefits that, if recognized, would favorably affect the annual effective income tax rate. As of December 31, 20192022 and 2018, $5622021, $355 and $477,$282, respectively, of interest and penalties were included in the liability for uncertain tax positions. A reconciliation of the beginning and ending balances of the total amounts of unrecognized tax benefits is as follows: | | | | | | | | | | | | | | | | | | | | | | | 2019 | | 2018 | | 2017 | | | 2022 | | 2021 | | 2020 | | Unrecognized tax benefits at January 1 | | $ | 3,339 | | $ | 4,342 | | $ | 4,746 | | | $ | 3,133 | | $ | 3,011 | | $ | 3,678 | | Increases in tax positions for the current year | | | 1,164 | | | 448 | | | 394 | | | | 393 | | | 700 | | | 377 | | Reductions in tax positions for lapse of statute of limitations | | | (576) | | | (751) | | | (793) | | | | (134) | | | (578) | | | (501) | | Reductions in tax positions for settlements and payments | | | (249) | | | — | | | — | | | | — | | | — | | | (308) | | Increases (decreases) in prior period unrecognized tax benefits due to change in judgment | | | — | | | (700) | | | (5) | | | | — | | | — | | | (235) | | Unrecognized tax benefits at December 31 | | $ | 3,678 | | $ | 3,339 | | $ | 4,342 | | | $ | 3,392 | | $ | 3,133 | | $ | 3,011 | |
The Company recognizes interest and penalties related to unrecognized tax benefits in the provision for income taxes on the Consolidated Statements of Earnings and Retained Earnings. The Company is subject to taxation in the U.S. and various state and foreign jurisdictions.jurisdictions, primarily Canada and Mexico. The Company generally remains subject to examination by U.S. federal, and state and foreign tax authorities for the years 20162019 through 2018.2021. With few exceptions, the Company is no longer subject to examinations by tax authorities for the years 20152018 and prior. NOTE 5—SHARE CAPITAL AND CAPITAL IN EXCESS OF PAR VALUE: | | | | | | | | | | | | | | | | | | | | | | | | | | | | | | | | | | | | | | | | | | | | | | | | | | | | | | | | Capital in | | | | | | | | | | | | | | | | | | Capital in | | | | | | | | | Class B | | | | | | | Excess | | | | | | | | Class B | | | | | | | Excess | | | | Common Stock | | Common Stock | | Treasury Stock | | of Par | | | Common Stock | | Common Stock | | Treasury Stock | | of Par | | | | Shares | | Amount | | Shares | | Amount | | Shares | | Amount | | Value | | | Shares | | Amount | | Shares | | Amount | | Shares | | Amount | | Value | | | | (000’s) | | | | | (000’s) | | | | | (000’s) | | | | | | | | | (000’s) | | | | | (000’s) | | | | | (000’s) | | | | | | | | Balance at January 1, 2017 | | 37,701 | | $ | 26,181 | | 24,221 | | $ | 16,820 | | 83 | | $ | (1,992) | | $ | 646,768 | | | Balance at December 31, 2019 | | | 38,836 | | | 26,969 | | 26,287 | | | 18,254 | | 90 | | | (1,992) | | | 696,059 | | Issuance of 3% stock dividend | | 1,124 | | | 781 | | 726 | | | 504 | | 2 | | | — | | | 43,477 | | | 1,157 | | | 804 | | 787 | | | 547 | | 3 | | | — | | | 42,244 | | Conversion of Class B common shares to common shares | | 56 | | | 39 | | (56) | | | (39) | | — | | | — | | | — | | | 62 | | | 43 | | (62) | | | (43) | | — | | | — | | | — | | Purchase and retirement of common shares | | (921) | | | (640) | | — | | | — | | — | | | — | | | (33,493) | | | (982) | | | (682) | | — | | | — | | — | | | — | | | (31,373) | | Balance at December 31, 2017 | | 37,960 | | | 26,361 | | 24,891 | | | 17,285 | | 85 | | | (1,992) | | | 656,752 | | | Balance at December 31, 2020 | | | 39,073 | | | 27,134 | | 27,012 | | | 18,758 | | 93 | | | (1,992) | | | 706,930 | | Issuance of 3% stock dividend | | 1,125 | | | 781 | | 746 | | | 519 | | 3 | | | — | | | 58,688 | | | 1,163 | | | 807 | | 810 | | | 562 | | 3 | | | — | | | 32,495 | | Conversion of Class B common shares to common shares | | 53 | | | 37 | | (53) | | | (37) | | — | | | — | | | — | | | 29 | | | 20 | | (29) | | | (20) | | — | | | — | | | — | | Purchase and retirement of common shares | | (594) | | | (412) | | — | | | — | | — | | | — | | | (18,905) | | | (921) | | | (639) | | — | | | — | | — | | | — | | | (29,545) | | Balance at December 31, 2018 | | 38,544 | | | 26,767 | | 25,584 | | | 17,767 | | 88 | | | (1,992) | | | 696,535 | | | Balance at December 31, 2021 | | | 39,344 | | | 27,322 | | 27,793 | | | 19,300 | | 96 | | | (1,992) | | | 709,880 | | Issuance of 3% stock dividend | | 1,150 | | | 798 | | 768 | | | 532 | | 2 | | | — | | | 32,999 | | | 1,176 | | | 817 | | 833 | | | 579 | | 3 | | | — | | | 41,068 | | Conversion of Class B common shares to common shares | | 65 | | | 45 | | (65) | | | (45) | | — | | | — | | | — | | | 19 | | | 13 | | (19) | | | (13) | | — | | | — | | | — | | Purchase and retirement of common shares | | (923) | | | (641) | | — | | | — | | — | | | — | | | (33,475) | | | (818) | | | (568) | | — | | | — | | — | | | — | | | (31,342) | | Balance at December 31, 2019 | | 38,836 | | $ | 26,969 | | 26,287 | | $ | 18,254 | | 90 | | $ | (1,992) | | $ | 696,059 | | | Balance at December 31, 2022 | | | 39,721 | | $ | 27,584 | | 28,607 | | $ | 19,866 | | 99 | | $ | (1,992) | | $ | 719,606 | |
Average shares outstanding and all per share amounts included in the financial statements and notes thereto have been adjusted retroactively to reflect annual three percent stock dividends. While the Company does not have a formal or publicly announced Company common stock purchase program, the Company’s board of directors periodically authorizes a dollar amount for such share purchases. Based upon this policy, shares were purchased and retired as follows: | | | | | | | | | | | | | | | Total Number of Shares | | | | | | Total Number of Shares | | | | | Year | | Purchased (000’s) | | Average Price Paid Per Share | | | Purchased (000’s) | | Average Price Paid Per Share | | 2019 | | 923 | | $ | 36.93 | | | 2018 | | 594 | | $ | 32.48 | | | 2017 | | 921 | | $ | 37.01 | | | 2022 | | | 818 | | $ | 38.98 | | 2021 | | | 921 | | $ | 32.76 | | 2020 | | | 982 | | $ | 32.59 | |
NOTE 6—OTHER INCOME, NET: Other income, net is comprised of the following: | | | | | | | | | | | | | | | | | | | | | | | 2019 | | 2018 | | 2017 | | | 2022 | | 2021 | | 2020 | | Interest and dividend income | | $ | 4,423 | | $ | 3,535 | | $ | 2,851 | | | $ | 2,641 | | $ | 2,740 | | $ | 4,005 | | Gains (losses) on trading securities relating to deferred compensation plans | | | 11,292 | | | (1,103) | | | 9,977 | | | | (17,263) | | | 14,207 | | | 12,519 | | Interest expense | | | (220) | | | (181) | | | (144) | | | | (104) | | | (46) | | | (164) | | Foreign exchange gains (losses) | | | (533) | | | (659) | | | 259 | | | Foreign exchange gains | | | | 1,307 | | | 667 | | | 534 | | Capital gains (losses) | | | 22 | | | (11) | | | 25 | | | | 121 | | | (286) | | | (6) | | Miscellaneous, net | | | 1,206 | | | 1,143 | | | 1,171 | | | | 684 | | | 1,314 | | | 1,130 | | | | $ | 16,190 | | $ | 2,724 | | $ | 14,139 | | | $ | (12,614) | | $ | 18,596 | | $ | 18,018 | |
NOTE 7—EMPLOYEE BENEFIT PLANS: Pension plans: The Company sponsors a defined contribution pension plansplan covering certain non-union employees with over one year of credited service. The Company’s policy is to fund pension costs accrued based on compensation levels. Total pension expense for 2019, 2018this plan for 2022, 2021 and 20172020 approximated $3,114, $2,988$2,682, $3,010 and $3,087,$2,772, respectively. The Company also maintains certain defined contribution 401K profit sharing and retirement savings-investment plans. Company contributions in 2019, 20182022, 2021 and 20172020 to these plans were $2,858, $2,734$3,265, $3,201 and $2,512$2,766 respectively. The Company also contributes to a multi-employer defined benefit pension plan for certain of its union employees under a collective bargaining agreement which is as follows: Plan name: Bakery and Confectionery Union and Industry International Pension Fund (Plan) Employer Identification Number and plan number: 52-6118572, plan number 001 Funded Status as of the most recent year available: 51.60%48.50% funded as of January 1, 20182021 The Company’s contributions to such plan: $2,943, $2,836$3,508, $3,118 and $2,603$2,850 in 2019, 20182022, 2021 and 2017,2020, respectively Plan status: Critical and declining as of December 31, 2018for the plan year beginning January 1, 2022 (most recent date information is available) Beginning in 2012, the Company has received periodic notices from the Bakery, Confectionery, Tobacco Workers and Grain Millers International Union Pension Plan, (Plan), a multi-employer defined benefit pension plan for certain Company union employees, that the Plan’s actuary certified the Plan to be in “critical status”, the “Red Zone”, as defined by the Pension Protection Act (PPA) and the Pension Benefit Guaranty Corporation (PBGC); and that a plan of rehabilitation was adopted by the trustees of the Plan in 2012. DuringBeginning in 2015, the Company received new notices that the Plan was reclassified to “critical and declining status”, as defined by the PPA and PBGC, for the plan year beginning January 1, 2015. A designation of “critical and declining status” implies that the Plan is expected to become insolvent in the next 20 years. In 2016, the Company received new notices that the Plan’s trustees adopted an updated Rehabilitation Plan effective January 1, 2016, and all annual notices through 20192021 have continued to classify the Plan in the “critical and declining status” category. The Company has been advised that its withdrawal liability would have been $99,800, $81,600$104,300, $99,300 and $82,200$99,800 if it had withdrawn from the Plan during 2021, 2020 and 2019 2018respectively. The Plan will not have updated actuarial and 2017, respectively.withdrawal liability information until second quarter 2023. Should the Company actually withdraw from the Plan at a future date, a withdrawal liability, which could be higher than the above discussed amounts, could be payable to the Plan. The amended rehabilitation plan, which continues, requires that employer contributions include 5% compounded annual surcharge increases each year for an unspecified period of time beginning January 2013 (in addition to the 5% interim surcharge initiated in 2012) as well as certain plan benefit reductions. In fourth quarter 2020, the Plan Trustees advised the Company that the surcharges would no longer increase and therefore be “frozen” at the rates and amounts in effect as of December 31, 2020 provided that the local bargaining union and the Company executed a formal consenting agreement by March 31, 2021. During first quarter 2021, the local bargaining union and the Company executed this agreement which resulted in the “freezing” of such surcharges as of December 31, 2020. The Company’s pension expense for this Plan for 2019, 20182022, 2021 and 20172020 was $2,961, $2,836$3,510, $3,156 and $2,617,$2,866, respectively. The aforementioned expense includes surcharges of $948, $811$1,237, $1,112 and $656$1,010 in 2019, 20182022, 2021 and 2017,2020, respectively, as required under the plan of rehabilitation, as amended. The Company is currently unable to determine the ultimate outcome of the above discussed matter and therefore is unable to determine the effects on its consolidated financial statements, but the ultimate outcome or the effects of any modifications to the current rehabilitation plan could be material to its consolidated results of operations or cash flows in one or more future periods. Deferred compensation: The Company sponsors 3three deferred compensation plans for selected executives and other employees: (i) the Excess Benefit Plan, which restores retirement benefits lost due to IRS limitations on contributions to tax-qualified plans, (ii) the Supplemental Plan, which allows eligible employees to defer the receipt of eligible compensation until designated future dates and (iii) the Career Achievement Plan, which provides a deferred annual incentive award to selected executives. Participants in these plans earn a return on amounts due them based on several investment options, which mirror returns on underlying investments (primarily mutual funds). The Company economically hedges its obligations under the plans by investing in the actual underlying investments. These investments are classified as trading securities and are carried at fair value. At December 31, 20192022 and 2018,2021, these investments totaled $76,183$71,208 and $62,260,$89,736, respectively. All gains and losses and related investment income from these investments, which are recorded in other income, net, are equally offset by corresponding increases and decreases in the Company’s deferred compensation liabilities. Postretirement health care benefit plans: The Company maintains a post-retirement health benefits plan for a group of “grandfathered” corporate employees. The plan, as amended in 2013, generally limited future annual cost increases in health benefits to 3%, restricted this benefit to current employees and retirees with long-term service with the Company, and eliminated all post-retirement benefits for future employees effective April 1, 2014. Post-retirement benefits liabilities (as amended) were $13,743$9,961 and $12,451$13,235 at December 31, 20192022 and 2018,2021, respectively. Amounts recognized in accumulated other comprehensive loss (pre-tax) at December 31, 20192022 are as follows: | | | | Prior service credit | | $ | (3,066)—
| Net actuarial gain | | | (808)(4,452)
| Net amount recognized in accumulated other comprehensive loss | | $ | (3,874)(4,452)
|
The estimated actuarial gain and prior service credit to be amortized from accumulated other comprehensive loss into net periodic benefit income during 2020 are $123 and $1,227, respectively.41
The changes in the accumulated postretirement benefit obligation at December 31, 20192022 and 20182021 consist of the following: | | | | | | | | | | | | | | | | | December 31, | | | December 31, | | | | 2019 | | 2018 | | | 2022 | | 2021 | | Benefit obligation, beginning of year | | $ | 12,451 | | $ | 13,497 | | | $ | 13,235 | | $ | 13,487 | | Service cost | | | 270 | | | 337 | | | | 241 | | | 270 | | Interest cost | | | 499 | | | 455 | | | | 336 | | | 291 | | Actuarial (gain)/loss | | | 922 | | | (1,409) | | | | (3,323) | | | (326) | | Benefits paid | | | (399) | | | (429) | | | | (528) | | | (487) | | Benefit obligation, end of year | | $ | 13,743 | | $ | 12,451 | | | $ | 9,961 | | $ | 13,235 | |
The actuarial (gain) in 2022 is attributable to an increase in the discount rate, resulting in a (gain). The actuarial (gain) in 2021 is attributable to an increase in the discount rate, resulting in a (gain), partially offset by updated mortality projections for the year ended December 31, 2021, resulting in a loss.
Net periodic postretirement benefit cost (income) included the following components: | | | | | | | | | | | | | 2019 | | 2018 | | 2017 | | Service cost—benefits attributed to service during the period | | $ | 270 | | $ | 337 | | $ | 323 | | Interest cost on the accumulated postretirement benefit obligation | | | 499 | | | 455 | | | 468 | | Net amortization | | | (1,522) | | | (1,324) | | | (1,462) | | Net periodic postretirement benefit cost (income) | | $ | (753) | | $ | (532) | | $ | (671) | |
| | | | | | | | | | | | | 2022 | | 2021 | | 2020 | | Service cost—benefits attributed to service during the period | | $ | 241 | | $ | 270 | | $ | 288 | | Interest cost on the accumulated postretirement benefit obligation | | | 336 | | | 291 | | | 403 | | Net amortization | | | (826) | | | (1,405) | | | (1,349) | | Net periodic postretirement benefit cost (income) | | $ | (249) | | $ | (844) | | $ | (658) | |
The Company estimates future benefit payments will be $598, $614, $637,$658, $663, $677, $688 and $692$696 in 2020each year beginning in 2023 through 2024,2027, respectively, and a total of $3,687$3,543 in 20252028 through 2029.2032. NOTE 8—COMMITMENTS:
Lease expense aggregated $1,032, $793 and $785 in 2019, 2018 and 2017, respectively. Future operating lease commitments are as follows: $979, $540, and $61 in 2020, 2021 and 2022, respectively.
NOTE 9—8—SEGMENT AND GEOGRAPHIC INFORMATION: The Company operates as a single reportable segment encompassing the manufacture and sale of confectionery products. Its principal manufacturing operations are located in the United States and Canada, and its principal market is the United States. The Company also manufactures confectionery products in Mexico, primarily for sale in Mexico, and exports products to Canada and other countries worldwide. The following geographic data includes net product sales summarized on the basis of the customer location and long-lived assets based on their physical location: | | | | | | | | | | | | | | | | | | | | | | | 2019 | | 2018 | | 2017 | | | 2022 | | 2021 | | 2020 | | Net product sales: | | | | | | | | | | | | | | | | | | | | | United States | | $ | 478,790 | | $ | 471,561 | | $ | 472,222 | | | $ | 622,817 | | $ | 514,437 | | $ | 431,024 | | Canada, Mexico and Other | | | 44,826 | | | 43,690 | | | 43,452 | | | | 58,623 | | | 51,606 | | | 36,403 | | | | $ | 523,616 | | $ | 515,251 | | $ | 515,674 | | | $ | 681,440 | | $ | 566,043 | | $ | 467,427 | | Long-lived assets: | | | | | | | | | | | | | | | | | | | | | United States | | $ | 155,428 | | $ | 151,770 | | $ | 145,210 | | | $ | 182,393 | | $ | 178,936 | | $ | 155,664 | | Canada | | | 30,412 | | | 31,843 | | | 30,823 | | | | 25,715 | | | 27,051 | | | 28,765 | | Mexico and Other | | | 2,615 | | | 2,488 | | | 2,939 | | | | 3,935 | | | 2,919 | | | 2,899 | | | | $ | 188,455 | | $ | 186,101 | | $ | 178,972 | | | $ | 212,043 | | $ | 208,906 | | $ | 187,328 | |
Sales revenues from Wal-Mart Stores, Inc. aggregated approximately 24.2%23.0%, 24.1%22.7%, and 24.0%23.5% of net product sales during the yearsyear ended December 31, 2019, 20182022, 2021 and 2017,2020, respectively. Sales revenues from Dollar Tree, Inc. (which includes Family Dollar which was acquired by Dollar Tree) aggregated approximately 11.3%12.4%, 11.2%12.1%, and 10.9%11.7% of net product sales during the yearsyear ended December 31, 2019, 20182022, 2021 and 2017,2020, respectively. Some of the aforementioned sales to Wal-Mart and Dollar Tree are sold to McLane Company, a large national grocery wholesaler, which services and delivers certain of the Company’s products to Wal-Mart, Dollar Tree and other retailers in the U.S.A. Net product sales revenues from McLane, which includes these Wal-Mart and Dollar Tree sales as well as sales and deliveries to other Company customers, were 17.7%20.4% in 20192022 and 17.4%21.0% in 20182021 and 16.9%22.1% in 2017.2020. At December 31, 20192022 and 2018,2021, the Company’s 3three largest customers discussed above accounted for approximately 30%37% and 31%36% of total accounts receivable, respectively. NOTE 10—9—FAIR VALUE MEASUREMENTS: Current accounting guidance defines fair value as the price that would be received in the sale of an asset or paid to transfer a liability in an orderly transaction between market participants at the measurement date. Guidance requires disclosure of the extent to which fair value is used to measure financial assets and liabilities, the inputs utilized in calculating valuation measurements, and the effect of the measurement of significant unobservable inputs on earnings, or changes in net assets, as of the measurement date. Guidance establishes a three-level valuation hierarchy based upon the transparency of inputs utilized in the measurement and valuation of financial assets or liabilities as of the measurement date. Level 1 inputs include quoted prices for identical instruments and are the most observable. Level 2 inputs include quoted prices for similar assets and observable inputs such as interest rates, foreign currency exchange rates, commodity rates and yield curves. Level 3 inputs are not observable in the market and include management’s own judgments about the assumptions market participants would use in pricing the asset or liability. The use of observable and unobservable inputs is reflected in the hierarchy assessment disclosed in the table below. As of December 31, 2022 and 2021, the Company held certain financial assets that are required to be measured at fair value on a recurring basis. These include derivative hedging instruments related to the foreign currency forward contracts and purchase of certain raw materials, investments in trading securities and available for sale securities. The Company’s available for sale and trading securities principally consist of corporate bonds and variable rate demand notes. The fair value of the Company’s industrial revenue development bonds at December 31, 2022 and 2021 were valued using Level 2 inputs which approximates the carrying value of $7,500 for both periods. Interest rates on these bonds reset weekly based on current market conditions. The following tables present information about the Company’s financial assets and liabilities measured at fair value as of December 31, 2022 and 2021, and indicate the fair value hierarchy and the valuation techniques utilized by the Company to determine such fair value: | | | | | | | | | | | | | | | | Estimated Fair Value December 31, 2022 | | | | Total | | Input Levels Used | | | | Fair Value | | Level 1 | | Level 2 | | Level 3 | | Cash and equivalents | | $ | 53,270 | | $ | 53,270 | | $ | — | | $ | — | | Available for sale securities | | | 272,448 | | | 1,889 | | | 270,559 | | | — | | Foreign currency derivatives | | | (282) | | | — | | | (282) | | | — | | Commodity derivatives | | | 10 | | | 10 | | | — | | | — | | Trading securities | | | 71,208 | | | 56,049 | | | 15,159 | | | — | | Total assets measured at fair value | | $ | 396,654 | | $ | 111,218 | | $ | 285,436 | | $ | — | |
| | | | | | | | | | | | | | | | Estimated Fair Value December 31, 2021 | | | | Total | | Input Levels Used | | | | Fair Value | | Level 1 | | Level 2 | | Level 3 | | Cash and equivalents | | $ | 105,840 | | $ | 105,840 | | $ | — | | $ | — | | Available for sale securities | | | 241,407 | | | 1,282 | | | 240,125 | | | — | | Foreign currency derivatives | | | 426 | | | — | | | 426 | | | — | | Commodity derivatives | | | 124 | | | 124 | | | — | | | — | | Trading securities | | | 89,736 | | | 76,196 | | | 13,540 | | | — | | Total assets measured at fair value | | $ | 437,533 | | $ | 183,442 | | $ | 254,091 | | $ | — | |
Available for sale securities which utilize Level 2 inputs consist primarily of corporate bonds and variable rate demand notes, which are valued based on quoted market prices or alternative pricing sources with reasonable levels of price transparency.
As of December 31, 2019 and 2018, the Company held certain financial assets that are required to be measured at fair value on a recurring basis. These include derivative hedging instruments related to the foreign currency forward contracts and purchase of certain raw materials, investments in trading securities and available for sale securities. The Company’s available for sale and trading securities principally consist of corporate and municipal bonds and variable rate demand notes.
The following tables present information about the Company’s financial assets and liabilities measured at fair value as of December 31, 2019 and 2018, and indicate the fair value hierarchy and the valuation techniques utilized by the Company to determine such fair value:
| | | | | | | | | | | | | | | | Estimated Fair Value December 31, 2019 | | | | Total | | Input Levels Used | | | | Fair Value | | Level 1 | | Level 2 | | Level 3 | | Cash and equivalents | | $ | 138,960 | | $ | 138,960 | | $ | — | | $ | — | | Available for sale securities | | | 177,292 | | | 3,588 | | | 173,704 | | | — | | Foreign currency forward contracts | | | 14 | | | — | | | 14 | | | — | | Commodity futures contracts, net | | | 121 | | | 121 | | | — | | | — | | Trading securities | | | 76,183 | | | 48,260 | | | 27,923 | | | — | | Total assets measured at fair value | | $ | 392,570 | | $ | 190,929 | | $ | 201,641 | | $ | — | |
| | | | | | | | | | | | | | | | Estimated Fair Value December 31, 2018 | | | | Total | | Input Levels Used | | | | Fair Value | | Level 1 | | Level 2 | | Level 3 | | Cash and equivalents | | $ | 110,899 | | $ | 110,899 | | $ | — | | $ | — | | Available for sale securities | | | 183,289 | | | 3,007 | | | 180,282 | | | — | | Foreign currency forward contracts | | | (407) | | | — | | | (407) | | | — | | Commodity futures contracts, net | | | (587) | | | (587) | | | — | | | — | | Trading securities | | | 62,260 | | | 36,753 | | | 25,507 | | | — | | Total assets measured at fair value | | $ | 355,454 | | $ | 150,072 | | $ | 205,382 | | $ | — | |
Available for sale securities which utilize Level 2 inputs consist primarily of corporate and municipal bonds and variable rate demand notes, which are valued based on quoted market prices or alternative pricing sources with reasonable levels of price transparency.
A summary of the aggregate fair value, gross unrealized gains, gross unrealized losses, realized losses and amortized cost basis of the Company’s investment portfolio by major security type is as follows: | | | | | | | | | | | | | | | | | | | | | | | | | | | | | | | | | December 31, 2019 | | | December 31, 2022 | | | | Amortized | | Fair | | Unrealized | | Realized | | | Amortized | | Fair | | Unrealized | | | Available for Sale: | | Cost | | Value | | Gains | | Losses | | Losses | | | Cost | | Value | | Gains | | Losses | | | Municipal bonds | | $ | — | | $ | — | | $ | — | | $ | — | | $ | — | | | $ | 41 | | $ | 40 | | $ | — | | $ | (1) | | | Variable rate demand notes | | | 25,845 | | | 25,845 | | | — | | | — | | | — | | | | 4,800 | | | 4,800 | | | — | | | — | | | Corporate bonds | | | 139,803 | | | 140,797 | | | 994 | | | — | | | — | | | | 276,148 | | | 264,575 | | | — | | | (11,573) | | | Government securities | | | 3,503 | | | 3,588 | | | 85 | | | — | | | — | | | | 1,924 | | | 1,889 | | | — | | | (35) | | | Certificates of deposit | | | 6,978 | | | 7,062 | | | 84 | | | — | | | — | | | | 1,157 | | | 1,144 | | | — | | | (13) | | | | | $ | 176,129 | | $ | 177,292 | | $ | 1,163 | | $ | — | | $ | — | | | $ | 284,070 | | $ | 272,448 | | $ | — | | $ | (11,622) | | |
| | | | | | | | | | | | | | | | | | | | | | | | | | | | | | | | | December 31, 2018 | | | December 31, 2021 | | | | Amortized | | Fair | | Unrealized | | Realized | | | Amortized | | Fair | | Unrealized | | | Available for Sale: | | Cost | | Value | | Gains | | Losses | | Losses | | | Cost | | Value | | Gains | | Losses | | | Municipal bonds | | $ | 6,173 | | $ | 5,123 | | $ | — | | $ | (1,050) | | $ | — | | | $ | 542 | | $ | 536 | | $ | — | | $ | (6) | | | Variable rate demand notes | | | 20,195 | | | 20,195 | | | — | | | — | | | — | | | | — | | | — | | | — | | | — | | | Corporate bonds | | | 149,795 | | | 148,863 | | | — | | | (932) | | | — | | | | 238,045 | | | 236,332 | | | — | | | (1,713) | | | Government securities | | | 2,979 | | | 3,007 | | | 28 | | | — | | | — | | | | 1,271 | | | 1,282 | | | 11 | | | — | | | Certificates of deposit | | | 6,148 | | | 6,101 | | | — | | | (47) | | | — | | | | 3,246 | | | 3,257 | | | 11 | | | — | | | | | $ | 185,290 | | $ | 183,289 | | $ | 28 | | $ | (2,029) | | $ | — | | | $ | 243,104 | | $ | 241,407 | | $ | 22 | | $ | (1,719) | | |
The fair value of the Company’s industrial revenue development bonds at December 31, 2019 and 2018 were valued using Level 2 inputs which approximates the carrying value of $7,500 for both periods. Interest rates on these bonds reset weekly based on current market conditions.
NOTE 11—10—DERIVATIVE INSTRUMENTS AND HEDGING ACTIVITIES: From time to time, the Company uses derivative instruments, including foreign currency forward contracts and commodity futures contracts to manage its exposures to foreign exchange and commodity prices. Commodity futures contracts are intended and effective as hedges of market price risks associated with the anticipated purchase of certain raw materials (primarily sugar). Foreign currency forward contracts are intended and effective as hedges of the Company’s exposure to the variability of cash flows, primarily related to the foreign exchange rate changes of products manufactured in Canada and sold in the United States, and periodic equipment purchases from foreign suppliers denominated in a foreign currency. The Company does not engage in trading or other speculative use of derivative instruments. The Company recognizes all derivative instruments as either assets or liabilities at fair value in the Consolidated Statements of Financial Position. Derivative assets are recorded in other receivables and derivative liabilities are recorded in accrued liabilities. The Company uses either hedge accounting or mark-to-market accounting for its derivative instruments. Derivatives that qualify for hedge accounting are designated as cash flow hedges by formally documenting the hedge relationships, including identification of the hedging instruments, the hedged items and other critical terms, as well as the Company’s risk management objectives and strategies for undertaking the hedge transaction. As of December 31, 2022 and 2021, all derivative instruments are accounted for using hedge accounting. Changes in the fair value of the Company’s cash flow hedges are recorded in accumulated other comprehensive loss, net of tax, and are reclassified to earnings in the periods in which earnings are affected by the hedged item. Substantially all amounts reported in accumulated other comprehensive loss for commodity derivatives are expected to be reclassified to cost of goods sold. Approximately $121$10 of this accumulated comprehensive gain is expected to be charged to earnings in 2020.2023. Approximately $14$282 in accumulated other comprehensive gainloss for foreign currency derivatives is expected to be reclassified to other income, net in 2020.
The following table summarizes the Company’s outstanding derivative contracts and their effects on its Consolidated Statements of Financial Position at December 31, 2019 and 2018:
| | | | | | | | | | | | | December 31, 2019 | | | | Notional | | | | | | | | | | Amounts | | Assets | | Liabilities | | Derivatives designated as hedging instruments: | | | | | | | | | | | Foreign currency forward contracts | | $ | 5,533 | | $ | 14 | | $ | — | | Commodity futures contracts | | | 7,147 | | | 205 | | | (84) | | Total derivatives | | | | | $ | 219 | | $ | (84) | |
2023.
| | | | | | | | | | | | | December 31, 2018 | | | | Notional | | | | | | | | | | Amounts | | Assets | | Liabilities | | Derivatives designated as hedging instruments: | | | | | | | | | | | Foreign currency forward contracts | | $ | 11,050 | | $ | — | | $ | (407) | | Commodity futures contracts | | | 9,580 | | | 92 | | | (679) | | Total derivatives | | | | | $ | 92 | | $ | (1,086) | |
The following table summarizes the Company’s outstanding derivative contracts and their effects on its Consolidated Statements of Financial Position at December 31, 2022 and 2021: | | | | | | | | | | | | | December 31, 2022 | | | | Notional | | | | | | | | | | Amounts | | Assets | | Liabilities | | Derivatives designated as hedging instruments: | | | | | | | | | | | Foreign currency derivatives | | $ | 7,264 | | $ | — | | $ | (282) | | Commodity derivatives | | | 189 | | | 10 | | | — | | Total derivatives | | | | | $ | 10 | | $ | (282) | |
| | | | | | | | | | | | | December 31, 2021 | | | | Notional | | | | | | | | | | Amounts | | Assets | | Liabilities | | Derivatives designated as hedging instruments: | | | | | | | | | | | Foreign currency derivatives | | $ | 6,729 | | $ | 426 | | $ | — | | Commodity derivatives | | | 6,012 | | | 231 | | | (107) | | Total derivatives | | | | | $ | 657 | | $ | (107) | |
The effects of derivative instruments on the Company’s Consolidated Statement of Earnings, Comprehensive Earnings and Retained Earnings for yearsyear ended December 31, 20192022 and 20182021 are as follows: | | | | | | | | | | | | | | | | | | | | | | For Year Ended December 31, 2019 | | | For Year Ended December 31, 2022 | | | | | | | | | | Gain (Loss) | | | | | | | | | Gain (Loss) | | | | | | | Gain (Loss) | | on Amount Excluded | | | | | Gain (Loss) | | on Amount Excluded | | | | Gain (Loss) | | Reclassified from | | from Effectiveness | | | Gain (Loss) | | Reclassified from | | from Effectiveness | | | | Recognized | | Accumulated OCI | | Testing Recognized | | | Recognized | | Accumulated OCI | | Testing Recognized | | | | in OCI | | into Earnings | | in Earnings | | | in OCI | | into Earnings | | in Earnings | | Foreign currency forward contracts | | $ | 359 | | $ | (62) | | $ | — | | | Commodity futures contracts | | | 92 | | | (615) | | | — | | | Foreign currency derivatives | | | $ | (484) | | $ | 223 | | $ | — | | Commodity derivatives | | | | 233 | | | 347 | | | — | | Total | | $ | 451 | | $ | (677) | | $ | — | | | $ | (251) | | $ | 570 | | $ | — | |
| | | | | | | | | | | | | | | | | | | | | | For Year Ended December 31, 2018 | | | For Year Ended December 31, 2021 | | | | | | | | | | Gain (Loss) | | | | | | | | | Gain (Loss) | | | | | | | Gain (Loss) | | on Amount Excluded | | | | | Gain (Loss) | | on Amount Excluded | | | | Gain (Loss) | | Reclassified from | | from Effectiveness | | | Gain (Loss) | | Reclassified from | | from Effectiveness | | | | Recognized | | Accumulated OCI | | Testing Recognized | | | Recognized | | Accumulated OCI | | Testing Recognized | | | | in OCI | | into Earnings | | in Earnings | | | in OCI | | into Earnings | | in Earnings | | Foreign currency forward contracts | | $ | (418) | | $ | 67 | | $ | — | | | Commodity futures contracts | | | (2,316) | | | (1,697) | | | — | | | Foreign currency derivatives | | | $ | 93 | | $ | 445 | | $ | — | | Commodity derivatives | | | | 1,330 | | | 2,148 | | | — | | Total | | $ | (2,734) | | $ | (1,630) | | $ | — | | | $ | 1,423 | | $ | 2,593 | | $ | — | |
NOTE 12—11—ACCUMULATED OTHER COMPREHENSIVE LOSS: The following table sets forth information with respect to accumulated other comprehensive earnings (loss): | | | | | | | | | | | | | | | | | | | | | | | | | | | | | | | | | | | | | | | | | | | | | | | | | | | | | | Accumulated | | | | | | | | | | | | | | | | | Accumulated | | | Foreign | | | | Foreign | | | | Postretirement | | Other | | Foreign | | | | Foreign | | | | Postretirement | | Other | | | Currency | | | | Currency | | Commodity | | and Pension | | Comprehensive | | Currency | | | | Currency | | Commodity | | and Pension | | Comprehensive | | | Translation | | Investments | | Derivatives | | Derivatives | | Benefits | | Earnings (Loss) | | Translation | | Investments | | Derivatives | | Derivatives | | Benefits | | Earnings (Loss) | Balance at December 31, 2017 | | $ | (24,262) | | $ | (889) | | $ | 51 | | $ | 20 | | $ | 3,289 | | $ | (21,791) | | Balance at December 31, 2020 | | | $ | (24,581) | | $ | 1,992 | | $ | 589 | | $ | 713 | | $ | 1,472 | | $ | (19,815) | Other comprehensive earnings (loss) before reclassifications | | | 103 | | | (459) | | | (318) | | | (1,754) | | | 1,172 | | | (1,256) | | | (301) | | | (3,205) | | | 70 | | | 1,009 | | | 332 | | | (2,095) | Reclassifications from accumulated other comprehensive loss | | | — | | | — | | | (51) | | | 1,286 | | | (1,003) | | | 232 | | | — | | | (73) | | | (337) | | | (1,628) | | | (1,065) | | | (3,103) | Other comprehensive earnings (loss) net of tax | | | 103 | | | (459) | | | (369) | | | (468) | | | 169 | | | (1,024) | | | (301) | | | (3,278) | | | (267) | | | (619) | | | (733) | | | (5,198) | Adoption of ASU 2018-02 | | | - | | | (168) | | | 9 | | | 4 | | | 748 | | | 593 | | Balance at December 31, 2018 | | $ | (24,159) | | $ | (1,516) | | $ | (309) | | $ | (444) | | $ | 4,206 | | $ | (22,222) | | Balance at December 31, 2021 | | | $ | (24,882) | | $ | (1,286) | | $ | 322 | | $ | 94 | | $ | 739 | | $ | (25,013) | Other comprehensive earnings (loss) before reclassifications | | | 791 | | | 2,372 | | | 272 | | | 70 | | | (914) | | | 2,591 | | | 1,087 | | | (7,511) | | | (368) | | | 177 | | | 2,529 | | | (4,086) | Reclassifications from accumulated other comprehensive loss | | | — | | | 26 | | | 47 | | | 466 | | | (1,153) | | | (614) | | | — | | | (12) | | | (169) | | | (263) | | | (626) | | | (1,070) | Other comprehensive earnings (loss) net of tax | | | 791 | | | 2,398 | | | 319 | | | 536 | | | (2,067) | | | 1,977 | | | 1,087 | | | (7,523) | | | (537) | | | (86) | | | 1,903 | | | (5,156) | Balance at December 31, 2019 | | $ | (23,368) | | $ | 882 | | $ | 10 | | $ | 92 | | $ | 2,139 | | $ | (20,245) | | Balance at December 31, 2022 | | | $ | (23,795) | | $ | (8,809) | | $ | (215) | | $ | 8 | | $ | 2,642 | | $ | (30,169) |
The amounts reclassified from accumulated other comprehensive income (loss) consisted of the following: | | | | | | | | | | | | | | | | | | | Details about Accumulated Other | | Year to Date Ended | | | | | Year to Date Ended | | | | Comprehensive Income Components | | December 31, 2019 | | December 31, 2018 | | Location of (Gain) Loss Recognized in Earnings | | | December 31, 2022 | | December 31, 2021 | | Location of (Gain) Loss Recognized in Earnings | | Investments | | $ | 34 | | $ | - | | Other income, net | | | $ | (16) | | $ | (96) | | Other income, net | | Foreign currency derivatives | | | 62 | | | (67) | | Other income, net | | | | (223) | | | (445) | | Other income, net | | Commodity derivatives | | | 615 | | | 1,697 | | Product cost of goods sold | | | | (347) | | | (2,148) | | Product cost of goods sold | | Postretirement and pension benefits | | | (1,522) | | | (1,324) | | Other income, net | | | | (826) | | | (1,405) | | Other income, net | | Total before tax | | | (811) | | | 306 | | | | | | (1,412) | | | (4,094) | | | | Tax expense (benefit) | | | 197 | | | (74) | | | | | | 342 | | | 991 | | | | Net of tax | | $ | (614) | | $ | 232 | | | | | $ | (1,070) | | $ | (3,103) | | | |
NOTE 13—12—GOODWILL AND INTANGIBLE ASSETS: All of the Company’s intangible indefinite-lived assets are trademarks. The changes in the carrying amount of trademarks for 20192022 and 20182021 were as follows: | | | | | | | | | | | | | | | | | 2019 | | 2018 | | | 2022 | | 2021 | | Original cost | | $ | 193,767 | | $ | 193,767 | | | $ | 193,767 | | $ | 193,767 | | Accumulated impairment losses as of January 1 | | | (18,743) | | | (18,743) | | | | (18,743) | | | (18,743) | | Balance at January 1 | | $ | 175,024 | | $ | 175,024 | | | $ | 175,024 | | $ | 175,024 | | Current year impairment losses | | | — | | | — | | | | — | | | — | | Balance at December 31 | | $ | 175,024 | | $ | 175,024 | | | $ | 175,024 | | $ | 175,024 | | Accumulated impairment losses as of December 31 | | $ | (18,743) | | $ | (18,743) | | | $ | (18,743) | | $ | (18,743) | |
The fair value of indefinite-lived intangible assets was primarily assessed using the present value of estimated future cash flows and relief-from-royalty method. The Company has 0no accumulated impairment losses of goodwill.
Note 14 — LEASESNOTE 13—LEASES:
The Company leases certain buildings, land and equipment that are classified as operating leases. These leases have remaining lease terms of up to approximately 319 years. In the fourth quarterOperating lease cost totaled $979 and $1,068 for twelve months of 2019, operating lease cost2022 and cash2021, respectively. Cash paid for operating lease liabilities totaled $258is substantially the same as operating lease cost and $1,004, respectively, which is classifiedpresented in cash flows from operating activities. As of December 31, 2019,2022 and 2021, operating lease right-of-use assets were $4,703 and $7,419, respectively, and operating lease liabilities were $4,743 and $7,419, respectivelyboth $1,580.. The weighted-average remaining lease term related to these operating leases was 1.615.9 years and 16.9 years as of December 31, 2019.2022 and 2021, respectively. The weighted-average discount rate related to ourthe Company’s operating leases was 3.1%3.3% and 2.3% as of December 31, 2019.2022 and 2021, respectively. Maturities of operating lease liabilities at December 31, 20192022 are as follows: $979 $654 in 2020, $5402023, $154 in 2021,2024, $159 in 2025, $153 in 2026 and $61$3,623 in 2022.2027 through 2041. The Company, as lessor, rents certain commercial real estate to third party lessees. The December 31, 2022 and 2021 cost related to these leased properties was $51,370 and $51,384, respectively, and the accumulated depreciation related to these leased properties were $36,378was $16,903 and $10,252, respectively, as$15,844, respectively. Terms of December 31, 2019. Terms ofcertain such leases, including renewal options, may be extended for up to sixtyapproximately fifty-eight years, many of which provide for periodic adjustment of rent payments based on changes in consumer or other price indices. The Company recognizes lease income on a straight-line basis over the lease term. Lease income in fourth quarter andthe twelve months 2019of 2022 and 2021 was $718$4,934 and $2,951,$4,223, respectively, and is classified in cash flows from operating activities. NOTE 15—QUARTERLY FINANCIAL DATA (UNAUDITED):
| | | | | | | | | | | | | | | | | | | (Thousands of dollars except per share data) | | | | First | | Second | | Third | | Fourth | | Year | | 2019 | | | | | | | | | | | | | | | | | Net product sales | | $ | 101,019 | | $ | 106,021 | | $ | 181,913 | | $ | 134,663 | | $ | 523,616 | | Product gross margin | | | 36,163 | | | 40,076 | | | 69,046 | | | 49,229 | | | 194,514 | | Net earnings attributable to Tootsie Roll Industries, Inc. | | | 8,955 | | | 11,556 | | | 29,854 | | | 14,555 | | | 64,920 | | Net earnings attributable to Tootsie Roll Industries, Inc. per share | | | 0.14 | | | 0.18 | | | 0.46 | | | 0.22 | | | 0.99 | | | | | | | | | | | | | | | | | | | 2018 | | | | | | | | | | | | | | | | | Net product sales | | $ | 100,859 | | $ | 105,623 | | $ | 181,505 | | $ | 127,264 | | $ | 515,251 | | Product gross margin | | | 35,025 | | | 38,142 | | | 66,259 | | | 45,945 | | | 185,371 | | Net earnings attributable to Tootsie Roll Industries, Inc. | | | 8,125 | | | 10,489 | | | 26,104 | | | 12,175 | | | 56,893 | | Net earnings attributable to Tootsie Roll Industries, Inc. per share | | | 0.12 | | | 0.16 | | | 0.40 | | | 0.18 | | | 0.86 | |
Net earnings per share is based upon average outstanding shares as adjusted for 3%stock dividends issued during the second quarter of each year as discussed above. The sum of the quarterly per share amounts may not equal annual amounts due to rounding.
ITEM 9. Changes in and Disagreements with Accountants on Accounting and Financial Disclosure. None. ITEM 9A. Controls and Procedures. Disclosure Controls and Procedures The Company’s Chief Executive Officer and Chief Financial Officer have concluded, based on their evaluation as of the end of the period covered by this report, that the Company’s disclosure controls and procedures (as defined in Rule 13a-15(e) of the Securities Exchange Act of 1934, as amended (the “Exchange Act”) ) are effective to ensure that information required to be disclosed in the reports that the Company files or submits under the Exchange Act is (i) recorded, processed, summarized and reported within the time periods specified in the Securities and Exchange Commission’s rules and forms, and (ii) is accumulated and communicated to the Company’s management, including its Chief Executive Officer and Chief Financial Officer, as appropriate to allow timely decisions regarding required disclosure. Internal Control over Financial Reporting (a)See “Management’s Report on Internal Control Over Financial Reporting,” included in Item 8 “Financial Statements and Supplementary Data,” which is incorporated herein by reference.
| (a) | See “Management’s Report on Internal Control Over Financial Reporting,” included in Item 8 “Financial Statements and Supplementary Data,” which is incorporated herein by reference. |
(b)See “Report of Independent Registered Public Accounting Firm” included in Item 8 “Financial Statements and Supplementary Data” for the attestation report of the Company’s independent registered public accounting firm, which is incorporated herein by reference.
| (b) | See “Report of Independent Registered Public Accounting Firm” included in Item 8 “Financial Statements and Supplementary Data” for the attestation report of the Company’s independent registered public accounting firm, which is incorporated herein by reference. |
(c)There were no changes in the Company’s internal control over financial reporting during the quarter ended December 31, 2019 that have materially affected, or are reasonably likely to materially affect, the Company’s internal control over financial reporting.
| (c) | There were no changes in the Company’s internal control over financial reporting during the quarter ended December 31, 2022 that have materially affected, or are reasonably likely to materially affect, the Company’s internal control over financial reporting. |
ITEM 9B. Other Information. None. ITEM 9C. Disclosure Regarding Foreign Jurisdictions that Prevent Inspections. None. PART III ITEM 10. Directors, Executive Officers and Corporate Governance. See the information with respect to the Directors of the Company which is set forth in the section entitled “Election of Directors” of the 2020 Proxy Statement, which section of the 2020 Proxy Statement is incorporated herein by reference. See the information in the section entitled “Section 16(a) Beneficial Ownership Reporting Compliance” of the Company’s 2020 Proxy Statement, which section is incorporated herein by reference. The following table sets forth the information with respect to the executive officers of the Company: | | | | | Name | | Position (1) | | Age | | | | | | Ellen R. Gordon* | | Chairman of the Board and Chief Executive Officer | | 8891
| | | | | | G. Howard Ember Jr. | | Vice President/Finance | | 6770
| | | | | | Stephen P. Green | | Vice President/Manufacturing | | 6164
| | | | | | Thomas E. CorrKenneth D. Naylor
| | Vice President/Marketing and Sales | | 7163
| | | | | | Barry P. Bowen | | Treasurer | | 6467
| | | | | | Henry G. Mills | | Vice President/Business Development | | 34 |
* A member of the Board of Directors of the Company. | (1) | All of the above named officers have served in the positions set forth in the table as their principal occupations for more than the past five years except for Mrs. GordonMr. Naylor and Mr. GreenMills who were appointed to their current positions on January 20, 20151, 2020 and January 16, 2017,October 1, 2022, respectively. Thomas E. Corr retired effective December 31, 2019,Previously, Mr. Naylor and Kenneth Naylor was promoted toMr. Mills held positions of Vice President/MarketingPresident, U.S.A. Sales and Sales effective January 1, 2020.Director, Business Development, respectively, during the past five-year period. |
Code of Ethics The Company has a Code of Business Conduct and Ethics, which applies to all of the Company’s directors and employees, and which meets the Securities Exchange Commission criteria for a “code of ethics.” The Code of Business Conduct and Ethics is available on the Company’s website, located at www.tootsie.com, and the information in such is available in print to any shareholder who requests a copy. ITEM 11. Executive Compensation. See the information set forth in the sections entitled “Executive Compensation” and “Director Compensation” of the Company’s 2020 Proxy Statement, which are incorporated herein by reference. ITEM 12. Security Ownership of Certain Beneficial Owners and Management and Related Stockholder Matters. For information with respect to the beneficial ownership of the Company’s common stock and Class B common stock by the beneficial owners of more than 5% of said shares and by the management of the Company, see the sections entitled “Ownership of Common Stock and Class B Common Stock by Certain Beneficial Owners” and “Ownership of Common Stock and Class B Common Stock by Management” of the 2020 Proxy Statement. These sections of the 2020 Proxy Statement are incorporated herein by reference. The Company does not have any compensation plans under which equity securities of the Company are authorized for issuance. ITEM 13. Certain Relationships and Related Transactions, and Director Independence. See the section entitled “Related Person Transactions” of the 2020 Proxy Statement, which is incorporated herein by reference. The Company’s board of directors has determined that its non-management directors, Mr. Seibert and Ms. Wardynski and Ms. Lewis-Brent, are independent under the New York Stock Exchange listing standards because they have no direct or indirect relationship with the Company other than through their service on the Board of Directors. ITEM 14. Principal Accounting Fees and Services. See the section entitled “Independent Auditor Fees and Services” of the 2020 Proxy Statement, which is incorporated herein by reference. ITEM 15. Exhibits, Financial Statement Schedules. | | (a) Financial Statements. | | | | (1) The following financial statements are included in Item 8: | | | | Report of Independent Registered Public Accounting Firm | | | | Consolidated Statements of Earnings and Retained Earnings for each of the three years ended December 31, 2019, 20182022, 2021 and 20172020 | | | | Consolidated Statements of Comprehensive Earnings for each of the three years ended December 31, 2019, 20182022, 2021 and 20172020 | | | | Consolidated Statements of Financial Position at December 31, 20192022 and 20182021 | | | | Consolidated Statements of Cash Flows for each of the three years ended in the period December 31, 2019, 20182022, 2021 and 20172020 | | | | Notes to Consolidated Financial Statements | | | | | | | | (2) Financial Statement Schedules. | | | | The financial statement schedule included in this Form 10-K is Schedule II - Valuation and Qualifying Accounts and Reserves for the YearsYear Ended December 31, 2019, 20182022, 2021 and 20172020 (see Schedule II immediately following ITEM 16 of this Form 10-K). | | | | | | | | (3) Exhibits required by Item 601 of Regulation S-K: | | | | See Index to Exhibits which appears following Financial Schedule II. | |
ITEM 16. Form 10-K Summary. None. SCHEDULE II – VALUATION AND QUALIFYING ACCOUNTS (in thousands) DECEMBER 31, 2019, 20182022, 2021 and 20172020 | | | | | | | | | | | | | | | | | | | | | | | | | | | | | | | | Additions | | | | | | | | | | | | Additions | | | | | | | | | | | | | (reductions) | | | | | | | | | | | | (reductions) | | | | | | | | | | Balance at | | charged | | | | | Balance at | | | Balance at | | charged | | | | | Balance at | | | | beginning | | (credited) to | | | | | End of | | | beginning | | (credited) to | | | | | End of | | Description | | of year | | expense | | Deductions(1) | | Year | | | of year | | expense | | Deductions(1) | | Year | | | | | | | | | | | | | | | | | | | | | | | | | | | | | 2019: | | | | | | | | | | | | | | | 2022: | | | | | | | | | | | | | | | Reserve for bad debts | | $ | 1,128 | | $ | 676 | | $ | 467 | | $ | 1,337 | | | $ | 1,392 | | $ | 34 | | $ | 12 | | $ | 1,414 | | Reserve for cash discounts | | | 692 | | | 9,482 | | | 9,562 | | | 612 | | | | 889 | | | 12,153 | | | 12,121 | | | 921 | | Deferred tax asset valuation | | | 3,892 | | | 1,093 | | | — | | | 4,985 | | | | 5,555 | | | 148 | | | — | | | 5,703 | | | | $ | 5,712 | | $ | 11,251 | | $ | 10,029 | | $ | 6,934 | | | $ | 7,836 | | $ | 12,335 | | $ | 12,133 | | $ | 8,038 | | | | | | | | | | | | | | | | | | | | | | | | | | | | | 2018: | | | | | | | | | | | | | | | 2021: | | | | | | | | | | | | | | | Reserve for bad debts | | $ | 1,197 | | $ | 38 | | $ | 107 | | $ | 1,128 | | | $ | 1,108 | | $ | 418 | | $ | 134 | | $ | 1,392 | | Reserve for cash discounts | | | 724 | | | 9,122 | | | 9,154 | | | 692 | | | | 586 | | | 10,153 | | | 9,850 | | | 889 | | Deferred tax asset valuation | | | 3,269 | | | 623 | | | — | | | 3,892 | | | | 5,593 | | | (38) | | | — | | | 5,555 | | | | $ | 5,190 | | $ | 9,783 | | $ | 9,261 | | $ | 5,712 | | | $ | 7,287 | | $ | 10,533 | | $ | 9,984 | | $ | 7,836 | | | | | | | | | | | | | | | | | | | | | | | | | | | | | 2017: | | | | | | | | | | | | | | | 2020: | | | | | | | | | | | | | | | Reserve for bad debts | | $ | 1,225 | | $ | 27 | | $ | 55 | | $ | 1,197 | | | $ | 1,337 | | $ | 123 | | $ | 352 | ��� | $ | 1,108 | | Reserve for cash discounts | | | 659 | | | 9,268 | | | 9,203 | | | 724 | | | | 612 | | | 8,504 | | | 8,530 | | | 586 | | Deferred tax asset valuation | | | 2,317 | | | 952 | | | — | | | 3,269 | | | | 4,985 | | | 608 | | | — | | | 5,593 | | | | $ | 4,201 | | $ | 10,247 | | $ | 9,258 | | $ | 5,190 | | | $ | 6,934 | | $ | 9,235 | | $ | 8,882 | | $ | 7,287 | |
| (1) | Deductions against reserve for bad debts consist of accounts receivable written off net of recoveries and exchange rate movements. Deductions against reserve for cash discounts consist of allowances to customers. |
INDEX TO EXHIBITS | | | | 3.1 | | Restated Articles of Incorporation. Incorporated by reference to Exhibit 3.1 of the Company’s Quarterly Report on Form 10-Q for the quarterly period ended June 30, 1997. | | | | 3.2 | | Amendment to Restated Articles of Incorporation. Incorporated by reference to Exhibit 3.2 of the Company’s Annual Report on Form 10-K for the year ended December 31, 1999. | | | | 3.3 | | Amended and Restated By-Laws. Incorporated by reference to Exhibit 3.2 of the Company’s Annual Report on Form 10-K for the year ended December 31, 1996. | | | | 4.1 | | Specimen Class B Common Stock Certificate. Incorporated by reference to Exhibit 1.1 of the Company’s Registration Statement on Form 8-A dated February 29, 1988. | | | | 4.2 | | Description of Common Stock. Incorporated by reference to Exhibit 4.2 of the Company’s Annual Report on Form 10-K for the year ended December 31, 2019. | | | | 10.1* | | Excess Benefit Plan. Incorporated by reference to Exhibit 10.8.1 of the Company’s Annual Report on Form 10-K for the year ended December 31, 1990. | | | | 10.2* | | Amended and Restated Career Achievement Plan of the Company. Incorporated by reference to Exhibit 10.8.2 of the Company’s Annual Report on Form 10-K for the year ended December 31, 1998. | | | | 10.3* | | Amendment to the Amended and Restated Career Achievement Plan of the Company. Incorporated by reference to Exhibit 10.8.3 of the Company’s Annual Report on Form 10-K for the year ended December 31, 1999. | | | | 10.4* | | Restatement of Split Dollar Agreement (Special Trust) between the Company and the trustee of the Gordon Family 1993 Special Trust dated January 31, 1997. Incorporated by reference to Exhibit 10.12 of the Company’s Annual Report on Form 10-K for the year ended December 31, 1996. | | | | 10.5* | | Form of Change In Control Agreement dated August, 1997 between the Company and certain executive officers. Incorporated by reference to Exhibit 10.25 of the Company’s Annual Report on Form 10-K for the year ended December 31, 1997. | | | | 10.6* | | Amendment to Split Dollar Agreement (Special Trust) dated April 2, 1998 between the Company and the trustee of the Gordon Family 1993 Special Trust, together with related Collateral Assignments. Incorporated by reference to Exhibit 10.27 of the Company’s Annual Report on Form 10-K for the year ended December 31, 1998. | | | | 10.7* | | Form of Amendment to Change in Control Agreement between the Company and certain executive officers. Incorporated by reference to Exhibit 10.28 of the Company’s Annual Report on Form 10-K for the year ended December 31, 2008. | | | | 10.8* | | Post 2004 Supplemental Savings Plan of the Company. Incorporated by reference to Exhibit 10.29 of the Company’s Annual Report on Form 10-K for the year ended December 31, 2008. | | | | 10.9* | | Post 2004 Excess Benefit Plan of the Company. Incorporated by reference to Exhibit 10.30 of the Company’s Annual Report on Form 10-K for the year ended December 31, 2008. | | | | 10.10* | | Amended and Restated Career Achievement Plan of the Company. Incorporated by reference to Exhibit 10.31 of the Company’s Annual Report on Form 10-K for the year ended December 31, 2008. | | | |
*Management compensation plan or arrangement. SIGNATURES Pursuant to the requirements of Section 13 or 15 (d) of the Securities Exchange Act of 1934, Tootsie Roll Industries, Inc., has duly caused this report to be signed on its behalf by the undersigned, thereunto duly authorized. | | | | TOOTSIE ROLL INDUSTRIES, INC. | | | | | | | | By: | Ellen R. Gordon | | | Ellen R. Gordon, Chairman of the Board of Directors and Chief Executive Officer | | | | | Date: | February 28, 2020March 1, 2023
|
Pursuant to the requirements of the Securities Exchange Act of 1934, this report has been signed below by the following persons on behalf of the registrant and in the capacities and on the dates indicated. | | | | | Ellen R. Gordon | | Chairman of the Board of Directors and Chief Executive Officer | | February 28, 2020March 1, 2023
| Ellen R. Gordon | | (principal executive officer) | | | | | | | | Paula M. Wardynski | | Director | | February 28, 2020March 1, 2023
| Paula M. Wardynski | | | | | | | | | | Lana Jane Lewis-Brent | | Director | | February 28, 2020March 1, 2023
| Lana Jane Lewis-Brent | | | | | | | | | | Barre A. Seibert | | Director | | February 28, 2020March 1, 2023
| Barre A. Seibert | | | | | | | | | | Virginia L. Gordon | | Director | | March 1, 2023 | Virginia L. Gordon | | | | | | | | | | G. Howard Ember, Jr. | | Vice President, Finance | | February 28, 2020March 1, 2023
| G. Howard Ember, Jr. | | (principal financial officer and principal accounting officer) | | |
|
|