| ● | Increases in income tax rates, changes in income tax laws or disagreements with tax authorities could adversely affect our business; |
| ● | If our transfer pricing arrangements are ineffective, our tax liability may increase. |
Risks Related to Our International Operations
| ● | We face special risks associated with international operations; |
| ● | Our delivery model involves geographic concentration outside of the United States exposing us to significant operational risks; |
| ● | We may face new risks as we expand into countries where we have no prior experience; |
| ● | Our financial results may be adversely impacted by foreign currency exchange rate risk. |
Risks Related to Ownership of Our Common Stock
| ● | Exclusive forum for dispute resolution in our bylaws could limit our stockholders’ ability to obtain a favorable judicial forum for their disputes; |
| ● | Delaware law and provisions in our certificate of incorporation and bylaws might discourage, delay or prevent a change of control of our Company or changes in our management and, therefore, depress the price of our common stock; |
| ● | Our inability to meet our clients’ or investors’ expectations for our environmental, social and governance (ESG) practices may impact our reputation and stock value; |
| ● | Our stock price may fluctuate significantly due to many factors, some of which we cannot control; |
| ● | Our Chairman and Chief Executive Officer controls a majority of our stock and has control over all matters requiring action by our stockholders; and his interest may conflict with the interests of our other stockholders; |
| ● | Our status as a “controlled company” could make our common stock less attractive to investors or otherwise harm our stock price. |
AVAILABILITY OF INFORMATIONINFORMATION
As of the date of this report, TTEC Holdings, Inc.’s principal executive offices are located at 9197 South Peoria Street, Englewood, Colorado 80112. Electronic copies of our Annual Reports on Form 10-K, Quarterly Reports on Form 10-Q, Current Reports on Form 8-K, Proxy Statements and any amendments to these reports are available free of charge by (i) visiting our website at http://www.ttec.com/investors/sec-filings/ or (ii) sending a written request to Investor Relations at our corporate headquarters or to investor.relations@ttec.com. TTEC’s SEC filings are posted on our corporate website as soon as reasonably practical after we electronically file such materials with, or furnish them to, the SEC. Information on our website is not incorporated by reference into this report.
You may also access any materials that we file with the SEC via the SEC’s public website at www.sec.gov.
iiiv
PART I
ITEM 1.
BUSINESS
Our Business
TTEC Holdings, Inc. (“TTEC”, “the Company”, “we”, “our” or “us”; pronounced “T-TEC”) is a leading global customer experience technology and services company focused on the design, implementation and delivery of transformative customer experience outcomes(“CX”) as a service (“CXaaS”) partner for many of the world’s most iconic companies, disruptive hypergrowth brands, and disruptive brands. Since our inception in 1982, we have been helping clients deliver frictionlesslarge public sector agencies. TTEC designs, builds, orchestrates, and delivers seamless digitally-enabled customer experiences strengthenthat increase brand value, customer loyalty, revenue, and profitability through personalized, outcome-based interactions. We help clients improve their customer relationships, brand recognition and loyalty through personalized interactions, significantly improve their Net Promoter Score ("NPS"), and lowersatisfaction while lowering their total cost to serve by enablingcombining innovative digital solutions with service capabilities that deliver a frictionless CX across numerous real-time digital and delivering simplified, consistentlive interaction channels and seamless customer experience across channels anddifferent phases of the customer lifecycle.
Our customer experience thought leadership is substantiated, with innovative programs that differentiate our clients from their competition.
In the fast expanding direct-to-customer ("DTC") channel where experiences are everything, enterprises must become increasingly customer-centricThe Company operates and digitally enabled. Digital transformation has become a have-to-have in winning and keeping customers. It is our mission to enable and accelerate our clients' path to digital transformation. We are focused on improving the experience of our clients' customers by leveraging existing and emerging technologies — artificial intelligence ("AI"), machine learning ("ML"), robotic process automation ("RPA"), cloud, analytics, omnichannel and real-time messaging.
Through the first quarter of 2019, the Company reportedreports its financial results of operations across four segments: Customer Strategy Services (“CSS”), Customer Technology Services (“CTS”), Customer Growth Services (“CGS”) and Customer Management Services (“CMS”). Starting in the second quarter of 2019, the Company changed its go-to-market strategy, how its clients evaluate and consume its services, how TTEC assesses its operating performance and the leadership accountability for its segments. As a result, the Company now reports its financial information based onthrough two business segments: TTEC Digital and TTEC Engage.
| TTEC Digital is one of the largest pure-play CX technology service providers with expertise in CX strategy, digitization, analytics, process optimization, system integration, cloud-based technology solutions, and transformation enabled by our proprietary CX applications and technology partnerships. TTEC Digital designs, builds, and |
| TTEC Engage provides the |
TTEC Digital and TTEC Engage strategically come together under our unified offering, Humanify™ Customer Experience as a Service ("CXaas"),Humanify® CXaaS, which drives measurable customer results for clients through the delivery of personalized and seamless omnichannel experiences. Our Humanify™Humanify® cloud platform provides a fully integrated ecosystem of Customer Experience ("CX")CX offerings, including omnichannel, messaging, AI, ML, RPA,machine learning, robotic process automation, analytics, cybersecurity, customer relationship management ("CRM"),CRM, knowledge management, journey orchestration, and journey orchestration.traditional voice solutions. Our end-to-end CXaaS platform differentiates us from many competitors by combining design, strategic consulting, best in class technology, data analytics, process optimization, system integration, and operational excellence.excellence along with our decades of industry know-how. This unified offering is value-oriented, outcome-based and delivered to large enterpriseenterprises, hypergrowth companies and governmentspublic sector agencies on a global scale.
During fiscal 2019,2022, the TTEC global operating platform delivered onshore, nearshore and offshore services in 2221 countries on six continents -- the United States, Australia, Belgium, Brazil, Bulgaria, Canada, Colombia, Costa Rica, Germany, Greece, Hong Kong, India, Ireland, Mexico, the Netherlands, New Zealand, the Philippines, Poland, Singapore, South Africa, Thailand, United Arab Emirates, and the United Kingdom. We provide onshore, nearshoreKingdom – with the help of 69,400 consultants, technologists, and offshore services on six continents to accommodate client requirements. TTEC has 49,500 employees, approximately 1,400 of whom are CX professionals serving TTEC Digital clients and approximately 48,100 of whom serve TTEC Engage clients.
1
professionals.
Our revenue for fiscal 20192022 was $1.644$2.444 billion, approximately $305$472 million, or 19%, which came from our TTEC Digital segment and $1.338$1.972 billion, or 81%, which came from our TTEC Engage segment.
To improve our competitive position in a rapidly changing market and stay strategically relevant to lead our clients with emerging CX methodologies, we continue to invest in innovation and service offerings for both mainstream and high growthhigh-growth disruptive businesses, diversifying and strengthening our core customer care services with consulting,technology-enabled, outcomes-focused services, data analytics, insights, and technology-enabled, outcomes-focused services.consulting.
1
We also invest to expand our geographic footprint, broaden our product and service capabilities, increase our global client base and industry expertise, tailor our geographic footprint to the needs of our clients, and further scale our end-to-end integrated solutions platform. To this end we have beenwere highly acquisitive in the last several years, including our acquisition in April 2022 of certain public sector assets of Faneuil, Inc. that included healthcare exchange and transportation services contracts. The acquisition expanded our capabilities in the growing public sector market by adding the building and operating of technology-enabled citizen engagement solutions to our offerings. We also completed an acquisition early in the second quarter of 2021 of a provider of Genesys and Microsoft cloud contact center services, which followed an acquisition in 2019the second half of 2020 of a U.S.-based provider of customer care, social media community management, content moderation, technical support and business process solutions; an acquisition in 2018 of a U.K.-based systems integrator for multichannelpreferred Amazon Connect cloud contact center platforms; an acquisition in 2017 of an India-based digital fraud preventionservice and detection and content moderation services company; and an acquisition in 2017 of a U.S.-based healthcare services company focused on improving the customer experience for healthcare plan providers and pharmacy benefits managers.implementation provider.
We have extensive expertise in the healthcare, automotive, communications,national/federal and state and local government, financial services, government, healthcare,communications, technology, travel and logistics, media and entertainment, e-tail/retail, technology, travel and transportation industries. We serve more than 300775 diverse clients globally, including many of the world’s iconic blue-chip brands, Fortune 1000 companies, public sector agencies, and disruptive growthhypergrowth companies.
Our strong balance sheet, cash flow from operations and access to debt and capital markets have historically provided us the financial flexibility to effectively fund our organic growth, capital expenditures, strategic acquisitions, incremental investments, and capital distributions.
We continue to return capital to our shareholders via semi-annual dividends. Given our cash flow generation and balance sheet strength, we believe cash dividends, in balance with our investments in innovation and strategic acquisitions, align shareholder interests with the needs of the Company. In 2015, our Board of Directors adopted a dividend policy, with the intent to distribute a periodic cash dividend to stockholders of our common stock, after consideration of, among other factors, TTEC’s performance, cash flow from operations, capital needs and the overall liquidity of the Company. Since inception in 2015, the Company has continued to pay a semi-annual dividend in October and April of each year in gradually increasing amounts from $0.18 to $0.32 per common share. On February 27, 2020, the Company’s Board of Directors authorized a semi-annual dividend of $0.34 per common share, payable on April 16, 2020 to shareholders of record as of April 1, 2020.
Our Industry – Key Emerging Themes
| Accelerated Digital and Virtual Transformation – Before the onset of the COVID-19 pandemic, leading organizations were already transforming to a more digitized, virtualized future. The pandemic and related impacts on access to products and services, and how organizations manage their customer interactions, exposed significant customer interaction technology and delivery deficiencies for many organizations across the world that were not digitized or agile enough to adequately support their customers. Organizations’ front-line operations and customer support infrastructure were too brick-and-mortar focused with limited non-voice digital customer interaction alternatives. Organizations are recognizing the growing importance of increased virtual delivery solutions and expanded and enhanced digital omnichannel capabilities. This development is expected to create accelerated demand for our demonstrated suite of CX product and service offerings to enable and support this transformation. |
● | Direct-to-Consumer (“DTC”) Revolution - The DTC revolution has created a new generation of disruptive brands with few barriers to entry. These emerging brands thrive on emotional connection and authentic customer relationships relying on trusted influencers and personalized service to win the hearts and minds of a growing customer base, one that requires an on-demand, curated buying experience. We believe DTC can enhance the value we provide to our clients as we design, build and operate our clients’ digital customer experience. |
| Evolution of Customer Behavior and CX Imperative - Yesterday's customer service experience is being replaced by today's direct experience, where brands deliver a personalized end-to-end journey. As customers become more connected and share their experiences across a variety of social channels, the quality of the experience has a greater impact on brand loyalty and business performance. |
2
| CX Technology is Migrating to the Cloud - Cloud investment is expected to continue to grow significantly. |
2
| Enterprises are Consolidating Partners - |
| ● | Delivery Shifting from Brick-and-Mortar to Work From Home – COVID-19 accelerated the shift of customer experience delivery from brick-and-mortar to work from home. While a portion of work from home delivery has shifted back to brick-and-mortar post-pandemic, we expect a high portion of delivery will remain in work from home locations. |
Our Strategy
We aim to grow our revenue and profitability by focusing on our core customer engagement operational capabilities, linking them to higher margin, insights and technology-enabled platforms and managed services to drive a superior experience for our clients’ customers. To that end we continually strive to:
| Build deeper, more strategic relationships with existing global clients to drive enduring, transformational change within their organizations; |
| Pursue new clients who lead their respective industries and who are committed to value driven customer engagement as a differentiator; |
| Invest in our global sales and marketing leadership team at both the segment level to improve collaboration and speed-to-market, and consultative sales level to deliver more integrated, strategic, and transformational solutions; |
| Expand into new geographic markets that give us access to new customers, partners, and delivery center capabilities; |
● | Execute strategic acquisitions that further complement and expand our integrated solutions; |
| Invest in technology-enabled platforms and innovation through technology advancements, broader and globally protected intellectual property, and process |
| Work within our technology partner ecosystem to deliver |
Our Integrated Service Offerings and Business Segments
We provide strategic value and differentiation through our two business segments: TTEC Digital and TTEC Engage.
TTEC Digital is one of the largest pure-play CX technology service providers with expertise in CX strategy, digitization, analytics, process optimization, system integration, cloud-based technology solutions, and transformation enabled by our proprietary CX applications and technology partnerships. TTEC Digital designs, builds, and delivers tech-enabled, insights-basedoperates robust digital experiences for clients and outcome-driven customer experience solutionstheir customers through our professional servicesthe contextual integration and suiteorchestration of CRM, data, analytics, CXaaS technology, offerings. These solutions are criticaland intelligent automation to enabling and accelerating digital transformation for our clients.ensure high-quality, scalable CX outcomes.
| Technology Services: Our technology services design, |
| Professional Services: Our management consulting practices deliver customer experience strategy, analytics, process optimization, and |
3
TTEC Engage provides the essential technologies, human resources, infrastructure and processesdigitally enabled CX managed services to operatesupport our clients’ end-to-end customer interaction delivery at scale. The segment delivers omnichannel customer care, technology support, order fulfillment, customer acquisition, growth, and retention services with industry specialization and distinctive CX capabilities for hypergrowth brands. TTEC Engage also delivers digitally enabled back office and industry specific specialty services including AI operations, and fraud detection and preventionmanagement services.
| Customer Acquisition, Growth, and Retention Services: Our customer growth and acquisition services optimize the buying journeys for acquiring new customers by leveraging technology and analytics to deliver personal experiences that we believe increase the quantity and quality of leads and customers. |
| Customer Care, Technology Support, and Order Fulfillment Services: Our customer care, technology support, and order fulfillment services provide turnkey contact center solutions, including digital omnichannel technologies, associate recruiting and training, facilities, and operational expertise to create exceptional customer experiences across all touchpoints. |
3
|
|
Based on our clients’ preference,preferences, we provide our services on an integrated cross-business segment and/or on a discrete basis.
Additional information with respect to our segments and geographic footprint is included in Part II, Item 8. Financial Statements and Supplementary Data, Note 3 to the Consolidated Financial Statements.
Our Competitive Strengths
We have established ourselves asTTEC is an industry leader in CX by leveraging the following competitive strengths:
| Humanify |
Fundamental to our platforms is our network of global data centers, which provide an integrated suite of voice and data routing, workforce management, quality monitoring, business analytics, storage, and storageinfrastructure security and fault-tolerance capabilities, enabling seamless operations from locations around the globe. This ‘hub and spoke model’ enables us to provide services at a competitive cost while delivering scalability, reliability, regulatory compliance, and asset utilization across the full suite of our service offerings. It also provides effective redundancy for a timely response to system interruptions and outages due to natural disasters, grid downtime, and other conditions outside of our control. Importantly, this broad-based platform has accelerated our time to market foundation for new, innovative offerings such as TTEC's cloud based Humanify™Humanify® Operations/Insights Platform, Humanify™ Humanify® @Home for remote omnichannel agents, and our suite of human capital solutions.
Further, our Humanify™Humanify® Technology Platforms leverage reference architectures for multiple solutions whether we are operating the platforms and the services, implementing customized platforms for clients, or providing advanced managed services and continuous and automated development environments. They also provide clients with secure and compliant solutions for regional (e.g., the European Union General Data Protection Regulation (“GDPR”), or the California Consumer Protection Act (“CCPA”)), industry (e.g., the Payment Card Industry Data Security Standard (“PCI”), or the Health Insurance Portability and Accountability Act (“HITRUST”HIPPA”)), or client specific standards (e.g., FedRamp or FISMA).
4
| Innovative Human Capital Strategies |
| Robust Technology Partner Ecosystem - Our strategic alliances with important digital channel partners enable our clients to deliver high-impact, personalized customer experiences more efficiently. We go to market with our |
4
| Globally Deployed Operating Best |
New customer engagement centers are established and existing centers are expanded or scaled down to accommodate anticipated business demands or specific client needs. As of December 31, 2019, we had significant capacity in the United States, Brazil, Bulgaria, Canada, Greece, India, Mexico, the Philippines, Poland and the United Kingdom to support customer demand and deliver superior cost efficiencies. We continue to explore opportunities in North America, Central Europe, South America and Africa to diversify our delivery footprint enabling near-shore and off-shore locations that support our multi-lingual service offerings and provide attractive client economics.
See Item 1A. Risk Factors for a description of the risks associated with our foreign operations.
Clients
We develop long-term relationships with clients globally, including many of the worlds’ iconic blue-chip brands, Fortune 1000 companies, public sector agencies, and disruptive growthhypergrowth companies. These companiesorganizations are in customer intensive industries or sectors, whose business complexities and customer focus requiresrequire a partner that can quickly design and globally scalebuild integrated technology and data-enabled services.services, often on a global scale. In 2019,2022, our top five and ten10 clients represented 37%35% and 50%47% of total revenue, respectively.
In several of our offerings across TTEC Digital and TTEC Engage, we enter into long-term relationships that provide us with a more predictable recurring revenue stream. In our TTEC Digital segment, our CX cloud and managed services technology solution contracts have an average three-year term with penalties in the case a client terminates for convenience. In our TTEC Engage segment, most of our contracts can be terminated for convenience by either party, but our relationships with our top five clients have ranged from 1316 to 23 years including multiple programs and contract renewals for severalmost of these clients. In 2019,2022, we had a 102%97% revenue retention rate for the TTEC Engage segment, versus 98%109% in 2018.2021.
Certain of our communications clients provide us with telecommunication services through arm’s length negotiated transactions. These clients currently represent approximately 12%5% of our total annual revenue. Expenditures under these supplier contracts represent less than one percent1% of our total operating costs.
COVID-19 Pandemic
Through the period ended December 31, 2022 the COVID-19 pandemic has not had a material adverse impact on our operational or financial results. As of December 31, 2022 we have no continuing COVID-19 related surge work. Our clients continue to reposition their work in the post-pandemic environment, leveraging new ways of working, and evolving the use of technology. Based on currently available information, we cannot accurately predict the post-pandemic changes to our clients’ businesses and their effect on the magnitude and timing of our clients’ buying decisions. Further, while to date we have been successful in managing service delivery from a mix of delivery centers and highly disbursed employee population working remotely, certain seasonal weather cycles and their potential impacts on power grid and internet availability for our employees working from home may impact our delivery capability with little notice, thus potentially impacting our results of operations in the future. As the needs of the business and our client requests now require us to return some of our employees who have been working remotely to on-site work in our delivery centers, some employees may be reluctant to return to traditional work on-sites and it may have impacts on our ability to staff projects and deliver services.
5
Competition
We are a leading global customer experience technology and services company focused on the design, implementation and delivery of transformative solutionspartner for many of the world’s most iconic brands, Fortune 1000 companies, public sector agencies, and disruptive brands.hypergrowth companies. Our competitors vary by geography and business segment, and range from large multinational corporations to smaller, narrowly focused enterprises. Across our lines of business, the principal competitive factors include: client relationships, technology and process innovation, integrated solutions, digital and virtual delivery capabilities, operational performance and efficiencies, pricing, brand recognition, and financial strength.
Our strategy in maintaining market leadership is to invest, innovate, and provide integrated value-driven services, all centered around customer engagement management. Today, we are executing on a more expansive, holistic strategy by transforming our business into higher-value offerings through organic investments and strategic acquisitions. As we execute, we are differentiating ourselves in the marketplace and entering new markets that introduce us to an expanded competitive landscape.
5
In our TTEC Digital segment, we primarily compete with smaller specialized companiespure-play technology and service providers and divisions of multinational companies, including Bain & Company, McKinsey & Company, 8X8,Five9, InContact, Twilio, EPAM, Endava, Globant, Accenture, IBM, AT&T, Genpact, Interactive Intelligence, LiveOps, inContact, Five9, WPP, Publicis Groupe, Dentsu,Cognizant, and Infosys, among others.
In our TTEC Engage segment, we primarily compete with in-house customer management operations as well as other companies that provide customer care services including: Alorica,Teleperformance, Telus International, Concentrix, Sitel, Sykes,TaskUs, Intouch CX, Webhelp, Accenture, Genpact, and Teleperformance, amongstExl, among others.
EmployeesRegulations Relevant to Our Business
Our peopleTTEC is subject to various domestic and international laws and regulations, permitting and licensing regimes (collectively, “Regulations”). These Regulations often change and require TTEC to devote considerable resources and make investments to stay in consistent compliance. The narrative that follows summarizes some of the more important Regulations that impact our business; it is not intended as an all-inclusive list. In jurisdictions where we do business, TTEC has processes in place to monitor regulatory requirements and take reasonable steps to assure compliance.
Data Privacy. We are our most valuable asset. Assubject to data protection and privacy regulations in many of December 31, 2019,the countries where we had 49,500 employees in 22 countries on six continents. Although a percentageoperate, including the European General Data Protection Regulation ("GDPR"), the California Consumer Protection Act ("CCPA") and other similar U.S. state-level data protection legislation, and the Philippine Data Privacy Act (“Republic Act No. 10173”). Certain of our systems, that support clients with special regulatory requirements, also require compliance with Health Information Trust Alliance (“HITRUST”) requirements and Health Insurance Portability and Accountability Act (“HIPAA”) regulations for clients in the healthcare industry; the Payment Card Industry Data Security Standard (“PCI-DSS”) for financial services clients and other clients where we have access to their customers’ payment card information; Federal Information Security Management Act GSA (“FISMA”) and Federal Risk and Authorization Management Program (“FedRamp”) requirements for U.S. federal government clients; and other similar requirements.
TTEC Engage segment employeesmaintains a cyber security and data privacy program designed to protect our clients’, their customers’, and our employees’ confidential personal and sensitive information. We have invested in our cyber security capabilities to identify, detect, respond to and recover from cyber threats and attacks. These investments help us reduce our vulnerabilities to cyber incidents and minimize their impacts on our operations. They also support compliance with our contractual obligations and the laws and regulations governing our activities. We engage independent auditors to conduct general controls and business process (SOC1 and SOC2) assessments for technology solutions we use in our banking, financial services, and insurance (“BFSI”) and healthcare verticals. We also engage third parties to conduct vulnerability assessment and penetration testing of our technology environments. See "Risk Factors — Uncertainty and inconsistency in privacy and data protection laws relevant to our business, failure to comply with contractual obligations related to privacy, and high cost of compliance may impact our ability to deliver services and our results of operations.”
6
Work From Home Regulations. The transition to remote work due to the COVID-19 pandemic gave rise to new Regulations specific to work from home, which vary among jurisdictions and range from requirements to reimburse costs associated with remote work, to special health and safety mandates, and special government reporting requirements. To comply with these Regulations, TTEC updated its payroll practices and adopted new ways of working, including the use of virtual private networks to access service delivery applications, and remote monitoring and coaching of employees. As we were not always able to replicate in the work from home environment the physical controls we have in place at our delivery centers, we agreed with our clients to implement certain additional controls. Employees that work from home are hired seasonallyrequired to attest to their understanding and compliance with these controls and with TTEC’s enhanced remote work policy that is designed to address periodic highernew Regulations and the modified contractual requirements. TTEC works diligently with specialists to stay current on the rapidly changing regulatory environment, but the distributed nature of remote service delivery continues to represent heightened risks of security threats and compliance challenges and there can be no assurance that these risks can be fully contained. See "Risk Factors — Our client services delivered by employees working from home are now a standard and this change in the operating model may subject us to new untested risks.”
Other Regulations. TTEC is a labor-intensive business volumesthat is subject to complex labor and employment laws established by the U.S. Department of Labor, state and local regulatory bodies, and similar regulators in retail, healthcare and other seasonal industries, most remain employed throughout the year. Approximately 67% of our employees are locatedjurisdictions outside of the U.S. Approximately 10% of our employees are covered by collective bargaining agreements, most of which are mandated under national labor laws outside ofThese Regulations govern working conditions, paid time off, workplace safety, wage and hour standards, and hiring and employment practices.
Our public sector work is secured and delivered in compliance with various jurisdiction-specific government procurement regulations, like the United States. These agreementsFederal Acquisition Regulations (known as “FAR”) and government agency specific supplemental regulations that we comply with when we bid and deliver work for the U.S. federal government.
Our global operations are subject to periodic renegotiationsvarious domestic and foreign anti-corruption mandates, such as the U.S. Foreign Corrupt Practices Act, the U.K. Bribery Act, and similar anti-bribery laws in other jurisdictions where we anticipatedo business. As a U.S. company operating through non-U.S. subsidiaries, TTEC is subject to foreign exchange control, transfer pricing, cross-border tax Regulations, immigration and customs Regulations that they willprescribe how funds, goods, and people traverse between TTEC and our foreign subsidiaries. See "Risk Factors — Risks Related to Our International Operations.”
Work we do for some of our clients is subject to special licensing requirements, e.g., insurance producer and gaming licenses. The granting of these licenses can be reneweddiscretionary on the part of regulatory authorities. As part of the licensing requirements, we may also be subject to extensive and expensive cybersecurity regulations or subject to heightened disclosure requirements that impact our companies or our executives. See, “Risk Factors -- Our financial results may be impacted by changes in the ordinary course of business without material impactlaws/regulations and our failure to comply with laws/regulations relevant to our businessbusiness.”
We believe that our operations are in substantial compliance with relevant Regulations; but our compliance with Regulations may cause us to make additional capital and operational expenditures, the cost of which we may not always be able to pass to our clients through our pricing structures, and such additional investments could be material to our results of operations, financial position, or cash flows. See "Risk Factors — Our results of operations may be impacted by changes in a manner materially different from other companies covered by such industry-wide agreements.laws, our failure to comply with laws and regulations relevant to our business.”
Research, Innovation, Intellectual Property and Proprietary Technology
We recognize the value of innovation in our business and are committed to developing leading-edge technologies and proprietary solutions. Research and innovation have been a major factor in our success and we believe that they will continue to contribute to our growth in the future. We use our investment in research and development to create, commercialize, and deploy innovative business strategies and high-value technology solutions.
7
We deliver value to our clients through, and our success in part depends on, certain proprietary technologies and methodologies. We leverage U.S. and foreign patent, trade secret, copyright, and trademark laws as well as confidentiality, proprietary information, non-disclosure agreements, and key staff non-competition agreements to protect our proprietary technology.
As of December 31, 2019,2022, we had 211 patent applications pending; and also hold 7996 U.S. and non-U.S. patents in 89 jurisdictions that we leverage in our operations and as marketplace differentiation for our service offerings. Our trade name, logos, and names of our proprietary solution offerings are protected by their historic use and, in addition, by trademarks and service marks registered in 22 countries.32 jurisdictions.
Human Capital Resources
Headcount Information: As of December 31, 2022, TTEC had 69,400 employees, approximately 2,800 of whom are CX professionals serving TTEC Digital clients and approximately 66,600 of whom serve TTEC Engage clients. Approximately 47% of our employees are based in the Asia-Pacific region, 42% in North America (with 40% in the United States), 7% in Central and South America, and 4% in the Europe, Middle East and Africa (EMEA) region.
Development and Training: Our 2022 Human Experience (HX) people strategy is focused on the attraction, development and retention of our employees through meaningful engagement and purposeful development. To support advancement of our employees and prepare them for demands of rapidly changing workplace and client requirements we offer career development focused programs, technologies, and resources. In 2022 we made significant investments in learning technologies and courseware, including the expansion of capabilities within our robust talent management platform, TTEC Talenttm, that provides a streamlined end-to-end career management experience. Expansion included the implementation of a mobile app that provides all employees access to TTEC Talenttm at any time from any device. TTEC Talenttm houses a library of more than 10,000 courses that cover topics on general business acumen ranging from business operations, professionalism, leadership, ethics, finance, negotiations, and project management to subject-matter specific professional and technical curriculum. We also expanded our courseware offerings in informational Technology and Digital Transformation through partnerships with specialty courseware vendors. In direct support of our Digital segment, we launched the Digital University program, a scalable 60-90 day learning journey providing talent readiness needed to enter the organization and best serve our clients. Our TTEC development programs help identify top performers, improve employee performance, engagement, and retention, and create promotion-from-within opportunities in the Company with 71% of our open positions filled by internal candidates in 2022.
Our performance management philosophy is a comprehensive strategy aligned to our Company’s business priorities, requiring regular coaching sessions and performance evaluations that aim at building a high-performance culture. Managers and employees can collaborate to create goals, assess goal completion, identify developmental opportunities and how values driven behavior contributes to results. Feedback can be requested or provided at any time on goal progress, values behavior, recognition, or development, and in 2022 through TTEC Talenttm 95% of eligible employees completed check-ins with their manager focused on goals, priorities, and personal development on a quarterly basis.
Our 2022 comprehensive executive talent development strategy can be easily customized and launched by segment and/or department and enables leaders and teams to plan and build talent capability. Talent planning and development for executive roles is accomplished through a talent review and succession planning process which includes consulting, training, data analytics, calibration, and development recommendations. We evaluate all mid-level managers and above roles, determine top talent and successors and invest in their development to meet our growth goals. Executive development programs created and launched in 2022 include an Executive Learning Center of Excellence, a one-stop-shop for executive development resources and our Executive Leadership Academy, a leadership development program for high potential Directors and above that includes 360 assessments, formal and informal learning, facilitator and faculty-led sessions, coaching and mentoring, and applied learning.
8
In 2022, TTEC launched the second cohort of employees as part of our Leadership Development Internship (“LDI”). The LDI program, originally launched in 2021, is designed to identify and attract new talent and prepare them for success within our organization. Each year the program recruits individuals finishing up their undergraduate degrees or early in their career with diverse backgrounds in various fields relevant to TTEC ranging from technology to humanities. These individuals are paired into departments that align with their interests and career goals and spend a summer working in those areas and learning all about our business. We also launched our first Leadership Development Internship cohort in India, and at the end of the year made plans to begin this program in Mexico.
Diversity Equity & Inclusion (DEI): TTEC believes that our differences are one of our greatest strengths; and that diversity of our employees enables us to innovate how we serve our clients and their diverse customers on six continents. Our DEI Council, comprised of senior leaders from different business segments a wide range of ethnicities, nationalities, genders, and sexual orientations, governs TTEC DEI education and advancement initiatives; provides resources for our employees to achieve their full potential; and oversees our employee resource groups (“ERGs”) dedicated to empowerment and opportunities to member of special interest groups including:
| ● | Champions of Color, a group that supports employees of Black or of African descent; |
| ● | Women In Leadership group that supports a global community of TTEC women and allies, with a subset group focused on Women in Tech; |
| ● | MINDS, the group that highlights the strengths of individual neurodiversity; and |
| ● | PRISM, the group that supports and celebrates employees who identify as LGBTQIA+ and their allies. |
Our DEI Council is a critical driver in fostering organizational change, establishing a dedicated focus on DEI priorities and how they align with the Company’s business strategy and its Environmental Social Governance (“ESG”) objectives. The Council, together with TTEC executive leadership team, hold the organization accountable to increase awareness and education and provide leadership opportunities for underrepresented employees so they can reach their full potential and delivery on the Company’s promise to Bringing Humanity to BusinessTM. These focused initiatives paid dividend when the results of our 2022 Employee Experience (EX25) survey told us that 89% of our employees feel they can be themselves at work and succeed to their full potential. As of December 31, 2022, 61% of the Company’s global workforce and 56% of our employees in supervisory roles were female; while 57% of our U.S. workforce and 41% of our employees in supervisory roles were people of color.
Competitive Pay/Benefits and Pay-for-Performance Philosophy: Our pay-for-performance philosophy aligns our compensation programs with TTEC’s performance and reflects our commitment to reward short and long-term performance that aligns with and drives long-term stockholder value. TTEC compensation programs are designed to provide appropriate incentives to attract, retain and motivate employees to achieve desired outcomes for our clients and our shareholders. Further, TTEC provides employees with a comprehensive benefits program that includes health insurance and important wellness programs, including mental health initiatives, as well as other programs that support employees’ physical, emotional, and financial health.
Workplace Safety: The health and safety of our employees is one of our top priorities. TTEC’s success depends on protecting our employees, visitors, clients and facilities, and our goal is to provide everyone that works for us and with us, a safe and healthy work environment. TTEC employees are required to complete health and safety training when they join the Company and are encouraged to report any concerns they have about health and safety in their work environment.
In 2022 the majority of our global workforce remained working in a remote environment. For employees that worked in a bricks and mortar setting, we continued to follow diligent COVID protocols to ensure employee safety. These safety protocols included increased cleaning frequency, additional signage, workstation reconfiguration for social distancing, personal protective equipment, contact tracing, shuttle services, and automated health attestations.
9
Retention and Turnover: Employee experience and retention remain a top priority for TTEC and are a key driver of financial results of our operations. Our turnover reduction efforts focus on market pay, trained management teams, development programs, career mobility, communication and the work environment and company culture that make an employee feel engaged, rewarded, appreciated, informed, and fulfilled in the organization. In 2022, we saw great improvement in employee retention due to diligent focus on these efforts.
Employee Engagement: We continuously assess employee engagement by gathering employees’ sentiment and in 2022 we launched all-new methodologies to understand employee sentiment throughout the year and annually. These new surveys allow us to measure employee engagement as well as four other key performance indicators of employee experience (Well-being, Inclusion, Experience Versus Expectations, and Intent to Stay). In 2022, about 44,000 of our employees responded to our annual engagement survey alone. Based on these surveys our employee engagement ratings exceed best-in-class engagement scores.
ITEM 1A. RISK FACTORSFACTORS
In addition to the other information presented in this Annual Report on Form 10-K, you should carefully consider the risks and uncertainties discussed in this section when evaluating our business. If any of these risks or uncertainties actually occur, our business, financial condition, and results of operations (including revenue, profitability and cash flows) could be materially and adversely affected, and the market price of our stock could decline.
RISK RELATED TO OUR BUSINESS OPERATIONS AND OUR STRATEGY
If we are unsuccessful in implementing our business strategy is not successful, our long-termbusiness and financial prospects couldwill be adversely affected
Our growth strategy is based on continuous diversification ofintegrating our business beyond contact center customer care outsourcing to an integrated customer experienceexpertise with our CXaaS platform that unites innovative and disruptive technologies, strategicCX consulting, data analytics, client growth solutions, and customer experience focused system design and integration. Theseintegration enabled through industry focused client relationships, scaled delivery footprint, CX partner ecosystem, and strategic M&A. Failure to successfully implement our business strategy and effectively respond to changes in market dynamics may impact our financial results of operations. Our investments in technologies and integrated solution development however, may not lead to increased revenue and profitability. If we are not successful in creating value from these investments, there could be a negative impact on our operating results and financial condition.
6
Our markets aremarket is highly competitive, and we mightmay not be able to compete effectively
The markets where we offer our services are highly competitive. Our future performance is largely dependent on our ability to compete successfully in markets we currently serve, while expanding into new, profitable markets. We compete with large multinational service providers;and offshore low-cost service providers from lower-cost jurisdictions that offer similar services, often at highly competitive prices and aggressive contract terms; niche solution providers that compete with us in specific geographic markets,geographies, industry segments or service areas; companies that utilize new, potentially disruptive technologies or delivery models, including artificial intelligence (AI) powered solutions; and in-house customer care and experience functions of large companies that use their own resources, rather than outsourcing the customer care and customer experience services we provide. Some ofcompanies.The recent consolidation trend in our competitors have greater financial or marketing resources than we do and, therefore, may be better able to compete.
Further, the continuing trend of consolidation among business process outsourcing competitors in various geographies where we have operations may resultindustry resulted in new competitors with greater scale aand broader footprint, better technologies,geographic footprint. They may have access to greater financial resources, have proprietary technology solutions, or price efficiencies that may be attractive to our clients. clients and impact our business.If we are unable to compete successfully and provide our clients with superior service and solutionsdifferentiated services at competitive prices, we could lose market share, and clients to competitors, which would materially adversely affect our business, financial condition, and results of operations.business.
Our results of operations and ability to grow could be materially affected ifIf we cannot adapt our service offerings to changes in technology and customermarket expectations, our ability to grow may be affected
Our growth and profitability will depend on our ability to develop and adopt new technologiessolutions that expand our existing service offerings by leveraging new technological trendstechnologies and cost efficiencies in our operations, while meeting rapidly evolving client expectations. As technology evolves, moresome tasks currently performed by our agentsassociates may be replaced by automation, robotics, artificial intelligence,AI, chatbots and other technological advances, which puts our lower-skill tier one customer care offerings at risk.technology solutions. These technology innovations could potentially reduce our business volumes and related revenues,revenue unless we are successful in adapting and deploying themthese technologies profitably. Specifically, some of the recently brought to market chatbot AI solutions have the potential of replacing some of our lower tier service offerings and, if we are unable to adopt and timely deploy this AI in our offerings, our results of operations will be impacted.
10
We may not be successful in anticipating or responding to our client expectations and interests in adopting evolving technology solutions, and their integration in our offerings may not achieve the intended enhancements or cost reductions. Services and technologies offered by our competitors may make our service offerings not competitive, or even obsolete, and may negatively impact our clients’ interest in our offerings.services. Our failure to innovate, maintain technological advantages, or respond effectively and timely to transformational changes in technology could have a material adverse effect on our business, financial condition, and results of operations.
The current trend to outsource customer care may not continue and the prices that clients are willing to pay for the services may diminish,Our business can be disproportionately adversely affecting our business
Our growth depends, in large part, on the willingnessimpacted by events outside of our clientscontrol, such as economic conditions, geopolitical tensions, and potential clientsoutbreaks of infectious diseases
If global economic conditions continue to outsource customer care and management services to companies like TTEC. There can be no assurance thatdeteriorate, the customer care outsourcing trend will continue; and our clients and potential clients may elect to perform in-house customer care and management services that they currently outsource. ReductionCompany could experience reduction in demand for our services and increased competitionpressure on revenue and profit margins. Our business volumes are impacted by consumer sentiment, and the current inflationary and recessionary pressures are impacting consumer demand for our clients’ products and services which can have direct impact on the demand for our offerings. The cost increases of our services due to growing labor costs and social pressures on our clients to utilize their own staff for services, instead of laying off employees, while outsourcing work, may cause clients to bring the previously outsourced services in-house.
Current geopolitical tensions could escalate, which could have unpredictable consequences on our business. For example, the Company’s business could be negatively affected by the escalation in the Russian-Ukrainian conflict, as it can impact our European operations and our European clients’ demand for our services; continuing tensions with China could impact our delivery centers in the Asian Pacific region and especially in the Philippines; while ongoing tensions between India and Pakistan can impact our operations in the Indian provinces near the Pakistani border. The natural disasters in locations where we have employees and operations, like the Philippines, Mexico, and the east, west and gulf coasts of the United States can also have significant negative impacts on our ability to deliver services and our reputation for stable service delivery. Finally, widespread outbreak of infectious diseases, like the COVID-19 pandemic, would impact our global operations, our delivery capabilities and our clients’ demand for services.
Our client services delivered by employees working from otherhome are now a standard and this change in the operating model may subject us to new untested risks
In connection with the COVID-19 pandemic, TTEC expanded its work from home delivery and transitioned employees to work remotely on what at the time we believed to be a temporary basis; most employees hired in 2020 through 2022 were hired to work from home. As the impacts of the pandemic receded in 2022, some employees returned to conventional delivery sites, but many will continue to work remotely as part of the evolution in our delivery model. Certain jurisdictions where we do business have regulations specific to work from home, which add complexity and cost to our service delivery. Some of the services we provide are subject to stringent regulatory requirements, and our inability to continuously observe how our associates deliver services, when working from home, may impact our compliance. Service delivery from home, in certain lines of our business, may also expose TTEC, our clients, and their customers to a heightened risk of fraud, because our ability to detect inappropriate behavior early could be impaired by remote service delivery.
Employees who work from home rely on residential communication and internet providers that may not be as resilient as commercial providers and in-housemay be more susceptible to service alternatives could create pricing pressuresinterruptions and excess capacitycyberattacks, which may also make TTEC information technology systems, when interfacing with these residential environments, vulnerable. Although we have continuously evolved our business continuity and disaster recovery plans and processes to focus beyond our delivery centers to include remote delivery, these plans and processes may not work effectively in a distributed remote delivery model, where weather impacts, internet access and power grid downtime may be difficult to manage and where system redundancies are not possible.
Over the years, TTEC established strong operational and administrative controls over our business that would have an adverse effectfocused on our business, financial condition,physical locations; and although these controls are evolving to reflect the facilities and remote delivery mix, they may not always provide effective safeguards for a large-scale work from home delivery model. We may not be effective in timely updating our existing controls nor implementing new controls, tailored to the work from home environment. For these and other reasons, our clients may be unwilling to continue to allow us to deliver our services remotely. If we are unable to manage our work from home environment effectively to
11
address these and other risks unique to remote service delivery, or if we cannot maintain client confidence in our work from home environment, our reputation and results of operations may be impacted.
Remote work for an extended period of time may impact TTEC culture and employee engagement with our company, which could affect productivity and our ability to retain employees critical to our operations.
Cyber-attacks, cyber-fraud,As impacts of the COVID-19 pandemic recede, some of our clients wish to return to more traditional service delivery models, while our employees, many of whom prefer the new remote work model, may be unwilling to return to our delivery centers. As our employees, our clients, and unauthorized information disclosure could harmthe economy transition to post COVID-19 realities, we may be unable to accurately predict the full impact on our reputation, cause liability, resultoperations, timely adjust our costs and service delivery patterns and that may impact our financial results of operations.
Inflation and changes in service outagesthe cost or availability of labor, energy, and losses, any of whichother operational necessities could adversely affect our business and results of operations
OurCompetition for labor in many jurisdictions where we do business involves the use, storage,is acute and transmission of information aboutwe have experienced increased labor costs as a result. Inflation is also causing material increases in our clients, customersother critical operating costs. Many of our clients,long-term contracts do not allow for escalation of fees, as our operating costs increase; and our employees. While we take reasonable measuresthose that do allow for escalations do not always provide for rate increases comparable to protect the security of and unauthorized access to our systems and the privacy of personal and proprietary informationcost increases that we access and store, our security controls over our systems may not prevent the improper access to or disclosure of this information. Such unauthorized access or disclosure could subject us to liability under relevant law or our contracts and could harm our reputation resulting in loss of revenue and loss of business opportunities.
7
In recent years, there have been an increasing number of high-profile security breaches at companies and government agencies, and security experts have warned about the growing risks of hackers and cyber criminals launching a broad range of attacks targeting information technology systems. Our business is dependent on information technology systems. Information security breaches, computer viruses, interruption or loss of business data, DDoS (distributed denial of service) attacks, and other cyber-attacks on any of these systems could disrupt the normal operations of our contact centers, our cloud platform offerings, and our enterprise services, impeding our ability to provide critical services to our clients.
We are experiencing an increasenow and likely to experience in frequency of cyber-fraud attempts, such as so-called “social engineering” attacksthe future. There is no assurance that we will be able to fully offset any cost increases through cost management or price increases, especially given the current highly competitive business process outsourcing and phishing scams, which typically seek unauthorized money transfers or information disclosure. We actively train our employees to recognize these attacks and have implemented proactive risk mitigation measures to curb them. There are no assurances, however, that these attacks, whichtechnology environments. Our clients are also growing in sophistication,experiencing economic pressures, and faced with cost increases from us, may take-over the delivery of the services we historically performed for them. If we are not deceiveable to increase our employees, resulting in a material loss.pricing or otherwise offset our increased costs while maintaining our market share, our operating results and profitability could be adversely affected.
While we have taken reasonable measures to protect our systems and processes from intrusion and cyber- fraud, we cannot be certain that advances in cyber-criminal capabilities, discovery of new system vulnerabilities, and attempts to exploit such vulnerabilities will not compromise or breach the technology protecting our systems and the information that we manage and control, which could result in damage to our systems, our reputation and our profitability.
Our need for consistent improvements in cybersecurity may force us to expend significant additional resources to respond to system disruptions and security breaches, including additional investments in repairing systems damaged by such attacks, reconfiguring and rerouting systems to reduce vulnerabilities, and resolving of legal claims that may arise from data breaches. A significant cyber security breach could materially harm our business, financial condition, and operating results.
A large portion of our revenue is generated from a limited number of clients and the loss of one or more of ourthese clients could adversely affect our business
We rely on strategic, long-term relationships with large, global companies in targeted industries and certain agencies of the United States and state and local governments.government agencies. As a result, we derive a substantial portion of our revenue from relatively few clients. Our five and ten largest clients, collectively, represented 37%35% and 50%47% of our revenue in 20192022, with no one client representing over 10%. of our revenue.
AlthoughWhile we have multiple engagements with all of our largest clients and all contracts are unlikely to terminate at the same time, the contracts with our five largest clients expire between 20202023 and 20232025; and there can be no assurance that these contracts will continue to be renewed at all or be renewed on favorable terms. While our on-goingongoing sales and marketing activities aim to add new commercial and public sector clients and new opportunities with existing and new commercial and government clients, there can be no assurancesassurance that such additional work can be secured noror that it would yield financial benefits comparable to expiring contracts. The loss of all or part of a major client’sclients’ business could have a material adverse effect on our business, financial condition, and results of operations, if the loss of revenue wasis not replaced with profitable business from other clients.
We serve clients in industries that have historically experienced a significant level of consolidation. If one of our clients is acquired (including by another of our clients) our business volumevolumes and revenue may materially decrease due to the termination or phase out of an existing client contract, volume discounts, or other contract concessions which could have an adverse effect on our business, financial condition, and results of operations.
We also serve client industries that rely extensivelyA large portion of our revenue in TTEC Digital business is generated from technology partners whose products’ reliability and risk allocation practices may adversely impact our business
A large portion of our TTEC Digital revenue is tied to our partnerships with providers of customer management technology solution. These partners designate us as their preferred system integrator, and implementation and maintenance partner, recommending us to their technology platform customers, and providing us with sales leads for services and technology resale opportunities. Our profitability, therefore, often depends on supply chain arrangementsthe health of these partnerships, and the effectiveness and stability of these third-party technology platforms, as well as on how these solutions are perceived by the market. Clients, who buy these third-party solutions and related services from the Company, hold us responsible for the stability and reliability of these platforms, as well as for any losses or damages arising from system outages and cyber security incidents, involving these third-party
12
solutions. Because we do not have control over the stability or the reliability of these technology solutions, we seek back-to-back indemnifications from the technology partners for liabilities we cannot control or mitigate. If our technology partners’ solutions lag in the People’s Republicinnovation, do not meet customer expectations in functionality, or have stability or reliability issues, our results of China and other parts of Asia.operations may be materially impacted. If these supply chain arrangements experience material disruptiontechnology partners are not willing to provide us with the indemnity coverage for any reason, including large scale virus epidemics, these clients’ needs forexposures that we cannot control or mitigate, or if they are not able or unwilling to honor their indemnification obligations, our servicesresults of operations may be impactedmaterially adversely impacted.
Our clients’ inability to accurately forecast demand and our businessinability to accurately forecast the level of effort or staffing levels, sites and remote delivery mix could impact our financial results of operations
Predicting customer demand, making timely staffing level decisions, predicting likely delivery centers and work from home delivery mix, making dynamic investments in our delivery centers and our work from home technologies are important to our successful execution and profitability maximization. We can provide no assurance that we will continue to be able to achieve or maintain desired delivery center capacity utilization and work from home delivery mix, because quarterly variations in client volumes, impacted by recessionary pressures, and revenues may materially decrease, which couldclient changing sentiment toward work from home delivery, can have ana material adverse effect on our delivery platform and our utilization rates. If our utilization rates are below expectations or if unexpected real estate demands exceed our capacity and we are unable to right size our real estate commitments quickly, our high-fixed costs of operation or our loss of business because we cannot support capacity may cause our financial condition,conditions and results of operations to be adversely affected.
In configuring our large-scale facilities, where employees work in close proximity to each other, we took into account the recent easing of social distancing rules and other pandemic related government mandates. If these regulations change unexpectedly, we will have to make rapid changes and make investments to adjust our facilities. If we are unable to adjust to these changes quickly and renegotiate our contracts to recoup these additional costs, manage these costs effectively, or adjust our cost structure to absorb them, our margins and profitability will be impacted and will result in adverse impact on our results of operations.
8
our services in our Digital business is contingent on our ability to accurately forecast the level of effort and cost necessary to deliver our services, which is data dependent and can be inaccurate. The errors in our level of effort estimations could yield lower profit margins or cause projects to become unprofitable, resulting in adverse impacts on our results of operations.
If we cannot recruit hire, train, and retain qualified employees to respond to client demands at the right price point, our business will be adversely affected
Our business is labor intensive and our ability to recruit and train employees with the right skills, at the right price point, and in the timeframe required by our client commitments is critical to achieving our growth objective. objectives. Demand for qualified personnel with multi-lingual capabilities and fluency in English may exceed supply. While we invest in employee retention, our industry is known for high employee turnover and we are continuously recruiting and training replacement staff.
We sign multi-year client contracts that are priced based on prevailing labor rates in jurisdictions where we deliver services. In the United States, however, our business is confronted with a patchwork of ever changingever-changing minimum wage, mandatory time off, paid medical leaves, and rest and meal break laws at the state and local levels. As these jurisdiction-specific laws change with little notice or grace period for transition, we often have no opportunity to adjust and change how we do business noror pass cost increases to our clients.
Prolonged unemployment during the COVID-19 pandemic provided potential TTEC employment prospects with an opportunity to consider alternatives such as self-employment, employment outside of the customer experience industry, or caused them to reconsider employment altogether. These frequentfundamental changes in the law and inconsistencies in laws across different jurisdictions in the United States, may result in higher costs, lower contract profitability, higher turnover and reduced operational efficiencies, which could, in the aggregate, have material adverse impact on our results of operations.
Demandmany labor markets critical for qualified personnel with multiple language capabilities and fluency in English may exceed supply. Employees with specific skills may also be required to keep pace with evolving technologies and client demands. While we invest in employee retention, we continue to experience high employee turnover and are continuously recruiting and training replacement staff. Our inability to attract and retain qualified personnel at costs acceptable under our contracts, our costs associated with attracting, training, and retaining employees, and the challenge of managing continuously changing and seasonal client demands could have a material adverse effect on our business financial condition, and results of operations.
Our delivery model involves geographic concentration exposingmakes it more difficult for us to significant operational risks
Our business model is dependent on our customer engagement centers and enterprise support functions being located in low cost jurisdictions around the globe. Our customer engagement delivery capacity and our back-office functions are concentrated in the United States, the Philippines, Mexico, India, and Bulgaria and our technology solutions centers are concentrated inhire a few locations in the United States, India and the UK. Our dependence on our customer engagement centers and enterprise support functions in the Philippines and Mexico, which is subjectsufficient number of employees to frequent severe weather, natural disasters, and occasional health and security threats, represents a particular risk. Natural disasters (floods, winds, and earthquakes), terrorist attacks, pandemics, large-scale utilities outages, telecommunication and transportation disruptions, labor or political unrest, and restriction on repatriation of funds at some of these locations may interrupt or limit our ability to operate or may increase our costs. Our business continuity and disaster recovery plans, while extensive, may not be effective, particularly if catastrophic events occur.
For these and other reasons, our geographic concentration could result in a material adverse effect on our business, financial condition and results of operations. Although we procure business interruption insurance to cover some of these exposures, adequate insurance may not be available on an ongoing basis for a reasonable price.
We routinely consider acquisitions, divestitures or other strategic transactions and may enter into such transactions at any time
We are engaged in a regular review of our strategic opportunities, including acquisitions, divestitures or other strategic transactions that we believe would provide value for our stockholders. We routinely have merger, acquisition, and divestiture opportunities in various stages of active review, and we also routinely engage consultants and advisors to assist us in analyzing opportunities. While at this time we are not actively engaged in negotiations regarding a material merger, acquisition or divestiture transaction, we could do so at any time. If such a transaction involves a sale of a part of the business, it would likely reduce the revenue and income of the remaining business and may impact the Company’s stock price. While we consider these transactions to improve our business and financial results over time, there can be no assurance that our goals will be realized.
Our strategy of growing through acquisitions may impact our business in unexpected ways
Our growth strategy involves acquisitions that help us expand our service offerings and diversify our existing geographic footprint. We continuously evaluate acquisition opportunities, but there are no assurances that we will be able to identify acquisition targets that complement our strategy and are available at valuation levels accretive to our business.
9
Even if we are successful in making acquisitions, the acquired businesses may subject our business to risks that may impact our results of operation; including:
|
|
|
|
|
|
|
|
|
|
|
|
|
|
|
|
Compliance with laws, including unexpected changes to such laws, could adversely affect our results of operations
Our business is subject to extensive regulation by the United States and foreign national, state and provincial authorities relating to confidential client and customer data, customer communications, telemarketing practices, and licensed healthcare and financial services activities, among other areas. Costs and complexity of compliance with existing and future regulations could adversely affect our profitability. If we fail to comply with regulations relevant to our business, we could be subject to civil or criminal liability, monetary damages and fines. Private lawsuits and enforcement actions by regulatory agencies could also materially increase our costs of operations and impact our ability to serve our clients.
As we provide services to clients’ customers residing in countries across the world, we are subject to numerous, and sometimes conflicting, legal regimes on matters as diverse as data privacy, import/export controls, communication content requirements, trade restrictions and sanctions, tariffs, taxation, labor regulations, wages and severance, health care requirements, internal and disclosure control obligations, and immigration. Violations of these laws and related regulations could impact our reputation and result in financial liability, criminal prosecution, unfavorable publicity, restrictions on our ability to process information, financial penalties, and breach ofdeliver our contractual commitments.
Adverse changes in lawscommitments or regulations that impact our business may negatively affect the sale of our services, slow the growth of our operations, or mandate changes to how we deliver our services, including our ability to use offshore resources. These changes could threaten our ability to continue to serve certain markets.
10
Uncertainty and inconsistency in privacy and data protection laws that impact our business and high cost of complianceaccept new work. Inflationary wage pressures, recently tempered with such laws may impact our ability to deliver services and our results of operations
During the last few years, there has been a significant increase in data protection and privacy regulations and enforcement activityrecessionary fears but still ongoing, in many jurisdictions where we and our clients do business. These new regulations are often complex and at times they impose conflicting requirements among different jurisdictions that we serve. For example, GDPR, adopted by the European Union in 2018, imposed new data protection requirements for controllers and processers of personally identifiable information collected in Europe, while the State of California in the United States imposed similar regulations effective 2020 with a different reach. Several other states in the United States are expectedhire may continue to adopt their own regulations in 2020. Failure to comply with all privacy and data protection laws that are relevant to different parts of our business may result in legal claims, significant fines, sanctions, or penalties, or may make it difficult for us to secure business or efficiently serve our clients. Compliance with these evolving regulations may require significant investment which would impact our results of operations.
Our cloud solutions are technology vendor dependent, which may impact our ability to grow our business and our results of operations
Our current cloud service solutions are primarily based on a single vendor technology. If this vendor does not continue to evolve the technology to stay competitive in the rapidly changing cloud computing services market, our financial results of operations could be materially impacted. There also can be no assurance that TTEC will be able to diversify its cloud service offerings quickly enough to offset any potential negative market trends for the cloud technology vendor that we are currently partnering with, and our inability to diversify may have impacts on our business and results of operations.
Our growth of operations and geographic footprint expansion could strain our resources and cause our business to suffer
We plan to continue growing our business through the growth of clients’ wallet share, increasing sales efforts, geographic expansion and strategic acquisitions, while maintaining tight controls on our expenses and overhead. Lean overhead functions combined with focused growth may place a strain on our management systems, infrastructure and resources, resulting in internal control failures, missed opportunities, and staff attrition which could impact our business and results of operations.
Our profitability could suffer if our cost-management strategies are unsuccessful
Our ability to improve or maintain our profitability is dependent on our ability to engage in continuous management of our costs. Our cost management strategies include optimizing the alignment between the demand for our services and our resource capacity, including our contact center utilization; the costs of service delivery; the cost of sales and general and administrative costs as a percentage of revenues; and the use of process automation for standard operating tasks. If we are not effective in managing our operating and administrative costs in response to changes in demand and pricing for our services, or if we are unable to absorb or pass on to our clients the increases in our costs of operations, our results of operations could be materially adversely affected.
Our financial results depend on our capacity utilization and our ability to forecast demand and make timely decisions about staffing levels, investments, and operating expenses
Our ability to meet our strategic growth and profitability objectives dependscontractual commitments on how effectively we manage our customer engagement center capacity against the fluctuating and seasonalmulti-year client demands. Predicting customer demand and making timely staffing level decisions, investments, and other operating expenditure commitments in each of our delivery center locations is key to our successful execution and profitability maximization. We can provide no assurancecontracts that we will continue to be able to achievedo not have wage escalation provisions or maintain desired delivery center capacity utilization, because quarterly variations in client volumes, many of which are outside our control, can have a material adverse effect on our utilization rates. If our utilization rates are below expectations, because of our high fixed costs of operation, our financial conditions and results of operations could be adversely affected.
may make such contracts not profitable.
1113
Our sales cycles for new client relationships and new lines of business with existing clients can be long, which results in a long lead time before we receive revenuesrevenue
We often face a long selling cycle to secure contracts with new clients or contracts for new lines of business with existing clients. When we are successful in securing a new client engagement, it is generally followed by a long implementation period when clients must give notice to incumbent service providers or transfer in-house operations to us. There may also be a long ramp up period before we commence our services, and for certainunder most of our contracts we receive no revenue until we start performing the work. Prolonged ramp-ups require investment that may not be recovered until future performance periods. If we are not successful in obtaining contractual commitmentswinning work after the initial prolonged sales cycle, or in maintaining the contractual relationship for a period of time necessary to offset new project investment costs and appropriate return on that investment, the investments may have a material adverse effect on our results of operations.
Contract terms typical in our industry can lead to volatility in our revenue and our margins
Our contracts do not have guaranteed revenue levels. Mostgrowth strategy includes the expansion of our contracts require clientsofferings to provide monthly forecasts of volumes, but no guaranteed or minimum volume levels. Such forecasts vary from month to month, which can impact our staff utilizations, our cost structure, and our profitability.
Many of our contracts have terminationpublic sector clients. The procurement process for convenience clauses with short notice periods, which could have a material adverse effect on our results of operation. Many of our contracts can be terminated for convenience and our contracts do not guarantee a minimum revenue level or profitability. If a client terminates a contract or materially reduces customer interaction volumes, this could have a material adverse effect on our results of operations and makes it harder to make projections.
We may not always offset increased costs with increased fees under long-term contracts. The pricing and other terms of our client contracts, particularly on our long-term contact center agreements, are based on estimates and assumptions we make at the time we enter into these contracts. These estimates reflect our best judgments regarding the nature of the engagement and our expected costs to provide the contracted services but these judgments could differ from actual results. Not all our contracts allow for escalation of fees as our cost of operations increase. Moreover, those that do allow for such escalations do not always allow increases at rates comparable to increases that we experience due to rising minimum wage costs and related payroll cost increases. If and to the extent we do not negotiate long-term contract terms that provide for fee adjustments to reflect increases in our cost of service delivery, our business, financial conditions, and results of operation could be materially impacted.
Our pricing depends on effectiveness of our level of effort forecasts. Pricing of our services in our technology and strategic consulting businessesgovernment entities is contingent on our ability to accurately forecast the level of effort and cost necessary to deliver our services, which is data dependent and can be inaccurate. The errors in level of effort estimations could yield lower profit margins or cause projects to become unprofitable, resulting in adverse impacts on our results of operations.
Increases in income tax rates, changes in income tax laws or disagreements with tax authorities could adversely affect our business, financial condition or results of operations
We are subject to income taxesoften more challenging than contracting in the United Statesprivate sector and in certain foreign jurisdictions in which we operate. Increases in income tax rates or other changes in income tax laws in any particular jurisdiction could reduceis different from our after-tax income from such jurisdictionsstandard Engage and could adversely affect ourDigital business financial condition or results of operations. Our operations outside the United States generate a significant portion of our incomepractices, including upfront investment to position for opportunities and many of the other countries in which we have significant operations, have recently made or are actively considering changesrespond to existing tax laws. For example, in December 2017, the Tax Cuts and Jobs Act (“2017 Tax Act”) was signed into law in the United States. While our accountingrequests for the recorded impact of the 2017 Tax Act is deemed to be complete, these amounts are based on prevailing regulations and currently available information, and any additional guidance issued by the Internal Revenue Service (“IRS”) could impact our recorded amounts in future periods.
Additional changes in the U.S. tax regime or in how U.S. multinational corporations are taxed on foreign earnings, including changes in how existing tax laws are interpreted or enforced, could adversely affect our business, financial condition or results of operations.
12
There are no assurances that we will be able to implement effective tax planning strategies that are necessary to optimize our tax position following changes in tax laws globally.proposal. If we are unable to implement a cost effective contracting structure,manage our effective tax ratepublic sector business development effectively and are not successful in winning and renewing that work, despite the investments we make, our public sector work can adversely impact our results of operations would be impacted.operations.
Our growth and geographic expansion could strain our resources and negatively impact our business
We face special risks associated withplan to continue growing our business outsidethrough the growth of the United States
An important component ofclients’ wallet share, increasing sales efforts, geographic expansion, and strategic acquisitions, while maintaining tight controls on our expenses and overhead. Lean overhead functions combined with significant growth targets may place a strain on our management systems, infrastructure, and resources, resulting in internal control failures, missed opportunities, and staff attrition. If we fail to manage our growth effectively, our business, strategy is service delivery outside of the United States and our continuing international expansion. During 2019, we derived approximately 40% of our revenue from operations outside of the United States. Conducting business abroad is subject to a variety of risks, including:
|
|
|
|
|
|
|
|
|
|
|
|
|
|
|
|
|
|
While we monitor and endeavor to mitigate in a timely manner the relevant regulatory, geopolitical, and other risks related to our operations outside of the United States, we cannot assess with certainty what impact such risks are likely to have over time on our business, and we can provide no assurance that we will always be able to mitigate these risks successfully and avoid adverse impact on our businessfinancial condition, and results of operations.operations could be adversely affected
Our profitability may be adversely affected if we are unable to expand and maintain our delivery centers in countriesinto locations with stable wage rates, and find new locations required by our clients
Our business is labor-intensive and therefore cost of wages, benefits, and related taxes constitute a large component of our operating expenses. As a result, expansion of our businessOur growth is, therefore, dependent upon our ability to maintain and expand our operations in cost-effective locations, in and outside of the United States. Most of our customer engagement centers are located in jurisdictions subject to minimum wage regulations, which may result in increased wages in the future, thus impacting our profitability.
13
Our clients often dictate locations from where they wish for us to locate the delivery centers that serve their customers, such as “near shore” jurisdictions located in close proximity to the United Statesclients’ U.S.-based headquarter locations, or in specific locations elsewhere inaround the world.globe. There is no assurance that we will be able to find and secure locations suitable for delivery centereffectively launch operations in jurisdictions which meet our cost-effectivenesscost, labor availability, and security standards. Our inability to expand our operations to such locations, however, may impact our ability to secure new clients and additional business from existing clients, and could adversely affect our growth and results of operations.
IncreasesOur profitability could suffer if our cost-management strategies are unsuccessful
Our ability to improve or maintain our profitability is dependent on our continuous management of our costs. Our cost management strategies include optimizing the alignment between the demand for our services and our resource capacity, including our delivery centers’ utilization; investment in our work from home environment; the costs of service delivery; the cost of communicationsales in general and dataadministrative costs as a percentage of revenues; offshoring of certain corporate functions; and the use of automation for standard tasks. Our ongoing cost management measures must be balanced against the need for investment to support our growth, technology transformation in our business, and increasing cybersecurity threats. The cost management measures are also being impacted by the inflationary pressures in the economies where we do business. If we are not effective in managing our operating and administrative costs in response to changes in demand and pricing for our services, or significant interruptions in such services could adversely affectif we manage our costs at the expense of investments necessary to grow and protect our business, or if we are unable to absorb or pass on to our clients the increases in our costs of operations, our results of operations could be materially adversely affected.
14
The current outsourcing trend may not continue and the prices that clients are willing to pay for the services may diminish, adversely affecting our business
Our business is significantly dependentgrowth depends, in large part, on telephone, internetthe willingness of clients to outsource customer care and data service provided by various domesticmanagement services to companies like TTEC. There can be no assurance that the customer care outsourcing trend will continue especially in current inflationary and foreign communication companies. Any disruption ofrecessionary climate; and clients may elect to perform these services in-house. Reduction in demand for our services and increased competition from other providers and in-house service alternatives could adversely affectcreate pricing pressures and excess capacity that would have an adverse effect on our business, financial condition, and results of operations.
We may not be able to leverage insurance to mitigate risks which would negatively impact our cashflow and result of operations
We maintain insurance coverage against various risks common for our industry, including claims against officers and directors for failure to meet their fiduciary duty in overseeing the management of the Company and resulting securities or derivative shareholder claims; employer liability risks; fiduciary duty claims related to TTEC’s management of our employee benefit plans; losses from crime and fraud; errors and omissions exposures; cyber security related losses; losses related to property damage; business interruption exposures; workers compensation claims; surety bonds; and general liability claims inherent in the running of our business. We believe these insurance programs are an effective way to protect our assets against liability risks and some of these programs are also required by our clients, as a condition of doing business with us. Our access to the necessary insurance coverage can be impacted, however, by availability of insurance and reinsurance capacity in the marketplace, insurers willingness to insure TTEC’s risks (especially our property damage exposure in high risk locations, cyber risks, and related business interruption coverage) at an affordable price point. Further, our insurance carriers have taken stepsin the past sought or may in the future seek to mitigatedeny coverage for pending claims. If we cannot secure sufficient and affordable insurance coverage, or if the insurance companies are successful in denying coverage under existing policies, our exposure to service disruptions by investing in complexcashflow and multi-layered redundancies,results of operations may be impacted, and we may also be unable to serve those of our clients who require insurance as a condition of doing business with us.
We routinely consider strategic mergers, acquisitions and business combination transactions and may enter into such transactions any time; and such transactions may negatively impact our business and create unanticipated risks
We continuously analyze strategic opportunities that we believe could provide value for our stockholders, and have acquisitions, divestitures, and potential business combinations in various stages of active review. There can transition services amongbe no assurances, however, that we will be able to identify strategic transaction opportunities that complement our different customer engagement centers around the world. Despitestrategy and are available at valuation levels accretive to our business. Even if we are successful in identifying and executing these efforts,transactions, they may subject our business to risks that could impact our results of operation, including:
| • | Inability to integrate acquired companies effectively and realize anticipated acquisition benefits; |
| • | Diversion of management’s attention to the integration of the acquired businesses at the expense of delivering results for the legacy business; |
| • | Inability to appropriately scale critical resources to support the business of the expanded enterprise; |
| • | Inability to retain key employees of the acquired businesses and/or inability of such key employees to be effective as part of TTEC operations; |
| • | Impact of liabilities, compliance failures, or ethical issues of the acquired businesses undiscovered or underestimated as part of the acquisition due diligence; |
15
| • | Failure to realize anticipated growth opportunities from a combined business, because existing and potential clients may be unwilling to consolidate business with a single service provider or to stay with the acquirer post acquisition; |
| • | Impacts of cash on hand and debt incurred to finance acquisitions, thus reducing liquidity for other significant strategic objectives; |
| • | Inadequate or ineffective internal controls, disclosure controls, corruption prevention policies, human resources and other key policies and practices of the acquired companies; and |
| • | Reduced revenue and income and resultant stock price impact due to divestiture transactions. |
While we consider these transactions to improve our business, financial results, and shareholder value over time, there can be no assurance that the redundancies we have in place wouldour goals will be sufficient to maintain operations without disruption.realized.
Our inability to obtain communication and data services at favorable rates could negatively affect our results of operations. Where possible, we have entered into long-term contracts with various providers to mitigate short term rate increases and fluctuations. There is no obligation, however, for the vendors to renew their contracts with us, or to offer the same or lower rates in the future, and such contracts may be subject to termination or modification for various reasons outside of our control. A significant increase in the cost of communication services that is not recoverable through an increase in the price of our services could adversely affect our business.
Defects or errors in software utilized in our service offerings could adversely affect our business
The third-party software and systems that we use to conduct our business and serve our clients are highly complex and may, from time to time, contain design defects, coding errors or other software errors that may be difficult to detect or correct, and which are outside of our control. Although our commercial agreements contain provisions designed to limit our exposure to potential claims and liabilities, these provisions may not always effectively protect us against claims in all jurisdictions. As a result, problems with software and systems that we use may result in damages to our clients for which we are held responsible, causing damage to our reputation, adversely affecting our business, our results of operations and financial condition.
If the transfer pricing arrangements we have among our subsidiaries are determined to be inappropriate, our tax liability may increase
We have transfer pricing arrangements among our subsidiaries in relation to various aspects of our business, including operations, marketing, sales, and delivery functions. The United States, Australia, Mexico, Philippines and other transfer pricing regulations in other countries where we operate, require that cross-border transactions between affiliates be on arm’s-length terms. We carefully consider the pricing among our subsidiaries to assure that they are at arm’s-length. If tax authorities were to determine that the transfer prices and terms we have applied are not appropriate, we may incur increased tax liability, including accrued interest and penalties, which would cause material increase in our tax liability, thereby impacting our profitability and cash flows, and potentially resulting in a material adverse effect on our operations, effective tax rate and financial condition.
14
We have incurred and may in the future incur impairments to goodwill, long-lived assets or strategic investments
As a result of past acquisitions, as of December 31, 2019,2022, we have approximately $301.7$807.8 million of goodwill and $115.6$233.9 million of intangible assets included on our Consolidated Balance Sheet. We review our goodwill and intangible assets for impairment at least once annually, and more often when events or changes in circumstances indicate the carrying value may not be recoverable. We perform an assessment of qualitative and quantitative factors to determine whether the existence of events or circumstances leadslead to a determination that it is more likely than not that the fair value of the goodwill or intangible asset is less than its carrying amount. In the event that the book value of goodwill or intangible asset is impaired, such impairment would be charged to earnings in the period when such impairment is determined. We have recorded goodwill and intangible impairments in the past, and there can be no assurance that we will not incur impairment charges in the future that could have material adverse effects on our financial condition or results of operations.
RISKS RELATED TO OUR TECHNOLOGY
A disruption to the Company’s information technology systems could adversely affect our business and reputation
Our business relies extensively on cloud and on-premises technology platforms and third-party software solutions to serve our clients and to conduct our business. These information technology systems are complex and may, from time to time, get damaged or be subject to performance interruptions from power outages, telecommunications failures, computer viruses and malicious attacks, cybersecurity breaches, or catastrophic events. They may also have design defects, configuration or coding errors, and other vulnerabilities that may be difficult to detect or correct, and which may be outside of our control. If the Company’s information technology systems fail to function properly, the Company could incur substantial repair, recovery or replacement costs and experience data loss, all or any of which could result in material impediments to our ability to conduct business and would damage the market’s perception of the reliability and stability of the Company and its service offerings.
In addition, an information system disruption could result in TTEC failing to meet our contractual performance standards and obligations, which could subject the Company to liability, penalties and contract termination. Our agreements with third-party technology and software providers often have limitations of liability that do not fully protect us against liability to our clients that we may incur due to the technology failures. Any of these events or combination of several may adversely affect our reputation and financial results.
Cyberattacks, cyber fraud, or unauthorized data access could harm us or our clients and result in liability, which could adversely affect our business and results of operations
Cyberattacks. Our business involves the use, storage, and transmission of clients’, their customers’, and our employees’ information. We also monitor and support information technology systems for certain clients through cloud-based and on-client-premises managed services model. While we believe that we take reasonable security measures to prevent the unauthorized access to our information technology systems and to our clients’ systems, and to protect the privacy of personal and proprietary information that we access and store, our security controls over our systems have not prevented in the past and may not prevent in the future improper
16
access to these systems or unauthorized disclosure of this information. Such unauthorized access or disclosure could subject, and in the past has subjected, TTEC to significant liability under relevant laws, our contracts, and our licenses to perform certain regulated services; and could harm our reputation, resulting in material impacts to our operations, loss of future revenue and business opportunities. These risks may further increase as our business model now relies on a higher percentage of work delivered from home, in addition to our traditional delivery center model. The risks may also increase, as we expand geographically into new locations, where cyber security is difficult to assure.
In recent years, there have been an increasing number of high-profile security breaches at companies and government agencies, when hackers, cyber criminals and state actors launch a broad range of ransomware, data exfiltration, and other cyberattacks targeting information technology systems. Information security breaches, computer viruses, service interruption, loss of business data, DDoS (distributed denial of service) attacks, ransomware and other cyberattacks on any of our systems or on our clients’ systems, through our channels, have and in the future could disrupt our normal operations, our cloud platform digital offerings, our clients’ on-premise managed service offerings, and our corporate functions, impeding our ability to provide critical services to our clients and financial reporting of our results of operations. Techniques used by cyber criminals to obtain unauthorized access, disable or degrade services, or sabotage systems evolve frequently and may not immediately be detected, and we may be unable to implement adequate preventative measures.
For example, in 2021, TTEC experienced two significant cybersecurity incidents. One involved a global supply chain compromise that impacted thousands of companies worldwide, including a TTEC Digital subsidiary and its managed services clients. Another involved a ransomware attack that temporarily disrupted the TTEC Engage business. Although neither of these incidents resulted in material impact on our results of operations in 2021, there can be no assurances that future cyber security incidents, which are unavoidable, would not have material impact on our results of operations. Following these cyber security incidents, TTEC has made and continues to make significant investments to enhance our information technology environment (see Part II, Item 7. Management's Discussion and Analysis of Financial Condition and Results of Operations for additional information regarding the impact of the 2021 security incidents and resulting technology investments on results of operations in 2022), but there can be no assurances that investments made to date and the investments planned to be made in the future would be sufficient to prevent future cyber security incidents.
Cybersecurity events may have cascading effects that unfold over time and result in additional costs, including costs associated with investigations, government enforcement actions, regulatory investigations, fines and penalties, contractual claims, performance penalties, litigation, financial judgement or settlements in excess of insurance, disputes with insurance carriers concerning coverage and the availability of cyber insurance in the future, loss of clients’ trust, future business cancelations and other losses. Any client perceptions that our systems or the information system environments that we support for our clients are not secure could result in a material loss of business and revenue and could damage our reputation and competitiveness.
Cyber fraud. As others, we are experiencing an increase in frequency of cyber fraud attempts, including phishing attempts, and so-called “social engineering” attacks, which typically seek unauthorized access into the environment, money transfers or unauthorized information disclosure. We train our employees to recognize these attacks and have implemented proactive risk mitigation measures to curb them. There are no assurances, however, that these attacks, which are growing in sophistication and frequency, would not deceive our employees, resulting in a material loss and impacts to our operations and corporate functions.
While we believe we have taken reasonable measures to protect our systems and processes from unauthorized intrusions and cyber fraud, we cannot be certain that advances in cybercriminal capabilities, discovery of new system vulnerabilities, and attempts to exploit such vulnerabilities will not compromise or breach the technologies protecting our systems and the information that we manage and control, which could result in damage to our systems, our reputation, and our profitability.
Significant interruptions in communication and data services provided to us by third-party vendors could adversely impact our business
Our business is dependent on internet, data, and telephone services provided by various domestic and foreign third-party communication companies. Any disruption of these services could adversely affect our business. We have taken steps to mitigate our exposure to service disruptions by investing in multi-layered redundancies,
17
which have been historically focused on our delivery centers, and we can transition service delivery among our different delivery centers around the world. Despite these risk mitigation processes, and especially in light of the transition of a large portion of our delivery to a work from home environment where conventional redundancies strategies are ineffective, there can be no assurance that the redundancies we have in place would be sufficient to maintain operations without disruption.
Inability to effectively adopt AI into our offerings, could materially impact our ability to compete
We are integrating AI into our solutions and it is likely to be an important part of our future service offerings. While AI offers significant benefits, it also presents risks and challenges to our business. Some of the recently brought to market third-party AI solutions have the potential of replacing some of our lower tier service offerings which puts pressure on the ‘speed to market’ for our efforts. At the same time, AI solutions are evolving and are not infallible, and issues with data sourcing, technology integration, program bias into decision-making algorithms, security challenges and the protection of personal information and privacy could impair our successful and timely adoption. If our AI solutions are deployed before they are perfected and the output from our AI solutions is deemed by clients to be inaccurate or questionable, our brand and reputation may be harmed and our results of operations may be impacted. On the other hand, if we are too slow to market and are unable to timely and effectively deploy AI in our offerings, we would fall behind our competitors and our results of operations and future prospects may also be impacted.
RISKS RELATED TO OUR CONTRACTING PRACTICES, LEGAL AND REGULATORY MATTERS
Our financial results may be impacted by changes in laws/regulations and our failure to comply with laws/regulations relevant to our business
Our business is subject to extensive, and at times conflicting, regulations by the United States federal, state, local, foreign national, and provincial authorities relating to confidential client and customer data, data privacy, customer communications, and telemarketing practices; licensed healthcare, financial services, collections, insurance, and gaming/gambling support activities; trade restrictions and sanctions, tariffs, import/export controls; taxation; labor regulations, healthcare and wellness rules, wages, breaks and severance regulations; health and safety regulations; disclosure obligations; and immigration laws, among other areas.
As we provide services to clients’ customers residing in countries where we do not have operations on the ground or if we use telecommunication channels and airways in countries where we do not have physical presence, we may also be subject to laws and regulations of these countries. Costs and complexity of compliance with existing and future regulations that could apply to our business may adversely affect our profitability; and if we fail to comply with these mandates, we could be subject to contractual, civil and criminal liability, monetary damages and fines. Enforcement actions by regulatory agencies could also materially increase our costs of operations and impact our ability to serve our clients.
Adverse changes in laws or regulations that impact our business may negatively affect the sale of our services, slow the growth of our operations, or mandate changes to how we deliver our services, including our ability to use and how we use offshore resources. These changes could threaten our ability to continue to serve certain markets.
Uncertainty and inconsistency in privacy and data protection laws relevant to our business, failure to comply with contractual obligations related to data privacy, and high cost of compliance may impact our ability to deliver services and our results of operations
During the last several years, there has been a significant increase in data protection and privacy regulations and enforcement activity in many jurisdictions where we and our clients do business. These regulations are often complex and at times they impose conflicting requirements among different jurisdictions that we serve. For example, the European Union’s General Data Protection Regulation (GDPR) imposes data protection requirements for controllers and processers of personally identifiable information collected in Europe, while the California Consumer Privacy Protection Act (CCPA), and other similar acts in other states imposed similar regulations protecting state residents with a different reach. We are also subject to the terms of our privacy policies and client contractual obligations related to privacy, data protection, and information security. Additionally, there is an increased focus on automated processing and services delivered with the use of AI that may lead to increased regulatory restrictions that could have an impact on our business.
18
The scope of these laws, regulations and policies is subject to differing interpretations, and may be inconsistent among, or conflict with other laws and regulations. The regulatory framework for privacy and data protection worldwide is, and is likely to remain for the foreseeable future, uncertain and complex, and it is possible that these varied obligations may be interpreted and applied in a manner that currently we do not anticipate or that they are inconsistent from one jurisdiction to another and may conflict with other rules or our practices.
Well publicized security breaches have led to enhanced government and regulatory scrutiny of the measures being taken by companies to protect against cyberattacks and resulted in heightened cybersecurity requirements, including additional regulatory expectations for licensed service providers, and the oversight of vendors activities. Unauthorized disclosure of sensitive or confidential client, their customers’, and our employees’ data, whether through breach of our systems or otherwise, has exposed us in the past and could expose us in the future to costly litigation, regulatory enforcement, and could cause us to lose clients.
For example, the New York Department of Financial Services that regulates some of our licensed activity issues their own cyber security mandates, in addition to those issued by the state of New York; while the U.S. federal government may impose new federal data privacy and regulation mandates which would overlap with and may supersede certain state requirements. Failure to comply with all privacy and data protection laws that are relevant to different parts of our business have resulted in, and may result in additional legal claims, significant fines, sanctions, or penalties, and loss of licenses; and may make it difficult for us to secure business or efficiently serve our clients. Compliance with these evolving regulations requires significant investment which impacts our financial results of operations.
Wage and hour class action lawsuits can expose us to costly litigation and damage our reputation
The customer care business process outsourcing industry in the United States is a target of plaintiffs’ law firms that specialize in wage and hour class action lawsuits against large employers by soliciting potential plaintiffs (current and former employees) with billboard and social media advertising. The plaintiffs’ law firms seek large settlements based entirely on the number of potential plaintiffs in a class, whether or not there is any basis for the claims that they make on behalf of their clients, most of whom do not believe themselves to be aggrieved nor seek recourse until solicited. The cost of defending litigation for these large class action lawsuits has been and will continue to be significant. Because TTEC hires large numbers of employees in the United States and our industry has large turnover, the potential size of plaintiffs’ classes in these wage and hour lawsuits can be considerable, creating a material impact on the cost of operations. As we continue to hire more employees in the United States, and expand our operations to California, where the number of wage and hour class action lawsuits is larger than in many other states combined and where verdicts in these lawsuits are very large, our results of operations may be material impacted by these lawsuits.
Contract terms typical in our industry can lead to volatility in our revenue and in our margins
Many of our TTEC Engage contracts require clients to provide monthly forecasts of volumes, but no guaranteed or minimum volume or revenue levels. Such forecasts vary from month to month, which can impact our staff and space utilizations, our cost structure, and our profitability.
Many of our contracts have termination for convenience clauses with short notice periods and no guarantees of minimum revenue levels or profitability, which could have a material adverse effect on our results of operation. If a client terminates a contract or materially reduces customer interaction volumes, it could have a material adverse effect on our results of operations and makes it harder to make projections.
We may not always offset increased costs with increased fees under long-term contracts. The pricing and other terms of our client contracts, particularly on our long-term service agreements, are based on estimates and assumptions we make at contract inception. These estimates reflect our best judgment, at the time, regarding the nature of the engagement and our expected costs to provide the contracted services, but these judgments could differ from actual results, especially with conflicting inflationary and recessionary pressures.
19
Not all our contracts allow for escalation of fees as our cost of operations increase. Moreover, those that do allow for such escalations do not always allow increases at rates comparable to the increases that we experience due to rising minimum wage costs, related payroll cost increases, increased costs of work from home environment not offset by reduction in physical footprint due to long term lease commitments, and the increasing costs of evolving regulatory requirements. If and to the extent we do not negotiate long-term contract terms that provide for fee adjustments to reflect increases in our cost of service delivery, our business, financial conditions, and results of operation could be materially impacted.
We provide service level commitments to certain customers. If we do not meet these contractual commitments, we could be subject to credits, refunds or contract terminations, which could adversely affect our revenue and harm our reputation.
The growing trend of clients seeking to transfer cybersecurity and data risks to service providers could significantly impact our operations and profitability
As cybersecurity incidents and data breaches are becoming more common and often impossible to avoid, clients are looking to their service providers to cover their cost of these incidents. Many of the services we provide are performed in the clients’ and not in TTEC information technology environments and security incidents that clients experience may have many causes and many contributory factors, most of which are unrelated to TTEC’s activities or situations that we cannot control. Yet, clients are increasingly seeking for service providers like TTEC to accept full liability for incidents that we did not cause but which our errors or omissions may have contributed to, in part. Potential liability and related cost is often unpredictable, cannot be easily quantified or priced, and cannot always be insured. If we are unable to negotiate reasonable contractual terms with our clients where liabilities for our services are reasonably allocated to events we can impact, control or mitigate, we may have to decline business opportunities or incur significant liability that would have impact on our results of operations.
Intellectual property infringement by us and by others may adversely impact our ability to innovate and compete
From time to time, we and members of our supply chain receive assertions that our service offerings or technologies infringe on the patents or other intellectual property rights of third parties. While to date we have been successful in defending such claims and many of these claims are without basis, the claims could require us to cease activities, incur expensive licensing costs, or engage in costly litigation, which could adversely affect our business and results of operations.
Our intellectual property may not always receive favorable treatment from the United States Patent and Trademark Office, the European Patent Office, or similar foreign intellectual property adjudication and registration agencies; and our “patent pending” intellectual property may not receive a patent or may be subject to prior art limitations. Our trademarks may be challenged, and have been challenged, by others with similar marks.
The lack of an effective legal system in certain countries where we do business or lack of commitment to protection of intellectual property rights, may prevent us from being able to defend our intellectual property and related technology against infringement by others, leading to a material adverse effect on our business, results of operations and financial condition.
As our reliance on technology for services that we provide increases, so is the risk of infringement or claims of infringement of intellectual property rights of others. If we are not successful in defending against such claims, our results of operations may be impacted.
Our inability to timely secure licensing required to perform services may significantly impact our results of operations
Some of the services we provide for our healthcare, financial services, gaming and other highly regulated clients require for some of our legal entities, directors and officers of these entities, and employees who perform the services to be licensed by authorities that oversee these regulated activities. These licensing requirements vary among jurisdictions where we provide services; and the ongoing compliance requirements to maintain and renew these licenses also varies among regulators and change often. Our ability to maintain these licenses and to comply with various evolving regulations that underpin the licensing requirements depends on many factors, not all of which we control; and the cost of this compliance can be significant. Failure to comply with all regulations in one jurisdiction may impact our licensing status with regulators in other jurisdictions. TTEC’s and our directors’, officers’, and employees’ ability to secure and maintain these licenses and to do so timely cannot always be assured, and depends on many factors some of which we cannot control. While we have been able to stay current with most known licensing requirements, there can be no assurance that we will be able to continue to do so in the future. If we are unable to maintain these licenses, if we fail to monitor the evolving
20
regulations in all the jurisdictions where we deliver services, or if we are unable to meet the regulatory requirements, we may lose significant business opportunities or breach ongoing contractual obligations, which would have material advice impact on our results of operations.
Increases in income tax rates, changes in income tax laws or disagreements with tax authorities could adversely affect our business
We are subject to income taxes in the United States and in certain foreign jurisdictions where we operate or where clients benefit from our services. Increases in income tax rates or other changes in income tax laws could reduce our after-tax income from the relevant jurisdictions and could adversely affect our business, financial condition or results of operations. Our operations outside the United States generate a significant portion of our income and many of the other countries where we have significant operations, have recently made or are actively considering changes to existing tax laws that could significantly impact how U.S. multinational corporations are taxed on foreign earnings.
The Biden administration and many European governments have called for changes to fiscal and tax policies, which may include comprehensive tax reform. Many of these proposed changes to the taxation of our activities, if enacted, could increase our effective tax rate or adversely affect our business, financial condition, or results of operations.
There are no assurances that we will be able to implement effective tax planning strategies that are necessary to optimize our tax position following changes in tax laws globally. If we are unable to implement a cost-effective contracting structure and other changes in how we do business to mitigate these changes, our effective tax rate and our results of operations would be impacted.
Our ability to use our net operating losses or federal tax credits to offset future taxable income may be subject to certain limitations.
If our transfer pricing arrangements are ineffective, our tax liability may increase
Transfer pricing regulations in the United States, Australia, India, Mexico, the Netherlands, the Philippines, and other countries where we operate, require that cross-border transactions between affiliates be on arm’s-length terms. We carefully consider pricing for operations delivery, marketing, sales, and other services among our domestic and foreign subsidiaries to assure that they are at arm’s-length. If tax authorities determine that the transfer prices and terms that we have applied are not appropriate, our tax liability may increase, including accrued interest and penalties, thereby impacting our profitability and cash flows, and potentially resulting in a material adverse effect to our operations, effective tax rate and financial condition.
RISKS RELATED TO OUR INTERNATIONAL OPERATIONS
We face special risks associated with international operations
An important component of our business strategy is service delivery outside of the United States and our continuing international expansion. During 2022, we derived approximately 32% of our revenue from operations outside of the United States. Conducting business abroad is subject to a variety of risks, including:
| • | inconsistent regulations, licensing requirements, prescriptive labor rule, corrupt business practices, restrictive export control and immigration laws, which may result in inadvertent violation of laws that we may not be able to immediately detect or correct; and may increase our cost of operations as we endeavor to comply with laws that differ from one country to another; |
| • | uncertainty of tax regulations in countries where we do business may affect our costs of operation; |
| • | longer payment cycles, especially during economic downturn, could impact our cash flows and results of operations; |
21
| • | political and economic instability and unexpected changes in regulatory regimes could adversely affect our ability to deliver services overseas and our ability to repatriate cash. For example, in 2022, Russian forces launched a significant military action against Ukraine, which has resulted in conflict and disruptions in the region and drew other countries (the U.S., the UK, Germany, Poland, Iran, and China), indirectly, into taking sides and supplying logistical assistance and arms. It also caused Russia to take certain retaliatory actions against the European Union in restricting its access to Russian energy. These geopolitical alignments create instability in regions where we do business. Although we do not believe that, to date, these events had material impact on our business, financial position or operations, if any of these, or any other factors, disrupt a country or region where we have significant operations (in particular the U.S., India, Bulgaria, Poland, or the Philippines), clients or vendors, our business could be materially adversely affected. |
| • | currency exchange rate fluctuations and restrictions on currency movement or negative tax consequences triggered by such movement could adversely affect our results of operations, if we are forced to maintain assets in currencies other than U.S. dollars, while our financial results are reported in U.S. dollars; and if we are forced to maintain assets in currencies other than those that we use for payment of our operating expenses; |
| • | infrastructure challenges and lack of sophisticated disaster and pandemic preparedness in some countries where we do business may impact our service delivery; and |
| • | terrorist attacks or civil unrest in some of the regions where we do business, and the resulting need for enhanced security measures may impact our ability to deliver services, threaten the safety of our employees, and increase our costs of operations. |
While we monitor and endeavor to mitigate in a timely manner the relevant regulatory, geopolitical, and other risks related to our operations outside of the United States, we cannot assess with certainty what impact such risks are likely to have over time on our business, and we can provide no assurance that we will always be able to mitigate these risks successfully and avoid adverse impact on our business and results of operations.
Our delivery model involves geographic concentration outside of the United States exposing us to significant operational risks
Our delivery centers and our corporate functions, outside of the United States, are concentrated in the Philippines, Mexico, India, and Bulgaria. Our business model is dependent on our ability to locate at least some of our delivery and corporate functions in low-cost jurisdictions around the globe. Our dependence on our delivery centers and corporate support functions in areas subject to frequent severe weather, natural disasters, health and security threats, and arbitrary government actions represents a particular risk. Natural disasters (floods, winds, and earthquakes), terrorist attacks, pandemics, large-scale utilities outages, telecommunication and transportation disruptions, labor or political unrest, and restriction on repatriation of funds at some of the locations where we do business may interrupt or limit our ability to operate or may increase our costs. Our business continuity and disaster recovery plans, while extensive, may not be effective, particularly if catastrophic events occur; and business interruption insurance that we procure to address some of these risks may not be always available or may not be affordable.
For these and other reasons, our geographic concentration in locations outside of the United States could result in a material adverse effect on our business, financial condition and results of operations.
We may face new risks as we expand into countries where we have no prior experience
Our clients sometimes ask us to establish new operations, quickly, in countries where we previously have not done business. New market entry is fraught with operational, security, regulatory compliance, safety, and corruption risks, and these risks are exacerbated when new operations are launched quickly. TTEC has experience in new market entry around the globe, but there can be no assurance that new operations in new countries would not result in financial losses and operational instability. If we elect not to follow our clients to markets where they wish to have services, we may lose lucrative contracts, including contracts in multiple jurisdictions where we have experience, or to competitors who are already established in the markets new to us, which would impact our financial results of operations.
22
Our financial results may be adversely impacted by foreign currency exchange rate risk
Many contracts that we service from customer engagement centers or employees working from home based outside of the United States are typically priced, invoiced, and paid in U.S. and Australian dollars, the British poundpounds, or Euros, while the costs incurred to deliver thethese services and operate are incurred in the functional currencies of the applicable operating subsidiary.country of operations. The fluctuations between the currencies of the contract and operating currencies present foreign currency exchange risks. Furthermore, because our financial statements are denominated in U.S. dollars, but approximately 21%14% of our revenue is derived from contracts denominated in other currencies, our results of operations could be adversely affected if the U.S. dollar strengthens significantly against foreign currencies.
While we hedge at various levels against the effect of exchange rate fluctuations, we can provide no assurance that we will be able to continue to successfully manage this foreign currency exchange risk and avoid adverse impacts on our business, financial condition, and results of operations.
Legislation discouraging offshoring of service by United States companies or making such offshoring difficult could significantly affect our businessRISKS RELATED TO OWNERSHIP OF OUR COMMON STOCK
A perceived association between offshore service providers and the loss of jobs in the United States has been a focus of political debate in recent years. As a result, current and prospective clients may be reluctant to hire offshore service providers like TTEC to avoid negative perceptions and regulatory scrutiny. If they seek customer care and management capacity onshore that was previously available to them through outsourcers outside of the United States, they may elect to perform these services in-house instead of outsourcing the services onshore. Possible tax incentives for United States businesses to return offshored, including outsourced and offshored, services to the United States could also impact our clients’ continuing interest in using our services.
15
Legislation aimed to expand protections for United States based customers from having their personal data accessible outside of the United States could also impact offshore outsourcing opportunities by requiring notice and consent as a condition for sharing personal identifiable information with service providers based outside of the United States. Any material changes in current trends among United States based clients to use services outsourced and delivered offshore would materially impact our business and results of operations.
Health epidemics could disrupt our business and adversely affect our financial results
Our customer engagement centers typically seat hundreds of employees in one location. Accordingly, an outbreak of a contagious infection in one or more of the locations in which we do business may result in significant worker absenteeism, lower capacity utilization rates, voluntary or mandatory closure of our customer engagement centers, transportation restrictions that could make it difficult for our employees to commute to work, travel restrictions on our employees, and other disruptions to our business. Any prolonged or widespread health epidemic could severely disrupt our business operations and have a material adverse effect on our business, its financial condition and results of operations.
Our bylaws designate Delaware courts as the exclusiveExclusive forum for most disputes withdispute resolution in our stockholders, whichbylaws could limit our stockholders’ ability to obtain a favorable judicial forum for their disputes.disputes
Our bylaws designate Delaware’s state courts as the exclusive forum for most disputes between us and our stockholders, including U.S. federal claims and derivative actions. We believe that this provision may benefit us by providing increased consistency in the application of Delaware law and federal securities laws by chancellors and judges who are particularly experienced in resolving corporate disputes, efficient administration of cases relative to other forums, and protection against the burdens of multi-forum litigation. This choice of forum provision does not have the effect of causing our stockholders to waive our obligation to comply with the federal securities laws.
This bylaw forum selection provision is not uncommon for companies incorporated in the State of Delaware, but it could limit our stockholders’ ability to select a more favorable judicial forum for disputes with us, our directors, officers or other employees and may therefore discourage litigation. It is important to note, however, that our choice of forum provision would (i) not be enforceable with respect to any suits brought to enforce any liability or duty created by the Securities Exchange Act of 1934, as amended, and (ii) have uncertain enforceability with respect to claims under the Securities Act of 1933, as amended.
Delaware law and certain provisions in our restated certificate of incorporation and amended and restated bylaws might discourage, delay or prevent a change of control of our companyCompany or changes in our management and, therefore, depress the price of our common stock
Our restated certificate of incorporation and amended and restated bylaws contain provisions that could depress the market price of our common stock by acting to discourage, delay or prevent a change in control of our companyCompany or changes in our management that the stockholders of our companyCompany may deem advantageous. These provisions, among other things:
| authorize the issuance of "blank check" preferred stock that our board of directors could use to implement a stockholder rights plan; |
| provide that special meetings of our stockholders may be called only by our Chairman, TTEC President or our board of directors; |
| establish advance notice requirements for nominations for election to our board of directors or for proposing matters that can be acted upon by stockholders at annual stockholder meetings; |
| permit the board of directors to establish the number of |
| provide that the board of directors is expressly authorized to make, alter or repeal our amended and restated bylaws. |
16
In addition, Section 203 of the Delaware General Corporation Law may discourage, delay or prevent a change in control of our company. Section 203 imposes certain restrictions on mergers, business combinations and other transactions between us and holders of 15% or more of our common stock. Further, as described below,
23
Our inability to meet our clients’ or investors’ expectations for our environmental, social and governance (ESG) practices may impact our reputation and stock value
Our current and prospective clients and investors, our employees and other stakeholders are increasingly focused on our corporate environmental, social and governance (ESG) practices. Some of the regulators specific to industries we serve and to our public company status are also in the process of establishing certain ESG standards that we may or may not be able to meet. Although TTEC has a majorityrobust ESG program, it is scaled to the size of our business, and if our ESG program or our operations fail to meet the standards or expectations of our clients, investors, regulators, employees or other stakeholders, our reputation may be damaged and our business may be adversely impacted; we may find it difficult to recruit employees, and may lose business opportunities and investors.
Our stock price may fluctuate significantly due to many factors, some of which we cannot control
In recent years, the market value of our stock is heldhas fluctuated significantly due to many unrelated factors. Our results of operations directly impact our stock value, but many developments affecting the CX solutions industry, in general, and not directly related to us or controlled by a single controlling stockholder, which means that a change in controlus, may also have material impact on our stock value. For example, our stock value may be impacted by the performance of our companycompetitors and other similar companies, as it is perceived by investors and analysts in comparison to our performance; general economic, industry and market conditions; the announcement of acquisitions or consolidation in our industry; changes in key personnel; changes in market valuations of similar companies; fluctuations in currency exchange rates; our dividend policy as it compares to the dividend policies of other similar companies; investors’ perception about our business and our management team; the adequacy of our ESG practices; the passage of adverse legislation or other regulatory developments in countries where we do business; or the compositionstock market fluctuations due to geo political events, energy prices or terrorist activities.
Our stock value may also be impacted by financial projections that we provide to the public and whether these projections align with the expectations of our current investors, potential investors, and financial analysts who follow and comment on our stock. Any changes in our projections of our results of operations, or our failure to meet or exceed these projections and the investors’ and analysts’ expectations about our results of operations could result in material impact on our stock value.
While many of these factors impact the stock value of all companies in and outside of our industry, we may be more significantly impacted because of the Boardrelatively small trading volume of Directors will not occur without the approval of the controlling stockholder.our shares.
Our Chairman and Chief Executive Officer controls a majority of our stock and has control over all matters requiring action by our stockholders; and his interest may conflict with the interests of our other stockholders
Kenneth D. Tuchman, our Chairman and Chief Executive Officer, directly and beneficially owns approximately 61%59% of TTEC’s common stock. As a result, Mr. Tuchman could and does exercise significant influence and control over our business practices and strategy. As long as Mr. Tuchman continues to beneficially own more than 50% of our common stock he will be able toHe can elect all of the members of our Boardboard of Directors,directors, effect stockholder actions by written consent in lieu of stockholder meetings, and determine the outcome of all matters submitted to a vote of our stockholders, including matters involving mergers or other business combinations, the acquisition or disposition of assets, the occurrence of indebtedness, the issuance of any additional shares of common stock or other equity securities and the payment of dividends on our common stock.
The interest of Mr. Tuchman may not always coincide with the interest of our other stockholders, and Mr. Tuchman may seek to cause the Company to take actions that might involve risks to our business or adversely affect us or our other stockholders. For example, Mr. Tuchman’s control of TTEC could delay or prevent a change of control, merger, consolidation, or sale of all or substantially all of our assets that our other stockholders support, or conversely, Mr. Tuchman’s control could result in the consummation of a transaction that our other stockholders do not support. As a controlling stockholder, Mr. Tuchman is generally entitled to vote his shares as he sees fit, which may not always be in the interest of our other stockholders. This concentrated control could also discourage partiesinvestors from acquiring our common stock or initiating potential mergers, takeovers or other change of control transactions, which could depress the trading price of our common stock.
24
Our status as a “controlled company” could make our common stock less attractive to some investors or otherwise harm our stock price.price
Because we qualify as a “controlled company” under the listing rules of the NASDAQ Stock Market, we are not required to have a majority of our Boardboard of Directorsdirectors be independent, nor are we required to have an independent compensation committee or an independent nominating committee of the Board.board. While the Company has elected not to avail itself of these governance exceptions available to “controlled companies,” in the future, the Company may elect to do so. Accordingly, because of our “controlled company” status, theour other stockholders may not have the same protections affordedthat are available to stockholders of companies that are subject to all of the corporate governance rules for NASDAQ-listed companies. Our status as a controlled company“controlled company” could make our common stock less attractive to some investors or otherwise harm our stock price.
ITEM 1B. UNRESOLVED STAFF COMMENTS
We have not received written comments regarding our periodic or current reports from the staff of the SEC that were issued 180 days or more preceding the end of our 20192022 fiscal year that remain unresolved.
17
Our corporate headquarters are located in Englewood, Colorado. In addition to our headquarters and the customer engagement centers used by our Engage segment discussed below, we also maintain sales and consulting offices in several countries around the world which serve our Digital segment.
As of December 31, 20192022 we operated 8973 customer engagement centers that are classified as follows:
| Multi-Client Center — We lease space for these centers and serve multiple clients in each facility; |
| Dedicated Center — We lease space for these centers and dedicate the entire facility to one client; and |
| Managed Center — These facilities are leased or owned by our clients and we staff and manage these sites on behalf of our clients in accordance with facility management contracts. |
As of December 31, 2019,2022, our customer engagement centers were located in the following countries:
| | | | | | | | | |
|
| |
| |
| |
| Total |
|
| | | | | | | | Number of |
|
| | Multi-Client | | Dedicated | | Managed | | Delivery |
|
| | Centers | | Centers | | Centers | | Centers |
|
Australia |
| — | | 3 | | — |
| 3 | |
Brazil |
| 1 | | — | | — |
| 1 | |
Bulgaria |
| 2 | | — | | — |
| 2 | |
Canada |
| 1 | | — | | 1 |
| 2 | |
Colombia | | — | | — | | 2 | | 2 | |
Greece | | — | | — | | 1 | | 1 | |
Germany |
| — | | — | | 1 |
| 1 | |
India |
| 2 | | — | | — |
| 2 | |
Mexico |
| 2 | | — | | — |
| 2 | |
Philippines |
| 15 | | — | | — |
| 15 | |
Poland | | 1 | | — | | — | | 1 | |
South Africa |
| — | | — | | 2 |
| 2 | |
Thailand | | — | | — | | 1 | | 1 | |
United Kingdom |
| 1 | | — | | 2 |
| 3 | |
United States of America |
| 23 | | 3 | | 9 |
| 35 | |
Total |
| 48 |
| 6 |
| 19 |
| 73 | |
|
|
|
|
|
|
|
|
|
|
|
|
|
|
|
|
|
| Total |
|
|
|
|
|
|
|
|
| Number of |
|
|
| Multi-Client |
| Dedicated |
| Managed |
| Delivery |
|
|
| Centers |
| Centers |
| Centers |
| Centers |
|
Australia |
| — |
| 3 |
| — |
| 3 |
|
Brazil |
| 2 |
| — |
| — |
| 2 |
|
Bulgaria |
| 2 |
| — |
| — |
| 2 |
|
Canada |
| 5 |
| — |
| 1 |
| 6 |
|
Greece |
| 1 |
| — |
| — |
| 1 |
|
Germany |
| — |
| — |
| 1 |
| 1 |
|
India |
| 1 |
| — |
| — |
| 1 |
|
Ireland |
| 1 |
| — |
| — |
| 1 |
|
Mexico |
| 3 |
| — |
| — |
| 3 |
|
Philippines |
| 18 |
| — |
| — |
| 18 |
|
Poland |
| — |
| — |
| 1 |
| 1 |
|
South Africa |
| — |
| — |
| 1 |
| 1 |
|
Thailand |
| — |
| — |
| 1 |
| 1 |
|
United Kingdom |
| — |
| — |
| 2 |
| 2 |
|
United States of America |
| 32 |
| 5 |
| 9 |
| 46 |
|
Total |
| 65 |
| 8 |
| 16 |
| 89 |
|
25
The leases for our customer engagement centers have remaining terms ranging from one to 1311 years and generally contain renewal options. We believe that our existing customer engagement centers are suitable and adequate for our current operations, and we have plans to build additional centers to accommodate future business.
ITEM 3. LEGAL PROCEEDINGS
From time to time, the Company has been involved in legal actions, both as plaintiff and defendant, which arise in the ordinary course of business. The Company accrues for exposures associated with such legal actions to the extent that losses are deemed both probable and reasonably estimable. To the extent specific reserves have not been made for certain legal proceedings, their ultimate outcome, and consequently, an estimate of possible loss, if any, cannot reasonably be determined at this time.
Based on currently available information and advice received from counsel, the Company believes that the disposition or ultimate resolution of any current legal proceedings, except as otherwise specifically reserved for in its financial statements, will not have a material adverse effect on the Company’s financial position, cash flows or results of operations.
ITEM 4. MINE SAFETY DISCLOSURES
Not applicable.
PART II
ITEM 5. MARKET FOR REGISTRANT’S COMMON EQUITY, RELATED STOCKHOLDER
MATTERS AND ISSUER PURCHASES OF EQUITY SECURITIES
Our common stock is traded on the NASDAQ Global Select Market under the symbol “TTEC.”
As of December 31, 2019,2022, we had 282217 holders of record of our common stock and during 20192022 we declared and paid a $0.30$0.50 per share semi-annual dividend and a $0.32$0.52 per share semi-annual dividend on our common stock. During 20182021 we declared and paid a $0.27$0.43 per share semi-annual dividend and a $0.28$0.47 per share semi-annual dividend on our common stock as discussed below.stock.
In 2015, our Board of Directors adopted a dividend policy, with the intent to distribute a periodic cash dividend to stockholders of our common stock, after consideration of, among other things, TTEC’s performance, cash flows, capital needs and liquidity factors. The Company paid the initial dividend in 2015 and has continued to pay a semi-annual dividend in October and April of each year in amounts ranging between $0.18 and $0.32 per common share.share in 2015 and $0.52 per common share in October 2022. On February 27, 2020,23, 2023, the Board of Directors authorized a $0.34$0.52 dividend per common share, payable on April 16, 2020,20, 2023, to shareholders of record as of April 1, 2020.March 31, 2023. While it is our intention to continue to pay semi-annual dividends in 20202023 and beyond, any decision to pay future cash dividends will be made by our Board of Directors. In addition, our credit facility restricts our ability to pay dividends in the event we are in default or do not satisfy certain covenants.
Stock Repurchase Program
We continue to have the opportunity to return capital to our shareholders via an ongoing stock repurchase program (originally authorized by the Board of Directors in 2001). As of December 31, 2019,2022, the cumulative authorized repurchase allowance was $762.3 million, of which we have used $735.8 million to purchase 46.1 million shares. As of December 31, 2022, the remaining amount authorized for repurchases under the program was approximately $26.6 million. During 20182021 and 2019,2022, we did not purchase any shares under the program,program.
From January 1, 2023 through February 22, 2023, we did not purchase any additional shares and we do not currently have plans to make repurchases in 2020.
Issuer Purchases of Equity Securities During the Fourth Quarter of 2019
The following table provides information about our repurchases of equity securities during the quarter ended December 31, 2019:
|
|
|
|
|
|
|
|
|
|
|
|
|
|
|
|
|
|
| Total Number of |
| Approximate Dollar |
| |
|
|
|
|
|
|
| Shares |
| Value of Shares that |
| |
|
|
|
|
|
|
| Purchased as |
| May Yet Be |
| |
|
|
|
|
|
|
| Part of Publicly |
| Purchased Under |
| |
|
| Total Number |
|
|
|
| Announced |
| the Plans or |
| |
|
| of Shares |
| Average Price |
| Plans or |
| Programs (In |
| ||
Period |
| Purchased |
| Paid per Share |
| Programs |
| thousands) |
| ||
September 30, 2019 |
|
|
|
|
|
|
|
| $ | 26,580 |
|
October 1, 2019 - October 31, 2019 |
| — |
| $ | — |
| — |
| $ | 26,580 |
|
November 1, 2019 - November 30, 2019 |
| — |
| $ | — |
| — |
| $ | 26,580 |
|
December 1, 2019 - December 31, 2019 |
| — |
| $ | — |
| — |
| $ | 26,580 |
|
Total |
| — |
|
|
|
| — |
|
|
|
|
From January 1, 2020 through February 28, 2020, we did not purchase any additional shares.2023. The stock repurchase program does not have an expiration date and the Board authorizes additional stock repurchases under the program from time to time.
date.
1926
Stock Performance Graph
The graph depicted below compares the performance of TTEC common stock with the performance of the NASDAQ Composite Index; the Russell 2000 Index; and customized peer group over the period beginning on December 31, 20142017 and ending on December 31, 2019.2022. We have chosen the 2019 “Peer Group” composed2022 Peer Group comprised of 8x8, Inc.Accenture Plc (NASDAQ: EGHT)ACN), Five9 Inc.Cognizant Technology Solutions Corp. (NASDAQ: FIVN)CTSH), GenpactConcentrix (NASDAQ: G)CNXC), Sykes Enterprises, Incorporated (NASDAQ: SYKE) andGlobant S.A. (NYSE: GLOB), Teleperformance (NYSE Euronext: RCF) and Telus International (NYSE: TIXT). We believe that the companies in the 20192022 Peer Group are relevant to our current business model, market capitalization and our two segments Digital and Engage. The 20182021 Peer Group included Sykes Enterprises, IncorporatedAccenture Plc (NASDAQ: SYKE)ACN), Cognizant Technology Solutions Corp. (NASDAQ: CTSH), Genpact (NASDAQ: G), LivePerson Inc. (NASDAQ: LPSN), and Teleperformance (NYSE Euronext: RCF), which were relevant to our Engage segment..
The graph assumes that $100 was invested on December 31, 20142017 in our common stock and in each comparison index, and that all dividends were reinvested. We declared per share dividends on our common stock of $0.55$2.88 during 20182020, $0.90 during 2021 and $0.62$1.02 during 2019.2022. Stock price performance shown on the graph below is not necessarily indicative of future price performance.
27
COMPARISON OF 5 YEAR CUMULATIVE TOTAL RETURN
Among TTEC Holdings, Inc., The NASDAQ Composite Index,
The Russell 2000 Index, And A Peer GroupGroups
|
|
|
|
|
|
|
|
|
|
|
|
|
|
|
|
|
|
|
| |||||||||||||||||||
|
| December 31, |
| |||||||||||||||||||||||||||||||||||
|
| 2014 |
| 2015 |
| 2016 |
| 2017 |
| 2018 |
| 2019 |
| |||||||||||||||||||||||||
| | | | | | | | | | | | | | | | | | | | |||||||||||||||||||
| | December 31, |
| |||||||||||||||||||||||||||||||||||
|
| 2017 |
| 2018 |
| 2019 |
| 2020 |
| 2021 |
| 2022 |
| |||||||||||||||||||||||||
TTEC Holdings, Inc. |
| $ | 100 |
| $ | 120 |
| $ | 132 |
| $ | 177 |
| $ | 128 |
| $ | 180 |
| | $ | 100 | | $ | 72 | | $ | 102 | | $ | 196 | | $ | 245 | | $ | 122 | |
NASDAQ Composite |
| $ | 100 |
| $ | 107 |
| $ | 116 |
| $ | 151 |
| $ | 147 |
| $ | 200 |
| | $ | 100 | | $ | 97 | | $ | 133 | | $ | 192 | | $ | 235 | | $ | 159 | |
Russell 2000 |
| $ | 100 |
| $ | 96 |
| $ | 116 |
| $ | 133 |
| $ | 118 |
| $ | 148 |
| | $ | 100 | | $ | 89 | | $ | 112 | | $ | 134 | | $ | 154 | | $ | 122 | |
2018 Peer Group |
| $ | 100 |
| $ | 126 |
| $ | 146 |
| $ | 201 |
| $ | 217 |
| $ | 335 |
| |||||||||||||||||||
2019 Peer Group |
| $ | 100 |
| $ | 130 |
| $ | 143 |
| $ | 192 |
| $ | 206 |
| $ | 309 |
| |||||||||||||||||||
2021 Peer Group | | $ | 100 | | $ | 94 | | $ | 130 | | $ | 165 | | $ | 244 | | $ | 159 | | |||||||||||||||||||
2022 Peer Group | | $ | 100 | | $ | 94 | | $ | 130 | | $ | 168 | | $ | 253 | | $ | 163 | | |||||||||||||||||||
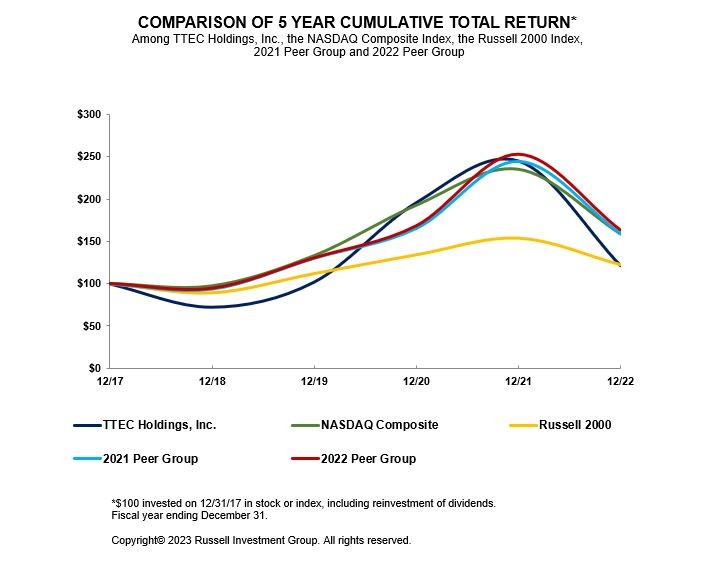
ITEM 6. <RESERVED>
2028
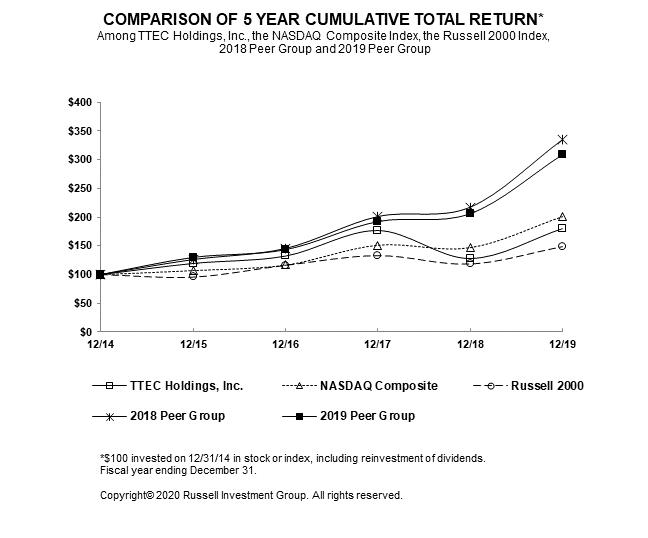
21
ITEM 6. SELECTED FINANCIAL DATA
The following selected financial data should be read in conjunction with Item 7. Management’s Discussion and Analysis of Financial Condition and Results of Operations, the Consolidated Financial Statements and the related notes appearing elsewhere in this Form 10-K (amounts in thousands except per share amounts).
|
|
|
|
|
|
|
|
|
|
|
|
|
|
|
|
|
|
| Year Ended December 31, |
| |||||||||||||
|
| 2019 |
| 2018 |
| 2017 |
| 2016 |
| 2015 |
| |||||
|
|
|
|
|
|
|
|
|
|
|
|
|
|
|
|
|
Statement of Operations Data |
|
|
|
|
|
|
|
|
|
|
|
|
|
|
|
|
Revenue |
| $ | 1,643,704 |
| $ | 1,509,171 |
| $ | 1,477,365 |
| $ | 1,275,258 |
| $ | 1,286,755 |
|
Cost of services |
|
| (1,242,887) |
|
| (1,157,927) |
|
| (1,110,068) |
|
| (941,592) |
|
| (928,247) |
|
Selling, general and administrative |
|
| (202,540) |
|
| (182,428) |
|
| (182,314) |
|
| (175,797) |
|
| (194,606) |
|
Depreciation and amortization |
|
| (69,086) |
|
| (69,179) |
|
| (64,507) |
|
| (68,675) |
|
| (63,808) |
|
Other operating expenses |
|
| (5,482) | (1) |
| (7,583) | (5) |
| (19,987) | (8) |
| (36,442) | (12) |
| (9,914) | (16) |
Income from operations |
|
| 123,709 |
|
| 92,054 |
|
| 100,489 |
|
| 52,752 |
|
| 90,180 |
|
Other income (expense) |
|
| (13,298) | (2) |
| (35,816) | (6) |
| (11,602) | (9) |
| (2,454) | (13) |
| (4,291) |
|
Provision for income taxes |
|
| (25,677) | (3) |
| (16,483) | (7) |
| (78,075) | (10) |
| (12,863) | (14) |
| (20,004) | (17) |
Noncontrolling interest |
|
| (7,570) |
|
| (3,938) |
|
| (3,556) |
|
| (3,757) |
|
| (4,219) |
|
Net income attributable to TTEC stockholders |
| $ | 77,164 |
| $ | 35,817 |
| $ | 7,256 |
| $ | 33,678 |
| $ | 61,666 |
|
|
|
|
|
|
|
|
|
|
|
|
|
|
|
|
|
|
Weighted average shares outstanding |
|
|
|
|
|
|
|
|
|
|
|
|
|
|
|
|
Basic |
|
| 46,373 |
|
| 46,064 |
|
| 45,826 |
|
| 47,423 |
|
| 48,370 |
|
Diluted |
|
| 46,758 |
|
| 46,385 |
|
| 46,382 |
|
| 47,736 |
|
| 49,011 |
|
|
|
|
|
|
|
|
|
|
|
|
|
|
|
|
|
|
Net income per share attributable to TTEC stockholders |
|
|
|
|
|
|
|
|
|
|
|
|
|
|
|
|
Basic |
| $ | 1.66 |
| $ | 0.78 |
| $ | 0.16 |
| $ | 0.71 |
| $ | 1.27 |
|
Diluted |
| $ | 1.65 |
| $ | 0.77 |
| $ | 0.16 |
| $ | 0.71 |
| $ | 1.26 |
|
|
|
|
|
|
|
|
|
|
|
|
|
|
|
|
|
|
Dividends issued per common share |
| $ | 0.62 |
| $ | 0.55 |
| $ | 0.47 |
| $ | 0.385 |
| $ | 0.36 |
|
|
|
|
|
|
|
|
|
|
|
|
|
|
|
|
|
|
Balance Sheet Data |
|
|
|
|
|
|
|
|
|
|
|
|
|
|
|
|
Total assets |
| $ | 1,376,788 | (4) | $ | 1,054,508 |
| $ | 1,078,736 | (11) | $ | 846,304 | (15) | $ | 843,327 |
|
Total long-term liabilities |
| $ | 532,846 | (4) | $ | 466,241 |
| $ | 514,113 | (11) | $ | 304,380 | (15) | $ | 191,473 |
|
|
|
|
|
|
|
|
|
|
|
|
|
22
|
|
|
|
|
|
|
|
|
|
|
|
|
|
|
|
|
|
|
|
|
|
|
23
ITEM 7. MANAGEMENT’S DISCUSSION AND ANALYSIS OF FINANCIAL CONDITION AND RESULTS OF OPERATIONS
Executive Summary
TTEC Holdings, Inc. (“TTEC”, “the Company”, “we”, “our” or “us”; pronounced “T-TEC”) is a leading global customer experience technology and services company focused on the design, implementation and delivery of transformative customer experience outcomes(“CX”) as a service (“CXaaS”) partner for many of the world’s most iconic companies, disruptive hypergrowth brands, and disruptive brands. Since our inception in 1982, we have been helping clients deliver frictionlesslarge public sector agencies. TTEC designs, builds, orchestrates, and delivers seamless digitally enabled customer experiences strengthenthat increase brand value, customer loyalty, revenue, and profitability through personalized, outcome-based interactions. We help clients improve their customer relationships, brand recognition and loyalty through personalized interactions, significantly improve their Net Promoter Score ("NPS"), and lowersatisfaction while lowering their total cost to serve by enablingcombining innovative digital solutions with service capabilities that deliver a frictionless CX across numerous real-time digital and delivering simplified, consistentlive interaction channels and seamless customer experience across channels anddifferent phases of the customer lifecycle.
Our customer experience thought leadership is substantiated, with innovative programs that differentiate our clients from their competition.
In the fast expanding direct-to-customer ("DTC") channel where experiences are everything, enterprises must become increasingly customer-centricThe Company operates and digitally enabled. Digital transformation has become a have-to-have in winning and keeping customers. It is our mission to enable and accelerate our clients' path to digital transformation. We are focused on improving the experience of our clients' customers, by leveraging existing and emerging technologies — artificial intelligence ("AI"), machine learning ("ML"), robotic process automation ("RPA"), cloud, analytics, omnichannel and real-time messaging.
Through the first quarter of 2019, the Company reportedreports its financial results of operations across four segments: Customer Strategy Services (“CSS”), Customer Technology Services (“CTS”), Customer Growth Services (“CGS”) and Customer Management Services (“CMS”). Starting in the second quarter of 2019, the Company changed its go-to-market strategy, how its clients evaluate and consume its services, how TTEC assesses its operating performance and the leadership accountability for its segments. As a result, the Company now reports its financial information based onoperation through two business segments: TTEC Digital and TTEC Engage.
| TTEC Digital is one of the largest pure-play CX technology service providers with expertise in CX strategy, digitization, analytics, process optimization, system integration, cloud-based technology solutions, and transformation enabled by our proprietary CX applications and technology partnerships. TTEC Digital designs, builds, and |
| TTEC Engage provides the |
TTEC Digital and TTEC Engage strategically come together under our unified offering, Humanify™ Customer Experience as a Service ("CXaas"),Humanify® CXaaS, which drives measurable customer results for clients through the delivery of personalized and seamless omnichannel experiences. Our Humanify™Humanify® cloud platform provides a fully integrated ecosystem of Customer Experience ("CX")CX offerings, including omnichannel, messaging, AI, ML, RPA,machine learning, robotic process automation, analytics, cybersecurity, customer relationship management ("CRM"),CRM, knowledge management, journey orchestration, and journey orchestration.traditional voice solutions. Our end-to-end CXaaS platform differentiates us from many competitors by combining design, strategic consulting, best in class technology, data analytics, process optimization, system integration, and operational excellence.excellence along with our decades of industry know-how. This unified offering is value-oriented, outcome-based and delivered to large enterpriseenterprises, hypergrowth companies and governmentspublic sector agencies on a global scale.
During fiscal 2019,2022, the TTEC global operating platform delivered onshore, nearshore, and offshore services in 2221 countries on six continents -- the United States, Australia, Belgium, Brazil, Bulgaria, Canada, Colombia, Costa Rica, Germany, Greece, Hong Kong, India, Ireland, Mexico, the Netherlands, New Zealand, the Philippines, Poland, Singapore, South Africa, Thailand, United Arab Emirates, and the United Kingdom. We provide onshore, nearshoreKingdom with the help of 69,400 consultants, technologists, and offshore services on six continents to accommodate client requirements. TTEC has 49,500 employees, approximately 1,400 of whom are CX professionals serving TTEC Digital clients and approximately 48,100 of whom serve TTEC Engage clients.professionals.
Our revenue for fiscal 20192022 was $1.644$2.444 billion, approximately $305$472 million, or 19%, which came from our TTEC Digital segment and $1.338$1.972 billion, or 81%, which came from our TTEC Engage segment.
24
To improve our competitive position in a rapidly changing market and stay strategically relevant to lead our clients with emerging CX methodologies, we continue to invest in innovation and service offerings for both mainstream and high growthhigh-growth disruptive businesses, diversifying and strengthening our core customer care services with consulting,technology-enabled, outcomes-focused services, data analytics, insights, and technology-enabled, outcomes-focused services.consulting.
29
We also invest to expand our geographic footprint, broaden our product and service capabilities, increase our global client base and industry expertise, tailor our geographic footprint to the needs of our clients, and further scale our end-to-end integrated solutions platform. To this end we have beenwere highly acquisitive in the last several years, including our acquisition in April 2022 of certain public sector assets of Faneuil, Inc. that included healthcare exchange and transportation services contracts. The acquisition expanded our capabilities in the growing public sector market by adding the building and operating of technology-enabled citizen engagement solutions to our offerings. We also completed an acquisition early in the second quarter of 2021 of a provider of Genesys and Microsoft cloud contact center services, which followed an acquisition in 2019the second half of 2020 of a U.S.-based provider of customer care, social media community management, content moderation, technical support and business process solutions; an acquisition in 2018 of a U.K.-based systems integrator for multichannelpreferred Amazon Connect cloud contact center platforms; an acquisition in 2017 of an India-based digital fraud preventionservice and detection and content moderation services company; and an acquisition in 2017 of a U.S.-based healthcare services company focused on improving the customer experience for healthcare plan providers and pharmacy benefits managers.implementation provider.
We have extensive expertise in the healthcare, automotive, communications,national/federal and state and local government, financial services, government, healthcare,communications, technology, travel, logistics, media and entertainment, e-tail/retail, technology, travel and transportation industries. We serve more than 300775 diverse clients globally, including many of the world’s iconic blue-chip brands, Fortune 1000 companies, public sector agencies, and disruptive growthhypergrowth companies.
Cybersecurity Incident
In 2021, TTEC experienced two significant cybersecurity incidents. One involved a global supply chain compromise that impacted thousands of companies worldwide, including a TTEC Digital subsidiary and its managed services clients. Another involved a ransomware attack that temporarily disrupted the TTEC Engage business. With support from outside forensic experts, in the fourth quarter of 2021 TTEC completed its investigation of root causes and impacts of the cybersecurity incident and has been working to harden the security of its information technology environment and has taken the measures it believes to be appropriate to protect its systems and its data.
In connection with these incidents, we also exercised reasonable efforts to identify data that may have been exfiltrated and found no credible evidence that exfiltrated data was publicly released. By January 2022, the data involved in the incident had been analyzed for impact and notice obligations, and we provided appropriate regulatory and individual notices about the incident and its potential impacts.
The Company performed appropriate procedures to validate the accuracy and completeness of information involved in its financial reporting, and we had no indication that the accuracy and completeness of any financial information was impacted as a result of the incident.
The temporary operational disruptions that occurred due to these incidents did not have a long-term impact on our results of operations. TTEC has made and continues to make significant investments to enhance our information technology environment, our operational governance of our information technology system and our data governance practices during the fourth quarter of 2021 and 2022. In 2022, allegations were made against the Company about data privacy failures, which are typical when cybersecurity incidents result in data exfiltration. The Company settled these allegations without material impact to operations. The incident resulted in certain government enforcement actions, regulatory investigations, fines, penalties, and private legal actions, which although significant, are typical under these circumstances and did not materially impact our results of operations. Other actual and potential consequences of the incident included and may include negative publicity, loss of client trust, reputational damage, litigation, contractual claims, financial judgement or settlements in excess of insurance, and disputes with insurance carriers concerning coverage. See, Part I, Item 1A Risk Factors.
30
COVID-19 Pandemic
Through the period ended December 31, 2022 the COVID-19 pandemic has not had a material adverse impact on our operational or financial results. As of December 31, 2022 we have no continuing COVID-19 related surge work. Our clients continue to reposition their work in the post-pandemic environment, leveraging new ways of working, and evolving the use of technology. Based on currently available information, we cannot accurately predict the post-pandemic changes to our clients’ businesses and their effect on the magnitude and timing of our clients’ buying decisions. Further, while to date we have been successful in managing service delivery from a mix of delivery centers and highly disbursed employee population working remotely, certain seasonal weather cycles and their potential impacts on power grid and internet availability for our employees working from home may impact our delivery capability with little notice, thus potentially impacting our results of operations in the future. As the needs of the business and our client requests now require us to return some of our employees who have been working remotely to on-site work in our delivery centers, some employees may be reluctant to return to traditional work on-sites and it may have impacts on our ability to staff projects and deliver services.
Capital and Financing Availability
Our strong balance sheet, cash flow from operations and access to debt and capital markets have historically provided us the financial flexibility to effectively fund our organic growth, capital expenditures, strategic acquisitions, incremental investments, and capital distributions.
We return capital to our shareholders through our dividend program. Given our cash flow generation and balance sheet strength, we believe cash dividends, in balance with our investments in product and service innovations, organic growth, and strategic acquisitions, align shareholder interests with the needs of the Company. After consideration of TTEC’s performance, cash flow from operations, capital needs and the overall liquidity of the Company, the Company’s Board of Directors adopted a dividend policy in 2015, with the intent to distribute a periodic cash dividend to stockholders of our common stock. Since inception in 2015, the Company has continued to pay a semi-annual dividend in October and April of each year in gradually increasing amounts from $0.18 per common share in 2015 to $0.52 per common share in October 2022. In December 2020, the Board of Directors authorized a special one-time dividend of $2.14 per common share. On February 23, 2023, the Board of Directors authorized a semi-annual dividend of $0.52 per common share, payable on April 20, 2023 to shareholders of record as of March 31, 2023.
Our Integrated Service Offerings and Business Segments
We provide strategic value and differentiation through our two business segments: TTEC Digital and TTEC Engage.
TTEC Digital is one of the largest pure-play CX technology service providers with expertise in CX strategy, digitization, analytics, process optimization, system integration, cloud-based technology solutions, and transformation enabled by our proprietary CX applications and technology partnerships. TTEC Digital designs, builds, and delivers tech-enabled, insights-basedoperates robust digital experiences for clients and outcome-driven customer experience solutionstheir customers through our professional servicesthe contextual integration and suiteorchestration of CRM, data, analytics, CXaaS technology, offerings. These solutions are criticaland intelligent automation to enabling and accelerating digital transformation for our clients.ensure high-quality, scalable CX outcomes.
| Technology Services: Our technology services design, |
| Professional Services: Our management consulting practices deliver customer experience strategy, analytics, process optimization, and |
TTEC Engage provides the essential technologies, human resources, infrastructure and processesdigitally enabled CX managed services to operatesupport our clients’ end-to-end customer interaction delivery at scale. The segment delivers omnichannel customer care, technology support, order fulfillment, customer acquisition, growth, and retention services with industry specialization and distinctive CX capabilities for hypergrowth brands. TTEC Engage also delivers digitally enabled back office and industry specific specialty services including AI operations, and fraud detection and preventionmanagement services.
31
| Customer Acquisition, Growth, and Retention Services: Our customer growth and acquisition services optimize the buying journeys for acquiring new customers by leveraging technology and analytics to deliver personal experiences that we believe increase the quantity and quality of leads and customers. |
| Customer Care, Technology Support, and Order Fulfillment Services: Our customer care, technology support, and order fulfillment services provide turnkey contact center solutions, including digital omnichannel technologies, associate recruiting and training, facilities, and operational expertise to create exceptional customer experiences across all touchpoints. |
|
|
Based on our clients’ preference,preferences, we provide our services on an integrated cross-business segment and/or on a discrete basis.
Additional information with respect to our segments and geographic footprint is included in Part II, Item 8. Financial Statements and Supplementary Data, Note 3 to the Consolidated Financial Statements.
Our 20192022 Financial Results
In 2019,2022, our revenue increased 8.9%7.5% over 2021 to $1,644$2,443.7 million, over 2018, including an increasea decrease of 0.1%1.9% or $0.8$42.4 million due to foreign currency fluctuations and a decrease of $17.9 million, or 1.2%, due to the initial adoption of ASC 606 for revenue in the first quarter of 2018.fluctuations. The increase in revenue was comprised of a $66.5$57.4 million, or 27.9%13.9%, increase for TTEC Digital and a $68.0$113.2 million, or 5.4%6.1%, increase for TTEC Engage.
25
Our 20192022 income from operations increased $31.7decreased $48.7 million to $123.7$168.5 million, or 7.5%6.9% of revenue, from $92.1$217.2 million or 6.1%which was 9.6% of revenue for 2018.2021. The change in operating income is attributable to a number of different factors across the segments. The TTEC Digital operating income expandeddeclined with an 18%4.8%, or $5.9$1.7 million, improvementdecrease over last year primarily on the growth of its higher margin cloud businessdue to increased revenue and its system integration business which provides services preprogram gross margins offset by a continued investment in sales and post the buildout of each client’s cloud platform.marketing, product engineering, and geographic expansion. The TTEC Engage operating income increased 44%decreased 25.8%, or $25.8$46.9 million, compared to the prior year based on the increase in revenue and a $6.8 million benefit related to foreign currency fluctuations which was offset by a $9.8 million decreaseprimarily related to the initial adoptionacquisition of ASC 606 duringFaneuil and other revenue increases offset by the first quarterramp of 2018.several new programs, change in revenue mix away from COVID-surge programs, increased sales and marketing expenses, increased amortization of acquisition related intangible assets, impairments of internally developed software and real estate leases, and accelerated amortization of software.
Income from operations in 20192022 and 20182021 included a total of $5.5$19.4 million and $7.6$15.1 million of restructuring and asset impairments, respectively.
Our offshore customer engagementexperience centers spanning six countries serve clients based in the U.S. and in other countries and span five countries with 23,91519,900 workstations representing 52%61% of our global delivery capabilities. Revenue for our TTEC Engage segment provided in these offshore locations was $455 million and represented 34%27% of our 20192022 revenue, as compared to $440 million and 35%29% of our 20182021 revenue.
Our seat utilization is defined as the total number of utilized workstations compared to the total number of available production workstations. As of December 31, 2019,2022, the total production workstations for our TTEC Engage segment was 45,61132,825 and the overall capacity utilization in our centers was 74%.78% versus 63% in the prior year period. The utilization is lower thansignificant improvement was driven by the previous yearCompany’s site optimization strategy as more and more clients are adopting the @Home operational platform on a permanent basis.
Post COVID-19 we expect our clients to leverage a more diversified geographic footprint and an increased mix of work from home versus brick-and-mortar seats. We will continue to refine our site strategy and capacity as we expand and shift capacity in certain countries to accommodate the volume and location related to client specific customer engagement volume. The table below presents workstation data for all of our centers as of December 31, 2019 and 2018. Our utilization percentage is defined as the total number of utilized production workstations compared to the total number of available production workstations.
|
|
|
|
|
|
|
|
|
|
|
|
|
|
|
| December 31, 2019 |
| December 31, 2018 |
| ||||||||
|
| Total |
|
|
|
|
| Total |
|
|
|
|
|
|
| Production |
|
|
| % In |
| Production |
|
|
| % In |
|
|
| Workstations |
| In Use |
| Use |
| Workstations |
| In Use |
| Use |
|
|
|
|
|
|
|
|
|
|
|
|
|
|
|
Total centers |
|
|
|
|
|
|
|
|
|
|
|
|
|
Sites open >1 year |
| 40,140 |
| 29,749 |
| 74 | % | 42,687 |
| 34,017 |
| 80 | % |
Sites open <1 year |
| 5,471 |
| 3,870 |
| 71 | % | 309 |
| 231 |
| 75 | % |
Total workstations |
| 45,611 |
| 33,619 |
| 74 | % | 42,996 |
| 34,248 |
| 80 | % |
We continue to see demand from all geographic regions to utilize our offshore delivery capabilities and expect this trend to continue. On the other hand, some offinalize plans with our clients may be subject to regulatory pressures to bring more services onshore to the United States. In light of these trends, weand prospects.
We plan to continue to selectively retain and grow capacity in and expand into new offshore markets, while maintaining appropriate capacity in the United States.onshore. As we grow our offshore delivery capabilities and our exposure to foreign currency fluctuationsfluctuation increases, we will continue to actively manage this risk via a multi-currency hedging program designed to minimize operating margin volatility.
32
Critical Accounting Policies and Estimates
Management’s Discussion and Analysis of our financial condition and results of operations are based upon our Consolidated Financial Statements, which have been prepared in accordance with accounting principles generally accepted in the U.S. (“GAAP”). The preparation of these financial statements requires us to make estimates and assumptions that affect the reported amounts of assets, liabilities, revenue and expenses as well as the disclosure of contingent assets and liabilities. We regularly review our estimates and assumptions. These estimates and assumptions, which are based upon historical experience and on various other factors believed to be reasonable under the circumstances, form the basis for making judgments about the carrying values of assets and liabilities that are not readily apparent from other sources. Reported amounts and disclosures may have been different had management used different estimates and assumptions or if different conditions had occurred in the periods presented. Below is a discussion of the policies that we believe may involve a high degree of judgment and complexity.
26
Revenue Recognition – 2019 and 2018 Revenue
The Company recognizes revenue from contracts and programs when control of the promised goods or services is transferred to the customers, in an amount that reflects the consideration it expects to be entitled to in exchange for those goods or services. Revenue is recognized when or as performance obligations are satisfied by transferring control of a promised good or service to a customer. A performance obligation is a promise in a contract to transfer a distinct good or service to the customer. Performance obligation is the unit of accounting for revenue recognition under the provisions of ASC Topic 606, “Revenue from Contracts with Customers” and all related amendments (“ASC 606”). A contract’s transaction price is allocated to each distinct performance obligation in recognizing revenue.
The BPObusiness process outsourcing (“BPO”) inbound and outbound service fees are based on either a per minute, per hour, per FTE, per transaction or per call basis, which represents the majority of our contracts. These contracts have a single performance obligation as the promise to transfer the individual goods or services is not separately identifiable from other promises in the contracts and, therefore, not distinct. For example, services forWith the exception of training, of the Company’s agents (which are separately billable to the customer) are a separate promise in our BPO contracts, but they are not distinct from the primary service obligations to transfer services to the customers. The performance of the customer service by the agents is highly dependent on the initial, growth, and seasonal training services provided to the agents during the life of a program. The training itselfwhich is not considered to have value to the customer on a standalonestand-alone basis, and therefore, training on a standalone basis cannot be considered a separate unit of accounting. The Company therefore defers revenue from certain training services that are rendered mainly upon commencement of a new client contract or program, including seasonal programs. Revenue is also deferred when there is significant growth training in an existing program. Accordingly, recognition of initial, growth, and seasonal training revenues and associated costs (consisting primarily of labor and related expenses) are deferred and amortized over the period of economic benefit. With the exception of training, which is typically billed upfront and deferred, the remainder of revenue is invoiced on a monthly or quarterly basis as services are performed and does not create a contract asset or liability.
In addition to revenue from BPO services, revenue also consists of fees from services for program launch, professional consulting, fully-hosted or managed technology and learning innovation services. The contracts containing these service offerings may contain multiple performance obligations. For contracts with multiple performance obligations, the Company allocates the contract’s transaction price to each performance obligation using the best estimate of the standalone selling price of each distinct good or service in the contract. The primary method used to estimate standalone selling price is the expected cost plus a margin approach, under which the Company forecasts its expected costs of satisfying a performance obligation and then adds an appropriate margin for that distinct good or service. The Company forecasts its expected cost based on historical data, current prevailing wages, other direct and indirect costs incurred in recently completed contracts, market conditions, and other client specific cost considerations. For these services, the point at which the transfer of control occurs determines when revenue is recognized in a specific reporting period. Within our Digital segment, where there are product sales, the attribution of revenue is recognized when the transfer of control is completed and the products are delivered to the client’s location. Where services are rendered to a customer, the attribution is aligned with the progress of work and is recognized over time (i.e. based on measuring the progress toward complete satisfaction of a performance obligation using an output method or an input method). Where output method is used, revenue is recognized on the basis of direct measurements of the value to the customer of the goods or services transferred relative to the remaining goods or services promised under the contract. The majority of the Company’s services are recognized over time using the input method in which revenue is recognized on the basis of efforts or inputs toward satisfying a performance obligation (for example, resources consumed, labor hours expended, costs incurred, or time elapsed) relative to the total expected inputs to satisfy the performance obligation. The measures used provide faithful depiction of the transfer of goods or services to the customers. For example, revenue is recognized on certain consulting contracts based on labor hours expended as a measurement of progress where the consulting work involves input of consultants’ time. The progress is measured based on the hours expended over total number of estimated hours included in the contract multiplied by the total contract consideration. The contract consideration can be a fixed price or an hourly rate, and in either case, the use of labor hours expended as an input measure provides a faithful depiction of the transfer of services to the customers. Deferred revenues for these services represent amounts collected from, or invoiced to, customers in excess of revenues recognized.
27
This results primarily from i) receipt of license fees that are deferred due to one or more of the revenue recognition criteria not being met, and ii) the billing of annual customer support agreements, annual managed service agreements, and billings for other professional services that have not yet been performed by the Company. The Company records amounts billed and received, but not earned, as deferred revenue. These amounts are recorded in Deferred revenue or Other long-term liabilities, as applicable, in the accompanying Consolidated Balance Sheets based on the period over which the Company expects to render services. Costs directly associated with revenue deferred, consisting primarily of labor and related expenses, are also deferred and recognized in proportion to the expected future revenue from the contract.
Variable consideration exists in contracts for certain client programs that provide for adjustments to monthly billings based upon whether the Company achieves, exceeds or fails certain performance criteria. Adjustments to monthly billings consist of contractual bonuses/penalties, holdbacks and other performance based conditions. Variable consideration is estimated at contract inception at its most likely value and updated at the end of each reporting period as additional performance data becomes available. Revenue related to such variable consideration is recognized only to the extent that a significant reversal of any incremental revenue is not considered probable.
33
Contract modifications are routine in the performance of the customer contracts. Contracts are often modified to account for customer mandated changes in the contract specifications or requirements, including service level changes. In most instances, contract modifications relate to goods or services that are incremental and distinctly identifiable, and, therefore, are accounted for prospectively.
Direct and incremental costs to obtain or fulfill a contract are capitalized, and the capitalized costs are amortized over the corresponding period of benefit, determined on a contract by contract basis. The Company recognizes an asset for the incremental costs of obtaining a contract with a customer if it expects to recover those costs. The incremental costs of obtaining a contract are those costs that the Company incurs to obtain a customer contract that it would not have incurred if the contract had not been obtained. Contract acquisition costs consist primarily of payment of commissions to sales personnel and are incurred when customer contracts are signed. The deferred sales commission amounts are amortized based on the expected period of economic benefit and are classified as current or non-current based on the timing of when they are expected to be recognized as an expense. Costs to obtain a contract that would have been incurred regardless of whether the contract was obtained are recognized as an expense when incurred, unless those costs are explicitly chargeable to the customer regardless of whether the contract is obtained. Sales commissions are paid for obtaining new clients only and are not paid for contract renewals or contract modifications.Capitalized costs of obtaining contracts are periodically reviewed for impairment.
In certain cases, the Company negotiates an upfront payment to a customer in conjunction with the execution of a contract. Such upfront payments are critical to acquisition of new business and are often used as an incentive to negotiate favorable rates from the clients and are accounted for as upfront discounts for future services. Such payments are either made in cash at the time of execution of a contract or are netted against the Company’s service invoices. Payments to customers are capitalized as contract acquisition costs and are amortized as a reduction to revenue in proportion to the expected future revenue from the contract, which in most cases results in straight-line amortization over the life of the contract. Such payments are considered a reduction of the selling prices of the Company’s products or services, and therefore, are accounted for as a reduction of revenue when amortized. Such capitalized contract acquisition costs are periodically reviewed for impairment taking into consideration ongoing future cash flows expected from the contract and estimated remaining useful life of the contract.
28
Some of the Company’s service contracts are short-term in nature with a contract term of one year or less. For those contracts, the Company has utilized the practical expedient in ASC 606-10-50-14 exempting the Company from disclosure of the transaction price allocated to remaining performance obligations if the performance obligation is part of a contract that has an original expected duration of one year or less. Also in alignment with ASC 606-10-50-14, the Company does not disclose the value of unsatisfied performance obligations for contracts for which it recognizes revenue at the amount to which it has the right to invoice for services performed. Additionally, the Company’s standard payment terms are less than one year. Given the foregoing, the Company has elected the practical expedient under ASC 606-10-32-18 to not assess whether a contract has a significant financing component. Pursuant to the Company’s election of the practical expedient under ASC 606-10-32-2A, sales, value add, and other taxes that are collected from customers concurrent with revenue-producing activities, which the Company has an obligation to remit to the governmental authorities, are excluded from revenue.
Revenue Recognition – 2017 and prior years
We recognize revenue when evidence of an arrangement exists, the delivery of service has occurred, the fee is fixed or determinable and collection is reasonably assured. The BPO inbound and outbound service fees are based on either a per minute, per hour, per full-time employee, per transaction or per call basis. Certain client programs provide for adjustments to monthly billings based upon whether we achieve, exceed or fail certain performance criteria. Adjustments to monthly billings consist of contractual bonuses/penalties, holdbacks and other performance based contingencies. Revenue recognition is limited to the amount that is not contingent upon delivery of future services or meeting other specified performance conditions.
Revenue also consists of services for agent training, program launch, professional consulting, fully-hosted or managed technology and learning innovation. These service offerings may contain multiple element arrangements whereby we determine if those service offerings represent separate units of accounting. A deliverable constitutes a separate unit of accounting when it has standalone value and delivery or performance of the undelivered items is considered probable and substantially within our control. If those deliverables are determined to be separate units of accounting, revenue is recognized as services are provided. If those deliverables are not determined to be separate units of accounting, revenue for the delivered services are bundled into one unit of accounting and recognized over the life of the arrangement or at the time all services and deliverables have been delivered and satisfied. We allocate revenue to each of the deliverables based on a selling price hierarchy of vendor specific objective evidence (“VSOE”), third-party evidence, and then estimated selling price. VSOE is based on the price charged when the deliverable is sold separately. Third-party evidence is based on largely interchangeable competitor services in standalone sales to similarly situated customers. Estimated selling price is based on our best estimate of what the selling prices of deliverables would be if they were sold regularly on a standalone basis. Estimated selling price is established considering multiple factors including, but not limited to, pricing practices in different geographies, service offerings, and customer classifications. Once we allocate revenue to each deliverable, we recognize revenue when all revenue recognition criteria are met.
Periodically, we will make certain expenditures related to acquiring contracts or provide up-front discounts for future services. These expenditures are capitalized as contract acquisition costs and amortized in proportion to the expected future revenue from the contract, which in most cases results in straight-line amortization over the life of the contract. Amortization of these contract acquisition costs is recorded as a reduction to revenue.
Income Taxes
Accounting for income taxes requires recognition of deferred tax assets and liabilities for the expected future income tax consequences of transactions that have been included in the Consolidated Financial Statements or tax returns. Under this method, deferred tax assets and liabilities are determined based on the difference between the financial statement and tax basis of assets and liabilities using tax rates in effect for the year in which the differences are expected to reverse. When circumstances warrant, we assess the likelihood that our net deferred tax assets will more likely than not be recovered from future projected taxable income.
We continually review the likelihood that deferred tax assets will be realized in future tax periods under the “more-likely-than-not” criteria. In making this judgment, we consider all available evidence, both positive and negative, in determining whether, based on the weight of that evidence, a valuation allowance is required.
29
We follow a two-step approach to recognizing and measuring uncertain tax positions. The first step is to determine if the weight of available evidence indicates that it is more likely than not that the tax position will be sustained on audit. The second step is to estimate and measure the tax benefit as the amount that has a greater than 50% likelihood of being realized upon ultimate settlement with the tax authority. We evaluate these uncertain tax positions on a quarterly basis. This evaluation is based on the consideration of several factors including changes in facts or circumstances, changes in applicable tax law, and settlement of issues under audit.
Interest and penalties relating to income taxes and uncertain tax positions are accrued net of tax in the Provision for income taxes in the accompanying Consolidated Statements of Comprehensive Income (Loss).
In the future, our effective tax rate could be adversely affected by several factors, many of which are outside our control. Our effective tax rate is affected by the proportion of revenue and income before taxes in the various domestic and international jurisdictions in which we operate. Further, we are subject to changing tax laws, regulations and interpretations in multiple jurisdictions in which we operate, as well as the requirements, pronouncements and rulings of certain tax, regulatory and accounting organizations. We estimate our annual effective tax rate each quarter based on a combination of actual and forecasted results of subsequent quarters. Consequently, significant changes in our actual quarterly or forecasted results may impact the effective tax rate for the current or future periods.
Tax Reform34
Business Combinations
In 2017,We account for business combinations under the United States enacted comprehensive tax reform legislation known as the Tax Cuts and Jobs Act (the "2017 Tax Act") that, among other things, reduced the U.S. federal corporate income tax rate from 35% to 21% and implemented a territorial tax system, but imposedacquisition method of accounting in accordance with ASC Topic 805, Business Combinations, which requires an alternative “base erosion and anti-abuse tax” (“BEAT”), and an incremental tax on global intangible low taxed foreign income (“GILTI”) effective January 1, 2018. In addition, the law imposed a one-time mandatory repatriation tax on accumulated post-1986 foreign earnings on domestic corporations effective for the 2017 tax year. As of December 31, 2018, we completed our accounting for the tax effectsallocation of the 2017 Tax Act and no material adjustment was recordedconsideration we paid to the 2017 estimate.
While our accounting foridentifiable assets, intangible assets and liabilities based on the recorded impactestimated fair values as of the 2017 Tax Actclosing date of the acquisition. The excess of the fair value of the purchase price over the fair values of these identifiable assets, intangible assets and liabilities is deemedrecorded as goodwill.
Purchased intangibles other than goodwill are initially recognized at fair value and amortized over their useful lives unless those lives are determined to be complete, these amounts areindefinite. The valuation of acquired assets will impact future operating results. The fair value of identifiable intangible assets is determined using an income approach on an individual asset basis. Specifically, we use the multi-period excess earnings method to determine the fair value of customer relationships and the relief-from-royalty approach to determine the fair value of the trade name. Determining the fair value of acquired intangibles involves significant estimates and assumptions, including forecasted revenue growth rates, EBITDA margins, customer attrition rate, and market-participant discount rates.
The determination of the useful life of an intangible asset other than goodwill is based on prevailing regulations and currently available information, and any additional guidance issued by the Internal Revenue Service (“IRS”) or the results of an audit related to these items, could impact our recorded amounts in future periods.
The Company’s selection of an accounting policyfactors including historical tradename performance with respect to both the new GILTIconsumer name recognition, geographic market presence, market share, plans for ongoing trade name support and BEAT rules is to compute the related taxes in the period the entity becomes subject to either. A reasonable estimate of the effects of these provisions has been included in the 2019promotion, customer attrition rate, and 2018 annual financial statements.other relevant factors.
Impairment of Long-Lived Assets
We evaluate the carrying value of property, plant and equipment and definite-lived intangible assets for impairment whenever events or changes in circumstances indicate that the carrying amount may not be recoverable. An asset is considered to be impaired when the forecasted undiscounted cash flows of an asset group are estimated to be less than its carrying value. The amount of impairment recognized is the difference between the carrying value of the asset group and its fair value. Fair value estimates are based on assumptions concerning the amount and timing of estimated future cash flows and assumed discount rates.
Goodwill and Indefinite-Lived Intangible Assets
We evaluate goodwill and indefinite-lived intangible assets for possible impairment at least annually or whenever events or changes in circumstances indicate that the carrying amount of such assets may not be recoverable.
30
We use a two steptwo-step process to assess the realizability of goodwill. The first step, Step 0, is a qualitative assessment that analyzes current economic indicators associated with a particular reporting unit. For example, we analyze changes in economic, market and industry conditions, business strategy, cost factors, and financial performance, among others, to determine if there would be a significant decline to the fair value of a particular reporting unit. A qualitative assessment also includes analyzing the excess fair value of a reporting unit over its carrying value from impairment assessments performed in previous years. If the qualitative assessment indicates a stable or improvedthe fair value of the reporting unit is in excess of its carrying value, no further testing is required.
If a qualitative assessment indicates that a significant decline to fair value of a reporting unit is more likely than not, or if a reporting unit’s fair value has historically been closer to its carrying value, we will proceed to Step 1 testing where we calculate the fair value of a reporting unit based on discounted future probability-weighted cash flows. If Step 1 indicates that the carrying value of a reporting unit is in excess of its fair value, we will record an impairment equal to the amount by which a reporting unit’s carrying value exceeds its fair value.
During 2022, we completed a Step 1 goodwill analysis and determined that for all three reporting units the estimated fair value exceeds the carrying value. The calculation of fair value is based on estimates including revenue projections, EBITDA margin projections, estimated tax rates, estimated capital expenditures and discount rates.
We estimate fair value using discounted cash flows of the reporting units. The most significant assumptions used in these analyses are those made in estimating future cash flows. In estimating future cash flows, we use financial assumptions in our internal forecasting model such as projected capacity utilization, projected changes in the prices we charge for our services, projected labor costs, as well as contract negotiation status. The financial and credit market volatility directly impacts our fair value measurement through our weighted average cost of capital that we use to determine our discount rate. We use a discount rate we consider appropriate for the country where the business unit is providing services.
Similar to goodwill, the Company may first use a qualitative analysis to assess the realizability of its indefinite-lived intangible assets. The qualitative analysis will include a review of changes in economic, market and industry conditions, business strategy, cost factors, and financial performance, among others, to determine if there would be a significant decline to the fair value of an indefinite-lived intangible asset. If a quantitative analysis is completed, an indefinite-lived intangible asset (such as a trade name) is evaluated for possible impairment by comparing the fair value of the asset with its carrying value. Fair value is estimated as the discounted value of future revenues arising from a trade name using a royalty rate that a market participant would pay for use of that trade name. An impairment charge is recorded if the trade name’s carrying value exceeds its estimated fair value.
Derivatives
We may enter into foreign exchange forward and option contracts to reduce our exposure to foreign currency exchange rate fluctuations that are associated with forecasted revenue earned in foreign locations. We may enter into interest rate swaps to reduce our exposure to interest rate fluctuations associated with our variable rate debt. Upon proper qualification, these contracts are often accounted for as cash flow hedges under current accounting standards. From time-to-time, we may also enter into foreign exchange forward contracts to hedge our net investment in a foreign operation.
All derivative financial instruments are reported in the accompanying Consolidated Balance Sheets at fair value. Changes in fair value of derivative instruments designated as cash flow hedges are recorded in Accumulated other comprehensive income (loss), a component of Stockholders’ Equity, to the extent they are deemed effective. Based on the criteria established by current accounting standards, all of our cash flow hedge contracts are deemed to be highly effective. Changes in fair value of any net investment hedge are recorded as cumulative translation adjustment in Accumulated other comprehensive income (loss) in the accompanying Consolidated Balance Sheets offsetting the change in cumulative translation adjustment attributable to the hedged portion of our net investment in the foreign operation. Any realized gains or losses resulting from the foreign currency cash flow hedges are recognized together with the hedged transactions within Revenue. Any realized gains or losses resulting from the interest rate swaps are recognized in Interest expense. Gains and losses from the settlements of our net investment hedges remain in Accumulated other comprehensive income (loss) until partial or complete liquidation of the applicable net investment.
31
We also enter into fair value derivative contracts to reduce our exposure to foreign currency exchange rate fluctuations associated with changes in asset and liability balances. Changes in the fair value of derivative instruments designated as fair value hedges affect the carrying value of the asset or liability hedged, with changes in both the derivative instrument and the hedged asset or liability being recognized in Other income (expense), net in the accompanying Consolidated Statements of Comprehensive Income (Loss).
While we expect that our derivative instruments will continue to be highly effective and in compliance with applicable accounting standards, if our hedges did not qualify as highly effective or if we determine that forecasted transactions will not occur, the changes in the fair value of the derivatives used as hedges would be reflected currently in earnings.
Contingencies
We record a liability for pending litigation and claims where losses are both probable and reasonably estimable. Each quarter, management reviews all litigation and claims on a case-by-case basis and assigns probability of loss and range of loss.
Explanation35
Other ItemsComponents of Results of Operations
Cost of Services
Cost of services principally include costs incurred in connection with our customer experience services and technology services, including direct labor and related taxes and benefits, telecommunications, technology costs, sales and use tax and certain fixed costs associated with the customer engagement centers. In addition, cost of services includes income related to grants we may receive from local or state governments as an incentive to locate customer engagement centers in their jurisdictions which reduce the cost of services for those facilities.
Selling, General and Administrative
Selling, general and administrative expenses primarily include costs associated with administrative services such as sales, marketing, product development, legal, information systems (including core technology and telephony infrastructure), accounting and finance. It also includes outside professional fees (i.e., legal and accounting services), building expense for non-engagement center facilities and other items associated with general business administration.
Restructuring and Integration Charges, Net
Restructuring charges, net primarily include costs incurred in conjunction with reductions in force or decisions to exit facilities, including termination benefits and lease liabilities, net of expected sublease rentals. Integration charges represent the activities
Impairment Losses
Impairment losses include costs related to the re-hiringimpairment of right-of-use assets, leasehold improvement assets, internally developed software, and retraining of the agents, the consolidation of facilities, the transfer of IT systems and other duplicative expenses incurred as the acquisitions are fully integrated.certain computer equipment.
Interest Expense
Interest expense includes interest expense, amortization of debt issuance costs associated with our Credit Facility, and the accretion of deferred payments associated with our acquisitions.
Other Income
The main components of other income are miscellaneous income not directly related to our operating activities, such as foreign exchange gains and reductions in our contingent consideration.
Other Expenses
The main components of other expenses are expenditures not directly related to our operating activities, such as foreign exchange losses and increases in our contingent consideration.
32
RESULTS OF OPERATIONS
Year Ended December 31, 20192022 Compared to December 31, 20182021
The tables included in the following sections are presented to facilitate an understanding of Management’s Discussion and Analysis of Financial Condition and Results of Operations and present certain information by segment for the years ended December 31, 20192022 and 20182021 (amounts in thousands). All inter-company transactions between the reported segments for the periods presented have been eliminated.
TTEC Digital
|
|
|
|
|
|
|
|
|
|
|
|
|
| |||||||||||||
|
| Year Ended December 31, |
|
|
|
|
|
|
| |||||||||||||||||
|
| 2019 |
| 2018 |
| $ Change |
| % Change |
|
| ||||||||||||||||
| | | | | | | | | | | | | | |||||||||||||
| | Year Ended December 31, | | | | | |
| | |||||||||||||||||
|
| 2022 |
| 2021 |
| $ Change |
| % Change |
| | ||||||||||||||||
Revenue |
| $ | 305,346 |
| $ | 238,799 |
| $ | 66,547 |
| 27.9 | % |
| | $ | 471,523 | | $ | 414,104 | | $ | 57,419 |
| 13.9 | % | |
Operating Income |
|
| 38,927 |
|
| 33,054 |
|
| 5,873 |
| 17.8 | % |
| |
| 33,729 | |
| 35,437 | |
| (1,708) |
| (4.8) | % | |
Operating Margin |
|
| 12.7 | % |
| 13.8 | % |
|
|
|
|
|
| |
| 7.2 | % |
| 8.6 | % | | | | | | |
The increase in revenue for the TTEC Digital segment was related to significantdriven by increases in the cloud platform and the systemssystem integration practice including a large multi-year governmental contract and increases in the digital learning and insights practices, offset by reductions in both the legacy facilitation based training and lower volumes in the Middle East business, which the Company is in the processacquisition of winding down.Avtex.
36
The operating income expansionreduction is primarily attributable to theincreased revenue growth, improved utilization of technology and people assets as the business scales its cloud and system integration revenue. The operating income increase wasprogram gross margins offset by investmentsa continued investment in sales and marketing, product engineering and a $2.0geographic expansion and $1.7 million impairment of intangible and other long-lived assets related to the facilitation componentaccelerated amortization of this segment.software. The operating income as a percentage of revenue decreased slightly to 12.7%7.2% in 20192022 as compared to 13.8%8.6% in 2018.2021. Included in the operating income was amortization related to acquired intangibles of $2.6$19.9 million and $2.5$18.8 million for the years ended December 31, 20192022 and 2018,2021, respectively.
TTEC Engage
|
|
|
|
|
|
|
|
|
|
|
|
|
| |||||||||||||
|
| Year Ended December 31, |
|
|
|
|
|
|
| |||||||||||||||||
|
| 2019 |
| 2018 |
| $ Change |
| % Change |
|
| ||||||||||||||||
| | | | | | | | | | | | | | |||||||||||||
| | Year Ended December 31, | | | | | |
| | |||||||||||||||||
|
| 2022 |
| 2021 |
| $ Change |
| % Change |
| | ||||||||||||||||
Revenue |
| $ | 1,338,358 |
| $ | 1,270,372 |
| $ | 67,986 |
| 5.4 | % |
| | $ | 1,972,184 | | $ | 1,858,958 | | $ | 113,226 |
| 6.1 | % | |
Operating Income |
|
| 84,782 |
|
| 59,000 |
|
| 25,782 |
| 43.7 | % |
| |
| 134,814 | |
| 181,755 | |
| (46,941) |
| (25.8) | % | |
Operating Margin |
|
| 6.3 | % |
| 4.6 | % |
|
|
|
|
|
| |
| 6.8 | % |
| 9.8 | % | | | | | | |
The increase in revenue for the TTEC Engage segment was due to a net increase of $172.2$325.8 million in client programs including noteworthy increases in the customer growth, @home and fraud detection and prevention offerings as well as our automotive and hypergrowth born digital sectors, our acquisition of FCR,Faneuil, offset by a decrease for program completions of $173.1 million and a $1.6$39.5 million increasedecrease due to foreign currency fluctuations. This increase was offset by decreases for program completions of $88.0 million, a $17.9 million reduction due to the initial adoption of ASC 606 related to revenue in 2018.
The operating income increaseddecreased due to the change in linerevenue mix away from COVID-surge programs, ramp costs for the new programs, incremental growth-oriented investments, integration-related costs associated with the improved revenue, pricing increasesFaneuil acquisition, increased amortization of acquisition related intangible assets, $18.4 million of restructuring and impairment charges related to rising wages, lower healthcare costs, improved profitabilityreal estate leases and internally developed software that will not be used in our customer growth, @homethe future, and fraud detection and prevention offerings and our automotive and hypergrowth client portfolios, and a $6.4$6.8 million volume commitment payment. Additionally,of accelerated amortization of software. Prior year operating income for the same period was impacted by the cybersecurity incident which reduced the operating income was positively affected by $6.7 million of foreign currency fluctuations and negatively impacted by an $9.8 million decrease due to the initial adoption of ASC 606 in 2018.$13.4 million. As a result, the operating income as a percentage of revenue increaseddecreased to 6.3%6.8% in 20192022 as compared to 4.6%9.8% in the prior period. Included in the operating income was amortization expense related to acquired intangibles of $9.0$17.2 million and $8.2$13.2 million for the years ended December 31, 20192022 and 2018,2021, respectively.
33
Interest Income (Expense)
Interest income decreasedincreased to $1.9$1.8 million in 20192022 from $4.5$0.8 million in 2018 due to lower average cash balances.2021. Interest expense decreasedincreased to $19.1$36.1 million during 20192022 from $28.7$12.4 million during 2018,2021, primarily due to lowerhigher utilization of the line of credit and a $5.3 million reduction in the charge related to the future purchase of the remaining 30%higher interest in Motif versus the prior year.rates.
Other Income (Expense), Net
For the year ended December 31, 2022 Other income (expense), net increased to net income of $10.2 million from net income of $2.3 million during the prior year.
Included in the year ended December 31, 20192022 was a $2.4gain of $4.1 million benefitdue to insurance recovery related to property damages and a net $1.8 million expense related to the fair value adjustmentadjustments of contingent consideration accruals and receivables for an acquisition, a $1.4 million benefit on recovery of receivables in connection with the consulting business that we are winding down, a $1.4 million benefit related to royalty payments in connection with the sale of a business, and a $0.7 million benefit on the sale of trademarks.one acquisition.
Included in the year ended December 31, 20182021 was a $15.6net $1.2 million impairment of the full value of an equity investment and a related bridge loan, a net $1.6 million loss related to a business unit which was classified as assets held for sale but was reclassified to assets held and used at December 31, 2018, a $2.0 million gain related to royalty payments in connection with the sale of a business unit, a $0.7 million gainexpense related to the bargain purchase for the Percepta acquisition closed on March 31, 2018, and a $0.3 million benefit related to a fair value adjustmentadjustments of the contingent consideration based on revised estimates of performance against targets for one of ourtwo acquisitions.
For further information on the above items, see Part II. Item 8. Financial Statements, Note 2 to the Consolidated Financial Statements.
Income Taxes
The reported effective tax rate for 20192022 was 23.3%18.8% as compared to 29.3%23.9% for 2018.2021. The effective tax rate for 20192022 was impacted by earnings in international jurisdictions currently under an income tax holiday, $0.7a $1.4 million of expensebenefit related to changes in tax contingent liabilities, a $1.7$0.4 million benefit related to provision to return adjustments, $0.9 million of expense related to the cybersecurity incident, a $0.5 million benefit related to changes in valuation allowances and related deferred tax liabilities, a $5.0 million benefit related to restructuring charges, a $0.7 million benefit related to tax rate changes, a $5.7 million benefit related to equity based compensation, a $9.7 million benefit related to the amortization of purchased intangibles, and a $2.2 million benefit related to accelerated amortization of software. Without these items our effective tax rate for the year ended December 31, 2022 would have been 22.9%.
37
For the year ended December 31, 2021, our effective tax rate was 23.9%. The effective tax rate for 2021 was impacted by earnings in international jurisdictions currently under an income tax holiday, a $0.8 million benefit related to changes in tax contingent liabilities, a $1.3 million benefit related to provision to return adjustments, a $2.8$3.5 million benefit related to tax rate changes, $4.5the cybersecurity incident, $13.9 million of expense related to changes in valuation allowances, a $0.9$3.8 million benefit related to restructuring charges, $4.1 million of expense related to international legal entity reorganization, a $9.6 million benefit related to equity based compensation, an $8.3 million benefit related to the amortization of purchased intangibles, and $0.3$0.1 million of other benefits. Without these items our effective tax rate for the year ended December 31, 20192021 would have been 22.9%.
For the year ended December 31, 2018, our effective tax rate was 29.3%. The effective tax rate for 2018 was impacted by earnings in international jurisdictions currently under an income tax holiday, $1.6 million of expense related to changes in tax contingent liabilities, a $3.4 million benefit related to provision to return adjustments, a $4.2 million benefit related to the impairment of an equity investment, $0.5 million of expense related to the disposition of assets, $1.5 million of expense related to changes in valuation allowances, a $0.7 million benefit related to excess taxes on equity compensation, a $2.1 million benefit related to restructuring charges, and $0.5 million of other benefits. Without these items our effective tax rate for the year ended December 31, 2018 would have been 25.6%21.3%.
Year Ended December 31, 20182021 compared to December 31, 20172020
For a discussion of our results of operations for the year ended December 31, 20182021 compared to the year ended December 31, 2017,2020, please see Part II. Item 7. Management’s Discussion and Analysis of Financial Condition and Results of Operations – Results of Operations in our Annual Report on Form 10-Kfor the year ended December 31, 2018.2021.
Liquidity and Capital Resources
Our principal sources of liquidity are our cash generated from operations, our cash and cash equivalents, and borrowings under our Credit Facility.Facility (as defined below). During the year ended December 31, 2019,2022, we generated positive operating cash flows of $238.0$137.0 million. We believe that our cash generated from operations, existing cash and cash equivalents, and available credit will be sufficient to meet expected operating and capital expenditure requirements for the next 12 months.
34
months, however, if our access to capital is restricted or our borrowing costs increase, our operations and financial condition could be adversely impacted.
We manage a centralized global treasury function in the United States with a focus on concentratingsafeguarding and safeguardingoptimizing the use of our global cash and cash equivalents. While the majority of ourOur cash is held outsidein the U.S., we prefer to hold in U.S. Dollarsdollars, and outside of the U.S. in addition to the local currencies of ourU.S. dollars and foreign subsidiaries.currencies. We expect to use our offshore cash to supportfund working capital, global operations, dividends, acquisitions, and growth of our foreign operations.other strategic activities. While there are no assurances, we believe our global cash is well protected given our cash management practices, banking partners and utilization of diversified bank deposit accounts and other high quality investments.
In 2018 and 2019, the Company paid dividends from its foreign operations to its U.S. parent in the amount of $310 million and $39 million, respectively, which were used to pay down portions of the Credit Facility.
We have global operations that expose us to foreign currency exchange rate fluctuations that may positively or negatively impact our liquidity. We are also exposed to higher interest rates associated with our variable rate debt. To mitigate these risks, we enter into foreign exchange forward and option contracts through our cash flow hedging program. Please refer to Item 7A. Quantitative and Qualitative Disclosures About Market Risk, Foreign Currency Risk, for further discussion.
In early April 2021, we drew down approximately $500 million on the Credit Facility in order to provide funding for the acquisition of Avtex Solutions, Holdings LLC.
We primarily utilize our Credit Facility to fund working capital, general operations, stock repurchases, dividends, and other strategic activities, such as the acquisitions described in Part II. Item 8. Financial Statements and Supplementary Data, Note 2 to the Consolidated Financial Statements. During the fourth quarter of 2021, the Credit Facility was amended including an increase to $1.5 billion of total commitments (see discussion below in the Debt Instruments and Related Covenants). As of December 31, 20192022 and 2018,2021, we had borrowings of $290.0$960.0 million and $282.0$791.0 million, respectively, under our Credit Facility, and our average daily utilization was $331.8$1,037.4 million and $514.7$797.2 million for the years ended December 31, 20192022 and 2018,2021, respectively. After consideration for the current level of availability based on the covenant calculations, our remaining borrowing capacity was approximately $530.0$335 million as of December 31, 2019.2022. As of December 31, 2019,2022, we were in compliance with all covenants and conditions under our Credit Facility.
The amount of capital required over the next 12 months will depend on our levels of investment in infrastructure necessary to maintain, upgrade or replace existing assets. Our working capital and capital expenditure requirements could also increase materially in the event of acquisitions or joint ventures, among other factors. These factors could require that we raise additional capital through future debt or equity financing. We can provide no assurance that we will be able to raise additional capital with commercially reasonable terms acceptable to us.
38
The following discussion highlights our cash flow activities during the years ended December 31, 20192022 and 2018.2021.
Cash and Cash Equivalents
We consider all liquid investments purchased within 90 days of their original maturity to be cash equivalents. Our cash and cash equivalents totaled $82.4$153.4 million and $78.2$158.2 million as of December 31, 20192022 and 2018,2021, respectively. We diversify the holdings of such cash and cash equivalents considering the financial condition and stability of the counterparty institutions.
We reinvest our cash flows to grow our client base, expand our infrastructure, for investment in research and development, for strategic acquisitions, and to pay dividends.
Cash Flows from Operating Activities
For the years 20192022 and 20182021 we reported net cash flows provided by operating activities of $238.0$137.0 million and $168.3$251.3 million, respectively. The increasedecrease of $69.6$114.2 million from 20182021 to 20192022 was primarily due to a $23.9$17.4 million increasedecrease in net cash income from operations and a $45.7$96.9 million improvementreduction in net working capital.
Cash Flows from Investing Activities
For the years 20192022 and 2018,2021, we reported net cash flows used in investing activities of $162.9$226.2 million and $47.6$542.0 million, respectively. The net increasedecrease in cash used in investing activities from 20182021 to 20192022 was primarily due to a $17.3decrease related to acquisitions of $339.3 million offset by a $23.7 million increase in capital expenditures and a $98.3 million increase related to acquisitions. expenditures.
35
Cash Flows from Financing Activities
For the years 20192022 and 2018,2021, we reported net cash flows used inprovided by financing activities of $47.4$89.0 million and $102.1$319.6 million, respectively. The change in net cash flows from 20182021 to 20192022 was primarily due to a $70.0$237.0 million paydown onnet change in the line of credit and a $4.6 million payment related to the hold-back for an acquisition, a $3.4$5.9 million increase in dividends paid to shareholders, offset by a $4.2 million decrease in tax payments related to restricted stock units, a $3.6 million decrease in payment of debt issuance costs, and a $5.9$3.4 million of increaseddecrease in payments on other debt.
Free Cash Flow
Free cash flow (see “Presentation of Non-GAAP Measurements” below for the definition of free cash flow) was $177.2$53.0 million and $124.9$190.9 million for the years 20192022 and 2018,2021, respectively. The increasedecrease from 20182021 to 20192022 was primarily due to an increasea decrease in the net cash from operations offset by higherand an increase in capital expenditures and higher spending on acquisitions. expenditures.
Presentation of Non-GAAP Measurements
Free Cash Flow
Free cash flow is a non-GAAP liquidity measurement. We believe that free cash flow is useful to our investors because it measures, during a given period, the amount of cash generated that is available for debt obligations and investments other than purchases of property, plant and equipment. Free cash flow is not a measure determined by GAAP and should not be considered a substitute for “income from operations,” “net income,” “net cash provided by operating activities,” or any other measure determined in accordance with GAAP. We believe this non-GAAP liquidity measure is useful, in addition to the most directly comparable GAAP measure of “net cash provided by operating activities,” because free cash flow includes investments in operational assets. Free cash flow does not represent residual cash available for discretionary expenditures, since it includes cash required for debt service. Free cash flow also includes cash that may be necessary for acquisitions, investments and other needs that may arise.
39
The following table reconciles net cash provided by operating activities to free cash flow for our consolidated results (in thousands):
|
|
|
|
|
|
|
| |||||||||
|
| Year Ended December 31, | ||||||||||||||
|
| 2019 |
| 2018 |
| |||||||||||
| | | | | | | | |||||||||
| | Year Ended December 31, | ||||||||||||||
|
| 2022 |
| 2021 | | |||||||||||
Net cash provided by operating activities |
|
| $ | 237,989 |
| $ | 168,345 |
| | | $ | 137,048 | | $ | 251,296 | |
Less: Purchases of property, plant and equipment |
|
|
| 60,776 |
|
| 43,450 |
| | |
| 84,012 | |
| 60,358 | |
Free cash flow |
|
| $ | 177,213 |
| $ | 124,895 |
| | | $ | 53,036 | | $ | 190,938 | |
Obligations and Future Capital Requirements
Future maturities ofAt December 31, 2022, our outstanding debt andfuture contractual obligations aswere related primarily to debt, leases and income taxes. See the following footnotes in Part II. Item 8. Financial Statements and Supplementary Data: Note 10 Income Taxes, Note 12 Indebtedness, Note 13 Commitments and Contingencies and Note 15 Leases for a discussion of December 31, 2019 are summarized as follows (in thousands):the obligation and timing of required payments.
|
|
|
|
|
|
|
|
|
|
|
|
|
|
|
|
|
|
| Less than |
| 1 to 3 |
| 3 to 5 |
| Over 5 |
|
|
|
| ||||
|
| 1 Year |
| Years |
| Years |
| Years |
| Total |
| |||||
|
|
|
|
|
|
|
|
|
|
|
|
|
|
|
|
|
Credit Facility(1) |
| $ | 8,960 |
| $ | 17,921 |
| $ | 300,065 |
| $ | — |
| $ | 326,946 |
|
Equipment financing arrangements |
|
| 6,825 |
|
| 7,313 |
|
| 1,414 |
|
| — |
|
| 15,552 |
|
Purchase obligations |
|
| 11,485 |
|
| 7,848 |
|
| 813 |
|
| — |
|
| 20,146 |
|
Operating lease commitments undiscounted) |
|
| 54,903 |
|
| 91,482 |
|
| 42,618 |
|
| 14,734 |
|
| 203,737 |
|
Transition tax related to US 2017 Tax Act |
|
| 3,300 |
|
| 6,700 |
|
| 14,600 |
|
| 4,422 |
|
| 29,022 |
|
Other debt |
|
| 43,803 |
|
| 470 |
|
| 71 |
|
| — |
|
| 44,344 |
|
Total |
| $ | 129,276 |
| $ | 131,734 |
| $ | 359,581 |
| $ | 19,156 |
| $ | 639,747 |
|
|
|
36
|
|
|
|
|
|
Our outstanding debt is primarily associated with the use of funds under our Credit Agreement to fund working capital, for strategic acquisitions, to pay dividends and for other cash flow needs across our global operations.
Purchase Obligations
Occasionally we contract with certain of our communications clients to provide us with telecommunication services. These clients currently represent approximately 12%5% of our total annual revenue. We believe these contracts are negotiated on an arm’s-length basis and may be negotiated at different times and with different legal entities.
Future Capital Requirements
We expect total capital expenditures in 20202023 to be between 3.6%3.3% and 3.8%3.5% of revenue. Approximately 65% of these expected capital expenditures are to support growth in our business and 35% relate to the maintenance of existing assets. The anticipated level of 20202023 capital expenditures is primarily driven by new client contracts and the corresponding requirements for additional customer engagement center capacity as well as enhancements to our technological infrastructure.
We may consider restructurings, dispositions, mergers, acquisitions and other similar transactions. Such transactions could include the transfer, sale or acquisition of significant assets, businesses or interests, including joint ventures or the incurrence, assumption, or refinancing of indebtedness and could be material to the consolidated financial condition and consolidated results of our operations. Our capital expenditures requirements could also increase materially in the event of an acquisition or joint venture. In addition, as of December 31, 2019,2022, we were authorized to purchase an additional $26.6 million of common stock under our stock repurchase program (see Item 5. Market for Registrant’s Common Equity, Related Stockholder Matters and Issuer Purchases of Equity Securities). Our stock repurchase program does not have an expiration date.
The launch of large client contracts may result in short-term negative working capital because of the time period between incurring the costs for training and launching the program and the beginning of the accounts receivable collection process. As a result, we may sometimes generate negative cash flows from operating activities.
Debt Instruments and Related Covenants
On February 14, 2019,November 23, 2021, we entered into a FourthSixth Amendment to our Amended and Restated Credit Agreement and Amended and Restated Security Agreement(“the Credit Agreement”) originally dated as of June 3, 2013 (collectively, the “Credit Agreement”Facility”) forto convert the $300 million term loan included in the total Credit Facility commitments, that was previously agreed on March 25, 2021 as part of the Fifth Amendment to the Credit Agreement, into a $1.5 billion senior secured revolving credit facilityCredit Facility with a syndicate of lenders led by Wells Fargo, Bank, National Association, as agent, swing lineswingline and fronting lender (the “Credit Facility”).lender. The amended Credit Agreement provides for a secured revolving Credit Facility that matures on February 14, 2024.
Other than the extension of the Credit Facility’s maturity date and a few material terms outlined below, the material terms of theNovember 23, 2026. We primarily use our Credit Facility including pricingto fund working capital, general operations, dividends, acquisitions and collateral, are substantially the same as those previously disclosed as part of our Annual Report on Form 10-K for the period ended December 31, 2015 (“2016 Credit Facility”).
other strategic activities.
3740
The maximum commitment under the Credit Facility is $900.0 million with an accordion feature of up to $1.2$1.5 billion in the aggregate, if certain conditions are satisfied. The Credit Facility commitment fees are payable to the lenders as previously disclosed and as determined by reference to our net leverage ratio. The Credit Agreement contains customary affirmative, negative, and financial covenants, which primarily remained unchanged from the 20162019 Credit Facility, except that we are now obligated to maintain a maximum net leverage ratio of 3.50 to 1.00, and a minimum Interest Coverage Ratio of 2.50 to 1.00.Facility. The Credit Agreement permits accounts receivable factoring up to the greater of $75$100 million or 25 percent of the average book value of all accounts receivable over the most recent twelve month period.
We primarily utilize our Credit Facility to fund working capital, general operations, dividends, acquisitions, and other strategic activities.
Base rate loans bear interest at a rate equal to the greatest of (i) Wells Fargo’s prime rate, (ii) one half of 1% in excess of the federal funds effective rate, or (iii) 1.25% in excess of the one month London Interbank Offered Rate (“LIBOR”), plus in each case a margin of 0% to 0.75% based on our net leverage ratio. Eurodollar loans bear interest at LIBOR plus a margin of 1.0% to 1.75% based on our net leverage ratio. Alternate currency loans bear interest at rates applicable to their respective currencies.
Letter of credit fees are one eighth of 1% of the stated amount of the letter of credit on the date of issuance, renewal or amendment, plus an annual fee equal to the borrowing margin for Eurodollar loans.
Indebtedness under the Credit Agreement is guaranteed by certain of our domestic subsidiaries and is secured by security interests (subject to permitted liens) in the U.S. accounts receivable and cash of our Company and certain of its domestic subsidiaries. The indebtedness may also be secured by tangible assets of our Company and its domestic subsidiaries, if borrowings by foreign subsidiaries exceed $100.0 million7.5% of our Company’s consolidated total assets and the total net leverage ratio is greater than 3.003.25 to 1.00. We also pledged 65% of the voting stock and all of the non-voting stock, if any, of certain of our material foreign subsidiaries.
The Credit Facility also contains certain customary information and reporting requirements, and events of default, including without limitation events of default based on payment obligations, material inaccuracies of representations and warranties, covenant defaults, cross defaults to certain other debt, certain ERISA events, changes in control, monetary judgments, and insolvency proceedings. Upon the occurrence of an event of default, the lenders may accelerate the maturity of all amounts outstanding under the Credit Facility.
As of December 31, 20192022 and 2018,2021, we had borrowings of $290.0$960.0 million and $282.0$791.0 million, respectively, under the Credit Facility. During 2019, 20182022, 2021 and 2017,2020, borrowings accrued interest at an average rate of approximately 3.4%3.1%, 3.1%1.3%, and 2.2%1.6% per annum, respectively, excluding unused commitment fees. Our daily average borrowings during 2019, 20182022, 2021 and 20172020 were $331.8$1,037.4 million, $514.7$797.2 million and $494.7$550.9 million, respectively. As of December 31, 2019,2022, and 2018,2021, based on the current level of availability based on the covenant calculations, the remaining borrowing capacity was approximately $530.0$335 million and $360.0$565 million, respectively.
Off-Balance Sheet Arrangements
As of December 31, 2019, we had no transactions that met the definition of off-balance sheet arrangements that may have a current or future material effect on our consolidated financial position or operating results.
38
Client Concentration
During 2019, none2022, only one of our clients represented more than 10% of our total annual revenue. Our five largest clients accounted for 37%, 35% and 35%38% of our annual revenue for each of the threetwo years ended December 31, 2019, 20182022 and 2017,2021, respectively. We have long-term relationships with our top five Engage clients, ranging from 1316 to 23 years, with the majorityall of these clients having completed multiple contract renewals with us. The relative contribution of any single client to consolidated earnings is not always proportional to the relative revenue contribution on a consolidated basis and varies greatly based upon specific contract terms. In addition, clients may adjust business volumes served by us based on their business requirements. We believe the risk of this concentration is mitigated, in part, by the long-term contracts we have with our largest clients. Although certain client contracts may be terminated for convenience by either party, we believe this risk is mitigated, in part, by the service level disruptions and transition/migration costs that would arise for our clients if they terminated our contract for convenience.
TheSome of the contracts with our five largest clients expire between 20202023 and 2023. Additionally, a particular client may2025, but many of our largest clients have multiple contracts with us with different expiration dates.dates for different lines of work. We have historically renewed most of our contracts with our largest clients, but there can be no assurance that future contracts will be renewed or, if renewed, will be on terms as favorable as the existing contracts.
41
Cybersecurity Investments and Governance
We have made and continue to make significant financial investments in technologies and processes to mitigate cyber risks. We have a number of complex information systems used for a variety of functions ranging from services we deliver to our clients and their customers to support for our operations. We dependThe effective operation of our business depends on the proper functioning of these information systems. Like any information system, theyour systems are susceptible to cyber-attack. Any cyber-attack could impact the availability, reliability, speed, accuracy, or other proper functioning of these systems or result in confidentialour data, our employees’ data and our clients’ data that we retain for the provision of our services being compromised, which could have a significant impact on our reputation, results of operations, and financial condition. Our information systems are protected through physical and technological safeguards as well as backup systems and protocols considered appropriate by management. We also provide role-based employee cybersecurity risk awareness training about phishing, malware, social engineering, data protection, and other cyber risks. Further, several years ago we have formed a cybersecurity specific risk management steering committee that is comprised of technology leaders and management from each of our business segments, leaders from our information technology and information security organizations; representatives from our regulatory and risk oversight functions and our internal audit group. This steering committee meets periodicallyregularly to fully coordinate all enterprise level cybersecurity issues. Ourrisk management issues and set proactive priorities to secure the business. In 2022, our Board of Directors formed a new Board committee – the Security & Technology Committee, with the delegated authority from the Board to oversee TTEC cybersecurity risk management, stability of our technology, and our data governance and protection (prior to last year, the Audit Committee of our Board had similar oversight responsibilities but the Board determined that the issues warrant a special dedicated committee of the Board that draws on the expertise of Board members with special technology and cybersecurity experience). Our executive leadership team and the Security & Technology Committee are updated at least quarterly on the progress and status of our cybersecurity and technology priorities. We continuously monitor and develop our information technology networks and infrastructure to prevent, detect, address, and mitigate the risk of unauthorized access, distributed denial of service attacks, malware attacks, computer viruses, cyber fraud, and other events intended to disrupt information systems, theft of valuableunauthorized access to confidential information, or other types of malicious events that may result in harm to our business. Our investment in cybersecurity is not expected to decrease in the foreseeable future, and despite our on-going efforts to improve our cybersecurity, there can be no assurance that a sophisticated cyber-attack could timely be detected or thwarted.
Recently Issued Accounting Pronouncements
We discuss the potential impact of recent accounting pronouncements in Part II, Item 8. Financial Statements and Supplementary Data, Note 1 to the Consolidated Financial Statements.
Changes in Accounting Principle
As discussedSee discussion of adopted accounting standards in Part II, Item 8. Financial Statements and Supplementary Data, Note 1 the Company changed its method of accounting for leases in 2019 due to the adoption of Accounting Standards Update (“ASU”) No. 2016-02, Leases (Topic 842).Consolidated Financial Statements.
39
ITEM 7A. QUANTITATIVE AND QUALITATIVE DISCLOSURES ABOUT MARKET RISK
Market risk represents the risk of loss that may impact our consolidated financial position, consolidated results of operations, or consolidated cash flows due to adverse changes in financial and commodity market prices and rates. Market risk also includes credit and non-performance risk by counterparties to our various financial instruments. We are exposed to market risks due to changes in interest rates and foreign currency exchange rates (as measured against the U.S. dollar), as well as credit risk associated with potential non-performance of our counterparty banks. These exposures are directly related to our normal operating and funding activities. We enter into derivative instruments to manage and reduce the impact of currency exchange rate changes, primarily between the U.S. dollar/Philippine peso, the U.S. dollar/Mexican peso, and the Australian dollar/Philippine peso. We enter into interest rate derivative instruments to reduce our exposure to interest rate fluctuations associated with our variable rate debt. To mitigate against credit and non-performance risk, it is our policy to only enter into derivative contracts and other financial instruments with investment grade counterparty financial institutions and, correspondingly, our derivative valuations reflect the creditworthiness of our counterparties. As of the date of this report, we have not experienced, nor do we anticipate, any issue related to derivative counterparty defaults.
42
Interest Rate Risk
We have previously entered into interest rate derivative instruments to reduce our exposure to interest rate fluctuations associated with our variable rate debt. The interest rate on our Credit Agreement is variable based upon the Prime Rate and LIBOR and, therefore, is affected by changes in market interest rates. As of December 31, 2019,2022, we had $290.0$960.0 million of outstanding borrowings under the Credit Agreement. Based upon average daily outstanding borrowings during the years ended December 31, 20192022 and 2018,2021, interest accrued at a rate of approximately 3.4%3.1% and 3.1%1.3% per annum, respectively. If the Prime Rate or LIBOR increased by 100 basis points, there would be $1.0 million of additional interest expense per $100.0 million of outstanding borrowing under the Credit Agreement.
The Company’s interest rate swap arrangement expired as of May 31, 2017 and no additional swaps have been entered into since that time.
Foreign Currency Risk
Our subsidiaries in the Philippines, Mexico, India, Bulgaria and Poland use the local currency as their functional currency for paying labor and other operating costs. Conversely, revenue for these foreign subsidiaries is derived principally from client contracts that are invoiced and collected in U.S. dollars or other foreign currencies. As a result, we may experience foreign currency gains or losses, which may positively or negatively affect our results of operations attributed to these subsidiaries. For the years ended December 31, 2019, 20182022, 2021 and 2017,2020, revenue associated with this foreign exchange risk was 22%20%, 23%17% and 26%17% of our consolidated revenue, respectively.
The following summarizes relative (weakening) strengthening of local currencies that are relevant to our business:
|
|
|
|
|
|
|
| |||||||
|
| Year Ended December 31, |
| |||||||||||
|
| 2019 |
| 2018 |
| 2017 |
| |||||||
| | | | | | | | |||||||
| | Year Ended December 31, |
| |||||||||||
|
| 2022 |
| 2021 |
| 2020 |
| |||||||
Canadian Dollar vs. U.S. Dollar |
| 4.5 | % | (8.6) | % | 6.6 | % |
| (6.6) | % | 0.3 | % | 2.1 | % |
Philippine Peso vs. U.S. Dollar |
| 3.5 | % | (5.1) | % | (0.8) | % |
| (9.2) | % | (6.4) | % | 5.2 | % |
Mexican Peso vs. U.S. Dollar |
| 3.8 | % | 0.2 | % | 5.0 | % |
| 4.8 | % | (2.9) | % | (5.2) | % |
Australian Dollar vs. U.S. Dollar |
| (0.6) | % | (10.7) | % | 7.7 | % |
| (6.5) | % | (6.1) | % | 9.0 | % |
Euro vs. U.S. Dollar |
| (2.0) | % | (4.7) | % | 12.1 | % |
| (5.9) | % | (8.1) | % | 8.6 | % |
Indian Rupee vs. U.S. Dollar | | (11.3) | % | (1.8) | % | (2.5) | % | |||||||
Philippine Peso vs. Australian Dollar |
| 4.0 | % | 5.0 | % | (9.2) | % |
| (2.5) | % | (0.2) | % | (4.2) | % |
40
In order to mitigate the risk of these non-functional foreign currencies weakening against the functional currencies of the servicing subsidiaries, which thereby decreases the economic benefit of performing work in these countries, we may hedge a portion, though not 100%, of the projected foreign currency exposure related to client programs served from these foreign countries through our cash flow hedging program. While our hedging strategy can protect us from adverse changes in foreign currency rates in the short term, an overall weakening of the non-functional revenue foreign currencies would adversely impact margins in the segments of the servicing subsidiary over the long term.
Cash Flow Hedging Program
To reduce our exposure to foreign currency exchange rate fluctuations associated with forecasted revenue in non-functional currencies, we purchase forward and/or option contracts to acquire the functional currency of the foreign subsidiary at a fixed exchange rate at specific dates in the future. We have designated and account for these derivative instruments as cash flow hedges for forecasted revenue in non-functional currencies.
While we have implemented certain strategies to mitigate risks related to the impact of fluctuations in currency exchange rates, we cannot ensure that we will not recognize gains or losses from international transactions, as this is part of transacting business in an international environment. Not every exposure is or can be hedged and, where hedges are put in place based on expected foreign exchange exposure, they are based on forecasts for which actual results may differ from the original estimate. Failure to successfully hedge or anticipate currency risks properly could adversely affect our consolidated operating results.
43
Our cash flow hedging instruments as of December 31, 20192022 and 20182021 are summarized as follows (in thousands). All hedging instruments are forward contracts, except as noted.
| | | | | | | | | | | | |
|
| Local |
| | |
|
| |
|
| |
|
| | Currency | | U.S. Dollar | | | % Maturing | | | Contracts |
| |
| | Notional | | Notional | | | in the next | | | Maturing |
| |
As of December 31, 2022 | | Amount | | Amount | | | 12 months | | | Through |
| |
Canadian Dollar |
| 12,000 | | $ | 9,177 | | | 100.0 | % | | December 2023 | |
Philippine Peso |
| 8,617,000 | |
| 157,855 | (1) | | 55.7 | % | | September 2025 | |
Mexican Peso |
| 1,024,500 | |
| 44,690 | | | 60.2 | % | | March 2025 | |
| | | | $ | 211,722 | | | | | | | |
| | | | | | | | | | | | |
|
| Local |
| | |
|
| | |
| | |
| | Currency | | U.S. Dollar |
| | | | | | | |
| | Notional | | Notional |
| | | | | | | |
As of December 31, 2021 | | Amount | | Amount |
| | | | | | | |
Canadian Dollar |
| 9,000 | | $ | 7,022 | | | | | | | |
Philippine Peso |
| 8,472,000 | | | 164,295 | (1) | | | | | | |
Mexican Peso |
| 1,422,500 | |
| 63,002 | | | | | | | |
| | | | $ | 234,319 | | | | | | | |
|
|
|
|
|
|
|
|
|
|
|
|
|
|
| Local |
|
|
|
|
|
|
|
|
|
|
|
| Currency |
| U.S. Dollar |
|
| % Maturing |
|
| Contracts |
| |
|
| Notional |
| Notional |
|
| in the next |
|
| Maturing |
| |
As of December 31, 2019 |
| Amount |
| Amount |
|
| 12 months |
|
| Through |
| |
Philippine Peso |
| 7,715,000 |
|
| 147,654 | (1) |
| 58.2 | % |
| December 2022 |
|
Mexican Peso |
| 1,299,500 |
|
| 61,529 |
|
| 46.9 | % |
| December 2022 |
|
|
|
|
| $ | 209,183 |
|
|
|
|
|
|
|
|
|
|
|
|
|
|
|
|
|
|
|
|
|
| Local |
|
|
|
|
|
|
|
|
|
|
|
| Currency |
| U.S. Dollar |
|
|
|
|
|
|
| |
|
| Notional |
| Notional |
|
|
|
|
|
|
| |
As of December 31, 2018 |
| Amount |
| Amount |
|
|
|
|
|
|
| |
Philippine Peso |
| 6,710,000 |
|
| 130,957 | (1) |
|
|
|
|
|
|
Mexican Peso |
| 1,091,500 |
|
| 57,708 |
|
|
|
|
|
|
|
|
|
|
| $ | 188,665 |
|
|
|
|
|
|
|
| (1) |
| Includes contracts to purchase Philippine pesos in exchange for New Zealand dollars and Australian dollars, which are translated into equivalent U.S. dollars on December 31, |
The fair value of our cash flow hedges at December 31, 20192022 was an assetasset(liability) (in thousands):
|
|
|
|
|
|
|
| |||||||
|
|
|
|
| Maturing in the |
| ||||||||
|
| December 31, 2019 |
| Next 12 Months |
| |||||||||
| | | | | | | | |||||||
| | | | | Maturing in the | | ||||||||
|
| December 31, 2022 |
| Next 12 Months |
| |||||||||
Canadian Dollar | | $ | (300) | | $ | (300) | | |||||||
Philippine Peso |
|
| 2,517 |
|
| 929 |
| |
| (4,458) | |
| (4,048) | |
Mexican Peso |
|
| 3,157 |
|
| 1,315 |
| |
| 4,873 | |
| 3,219 | |
|
| $ | 5,674 |
| $ | 2,244 |
| |||||||
| | $ | 115 | | $ | (1,129) | | |||||||
Our cash flow hedges are valued using models based on market observable inputs, including both forward and spot foreign exchange rates, implied volatility, and counterparty credit risk. The fair value of our cash flow hedges increased by $17.0 million$200 thousand from December 31, 20182021 to December 31, 2019.2022. The increase in fair value from December 31, 2018 largely2021 primarily reflects a reductionchanges in the total notional value of outstanding cash flow hedgescurrency translation between the U.S. dollar and an increase in average hedge exchange rates.
41
Mexican Peso and U.S. dollar and Philippines Peso.
We recorded net losses(losses)/gains of $4.2$(2.9) million, $17.5$4.9 million, and $22.8$2.6 million for settled cash flow hedge contracts for the years ended December 31, 2019, 2018,2022, 2021, and 2017,2020, respectively. These lossesgains(losses) were reflected in Revenue in the accompanying Consolidated Statements of Comprehensive Income (Loss). If the exchange rates between our various currency pairs were to increase or decrease by 10% from current period-end levels, we would incur a material gain or loss on the contracts. However, any gain or loss would be mitigated by corresponding increases or decreases in our underlying exposures.
Other than the transactions hedged as discussed above and in Part II. Item 8. Financial Statements and Supplementary Data, Note 8 to the Consolidated Financial Statements, the majority of the transactions of our U.S. and foreign operations are denominated in their respective local currency. However, transactions are denominated in other currencies from time-to-time. We do not currently engage in hedging activities related to these types of foreign currency risks because we believe them to be insignificant as we endeavor to settle these accounts on a timely basis. For the years ended 20192022 and 2018,2021, approximately 21%14% and 23%14%, respectively, of revenue was derived from contracts denominated in currencies other than the U.S. Dollar. Our results of operations and revenue could be adversely affected if the U.S. Dollar strengthens significantly against foreign currencies.
44
Fair Value of Debt and Equity Securities
We did not have any investments in marketable debt or equity securities as of December 31, 20192022 or 2018.2021.
ITEM 8. FINANCIAL STATEMENTS AND SUPPLEMENTARY DATA
The financial statements required by this item are located beginning on page F-1 of this report and incorporated herein by reference.
ITEM 9. CHANGES IN AND DISAGREEMENTS WITH ACCOUNTANTS ON ACCOUNTING AND FINANCIAL DISCLOSURE
Not applicable.
ITEM 9A. CONTROLS AND PROCEDURES
This Form 10-K includes the certifications of our Chief Executive Officer (the “CEO”) and Chief Financial Officer (the “CFO”) required by Rule 13a-14 of the Securities Exchange Act of 1934, as amended (the “Exchange Act”). See Exhibits 31.1 and 31.2. This Item 9A includes information concerning the controls and control evaluations referred to in those certifications.
Disclosure Controls and Procedures
Disclosure controls and procedures (as defined in Rules 13a-15(e) and 15d-15(e) under the Exchange Act) are designed to provide reasonable assurance that information required to be disclosed in reports filed or submitted under the Exchange Act is recorded, processed, summarized, and reported within the time periods specified in SEC rules and forms, and that such information is accumulated and communicated to management, including our CEO and CFO, as appropriate, to allow timely decisions regarding required disclosure.
We carried out an evaluation under the supervision and with the participation of management, including the CEO and CFO, of the effectiveness of our disclosure controls and procedures, as of December 31, 2019,2022, the end of the period covered by this Form 10-K. Based on this evaluation, our CEO and CFO have concluded that the Company’s disclosure controls and procedures (as defined in Rules 13a-15(e) and 15d-15(e) under the Securities Exchange Act of 1934, as amended)Act) were effective at the reasonable assurance level.
42
Inherent Limitations of Internal Controls
Our management, including the CEO and CFO, believes that any disclosure controls and procedures or internal control over financial reporting, no matter how well conceived and operated, can provide only reasonable, not absolute, assurance that the objectives of internal controls are met. Further, the design of internal controls must consider the benefits of controls relative to their costs. Inherent limitations within internal controls include the realities that judgments in decision-making can be faulty, and that breakdowns can occur because of simple error or mistake. Additionally, controls can be circumvented by the individual acts of some persons, by collusion of two or more people, or by unauthorized override of the control. Over time, control may become inadequate because of changes in conditions or deterioration in the degree of compliance with associated policies or procedures. While the objective of the design of any system of controls is to provide reasonable assurance of the effectiveness of controls, such design is also based in part upon certain assumptions about the likelihood of future events, and such assumptions, while reasonable, may not take into account all potential future conditions. Thus, even effective internal control over financial reporting can only provide reasonable assurance of achieving their objectives. Therefore, because of the inherent limitations in cost effective internal controls, misstatements due to error or fraud may occur and may not be prevented or detected.
45
Management’s Report on Internal Control over Financial Reporting
Management is responsible for establishing and maintaining adequate internal control over financial reporting, as defined in Rules 13a-15(f) and 15d-15(f) under the Exchange Act. Internal control over financial reporting is a process designed to provide reasonable assurance regarding the reliability of financial reporting and the preparation of financial statements for external purposes in accordance with generally accepted accounting principles. Internal control over financial reporting includes those policies and procedures which (a) pertain to the maintenance of records that, in reasonable detail, accurately and fairly reflect the transactions and dispositions of assets, (b) provide reasonable assurance that transactions are recorded as necessary to permit preparation of financial statements in accordance with generally accepted accounting principles, (c) provide reasonable assurance that receipts and expenditures are being made only in accordance with appropriate authorization of management and the Board of Directors, and (d) provide reasonable assurance regarding prevention or timely detection of unauthorized acquisition, use or disposition of assets that could have a material effect on the financial statements.
In connection with the preparation of this Annual Report on Form 10-K, our management, under the supervision and with the participation of our CEO and CFO, conducted an evaluation of the effectiveness of our internal control over financial reporting as of December 31, 20192022 based on the framework established in Internal Control — Integrated Framework (2013) issued by the Committee of Sponsoring Organizations of the Treadway Commission (“COSO”). As a result of that evaluation, our management concluded that the Company’s internal control over financial reporting was effective as of December 31, 2019,2022, the end of the period covered by this Form 10-K.
We excluded First Call Resolution, LLCthe business acquired from Faneuil, Inc. (“FCR”Faneuil”) from our assessment of internal control over financial reporting as of December 31, 20192022 because this companyit was acquired by the Company in a purchase business combination in 2019. FCR’sduring 2022. Faneuil’s total assets and total revenues represent 12.6%1.9% and 1.2%5.0%, respectively, of the related consolidated financial amounts as of and for the year ended December 31, 2019.2022.
The effectiveness of our internal control over financial reporting as of December 31, 20192022 has been audited by PricewaterhouseCoopers LLP, our independent registered public accounting firm, as stated in their report, which is included herein.
Changes in Internal Control over Financial Reporting
There were no changes in our internal control over financial reporting during the most recent quarter that has materially affected, or is reasonably likely to materially affect, our internal control over financial reporting.
None.
ITEM 9C. DISCLOSURE REGARDING FOREIGN JURISDICTIONS THAT PREVENT INSPECTIONS
Not applicable.
4346
PART III
ITEM 10. DIRECTORS, EXECUTIVE OFFICERS AND CORPORATE GOVERNANCEGOVERNANCE
The information in our 20202023 Definitive Proxy Statement on Schedule 14A, which will be filed no later than 120 days after December 31, 20192022 (the “2020“2023 Proxy Statement”) regarding our executive officers under the heading “Information Regarding Executive Officers” is incorporated herein by reference. We have both the Ethics Code for Senior Executive and Financial Officers and the Ethics Code defining rules of conduct for our employees, partners and suppliers. Our Ethics Code for Senior Executive and Financial Officers applies to our Chief Executive Officer, President, Chief Financial Officer, lead executives of our business segments, Controller, Treasurer, the General Counsel, Chief Audit executive, senior financial officers of each operating segment and other persons performing similar functions. The Ethics Code defines conduct for all directors, officers, employees, partners and suppliers (as applicable). Both the Ethics Code for Senior Executive and Financial Officers and the Ethics Code are posted on our website at www.ttec.com on the Corporate Governance page. We will post on our website any amendments to or waivers under the Ethics Code for Senior Executive and Financial Officers in accordance with applicable laws and regulations.
There have been no material changes to the procedures by which stockholders may recommend nominees to the board of directors. The remaining information called for by this Item 10 is incorporated by reference herein from our 20202023 Proxy Statement.
ITEM 11. EXECUTIVE COMPENSATION
The information in our 20202023 Proxy Statement is incorporated herein by reference.
ITEM 12. SECURITY OWNERSHIP OF CERTAIN BENEFICIAL OWNERS AND MANAGEMENT AND RELATED STOCKHOLDER MATTERS
The information regarding these matters is included in Part II, Item 5. Market for Registrant’s Common Equity, Related Stockholder Matters and Issuer Purchases of Equity Securities. Also the information in our 20202023 Proxy Statement is incorporated herein by reference.
ITEM 13. CERTAIN RELATIONSHIPS AND RELATED TRANSACTIONS, AND DIRECTOR INDEPENDENCE
The information in our 20202023 Proxy Statement is incorporated herein by reference.
ITEM 14. PRINCIPAL ACCOUNTANTS FEES AND SERVICES
The information in our 20202023 Proxy Statement is incorporated herein by reference.
ITEM 15. EXHIBITS AND FINANCIAL STATEMENT SCHEDULES
(a) | The following documents are filed as part of this report: |
(a)The following documents are filed as part of this report:
1. Consolidated Financial Statements.
The Index to Consolidated Financial Statements is set forth on page F-1 of this report.
2. Financial Statement Schedules.
All schedules for TTEC have been omitted since the required information is not present or not present in amounts sufficient to require submission of the schedule, or because the information is included in the respective Consolidated Financial Statements or notes thereto.
4447
3. Exhibits.
3. Exhibits.
EXHIBIT INDEX
| | | | | | | | |
Exhibit | | | | Incorporated Herein by Reference | ||||
No. | Exhibit Description | | Form | | Exhibit | | Filing Date | |
| | | | | | | | |
2.01** | | | 8-K | | 2.01 | | 12/27/2021 | |
| | | | | | | | |
3.01** | | | S-1/A | | 3.01 | | 7/5/1996 | |
| | | | | | | | |
3.03** | | | 8-K | | 3.03 | | 1/9/2018 | |
| | | | | | | | |
3.04** | | Amended and Restated Bylaws of TTEC Holdings, Inc. (reflecting name change) | | 8-K | | 3.04 | | 1/9/2018 |
| | | | | | | | |
4.01** | | | 10-K | | 4.01 | | 3/4/2020 | |
| | | | | | | | |
| | | 8-K | | 10.1 | | 3/3/2021 | |
| | | | | | | | |
10.06** | | | DEF 14A | | A | | 4/12/2010 | |
| | | | | | | | |
| | | DEF 14A | | A | | 4/3/2020 | |
| | | | | | | | |
10.26** | | | 10-Q | |
| |
| |
| | | | | | | | |
| | | 10-Q | | 10.27 | | 8/3/2021 | |
| | | | | | | | |
10.28** | | Form of TTEC Holdings, Inc. Restricted Stock Unit Award Agreement effective July 1, 2021 | | 10-Q | | 10.28 | | 8/3/2021 |
| | | | | | | | |
10.29** | | | 10-K | | 10.29 | | 3/9/2015 | |
| | | | | | | | |
10.30** | | | 10-K | | 10.30 | | 3/9/2015 | |
| | | | | | | | |
| | |
| |
| |
| |
| | | | | | | | |
10.33** | | Form of Indemnification Agreement with Directors and Executive Officers | | 10-Q | | 10.33 | | 11/5/2019 |
| | | | | | | | |
| | Independent Director Compensation Arrangements (effective May 2022) | | 10-K | | 10.34 | | 3/01/2021 |
| | | | | | | | |
10.35** | | | 10-Q | | 10.35 | | 5/5/2022 | |
| | | | | | | | |
48
10.40** | | Employment Agreement between Kenneth D. Tuchman and TeleTech Holdings, Inc. dated October 15, 2001 | | 10-K | | 10.68 | | 4/1/2002 |
| | | | | | | | |
10.41** | | | 10-K | | 10.17 | | 2/23/2009 | |
| | | | | | | | |
10.60** | | | 10-Q | | 10.60 | |
| |
| | | | | | | | |
| | | 10-Q | | 10.81 | | 11/09/2022 | |
| | | | | | | | |
10.83** | | | 8-K | | 10.83 | | 11/12/2021 | |
| | | | | | | | |
10.84** | | | 10-Q | |
| | 5/ | |
| | | | | | | | |
| | |
| |
| |
| |
| | | | | | | | |
10.86** | | | 10-K | | 10.86 | | 3/6/2019 | |
| | | | | | | | |
| | |
| |
| |
|
45
1/6/2023 | ||||||||
| | | | | | | | |
10.90** | | | 8-K | | 10.1 | | 6/7/2013 | |
| | | | | | | | |
10.91** | | | 8-K | | 10.90 | | 2/16/2016 | |
| | | | | | | | |
| | | 8-K | |
| |
| |
| | | | | | | | |
| |
|
|
| ||||
|
|
|
| |||||
| | 8-K | | 10.99 | | 10/29/2019 | ||
| | | | | | | | |
21.1* | | | | | | | | |
| | | | | | | | |
23.1* | | |||||||
| | | | | | | ||
| | | | | | | | |
49
24.1* | | | | | | | | |
| | | | | | | | |
31.1* | | |||||||
| | | | | | | ||
| | | | | | | | |
31.2* | | | | | | | | |
| | | | | | | | |
32.1* |
| | | | | | | |
| | | | | | | | |
32.2* | | | | | | | | |
| | | | | | | | |
101.INS | |
46
| XBRL Instance Document (the instance document does not appear in the Interactive Data File because its XBRL tags are embedded within the Inline XBRL document) | | | | | | | |
| | | | | | | | |
| | XBRL Taxonomy Extension Schema | | | | | | |
| | | | | | | | |
| | XBRL Taxonomy Extension Calculation Linkbase | | | | | | |
| | | | | | | | |
101.DEF | | XBRL Taxonomy Extension Definition Linkbase | | | | | | |
| | | | | | | | |
101.LAB | | XBRL Taxonomy Extension Label Linkbase | | | | | | |
| | | | | | | | |
| | XBRL Taxonomy Extension Presentation Linkbase | | | | | | |
| | | | | | | | |
| | The cover page from TTEC Holdings, Inc’s Annual Report on Form 10-K for the year ended December 31, 2022, formatted in Inline XBRL | | | | | | |
|
* Filed or furnished herewith.
**Identifies exhibit that consists of or includes a management contract or compensatory plan or arrangement.
*** Attached as Exhibit 101 to this report are the following documents formatted in XBRL (Extensible Business Reporting Language): (i) Consolidated Balance Sheets as of December 31, 2019 and 2018, (ii) Consolidated Statements of Comprehensive Income (Loss) for the years ended December 31, 2019, 2018 and 2017, (iii) Consolidated Statements of Stockholders’ Equity for the years ended December 31, 2019, 2018 and 2017, (iv) Consolidated Statements of Cash Flows for the years ended December 31, 2019, 2018 and 2017, and (v) Notes to Consolidated Financial Statements.
None
4750
SIGNATURES
Pursuant to the requirements of Section 13 or 15(d) of the Securities Exchange Act of 1934, the registrant has duly caused this report to be signed on its behalf by the undersigned; thereunto duly authorized on March 4, 2020.
February 28, 2023.
| | |
| TTEC HOLDINGS, INC. | |
| | |
| | |
| By: | /s/ KENNETH D. TUCHMAN |
| | Chief Executive Officer |
Pursuant to the requirements of the Securities Exchange Act of 1934, this report has been signed below on March 4, 2020,February 28, 2023, by the following persons on behalf of the registrant and in the capacities indicated:
| | |
Signature | | Title |
| |
|
| ||
/s/ KENNETH D. TUCHMAN | | PRINCIPAL EXECUTIVE OFFICER |
Kenneth D. Tuchman | | Chief Executive Officer and Chairman of the Board |
| | |
| | |
/s/ | | PRINCIPAL FINANCIAL AND ACCOUNTING OFFICER |
| | Chief Financial Officer |
| | |
* | | DIRECTOR |
Steven J. Anenen | | |
| | |
* | | DIRECTOR |
Tracy L. Bahl | | |
| | |
* | | DIRECTOR |
Gregory A. Conley | | |
| | |
* | | DIRECTOR |
Robert N. Frerichs | | |
| | |
* | | DIRECTOR |
Marc L. Holtzman | | |
| | |
* | | DIRECTOR |
Gina Loften | | |
| | |
* | | DIRECTOR |
Ekta Singh-Bushell | | |
* By /s/ Regina M. PaolilloDustin J. Semach under Power of Attorney as attached hereto as Exhibit 24.1
4851
INDEX TO THE CONSOLIDATED FINANCIAL STATEMENTS OF TTEC HOLDINGS, INC.
| |
| Page No. |
Report of Independent Registered Public Accounting Firm (PCAOB ID 238) | F-2 |
Consolidated Balance Sheets as of December 31, |
|
| |
| |
| |
|
F-1
Report of Independent Registered Public Accounting Firm
To theBoard of Directors and Stockholders of TTEC Holdings, Inc.
Opinions on the Financial Statements and Internal Control over Financial Reporting
We have audited the accompanying consolidated balance sheets of TTEC Holdings, Inc. and its subsidiaries (the “Company”) as of December 31, 20192022 and 2018,2021, and the related consolidated statements of comprehensive income (loss), of stockholders’ equity and mezzanine equity, and of cash flows for each of the three years in the period ended December 31, 2019,2022, including the related notes (collectively referred to as the “consolidated financial statements”). We also have audited the Company's internal control over financial reporting as of December 31, 2019,2022, based on criteria established in Internal Control - Integrated Framework (2013) issued by the Committee of Sponsoring Organizations of the Treadway Commission (COSO).
In our opinion, the consolidated financial statements referred to above present fairly, in all material respects, the financial position of the Company as of December 31, 20192022 and 2018,2021 and the results of itsoperations and itscash flows for each of the three years in the period ended December 31, 20192022 in conformity with accounting principles generally accepted in the United States of America. Also in our opinion, the Company maintained, in all material respects, effective internal control over financial reporting as of December 31, 2019,2022 , based on criteria established in Internal Control - Integrated Framework(2013)issued by the COSO.
Changes in Accounting Principles
As discussed in Note 1 to the consolidated financial statements, the Company changed the manner in which it accounts for leases in 2019 and the manner in which it accounts for revenues from contracts with customers in 2018.
Basis for Opinions
The Company's management is responsible for these consolidated financial statements, for maintaining effective internal control over financial reporting, and for its assessment of the effectiveness of internal control over financial reporting, included in Management’s Report on Internal Control over Financial Reporting appearing under Item 9A. Our responsibility is to express opinions on the Company’s consolidatedfinancial statements and on the Company's internal control over financial reporting based on our audits. We are a public accounting firm registered with the Public Company Accounting Oversight Board (United States) (PCAOB) and are required to be independent with respect to the Company in accordance with the U.S. federal securities laws and the applicable rules and regulations of the Securities and Exchange Commission and the PCAOB.
We conducted our audits in accordance with the standards of the PCAOB. Those standards require that we plan and perform the audits to obtain reasonable assurance about whether the consolidatedfinancial statements are free of material misstatement, whether due to error or fraud, and whether effective internal control over financial reporting was maintained in all material respects.
Our audits of the consolidatedfinancial statements included performing procedures to assess the risks of material misstatement of the consolidatedfinancial statements, whether due to error or fraud, and performing procedures that respond to those risks. Such procedures included examining, on a test basis, evidence regarding the amounts and disclosures in the consolidatedfinancial statements. Our audits also included evaluating the accounting principles used and significant estimates made by management, as well as evaluating the overall presentation of the consolidatedfinancial statements. Our audit of internal control over financial reporting included obtaining an understanding of internal control over financial reporting, assessing the risk that a material weakness exists, and testing and evaluating the design and operating effectiveness of internal control based on the assessed risk. Our audits also included performing such other procedures as we considered necessary in the circumstances. We believe that our audits provide a reasonable basis for our opinions.
F-2
As described in Management’s Report on Internal Control over Financial Reporting, management has excluded First Call Resolution, LLC (“FCR”the business acquired from Faneuil, Inc. ("Faneuil") from its assessment of internal control over financial reporting as of December 31, 20192022 because it was acquired by the Company in a purchase business combinationscombination during 2019.2022. We have also excluded FCRFaneuil from our audit of internal control over financial reporting. FCR is a majority owned subsidiary, whoseFaneuil's total assets and total revenues excluded from management’s assessment and our audit of internal control over financial reporting represent 12.6%1.9% and 1.2%5.0%, respectively, of the related consolidated financial statement amounts as of and for the year ended December 31, 2019.2022.
F-2
Definition and Limitations of Internal Control over Financial Reporting
A company’s internal control over financial reporting is a process designed to provide reasonable assurance regarding the reliability of financial reporting and the preparation of financial statements for external purposes in accordance with generally accepted accounting principles. A company’s internal control over financial reporting includes those policies and procedures that (i) pertain to the maintenance of records that, in reasonable detail, accurately and fairly reflect the transactions and dispositions of the assets of the company; (ii) provide reasonable assurance that transactions are recorded as necessary to permit preparation of financial statements in accordance with generally accepted accounting principles, and that receipts and expenditures of the company are being made only in accordance with authorizations of management and directors of the company; and (iii) provide reasonable assurance regarding prevention or timely detection of unauthorized acquisition, use, or disposition of the company’s assets that could have a material effect on the financial statements.
Because of its inherent limitations, internal control over financial reporting may not prevent or detect misstatements. Also, projections of any evaluation of effectiveness to future periods are subject to the risk that controls may become inadequate because of changes in conditions, or that the degree of compliance with the policies or procedures may deteriorate.
Critical Audit Matters
The critical audit matter communicated below is a matter arising from the current period audit of the consolidated financial statements that was communicated or required to be communicated to the audit committee and that (i) relates to accounts or disclosures that are material to the consolidated financial statements and (ii) involved our especially challenging, subjective, or complex judgments. The communication of critical audit matters does not alter in any way our opinion on the consolidated financial statements, taken as a whole, and we are not, by communicating the critical audit matter below, providing a separate opinion on the critical audit matter or on the accounts or disclosures to which it relates.
Acquisition of Certain Assets of Faneuil, Inc. - Valuation of Customer Relationships Intangible Assets
As described in Note 2 to the consolidated financial statements, on April 1, 2022, the Company completed an asset acquisition of certain public sector citizen experience contracts from Faneuil, Inc., a subsidiary of ALJ Regional Holdings, Inc., for total cash paid of $142.42 million, which resulted in $61.31 million of customer relationships intangible assets being recorded. A multi-period excess earnings method under the income approach was used by management to estimate the fair value of the customer relationships intangible assets. The significant assumptions utilized in calculating the fair value of the customer relationships intangible assets were the customer attrition rate, revenue growth rates, forecasted EBITDA, and the discount rate.
The principal considerations for our determination that performing procedures relating to the valuation of customer relationships intangible assets acquired in the acquisition of certain assets of Faneuil, Inc. is a critical audit matter are (i) the significant judgment by management when developing the fair value estimate of the customer relationships intangible assets acquired; (ii) a high degree of auditor judgment, subjectivity, and effort in performing procedures and evaluating management’s significant assumptions related to the customer attrition rate, revenue growth rates, forecasted EBITDA, and the discount rate; and (iii) the audit effort involved the use of professionals with specialized skill and knowledge.
F-3
Addressing the matter involved performing procedures and evaluating audit evidence in connection with forming our overall opinion on the consolidated financial statements. These procedures included testing the effectiveness of controls relating to the acquisition accounting, including controls over management’s valuation of the customer relationships intangible assets acquired. These procedures also included, among others (i) reading the purchase agreement, (ii) testing management’s process for developing the fair value estimate of the customer relationships intangible assets acquired, (iii) evaluating the appropriateness of the multi-period excess earnings method, (iv) evaluating the reasonableness of the significant assumptions used by management related to the customer attrition rate, revenue growth rates, forecasted EBITDA, and the discount rate, and (v) testing the completeness and accuracy of data used in the multi-period excess earnings method. Evaluating management’s significant assumptions related to the customer attrition rate, revenue growth rates, forecasted EBITDA, and the discount rate involved considering (i) the past performance of the business; (ii) consistency with external industry and market data; (iii) and whether these assumptions were consistent with evidence obtained in other areas of the audit. Professionals with specialized skill and knowledge were used to assist in evaluating the appropriateness of the Company’s valuation method and the reasonableness of the customer attrition rate and discount rate assumptions.
/s/PricewaterhouseCoopers LLP
Denver, Colorado
March 4, 2020February 28, 2023
We have served as the Company’s auditor since 2007.
F-3F-4
TTEC HOLDINGS, INC. AND SUBSIDIARIES
(Amounts in thousands, except share amounts)
|
|
|
|
|
|
|
|
|
| December 31, |
| December 31, |
| ||
�� |
| 2019 |
| 2018 |
| ||
ASSETS |
|
|
|
|
|
|
|
Current assets |
|
|
|
|
|
|
|
Cash and cash equivalents |
| $ | 82,407 |
| $ | 78,237 |
|
Accounts receivable, net |
|
| 331,096 |
|
| 350,962 |
|
Prepaids and other current assets |
|
| 96,287 |
|
| 61,808 |
|
Income and other tax receivables |
|
| 40,035 |
|
| 35,470 |
|
Total current assets |
|
| 549,825 |
|
| 526,477 |
|
|
|
|
|
|
|
|
|
Long-term assets |
|
|
|
|
|
|
|
Property, plant and equipment, net |
|
| 176,633 |
|
| 161,523 |
|
Operating lease assets |
|
| 150,808 |
|
| — |
|
Goodwill |
|
| 301,694 |
|
| 204,633 |
|
Deferred tax assets, net |
|
| 13,263 |
|
| 15,523 |
|
Other intangible assets, net |
|
| 115,596 |
|
| 80,911 |
|
Other long-term assets |
|
| 68,969 |
|
| 65,441 |
|
Total long-term assets |
|
| 826,963 |
|
| 528,031 |
|
Total assets |
| $ | 1,376,788 |
| $ | 1,054,508 |
|
|
|
|
|
|
|
|
|
LIABILITIES AND STOCKHOLDERS’ EQUITY AND MEZZANINE EQUITY |
|
|
|
|
|
|
|
Current liabilities |
|
|
|
|
|
|
|
Accounts payable |
| $ | 64,440 |
| $ | 59,447 |
|
Accrued employee compensation and benefits |
|
| 114,165 |
|
| 83,437 |
|
Other accrued expenses |
|
| 79,171 |
|
| 15,963 |
|
Income tax payable |
|
| 11,307 |
|
| 12,325 |
|
Deferred revenue |
|
| 39,447 |
|
| 44,926 |
|
Current operating lease liabilities |
|
| 45,218 |
|
| — |
|
Other current liabilities |
|
| 9,541 |
|
| 19,320 |
|
Total current liabilities |
|
| 363,289 |
|
| 235,418 |
|
|
|
|
|
|
|
|
|
Long-term liabilities |
|
|
|
|
|
|
|
Line of credit |
|
| 290,000 |
|
| 282,000 |
|
Deferred tax liabilities, net |
|
| 10,602 |
|
| 10,371 |
|
Non-current income tax payable |
|
| 25,208 |
|
| 30,754 |
|
Deferred rent |
|
| — |
|
| 16,584 |
|
Non-current operating lease liabilities |
|
| 127,395 |
|
| — |
|
Other long-term liabilities |
|
| 79,641 |
|
| 126,532 |
|
Total long-term liabilities |
|
| 532,846 |
|
| 466,241 |
|
Total liabilities |
|
| 896,135 |
|
| 701,659 |
|
|
|
|
|
|
|
|
|
Commitments and contingencies (Note 13) |
|
|
|
|
|
|
|
|
|
|
|
|
|
|
|
Redeemable noncontrolling interest |
|
| 48,923 |
|
| — |
|
|
|
|
|
|
|
|
|
Stockholders’ equity |
|
|
|
|
|
|
|
Preferred stock; $0.01 par value; 10,000,000 shares authorized; zero shares outstanding as of December 31, 2019 and December 31, 2018 |
|
| — |
|
| — |
|
Common stock; $0.01 par value; 150,000,000 shares authorized; 46,488,938 and 46,194,717 shares outstanding as of December 31, 2019 and December 31, 2018, respectively |
|
| 465 |
|
| 462 |
|
Additional paid-in capital |
|
| 356,409 |
|
| 353,932 |
|
Treasury stock at cost: 35,563,315 and 35,857,536 shares as of December 31, 2019 and December 31, 2018, respectively |
|
| (605,314) |
|
| (610,177) |
|
Accumulated other comprehensive income (loss) |
|
| (106,234) |
|
| (124,596) |
|
Retained earnings |
|
| 773,218 |
|
| 725,551 |
|
Noncontrolling interest |
|
| 13,186 |
|
| 7,677 |
|
Total stockholders’ equity |
|
| 431,730 |
|
| 352,849 |
|
Total liabilities and stockholders’ equity and mezzanine equity |
| $ | 1,376,788 |
| $ | 1,054,508 |
|
| | | | | | | |
| | December 31, | | December 31, |
| ||
|
| 2022 |
| 2021 |
| ||
ASSETS | | | | | | | |
Current assets | | | | | | | |
Cash and cash equivalents | | $ | 153,435 | | $ | 158,205 | |
Accounts receivable, net of allowance of $3,524 and $5,409 | |
| 417,637 | |
| 357,310 | |
Prepaids and other current assets | |
| 133,365 | |
| 134,333 | |
Income and other tax receivables | |
| 45,533 | |
| 48,139 | |
Total current assets | |
| 749,970 | |
| 697,987 | |
| | | | | | | |
Long-term assets | | | | | | | |
Property, plant and equipment, net | |
| 183,360 | |
| 168,404 | |
Operating lease assets | | | 92,431 | | | 90,180 | |
Goodwill | |
| 807,845 | |
| 739,481 | |
Deferred tax assets, net | |
| 18,713 | |
| 11,130 | |
Other intangible assets, net | |
| 233,909 | |
| 212,349 | |
Other long-term assets | |
| 67,734 | |
| 77,273 | |
Total long-term assets | |
| 1,403,992 | |
| 1,298,817 | |
Total assets | | $ | 2,153,962 | | $ | 1,996,804 | |
| | | | | | | |
LIABILITIES, STOCKHOLDERS’ EQUITY AND MEZZANINE EQUITY | | | | | | | |
Current liabilities | | | | | | | |
Accounts payable | | $ | 93,937 | | $ | 70,415 | |
Accrued employee compensation and benefits | |
| 145,096 | |
| 156,324 | |
Other accrued expenses | |
| 34,451 | |
| 63,369 | |
Income tax payable | |
| 7,166 | |
| 9,471 | |
Deferred revenue | |
| 87,846 | |
| 95,608 | |
Current operating lease liabilities | | | 35,271 | | | 44,460 | |
Other current liabilities | |
| 7,597 | |
| 4,749 | |
Total current liabilities | |
| 411,364 | |
| 444,396 | |
| | | | | | | |
Long-term liabilities | | | | | | | |
Line of credit | |
| 960,000 | |
| 791,000 | |
Deferred tax liabilities, net | |
| 3,829 | |
| 5,335 | |
Non-current income tax payable | | | 9,140 | | | 17,486 | |
Non-current operating lease liabilities | | | 69,575 | | | 64,419 | |
Other long-term liabilities | |
| 66,304 | |
| 79,827 | |
Total long-term liabilities | |
| 1,108,848 | |
| 958,067 | |
Total liabilities | |
| 1,520,212 | |
| 1,402,463 | |
| | | | | | | |
Commitments and contingencies (Note 13) | | | | | | | |
| | | | | | | |
Redeemable noncontrolling interest | | | 55,645 | | | 56,316 | |
| | | | | | | |
Stockholders’ equity | | | | | | | |
Preferred stock; $0.01 par value; 10,000,000 shares authorized; zero shares outstanding as of December 31, 2022 and December 31, 2021 | |
| — | |
| — | |
Common stock; $0.01 par value; 150,000,000 shares authorized; 47,224,074 and 46,990,031 shares outstanding as of December 31, 2022 and December 31, 2021, respectively | |
| 472 | |
| 470 | |
Additional paid-in capital | |
| 367,673 | |
| 361,135 | |
Treasury stock at cost: 34,828,179 and 35,062,222 shares as of December 31, 2022 and December 31, 2021, respectively | |
| (593,164) | |
| (597,031) | |
Accumulated other comprehensive income (loss) | |
| (126,301) | |
| (98,426) | |
Retained earnings | |
| 911,233 | |
| 856,065 | |
Noncontrolling interest | |
| 18,192 | |
| 15,812 | |
Total stockholders’ equity | |
| 578,105 | |
| 538,025 | |
Total liabilities, stockholders’ equity and mezzanine equity | | $ | 2,153,962 | | $ | 1,996,804 | |
The accompanying notes are an integral part of these consolidated financial statements.
F-4F-5
TTEC HOLDINGS, INC. AND SUBSIDIARIES
Consolidated Statements of Comprehensive Income (Loss)
(Amounts in thousands, except per share amounts)
|
|
|
|
|
|
|
|
|
|
|
|
|
|
| Year Ended December 31, |
| |||||||
|
|
| 2019 |
| 2018 |
| 2017 |
| |||
Revenue |
|
| $ | 1,643,704 |
| $ | 1,509,171 |
| $ | 1,477,365 |
|
|
|
|
|
|
|
|
|
|
|
|
|
Operating expenses |
|
|
|
|
|
|
|
|
|
|
|
Cost of services (exclusive of depreciation and amortization presented separately below) |
|
|
| 1,242,887 |
|
| 1,157,927 |
|
| 1,110,068 |
|
Selling, general and administrative |
|
|
| 202,540 |
|
| 182,428 |
|
| 182,314 |
|
Depreciation and amortization |
|
|
| 69,086 |
|
| 69,179 |
|
| 64,507 |
|
Restructuring and integration charges, net |
|
|
| 1,747 |
|
| 6,131 |
|
| 14,665 |
|
Impairment losses |
|
|
| 3,735 |
|
| 1,452 |
|
| 5,322 |
|
Total operating expenses |
|
|
| 1,519,995 |
|
| 1,417,117 |
|
| 1,376,876 |
|
|
|
|
|
|
|
|
|
|
|
|
|
Income from operations |
|
|
| 123,709 |
|
| 92,054 |
|
| 100,489 |
|
|
|
|
|
|
|
|
|
|
|
|
|
Other income (expense) |
|
|
|
|
|
|
|
|
|
|
|
Interest income |
|
|
| 1,913 |
|
| 4,476 |
|
| 2,841 |
|
Interest expense |
|
|
| (19,113) |
|
| (28,674) |
|
| (13,734) |
|
Other income (expense), net |
|
|
| 3,902 |
|
| (11,618) |
|
| 1,869 |
|
Loss on asset held for sale |
|
|
| — |
|
| — |
|
| (2,578) |
|
Total other income (expense) |
|
|
| (13,298) |
|
| (35,816) |
|
| (11,602) |
|
|
|
|
|
|
|
|
|
|
|
|
|
Income before income taxes |
|
|
| 110,411 |
|
| 56,238 |
|
| 88,887 |
|
|
|
|
|
|
|
|
|
|
|
|
|
Provision for income taxes |
|
|
| (25,677) |
|
| (16,483) |
|
| (78,075) |
|
|
|
|
|
|
|
|
|
|
|
|
|
Net income |
|
|
| 84,734 |
|
| 39,755 |
|
| 10,812 |
|
|
|
|
|
|
|
|
|
|
|
|
|
Net income attributable to noncontrolling interest |
|
|
| (7,570) |
|
| (3,938) |
|
| (3,556) |
|
|
|
|
|
|
|
|
|
|
|
|
|
Net income attributable to TTEC stockholders |
|
| $ | 77,164 |
| $ | 35,817 |
| $ | 7,256 |
|
|
|
|
|
|
|
|
|
|
|
|
|
Other comprehensive income (loss) |
|
|
|
|
|
|
|
|
|
|
|
Net income |
|
| $ | 84,734 |
| $ | 39,755 |
| $ | 10,812 |
|
Foreign currency translation adjustments |
|
|
| 6,816 |
|
| (30,382) |
|
| 8,285 |
|
Derivative valuation, gross |
|
|
| 16,990 |
|
| 11,526 |
|
| 27,931 |
|
Derivative valuation, tax effect |
|
|
| (4,530) |
|
| (4,058) |
|
| (11,284) |
|
Other, net of tax |
|
|
| (786) |
|
| 308 |
|
| 105 |
|
Total other comprehensive income (loss) |
|
|
| 18,490 |
|
| (22,606) |
|
| 25,037 |
|
Total comprehensive income (loss) |
|
|
| 103,224 |
|
| 17,149 |
|
| 35,849 |
|
|
|
|
|
|
|
|
|
|
|
|
|
Less: Comprehensive income attributable to noncontrolling interest |
|
|
| (7,698) |
|
| (3,624) |
|
| (3,933) |
|
|
|
|
|
|
|
|
|
|
|
|
|
Comprehensive income attributable to TTEC stockholders |
|
| $ | 95,526 |
| $ | 13,525 |
| $ | 31,916 |
|
|
|
|
|
|
|
|
|
|
|
|
|
Weighted average shares outstanding |
|
|
|
|
|
|
|
|
|
|
|
Basic |
|
|
| 46,373 |
|
| 46,064 |
|
| 45,826 |
|
Diluted |
|
|
| 46,758 |
|
| 46,385 |
|
| 46,382 |
|
|
|
|
|
|
|
|
|
|
|
|
|
Net income per share attributable to TTEC stockholders |
|
|
|
|
|
|
|
|
|
|
|
Basic |
|
| $ | 1.66 |
| $ | 0.78 |
| $ | 0.16 |
|
Diluted |
|
| $ | 1.65 |
| $ | 0.77 |
| $ | 0.16 |
|
| | | | | | | | | | | |
| |
| Year Ended December 31, |
| |||||||
|
|
| 2022 |
| 2021 |
| 2020 |
| |||
Revenue | | | $ | 2,443,707 | | $ | 2,273,062 | | $ | 1,949,248 | |
| | | | | | | | | | | |
Operating expenses | | | | | | | | | | | |
Cost of services (exclusive of depreciation and amortization presented separately below) | | |
| 1,856,518 | |
| 1,704,109 | |
| 1,452,719 | |
Selling, general and administrative | | |
| 287,433 | |
| 239,994 | |
| 203,902 | |
Depreciation and amortization | | |
| 111,791 | |
| 96,706 | |
| 78,862 | |
Restructuring charges, net | | | | 5,673 | | | 3,807 | | | 3,264 | |
Impairment losses | | |
| 13,749 | |
| 11,254 | |
| 5,809 | |
Total operating expenses | | |
| 2,275,164 | |
| 2,055,870 | |
| 1,744,556 | |
| | | | | | | | | | | |
Income from operations | | |
| 168,543 | |
| 217,192 | |
| 204,692 | |
| | | | | | | | | | | |
Other income (expense) | | | | | | | | | | | |
Interest income | | |
| 1,811 | |
| 761 | |
| 1,656 | |
Interest expense | | |
| (36,067) | |
| (12,384) | |
| (17,489) | |
Other income (expense), net | | |
| 10,161 | |
| 2,315 | |
| (18,591) | |
Total other income (expense) | | |
| (24,095) | |
| (9,308) | |
| (34,424) | |
| | | | | | | | | | | |
Income before income taxes | | |
| 144,448 | |
| 207,884 | |
| 170,268 | |
| | | | | | | | | | | |
Provision for income taxes | | |
| (27,115) | |
| (49,695) | |
| (40,937) | |
| | | | | | | | | | | |
Net income | | |
| 117,333 | |
| 158,189 | |
| 129,331 | |
| | | | | | | | | | | |
Net income attributable to noncontrolling interest | | |
| (14,093) | |
| (17,219) | |
| (10,683) | |
| | | | | | | | | | | |
Net income attributable to TTEC stockholders | | | $ | 103,240 | | $ | 140,970 | | $ | 118,648 | |
| | | | | | | | | | | |
Other comprehensive income (loss) | | | | | | | | | | | |
Net income | | | $ | 117,333 | | $ | 158,189 | | $ | 129,331 | |
Foreign currency translation adjustments | | |
| (28,688) | |
| (17,551) | |
| 29,537 | |
Derivative valuation, gross | | |
| 178 | |
| (11,452) | |
| 5,717 | |
Derivative valuation, tax effect | | |
| (49) | |
| 2,981 | |
| (1,468) | |
Other, net of tax | | |
| 183 | |
| (391) | |
| 488 | |
Total other comprehensive income (loss) | | |
| (28,376) | |
| (26,413) | |
| 34,274 | |
Total comprehensive income (loss) | | |
| 88,957 | |
| 131,776 | |
| 163,605 | |
| | | | | | | | | | | |
Less: Comprehensive income attributable to noncontrolling interest | | |
| (12,679) | |
| (12,067) | |
| (8,352) | |
| | | | | | | | | | | |
Comprehensive income attributable to TTEC stockholders | | | $ | 76,278 | | $ | 119,709 | | $ | 155,253 | |
| | | | | | | | | | | |
Weighted average shares outstanding | | | | | | | | | | | |
Basic | | |
| 47,121 | |
| 46,890 | |
| 46,647 | |
Diluted | | |
| 47,335 | |
| 47,386 | |
| 46,993 | |
| | | | | | | | | | | |
Net income per share attributable to TTEC stockholders | | | | | | | | | | | |
Basic | | | $ | 2.19 | | $ | 3.01 | | $ | 2.54 | |
Diluted | | | $ | 2.18 | | $ | 2.97 | | $ | 2.52 | |
The accompanying notes are an integral part of these consolidated financial statements.
F-5F-6
TTEC HOLDINGS, INC. AND SUBSIDIARIES
Consolidated Statements of Stockholders’ EquityEquity and Mezzanine Equity
(Amounts in thousands)
|
|
|
|
|
|
|
|
|
|
|
|
|
|
|
|
|
|
|
|
|
|
|
|
|
|
|
|
|
|
|
|
|
|
| Stockholders’ Equity of the Company |
|
|
|
|
|
|
|
|
|
| ||||||||||||||||||||
|
|
|
|
|
|
|
|
|
|
|
|
|
|
|
|
|
| Accumulated |
|
|
|
|
|
|
|
|
|
|
|
|
| |
|
|
|
|
|
|
|
|
|
|
|
|
|
|
|
|
|
| Other |
|
|
|
|
|
|
|
|
|
|
|
|
| |
|
| Preferred Stock |
| Common Stock |
| Treasury |
| Additional |
| Comprehensive |
| Retained |
| Noncontrolling |
|
|
|
| Mezzanine |
| ||||||||||||
|
| Shares |
| Amount |
| Shares |
| Amount |
| Stock |
| Paid-in Capital |
| Income (Loss) |
| Earnings |
| interest |
| Total Equity |
| Equity |
| |||||||||
Balance as of December 31, 2016 |
| — |
| $ | — |
| 46,114 |
| $ | 462 |
| $ | (603,262) |
| $ | 348,739 |
| $ | (126,964) |
| $ | 735,939 |
| $ | 6,981 |
| $ | 361,895 |
| $ | — |
|
Net income |
| — |
|
| — |
| — |
|
| — |
|
| — |
|
| — |
|
| — |
|
| 7,256 |
|
| 3,556 |
|
| 10,812 |
|
| — |
|
Dividends to shareholders ($0.47 per common share) |
| — |
|
| — |
| — |
|
| — |
|
| — |
|
| — |
|
| — |
|
| (21,531) |
|
| — |
|
| (21,531) |
|
| — |
|
Dividends distributed to noncontrolling interest |
| — |
|
| — |
| — |
|
| — |
|
| — |
|
| — |
|
| — |
|
| — |
|
| (3,645) |
|
| (3,645) |
|
| — |
|
Foreign currency translation adjustments |
| — |
|
| — |
| — |
|
| — |
|
| — |
|
| — |
|
| 7,908 |
|
| — |
|
| 377 |
|
| 8,285 |
|
| — |
|
Derivatives valuation, net of tax |
| — |
|
| — |
| — |
|
| — |
|
| — |
|
| — |
|
| 16,647 |
|
| — |
|
| — |
|
| 16,647 |
|
| — |
|
Vesting of restricted stock units |
| — |
|
| — |
| 298 |
|
| 3 |
|
| 4,913 |
|
| (10,313) |
|
| — |
|
| — |
|
| — |
|
| (5,397) |
|
| — |
|
Exercise of stock options |
| — |
|
| — |
| 60 |
|
| — |
|
| 994 |
|
| 1,156 |
|
| — |
|
| — |
|
| — |
|
| 2,150 |
|
| — |
|
Equity-based compensation expense |
| — |
|
| — |
| — |
|
| — |
|
| — |
|
| 12,143 |
|
| — |
|
| — |
|
| (291) |
|
| 11,852 |
|
| — |
|
Purchases of common stock |
| — |
|
| — |
| (610) |
|
| (6) |
|
| (18,322) |
|
| — |
|
| — |
|
| — |
|
| — |
|
| (18,328) |
|
| — |
|
Other, net of tax |
| — |
|
| — |
| — |
|
| — |
|
| — |
|
| — |
|
| 105 |
|
| — |
|
| — |
|
| 105 |
|
| — |
|
Balance as of December 31, 2017 |
| — |
| $ | — |
| 45,862 |
| $ | 459 |
| $ | (615,677) |
| $ | 351,725 |
| $ | (102,304) |
| $ | 721,664 |
| $ | 6,978 |
| $ | 362,845 |
| $ | — |
|
Cumulative effect of adopting accounting standard updates |
| — |
|
| — |
| — |
|
| — |
|
| — |
|
| — |
|
| — |
|
| (6,584) |
|
| — |
|
| (6,584) |
|
| — |
|
Net income |
| — |
|
| — |
| — |
|
| — |
|
| — |
|
| — |
|
| — |
|
| 35,817 |
|
| 3,938 |
|
| 39,755 |
|
| — |
|
Dividends to shareholders ($0.55 per common share) |
| — |
|
| — |
| — |
|
| — |
|
| — |
|
| — |
|
| — |
|
| (25,346) |
|
| — |
|
| (25,346) |
|
| — |
|
Dividends distributed to noncontrolling interest |
| — |
|
| — |
| — |
|
| — |
|
| — |
|
| — |
|
| — |
|
| — |
|
| (2,925) |
|
| (2,925) |
|
| — |
|
Foreign currency translation adjustments |
| — |
|
| — |
| — |
|
| — |
|
| — |
|
| — |
|
| (30,068) |
|
| — |
|
| (314) |
|
| (30,382) |
|
| — |
|
Derivatives valuation, net of tax |
| — |
|
| — |
| — |
|
| — |
|
| — |
|
| — |
|
| 7,468 |
|
| — |
|
| — |
|
| 7,468 |
|
| — |
|
Vesting of restricted stock units |
| — |
|
| — |
| 318 |
|
| 3 |
|
| 5,252 |
|
| (9,898) |
|
| — |
|
| — |
|
| — |
|
| (4,643) |
|
| — |
|
Exercise of stock options |
| — |
|
| — |
| 15 |
|
| — |
|
| 248 |
|
| (40) |
|
| — |
|
| — |
|
| — |
|
| 208 |
|
| — |
|
Equity-based compensation expense |
| — |
|
| — |
| — |
|
| — |
|
| — |
|
| 12,145 |
|
| — |
|
| — |
|
| — |
|
| 12,145 |
|
| — |
|
Other, net of tax |
| — |
|
| — |
| — |
|
| — |
|
| — |
|
| — |
|
| 308 |
|
| — |
|
| — |
|
| 308 |
|
| — |
|
Balance as of December 31, 2018 |
| — |
| $ | — |
| 46,195 |
| $ | 462 |
| $ | (610,177) |
| $ | 353,932 |
| $ | (124,596) |
| $ | 725,551 |
| $ | 7,677 |
| $ | 352,849 |
| $ | — |
|
Cumulative effect of adopting accounting standard updates |
| — |
|
| — |
| — |
|
| — |
|
| — |
|
| — |
|
| — |
|
| (758) |
|
| — |
|
| (758) |
|
| — |
|
Acquisition of noncontrolling interest |
| — |
|
| — |
| — |
|
| — |
|
| — |
|
| — |
|
| — |
|
| — |
|
| — |
|
| — |
|
| 48,322 |
|
Net income |
| — |
|
| — |
| — |
|
| — |
|
| — |
|
| — |
|
| — |
|
| 77,164 |
|
| 6,969 |
|
| 84,133 |
|
| 601 |
|
Dividends to shareholders ($0.62 per common share) |
| — |
|
| — |
| — |
|
| — |
|
| — |
|
| — |
|
| — |
|
| (28,739) |
|
| — |
|
| (28,739) |
|
| — |
|
Contribution from noncontrolling interest |
| — |
|
| — |
| — |
|
| — |
|
| — |
|
| — |
|
| — |
|
| — |
|
| 3,362 |
|
| 3,362 |
|
| — |
|
Dividends distributed to noncontrolling interest |
| — |
|
| — |
| — |
|
| — |
|
| — |
|
| — |
|
| — |
|
| — |
|
| (4,950) |
|
| (4,950) |
|
| — |
|
Foreign currency translation adjustments |
| — |
|
| — |
| — |
|
| — |
|
| — |
|
| — |
|
| 6,688 |
|
| — |
|
| 128 |
|
| 6,816 |
|
| — |
|
Derivatives valuation, net of tax |
| — |
|
| — |
| — |
|
| — |
|
| — |
|
| — |
|
| 12,460 |
|
| — |
|
| — |
|
| 12,460 |
|
| — |
|
Vesting of restricted stock units |
| — |
|
| — |
| 294 |
|
| 3 |
|
| 4,863 |
|
| (10,337) |
|
| — |
|
| — |
|
| — |
|
| (5,471) |
|
| — |
|
Equity-based compensation expense |
| — |
|
| — |
| — |
|
| — |
|
| — |
|
| 12,814 |
|
| — |
|
| — |
|
| — |
|
| 12,814 |
|
| — |
|
Other, net of tax |
| — |
|
| — |
| — |
|
| — |
|
| — |
|
| — |
|
| (786) |
|
| — |
|
| — |
|
| (786) |
|
| — |
|
Balance as of December 31, 2019 |
| — |
| $ | — |
| 46,489 |
| $ | 465 |
| $ | (605,314) |
| $ | 356,409 |
| $ | (106,234) |
| $ | 773,218 |
| $ | 13,186 |
| $ | 431,730 |
| $ | 48,923 |
|
| | | | | | | | | | | | | | | | | | | | | | | | | | | |
| | Stockholders’ Equity of the Company | | | |
| |||||||||||||||||||||
|
|
|
|
| |
|
| |
|
| |
| Accumulated |
|
| |
|
| |
|
| |
|
| |
| |
| | | | | | | | | | | | | Other | | | | | | | | | | | | |
| |
| | Common Stock | | Treasury | | Additional | | Comprehensive | | Retained | | Noncontrolling | | | | | Mezzanine |
| |||||||||
| | Shares | | Amount | | Stock | | Paid-in Capital | | Income (Loss) | | Earnings | | interest | | Total Equity | | Equity |
| ||||||||
Balance as of December 31, 2019 |
| 46,489 | | $ | 465 | | $ | (605,314) | | $ | 356,409 | | $ | (106,234) | | $ | 773,218 | | $ | 13,186 | | $ | 431,730 | | $ | 48,923 | |
Net income |
| — | |
| — | |
| — | |
| — | |
| — | |
| 118,648 | |
| 8,156 | |
| 126,804 | |
| 2,527 | |
Acquisition of noncontrolling interest | | — | | | — | | | — | | | — | | | — | | | — | | | — | | | — | | | 3,849 | |
Dividends to shareholders ($2.88 per common share) |
| — | |
| — | |
| — | |
| — | |
| — | |
| (134,554) | |
| — | |
| (134,554) | |
| — | |
Dividends distributed to noncontrolling interest | | — | | | — | | | — | | | — | | | — | | | — | | | (8,478) | | | (8,478) | | | (2,323) | |
Foreign currency translation adjustments |
| — | |
| — | |
| — | |
| — | |
| 29,341 | |
| — | |
| 196 | |
| 29,537 | |
| — | |
Derivatives valuation, net of tax |
| — | |
| — | |
| — | |
| — | |
| 4,249 | |
| — | |
| — | |
| 4,249 | |
| — | |
Vesting of restricted stock units |
| 248 | |
| 2 | |
| 4,100 | |
| (8,623) | |
| — | |
| — | |
| — | |
| (4,521) | |
| — | |
Equity-based compensation expense |
| — | |
| — | |
| — | |
| 12,507 | |
| — | |
| — | |
| — | |
| 12,507 | |
| — | |
Other, net of tax |
| — | |
| — | |
| — | |
| — | |
| 488 | |
| — | |
| — | |
| 488 | |
| — | |
Balance as of December 31, 2020 |
| 46,737 | | $ | 467 | | $ | (601,214) | | $ | 360,293 | | $ | (72,156) | | $ | 757,312 | | $ | 13,060 | | $ | 457,762 | | $ | 52,976 | |
Net income | | — | | | — | | | — | | | — | | | — | | | 140,970 | | | 12,210 | | | 153,180 | | | 5,009 | |
Dividends to shareholders ($0.90 per common share) |
| — | |
| — | |
| — | |
| — | |
| — | |
| (42,217) | |
| — | |
| (42,217) | |
| — | |
Dividends distributed to noncontrolling interest | | — | | | — | | | — | | | — | | | — | | | — | | | (9,315) | | | (9,315) | | | (1,669) | |
Foreign currency translation adjustments |
| — | |
| — | |
| — | |
| — | |
| (17,408) | |
| — | |
| (143) | |
| (17,551) | |
| — | |
Derivatives valuation, net of tax |
| — | |
| — | |
| — | |
| — | |
| (8,471) | |
| — | |
| — | |
| (8,471) | |
| — | |
Vesting of restricted stock units |
| 253 | |
| 3 | |
| 4,183 | |
| (15,583) | |
| — | |
| — | |
| — | |
| (11,397) | |
| — | |
Equity-based compensation expense |
| — | |
| — | |
| — | |
| 16,425 | |
| — | |
| — | |
| — | |
| 16,425 | |
| — | |
Other, net of tax |
| — | |
| — | |
| — | |
| — | |
| (391) | |
| — | |
| — | |
| (391) | |
| — | |
Balance as of December 31, 2021 |
| 46,990 | | $ | 470 | | $ | (597,031) | | $ | 361,135 | | $ | (98,426) | | $ | 856,065 | | $ | 15,812 | | $ | 538,025 | | $ | 56,316 | |
Net income |
| — | |
| — | |
| — | |
| — | |
| — | |
| 103,240 | |
| 13,180 | |
| 116,420 | |
| 913 | |
Dividends to shareholders ($1.02 per common share) | | — | |
| — | |
| — | |
| — | |
| — | | | (48,072) | | | — | | | (48,072) | | | — | |
Dividends distributed to noncontrolling interest |
| — | |
| — | |
| — | |
| — | |
| — | |
| — | |
| (10,299) | |
| (10,299) | |
| (1,584) | |
Foreign currency translation adjustments |
| — | |
| — | |
| — | |
| — | |
| (28,187) | |
| — | |
| (501) | |
| (28,688) | |
| — | |
Derivatives valuation, net of tax |
| — | |
| — | |
| — | |
| — | |
| 129 | |
| — | |
| — | |
| 129 | |
| — | |
Vesting of restricted stock units |
| 234 | |
| 2 | |
| 3,867 | |
| (11,033) | |
| — | |
| — | |
| — | |
| (7,164) | |
| — | |
Equity-based compensation expense |
| — | |
| — | |
| — | |
| 17,571 | |
| — | |
| — | |
| — | |
| 17,571 | |
| — | |
Other, net of tax |
| — | |
| — | |
| — | |
| — | |
| 183 | |
| — | |
| — | |
| 183 | |
| — | |
Balance as of December 31, 2022 |
| 47,224 | | $ | 472 | | $ | (593,164) | | $ | 367,673 | | $ | (126,301) | | $ | 911,233 | | $ | 18,192 | | $ | 578,105 | | $ | 55,645 | |
The accompanying notes are an integral part of these consolidated financial statements.
F-6F-7
TTEC HOLDINGS, INC. AND SUBSIDIARIES
Consolidated Statements of Cash Flows
(Amounts in thousands)
|
|
|
|
|
|
|
|
|
|
|
|
| Year Ended December 31, |
| |||||||
|
| 2019 |
| 2018 |
| 2017 |
| |||
Cash flows from operating activities |
|
|
|
|
|
|
|
|
|
|
Net income |
| $ | 84,734 |
| $ | 39,755 |
| $ | 10,812 |
|
Adjustments to reconcile net income to net cash provided by operating activities: |
|
|
|
|
|
|
|
|
|
|
Depreciation and amortization |
|
| 69,086 |
|
| 69,179 |
|
| 64,507 |
|
Amortization of contract acquisition costs |
|
| 1,002 |
|
| 3,015 |
|
| 1,678 |
|
Amortization of debt issuance costs |
|
| 1,083 |
|
| 992 |
|
| 745 |
|
Imputed interest expense and fair value adjustments to contingent consideration |
|
| 2,339 |
|
| 10,217 |
|
| 51 |
|
Provision for doubtful accounts |
|
| 1,711 |
|
| 3,679 |
|
| 458 |
|
(Gain) loss on disposal of assets |
|
| 189 |
|
| 111 |
|
| 3,694 |
|
Gain on sale of businesses and dissolution of entity |
|
| — |
|
| — |
|
| (908) |
|
Impairment losses |
|
| 3,735 |
|
| 1,452 |
|
| 5,322 |
|
Impairment on equity investment |
|
| — |
|
| 15,632 |
|
| — |
|
Gain (adjustment) on bargain purchase of a business |
|
| — |
|
| (685) |
|
| — |
|
Non-cash loss on assets held for sale reclassified to held and used |
|
| — |
|
| 1,616 |
|
| — |
|
Deferred income taxes |
|
| (1,376) |
|
| (7,975) |
|
| 16,777 |
|
Excess tax benefit from equity-based awards |
|
| (1,231) |
|
| (635) |
|
| (2,192) |
|
Equity-based compensation expense |
|
| 12,814 |
|
| 12,145 |
|
| 11,852 |
|
(Gain) loss on foreign currency derivatives |
|
| (140) |
|
| 1,524 |
|
| (681) |
|
Changes in assets and liabilities, net of acquisitions: |
|
|
|
|
|
|
|
|
|
|
Accounts receivable |
|
| 29,608 |
|
| 29,985 |
|
| (59,284) |
|
Prepaids and other assets |
|
| 27,413 |
|
| (30,438) |
|
| (19,266) |
|
Accounts payable and accrued expenses |
|
| 97,268 |
|
| 11,713 |
|
| 18,968 |
|
Deferred revenue and other liabilities |
|
| (90,246) |
|
| 7,063 |
|
| 60,619 |
|
Net cash provided by operating activities |
|
| 237,989 |
|
| 168,345 |
|
| 113,152 |
|
|
|
|
|
|
|
|
|
|
|
|
Cash flows from investing activities |
|
|
|
|
|
|
|
|
|
|
Proceeds from sale of long-lived assets |
|
| 382 |
|
| 34 |
|
| 39 |
|
Purchases of property, plant and equipment, net of acquisitions |
|
| (60,776) |
|
| (43,450) |
|
| (51,958) |
|
Proceeds from sale of business |
|
| — |
|
| — |
|
| 636 |
|
Investments in non-marketable equity investments |
|
| — |
|
| (2,119) |
|
| (1,384) |
|
Acquisitions, net of cash acquired of $4,547, $4,530, and $5,997, respectively |
|
| (102,457) |
|
| (2,027) |
|
| (116,320) |
|
Net cash used in investing activities |
|
| (162,851) |
|
| (47,562) |
|
| (168,987) |
|
|
|
|
|
|
|
|
|
|
|
|
Cash flows from financing activities |
|
|
|
|
|
|
|
|
|
|
Proceeds from line of credit |
|
| 1,152,750 |
|
| 2,162,400 |
|
| 2,293,587 |
|
Payments on line of credit |
|
| (1,144,750) |
|
| (2,224,400) |
|
| (2,166,887) |
|
Payments on other debt |
|
| (11,855) |
|
| (5,989) |
|
| (6,041) |
|
Payments of contingent consideration and hold-back payments to acquisitions |
|
| (5,902) |
|
| (1,349) |
|
| (1,409) |
|
Dividends paid to shareholders |
|
| (28,739) |
|
| (25,346) |
|
| (21,531) |
|
Payments to noncontrolling interest |
|
| (4,950) |
|
| (2,925) |
|
| (3,645) |
|
Capital contribution from noncontrolling interest |
|
| 3,362 |
|
| — |
|
| — |
|
Proceeds from exercise of stock options |
|
| — |
|
| 208 |
|
| 2,150 |
|
Tax payments related to issuance of restricted stock units |
|
| (5,471) |
|
| (4,643) |
|
| (5,397) |
|
Payments of debt issuance costs |
|
| (1,819) |
|
| (35) |
|
| (918) |
|
Purchase of treasury stock |
|
| — |
|
| — |
|
| (18,328) |
|
Net cash (used in) provided by financing activities |
|
| (47,374) |
|
| (102,079) |
|
| 71,581 |
|
|
|
|
|
|
|
|
|
|
|
|
Effect of exchange rate changes on cash, cash equivalents and restricted cash |
|
| (410) |
|
| (14,904) |
|
| 3,427 |
|
|
|
|
|
|
|
|
|
|
|
|
Increase in cash, cash equivalents and restricted cash |
|
| 27,354 |
|
| 3,800 |
|
| 19,173 |
|
Cash, cash equivalents and restricted cash, beginning of period |
|
| 78,237 |
|
| 74,437 |
|
| 55,264 |
|
Cash, cash equivalents and restricted cash, end of period |
| $ | 105,591 |
| $ | 78,237 |
| $ | 74,437 |
|
|
|
|
|
|
|
|
|
|
|
|
Supplemental disclosures |
|
|
|
|
|
|
|
|
|
|
Cash paid for interest |
| $ | 13,108 |
| $ | 17,456 |
| $ | 11,727 |
|
Cash paid for income taxes |
| $ | 36,316 |
| $ | 39,984 |
| $ | 18,813 |
|
Non-cash investing and financing activities |
|
|
|
|
|
|
|
|
|
|
Acquisition of long-lived assets through finance leases |
| $ | 3,731 |
| $ | 15,018 |
|
| 9,836 |
|
Acquisition of equipment through increase in accounts payable, net |
| $ | 881 |
| $ | 339 |
| $ | 97 |
|
| | | | | | | | | | |
| | Year Ended December 31, |
| |||||||
|
| 2022 |
| 2021 |
| 2020 |
| |||
Cash flows from operating activities | | | | | | | | | | |
Net income | | $ | 117,333 | | $ | 158,189 | | $ | 129,331 | |
Adjustments to reconcile net income to net cash provided by operating activities: | | | | | | | | | | |
Depreciation and amortization | |
| 111,791 | |
| 96,706 | |
| 78,862 | |
Amortization of contract acquisition costs | |
| 2,065 | |
| 983 | |
| 590 | |
Amortization of debt issuance costs | |
| 1,018 | |
| 1,016 | |
| 732 | |
Imputed interest expense and fair value adjustments to contingent consideration | |
| 1,746 | |
| 1,168 | |
| 4,484 | |
Provision for credit losses | |
| 9,391 | |
| (350) | |
| 494 | |
Loss on disposal of assets | |
| 1,916 | |
| 1,127 | |
| 521 | |
Loss on dissolution of subsidiary | | | — | | | — | | | 19,905 | |
Impairment losses | |
| 13,749 | |
| 11,254 | |
| 5,809 | |
Deferred income taxes | |
| (11,001) | |
| 831 | |
| (5,193) | |
Excess tax benefit from equity-based awards | |
| (1,122) | |
| (5,301) | |
| (726) | |
Equity-based compensation expense | |
| 17,571 | |
| 16,425 | |
| 12,507 | |
(Gain) loss on foreign currency derivatives | |
| (7) | |
| (213) | |
| 103 | |
Changes in assets and liabilities, net of acquisitions: | | | | | | | | | | |
Accounts receivable | |
| (74,564) | |
| 40,156 | |
| (40,625) | |
Prepaids and other assets | |
| 43,699 | |
| 18,407 | |
| 57,597 | |
Accounts payable and accrued expenses | |
| (12,695) | |
| (17,209) | |
| 76,726 | |
Deferred revenue and other liabilities | |
| (83,842) | |
| (71,893) | |
| (69,197) | |
Net cash provided by operating activities | |
| 137,048 | |
| 251,296 | |
| 271,920 | |
| | | | | | | | | | |
Cash flows from investing activities | | | | | | | | | | |
Proceeds from sale of long-lived assets | |
| 229 | |
| 93 | |
| 20 | |
Purchases of property, plant and equipment, net of acquisitions | |
| (84,012) | |
| (60,358) | |
| (59,772) | |
Acquisitions, net of cash acquired of zero, $18,638 and $4,423, respectively | |
| (142,420) | |
| (481,718) | |
| (52,675) | |
Net cash used in investing activities | |
| (226,203) | |
| (541,983) | |
| (112,427) | |
| | | | | | | | | | |
Cash flows from financing activities | | | | | | | | | | |
Net proceeds(borrowings) from line of credit | |
| 169,000 | |
| 406,000 | |
| 95,000 | |
Payments on other debt | |
| (3,245) | |
| (6,626) | |
| (8,619) | |
Payments of contingent consideration and hold-back payments to acquisitions | |
| (9,600) | |
| (11,517) | |
| (48,686) | |
Dividends paid to shareholders | | | (48,072) | | | (42,217) | | | (134,554) | |
Payments to noncontrolling interest | |
| (11,883) | |
| (10,984) | |
| (10,801) | |
Tax payments related to issuance of restricted stock units | | | (7,164) | | | (11,397) | | | (4,521) | |
Payments of debt issuance costs | |
| — | |
| (3,614) | |
| (45) | |
Net cash provided by (used in) financing activities | |
| 89,036 | |
| 319,645 | |
| (112,226) | |
| | | | | | | | | | |
Effect of exchange rate changes on cash, cash equivalents and restricted cash | |
| (13,499) | |
| (7,291) | |
| 6,157 | |
| | | | | | | | | | |
(Decrease)/increase in cash, cash equivalents and restricted cash | |
| (13,618) | |
| 21,667 | |
| 53,424 | |
Cash, cash equivalents and restricted cash, beginning of period | |
| 180,682 | |
| 159,015 | |
| 105,591 | |
Cash, cash equivalents and restricted cash, end of period | | $ | 167,064 | | $ | 180,682 | | $ | 159,015 | |
| | | | | | | | | | |
Supplemental disclosures | | | | | | | | | | |
Cash paid for interest | | $ | 34,984 | | $ | 11,188 | | $ | 10,233 | |
Cash paid for income taxes | | $ | 42,563 | | $ | 71,392 | | $ | 47,761 | |
Non-cash investing and financing activities | | | | | | | | | | |
Acquisition of long-lived assets through finance leases | | $ | 461 | | $ | 912 | | | 1,852 | |
Acquisition of equipment through increase in accounts payable, net | | $ | 3,346 | | $ | (2,243) | | $ | 347 | |
The accompanying notes are an integral part of these consolidated financial statements.
F-7F-8
(1)
Overview
TTEC Holdings, Inc. (“TTEC”, “the Company”; pronounced “T-TEC”) is a leading global customer experience technology and services company focused on the design, implementation and delivery of transformative customer experience outcomes(“CX”) as a service (“CXaaS”) partner for many of the world’s most iconic companies, disruptive hypergrowth brands, and disruptive brands. Since inception in 1982, the Company has been helping clients deliver frictionlesslarge public sector agencies. TTEC designs, builds, orchestrates, and delivers seamless digitally-enabled customer experiences strengthenthat increase brand value, customer loyalty, revenue and profitability through personalized, outcome-based interactions. The Company helps clients improve their customer relationships, brand recognition and loyalty through personalized interactions, significantly improve their Net Promoter Score ("NPS"), and lowersatisfaction while lowering their total cost to serveservice by enablingcombining innovative digital solutions with service capabilities that deliver a frictionless CX across numerous real-time digital and delivering simplified, consistentlive interaction channels and seamless customer experience across channels anddifferent phases of the customer lifecycle. TTEC’s 49,50069,400 employees serve clients in the automotive, communication, financial services, government,national/federal and state and local governments, healthcare, logistics, media and entertainment, e-tail/retail, technology, transportationtravel and traveltransportation industries via operations in the United States, Australia, Belgium, Brazil, Bulgaria, Canada, Colombia, Costa Rica, Germany, Greece, Hong Kong, India, Ireland, Mexico, the Netherlands, New Zealand, the Philippines, Poland, Singapore, South Africa, Thailand, the United Arab Emirates, and the United Kingdom.
Through the first quarter of 2019, theThe Company reportedoperates and reports its financial results of operations across four segments: Customer Strategy Services (“CSS”), Customer Technology Services (‘CTS”), Customer Growth Services (“CGS’) and Customer Management Services (“CMS”). Starting in the second quarter of 2019, the Company changed its go-to-market strategy, how its clients evaluate and consume its services, how TTEC assesses its operating performance and the leadership accountability for its segments. As a result, the Company now reports its financial information based onoperation through two business segments: TTEC Digital and TTEC Engage.
| TTEC Digital is one of the largest pure-play CX technology service providers with expertise in CX strategy, digitization, analytics, process optimization, system integration, cloud-based technology solutions, and transformation enabled by the Company’s proprietary CX applications and technology partnerships. TTEC Digital designs, builds, and |
| TTEC Engage provides the |
TTEC Digital and TTEC Engage strategically come together under our unified offering, Humanify™ Customer Experience as a Service ("CXaas"),Humanify® CXaaS, which drives measurable customer results for clients through the delivery of personalized and seamless, omnichannel experiences. Our Humanify™Humanify® cloud platform provides a fully integrated ecosystem of Customer Experience ("CX")CX offerings, including omnichannel, messaging, AI, ML, RPA,machine learning, robotic process automation, analytics, cybersecurity, customer relationship management ("CRM"),CRM, knowledge management, journey orchestration, and journey orchestration.traditional voice solutions. Our end-to-end CXaaS platform differentiates us from competitors by combining design, strategic consulting, technology, data analytics, process optimization, system integration, and operational excellence along with our decades of industry know-how. This unified offering is value-oriented, outcome-based and delivered to large enterprises, hypergrowth companies and public sector agencies on a global scale.
Basis of Presentation
The Consolidated Financial Statements are comprised of the accounts of TTEC, its wholly owned subsidiaries, its 55% equity owned subsidiary Percepta, LLC, and its 70% equity owned subsidiary First Call Resolution, LLC and its 70% equity owned subsidiary Serendebyte, Inc. (see Note 2). All intercompany balances and transactions have been eliminated in consolidation.
As of December 31, 2018, one business unit in the Digital segment classified as assets and liabilities held for sale as of September 30, 2016, was reclassified as held and used as of December 31, 2018 and 2017. The assets and liabilities of the business unit are no longer separately identified as held for sale as of December 31, 2018 and 2017 (see Note 2).
Reclassifications
Current prior year amounts have been reclassified to conform to the current year presentation.
F-8F-9
Use of Estimates
The preparation of the Consolidated Financial Statements in conformity with accounting principles generally accepted in the U.S. (“GAAP”) requires management to make estimates and assumptions in determining the reported amounts of assets and liabilities, disclosure of contingent liabilities at the date of the Consolidated Financial Statements and the reported amounts of revenue and expenses during the reporting period. On an on-going basis, the Company evaluates its estimates including those related to derivatives and hedging activities, income taxes including the valuation allowance for deferred tax assets, self-insurance reserves, litigation reserves, restructuring reserves, allowance for doubtful accounts,credit losses, contingent consideration, redeemable noncontrolling interest, and valuation of goodwill, long-lived and intangible assets. The Company bases its estimates on historical experience and on various other assumptions that are believed to be reasonable, the results of which form the basis for making judgments about the carrying values of assets and liabilities. Actual results may differ materially from these estimates under different assumptions or conditions.
Cash, Cash Equivalents and Restricted Cash
Cash and cash equivalents consist of cash, primarily held in interest-bearing investments, and liquid short-term investments, which have original maturities of less than 90 days. Restricted cash includes cash whereby the Company’s ability to use the funds at any time is contractually limited or is generally designated for specific purposes arising out of certain contractual or other obligations.
The Company manages a centralized global treasury function in the United States with a focus on safeguarding and optimizing the use of its global cash and cash equivalents. The Company’s cash is held in the U.S. in U.S. dollars and outside of the U.S. in U.S. dollars and foreign currencies. The Company believes that it has effectively mitigated and managed its risk relating to its global cash through its cash management practices, banking partners, and utilization of diversified bank deposit accounts and high quality investments. However, the Company can provide no assurances that it will not sustain losses.
The following table provides a reconciliation of cash, cash equivalents and restricted cash reported in the Consolidated Balance Sheets that sum to the amounts reported in the Consolidated Statement of Cash Flows (in thousands):
| | | | | | | | | | | |
| | | December 31, 2022 |
| December 31, 2021 |
| December 31, 2020 | | |||
| | | | | | | | | | | |
Cash and cash equivalents | | | $ | 153,435 |
| $ | 158,205 |
| $ | 132,914 | |
Restricted cash included in "Prepaid and other current assets" | | |
| 13,629 | |
| 22,477 | |
| 26,101 | |
Total | | | $ | 167,064 |
| $ | 180,682 |
| $ | 159,015 | |
Concentration of Credit Risk
The Company is exposed to credit risk in the normal course of business, primarily related to accounts receivable and derivative instruments. Historically, the losses related to credit risk have been immaterial. The Company regularly monitors its credit risk to mitigate the possibility of current and future exposures resulting in a loss. The Company evaluates the creditworthiness of its clients prior to entering into an agreement to provide services and as necessary through the life of the client relationship. The Company does not believe it is exposed to more than a nominal amount of credit risk in its derivative hedging activities, as the Company diversifies its activities across nineeight investment-grade financial institutions.
Fair Value of Financial Instruments
Fair values of cash equivalents, accounts receivable, andaccounts payable and debt approximate the carrying amounts because of their short-term nature.
Cash, Cash EquivalentsAccounts Receivable
At the end of each quarter an allowance for credit losses will be calculated based on the current quarterly revenue multiplied by the historical loss percentage of the prior three-year period and Restricted Cash
Cash and cash equivalents consist of cash and highly liquid short-term investments, primarily held in interest-bearing investments which have original maturities of less than 90 days. Restricted cash includes cash whereby the Company’s ability to use the funds at any time is contractually limited or is generally designed for specific purposes arising out of certain contractual or other obligations.
The Company manages a centralized global treasury functionrecorded in the United States with a focus on concentrating and safeguarding its global cash and cash equivalents. While the majority of the Company’s cash is held outside the U.S., the Company prefers to hold U.S. Dollars inincome statement. In addition to the local currenciesevaluation of historical losses, the foreign subsidiaries.Company considers current and future economic conditions and events such as changes in customer credit quality and liquidity. The Company believes that it has effectively mitigated and managed its risk relating to its global cash through its cash management practices, banking partners, and utilization of diversified, high quality investments. However, the Company can provide no assurances that it will not sustain losses.
The following table provides a reconciliation of cash, cash equivalents and restricted cash reported in the Consolidated Balance Sheets that sum to the amounts reported in the Consolidated Statement of Cash Flows (in thousands):
|
|
|
|
|
|
|
|
|
|
|
|
|
|
| December 31, 2019 |
| December 31, 2018 |
| December 31, 2017 |
| |||
|
|
|
|
|
|
|
|
|
|
|
|
Cash and cash equivalents |
|
| $ | 82,407 |
| $ | 78,237 |
| $ | 74,437 |
|
Restricted cash included in "Prepaid and other current assets" |
|
|
| 23,172 |
|
| — |
|
| — |
|
Restricted cash included in "Other noncurrent assets" |
|
|
| 12 |
|
| — |
|
| — |
|
Total |
|
| $ | 105,591 |
| $ | 78,237 |
| $ | 74,437 |
|
F-9
Accounts Receivable
An allowance for doubtful accounts is determined based on the aging of the Company’s accounts receivable, historical experience, client financial condition, and management judgment. The Company writes offwrite-off accounts receivable against thethis allowance when the Company determines a balance is uncollectible.
F-10
Derivatives
The Company enters into foreign exchange forward and option contracts to reduce its exposure to foreign currency exchange rate fluctuations that are associated with forecasted revenue earned in foreign locations. The Company also enters into interest rate derivatives which consist of interest rate swaps to reduce the Company’s exposure to interest rate fluctuations associated with its variable rate debt. Upon proper qualification, these contracts are designated as cash flow hedges. The Company formally documents at the inception of the hedge all relationships between hedging instruments and hedged items as well as its risk management objective and strategy for undertaking various hedging activities.
All derivative financial instruments are reported at fair value and recorded in Prepaids and other current assets, Other long-term assets, Other current liabilities, and Other long-term liabilities in the accompanying Consolidated Balance Sheets as applicable for each period end. Changes in fair value of derivative instruments designated as cash flow hedges are recorded in Accumulated other comprehensive income (loss), a component of Stockholders’ Equity, to the extent they are deemed effective. Ineffectiveness is measured based on the change in fair value of the forward contracts and the fair value of the hypothetical derivatives with terms that match the critical terms of the risk being hedged. Based on the criteria established by current accounting standards, the Company’s cash flow hedge contracts are deemed to be highly effective. Any realized gains or losses resulting from the foreign currency cash flow hedges are recognized together with the hedged transaction within Revenue. Any realized gains or losses from the interest rate swaps are recognized in Interest expense. Gains and losses from the settlements of the Company’s net investment hedges remain in Accumulated other comprehensive income (loss) until partial or complete liquidation of the applicable net investment.
The Company also enters into fair value derivative contracts that hedge against foreign currency exchange gains and losses primarily associated with short-term payables and receivables. Changes in the fair value of derivative instruments designated as fair value hedges affect the carrying value of the asset or liability hedged, with changes in both the derivative instrument and the hedged asset or liability being recognized in Other income (expense), net in the accompanying Consolidated Statements of Comprehensive Income (Loss).
Property, Plant and Equipment
Property, plant and equipment are stated at historical cost less accumulated depreciation and amortization. Maintenance, repairs and minor renewals are expensed as incurred.
Depreciation and amortization are computed on the straight-line method based on the following estimated useful lives:
| | |
Building |
| 30 years |
Computer equipment and software |
| 3 to 7 years |
Telephone equipment |
| 4 to 7 years |
Furniture and fixtures |
| 5 years |
Leasehold improvements |
| Lesser of economic useful life (typically 10 years) or original lease term |
Other |
| 3 to 7 years |
The Company evaluates the carrying value of property, plant and equipment for impairment whenever events or changes in circumstances indicate that the carrying amounts may not be recoverable. An asset is considered to be impaired when the forecasted undiscounted cash flows of an asset group are estimated to be less than its carrying value. The amount of impairment recognized is the difference between the carrying value of the asset group and its fair value. Fair value estimates are based on assumptions concerning the amount and timing of forecasted future cash flows.
F-10
Software Development Costs
The Company capitalizes costs incurred to acquire or develop software for internal use. Capitalized software development costs are amortized using the straight-line method over the estimated useful life equal to the lesser of the license term or 4 or 7 years depending on the software type. The expense related to these assets has been classified as amortization expense is recorded in Depreciation and amortization inwithin the accompanyingincome statement except for assets that are classified as cloud computing arrangements which will be expensed as operating expenses within the income statement.
F-11
TTEC HOLDINGS, INC. AND SUBSIDIARIES
Notes to the Consolidated Financial Statements of Comprehensive Income (Loss).
Goodwill
The Company evaluates goodwill for possible impairment at least annually on December 1, and whenever events or changes in circumstances indicate that the carrying amount of such assets may not be recoverable. The Company uses a two steptwo-step process to assess the realizability of goodwill. The first step, Step 0, is a qualitative assessment that analyzes current economic indicators associated with a particular reporting unit. For example, the Company analyzes changes in economic, market and industry conditions, business strategy, cost factors, and financial performance, among others, to determine if there would be a significant decline to the fair value of a particular reporting unit. A qualitative assessment also includes analyzing the excess fair value of a reporting unit over its carrying value from impairment assessments performed in previous years. If the qualitative assessment indicates a stable or improved fair value, no further testing is required.
If a qualitative assessment indicates that a significant decline to fair value of a reporting unit is more likely than not, or if a reporting unit’s fair value has historically been closer to its carrying value, the Company will proceed to Step 1 testing where the Company calculates the fair value of a reporting unit. If Step 1 indicates that the carrying value of a reporting unit is in excess of its fair value, the Company will record an impairment equal to the amount by which a reporting unit’s carrying value exceeds its fair value.
Other Intangible Assets
The Company has other intangible assets that include customer relationships (definite-lived), trade names (definite-lived) and non-compete agreements (definite-lived). Definite-lived intangible assets are amortized on a straight-line basis over their estimated useful lives, which range from 31 to 12 years. The Company evaluates the carrying value of its definite-lived intangible assets whenever events or changes in circumstances indicate that the carrying amount may not be recoverable. A definite-lived intangible asset is considered to be impaired when the forecasted undiscounted cash flows of its asset group are estimated to be less than its carrying value.
The Company evaluates indefinite-lived intangible assets for possible impairment at least annually or whenever events or changes in circumstances indicate that the carrying amount of such assets may not be recoverable. Similar to goodwill, the Company may first use a qualitative analysis to assess the realizability of its indefinite-lived intangible assets. The qualitative analysis will include a review of changes in economic, market and industry conditions, business strategy, cost factors, and financial performance, among others, to determine if there would be a significant decline to the fair value of an indefinite-lived intangible asset. If a quantitative analysis is completed, an indefinite-lived intangible asset (i.e. trade name) is evaluated for possible impairment by comparing the fair value of the asset with its carrying value. Fair value is estimated as the discounted value of future revenues arising from a trade name using a royalty rate that a market participant would pay for use of that trade name. An impairment charge is recorded if the trade name’sintangible asset’s carrying value exceeds its estimated fair value.
Self Insurance Liabilities
The Company self-insures for certain levels of workers’ compensation and employee health insurance. The Company records estimated liabilities for these insurance lines based upon analyses of historical claims experience. The most significant assumption the Company makes in estimating these liabilities is that future claims experience will emerge in a similar pattern with historical claims experience. The liabilities related to workers’ compensation and employee health insurance are included in Accrued employee compensation and benefits in the accompanying Consolidated Balance Sheets. The liability for other general liability insurance is included in Other accrued expenses in the accompanying Consolidated Balance Sheets.
F-11
Restructuring Liabilities
The Company routinely assesses the profitability and utilization of its customer engagement centers and existing markets. In some cases, the Company has chosen to close under-performing customer engagement centers and complete reductions in workforce to enhance future profitability. Severance payments that occur from reductions in workforce are in accordance with the Company’s postemployment plans and/or statutory requirements that are communicated to all employees upon hire date; therefore, severance liabilities are recognized when they are determined to be probable and reasonably estimable. Other liabilities for costs associated with an exit or disposal activity are recognized when the liability is incurred, rather than upon commitment to a plan.
Asset Retirement ObligationsF-12
Asset retirement obligations relateTTEC HOLDINGS, INC. AND SUBSIDIARIES
Notes to legal obligations associated with the retirement of long-lived assets resulting from the acquisition, construction, development and/or normal use of the underlying assets.Consolidated Financial Statements
The Company records all asset retirement obligations at estimated fair value. The Company’s asset retirement obligations primarily relate to clauses in its customer engagement center operating leases which require the Company to return the leased premises to its original condition. The associated asset retirement obligations are capitalized as part of the carrying amount of the underlying asset and depreciated over the estimated useful life of the asset. The liability, reported within Other long-term liabilities, is accreted through charges to operating expenses. If the asset retirement obligation is settled for an amount other than the carrying amount of the liability, the Company recognizes a gain or loss on settlement in operating expenses.
Income Taxes
Accounting for income taxes requires recognition of deferred tax assets and liabilities for the expected future income tax consequences of transactions that have been included in the Consolidated Financial Statements or tax returns. Under this method, deferred tax assets and liabilities are determined based on the difference between the financial statement and tax basis of assets and liabilities using enacted tax rates in effect for the year in which the differences are expected to reverse. Gross deferred tax assets may then be reduced by a valuation allowance for amounts that do not satisfy the realization criteria established by current accounting standards.
The Company accounts for uncertain tax positions using a two-step approach to recognizing and measuring uncertain tax positions. The first step is to determine if the weight of available evidence indicates that it is more likely than not that the tax position will be sustained on audit. The second step is to estimate and measure the tax benefit as the amount that has a greater than 50% likelihood of being realized upon ultimate settlement with the tax authority. The Company evaluates these uncertain tax positions on a quarterly basis. This evaluation is based on the consideration of several factors including changes in facts or circumstances, changes in applicable tax law, and settlement of issues under audit. The Company recognizes interest and penalties related to uncertain tax positions as a part of the Provision for income taxes in the accompanying Consolidated Statements of Comprehensive Income (Loss).
No significant changes in indefinite reinvestment assertion were made during 2019.2022. The Company has completed its analysis in regard to the full tax impact related to prior changes in indefinite reinvestment reassertion and any related taxes have been recorded. The Company generally intends to limit distributions from non-U.S. subsidiaries of cash balances available in foreign jurisdictions.
No additional income taxes have been provided for any remaining outside basis difference inherent in our foreign subsidiaries as these amounts continue to be indefinitely reinvested in foreign operations. Determination of any unrecognized deferred tax liability related to the outside basis difference in investments in foreign subsidiaries is not practicable due to the inherent complexity of the multi-national tax environment in which we operate.
F-12
Tax Reform
In 2017, the United States enacted comprehensive tax reform legislation known as the Tax Cuts and Jobs Act (the "2017 Tax Act") that, among other things, reduced the U.S. federal corporate income tax rate from 35% to 21% and implemented a territorial tax system, but imposed an alternative “base erosion and anti-abuse tax” (“BEAT”), and an incremental tax on global intangible low taxed foreign income (“GILTI”) effective January 1, 2018. In addition, the law imposed a one-time mandatory repatriation tax on accumulated post-1986 foreign earnings on domestic corporations effective for the 2017 tax year. As of December 31, 2018, the Company had completed the accounting for the tax effects of the 2017 Tax Act and no material adjustment was recorded to the 2017 estimate.
While the Company’s accounting for the recorded impact of the 2017 Tax Act is deemed to be complete, these amounts are based on prevailing regulations and current information, and any additional guidance issued by the Internal Revenue Service (“IRS”) or the results of an audit related to these items, could impact the Company’s recorded amounts in future periods.
The Company’s selection of an accounting policy with respect to both the new GILTI and BEAT rules is to compute the related taxes in the period the entity becomes subject to either. A reasonable estimate of the effects of these provisions has been included in the 2019 and 2018 annual financial statements.
Revenue Recognition
2019 and 2018 Revenue
The Company recognizes revenue from contracts and programs when control of the promised goods or services is transferred to the customers, in an amount that reflects the consideration it expects to be entitled to in exchange for those goods or services. Revenue is recognized when or as performance obligations are satisfied by transferring control of a promised good or service to a customer. A performance obligation is a promise in a contract to transfer a distinct good or service to the customer. Performance obligation is the unit of accounting for revenue recognition under the provisions of ASC Topic 606, “Revenue from Contracts with Customers” and all related amendments (“ASC 606”). A contract’s transaction price is allocated to each distinct performance obligation in recognizing revenue.
F-13
The Business Process Outsourcing (“BPO”) inbound and outbound service fees are based on either a per minute, per hour, per FTE, per transaction or per call basis, which represents the majority of our contracts. These contracts have a single performance obligation as the promise to transfer the individual goods or services is not separately identifiable from other promises in the contracts and, therefore, not distinct. For example, services for the training of the Company’s agents (which are separately billable to the customer) are a separate promise in the BPO contracts, but they are not distinct from the primary service obligations to transfer services to the customers. The performance of the customer service by the agents is highly dependent on the initial, growth, and seasonal training services provided to the agents during the life of a program. The training itself is not considered to have value to the customer on a standalone basis, and therefore, training on a standalone basis cannot be considered a separate unit of accounting. The Company therefore defers revenue from certain training services that are rendered mainly upon commencement of a new client contract or program, including seasonal programs. Revenue is also deferred when there is significant growth training in an existing program. Accordingly, recognition of initial, growth, and seasonal training revenues and associated costs (consisting primarily of labor and related expenses) are deferred and amortized over the period of economic benefit. With the exception of training which is typically billed upfront and deferred, the remainder of revenue is invoiced on a monthly or quarterly basis as services are performed and does not create a contract asset or liability.
In addition to revenue from BPO services, revenue also consists of fees from services for program launch, professional consulting, fully-hosted or managed technology and learning innovation services. The contracts containing these service offerings may contain multiple performance obligations. For contracts with multiple performance obligations, the Company allocates the contract’s transaction price to each performance obligation using the best estimate of the standalone selling price of each distinct good or service in the contract. The primary method used to estimate standalone selling price is the expected cost plus a margin approach, under which the Company forecasts its expected costs of satisfying a performance obligation and then adds an appropriate margin for that distinct good or service. The Company forecasts its expected cost based on
F-13
historical data, current prevailing wages, other direct and indirect costs incurred in recently completed contracts, market conditions, and other client specific cost considerations. For these services, the point at which the transfer of control occurs determines when revenue is recognized in a specific reporting period. Within ourthe Digital segment, where there are product sales, the attribution of revenue is recognized when the transfer of control is completed and the products are delivered to the client’s location. Where services are rendered to a customer, the attribution is aligned with the progress of work and is recognized over time (i.e. based on measuring the progress toward complete satisfaction of a performance obligation using an output method or an input method). Where an output method is used, revenue is recognized on the basis of direct measurements of the value to the customer of the goods or services transferred relative to the remaining goods or services promised under the contract. The majority of the Company’s services are recognized over time using the input method in which revenue is recognized on the basis of efforts or inputs toward satisfying a performance obligation (for example, resources consumed, labor hours expended, costs incurred, or time elapsed) relative to the total expected inputs to satisfy the performance obligation. The measures used provide faithful depiction of the transfer of goods or services to the customers. For example, revenue is recognized on certain consulting contracts based on labor hours expended as a measurement of progress where the consulting work involves input of consultants’ time. The progress is measured based on the hours expended over total number of estimated hours included in the contract multiplied by the total contract consideration. The contract consideration can be a fixed price or an hourly rate, and in either case, the use of labor hours expended as an input measure provides a faithful depiction of the transfer of services to the customers. Deferred revenues for these services represent amounts collected from, or invoiced to, customers in excess of revenues recognized. This results primarily from i) receipt of license fees that are deferred due to one or more of the revenue recognition criteria not being met, and ii) the billing of annual customer support agreements, annual managed service agreements, and billings for other professional services that have not yet been performed by the Company. The Company records amounts billed and received, but not earned, as deferred revenue. These amounts are recorded in either Deferred revenue or Other long-term liabilities, as applicable, in the accompanying Consolidated Balance Sheets based on the period over which the Company expects to render services. Costs directly associated with revenue deferred, consisting primarily of labor and related expenses, are also deferred and recognized in proportion to the expected future revenue from the contract.
F-14
Variable consideration exists in contracts for certain client programs that provide for adjustments to monthly billings based upon whether the Company achieves, exceeds or fails certain performance criteria. Adjustments to monthly billings consist of contractual bonuses/penalties, holdbacks and other performance based conditions. Variable consideration is estimated at contract inception at its most likely value and updated at the end of each reporting period as additional performance data becomes available. Revenue related to such variable consideration is recognized only to the extent that a significant reversal of any incremental revenue is not considered probable.
Contract modifications are routine in the performance of the customer contracts. Contracts are often modified to account for customer mandated changes in the contract specifications or requirements, including service level changes. In most instances, contract modifications relate to goods or services that are incremental and distinctly identifiable, and, therefore, are accounted for prospectively.
Incremental Costs to Obtain a Contract
Direct and incremental costs to obtain or fulfill a contract are capitalized, and the capitalized costs are amortized over the corresponding period of benefit, determined on a contract by contract basis. The Company recognizes an asset for the incremental costs of obtaining a contract with a customer if it expects to recover those costs. The incremental costs of obtaining a contract are those costs that the Company incurs to obtain a customer contract that it would not have incurred if the contract had not been obtained. Contract acquisition costs consist primarily of payment of commissions to sales personnel and are incurred when customer contracts are signed. The deferred sales commission amounts are amortized based on the expected period of economic benefit and are classified as current or non-current based on the timing of when they are expected to be recognized as an expense. Costs to obtain a contract that would have been incurred regardless of whether the contract was obtained are recognized as an expense when incurred, unless those costs are explicitly chargeable to the customer regardless of whether the contract is obtained. Sales commissions are paid for obtaining new clients only and are not paid for contract renewals or contract modifications.Capitalized costs of obtaining contracts
F-14
are periodically reviewed for impairment. As of December 31, 2019,2022, the Company has a deferred asset of $7.0$6.6 million related to sales commissions.
In certain cases, the Company negotiates an upfront payment to a customer in conjunction with the execution of a contract. Such upfront payments are critical to acquisition of new business and are often used as an incentive to negotiate favorable rates from the clients and are accounted for as upfront discounts for future services. Such payments are either made in cash at the time of execution of a contract or are netted against the Company’s service invoices. Payments to customers are capitalized as contract acquisition costs and are amortized in proportion to the expected future revenue from the contract, which in most cases results in straight-line amortization over the life of the contract. Such payments are considered a reduction of the selling prices of the Company’s products or services, and therefore, are accounted for as a reduction of revenue when amortized. Such capitalized contract acquisition costs are periodically reviewed for impairment taking into consideration ongoing future cash flows expected from the contract and estimated remaining useful life of the contract.
Practical Expedients and Exemptions
Some of the Company’s service contracts are short-term in nature with a contract term of one year or less. For those contracts, the Company has utilized the practical expedient in ASC 606-10-50-14 exempting the Company from disclosure of the transaction price allocated to remaining performance obligations if the performance obligation is part of a contract that has an original expected duration of one year or less. Also in alignment with ASC 606-10-50-14, the Company does not disclose the value of unsatisfied performance obligations for contracts for which it recognizes revenue at the amount to which it has the right to invoice for services performed. Additionally, the Company’s standard payment terms are less than one year from transfer of goods or services, as such, the election could apply.services. Given the foregoing, the Company has elected the practical expedient under ASC 606-10-32-18 to not assess whether a contract has a significant financing component. Pursuant to the Company’s election of the practical expedient under ASC 606-10-32-2A, sales, value add, and other taxes that are collected from customers concurrent with revenue-producing activities, which the Company has an obligation to remit to the governmental authorities, are excluded from revenue.
2017 and Prior Revenue
The Company recognizes revenue when evidence of an arrangement exists, the delivery of service has occurred, the fee is fixed or determinable and collection is reasonably assured. The BPO inbound and outbound service fees are based on either a per minute, per hour, per full-time employee, per transaction or per call basis. Certain client programs provide for adjustments to monthly billings based upon whether the Company achieves, exceeds or fails certain performance criteria. Adjustments to monthly billings consist of contractual bonuses/penalties, holdbacks and other performance based contingencies. Revenue recognition is limited to the amount that is not contingent upon delivery of future services or meeting other specified performance conditions.
Revenue also consists of services for agent training, program launch, professional consulting, fully-hosted or managed technology and learning innovation. These service offerings may contain multiple element arrangements whereby the Company determines if those service offerings represent separate units of accounting. A deliverable constitutes a separate unit of accounting when it has standalone value and delivery or performance of the undelivered items is considered probable and substantially within the Company’s control. If those deliverables are determined to be separate units of accounting, revenue is recognized as services are provided. If those deliverables are not determined to be separate units of accounting, revenue for the delivered services are bundled into one unit of accounting and recognized over the life of the arrangement or at the time all services and deliverables have been delivered and satisfied. The Company allocates revenue to each of the deliverables based on a selling price hierarchy of vendor specific objective evidence (“VSOE”), third-party evidence, and then estimated selling price. VSOE is based on the price charged when the deliverable is sold separately. Third-party evidence is based on largely interchangeable competitor services in standalone sales to similarly situated customers. Estimated selling price is based on its best estimate of what the selling prices of deliverables would be if they were sold regularly on a standalone basis. Estimated selling price is established considering multiple factors including, but not limited to, pricing practices in different geographies, service
F-15
offerings, and customer classifications. Once the Company allocates revenue to each deliverable, it recognizes revenue when all revenue recognition criteria are met.
Periodically, the Company will make certain expenditures related to acquiring contracts or provide up-front discounts for future services. These expenditures are capitalized as contract acquisition costs and amortized in proportion to the expected future revenue from the contract, which in most cases results in straight-line amortization over the life of the contract. Amortization of these contract acquisition costs is recorded as a reduction to revenue.
Lease Expense
The Company has negotiated certain rent holidays, landlord/tenant incentives and escalations in the base price of lease payments over the initial term of its operating leases. The initial term could include the “build-out” period of leases, where no lease payments are typically due. The Company recognizes rent holidays and rent escalations on a straight-line basis to lease expense over the lease term. The landlord/tenant incentives are recorded as a reduction to the right of use asset and depreciated on a straight line basis over the remaining lease term once the assets are placed in service.
Equity-Based Compensation Expense
Equity-based compensation expense for all share-based payment awards granted is determined based on the grant-date fair value net of an estimated forfeiture rate on a straight-line basis over the requisite service period of the award, which is typically the vesting term of the share-based payment award. The Company estimates the forfeiture rate annually based on its historical experience of forfeited awards.
Foreign Currency Translation
The assets and liabilities of the Company’s foreign subsidiaries, whose functional currency is not the U.S. Dollar, are translated at the exchange rates in effect on the last day of the period and income and expenses are translated using the monthly average exchange rates in effect for the period in which the items occur. Foreign currency translation gains and losses are recorded in Accumulated other comprehensive income (loss) within Stockholders’ Equity. Foreign currency transaction gains and losses are included in Other income (expense), net in the accompanying Consolidated Statements of Comprehensive Income (Loss).
Recently Adopted Accounting Pronouncements
On January 1, 2018, the Company adopted ASC 606, using the modified retrospective method. The adoption of ASC 606 resulted in the deferral of certain fees that had already been recognized in prior periods. The Company recorded a net reduction to opening retained earnings of $10.0 million, net of tax, as of January 1, 2018 due to the cumulative impact of adopting ASC 606. The ASC 606 adjustments pertain to the timing of revenue recognition associated with upfront training fees on certain contracts. Consistent with the modified retrospective method of adoption, the Company has not adjusted prior period amounts which continue to be reported in accordance with the Company’s historic revenue accounting policy and principles.
In February 2016, the Financial Accounting Standards Board (“FASB”) issued Accounting Standards Update (“ASU”) 2016-02, “Leases”, which amends the existing accounting standards for lease accounting, including requiring lessees to recognize most leases on their balance sheets related to the rights and obligations created by those leases, and making targeted changes to lessor accounting. The FASB also issued ASU 2018-10, Codification Improvements to Topic 842 Leases, and ASU 2018-11, Targeted Improvements to Topic 842 Leases, which allows the new lease standard to be applied as of the adoption date with a cumulative-effect adjustment to the opening balance of retained earnings rather than a retroactive restatement of all periods presented.
F-16
The Company adopted Accounting Standards Codification (“ASC”) 842 as of January 1, 2019 using the effective date as the date of initial application. The election allowed the Company to recognize the effects of the implementation of ASC 842 as a cumulative effect adjustment to the opening balance of retained earnings in the period of adoption. The Company also made certain assumptions in judgements when applying ASC 842. The most significant judgements are as follows:
|
|
|
|
|
|
|
|
The Company determines if an arrangement is a lease at contract inception. The key specifics in determining if a leasing arrangement exists are as follows:
|
|
|
|
The Company predominantly acts as a lessee and is required under the new standard to apply a dual approach, classifying leases as either finance or operating leases based on whether or not the lease is effectively a financed purchase. The determination of the lease type is largely similar to the process the Company utilized under ASC 840. This classification determines whether lease expense is recognized based on an effective interest method or on a straight-line basis over the term of the lease. ASC 842 also requires lessees to record a right of use asset and a lease liability for all leases with a term of greater than one year regardless of classification.
The adoption of the new standard resulted in the recording of additional net lease assets and lease liabilities of $129.9 million and $148.3 million, respectively, as of January 1, 2019. The operating lease assets are lower than the operating lease liabilities primarily due to deferred rent balances at the transition date being reclassed into the right of use operating assets. On January 1, 2019 the Company recognized a reduction of $0.8 million, net of tax, in its retained earnings as a result of recognizing previously impaired right of use assets recorded at transition. The standard did not impact our consolidated net earnings or cash flows. See Note 15 for additional lease disclosures.
Other Recently Issued Accounting Pronouncements
In August 2017, the FASB issued ASU 2017-12, “Derivatives and Hedging (Topic 815): Targeted Improvements to Accounting for Hedging Activities”. ASU 2017-12 amends and simplifies existing guidance for derivatives and hedges including aligning accounting with companies’ risk management strategies and increasing disclosure transparency regarding both the scope and results of hedging programs. The changes include designation and measurement guidance for qualifying hedging relationships and the presentation of hedge results. The ASU is effective for interim and annual periods beginning after December 15, 2018 and early adoption is permitted. The Company has adopted the new guidance effective January 1, 2019 and the adoption did not have a material impact on the consolidated statements or related disclosures.
F-17
In January 2016, the FASB issued ASU 2016-13, “Financial Instruments – Credit Losses” (ASC 326), which amends the methodology of how and when companies measure credit losses on financial instruments. The objective of the ASU is to provide financial statement users more useful information regarding expected credit losses on financial instruments and other commitments. In November 2018, the FASB issued ASU 2018-19, “Codification Improvements to Topic 326, Financial Instruments – Credit Losses” which clarifies the scope of guidance in ASU 2016-13. In May 2019, the FASB issued ASU No. 2019-05, “Financial Instruments – Credit Losses (Topic 326), Targeted Transition Relief”, which amended the transition guidance for the new credit losses standard (ASC 326). The ASU is effective for interim and annual periods beginning on or after December 15, 2019 with early adoption permitted, using a modified retrospective approach. The Company is finalizing the evaluation of effects of adoption on its consolidated financial statements and related disclosures with particular emphasis on accounts receivable as this will be the most impacted financial line item.
In December 2019, the FASB issuesissued ASU 2019-12, “Simplifying the Accounting for Income Taxes” (ASU 740), which is intended to simplify various aspects related to income tax accounting. The ASU iswas effective for interim and annual periods beginning on or after December 15, 2020 with early adoption permitted. The Company is currently evaluatingadopted the potential effects ofnew guidance effective January 1, 2021, and the adoption had no effect on its consolidatedthe financial statements or related disclosures during the year.
In October 2021, the FASB issued ASU 2021-08, Business Combinations (Topic 805), “Accounting for Contract Assets and Contract Liabilities from Contracts with Customers”, which now requires the acquirer to account for revenue contracts in accordance with Topic 606 as if it had acquired the contract, versus recording these assets and liabilities at fair value on acquisition date. The ASU is effective for interim and annual periods beginning on or after December 15, 2022 with early adoption permitted. The Company adopted the new guidance during the fourth quarter of 2021 which required application to all acquisitions completed during the adoption year. See further discussion in Note 2.
Other Accounting Pronouncements
In March 2020, the FASB issued ASU 2020-04, “Reference Rate Reform” (Topic 848), which provides optional expedients and exceptions for contracts, hedging relationships, and other transactions affected by reference rate reform due to the anticipated cessation of the London Interbank Offered Rate (“LIBOR”) on or before December 31, 2021. The ASU is effective from March 12, 2020 through December 31, 2022 and could impact the accounting for LIBOR provisions in the Company’s credit facility agreement. In addition, in January 2021, the FASB issued ASU 2021-01, “Reference Rate Reform – Scope,” which clarified the scope of ASC 848 relating to contract modifications. The Company has not yet adopted the standard but does not expect that the adoption of this guidance will have a material impact on the Company’s financial position, results of operations or cash flows.
F-16
(2)ACQUISITIONS
Certain Assets of Faneuil
On April 1, 2022, the Company completed an asset acquisition through its subsidiary TTEC Government Solutions LLC, of certain public sector citizen experience contracts in the transportation infrastructure and healthcare exchange industries from Faneuil, Inc., a subsidiary of ALJ Regional Holdings, Inc., (“the Faneuil Transaction”). The business is operated as part of the TTEC Engage segment and was fully consolidated into the financial statements of TTEC. The Faneuil Transaction was recorded as a business combination under ASC 805, Business Combinations, with identifiable assets acquired and liabilities assumed recorded at their estimated fair values as of the acquisition date.
Total cash paid at acquisition was $142.4 million. In addition, Faneuil granted to TTEC Government Solutions LLC a three-year call right and right of first offer to purchase certain other assets of Faneuil in its utilities and commercial healthcare verticals as well as certain proprietary technology. The Faneuil Transaction includes two contingent payments anticipated to be paid in early 2024 which are based on the revenue and EBITDA performance of one contract and one potential contract.
The fair value of the two contingent payments has been estimated using a Monte Carlo model. The model was based on current expected EBITDA performance for the two specific client programs, a discount rate of 7.6% related to revenue and a discount rate of 19.3% related to EBITDA, a volatility rate of 20%, and an adjusted risk-free rate of 1.7%. The potential payments range from a minimum of zero to an unlimited maximum. Based on the model, a combined $8.8 million expected future payment was calculated and recorded as of the acquisition date. During the third quarter of 2022, a $2.4 million net gain was recorded related to fair value adjustments for the estimated contingent payments based on the timing of cash flows and market interest rates which resulted in an updated discount factor for one contract and a complete reduction for the second contract as it was not awarded to the Company. During the fourth quarter of 2022, a $0.5 million net gain was recorded related to a fair value adjustment for the estimated contingent payment based on changes in estimated EBITDA and the timing of cash flows. These benefits were included in Other income (expense) in the Consolidated Statements of Comprehensive Income (Loss). As of December 31, 2022, the contingent payment is accrued at $5.9 million and is included in Other long-term liabilities in the accompanying Consolidated Balance Sheets.
The Faneuil Transaction included a call option providing the right but not the obligation to purchase additional assets in the utilities and commercial healthcare verticals based on trailing twelve-month revenue plus an additional earn-out payment based on newly added contracts. A second call option provided the right to purchase a software intangible asset and related disclosures.support functions based on trailing twelve-month revenue. These call options were valued based on information including the call right and the exclusivity period and a $270 thousand asset was recorded as of the acquisition date which is included in Other long-term assets in the accompanying Consolidated Balance Sheets. During the fourth quarter of 2022, a reduction in fair value of $52 thousand was recorded due to changes in estimated revenue, which was included in Other income (expense) in the Consolidated Statements of Comprehensive Income (Loss). As of December 31, 2022, the fair value is $218 thousand.
The Faneuil Transaction included an indemnity escrow which was disbursed as a holdback payment on the acquisition date. The indemnity payments relate to real estate and technology funds that will be spent post-close related to various IT upgrades and real estate expenses, and indemnity related to potential future employee wage increases. The indemnity payments were valued based on a weighted average of several current scenarios and a receivable of $10.4 million was recorded as of the acquisition date. During the third and fourth quarters of 2022, reductions in the fair value were calculated and a $4.4 million and a $0.2 million expense, respectively, were recorded related to fair value adjustments for the receivable based on current information reflecting a better outcome with the contract negotiations and slightly lower anticipated IT spending. The reductions in fair value related expense were included in Other income (expense) in the Consolidated Statements of Comprehensive Income (Loss). As of December 31, 2022, the fair value of the receivable is $5.7 million and is included in Other current assets in the accompanying Consolidated Balance Sheets.
F-17
A multi-period excess earnings method under the income approach was used to estimate the fair value of the customer relationships intangible assets. The significant assumptions utilized in calculating the fair value of the customer relationships intangible assets were the customer attrition rate, revenue growth rates, forecasted EBITDA, and the discount rate.
(2)ACQUISITIONSThe following summarizes the estimated fair values of the identifiable assets acquired and liabilities assumed as of the acquisition date (in thousands):
| | | | |
|
| Preliminary |
| |
| | Estimate of |
| |
| | Acquisition Date |
| |
| | Fair Value |
| |
Cash | | $ | — | |
Accounts receivable, net | |
| 704 | |
Prepaid and other assets | |
| 8,420 | |
Net fixed assets | | | 5,622 | |
Right of use lease assets | | | 17,778 | |
Other assets | | | 2,572 | |
Customer relationships | | | 61,310 | |
Goodwill | | | 75,902 | |
| | $ | 172,308 | |
| | | | |
Accrued employee compensation | | $ | 202 | |
Accrued expenses | |
| 2,763 | |
Right of use lease liability - current | | | 3,129 | |
Right of use lease liability - non-current | | | 14,092 | |
Deferred income | |
| 811 | |
Other liabilities | |
| 8,891 | |
| | $ | 29,888 | |
| | | | |
Total purchase price | | $ | 142,420 | |
First Call ResolutionThe estimates of fair value of identifiable assets and liabilities assumed are preliminary, pending finalization of the valuation, lease evaluation, and tax returns, thus are subject to revisions that may result in adjustments to the values presented above.
The Faneuil customer relationships have been estimated based on the initial valuation and will be amortized over an estimated useful life of 10 years. The goodwill recognized from the Faneuil acquisition is estimated to be attributable, but not limited to, the acquired workforce and expected synergies with the TTEC Engage segment. The tax basis of the acquired intangibles and goodwill will be materially deductible for income tax purposes. The acquired goodwill and intangibles and operating results of Faneuil are reported within the TTEC Engage segment from the date of acquisition.
Avtex
On October 26, 2019,April 8, 2021, the Company acquired, through its subsidiary TTEC Services Corporation (“TSC”), 70%Digital, LLC, 100% of the outstanding membership interest in First Call Resolution,stock of Avtex Solutions Holdings, LLC (“FCR”Avtex”),. Avtex is an Oregon limited liability company (“the Transaction”). FCR is aend-to-end customer care, social networkingexperience and business processCXaaS solutions service provider with approximately 2,000 employees basedofferings in the U.S.Genesys and Microsoft cloud solutions. The business has been integrated intois operated as part of the EngageTTEC Digital segment and is being fully consolidated into the financial statements of TTEC.
Total cash paid at acquisition was $107.0$499.946 million inclusive of $4.5($490.0 million related tobase purchase price plus cash, balances, for the 70% membership interest in FCR.less debt and working capital estimate). The Transaction wasAvtex transaction is subject to customary representations and warranties, holdbacks, and a net working capital adjustment. The Company used cash from operations and drew down on its Credit Facility to fund the acquisition. The Company finalized the net working capital adjustment for $0.1 million during the third quarter of 2021 which was paid by Avtex to the Company in the third quarter of 2021.
F-18
During the fourth quarter of 2021, TTEC implemented ASU 2021-08 which required an accounting modification to the deferred revenue balance as of the acquisition date (see discussion above in Note 1). The deferred revenue balance was evaluated as if TTEC had been the company securing the initial contract and accounted for these contracts in accordance with ASC 606. Based on this re-assessment, the $4.9 million reduction initially recorded to deferred revenue in connection with the purchase price accounting was eliminated and an offsetting increase to Goodwill was recorded as of the acquisition date. In connection with this modification, revenue of $3.4 million was recorded in the fourth quarter of 2021 related to deferred revenue from the second and third quarters of 2021.
A multi-period excess earnings method under the income approach was used to estimate the fair value of the customer relationships intangible asset. The significant assumptions utilized in calculating the fair value of the customer relationships intangible asset were the customer attrition rate, revenue growth rates, forecasted EBITDA, contributory asset charge, and the discount rate.
The following summarizes the estimated fair values of the identifiable assets acquired and liabilities assumed as of the acquisition date (in thousands):
| | | | |
| | Acquisition Date |
| |
| | Fair Value |
| |
Cash | | $ | 18,638 | |
Accounts receivable, net | |
| 22,214 | |
Prepaid expenses | |
| 26,389 | |
Current income tax receivables | | | 93 | |
Net fixed assets | | | 3,162 | |
Right of use lease assets | | | 3,614 | |
Other assets | | | 480 | |
Tradename | | | 5,300 | |
Intellectual property intangible | | | 770 | |
Customer relationships | | | 128,200 | |
Goodwill | | | 378,882 | |
| | $ | 587,742 | |
| | | | |
Accounts payable | | $ | 20,580 | |
Accrued employee compensation | |
| 4,325 | |
Accrued expenses | | | 250 | |
Right of use lease liability - current | | | 678 | |
Deferred revenue | |
| 56,765 | |
Accrued income taxes | | | 332 | |
Deferred tax liability | | | 1,930 | |
Right of use lease liability - noncurrent | |
| 2,936 | |
| | $ | 87,796 | |
| | | | |
Total purchase price | | $ | 499,946 | |
In the first quarter of 2022, the Company finalized the valuation of Avtex for the acquisition date assets acquired and liabilities assumed and determined that no material adjustments to any of the balances were required.
The Avtex customer relationships, intellectual property intangible, and tradename are being amortized over useful lives of 9, 3, and 1 years, respectively. The goodwill recognized from the Avtex acquisition is attributable, but not limited to, the acquired workforce and expected synergies with the TTEC Digital segment. The tax basis of the acquired intangibles and goodwill will be materially deductible for income tax purposes. The acquired goodwill and intangibles and operating results of Avtex are reported within the TTEC Digital segment from the date of acquisition.
F-19
VoiceFoundry US
On August 5, 2020, TTEC Digital, LLC, closed the first phase of the acquisition of the VoiceFoundry business by acquiring 100% of the business’s net assets in the U.S. and U.K., (the “VF US Transaction”). VoiceFoundry is a preferred Amazon Connect cloud contact center service and implementation partner. The business has been integrated into the TTEC Digital segment and is being fully consolidated into the financial statements of TTEC.
Total cash paid at acquisition was $34.3 million. The VF US Transaction included a potentialis subject to customary representations and warranties, holdbacks, and working capital adjustments. The VF US Transaction includes two contingent payments over the next two years with each payment withhaving a maximum value of $10.9$7.4 million based on FCR’sVF US’s EBITDA performance for 2020 EBITDA performance.and 2021. The Company finalized the net working capital adjustment for $0.4$0.3 million which was paid to VoiceFoundry during the first quarter of 2021.
The fair value of the contingent consideration has been estimated using a Monte Carlo model. The model was based on current expected EBITDA performance, a discount rate of 23.1%, a volatility rate of 47%, and an adjusted risk-free rate of 2.6%. Based on the model, a $10.9 million expected future payment was calculated and recorded as of the acquisition date. During the fourth quarter of 2020, the first quarter of 2021, the second quarter of 2021 and the fourth quarter of 2021, a $3.2 million expense, a $0.5 million expense, a $0.2 million expense, and a $25 thousand expense, respectively, were recorded related to a fair value adjustment of the estimated contingent consideration based on revised estimates of EBITDA performance for 2021. The expense was included in Other income (expense) in the Consolidated Statements of Comprehensive Income (Loss). During the first quarter of 2021, the contingent payment related to 2020 was finalized at a value of $7.4 million and was paid in April 2021. During the first quarter of 2022, the contingent payment related to 2021 was finalized at a value of $7.4 million and was paid in April 2022
In the first quarter of 2021, the Company finalized the valuation of VF US for the acquisition date assets acquired and liabilities assumed and determined that no material adjustments to any of the balances were required.
The VF US customer relationships and tradename are being amortized over useful lives of 4 and 2 years, respectively. The goodwill recognized from the VF US acquisition is attributable, but not limited to, the acquired workforce and expected synergies with TTEC Digital segment. The tax basis of the acquired intangibles and goodwill will be deductible for income tax purposes. The acquired goodwill and intangibles and operating results of VF US are reported within the TTEC Digital segment from the date of acquisition.
VoiceFoundry ASEAN
On November 4, 2020, TTEC Europe BV, a subsidiary of the Company, closed the final phase of the acquisition of the VoiceFoundry business by acquiring 100% of the issued stock of Saasy Ventures Pty Ltd. (“Saasy”, “VF ASEAN”). The business has been integrated into the TTEC Digital segment and is being fully consolidated into the financial statements of TTEC.
Total cash paid at acquisition was $15.2 million. The VF ASEAN Transaction is subject to customary representations and warranties, holdbacks, and working capital adjustments. The VF ASEAN Transaction includes two contingent payments over the next two years with each payment having a maximum value of $2.2 million based on VF ASEAN’s EBITDA performance for 2020 and 2021. The Company finalized the net working capital adjustment for $0.2 million which was paid from VoiceFoundry during the third quarter of 2021.
F-20
The fair value of the contingent consideration has been estimated using a Monte Carlo model. The model was based on current expected EBITDA performance, a discount rate of 18.4%, a volatility rate of 50%, and an adjusted risk-free rate of 1.6%. Based on the model, a $2.8 million expected future payment was calculated and recorded as of the acquisition date. During the fourth quarter of 2020, the first quarter of 2021, the second quarter of 2021 and the fourth quarter of 2021, a $1.2 million expense, a $0.4 million expense, a $0.1 million benefit and a $0.1 million expense, respectively, were recorded related to fair value adjustments of the estimated contingent consideration based on estimates of EBITDA performance for 2020 and 2021. These expenses/benefits were included in Other income (expense) in the Consolidated Statements of Comprehensive Income (Loss). During the first quarter of 2021, the contingent payment related to 2020 was finalized at a value of $2.2 million and was paid in April 2021. During the first quarter of 2022, the contingent payment related to 2021 was finalized at a value of $2.2 million and was paid in April 2022.
In the second quarter of 2021, the Company finalized the valuation for VF ASEAN for the acquisition date assets acquired and liabilities assumed and determined that no material adjustments to any of the balances were required.
The VF ASEAN customer relationships and tradename are being amortized over useful lives of 4 and 2 years, respectively. The goodwill recognized from the VF ASEAN Transaction is attributable, but not limited to, the acquired workforce and expected synergies with TTEC Digital segment. The tax basis of the acquired intangibles and goodwill will be not deductible for income tax purposes. The acquired goodwill and intangibles and operating results of VF ASEAN are reported within the TTEC Digital segment from the date of acquisition.
Serendebyte
On February 7, 2020, the Company acquired, through its subsidiary TTEC Digital LLC, 70% of the outstanding shares of capital stock of Serendebyte Inc., a Delaware corporation (“the Serendebyte Transaction”). Serendebyte is an autonomous customer experience and intelligent automation solutions provider based in India, the United States, and Canada. The business has been integrated into the TTEC Digital segment and is being fully consolidated into the financial statements of TTEC.
Total cash paid at acquisition, for 70% of the outstanding shares of capital stock, was $9.0 million. The Serendebyte Transaction is subject to customary representations and warranties, holdbacks, and a net working capital adjustment. The Company finalized the net working capital adjustment for $0.8 million during the second quarter of 2020 which will bewas paid from FCRby Serendebyte to TSCthe Company in Marchthe second quarter of 2020.
As of the closing of the Serendebyte Transaction, Ortana Holdings, LLC, an Oregon limited liability company (“Ortana”), owned by the FCR founders, will continueSerendebyte’s founder and certain members of its management continued to hold the remaining 30% membership interest in FCRSerendebyte, Inc. (“Remaining Interest”). Between January 31, 2023 and December 31, 2023, OrtanaSerendebyte’s founder and the management team shall have an option to sell to TSCTTEC Digital LLC and TSCTTEC Digital LLC shall have an option to purchase from Ortana the Remaining Interest at a purchase price equal to a multiple of FCR’sSerendebyte’s adjusted trailing twelve month EBITDA for this particular acquisition and not to compete with the Company for a period of four years after the disposition of the Remaining Interest.acquisition. The noncontrolling interest was recorded at fair value on the date of acquisition. The fair value was based on significant inputs not observable in the market (Level 3 inputs) including forecasted earnings, discount rate of 19.6%35%, working capital requirements and applicable tax rates. The noncontrolling interest was valued at $48.3$3.8 million at the acquisition date and is shown as Redeemable noncontrolling interest in the accompanying Consolidated Balance Sheets.
The fairCompany recognizes changes in the redemption value of the contingent consideration has been measuredRedeemable noncontrolling interest immediately as they occur but does not reduce the carrying value below the carrying value determined in accordance with ASC 810 (that amount being determined based on significant inputs not observable in the market (Level 3 inputs)allocation of income or loss to the noncontrolling interest as adjusted for distributions). Significant assumptions include a discount rate of 16.7% expected forecast volatility of 20%, an equivalent metric risk premium of 15.1%, risk-free rate of 1.6% and a credit spread of 1.8%. Based on these, a $6.5 million expected future payment was calculated. As of the acquisitionAt each subsequent reporting date, the presentcurrent redeemable value ofis calculated and, if necessary, an adjustment is recorded to increase or decrease the contingent consideration was $6.1 million.noncontrolling interest account to reflect the appropriate balance, with the corresponding adjustment to retained earnings. As of December 31, 2019, the value of the contingent consideration was $6.1 million and was included in Other long-term liabilities in the accompanying Consolidated Balance Sheets.
F-18
The following summarizes the fair values of the identifiable assets acquired and liabilities assumed as of the acquisition date (in thousands):
|
|
|
|
|
|
| Preliminary |
| |
|
| Estimate of |
| |
|
| Acquisition Date |
| |
|
| Fair Value |
| |
Cash |
| $ | 5,225 |
|
Accounts receivable, net |
|
| 10,659 |
|
Prepaid expenses |
|
| 357 |
|
Property and equipment |
|
| 6,006 |
|
Other assets |
|
| 224 |
|
Operating lease assets |
|
| 5,127 |
|
Tradename |
|
| 8,600 |
|
Customer relationships |
|
| 38,540 |
|
Goodwill |
|
| 96,993 |
|
|
| $ | 171,731 |
|
|
|
|
|
|
Accounts payable |
| $ | 388 |
|
Operating lease liability - short-term |
|
| 1,160 |
|
Accrued employee compensation and benefits |
|
| 4,049 |
|
Accrued expenses |
|
| 72 |
|
Operating lease liability - long-term |
|
| 3,967 |
|
|
| $ | 9,636 |
|
|
|
|
|
|
Total purchase price |
| $ | 162,095 |
|
The estimates of fair value of identifiable assets acquired and liabilities assumed are preliminary, pending finalization of a valuation and tax returns, thus are subject to revisions that may result in2022, no adjustments to the values presented above.
As part of the purchase, an additional net $0.7 million of cash was retained in the entity to pay for certain Ortana liabilities that had been recorded prior to the acquisition.
The FCR customer relationships and tradename have been estimated based on the initial valuation and will be amortized over an estimated useful life of 10 and 4 years, respectively. The goodwill recognized from the FCR acquisition is estimated to be attributable, but not limited to, the acquired workforce and expected synergies with Engage. The tax basis of the acquired intangibles and goodwill will be deductible for income tax purposes. The acquired goodwill and intangibles and operating results of FCR are reported within the Engage segment from the date of acquisition.
Strategic Communications Services
On April 30, 2018, the Company acquired all of the outstanding equity securities of Strategic Communications Services, Ltd (“SCS”). SCS provides services as a system integrator for multichannel contact center platforms, including CISCO. The Company offers in-house, managed and outsourced network, information, communications and contact center services to leading brands throughout Europe. This business has been integrated into the Company’s Digital segment.
Total cash paid at acquisition was £4.4 million ($6.1 million USD) (inclusive of $4.5 million related to cash balances). The purchase price was subject to customary representations and warranties, indemnities, and a net working capital adjustment. The agreement includes potential contingent payments over the next three years with a maximum value of £3.0 million ($4.1 million USD) based on EBITDA performance over the next three years. The Company finalized the working capital adjustment for an additional $210 thousand during the third quarter of 2018 which was paid in October 2018.
F-19
The fair value of the contingent consideration has been measured based on significant inputs not observable in the market (Level 3 inputs). Key assumptions include a discount rate of 4.7% and expected future value of payments of $2.9 million. The $2.9 million of expected future payments was calculated using probability weighted EBITDA assessment with the highest probability associated with SCS achieving the targeted EBITDA for each earn-out year. As of the acquisition date, the fair value of the contingent consideration was $2.7 million. During the fourth quarter of 2018 and the second quarter of 2019, $0.3 million and $2.4 million in net benefits, respectively, were recorded related to fair value adjustments ofchanges in the estimated contingent consideration based on revised actuals and estimates of EBITDA performance for 2018, 2019 and 2020. The benefits were included in Other Income (Expense) in the Consolidated Statements of Comprehensive Income (Loss) in the applicable quarters. As of December 31, 2019, the fair value of the contingent consideration was zero.
The following summarizes the fair values of the identifiable assets acquired and liabilities assumed as of the acquisition date (in thousands):
|
|
|
|
|
|
| Acquisition Date |
| |
|
| Fair Value |
| |
Cash |
| $ | 4,530 |
|
Accounts receivable, net |
|
| 985 |
|
Prepaid expenses |
|
| 39 |
|
Customer relationships |
|
| 3,619 |
|
Goodwill |
|
| 1,231 |
|
|
| $ | 10,404 |
|
|
|
|
|
|
Accounts payable |
| $ | 216 |
|
Accrued employee compensation and benefits |
|
| 27 |
|
Accrued expenses |
|
| 21 |
|
Deferred tax liabilities |
|
| 629 |
|
|
| $ | 893 |
|
|
|
|
|
|
Total purchase price |
| $ | 9,511 |
|
In the first quarter of 2019, the Company finalized its valuation of SCS for the acquisition date assets acquired and liabilities assumed and determined that no material adjustments to any of the balances were required.
The SCS customer relationships are being amortized over a useful life of 10 years. The goodwill recognized from the SCS acquisition is attributable, but not limited to, the acquired workforce and expected synergies with Digital. None of the tax basis of the acquired intangibles and goodwill will be deductible for income tax purposes. The acquired goodwill and intangibles and operating results of SCS are reported within the Digital segment from the date of acquisition.
Berkshire Hathaway Specialty Concierge
On March 31, 2018, the Company, through its subsidiary Percepta, acquired certain assets from Berkshire Hathaway Specialty Concierge, LLC (“BH”) related to a customer engagement center and the related customer contracts. This acquisition is being accounted for as a business combination. These assets will be integrated into the Company’s Engage segment.
The total cash paid was $1. In connection with the purchase, Percepta assumed the lease for the customer engagement center and entered into a transitional services agreement with BH to facilitate the transfer of the employees and business. Fair values were assigned to each purchased asset including $257 thousand for customer relationships, $330 thousand as a lease subsidy and $98 thousand for fixed assets. Based on the $1 purchase price, a gain on purchase of $685 thousand was recorded in the quarter ended March 31, 2018 and was included in Other income (expense) in the Consolidated Statements of Comprehensive Income (Loss).
F-20
Financial Impact of Acquired Businesses
The acquired businesses purchased in 2019 and 2018 noted above contributed revenues of $21.5 million and $3.1 million, and a net income of $0.2 million and $0.4 million, inclusive of $1.4 million and $0.2 million of acquired intangible amortization, to the Company for the years ended December 31, 2019 and 2018, respectively.
The unaudited proforma financial results for the twelve months ended 2019 and 2018 combines the consolidated results of the Company, FCR, SCS, and BH, assuming the acquisitions had been completed on January 1, 2018. The reported revenue and net income of $1,509.2 million and $35.8 million would have been $1,585.0 million and $48.2 million for the twelve months ended December 31, 2018, respectively, on an unaudited proforma basis.
For 2019, the reported revenue and net income of $1,643.7 million and $77.7 million would have been $1,716.9 million and $88.3 million for the year ended December 31, 2019, respectively, on an unaudited proforma basis.
The unaudited pro forma consolidated results are not to be considered indicative of the results if these acquisitions occurred in the periods mentioned above, or indicative of future operations or results. Additionally, the pro forma consolidated results do not reflect any anticipated synergies expected as a result of the acquisition.
Assets and Liabilities Held for Sale
During the third quarter of 2016, the Company determined that one business unit from the Engage segment and one business unit from the Digital segment would be divested from the Company’s operations. These business units met the criteria to be classified as held for sale. The Company took into consideration the discounted cash flow models, management input based on early discussions with brokers and potential buyers, and third-party evidence from similar transactions to complete the fair value analysis as there had not been a selling price determined at this point for either unit. For the two business units in Engage and Digital losses of $2.6 million and $2.7 million, respectively, were recorded as of December 31, 2016 in Loss on assets held for sale in the Consolidated Statements of Comprehensive Income (Loss).
For the business unit in Engage, based on further discussion and initial offers, management determined that the estimated selling price assumed should be revised and an additional $3.2 million loss was recorded as of June 30, 2017 and included in Loss on assets held for sale in the Consolidated Statements of Comprehensive Income (Loss). Effective December 22, 2017, the business unit was sold to The Search Agency (“TSA”) for an up-front payment of $245 thousand and future contingent earnout on the one year anniversary of the closing date. During the fourth quarter of 2017, a net $0.6 million gain was recorded in Loss on assets held for sale in the Consolidated Statements of Comprehensive Income (Loss).
For the business unit in Digital, based on further discussions and the offer at that time, management determined that the estimated selling price assumed should be revised and an additional $2.0 million loss was recorded during the quarter ended June 30, 2018 and included in Loss on assets held for sale in the Consolidated Statements of Comprehensive Income (Loss).
As of December 31, 2018, management determined that the business unit in Digital should be reclassified from assets held for sale to assets held and used. At this point, a fair value assessment of this specific balance sheet was completed and a $0.4 million gain was recorded during the quarter ended December 31, 2018. This gain in addition to the $2.0 million loss recorded earlier in 2018 were reclassified to Other Income (Expense), net in the Consolidated Statements of Comprehensive Income (Loss) for the year ended December 31, 2018. The assets and liabilities of the business are no longer separately identified as held for sale on the Consolidated Balance Sheets as of December 31, 2018 and 2017 and the estimated loss on sale recorded during 2016 has been reclassified to Other income (expense), net in the Consolidated Statements of Comprehensive Income (Loss).
F-21
Investments
CaféX
In 2015, the Company invested $9.0 million in CaféX Communications, Inc. (“CaféX”), a provider of omni-channel web-based real time communication (WebRTC) solutions, through the purchase of a portion of its outstanding Series B Preferred Stock. During the fourth quarter of 2016, the Company invested an additional $4.3 million to purchase a portion of the Series C Preferred Stock of CaféX. During the first quarter of 2019, the Company purchased a portion of the common shares of CaféX from another investor for $1. At December 31, 2019, the Company owns 17.8% of the total equity of CaféX. The investment is accounted for under the cost method of accounting. The Company evaluates its investments for possible other-than-temporary impairment at least annually or whenever events or changes in circumstances indicate that the carrying amount of such assets may not be recoverable.
During the first quarter of 2018, the Company provided a $2.1 million bridge loan to CaféX which accrues interest at a rate of 12% per year until maturity or conversion, which will be no later than June 30, 2020.
As of March 31, 2018, the Company evaluated the investment in CaféX for impairment due to a large anticipated sale of IP not being completed as planned, a shift in the strategy of the company, an ongoing default by CaféX of its loan agreement with its bank, and a lack of potential additional funding options. Based on this evaluation, the Company determined that the fair value of its investment was zero and thus the investment was impaired as of March 31, 2018. The Company recorded a $15.6 million write-off of the equity investment and the bridge loan which was included in Other income (expense) in the Consolidated Statements of Comprehensive Income (Loss).
Subsequent Event
On February 7, 2020, the Company acquired, through its subsidiary TTEC Digital, LLC (“TTEC Digital”), 70% of the outstanding shares of capital stock of Serendebyte Inc., a Delaware corporation (“the Transaction”). Serendebyte is an autonomous customer experience and intelligent automation solutions provider with 125 employees based in India, the United States, and Canada. The business has been integrated into the Digital segment.
Total cash paid at acquisition was $9.0 million. The Transaction is subject to customary representations and warranties, holdbacks, and a net working capital adjustment.
As of the closing of the Transaction, Serendebyte’s founder and certain members of its management will continue to hold the remaining 30% interest in Serendebyte, Inc. (“Remaining Interest”). Between January 31, 2023 and December 31, 2023, Serendebyte’s founder and the management team shall have an option to sell to TTEC Digital and TTEC Digital shall have an option to purchase the Remaining Interest at a purchase price equal to a multiple of Serendebyte’s adjusted trailing twelve month EBITDA for this particular acquisition.redemption value.
As a condition to closing, Serendebyte’s founder and certain members of the management team agreed to continue their affiliation with Serendebyte at least through 2023, and the founder agreed not to compete with TTEC for a period of four years after the disposition of the Remaining Interest.
F-21
TTEC HOLDINGS, INC. AND SUBSIDIARIES
DuringNotes to the secondConsolidated Financial Statements
In the fourth quarter of 2019,2020, the Company finalized changesthe valuation of Serendebyte for the acquisition date assets acquired and liabilities assumed and determined no material adjustments to any of the Company’s operating strategy andbalances were required.
At the waydate of the purchase, an additional $2.2 million of cash was retained in which the Company assesses performance. In accordance with this change,entity that was withdrawn by the Company adjusted certain reporting relationships betweenholders of the Chief Operating Decision Maker (“CODM”) and other members of management, updated the compensation metrics for senior management, and modified the internal financial reporting provided to the CODM and his direct reports consistent with this revised management and measurement structure. Accordingly,Remaining Interest during the second quarter of 2019,2020.
The Serendebyte customer relationships and tradename are being amortized over useful lives of 5 and 3 years, respectively. The goodwill recognized from the Serendebyte acquisition is attributable, but not limited to, the acquired workforce and expected synergies with TTEC Digital segment. The tax basis of the acquired intangibles and goodwill will not be deductible for income tax purposes. The acquired goodwill and intangibles and operating results of Serendebyte are reported within the TTEC Digital segment from the date of acquisition.
Financial Impact of Acquired Businesses
The acquired businesses purchased in 2022, 2021 and 2020 noted above contributed revenues of $112.3 million, $147.7 million and $19.4 million, and a net income of $6.0 million, $9.8 million and $1.9 million, to the Company reevaluatedin the definitionrespective year in which they were acquired for the years ended December 31, 2022, 2021 and 2020, respectively.
The unaudited proforma financial results for the twelve months ended 2022 combines the consolidated results of the operating segments, reportable segments,Company and reporting units which resulted in a changeFaneuil assuming the acquisition had been completed on January 1, 2021. The reported revenue and net income of $2,443.7 million and $103.2 million would have been $2,485.7 million and $106.6 million for the year ended December 31, 2022, respectively, on an unaudited proforma basis.
The unaudited proforma financial results for the twelve months ended 2021 combines the consolidated results of the Company, Faneuil assuming the acquisition had been completed on January 1, 2021, and Avtex assuming the acquisition had been completed on January 1, 2020. The reported revenue and net income of $2,273.1 million and $141.0 million would have been $2,447.3 million and $156.3 million for the year ended December 31, 2021, respectively, on an unaudited proforma basis.
The unaudited proforma financial results for the twelve months ended 2020 combines the consolidated results of the Company, and Avtex assuming the acquisition had been completed on January 1, 2020 and VoiceFoundry US, VoiceFoundry ASEAN and Serendebyte, assuming the acquisitions had been completed on January 1, 2019. For 2020, the reported revenue and net income of $1,949.2 million and $118.6 million would have been $2,135.6 million and $115.6 million for the year ended December 31, 2020, respectively, on an unaudited proforma basis.
The Company did not have any material, nonrecurring proforma adjustments directly attributable to the reportable segments. Effective June 30, 2019,business combinations included in the segment information was reported consistentproforma revenue earnings. These proforma amounts have been calculated after applying the Company’s accounting policies and adjusting the respective acquired businesses’ results to reflect the additional depreciation and amortization that would have been charged assuming the fair value adjustments to property, plant and equipment, and intangible assets had been applied from the date indicated, with the consequential tax effects.
The unaudited proforma consolidated results are not to be considered indicative of the results if these updated reportable segments comprisedacquisitions occurred in the periods mentioned above, or indicative of TTEC Digital and TTEC Engage.
future operations or results. Additionally, the proforma consolidated results do not reflect any anticipated synergies expected as a result of the acquisition.
F-22
Dissolutions
In the ordinary course of business, the Company operates different legal entities around the globe that have functional currencies other than USD. From time-to-time, the Company liquidates some of the entities when they are no longer needed to operate its business, and also forms new entities to support the needs of the business. The liquidation proceedings may take different forms, take considerable amount of time, and may also result in losses or gains unrelated to operations. In the second quarter ended June 30, 2020, the Company exited a foreign subsidiary that resulted in a non-cash $2.5 million loss included in Other income (expense), net in the Consolidated Statements of Comprehensive Income (Loss) from the realization of the Accumulated other comprehensive income (loss), which represents the currency translation adjustment of the investment in the foreign subsidiary. Similarly, in the third quarter ended September 30, 2020, the Company exited two foreign subsidiaries that ceased operations and were removed from the consolidated financial statements as of the reporting period ended September 30, 2020. As a result of the deconsolidation, a non-cash $17.4 million loss was included in Other income (expense), net in the Consolidated Statements of Comprehensive Income (Loss). The majority of this loss related to the realization of the Accumulated other comprehensive income (loss) balance which represents the currency translation adjustment of the investment in the foreign subsidiaries. The operating income of these subsidiaries prior to dissolution was not material to the year-to-date consolidated results of the Company.
Subsequent Event
Pursuant to the Membership Interest Purchase Agreement of October 26, 2019 between Ortana Holdings, Inc. and TTEC Services Corporation for the acquisition by TTEC of 70% interest in First Call Resolution, LLC (“FCR MIPA”), Ortana Holdings exercised its put rights which require TTEC to acquire Ortana Holdings’ remaining 30% interest in First Call Resolution, LLC. The purchase price for the remaining 30% interest was determined based on the express provisions of the FCR MIPA, was based on First Call Resolution’s performance during 2022, and has been finalized at $22.3 million. The only remaining actions in connection with this acquisition is the documentation of the transaction and the update of the seller’s representations and warranties about the business, which is expected to be completed during the first half of 2023.
(3)SEGMENT INFORMATION
The Company reports the following two segments:
TTEC Digital is one of the largest pure-play CX technology service providers with expertise in CX strategy, digitization, analytics, process optimization, systems integration, cloud-based technology solutions, and transformation enabled by the Company’s proprietary CX applications and technology partnerships. TTEC Digital designs, builds, and operates robust digital experiences for clients and their customers through the contextual integration and orchestration of CRM, data, analytics, CXaaS technology, and intelligent automation to ensure high-quality, scalable CX outcomes.
|
|
| Technology Services: |
| Professional Services: |
TTEC Engage provides the digitally enabled CX managed services to support our clients’ end-to-end customer interaction delivery at scale. The segment delivers omnichannel customer care, technology support, order fulfillment, customer acquisition, growth, and retention services with industry specialization and distinctive CX capabilities for hypergrowth brands. TTEC Engage also delivers digitally enabled back office and industry specific specialty services including AI operations, and fraud management services.
|
|
| Customer Acquisition, Growth, and Retention Services: |
F-23
|
|
The Company allocates to each segment its portion of corporate operating expenses. All intercompany transactions between the reported segments for the periods presented have been eliminated.
The following tables present certain financial data by segment (in thousands):
Year Ended December 31, 20192022
| | | | | | | | | | | | | | | | |
|
| | |
| | |
| | |
| Depreciation |
| Income |
| ||
| | Gross | | Intersegment | | Net | | & | | from |
| |||||
| | Revenue | | Sales | | Revenue | | Amortization | | Operations |
| |||||
TTEC Digital | | $ | 471,520 | | $ | 3 | | $ | 471,523 | | $ | 33,515 | | $ | 33,729 | |
TTEC Engage | |
| 1,972,184 | |
| — | |
| 1,972,184 | |
| 78,276 | |
| 134,814 | |
Total | | $ | 2,443,704 | | $ | 3 | | $ | 2,443,707 | | $ | 111,791 | | $ | 168,543 | |
|
|
|
|
|
|
|
|
|
|
|
|
|
|
|
|
|
|
|
|
|
|
|
|
|
|
|
| Depreciation |
| Income |
| ||
|
| Gross |
| Intersegment |
| Net |
| & |
| (Loss) from |
| |||||
|
| Revenue |
| Sales |
| Revenue |
| Amortization |
| Operations |
| |||||
TTEC Digital |
| $ | 305,595 |
| $ | (249) |
| $ | 305,346 |
| $ | 11,216 |
| $ | 38,927 |
|
TTEC Engage |
|
| 1,338,358 |
|
| — |
|
| 1,338,358 |
|
| 57,870 |
|
| 84,782 |
|
Total |
| $ | 1,643,953 |
| $ | (249) |
| $ | 1,643,704 |
| $ | 69,086 |
| $ | 123,709 |
|
Year Ended December 31, 20182021
| | | | | | | | | | | | | | | | |
|
| | |
| | |
| | |
| Depreciation |
| Income |
| ||
| | Gross | | Intersegment | | Net | | & | | from |
| |||||
| | Revenue | | Sales | | Revenue | | Amortization | | Operations |
| |||||
TTEC Digital | | $ | 414,148 | | $ | (44) | | $ | 414,104 | | $ | 30,468 | | $ | 35,437 | |
TTEC Engage | |
| 1,858,965 | |
| (7) | |
| 1,858,958 | |
| 66,238 | |
| 181,755 | |
Total | | $ | 2,273,113 | | $ | (51) | | $ | 2,273,062 | | $ | 96,706 | | $ | 217,192 | |
|
|
|
|
|
|
|
|
|
|
|
|
|
|
|
|
|
|
|
|
|
|
|
|
|
|
|
| Depreciation |
| Income |
| ||
|
| Gross |
| Intersegment |
| Net |
| & |
| (Loss) from |
| |||||
|
| Revenue |
| Sales |
| Revenue |
| Amortization |
| Operations |
| |||||
TTEC Digital |
| $ | 239,144 |
| $ | (345) |
| $ | 238,799 |
| $ | 8,814 |
| $ | 33,054 |
|
TTEC Engage |
|
| 1,270,372 |
|
| — |
|
| 1,270,372 |
|
| 60,365 |
|
| 59,000 |
|
Total |
| $ | 1,509,516 |
| $ | (345) |
| $ | 1,509,171 |
| $ | 69,179 |
| $ | 92,054 |
|
Year Ended December 31, 20172020
| | | | | | | | | | | | | | | | |
|
| | |
| | |
| | |
| Depreciation |
| Income |
| ||
| | Gross | | Intersegment | | Net | | & | | from |
| |||||
| | Revenue | | Sales | | Revenue | | Amortization | | Operations |
| |||||
TTEC Digital | | $ | 307,278 | | $ | (293) | | $ | 306,985 | | $ | 14,029 | | $ | 45,315 | |
TTEC Engage | |
| 1,642,263 | |
| — | |
| 1,642,263 | |
| 64,833 | |
| 159,377 | |
Total | | $ | 1,949,541 | | $ | (293) | | $ | 1,949,248 | | $ | 78,862 | | $ | 204,692 | |
|
|
|
|
|
|
|
|
|
|
|
|
|
|
|
|
| |||||||||||
|
|
|
|
|
|
|
|
|
|
| Depreciation |
| Income |
| |||||||||||||
|
| Gross |
| Intersegment |
| Net |
| & |
| (Loss) from |
| ||||||||||||||||
|
| Revenue |
| Sales |
| Revenue |
| Amortization |
| Operations |
| ||||||||||||||||
| | | | | | | | | | | | ||||||||||||||||
| | | | | | | | | | | | ||||||||||||||||
| | | For the Year Ended December 31, |
| |||||||||||||||||||||||
|
|
| 2022 |
| 2021 |
| 2020 |
| |||||||||||||||||||
Capital Expenditures | | | | | | | | | | | | ||||||||||||||||
TTEC Digital |
| $ | 207,244 |
| $ | (337) |
| $ | 206,907 |
| $ | 9,355 |
| $ | 14,480 |
| | | $ | 9,155 | | $ | 8,919 | | $ | 7,881 | |
TTEC Engage |
|
| 1,270,477 |
|
| (19) |
|
| 1,270,458 |
|
| 55,152 |
|
| 86,009 |
| | |
| 74,857 | |
| 51,439 | |
| 51,891 | |
Total |
| $ | 1,477,721 |
| $ | (356) |
| $ | 1,477,365 |
| $ | 64,507 |
| $ | 100,489 |
| | | $ | 84,012 | | $ | 60,358 | | $ | 59,772 | |
| | | | | | | | | | | |
| | | December 31, | | |||||||
| | | 2022 |
| 2021 | | 2020 | | |||
Total Assets | | | | | | | | | | | |
TTEC Digital | | | $ | 811,258 |
| $ | 828,255 | | $ | 277,365 | |
TTEC Engage | | |
| 1,342,704 | |
| 1,168,549 | |
| 1,239,043 | |
Total | | | $ | 2,153,962 |
| $ | 1,996,804 | | $ | 1,516,408 | |
| | | | | | | | | | | |
F-23F-24
|
|
|
|
|
|
|
|
|
|
|
|
|
|
|
|
|
|
|
|
|
|
|
|
|
|
| For the Year Ended December 31, |
| |||||||
|
|
| 2019 |
| 2018 |
| 2017 |
| |||
Capital Expenditures |
|
|
|
|
|
|
|
|
|
|
|
TTEC Digital |
|
| $ | 14,397 |
| $ | 4,833 |
| $ | 3,018 |
|
TTEC Engage |
|
|
| 46,379 |
|
| 38,617 |
|
| 48,940 |
|
Total |
|
| $ | 60,776 |
| $ | 43,450 |
| $ | 51,958 |
|
|
|
|
|
|
|
|
|
|
|
|
|
|
|
| December 31, |
| |||||||
|
|
| 2019 |
| 2018 |
| 2017 |
| |||
Total Assets |
|
|
|
|
|
|
|
|
|
|
|
TTEC Digital |
|
| $ | 238,081 |
| $ | 222,977 |
| $ | 168,106 |
|
TTEC Engage |
|
|
| 1,138,707 |
|
| 831,531 |
|
| 910,630 |
|
Total |
|
| $ | 1,376,788 |
| $ | 1,054,508 |
| $ | 1,078,736 |
|
|
|
|
|
|
|
|
|
|
|
|
|
|
|
| December 31, |
| |||||||
|
|
| 2019 |
| 2018 |
| 2017 |
| |||
Goodwill |
|
|
|
|
|
|
|
|
|
|
|
TTEC Digital |
|
| $ | 66,275 |
| $ | 66,158 |
| $ | 65,791 |
|
TTEC Engage |
|
|
| 235,419 |
|
| 138,475 |
|
| 143,936 |
|
Total |
|
| $ | 301,694 |
| $ | 204,633 |
| $ | 209,727 |
|
|
|
|
|
|
|
|
|
|
|
|
|
The following tables present certain financial data based upon the geographic location where the services are provided (in thousands):
|
|
|
|
|
|
|
|
|
|
|
| |||||||||||
|
|
| As of and for the |
| ||||||||||||||||||
|
|
| Year Ended December 31, |
| ||||||||||||||||||
|
|
| 2019 |
| 2018 |
| 2017 |
| ||||||||||||||
| | | | | | | | | | | | |||||||||||
| | | As of and for the |
| ||||||||||||||||||
| | | Year Ended December 31, |
| ||||||||||||||||||
|
| | 2022 |
| 2021 |
| 2020 |
| ||||||||||||||
Revenue |
|
|
|
|
|
|
|
|
|
|
| | | | | | | | | | | |
United States |
|
| $ | 1,002,524 |
| $ | 862,026 |
| $ | 820,597 |
| |||||||||||
Philippines |
|
|
| 370,395 |
|
| 351,829 |
|
| 353,122 |
| |||||||||||
United States / Canada | | | $ | 1,738,053 | | $ | 1,570,791 | | $ | 1,364,812 | | |||||||||||
Philippines / Asia Pacific / India | | |
| 457,526 | |
| 476,395 | |
| 407,325 | | |||||||||||
Latin America |
|
|
| 100,117 |
|
| 109,104 |
|
| 130,082 |
| | |
| 116,553 | |
| 114,967 | |
| 98,633 | |
Europe / Middle East / Africa |
|
|
| 70,613 |
|
| 67,163 |
|
| 62,597 |
| | |
| 131,575 | |
| 110,909 | |
| 78,478 | |
Asia Pacific / India |
|
|
| 55,554 |
|
| 57,978 |
|
| 36,715 |
| |||||||||||
Canada |
|
|
| 44,501 |
|
| 61,071 |
|
| 74,252 |
| |||||||||||
Total |
|
| $ | 1,643,704 |
| $ | 1,509,171 |
| $ | 1,477,365 |
| | | $ | 2,443,707 | | $ | 2,273,062 | | $ | 1,949,248 | |
|
|
|
|
|
|
|
|
|
|
|
| |||||||||||
| | | | | | | | | | | | |||||||||||
Property, plant and equipment, gross |
|
|
|
|
|
|
|
|
|
|
| | | | | | | | | | | |
United States |
|
| $ | 559,326 |
| $ | 508,202 |
| $ | 490,110 |
| |||||||||||
Philippines |
|
|
| 144,213 |
|
| 130,176 |
|
| 137,683 |
| |||||||||||
United States / Canada | | | $ | 631,459 | | $ | 620,407 | | $ | 590,647 | | |||||||||||
Philippines / Asia Pacific / India | | |
| 162,857 | |
| 173,075 | |
| 178,309 | | |||||||||||
Latin America |
|
|
| 45,743 |
|
| 44,065 |
|
| 51,451 |
| | |
| 41,892 | |
| 47,540 | |
| 46,307 | |
Europe / Middle East / Africa |
|
|
| 14,823 |
|
| 10,499 |
|
| 10,280 |
| | |
| 21,435 | |
| 19,594 | |
| 23,043 | |
Asia Pacific / India |
|
|
| 21,562 |
|
| 19,874 |
|
| 24,592 |
| |||||||||||
Canada |
|
|
| 15,516 |
|
| 15,193 |
|
| 15,912 |
| |||||||||||
Total |
|
| $ | 801,183 |
| $ | 728,009 |
| $ | 730,028 |
| | | $ | 857,643 | | $ | 860,616 | | $ | 838,306 | |
|
|
|
|
|
|
|
|
|
|
|
| |||||||||||
| | | | | | | | | | | | |||||||||||
Other long-term assets |
|
|
|
|
|
|
|
|
|
|
| | | | | | | | | | | |
United States |
|
| $ | 57,417 |
| $ | 56,459 |
| $ | 46,029 |
| |||||||||||
Philippines |
|
|
| 7,892 |
|
| 5,188 |
|
| 7,753 |
| |||||||||||
United States / Canada | | | $ | 56,372 | | $ | 68,052 | | $ | 55,716 | | |||||||||||
Philippines / Asia Pacific / India | | |
| 8,826 | |
| 6,622 | |
| 10,482 | | |||||||||||
Latin America |
|
|
| 993 |
|
| 1,329 |
|
| 1,475 |
| | |
| 1,230 | |
| 864 | |
| 912 | |
Europe / Middle East / Africa |
|
|
| 993 |
|
| 544 |
|
| (750) |
| | |
| 1,306 | |
| 1,735 | |
| 2,328 | |
Asia Pacific / India |
|
|
| 1,422 |
|
| 1,680 |
|
| 4,326 |
| |||||||||||
Canada |
|
|
| 252 |
|
| 241 |
|
| 324 |
| |||||||||||
Total |
|
| $ | 68,969 |
| $ | 65,441 |
| $ | 59,157 |
| | | $ | 67,734 | | $ | 77,273 | | $ | 69,438 | |
F-24
(4)
Accounts receivable, net in the accompanying Consolidated Balance Sheets consists of the following (in thousands):
| | | | | | | |
| | December 31, |
| ||||
|
| 2022 |
| 2021 |
| ||
Accounts receivable | | $ | 421,161 | | $ | 362,719 | |
Less: Allowance for credit losses | |
| (3,524) | |
| (5,409) | |
Accounts receivable, net | | $ | 417,637 | | $ | 357,310 | |
In connection with the implementation of ASC 326 as of January 1, 2020, the Company analyzed the prior history of credit losses on revenue for TTEC as a whole and separately for each of the two segments. Based on this evaluation, no modification to the allowance for credit losses balance was necessary as of the implementation date. At the end of each quarter beginning with March 31, 2020, an allowance for credit losses has been calculated based on the current quarterly revenue multiplied by the historical loss percentage of the prior three-year period and recorded in the income statement. In addition to the evaluation of historical losses, the Company considers current and future economic conditions and events such as changes in customer credit quality and liquidity. The Company will write-off accounts receivable against this allowance when the Company determines a balance is uncollectible.
|
|
|
|
|
|
|
|
|
| December 31, |
| ||||
|
| 2019 |
| 2018 |
| ||
Accounts receivable |
| $ | 336,548 |
| $ | 356,554 |
|
Less: Allowance for doubtful accounts |
|
| (5,452) |
|
| (5,592) |
|
Accounts receivable, net |
| $ | 331,096 |
| $ | 350,962 |
|
F-25
Activity in the Company’s Allowance for doubtful accountscredit losses consists of the following (in thousands):
|
|
|
|
|
|
|
|
|
|
| ||||||||||
|
| December 31, |
| |||||||||||||||||
|
| 2019 |
| 2018 |
| 2017 |
| |||||||||||||
| | | | | | | | | | | ||||||||||
| | December 31, |
| |||||||||||||||||
|
| 2022 |
| 2021 |
| 2020 |
| |||||||||||||
Balance, beginning of year |
| $ | 5,592 |
| $ | 921 |
| $ | 662 |
| | $ | 5,409 | | $ | 5,067 | | $ | 5,452 | |
Provision for doubtful accounts |
|
| 1,711 |
|
| 3,679 |
|
| 458 |
| ||||||||||
Provision for credit losses | |
| 9,391 | |
| (350) | |
| 494 | | ||||||||||
Uncollectible receivables written-off |
|
| (1,311) |
|
| (429) |
|
| (180) |
| |
| (11,278) | |
| (281) | |
| (880) | |
Effect of foreign currency and other |
|
| (540) |
|
| 1,421 |
|
| (19) |
| | | 2 | | | (15) | | | 1 | |
Acquisition | |
| — | |
| 988 | |
| — | | ||||||||||
Balance, end of year |
| $ | 5,452 |
| $ | 5,592 |
| $ | 921 |
| | $ | 3,524 | | $ | 5,409 | | $ | 5,067 | |
On October 15, 2018, Sears Holding Corporation (“Sears”) announced that it had filed a petition for bankruptcy protection in the United States Bankruptcy Court for the Southern District of New York. As of December 31, 2019 and 2018, TTEC had approximately $2.7 million in pre-petition accounts receivables outstanding related to Sears; during the fourth quarter of 2018 a $2.7 million allowance for uncollectible accounts was recorded and included in Selling, general and administrative expenses in the Consolidated Statements of Comprehensive Income (Loss). TTEC continues to provide post-petition services to Sears and has assessed these receivables for collection risk and has determined that these will be collectible.
Significant Clients
The Company had no clients that contributed in excess of 10% of total revenue for the year ended December 31, 2019. The Company has one client that contributed in excess of 10% of total revenue for each of the yearyears ended December 31, 2018; this2022, 2021 and 2020. The 2022 client operates in the healthcareautomotive industry and is included in the Engage segment. The 2021 and 2020 client operates in the financial services sector and is included in the Engage segment. The revenue from this clientthese clients as a percentage of total revenue wasis as follows:
|
|
|
|
|
|
|
|
|
| Year Ended December 31, |
| ||||
|
| 2019 |
| 2018 |
| 2017 |
|
|
|
|
|
|
|
|
|
Healthcare client |
| 8 | % | 10 | % | 7 | % |
| | | | | | | | | | |
| | Year Ended December 31, |
| |||||||
|
| 2022 | | 2021 | | 2020 |
| |||
| | | | | | | | | | |
Automotive client | | 10 | % | | 9 | % | | 8 | % | |
Financial services client |
| 7 | % | | 12 | % | | 13 | % | |
Accounts receivable from this clientthese clients was as follows (in thousands):
|
|
|
|
|
|
|
|
|
|
|
|
| Year Ended December 31, |
| |||||||
|
| 2019 |
| 2018 |
| 2017 |
| |||
|
|
|
|
|
|
|
|
|
|
|
Healthcare client |
| $ | 18,385 |
| $ | 49,245 |
| $ | 56,802 |
|
| | | | | | | | | | |
| | Year Ended December 31, |
| |||||||
|
| 2022 |
| 2021 |
| 2020 |
| |||
| | | | | | | | | | |
Automotive client | | $ | 38,539 | | $ | 36,466 | | $ | 27,860 | |
Financial services client | | $ | 14,019 | | $ | 15,483 | | $ | 58,960 | |
F-25
The Company does have clients with aggregate revenue exceeding $100 million annually and the loss of one or more of these significant clients could have a material adverse effect on the Company’s business, operating results, or financial condition. To mitigate this risk, the Company has multiple contracts with these larger clients, where each individual contract is for an amount below the $100 million aggregate.
To limit the Company’s credit risk with its clients, management performs periodic credit evaluations, maintains allowances for uncollectible accountscredit losses and may require pre-payment for services from certain clients. Based on currently available information, management does not believe significant credit risk exists as of December 31, 2019.2022.
Accounts Receivable Factoring Agreement
On March 5, 2019, theThe Company entered intois party to an Uncommitted Receivables Purchase Agreement (“Agreement”) with Bank of the West (“Bank”), whereby from time-to-time the Company may elect to sell, on a revolving basis, U.S. accounts receivables of certain clients at a discount to the bankBank for cash on a limited recourse basis. The maximum amount of receivables that the Company may sell to the Bank at any given time shall not exceed $75$100 million. The sales of accounts receivable in accordance with the Agreement are reflected as a reduction of Accounts Receivable, net on the Consolidated Balance sheets.Sheets. The Company has retained no interest in the sold receivables but retains all collection responsibilities on behalf of the Bank. The discount on the accounts receivable sold will be recorded within Other expense, net in the Consolidated Statements of Comprehensive Income (Loss). The cash proceeds from this Agreement are included in the change in accounts receivable within the operating activities section of the Consolidated Statements of Cash Flows.
AsF-26
TTEC HOLDINGS, INC. AND SUBSIDIARIES
Notes to the Bank. Consolidated Financial Statements
The balances related to the Factoring agreement are as follows (in thousands):
| | | | | | | |
| | December 31, |
| ||||
|
| 2022 |
| 2021 |
| ||
Total accounts receivable factored | | $ | 99,503 | | $ | 97,700 | |
| |
| | |
| | |
Total amounts collected from clients not yet remitted to Bank | | $ | 13,602 | | $ | 22,477 | |
The unremitted cash is Restricted Cash and is included within Prepaid and Other Current Assets with the corresponding liability included in Accrued Expenses on the Consolidated Balance Sheet. The Company has not recorded any servicing assets or liabilities as of December 31, 20192022 and 2021 as the fair value of the servicing arrangement as well as the fees earned were not material to the financial statements.
Effective November 1, 2022, the Company amended the arrangement to modify the list of eligible clients who may be sold pursuant to the Agreement, and to memorialize the transition from LIBOR to SOFR for discount calculation purposes.
(5)
PROPERTY, PLANT AND EQUIPMENT
Property, plant and equipment consisted of the following (in thousands):
|
|
|
|
|
|
|
| |||||||
|
| December 31, |
| |||||||||||
|
| 2019 |
| 2018 |
| |||||||||
| | | | | | | | |||||||
| | December 31, |
| |||||||||||
|
| 2022 |
| 2021 |
| |||||||||
Land and buildings |
| $ | 32,942 |
| $ | 33,286 |
| | $ | 32,070 | | $ | 32,942 | |
Computer equipment and software |
|
| 447,260 |
|
| 411,653 |
| |
| 527,096 | |
| 503,056 | |
Telephone equipment |
|
| 49,447 |
|
| 45,351 |
| |
| 46,235 | |
| 50,256 | |
Furniture and fixtures |
|
| 85,191 |
|
| 74,538 |
| |
| 80,843 | |
| 84,944 | |
Leasehold improvements |
|
| 186,083 |
|
| 161,960 |
| |
| 171,141 | |
| 189,161 | |
Motor vehicles |
|
| 260 |
|
| 90 |
| |
| 258 | |
| 257 | |
Construction-in-progress and other |
|
| - |
|
| 1,131 |
| |||||||
Property, plant and equipment, gross |
|
| 801,183 |
|
| 728,009 |
| |
| 857,643 | |
| 860,616 | |
Less: Accumulated depreciation and amortization |
|
| (624,550) |
|
| (566,486) |
| |
| (674,283) | |
| (692,212) | |
Property, plant and equipment, net |
| $ | 176,633 |
| $ | 161,523 |
| | $ | 183,360 | | $ | 168,404 | |
Depreciation and amortization expense for property, plant and equipment was $57.5$64.5 million, $58.4$63.5 million and $57.0$62.7 million for the years ended December 31, 2019, 20182022, 2021 and 2017,2020, respectively.
Included in the computer equipment and software is internally developed software of $15.3$26.8 million net and $11.2$19.4 million net as of December 31, 20192022 and 2018,2021, respectively.
F-26
Table During 2022 and 2021, impairments of Contents
TTEC HOLDINGS, INC. AND SUBSIDIARIES
Notes tointernally developed software of $6.0 million and $3.2 million, respectively, were expensed and included in Impairment losses in the Consolidated Financial Statements
of Comprehensive Income (Loss).
(6)
GOODWILLGoodwill consisted of the following (in thousands):
| | | | | | | | | | | | | | | | |
|
| | |
| | |
| | |
| Effect of |
| | |
| |
| | December 31, | | Acquisitions / | | | | | Foreign | | December 31, |
| ||||
| | 2021 | | Adjustments | | Impairments | | Currency | | 2022 |
| |||||
| | | | | | | | | | | | | | | | |
TTEC Digital | | $ | 505,222 | | $ | — | | $ | — | | $ | (2,416) | | $ | 502,806 | |
TTEC Engage | |
| 234,259 | |
| 75,896 | |
| — | |
| (5,116) | |
| 305,039 | |
Total | | $ | 739,481 | | $ | 75,896 | | $ | — | | $ | (7,532) | | $ | 807,845 | |
|
|
|
|
|
|
|
|
|
|
|
|
|
|
|
|
|
|
|
|
|
|
|
|
|
|
|
| Effect of |
|
|
|
| |
|
| December 31, |
| Acquisitions / |
|
|
|
| Foreign |
| December 31, |
| ||||
|
| 2018 |
| Adjustments |
| Impairments |
| Currency |
| 2019 |
| |||||
|
|
|
|
|
|
|
|
|
|
|
|
|
|
|
|
|
TTEC Digital |
| $ | 66,158 |
| $ | — |
| $ | — |
| $ | 117 |
| $ | 66,275 |
|
TTEC Engage |
|
| 138,475 |
|
| 96,993 |
|
| — |
|
| (49) |
|
| 235,419 |
|
Total |
| $ | 204,633 |
| $ | 96,993 |
| $ | — |
| $ | 68 |
| $ | 301,694 |
|
F-27
|
|
|
|
|
|
|
|
|
|
|
|
|
|
|
|
|
|
|
|
|
|
|
|
|
|
|
| Effect of |
|
|
|
| |
|
| December 31, |
| Acquisitions / |
|
|
|
| Foreign |
| December 31, |
| ||||
|
| 2017 |
| Adjustments |
| Impairments |
| Currency |
| 2018 |
| |||||
|
|
|
|
|
|
|
|
|
|
|
|
|
|
|
|
|
TTEC Digital |
| $ | 65,791 |
| $ | 1,232 |
| $ | — |
| $ | (865) |
| $ | 66,158 |
|
TTEC Engage |
|
| 143,936 |
|
| (125) |
|
| — |
|
| (5,336) |
|
| 138,475 |
|
Total |
| $ | 209,727 |
| $ | 1,107 |
| $ | — |
| $ | (6,201) |
| $ | 204,633 |
|
| | | | | | | | | | | | | | | | |
|
| | |
| | |
| | |
| Effect of |
| | |
| |
| | December 31, | | Acquisitions / | | | | | Foreign | | December 31, |
| ||||
| | 2020 | | Adjustments | | Impairments | | Currency | | 2021 |
| |||||
| | | | | | | | | | | | | | | | |
TTEC Digital | | $ | 128,211 | | $ | 378,908 | | $ | — | | $ | (1,897) | | $ | 505,222 | |
TTEC Engage | |
| 235,291 | |
| — | |
| — | |
| (1,032) | |
| 234,259 | |
Total | | $ | 363,502 | | $ | 378,908 | | $ | — | | $ | (2,929) | | $ | 739,481 | |
Impairment
The Company has three reporting units with goodwill and performs a goodwill impairment test on at least an annual basis. The Company conducts its annual goodwill impairment test during the fourth quarter, or more frequently, if indicators of impairment exist.
For the annual goodwill impairment analysis, the Company elected to perform a Step 1 evaluation for all of its reporting units, which includes comparing a reporting unit’s estimated fair value to its carrying value. The determination of fair value requires significant judgments including estimation of future cash flows, which is dependent on internal forecasts, estimation of the long-term growth rates for the businesses, the useful lives over which the cash flows will occur and determination of appropriate discount rates (based in part on the Company’s weighted average cost of capital). Changes in these estimates and assumptions could materially affect the determination of fair value and/or conclusions on goodwill impairment for each reporting unit. As of December 1, 2019,2022, the date of the annual impairment testing, the Company concluded that for all three of the reporting units the fair values were in excess of their respective carrying values and the goodwill for those reporting units was not impaired.
The process of evaluating the fair value of the reporting units is highly subjective and requires significant judgment and estimates as the reporting units operate in a number of markets and geographical regions. The Company used a market approach and an income approach to determine our best estimates of fair value which incorporated the following significant assumptions:
| Revenue projections, including revenue growth during the forecast periods ranging from |
| EBITDA margin projections held relatively flat over the forecast periods ranging from |
| Estimated income tax rates of |
| Estimated capital expenditures ranging from |
| Discount rates ranging from |
F-27
TTEC HOLDINGS, INC. AND SUBSIDIARIES
Notes to the Consolidated Financial Statements
During the Company’s annual impairment testing as of December 1, 2019, the Company identified triggering events that could lead to impairment of goodwill for the Digital Consulting reporting unit, including lower revenues and profits than had been anticipated over the past two years. The carrying value of Digital Consulting was $39.7 million at December 1, 2019, including approximately $24.3 million of goodwill. Based on the Company’s assessment, the estimated fair value of the Digital Consulting reporting unit exceeded its carrying value by approximately 26%, but based on additional sensitivity analysis, the amount of cushion could fall to 0% or below if the performance of the business does not improve as expected. The estimate of fair value was based on generally accepted valuation techniques and information available at the date of the assessment, which incorporated management’s assumptions about expected revenues and future cash flows and available market information for comparable companies.
Other intangible assets which are included in Other long-term assets in the accompanying Consolidated Balance Sheets consisted of the following (in thousands):
| | | | | | | | | | | | | | | | | | | |
|
| | |
| | |
| | |
| Acquisitions |
| Effect of |
| | |
| ||
| | December 31, | | | | | | | | and | | Foreign | | December 31, |
| ||||
| | 2021 | | Amortization | | Impairments | | Adjustments | | Currency | | 2022 |
| ||||||
Customer relationships, gross | | $ | 299,948 | | $ | — | | $ | — |
| $ | 61,310 |
| $ | (5,541) | | $ | 355,717 | |
Customer relationships - accumulated amortization | |
| (93,582) | |
| (33,244) | |
| — |
| | — |
| | 2,944 | |
| (123,882) | |
Other intangible assets, gross | |
| 19,731 | |
| — | |
| — |
| | — |
| | (19) | |
| 19,712 | |
Other intangible assets - accumulated amortization | |
| (13,748) | |
| (3,899) | |
| — |
| | — |
| | 9 | |
| (17,638) | |
Other intangible assets, net | | $ | 212,349 | | $ | (37,143) | | $ | — | | $ | 61,310 | | $ | (2,607) | | $ | 233,909 | |
|
|
|
|
|
|
|
|
|
|
|
|
|
|
|
|
|
|
|
|
|
|
|
|
|
|
|
|
|
|
| Acquisitions |
| Effect of |
|
|
|
| ||
|
| December 31, |
|
|
|
|
|
|
| and |
| Foreign |
| December 31, |
| ||||
|
| 2018 |
| Amortization |
| Impairments |
| Adjustments |
| Currency |
| 2019 |
| ||||||
Customer relationships, gross |
| $ | 123,527 |
| $ | — |
| $ | — |
| $ | 38,540 |
| $ | (311) |
| $ | 161,756 |
|
Customer relationships - accumulated amortization |
|
| (43,223) |
|
| (11,055) |
|
| (423) |
|
| — |
|
| 48 |
|
| (54,653) |
|
Other intangible assets, gross |
|
| 4,575 |
|
| — |
|
| — |
|
| 8,600 |
|
| (13) |
|
| 13,162 |
|
Other intangible assets - accumulated amortization |
|
| (3,968) |
|
| (541) |
|
| (170) |
|
| — |
|
| 10 |
|
| (4,669) |
|
Other intangible assets, net |
| $ | 80,911 |
| $ | (11,596) |
| $ | (593) |
| $ | 47,140 |
| $ | (266) |
| $ | 115,596 |
|
F-28
|
|
|
|
|
|
|
|
|
|
|
|
|
|
|
|
|
|
|
|
|
|
|
|
|
|
|
|
| Acquisitions |
| Effect of |
|
|
|
| ||||
|
| December 31, |
|
|
|
|
| and |
| Foreign |
| December 31, |
| ||||||
|
| 2017 |
| Amortization |
| Impairments |
| Adjustments |
| Currency |
| 2018 |
| ||||||
Customer relationships, gross |
| $ | 127,431 |
| $ | — |
| $ | — |
| $ | 1,956 |
| $ | (5,860) |
| $ | 123,527 |
|
Customer relationships - accumulated amortization |
|
| (35,217) |
|
| (10,546) |
|
| — |
|
| 1,203 |
|
| 1,337 |
|
| (43,223) |
|
Other intangible assets, gross |
|
| 4,784 |
|
| — |
|
| — |
|
| — |
|
| (209) |
|
| 4,575 |
|
Other intangible assets - accumulated amortization |
|
| (3,913) |
|
| (212) |
|
| — |
|
| — |
|
| 157 |
|
| (3,968) |
|
Other intangible assets, net |
| $ | 93,085 |
| $ | (10,758) |
| $ | — |
| $ | 3,159 |
| $ | (4,575) |
| $ | 80,911 |
|
| | | | | | | | | | | | | | | | | | | |
|
| | |
| |
| |
| Acquisitions |
| Effect of |
| | |
| ||||
| | December 31, | | | | | | and | | Foreign | | December 31, |
| ||||||
| | 2020 | | Amortization | | Impairments | | Adjustments | | Currency | | 2021 |
| ||||||
Customer relationships, gross | | $ | 173,601 | | $ | — | | $ | — | | $ | 128,186 | | $ | (1,839) | | $ | 299,948 | |
Customer relationships - accumulated amortization | |
| (68,769) | |
| (25,440) | |
| (671) | |
| — | |
| 1,298 | |
| (93,582) | |
Other intangible assets, gross | |
| 14,450 | |
| — | |
| — | |
| 5,300 | |
| (19) | |
| 19,731 | |
Other intangible assets - accumulated amortization | |
| (7,223) | |
| (6,529) | |
| — | |
| — | |
| 4 | |
| (13,748) | |
Other intangible assets, net | | $ | 112,059 | | $ | (31,969) | | $ | (671) | | $ | 133,486 | | $ | (556) | | $ | 212,349 | |
The acquisitionsacquisition recorded during 2019 relate2022 relates to the purchase of FCRFaneuil and the acquisition recorded during 2021 relates to the purchase of Avtex (see Note 2 for further information). The impairments recorded during 2019 relate to rogenSi intangible assets (see below)
The acquisitions and adjustments recorded during 2018 relate to the purchase of SCS (see Note 2 for further information) and the fair value of the Digital-PRG balance sheet (see below).
Digital - PRG
As of December 31, 2018, in connection with reclassifying a business unit from assets held for sale to assets held and used, a fair value assessment was completed and it was determined that due to continuing estimated losses, the fair value of the customer relationship balance was zero. The Company recorded a $0.7 million expense related to a fair value adjustment during the fourth quarter of 2018 which was included in Other income (expense), net in the Consolidated Statements of Comprehensive Income (Loss).
F-28
Digital - rogenSi
In connection with reduced profitability of the rogenSi component of the TTEC Digital segment, an interim impairment analysis was completed during the second quarter of 2019. The long-lived assets reviewed for impairment consisted of the customer relationship intangible, intellectual property, and right of use assets. The Company completed an asset group recoverability evaluation based on the current estimated cash flow based on forecasted revenues and operating income using significant inputs not observable in the market (Level 3 inputs). Based on this calculation, the Company recorded an impairment expense of $2.0 million in the three months ended June 30, 2019, which was included in Impairment losses in the Consolidated Statements of Comprehensive Income (Loss). As part of the $2.0 million impairment $0.4 million was assigned to the customer relationship intangible asset and $0.2 million to the IP intangible asset. At December 31, 2019, the Company reviewed the evaluation completed as of June 30, 2019, and noted no material changes, thus no additional impairment is required.
Customer relationships are being amortized over the remaining weighted average useful life of 8.27.1 years and other intangible assets are being amortized over the remaining weighted average useful life of 5.51.0 years. Amortization expense related to intangible assets was $10.5$37.1 million, $10.8$32.0 million and $7.5$16.2 million for the years ended December 31, 2019, 20182022, 2021 and 2017,2020, respectively.
Expected future amortization of other intangible assets as of December 31, 20192022 is as follows (in thousands):
|
|
|
| |||
2020 |
| $ | 14,942 | |||
2021 |
|
| 14,686 | |||
2022 |
|
| 14,066 | |||
| | | �� | |||
2023 |
|
| 13,204 |
| $ | 35,521 |
2024 |
|
| 11,122 | |
| 32,958 |
2025 | |
| 31,008 | |||
2026 | |
| 30,948 | |||
2027 | |
| 30,948 | |||
Thereafter |
|
| 47,576 | |
| 72,526 |
Total |
| $ | 115,596 | | $ | 233,909 |
(8)DERIVATIVES
Cash Flow Hedges
The Company enters into foreign exchange related derivatives. Foreign exchange derivatives entered into consist of forward and option contracts to reduce the Company’s exposure to foreign currency exchange rate fluctuations that are associated with forecasted revenue earned in foreign locations. Upon proper qualification, these contracts are designated as cash flow hedges. It is the Company’s policy to only enter into derivative contracts with investment grade counterparty financial institutions, and correspondingly, the fair value of derivative assets considers, among other factors, the creditworthiness of these counterparties. Conversely, the fair value of derivative liabilities reflects the Company’s creditworthiness. As of December 31, 2019,2022, the Company had not experienced, nor does it anticipate, any issues related to derivative counterparty defaults. The following table summarizes the aggregate unrealized net gain or loss in Accumulated other comprehensive income (loss) for the years ended December 31, 2019, 20182022, 2021 and 20172020 (in thousands and net of tax):
|
|
|
|
|
|
|
|
|
|
|
| |||||||||||
|
|
| Year Ended December 31, |
| ||||||||||||||||||
|
|
| 2019 |
| 2018 |
| 2017 |
| ||||||||||||||
|
|
|
|
|
|
|
|
|
|
|
| |||||||||||
| | | | | | | | | | | | |||||||||||
| | | Year Ended December 31, |
| ||||||||||||||||||
| | | 2022 |
| 2021 |
| 2020 |
| ||||||||||||||
| | | | | | | | | | | | |||||||||||
Aggregate unrealized net gain/(loss) at beginning of period |
|
| $ | (8,278) |
| $ | (15,746) |
| $ | (32,393) |
| | | $ | (40) | | $ | 8,431 | | $ | 4,182 | |
Add: Net gain/(loss) from change in fair value of cash flow hedges |
|
|
| 15,545 |
|
| 20,278 |
|
| 31,053 |
| | |
| 2,281 | |
| (12,126) | |
| 2,321 | |
Less: Net (gain)/loss reclassified to earnings from effective hedges |
|
|
| (3,085) |
|
| (12,810) |
|
| (14,406) |
| | |
| (2,152) | |
| 3,655 | |
| 1,928 | |
Aggregate unrealized net gain/(loss) at end of period |
|
| $ | 4,182 |
| $ | (8,278) |
| $ | (15,746) |
| | | $ | 89 | | $ | (40) | | $ | 8,431 | |
F-29
The Company’s foreign exchange cash flow hedging instruments as of December 31, 20192022 and 20182021 are summarized as follows (in thousands). All hedging instruments are forward contracts.
| | | | | | | | | | | | |
|
| Local |
| | |
| | |
| | |
|
| | Currency | | U.S. Dollar | | | % Maturing | | | Contracts |
| |
| | Notional | | Notional | | | in the next | | | Maturing |
| |
As of December 31, 2022 | | Amount | | Amount | | | 12 months | | | Through |
| |
Canadian Dollar |
| 12,000 | | $ | 9,177 | | | 100.0 | % | | December 2023 | |
Philippine Peso |
| 8,617,000 | |
| 157,855 | (1) | | 55.7 | % | | September 2025 | |
Mexican Peso |
| 1,024,500 | |
| 44,690 | | | 60.2 | % | | March 2025 | |
| | | | $ | 211,722 | | | | | | | |
| | | | | | | | | | | | |
|
| Local |
| | |
| | |
| | | |
| | Currency | | U.S. Dollar | | | | | |
| | |
| | Notional | | Notional |
| |
|
| | | | |
As of December 31, 2021 | | Amount | | Amount |
| | | | | | | |
Canadian Dollar |
| 9,000 | | $ | 7,022 | | | | | | | |
Philippine Peso |
| 8,472,000 | |
| 164,295 | (1) | | | | | | |
Mexican Peso |
| 1,422,500 | |
| 63,002 | | | | | | | |
| | | | $ | 234,319 | | | | | | | |
| | | | | | | | | | | | |
|
|
|
|
|
|
|
|
|
|
|
|
|
|
| Local |
|
|
|
|
|
|
|
|
|
|
|
| Currency |
| U.S. Dollar |
|
| % Maturing |
|
| Contracts |
| |
|
| Notional |
| Notional |
|
| in the next |
|
| Maturing |
| |
As of December 31, 2019 |
| Amount |
| Amount |
|
| 12 months |
|
| Through |
| |
Philippine Peso |
| 7,715,000 |
|
| 147,654 | (1) |
| 58.2 | % |
| December 2022 |
|
Mexican Peso |
| 1,299,500 |
|
| 61,529 |
|
| 46.9 | % |
| December 2022 |
|
|
|
|
| $ | 209,183 |
|
|
|
|
|
|
|
|
|
|
|
|
|
|
|
|
|
|
|
|
|
| Local |
|
|
|
|
|
|
|
|
|
|
|
| Currency |
| U.S. Dollar |
|
|
|
|
|
|
| |
|
| Notional |
| Notional |
|
|
|
|
|
|
| |
As of December 31, 2018 |
| Amount |
| Amount |
|
|
|
|
|
|
| |
Philippine Peso |
| 6,710,000 |
|
| 130,957 | (1) |
|
|
|
|
|
|
Mexican Peso |
| 1,091,500 |
|
| 57,708 |
|
|
|
|
|
|
|
|
|
|
| $ | 188,665 |
|
|
|
|
|
|
|
|
|
|
|
|
|
|
|
|
|
|
|
|
| (1) |
| Includes contracts to purchase Philippine pesos in exchange for New Zealand dollars and Australian dollars, which are translated into equivalent U.S. dollars on December 31, |
Fair Value Hedges
The Company enters into foreign exchange forward contracts to economically hedge against foreign currency exchange gains and losses on certain receivables and payables of the Company’s foreign operations. Changes in the fair value of derivative instruments designated as fair value hedges are recognized in earnings in Other income (expense), net. As of December 31, 20192022 and 2018,2021, the total notional amount of the Company’s forward contracts used as fair value hedges was $64.5$80.8 million and $70.4$32.9 million, respectively.
Derivative Valuation and Settlements
The Company’s derivatives as of December 31, 20192022 and 20182021 were as follows (in thousands):
|
|
|
|
|
|
|
| |||||||
|
| December 31, 2019 |
| |||||||||||
|
| Designated | Not Designated |
| ||||||||||
|
| as Hedging | as Hedging |
| ||||||||||
| | | | | | | | |||||||
| | December 31, 2022 |
| |||||||||||
| | Designated | Not Designated |
| ||||||||||
| | as Hedging | as Hedging | | ||||||||||
Designation: |
| Instruments | Instruments |
| | Instruments | Instruments |
| ||||||
|
| Foreign |
| Foreign |
| |||||||||
|
| Foreign |
| Foreign |
| |||||||||
Derivative contract type: |
| Exchange |
| Exchange |
| | Exchange | | Exchange |
| ||||
Derivative classification: |
| Cash Flow |
| Fair Value |
| | Cash Flow | | Fair Value | | ||||
|
|
|
|
|
|
|
| |||||||
| | | | | | | | |||||||
Fair value and location of derivative in the Consolidated Balance Sheet: |
|
|
|
|
|
|
| | | | | | | |
Prepaids and other current assets |
| $ | 3,467 |
| $ | 205 |
| | $ | 4,001 | | $ | 281 | |
Other long-term assets |
|
| 3,525 |
|
| — |
| |
| 3,019 | |
| — | |
Other current liabilities |
|
| (1,223) |
|
| (107) |
| |
| (5,157) | |
| (76) | |
Other long-term liabilities |
|
| (95) |
|
| — |
| |
| (1,748) | |
| — | |
Total fair value of derivatives, net |
| $ | 5,674 |
| $ | 98 |
| | $ | 115 | | $ | 205 | |
F-30
|
|
|
|
|
|
|
|
|
| December 31, 2018 |
| ||||
|
| Designated | Not Designated |
| |||
|
| as Hedging | as Hedging |
| |||
Designation: |
| Instruments | Instruments |
| |||
|
| Foreign |
| Foreign |
| ||
Derivative contract type: |
| Exchange |
| Exchange |
| ||
Derivative classification: |
| Cash Flow |
| Fair Value |
| ||
|
|
|
|
|
|
|
|
Fair value and location of derivative in the Consolidated Balance Sheet: |
|
|
|
|
|
|
|
Prepaids and other current assets |
| $ | 814 |
| $ | 60 |
|
Other long-term assets |
|
| 215 |
|
| — |
|
Other current liabilities |
|
| (8,861) |
|
| (104) |
|
Other long-term liabilities |
|
| (3,484) |
|
| — |
|
Total fair value of derivatives, net |
| $ | (11,316) |
| $ | (44) |
|
| | | | | | | |
| | December 31, 2021 |
| ||||
| | Designated | Not Designated |
| |||
| | as Hedging | as Hedging | | |||
Designation: | | Instruments | Instruments |
| |||
|
| Foreign |
| Foreign |
| ||
Derivative contract type: | | Exchange | | Exchange |
| ||
Derivative classification: | | Cash Flow | | Fair Value | | ||
| | | | | | | |
Fair value and location of derivative in the Consolidated Balance Sheet: | | | | | | | |
Prepaids and other current assets | | $ | 2,272 | | $ | 204 | |
Other long-term assets | |
| 611 | |
| — | |
Other current liabilities | |
| (1,527) | |
| (6) | |
Other long-term liabilities | |
| (1,418) | |
| — | |
Total fair value of derivatives, net | | $ | (62) | | $ | 198 | |
The effect of derivative instruments on the Consolidated Statements of Comprehensive Income (Loss) for the years ended December 31, 20192022 and 20182021 were as follows (in thousands):
| | | | | | | | |||||||
| | Year Ended December 31, | | |||||||||||
| | 2022 | | 2021 | | |||||||||
|
|
|
|
|
|
|
| |||||||
|
| Year Ended December 31, |
| |||||||||||
|
| 2019 |
| 2018 |
| |||||||||
|
| Designated as Hedging |
| |||||||||||
| | Designated as Hedging | | |||||||||||
Designation: |
| Instruments |
| | Instruments | | ||||||||
Derivative contract type: |
| Foreign Exchange |
| | Foreign Exchange | | ||||||||
Derivative classification: |
| Cash Flow |
|
| Cash Flow | | ||||||||
|
|
|
|
|
|
|
| |||||||
| | | | | | | | |||||||
Amount of gain or (loss) recognized in Other comprehensive income (loss) - |
| $ | (3,085) |
| $ | (12,810) |
| | $ | (2,152) | | $ | 3,655 | |
|
|
|
|
|
|
|
| |||||||
| | | | | | | | |||||||
Amount and location of net gain or (loss) reclassified from Accumulated OCI |
|
|
|
|
|
|
| | | | | | | |
Revenue |
| $ | (4,228) |
| $ | (17,548) |
| | $ | (2,906) | | $ | 4,939 | |
|
|
|
|
|
|
|
| |||||||
|
| Year Ended December 31, |
| |||||||||||
| | | | | | | | |||||||
| | Year Ended December 31, | | |||||||||||
| | 2022 | | 2021 | | |||||||||
|
| 2019 |
| 2018 |
| |||||||||
Designation: |
| Not Designated as Hedging Instruments |
|
| Not Designated as Hedging Instruments | | ||||||||
Derivative contract type: |
| Foreign Exchange |
|
| Foreign Exchange | | ||||||||
Derivative classification: |
| Fair Value |
|
| Fair Value | | ||||||||
|
|
|
|
|
|
|
| |||||||
| | | | | | | | |||||||
Amount and location of net gain or (loss) recognized in the Consolidated Statement of Comprehensive Income (Loss): |
|
|
|
|
|
|
| | | | | | | |
Cost of services |
| $ | — |
| $ | — |
| |||||||
Other income (expense), net |
|
| 1,773 |
|
| (7,436) |
|
| $ | 827 |
| $ | 191 | |
F-31
The authoritative guidance for fair value measurements establishes a three-level fair value hierarchy that prioritizes the inputs used to measure fair value. This hierarchy requires that the Company maximize the use of observable inputs and minimize the use of unobservable inputs. The three levels of inputs used to measure fair value are as follows:
Level 1 — | Quoted prices in active markets for identical assets or liabilities. |
| |
Level 2 — | Observable inputs other than quoted prices included in Level 1, such as quoted prices for similar assets and liabilities in active markets, similar assets and liabilities in markets that are not active or can be corroborated by observable market data. |
| |
Level 3 — | Unobservable inputs that are supported by little or no market activity and that are significant to the fair value of the assets or liabilities. This includes certain pricing models, discounted cash flow methodologies and similar techniques that use significant unobservable inputs. |
The following presents information as of December 31, 20192022 and 20182021 of the Company’s assets and liabilities required to be measured at fair value on a recurring basis, as well as the fair value hierarchy used to determine their fair value.
Accounts Receivable and Payable - The amounts recorded in the accompanying balance sheets approximate fair value because of their short-term nature.
Investments – The Company measures investments, including cost and equity method investments, at fair value on a nonrecurring basis when they are deemed to be other-than-temporarily impaired. The fair values of these investments are determined based on valuation techniques using the best information available and may include market observable inputs and discounted cash flow projections. An impairment charge is recorded when the cost of the investment exceeds its fair value and this condition is determined to be other-than-temporary. As of December 31, 2019, the investment in CaféX Communications, Inc., which consists of the Company’s total $15.6 million investment, was fully impaired to zero (see Note 2).
Debt - The Company’s debt consists primarily of the Company’s Credit Agreement, which permits floating-rate borrowings based upon the current Prime Rate or LIBOR plus a credit spread as determined by the Company’s leverage ratio calculation (as defined in the Credit Agreement). As of December 31, 20192022 and 2018,2021, the Company had $290.0$960.0 million and $282.0$791.0 million, respectively, of borrowings outstanding under the Credit Agreement. During 20192022 and 2018,2021, borrowings accrued interest at an average rate of 3.4%3.1% and 3.1%1.3% per annum, respectively, excluding unused commitment fees. The amounts recorded in the accompanying Balance Sheets approximate fair value due to the variable nature of the debt based on level 2 inputs.
Derivatives - Net derivative assets (liabilities) are measured at fair value on a recurring basis. The portfolio is valued using models based on market observable inputs, including both forward and spot foreign exchange rates, interest rates, implied volatility, and counterparty credit risk, including the ability of each party to execute its obligations under the contract. As of December 31, 2019,2022, credit risk did not materially change the fair value of the Company’s derivative contracts.
F-32
The following is a summary of the Company’s fair value measurements for its net derivative assets (liabilities) as of December 31, 20192022 and 20182021 (in thousands):
As of December 31, 20192022
|
|
|
|
|
|
|
|
|
|
|
|
|
| |||||||||||||
|
| Fair Value Measurements Using |
|
|
|
| ||||||||||||||||||||
|
| Quoted Prices in |
| Significant |
|
|
|
|
|
|
| |||||||||||||||
|
| Active Markets |
| Other |
| Significant |
|
|
|
| ||||||||||||||||
|
| for Identical |
| Observable |
| Unobservable |
|
|
|
| ||||||||||||||||
|
| Assets |
| Inputs |
| Inputs |
|
|
|
| ||||||||||||||||
|
| (Level 1) |
| (Level 2) |
| (Level 3) |
| At Fair Value |
| |||||||||||||||||
| | | | | | | | | | | | | | |||||||||||||
| | Fair Value Measurements Using | | | |
| ||||||||||||||||||||
|
| Quoted Prices in |
| Significant |
| | |
|
| |
| |||||||||||||||
| | Active Markets | | Other | | Significant | | | |
| ||||||||||||||||
| | for Identical | | Observable | | Unobservable | | | |
| ||||||||||||||||
| | Assets | | Inputs | | Inputs | | | |
| ||||||||||||||||
| | (Level 1) | | (Level 2) | | (Level 3) | | At Fair Value |
| |||||||||||||||||
Cash flow hedges |
| $ | — |
| $ | 5,674 |
| $ | — |
| $ | 5,674 |
| | $ | — | | $ | 115 | | $ | — | | $ | 115 | |
Fair value hedges |
|
| — |
|
| 98 |
|
| — |
|
| 98 |
| |
| — | |
| 205 | |
| — | |
| 205 | |
Total net derivative asset (liability) |
| $ | — |
| $ | 5,772 |
| $ | — |
| $ | 5,772 |
| | $ | — | | $ | 320 | | $ | — | | $ | 320 | |
As of December 31, 20182021
|
|
|
|
|
|
|
|
|
|
|
|
|
| |||||||||||||
|
| Fair Value Measurements Using |
|
|
|
| ||||||||||||||||||||
|
| Quoted Prices in |
| Significant |
|
|
|
|
|
|
| |||||||||||||||
|
| Active Markets |
| Other |
| Significant |
|
|
|
| ||||||||||||||||
|
| for Identical |
| Observable |
| Unobservable |
|
|
|
| ||||||||||||||||
|
| Assets |
| Inputs |
| Inputs |
|
|
|
| ||||||||||||||||
|
| (Level 1) |
| (Level 2) |
| (Level 3) |
| At Fair Value |
| |||||||||||||||||
| | | | | | | | | | | | | | |||||||||||||
| | Fair Value Measurements Using | | | |
| ||||||||||||||||||||
|
| Quoted Prices in |
| Significant |
| | |
|
| |
| |||||||||||||||
| | Active Markets | | Other | | Significant | | | |
| ||||||||||||||||
| | for Identical | | Observable | | Unobservable | | | |
| ||||||||||||||||
| | Assets | | Inputs | | Inputs | | | |
| ||||||||||||||||
| | (Level 1) | | (Level 2) | | (Level 3) | | At Fair Value |
| |||||||||||||||||
Cash flow hedges |
| $ | — |
| $ | (11,316) |
| $ | — |
| $ | (11,316) |
| | $ | — | | $ | (62) | | $ | — | | $ | (62) | |
Fair value hedges |
|
| — |
|
| (44) |
|
| — |
|
| (44) |
| |
| — | |
| 198 | |
| — | |
| 198 | |
Total net derivative asset (liability) |
| $ | — |
| $ | (11,360) |
| $ | — |
| $ | (11,360) |
| | $ | — | | $ | 136 | | $ | — | | $ | 136 | |
The following is a summary of the Company’s fair value measurements as of December 31, 20192022 and 20182021 (in thousands):
As of December 31, 20192022
| | | | | | | | | | |
| | Fair Value Measurements Using |
| |||||||
|
| Quoted Prices in |
| | |
| Significant |
| ||
| | Active Markets for | | Significant Other | | Unobservable |
| |||
| | Identical Assets | | Observable Inputs | | Inputs |
| |||
| | (Level 1) | | (Level 2) | | (Level 3) |
| |||
Assets | | | | | | | | | | |
Derivative instruments, net | | $ | — | | $ | 320 | | $ | — | |
Deferred compensation plan asset | | | 25,046 | | | — | | | — | |
Contingent consideration | | | — | | | — | | | 5,724 | |
Total assets | | $ | 25,046 | | $ | 320 | | $ | 5,724 | |
| | | | | | | | | | |
Liabilities | | | | | | | | | | |
Derivative instruments, net | | $ | — | | $ | — | | $ | — | |
Contingent consideration | |
| — | |
| — | |
| (5,916) | |
Total liabilities | | $ | — | | $ | — | | $ | (5,916) | |
| | | | | | | | | | |
Redeemable noncontrolling interest | | $ | — | | $ | — | | $ | (55,645) | |
|
|
|
|
|
|
|
|
|
|
|
|
| Fair Value Measurements Using |
| |||||||
|
| Quoted Prices in |
|
|
|
| Significant |
| ||
|
| Active Markets for |
| Significant Other |
| Unobservable |
| |||
|
| Identical Assets |
| Observable Inputs |
| Inputs |
| |||
|
| (Level 1) |
| (Level 2) |
| (Level 3) |
| |||
Assets |
|
|
|
|
|
|
|
|
|
|
Derivative instruments, net |
| $ | — |
| $ | 5,772 |
| $ | — |
|
Total assets |
| $ | — |
| $ | 5,772 |
| $ | — |
|
|
|
|
|
|
|
|
|
|
|
|
Liabilities |
|
|
|
|
|
|
|
|
|
|
Deferred compensation plan liability |
| $ | — |
| $ | (20,370) |
| $ | — |
|
Derivative instruments, net |
|
| — |
|
| — |
|
| — |
|
Contingent consideration |
|
| — |
|
| — |
|
| (6,134) |
|
Total liabilities |
| $ | — |
| $ | (20,370) |
| $ | (6,134) |
|
F-33
As of December 31, 20182021
| | | | | | | | | | |
| | Fair Value Measurements Using |
| |||||||
|
| Quoted Prices in |
| | |
| Significant |
| ||
| | Active Markets for | | Significant Other | | Unobservable |
| |||
| | Identical Assets | | Observable Inputs | | Inputs |
| |||
| | (Level 1) | | (Level 2) | | (Level 3) |
| |||
Assets | | | | | | | | | | |
Derivative instruments, net | | $ | — | | $ | 136 | | $ | — | |
Deferred compensation plan asset | | | 28,572 | | | — | | | — | |
Total assets | | $ | 28,572 | | $ | 136 | | $ | — | |
| | | | | | | | | | |
Liabilities | | | | | | | | | | |
Derivative instruments, net | | $ | — | | $ | — | | $ | — | |
Contingent consideration | |
| — | |
| — | |
| (9,600) | |
Total liabilities | | $ | — | | $ | — | | $ | (9,600) | |
| | | | | | | | | | |
Redeemable noncontrolling interest | | $ | — | | $ | — | | $ | (56,316) | |
|
|
|
|
|
|
|
|
|
|
|
|
| Fair Value Measurements Using |
| |||||||
|
| Quoted Prices in |
|
|
|
| Significant |
| ||
|
| Active Markets for |
| Significant Other |
| Unobservable |
| |||
|
| Identical Assets |
| Observable Inputs |
| Inputs |
| |||
|
| (Level 1) |
| (Level 2) |
| (Level 3) |
| |||
Assets |
|
|
|
|
|
|
|
|
|
|
Derivative instruments, net |
| $ | — |
| $ | — |
| $ | — |
|
Total assets |
| $ | — |
| $ | — |
| $ | — |
|
|
|
|
|
|
|
|
|
|
|
|
Liabilities |
|
|
|
|
|
|
|
|
|
|
Deferred compensation plan liability |
| $ | — |
| $ | (14,836) |
| $ | — |
|
Derivative instruments, net |
|
| — |
|
| (11,360) |
|
| — |
|
Contingent consideration |
|
| — |
|
| — |
|
| (2,363) |
|
Total liabilities |
| $ | — |
| $ | (26,196) |
| $ | (2,363) |
|
Deferred Compensation Plan - The Company maintains a non-qualified deferred compensation plan structured as a Rabbi trust for certain eligible employees. ParticipantsThe plan assets are invested in the deferred compensation plan select from a menuvariety of phantom investment options for their deferral dollars offered by the Company each year, which are based upon changes in value of complementary, defined market investments.equity and bond mutual funds. The deferred compensation liabilityasset represents the combined fair value of all the funds based on quoted values ofand market investments against which participant accounts are tracked.observable inputs.
Contingent Consideration — The Company recorded contingent consideration related to the acquisitions of SCSthe U.S. and FCR. ThisU.K. assets of VoiceFoundry (“VF US”) and the remaining VoiceFoundry business (“VF ASEAN”) that closed during 2020, and Faneuil that closed in 2022. The contingent payable for VF US was recognized at fair valuecalculated using either a discounted cash flow approach or an option valuation model andMonte Carlo simulation including a discount rate of 4.7% and 16.7%, respectively.23.1%. The contingent payable for VF ASEAN was calculated using a Monte Carlo simulation including a discount rate of 18.4% The contingent payables for Faneuil were calculated using a Monte Carlo simulation including a discount rate of 19.3%. The measurements were based on significant inputs not observable in the market. The Company records interest expense each period using the effective interest method until the future value of these contingent payables reaches their expected future value. Interest expense related to all recorded contingent payables is included in Interest expense in the Consolidated Statements of Comprehensive Income (Loss).
During the fourth quarter of 2018 and2020, the first quarter of 2021, the second quarter of 2019,2021 and the fourth quarter of 2021, the Company recorded fair value adjustments to the contingent consideration associated with the SCS acquisitionVF US and VF ASEAN acquisitions based on decreasedincreased actual results and estimates of EBITDA for 2021 which caused the estimated payablepayables to be zero for both future payments.increase. Accordingly, a $0.3combined $4.3 million increase, $0.9 million increase, $0.2 million increase and a $2.5$0.1 million decreaseincrease to the payablepayables were recorded as of December 31, 2018 and2020, March 31, 2021, June 30, 2019,2021, and December 31, 2021, respectively, and were included in Other income (expense), net in the Consolidated Statements of Comprehensive Income (Loss). As of December 31, 2019, the expectedThe future EBITDA is still below the target, thus the contingent consideration remainsfor the VF US and VF ASEAN acquisitions were finalized at zero.$9.6 million and were paid in March 2022.
During the third and fourth quarters of 2022, fair value adjustments of $2.4 million and $0.5 million net benefits were recorded related to fair value adjustments of the estimated contingent payments associated with the Faneuil acquisition based on updated discount factor and EBITDA estimates for one contract and a complete reduction for the second contract as it was not awarded to the Company. The fair value adjustment benefits were included in Other income (expense) in the Consolidated Statements of Comprehensive Income (Loss).
Contingent Receivables – The Company recorded a contingent considerationreceivable related to the Faneuil acquisition that closed in 2022. During the third and fourth quarters of 2022, the Company recorded fair value adjustments for the receivable based on current information which caused the receivable to decrease, and a revenue servicing agreement with Welltok$4.4 million expense and a $0.2 million expense, respectively, were included in Other income (expense), net in the fourth quarterConsolidated Statements of 2016, in which a maximumComprehensive Income (Loss).
F-34
Table of $1.25 million would be paid over eight quarters based onContents
TTEC HOLDINGS, INC. AND SUBSIDIARIES
Notes to the dollar value of revenue earned by the Company. The contingent payable was recognized at fair value of $1.25 million as of December 31, 2016. Payments totaling $851 thousand were completed during 2017 and the final payment of $399 thousand was made during the first quarter of 2018. Consolidated Financial Statements
A rollforward of the activity in the Company’s fair value of the contingent consideration payable is as follows (in thousands):
|
|
|
|
|
|
|
|
|
|
|
|
|
|
|
|
|
|
|
|
|
|
|
|
|
|
|
| Imputed |
|
|
|
| |
|
| December 31, |
|
|
|
|
|
|
| Interest / |
| December 31, |
| |||
|
| 2018 |
| Acquisitions |
| Payments |
| Adjustments |
| 2019 |
| |||||
|
|
|
|
|
|
|
|
|
|
|
|
|
|
|
|
|
Welltok |
| $ | — |
| $ | — |
| $ | — |
| $ | — |
| $ | — |
|
SCS |
|
| 2,363 |
|
| — |
|
| — |
|
| (2,363) |
|
| — |
|
FCR |
|
| — |
|
| 6,134 |
|
| — |
|
| — |
|
| 6,134 |
|
Total |
| $ | 2,363 |
| $ | 6,134 |
| $ | — |
| $ | (2,363) |
| $ | 6,134 |
|
| | | | | | | | | | | | | | | | |
|
| | |
| | |
| | |
| Imputed |
| | |
| |
| | December 31, | | | | | | | | Interest / | | December 31, |
| |||
| | 2021 | | Acquisitions | | Payments | | Adjustments | | 2022 |
| |||||
| | | | | | | | | | | | | | | | |
VF US | | $ | (7,414) | | $ | — | | $ | 7,414 | | $ | — | | $ | — | |
VF ASEAN | | | (2,186) | | | — | | | 2,186 | | | — | | | — | |
Faneuil | | | — | | | (8,816) | | | — | | | 2,900 | | | (5,916) | |
Total | | $ | (9,600) | | $ | (8,816) | | $ | 9,600 | | $ | 2,900 | | $ | (5,916) | |
| | | | | | | | | | | | | | | | |
|
| | |
| | |
| | |
| Imputed |
| | |
| |
| | December 31, | | | | | | | | Interest / | | December 31, |
| |||
| | 2020 | | Acquisitions | | Payments | | Adjustments | | 2021 |
| |||||
| | | | | | | | | | | | | | | | |
VF US | | $ | (14,085) | | $ | — | | $ | 7,414 | | $ | (743) | | $ | (7,414) | |
VF ASEAN | |
| (3,947) | |
| — | |
| 2,186 | |
| (425) | |
| (2,186) | |
Total | | $ | (18,032) | | $ | — | | $ | 9,600 | | $ | (1,168) | | $ | (9,600) | |
F-34
TableA rollforward of Contentsthe activity in the Company’s fair value of the contingent consideration receivable is as follows (in thousands):
| | | | | | | | | | | | | | | | |
|
| | |
| | |
| | |
| Imputed |
| | |
| |
| | December 31, | | | | | | | | Interest / | | December 31, |
| |||
| | 2021 | | Acquisitions | | Payments | | Adjustments | | 2022 |
| |||||
| | | | | | | | | | | | | | | | |
Faneuil | | $ | — | | $ | 10,370 | | $ | — | | $ | (4,646) | | $ | 5,724 | |
Total | | $ | — | | $ | 10,370 | | $ | — | | $ | (4,646) | | $ | 5,724 | |
TTEC HOLDINGS, INC. AND SUBSIDIARIES
Notes to the Consolidated Financial Statements
|
|
|
|
|
|
|
|
|
|
|
|
|
|
|
|
|
|
|
|
|
|
|
|
|
|
|
| Imputed |
|
|
|
| |
|
| December 31, |
|
|
|
|
|
|
| Interest / |
| December 31, |
| |||
|
| 2017 |
| Acquisitions |
| Payments |
| Adjustments |
| 2018 |
| |||||
|
|
|
|
|
|
|
|
|
|
|
|
|
|
|
|
|
Welltok |
| $ | 399 |
| $ | — |
| $ | (399) |
| $ | — |
| $ | — |
|
SCS |
|
| — |
|
| 2,731 |
|
| — |
|
| (368) |
|
| 2,363 |
|
Total |
| $ | 399 |
| $ | 2,731 |
| $ | (399) |
| $ | (368) |
| $ | 2,363 |
|
The sources of pre-tax operating income are as follows (in thousands):
|
|
|
|
|
|
|
|
|
|
| ||||||||||
|
| Year Ended December 31, |
| |||||||||||||||||
|
| 2019 |
| 2018 |
| 2017 |
| |||||||||||||
| | | | | | | | | | | ||||||||||
| | Year Ended December 31, |
| |||||||||||||||||
|
| 2022 |
| 2021 |
| 2020 |
| |||||||||||||
Domestic |
| $ | 39,864 |
| $ | (13,926) |
| $ | 10,909 |
| | $ | 52,887 | | $ | 108,160 | | $ | 129,620 | |
Foreign |
|
| 70,547 |
|
| 70,164 |
|
| 77,978 |
| |
| 91,561 | |
| 99,724 | |
| 40,648 | |
Total |
| $ | 110,411 |
| $ | 56,238 |
| $ | 88,887 |
| | $ | 144,448 | | $ | 207,884 | | $ | 170,268 | |
In 2017, the United States enacted comprehensive tax reform legislation known as the Tax Cuts and Jobs Act (the "2017 Tax Act") that, among other things, reduces the U.S. federal corporate income tax rate from 35% to 21% and implements a territorial tax system, but imposes an alternative “base erosion and anti-abuse tax” (“BEAT”), and an incremental tax on global intangible low taxed foreign income (“GILTI”) effective January 1, 2018. In addition, the law imposed a one-time mandatory repatriation tax on accumulated post-1986 foreign earnings on domestic corporations effective for the 2017 tax year. As of December 31, 2018, the Company had completed its analysis of the impacts of the 2017 Tax Act within the measurement period in accordance with SAB 118, and no material adjustment was recorded to the 2017 estimate.
The significant components of this expense include (i) the remeasurement of net deferred tax assets at the lower enacted U.S. federal corporate tax rate, (ii) the deemed repatriation tax on unremitted non-U.S. earnings and profits that were previously tax deferred and (iii) other miscellaneous tax impacts.
While the Company’s accounting for the recorded impact of the 2017 Tax Act is deemed to be complete, these amounts are based on prevailing regulations and currently available information, and any additional guidance issued by the Internal Revenue Service (“IRS”) or the results of an audit related to these items, could impact the Company’s recorded amounts in future periods.
The Company’s selection of an accounting policy with respect to both the new GILTI and BEAT rules is to compute the related taxes in the period the entity becomes subject to either. A reasonable estimate of the effects of these provisions has been included in the 2019 and 20182022 annual financial statements.
No significant changes in indefinite reinvestment assertion were made during the year. The Company has completed its analysis in regard to the full tax impact related to prior changes in indefinite reinvestment reassertion and any related taxes have been recorded. The Company generally intends to limit distributions from non-U.S. subsidiaries to cash balances available in foreign jurisdictions.
No additional income taxes have been provided for any remaining outside basis difference inherent in the Company’s foreign subsidiaries as these amounts continue to be indefinitely reinvested in foreign operations. The Company has an estimated $266 million of outside basis differences as of December 31, 2022. Determination of any unrecognized deferred tax liability related to the outside basis difference in investments in foreign subsidiaries is not practicable due to the inherent complexity of the multi-national tax environment in which the Company operates.
F-35
The components of the Company’s Provision for (benefit from) income taxes are as follows (in thousands):
|
|
|
|
|
|
|
|
|
|
| ||||||||||
|
| Year Ended December 31, |
| |||||||||||||||||
|
| 2019 |
| 2018 |
| 2017 |
| |||||||||||||
| | | | | | | | | | | ||||||||||
| | Year Ended December 31, |
| |||||||||||||||||
|
| 2022 |
| 2021 |
| 2020 |
| |||||||||||||
Current provision for (benefit from) |
|
|
|
|
|
|
|
|
|
| | | | | | | | | | |
Federal |
| $ | 5,289 |
| $ | 2,771 |
| $ | 48,556 |
| | $ | 10,816 | | $ | 20,697 | | $ | 22,763 | |
State |
|
| 2,826 |
|
| 2,754 |
|
| 99 |
| |
| 5,245 | |
| 8,006 | |
| 9,871 | |
Foreign |
|
| 18,938 |
|
| 18,933 |
|
| 12,643 |
| |
| 22,055 | |
| 20,161 | |
| 13,496 | |
Total current provision for (benefit from) |
|
| 27,053 |
|
| 24,458 |
|
| 61,298 |
| |
| 38,116 | |
| 48,864 | |
| 46,130 | |
Deferred provision for (benefit from) |
|
|
|
|
|
|
|
|
|
| | | | | | | | | | |
Federal |
|
| 2,515 |
|
| (943) |
|
| 14,441 |
| |
| (3,128) | |
| (7,017) | |
| (2,390) | |
State |
|
| 118 |
|
| (138) |
|
| 707 |
| |
| (192) | |
| (402) | |
| (254) | |
Foreign |
|
| (4,009) |
|
| (6,894) |
|
| 1,629 |
| |
| (7,681) | |
| 8,250 | |
| (2,549) | |
Total deferred provision for (benefit from) |
|
| (1,376) |
|
| (7,975) |
|
| 16,777 |
| |
| (11,001) | |
| 831 | |
| (5,193) | |
Total provision for (benefit from) income taxes |
| $ | 25,677 |
| $ | 16,483 |
| $ | 78,075 |
| | $ | 27,115 | | $ | 49,695 | | $ | 40,937 | |
The following reconciles the Company’s effective tax rate to the federal statutory rate (in thousands):
|
|
|
|
|
|
|
|
|
|
| ||||||||||
|
| Year Ended December 31, |
| |||||||||||||||||
|
| 2019 |
| 2018 |
| 2017 |
| |||||||||||||
Income tax per U.S. federal statutory rate (21%, 21%, 35%) |
| $ | 23,186 |
| $ | 11,810 |
| $ | 31,110 |
| ||||||||||
| | | | | | | | | | | ||||||||||
| | Year Ended December 31, |
| |||||||||||||||||
|
| 2022 |
| 2021 |
| 2020 |
| |||||||||||||
Income tax per U.S. federal statutory rate (21%, 21%, 21%) | | $ | 30,334 | | $ | 43,655 | | $ | 35,756 | | ||||||||||
State income taxes, net of federal deduction |
|
| 3,144 |
|
| 2,003 |
|
| 460 |
| |
| 2,717 | |
| 4,588 | |
| 6,923 | |
Change in valuation allowances |
|
| 9,832 |
|
| 2,191 |
|
| (924) |
| |
| (3,278) | |
| 12,567 | |
| 3,903 | |
Foreign income taxes at different rates than the U.S. |
|
| (3,356) |
|
| (3,758) |
|
| (14,417) |
| |
| 1,202 | |
| (1,416) | |
| (783) | |
Foreign withholding taxes |
|
| 600 |
|
| 785 |
|
| 323 |
| |
| (2) | |
| (93) | |
| 106 | |
Losses in international markets without tax benefits |
|
| (2,651) |
|
| (68) |
|
| 1,098 |
| |
| — | |
| — | |
| (1,656) | |
Nondeductible compensation under Section 162(m) |
|
| 668 |
|
| 615 |
|
| 647 |
| |
| 841 | |
| 1,494 | |
| 656 | |
Taxes related to equity compensation | | | (907) | | | (4,282) | | | (587) | | ||||||||||
Liabilities for uncertain tax positions |
|
| 661 |
|
| 1,105 |
|
| 1,607 |
| |
| (1,435) | |
| (790) | |
| 2,882 | |
Permanent difference related to foreign exchange gains |
|
| 36 |
|
| 136 |
|
| 142 |
| |
| 139 | |
| 3,362 | |
| (71) | |
(Income) losses of foreign branch operations |
|
| 55 |
|
| 475 |
|
| (824) |
| ||||||||||
Impacts of foreign branch operations | | | 2,315 | | | (187) | | | (10) | | ||||||||||
Non-taxable earnings of noncontrolling interest |
|
| (1,294) |
|
| (594) |
|
| (1,030) |
| |
| (2,638) | |
| (3,085) | |
| (1,964) | |
Foreign dividend less foreign tax credits |
|
| (1,681) |
|
| (1,748) |
|
| (4,798) |
| |
| (1,616) | |
| (1,142) | |
| (1,723) | |
Decrease (increase) to deferred tax asset - change in tax rate |
|
| (2,848) |
|
| (1,944) |
|
| 1,101 |
| |
| — | |
| — | | | (48) | |
State income tax credits |
|
| (1,176) |
|
| 19 |
|
| 207 |
| ||||||||||
State and Federal income tax credits and NOL's | |
| (4,604) | |
| (4,531) | |
| (3,918) | | ||||||||||
Foreign earnings taxed currently in U.S. |
|
| 2,172 |
|
| 3,976 |
|
| 3,143 |
| |
| 2,978 | |
| 1,930 | |
| 1,936 | |
Taxes related to prior year filings |
|
| (1,643) |
|
| (1,659) |
|
| (865) |
| |
| (432) | |
| (1,192) | | | (1,718) | |
Taxes related to acquisition accounting |
|
| 978 |
|
| 2,110 |
|
| — |
| | | — | | | — | | | 1,317 | |
Transition tax |
|
| — |
|
| — |
|
| 61,569 |
| ||||||||||
Other |
|
| (1,006) |
|
| 1,029 |
|
| (474) |
| |
| 1,501 | |
| (1,183) | |
| (64) | |
Income tax per effective tax rate |
| $ | 25,677 |
| $ | 16,483 |
| $ | 78,075 |
| | $ | 27,115 | | $ | 49,695 | | $ | 40,937 | |
|
|
|
|
|
|
|
|
|
|
| ||||||||||
| | | | | | | | | | | ||||||||||
Effective tax rate percentage |
|
| 23.30% |
|
| 29.30% |
|
| 87.80% |
| | | 18.8% | | | 23.9% | | | 24.0% | |
F-36
The Company’s deferred income tax assets and liabilities are summarized as follows (in thousands):
|
|
|
|
|
|
|
| |||||||
|
| Year Ended December 31, |
| |||||||||||
|
| 2019 |
| 2018 |
| |||||||||
| | | | | | | | |||||||
| | Year Ended December 31, |
| |||||||||||
|
| 2022 |
| 2021 |
| |||||||||
Deferred tax assets, gross |
|
|
|
|
|
|
| | | | | | | |
Accrued workers compensation, deferred compensation and employee benefits |
| $ | 7,999 |
| $ | 8,724 |
| | $ | 9,715 | | $ | 8,441 | |
Allowance for doubtful accounts, insurance and other accruals |
|
| 3,393 |
|
| 3,301 |
| |||||||
Allowance for credit losses, insurance and other accruals | |
| 4,109 | |
| 4,767 | | |||||||
Amortization of deferred lease liabilities |
|
| 25,757 |
|
| 2,614 |
| |
| 18,475 | |
| 15,816 | |
Net operating losses |
|
| 19,222 |
|
| 18,475 |
| |
| 18,312 | |
| 18,006 | |
Equity compensation |
|
| 1,442 |
|
| 1,348 |
| |
| 1,912 | |
| 2,302 | |
Customer acquisition and deferred revenue accruals |
|
| 9,047 |
|
| 13,894 |
| |
| 18,749 | |
| 20,069 | |
Federal and state tax credits, net |
|
| 1,263 |
|
| 549 |
| |
| 3,247 | |
| 2,759 | |
Unrealized losses on derivatives |
|
| 1,421 |
|
| 2,035 |
| |
| — | |
| 22 | |
Impairment of equity investment |
|
| 4,142 |
|
| 4,221 |
| | | 1,047 | | | 4,064 | |
Depreciation and amortization | | | 7,896 | | | — | | |||||||
Partnership Investment |
|
| 2,435 |
|
| — |
| | | 102 | | | 106 | |
Other |
|
| 1,322 |
|
| 1,001 |
| |
| 3,931 | |
| 5,052 | |
Total deferred tax assets, gross |
|
| 77,443 |
|
| 56,162 |
| |
| 87,495 | |
| 81,404 | |
Valuation allowances |
|
| (17,051) |
|
| (10,867) |
| |
| (24,944) | |
| (29,620) | |
Total deferred tax assets, net |
|
| 60,392 |
|
| 45,295 |
| |
| 62,551 | |
| 51,784 | |
Deferred tax liabilities |
|
|
|
|
|
|
| | | | | | | |
Depreciation and amortization |
|
| (6,095) |
|
| (15,547) |
| |
| — | |
| (10,291) | |
Unrealized gain on derivatives |
|
| (1,491) |
|
| — |
| | | (27) | | | — | |
Contract acquisition costs |
|
| (5,740) |
|
| (8,519) |
| |
| (19) | |
| (1,831) | |
Intangible assets |
|
| (22,585) |
|
| (15,890) |
| |
| (28,848) | |
| (21,202) | |
Operating lease assets |
|
| (21,413) |
|
| — |
| |
| (15,594) | |
| (12,481) | |
Other |
|
| (407) |
|
| (187) |
| |
| (3,208) | |
| (184) | |
Total deferred tax liabilities |
|
| (57,731) |
|
| (40,143) |
| |
| (47,696) | |
| (45,989) | |
Net deferred tax assets |
| $ | 2,661 |
| $ | 5,152 |
| | $ | 14,855 | | $ | 5,795 | |
Quarterly, the Company assesses the likelihood by jurisdiction that its net deferred tax assets will be recovered. Based on the weight of all available evidence, both positive and negative, the Company records a valuation allowance against deferred tax assets when it is more-likely-than-not that a future tax benefit will not be realized.
As of December 31, 20192022 the Company had approximately $3.9 million of net deferred tax liabilities in the U.S. and $6.6$10.3 million of net deferred tax assets related to certain international locations whose recoverability is dependent uponin the U.S. and $4.5 million across their future profitability.foreign operations. As of December 31, 20192022 the deferred tax valuation allowance was $17.1$24.9 million and related primarily to tax losses in foreign jurisdictions which do not meet the “more-likely-than-not” standard under current accounting guidance.
When there is a change in judgment concerning the recovery of deferred tax assets in future periods, a valuation allowance is recorded into earnings during the quarter in which the change in judgment occurred. In 2019,2022, the Company made adjustments to its deferred tax assets and corresponding valuation allowances. The net change to the valuation allowance consisted of the following: a $4.6$1.3 million increase related to capital lossinterest expense limitation carry forwards, state net operating losses and other credit carry forwardsforeign tax credits not expected to be utilized in Brazil and Canada,the United States; a $2.7$1.0 million increase in valuation allowance in the United Kingdom, Ireland,Mexico, Netherlands, Canada Luxembourg, Turkey, the United States and Australiavarious other jurisdictions for deferred tax assets that do not meet the “more-likely-than-not” standard,standard; and a $1.1$6.9 million release of valuation allowance in Argentina, New Zealand, andCanada, the United Kingdom, the Netherlands, and various other jurisdictions related to the utilization or write-off of deferred tax assets.
F-37
Activity in the Company’s valuation allowance accounts consists of the following (in thousands):
|
|
|
|
|
|
|
|
|
|
| ||||||||||
|
| Year Ended December 31, |
| |||||||||||||||||
|
| 2019 |
| 2018 |
| 2017 |
| |||||||||||||
| | | | | | | | | | | ||||||||||
| | Year Ended December 31, |
| |||||||||||||||||
|
| 2022 |
| 2021 |
| 2020 |
| |||||||||||||
Beginning balance |
| $ | 10,867 |
| $ | 9,526 |
| $ | 9,949 |
| | $ | 29,620 | | $ | 18,697 | | $ | 17,051 | |
Additions of deferred income tax expense |
|
| 7,373 |
|
| 2,913 |
|
| 2,044 |
| |
| 2,248 | |
| 14,660 | |
| 4,650 | |
Reductions of deferred income tax expense |
|
| (1,189) |
|
| (1,572) |
|
| (2,467) |
| |
| (6,924) | |
| (3,737) | |
| (3,004) | |
Ending balance |
| $ | 17,051 |
| $ | 10,867 |
| $ | 9,526 |
| | $ | 24,944 | | $ | 29,620 | | $ | 18,697 | |
F-37
As of December 31, 2019,2022, after consideration of all tax loss and tax credit carry back opportunities, the Company had tax affected tax loss carry forwards worldwide expiring as follows (in thousands):
|
|
|
|
2020 |
| $ | 1,151 |
2021 |
|
| 5 |
2022 |
|
| 3 |
2023 |
|
| 1,105 |
After 2023 |
|
| 9,298 |
No expiration |
|
| 7,660 |
Total |
| $ | 19,222 |
| | | |
2023 |
| $ | 12 |
2024 | |
| 9 |
2025 | |
| 47 |
2026 | |
| 50 |
After 2026 | |
| 7,624 |
No expiration | |
| 10,570 |
Total | | $ | 18,312 |
The Company has been granted “Tax Holidays” as an incentive to attract foreign investment by the governments of the Philippines and Costa Rica. Generally, a Tax Holiday is an agreement between the Company and a foreign government under which the Company receives certain tax benefits in that country, such as exemption from taxation on profits derived from export-related activities. In the Philippines, the Company has been granted multiple agreements withunder local laws which result in an initial period of four yearsoverall reduced tax rate. These incentives have varying benefit year over year and additional periods for varying years, expiringexpire at various times between 2020 and 2022.beginning in 2030. The aggregate benefit to income tax expense for the years ended December 31, 2019, 20182022, 2021 and 20172020 was approximately $8.4$1.6 million, $8.2$6.3 million and $11.9$4.4 million, respectively, which had a favorable impact on diluted net income per share of $0.18, $0.18$0.04, $0.13 and $0.26,$0.09, respectively.
Accounting for Uncertainty in Income Taxes
In accordance with ASC 740, the Company has recorded a reserve for uncertain tax positions. The total amount of interest and penalties recognized in the accompanying Consolidated Balance Sheets and Consolidated Statements of Comprehensive Income (Loss) as of December 31, 2019, 20182022, 2021 and 20172020 was approximately $2.1$1.8 million, $1.4$2.8 million and $1.8$3.0 million, respectively.
The Company had a reserve for uncertain tax benefits, on a net basis, of $4.8$6.6 million and $4.8$6.9 million for the years ended December 31, 20192022 and 2018,2021, respectively. The liability for uncertain tax positions was unchanged during 2019.
The tabular reconciliation of the reserve for uncertain tax benefits on a gross basis without interest for the three years ended December 31, 20192022 is presented below (in thousands):
| | | |
Balance as of December 31, 2019 |
| $ | 4,784 |
Additions for current year tax positions | |
| 2,725 |
Reductions in prior year tax positions | |
| — |
Balance as of December 31, 2020 | |
| 7,509 |
Additions for current year tax positions | |
| 220 |
Reductions in prior year tax positions | |
| (826) |
Balance as of December 31, 2021 | |
| 6,903 |
Additions for current year tax positions | |
| 143 |
Reductions in prior year tax positions | |
| (479) |
Balance as of December 31, 2022 | | $ | 6,567 |
|
|
|
|
Balance as of December 31, 2016 |
| $ | 2,382 |
Additions for current year tax positions |
|
| 916 |
Reductions in prior year tax positions |
|
| — |
Balance as of December 31, 2017 |
|
| 3,298 |
Additions for current year tax positions |
|
| 3,600 |
Reductions in prior year tax positions |
|
| (2,114) |
Balance as of December 31, 2018 |
|
| 4,784 |
Additions for current year tax positions |
|
| — |
Reductions in prior year tax positions |
|
| — |
Balance as of December 31, 2019 |
| $ | 4,784 |
F-38
At December 31, 2019,2022, the amount of uncertain tax benefits including interest, that, if recognized, would reduce tax expense was $6.8$8.4 million. Within the next 12 months, it is expected that the amount of unrecognized tax benefits may be reduced by $1.4$7.8 million as a result of the expiration of various statutes of limitation or other confirmations of tax positions.
In accordance with ASC 740, during the second quarter of 2018, $1.1 million of liability was released due to the closing of statues of limitations. During the third quarter of 2018, $2.0 million of liability was released due to the closing of statutes of limitations and changes calculated as allowed under SAB 118 related to the 2017 Tax Act. During the fourth quarter of 2018, the Company recorded liabilities of $3.6 million related to new uncertain tax positions.
F-38
The Company and its domestic and foreign subsidiaries (including Percepta LLC and its domestic and foreign subsidiaries) file income tax returns as required in the U.S. federal jurisdiction and various state and foreign jurisdictions. The following table presents the major tax jurisdictions and tax years that are open as of December 31, 20192022 and subject to examination by the respective tax authorities:
| | |
Tax Jurisdiction | Tax Year Ended | |
United States |
|
|
Australia |
|
|
|
|
|
Canada |
|
|
Mexico |
|
|
Philippines |
|
|
The Company’s U.S. income tax returns filed for the tax years ending December 31, 20162017 to present, remain open tax years. The Company has been notified of the intent to audit, or is currently under audit of, income taxes for the United States for tax year 2017 Canadaand 2018, the Philippines for tax year 2020, the state of California in the United States for tax years 20092017 and 2010,2018, and the state of New YorkIndia for tax years 20152017 through 2017.2020. Although the outcome of examinations by taxing authorities are always uncertain, it is the opinion of management that the resolution of these audits will not have a material effect on the Company’s Consolidated Financial Statements.
(11)RESTRUCTURING CHARGES, INTEGRATION CHARGES AND IMPAIRMENT LOSSES
Restructuring Charges
During the years ended December 31, 2019, 2018 and 2017, the Company continued restructuring activities primarily associated with reductions in the Company’s capacity, workforce and related management in both segments to better align the capacity and workforce with current business needs.
During 2017, several restructuring activities were completed related to an acquisition including the closure of two delivery centers that came with the acquisition. During 2017, a net $0.4 million severance accrual was recorded in relation to these closures. In conjunction with closing these two delivery centers, a $0.6 million termination fee and a $1.4 million net lease liability and applicable expenses were recorded as of December 31, 2017. These net charges were included in the Consolidated Statements of Comprehensive Income (Loss) during the year ended December 31, 2017. During 2018, in connection with one of these delivery centers, an early termination option was exercised and a $1.9 million fee was expensed and recorded in Restructuring, net in the Consolidated Statements of Comprehensive Income (Loss).
During 2018, TTEC determined it would close several other delivery centers in the Engage segment and a net $2.9 million was expensed related to early termination fees and cease use lease accruals. These expenses are included in the Restructuring and integration charges, net in the Consolidated Statements of Comprehensive Income (Loss) as of December 31, 2018.
A summary of the expenses recorded for restructuring and included in Restructuring and integration charges, net in the accompanying Consolidated Statements of Comprehensive Income (Loss) for the years ended December 31, 2019, 2018 and 2017, respectively, is as follows (in thousands):
|
|
|
|
|
|
|
|
|
|
|
|
|
|
| Year Ended December 31, |
| |||||||
|
|
| 2019 |
| 2018 |
| 2017 |
| |||
Reduction in force |
|
|
|
|
|
|
|
|
|
|
|
TTEC Digital |
|
| $ | 141 |
| $ | 133 |
| $ | 149 |
|
TTEC Engage |
|
|
| 894 |
|
| 694 |
|
| 1,012 |
|
Total |
|
| $ | 1,035 |
| $ | 827 |
| $ | 1,161 |
|
F-39
|
|
|
|
|
|
|
|
|
|
|
|
|
|
| Year Ended December 31, |
| |||||||
|
|
| 2019 |
| 2018 |
| 2017 |
| |||
Facility exit and other charges |
|
|
|
|
|
|
|
|
|
|
|
TTEC Digital |
|
| $ | 41 |
| $ | — |
| $ | 169 |
|
TTEC Engage |
|
|
| 671 |
|
| 5,304 |
|
| 2,050 |
|
Total |
|
| $ | 712 |
| $ | 5,304 |
| $ | 2,219 |
|
A rollforward of the activity in the Company’s restructuring accruals for the years ended December 31, 2019 and 2018, respectively, is as follows (in thousands):
|
|
|
|
|
|
|
|
|
|
|
|
| Reduction |
| Facility Exit and |
|
|
|
| ||
|
| in Force |
| Other Charges |
| Total |
| |||
|
|
|
|
|
|
|
|
|
|
|
Balance as of December 31, 2017 |
| $ | 694 |
| $ | 1,409 |
| $ | 2,103 |
|
Expense |
|
| 1,021 |
|
| 5,303 |
|
| 6,324 |
|
Payments |
|
| (937) |
|
| (3,480) |
|
| (4,417) |
|
Changes due to foreign currency |
|
| (169) |
|
| (6) |
|
| (175) |
|
Changes in estimates |
|
| (193) |
|
| — |
|
| (193) |
|
Balance as of December 31, 2018 |
|
| 416 |
|
| 3,226 |
|
| 3,642 |
|
Expense |
|
| 1,039 |
|
| 712 |
|
| 1,751 |
|
Payments |
|
| (1,145) |
|
| (962) |
|
| (2,107) |
|
Changes due to foreign currency |
|
| (55) |
|
| 15 |
|
| (40) |
|
Changes in estimates |
|
| (4) |
|
| — |
|
| (4) |
|
Reclassifications due to ASU 842 implementation |
|
| — |
|
| (2,917) |
|
| (2,917) |
|
Balance as of December 31, 2019 |
| $ | 251 |
| $ | 74 |
| $ | 325 |
|
The remaining restructuring accruals are expected to be paid or extinguished during 2020 and are all classified as current liabilities within Other accrued expenses in the Consolidated Balance Sheets.
Integration Charges
During the third and fourth quarters of 2017, as a result of the Connextions acquisition, certain integration activities were completed and $5.6 million and $3.9 million of additional expenses were incurred and paid, respectively. These integration activities included the hiring, training and licensing of a group of employees at new delivery centers as one of the acquired centers was closed during the third quarter of 2017 and one of the acquired centers was closed during the fourth quarter of 2017. In connection with these center closures, leasehold improvements of $3.5 million were written off as a related integration expense. The Company has also incurred significant expenses related to the integration of the IT systems and has paid duplicative software costs and facilities expenses for several areas during the transition period.
Impairment LossesOF ASSETS
During each of the periods presented, the Company evaluated the recoverability of its leasehold improvement assets at certain customer engagement centers.centers as well as all internally developed software projects. An asset group is considered to be impaired when the anticipated undiscounted future cash flows of its asset group areis estimated to be less than the asset group’s carrying value. The amount of impairment recognized is the difference between the carrying value of the asset group and its fair value. To determine fair value, the Company used Level 3 inputs in its discounted cash flows analysis. Assumptions included the amount and timing of estimated future cash flows and assumed discount rates. During 2019, 20182022, 2021 and 2017,2020, the Company recognized impairment losses, net related to leasehold improvement assets, right of zero, $1.1use lease assets, internally developed software and certain computer equipment of $13.7 million, $11.3 million and zero,$5.8 million, respectively, in itsacross the TTEC Digital and TTEC Engage segment.segments.
(12)INDEBTEDNESS
F-40
Credit Facility
On February 14, 2019,November 23, 2021, the Company entered into a FourthSixth Amendment to itsthe Amended and Restated Credit Agreement and Amended and Restated Security Agreement(“the Credit Agreement”) originally dated as of June 3, 2013, (collectively, the “Credit Agreement”Facility”) forto convert the $300 million term loan included in the total Credit Facility commitments, that was previously agreed on March 25, 2021 as part of the Fifth Amendment to the Credit Agreement, into a $1.5 billion senior secured revolving credit facilityCredit Facility with a syndicate of lenders led by Wells Fargo, Bank, National Association, as agent, swing lineswingline and fronting lender (the “Credit Facility”).lender. The amended Credit Agreement provides for a secured revolving Credit Facility that matures on February 14, 2024.
Other than the extension of the Credit Facility’s maturity date and a few material terms outlined below, the material terms ofNovember 23, 2026. The Company primarily uses the Credit Facility including pricingto fund working capital, general operations, dividends, acquisitions and collateral, are substantiallyother strategic activities.
On March 25, 2021, the same as those previously disclosed as partCompany entered into a Fifth Amendment to its Credit Agreement and Credit Facility to increase the total commitments by $300 million to $1.2 billion by exercising the accordion feature that was included in the senior secured revolving credit facility. The $300 million increase was in the form of a term loan, could be prepaid anytime, and would become due February 14, 2024, contemporaneously with the expiration of the Company’s revolving line of credit.
F-39
Annual Report on Form 10-KTable of Contents for
TTEC HOLDINGS, INC. AND SUBSIDIARIES
Notes to the period ended December 31, 2015 (“2016 Credit Facility”).Consolidated Financial Statements
The maximum commitment under the Credit Facility is $900.0 million with an accordion feature of up to $1.2$1.5 billion in the aggregate, if certain conditions are satisfied. The Credit Facility commitment fees are payable to the lenders in an amount equal to the unused portion of the Credit Facility multiplied by a rate per annum as determined by reference to the Company’s net leverage ratio. The Credit Agreement contains customary affirmative, negative, and financial covenants, which remained unchanged from the 2016 Credit Facility, except that the Company is now obligated to maintain a maximum net leverage ratio of 3.50 to 1.00, and a minimum Interest Coverage Ratio of 2.50 to 1.00.covenants. The Credit Agreement permits accounts receivable factoring up to the greater of $75$100 million or 25 percent of the average book value of all accounts receivable over the most recent twelve monthtwelve-month period. The Credit Agreement also permits the utilization of up to $100 million of limits within the Credit Facility for letters of credit to be used in the business.
Base rate loans bear interest at a rate equal to the greatest of (i) Wells Fargo’s prime rate, (ii) one half of 1% in excess of the federal funds effective rate, and (iii) 1.25% in excess of the one monthone-month London Interbank Offered Rate (“LIBOR”); plus in each case a margin of 0% to 0.75% based on the Company’s net leverage ratio. Eurodollar loans bear interest at LIBOR plus a margin of 1.0% to 1.75% based on the Company’s net leverage ratio. Alternate currency loans bear interest at rates applicable to their respective currencies.
Letter of credit fees are one eighth of 1% of the stated amount of the letter of credit on the date of issuance, renewal or amendment, plus an annual fee equal to the borrowing margin for Eurodollar loans.
The Company primarily utilizes its Credit Agreement to fund working capital, general operations, dividends, and other strategic activities, such as the acquisitions described in Note 2. As of December 31, 2019,2022, and 2018,2021, the Company had borrowings of $290.0$960.0 million and $282.0$791.0 million, respectively, under its Credit Agreement and its average daily utilization was $331.8$1,037.4 million and $514.7$797.2 million for the years ended December 31, 20192022 and 2018,2021, respectively. During early April 2021, the Company increased borrowings by approximately $500 million in connection with the acquisition of Avtex (see Note 2). Based on the current level of availability based on the covenant calculations, the Company’s remaining borrowing capacity was approximately $530.0$335 million as of December 31, 2019.2022. As of December 31, 2019,2022, the Company was in compliance with all covenants and conditions under its Credit Agreement.
(13)
Letters of Credit
As of December 31, 2019,2022, outstanding letters of credit under the Credit Agreement totaled $3.1$0.2 million and primarily guaranteed workers’ compensation and other insurance related obligations. As of December 31, 2019,2022, letters of credit and contract performance guarantees issued outside of the Credit Agreement totaled $0.5$0.3 million.
Guarantees
Indebtedness under the Credit Agreement is guaranteed by certain of the Company’s present and future domestic subsidiaries.
F-41
Legal Proceedings
From time to time, the Company has been involved in legal actions, both as plaintiff and defendant, which arise in the ordinary course of business. The Company accrues for exposures associated with such legal actions to the extent that losses are deemed both probable and reasonably estimable. To the extent specific reserves have not been made for certain legal proceedings, their ultimate outcome, and consequently, an estimate of possible loss, if any, cannot reasonably be determined at this time.
Based on currently available information and advice received from counsel, the Company believes that the disposition or ultimate resolution of any current legal proceedings, except as otherwise specifically reserved for in its financial statements, will not have a material adverse effect on the Company’s financial position, cash flows or results of operations.
F-40
(14)DEFERRED REVENUE AND COSTSREMAINING PERFORMANCE OBLIGATIONS
Deferred revenue in the accompanying Consolidated Balance Sheets consist of the following (in thousands):
| | | | | | | |
| | December 31, |
| ||||
|
| 2022 |
| 2021 |
| ||
Deferred Revenue - Current | | $ | 87,846 | | $ | 95,608 | |
Deferred Revenue - Long-term (included in Other long-term liabilities) | |
| 5,760 | |
| 17,078 | |
Total Deferred Revenue | | $ | 93,606 | | $ | 112,686 | |
|
|
|
|
|
|
|
|
|
| December 31, |
| ||||
|
| 2019 |
| 2018 |
| ||
Deferred Revenue - Current |
| $ | 39,447 |
| $ | 44,926 |
|
Deferred Revenue - Long-term (included in Other long-term liabilities) |
|
| 23,142 |
|
| 33,247 |
|
Total Deferred Revenue |
| $ | 62,589 |
| $ | 78,173 |
|
Deferred costs in the accompanying Consolidated Balance Sheets consist of the following (in thousands):
|
|
|
|
|
|
|
| |||||||
|
| December 31, |
| |||||||||||
|
| 2019 |
| 2018 |
| |||||||||
| | | | | | | | |||||||
| | December 31, |
| |||||||||||
|
| 2022 |
| 2021 |
| |||||||||
Deferred Costs - Current (included in Prepaids and other current assets) |
| $ | 26,092 |
| $ | 23,539 |
| | $ | 42,632 | | $ | 49,043 | |
Deferred Costs - Long-term (included in Other long-term assets) |
|
| 25,436 |
|
| 34,042 |
| |
| 6,550 | |
| 14,406 | |
Total Deferred Costs |
| $ | 51,528 |
| $ | 57,581 |
| | $ | 49,182 | | $ | 63,449 | |
Activity in the Company’s Deferred revenue accounts consists of the following (in thousands):
|
|
|
|
| ||||
Balance as of December 31, 2018 |
| $ | 78,173 |
| ||||
| | | | | ||||
Balance as of December 31, 2021 | | $ | 112,686 | | ||||
Additions |
|
| 139,021 |
| |
| 288,537 | |
Amortization |
|
| (154,605) |
| |
| (307,617) | |
Balance as of December 31, 2019 |
| $ | 62,589 |
| ||||
Balance as of December 31, 2022 | | $ | 93,606 | | ||||
The Company adopted ASU 842, Leases,Revenue recognized for the year ended December 31, 2022 from amounts included in deferred revenue as of January 1, 2019 usingDecember 31, 2021 was $288.5 million. Revenue recognized for the effective dateyear ended December 31, 2021 from amounts included in deferred revenue as of December 31, 2020 was $297.6 million.
Remaining performance obligations (“RPO”) represent the dateamount of initial application. contracted future revenue that has not yet been recognized, including both deferred revenue and non-cancelable contracted amounts that will be invoiced and recognized as revenue in future periods. The Company’s RPO excludes performance obligations from on-demand arrangements as there are no minimum purchase commitments associated with these arrangements, and certain time and materials contracts that are billed in arrears.
As a result, prior year financials were not recast underof December 31, 2022, the new standardCompany’s RPO was $240.3 million, which will be delivered and therefore, those amountsrecognized within the next five years. However, the amount and timing of revenue recognition are not presented.generally driven by customer consumption, which can extend beyond the original contract term in cases where customers are permitted to roll over unused capacity to future periods, generally upon the purchase of additional capacity at renewal.
(15)LEASES
Operating leases are included in our Consolidated Balance Sheet as Operating lease assets, Current operating lease liabilities and Non-current operating lease liabilities. Finance leases are included in Property, plant and equipment, Other current liabilities and Other long-term liabilities in our Consolidated Balance Sheet. The Company primarily leases real estate and equipment under various arrangements that provide the Company the right-of-use for the underlying asset that require lease payments over the lease term. The Company determines the value of each lease by computing the present value of each lease payment using the interest rate implicit in the lease, if available; otherwise the Company estimates its incremental borrowing rate over the lease term. The Company determines its incremental borrowing rate based on its estimated credit risk with adjustments for each individual leases’ geographical risk and lease term. Operating lease assets also include prepaid rent and initial direct costs less any tenant improvements.
F-42F-41
The Company’s real estate portfolio typically includes one or more options to renew, with renewal terms that generally can extend the lease term from one to 10 years. The exercise of these lease renewal options is at the Company’s discretion and is included in the lease term only if the Company is reasonably certain to exercise. The Company also has service arrangements whereby it controls specific space provided by a third-party service provider. These arrangements meet the definition of a lease and are accounted for under ASC 842. Lease expense for operating leases is recognized on a straight-line basis over the lease term and is included in the Consolidated Statements of Comprehensive Income (Loss). The Company’s lease agreements do not contain any material residual value guarantees or restrictive guarantees.
The components of lease expense for the yearyears ended December 31, 20192022 and 2021 are as follows (in thousands):
|
|
|
|
|
|
| ||||||||||||
|
| Location in Statements of |
| Year Ended |
| |||||||||||||
| | | | | | | | | | | | | ||||||
| | Location in Statements of | | Year Ended December 31, | | |||||||||||||
Description |
| Comprehensive Income (Loss) |
| December 31, 2019 |
|
| Comprehensive Income (Loss) |
| 2022 |
| 2021 |
| 2020 |
| ||||
Amortization of ROU assets - finance leases |
| Depreciation and amortization |
| $ | 7,157 |
| | Depreciation and amortization | | $ | 3,785 | | $ | 6,674 | | $ | 7,661 | |
Interest on lease liabilities - finance leases |
| Interest expense |
|
| 141 |
| | Interest expense | | | 79 | | | 136 | | | 203 |
|
Operating lease cost (cost resulting from lease payments) |
| Cost of services |
|
| 47,269 |
| | Cost of services | |
| 34,786 | |
| 39,087 | |
| 46,375 | |
Operating lease cost (cost resulting from lease payments) |
| Selling, general and administrative |
|
| 3,731 |
| | Selling, general and administrative | | | 2,524 | | | 2,770 | | | 2,040 | |
Operating lease cost (cost resulting from lease payments) |
| Other income (expense), net |
|
| 968 |
| | Restructuring | | | 925 | | | 1,614 | | | 1,232 | |
Operating lease cost | | Impairment | | | 4,821 | | | 5,338 | | | 5,127 | | ||||||
Operating lease cost (cost resulting from lease payments) | | Other income (expense), net | | | 1,298 | | | 1,240 | | | 1,149 | | ||||||
Short-term lease cost |
| Cost of services |
|
| 4,338 |
| | Cost of services | |
| 3,428 | |
| 4,529 | |
| 3,888 | |
Variable lease cost (cost excluded from lease payments | | Cost of services | | | 1,320 | | | 1,246 | | | (287) | | ||||||
Less: Sublease income |
| Selling, general and administrative |
|
| (445) |
| | Selling, general and administrative | | | (710) | | | (807) | | | (836) | |
Less: Sublease income |
| Other income (expense), net |
|
| (1,984) |
| | Other income (expense), net | |
| (2,748) | |
| (2,584) | |
| (2,464) | |
Total lease cost |
|
|
| $ | 61,175 |
| | | | $ | 49,508 |
| $ | 59,243 |
| $ | 64,088 | |
Other supplementary information for the yearyears ended December 31, 20192022 and 2021 are as follows (dollar values in thousands):
|
|
|
|
| ||||||||||
|
| Year Ended |
| |||||||||||
|
| December 31, 2019 |
| |||||||||||
| | | | | | | | | | | ||||
| | Year Ended December 31, | | |||||||||||
|
| 2022 |
| 2021 |
| 2020 |
| |||||||
Finance lease - operating cash flows |
| $ | 103 |
| | $ | 26 | | $ | 45 | | $ | 68 | |
Finance lease - financing cash flows |
| $ | 10,251 |
| | $ | 3,087 | | $ | 6,385 | | $ | 7,911 | |
Operating lease - operating cash flows (fixed payments) |
| $ | 51,898 |
| | $ | 51,693 | | $ | 52,358 | | $ | 55,862 | |
New ROU assets - operating leases |
| $ | 15,494 |
| | $ | 36,040 | | $ | 15,280 | | $ | 6,834 | |
Modified ROU assets - operating leases |
| $ | 46,543 |
| | $ | 10,629 | | $ | 736 | | $ | 6,485 | |
New ROU assets - finance leases |
| $ | 6,133 |
| | $ | 483 | | $ | 1,141 | | $ | 2,292 | |
| ||||
|
| |||
|
| |||
| ||||
| ||||
| | | | | | | | | | |
| | December 31, 2022 | | December 31, 2021 | | December 31, 2020 | | |||
Weighted average remaining lease term - finance leases | | | 1.87 years | | | 2.34 years | | | 2.46 years | |
Weighted average remaining lease term - operating leases | | | 4.06 years | | | 3.32 years | | | 3.73 years | |
Weighted average discount rate - finance leases | | | 2.07% | | | 1.85% | | | 1.64% | |
Weighted average discount rate - operating leases | | | 4.91% | | | 5.38% | | | 6.95% | |
F-43F-42
Operating and financing lease right-of-use assets and lease liabilities within our Consolidated Balance Sheet as of December 31, 20192022 and January 1, 2019 (date of adoption of ASU 842)2021 are as follows (in thousands):
|
|
|
|
|
|
|
|
| ||||||||
|
|
|
|
|
| January 1, 2019 |
| |||||||||
| | | | | | | | | ||||||||
Description | Location in Balance Sheet |
| December 31, 2019 |
| (date of adoption) |
| Location in Balance Sheet | | December 31, 2022 | | December 31, 2021 |
| ||||
Assets |
|
|
|
|
|
|
|
| | | | | | | | |
Operating lease assets | Operating lease assets |
| $ | 150,808 |
| $ | 129,894 |
| Operating lease assets | | $ | 92,431 | | $ | 90,180 | |
Finance lease assets | Property, plant and equipment, net |
|
| 18,016 |
|
| 18,261 |
| Property, plant and equipment, net | |
| 3,814 | |
| 7,119 | |
Total leased assets |
|
| $ | 168,824 |
| $ | 148,155 |
| | | $ | 96,245 | | $ | 97,299 | |
|
|
|
|
|
|
|
|
| ||||||||
| | | | | | | | | ||||||||
Liabilities |
|
|
|
|
|
|
|
| | | | | | | | |
Current |
|
|
|
|
|
|
|
| | | | | | | | |
Operating | Current operating lease liabilities |
| $ | 45,218 |
| $ | 35,535 |
| Current operating lease liabilities | | $ | 35,271 | | $ | 44,460 | |
Finance | Other current liabilities |
|
| 7,470 |
|
| 8,770 |
| Other current liabilities | | | 2,056 | | | 3,001 | |
Non-current |
|
|
|
|
|
|
|
| | | | | | | | |
Operating | Non-current operating lease liabilities |
|
| 127,395 |
|
| 112,754 |
| Non-current operating lease liabilities | | | 69,575 | | | 64,419 | |
Finance | Other long-term liabilities |
|
| 8,896 |
|
| 10,765 |
| Other long-term liabilities | | | 1,257 | | | 2,866 | |
Total lease liabilities |
|
| $ | 188,979 |
| $ | 167,824 |
| | | $ | 108,159 | | $ | 114,746 | |
The future minimum operating lease and finance lease payments required under non-cancelable leases as of December 31, 20192022 and 2021 are as follows (in thousands):
|
|
|
|
|
|
|
|
|
|
|
|
| Operating |
| Sub-lease |
| Finance |
| |||
|
| Leases |
| Income |
| Leases |
| |||
Year 1 |
| $ | 54,903 |
| $ | (2,976) |
| $ | 7,594 |
|
Year 2 |
|
| 47,892 |
|
| (621) |
|
| 5,587 |
|
Year 3 |
|
| 43,590 |
|
| (345) |
|
| 2,139 |
|
Year 4 |
|
| 28,124 |
|
| (201) |
|
| 1,109 |
|
Year 5 |
|
| 14,494 |
|
| — |
|
| 331 |
|
Thereafter |
|
| 14,734 |
|
| — |
|
| — |
|
Total minimum lease payments |
| $ | 203,737 |
| $ | (4,143) |
| $ | 16,760 |
|
Less imputed interest |
|
| (31,124) |
|
|
|
|
| (394) |
|
Total lease liability |
| $ | 172,613 |
|
|
|
| $ | 16,366 |
|
The future minimum rental and capital lease payments under non-cancelable leases as of December 31, 2018 are as follows (in thousands):2022
| | | | | | | | | | |
|
| Operating |
| Sub-lease |
| Finance |
| |||
| | Leases | | Income | | Leases |
| |||
Year 1 | | $ | 38,783 | | $ | (3,527) | | $ | 2,071 | |
Year 2 | |
| 26,789 | |
| (2,940) | |
| 1,020 | |
Year 3 | |
| 18,229 | |
| (2,940) | |
| 268 | |
Year 4 | |
| 12,906 | |
| (490) | |
| 14 | |
Year 5 | |
| 9,749 | |
| — | |
| — | |
Thereafter | |
| 10,320 | |
| — | |
| — | |
Total minimum lease payments | | $ | 116,776 | | $ | (9,897) | | $ | 3,373 | |
Less imputed interest | | | (11,930) | | | | | | (60) | |
Total lease liability | | $ | 104,846 | | | | | $ | 3,313 | |
December 31, 2021
| | | | | | | | | | |
|
| Operating |
| Sub-lease |
| Finance |
| |||
| | Leases | | Income | | Leases |
| |||
Year 1 | | $ | 48,559 | | $ | (3,465) | | $ | 3,026 | |
Year 2 | |
| 32,054 | |
| (3,112) | |
| 1,921 | |
Year 3 | |
| 18,862 | |
| (2,905) | |
| 870 | |
Year 4 | |
| 10,162 | |
| (2,940) | |
| 164 | |
Year 5 | |
| 3,508 | |
| (490) | |
| — | |
Thereafter | |
| 6,759 | |
| — | |
| — | |
Total minimum lease payments | | $ | 119,904 | | $ | (12,912) | | $ | 5,981 | |
Less imputed interest | | | (11,025) | | | | | | (114) | |
Total lease liability | | $ | 108,879 | | | | | $ | 5,867 | |
|
|
|
|
|
|
|
|
|
|
|
|
| Operating |
| Sub-lease |
| Capital |
| |||
|
| Leases |
| Income |
| Leases |
| |||
Year 1 |
| $ | 47,379 |
| $ | (2,624) |
| $ | 8,770 |
|
Year 2 |
|
| 36,045 |
|
| (2,631) |
|
| 5,548 |
|
Year 3 |
|
| 30,678 |
|
| (276) |
|
| 3,798 |
|
Year 4 |
|
| 26,584 |
|
| — |
|
| 1,005 |
|
Year 5 |
|
| 17,226 |
|
| — |
|
| 414 |
|
Thereafter |
|
| 25,362 |
|
| — |
|
| — |
|
Total minimum lease payments |
| $ | 183,274 |
| $ | (5,531) |
| $ | 19,535 |
|
Less imputed interest |
|
|
|
|
|
|
|
| — |
|
Total lease liability |
|
|
|
|
|
|
| $ | 19,535 |
|
F-43
In 2008, the Company sub-leased one of its customer engagement centers to a third party for the remaining term of the original lease. The sub-lease began on January 1, 2009 and rental income is recognized on a straight-line basis over the term of the sub-lease through 2021.2026. In 2017, the Company sub-leased one of its office spaces for the remaining term of the original lease. The sub-lease began on November 6, 2017 and endsended on May 31, 2021. In 2019, the Company sub-leased one of its office spaces for the remaining term of the original lease. The sub-lease began on March 1, 2019 and ends July 31,21, 2023.
F-44
TTEC HOLDINGS, INC. AND SUBSIDIARIES
Notes toIn 2020, the Consolidated Financial Statements
Asset Retirement Obligations
The Company records asset retirement obligations (“ARO”) for severalsub-leased one of its customer engagement center leases. Capitalized costs related to ARO’s are included in Other long-term assets inoffice spaces for the accompanying Consolidated Balance Sheets while the ARO liability is included in Other long-term liabilities in the accompanying Consolidated Balance Sheets. Following is a summaryremaining term of the amounts recorded (in thousands):original lease. The sub-lease began on February 6, 2020 and ends on June 14, 2023. In 2022, the Company sub-leased one of its office spaces for the majority of the remaining term of the original lease. The sub-lease began on June 29, 2022 and ends January 31, 2024.
|
|
|
|
|
|
|
|
|
|
|
|
|
|
|
|
|
|
| Balance at |
|
|
|
|
|
|
|
|
|
| Balance at |
| ||
|
| December 31, |
| Additions and |
|
|
|
|
|
|
| December 31, |
| |||
|
| 2018 |
| Modifications |
| Accretion |
| Settlements |
| 2019 |
| |||||
|
|
|
|
|
|
|
|
|
|
|
|
|
|
|
|
|
ARO liability total |
| $ | 2,482 |
| $ | 788 |
| $ | 26 |
| $ | (292) |
| $ | 3,004 |
|
|
|
|
|
|
|
|
|
|
|
|
|
|
|
|
|
|
|
| Balance at |
|
|
|
|
|
|
|
|
|
| Balance at |
| ||
|
| December 31, |
| Additions and |
|
|
|
|
|
|
| December 31, |
| |||
|
| 2017 |
| Modifications |
| Accretion |
| Settlements |
| 2018 |
| |||||
|
|
|
|
|
|
|
|
|
|
|
|
|
|
|
|
|
ARO liability total |
| $ | 1,938 |
| $ | 1,153 |
| $ | 14 |
| $ | (623) |
| $ | 2,482 |
|
Increases to ARO result from a new lease agreement or modifications on an ARO from a preexisting lease agreement. Modifications to ARO liabilities and accumulated accretion occur when lease agreements are amended or when assumptions change, such as the rate of inflation. Modifications are accounted for prospectively as changes in estimates. Settlements occur when leased premises are vacated and the actual cost of restoration is paid. Differences between the actual costs of restoration and the balance recorded as ARO liabilities are recognized as gains or losses in the accompanying Consolidated Statements of Comprehensive Income (Loss).
(16) OTHER LONG-TERM LIABILITIES
The components of Other long-term liabilities as of December 31, 20192022 and 20182021 are as follows (in thousands):
|
|
|
|
|
|
| ||||||||||
|
|
| December 31, 2019 |
| December 31, 2018 |
| ||||||||||
|
|
|
|
|
|
| ||||||||||
| | | | | | | | |||||||||
| | | December 31, 2022 |
| December 31, 2021 | | ||||||||||
| | | | | | | | |||||||||
Deferred revenue |
|
| $ | 23,142 |
| $ | 33,247 |
| | | $ | 5,760 |
| $ | 17,078 | |
Deferred compensation plan |
|
|
| 20,370 |
| 14,836 |
| | | | 25,889 | | 30,012 | | ||
Payable for remaining portion of acquisition |
|
|
| — |
| 37,756 |
| |||||||||
Other |
|
|
| 36,129 |
|
| 40,693 |
| | |
| 34,655 | |
| 32,737 | |
Total |
|
| $ | 79,641 |
| $ | 126,532 |
| | | $ | 66,304 |
| $ | 79,827 | |
F-45F-44
(17)ACCUMULATED OTHER COMPREHENSIVE INCOME (LOSS)
The following table presents changes in the accumulated balance for each component of Other comprehensive income (loss), including current period other comprehensive income (loss) and reclassifications out of accumulated other comprehensive income (loss) (in thousands):
| | | | | | | | | | | | | |
|
| Foreign |
| | |
| | |
| | |
| |
| | Currency | | Derivative | | | | | | |
| ||
| | Translation | | Valuation, Net | | Other, Net | | | |
| |||
| | Adjustment | | of Tax | | of Tax | | Totals |
| ||||
| | | | | | | | | | | | | |
Accumulated other comprehensive income (loss) at December 31, 2019 | | $ | (107,480) | | $ | 4,182 | | $ | (2,936) | | $ | (106,234) | |
| | | | | | | | | | | | | |
Other comprehensive income (loss) before reclassifications | |
| 9,722 | |
| 2,321 | |
| 1,016 | |
| 13,059 | |
Amounts reclassified from accumulated other comprehensive income (loss) | |
| 19,619 | |
| 1,928 | |
| (528) | |
| 21,019 | |
Net current period other comprehensive (income) loss | |
| 29,341 | |
| 4,249 | |
| 488 | |
| 34,078 | |
| | | | | | | | | | | | | |
Accumulated other comprehensive income (loss) at December 31, 2020 | | $ | (78,139) | | $ | 8,431 | | $ | (2,448) | | $ | (72,156) | |
| | | | | | | | | | | | | |
Accumulated other comprehensive income (loss) at December 31, 2020 | | $ | (78,139) |
| $ | 8,431 |
| $ | (2,448) |
| $ | (72,156) | |
| | | | | | | | | | | | | |
Other comprehensive income (loss) before reclassifications | |
| (17,408) | |
| (12,126) | |
| (103) | |
| (29,637) | |
Amounts reclassified from accumulated other comprehensive income (loss) | |
| — | |
| 3,655 | |
| (288) | |
| 3,367 | |
Net current period other comprehensive income (loss) | |
| (17,408) | |
| (8,471) | |
| (391) | |
| (26,270) | |
| | | | | | | | | | | | | |
Accumulated other comprehensive income (loss) at December 31, 2021 | | $ | (95,547) |
| $ | (40) |
| $ | (2,839) |
| $ | (98,426) | |
| | | | | | | | | | | | | |
Accumulated other comprehensive income (loss) at December 31, 2021 | | $ | (95,547) |
| $ | (40) |
| $ | (2,839) |
| $ | (98,426) | |
| | | | | | | | | | | | | |
Other comprehensive income (loss) before reclassifications | |
| (28,187) | |
| 2,281 | |
| 455 | |
| (25,451) | |
Amounts reclassified from accumulated other comprehensive income (loss) | |
| — | |
| (2,152) | |
| (272) | |
| (2,424) | |
Net current period other comprehensive income (loss) | |
| (28,187) | |
| 129 | |
| 183 | |
| (27,875) | |
| | | | | | | | | | | | | |
Accumulated other comprehensive income (loss) at December 31, 2022 | | $ | (123,734) |
| $ | 89 |
| $ | (2,656) |
| $ | (126,301) | |
|
|
|
|
|
|
|
|
|
|
|
|
|
|
|
| Foreign |
|
|
|
|
|
|
|
|
|
| |
|
| Currency |
| Derivative |
|
|
|
|
|
|
| ||
|
| Translation |
| Valuation, Net |
| Other, Net |
|
|
|
| |||
|
| Adjustment |
| of Tax |
| of Tax |
| Totals |
| ||||
|
|
|
|
|
|
|
|
|
|
|
|
|
|
Accumulated other comprehensive income (loss) at December 31, 2016 |
| $ | (92,008) |
| $ | (32,393) |
| $ | (2,563) |
| $ | (126,964) |
|
|
|
|
|
|
|
|
|
|
|
|
|
|
|
Other comprehensive income (loss) before reclassifications |
|
| 7,908 |
|
| 31,053 |
|
| 575 |
|
| 39,536 |
|
Amounts reclassified from accumulated other comprehensive income (loss) |
|
| — |
|
| (14,406) |
|
| (470) |
|
| (14,876) |
|
Net current period other comprehensive (income) loss |
|
| 7,908 |
|
| 16,647 |
|
| 105 |
|
| 24,660 |
|
|
|
|
|
|
|
|
|
|
|
|
|
|
|
Accumulated other comprehensive income (loss) at December 31, 2017 |
| $ | (84,100) |
| $ | (15,746) |
| $ | (2,458) |
| $ | (102,304) |
|
|
|
|
|
|
|
|
|
|
|
|
|
|
|
Accumulated other comprehensive income (loss) at December 31, 2017 |
| $ | (84,100) |
| $ | (15,746) |
| $ | (2,458) |
| $ | (102,304) |
|
|
|
|
|
|
|
|
|
|
|
|
|
|
|
Other comprehensive income (loss) before reclassifications |
|
| (30,068) |
|
| 20,278 |
|
| 712 |
|
| (9,078) |
|
Amounts reclassified from accumulated other comprehensive income (loss) |
|
| — |
|
| ( 12,810) |
|
| (404) |
|
| (13,214) |
|
Net current period other comprehensive income (loss) |
|
| (30,068) |
|
| 7,468 |
|
| 308 |
|
| (22,292) |
|
|
|
|
|
|
|
|
|
|
|
|
|
|
|
Accumulated other comprehensive income (loss) at December 31, 2018 |
| $ | (114,168) |
| $ | (8,278) |
| $ | (2,150) |
| $ | (124,596) |
|
|
|
|
|
|
|
|
|
|
|
|
|
|
|
Accumulated other comprehensive income (loss) at December 31, 2018 |
| $ | (114,168) |
| $ | (8,278) |
| $ | (2,150) |
| $ | (124,596) |
|
|
|
|
|
|
|
|
|
|
|
|
|
|
|
Other comprehensive income (loss) before reclassifications |
|
| 6,688 |
|
| 15,545 |
|
| (588) |
|
| 21,645 |
|
Amounts reclassified from accumulated other comprehensive income (loss) |
|
| — |
|
| (3,085) |
|
| (198) |
|
| (3,283) |
|
Net current period other comprehensive income (loss) |
|
| 6,688 |
|
| 12,460 |
|
| (786) |
|
| 18,362 |
|
|
|
|
|
|
|
|
|
|
|
|
|
|
|
Accumulated other comprehensive income (loss) at December 31, 2019 |
| $ | (107,480) |
| $ | 4,182 |
| $ | (2,936) |
| $ | (106,234) |
|
F-46F-45
The following table presents the classification and amount of the reclassifications from Accumulated other comprehensive income (loss) to the Statement of Comprehensive Income (Loss) (in thousands):
|
|
|
|
|
|
|
|
|
|
|
|
| ||||||||||||
|
|
|
|
|
|
|
|
|
|
| Statement of |
| ||||||||||||
|
| For the Year Ended December 31, |
| Comprehensive Income |
| |||||||||||||||||||
|
| 2019 |
| 2018 |
| 2017 |
| (Loss) Classification |
| |||||||||||||||
|
|
|
|
|
|
|
|
|
|
|
|
| ||||||||||||
| | | | | | | | | | | | | ||||||||||||
| | | | | | | | | | | Statement of |
| ||||||||||||
| | For the Year Ended December 31, | | Comprehensive Income |
| |||||||||||||||||||
|
| 2022 |
| 2021 |
| 2020 |
| (Loss) Classification |
| |||||||||||||||
| | | | | | | | | | | | | ||||||||||||
Derivative valuation |
|
|
|
|
|
|
|
|
|
|
|
| | | | | | | | | | | | |
Loss on foreign currency forward exchange contracts |
| $ | (4,228) |
| $ | (17,548) |
| $ | (22,792) |
| Revenue |
| ||||||||||||
Loss on interest rate swaps |
|
| — |
|
| — |
|
| (115) |
| Interest expense |
| ||||||||||||
(Gain)/loss on foreign currency forward exchange contracts | | $ | (2,906) | | $ | 4,939 | | $ | 2,618 |
| Revenue | | ||||||||||||
Tax effect |
|
| 1,143 |
|
| 4,738 |
|
| 8,501 |
| Provision for income taxes |
| |
| 754 | |
| (1,284) | |
| (690) |
| Provision for income taxes | |
|
| $ | (3,085) |
| $ | (12,810) |
| $ | (14,406) |
| Net income (loss) |
| ||||||||||||
|
|
|
|
|
|
|
|
|
|
|
|
| ||||||||||||
| | $ | (2,152) | | $ | 3,655 | | $ | 1,928 |
| Net income (loss) | | ||||||||||||
| | | | | | | | | | | | | ||||||||||||
Other |
|
|
|
|
|
|
|
|
|
|
|
| | | | | | | | | | | | |
Actuarial loss on defined benefit plan |
| $ | (221) |
| $ | (446) |
| $ | (522) |
| Cost of services |
| | $ | (302) | | $ | (320) | | $ | (588) |
| Cost of services | |
Tax effect |
|
| 23 |
|
| 42 |
|
| 52 |
| Provision for income taxes |
| |
| 30 | |
| 32 | |
| 60 |
| Provision for income taxes | |
|
| $ | (198) |
| $ | (404) |
| $ | (470) |
| Net income (loss) |
| ||||||||||||
| | $ | (272) | | $ | (288) | | $ | (528) |
| Net income (loss) | | ||||||||||||
(18)NET INCOME PERWEIGHTED AVERAGE SHARE COUNTS
The following table sets forth the computation of basic and diluted shares for the periods indicated (in thousands):
|
|
|
|
|
|
|
| |||||||||
|
|
| Year Ended December 31, |
| ||||||||||||
|
| 2019 |
| 2018 |
| 2017 |
| |||||||||
|
|
|
|
|
|
|
| |||||||||
| | | | | | | | |||||||||
| | | Year Ended December 31, |
| ||||||||||||
|
| 2022 |
| 2021 |
| 2020 |
| |||||||||
| | | | | | | | | ||||||||
Shares used in basic earnings per share calculation |
| 46,373 |
| 46,064 |
| 45,826 |
| |
| 47,121 |
| 46,890 |
| 46,647 | | |
Effect of dilutive securities: |
|
|
|
|
|
|
|
| | | | | | | | |
Stock options |
|
| — |
| 6 |
| 10 |
| ||||||||
Restricted stock units |
|
| 349 |
| 314 |
| 536 |
| |
| 205 |
| 468 |
| 318 | |
Performance-based restricted stock units |
|
| 36 |
| 1 |
| 10 |
| |
| 9 |
| 28 |
| 28 | |
Total effects of dilutive securities |
|
| 385 |
| 321 |
| 556 |
| |
| 214 |
| 496 |
| 346 | |
Shares used in dilutive earnings per share calculation |
| 46,758 |
| 46,385 |
| 46,382 |
| |
| 47,335 |
| 47,386 |
| 46,993 | | |
For the years ended December 31, 2019, 20182022, 2021 and 2017, there were no options to purchase shares of common stock or performance-based restricted stock that were outstanding but not included in the computation of diluted net income per share because the exercise price exceeded the value of the shares and the effect would have been anti-dilutive. For the years ended December 31, 2019, 2018 and 2017,2020, restricted stock units of 28462 thousand, 212124 thousand, and 218 thousand, respectively, were outstanding but not included in the computation of diluted net income per share because the effect would have been anti-dilutive.
(19)
Employee Benefit Plan
The Company currently has a 401(k) profit-sharing plan that allows participation by U.S. employees who have completed six months of service, as defined, and are 21 years of age or older. Participants may defer up to 75% of their gross pay, up to a maximum limit determined by U.S. federal law. Participants are also eligible for a matching contribution. The Company may from time to time, at its discretion, make a “matching contribution” based on the amount and rate of the elective deferrals. The Company determines how much, if any, it will contribute for each dollar of elective deferrals. Participants vest in matching contributions over a three-year period. Company matching contributions to the 401(k) plan(s) totaled $6.7$12.2 million, $5.2$10.8 million and $5.7$4.2 million for the years ended December 31, 2019, 20182022, 2021 and 2017,2020, respectively.
F-47F-46
Equity Compensation Plans
In May 2010, the Company adopted the TeleTech Holdings, Inc. 2010 Equity Incentive Plan, renamed TTEC Holdings, Inc. 2010 Incentive Plan in 2018 (the “2010 Plan”). An aggregate of 4.0 million shares of common stock has been reserved for issuance under the 2010 Plan, which permits the award of incentive stock options, non-qualified stock options, stock appreciation rights, shares of restricted common stock and RSUs. The 2010 Plan also provides for annual equity-based compensation grants to members of the Company’s Board of Directors. Options granted to employees generally vest over four to five years and have a contractual life of ten years. Options issued to Directors vest over one year and have a contractual life of ten years. As of December 31, 2019, a total of 4.0 million shares were authorized and 1.1 million shares were available for issuance under the 2010 Plan. The 2010 Plan expires in 2020 and additional shares cannot be issued under the plan starting March 30, 2020.
In February 2020, the Company adopted the TTEC Holdings, Inc., 2020 Equity Incentive Plan (the “2020 Plan”), which permits awards of incentive stock options, non-qualified stock options, stock appreciation rights, shares of restricted common stock, performance stock units and restricted stock units. The 2020 Plan will also provide for annual equity-based compensation grants to members of the Company’s Board of Directors. Options granted to employees under the 2020 Plan generally vest over three to five years and have a contractual life of ten years. Options issued to Directors vest over one year and have a contractual life of ten years. As part ofAt the 2020 Annual Stockholder Meeting, the Company plans to seekreceived shareholder approval for the 2020 Plan, including 4.0 million shares of common stock to be reserved for issuance under the Plan.
ForThe following table presents the total equity-based compensation expense (stock options and RSUs) for the years ended December 31, 2019, 2018,2022, 2021 and 2017, the Company recorded total equity-based compensation expense under all equity-based arrangements (stock options and RSUs) of $12.8 million, $12.1 million and $11.9 million, respectively. For 2019, 2018 and 2017, of the total compensation expense, $4.7 million, $4.7 million and $4.1 million was recognized in Cost of services and $8.1 million, $7.4 million and $7.8 million, was recognized in Selling, general and administrative in the Consolidated Statements of Comprehensive Income (Loss), respectively. For the years ended December 31, 2019, 2018, and 2017, the Company recognized a tax benefit under all equity-based arrangements (stock options and RSUs) of $4.2 million, $3.7 million and $6.8 million, respectively.2020 (in thousands):
| | | | | | | | | | |
| | Year Ended December 31, |
| |||||||
|
| 2022 | | 2021 | | 2020 |
| |||
| | | | | | | | | | |
Equity-based compensation expense recognized in Cost of services | | $ | 7,175 | | $ | 6,099 | | $ | 4,254 | |
Equity-based compensation expense recognized in Selling, general and administrative | | | 10,396 | | | 10,326 | | | 8,253 | |
Total equity-based compensation expense | | $ | 17,571 | | $ | 16,425 | | $ | 12,507 | |
| |
| | |
| | | | | |
Total tax benefit recognized | | $ | 5,512 | | $ | 8,673 | | $ | 3,471 | |
Restricted Stock Units
2017, 20182020, 2021 and 20192022 RSU Awards: The Company granted RSUs in 2017, 20182020, 2021 and 20192022 to new and existing employees that vest over four or five years. The Company also granted RSUs in 2017, 20182020, 2021 and 20192022 to members of the Board of Directors that vest over one year.
During 2015, the Company granted performance-based RSUs to an executive the amount of which is determinable based on a reporting segment of the Company achieving incremental operating income for each year from 2015-2017. During 2015 and 2016, based on operating income performance for reporting segment of the Company, approximately $0.4 million and $0.1 million of RSUs were earned. These RSUs were granted in March 2016 and March 2017, respectively, and will vest 12 months from the grant date. During 2017, the Company cancelled the 2017 performance grant.
Summary of RSUs: Settlement of the RSUs shall be made in shares of the Company’s common stock by delivery of one share of common stock for each RSU then being settled. The Company calculates the fair value for RSUs based on the closing price of the Company’s stock on the date of grant and records compensation expense over the vesting period using a straight-line method. The Company factors an estimated forfeiture rate in calculating compensation expense on RSUs and adjusts for actual forfeitures upon the vesting of each tranche of RSUs. The Company also factors in the present value of the estimated dividend payments that will have accrued as these RSUs are vesting.
The weighted average grant-date fair value of RSUs, including performance-based RSUs, granted during the years ended December 31, 2019, 2018,2022, 2021, and 20172020 was $40.10, $35.15,$65.36, $96.47, and $29.56,$44.70, respectively. The total intrinsic value and fair value of RSUs vested during the years ended December 31, 2019, 2018,2022, 2021, and 20172020 was $12.5$18.4 million, $12.5$14.2 million, and $10.6$11.5 million, respectively.
F-48
Performance Based Restricted Stock Unit Grants
During the quarter ended June 30, 2019, the Company awarded performance restricted stock units (“PRSUs”) that were subject to service and performance vesting conditions. If defined minimum targets were met, the annual value of the PRSUs issued would be between $0.4 million and $1.4 million and vest immediately. If the defined minimum targets were not met, then no shares would be issued. The award amounts were based on the Company’s annual adjusted operating income for the fiscal years 2019, 2020 and 2021. Each fiscal year’s adjusted operating income determined the award amount. The Company recognized compensation expense related to the 2019 PRSUs of $1.1 million and $1.1 million for the years ended December 31, 2021 and 2020, respectively.
F-47
During 2020, the Company awarded PRSUs that are subject to service and performance vesting conditions. If defined minimum targets are met, the annual value of the PRSUs issued will be between $0.4$0.2 million and $1.4$2.0 million and vest immediately. If the defined minimum targets are not met, then no shares will be issued. The award amountsnumber of shares awarded are based on the Company’s annual revenue and adjusted operating income for the fiscal years 2019, 20202021 and 2021.2022. Each fiscal year’s revenue and adjusted operating income will determine the award amount. The Company recognized compensation expense related to the 2020 PRSUs of $1.4$1.2 million and $1.6 million for the year ended December 31, 2019.2022 and 2021, respectively.
During 2021, the Company awarded PRSUs that are subject to service and performance vesting conditions. If defined minimum targets are met, the annual value of the PRSUs issued will be between $1.2 million and $4.9 million and vest immediately in 2024. If the defined minimum targets are not met, then no shares will be issued. The number of shares that will be awarded will be based on the Company's annual revenue and adjusted operating income for the fiscal year 2023. Expense for these awards will begin at the start of the requisite service period, beginning January 1, 2023.
During 2022, the Company made awards of two different PRSU programs that are subject to service and performance vesting conditions: ordinary course annual PRSUs and one-time stretch financial goals PRSUs. For the ordinary course annual PRSUs, if defined minimum targets are met, the annual value of the PRSUs issued will be between $0.9 million and $3.5 million and vest immediately in March 2025. If the defined minimum targets are not met, then no shares will be issued. The number of shares that will be awarded will be based on the Company’s annual revenue and adjusted EBITDA for the fiscal year 2024. For the one-time stretch financial goals PRSUs, if defined minimum targets at TTEC Engage and TTEC Digital business segments’ levels are met, the number of shares of PRSUs issued will be between 0.0 million shares and 0.5 million shares and will vest immediately in March 2026. If the defined minimum targets are not met, then no shares will be issued. The number of shares to be awarded will be based on the TTEC Engage and TTEC Digital business segments’ annual revenue and adjusted EBITDA for the fiscal year 2025. Expense for these awards will begin at the start of the requisite service periods, beginning January 1, 2024 and January 1, 2025, respectively.
A summary of the status of the Company’s non-vested RSUs and performance-based RSUsPRSUs and activity for the year ended December 31, 20192022 is as follows:
|
|
|
|
|
|
| ||||||
|
|
|
| Weighted |
| |||||||
|
|
|
| Average |
| |||||||
|
|
|
| Grant Date |
| |||||||
|
| Shares |
| Fair Value |
| |||||||
|
|
|
|
|
|
| ||||||
Unvested as of December 31, 2018 |
| 1,141,438 |
| $ | 30.78 |
| ||||||
| | | | | | | ||||||
|
| |
| Weighted |
| |||||||
| | | | Average |
| |||||||
| | | | Grant Date |
| |||||||
| | Shares | | Fair Value |
| |||||||
| | | | | | | ||||||
Unvested as of December 31, 2021 |
| 885,612 | | $ | 61.73 | | ||||||
Granted |
| 150,070 |
| $ | 40.10 |
|
| 1,120,176 | | $ | 65.36 | |
Vested |
| (425,456) |
| $ | 29.41 |
|
| (320,593) | | $ | 55.17 | |
Cancellations/expirations |
| (97,580) |
| $ | 32.72 |
|
| (326,472) | | $ | 65.80 | |
Unvested as of December 31, 2019 |
| 768,472 |
| $ | 33.11 |
| ||||||
Unvested as of December 31, 2022 |
| 1,358,723 | | $ | 65.37 | | ||||||
All RSUs vested during the year ended December 31, 20192022 were issued out of treasury stock. As of December 31, 2019,2022, there was approximately $16.5$42.2 million of total unrecognized compensation expense and approximately $30.4$60.0 million in total intrinsic value related to non-vested RSU grants. The unrecognized compensation expense will be recognized over the remaining weighted-average vesting period of 1.32.1 years using the straight-line method.
Stock Options
There were no stock options granted during 2019, 2018 or 2017. The total intrinsic value of options exercised during the years ended December 31, 2019, 2018 and 2017 was zero, $156 thousand and $194 thousand, respectively. The total fair value of stock options vested during the years ended December 31, 2019, 2018 and 2017 was zero, respectively.
Cash received from option exercises under the Plans for the years ended December 31, 2019, 2018 and 2017 was zero, $0.2 million and $2.1 million, respectively. The recognized tax benefit from option exercises for the years ended December 31, 2019, 2018 and 2017 was zero, $0.0 million and $0.0 million, respectively.
Stock Repurchase Program
The Company has a stock repurchase program, which was initially authorized by the Company’s Board of Directors in November 2001.2001, and is accounted for using the cash method. As of December 31, 2019,2022, the cumulative authorized repurchase allowance was $762.3 million. During the year ended December 31, 2019,2022, the Company purchased no additional shares. Since inception of the program, the Company has purchased 46.1 million shares for $735.8 million. As of December 31, 2019,2022, the remaining allowance under the program was approximately $26.6 million. For the period from January 1, 20192023 through February 28, 2020,22, 2023, the Company did not purchase any additional shares. The stock repurchase program does not have an expiration date.
F-49F-48
(21)
The Company entered into an agreement under which Avion, LLC (“Avion”) and Airmax LLC (“Airmax”) provide certain aviation flight services as requested by the Company. Such services include the use of an aircraft and flight crew. Kenneth D. Tuchman, Chairman and Chief Executive Officer of the Company, has a directan indirect 100% beneficial ownership interest in Avion and Airmax. During 2019, 20182022, 2021 and 2017,2020, the Company expensed $1.1$0.5 million, $1.1$0.6 million and $1.1$0.4 million, respectively, to Avion and Airmax for services provided to the Company. There was $200$111 thousand in payments due and outstanding to Avion and Airmax as of December 31, 2019.
During 2014, the Company entered into a vendor contract with Convercent Inc. to provide learning management and web and telephony based global helpline solutions. This contract was renewed, after an arms-length market pricing review, in the fourth quarter of 2019. A minority owner of Convercent is a company which is owned and controlled by Kenneth D. Tuchman, Chairman and Chief Executive Officer of the Company. During 2019, 2018 and 2017, the Company expensed $60 thousand, $60 thousand and $70 thousand, respectively, to Convercent.
During 2015, the Company entered into a contract to purchase software from CaféX, in which the Company holds a 17.8% equity investment. During 2019, 2018 and 2017, the Company purchased $50 thousand, $61 thousand and $72 thousand, respectively, of software from CaféX. See Note 2 for further information regarding this investment. 2022.
Ms. Regina M. Paolillo, former Global Chief Financial and AdministrativeOperating Officer of the Company, iswas a member of the board of directors of Welltok, Inc., a consumer health SaaS company, and partner of the Company in athe TTEC Welltok joint venture. During the years ended December 31, 2019, 20182022, 2021 and 2017,2020, the Company recorded revenue of $5.3$0.5 million, $5.7$1.5 million and $5.5$3.0 million, respectively, in connection with work performed through the joint venture.
(22)OTHER FINANCIAL INFORMATION
Self-insurance liabilities As of December 2021, Ms. Paolillo is no longer a member of the board of directors and the joint venture has been wound down, but TTEC continues to service revenue for Welltok, Inc.
Ms. Paolillo is a member of the board of directors of Unisys (NYSE: UIS), a global information technology company. During the years ended December 31, 2022 and 2021, the Company which are includedrecorded revenue of $0.1 million and $0.4 million, respectively, in Accrued employee compensationconnection with services performed for Unisys.
Ms. Paolillo is a member of the board of directors of Alight (NYSE: ALIT), a provider of digital human capital and benefitsbusiness solutions. Starting in November 2022, the Company engaged Alight to provide certain benefit communication and Other accrued expenses in the accompanying Consolidated Balance Sheets were as follows (in thousands):
|
|
|
|
|
|
|
|
|
| December 31, |
| ||||
|
| 2019 |
| 2018 |
| ||
Employee health and dental insurance |
| $ | 5,871 |
| $ | 3,987 |
|
Workers compensation |
|
| 1,791 |
|
| 1,802 |
|
Total self-insurance liabilities |
| $ | 7,662 |
| $ | 5,789 |
|
F-50
(23)QUARTERLY FINANCIAL DATA (UNAUDITED)
The following tables present certain quarterly financial data forenrollment services. During the year ended December 31, 2019 (in thousands except per share amounts).
|
|
|
|
|
|
|
|
|
|
|
|
|
|
|
| First |
| Second |
| Third |
| Fourth |
| ||||
|
| Quarter |
| Quarter |
| Quarter |
| Quarter |
| ||||
|
|
|
|
|
|
|
|
|
|
|
|
|
|
Revenue |
| $ | 394,356 |
| $ | 392,515 |
| $ | 395,507 |
| $ | 461,326 |
|
Cost of services |
|
| 293,334 |
|
| 299,237 |
|
| 304,622 |
|
| 345,694 |
|
Selling, general and administrative |
|
| 49,720 |
|
| 50,864 |
|
| 48,062 |
|
| 53,894 |
|
Depreciation and amortization |
|
| 16,743 |
|
| 17,050 |
|
| 16,659 |
|
| 18,634 |
|
Restructuring and integration charges, net |
|
| 961 |
|
| 428 |
|
| 183 |
|
| 175 |
|
Impairment losses |
|
| 1,506 |
|
| 2,063 |
|
| — |
|
| 166 |
|
Income from operations |
|
| 32,092 |
|
| 22,873 |
|
| 25,981 |
|
| 42,763 |
|
Other income (expense) |
|
| (4,150) |
|
| (1,914) |
|
| (806) |
|
| (6,428) |
|
Provision for income taxes |
|
| (7,466) |
|
| (7,345) |
|
| (5,196) |
|
| (5,670) |
|
Non-controlling interest |
|
| (1,474) |
|
| (1,816) |
|
| (1,878) |
|
| (2,402) |
|
Net income attributable to TTEC stockholders |
| $ | 19,002 |
| $ | 11,798 |
| $ | 18,101 |
| $ | 28,263 |
|
|
|
|
|
|
|
|
|
|
|
|
|
|
|
Weighted average shares outstanding |
|
|
|
|
|
|
|
|
|
|
|
|
|
Basic |
|
| 46,203 |
|
| 46,318 |
|
| 46,481 |
|
| 46,487 |
|
Diluted |
|
| 46,590 |
|
| 46,684 |
|
| 46,768 |
|
| 46,831 |
|
|
|
|
|
|
|
|
|
|
|
|
|
|
|
Net income per share attributable to TTEC stockholders |
|
|
|
|
|
|
|
|
|
|
|
|
|
Basic |
| $ | 0.41 |
| $ | 0.25 |
| $ | 0.39 |
| $ | 0.61 |
|
Diluted |
| $ | 0.41 |
| $ | 0.25 |
| $ | 0.39 |
| $ | 0.60 |
|
2022, the Company did not expense anything related to Alight for services provided to the Company.
Included in Other income (expense) inMs. Michelle Swanback, President of the second quarterCompany, is a $2.4 million benefit relatedmember of the board of directors of WTW (NYSE: WTW) (fka “Willis Towers Watson”), that provides compensation consulting and insurance brokerage services to the fair value adjustment of contingent consideration for an acquisition.
Included in Other income (expense) in the third quarter is a $1.4 million benefit on recovery of receivables in connection with the consulting business that is being wound down and a $0.7 million benefit on the sale of trademarks.
Included in Other Income (expense) for each of the quarters is an interest expense charge related to the future purchase for the remaining 30% of the Motif acquisition - $1.3 million, $0.5 million, $0.8 million and $2.1 million in the first, second, third and fourth quarters, respectively.
Included in the Provision for Income Taxes is: a $0.2 million expense in the fourth quarter, a $0.2 million expense in the third quarter, a $0.1 million expense in the second quarter, and a $0.2 million expense in the first quarter related to changes in tax contingent liabilities; a $1.6 million benefit in the fourth quarter, a $0.2 million benefit in the third quarter, a $0.1 million benefit in the second quarter and a $0.1 million expense in the first quarter related to return to provision adjustments; a $2.8 million benefit in the fourth quarter related to tax rate changes; a $2.2 million expense in the fourth quarter, and a $2.3 million expense in the second quarter related to changes in valuation allowances; a $0.2 million benefit in the second quarter and a $0.7 million benefit in the first quarter related to restructuring charges; and a $0.1 million benefit in the fourth quarter, a $0.2 million expense in the third quarter, a $0.1 million expense in the second quarter, and a $0.1 million expense in the first quarter of other items. Without these items our effective tax rate forCompany. During the year ended December 31, 2019 would have been 22.9%. 2022, the Company expensed $1.7 million for these services.
F-51F-49
The following tables present certain quarterly financial data for the year ended December 31, 2018 (in thousands except per share amounts).
|
|
|
|
|
|
|
|
|
|
|
|
|
|
|
| First |
| Second |
| Third |
| Fourth |
| ||||
|
| Quarter |
| Quarter |
| Quarter |
| Quarter |
| ||||
|
|
|
|
|
|
|
|
|
|
|
|
|
|
Revenue |
| $ | 375,249 |
| $ | 349,853 |
| $ | 364,936 |
| $ | 419,133 |
|
Cost of services |
|
| 283,370 |
|
| 274,260 |
|
| 286,925 |
|
| 313,372 |
|
Selling, general and administrative |
|
| 47,045 |
|
| 44,245 |
|
| 43,321 |
|
| 47,817 |
|
Depreciation and amortization |
|
| 17,924 |
|
| 16,811 |
|
| 17,317 |
|
| 17,127 |
|
Restructuring and integration charges, net |
|
| 849 |
|
| 1,034 |
|
| 2,716 |
|
| 1,532 |
|
Impairment losses |
|
| 1,120 |
|
| — |
|
| — |
|
| 332 |
|
Income from operations |
|
| 24,941 |
|
| 13,503 |
|
| 14,657 |
|
| 38,953 |
|
Other income (expense) |
|
| (16,907) |
|
| (6,553) |
|
| (6,020) |
|
| (6,336) |
|
Provision for income taxes |
|
| (2,102) |
|
| (653) |
|
| (1,893) |
|
| (11,835) |
|
Non-controlling interest |
|
| (1,341) |
|
| (779) |
|
| (1,369) |
|
| (449) |
|
Net income (loss) attributable to TTEC stockholders |
| $ | 4,591 |
| $ | 5,518 |
| $ | 5,375 |
| $ | 20,333 |
|
|
|
|
|
|
|
|
|
|
|
|
|
|
|
Weighted average shares outstanding |
|
|
|
|
|
|
|
|
|
|
|
|
|
Basic |
|
| 45,871 |
|
| 46,016 |
|
| 46,172 |
|
| 46,193 |
|
Diluted |
|
| 46,452 |
|
| 46,401 |
|
| 46,316 |
|
| 46,390 |
|
|
|
|
|
|
|
|
|
|
|
|
|
|
|
Net income per share attributable to TTEC stockholders |
|
|
|
|
|
|
|
|
|
|
|
|
|
Basic |
| $ | 0.10 |
| $ | 0.12 |
| $ | 0.12 |
| $ | 0.44 |
|
Diluted |
| $ | 0.10 |
| $ | 0.12 |
| $ | 0.12 |
| $ | 0.44 |
|
Included in Other income (expense) in the first quarter is a $15.6 million expense related to the impairment of the full value of an equity investment and related bridge loan. Also included is a $0.7 million gain on the purchase of an acquisition.
Included in Other income (expense) in the second quarter and fourth quarter was a $2.0 million loss and a $0.4 million gain, respectively, related to a business unit which was classified as assets held for sale but subsequently reclassified to assets held and used.
Included in Other Income (expense) for each of the quarters is an interest expense charge related to the future purchase for the remaining 30% of the Motif acquisition - $1.9 million, $3.1 million, $3.0 million and $1.9 million in the first, second, third and fourth quarters, respectively.
Included in the Provision for Income Taxes is a $3.6 million expense in the fourth quarter, a $1.1 million benefit in the third quarter, a $1.0 million benefit in the second quarter related to changes in tax contingent liabilities, a $3.0 million benefit in the fourth quarter, a $0.2 million expense in the third quarter, a $0.5 million benefit in the second quarter related to return to provision adjustments, a $4.2 million benefit in the first quarter related to impairment of an equity investment, a $0.2 million expense in the first quarter, $0.1 million of expense in the second quarter, $0.1 million of expense in the third quarter and $0.1 million of expense in the fourth quarter related to the disposition of assets, a $1.5 million expense in the fourth quarter related to changes in valuation allowances, a $0.1 million benefit in the first quarter, a $0.2 million benefit in the second quarter and a $0.4 million benefit in the third quarter related to excess taxes on equity compensation, a $0.5 million benefit in the fourth quarter, a $0.7 million benefit in the third quarter, a $0.2 million benefit in the second quarter, a $0.6 million benefit in the first quarter related to restructuring charges, a $0.9 million benefit in the fourth quarter, $0.1 million of expense in the third quarter and a $0.2 million expense in the first quarter of other items. Without these items our effective tax rate for the year ended December 31, 2018 would have been 25.6%.
F-52