Table of Contents

UNITED STATES

SECURITIES AND EXCHANGE COMMISSION

Washington, D.C. 20549

Form 10-K

(Mark One)

ANNUAL REPORT PURSUANT TO SECTION 13 OR 15(d) OF THE SECURITIES EXCHANGE ACT OF 1934

For the Fiscal Year Ended June 30, 2020

or

TRANSITION REPORT PURSUANT TO SECTION 13 OR 15(d) OF THE SECURITIES EXCHANGE ACT OF 1934

For the Transition Period From toFiscal Year Ended December 31, 2022

Commission File Number 001-13357

Royal Gold, Inc.

(Exact Name of Registrant as Specified in Its Charter)

Delaware
(State or Other Jurisdiction of
Incorporation or Organization)

84-0835164
(I.R.S. Employer
Identification No.)

1144 15th Street, Suite 2500

Denver, Colorado
(Address of Principal Executive Offices)

80202
(Zip Code)

Registrant’s telephone number, including area code (303573-1660

Securities registered pursuant to Section 12(b) of the Act:

Title of Each Class

Trading Symbol

Name of the Exchange on which Registered

Common Stock, $0.01 par value

RGLD

Nasdaq Global Select Market

Securities registered pursuant to Section 12(g) of the Act: None

Indicate by check mark if the registrant is a well-known seasoned issuer, as defined in Rule 405 of the Securities Act. Yes  No 

Indicate by check mark if the registrant is not required to file reports pursuant to Section 13 or Section 15(d) of the Exchange Act. Yes  No 

Indicate by check mark whether the registrant (1) has filed all reports required to be filed by Section 13 or 15 (d) of the Securities Exchange Act of 1934 during the preceding 12 months (or for such shorter period that the registrant was required to file such reports), and (2) has been subject to such filing requirements for the past 90 days. Yes  No 

Indicate by check mark whether the registrant has submitted electronically every Interactive Data File required to be submitted pursuant to Rule 405 of Regulation S-T (§ 232.405 of this chapter) during the preceding 12 months (or for such shorter period that the registrant was required to submit such files). Yes  No 

Indicate by check mark whether the registrant is a large accelerated filer, an accelerated filer, a non-accelerated filer, smaller reporting company, or an emerging growth company. See the definitions of “large accelerated filer,” “accelerated filer,” “smaller reporting company,” and “emerging growth company” in Rule 12b-2 of the Exchange Act.

Large accelerated filer 

Accelerated filer 

Non-accelerated filer 

Smaller reporting company 

Emerging growth company 

If an emerging growth company, indicate by check mark if the registrant has elected not to use the extended transition period for complying with any new or revised financial accounting standards provided pursuant to Section 13(a) of the Exchange Act.  

Indicate by check mark whether the registrant has filed a report on and attestation to its management’s assessment of the effectiveness of its internal control over financial reporting under Section 404(b) of the Sarbanes-Oxley Act (15 U.S.C. 7262(b)) by the registered public accounting firm that prepared or issued its audit report.

If securities are registered pursuant to Section 12(b) of the Act, indicate by check mark whether the financial statements of the registrant included in the filing reflect the correction of an error to previously issued financial statements.  

Indicate by check mark whether any of those error corrections are restatements that required a recovery analysis of incentive-based compensation received by any of the registrant’s executive officers during the relevant recovery period pursuant to §240.10D-1(b).

Indicate by check mark whether the registrant is a shell company (as defined in Rule 12b-2 of the Exchange Act). Yes  No 

AggregateThe aggregate market value of theRoyal Gold voting common stock held by non-affiliates of the registrant, based uponon the closing sale price of Royal Gold common stock on December 31, 2019,June 30, 2022, as reported on the Nasdaq Global Select Market was $8.0$7 billion.

There were 65,591,04365,644,110 shares of Royal Gold common stock par value $0.01 per share, outstanding as of July 30, 2020.February 9, 2023.

DOCUMENTS INCORPORATED BY REFERENCE

Portions of the Proxy Statement for the 2020 Annual Meeting of Stockholders scheduled to be held on November 18, 2020, and to be filed within 120 days after June 30, 2020, are incorporatedCertain information required by reference into Part III, Items 10, 11, 12, 13, and 14 of this Annual Report onPart III of Form 10-K. is incorporated by reference from portions of Royal Gold’s definitive proxy statement relating to its 2023 annual meeting of stockholders to be filed within 120 days after December 31, 2022.

Table of Contents

INDEX

PAGE

PART I.

ITEM 1.

Business

23

ITEM 1A.

Risk Factors

710

ITEM 1B.

Unresolved Staff Comments

1519

ITEM 2.

Properties

1520

ITEM 3.

Legal Proceedings

2867

ITEM 4.

Mine Safety Disclosure

2867

PART II.

ITEM 5.

Market for Registrant’s Common Equity, Related Stockholder Matters and Issuer Purchases of Equity Securities

2867

ITEM 6.

Selected Financial DataReserved

2869

ITEM 7.

Management’s Discussion and Analysis of Financial Condition and Results of Operations

2969

ITEM 7A.

Quantitative and Qualitative Disclosures About Market Risk

3981

ITEM 8.

Financial Statements and Supplementary Data

4082

ITEM 9.

Changes in and Disagreements with Accountants on Accounting and Financial Disclosure

72116

ITEM 9A.

Controls and Procedures

72116

ITEM 9B.

Other Information

73117

ITEM 9C.

Disclosure Regarding Foreign Jurisdictions that Prevent Inspection

118

PART III.

ITEM 10.

Directors, Executive Officers and Corporate Governance

74118

ITEM 11.

Executive Compensation

74118

ITEM 12.

Security Ownership of Certain Beneficial Owners and Management and Related Stockholder Matters

74118

ITEM 13.

Certain Relationships and Related Transactions, and Director Independence

74118

ITEM 14.

Principal Accountant Fees and Services

74118

PART IV.

ITEM 15.

Exhibits and Financial Statement Schedules

74118

ITEM 16

Form 10-K Summary

80122

SIGNATURES

81123

12

Table of Contents

This report contains and incorporates by reference “forward-looking statements” within the meaning of U.S. federal securities laws. Forward-looking statements are made based on management’s current expectations and beliefs concerning future developments. Actual results may differ, possibly materially, from forward-looking statements due to various factors. For a discussion of some of these factors, see Item 1A Risk Factors, and Item 7 Management’s Discussion and Analysis of Financial Condition and Results of Operations (“MD&A”), of this report.

Royal Gold does not own, develop, or mine the properties on which it holds stream or royalty interests, except for our interest in the Peak Gold, LLC joint venture (“Peak Gold JV”).interests. Certain information provided in this Annual Report on Form 10-Kreport about operating properties in which we hold interests, including information about mineral reserves, mineral resources, historical production, production estimates, property descriptions, and property developments, was provided to us by the operators of those properties or is publicly available information filed by these operators with applicable securities regulatory bodies, including the Securities and Exchange Commission (the “SEC”). Royal Gold has not verified, and is not in a position to verify, and expressly disclaims any responsibility for the accuracy, completeness, or fairness of, suchthis third-party information and refers the reader to the public reports filed by the operators for information regarding those properties.

Unless the context otherwise requires, references to “Royal Gold,” the “Company,” “we,” “us,” and “our” refer to Royal Gold, Inc. and its consolidated subsidiariessubsidiaries.

PART I

ITEM 1.  BUSINESS

Change in Fiscal Year

On August 9, 2021, our board of directors approved a change in our fiscal year end from June 30 to December 31, effective as of December 31, 2021. As a result, this Annual Report on Form 10-K (this “Form 10-K”) includes financial information for the transition period from July 1, 2021, through December 31, 2021. Prior to the six months ended December 31, 2021, our fiscal year ended on June 30. References in this report to the “transition period” refer to the six-month period ended December 31, 2021. See Item 8, Note 17 to our Consolidated Financial Statements for further information.

Overview

We acquire and manage precious metal streams, royalties, and similar interests. We seek to acquire existing stream and royalty interests or to finance projects that are in production, development or in the developmentexploration stage in exchange for stream or royalty interests. Please refer to Item 2, Properties, for a discussion of the development at our principal properties.

We manage our business under two segments:

Acquisition and Management of Stream Interests—A metal stream is a purchase agreement that provides, in exchange for an upfront deposit payment, the right to purchase all or a portion of one or more metals produced from a mine, at a price determined for the life of the transaction by the purchase agreement. As of June 30, 2020, we owned seven stream interests, which are on six producing properties and two development stage properties. Our stream interests accounted for approximately 72% of our total revenue for each of the fiscal years ended June 30, 2020 and 2019. We expect stream interests to continue representing a significant portion of our total revenue.

Acquisition and Management of Royalty Interests—Royalties are non-operating interests in mining projects that provide the right to a percentage of revenue or metals produced from the project after deducting specified costs, if any. As of June 30, 2020, we owned royalty interests on 35 producing properties, 14 development stage properties and 130 exploration stage properties, of which we consider 49 to be evaluation stage projects. We use “evaluation stage” to describe exploration stage properties that contain mineralized material and on which operators are engaged in the search for reserves. Royalties accounted for approximately 28% of our total revenue for each of the fiscal years ended June 30, 2020 and 2019.

We do not conduct mining operations on the properties in which we hold stream and royalty interests. Except for our interest in the Peak Gold JV, weinterests and are generally not required to contribute to capital costs, exploration costs, environmental costs, or other operating costs on thosethe properties. Please refer to Item 2, Properties, for a discussion of the developments at our principal properties.

In the ordinary course of business, we engage in a continual review of opportunities to acquire existing stream and royalty interests, to establish new streamsstream and royalty interests on operating mines, to create new stream and royalty interests through the financing of mine development or exploration, or to acquire companies that hold stream and royalty interests. We currently, and generally at any time, have acquisition opportunities in various stages of active review, including, for example, our

2

Table of Contents

engagement of consultants and advisors to analyze particular opportunities, our analysis of technical, financial, legal and other confidential information of particular opportunities, submission of indications of interest and term sheets, participation in preliminary discussions and negotiations and involvement as a bidder in competitive processes.

As discussed in further detail throughout this report, some key highlights ofand developments for our business during fiscalfor the year 2020ended December 31, 2022 were as follows:

Our revenue increased 18%On December 29, 2022 we acquired two portions of a gross smelter return royalty that together cover a large area including the Cortez mine operational area and the entirety of the Fourmile development project in Nevada from certain holders who are successors in interest to $498.8Idaho Mining Corporation for cash consideration of $204.1 million. The two portions of the gross smelter return royalty are comprised of a 0.24% gross royalty that covers

3

Table of Contents

areas including the Pipeline and Crossroads deposits and a 0.45% gross royalty that covers areas including the Cortez Hills, Goldrush, Fourmile and Robertson deposits. These royalties are not subject to stepdowns or caps and have no applicable deductions.

On September 9, 2022, we completed the acquisition of all the issued and outstanding shares of Great Bear Royalties Corporation for cash consideration of approximately C$199.6 million compared(US$151.7 million). The sole material asset of Great Bear Royalties Corp. is a 2.0% net smelter royalty that covers the entirety of the Great Bear Project in the Red Lake district of Ontario, Canada, owned and operated by a subsidiary of Kinross Gold Corporation.

On August 1, 2022, we acquired a sliding scale gross royalty from Kennecott Royalty Company, a wholly owned subsidiary of Rio Tinto European Holdings Limited, on production from an area including the Cortez mine operational area, including the Pipeline, Crossroads, Cortez Hills and Goldrush deposits, and the Fourmile development project for cash consideration of $525 million. Based on information available, the royalty would not cover the existing Robertson deposits. At gold prices above $900 per ounce, the sliding scale gross royalty is an effective 1.2% gross royalty and is not subject to $423.1 million during fiscal 2019.any stepdowns or caps.
WeOn March 14, 2022, we made several key leadership changes dueour final advance payment toward the Khoemacau option stream which increased our right to retirements and used our management succession planningreceive payable silver produced from Khoemacau from 93% to fill those roles.100%.

We had revenue of $603.2 million for the year ended December 31, 2022, compared to $653.6 million for the comparable prior year period. This was an 8% decrease period over period.

We generated $417.3 million of net operating cash flow for the year ended December 31, 2022, compared to $461.9 million for the comparable prior year period. This was a 9.7% decrease period over period.

At December 31, 2022, we had $575 million outstanding under our $1.0 billion revolving credit facility and had cash and equivalents of $119 million.

We increased our calendar year dividend to $1.12$1.50 per basic share, which is paid in quarterly installments throughout calendar year 2020.2023. This represents a 6%7% increase compared with the dividend paid during calendar year 2019.2022.

Certain Definitions

Dollar or “$”: Refers to U.S. dollars. We refer to Canadian dollars as C$.

Development stage property. A property that has mineral reserves disclosed but no material extraction.

Exploration stage property: A property that has no mineral reserves disclosed.

Gold equivalent ounces (GEOs): GEOs are calculated as Royal Gold’s revenue divided by the average gold price for the period.period, with the gold price determined based on the LBMA Price.

Gross smelter return (GSR) royalty: A defined percentage of the gross revenue from a mineral resource extraction operation, less, if applicable, certain contract-defined costs paid by or charged to the operator.

Indicated mineral resource: That part of a mineral resource for which quantity and grade or quality are estimated on the basis of adequate geological evidence and sampling. The level of geological certainty associated with an indicated mineral resource is sufficient to allow a qualified person to apply modifying factors in sufficient detail to support mine planning and evaluation of the economic viability of the deposit. Because an indicated mineral resource has a lower level of confidence than the level of confidence of a measured mineral resource, an indicated mineral resource may only be converted to a probable mineral reserve.

4

Table of Contents

Inferred mineral resource: That part of a mineral resource for which quantity and grade or quality are estimated on the basis of limited geological evidence and sampling. The level of geological uncertainty associated with an inferred mineral resource is too high to apply relevant technical and economic factors likely to influence the prospects of economic extraction in a manner useful for evaluation of economic viability. Because an inferred mineral resource has the lowest level of geological confidence of all mineral resources, which prevents the application of the modifying factors in a manner useful for evaluation of economic viability, an inferred mineral resource may not be considered when assessing the economic viability of a mining project, and may not be converted to a mineral reserve.

LBMA Price: The London Bullion Market Association PM fixing prices in U.S. dollars for gold and daily fixing prices in U.S. dollars for silver.

LMEPrice: The London Metals Exchange settlement price for copper and other metals, as applicable.

Measured mineral resource: That part of a mineral resource for which quantity and grade or quality are estimated on the basis of conclusive geological evidence and sampling. The level of geological certainty associated with a measured mineral resource is sufficient to allow a qualified person to apply modifying factors, as defined in Subpart 1300 of Regulation S-K (“SK1300”), in sufficient detail to support detailed mine planning and final evaluation of the economic viability of the deposit. Because a measured mineral resource has a higher level of confidence than the level of confidence of either an indicated mineral resource or an inferred mineral resource, a measured mineral resource may be converted to a proven mineral reserve or to a probable mineral reserve.

Metal stream: A purchase agreement that provides, in exchange for an upfront deposit payment, the right to purchase all or a portion of one or more metals produced from a mine, at a price determined for the life of the transaction by the purchase agreement.

Mineral reserve: An estimate of tonnage and grade or quality of indicated and measured mineral resources that, in the opinion of the qualified person, can be the basis of an economically viable project. More specifically, it is the economically mineable part of a measured or indicated mineral resource, which includes diluting materials and allowances for losses that may occur when the material is mined or extracted.

Mineral resource: A concentration or occurrence of material of economic interest in or on the Earth's crust in such form, grade or quality, and quantity that there are reasonable prospects for economic extraction. A mineral resource is a reasonable estimate of mineralization, taking into account relevant factors such as cut-off grade, likely mining dimensions, location or continuity, that, with the assumed and justifiable technical and economic conditions, is likely to, in whole or in part, become economically extractable. It is not merely an inventory of all mineralization drilled or sampled.  

Mineralized material: ThatA term used for reporting historically that refers to that part of a mineral system that has potential economic significance but is not included in the proven and probable reserve estimates until further drilling and metallurgical work is completed, and until other economic and technical feasibility factors based on such work have been resolved.

Net smelter return (NSR) royalty: A defined percentage of the gross revenue from a resource extraction operation less a proportionate share of incidental transportation, insurance, refining and smelting costs.

Net value royalty (NVR): A defined percentage of the gross revenue from a resource extraction operation less certain contract-defined costs.

Probable reserves:mineral reserve: Reserves for which quantityThe economically mineable part of an indicated and, grade and/or quality are computed from information similar to that used for proven reserves, but the sites for inspection, sampling and measurement are farther apart or are otherwise less adequately spaced. The degreein some cases, a measured mineral resource.

Production stage property. A property with material extraction of assurance, although lower than that for proven reserves, is high enough to assume continuity between points of observation.mineral reserves.

Proven reserves:mineral reserve: Reserves for which (a) quantity is computedThe economically mineable part of a measured mineral resource that can only result from dimensions revealed in outcrops, trenches, workings or drill holes, grade and/or quality are computed from the resultsconversion of detailed sampling, and (b) the sites for inspection, sampling and measurement are spaced so closely and the geologic character is so well defined that size, shape, depth anda measured mineral contentresource.

5

Table of reserves are well established.Contents

Payable metal: Ounces or pounds of metal in concentrate after deduction of a percentage of metal in concentrate by a third-party smelter pursuant to smelting contracts.

3

Table of Contents

Reserve: That part of a mineral deposit that could be economically and legally extracted or produced at the time of the reserve determination.

Royalty: The right to receive a percentage or other denomination of mineral production from a mining operation.

Ton: A unit of weight equal to 2,000 pounds or 907.2 kilograms.

Tonne: A unit of weight equal to 2,204.6 pounds or 1,000 kilograms.

Fiscal 2020 Business Developments

Please refer to Item 7, MD&A, for discussion on recent liquidity and capital resource developments.

Alturas royalty acquisition

On January 29, 2020, we entered into an agreement with various private individuals for the acquisition of an NSR royalty of up to 1.06% (gold) and up to 1.59% (copper) on mining concessions included as part of the Alturas project, which is located within the Coquimbo Region of Chile and held by Compañia Minera Salitrales Limitada, a subsidiary of Barrick Gold Corporation (“Barrick”). Total consideration for the royalty is up to $41 million, of which $11 million was paid on January 29, 2020. A future payment of up to $20 million is conditioned based on a project construction decision by Barrick and the size of the minable mineralized material on the date of the construction decision. A further future payment of up to $10 million will be made upon first production from the mining concessions.  

Castelo de Sonhos royalty acquisition

In August 2019, we entered into an agreement with TriStar Gold Inc. and its subsidiaries (together “TriStar”) to acquire (i) up to a 1.5% NSR royalty on the Castelo de Sonhos gold project (“CDS”), located in Brazil, and (ii) warrants to purchase up to 19,640,000 common shares of TriStar. Total consideration was $7.5 million, of which $4.5 million was paid in August 2019, $1.5 million was paid in November 2019, and $1.5 million was paid in March 2020.

Aggregate funds we invested with TriStar will be used primarily to advance CDS to the feasibility stage, including advancing permitting activities. A preliminary economic assessment for CDS was prepared by TriStar in calendar 2018 and was based on a total of 2.0 million ounces of mineralized material at an average gold grade of approximately 1.0 gram per tonne. Since August 2019, TriStar has completed reverse circulation drilling, which will support the preparation of a preliminary feasibility study. Refer to Note 3 of our notes to consolidated financial statements for further discussion.

Covid-19 and current economic environment

Several of our operating counterparties previously announced temporary operational curtailments or the withdrawal or review of previously disclosed guidance due to the ongoing COVID-19 pandemic. The economic and societal impacts associated with COVID-19 are fluid and changing rapidly, and we are currently unable to predict the nature or extent of any impacts on our results of operations and financial condition. We will continue to monitor any further developments that the COVID-19 pandemic may have on stream or royalty interests as part of our regular asset impairment analysis.

Leadership changes

We made several key leadership changes as a result of our ongoing management succession planning. After a thorough search process, our Board of Directors appointed William Heissenbuttel as our President and Chief Executive Officer and a member of the Board of Directors, effective January 2, 2020. Mr. Heissenbuttel most recently served as our Chief Financial Officer and Vice President Strategy. In addition, the Board of Directors promoted the following executives effective January 2, 2020: Mark Isto, Executive Vice President and Chief Operating Officer; Paul Libner, Chief Financial Officer and Treasurer; and Randy Shefman, Vice President and General Counsel.

4

Table of Contents

Our Operational Information

Reportable Segments and Financial Information

We manage our business under two reportable segments, consisting of the acquisition and management of stream interests and the acquisition and management of royalty interests. Royal Gold’ssegments:

Acquisition and Management of Stream Interests — A metal stream is a purchase agreement that provides, in exchange for an upfront deposit payment, the right to purchase all or a portion of one or more metals produced from a mine, at a price determined for the life of the transaction by the purchase agreement. As of December 31, 2022, we owned nine stream interests, which are on eight production stage properties and one development stage property. Stream interests accounted for 69%, 66%, 69%, and 72% of our total revenue for the year ended December 31, 2022, six months ended December 31, 2021, and fiscal years ended June 30, 2021 and 2020, respectively. We expect stream interests to continue representing a significant portion of our total revenue.

Acquisition and Management of Royalty Interests — Royalties are non-operating interests in mining projects that provide the right to revenue or metals produced from the project after deducting specified costs, if any. As of December 31, 2022, we owned royalty interests on 32 production stage properties, 18 development stage properties and 123 exploration stage properties, of which we consider 52 to be evaluation stage projects. We use “evaluation stage” to describe exploration stage properties that contain mineral resources and on which operators are engaged in the search for reserves. Royalty interests accounted for 31%, 34%, 31%, and 28% of our total revenue for the year ended December 31, 2022, six months ended December 31, 2021, and fiscal years ended June 30, 2021 and 2020, respectively.

Our long-lived assets (stream and royalty interests, net) are geographically distributed as shown in the following table (amounts are in thousands):

As of June 30, 2020

As of June 30, 2019

As of December 31, 2022

As of December 31, 2021

Total stream

Total stream

Total stream

Total stream

Stream

Royalty

and royalty

Stream

Royalty

and royalty

Stream

Royalty

and royalty

Stream

Royalty

and royalty


interest


interest


interests, net


interest


interest


interests, net


interest


interest


interests, net


interest


interest


interests, net

Canada

$

702,732

$

189,855

$

892,587

$

767,749

$

200,251

$

968,000

$

511,957

$

620,549

$

1,132,506

$

579,326

$

412,419

$

991,745

Dominican Republic

406,469

406,469

451,585

451,585

320,867

320,867

350,083

350,083

Africa

299,722

321

300,043

297,569

321

297,890

Chile

277,661

223,922

501,583

301,507

214,226

515,733

236,312

224,116

460,428

249,147

224,116

473,263

Africa

215,463

321

215,784

89,556

321

89,877

United States

823,203

823,203

107,761

107,761

Mexico

75,951

75,951

83,748

83,748

50,156

50,156

60,977

60,977

United States

159,445

159,445

163,398

163,398

Australia

30,006

30,006

31,944

31,944

22,120

22,120

27,496

27,496

Rest of world

12,038

25,050

37,088

12,038

22,993

35,031

101,440

26,639

128,079

107,920

26,617

134,537

Total

$

1,614,363

$

704,550

$

2,318,913

$

1,622,435

$

716,881

$

2,339,316

$

1,470,298

$

1,767,104

$

3,237,402

$

1,584,045

$

859,707

$

2,443,752

6

Table of Contents

Our reportable segments for purposes of assessing performance for ourthe year ended December 31, 2022, six months ended December 31, 2021, and fiscal years ended June 30, 2021 and 2020, and 2019respectfully, are shown below (amounts are in thousands):

Year Ended June 30, 2020

Year Ended December 31, 2022


Revenue


Cost of sales (1)


Production taxes


Depletion (2)


Segment gross profit(3)


Revenue


Cost of sales(1)


Production taxes


Depletion(2)


Segment gross profit(3)

Stream interests

$

359,868

$

83,890

$

$

144,678

$

131,300

Canada

$

212,369

$

46,438

$

$

67,368

$

98,563

Dominican Republic

85,863

26,211

29,216

30,436

Africa

53,787

11,135

24,348

18,304

Chile

47,347

7,165

12,835

27,347

Rest of world

18,427

3,693

9,759

4,975

Total stream interests

417,793

94,642

143,526

179,625

Royalty interests

138,951

3,824

30,369

104,758

United States

$

81,642

$

$

4,131

$

13,966

$

63,545

Mexico

52,388

10,822

41,566

Canada

27,210

2,890

9,039

15,281

Australia

15,672

1,089

14,583

Africa

316

316

Rest of world

8,185

8,185

Total royalty interests

185,413

7,021

34,916

143,476

Total

$

498,819

$

83,890

$

3,824

$

175,047

$

236,058

$

603,206

$

94,642

$

7,021

$

178,442

$

323,101

Year Ended June 30, 2019

Six Months Ended December 31, 2021


Revenue


Cost of sales


Production taxes


Depletion


Segment gross profit


Revenue


Cost of sales(1)


Production taxes


Depletion(2)


Segment gross profit(3)

Stream interests

$

305,824

$

77,535

$

$

127,770

$

100,519

Canada

$

81,021

$

23,393

$

$

$

57,628

$

115,544

$

25,396

$

$

44,886

$

45,262

Dominican Republic

37,717

17,675

20,042

52,958

16,540

16,615

19,803

Chile

35,378

7,684

27,694

28,075

4,216

7,457

16,402

Africa

17,611

5,012

12,599

22,228

4,652

9,452

8,124

Rest of world

7,746

1,525

4,193

2,028

Total stream interests

171,727

53,764

-

117,963

226,551

52,329

82,603

91,619

Royalty interests

117,232

4,112

35,086

78,034

Canada

$

17,717

$

$

$

$-

$

17,717

United States

14,340

14,340

$

54,046

$

$

2,601

$

5,056

$

46,389

Mexico

15,833

15,833

31,858

5,890

25,968

Canada

13,756

1,811

5,208

6,737

Australia

6,217

6,217

11,174

621

10,553

Africa

1,024

1,024

1,107

1,107

Chile

$-

-

Rest of world

4,738

4,738

4,460

92

4,368

Total royalty interests

59,869

-

-

59,869

116,401

4,412

16,867

95,122

Total

$

423,056

$

77,535

$

4,112

$

162,856

$

178,553

$

342,952

$

52,329

$

4,412

$

99,470

$

186,741

7

Table of Contents

Fiscal Year Ended June 30, 2021


Revenue


Cost of sales(1)


Production taxes


Depletion(2)


Segment gross profit(3)

Stream interests

Canada

$

190,537

$

40,121

$

$

78,520

$

71,896

Dominican Republic

115,583

33,453

39,771

42,359

Chile

82,164

12,048

21,057

49,059

Africa

35,705

7,276

11,246

17,183

Total stream interests

423,989

92,898

150,594

180,497

Royalty interests

United States

$

68,611

$

$

3,482

$

5,938

$

59,191

Mexico

58,212

9,084

49,128

Canada

31,671

3,261

12,341

16,069

Australia

21,466

1,889

19,577

Africa

2,801

2,801

Rest of world

9,106

3,367

5,739

Total royalty interests

191,867

6,743

32,619

152,505

Total

$

615,856

$

92,898

$

6,743

$

183,213

$

333,002

Fiscal Year Ended June 30, 2020


Revenue


Cost of sales(1)


Production taxes


Depletion(2)


Segment gross profit(3)

Stream interests

Canada

$

158,736

$

39,257

$

$

65,017

$

54,462

Dominican Republic

96,978

27,882

45,115

23,981

Chile

74,219

10,878

23,846

39,495

Africa

29,935

5,873

10,700

13,362

Total stream interests

359,868

83,890

144,678

131,300

Royalty interests

United States

$

48,692

$

$

2,451

$

4,954

$

41,287

Mexico

32,731

7,797

24,934

Canada

30,524

1,373

10,397

18,754

Australia

15,252

���

1,939

13,313

Africa

2,575

2,575

Chile

Rest of world

9,177

5,282

3,895

Total royalty interests

138,951

3,824

30,369

104,758

Total

$

498,819

$

83,890

$

3,824

$

175,047

$

236,058

(1)Excludes depreciation, depletion and amortization.

5

Table of Contents

(2)Depletion amounts are included within Depreciation, depletion and amortization on our consolidated statements of operations and comprehensive income (loss).income.
(3)Refer to Note 1415 of our notes to consolidated financial statements for a reconciliation of total segment gross profit to consolidated income (loss) before income taxes.

Our financial results are primarily tied to the price of gold and, to a lesser extent, the prices of silver and copper, together with the amounts of production from our producing-stageproduction stage stream and royalty interests. During the fiscal year ended June 30, 2020,December 31, 2022, we derived approximately 88%84% of our revenue from precious metals (including 79%73% from gold and 9%11% from silver), 9%12% from copper, and 3%4% from other minerals. The prices of gold, silver, copper, and other metals have fluctuated widely in recent years. The marketability and the price of metals are influenced by numerous factors beyond our control. Significant declines in the prices of gold, silver, or copper could have a material adverse effect on our results of operations and financial condition.

8

Table of Contents

Competition

The mining industry in general, and streamingstream and royalty segments in particular, are very competitive. We compete with other streamingstream and royalty companies, mine operators, and financial buyers in efforts to acquire existing streamingstream and royalty interests. We also compete with the lenders, equity investors, and streamingstream and royalty companies providing financing to operators of mineral properties in our efforts to create new streamingstream and royalty interests. Our competitors may be larger than we are and may have greater resources and access to capital than we have. Key competitive factors in the stream and royalty acquisition and financing business include the ability to identify and evaluate potential opportunities, transaction structure and consideration, and access to capital.

Regulation

Operators of the mines that are subject to our stream and royalty interests must comply with numerous environmental, mine safety, land use, waste disposal, remediation and public health laws and regulations promulgated by federal, state, provincial and local governments in the United States, Canada, Chile, the Dominican Republic, Ghana, Mexico, Botswana Australia and other countries where we hold interests. Although we, as a stream or royalty interest owner, are not responsible for ensuring compliance with these laws and regulations, failure by the operators to comply with applicable laws, regulations and permits can result in injunctive action, orders to suspend or cease operations, damages, and civil and criminal penalties on the operators, which could have a material adverse effect on our results of operations and financial condition.

Corporate InformationHuman Capital Resources

Employees

We were incorporated undercurrently have 31 employees, 22 of whom work out of our headquarters in Denver, Colorado. The remainder work out of our offices in Lucerne, Switzerland, Vancouver, Canada, and Toronto, Canada. Our employees are not subject to a labor contract or collective bargaining agreement.

Human Capital Management Strategy

The continued growth and success of our business depends on our people, and our people are our most important resource. Management is responsible for ensuring that our policies and practices support our desired corporate culture and employee development. Our human capital management strategy is built on attracting the lawsbest talent and developing and retaining talent. We have benefited from a very low voluntary turnover rate, with many of the Statecurrent staff still with the company after 10 years of Delawareemployment.

Diversity and Inclusion

We believe that diversity can enhance creativity, productivity, and organizational strength. We strive to maintain an environment where the perspectives and experiences of all personnel are respected and valued. We seek to identify potential future candidates for employment and membership on January 5, 1981. our Board using a wide range of criteria that, depending on the position, may include diversity, experience in the mining industry, integrity, perspective, broad business judgment and leadership skills, personal qualities and reputation in the business community, and relevant technical, management, political, legal, governance, finance and other experience.

We are committed to an inclusive work environment where individuals are treated with fairness and respect and are given equal opportunity to develop and advance without regard to age, race, sex, gender identity or characteristics, color, religion, national origin, disability, sexual orientation, marital status, military status, pregnancy, genetic information, or any other status protected by state or local law.

We are committed to providing equal opportunities for promotion, compensation, training and development to all qualified individuals. We maintain a Diversity & Inclusion Policy that outlines our values, commitment to a diverse and inclusive Board and workforce and procedures for carrying out the policy. Among other things, when identifying new director candidates, the Compensation, Nominating and Governance Committee of our Board of Directors will require that the initial list of candidates, whether generated internally or by a third-party search firm, include qualified diverse candidates

9

Table of Contents

of gender, as well as racial and ethnic, diversity. Candidates for new hire employee positions, including senior management, will be recruited and considered in similar fashion.

Safety

We are committed to the wellbeing of all our employees. We promote a safe and healthy workplace and require strict adherence to legal and ethical standards in our business practices. For each of the past six years, we have recorded a total recordable injury frequency rate of zero for our employees. We maintain a People Policy that outlines our approach to maintaining safe work conditions for our employees. In response to the continued effects of the COVID-19 pandemic, we put in place initiatives to support our team in maintaining a healthy work-life balance at all our offices, including a hybrid in-office work schedule.  

Human Rights

We are committed to respecting human rights in the jurisdictions where we operate and affirm our commitment to comply with all applicable laws concerning human rights through our Human Rights Policy.

Compensation and Benefits

We offer competitive compensation and benefits to attract and retain top talent. We provide competitive medical and other insurance coverage for employees and eligible dependents and provide for sick leave in the case of illness or absence due to the sickness of the employee or an immediate family member.

Development

We support the continued professional development of our employees by underwriting or subsidizing education and professional development programs for our employees.

Host Community Commitment

We actively seek opportunities to advance sustainability initiatives with the goal of supporting communities that host the operations in which we hold stream and royalty interests during and following our operators’ mining operations. Many of our operators also actively and positively impact the communities where they mine. We encourage their sustainability initiatives and other efforts and often make our own financial contributions in support of their programs.

Local Community Support

We also believe in supporting the communities where we live and work.Our executive officesannual charitable giving is administered by a committee of employees that selects donation targets and recipients in our local communities.We are located at 1144 15th Street, Suite 2500,proud to partner with leading charities in Denver, Colorado 80202. Our telephone number is (303) 573-1660.Lucerne, Toronto, and Vancouver that are actively responding to community needs with respect to medical supplies, homelessness, food security, elder care, and education.

SEC Filings

We file periodic and current reports, proxy statements, and other information with the SEC. This includes our Annual Reports on Form 10-K, Quarterly Reports on Form 10-Q, Current Reports on Form 8-K, and any amendments to those forms. These reports are available free of charge on our website at www.royalgold.com as soon as reasonably practicable after they are electronically filed with or furnished to the SEC. These reports also can be obtained on the SEC’s website at www.sec.gov. The information on our website is not part of this or any other report filed with or furnished to the SEC.

Employees

We currently have 27 employees, 18 of which work out of our office in Denver, Colorado. The remainder work out of our offices in Lucerne, Switzerland, Vancouver, Canada, and Toronto, Canada. Our employees are not subject to a labor contract or collective bargaining agreement. We consider our overall employee relations to be good.

6

Table of Contents

Our global offices are adhering by the guidelines provided to the local health authorities during the COVID-19 pandemic.  The adoption of a remote work environment has not caused any material interruptions to the day-to-day activities of the Company.

ITEM 1A. RISK FACTORS

You should carefully consider the risks described in this section. Our future performance is subject to risks and uncertainties that could have a material adverse effect on our business, results of operations, and financial condition and

10

Table of Contents

the trading price of our common stock. We may be subject to other risks and uncertainties not presently known to us. In addition, please see our note about forward-looking statements included in Part II, Item 7,the MD&A of this Annual Report on Form 10-K.&A.

Risks Relating to our Business

Our revenue is subject to volatility in metal prices, which could negatively affect our results of operations or cash flow.

Market prices for gold, silver, copper, nickel, and other metals may fluctuate widely over time and are affected by numerous factors beyond our control. These factors include metal supply and demand, industrial and jewelry fabrication, investment demand, central banking actions, inflation expectations, currency values, interest rates, forward sales by metal producers, and legal, political, social, trade, economic, or banking conditions.

Our revenue is directly tied to metal prices.prices and is particularly sensitive to changes in the price of gold, as we derive the majority of our revenue from gold stream and royalty interests. Under our stream agreements, we purchase metal at a fixed price or a stated percentage of the market price and then sell the metal in the open market. If market prices decline, our revenue and cash flow from metal sales decline. A price decline can also impact our revenue under certain sliding-scale royalty agreements as we may receive a lower royalty rate when prices fall below specified thresholds. In addition, some of our royalty agreements are based on the operator’s concentrate sales to smelters and allow for price adjustments between the operator and the smelter based on changes in metals prices onbetween the date an operator ships concentrate to its offtake customer and the date the sale of concentrate is finally settled (typically a future date, typicallyperiod of three to five months after shipment of concentrate.months). These price adjustments can decrease our revenue in future periods if metal prices decline following shipment.

PriceMetal price declines could cause an operator to reduce, suspend, or terminate production or development at a project, which would impact our future revenue from the project. These production or development decisions could prevent us from recovering our initial investment in the project or result in an impairment to the value of our initial investment.

We own passivenonoperating interests in mining properties and cannot ensure properties are developed or operated in our best interests.

Our revenue is derived entirely from stream and royalty interests in properties owned and operated by third parties. In general, we have no decision-making authority regarding the development or operation of the mineral properties underlying our stream and royalty interests. Operators make all or substantially all development and operating decisions, including decisions about permitting, feasibility analysis, mine design and operation, processing, plant and equipment matters, and temporary or permanent suspension of operations, as well as estimates of resources and reserves. The interests of the operators and those of Royal Gold on the relevant properties are not always aligned, which can result in lower or delayed payments to us compared to what we anticipated.

We often have limited access to data about operating properties, which may make it difficult for us to project or assess the performance of our stream and royalty interests or to confirm mineral reserves and mineral resources.

We often do not have the contractual right under our stream and royalty agreements to receive production, operating, and other data, nor do we have the right to access the property or obtain drilling and metallurgical data that would allow us to confirm mineral reserves and mineral resources applicable to the properties in which we hold stream and royalty interests. As a result, it may be difficult for us to project or assess the performance of a stream or royalty interest, and we generally are unable to conduct our own mineral reserve and mineral resource analysis.

Our stream and royalty interests may not result in anticipated returns or may not otherwise ultimately benefit our business.

We are continually reviewing opportunities to acquire new stream and royalty interests, and we have acquisition opportunities at various stages of review. Any acquisition could be material to us. At times, we also consider opportunities to restructure our existing stream or royalty interests where we believe the restructuring would provide a long-term benefit to us, even though it could reduce near-term revenues or result in the incurrence of transaction-related costs. The success

11

Table of Contents

of our stream and royalty interests is based in part on our ability to make accurate assumptions at the time of acquisition or restructuring about the amount and timing of revenue to be derived from those interests. These assumptions are based on a variety of factors, including the geological, geotechnical, hydrogeological, hydrological, metallurgical, legal, permitting, environmental, social, and other aspects of the projects. For development projects, we also make assumptions about the cost, timing, and conduct of development. If an operator fails to bring a project into production as expected or if actual performance otherwise falls short of our assumptions, our revenue derived from the project may not be sufficient to yield an adequate, or any, return on our investment. In addition, we could be required to decrease the carrying value of our investment, which could have a material adverse effect on our results of operations or financial condition. We cannot ensure that any acquisition or other transaction will ultimately benefit Royal Gold.

Our future success depends on our ability to acquire additional stream or royalty interests at appropriate valuations.

Our future success depends largely on our ability to acquire additional stream and royalty interests at appropriate valuations. We may not adequately assess technical, operational, legal, environmental or social risks in connection with new acquisitions, which might adversely impact our expected investment returns or future results of operations. We may not be able to identify and complete acquisitions of additional interests at appropriate prices or terms. We may not have sufficient liquidity or may not be able to obtain debt or equity financing at an acceptable cost of capital in order to fund acquisitions due to economic volatility, credit crises, declines in metal prices, or changes in legal, political, social or other conditions. In addition, certain of our competitors are larger and have greater financial resources than we do, and we may not be able to compete effectively against them. Further, there has been significant growth in the number and relative size of stream and royalty companies over the last several years and some of these companies might have different investment criteria and costs of capital than we do, or are subject to different tax and accounting rules than we are, and we may not be able to compete effectively against them. Changes to tax rules, accounting policies, or the treatment of stream interests by ratings agencies could make streams or royalties less attractive to operators or render us less able to compete with other stream and royalty companies that are organized in countries with more favorable tax, accounting and regulatory regimes.

For some properties, we may not realize all of the expected benefits of our investments if operators are unable to replace current mineral reserves as they are consumed or identify new mineral resources, which could impact our future results of operations.

For some properties, our return on investment depends in part on the operators’ ability to replace mineral reserves as they are consumed in the ordinary course of mining. If current mineral reserves are not replaced as they are mined through conversion of mineral resources to new mineral reserves, or new mineral resources are not identified through expansion of known deposits, exploration, or otherwise, our expected investment returns or future results of operations could be adversely affected.

A significant portion of our revenue comes from a small number of operating properties, which means that adverse developments at these properties could have a more significant or lasting impact on our results of operations than if our revenue was less concentrated.

Approximately 70% of our revenue for the year ended December 31, 2022 came from 6 properties: Mount Milligan (30%), Pueblo Viejo (14%), Cortez (8%), Andacollo (8%), Peñasquito (7%), and Khoemacau (3%). We expect these properties to continue to represent a significant portion of our revenue going forward.This concentration of revenue could mean that adverse developments, including any adverse decisions made by the operators, at one or more of these properties could have a more significant or longer-term impact on our results of operations than if our revenue was less concentrated.

A significant disruption to our information technology systems or those of our third party service providers could adversely affect our business and operating results.

We rely on a variety of information technology and automated operating systems to manage and support our operations. For example, we depend on our information technology systems for financial reporting, operational and investment management, and email. These systems contain, among other information, our proprietary business information and personally identifiable information of our employees. The proper functioning of these systems and the security of such data is critical to the efficient operation and management of our business, and these functions are outsourced by us to third-

12

Table of Contents

party service providers on whom we rely for the security and proper functioning of these systems. In addition, these systems could require modifications or upgrades from time to time as a result of technological changes or growth in our business, and we might change the third-party service providers with whom we contract to maintain the functioning or security of these systems from time to time, which modifications, upgrades or changes could be costly and disruptive to our operations and could impose substantial demands on management’s time. Our systems, and those of our third-party service providers, could be vulnerable to damage or disruption caused by catastrophic events, power outages, natural disasters, computer system or network failures, viruses, ransomware or malware, physical or electronic break-ins, unauthorized access, or cyber-attacks. Any security breach could compromise our networks, and the information stored on them could be improperly accessed, disclosed, lost, stolen or restricted. Because techniques used to sabotage, obtain unauthorized access to systems or prohibit authorized access to systems change frequently and generally are not entitleddetected until successfully launched against a target, we or our third party service providers might be unable to compensation ifanticipate these techniques, and the steps that we or our third party service providers have taken to secure our systems and electronic information might not be adequate to prevent a disruption or attack. Any unauthorized activities could disrupt our operations or those of our third-party service providers on which we are shut down. This creates riskdependent, damage our reputation, or result in legal claims or proceedings, any of which could adversely affect our business, reputation, or operating results.

We depend on the services of our executives and other key employees, and the loss of one or more of these individuals could harm our business.

We believe that our success depends on retaining qualified executives and other key employees, especially in light of our limited number of personnel. These individuals have significant industry and Company-specific experience. If we are unsuccessful at retaining or attracting qualified personnel, our business could be disrupted and our reputation could be harmed, adversely impacting our ability to achieve our business objectives. We do not currently maintain key person life insurance on any of these individuals or our directors.

We face various risks related to health epidemics, pandemics and similar outbreaks, which could have material adverse effects on our business, results of operations, financial position, and/or the trading price of our stock.

Health epidemics, pandemics and similar outbreaks could cause significant volatility and uncertainty in the global economy and financial markets, supply chain issues, labor shortages, and declines in metal prices, and such events could adversely affect our ability to obtain future debt or equity financing for us becauseacquisitions on acceptable terms, or at all, and could require temporary curtailments of operations at the properties subject to our royalty and streaming interests, as occurred at Mount Milligan, Pueblo Viejo, Peñasquito and Khoemacau in response to the COVID 19 pandemic. In addition, health epidemics, pandemics and similar outbreaks and their resulting impacts may make it difficult for the operators may at times have businessof the properties subject to our royalty and streaming interests to forecast expected production amounts. The effects of health epidemics, pandemics and similar outbreaks will ultimately depend on many factors that are inconsistent withoutside of our interests control (including the severity and duration of such events and government and operator actions in response to such events) and could materially and adversely impact our business, results of operations, financial position, and/or may act contrarythe trading price of our stock.

Risks Relating to our interests.Stream and Royalty Interests

Our revenue is subject to operational and other risks faced by operators of the properties in which we hold stream or royalty interests.

We generally are not required to pay capital or operating costs on projects in which we hold stream or royalty interests. However, our revenue and the value of our investments are indirectly subject to hazards and risks normally associated with developing and operating mining properties, including the following:

7

Table of Contents

insufficient ore reserves
increased capital or operating costs
declines in the price of gold, silver, copper, nickel, or other metals
declines in metallurgical recoveries
construction or development delays

13

Table of Contents

operational disruptions, including those caused by pandemics or other global or local health crises
inability to assess and manage project technical risks
inability to obtain or maintain necessary permits
inability to replace or increase reserves and/or mineral resources as properties are mined
inability to maintain, or challenges to, exploration or mining rights
changes in mining taxes and royalties payable to governments and political environments in general
significant changes to environmental, permitting, or other legal or regulatory requirements or the enforcement of such requirements
challenges to operations, permits, or mining rights by local communities, indigenous populations, non-government organizations, or others and ineffective management of stakeholder communications and relations
litigation between operators and third parties relating to the properties
community or civil unrest, including protests and blockades
labor shortages, increased labor costs, labor disputes, strikes, or work stoppages or inability to access sufficient experienced and trained personnel
unavailability of mining, drilling, or other equipment
unanticipated geological conditions or metallurgical characteristics
unanticipated groundgroundwater or watersurface conditions, including lack of access to sufficient water
inadequate supplies of power or other raw materials
��pit wall or tailings dam failures or underground stability issues
fires, explosions, major mechanical or electrical equipment failures, other industrial accidents or other property damage
injurieschallenges managing land disturbances, reclamation requirements, tailing and waste storage, release of contaminants or other environmental incidents or damage
failure to humans, property,operate in accordance with industry standard safety practices or the environmentgovernment regulations
occurrence of safety events, including lost time incidents and/or fatalities
natural catastrophes and environmental hazards such as unanticipated groundwater or surface water conditions, earthquakes droughts, floods, forest fires,or hurricanes weather, or climate events
physical effects of climate change, such as extreme changes in temperature, extreme precipitation events, flooding, longer wet or dry seasons, increased temperatures and drought, increased or decreased precipitation and snowfall, wildfires, or more severe storms, and regulatory changes designed to reduce the effects of climate change;change, including regulations designed to curtail greenhouse gas emissions, which may lead to increased costs for mine operators
market risks associated with the perception of mine operators’ environmental, social and governance (“ESG”) performance and their ability to deliver on ESG commitments and expectations
market conditions, including prolonged periods of inflation and supply-chain disruptions and increased interest rates
uncertain political and economic environments,
including economic downturns
insufficient financing or inability to obtain financing at all or at an acceptable cost of capital
default by an operator on its obligations to us or its other creditors and counterparties
insolvency, bankruptcy, or other financial difficulty of the operator
changes in laws or regulations or the enforcement of laws or regulations

The occurrence of any of these events could negatively impact operations at the properties in which we hold stream or royalty interests, which in turn could have a material adverse effect on our revenue, cash flow and cash flow.financial condition.

Most of our revenue is derived from properties outside the United States, and risks associated with conducting business in foreign countries or other sovereign jurisdictions could adversely affect our business, results of operations, financial condition, or the trading price of our common stock.

Approximately 86% of our revenue for the year ended December 31, 2022, came from properties outside of the United States, and many of our operators are organized outside of the United States. Our principal production stage stream and royalty interests on properties outside of the United States are located in Canada, the Dominican Republic, Mexico, Chile and Botswana. Within the United States and other countries, indigenous people may be recognized as sovereign entities

14

Table of Contents

and may enforce their own laws and regulations. Our activities and operators’ activities are subject to the risks associated with conducting business in foreign countries or other sovereign jurisdictions, including the following:

expropriation or nationalization of mining property or other government takings
seizure of mineral production
exchange and currency controls and fluctuations
limitations on foreign exchange or repatriation of earnings
restrictions on mineral production or price controls
import or export regulations, including trade wars and sanctions and restrictions on metal exports
changes in government taxation, royalties, tariffs, or duties
changes in economic, trade, diplomatic, or other relationships between countries or the effects on global and economic conditions, the stability of global financial markets, or the ability of key market participants to operate in certain financial markets, including the imposition of sanctions on doing business with certain governments, companies or individuals
high rates of inflation
unfamiliar or uncertain foreign real estate, mineral tenure, safety, or environmental laws or rules
war, crime, terrorism, sabotage, blockades, or other forms of civil unrest
uncertain political or economic environments, including economic downturns
corruption
exposure to liabilities under anti-corruption or anti-money laundering laws
suspension of the enforcement of creditors’ or stockholders’ rights
loss of access to government-controlled infrastructure, such as roads, bridges, rails, ports, power sources, and water supplies

In addition, because many of our operators are organized outside of the United States, our stream and royalty interests may be subject to the application of foreign laws to our operators, and their stockholders, including laws relating to foreign ownership structures, corporate transactions, creditors’ rights, bankruptcy and liquidation. Foreign operations also could be adversely impacted by laws and policies of the United States affecting foreign trade, investment and taxation.

These risks may limit or disrupt the development or operation of properties in which we hold stream and royalty interests or impair our rights or interests in these properties, which could adversely affect our results of operations or financial condition.

If the assumptions underlying operators’ production, mineral reserve, or mineral resource estimates are inaccurate or if future events cause operators to negatively adjust their previous estimates, our future revenue or the value of our investments could be adversely affected.

The operators of the properties in which we hold stream and royalty interests generally prepare production, mineral reserve and mineral resource estimates for the properties. We do not independently prepare or verify this information and generally lack sufficient information and access to properties to do so. There are numerous uncertainties inherent in these estimates, many of which are outside the operators’ control. As a result, production and mineral reserve or mineral resource estimates are subjective and necessarily depend upon a number of assumptions, including, among others, reliability of historical data, geological interpretation, geotechnical, geologic and mining conditions, metallurgical recovery, metal prices, operating costs, capital expenditures, development and reclamation costs, mining technology improvements, and the effects of government regulation. If any of the assumptions that operators make in connection with production and mineral reserve or mineral resource estimates are incorrect, actual production could be significantly lower than the production, mineral reserve or mineral resource estimates, which could adversely affect our future revenue and the value of our investments. In addition, if operators’ estimates with respect to the timing of production are incorrect, we may experience variances in expected revenue from period to period.

Further, operators’ estimates of mineral resources are subject to future exploration and development and associated risks and may never convert to future reserves. In addition, estimates of mineral resources are subject to similar uncertainties and assumptions as discussed above with respect to mineral reserves.

15

Table of Contents

The current COVID-19 pandemic hasoperators of properties subject to our interests may be subject to growing environmental risks, including risks associated with climate change, which could have a material adverse effect on us, our financial condition or the value of our interests or of our common stock.

Mining operations are subject to extensive laws and regulations governing land use and the protection of the environment. In addition, many countries have implemented laws and regulations designed to address the effects of climate change, including rules to disclose and reduce industrial emissions and other environmental impacts to which operators or we might be subject. These laws and regulations are constantly evolving in a manner generally expected to result in stricter standards, more liability, and increased costs. Compliance with these laws and regulations can impose substantial costs and burdens on the operators of properties subject to our interests and perhaps on us as well. In addition, an operator’s failure to comply with these laws and regulations could result in injunctive action, orders to suspend or cease operations, damages, or civil or criminal penalties on the operator. If any of these events were to occur, our revenue or the value of our interests could be adversely affected, andaffected.

Climate change may continuealso pose physical risks to adversely affect, operations at somethe properties in which we hold an interest. This could include adverse effects on operations as a result of increasing occurrences of extreme weather events, flooding, water shortages, changes in rainfall and storm patterns, changes in sea levels, heat stress, wildfires, and other negative weather and climate patterns. For example, Andacollo experienced flooding due to a significant rainfall event in July 2022, which caused operations to shut down for five days.  These events could damage assets, negatively impact production, harm human life, halt mining operations, temporarily close supporting infrastructure or reduce labor productivity, among other effects.

Market impacts due to climate change and the transition to a low-carbon economy will be varied and complex. Supply and demand for certain commodities, products and services might shift in connection with evolving consumer and investor sentiments. Market perceptions of the mining sector, and, in particular, the role that certain metals will or will not play in the transition to a low-carbon economy, remain uncertain. Potential financial impacts may include increased production costs due to changing input prices, re-pricing of land and assets, increased global competition for key materials needed for new technologies, potential cost increases by insurers and lenders, and potential increases in taxation of the mining and metals sector.

In addition, governments and public-company stockholders are increasingly seeking enhanced disclosures on the risks, challenges, governance implications, and financial impacts of climate change faced by companies and demanding that companies take a proactive approach to addressing and reducing perceived environmental risks, including the physical, transition and liability risks associated with climate change, relating to their operations. Adverse publicity or climate-related litigation that impacts any of the operators of the properties in which we hold interests could have a negative impact on our business. As a holder of stream orand royalty interests, we generally will not have any influence on litigation such as this and more than likely not have access to non-public information concerning such litigation. In addition, we might not have access to sufficient information on the operations in respect of which we hold stream and royalty agreements in order to adequately comply with regulations or meet stockholder expectations on adequate disclosure or to quantify the potential impacts of climate change on our business.

Challenges relating to climate change could have an impact on the ability of these operators to access the capital markets and such limitations could have a corresponding negative effect on their business and operations. Although we do not conduct mining operations on the properties in which we hold stream and royalty interests and are not legally required to contribute to environmental or other operating costs on the properties, our own governmental regulators and stockholders may nonetheless demand that we bear some responsibility for addressing these environmental risks. If this were to occur, the value of our interests or your shares of common stock could be adversely affected.

Further, due to expansive environmental laws, it is possible that we could become subject to environmental liabilities for historic periods during which we owned or operated properties or relative to our current ownership interests in mining claims or leases. These liabilities could have a material adverse effect on our results of operations and financial condition.

The world is currently experiencing a deadly outbreak of the coronavirus disease 2019, or COVID-19. Public health and government authorities have recommended and mandated precautions to mitigate the spread of COVID-19, including in some cases quarantines, shelter-in-place orders, and restrictions on mining-related activities. As a result, several of our operating counterparties, including at our principal properties, have had temporary operational curtailments. There may be additional curtailments. The COVID-19 pandemic could also disrupt operators’ supply or distribution chains or access to workers, which in turn could adversely impact their production or sales. In addition, development and exploration activities at some properties may be delayed or suspended. Any of these events could have a material adverse impact on our results of operations and financial condition in future periods. We are unable to predict the nature or extent of any impact the COVID-19 pandemic may have on our future results of operations and financial condition.

The current COVID-19 pandemic has significantly impactedFinally, lenders might be unwilling to provide financing to the global economymining industry, including companies like Royal Gold that acquire stream and markets overroyalty interests in mining projects, due to such lenders’ concerns regarding market perceptions of the past several months and may continue to do so, which could adversely affect our business or the trading price of our stock.

816

Table of Contents

The global economy, metal prices,mining sector and financial markets have experienced significant volatility and uncertainty duelender commitments to COVID-19. Our revenue is directly relatednet-zero emissions targets. If we encounter difficulties in accessing the commercial debt market, our ability to the market pricefinance new acquisitions of gold and other metals. Metal price volatility causes our revenue to fluctuate from period to period. This price volatility could also cause operators or developers to defer or forgo projects, which could adversely impact our future revenue. Moreover, in the ordinary course of business, we review opportunities to acquire new stream and royalty interests could be materially and currently have acquisition opportunities at various stages of review. Reduced economic and travel activities or illness among our management team as a result of COVID-19 could limit or delay acquisition opportunities or other business activities.adversely affected. In addition, economic volatility, disruptions in the financial markets, or severeif we have to rely on issuing equity to finance transactions, our stock price declines for gold or other metalscould be negatively impacted and our stockholders’ ownership could be diluted.

Financing Risks

Current and future indebtedness could adversely affect our financial condition and impair our ability to obtainoperate our business.

As of December 31, 2022, we had $575 million outstanding and $425 million available under our revolving credit facility. Our credit facility contains a floating interest rate. We may incur additional indebtedness in the future. Current and future debt or equity financingindebtedness could have important consequences, including the following:

require us to dedicate a substantial portion of our cash flow from operations to service indebtedness, thereby reducing the availability of cash flow to fund acquisitions, working capital, or dividends
limit our flexibility in planning for, or reacting to, changes in our business
restrict us from exploiting business opportunities
make us more vulnerable to a downturn in our business or the economy
place us at a competitive disadvantage compared to our competitors with less indebtedness
require the consent of our existing lenders to incur additional indebtedness
limit our ability to borrow additional funds for acquisitions, working capital, or debt-service requirements
increase our cost of capital, including as a result of higher interest rates and the effects of exchange rates
increase our exposure to the credit risks of bank group lenders or those institutions with which we maintain deposits

Our credit facility contains financial and other restrictive covenants. For example, the agreement includes financial covenants that require us to maintain a maximum leverage ratio and a minimum interest coverage ratio (as these terms are defined under the agreement). These covenants could limit our ability to engage in activities that are in our long-term best interests. Our failure to comply with these covenants would result in an event of default that, if not waived, could result in the acceleration of all outstanding indebtedness. Our credit facility expires in July 2026. In the future, we may be unable to obtain new financing or refinancing on acceptable terms. Government efforts to counter the economic effects of COVID-19 through liquidity and stimulus programs may be insufficient or ineffective in preventing or reducing the effects of a recession. It is difficult to determine the extent of the economic and market impacts from COVID-19 and the many ways in which they may negatively affect our business and the trading price of our stock.

Legal Risks

A significant portionDefects in our stream or royalty interests or the bankruptcy or insolvency of our revenue comes from a small number of operating properties, which means that adverse developments at these propertiesan operator could have a more significant or lasting impactmaterial adverse effect on the value of our results of operations than if our revenue was less concentrated.investments.

Approximately 75%Despite our due diligence practices, it is possible that unknown defects or problems will exist relating to the existence, validity, enforceability, terms, or geographic extent of our stream and royalty interests. Similarly, stream interests and, in many jurisdictions, royalty interests, are or can be contractual in nature, rather than interests in land. As a result, these interests may not survive a bankruptcy or insolvency of an operator. We often do not have the protection of security interests that could help us recover all or part of our investment in a stream or royalty interest in the event of an operator’s bankruptcy or insolvency. In addition, the contracts governing our stream and royalty interests might not have sufficient legal protections or a court could impose restrictions on our enforcement rights. If our stream or royalty interests were set aside through judicial or administrative proceedings or if we are unable to enforce our contractual rights, the value of our investments could be adversely affected.

Some of the agreements governing our stream and royalty interests contain terms that reduce or cap the revenue for fiscal year 2020 camegenerated from six properties: Mount Milligan, Andacollo,those interests.

Revenue from some of our stream and royalty interests decreases or stops after threshold production, delivery, or payment milestones are achieved or other events occur. For example, our stream interests at Pueblo Viejo, Wassa, Peñasquito, Andacollo

17

Table of Contents

and Cortez. We expectKhoemacau and certain of our royalty interests at other properties contain these types of limitations. As a result, past production and revenue relating to these interests may not be indicative of future results. In addition, some of our stream and royalty interests do not cover all of the mineral reserves or mineral resources at certain properties, to continue to represent a significant portion of revenue going forward. This concentration of revenuewhich could mean that adverse developments, including any adverse decisions madeoverall performance reported by the operators at one or moremay not correlate to the performance of these properties could have a more significant or longer-term impact on our results of operations than if our revenue was less concentrated.interests in the properties.

Operators may fail to comply with their contractual arrangements with us or may interpret their obligations in a manner adverse to us, which could decrease our revenue or increase our costs.

At times, operators may be unable or unwilling to fulfill their contractual obligations to us. In addition, we often rely on the operators for the calculation of our stream deliveries or royalty payments and there is a risk of delay, error, and additional expense in receiving deliveries or payments. Payments may be delayed by restrictions imposed by lenders, delays in the sale or delivery of products, or the ability or willingness of smelters and refiners to process mine products. Our rights to payment under our stream and royalty agreements must, in most cases, be enforced by contract. When we enter into new stream or royalty interests,agreements, we attempt to secure contractual rights that allow us to monitor operators’ compliance with their obligations to us, such as audit or access rights. However, these rights may not be sufficient to ensure compliance. In addition, our stream and royalty agreements are often complex and may be subject to interpretation or uncertainties. Operators and other counterparties may interpret our interests in a manner adverse to us. For these or other reasons, we could be forced to expend resources or take legal action to enforce our contractual rights. We may not be successful in enforcing our contractual rights. As a result, our revenue relating to the disputed interests could be adversely affected. We may also need to expend significant monetary and human resources to defend our position, which could adversely affect our results of operations. In addition, we may be required to make retroactive revenue adjustments in future periods relating to past period revenue as a result of information that we learn through audit or access rights.rights or otherwise from operators and other counterparties.

We often have limited accessChanges to data about operating properties, which may make it difficult for us to project or assess the performance of our streamU.S. and royalty interests.

We often do not have the contractual right to receive production, operating, and other data from the operators of the properties in which we hold stream and royalty interests. As a result, it may be difficult for us to project or assess the performance of a stream or royalty interest. Thisforeign tax laws could result in delays in, or reductions of, our cash flow from the amounts that we anticipate based on the stage of development of or production from the properties, which could have an adverse impact onadversely affect our results of operations or financial condition.

Our stream and royalty interests may not result in the anticipated returns or may not otherwise ultimately benefit our business.operations.

We are continually reviewing opportunitiessubject to acquire new stream and royalty interests, and we have acquisition opportunities at various stages of review. Any acquisition could be material to us. At times, we also consider opportunities to restructure our existing stream or royalty interests where we believe the restructuring would provide a long-term benefit to us, even though it could reduce near-term revenues or resulttax in the incurrence of transaction-related costs. The success

9

Table of Contents

of our stream and royalty interests is based in part on our ability to make accurate assumptions at the time of acquisition about the amount and timing of revenue to be derived from those interests. These assumptions are based on a variety of factors, including the geological, metallurgical, permitting, environmental,U.S. and other aspects of the project. For development projects, we alsoforeign jurisdictions. Current economic and political conditions make assumptions about the cost, timing,tax laws and conduct of development. If an operator failstheir interpretation subject to bring a project into production as expected or if actual performance otherwise falls short of our assumptions, our revenue derived from the project may not be sufficient to yield an adequate, orsignificant change in any return on our investment. In addition, we could be required to decrease the carrying value of our investment, which could have a material adverse effect on our results of operations or financial condition.jurisdiction. We cannot ensure that any acquisitionpredict the timing or significance of future tax law changes in the U.S. or other transaction will ultimately benefit Royal Gold.

We may not be able to acquire additional stream or royalty interests at appropriate valuations.

Our future success depends largely on our ability to acquire additional stream and royalty interests at appropriate valuations. We may not be able to identify and complete acquisitions of additional interests at appropriate prices or terms. We may not have sufficient liquidity or may not be able to obtain debt or equity financing to fund acquisitions due to economic volatility, credit crises, declinescountries in metal prices, or other reasons. Certain of our competitors are larger and have greater financial resources thanwhich we do and we may not be able to compete effectively against them. In addition,business. If material tax law changes toare enacted, our future effective tax rules, accounting policies, or the treatment of stream interests by ratings agencies could make streams or royalties less attractive to counterparties. Any of these factors could adversely affect our ability to acquire new stream or royalty interests, which would adversely affect our futurerate, results of operations, and financial condition.

Some of the agreements governing our stream and royalty interests contain terms that reduce or cap the revenue generated from those interests.

Revenue from some of our stream and royalty interests decreases or stops after threshold production, delivery, or payment milestones are achieved. For example, our stream interests at Pueblo Viejo, Andacollo, Wassa, and Khoemacau, and certain of our royalty interests at other properties, contain these types of limitations. As a result, past production and revenue relating to these interests may not be indicative of future results.

If the assumptions underlying operators’ production, reserve, or mineralized material estimates are inaccurate or if future events cause operators to negatively adjust their previous estimates, our future revenue or the value of our investmentscash flows could be adversely affected.

The operators of the properties in which we hold stream and royalty interests generally prepare production and reserve estimates for the properties. We do not independently prepare or verify this information. There are numerous uncertainties inherent in these estimates, many of which are outside the operators’ control. As a result, production and reserve estimates are subjective and necessarily depend upon a number of assumptions, including, among others, reliability of historical data, geologic and mining conditions, metallurgical recovery, metal prices, operating costs, capital expenditures, development and reclamation costs, mining technology improvements, and the effects of government regulation.  If any of the assumptions that operators make in connection with production or reserve estimates are incorrect, actual production could be significantly lower than the production or reserve estimates, which could adversely affect our future revenue and the value of our investments. In addition, if operators’ estimates with respect to the timing of production are incorrect, we may experience variances in expected revenue from period to period.

Some operators also report publicly or to us estimates of mineralized material. The term “mineralized material” does not indicate proven or probable reserves as defined by the SEC. Mineralized material is subject to future exploration and development and associated risks and may never convert to future reserves.  In addition, estimates of mineralized material are subject to similar uncertainties and assumptions as discussed above with respect to mineral reserves.

Our disclosures relating to operating properties will change as a result of new SEC disclosure rules, and we continue to face uncertainty around how some of these rules apply to a streaming and royalty company.

10

Table of Contents

In 2018, the SEC adopted amendments to its disclosure requirements for mining companies, including streaming and royalty companies. We are required to comply with the new rules for our fiscal year beginning on July 1, 2021. Our disclosures about operating properties will change under the new rules, and, in some cases, we may be required to disclose in our SEC filings more or less information than we currently disclose about these properties. There continues to be uncertainty about how the rules will apply to a streaming and royalty company with significant investments in properties run by international operators that are not required to report under SEC rules.

Most of our revenue is derived from properties outside the United States, and risks associated with conducting business in foreign countries or other sovereign jurisdictions could adversely affect our results of operations or financial condition.

Over 90% of our revenue comes from properties outside of the United States, and many of our operators are organized outside of the United States. Within the United States and other countries, indigenous people may be recognized as sovereign entities and may enforce their own laws and regulations. Our and operators’ activities are subject to the risks associated with conducting business in foreign countries or other sovereign jurisdictions, including the following:

expropriation or nationalization of mining property or other government takings
seizure of mineral production
exchange and currency controls and fluctuations
limitations on foreign exchange or repatriation of earnings
restrictions on mineral production or price controls
import or export regulations, including trade wars and sanctions and restrictions on metal exports
changes in government taxation, royalties, tariffs, or duties
changes in economic, trade, diplomatic, or other relationships between countries or the effects on global and economic conditions, the stability of global financial markets, or the ability of key market participants to operate in certain financial markets
high rates of inflation
unfamiliar or uncertain foreign real estate, mineral tenure, safety, or environmental rules
war, crime, terrorism, sabotage, blockades, or other forms of civil unrest
uncertain political or economic environments
corruption
exposure to liabilities under anti-corruption or anti-money laundering laws
suspension of the enforcement of creditors’ or stockholders’ rights
loss of access to government-controlled infrastructure, such as roads, bridges, rails, ports, power sources, and water supplies

These risks may limit or disrupt the development or operation of properties in which we hold stream and royalty interests or impair our rights or interests in these properties, which could adversely affect our results of operations or financial condition.

We and our operating properties may be subject to environmental risks, including risks associated with climate change, which could have a material adverse effect on our financial condition or the value of our investments.

Mining operations are subject to extensive laws and regulations governing land use and the protection of the environment. In addition, many countries have implemented laws and regulations designed to address the effects of climate change, including rules to reduce industrial emissions and increase energy efficiency. These laws and regulations are constantly evolving in a manner generally expected to result in stricter standards, more liability, and increased costs. Compliance with these laws and regulations can impose substantial costs and burdens on operators of properties subject to our interests. In addition, an operator’s failure to comply with these laws and regulations could result in injunctive action, orders to

11

Table of Contents

suspend or cease operations, damages, or civil or criminal penalties on the operator. If any of these events were to occur, our revenue or the value of our investment could be adversely affected.

Further, due to expansive environmental laws, it is possible that we could become subject to environmental liabilities for historic periods during which we owned or operated properties or relative to our current ownership interests in lease and underlying unpatented mining claims. These liabilities could have a material adverse effect on our results of operations or financial condition.

Unknown defects in our stream or royalty interests or the bankruptcy or insolvency of an operator could have a material adverse effect on the value of our investments.

Despite our due diligence practices, it is possible that unknown defects or problems will exist relating to the existence, validity, enforceability, terms, or geographic extent of our stream and royalty interests. Similarly, stream interests and, in many jurisdictions, royalty interests are contractual in nature, rather than interests in land. As a result, these interests may not survive a bankruptcy or insolvency of an operator. We often do not have the protection of security interests that could help us recover all or part of our investment in a stream or royalty interest in the event of an operator’s bankruptcy or insolvency. If our stream or royalty interests were set aside through judicial or administrative proceedings, the value of our investments could be adversely affected.impacted.

Anti-corruption laws and regulations could subject us to liability and require us to incur costs.

We are subject to the U.S. Foreign Corrupt Practices Act (the "FCPA") and other laws that prohibit improper payments or offers of payments to third parties, including foreign governments and their officials, for the purpose of obtaining or retaining business. In some cases, we invest in mining operations in certain jurisdictions that have experiencedwhere corruption in the past.may be more common. Our international investment activities create the risk of unauthorized payments or offers of payments in violation of the FCPA or other anti-corruption laws by one of our employees or agents in violation of our policies. In addition, the operators of the properties in which we own stream and royalty interests may fail to comply with anti-corruption laws and regulations. Although we are passive investors indo not operate these properties, enforcement authorities could deem us to have some culpability for the operators’ actions. Any violations of the FCPA or other anti-corruption laws could result in significant civil or criminal penalties to us and could have an adverse effect on our reputation.

A significant disruption to our information technology systems could adversely affect our business and operating results.

We rely on a variety of information technology and automated operating systems to manage and support our operations. For example, we depend on our information technology systems for financial reporting, operational and investment management, and email. These systems contain our proprietary business information and personally identifiable information of our employees. The proper functioning of these systems and the security of this data is critical to the efficient operation and management of our business. In addition, these systems could require modifications or upgrades as a result of technological changes or growth in our business. These changes could be costly and disruptive to our operations and could impose substantial demands on management time. Our systems, and those of third-party providers, could be vulnerable to damage or disruption caused by catastrophic events, power outages, natural disasters, computer system or network failures, viruses or malware, physical or electronic break-ins, unauthorized access, or cyber-attacks. Any security breach could compromise our networks, and the information stored on them could be improperly accessed, disclosed, lost, or stolen. The steps that we have taken to secure our systems and electronic information may not be adequate to prevent a disruption. Any unauthorized activities could disrupt our operations, damage our reputation, or result in legal claims or proceedings, any of which could adversely affect our business, reputation, or operating results.

We depend on the services of our executives and other key employees, and the loss of one or more members of our management team could harm our business.

12

Table of Contents

We believe that our success depends on retaining qualified executives and other key employees. Our management team has significant industry and company-specific experience. If we are unsuccessful at retaining or attracting qualified personnel, our business could be disrupted and our ability to achieve our business objectives and grow effectively could be jeopardized. We do not currently maintain key person life insurance on any of our directors or employees.

Current and future indebtedness could adversely affect our financial condition and impair our ability to operate our business.

As of June 30, 2020, we had $305 million outstanding and $695 million available under our revolving credit facility. We may incur additional indebtedness in the future. Current and future indebtedness could have important consequences, including the following:

require us to dedicate a substantial portion of our cash flow from operations to service indebtedness, thereby reducing the availability of cash flow to fund acquisitions, working capital, or dividends
limit our flexibility in planning for, or reacting to, changes in our business
restrict us from exploiting business opportunities
make us more vulnerable to a downturn in our business or the economy
place us at a competitive disadvantage compared to our competitors with less indebtedness
require the consent of our existing lenders to incur additional indebtedness
limit our ability to borrow additional funds for acquisitions, working capital, or debt-service requirements

Our credit facility contains financial and other restrictive covenants. For example, the agreement includes financial covenants that require us to maintain a maximum leverage ratio and a minimum interest coverage ratio (as these terms are defined under the agreement). These covenants could limit our ability to engage in activities that are in our long-term best interests. Our failure to comply with these covenants would result in an event of default that, if not waived, could result in the acceleration of all outstanding indebtedness. Our credit facility expires in June 2024. In the future, we may be unable to obtain new financing or refinancing on acceptable terms.

The proposed phase out of the London Interbank Offered Rate ("LIBOR") could adversely affect our results of operations or financial condition.

In 2017, the United Kingdom's Financial Conduct Authority (the authority that regulates LIBOR) announced that it intends to phase out LIBOR by the end of calendar 2021. The Federal Reserve Board has convened a group of private-market participants to identify a proposed alternative rate and address the transition from LIBOR to an alternative rate. In 2019, the FASB proposed guidance that would help facilitate the market transition from existing reference rates to alternative rates. Borrowings under our revolving credit facility bear interest at LIBOR plus an applicable margin. Under the agreement governing the facility, if LIBOR is phased out, we are required to negotiate in good faith to establish an alternative rate under the facility. There is currently no definitive information regarding the future use of LIBOR or a replacement rate. We are unable to predict whether and to what extent a LIBOR change would impact our future results of operations and financial condition.

Risks Related to our Common Stock

Our stock price may continue to be volatile, and you could lose all or part of your investment.

The market price of our common stock has fluctuated in the past and may continue to do so in the future. For example, during fiscalthe year 2020,ended December 31, 2022, the market price of our common stock ranged from a low of $59.78$86.46 to a high of $139.63.$146.33. Many

13

Table of Contents

factors unrelated to operating performance can contribute to volatility in the market price of our common stock, including the following:

economic, market, or political, social or public health conditions including the effects of COVID-19

18

Table of Contents

market prices of gold, silver, copper, nickel, and other metals
developments relating to operating properties on which we hold stream or royalty interests
interest rates and inflation rates and expectations about inflationboth
currency values
credit market conditions

These marketMarket fluctuations, regardless of cause, may materially and adversely affect our stock price. As a result, you could lose all or part of your investment.

We may issue additional equity securities, which would dilute our existing stockholders and reduce our per-share financial measures and could reduce the market price of our common stock.

We may issue additional equity in the future in connection with acquisitions, strategic transactions, or for other purposes. If we issue additional equity securities, our existing stockholders would be diluted and our per-share financial measures would be reduced. In addition, shares of common stock that we issue in connection with an acquisition may not be subject to resale restrictions. The market price of our common stock could decline if our stockholders sell substantial amounts of our common stock or are perceived by the market as intending to sell these shares other than in an orderly manner.

We may change our practice of paying dividends, which could reduce the value of your investment.

We have paid a cash dividend on our common stock since calendar year 2000. Our board of directors has discretion in determining whether to declare a dividend based on a number of factors, including metal prices, economic or market conditions, earnings, cash flow, financial condition, and funding requirements for future opportunities or operations. In addition, corporate law limitations or future contractual restrictions could limit our ability to pay dividends in the future. If our board of directors reduces or eliminates future dividends, our stock price could fall, and the success of your investment would depend largely on any future stock price appreciation. We have increased our dividend in prior years. There can be no assurance, however, that we will continue to do so or that we will pay any dividends.

Provisions of Delaware law and our organizational documents could delay or prevent a third party from acquiring us.

The anti-takeover provisions of Delaware law impose barriers to the ability of a third party to acquire control of us, even if a change of control would be beneficial to our existing stockholders. In addition, our certificate of incorporation and bylaws contain provisions that may make it more difficult for a third party to acquire control of us without the approval of our board of directors. These provisions may make it more difficult or expensive for a third party to acquire a majority of our outstanding common stock. Among other things, these provisions provide for the following:

allow our board of directors to issue shares of common stock and preferred stock without stockholder approval, except as may be required by Nasdaq rules
allow our board of directors to establish the rights and preferences of authorized and unissued preferred stock
provide for a classified board, whereby our board of directors is divided into three classes of directors serving staggered three-year terms
prohibit stockholders from calling special meetings of stockholders
require advance notice of stockholder proposals and related information
require vacancies and newly created directorships on the board of directors to be filled only by affirmative vote of a majority of the directors then serving on the board

These provisions could increase the cost of acquiring us or discourage a third party from acquiring us or removing incumbent management, which could decrease the value of your investment.

14

Table of Contents

ITEM 1B.  UNRESOLVED STAFF COMMENTS

None.

19

Table of Contents

ITEM 2. PROPERTIES

We do not own

Introduction

In 2018, the SEC adopted amendments to the disclosure requirements for mining properties. Effective for fiscal years beginning on or operateafter January 1, 2021, the properties on which we holddisclosure requirements under the SEC’s Industry Guide 7 (“IG7”) have been replaced with new disclosure requirements under SK1300. The property disclosures in this Item 2 are presented in accordance with SK1300 subject to certain exemptions contained in the rule.

This Item 2 provides summary information about our overall portfolio of stream orand royalty interests, except for our interest in the Peak Gold JV, and therefore much of the information disclosed in this Form 10-K regarding these properties is provided to us by the operators. For example, the operators of certain properties provide us information regarding metals production, estimates of mineral reserves and additional mineralized material and production estimates. A list of our producing and development stage streams and royalties, as well their respective reserves, are summarized in Table 1 “Operators’ Estimated Provenas more detailed information about our material properties. Royal Gold management periodically reviews the materiality of individual royalty and Probable Gold Reserves” below within this Item 2. More information is available to the public regarding certain properties in which we have stream or royalty interests, including reports filed with the SEC or with the Canadian securities regulatory agencies available at www.sec.gov or www.sedar.com, respectively.

We manage our business under two reportable segments, consisting of the acquisition and management of stream interests and the acquisition and managementwithin our portfolio. As of royalty interests. The descriptionDecember 31, 2022, we determined that six of our principal streams and royalties set forth below includes the location, operator, stream or royalty rate, access and any material current developments at the property. For any reported production amounts discussed below, we consider reported production to relate to the amount of metal sales subject to our stream and royalty interests. Pleaseinterests are material to our business under SK1300: Andacollo, Cortez, Khoemacau, Mount Milligan, Peñasquito and Pueblo Viejo. We sometimes refer to Item 7, MD&A, for discussion on production estimates, historical production and revenue forthese properties as our material, or principal, properties. The map below illustrates the location of our principal producing stage properties.

Principal Producing Properties

We consider bothIn making this determination, management considers primarily estimated future revenue and, to a lesser extent, historical and future potential revenues to determine which stream and royalty interests in our portfolio are principal to our business.revenue. Estimated future potential revenues from producing properties arerevenue is based on a number ofseveral factors, including mineral reserves and resources subject to our stream and royalty interests, production estimates, feasibility studies, technical reports, metal price assumptions,and mine life legal status and other factors and assumptions, any of which could change and could cause us to conclude that one or more of such stream and royalty interests are no longer principal to our business. Currently, we consider the properties discussed below (listed alphabetically by stream and royalty interest) to be principal to our business.assumptions. Based on the factors discussed above, we no longer consider Rainy Riverour stream interest at the Wassa Gold Mine in Ghana to be a principal property.

Under SK1300, disclosures of material mineral reserves and resources must be based on a technical report summary prepared by a qualified person, absent an exemption. With respect to our material properties, our disclosures in this Item 2 are based on information provided to us by the operators of the properties or the operators’ public filings with the SEC or Canadian securities regulators including technical reports filed with Canadian securities administrators pursuant to National Instrument 43-101 (“NI 43-101”), 2014 Canadian Institute of Mining, Metallurgy and Petroleum Definition Standards and 2019 Best Practice Guideline (“CIM Standards”) and a technical report prepared under the Australasian Code for Reporting of Exploration Results, Mineral Resources and Ore Reserves (“JORC Code”). As of the date of this disclosure, these operators of our material properties have not filed technical report summaries for the properties with the SEC for the year ended December 31, 2022.

Since we are a stream and royalty company, and as further discussed below, we are relying on the exemption for stream and royalty companies set forth in Section 1302(b)(3)(ii) of Regulation S-K, which provides that a stream, royalty or similar company is not required to file a technical report summary with the SEC with respect to an underlying property where either (a) obtaining the information would result in an unreasonable burden or expense, or (b) the company requested the technical report summary from the owner, operator or other person possessing the technical report summary who denied the request. Our summary and individual property disclosures are also provided in accordance with Sections 1303(a)(3) and 1304(a)(2) of Regulation S-K, respectively, which provide that a registrant with a stream, royalty or other similar right may omit certain information required by the summary and individual property disclosure requirements if the registrant specifies the information to which it lacks access, explains the reason it lacks the required information and provides all required information that it does possess or which it can acquire without incurring an unreasonable burden or expense.

Our agreements governing our material property interests do not require the operators to prepare technical report summaries or permit us the access and information sufficient to prepare our own technical report summaries under SK1300.

For each of our material properties, we requested that the operator prepare a technical report summary under SK1300 or permit us the access and information necessary for us to prepare our own technical report summary relating to the property for filing with the SEC. In each case, the operator denied our request. None of the operators is an affiliate of Royal Gold.  As a result, we do not have sufficient rights or access to the information required for us to prepare a technical report summary.

Mineral resources and mineral reserves discussed in Item 2 are as publicly disclosed or provided to us by the operators of the properties, as of the dates indicated in the disclosure. Royal Gold does not attempt to account for mineral resource or

1520

Table of Contents

Graphicmineral reserve depletion due to mining activities, nor for mineral resource or mineral reserve expansion due to exploration activities, because Royal Gold does not have access under its agreements with its operators to the technical data required to account for this depletion or expansion. In accordance with Sections 1303(a)(3) and 1304(a)(4) of SK1300, Royal Gold is providing all required information in its possession or which it can acquire without incurring an unreasonable burden or expense. The property information included herein contains information reported by our operators in their respective jurisdictions pursuant to SK1300, or applicable mining codes based on the Committee for Mineral Reserves International Reporting Standards (“CRIRSCO”), such as JORC Code and NI 43-101. The SEC’s disclosure regime under SK1300, while similar to other CRIRSCO-based codes used in other jurisdictions, does not permit the substitution or reciprocal recognition of resources and reserves determined under the mining disclosure regimes of other jurisdictions. Royal Gold is providing this information because it represents information that Royal Gold has in its possession that we consider to be material to our investors. While SK1300 definitions are substantially similar to those set forth in the CIM and JORC, there are variations. Therefore, the mineral resources, mineral reserves and other technical information included in this annual report on Form 10-K could vary if it had been determined by a mining operator required to comply with SK1300.

Stream Interests

Most of our principal properties are operated by companies that report mineral resources and reserves pursuant to regulatory standards other than SK1300. For example, each of Pueblo Viejo and Cortez, operated by Barrick, and Andacollo, (Region IV, Chile)operated by Teck Resources Limited (“Teck”), as reporting companies under Canadian securities laws, are permitted under SK1300 to rely on Canadian property and mineral resource and reserve reporting standards accepted in their home jurisdiction (NI 43-101 in Canada), rather than those set forth in SK1300, under the SEC’s Multijurisdictional Disclosure System. Further, Canadian securities laws and regulations allow annual information forms covering the previous fiscal year to be filed within 90 days (or 120 days in some instances) after the applicable company’s fiscal year end. Mount Milligan is operated by Centerra, which is not listed for trading in the U.S. and does not file reports under the Securities Exchange Act of 1934, as amended, with the SEC and therefore does not need to comply with SK1300.  Khoemacau is privately owned and is also not subject to SEC reporting. Peñasquito, operated by Newmont Corporation (“Newmont”), is our only principal property for which a property and technical report is prepared under SK1300. Newmont’s Annual Report on Form 10-K is subject to the same deadline as this Form 10-K, and thus their technical report is not filed in time for us to refer to it in this Form 10-K. As a result of the foregoing, in most cases, we refer to mineral resource and reserve information for our principal properties as of periods earlier than December 31, 2022, in reliance on the exception to SK1300 pertaining to royalty companies regarding information they do not have under 1302(b)(3), 1303(a)(3) and 1304(a)(2) of SK1300 as discussed above.

Internal controls for determining and reporting the mineral resources and mineral reserves disclosed in Item 2 are the internal controls specific to the individual projects and are maintained by the operators. In general, mineral resources and mineral reserves are supported by technical studies relevant to the jurisdictions within which the operators conduct their financial disclosure, and qualified persons specified by the operators (as determined by the laws and disclosure rules in the applicable jurisdictions) have endorsed the quality of the work. Royal Gold’s agreements with its operators do not give Royal Gold access to underlying technical data sufficient to specifically confirm the opinion of the qualified persons for each mineral resource or mineral reserve or the status of the qualified persons as qualified persons under SK1300.

Summary

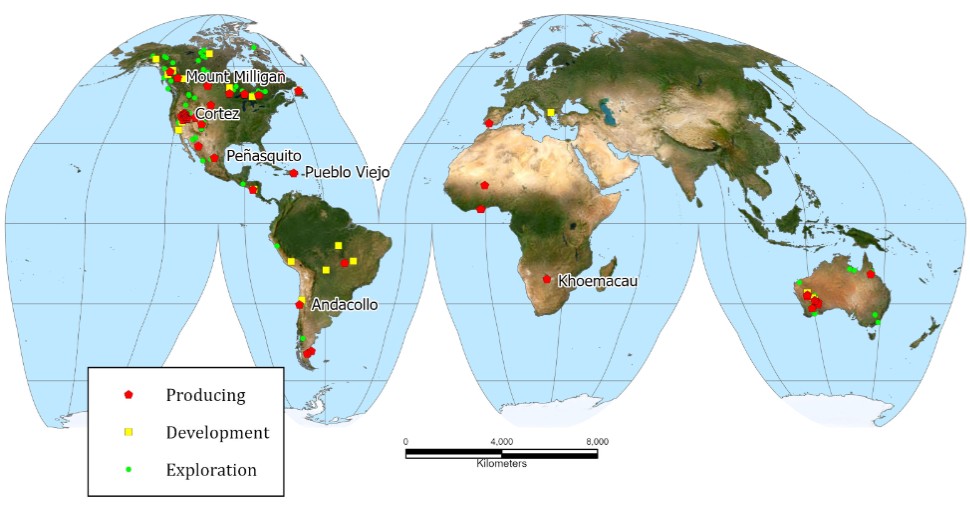
We own a large portfolio of stream and royalty interests on properties at various stages of review and development.

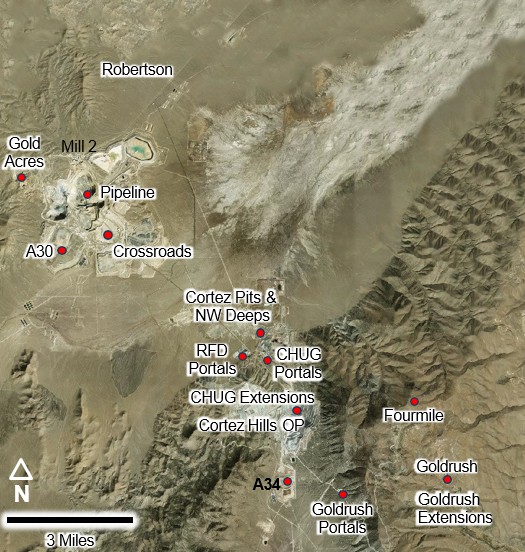
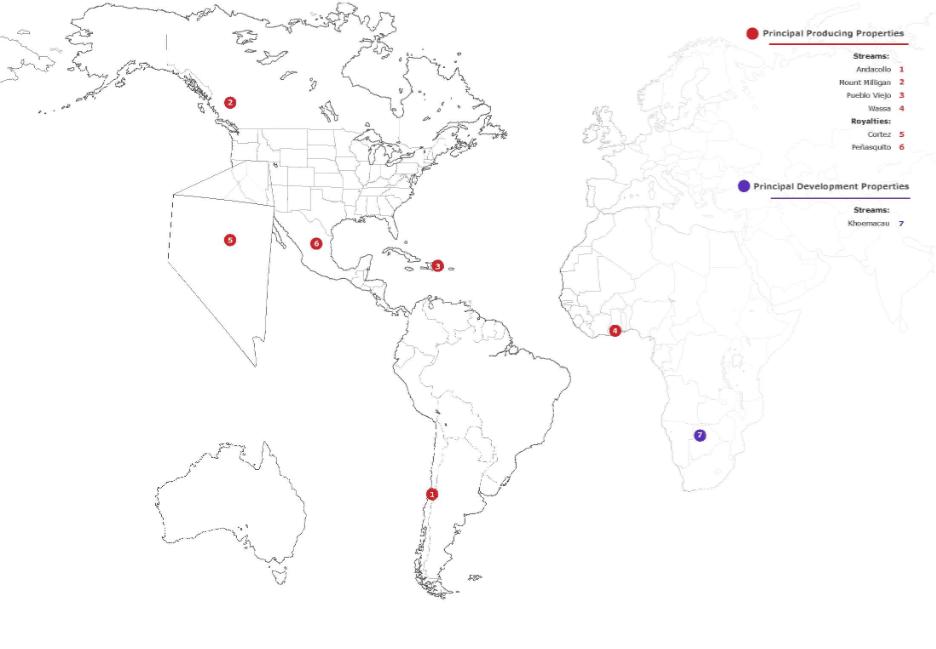
The Company’sfollowing map shows the approximate geographic distribution of all properties on which we hold stream or royalty interests. In many cases, properties shown on the map are in close proximity and the individual properties are not separately identifiable.  

21

Table of Contents

Graphic

Aggregate annual production for all properties on which we hold interests during the year ended December 31, 2022, the six months ended December 31, 2021, and fiscal years ended June 30 2021 and 2020 is shown in the table below.

Year Ended

Six Months Ended

Fiscal Years Ended

December 31, 

December 31, 

June 30,

June 30,

Stream

Metal

2022


2021


2021


2020

Mount Milligan

Gold (oz)

193,696

102,746

154,762

182,008

Copper (lb)

78,742,419

38,064,499

84,961,904

67,261,204

Andacollo

Gold (oz)

26,150

15,641

44,140

48,135

Pueblo Viejo

Gold (oz)

442,592

253,112

560,812

557,922

Silver (oz)

1,622,221

1,044,062

2,033,962

2,333,927

Khoemacau

Silver (oz)

896,883

257,680

-

-

Other

Gold (oz)

470,167

982,812

421,589

428,598

Other

��

Silver (oz)

425,791

448,958

355,638

314,645

Royalty

Cortez

Gold (oz)

414,117

226,419

237,023

173,319

Silver (oz)

126,792

37,780

36,280

14,326

Peñasquito

Silver (oz)

29,731,870

16,096,518

30,852,342

27,809,812

Copper (lb)

2,531,388

857,288

819,648

358,681

Lead (lb)

146,789,281

81,415,297

185,597,653

182,293,971

Zinc (lb)

373,148,732

212,349,387

412,746,614

393,861,837

Other

Gold (oz)

2,549,930

1,998,656

3,418,898

2,853,675

Other

Silver (oz)

2,843,599

1,316,894

3,305,133

5,708,602

Other

Copper (lb)

205,176,006

91,554,376

220,937,235

290,610,834

Other

Other (lb)

58,565,368

40,386,052

102,742,774

74,909,715

Location of the Properties

Approximately 86% of our revenue comes from properties outside of the United States, and most of our operators are organized outside of the United States. Our material properties are located in Botswana, Canada, Chile, the Dominican

22

Table of Contents

Republic, Mexico and the United States. Within the United States and other countries, indigenous people may be recognized as sovereign entities and may enforce their own laws and regulations.

Type and Amount of Ownership Interests

A metal stream is a purchase agreement that provides, in exchange for an upfront deposit payment, the right to purchase all or a portion of one or more metals produced from a mine, at a price determined for the life of the transaction by the purchase agreement. See “Certain Definitions” in Item 1. Business for more information.

Royalties are non-operating interests in mining projects that provide the right to a percentage of revenue or metals produced from the project after deducting specified costs, if any. See “Certain Definitions” in Item 1. Business for more information.

As of December 31, 2022, we owned 9 stream interests and 173 royalty interests.

Identity of Operator or Operators

We work with 137 different operators at our stream and royalty properties; 66 are headquartered in Canada, 23 are headquartered in the United States; and 48 are headquartered outside of Canada and the United States. In general, our operators are domiciled in the countries in which they operate. For further information about the operators of our material properties, refer to the section entitled “Material Properties” below.

Titles, Mineral Rights, Leases, or Options and Acreage Involved

The titles, mineral rights, leases, and options involved with our stream and royalty interests vary depending on the country and include exploitation concessions, unpatented and patented mining claims, fee lands, mining leases and prospecting and mining licenses. For information about the specific titles, mineral rights, leases, options and acreages involved at our material properties, refer to the section entitled “Material Properties” below.

We have an undeterminable number of acres relating to our stream and royalty interests because our interests do not always cover 100% of each property, in some cases our interests extend to an area of interest beyond the original property boundaries, and because the operators will, from time to time, add or subtract acreage from individual properties, which can, in some cases, modify the land position covered by a stream or royalty.

Stage of the Properties (Exploration, Development, or Production)

SK1300 subdivides mineral properties into 3 stages.

1.Production stage properties
2.Development stage properties
3.Exploration stage properties. Royal Gold further subdivides exploration stage properties into two categories:
a.Evaluation stage properties, for which mineral resources have been declared, supported by an appropriate technical report, and
b.Exploration stage properties, for which no mineral resources have been declared.

As of December 31, 2022, we owned stream interests on 8 production stage properties and 1 development stage property.

As of December 31, 2022, we owned royalty interests on 32 production stage properties, 18 development stage properties, and 123 exploration stage properties, of which we consider 52 to be evaluation stage properties.

Key Permit Conditions

Operators of the mines that are subject to our stream and royalty interests must comply with environmental, mine safety, land use, water use, waste disposal, remediation and public health laws and regulations promulgated by federal, state, provincial and local governments in the United States, Canada, Chile, the Dominican Republic, Mexico, Botswana, and other countries where we hold interests. Although we, as a stream or royalty interest owner, are not responsible for ensuring

23

Table of Contents

compliance with these laws and regulations, failure by the operators to comply with applicable laws, regulations and permits can result in injunctive action, orders to suspend or cease operations, damages, and civil and criminal penalties on the operators, which could have a material adverse effect on our results of operations and financial condition.

We have no decision-making authority regarding the development or operation of the mineral properties underlying our stream and royalty interests. Operators make all or substantially all development and operating decisions, including decisions about permitting, feasibility analysis, mine design and operation, processing, tailings storage facility (“TSF”) design and operation, plant and equipment matters, and temporary or permanent suspension of operations, as well as estimates of resources and reserves.

Mine Types and Mineralization Styles

Our operating stream and royalty interests cover all types of mineralization styles in a number of primary commodities. Table 1 shows mine types and mineralization styles at our principal properties.

Table 1 Mine Type and Mineralization Style for Principal Properties

Property

Mine Type

Mineralization styles

Andacollo

Open Pit

Porphyry Cu-Au

Cortez

Open Pit & Underground

Carlin-Type Sediment-Hosted Au

Khoemacau

Underground

Sediment-Hosted Cu-Ag

Mount Milligan

Open Pit

Porphyry Cu-Au

Peñasquito

Open Pit

Breccia-Hosted Pb-Zn-Au-Ag

Pueblo Viejo

Open Pit

High-Sulfidation Epithermal Au-Ag

Chemical symbols are used to refer to metals of economic importance: gold (“Au”), silver (“Ag”), copper (“Cu”), lead (“Pb”), and zinc (“Zn”).

Additional specific information on the principal properties is available in the section entitled “Material Properties”, below.

Processing Plants and Other Available Facilities

Facilities and infrastructure for our properties vary widely based on the stage of each property.

Our principal properties are all production stage properties. As such, each of our principal properties has infrastructure and facilities appropriate to conduct mining and processing operations. A summary of key processing infrastructure is shown in Table 2.

Table 2 Key Process Infrastructure for Principal Properties

,

Property

Processing

Andacollo

20.1 million tonne per annum (‘Mtpa”) sulfide flotation mill producing a copper-gold concentrate and copper dump leaching using SX-EW producing copper cathode

Cortez

4.90 Mtpa cyanide leaching mill along with gold dump leaching facilities for lower-grade, oxide gold ores and offsite processing of refractory ores, producing a gold-silver doré

Khoemacau

3.65 Mtpa sulfide flotation mill producing a copper-silver concentrate

Mount Milligan

21.9 Mtpa annum sulfide flotation operations, producing a single concentrate containing payable copper, gold and silver

Peñasquito

Sulfide flotation plant producing separate lead and zinc concentrates along with gold and silver doré from a pyrite leach circuit and from oxide ore dump leaching which has operated in the range of 35 to 36 Mtpa in recent years

Pueblo Viejo

8.76 Mtpa whole ore pressure oxidation and cyanide leaching plant producing separate gold and silver doré products

Measurement units presented in this document are generally metric units, with the exception that gold and silver quantities are reported in troy ounces and the content for copper, lead, and zinc are presented in pounds. There may be small rounding

24

Table of Contents

differences due to unit conversions. Additional specific information on the principal properties is available under Material Properties, below.

Mineral Resources and Reserves

Royal Gold controls metal streams and royalties for properties with a broad geographic distribution. Estimates of mineral resources and mineral reserves for these properties are tabulated based on the most recent disclosure presented by each of the individual operators of these properties, at dates and metal prices and grade and recovery assumptions specific to each mineral resource and mineral reserve estimate. It is not possible for Royal Gold to update or modify the individual mineral resource and mineral reserve statements because we do not have access to sufficient technical data required to do so. Table 3 is a summary of mineral resources exclusive of mineral reserves and aggregated by metal and by geographic area. Table 4 is a summary of mineral reserves aggregated by metal and by geographic area. Our material properties (Andacollo, Cortez, Khoemacau, Mount Milligan, Peñasquito and Pueblo Viejo) and properties with mineral resources and mineral reserves that represent over 10% of the aggregate mineral resources or reserves that generate our stream or royalty interests (Peñasquito and Red Chris) are listed individually.

Mineral resources and mineral reserves are presented for the properties or portions of the properties that generate our stream and royalty interests without regard to the specific percentage of Royal Gold’s stream and royalty interest. In cases where our stream or royalty interest covers only a portion of a property, only the covered portion of the mineral resource or mineral reserve is included in the summary.

Table 3: Summary Mineral Resources (1),(2),(3),(4)

Stream or
Royalty
Interest

Measured Mineral
Resources

Indicated Mineral
Resources

Measured &
Indicated Mineral
Resources

Inferred Mineral
Resources

Tonnes
(Millions)

Grade
(gpt or
%)

Tonnes
(Millions)

Grade
(gpt or
%)

Tonnes
(Millions)

Grade
(gpt or
%)

Tonnes
(Millions)

Grade
(gpt or
%)

GOLD RESOURCES

North America

Peñasquito

2.0% NSR

31.4

0.27

176.6

0.27

208.0

0.27

89.8

0.40

Red Chris (5)

1.0% NSR

9.5

0.15

437.5

0.30

447.0

0.30

188.5

0.32

Mount Milligan

35% of payable gold

36.5

0.26

152.8

0.31

189.3

0.30

4.6

0.47

Cortez

(6)

1.5

5.41

99.2

1.56

100.7

1.62

203.3

1.06

Remainder of North America

(7)

396.2

0.59

2,576.0

0.43

2,972.2

0.45

1,384.6

0.57

North America Total

(7)

475.2

0.55

3,442.1

0.43

3,917.2

0.45

1,870.8

0.59

Central America

Pueblo Viejo

7.5% of payable gold

11

1.41

50

1.51

61

1.50

4.6

1.80

Remainder of Central America

(7)

-

-

12.9

2.89

12.9

2.89

10.9

3.86

Central America Total

(7)

11

1.41

62.9

1.73

73.9

1.68

15.5

3.25

South America

Andacollo

100% of payable gold

41.5

0.11

353.9

0.09

395.4

0.09

72.6

0.08

Remainder of South America

(7)

37.7

1.63

326.4

1.37

364.1

1.40

313.7

1.10

South America Total

(7)

79.2

0.83

680.3

0.71

759.5

0.72

386.3

0.90

Africa

Africa Total

(7)

9.6

2.84

40.2

2.69

49.8

2.72

99.5

3.21

Australia

Australia Total

(7)

21.3

3.47

165.4

2.24

186.7

2.38

321.1

1.04

Europe

Europe Total

-

-

-

-

-

-

-

-

TOTAL GOLD RESOURCES

(7)

596.4

0.74

4,390.8

0.58

4,987.3

0.60

2,693.6

0.80

25

Table of Contents

SILVER RESOURCES

North America

Peñasquito

2.0% NSR

31.4

25.71

176.6

26.36

208.0

26.26

89.8

28.00

Remainder of North America

(7)

267.2

2.80

2,264.0

5.16

2,531.2

4.91

817.0

15.02

North America Total

(7)

298.6

5.21

2,440.6

6.69

2,739.2

6.53

906.8

16.31

Central America

Pueblo Viejo

75% of payable silver

11

6.79

50

8.29

61

8.02

4.6

10.5

Remainder of Central America

(7)

-

-

12.4

2.39

12.4

2.39

8.4

4.90

Central America Total

(7)

11

6.79

62.4

6.96

73.4

6.76

13.0

6.89

South America

South America Total

(7)

0.4

16.92

4.6

5.22

4.9

6.13

10.1

3.14

Africa

Khoemacau

100% of payable silver

5.6

24.76

14.8

25.33

20.4

25.17

59.2

22.12

Remainder of Africa

-

-

-

-

-

-

-

-

Africa Total

(7)

5.6

24.75

14.8

25.33

20.4

25.17

59.2

22.12

Australia

Australia Total

(7)

0.5

4.38

2.0

66.26

2.4

54.52

0.7

59.18

Europe

Europe Total

-

-

-

-

-

-

-

-

TOTAL SILVER RESOURCES

(7)

316.0

5.59

2,524.4

6.85

2,840.4

6.71

989.8

16.42

COPPER RESOURCES

North America

Mount Milligan

18.75% payable copper

36.5

0.21%

152.8

0.17%

189.3

0.18%

4.6

0.07%

Red Chris (5)

1.0% NSR

9.5

0.24%

437.5

0.33%

447.0

0.33%

188.5

0.30%

Remainder of North America

(7)

266.0

0.28%

2,480.0

0.25%

2,746.1

0.25%

908.5

0.24%

North America Total

(7)

312.0

0.27%

3,070.3

0.26%

3,382.4

0.26%

1,101.6

0.25%

Central America

Central America Total

-

-

-

-

-

-

-

-

South America

South America Total

(7)

38.0

0.12%

501.1

0.28%

539.2

0.26%

1,659.5

0.43%

Africa

Africa Total

-

-

-

-

-

-

-

-

Australia

Australia Total

(7)

0.5

1.22%

27.0

0.36%

27.4

0.38%

215.7

0.30%

Europe

Europe Total

(7)

19.2

0.28%

23.0

0.26%

42.2

0.27%

7.1

1.23%

TOTAL COPPER RESOURCES

(7)

369.7

0.26%

3,621.5

0.26%

3,991.2

0.26%

2,983.9

0.35%

(1)

The dates of the mineral resources range between December 31, 2014, and December 31, 2022. The information included in this table that relates to our material properties is dated December 31, 2021, except for Khoemacau, which is dated June 30, 2021, and Cortez and Pueblo Viejo, which are dated December 31, 2022.

(2)

The metal prices for the gold resources range between $1,100 per ounce and $1,800 per ounce; the metal prices for the silver resources range between $17.00 per ounce and $25.00 per ounce; and the metal prices for the copper resources range between $2.50 per pound and $3.50 per pound.

(3)

The metal prices, recoveries, and cut-off grades used for reporting of mineral resources are specific to each individual property and have been reviewed by qualified persons selected by the individual operators. Royal Gold has not made any determination that such persons are or are not “qualified persons” under SK1300.

(4)

In certain cases, we have omitted mineral resource information for properties other than our material properties.

26

Table of Contents

(5)

While the aggregate resources at Red Chris represent more than 10% of the aggregate mineral resources to which our royalty or stream interests apply, Royal Gold’s royalty interest in Red Chris is only a 1% NSR. Accordingly, we do not consider Red Chris to be a material property.

(6)

Royal Gold owns multiple royalty interests at the Cortez Complex, some of which overlap. For purposes of simplified disclosure, Royal Gold has divided its royalty interests at the Cortez Complex into two zones: the Legacy Zone and the Cortez Complex Zone (the “CC Zone”). The “Legacy Zone” royalty consists of an approximate equivalent 9.4% GSR royalty rate over the Pipeline and Crossroads deposits. The CC Zone includes an approximate equivalent 1.6% GSR royalty over the Cortez Hills, Cortez Pits, Fourmile and Goldrush deposits, an approximate equivalent 2.2% GSR royalty rate over the Goldrush SE deposit, and a 0.45% GSR royalty rate over the Robertson deposit.

(7)

Royal Gold owns royalty and stream interests in varying percentages on these properties. The resources listed are 100% of the resources to which the stream or royalty interest applies.

Table 4: Summary Mineral Reserves (1),(2),(3),(4)

Stream or
Royalty
Interest

Proven Mineral
Reserves

Probable Mineral
Reserves

Total Mineral
Reserves

Tonnes
(Millions)

Grade
(gpt or
%)

Tonnes
(Millions)

Grade
(gpt or
%)

Tonnes
(Millions)

Grade
(gpt or
%)

GOLD RESERVES

North America

Peñasquito

2.0% NSR

115.0

0.61

247.0

0.51

362.0

0.54

Red Chris (5)

1.0% NSR

-

-

472.5

0.52

472.5

0.52

Mount Milligan

35% of payable gold

76.5

0.37

169.7

0.37

246.2

0.37

Cortez

(6)

2.2

5.63

221.1

2.22

223.3

2.26

Remainder of North America

(7)

304.3

1.03

362.3

1.11

666.6

1.07

North America Total

(7)

498.0

0.85

1,472.6

0.89

1,970.6

0.88

Central America

Pueblo Viejo

7.5% of payable gold

35.0

2.29

140.0

2.16

170

2.19

Remainder of Central America

(7)

-

-

11.0

3.20

11.0

3.20

Central America Total

(7)

35.0

2.29

151.0

2.23

186.0

2.25

South America

Andacollo

100% of payable gold

103.0

0.10

178.6

0.10

281.6

0.10

Remainder of South America

(7)

13.9

1.29

51.8

1.27

65.7

1.27

South America Total

(7)

116.9

0.24

230.4

0.36

347.3

0.32

Africa

Africa Total

(7)

8.9

2.44

9.2

3.49

18.1

2.97

Australia

Australia Total

(7)

11.1

2.56

134.3

2.18

145.4

2.21

Europe

Europe Total

-

-

-

-

-

-

TOTAL GOLD RESERVES

(7)

669.9

0.87

1,997.5

1.03

2,667.4

0.99

SILVER RESERVES

North America

Peñasquito

2.0% NSR

115.0

38.26

247.0

31.79

362.0

33.84

Remainder of North America

(7)

52.3

11.07

92.9

9.54

145.3

10.09

North America Total

(7)

167.3

29.76

339.9

25.71

507.3

27.04

Central America

Pueblo Viejo

75% of payable silver

35

12.95

140

13.76

170

13.60

Remainder of Central America

(7)

-

-

11.0

4.44

11.0

4.44

Central America Total

(7)

35

12.95

151.0

13.09

186.0

13.14

South America

South America Total

(7)

2.1

2.56

134.3

2.18

145.4

2.21

27

Table of Contents

Africa

Khoemacau

100% of payable silver

11.0

20.76

22.9

19.15

33.9

19.67

Remainder of Africa

-

-

-

-

-

-

Africa Total

(7)

11.0

20.76

22.9

19.15

33.9

19.67

Australia

Australia Total

-

-

-

-

-

-

Europe

Europe Total

-

-

-

-

-

-

TOTAL SILVER RESERVES

(7)

215.4

26.81

513.8

21.71

729.2

23.21

COPPER RESERVES

North America

Mount Milligan

18.75% payable copper

76.5

0.20%

169.7

0.18%

246.2

0.18%

Red Chris (5)

1.0% NSR

-

0.00%

472.5

0.45%

472.5

0.45%

Remainder of North America

(7)

93.2

0.62%

50.1

0.75%

143.3

0.66%

North America Total

(7)

169.7

0.43%

692.2

0.40%

861.9

0.41%

Central America

Central America Total

(7)

-

-

-

-

-

-

South America

South America Total

(7)

118.1

0.60%

88.6

0.42%

206.7

0.52%

Africa

Africa Total

-

-

-

-

-

-

Australia

Australia Total

-

-

-

-

-

-

Europe

Europe Total

-

-

-

-

-

-

TOTAL COPPER RESERVES

(7)

287.8

0.50%

780.9

0.40%

1,068.7

0.43%

(1)

The dates of the mineral reserves range between December 31, 2014, and December 31, 2022. The information included in this table that relates to our material properties is dated December 31, 2021, except for Khoemacau, which is dated June 30, 2021, and Cortez and Pueblo Viejo, which are dated December 31, 2022. Certain nonmaterial properties have reserve reports prepared prior to December 31, 2021, under SEC Industry Guide 7, the predecessor to SK1300.

(2)

The metal prices for the gold reserves range between $1,100 per ounce and $1,750 per ounce; the metal prices for the silver reserves range between $16.00 per ounce and $25.00 per ounce; and the metal prices for the copper reserves range between $2.50 per pound and $3.50 per pound.

(3)

The metal prices and modifying factors used for reporting of mineral reserves are specific to each individual property and have been reviewed by qualified persons selected by the individual operators. Royal Gold has not made any determination that such persons are or are not “qualified persons” under SK1300.

(4)

In certain cases, we have omitted mineral reserve information for properties other than our material properties.

(5)

While the aggregate mineral reserves at Red Chris represent more than 10% of the aggregate mineral reserves to which our royalty or stream interest applies, Royal Gold’s royalty interest in Red Chris is only 1% NSR. Accordingly, we do not consider Red Chris to be a material property.

(6)

Royal Gold owns multiple royalty interests at the Cortez Complex, some of which overlap. For purposes of simplified disclosure, Royal Gold has divided its royalty interests at the Cortez Complex into two zones: the Legacy Zone and the Cortez Complex Zone (the “CC Zone”). The “Legacy Zone” royalty consists of an approximate equivalent 9.4% GSR royalty rate over the Pipeline and Crossroads deposits. The CC Zone includes an approximate equivalent 1.6% GSR royalty over the Cortez Hills, Cortez Pits, Fourmile and Goldrush deposits, an approximate equivalent 2.2% GSR royalty rate over the Goldrush SE deposit, and a 0.45% GSR royalty rate over the Robertson deposit.

(7)

Royal Gold owns stream and royalty interests in varying percentages on these properties. The reserves listed are 100% of the reserves to which the royalty or stream interest applies.

​The operators of the properties in which we hold stream and royalty interests generally prepare production and mineral reserve estimates for the properties. We do not independently prepare or verify this information, and we do not have access

28

Table of Contents

to sufficient data to do so. There are numerous uncertainties inherent in these estimates, many of which are outside the operators’ control. As a result, production and mineral reserve estimates are subjective and necessarily depend upon a number of assumptions, including, among others, reliability of historical data, geologic and mining conditions, metallurgical recovery, metal prices, operating costs, capital expenditures, development and reclamation costs, mining technology improvements, and the effects of government regulation. If any of the assumptions that operators make in connection with production or mineral reserve estimates are incorrect, actual production could be significantly lower than the production or mineral reserve estimates, which could adversely affect our future revenue and the value of our investments. In addition, if operators’ estimates with respect to the timing of production are incorrect, we may experience variances in expected revenue from period to period.

Some operators also report publicly or to us estimates of mineral resources. Mineral resources are subject to future exploration and development and associated risks and may never convert to future reserves. In addition, estimates of mineral resources are subject to similar uncertainties and assumptions as discussed above with respect to mineral reserves.

Material Properties

The disclosures below regarding our principal properties are derived from publicly available reports of the operators and/or other reports provided to Royal Gold under the terms of Royal Gold’s stream or royalty agreements with the respective operators and have generally been prepared pursuant to the mining disclosure regime of the applicable jurisdiction in which the operator reports. We do not independently prepare or verify this information and, as the holder of the stream or royalty interest, we do not have access to the properties or operations or to sufficient data to do so. We are dependent on the operators of the properties to provide information to us. There can be no assurance, and we cannot verify, that such third-party information is complete or accurate. We often refer to these material properties as “principal properties” in this Report.

Andacollo

The disclosures below regarding Carmen de Andacollo (“Andacollo”) are derived from the Technical Report dated July 12, 2006, pursuant to NI 43-101, as well as Teck’s Annual Information Form, dated February 28, 2022, attached as Exhibit 99.1 to the Annual Report on Form 40-F for the year ended December 31, 2021, of Teck. Teck presents mineral resource and mineral reserve updates pursuant to CIM Standards. Royal Gold requested information prepared in accordance with SK1300 or access to underlying technical data sufficient to prepare its own technical report summary, and the operator denied the request.

29

Table of Contents

Graphic

Location

Andacollo is an open-pit mine and milling operation located in central Chile, Coquimbo Region at 30.25°S latitude and 71.10°W longitude and is operated by Compañía Minera Teck Carmen de Andacollo (“CMCA”), a 90% owned subsidiary of Teck. The Andacollo mine is located in the foothills of the Andes Mountains approximately 2 kilometers (“km”) southwest of the town of Carmen de Andacollo, 55 km southeast from the regional capital of La Serena, and Santiago is approximately 350 km south by air.

The mine property lies at the southern limit of the Atacama Desert at a mean elevation of 1050 meters (“m”) above sea level. Geomorphologically, it is characterized by northerly trending valleys bounded by low rolling foothills of the Andes. The average annual temperature is 18.8°C with a range from -5°C in the winter to 32°C in the summer. Average annual rain fall is low (less than 100 millimeters (“mm”)) and concentrated within the months of May to August.

Infrastructure

Infrastructure to support the mining and processing operation is in place and fully supports the operation.

Access to the mine is provided by Route 43 (“R-43”) south from La Serena to El Peñon. From El Peñon, D-51 is followed east and eventually curves to the south to Andacollo. Both R-43 and D-51 are paved roads.

The mine is along a 2 km section of paved road from the town of Carmen de Andacollo. Airport facilities are available in La Serena with connections to Santiago and other cities located in the northern portion of the country. Port facilities are available at Coquimbo.

Andacollo is supplied with electric power by a 110 kilovolt (“kV”) line from El Peñon. In August 2020, CDA entered into a long-term power purchase agreement to provide 100% renewable power for Andacollo’s operations, which went into effect in September 2020 and will run through the end of 2031.

Process water is currently pumped to the site via a 30-centimeter (“cm”) diameter pipeline, primarily sourced from groundwater extracted at the Alfalfares region approximately 50 km from the site with a minor portion of the water supply coming from the Pan de Azucar region.

30

Table of Contents

Several mines operate within the same geographical area and, as such, supplies, material and experienced mine labor are readily available. The majority of mine personnel live in the town of Carmen de Andacollo or in the nearby cities of Coquimbo and La Serena. These cities have a combined population of about 350,000 inhabitants, with housing, shopping and construction facilities.

Area of Interest

Our stream interest at Andacollo covers 1,225 exploitation mining concessions, including 1,174 concessions termed the “Mining Properties” and 51 concessions termed the “Dayton Concessions.” Our interest also covers any additional claims held before the effective date of the stream agreement, as described below, or acquired after the effective date which are wholly or partially located within an approximately 1.5 km radius from the external boundary of the “Mining Properties,” any mining concessions held by CMCA or acquired following the effective date which are wholly or partially located within approximately 1 km radius from certain boundaries laid out in the agreement, and any Dayton Concession held by CMCA as of the effective date of the agreement, or acquired after the effective date.

Stream Agreement

Under the Long Term Offtake Agreement dated July 9, 2015, between CMCA and our wholly owned subsidiary, RGLD Gold AG (“RGLD Gold”) owns, we own the right to purchase 100% of the gold produced from the Andacollo copper-gold mine until 900,000 ounces of payable gold have been delivered, and 50% thereafter. The cash purchase price equals 15% of the monthly average gold price for the month preceding the delivery date for all gold purchased. As of June 30, 2020,December 31, 2022, approximately 237,100326,700 ounces of payable gold have been delivered to RGLD Gold.  us.

Although Andacollo is an open-pitprimarily a copper mine, our stream agreement covers only gold and milling operation locatednot copper production. We provide certain information on copper resources and reserves and production methods in central Chile, Region IV in the Coquimbo Province and is operated by Compañíorder to provide a Minera Teck Carmen de Andacollo (“CMCA”), a 90% owned subsidiary of Teck Resources Limited (“Teck”). The Andacollo mine is located in the foothillsbetter understanding of the Andes Mountains approximately 1.5 miles southwest of the town of Andacollo. The regional capital of La Serena and the coastal city of Coquimbo are approximately 34 miles northwest of the Andacollo mine by road, and Santiago is approximately 215 miles south by air. Access to the mine is provided by Route 43 (R-43) south from La Serena to El Peñon. From El Peñon, D-51 is followed east and eventually curves to the south to Andacollo. Both R-43 and D-51 are paved roads.

Stream deliveries from Andacollo were approximately 43,900 ounces of gold during the fiscal year ended June 30, 2020, compared to approximately 51,900 ounces of gold during the fiscal year ended June 30, 2019.  Stream deliveries decreased as a result of the temporary suspension of operations during the quarter ended December 31, 2019, due to a workers’ strike from October 14, 2019 through December 5, 2019, which was resolved with the ratification of a new 36-month collective agreement.operation.

Property Description

The Andacollo operation consists of an open pit mine, sulfide concentrator and copper heap leach facility.

The open pit mine is designed with a 10-meter bench height and an average overall pit slope of 53 degrees. A conventional owner operated and maintained truck and shovel mining operation is used for exploiting the hypogene reserve. See “Property Geology” below. Mining is carried out with 26 cubic meter (“m3”) hydraulic shovels and 19 m3 front-end loaders loading 180-tonne capacity haul trucks.

The life of mine waste to ore ratio was 0.35:1 at the start of the mine life and has reduced over time. With the majority of the mining activity, ore is delivered to stockpiles or the primary crusher and approximately 95% of the waste rock is used for the tailings dam construction.

Copper concentrate is produced by processing hypogene ore through semi-autogenous grinding and a flotation plant with the capacity to process up to 55,000 tonnes per day (“tpd”), depending on ore hardness. There is minor ongoing leaching of supergene ore on heap leach pads. Copper-bearing solutions from the heap leach are processed in an SX-EW plant to produce grade A copper cathode.

Copper concentrates produced by the operation are sold under long-term contracts to smelters in Asia and Europe, using the LME Price as the basis for copper pricing, and with treatment and refining charges negotiated on an annual basis.

The copper cathode produced at Andacollo is sold under annual and spot contracts. The price of copper cathodes is based on LME Prices plus a premium based on market conditions.

Tailings from the ore processing operation are stored in a single facility that has been used since the sulfide concentrator processing was initiated in 2010. The facility consists of five retention structures and high natural topography. The full

1631

Table of Contents

Teck expects gradesfacility is designed with six downstream embankment raises, which has a design capacity sufficient for the current ore reserve.

Age and Condition of Infrastructure

The sulfide concentrator was commissioned in 2010.

Royal Gold does not have specific information as to continuethe physical condition or age of the equipment and infrastructure.

Book Value

Royal Gold is not permitted to decline towards reserve gradesdisclose the operator’s book value or total cost detail for the property and associated plant and equipment.

Property History

CMCA began mining the oxide and supergene enrichment zone of the Andacollo copper deposit in calendar year 2020January 1996. Supergene and future years.oxide ores were processed by heap leaching and production of copper cathode in an SX-EW plant. Beginning in 2010, the mine began processing hypogene ore (which underlies the supergene ore) through a mill and concentration plant at site producing concentrates for third-party offtake.

Permitting and Encumbrances

In December 1994, CMCA prepared an environmental impact study for the Andacollo mine with the terms of reference of the study established by CMCA and the Comité Regional de Medio Ambiente (“COREMA”). The results of this study were presented before COREMA for approval. On July 13, 1995, COREMA granted CMCA an environmental permit to operate the existing Andacollo mine.

According to the operator, all major permits for current operations are in place and the operation is in material compliance with those permits. However, the operator discloses that the current life of mine for Andacollo is expected to continue until calendar2035 and that additional permitting or amendments will be required to execute the life of mine plan.

Property Geology

The Andacollo orebody is a porphyry copper deposit consisting of disseminated and fracture-controlled copper mineralization contained within a gently dipping sequence of andesitic to trachytic volcanic rocks and sub-volcanic intrusions. The mineralization is spatially related to a feldspar porphyry intrusion and a series of deeply-rooted fault structures. A primary copper-gold sulfide deposit (the “hypogene deposit”) containing principally disseminated and quartz vein-hosted chalcopyrite mineralization lies beneath the supergene deposit. The hypogene deposit was subjected to surface weathering processes resulting in the formation of a barren leached zone with a thickness of 10 to 60 m. The original copper sulfides leached from this zone were re-deposited below the barren leached zone as a copper-rich zone comprised of copper silicates (chrysocolla) and supergene copper sulfides (chalcocite with lesser covellite).

Mineral Resources and Mineral Reserves

Table 1 Andacollo – Summary of Gold Mineral Resources at December 31, 2021, Based on $1,500 Au, $3.00 Cu (1),(2),(3),(4)

Amount

Tonnes (M)

Au Grades

gpt

Cu Grades

%

Cut-Off Grade 

Metallurgical Recovery

Measured Mineral Resources

41.5

0.11

0.28

0.15 to 0.21% Cu

(5)

Indicated Mineral Resources

353.9

0.09

0.25

0.15 to 0.21% Cu

(5)

Measured + Indicated Mineral Resources

395.4

0.09

0.25

0.15 to 0.21% Cu

(5)

Inferred Mineral Resources

72.6

0.08

0.25

0.15 to 0.21% Cu

(5)

32

Table of Contents

(1)

Our metal stream on Andacollo pertains only to gold produced. Information on copper resources is included because the primary production from Andacollo is copper; the presentation of copper mineral resources is necessary to understanding the economics of the project.

(2)

Reported mineral resource is as of December 31, 2021, the most recent available public disclosure. Teck reports mineral resources pursuant to CIM Standards. SK1300 does not permit reciprocal recognition of mineral resources determined under the mining disclosure regime of another jurisdiction. The amounts, grades and recovery of mineral resources determined under SK1300 could vary from the disclosure set forth here. While the SK1300 definitions are substantially similar to those set forth in the CIM Standards, there are variations.

(3)

Mineral resources are presented exclusive of mineral reserves.

(4) Our stream interest at Andacollo is 100% of payable gold until 900,000 ounces are delivered, and 50% thereafter. The resources listed are 100% of the mineral resources to which our stream interest applies.

(5)Copper recoveries range from 82% to 91.5%, averaging 88.7%. Gold recoveries average 68.1%

Table 2 Andacollo – Summary of Gold Mineral Reserves at December 31, 2021, Based on $1,500 Au, $3.00 Cu (1),(2),(3)

Amount

Tonnes (M)

Au Grades

gpt

Cu Grades

%

Cut-Off Grade

Metallurgical Recovery

Proven Mineral Reserves

103.0

0.10

0.33

0.15 to 0.21% Cu

(4)

Probable Mineral Reserves

178.6

0.10

0.31

0.15 to 0.21% Cu

(4)

Total Mineral Reserves

281.6

0.10

0.32

0.15 to 0.21% Cu

(4)

(1)

Our metal stream on Andacollo pertains only to payable gold produced. Information on copper mineral reserves is included because the primary production from Andacollo is copper; the presentation of mineral reserves is necessary in understanding the economics of the project.

(2)

Reported mineral reserve is as of December 31, 2021, the most recent available public disclosure. Teck reports reserves pursuant to CIM Standards. SK1300 does not permit reciprocal recognition of reserves determined under the mining disclosure regime of another jurisdiction. The amounts, grades and recovery of mineral reserves determined under SK1300 could vary from the disclosure set forth here. While the SK1300 definitions are substantially similar to those set forth in the CIM Standards, there are variations.

(3)  Our stream interest at Andacollo is 100% of payable gold until 900,000 ounces are delivered, and 50% thereafter. The gold mineral reserves listed are 100% of the reserves to which our stream interest applies

(4)  Copper recoveries range from 82% to 91.5%, averaging 88.7%. Gold recoveries average 68.1%.

Change in Mineral Resources and Mineral Reserves from Prior Year

The previous mineral resources and mineral reserves reported by Teck were as of December 31, 2020. Gold mineral reserves decreased from 0.97 million ounces to 0.91 million ounces (6.6%) year 2035. Additionalover year.  Gold mineral resources increased from 1.0 million ounces to 1.17 million ounces (14%) year over year. Teck reported that the reduction in mineral reserves was a result of depletion from normal mining activities, the transfer back to mineral resources, and lower processing recoveries. Teck reported that the increase in mineral resources was a result of improved economic assumptions related to operational costs, higher gold prices, and adjustments in mine designs.

Recent Developments

Stream deliveries from Andacollo were approximately 27,700 ounces of gold during the year ended December 31, 2022, compared to approximately 37,500 ounces of gold during the year ended December 31, 2021. The decrease in deliveries resulted primarily from Andacollo experiencing lower gold grades, lower gold recoveries and lower tonnage milled.

As reported by Teck, a significant rainfall event in July 2022 caused operations to shut down for five days. We expect the impact of this shutdown and unplanned maintenance in the third quarter will affect stream deliveries in the first quarter of

33

Table of Contents

2023. Gold production at Andacollo has trended lower since the beginning of 2021 due to lower ore grades, as anticipated in the mine plan. According to Teck, the period of lower grades is expected to last through 2023, and the mine plan then anticipates a transition to higher grade ore as the next phase of mining is developed over the following years. Teck has reported that the current life of mine for Andacollo is expected to continue until 2035 and that additional permits or permit amendments will be required to execute the life of mine plan.

Khoemacau Project (Botswana)Khoemacau

In February 2019, RGLD Gold entered into The disclosures below regarding Khoemaca silver stream withu are derived from the Preliminary Economic Assessment - NI 43-101 Technical Report dated May 14, 2012, pursuant to NI 43-101, and non-public mineral resource and mineral reserve updates provided by Khoemacau Copper Mining (Pty.) Limited (“KCM”) forpursuant to the purchase of silver produced fromJORC Code. Royal Gold requested information prepared in accordance with SK1300 or access to underlying technical data sufficient to prepare its own technical report summary, and the operator denied the request.

Graphic

Location

Khoemacau Project (“Khoemacis a copper-silver development project located within the Ngamiland District of Botswana and is owned by KCM. The project’s mining area, Zone 5, and ore processing facilities, Boseto, are separated by a distance of 35 km. The Zone 5 mine area is generally south-west of the town of Maun and approximately 23 km south of the town of Toteng, and the Boseto facility is located at 20.56°S latitude and 22.95°E longitude with an approximate elevation of 1,000 m.

The climate of the project area is classified as semi-arid, with highly variable and unreliable rainfall. Rainfall is concentrated in the summer months from October to April and typically falls in high intensity convectional showers that are often highly localized. Winters are very dry, usually with no precipitation at all in July and August. Annual rainfall is normally less than 500 mm.

Infrastructure

Infrastructure to support the mining and processing operation is in place and fully supports the operation.

34

Table of Contents

Access to the Boseto mill site is via the paved Trans Kalahari Highway (Highway A3) from Maun 65 km southwest to just east of the town of Toteng, and a further 25 km by unpaved road to the south of Toteng. Zone 5 and the Boseto mill are connected by a 35 km divided sealed road to support both mill vehicle traffic and ore transport.

u”).

The city of Maun has an airport with connection within Botswana and several cities in South Africa.

Electric power is provided by a 132 kV line from the Botswana Power Corporation grid via a 50 km overhead transmission line connection. A 132 kV transmission line also links the Boseto plant to Zone 5 allowing all operations to be supplied by grid power. Existing diesel generation capacity from the previous Boseto operations is being used as backup power.

Water is being supplied from two wellfields, at the Boseto borefield, located 60 km from the Boseto plant, and the Haka borefield, connected to Zone 5 with a 40 km pipeline.

Labor and supplies for most of the basic mining and exploration needs for the project can be obtained from Maun, which has a population of approximately 56,000 (2011 Census) and hosts a wide range of supplies, services and labor. Many skills required to operate a mechanized underground mine are not available in Botswana and are sourced internationally. Both Boseto and Zone 5 have accommodation facilities for workers during their rotation work period.

Area of Interest

KCM controls 4040 km2 of mineral concessions of which our stream interest covers an area of interest surrounding Mining License 2015/015L with an area of 176 km2 (17,600 hectares), measuring 8 km by 22 km, which covers all reserves and resources referred to as Zone 5. Our area of interest also includes the Mango NE deposit.

Stream Agreement

Under the purchaseSilver Purchase and sale agreement, subject to the satisfaction of certain conditions,Sale Agreement dated February 24, 2019, between KCM and RGLD Gold, will make advance payments totaling $212 million towardas amended,we own the purchaseright to receive 100% of 80% of the payable silver produced from Khoemacau until certainthe delivery thresholds are met (the “Base Silver Stream”). At KCM’s option and subject to various conditions, RGLD Gold will make up to an additional $53 million in advance payments for up to the remaining 20% of the silver produced from Khoemacau (the “Option Silver Stream”). The stream rate will drop to 40% of silver produced from Khoemacau following delivery to RGLD Gold of 3240.0 million silver ounces, under the Base Silver Stream, or toand 50% of the silver produced from Khoemacau following delivery of 40 million silver ounces to RGLD Gold should KCM exercise the entire Option Silver Stream. RGLD Gold willthereafter. We pay a cash price equal to 20% of the spot silver price for each ounce delivered under the Base Silver Stream and Option Silver Stream;delivered; however, if KCM achieves mill expansion throughput levels above 13,000 tonnes per daytpd (30% above current mill design capacity), RGLD Goldwe will pay a higher ongoing cash price under the Base Silver Stream and Option Silver Stream for silver ounces delivered in excess of specific annual thresholds. As of December 31, 2022, approximately 1.2 million ounces of payable silver have been delivered to us.

Khoemacau is a copper-silver development project located within the North West and Ghanzi Districts of Botswana owned by KCM. The license area is generally southwest of the town of Maun and northeast of the town of Ghanzi. Khoemacau is accessed from the city of Maun, approximately 40 miles southwest to the town of Toteng on a major travel route, Botswana’s A3 highway, a paved road and then approximately 16 miles on gravel road to reach the Boseto plant site. The Zone 5 mining area is connected to the Boseto plant by a 20-mile gravel road.

According to KCM, progress continued at Khoemacau during the June 2020 quarter and the project reached approximately 54% of construction completion as of June 30, 2020 with 81% of the capital committed. According to KCM, activities are focused on refurbishment of the Boseto mill, underground development, completion of accommodation, power and water infrastructure at Zone 5 and completing construction of the haul road between Zone 5 and the Boseto mill. Also, according to KCM, underground development has cumulatively advanced 2,360 meters in the five declines, which is in line with planned development rates.

On July 5, 2020, RGLD Gold made its fourth advance payment of $11.1 million, which brings the total contribution to $146.8 million. RGLD Gold expects to commit approximately $35 - $45 million during the remainder of calendar year 2020, and assuming the midpoint of this range, the total remaining commitment in calendar year 2021 is expected to range from approximately $25 million for the Base Silver Stream up to approximately $78 million should KCM elect to fully exercise the Option Silver Stream. Further payments are subject to certain conditions and are scheduled to be made on a quarterly basis using an agreed formula and certification process as project spending progresses.

According to KCM, although a six-month state of emergency has been declared by the Government of Botswana to help prevent the spread of COVID-19, mining has been designated an “essential service” and general development activity at Khoemacau is continuing. However, due to the impacts experienced from travel restrictions, some activities have been slowed or rescheduled.  Barring any potential further impacts caused by COVID-19 considerations, we now expect the first shipment of concentrate to occur late in the third calendar quarter of 2021.Property Description

Mount Milligan (British Columbia, Canada)The Khoemacau operation consists of a mechanized underground mine producing from the Zone 5 orebody and a sulfide ore flotation plant for ore processing at Boseto. The project completed construction in the second half of calendar 2021 and ramp-up of mining and processing operations to the target production rate of 3.65 Mtpa (10,000 tpd) was achieved in December, 2022, as announced by KCM.

RGLD Gold owns the rightThe Zone 5 mine is a bulk mechanized mine, designed for a total production rate of 3.65 Mtpa through three mining corridors, with a single mining corridor production rate between 1 to purchase 35%2 Mtpa. The mine design is based on a Long Hole Open Stoping mining method. The first section of the payable goldmine incorporates pillars and 18.75%no paste backfill; however, paste backfill will be used as depth increases to improve overall mineral resource recovery.

Given that the orebody has a strike length of more than 4 km, it necessitated dividing the orebody into mining corridors due to the mining method selected, with separate decline systems dedicated to servicing each corridor. The twin decline layout allows for more than 1,000 meter coverage of strike extent of the payable copper produced from the Mount Milligan copper-gold mine in British Columbia, Canada, which is operated by an indirect subsidiary of Centerra Gold Inc. (“Centerra”). The cash purchase price for gold is equal to the lesser of $435 per ounce, with no inflation adjustment, or the prevailing market price when purchased. The cash purchase price for copper is 15%orebody, while offering multiple orezone attack points, highly productive layouts, and significant redundancy. Two of the spot price.  As of June 30, 2020, approximately 516,500 ounces of payable goldmining corridors are equipped with twin declines, while one corridor is equipped with a single decline.

The Zone 5 site is equipped with all maintenance, warehousing, administration and 34.71 million pounds of payable copper have been deliveredpersonnel accommodation facilities to RGLD Gold.fully support underground mining activities.

1735

Table of Contents

The mined ore is trucked approximately 35 km from the Zone 5 mine to the Boseto processing facility on a purpose built, fully sealed bitumen haul road, with a separate access road for light vehicles.

At Boseto, ores are processed in the 3.65 Mtpa sulfide concentrator, producing a copper-silver concentrate, which is purchased by third parties. Concentrate is loaded into approximately 1 tonne fabric bags for transport by road to port, for shipping and sale on the international market.

Tailings generated from the plant are deposited on a circular TSF, located south-west of the plant. Tailings are deposited mainly by spigot with a center decant tower for water recovery. The facility is designed as an upstream constructed facility, which enables concurrent rehabilitation to take place during operation.

The Boseto site is equipped with all maintenance, warehousing, administration and personnel accommodation facilities to fully support ore processing activities.

Age and Physical Condition of Infrastructure

Underground mining equipment and mine infrastructure are new. The associated Boseto concentrator is a previously existing installation which underwent significant overhauls and refurbishment starting in 2018.

Royal Gold does not have specific information as to the physical condition or the age of the equipment and infrastructure.

Book Value

The operator does not provide Royal Gold with the operator’s book value or total cost detail for the property and associated plant and equipment.

Property History

The first exploration over the Khoemacau area dates to the early 1960’s when Johannesburg Consolidated Investments was active in the area. Sporadic exploration over the project area between 1960 and 2008 consisted of geochemical, geophysical (airborne and ground) and diamond / RC drilling programs. KCM acquired the Zone 5 Licences in 2013.

Other deposits on the same project lease have been previously mined by open pit methods. This most notably includes the North and South Plutus Pits, and the Zeta pit to the South. These pits were worked extensively between 2012 and 2015 by Discovery Copper Botswana (Pty) Limited (“DCB”), which was owned and operated by Discovery Metals Limited. Due to these previous operations, a processing plant and infrastructure was already in place at Boseto when KCM acquired DCB from provisional liquidation in 2015.

Permitting and Encumbrances

Approvals for the operation are divided into the Mining Licenses issued by the Department of Mines and environmental approvals issued by the Department of Environmental Affairs (“DEA”). The following list of approvals is a subset of a much larger group of approvals received for the exploration, project development and operation of KCM’s activities.

Mine licenses have been issued by the Department of Mines as follows:

Khoemacau Copper Mining Zone 5 Mining License (ML 2015/05L) – issued in 2015 with a 20-year validity. Khoemacau has recently revised this Mine License to include the new surface infrastructure at Zone 5 on the footwall side of the deposit and for the potential future processing of ore from other deposits controlled by KCM; and,
Discovery Copper Botswana Mining License (Discovery ML 2010/99L) – issued in 2010 with 15-year validity. This Mining License was amended in 2014 and 2015 to include exploitation of the Zeta and Zeta NE targets, respectively. This Mining License was also amended in 2017 to reflect the execution of the Starter Project (i.e., throughput at the mill of 3.65 Mtpa).

36

Table of Contents

Five DEA approvals were received for the project, each requiring an individual Environmental and Social Impact Statements:

Boseto ML Amendment– including mill capacity increase from 3 to 3.65 Mtpa, repairs/modifications of surface infrastructure at the Boseto site, and sourcing of ore from Zone 5 (Authorized in November 2017);
Zone 5 ML Amendment – including five additional boxcuts (to reflect the Zone 5 Expansion case) and construction of a 6. Mtpa processing facility at Zone 5, including TSF (Authorized in May 2018);
Access Road/Haul Route – including service corridors for roads between A3, Boseto, and Zone 5. Also including emplacement of water pipelines from Haka, Boseto (Khoemacau), and Zone 5 borefields as well as authorization of project power and communications line routing between Zone 5 and Boseto (Authorized in April 2017);
BPC Powerline – including the powerline from the Legolthwane substation near Toteng village to Boseto (Authorized in May 2018); and,
Communications Tower – a new cellular tower on an existing communications site in the Kwebe Hills (Authorized in May 2017).

The submission of biannual monitoring reports to the DEA is a requirement of approval of the five separate Environmental Authorizations.

Additional prospecting licenses are in place for active exploration areas.

Property Geology

The Khoemacau Project area is located in the Kalahari copper belt, which stretches over approximately 800 km from central Namibia to the east of Botswana. The deposit is hosted within the Ghanzi-Chobe Fold Belt, a series of deformed metavolcanic and metasedimentary rocks. Deposits within the fold belt typically consist of stratiform copper mineralization within veins between specific rock units.

Zone 5 has a deposit strike length of 4 km with mineralization dipping at 56 degrees to the south-east over an average thickness of 10 m. Mineralization is situated in the hanging wall sequence, 30 m above the contact between the Kar Formation and Ngwako Pan Formation. Mineralization is sub-parallel to lithology and typically cross-cuts host units from the lower D’Kar limestone unit in the south-west to the carbon rich siltstone unit and interbedded alternating siltstone and sandstone unit toward the north-east. The host rock assemblage is sandwiched between two competent sandstone units; the footwall Ngwako Pan quartzite sandstone and the hanging wall Marker sandstone. The down dip extension of mineralization has been drilled to a maximum depth of 1,200 m vertically below surface. The deposit remains open at depth (down dip) and partially along strike.

Mineral boundaries were interpreted to distinguish areas that comprised overburden, oxide plus sulfide minerals and sulfide-only assemblages. The near surface mineralized zone was identified as a transitional sulfide zone that contained both oxide and sulfide minerals. The boundary between this zone and the sulfide only undulates parallel to topography between 60 and 75 m deep below the surface. This boundary was defined by acid soluble copper and total copper ratios, logged drill core and recorded specific gravity values. Common minerals found in this zone, in order of abundance, include malachite, bornite, chalcopyrite, native copper and minor chrysocolla. A small zone of deeper oxidation, with mineralization consisting dominantly of native copper, is located in the center portion of the deposit. This area shows strong brecciation and extends to depths of 400 m below the surface.

Economic mineralization consists of massive bornite and chalcocite with accompanying chalcopyrite and silver. Locally, secondary massive chalcocite has replaced bornite in the Central portion of the deposit at the forereef slope. These minerals are largely vein hosted and make up greater than 1.0% Cu grade domain. The mineralization is hosted within an extensive system of quartz and quartz carbonate veins, shears and cleavages. Parallel and sub-parallel shearing continues for hundreds of feet and are likely influenced by subtle changes in lithology and structure. Within the more competent units, shearing is replaced by brittle deformation, generally in the form of brecciation.

37

Table of Contents

Localized parasitic folds, thrusts and shears have thickened the mineralization and repeated the stratigraphy resulting in enhanced copper and silver grades over very wide intervals. Structural data in the NE portion of the deposit suggests a gently plunging fold toward the south-west. The fold is overprinted in the center portion of the deposit by a vertically plunging facies change. These two areas have the highest grades and thickest intervals.

Mineral Resources and Mineral Reserves

Table 1 Khoemacau – Summary of Silver Mineral Resources at June 30, 2021, Based on $18.00 Ag and $3.00 Cu(1),(2),(3),(4)

Amount

Tonnes (M)

Ag Grades

gpt

Cu Grades

%

Cut-Off Grades

Metallurgical Recovery(5)

Measured Mineral Resources

5.6

24.8

2.76

1% Cu

88.3% Cu / 84.1% Ag

Indicated Mineral Resources

14.8

25.3

2.30

1% Cu

88.1% Cu / 83.9% Ag

Measured + Indicated Mineral Resources

20.4

25.2

2.43

1% Cu

88.2% Cu / 84.0% Ag

Inferred Mineral Resources

59.2

22.1

2.00

1% Cu

88.2% Cu /84.1% Ag

(1)

Our metal stream on Khoemacau pertains only to payable silver produced. Information on copper mineral resources is included because the primary production from Khoemacau is copper; the presentation of copper mineral resources is necessary in understanding the economics of the project.

(2)  Reported mineral resource is as of June 30, 2021. Khoemacau Zone 5 mineral resources are reported pursuant to the JORC code. SK1300 does not permit reciprocal recognition of mineral resources determined under the mining disclosure regime of another jurisdiction. The amounts, grades and recovery of mineral resources determined under SK1300 could vary from the disclosure set forth here. While the SK1300 definitions are substantially similar to those set forth in the JORC code, there are variations. Our metal stream on Khoemacau pertains only to payable silver produced.

(3)   Mineral resources are presented exclusive of mineral reserves.

(4)

Our stream interest at Khoemacau is 100% of payable silver produced. The silver mineral resources listed are 100% of the resources to which our stream interest applies.

(5)

Metallurgical recoveries for copper and silver vary based on the dominant copper mineral. Copper recoveries are generally 86-90%. Silver recoveries are 83.3-87.1%. Copper recoveries are reduced in areas where acid soluble copper is greater than 15% of total copper content.

Table 2 Khoemacau – Summary of Silver Mineral Reserves at June 30, 2021, $20.00 Ag and $3.40 Cu(1),(2),(3)

Reserves

Cut-Off Grades

Metallurgical Recovery(4)

Amount

Tonnes (M)

Ag Grades

gpt

Cu Grades

%

Proven Mineral Reserves

11.0

20.76

2.19

$50-60 NSR

87.8% Cu 83.9% Ag

Probable Mineral Reserves

22.9

19.15

1.95

$50-60 NSR

87.8% Cu 83.9% Ag

Total Mineral Reserves

33.9

19.67

2.03

$50-60 NSR

87.8% Cu 83.9% Ag

(1)

Our metal stream on Khoemacau pertains only to payable silver produced. Information on copper mineral reserves is included because the primary production from Khoemacau is copper; the presentation of copper mineral reserves is necessary in understanding the economics of the project.

(2)

Khoemacau mineral reserves are reported at an effective date of June 30, 2021. Khoemacau Zone 5 mineral reserves are reported pursuant to the JORC Code. SK1300 does not permit reciprocal recognition of mineral reserves determined under the mining disclosure regime of another jurisdiction. The amounts, grades and recovery of mineral reserves determined under SK1300 could vary from the disclosure set forth here. While the SK1300 definitions are substantially similar to those set forth in the JORC code, there are variations.

(3)

Our stream interest at Khoemacau is 100% of payable silver. The silver mineral reserves listed are 100% of the reserves to which our stream interest applies.

(4)

Metallurgical recoveries for copper and silver vary based on the dominant copper mineral. Copper recoveries are generally 86-90%. Silver recoveries are 83.3-87.1%. Copper recoveries are reduced in areas where acid soluble copper

38

Table of Contents

is greater than 15% of total copper content. Treatment and refining charges are captured as a reduction in recoverable metal in the reserve model, 97% for copper and 90% for silver.

Change in Mineral Resources and Mineral Reserves from Prior Year

The last mineral resources and mineral reserves reported by the operator were as of June 30, 2021. There is no change in the reported mineral reserve between our year ended December 30, 2021 and the year ended December 31, 2022, as no new mineral reserve report has been made available by the operator. Disclosed Measured and indicated silver resources have increased from 8.1 million ounces to 16.5 million ounces (103%) because resources from the Mango NE deposit areas have been added to the quantities disclosed. Prior disclosure included only Zone 5.  

Recent Developments

Silver stream deliveries from Khoemacau were 951,500 ounces during the year ended December 31, 2022, compared to approximately 261,100 ounces during the year ended December 31, 2021. First concentrate was shipped in mid-July 2021 from Khoemacau and we received our first silver stream deliveries during the September 30, 2021 quarter.

According to KCM, the ramp-up of operations to the target production rate of 3.65 Mtpa (10,000 tpd) was achieved in December 2022, with mining operations continuing at nameplate capacity through January 2023. KCM also reported that all key operating and cost parameters are in line with expectations.

KCM continues to expect that at full production Khoemacau will produce an average of 155,000 to 165,000 tonnes of high-grade copper and silver concentrate a year from Zone 5, containing approximately 60,000 to 65,000 tonnes of payable copper and 1.8 to 2.0 million ounces of payable silver per year, over an approximate 20-year mine life from Zone 5.

Mount Milligan

The disclosures below regarding Mount Milligan are derived from the Technical Report on the Mount Milligan Mine North-Central British Columbia filed November 7, 2022, effective December 31, 2021, pursuant to NI 43-101 and CIM Standards. We requested information prepared in accordance with SK1300 or access to underlying technical data sufficient to prepare its own disclosure, and the operator denied the request.

39

Table of Contents

Graphic

Location

Mount Milligan is an open-pit mine and is located within the Omenica Mining Division in North Central British Columbia, at 55.12°N latitude and 124.01°W longitude, approximately 96 miles155 km northwest of Prince George, 53 miles85 km north of Fort St. James, and 59 miles95 km west of Mackenzie.

Infrastructure

Infrastructure to support the mining and processing operation is in place and fully supports the project.

The Mount Milligan projectmine is accessible by commercial air carrier to Prince George, British Columbia, then by vehicle from the east via Mackenzie on the Finlay Philip Forest Service Road and the North Philip Forest Service Road, and from the west via Fort St. James on the North Road and Rainbow Forest Service Road. Road travel to the Mount Milligan property site is 482 miles775 km from Prince Rupert and 158 miles254 km from Prince George.

Gold stream deliveries from Mount Milligan were approximately 59,900 ounces during These roads are maintained in good condition by the fiscal year ended June 30, 2020, compared to approximately 68,500 ounces during the fiscal year ended June 30, 2019. The decrease reflects differences in the timing of shipments and settlements during the periods, in addition to lower gold grades processed and lower gold recovery, slightly offset by increased tonnage processed.various user groups.

Copper stream deliveriesElectric power is accessed from Mount Milligan were approximately 12.7 million pounds during the fiscal year ended June 30, 2020, comparedBC Hydro Kennedy Substation, located 35 km southeast of Mackenzie, and connected to approximately 9.1 million pounds during the fiscal year ended June 30, 2019. Increased deliveries resulted from differences in the timing of shipments and settlements during the periods, in addition to higher tonnage and higher copper grades processed, slightly offset by lower copper recovery.

On March 26, 2020, Centerra published an updated National Instrument 43-101 (“NI 43-101”) technical report for the Mount Milligan mine which providedvia a detailed update to92 km, 230 kV transmission line. The system is fed from the life of mine plan contained in the previous NI 43-101 report for Mount Milligan published by Centerra in calendar 2017.Peace River hydro generation facilities.

Centerra reported a reduction in proven and probable reserves dueStored water inventory at the Mount Milligan mine is critical to increased costs, lower expected productivities, and lowerthe ability to process ore through the process plant throughput compared to their calendar 2017 technical report, as well as an update to the resource modelon a sustainable basis. Water supply and re-estimation of metallurgical recoveries. Detailsmake-up sources for the reservesproject include precipitation runoff, recycling of water from the TSF supernatant pond, pit dewatering, groundwater wells, fresh water from Meadows Creek, Rainbow Creek (temporary approval) and updated mine plan, which does not contemplate any growth capital or inclusion of additional mineralized material, were reported by Centerra as follows:

Reserves as of December 31, 2019 containing 2.4 million ounces of gold and 959 million pounds of copper (comprised of 191.0 million tonnes grading 0.39 grams per tonne of gold and 0.23% of copper)Philip Lake (temporary approval). Reserves were calculated using a gold price of $1,250 per ounce, a copper price of $3.00 per pound, and an exchange rate of US$ 1.00 to C$ 1.25;
Production based on a 9-year reserve life through calendar 2028;
Average life of mine recoveries of 61.8% for gold and 80.6% for copper;
Life of mine payable gold production of 1.45 million ounces, or an average of 161,000 ounces per year;
Life of mine payable copper production of 735.6 million pounds, or an average of 81.7 million pounds per year; and
Average life of mine all-in sustaining cost of $704 per ounce of gold sold on a by-product basis, which includes sustaining capital and copper revenue credits (assuming a copper price of $3.00 per pound and an exchange rate of US$ 1.00 to C$ 1.25).

Significant reductions in proven and probable reserves or mineralized material are indicators of potential impairment for our stream and royalty interests. As part of our regular asset impairment analysis during the quarter ended March 31, 2020, we determined that an impairment of our stream interest at Mount Milligan was not necessary as (i) the earlier financial impairment taken by Centerra does not impact the mine operating performance, and (ii) the reduction in reserves and mineralized material at Mount Milligan resulted in updated gold and copper depletion rates that remain well below current and long-term consensus gold and copper prices. Due to the reduction in gold and copper reserves, as reported by Centerra, the depletion rate of our investment at Mount Milligan increased from $402 to $764 per ounce of gold and from $0.81 to $1.48 per pound of copper.

On April 1, 2020, Centerra announced that reductionsWater required for ore processing operations is reclaimed from the TSF by a barge-mounted pump station and booster pump station. Water sourced from the TSF is supernatant from the settled tailings.

The communities of manpowerMackenzie and throughput atFort St. James are within daily commuting distance of the Mount Milligan would occur as a result of actions implementedmine, and both communities are serviced by rail, which connects to combat the COVID-19 pandemic. Centerra has since reported that workforce numbers returned to normal over the month of May resulting in miningmajor western and plant tonnages returning to planned levels. According to Centerra, process plant throughput averaged approximately 60% of target levels and mining operations experienced a four week partial shutdown during the reduction period, and during April, the process plant was shut down for eleven days to perform routine maintenance and reline the SAG mill.eastern rail routes.

1840

Table of Contents

Concentrate is transported by truck from the mine site to Mackenzie, transferred onto railcars of the Canadian National Railway to existing port storage facilities of Vancouver Wharves in North Vancouver and loaded as lots into bulk ore carriers. Concentrate is then shipped to customers via ocean transport.

Labor and services are readily available from the surrounding towns of Prince George, Fort St. James, Mackenzie, Vanderhoof, Smithers and Fraser Lake.

Area of Interest

At Mount Milligan, our stream interest covers Mining Lease 631503 and 110 mineral claims covering 51,078.2 hectares.

Stream Agreement

Under the Amended and Restated Purchase and Sale Agreement dated December 14, 2011, between Terrane Metals Corp., an indirect subsidiary of Centerra also reported thatGold Inc. (“Centerra”), and RGLD Gold, as amended, we own the right to purchase 35% of the payable gold and 18.75% of the payable copper produced from the Mount Milligan mine. The cash purchase price for gold is equal to the lesser of $435 per ounce, with no inflation adjustment, or the prevailing market price when purchased. The cash purchase price for copper is 15% of the spot price. As of December 31, 2022, approximately 676,400 ounces of payable gold and 72.7 million pounds of payable copper have been delivered to us.

Property Description

Mount Milligan is a copper-gold porphyry deposit, consisting of two principal zones, the Main Zone and the Southern Star (SS) Zone. The Main Zone includes four contiguous sub-zones: MBX, WBX, DWBX and 66 (low-copper and high-gold grades, southeast of the MBX sub-zone). These geologic zones are the basis for the metallurgical test work.

Open pit operations are designed and scheduled to deliver peak annual production of 54 Mtpa, with a life-of-mine (“LOM”) stripping ratio of 0.92 tonnes of waste to 1 tonne ore. All waste material is used in the construction of the TSF or in the case of the material being classified as potentially acid producing, stored within the TSF.

The mining operation’s equipment fleet comprises two 30 cm electric blast hole drills, two 41 m3 electric cable shovels, one 22 m3 hydraulic excavator and two 19 m3 front end loader and thirteen 229-tonne capacity haul trucks and two 181-tonne capacity haul trucks. These major units are supplemented with a back-up equipment fleet of graders, track and rubber-tired dozers, backhoes, and water inventorytrucks. A 15-meter bench height is used for mining both ore and waste.

The Mount Milligan sulfide flotation concentrator was designed to process ore at a nominal rate of 60,000 tpd, producing a marketable concentrate of copper, gold, and silver. A secondary crushing circuit, installed in 2016, together with process plant optimization projects, increased the capacity to a nominal rate of 62,500 tpd. It consists of the following unit operations:

primary crushing;
coarse ore stockpile;
Semi-Autogenous/Ball Mill/Pebble Crushing (“SABC”) grinding circuit;
rougher/scavenger flotation;
concentrate regrinding;
cleaner flotation;
gravity concentration;
concentrate dewatering; and
tailings disposal.

The run of mine (“ROM”) ore is crushed to 80% passing 15 cm, and then ground to 80% passing 200 micron prior to flotation. The rougher-scavenger flotation circuit includes two trains of five 200 m3 flotation cells. Each train has two rougher and three scavenger flotation cells. The concentrates from the first two cells of each train (rougher concentrate)

41

Table of Contents

and the concentrates from the last three cells of each train (scavenger concentrate) are reground separately. The rougher concentrate is reground to P80 30-50 μm in the vertically stirred mill using steel ball media while the rougher-scavenger concentrate together with the first cleaner, second cleaner, and third cleaner flotation tailings are reground to P80 18-25 μm in the horizontal stirred mills using ceramic ball media. To recover coarse metallic gold particles, approximately 20% of the rougher concentrate regrind hydrocyclone underflow is diverted to a centrifugal gravity concentrator. The reground concentrates undergo three stages of cleaning flotation to produce a final copper concentrate containing approximately 21.5% Cu and 30 to 40 g/t Au.

The infrastructure at Mount Milligan includes a TSF and reclaim water ponds, an administrative building and change house, a workshop/warehouse, a permanent operations residence, a first aid station, an emergency vehicle storage, a laboratory, and sewage and water treatment facilities.

Age and Condition of Infrastructure

The mine was commissioned in 2013.

Royal Gold does not have specific information about the physical condition of equipment and infrastructure at site.

Book Value

The operator does not provide us with the operator’s book value or total cost detail for the property and associated plant and equipment.

Property History

Limited exploration activity was first recorded in 1937. In 1984, prospector Richard Haslinger (“Haslinger”) and BP Resources Canada Limited (“BP Resources”) located claims on the current site.

In 1986, Lincoln Resources Inc. (“Lincoln”) optioned the claims and in 1987 completed a diamond drilling program that led to the discovery of significant copper-gold mineralization. In the late 1980s, Lincoln reorganized, amalgamated with Continental Gold Corp. (“Continental Gold”) and continued ongoing drilling in a joint venture with BP Resources.

In 1991, Placer Dome Inc. (“Placer Dome”) acquired the Project from the joint-venture partners, resumed exploration drilling and completed a pre-feasibility study for the development of a 60,000 tpd open pit mine and flotation process plant.

Barrick Gold Corporation (“Barrick”) purchased Placer Dome in 2006 and sold its Canadian assets to Goldcorp Inc. (“Goldcorp”), who then in turn sold the Project to Atlas Cromwell Ltd. (“Atlas Cromwell”). Atlas Cromwell changed its name to Terrane Metals Corp. (“Terrane”) and initiated a comprehensive work program.

In October 2010, Thompson Creek Metals Company Inc. (“TCM”) acquired the Mount Milligan development project through its acquisition of Terrane, entered a stream agreement with us and subsequently constructed the Mount Milligan mine, which commenced commercial production in February 2014.

In October 2016, TCM was acquired by a subsidiary of Centerra and, in connection with that acquisition, Terrane and certain other subsidiary entities of TCM were amalgamated into TCM. The Mount Milligan mine is now fully owned by TCM, an indirect subsidiary of Centerra.

Our interest in Mount Milligan evolved over time as a result of adapting the stream to address the needs of its operating partner. Our original 52.25% gold stream was acquired in three transactions from TCM, as part of the financing for the initial project acquisition and construction:

1.On July 15, 2010, we announced the acquisition of a 25% gold stream interest on the Mount Milligan project from TCM for $311.5 million and cash payments equal to the lesser of $400 or the prevailing market price for

42

Table of Contents

each payable ounce of gold until the delivery of 550,000 ounces to us, and the lesser of $450 or the prevailing market price for each additional ounce thereafter.

2.On December 15, 2011, we increased our gold stream interest on the Mount Milligan project by an additional 15% for $270 million and cash payments equal to the lesser of $435 or the prevailing market price for each payable ounce of gold delivered to us (replacing the payment structure of the July 15, 2010 transaction).

3.On August 9, 2012, we increased our gold stream interest in the Mount Milligan project by an additional 12.25% for $200 million and cash payments equal to the lesser of $435 or the prevailing market price for each payable ounce of gold delivered to us.

Subsequently, on October 20, 2016, after the first few years of operations, Centerra acquired all of the issued and outstanding common shares of TCM. Our stream interest at Mount Milligan was amended as part of this transaction to facilitate the acquisition and provide more gold exposure to Centerra. Under the terms of the amendment, our 52.25% gold stream at Mount Milligan was amended to a 35% gold stream and an 18.75% copper stream with a 15% of spot cash price.

Permitting and Encumbrances

As of the 2022 Technical Report, Mount Milligan held or was in the process of obtaining all permits required for the operation of its business for the defined LOM.

Mount Milligan was designed to use surface water and groundwater sources for processing. Stored water inventory is critical to the ability to process ore through the mill on a sustainable basis,basis. In the winter months of 2018 and 2019, due to sustained periods of low precipitation in the preceding months and corresponding low levels of stored water inventory, Mount Milligan experienced a lack of sufficient water resources that caused temporary suspensions and reductions of processing operations. In February 2019, the British Columbia Environmental Assessment Office approved an amendment to the Mount Milligan environmental assessment certificate (EAC #M09-1) to permit access to additional sources of surface water and groundwater until November 30, 2021, which was subsequently extended in excess of six million cubic meters as at June 30, 2020. Centerra reported that springearly 2021 to November 2023.

In addition to accessing water pumping started in April,from Rainbow Creek and substantial snowpack andMeadows Creek, Mount Milligan received temporary approvals to pump water from Philip Lake during a wet spring led to volumes pumped asportion of the end of June that exceeded those of the entire 2019 pumping season.  In addition, Centerra reported thatSpring run-off period. Mount Milligan continuedcontinues to access ground water from the Lower Rainbow Valley wellfield andas well as other groundwater wells near the tailings storage facility during the quarter ended June 30, 2020. Centerra also reported that it continued exploration activities focused on extending theTSF. The operation has received approval to draw groundwater capacity in the vicinityfrom within a 6 km radius of the existing infrastructure, and these activities will continueoperation for the remainder of 2020. Further, Centerra reported that it continues to pursue a longer-term solution to its water requirements at Mount Milligan.LOM.

On JulyJanuary 6, 2022, TCM received the approval of an amendment to EAC #M09-01 to utilize LOM surface water withdrawals external to the TSF during the open water season (April 1 to November 30) from either the Nation River as a single surface water source or Rainbow Creek and Philip Lake 1 as a combined surface water source. Following additional engineering studies, cost optimization, and hydrological analysis, TCM is seeking Water Sustainability Act license applications for the Rainbow Creek and Philip Creek option. This option, in addition to the currently permitted groundwater withdrawals, will be sufficient to maintain operations at current production targets for the approved LOM.

Property Geology

The Mount Milligan deposits are categorized as silica-saturated alkalic Cu-Au porphyry deposits associated with alkaline monzodioritic-to-syenitic igneous rocks. Two styles of mineralization have been identified.

oEarly-stage porphyry Au-Cu mineralization (and early-stage vein types) associated with composite monzonite porphyry stocks and related hydrothermal breccia, and narrower dyke and breccia complexes.

oLate-stage structurally controlled high-gold low-copper mineralization (and intermediate- to late-stage vein types) that is associated with faults and fault breccias, crosscuts/overprints the earlier stage porphyry mineralization and is more spatially widespread.

43

Table of Contents

Mineral Resource and Mineral Reserves

Table 1 Mount Milligan – Summary of Copper and Gold Mineral Resources at

December 31, 2021, Based on $3.50 Cu and $1,550 Au (1),(2),(3),(4)

Amount

Tonnes (M)

Au Grade

gpt

Cu Grade

%

Cut-Off Grade (5)

Metallurgical Recovery

Measured Mineral Resources

36.5

0.26

0.21

$7.35 NSR

(6)

Indicated Mineral Resources

152.8

0.31

0.17

$7.35 NSR

(6)

Measured + Indicated Mineral Resources

189.3

0.30

0.18

$7.35 NSR

(6)

Inferred Mineral Resources

4.6

0.47

0.07

$7.35 NSR

(6)

(1)

Reported mineral resource is as of December 31, 2021. Centerra reports resources pursuant to CIM Standards. SK1300 does not permit reciprocal recognition of mineral resources determined under the mining disclosure regime of another jurisdiction. The amounts, grades and recovery of mineral resources determined under SK1300 could vary from the disclosure set forth here. While the SK1300 definitions are substantially similar to those set forth in the CIM Standards, there are variations.

(2)

Mineral resources are presented exclusive of mineral reserves.

(3)

Our stream interest at Mount Milligan is 35% of payable gold and 18.75% of payable copper. The mineral resources listed are 100% of the mineral resources to which our stream interest applies.

(4)

Mineral resources are reported at copper equivalent cut-off equivalent to a $7.35 NSR per tonne using metal prices of $3.50 per pound copper and $1,550 per ounce gold, and an exchange rate of 1USD:1.30CAD.

(5)

The open pit mineral resources are constrained by a pit shell and are reported at copper equivalent cut-off equivalent to a $7.35 NSR per tonne and take into consideration metallurgical recoveries, concentrate grades, transportation costs, smelter treatment charges and stream and royalty arrangements in determining economic viability.

(6)

Metallurgical recoveries for reporting mineral resources assume variable copper recoveries between 75% and 83% and gold recoveries between 55% and 65%. Copper equivalent is estimated to blocks according to variable gold and copper recoveries.

Table 2 Mount Milligan – Summary of Copper and Gold Mineral Reserves at

December 31, 2021, Based on $3.25 Cu and $1,350 Au (1),(2),(3)

Amount

Tonnes (M)

Au Grade

gpt

Cu Grade

%

Cut-Off Grade (4)

Metallurgical Recovery

Proven Mineral Reserves

76.5

0.37

0.20

$7.40 NSR

(5)

Probable Mineral Reserves

169.7

0.37

0.18

$7.40 NSR

(5)

Total Mineral Reserves

246.2

0.37

0.19

$7.40 NSR

(5)

44

Table of Contents

(1)

Reported mineral reserve is as of December 31, 2021. Centerra reports mineral reserves pursuant to CIM Standards. SK1300 does not permit reciprocal recognition of mineral reserves determined under the mining disclosure regime of another jurisdiction. The amounts, grades and recovery of reserves determined under SK1300 could vary from the disclosure set forth here. While the SK1300 definitions are substantially similar to those set forth in the CIM Standards, there are variations.

(2)

Our stream interest at Mount Milligan is 35% of payable gold and 18.75% of payable copper. The mineral reserves listed are 100% of the mineral reserves to which our stream interest applies.

(3)

The mineral reserves have been estimated based on a gold price of $1,350 per ounce, copper price of $3.25 per pound and an exchange rate of 1USD:1.30CAD.

(4)

The open pit mineral reserves are estimated by Centerra based on an NSR cut-off of $7.40 per tonne and takes into consideration metallurgical recoveries, concentrate grades, transportation costs, smelter treatment charges and stream and royalty arrangements in determining economic viability.

(5)

Metallurgical recoveries are estimated using regression curves based on operational and metallurgical test work data. Annual average copper recoveries range from 76.4% to 82.4%. Annual average gold recoveries range from 55.2% to 64.2%.

Change in Mineral Resources and Mineral Reserves from Prior Year

For Mount Milligan, mineral resources and mineral reserves increased as of December 31, 2021, as compared to mineral resources and mineral reserves as of December 31, 2020, primarily because Centerra confirmed that there is no changeupdated resource and reserves estimates for the property to include new drilling and updated economic assumptions. Gold measured and indicated mineral resources increased from 1.4 million to 1.8 million ounces (31%) and copper increased from 521 million to 742 million pounds (42%). Gold proven and probable mineral reserves increased from 2.1 million to 2.9 million ounces (36%) and copper from 837 million to 996 million pounds (19%).

Recent Developments

Gold stream deliveries from Mount Milligan were approximately 68,900 ounces during the previously issued productionyear ended December 31, 2022, compared to approximately 61,600 ounces for the year ended December 31, 2021.

Copper stream deliveries from Mount Milligan were approximately 14.8 million pounds during the year ended December 31, 2022, compared to approximately 14.9 million pounds during the year ended December 31, 2021.

On January 17, 2023, Centerra reported 2023 guidance for Mount Milligan forMilligan. In calendar year 20202023, Centerra expects production of 140,000 tobetween 160,000 payableand 170,000 ounces of gold and 8060 million to 9070 million pounds of copper. Centerra expects Mount Milligan’s 2023 copper production to be back-end weighted with approximately 35% of concentrate sales expected to occur in the fourth quarter of 2023.

Pueblo Viejo (Sanchez Ramirez, Dominican Republic)Centerra continues to optimize the life of mine plan for the Mount Milligan Mine and anticipates increases in both gold and copper production for 2024 and 2025 when compared to the annual figures included in the Mount Milligan Mine December 31, 2021 NI 43-101 Technical Report.

Pueblo Viejo

The disclosures below regarding Pueblo Viejo are derived from the Technical Report on the Pueblo Viejo Mine, Sánchez Ramírez Province, Dominican Republic dated March 19, 2018 in accordance with NI 43-101 and CIM Standards, and the mineral resource and mineral reserve updates are derived from Barrick’s news release dated February 9, 2023 pursuant to NI 43-101. Royal Gold requested information prepared pursuant to SK1300 or access to the underlying technical data sufficient to prepare its own technical report summary, and the operator denied the request.

45

Table of Contents

Graphic

Location

The Pueblo Viejo mine is located in the province of Sánchez Ramírez, Dominican Republic, at 18.94°N latitude and 70.17°W longitude, approximately 100 km northwest of Santo Domingo, and is owned by a joint venture in which Barrick holds a 60% interest and is responsible for operations, and in which Newmont Corporation (“Newmont”) holds a 40% interest. Pueblo Viejo is accessed from Santo Domingo by traveling northwest on Autopista Duarte, Highway #1, approximately 77 km to Piedra Blanca and proceeding east for approximately 22.5 km on Highway #17 to the gatehouse for Pueblo Viejo. Both Highway #1 and Highway #17 are paved.

Elevation at the mine site ranges from 565 m at Loma Cuaba to approximately 65 m at the Hatillo Reservoir. The site is characterized by rugged and hilly terrain covered with subtropical wet forest and scrub cover. The region has a tropical climate with little fluctuation in seasonal temperatures. The heaviest rainfall occurs between May and October.

Infrastructure

Infrastructure to support the mining and processing operation is in place.

The main road from Santo Domingo to within about 22.5 km of the mine site is a surfaced, four-lane, divided highway that is generally in good condition. Access from the divided highway to the site is via a two-lane, paved highway. Gravel surfaced internal access roads provide access to the mine site facilities.

The Pueblo Viejo mine is supplied with electric power from two sources via two independent 230 kV transmission circuits. In 2013, Pueblo Viejo Dominicana Corporation (“PVDC”) commissioned a 218-megawatt (“MW”) Wartsila combined cycle reciprocating engine power plant, together with an approximately 72 km transmission line connecting the plant to the minesite. The power plant is located near the port city of San Pedro de Macoris on the south coast and provides the long-term power supply for the Pueblo Viejo mine. The plant is dual fuel and was converted to natural gas from heavy fuel oil in 2020. In 2019, PVDC signed a 10-year natural gas supply contract with AES Andres DR, S.A. (“AES”) in the Dominican Republic. AES also completed a new gas pipeline to the facility. The power plant began supplying power to the mine using natural gas in the first quarter of 2020.

46

Table of Contents

In addition to the existing access roads, the site infrastructure includes accommodations, offices, a truck shop, a medical clinic and other buildings, water supply, the TSF, and water treatment facilities. A double and single fence system protects the process plant site. Within the plant site area, the freshwater system, potable water system, fire water system, sanitary sewage system, storm drains, and fuel lines are buried underground. Process piping is typically left above ground on pipe racks or in pipe corridors.

A TSF is operating in the El Llagal valley approximately 3 km south of the plant site and the progressive raising of a large rock-filled dam with an impermeable saprolite core is underway.

The site has sufficient access, surface rights, and suitable sources of power, water, and personnel to maintain an efficient mining operation.

The city of Santo Domingo is the principal source of supply for the mine. It is a port city with a population of over three million with daily air service to the USA and other countries. Most non-technical staff positions and labor requirements are filled from local communities. The mine operates year round.

Area of Interest

At Pueblo Viejo, our stream interest covers a Special Lease Agreement of Mining Rights (“SLA”), as amended in November 2009 and in October 2013. The Lease has a term of 25 years with one extension by right for 25 years and a second 25 year extension at the mutual agreement of Barrick and the Dominican state, allowing a possible total term of 75 years.

Under the SLA, PVDC is obligated to make the following payments to the Dominican Republic: a net smelter return royalty of 3.2% based on gross revenues less some deductible costs (royalties do not apply to copper or zinc); a net profits interest of 28.75% based on an adjusted taxable cash flow; a corporate income tax of 25% based on adjusted net income; a withholding tax on interest paid on loans and on payments abroad; and other general tax obligations. The SLA tax regime includes a stability clause.

Stream Agreement

Under the Precious Metals Purchase and Sale Agreement dated August 5, 2015 between RGLD Gold ownsand BGC Holdings Ltd. and Barrick, as amended,we own the right to purchase 7.5% of Barrick’s interest in the gold produced from the Pueblo Viejo mine until 990,000 ounces of gold have been delivered, and 3.75% thereafter. The cash purchase price for gold is 30% of the spot price of gold per ounce delivered until 550,000 ounces of gold have been delivered, and 60% of the spot price of gold per ounce delivered thereafter. RGLD GoldWe also ownsown the right to purchase 75% of Barrick’s interest in the silver produced from the Pueblo Viejo mine, subject to a minimum silver recovery of 70%, until 50 million ounces of silver have been delivered, and 37.5% thereafter. The cash purchase price for silver is 30% of the spot price of silver per ounce delivered until 23.1 million ounces of silver have been delivered, and 60% of the spot price of silver per ounce delivered thereafter. As of June 30, 2020,December 31, 2022, approximately 226,400317,500 ounces of payable gold and 7.911.3 million ounces of payable silver have been delivered to RGLD Gold.us.

Property Description

Pueblo Viejo is a production stage property consisting of a conventional open pit surface mine and a complex processing circuit designed to process 24,000 tpd of refractory gold-silver ore through pressure oxidation. Gold and silver are recovered through a CIL circuit and electrowinning.

The pit stages have been chosen to facilitate the early extraction of the most profitable ore. The driver of the mine schedule is the sulphur blending requirement. Sulphur grade is important because the metallurgical aspects of the processing operation, the recoveries achieved, and the processing costs, all strongly depend on a very consistent, low-variability sulphur content in the plant feed.

47

Table of Contents

The Pueblo Viejo mine operates a conventional open pit, utilizing a truck and shovel mining operation mining on 10-meter high benches. It achieved commercial production in January 2013 and completed its ramp-up to full design capacity in 2014. Current mining operations supplement fresh ore from the Monte Negro and Moore pits with stockpiled ore to achieve the required ore blend for ore processing.

Equipment planning has considered mine design production of approximately 57 to 63 Mtpa total material movement, including limestone. This includes mill feed of 24,000 tpd, reclamation from stockpiles, and simultaneous mining in the limestone quarries and several operating pit phases. Loading is carried out with 20 m3 hydraulic shovels and 22 m3 front-end loaders, loading 175-tonne haul trucks.

Gold and silver are recovered through pressure oxidation (autoclave) of whole ore followed by hot cure and hot lime boil, prior to cyanidation of gold and silver in a CIL circuit. The autoclave circuit is designed to oxidize approximately 1,750 tonnes of sulfide per day, which is equivalent to about 24,000 tonnes of run-of-mine ore at 7.5% of sulfide. Lower sulfide ores are often fed to the plant resulting in higher tonnage, often well over 30,000 tpd. The rest of the process plant is designed to process a minimum 24,000 tpd, but can effectively process over 30,000 tpd as needed. From 2014 through 2022, the operation produced approximately 9.6 million ounces of gold. Gold production has been declining since 2018 due primarily to lower ore grades. Production in 2022 was 713,500 ounces of gold.

The TSF is located in the provinceEl Llagal valley, located approximately 4 km south of Sanchez Ramirez, Dominican Republic, approximately 60 miles northwestthe plant site. The Lower Llagal TSF, made up of Santo Domingo,one main dam and three saddle dams, will contain all of the waste rock generated over the life of the Pueblo Viejo mine as well as process tailings up to 2028, at which point the tailings deposition will transition to another proposed TSF location. In addition to solids storage, the Lower Llagal TSF is sized to provide storage for an operating pond and for extreme precipitation events. The location for an additional tailings impoundment to provide capacity for the mineral resource base has been identified and is owned bycurrently in the permitting process. The mine is situated in a joint venture in which Barrick holds a 60% interest and is responsible for operations, and in which Newmont Corporation holds a 40% interest.  Pueblo Viejo is accessed from Santo Domingo by traveling northwestseismically active area. The design of the dams at the site was based on Autopista Duarte, Highway #1, approximately 48 miles to Piedra Blanca and proceeding east for approximately 14 miles on Highway #17 to the gatehouse for Pueblo Viejo. Both Highway #1 and Highway #17 are paved.

Gold stream deliveries from Pueblo Viejo were approximately 45,000 ounces of gold during the fiscal year ended June 30, 2020, compared to approximately 41,200 ounces of gold during the fiscal year ended June 30, 2019.  Silver stream deliveries were approximately 1.7 million ounces of silver during the fiscal year ended June 30, 2020, compared to approximately 2.0 million ounces of silver during the fiscal year ended June 30, 2019.maximum credible earthquake criteria.

Barrick reports that it continuesis continuing to advance engineering and evaluation work towardsprogress a feasibility study for the process plant expansion and proposed tailings storage facility that could extend the mine life at Pueblo Viejoextension project. The plant expansion is designed to beyond calendar year 2040. Barrick estimates that the process plant and tailings expansion project could significantly increase throughput to 14 Mtpa and allow the mine to maintain average annual gold production of approximately 800,000 ounces after calendar year 2022 (on a 100%(100% basis), and that the increase in tailings storage capacity hasincorporation of a new TSF is intended to extend the potentialmine life to convert approximately 11 million ounces of mineralized material to reserves (on a 100% basis).the mid 2040s.

Barrick expectsThe process plant expansion flowsheet includes an additional primary crusher, coarse ore stockpile and ore reclaim delivering to a new single stage semi-autogenous (SAG) mill, and a new flotation circuit that will concentrate the proportion of lower grade stockpile ore in the feed blend to steadily increase until the mine expansion pits are fully developed as partbulk of the decision onsulfide ore prior to oxidation. The concentrate will be blended with fresh milled ore to feed the proposed plantmodified autoclave circuit, which will have additional oxygen supplied from a new 3,000 tonnes per day facility. The existing autoclaves will be upgraded to increase the sulfur processing capacity of each autoclave through additional high-pressure cooling water and tailings expansion project. Barrick also reported lower gold production during the June 2020 quarter as a result of a planned maintenance shutdown. For calendar year 2020, Barrick indicated production attributable to their interest at Pueblo Viejo is expected to be between 530,000recycle flash capability using additional slurry pumping and 580,000 ounces of gold.thickening.

Wassa (Western Region, Ghana)Age and Condition of Infrastructure

The mine initiated pre-stripping in 2010 and the mill was commissioned in 2012.

RGLDRoyal Gold ownsdoes not have specific information about the rightphysical condition of equipment and infrastructure at site, but the installation is relatively new.

Book Value

The operator does not provide us with the operator’s book value or total cost detail for the property and associated plant and equipment.

Property History

Early mining activity at the site dates back to purchase 10.5%the 1500s. Subsequent to that early mining activity, Rosario Resources commenced mining operations on the property in 1975. In 1979, the Central Bank of the gold produced fromDominican Republic purchased all foreign-held shares in Rosario Resources and the Wassa, Prestea and Bogoso mines, operated by Golden Star Resources Ltd. (“Golden Star”), until an aggregate 240,000 ounces have been delivered. Once the applicable delivery threshold is met, the stream percentage will decrease to 5.5%. The cash purchase price for gold is 20%Dominican Government continued operations as Rosario Dominicana

1948

Table of Contents

S.A. Gold and silver production from oxide, transitional, and sulfide ores occurred from 1975 to 1999. The mine ceased operations in 1999. In 2000, the Dominican Republic invited international bids for the leasing and mineral exploitation of the spot price per ouncePueblo Viejo mine site. In July 2001, PVDC (then known as Placer Dome Dominicana Corporation), an affiliate of Placer Dome, was awarded the bid. PVDC and the Dominican Republic subsequently negotiated the SLA for the Montenegro Fiscal Reserve, which was ratified by the Dominican National Congress and became effective on July 29, 2003. In March 2006, Barrick acquired Placer Dome and in May 2006 amalgamated the companies. At the same time, Barrick sold a 40% stake in the Pueblo Viejo project to Goldcorp (acquired by Newmont in 2019). On February 26, 2008, PVDC delivered until 240,000 ouncesthe Project Notice to the Government of goldthe Dominican Republic pursuant to the SLA and delivered the Pueblo Viejo Feasibility Study to the Government. In 2009, the Dominican Republic and PVDC agreed to amend the terms of the SLA. The amendment became effective on November 13, 2009 following its ratification by the Dominican National Congress. The Pueblo Viejo mine achieved commercial production in January 2013. A second amendment to the SLA became effective on October 5, 2013, and has resulted in additional and accelerated tax revenues to the government of the Dominican Republic.

Permitting and Encumbrances

PVDC has acquired all of the permits necessary to operate the mine at the present time. General Environmental and Natural Resources Law No. 64-00 (“Law 64-00”) of August 18, 2000, and its complementary regulations, governs all environmental related issues, including those applicable to mining, in the Dominican Republic. Law 64-00 sets out the general rules of conservation, protection, improvement, and restoration of the environment and natural resources by unifying segregated rules concerning environmental protection and creating a governmental body (the Ministry of Environment and Natural Resources) with wide authority to oversee and regulate its application. The Ministry of Environment and Natural Resources enforces Law 64-00 and establishes the process of obtaining environmental permits.

PVDC completed a Feasibility Study on the Mine in September 2005 and presented an Environmental Impact Assessment (“EIA”) to the Dominican state in November of the same year. The terms of reference for the Mine were approved by the Environmental Authority on May 30, 2005, and the Ministry of Environment approved the EIA in December 2006 and granted the Environmental License 101-06. Other changes have been delivered, and 30%submitted to the authorities for additional facilities. The last amendment to the Environmental License was issued on June 29, 2017, which authorized the construction of an emulsion plant. Requirements of the spot price per ounce delivered thereafter. AsEnvironmental License included submission of June 30, 2020, approximately 110,500 ouncesdetailed design of payable goldtailings dams, installation of monitoring stations, and submission for review of the waste management plan and incineration plant.

An environmental evaluation report was submitted in 2008 to address an increase in the planned processing rate to 24,000 tpd and in September 2010 the Ministry of Environment and Natural Resources issued the Environmental License 101-06 Modified.

When the former Rosario mine shut down its operations in 1999, proper closure and reclamation was not undertaken. The result has been a legacy of polluted soil and water and contaminated infrastructure. Responsibility for the clean-up is now shared jointly between PVDC and the Dominican government. Terms have been deliveredset for both parties in the SLA that governs the development and operation of the mine.

In November 2009, following approval by the Dominican Republic National Congress, President Leonel Fernandez ratified the first amendment to the SLA for Pueblo Viejo. The amended SLA better reflected the scope and scale of the project since its acquisition by Barrick in 2006. The amendments set out revised fiscal terms and clarified various administrative and operational matters to the mutual benefit of PVDC and the Dominican state. In particular, the agreement stipulates that environmental remediation within the development area is the responsibility of the company with the exception of the hazardous substances; the Dominican government is responsible for historic impacts outside the Mine development area and hazardous substances at the plant site.

In the second half of 2016, PVDC was contracted to act as an agent of the Dominican State to carry out activities for which the Dominican State is responsible under the SLA pursuant to the Environmental Management Plan of the State (Plan de Administración del Estado). The requisite environmental permits were received in November 2016 to carry out the first stage of the closure plan, which focuses on dewatering, buttressing, and improving the stability of the old Mejita tailings facility. Dewatering of the old Mejita tailings facility was completed in 2018, as well as the geotechnical investigation

49

Table of Contents

program. In 2020, the Environmental Management Plan of the State (Plan de Administración del Estado) achieved progress for the Mejita tailings cover component, with work occurring mainly at the north and central ponds. Progress was also made on the buttress excavation, with phase 1 now complete. In 2022, the PVDC plans to complete the buttress engineering design for phase 2 and then resume the buttress fill construction and tailings cover component.

In addition to the mine operations, by means of the Second Amendment to the SLA, the Dominican government granted PVDC a power concession to generate electricity for consumption by the mine and the right to sell excess power. Also, in March 2012, PVDC obtained an environmental permit for the Quisqueya 1 power plant and a power transmission line from Wassa, PresteaSan Pedro where the power plant is situated to the mine site.

Barrick has reported that an additional tailings impoundment facility is currently being studied and Bogoso mines,permitting activities are underway.

Barrick also reported that in 2021, PVDC’s activities at the Pueblo Viejo mine were, and continue to be, in compliance in all material respects with applicable corporate standards and environmental regulations.

Property Geology

The Pueblo Viejo deposit consists of high sulfidation or acid sulfate epithermal gold, silver, copper and zinc mineralization that 69,700 ounceswas formed during the Cretaceous Age island arc volcanism. Pueblo Viejo is hosted by the Lower Cretaceous Los Ranchos Formation, a series of payable goldvolcanic and volcaniclastic rocks that extend across the eastern half of the Dominican Republic, generally striking northwest and dipping southwest. The Los Ranchos Formation consists of a lower complex of pillowed basalt, basaltic andesite flows, dacitic flows, tuffs and intrusions, overlain by volcaniclastic sedimentary rocks and interpreted to be a Lower Cretaceous intra-oceanic island arc, one of several bimodal volcanic piles that form the base of the Greater Antilles Caribbean islands. The unit has undergone extensive seawater metamorphism (spilitization) and lithologies have been delivered from Wassareferred to RGLD Gold.as spilite (basaltic-andesite) and keratophyre (dacite).

The Wassa underground minePueblo Viejo Member of the Los Ranchos Formation is confined to a restricted, sedimentary basin measuring approximately 3.2 km north-south by 1.9 km east-west. The basin is interpreted to be either due to volcanic dome collapse forming a lake, or a maar-diatreme complex that cut through lower members of the Los Ranchos Formation. The basin is filled with lacustrine deposits that range from coarse conglomerate deposited at the edge of the basin to thinly bedded carbonaceous sandstone, siltstone, and oxide ore millmudstone deposited further from the paleo-shoreline. In addition, there are located nearpyroclastic rocks, dacitic domes, and diorite dikes within the villagebasin. The sedimentary basin and volcanic debris flows are considered to be of AkyempimNeocomian age (121 Ma to 144 Ma). The Pueblo Viejo Member is bounded to the east by volcaniclastic rocks and to the north and west by Platanal Member basaltic-andesite (spilite) flows and dacitic domes.

To the south, the Pueblo Viejo Member is overthrust by the Hatillo Limestone Formation, thought to be Cenomanian (93 Ma to 99 Ma), or possibly Albian (99 Ma to 112 Ma), in age.

Mineral Resources and Mineral Reserves

Table 1 Pueblo Viejo – Summary of Gold and Silver Mineral Resources at December 31, 2022, Based on $1.700 Au and $21 Ag(1),(2),(3)

Amount

Tonnes (M)

Au Grade

gpt

Ag Grade

gpt

Cut-Off Grades(4)

Metallurgical Recovery(5)

Measured Mineral Resources

11

1.41

6.79

ND

ND

Indicated Mineral Resources

50

1.51

8.29

ND

ND

Measured + Indicated Mineral Resources

61

1.50

8.02

ND

ND

Inferred Mineral Resources

4.6

1.8

10.5

ND

ND

(1)

Reported mineral resource is as of December 31, 2022. Barrick reports mineral resources pursuant to the CIM Standards. SK1300 does not permit reciprocal recognition of mineral resources determined under the mining disclosure regime of another jurisdiction. The amounts, grades and recovery of mineral resources determined under

50

Table of Contents

SK1300 could vary from the disclosure set forth here. While the SK1300 definitions are substantially similar to those set forth in the Wassa East District,CIM Standards, there are variations.

(2)

Mineral resources are presented independent of mineral reserves.

(3)

Our stream interest at Pueblo Viejo is 7.5% of payable gold until 990,000 ounces are delivered, 3.75% thereafter, and 75% of payable silver until 50 million ounces are delivered, and 37.5% thereafter. Mineral resources are disclosed on a 60% basis, as our stream agreement covers the 60% ownership share held by Barrick.

(4)

Specific cut-off grades for mineral resource estimates for Pueblo Viejo have not been disclosed by the operator.

(5)

Gold and silver metallurgical recovery assumptions for Pueblo Viejo have not been disclosed by the operator.

Table 2 Pueblo Viejo – Summary of Gold and Silver Mineral Reserves at December 31, 2022, Based on $1,300 Au and $18 Ag(1),(2)

Amount

Tonnes (M)

Au Grade

gpt

Ag Grade

gpt

Cut-Off Grades(3)

Metallurgical Recovery(4)

Proven Mineral Reserves

35

2.29

12.94

ND

ND

Probable Mineral Reserves

140

2.16

13.76

ND

ND

Total Mineral Reserves

170

2.19

13.60

ND

ND

(1)

Reported mineral reserve is as of December 31, 2022. Barrick reports mineral reserves pursuant to CIM Standards. SK1300 does not permit reciprocal recognition of mineral reserves determined under the mining disclosure regime of another jurisdiction. The amounts, grades and recovery of mineral reserves determined under SK1300 could vary from the disclosure set forth here. While the SK1300 definitions are substantially similar to those set forth in the CIM Standards, there are variations.

(2)

Our stream interest at Pueblo Viejo is 7.5% of payable gold until 990,000 ounces are delivered, 3.75% thereafter, and 75% of payable silver until 50 million ounces are delivered, and 37.5% thereafter. Mineral reserves are disclosed on a 60% basis, as our stream agreement covers the 60% ownership share held by Barrick.

(3)

Specific cut-off grades for mineral reserve estimates for Pueblo Viejo have not been disclosed by Barrick.

(4)

Gold and silver metallurgical recovery assumptions for Pueblo Viejo have not been disclosed by Barrick.

Change in Mineral Resources and Mineral Reserves from Prior Year

Between December 31, 2021 and December 31, 2022, measured and indicated gold mineral resources decreased from 8.6 million to 2.8 million ounces (67%) and silver mineral resources decreased from 50.3 million to 15 million ounces (70%), while proven and probable gold mineral reserves increased from 5.4 million to 12.3 million ounces (127%) and silver mineral reserves increased from 35.7 million to 77 million ounces (116%) net of mining depletion. Barrick announced that this was primarily a result of completion of a pre-feasibility study for the Western Region of Ghana, approximately 50 miles north of Cape Coast and 93 miles west of the capital Accra.  The main access to the site is from the east, via the Cape Coast to Twifo-Praso road, then over the combined road-rail bridge on the Pra River.  There is also an access road from Takoradi in the south via Mpohor.  An airport at Takoradi is capable of handling jet aircraft and is serviced by several commercial flights each day.new Naranjo tailings facility (which reclassified resources into reserves).  

Stream

Recent Developments

Gold stream deliveries from WassaPueblo Viejo were approximately 16,50032,500 ounces of gold duringfor the fiscal year ended June 30, 2020,December 31, 2022, compared to approximately 16,60038,700 ounces for the year ended December 31, 2021. Silver stream deliveries were approximately 1.2 million ounces for the year ended December 31, 2022, compared to 1.3 million ounces for the year ended December 31, 2021.

During the year ended December 31, 2022, an additional 91,400 ounces of goldsilver deliveries were deferred, partially offset by delivery of 37,700 ounces of previously deferred silver (net additional 53,700 ounces deferred). The deferred ounces are the result of a mechanism in the stream agreement that allows for the deferral of deliveries in a period if Barrick’s share of silver production is insufficient to cover its stream delivery obligations. The stream agreement terms include a fixed 70% silver recovery rate. If actual recovery rates fall below the contractual 70% recovery rate, ounces may be deferred with deferred ounces to be delivered in future periods as silver recovery allows. As of December 31, 2022, approximately 513,000 ounces remain deferred. We expect that silver recoveries could remain highly variable until the plant expansion project is complete and bottlenecks associated with the silver circuit and silver recovery can be fully addressed, and the timing for the delivery of the entire deferred amount is uncertain.

51

Table of Contents

On February 15, 2023, Barrick reported continued progress on the plant expansion and mine life extension project at Pueblo Viejo in the Dominican Republic. With respect to the plant expansion, Barrick reported that processing of first ore and commissioning of the new plant infrastructure is expected to be substantially complete during the fiscal year ended June 30, 2019.first quarter of 2023.  With respect to the mine life extension, Barrick disclosed that social, environmental and technical studies for the additional tailings storage capacity continued to advance, and an Environmental and Social Impact Assessment (“ESIA”) for the proposed new Naranjo TSF had been submitted to the relevant authorities in the fourth quarter. Barrick expects the Government of the Dominican Republic’s decision on the ESIA during the first half of 2023.  

Barrick also reported that a pre-feasibility study on the Naranjo TSF was completed during the fourth quarter, which allowed the addition of 6.5 million ounces of attributable proven and probable mineral reserves (60% basis), net of depletion, and extend the mine life beyond 2040. Barrick further reported that drilling and site investigation continues to allow for a feasibility level design by the end of 2023.

Barrick expects a Technical Report to support the Pueblo Viejo mine life extension and process plant expansion project, including the pre-feasibility study for the new Naranjo tailings storage facility, will be prepared in accordance with Form 43-101F1 and filed on SEDAR within 45 days of the February 9, 2023, news release.

On March 27, 2020, Golden StarFebruary 15, 2023, Barrick reported that deep drillingit expects gold production of 470,000 to 520,000 ounces in calendar year 2019 successfully extended the mineralization2023 from its 60% interest in Pueblo Viejo. Our stream interests are applicable to production from Barrick’s interest at Wassa by approximately 700 feet to the south where the deposit remains open to the south and down dip. Golden Star further reported that the exploration strategy during calendar year 2020 would transition away from growth of the overall resource to infill drilling to help define the potential mine plans for the southern extension of the operation. According to Golden Star, as of December 31, 2019 the proven mineral reserve at Wassa increased 87% over the prior year period to 1.4 million ounces of gold, and total underground mineralized material at Wassa contained approximately 11.2 million ounces of gold.Pueblo Viejo.

On July 27, 2020, Golden StarCortez

The disclosures below regarding Cortez are derived from the Technical Report on the Cortez Joint Venture Operations dated March 22, 2019 pursuant to NI 43-101 and CIM Standards, and from Barrick’s report dated February 18, 2021, and from Barrick’s news release dated February 9, 2023. Barrick provides us with non-public mineral resource and mineral reserve updates specific to our royalty area in accordance with CIM Standards. While Barrick has announced that it had signed a binding agreement with Future Global Resources Limited (“FGR”)updated mineral resources and mineral reserves for the saleCortez in its February 9, 2023 news release, as of the Presteadate of this disclosure, we have not yet received updates specific to our royalty area. Royal Gold requested information prepared pursuant to SK1300 or access to underlying technical data sufficient to prepare its own technical report summary, and Bogoso mines. This transaction will require the separation ofoperator denied the RGLD Gold stream agreement into separate stream agreements for each of Wassa and Prestea/Bogoso, which is conditional on, among other things, the approval of the board of directors of Royal Gold. Further, on July 28, 2020, Golden Star announced that, if approved, the separated Wassa stream agreement would require Golden Star to deliver 10.5% of the gold produced from Wassa in return for a cash purchase price for gold of 20% of the spot price per ounce delivered, until the delivery of 240,000 ounces, after which the obligation would decrease to 5.5% of the gold produced from Wassa in return for a cash purchase price for gold of 30% of the spot price per ounce delivered.

On July 28, 2020, Golden Star reported calendar year 2020 gold production guidance for Wassa of between 165,000 to 170,000 ounces, up from the previous guidance range of 155,000 to 165,000 ounces.

Royalty Interests

Cortez (Nevada, USA)request.

52

Table of Contents

Graphic

Location

Cortez is a series of large open-pit and underground mines, utilizing mill and heap leach processing, which are operated by Nevada Gold Mines LLC (“NGM”), a joint venture between Barrick and Newmont Corporation (“Newmont”) with respect to their Nevada operations. We refer to the Cortez property and its multiple mines and projects as the Cortez Complex, and the terms “Cortez” and “Cortez Complex” are used interchangeably. The operation is located approximately 60 air miles95 km southwest of Elko, Nevada, in Lander County.  County, Nevada, at 40.24°N latitude and 116.71°W longitude at an elevation of approximately 1,525 m (mill and administration facility).

Cortez is located in the high desert region of the Basin and Range physiographic province. The mean annual temperature is 51°F. Precipitation averages six inches per year, primarily derived from snow and summer thunderstorms.

Infrastructure

Infrastructure to support the mining and processing operation is in place and well established.

The site is reachedaccessed by driving west from Elko on Interstate 80 approximately 46 miles75 km, and proceeding south on State Highway 306 approximately 23 miles. Our royalty interest56 km. Both US Interstate 80 and Nevada State Route 306 are paved roads.

The Union Pacific Rail line runs parallel to US Interstate 80 to the north of Cortez. Elko, the closest city to Cortez, is serviced by daily commercial airline flights to Salt Lake City, Utah.

Electric power is provided to the Cortez site by NV Energy by an approximately 80 km long radial transmission line originating at their Falcon substation. The incoming NV Energy line terminates at the Barrick owned Pipeline Substation. Two 120 kV lines that tap onto the NV Energy power line feed Barrick owned 120 kV power lines: an approximately 15 km extension to serve the Cortez Hills development and an approximately 5 km extension to serve the South Pipeline and Crossroads pits.

Water for process use at Cortez applies toMill No. 2 is supplied from the Pipeline and South Pipeline deposits, partopen pit dewatering system. Approximately 6,600 liters per minute of the Gap pit and the Crossroads deposit.

The royalty interests we holddewatering volume is diverted for plant use. Additional water can be sourced as needed from wells at Cortez include:Mill No. 1.

(a)Reserve Claims (“GSR1”). This is a sliding-scale GSR royalty for all products from an area originally known as the “Reserve Claims,” which includes the majority of the Pipeline and South Pipeline deposits. The GSR1 royalty rate is tied to the price of gold and does not include indexing for inflation or deflation.  The GSR1 royalty rate is 5.0% at a gold price of $470 per ounce and higher.
(b)GAS Claims (“GSR2”). This is a sliding-scale GSR royalty for all products from an area outside of the Reserve Claims, originally known as the “GAS Claims,” which encompasses approximately 50% of the Gap deposit and all of the Crossroads deposit. The GSR2 royalty rate is tied to the gold price, without

2053

Table of Contents

indexing for inflation or deflation.

Cortez is located in a major mining region and labor, contractors and suppliers are well established resources. The GSR2 royalty rate is 5.0% at a gold price of $470 per ounce and higher.

(c)Reserve and GAS Claims Fixed Royalty (“GSR3”). The GSR3 royalty is a fixed rate GSR royalty of 0.7125% and covers the same cumulative area as is covered by our two sliding-scale GSR royalties, GSR1 and GSR2, except mining claims that comprise the undeveloped Crossroads deposit.
(d)Net Value Royalty (“NVR1”) and Net Value Royalty (Crossroads) (“NVR1C”). The NVR1 royalty is a fixed royalty of 4.91% NVR that covers the area of the GAS Claims, excluding the majority of the Crossroads deposit. The NVR1Cworkforce lives in the nearby towns of Elko, Spring Creek, Carlin, and Battle Mountain and travel daily to the mine.

Area of Interest

At Cortez, NGM directly controls approximately 124,000 hectares of mineral rights with ownership of mining claims and fee lands. There are 10,869 claims consisting of: 10,012 unpatented lode claims; 575 unpatented mill-site claims; 129 patented lode claims; 125 patented mill-site claims; and 28 unpatented placer claims.

We own multiple royalty which coversinterests at the majorityCortez Complex that have been acquired over time. Table 1 below summarizes those royalty interests for each of the Crossroads deposit, is a fixed royaltydeposits at the Cortez Complex as of 4.52% NVR.  

On average, above a gold price of $470 per ounceDecember 31, 2022, after the relevant deductions,acquisition of Idaho Royalty, which was announced on January 5, 2023. To simplify the combinedoverlapping royalties that cover each of the deposits, Table 1 also provides approximate blended royalty rates.

For purposes of simplified disclosure, we have divided our royalty interests at the Cortez Complex into two zones: the Legacy Zone and the Cortez Complex Zone. The Legacy Zone is our largest royalty exposure at the Cortez Complex, representing an equivalent 9.4% GSR royalty rate over the Pipeline and Crossroads deposits. The CC Zone includes an equivalent 1.6% GSR royalty over the Cortez Hills, Cortez Pits, Fourmile and Goldrush deposits, a 2.2% GSR royalty rate over the Goldrush SE deposit and a 0.45% GSR royalty rate over the Robertson deposit.

NGM does not provide guidance or production results for the individual mines within the Cortez Complex, and each of GSR1, GSR2, GSR3, NVR1the NGM partners provides consolidated guidance and NVR1C are equivalentresults for their respective interests. We have typically provided, and expect to an approximate 8.2% gross smelter returncontinue to provide, annual guidance for the total gold production subject to the Legacy Zone royalty interest. This guidance includes overlapping contributions from the Pipeline and Crossroads deposits in certain areas and is not directly comparable to actual production from these deposits.

Table 1 Cortez Complex – Royal Gold.Gold Royalty Interests

Graphic

(1)

Approximate equivalent royalty after blending the detailed royalty rates. Assumes total deduction to the Rio Tinto Royalty of 3% for the Legacy Royalties and the Idaho Royalty, and a 60% conversion from NVR to GSR rates.

(2)

Legacy Royalties are those royalties held by Royal Gold prior to August 2, 2022, and consist of overlapping royalties on the Pipeline and Crossroads deposits, with additional royalties covering a portion of the Goldrush deposit and other exploration areas.

54

Table of Contents

(3)

The overlapping royalties in the Legacy Zone are equivalent to an approximate 8% GSR royalty on production subject to this interest of 280,000 ounces in 2022 and 332,000 ounces per year from 2022 through 2026.

(4)

GSR1 and GSR2 are sliding-scale gross value royalties that vary from a rate of 0.4% at gold prices less than $210/oz to 5.0% at gold prices greater than $470/oz.

(5)

A small portion of the Crossroads deposit has a royalty rate of 4.91%.

(6)

NVR2 covers the south-east extension of the Goldrush Project on the Flying T Ranch.

(7)

The Rio Tinto Royalty is a sliding-scale gross value royalty that varies from a rate of 0.0% at gold prices less than $400/oz to 3.0% at gold prices greater than $900/oz on 40% of the production from the undivided Cortez Complex, excluding the existing Robertson deposits. Deductions from the royalty payment are limited to third party royalties that existed prior to January 1, 2008, which include the Legacy Royalties and the Idaho Royalty.

The Rio Tinto Royalty calculation is:

1.2% x {[(gold produced from all areas excluding Robertson) x (gold price)]LESS

[(gold produced from Pipeline and Crossroads) x (gold price) x (8% GSR approximate royalty rate) +

(gold produced from Goldrush SE) x (gold price) x (1.4167% NVR) +

(gold produced from Pipeline and Crossroads) x (gold price) x (0.689% GSR) +

(gold produced from Cortez Hills, Cortez Pits, Goldrush, Fourmile and Robertson) x (gold price) x

(1.2859% GSR)]}

The total third-party royalty deduction for the Legacy Royalties and the Idaho Royalty can be approximated as 3% through 2032 and 1.4% thereafter.

(8)

Idaho Royalty rates are rounded.

We also own three otheradditional royalties in the Cortez area where there is currently no production and no mineral resources or mineral reserves attributed to these royalty interests.

Royalty Agreements

Cortez GSR1 and GSR2 - Royalty Agreement dated April 1, 1999 between The Cortez Joint Venture (“Cortez JV”), Placer Dome U.S. Inc., and Royal Crescent Valley Inc. (“Royal Crescent”); as amended by that First Amended Memorandum of Grant of Royalty dated April 1, 1999 between Cortez JV, Placer Dome U.S. Inc., Royal Gold and Royal Crescent; that Second Amended Memorandum of Grant of Royalty dated December 8, 2000 between Cortez JV, Placer Dome U.S. Inc., Royal Gold and Royal Crescent; that Third Amended Memorandum of Grant of Royalty dated December 17, 2001 between Cortez JV, Placer Dome U.S. Inc., Royal Gold and Royal Crescent; that Fourth Amended Memorandum of Grant of Royalty dated October 1, 2008 between Cortez JV, Royal Gold and Royal Crescent; and subject to that Royalty Deed and Assignment dated October 1, 2008 from Royal Gold to Barrick Gold Finance Inc.

Cortez GSR3 - Special Warranty Deed Conveying Overriding Royalty Interest dated June 30, 1993, recorded in Book 396, commencing at Page 23 in Lander County and Book 248, commencing at Page 284 in Eureka County, as corrected by Correction Special Warranty Deed Conveying Overriding Royalty Interest dated August 9, 1993, recorded in Book 400, commencing at Page 328 in Lander County, and in Book 253, commencing at Page 405 in Eureka County.; Special Warranty Deed and Bill of Sale dated June 30, 1993, recorded in Book 396, commencing at Page 160 in Lander County, and in Book 248, commencing at Page 422 in Eureka County, as corrected by Correction Special Warranty Deed and Bill of Sale dated August 9, 1993, recorded in Book 400, commencing at Page 599 in Lander County, and in Book 254, commencing at Page 142 in Eureka County; Special Warranty Deed Conveying Interest in Overriding Royalty dated June 30, 1993, recorded in Book 396, commencing at Page 276 in Lander County, and in Book 249, commencing at Page 1 in Eureka County, as corrected by Correction Special Warranty Deed Conveying Interest in Overriding Royalty dated August 9, 1993, recorded in Book 400, commencing at Page 458 in Lander County, and in Book 254, commencing at Page 001 of the Official Records of Eureka County; Memorandum of Surviving Provisions of the Exchange Agreement dated June 30, 1993, recorded in Book 396, commencing at Page 151 in Lander County, and in Book 248, commencing at Page 412 in Eureka County, as corrected by Corrected Memorandum of Surviving Provisions of Exchange Agreement dated August 9, 1993, recorded in Book 400, commencing at Page 589 in Lander County, and in Book 254, commencing at Page 132 in Eureka County; Exchange Agreement dated June 30, 1993 as amended by First Amendment of Exchange Agreement dated August 9, 1993; Clarification Agreement dated August 11, 1995 between Cortez Joint Venture, Cortez Gold Mines, Placer Dome U.S. Inc., Kennecott Exploration (Australia), Ltd., Idaho Resources Corporation and the Idaho Group of royalty holders, recorded in Book 421, commencing at Page 205 in Lander County, and in Book 287, commencing at Page 552,

55

Table of Contents

in Eureka County; subject to certain special warranty deeds dated September 1, 1999; and subject to that Royalty Deed and Assignment dated October 1, 2008 between Royal Gold, Inc. and Barrick Gold Finance Inc.

Cortez NVR1 and Cortez NVR1C - Mining Lease dated April 15, 1991 between ECM, Inc. and Placer Dome U.S. Inc., as assigned by that Assignment and Quitclaim Deed dated August 14, 1991 from Placer Dome U.S. Inc. to Cortez Gold Mines, as amended by that First Amendment to Mining Lease dated December 22, 1992 between ECM, Inc. and Placer Dome U.S. Inc., that Second Amendment to Mining Lease dated May 26, 1994 between ECM, Inc. and Cortez Gold Mines, that Third Amendment to Mining Lease dated December 13, 1999 between ECM, Inc. and Cortez Gold Mines, that Fourth Amendment to Mining Lease dated March 23, 2001 between ECM, Inc. and Cortez Joint Venture, dba Cortez Gold Mines, that Fifth Amendment to Mining Lease dated December 6, 2001 between ECM, Inc. and Cortez Joint Venture, dba Cortez Gold Mines, and that Sixth Amendment to Mining Lease dated December 6, 2002 between ECM, Inc. and Cortez Joint Venture, dba Cortez Gold Mines; that Royalty Deed and Agreement dated April 15, 1991 between Royal Crescent and ECM, Inc., as assigned by that Assignment dated April 16, 1992 from Royal Crescent to Crescent Valley Partners, L.P.; as assigned by that Royalty Deed and Assignment dated October 1, 2008 between Crescent Valley Partners, L.P., and Barrick Gold Finance Inc., and that Deed and Assignment dated September 19, 2016 between ECM, Inc. and Denver Mining Finance Company, Inc.

Cortez NVR2 - North Mining Lease dated October 16, 2002 between Tom and Volina Connolly, and the Jeannette L. Baumann Trust, and Barrick Gold U.S. Inc., successor to Placer Dome U.S. Inc. (“Barrick Gold U.S.”); South Mining Lease dated October 16, 2002 between Tom and Volina Connolly, and the Jeannette L. Baumann Trust, and Barrick Gold U.S.; North Option Agreement dated October 16, 2002 between Tom and Volina Connolly, and Barrick Gold U.S.; South Option Agreement dated October 16, 2002 between Tom and Volina Connolly, and Barrick; as assigned by that Assignment of Lease dated November 2, 2004 from Tom and Volina Connolly to The Thomas and Volina Connolly Family Trust, assigning its interest in the North Mining Lease; that Assignment of Lease dated November 2, 2004 from Tom and Volina Connolly to The Thomas and Volina Connolly Family Trust; that General Warranty Deed with Reservation of Royalty (North) dated December 11, 2007 from The Thomas and Volina Connolly Family Trust to Barrick Gold U.S., recorded as Document No. 2007-211323 in Eureka County; that General Warranty Deed with Reservation of Royalty (South) dated December 11, 2007 from The Thomas and Volina Connolly Family Trust to Barrick Gold U.S., recorded as Document No. 2007-211324 in Eureka County; as assigned by that Assignment of Mining Leases and Option Agreements dated January 7, 2014 between The Thomas and Volina Connolly Family Trust and Royal Gold, Inc., recorded as Document No. 2014-226564 in Eureka County; as assigned by that Deed of Royalty and Assignment of Rights dated January 7, 2014 between The Thomas and Volina Connolly Family Trust and Royal Gold, Inc., recorded as Document No. 2014-226563 in Eureka County; and assigned by that Deed of Mineral Rights dated January 7, 2014 between The Thomas and Volina Connolly Family Trust and Royal Gold, Inc., recorded as Document No. 2014-226562 in Eureka County.

Rio Tinto Royalty - Rio Tinto Production Royalty Deed dated March 5, 2008 between Kennecott Royalty Company, successor to Kennecott Explorations (Australia) Ltd., and Barrick Gold Finance, Inc., recorded as Document No. 2008-211704 in Eureka County, and as Document No. 250801 in Lander County; as assigned by that Assignment of Production Royalty (Cortez Royalty; Lander and Eureka Counties, Nevada) between Kennecott Royalty Company and RG Royalties, LLC, recorded as Document No. 2022-248598 in Eureka County, and as Document No. 306208 in Lander County.

Idaho Royalty - Special Warranty Deed Conveying Overriding Royalty Interest dated June 30, 1993, recorded in Book 396, commencing at Page 23 in Lander County and Book 248, commencing at Page 284 in Eureka County, as corrected by Correction Special Warranty Deed Conveying Overriding Royalty Interest dated August 9, 1993, recorded in Book 400, commencing at Page 328 in Lander County, and in Book 253, commencing at Page 405 in Eureka County.; Special Warranty Deed and Bill of Sale dated June 30, 1993, recorded in Book 396, commencing at Page 160 in Lander County, and in Book 248, commencing at Page 422 in Eureka County, as corrected by Correction Special Warranty Deed and Bill of Sale dated August 9, 1993, recorded in Book 400, commencing at Page 599 in Lander County, and in Book 254, commencing at Page 142 in Eureka County; Special Warranty Deed Conveying Interest in Overriding Royalty dated June 30, 1993, recorded in Book 396, commencing at Page 276 in Lander County, and in Book 249, commencing at Page 1 in Eureka County, as corrected by Correction Special Warranty Deed Conveying Interest in Overriding Royalty dated August 9, 1993, recorded in Book 400, commencing at Page 458 in Lander County, and in Book 254, commencing at Page 001 of the Official Records of Eureka County; Memorandum of Surviving Provisions of the Exchange Agreement dated June 30, 1993, recorded in Book 396, commencing at Page 151 in Lander County, and in Book 248, commencing at Page 412 in

56

Table of Contents

Eureka County, as corrected by Corrected Memorandum of Surviving Provisions of Exchange Agreement dated August 9, 1993, recorded in Book 400, commencing at Page 589 in Lander County, and in Book 254, commencing at Page 132 in Eureka County; Exchange Agreement dated June 30, 1993 as amended by First Amendment of Exchange Agreement dated August 9, 1993; Clarification Agreement dated August 11, 1995 between Cortez Joint Venture, Cortez Gold Mines, Placer Dome U.S. Inc., Kennecott Exploration (Australia), Ltd., Idaho Resources Corporation and the Idaho Group of royalty holders, recorded in Book 421, commencing at Page 205 in Lander County, and in Book 287, commencing at Page 552, in Eureka County; subject to certain special warranty deeds dated effective December 30, 2022.

Property Description

The Cortez Complex is a combination of open pit and underground mining operations and projects owned and operated by NGM. NGM combined Newmont and Barrick assets across Nevada in 2019 to allow for operational integration between projects held by Newmont and Barrick. NGM is operated by Barrick.

The Cortez Complex comprises the Pipeline, Crossroads, Cortez Hills, Cortez Pits and Gold Acres open pit operations, the Cortez Hills underground mining operation, and the Goldrush, Fourmile and Robertson development projects. The Fourmile project is 100% owned by Barrick and is not currently included in the NGM joint venture, but may be contributed to the joint venture if certain criteria are met in the future.

Deposits within the Pipeline/Crossroads complex and Cortez Pits are mined by conventional open pit methods. Open pit operations moved 118 million tonnes of combined ore and waste in 2022. Two different mining methods are used at the underground operations, long-hole open stoping and drift-and-fill. Underground operations at Cortez Hills are based on an ore production rate of 3,630 tpd.

The gold-recovery process used at the Cortez Complex is determined by considering the grade and metallurgical character of the particular ore: lower grade ROM oxide ore is heap leached at existing facilities; higher-grade non-refractory ore is treated in a conventional mill using cyanidation and the CIL process; and refractory ore is stockpiled on site in designated areas and trucked to the nearby Carlin Complex for processing. Gold recovered from the ore is processed into doré on site and shipped to outside refineries for processing into gold bullion.

The active heap leach facilities are located at the Pipeline and Cortez Hills complexes. Milling activities at Cortez are conducted at the Pipeline complex, which includes crushing and grinding facilities, CIL circuits, reagent storage areas and a recovery/refining circuit. Plant throughput can reach up to 16,300 tpd depending on the hardness of the ore being processed.

The Goldrush underground project is currently in development. The primary access is a set of twin declines developed to allow exploration and initial test stoping on the orebody. The primary method of extraction at the Goldrush mine is longhole open stoping. The basic mining unit is a stope with the dimensions of 15 m (width) by 15 m (strike length) by 20 m (height). The stopes will be extracted on a transverse primary/secondary system with (where possible), a continuous mining front. Broken material is hauled from the mine using 63-tonne capacity haul trucks out of the mine declines. Void space is then filled with cemented rock fill. A paste plant is expected to be constructed to provide backfill.

Most of the Goldrush deposit contains typical double refractory roast-type ore (gold locked in sulfides and organic preg-robbing carbon present). All Goldrush samples showed a relatively high gold recovery in the bench-scale roast tests. Both the Carlin and Gold Quarry roasters at NGM’s Carlin Complex are capable of generating high gold recoveries from the Goldrush ore, and ore is expected to be trucked and processed at both facilities.

Barrick has reported that development of the Robertson open pit project is proposed to be in alignment with the Cortez Complex open pit operations, using conventional drill and blast techniques and truck and shovel fleet. Material is expected to be drilled, blasted and mined on 12 m benches. All mineralization is anticipated to be oxide and is currently planned to be processed at the Pipeline mill or on a future leach pad that will be constructed at the Robertson complex.

57

Table of Contents

Graphic

Source: Barrick, 2022

Age and Condition of Infrastructure

Construction of Mill #2 and associated infrastructure was completed in 1997 with the initial mining of the Pipeline deposit.

Royal Gold does not have current specific information on the physical condition of the equipment, facilities, infrastructure, or underground development of the Cortez complex mining operations.

Book Value

The operator does not provide Royal Gold with the operator’s book value or total cost detail for the property and associated plant and equipment.

Property History

In 1964, a joint venture was formed to explore the Cortez area. In 1969, the original Cortez mine went into production. From 1969 to 1997, gold ore was sourced from open pits at Cortez, Gold Acres, Horse Canyon and Crescent. In 1991, the Pipeline and South Pipeline deposits were discovered, with development approval received in 1996. In 1998, the Cortez Pediment deposit was discovered, with the Cortez Hills discovery announced in April 2003. The Cortez Hills development was approved by Placer Dome and Kennecott, then joint venturers, in September 2005 and confirmed by Barrick in 2006. Barrick obtained an interest in the Cortez property through its acquisition of Placer Dome in 2006. Barrick consolidated its 100% interest in the property following its purchase of the Kennecott interest in 2008. On July 1, 2019, Barrick’s interest in Cortez was contributed to NGM.

58

Table of Contents

Barrick purchased the Robertson property from Coral Gold Resources Ltd. In June 2017. The property is located 10 km due north of the Pipeline mill and administration complex. Robertson is the subject of a feasibility study based on open pit mining and ore processing at the Pipeline mill and heap leach facilities.

Permitting and Encumbrances

A number of federal and state permits are required to operate the Cortez mine. Cortez adheres to permitting guidelines from the U.S. Bureau of Land Management (“BLM”), the Nevada Revised Statutes, the Nevada Administrative Code, and additional federal government requirements.

The Cortez Operations are predominantly located on public lands administered by the BLM with a small portion on private lands owned by Barrick Cortez Inc. The operations are located in Eureka and Lander Counties with BLM jurisdiction from the Battle Mountain and Elko field offices. No facilities are located in Eureka County, however, the Cortez boundary extends onto BLM-administered lands in Eureka County to accommodate a portion of the Cortez Hills Open Pit and ancillary facilities.

The major permits required for operating on public lands are the approval of the Plan of Operation (“POO”) by the BLM and a Reclamation Permit from the BLM and Nevada Division of Environmental Protection (“NDEP”). The Cortez property has received approval for a number of POOs and reclamation permits since the early 1980s. Permits were issued to allow mining and processing of ore from the East Pit, Horse Canyon Pit, Gold Acres, South Extension Pit, Cortez Canyon, and other areas that are no longer actively mined. The major environmental analysis documents (e.g. Environmental Assessment, EIS, Supplemental Environmental Impact Statement, Record of Decision (“ROD”), Finding of No Significant Impact and POOs that have been issued for the currently active areas of Cortez (i.e., Crossroads, Pipeline, and Cortez Hills).

Reclamation of disturbed areas resulting from mining activities will follow the approved Reclamation Plan and will be completed in accordance with BLM and NDEP regulations that are intended to prevent unnecessary or undue degradation of public lands by operators authorized by the mining laws. The state of Nevada requires a reclamation bond based on the disturbed areas. The surety amount is reviewed every three years or whenever a POO amendment is submitted for review and approval to determine if the current bond is still adequate to execute the approved Reclamation Plan. The permit is valid for the life of the Mine unless it is modified, suspended, or revoked by NDEP.

The State of Nevada imposes a 5% Net Proceeds of Minerals tax on the value of all minerals severed in the State. This tax is calculated and paid based on a prescribed net income formula which is different from book income.

Property Geology

The Cortez property is situated along the Cortez/Battle Mountain trend. The principal gold deposits and mining operations are located in the southern portion of Crescent Valley, which was formed by basin and range extensional tectonism.

Mineralization is sedimentary rock-hosted and consists of submicron to micrometer-sized gold particles and gold in solid solution in pyrite. Mineralization is disseminated throughout the host rock matrix in zones of silicified, decarbonatized, and/or argillized, silty calcareous rocks.

The Cortez Hills deposit consists of the Breccia Zone, Middle Zone, Lower Zone, Renegade Zone and the Pediment deposit. The maximum strike length of mineralization in the Cortez Hills deposit is approximately 1,300 m, and the maximum width is approximately 420 m. The mineralized zone starts at approximately 120 m below surface and continues to more than 600 m below surface. Select areas of the underground mineral resource have expansion potential. Exploration to fully delineate the extent of the Cortez Hills deposit is ongoing.

Ore at the Pipeline complex deposit is hosted within silty carbonates associated with the Roberts Mountain and Wenban formations. The maximum strike length of mineralization in the Pipeline deposit is approximately 2,400 m and the

59

Table of Contents

maximum width is approximately 1,500 m. The mineralized zone starts approximately 60 m below surface and continues to 600 m below surface.

The Goldrush deposit has a maximum thickness of 76 m, a width of about 425 m, and extends along strike for approximately 5,275 m. The deepest significant intercept is currently at 1,435 m. The Goldrush system remains open to the north into Fourmile, to the southeast, and in multiple directions in the Ken Balleweg (KB) Domain.

Robertson is an igneous related gold system. Gold mineralization is found in Upper Plate siliciclastics of the Devonian Slaven and Silurian Elder formations, as well as inside Eocene intermediate composition igneous rocks, primarily diorite and granodiorite. Mineralization is primarily concentrated around the Tenabo Stock in three main areas: Gold Pan in the northwest, Porphyry in the east to northeast, and Altenburg Hill in the southeast. Gold is associated with bismuth and tellurium and is commonly found in association with arsenopyrite and loellingite (FeAsS). Gold at Robertson is present as native gold, with minor electrum, and all gold present is free-milling.

Mineral Resources and Mineral Reserves

Table 1 Cortez – Summary of Gold Mineral Resources at December 31, 2022, Based on $1,700 Au (1),(2),(3)

Amount

Tonnes (M)

Au Grade

gpt

Cut-Off Grade

Metallurgical Recovery

Measured Mineral Resources

1.5

5.41

(4)

(5)

Indicated Mineral Resources

99.2

1.56

(4)

(5)

Measured + Indicated Mineral Resources

100.7

1.62

(4)

(5)

Inferred Mineral Resources

203.3

1.06

(4)

(5)

(1)

Reported mineral resource is as of December 31, 2022. Barrick reports mineral resources pursuant to CIM Standards. SK1300 does not permit reciprocal recognition of mineral resources determined under the mining disclosure regime of another jurisdiction. The amounts, grades and recovery of mineral resources determined under SK1300 could vary from the disclosure set forth here. While the SK1300 definitions are substantially similar to those set forth in the CIM Standards, there are variations.

(2)

Mineral resources are presented exclusive of mineral reserves.

(3)

We control various royalty positions at Cortez, including (i) the overlapping royalties covering the Pipeline and Crossroads deposits (known as GSR1, GSR2, GSR3, NVR1 and NVR1C), which are equivalent to an approximate 8% gross smelter return royalty and cover (as of December 31, 2021) 5.2 million tonnes of measured and indicated mineral resources at an average grade of 1.33 gpt;  (ii) NVR2 over a portion of the Goldrush property, which is a 1% NVR covering 0.9 million tonnes of indicated resource averaging 4.42 gpt and 2.1 million tonnes of inferred resources grading 4.67 gpt.; (iii) The Rio Tinto Royalty, which is an effective 1.2% gross royalty on the Cortez Complex (excluding the existing Robertson deposits) at gold prices above $900 per ounce; and (iv) the Idaho Royalty, which is an approximate 0.24% gross royalty covering areas including the Pipeline and Crossroads deposits, and an approximate 0.45% gross royalty covering areas including the Cortez Hills, Goldrush, Fourmile and Robertson deposits. Barrick has updated mineral resource reporting for Cortez as of December 31, 2022, but has not yet provided us with the breakdown by region. Our royalties for Cortez cover all metals, but Barrick reports only gold resources for Cortez.

(4)

Specific cut-off grades for mineral resource estimates for Cortez have not been disclosed by Barrick.

(5)    

Metallurgical recovery assumptions for Cortez have not been disclosed by Barrick.

Table 2 Cortez – Summary of Gold Mineral Reserves at December 31, 2022, Based on $1,300 Au and $18 Ag (1),(2)

Amount

Tonnes (M)

Au Grade

gpt

Cut-Off Grade

Metallurgical Recovery

Proven Mineral Reserves

2.2

5.63

(3)

(4)

Probable Mineral Reserves

221.1

2.22

(3)

(4)

Total Mineral Reserves

223.3

2.26

(3)

(4)

(1)

Reported mineral reserve is as of December 31, 2022. Barrick reports mineral reserves pursuant to CIMC Standards. SK1300 does not permit reciprocal recognition of mineral reserves determined under the mining disclosure regime of another

60

Table of Contents

jurisdiction. The amounts, grades and recovery of mineral reserves determined under SK1300 could vary from the disclosure set forth here. While the SK1300 definitions are substantially similar to those set forth in the CIM Standards, there are variations.

(2)

We control various royalty positions at Cortez, including (i) the overlapping royalties covering the Pipeline and Crossroads deposits (known as GSR1, GSR2, GSR3, NVR1 and NVR1C), which are equivalent to an approximate 8% gross smelter return royalty and cover (as of December 31, 2021) 56.6 million tonnes of proven and probable reserves at an average grade of 1.65 gpt; (ii) NVR2 over a portion of the Goldrush property, which is a 1% NVR covering 4.9 million tonnes of probable reserves averaging 7.13 gpt; (iii) The Rio Tinto Royalty, which is an effective 1.2% gross royalty on the Cortez Complex (excluding the existing Robertson deposits) at gold prices above $900 per ounce; and (iv) the Idaho Royalty, which is an approximate 0.24% gross royalty covering areas including the Pipeline and Crossroads deposits, and an approximate 0.45% gross royalty covering areas including the Cortez Hills, Goldrush, Fourmile and Robertson deposits. Barrick has updated reserve reporting for Cortez, but has not yet provided us with the breakdown by region. Our royalties for Cortez cover all metals, but Barrick reports only gold reserves for the property.

(3)

Specific cut-off grades for mineral reserve estimates for Cortez have not been disclosed by Barrick.

(4)

Metallurgical recovery assumptions for Cortez have not been disclosed by Barrick.

Change in Mineral Resources and Mineral Reserves from Prior Year

From December 31, 2021 to December 31, 2022, measured and indicated gold mineral resources have increased from 0.1 million to 5.2 million ounces (4800%) and proven and probable gold mineral reserves have increased from 3.5 million to 15.7 million ounces (350%), primarily as a result of the acquisition of the CC Zone royalties described above, but also due to reserves replacement announced by Barrick.

Recent Developments

Production attributable to our royalty interestinterests at the Cortez increased to 173,300Complex for the year ended December 31, 2022, was approximately 414,000 ounces of gold, overof which 300,000 ounces were attributable to the prior fiscal year of 96,700Legacy Zone, and 114,000 ounces were attributable to the CC Zone, compared to approximately 361,300 ounces of gold as a result of production ramping upfor the year ended December 31, 2021. Production during the prior year was attributable to the Legacy Zone, including overlapping royalties at the Pipeline and Crossroads deposit, which is subjectdeposits (known as GSR1, GSR2, GSR3, NVR1 and NVR1C), while production for the year ended December 31, 2022 was attributable to our NVR1 (Crossroads)the Legacy Zone and GSR2 royalty interests and portionsthe CC Zone, but, in the case of the NVR1latter, only after the effective date of acquisition of our interests over the CC Zone.

At the Legacy Zone during 2022, the planned open pit mining in the Pipeline pit was materially completed and GSR3 royalty interests.

Duringa transition to the Crossroads open pit occurred. Gold production attributed to the Pipeline/Crossroads area was lower in the September quarter ended March 31, 2020, Barrick provided us with an updated reserve statementas this transition occurred and lifemining of mine plan for Cortez. According to Barrick, as of December 31, 2019, total proven and probable reserves subject to our royalty interests contained 3.5 million ounces of gold (consisting of 87.0 million tonnes ofhigher-grade oxide ore at a gradeCrossroads resulted in improved production in the December quarter.

At the CC Zone during 2022, project development continued, most notably at the Goldrush, Fourmile and Robertson projects. At Goldrush, underground development, bulk sampling, test mining, and other exploration continued and focused on verifying geological, geotechnical and hydrogeological models developed during the feasibility study. On February 15, 2023, Barrick reported that mine development and test stoping at Goldrush has continued at the Redhill zone, where dewatering of 1.26 grams per tonne). Reserves were calculated at a gold pricethe orebody is not required, and development continues on exploration drifts above the Goldrush orebody to facilitate future underground drilling platforms. The Record of $1,200 per ounce.

Further according to Barrick, total gold production at CortezDecision (“ROD”) from the regions subject to our interestsBLM is expected to be approximately 175,000 ouncesissued by the end of the first half of 2023, and the transition to full-scale mining is expected upon receipt of a positive ROD.

At Fourmile, resource and exploration drilling continued on areas in calendar year 2020, increasingthe gap between Goldrush and Fourmile and to an approximate averagethe north of 425,000 ounces from calendar 2021 through calendar 2026. The expected production increase from calendar year 2020 to calendar year 2021 is primarily due to higher contribution from the Crossroads deposit, whichexisting Fourmile model. This additional drilling is expected to ramp up through calendar yearadd to the indicated resource reported by Barrick of 1.0 million tonnes with a gold grade of 10.9 gpt gold and the inferred resource of 6.4 million tonnes with a gold grade of 10.6 gpt, dated December 31, 2021. A revised mineral resource is expected in early 2023.

At Robertson, resource and reserve definition drilling provided further understanding of the geologic controls and related processing options. On February 9, 2023, Barrick reported a maiden proven and offset decliningprobable reserve of 1.6 million ounces

61

Table of Contents

(100% basis) grading 0.46 gpt at the Robertson open pit project after the completion of a pre-feasibility study.  According to Barrick, this will be a key source of oxide mill feed in the Cortez Complex mine plan. Any plan for production from the other royalty regions.Robertson project will require permitting.

Peñasquito (Zacatecas, Mexico)Additionally, Barrick reported that successful resource definition drilling at Robertson and Goldrush supports the potential for future reserve growth.  

We own aOn February 15, 2023, Barrick reported that it expects gold production payment equivalentof 580,000 to a 2.0% NSR royalty on all metal650,000 ounces in 2023 from its 61.5% interest in the Cortez Complex, implying total production of approximately 940,000 to 1,060,000 ounces from the Cortez Complex.

Peñasquito

The disclosures below regarding Peñasquito open-pitare derived from the NI 43-101 Technical Report dated June 30, 2018 pursuant to NI 43-101 and CIM Standards, and the mineral resource and reserve updates are derived from Newmont’s 10K dated December 31, 2021 pursuant to SK1300. Royal Gold requested information prepared in accordance with SK1300 or access to underlying technical data sufficient to prepare its own technical report summary, and the operator denied the request.

Graphic

Location

The Peñasquito open pit mine and ore processing facilities are located inapproximately 200 km northeast of the Statecity of Zacatecas Mexico, and operated by a subsidiary of Newmont. The Peñasquito mine is located approximately 17 miles27 km west of the town of Concepción del Oro, Zacatecas, Mexico. Mexico, at 24.65°N latitude and 101.68°W longitude.

The mine, composedterrain is generally flat, with some rolling hills, with a prevailing elevation of two main deposits called Peñascothe property is approximately 1,900 m above sea level. The climate is generally dry with precipitation being limited for the most part to a rainy season in the months of June and Chile Colorado, hosts large gold, silver, zincJuly. Annual precipitation for the area is approximately 700 mm.

62

Table of Contents

Infrastructure

Infrastructure to support the mining and lead reserves. The deposits contain both oxideprocessing operation is in place and sulfide material, resulting in heap leach and mill processing.  well established.

There are two access routes to the site. The first is via a turnoff from Highway 54 onto the State La Pardita road, then onto the Mazapil to Cedros State road. The second access is via the Salaverna by-pass road from Highway 54 approximately 16 miles25 km south of Concepción del Oro. The Salaverna by-pass is a new, purpose-built gravel road that eliminates the steep switchback sections of cobblestone road just west of Concepción Del Oro and passes the town of Mazapil. From Mazapil, this is a well-maintained gravel road that accesses the mine main gate.

The closest rail link is 100 km to the west.

There is a private airport on site and commercial airports in the cities of Saltillo, Zacatecas and Monterrey. Travel from Monterrey/Saltillo is approximately 255 km, about three hours to site. Travel from Zacatecas is approximately 270 km, about 3.5 hours to site.

For fiscal 2020, gold production attributable

Power is supplied from the 182 MW power purchase agreement with InterGen, delivered to our royalty interest atthe mine by the Mexican Federal Electricity Commission (Comisión Federal de Electricidad or CFE). CFE also continues to provide backup power supply for both planned and unplanned shutdowns from the InterGen power plant.

Process and potable water for the Peñasquito increased to 312,200 ounces overmine is sourced from the prior fiscal yearTorres-Vergel well field located 6 km west of 158,800 ounces; silver production increased to 27.8 million ounces over the prior fiscal year of 16.4 million ounces; lead increased to 182.3 million pounds overPeñasquito Mine and an additional groundwater source within the prior fiscal year of 117.4 million pounds; and zinc increased to 393.9 million pounds overCedros basin named the prior fiscal year of 216.2 million pounds.Northern Well Field.

The increase in production is attributablemine has received permits to higher gradespump up to 4 million m3 of this water per year via eight water rights titles over the Torres and recoveriesVergel water well field and tons processed comparedNorthern Well field. Peñasquito continuously monitors the aquifers to the prior fiscal year, as well as the suspensionensure they remain sustainable, through a network of operations during the June 2019 quarter, resulting in significantly lower sales from Peñasquito during the prior fiscal year.monitoring wells to measure water levels and water quality.

A skilled labor force is available in the region and surrounding mining areas of Mexico. Fuel and supplies are sourced from nearby regional centers such as Monterrey, Monclova, Saltillo and Zacatecas and imports from the U.S. via Laredo.

Site accommodations comprise a camp with full dining, laundry and recreational facilities.

Area of Interest

At Peñasquito, our royalty interest covers 20 mining concessions comprising 45,823 hectares covering the Chile Colorado and Peñasco open pit mines.

Royalty Agreement

Under theTermination of Property Rights Agreement dated May 5, 1999 between Kennecott Exploration Company, Minera Kennecott S.A. de C.V. (together, “Kennecott”), Western Copper Holdings Ltd and Minera Western Copper S.A. de C.V., and assigned by Kennecott to Royal Gold in 2006 and as supplemented in 2012, we own a production payment equivalent to a 2.0% NSR royalty on all metal production from the Peñasquito open-pit mine, located in the State of Zacatecas, Mexico, and operated by a subsidiary of Newmont.

Property Description

The Peñasquito mine is a production stage property comprised of two open pit surface mines and a complex flotation and pyrite leaching processing facility.

The open pit operation is undertaken using a conventional truck-and-shovel fleet consists of five rope shovels, three hydraulic shovels, 3 front-end loaders paired with 82 haul trucks with a 312-tonne payload capacity, and nine blasthole drills. In 2021 the mining operations moved 177 million tonnes of total material.

2163

Table of Contents

On April 22, 2020, Newmont announcedThe Peñasquito reachedmine consists of a definitive agreement with the San Juan de Cedros community (oneleach facility that can process a nominal 6,000 tpd of 25 neighboring communities) in Zacatecas, Mexico on land use, water availability, infrastructureoxide ore and social investments, which includes access to 10,000 hectares for exploration and operational purposes, and resolves all outstanding issues with the community.a sulfide plant that can process a nominal 115,500 tpd of sulfide ore.

On May 5, 2020, Newmont announced that operationsThe sulfide processing plant, comprising four stages of flotation; carbon, lead, zinc and pyrite. Comminution is accomplished by one primary crusher, an augmented feed circuit including secondary crusher, pebble crushers, and high pressure grinding rolls. There are two SAG mills and four ball mills completing the comminution operation. The mine uses a 4-step flotation circuit to produce a lead concentrate, a zinc concentrate, and a pyrite leach circuit which yields a gold doré product. In 2021, the mill processed 35.7 million tonnes.

The carbon pre-flotation circuit was added in 2018 ahead of lead flotation to remove organic carbon associated with sedimentary ores. In the lead and zinc flotation, the slurry is conditioned with reagents to activate the desired minerals and produce lead and zinc concentrates. The pyrite leach circuit was added at the end of 2018, which treats the zinc tailings in a pyrite flotation leach, and Merrill Crowe process to recover additional silver and gold in the form of doré. Tailings from the leach circuit undergoes cyanide destruction and combines with final flotation tailings for final deposition in the TSF.

The markets for the lead and zinc concentrates from the Peñasquito were placed on care and maintenance on April 12 due to a Mexican federal government decree to temporarily suspend all non-essential activitiesmine are worldwide with smelters located in Mexico, Canada, United States, Asia and Europe.

All required project infrastructure, such as roadways, mine and administration buildings, process plant, explosives storage facility, fuel farm, truck shop, workshops and security, has been constructed and is operational.

Age and Condition of Infrastructure

Mine construction commenced in 2007. Sulfide processing plants were commissioned in 2009 and 2010. A pyrite leach project for leaching gold from pyrite tailings was completed in 2018.

Royal Gold does not have specific information as to the physical condition or the age or condition of the equipment and infrastructure.

Book Value

The operator does not provide Royal Gold with the operator’s book value or total cost detail for the property and associated plant and equipment.

Property History

In 1568, Spanish explorers discovered gold-silver deposits at Concepcion del Oro, 30 km to the east of the Peñasquito operations. Since then, the Concepcion del Oro area has produced 1.5 million ounces of gold and 250 million ounces of silver. About the same time, the Spanish also worked at the project developing shallow shafts and pits.

A summary of the known project owners over the mineral concessions covering the Peñasquito operations area are as follows:

Minera Peñoles, 1950’s
Minera Kennecott SA de CC, 1994-1998
Western Copper Holdings Lts, 1998
Minera Hochschilds S.A., 2000
Western Copper, 2000-2003
Western Silver Corporation, 2003-2006
Goldcorp, 2006-2019
Newmont, 2019-present

Mine construction commenced in 2007. Initial concentrates were produced as part of a nationwide effort to help slow the spread of COVID-19. According to Newmont, a phased ramp-up begancommissioning process in mid-May with milling and mining activities ramping up at the beginning ofOctober 2009. A second sulfide processing line was commissioned in June and production in the plant was back to pre-COVID levels by mid-June.

On July 30, Newmont provided full year 2020 production guidance2010. A pyrite leach project for Peñasquito of 510,000 ounces ofleaching gold 28 million ounces of silver, 360 million pounds of zinc, and 190 million pounds of lead.

Reserve Information

Table 1 below summarizes proven and probable reserves for gold, silver, copper, nickel, zinc, lead and cobalt that are subject to our stream and royalty interests as of December 31, 2019, as reported to us by the operators of the mines. Properties are currently in production unless noted as development (“DEV”) within the table. The exploration royalties we own do not contain proven and probable reserves as of December 31, 2019. Please refer to pages 22-26 for the footnotes to Table 1.from

2264

Table of Contents

Operators’ Estimated Proven and Probable Gold Reserves

Aspyrite tailings was completed in November 2018. The property was acquired in April 2019 by Newmont upon the acquisition of December 31, 2019(1)Goldcorp.

Gold(2)

PROVEN +

PROBABLE

RESERVES(3)(4)(5)


Average


Gold

Tons of

Gold

Contained

��

Ore

Grade

Ozs(6)

PROPERTY

ROYALTY/METAL STREAM

OPERATOR

LOCATION

(M)

(opt)

(M)

Bald Mountain


1.75% - 2.5% NSR(7)


Kinross


United States


18.950

0.023

0.436

Cortez GSR1


0.40 - 5.0% GSR(8)


Nevada Gold Mines LLC


United States


17.277

0.020

0.347

Cortez GSR2


0.40 - 5.0% GSR(8)


Nevada Gold Mines LLC


United States


78.662

0.040

3.168

Cortez GSR3


0.71% GSR


Nevada Gold Mines LLC


United States


26.714

0.017

0.466

Cortez NVR1


4.91% NVR


Nevada Gold Mines LLC


United States


16.065

0.016

0.262

Cortez NVR1C


4.52% NVR (9)


Nevada Gold Mines LLC


United States


69.225

0.044

3.049

Gold Hill


1.0 - 2.0% NSR(10,11)


Kinross


United States


4.897

0.016

0.080


0.6 - 0.9% NSR(12)


Goldstrike (SJ Claims)


0.9% NSR


Nevada Gold Mines LLC


United States


27.254

0.081

2.218

Hasbrouck Mountain (DEV)


1.5% NSR


West Vault Mining/Clover Nevada


United States


35.616

0.017

0.588

Leeville


1.8% NSR


Nevada Gold Mines LLC


United States


4.729

0.288

1.364

Marigold


2.0% NSR


SSR Mining


United States


173.425

0.014

2.356

Pinson (DEV)


3.0% NSR(13,14)


Waterton Precious Metals Fund


United States


7.557

0.064

0.483


2.94% NSR(13,15)


Relief Canyon (DEV)


3.0% NSR(16)


Americas Silver


United States


20.665

0.022

0.451

Robinson


3.0% NSR


KGHM


United States


84.310

0.005

0.413

Ruby Hill


3.0% NSR


Waterton Precious Metals Fund


United States


1.726

0.014

0.024

Twin Creeks


2.0% GPR


Nevada Gold Mines LLC


United States


0.768

0.060

0.046

Wharf


0.0 - 2.0% GSR(17)


Coeur Mining


United States


32.850

0.026

0.855

Back River - Goose Lake (DEV)


1.95% GSR(18)


Sabina Gold & Silver


Canada


13.623

0.184

2.503

Canadian Malartic


1.0 - 1.5% NSR(19)


Agnico Eagle/Yamana


Canada


43.531

0.028

1.239

Holt


0.00013 x quarterly avg. gold price


Kirkland Lake


Canada


4.829

0.116

0.562

Kutcho Creek (DEV)


2.0% NSR


Capstone Mining


Canada


11.509

0.009

0.100

LaRonde Zone 5


2.0% NSR


Agnico Eagle


Canada


10.237

0.067

0.686

Mount Milligan


35% of payable gold(20)


Centerra Gold


Canada


210.572

0.011

2.407

Pine Cove


7.5% NPI


Anaconda Mining


Canada


0.979

0.037

0.036

Rainy River


6.5% of gold produced(21)


New Gold


Canada


85.507

0.031

2.636

Williams


0.97% NSR


Barrick


Canada


18.017

0.059

1.068

Dolores


3.25% NSR


Pan American


Mexico


48.171

0.024

1.178

Peñasquito


2.0% NSR


Newmont


Mexico


486.670

0.017

8.080

Andacollo


100% of payable gold(22)


Teck


Chile


346.814

0.003

1.040

La Fortuna (DEV)


1.4% NSR(23)


Newmont


Chile


198.103

0.013

2.674

Don Mario


3.0% NSR


Orvana


Bolivia


2.240

0.054

0.121

Don Nicolas


2.0% NSR


Cerrado Gold


Argentina


1.327

0.148

0.196

Pueblo Viejo


7.5% of payable gold(24)


Barrick/Newmont


Dominican Republic


78.264

0.072

5.670

El Limon


3.0% NSR


Calibre


Nicaragua


2.253

0.127

0.286

La India (DEV)


3.0% NSR


Condor Gold


Nicaragua


7.606

0.089

0.675

Mara Rosa (DEV)


2.75% NSR


Amarillo Gold


Brazil


26.235

0.034

0.902

Balcooma


1.5% NSR


Consolidated Tin


Australia


0.762

0.002

0.001

Gwalia Deeps


1.5% NSR


St. Barbara


Australia


14.007

0.170

2.380

Jaguar Nickel (DEV)


1.5% NSR


Washington H. Soul Pattinson


Australia


1.323

0.008

0.010

King of the Hills


1.5% NSR


Red 5


Australia


39.683

0.036

1.448

Meekatharra


1.5% NSR(25)


Westgold Resources


Australia


5.524

0.082

0.454

South Laverton


1.5% NSR


Saracen


Australia


25.144

0.071

1.786

Southern Cross


1.5% NSR


Shandong Tianye


Australia


10.538

0.096

1.010

Wembley Durack (DEV)


1.0% NSR


Westgold Resources

Australia


0.362

0.055

0.020

Inata


2.5% GSR


Balaji Group


Burkina Faso


6.352

0.054

0.340

Taparko(26)


2.0% GSR


Nord Gold


Burkina Faso


6.504

0.074

0.483

Prestea


10.5% of payable gold (27)


Golden Star Resources


Ghana


0.856

0.353

0.302

Wassa


10.5% of payable gold (27)


Golden Star Resources


Ghana


18.406

0.077

1.410

Permitting and Encumbrances

Surface rights in the vicinity of the Peñasco and Chile Colorado open pits are held by three ejidos: Ejido Cedros, Ejido Mazapil and Ejido Cerro Gordo. Peñasquito has signed land use agreements with each ejidos, valid through 2035 and 2036, and the relevant private owners. In August 2020, Newmont and the Cedros General Assembly ratified the definitive agreement that was reached on April 22, 2020 and resolved all outstanding disputes between Peñasquito and the San Juan de Cedros community. In addition, easements have been granted in association with the La Pardita-Cedros Highway and the El Salero-Peñasquito powerline.

Newmont holds the appropriate permits under local, State and Federal laws to allow mining operations. Key permits include: environmental impact assessment; land use change; environmental risk; waste management; concession title for groundwater extraction; waste water discharge permit; environmental license (Licencia Ambiental Única); explosives permit; and accident prevention program.

Property Geology

The Peñasquito operation consists of two deposits: the Peñasco deposit, centered on a diatreme breccia pipe; and the Chile Colorado deposit, comprised of mineralized sedimentary rocks adjacent to the Brecha Azul diatreme. The diatreme and sediments contain and are surrounded by disseminated, veinlet and vein-hosted sulfides and sulfosalts containing base metals, silver, and gold.

Peñasco and Brecha Azul, which are funnel-shaped breccia pipes, flare upward and are filled with brecciated sedimentary and intrusive rocks, cut by intrusive dikes. The two diatremes are considered to represent breccia-pipe deposits developed as a result of Tertiary intrusion-related hydrothermal activity. Alteration mineral zoning, porphyry intrusion breccia clasts, and dikes all suggest the diatreme-hosted deposits represent distal mineralization some distance above an underlying quartz-feldspar porphyry system.

The larger diatreme, Peñasco, has dimensions of 900 m by 800 m immediately beneath surface alluvial cover, and diatreme breccias extend to at least 1,000 m below surface. The Brecha Azul diatreme, which lies to the southeast of Peñasco, is about 500 m in diameter immediately below alluvium, and diatreme breccias also extend to at least 1,000 m below surface. Porphyritic intrusive rocks intersected in drilling beneath the breccias may connect the pipes at depth.

Chile Colorado is a mineralized stock work located southwest of Brecha Azul in sediments of the Caracol Formation, with the geometry of approximately 600 m by 400 m immediately beneath surface alluvial cover, and it extends to at least 500 m below the surface.

Polymetallic mineralization is hosted by the diatreme breccias, intrusive dikes, and surrounding siltstone and sandstone units of the Caracol Formation. The diatreme breccias are broadly classified into three units, in order of occurrence from top to bottom within the breccia column, which are determined by clast composition:

Sediment-clast breccia;
Mixed-clast breccia (sedimentary and igneous clasts); and
Intrusive-clast breccia.

Mineralization consists of disseminations, veinlets and veins of various combinations of medium to coarse-grained pyrite, sphalerite, galena, and argentite (Ag2S). Sulfosalts of various compositions are also abundant in places, including bournonite (PbCuSbS3), jamesonite (PbSb2S4), tetrahedrite, polybasite (Ag,Cu)16 (Sb,As)2S11, and pyrogyrite (Ag3SbS3). Stibnite (Sb2S3), rare hessite (AgTe), chalcopyrite, and molybdenite have also been identified. Telluride minerals are the main gold-bearing phase, with electrum and native gold also being identified.

2365

Table of Contents

Operators’ Estimated ProvenMineral Resources and ProbableMineral Reserves

Table 1 Peñasquito – Summary of Gold, Silver, Reserves

As ofLead, and Zinc Mineral Resources at December 31, 20192021, Based on $1,400 Au, $23.00 Ag, $1.10 Pb, and $1.40 Zn (1),(2),(3)

Silver(28)

PROVEN +

RESERVES

PROBABLE

(3)(4)(5)

Average

Silver

Tons of

Silver

Contained

Ore

Grade

Ozs(6)

PROPERTY


ROYALTY/METAL STREAM


OPERATOR


LOCATION


(M)


(opt)


(M)

Gold Hill


1.0 - 2.0% NSR(10,11)


Kinross

United States


4.897

0.251

1.230


0.6 - 0.9% NSR(12)


Hasbrouck Mountain (DEV)


1.5% NSR


West Vault Mining/Clover Nevada

United States


35.616

0.297

10.569

Relief Canyon (DEV)

3.0% NSR(16)

Americas Silver

United States

20.665

0.037

0.760

Kutcho Creek (DEV)


2.0% NSR


Kutcho Copper

Canada


11.509

1.008

11.600

Rainy River


60% of silver produced (21)


New Gold

Canada


85.507

0.073

6.266

Dolores


2.0% NSR


Pan American

Mexico


48.171

0.762

36.700

Peñasquito


2.0% NSR


Newmont

Mexico


486.670

0.969

471.360

Don Mario


3.0% NSR


Orvana

Bolivia


2.240

1.438

3.221

Don Nicolas


2.0% NSR


Cerrado Gold

Argentina


1.327

0.302

0.401

Pueblo Viejo


75% of payable silver(24)


Barrick/Newmont

Dominican Republic


78.264

0.469

36.700

La India (DEV)


3.0% NSR


Condor Gold

Nicaragua


7.606

0.156

1.185

Balcooma


1.5% NSR


Consolidated Tin

Australia


0.762

0.498

0.380

Jaguar Nickel (DEV)


1.5% NSR


Washington H. Soul Pattinson

Australia


1.323

2.268

3.000

Khoemacau (DEV)

80% of payable silver(29)

Khoemacau Copper Mining

Botswana

33.521

0.567

19.011

Amount

Tonnes (M)

Au Grade

gpt

Ag Grade

gpt

Pb Grade

%

Zn Grade

%

Cut-Off Grade

Metallurgical Recovery

Measured Mineral Resources

31.4

0.27

25.71

0.29

0.66

(4)

(5)

Indicated Mineral Resources

176.6

0.27

26.36

0.26

0.57

(4)

(5)

Measured + Indicated Mineral Resources

208.0

0.27

26.26

0.26

0.58

(4)

(5)

Inferred Mineral Resources

89.8

0.40

28.00

0.24

0.54

(4)

(5)

(1)

Reported mineral resource is as of December 31, 2021. Newmont reports mineral resources pursuant to SK1300 requirements of the SEC.

(2)

Mineral resources are presented exclusive of mineral reserves.

(3)

Our interest at Peñasquito is a 2.0% NSR on all metals. The mineral resources listed are 100% of the mineral resources to which our royalty interest applies.

(4)

Gold cut-off grade varies with level of silver, lead, and zinc credits. Specific cut-off grades have not been disclosed by the operator.

(5)

Peñasquito mineral resources are presented assuming a 69% average metallurgical recovery for gold, 87% recovery for silver, 81% recovery for zinc, and 73% recovery for lead.

Operators’ Estimated Proven and Probable Base Metal Reserves

AsTable 2 Peñasquito – Summary of Gold, Silver, Lead, and Zinc Mineral Reserves at December 31, 20192021, Based on $1,200 Au, $20,00 Ag, $0.90 Pb, and $1.15 Zn (1),(2)

Copper(30)

PROVEN +

PROBABLE

RESERVES(3)(4)(5)

Average

Tons of

Base Metal

Base Metal

Ore

Grade

Contained Lbs(6)

PROPERTY

ROYALTY/METAL STREAM

OPERATOR

LOCATION

(M)

(%)

(M)

Robinson


3.0% NSR


KGHM


United States

84.310

0.41%

692.343

Kutcho Creek (DEV)


2.0% NSR


Kutcho Copper


Canada

11.509

2.01%

463.000

Mount Milligan

18.75% of payable copper(20)

Centerra Gold

Canada

210.572

0.23%

959.000

Voisey’s Bay


2.7% NVR


Vale


Canada

31.857

0.93%

590.221

Don Mario


3.0% NSR


Orvana


Bolivia

2.240

1.89%

84.723

La Fortuna (DEV)


1.4% NSR(23)


Newmont


Chile

198.103

0.49%

1,959.099

Balcooma


1.5% NSR


Consolidated Tin


Australia

0.762

2.13%

32.466

Jaguar Nickel (DEV)


1.5% NSR

Washington H. Soul Pattinson

Australia

1.323

0.42%

11.023

Las Cruces


1.5% NSR


First Quantum


Spain

1.874

4.82%

180.757

Amount

Tonnes (M)

Au Grade

gpt

Ag Grade

gpt

Pb Grade

%

Zn Grade

%

Cut-Of Grade

Metallurgical Recovery

Proven Mineral Reserves

115.0

0.61

38.27

0.37

0.94

(3)

(4)

Probable Mineral Reserves

247.0

0.52

31.78

0.30

0.71

(3)

(4)

Total Mineral Reserves

362.0

0.55

33.84

0.32

0.78

(3)

(4)

Lead(31)

PROVEN +

PROBABLE

RESERVES(3)(4)(5)

Average

Tons of

Base Metal

Base Metal

Ore

Grade

Contained Lbs(6)

PROPERTY

ROYALTY

OPERATOR

LOCATION

(M)

(%)

(M)

Peñasquito


2.0% NSR


Newmont


Mexico


483.474

0.34%

3,261.055

Balcooma


1.5% NSR


Consolidated Tin


Australia


0.762

0.52%

7.879

(1)

Reported mineral reserve is as of December 31, 2021. Newmont reports mineral reserves pursuant to SK1300 requirements of the SEC. Newmont states that the historical methodology applied to the prior year of estimating mineral reserves was not significantly impacted as a result of the change from IG7 to SK1300, and that, therefore, mineral reserves presented at December 31, 2021 and 2020, under the respective methodologies, are comparable.

(2)

Our interest at Peñasquito is a 2.0% NSR on all metals. The mineral reserves listed are 100% of the mineral reserves to which our royalty interest applies.

(3)

Gold cut-off grade varies with level of silver, lead, and zinc credits. Specific cut-off grades have not been disclosed by the operator.

(4)

Peñasquito mineral reserves are presented assuming a 69% average metallurgical recovery for gold, 87% recovery for silver, 81% recovery for zinc, and 73% recovery for lead.

Change in Mineral Resources and Mineral Reserves from Prior Year

The previous mineral resources and mineral reserves reported by Newmont were as of December 31, 2020. There was a decrease in mineral reserves and resources at the property year over year.


Proven and Probable Mineral Reserves

Measured and Indicated Mineral Resources


12/31/2020

12/31/2021

% Change

12/31/2020

12/31/2021

% Change

Au ounces (M)

7.1

6.3

-11%

2.4

1.80%

-26%

Ag ounces (M)

425.8

392.9

-7%

238.1

175.6

-26%

Pb Lbs. (B)

2.96

2.58

-13%

1.67

1.21

-27%

Zn Lbs. (B)

6.81

6.24

-8%

3.68

2.68

-27%

24

Table of Contents

Zinc(32)

PROVEN +

PROBABLE

RESERVES(3)(4)(5)

Average

Tons of 

Base Metal

Base Metal

Ore

Grade

Contained Lbs(6)

PROPERTY

ROYALTY

OPERATOR

LOCATION

(M)

(%)

(M)

Kutcho Creek (DEV)


2.0% NSR


Kutcho Copper


Canada

11.509

3.19%

734.000

Peñasquito


2.0% NSR


Newmont


Mexico

483.474

0.76%

7,389.628

Balcooma


1.5% NSR


Consolidated Tin


Australia

0.762

1.92%

29.274

Jaguar Nickel (DEV)


1.5% NSR


Washington H. Soul Pattinson


Australia

1.323

6.25%

165.347

Nickel(33)

PROVEN +

 PROBABLE

RESERVES(3)(4)(5)

Tons of 

Average

Base Metal

Ore

Base Metal

Contained Lbs(6)

PROPERTY

ROYALTY

OPERATOR

LOCATION

(M)

Grade (%)

(M)

Voisey’s Bay


2.7% NVR


Vale


Canada

31.857

2.11%

1,345.172

Cobalt(34)

PROVEN +

PROBABLE

RESERVES(3)(4)(5)

Average

Tons of 

Base Metal

Base Metal

Ore

Grade

Contained Lbs(6)

PROPERTY

ROYALTY

OPERATOR

LOCATION

(M)

(%)

(M)

Voisey’s Bay


2.7% NVR


Vale


Canada

31.857

0.12%

79.410

1.Reserves have been reported by the operators of record as of December 31, 2019, with the exception of the following properties where reserves have been reported by the operators of record or their predecessors in interest and are unadjusted for production since these dates: Mara Rosa - May 31, 2020; Don Mario - September 30, 2019; Dolores, Gwalia Deeps, King of the Hills, Meekatharra, Relief Canyon and South Laverton - June 30, 2019; La India - January 25, 2019; Wharf - December 31, 2018; Wembley Durack - June 30, 2018; Khoemacau - April 17, 2018; Pine Cove, Taparko and Williams - December 31, 2017; Jaguar Nickel - June 30, 2017; Kutcho Creek - June 15, 2017; Bald Mountain, Gold Hill, Inata and Robinson - December 31, 2016; Southern Cross - July 24, 2016; Back River - August 15, 2015; Hasbrouck Mountain - June 3, 2015; La Fortuna, Pinson and Ruby Hill - December 31, 2014; Don Nicolas - December 31, 2011; and Balcooma - June 30, 2011.

2.Gold reserves were calculated by the operators at the following per ounce prices:  A$1,800 - King of the Hills; A$1,725 - Meekatharra; A$1,600 - Southern Cross and South Laverton; $1,600 - Pine Cove; $1,500 - Don Mario; A$1,350 - Gwalia Deeps; $1,350 - El Limon; $1,300 - Andacollo, Dolores, La Fortuna, Mara Rosa, Pinson, Prestea, Relief Canyon and Wassa; $1,275 - Rainy River; $1,250 - Back River, Holt, Inata, La India, Marigold, Mount Milligan, Robinson, Taparko and Wharf; $1,225 - Hasbrouck Mountain; $1,200 - Bald Mountain, Canadian Malartic, Cortez, Gold Hill, Goldstrike, LaRonde Zone 5, Leeville, Peñasquito, Pueblo Viejo, Twin Creeks and Williams; and $1,100 - Don Nicolas and Ruby Hill. No gold price was reported for Balcooma, Jaguar Nickel, Kutcho Creek, or Wembley Durack.

3.Set forth below are the definitions of proven and probable reserves used by the SEC.  “Reserve” is that part of a mineral deposit which could be economically and legally extracted or produced at the time of the reserve determination. “Proven (Measured) Reserves” are reserves for which (a) quantity is computed from dimensions revealed in outcrops, trenches, workings or drill holes; grade and/or quality are computed from the results of detailed sampling; and (b) the sites for inspection, sampling and measurement are spaced so closely and the geologic character is so well defined that the size, shape, depth and mineral content of the reserves are well established. “Probable (Indicated) Reserves” are reserves for which the quantity and grade and/or quality are computed from information similar to that used for proven (measured) reserves, but the sites for inspection, sampling and measurement are farther apart or are otherwise less adequately spaced. The degree of assurance, although lower than that for proven (measured) reserves, is high enough to assume continuity between points of observation.

4.Certain reserve estimates are provided by operators that are foreign issuers and are not based on the SEC's definitions for proven and probable reserves. For Canadian issuers, definitions of "mineral reserve," "proven mineral reserve," and "probable

25

Table of Contents

mineral reserve" conform to the Canadian Institute of Mining, Metallurgy and Petroleum definitions of these terms as of the effective date of estimation as required by National Instrument 43-101 of the Canadian Securities Administrators. For Australian issuers, definitions of "mineral reserve," "proven mineral reserve," and "probable mineral reserve" conform with the Australasian Code for Reporting of Mineral Resources and Ore Reserves prepared by the Joint Ore Reserves Committee of the Australasian Institute of Mining and Metallurgy, Australian Institute of Geoscientists and Minerals Council of Australia, as amended ("JORC Code"). We do not reconcile the reserve estimates provided by the operators with definitions of reserves used by the SEC.

5.The reserves reported are either estimates received from the various operators or are based on documentation provided to us or are derived from publicly available information from the operators of the various properties or various National Instrument 43-101 or JORC Code reports filed by operators. We are not able to reconcile the reserve estimates prepared in reliance on National Instrument 43-101 or JORC Code with definitions of the SEC.

6.“Contained ounces” or “contained pounds” do not take into account recovery losses in mining and processing the ore.

7.NSR sliding-scale schedule (price of gold per ounce - royalty rate): Below $375 - 1.75%; >$375 to $400 - 2.0%; >$400 to $425 - 2.25%; >$425 - 2.5%. All price points are stated in 1986 dollars and are subject to adjustment in accordance with a blended index comprised of labor, diesel fuel, industrial commodities and mining machinery.

8.GSR1 and GSR 2 sliding-scale schedule (price of gold per ounce - royalty rate): Below $210 - 0.40%; $210 to $229.99 - 0.50%; $230 to $249.99 - 0.75%; $250 to $269.99 - 1.30%; $270 to $309.99 - 2.25%; $310 to $329.99 - 2.60%; $330 to $349.99 - 3.00%; $350 to $369.99 - 3.40%; $370 to $389.99 - $3.75%; $390 to $409.99 - 4.0%; $410 to $429.99 - 4.25%; $430 to $449.99 - 4.50%; $450 to $469.99 - 4.75%; $470 and higher - 5.00%.

9.NVR1C is the Crossroads portion of NVR1.

10.The royalty is capped at $10 million. As of June 30, 2020, royalty payments of approximately $7.78 million have been received.

11.The 1.0% to 2.0% sliding-scale NSR royalty will pay 2.0% when the price of gold is above $350 per ounce and 1.0% when the price of gold falls to $350 per ounce or below. The 0.6% to 0.9% NSR sliding-scale schedule (price of gold per ounce - royalty rate): Below $300 - 0.6%; $300 to $350 - 0.7%; > $350 to $400 - 0.8%; > $400 - 0.9%. The silver royalty rate is based on the price of gold.

12.The 0.6% to 0.9% sliding-scale NSR applies to the M-ACE claims. The operator did not break out reserves or resources subject to the M-ACE claims royalty.

13.Royalty only applies to Section 29 which currently holds about 95% of the reserves reported for the property.

14.A Cordilleran royalty of 5% NSR applies to a portion of Section 28.

15.Different Rayrock royalty rates apply to Sections 28, 32 and 33; these rates vary depending on pre-existing royalties. The Rayrock royalties take effect once 200,000 ounces of gold have been produced from open pit mines on the property. As of June 30, 2020, approximately 103,000 ounces have been produced.

16.Reserves represent our interest based on our royalty ground covering approximately 69% of the resource footprint by area.

17.NSR sliding-scale schedule (price of gold per ounce - royalty rate): $0.00 to under $350 - 0.0%; $350 to under $400 - 0.5%; $400 to under $500 - 1.0%; $500 or higher - 2.0%.

18.Goose Lake royalty applies to production above 400,000 ounces.

19.NSR sliding-scale schedule (price of gold per ounce - royalty rate): $0.00 to $350 - 1.0%; above $350 - 1.5%.

20.Centerra Gold will deliver 35% of payable gold produced, subject to a fixed payable percentage of 97%, and 18.75% of payable copper produced, subject to a minimum payable percentage of 95%. The purchase price for gold is equal to the lesser of $435 per ounce delivered or the prevailing market price and the purchase price for copper is 15% of the spot price per metric tonne delivered. As of June 30, 2020, approximately 516,500 ounces of payable gold and 34.7 million pounds of payable copper have been delivered.

26

Table of Contents

21.New Gold will deliver: (a) gold in amounts equal to 6.50% of gold produced until 230,000 ounces have been delivered, and 3.25% of gold produced thereafter, and (b) silver in amounts equal to 60% of silver produced until 3.10 million ounces have been delivered, and 30% of silver produced thereafter, in each case at a purchase price equal to 25% of the spot price per ounce delivered. As of June 30, 2020, approximately 38,700 ounces of payable gold and 410,500 ounces of payable silver have been delivered.

22.Teck will deliver gold in amounts equal to 100% of payable gold until 900,000 ounces have been delivered, and 50% of payable gold thereafter, subject to a fixed payable percentage of 89%, at a purchase price equal to 15% of the monthly average gold price for the month preceding the delivery date for each ounce delivered. As of June 30, 2020, approximately 237,100 ounces of payable gold have been delivered.

23.The royalty covers approximately 30% of the La Fortuna deposit. Reserves attributable to our royalty represent 3/7 of Newmont's reporting of 70% of the total reserve.

24.Barrick will deliver: (a) gold in amounts equal to 7.50% of Barrick’s 60% interest in gold produced until 990,000 ounces have been delivered, and 3.75% of Barrick’s 60% interest in gold produced thereafter, at a purchase price equal to 30% of the spot price per ounce delivered until 550,000 ounces have been delivered, and 60% of the spot price per ounce delivered thereafter; and (b) silver in amounts equal to 75% of Barrick’s 60% interest in silver produced, subject to a fixed silver recovery of 70%, until 50 million ounces have been delivered, and 37.50% of Barrick’s 60% interest in silver produced thereafter, at a purchase price equal to 30% of the spot price per ounce delivered until 23.10 million ounces of silver have been delivered, and 60% of the spot price per ounce delivered thereafter. As of June 30, 2020, approximately 226,400 ounces of payable gold and 7.93 million ounces of payable silver have been delivered.

25.At Paddy's Flat an additional royalty of A$10 per ounce applies on production above 50,000 ounces; At Reedy's an additional 1.5% to 2.5% NSR sliding-scale royalty pays at a rate of 1.5% for the first 75,000 ounces produced in any 12-month period and at a rate of 2.5% on production above 75,000 ounces during that 12-month period and a 1.0% NSR royalty applies to the Rand area only. At Yaloginda the royalty is 0.45% NSR.

26.There is a 0.75% GSR milling royalty that applies to ore that is mined outside of the defined area of the Taparko-Bouroum project that is processed through the Taparko facilities up to a maximum of 1.1 million tons per year.

27.Golden Star will deliver 10.5% of payable gold produced until 240,000 ounces have been delivered from Wassa and Prestea, and 5.5% of payable gold produced thereafter. The purchase price for gold ounces delivered is 20% of the spot gold price until the threshold has been met, and 30% of the spot gold price thereafter. As of June 30, 2020, approximately 110,500 ounces of payable gold have been delivered from Wassa and Prestea.

28.Silver reserves were calculated by the operators at the following prices per ounce: $25.00 - Don Nicolas; $20.00 - Gold Hill; $17.50 - Hasbrouck Mountain; $17.00 - Don Mario, Dolores and Rainy River; $16.50 - Pueblo Viejo; $16.00 - Peñasquito; and $15.00 - Khoemacau. No silver price was reported for Balcooma, Jaguar Nickel or Kutcho Creek.  

29.When production commences, KCM will deliver 80% of payable silver produced, subject to a fixed payable percentage of 90%. At KCM’s option and subject to various conditions, Royal Gold will make an additional advance payment for the right to purchase up to an additional 20% of the payable silver. The stream rate will drop by 50% upon the delivery of 32 million ounces of silver at the 80% stream level, and 40 million ounces of silver at the 100% stream level if the option is fully exercised. The purchase price is 20% of the spot price of silver. Depending on the achievement by Cupric of mill expansion throughput levels above 13,000 tonnes per day (30% above current mill design capacity), we will pay higher ongoing cash payments for ounces delivered in excess of specific annual thresholds.

30.Copper reserves were calculated by the operators at the following prices per pound: $3.00 - Andacollo, La Fortuna and Mount Milligan; $2.95 - Robinson; $2.83 - Voisey's Bay; $2.75 - Las Cruces; and $2.50 - Don Mario and Khoemacau.  No copper reserve price was reported for Balcooma, Jaguar Nickel or Kutcho Creek.

31.Lead reserve price was calculated by the operators at the following prices per pound: $0.95 - Peñasquito. No lead reserve price was reported for Balcooma.

32.Zinc reserve price was calculated by the operators at the following prices per pound: $1.15 - Peñasquito.  No zinc reserve price was reported for Balcooma, Jaguar Nickel or Kutcho Creek.

33.Nickel reserve price was calculated by the operator at the following price per pound: $5.66 - Voisey's Bay.
34.Cobalt reserve price was calculated by the operator at the following price per pound: $26.25 - Voisey's Bay.

2766

Table of Contents

Newmont reported that the reduction in mineral reserves is primarily a result of mining depletion and the reduction in mineral resources is due to design updates at Peñasquito.

Recent Developments

During the year ended December 31, 2022, gold production reported for our royalty interest at Peñasquito was approximately 573,000 ounces; silver production was approximately 29.7 million ounces; lead production was approximately 147million pounds; andzinc production was approximately 373 million pounds. During the year ended December 31, 2021, gold production reported for our royalty interest was approximately 710,000 ounces; silver production was approximately 31.8 million ounces; lead production was approximately 173 million pounds; and zinc production was approximately 433 million pounds. The decrease in gold production is primarily due to lower ore grade milled and lower mill recovery, while other metal production decreased due to lower ore grade milled.

In 2023, Newmont expects to increase production by implementing throughput and recovery improvements from the use of a new reagent to depress organic carbon, and by improving haul truck payload to increase tonnes mined.

ITEM 3. LEGAL PROCEEDINGS

Not applicable.None.

ITEM 4.  MINE SAFETY DISCLOSURE

Not applicable.

PART II

ITEM 5. MARKET FOR REGISTRANT’S COMMON EQUITY, RELATED STOCKHOLDER MATTERS AND ISSUER PURCHASES OF EQUITY SECURITIES

Market Information and Holders

Our common stock is listed and traded on the Nasdaq Global Select Market under the symbol “RGLD.” As of July 30, 2020,February 9, 2023, we had 773783 holders of record of our common stock. This figure does not reflect the beneficial ownership of shares held in nominee name.

Dividends

On November 15, 2022, we announced an increase in our annual dividend for calendar year 2023 from $1.40 to $1.50 per share, payable on a quarterly basis of $0.375 per share. The newly declared dividend is 7% higher than the dividend paid during calendar year 2022. We have steadily increased our annual dividend for 22 years, or since calendar year 2001. We expect to pay our annual dividend using cash on hand.

Sales of Unregistered Equity Securities

None.

Repurchases of Equity Securities

None.

ITEM 6.   SELECTED FINANCIAL DATA

Fiscal Year Ended June 30, 

2020

2019

2018

2017

2016

(Amounts in thousands, except per share data)

Revenue(1)


$

498,819


$

423,056


$

459,042


$

440,814


$

359,790

Operating income (loss)(2)

$

198,945

$

140,707

$

(74,535)

$

145,942

$

4,816

Net income (loss)

$

196,250

$

89,079

$

(119,351)

$

92,425

$

(82,438)

Net income (loss) attributable to Royal Gold common stockholders

$

199,343

$

93,825

$

(113,134)

$

101,530

$

(77,149)

Net income (loss) per share attributable to Royal Gold common stockholders:


Basic

$

3.04

$

1.43

$

(1.73)

$

1.55

$

(1.18)

Diluted

$

3.03

$

1.43

$

(1.73)

$

1.55

$

(1.18)

Dividends declared per common share(3)

$

1.11

$

1.05

$

0.99

$

0.95

$

0.91

As of June 30, 

2020

2019

2018

2017

2016

(Amounts in thousands)

Stream and royalty interests, net


$

2,318,913


$

2,339,316


$

2,501,117


$

2,892,256


$

2,848,087

Total assets

$

2,766,287

$

2,544,151

$

2,682,016

$

3,094,065

$

3,069,729

Debt

$

300,439

$

214,554

$

351,027

$

586,170

$

600,685

Total liabilities

$

464,168

$

373,698

$

540,747

$

773,801

$

783,844

Total Royal Gold stockholders’ equity

$

2,272,217

$

2,136,681

$

2,102,167

$

2,275,377

$

2,229,016

(1)Please refer to Item 7, MD&A, of this report for a discussion of recent developments that contributed to our 18% increase in revenue during fiscal year 2020 when compared to fiscal year 2019.

2867

Table of Contents

Issuer Purchases of Equity Securities

(2)

Please refer to Note 4

Period

(a) Total Number of Shares Purchased

(b) Average Price Paid Per Share

(c) Total Number of Shares Purchased as Part of Publicly Announced Plans or Programs

(d) Maximum Number (or Approximate Dollar Value) of Shares that May Yet Be Purchased Under the notes to consolidated financial statements for discussion on the impairment recognized at Pascua-Lama, which was attributable for the operating loss during our fiscal year 2018.Plan or Programs

(3)

October 2022

The

N/A

N/A

November 2022

2020, 2019, 2018, 2017 and 2016 calendar year dividends were $1.12, $1.06, $1.00, $0.96, and $0.92, respectively, as approved by our board of directors.

N/A

N/A

December 2022

N/A

N/A

Total

N/A

N/A

Stock Performance

The following graph shows a comparison of cumulative total shareholder return, calculated on a dividend-reinvested basis, for Royal Gold, the S&P 500 Index, and the PHLX Gold and Silver Index for the five years ended December 31, 2022. The graph assumes $100 was invested in each of stock or index as of the market close on December 31. Past stock price performance is not necessarily indicative of future stock price performance.

Graphic

December 31,

2022

2021

2020

2019

2018

2017

RGLD

$

145

$

134

$

134

$

152

$

106

$

100

S&P 500

$

157

$

149

$

149

$

126

$

96

$

100

PHLX gold/silver Index

$

151

$

162

$

173

$

128

$

84

$

100

The foregoing performance graph and related information shall not be deemed “soliciting material” or “filed” with the SEC or subject to Section 18 of the Securities Exchange Act of 1934, as amended, nor shall such information be incorporated by reference into any future filing under the Securities Act of 1933 or Securities Exchange Act of 1934, each as amended, except to the extent that the Company specifically incorporates it by reference into such filing.

68

Table of Contents

ITEM 6. RESERVED

ITEM 7. MANAGEMENT’S DISCUSSION AND ANALYSIS OF FINANCIAL CONDITION AND RESULTS OF OPERATIONS

General Presentation

This Item 7. Management’s Discussion and Analysis of Financial Condition and Results of Operations (“MD&A”) generally discusses year-to-year comparisons between the year ended December 31, 2022 and the comparative year ended December 31, 2021. Due to our change in fiscal year from June 30 to December 31, the comparative year ended December 31, 2021 was unaudited. A discussion of the changes in our financial condition and results of operations for the six months ended December 31, 2021 transition period and fiscal years ended June 30, 2019,2021 and 2018, has2020 have been omitted from this Annual Report,report, but may be found in Item 7,7. MD&A, of our Annual ReportReports on Form 10-K for the yearsix month transition period ended December 31, 2021 and for the years ended June 30, 2019,2021 and 2020, filed with the SEC on February 17, 2022, August 8, 2019,12, 2021 and August 6, 2020, respectively, which isare available free of charge on the SEC’s website at www.sec.gov and our website at www.royalgold.com.

Overview of Our Business

We acquire and manage precious metal streams, royalties, and similar interests. We seek to acquire existing stream and royalty interests or to finance projects that are in production, development or in the developmentexploration stage in exchange for stream or royalty interests.

We manage our business under two segments:

Acquisition and Management of Stream Interests—A metal stream is a purchase agreement that provides, in exchange for an upfront deposit payment, the right to purchase all or a portion of one or more metals produced from a mine, at a price determined for the life of the transaction by the purchase agreement. As of June 30, 2020, we owned seven stream interests, which are on six producing properties and two development stage properties. Our stream interests accounted for approximately 72% of our total revenue for each of the fiscal years ended June 30, 2020, and 2019. We expect stream interests to continue representing a significant portion of our total revenue.

Acquisition and Management of Stream Interests — A metal stream is a purchase agreement that provides, in exchange for an upfront deposit payment, the right to purchase all or a portion of one or more metals produced from a mine, at a price determined for the life of the transaction by the purchase agreement. As of December 31, 2022, we owned nine stream interests, which are on eight production stage properties and one development stage property. Stream interests accounted for 69% and 67% of our total revenue for the years ended December 31, 2022 and 2021, respectively. We expect stream interests to continue representing a significant portion of our total revenue.

Acquisition and Management of Royalty Interests—Royalties are non-operating interests in mining projects that provide the right to a percentage of revenue or metals produced from the project after deducting specified costs, if any. As of June 30, 2020, we owned royalty interests on 35 producing properties, 15 development stage properties and 129 exploration stage properties, of which we consider 48 to be evaluation stage projects. We use “evaluation stage” to describe exploration stage properties that contain mineralized material and on which operators are engaged in the search for reserves. Royalties accounted for approximately 28% of our total revenue for each of the fiscal years ended June 30, 2020, and 2019.

Acquisition and Management of Royalty Interests — Royalties are non-operating interests in mining projects that provide the right to revenue or metals produced from the project after deducting specified costs, if any. As of December 31, 2022, we owned royalty interests on 32 production stage properties, 18 development stage properties and 123 exploration stage properties, of which we consider 52 to be evaluation stage projects. We use “evaluation stage” to describe exploration stage properties that contain mineral resources and on which operators are engaged in the search for mineral reserves. Royalty interests accounted for 31% and 33% of our total revenue for the years ended December 31, 2022 and 2021, respectively.

We do not conduct mining operations on the properties in which we hold stream and royalty interests. Except for our interest in the Peak Gold JV,interests, and we generally are not required to contribute to capital costs, exploration costs, environmental costs or other operating costs on those properties.

In the ordinary course of business, we engage in a continual review of

We are continually reviewing opportunities to acquiregrow our portfolio, whether through the creation or acquisition of new or existing stream andor royalty interests to establish new streams and royalties on operating mines, to create new stream and royalty interests through the financing of mine development or exploration, or to acquire companies that hold stream and royalty interests.other acquisition activity. We currently, and generally at any time, have acquisition opportunities in various stages of activereview. Our review including,process may include, for example, our engagement ofengaging consultants and advisors to analyze particular opportunities, ouran opportunity; analysis of technical, financial, legal, and other confidential information of particular opportunities,an opportunity; submission of indications of interest and term sheets,sheets; participation in preliminary discussions and negotiationsnegotiations; and involvement as a bidder in competitive processes.

2969

Table of Contents

Business Trends and Uncertainties

Metal Prices

Our financial results are primarily tied to the price of gold, silver, copper, and other metals. Metal prices have fluctuated widely in recent years, and we expect this volatility to continue. The marketability and price of metals are influenced by numerous factors beyond our control, and significant changes in metal prices can have a lesser extent, the prices of silver and copper, together with the amounts of production frommaterial effect on our producing stage stream and royalty interests. revenue.

For the fiscal years ended June 30, 2020December 31, 2022, and 2019, gold, silver,2021, the average prices and copper price averages and percentagepercentages of revenue by metal were as follows:

Fiscal Year ended

June 30, 2020

June 30, 2019

Metal


Average
Price


Percentage of Revenue


Average
Price


Percentage
of Revenue

Gold ($/ounce)

$

1,560

79%

$

1,263

78%

Silver ($/ounce)

$

16.90

9%

$

15.00

9%

Copper ($/pound)

$

2.57

9%

$

2.79

9%

Other

N/A

3%

N/A

4%

Year Ended

December 31, 2022

December 31, 2021

Metal


Average
Price


Percentage
of Revenue


Average
Price


Percentage
of Revenue

Gold ($/ounce)(1)

$

1,800

73%

$

1,799

73%

Silver ($/ounce)(1)

$

21.73

11%

$

25.14

11%

Copper ($/pound)(2)

$

3.99

12%

$

4.23

12%

Other

N/A

4%

N/A

4%

(1) Based on the average LBMA Price for the period.

(2) Based on the average LME Price for the period.

Acquisition of Additional Royalty Interests on Cortez Complex

On December 29, 2022, we acquired two portions of a gross smelter return royalty (the “Idaho Royalty”) that together cover a large area including the Cortez mine operational area and the entirety of the Fourmile development project in Nevada (the “Cortez Complex”) from certain holders who are successors in interest to Idaho Mining Corporation for cash consideration of $204.1 million. The area within the Cortez Complex is owned or controlled by Nevada Gold Mines LLC (“NGM”), a joint venture between Barrick Gold Corporation (“Barrick”) and Newmont Corporation (“Newmont”), with the exception of the Fourmile development project which is 100% owned and operated by Barrick. The Idaho Royalty comprises a 0.24% gross royalty that covers areas including the Pipeline and Crossroads deposits and a 0.45% gross royalty that covers areas including the Cortez Hills, Goldrush, Fourmile and Robertson deposits. The Idaho Royalty is life of mine, not subject to any stepdowns or caps, and has no applicable deductions. The purchase price was funded with amounts available under the revolving credit facility and cash on hand.

The economic effective date for the transaction was December 1, 2022, and revenue of $0.7 million on production of approximately 116,000 ounces attributable to the royalty was recognized in the fourth quarter of 2022. 

Acquisition of Great Bear Royalties Corp.

On September 9, 2022 we completed the acquisition of all of the issued and outstanding shares of Great Bear Royalties Corporation (“GBR”) for cash consideration of approximately C$199.6 million (US$151.7 million) (the “Acquisition Price”). GBR’s sole material asset is a 2.0% net smelter return royalty (“Great Bear Royalty”) that covers the entirety of the Great Bear Project in the Red Lake district of Ontario, Canada, owned and operated by a subsidiary of Kinross Gold Corporation (“Kinross”). The Great Bear Royalty includes all metals produced from contiguous claims covering 9,140 hectares. Royalty payments will be made quarterly with applicable standard deductions. Refer to Note 3 of our notes to consolidated financial statements for further discussion on the GBR acquisition. The purchase price was funded with available cash on hand. As part of the acquisition and in exchange for information and access to the project provided by Kinross, we granted an option to Kinross to purchase a 25% interest in the Great Bear Royalty (0.5% of the 2.0% royalty rate) for an amount equal to 25% of the Acquisition Price, adjusted for inflation, at any time from the transaction closing date until the earlier of a construction decision for the Great Bear Project and 10 years after the transaction closing date.

On February 13, 2023, Kinross announced an initial mineral resource of 5 million ounces of gold (2.7 million ounces Indicated, 2.3 million ounces Inferred) at the Great Bear Project based on drilling to an approximate depth of 500 meters.

70

Table of Contents

Kinross expects 2023 activity to include drilling of 180,000 meters at depth, along strike and on parallel structures to support engineering studies and permitting activities.

Acquisition of Gross Royalty on Cortez Complex

On August 2, 2022, we acquired a sliding scale gross royalty (the “Rio Tinto Royalty”) on production from an area within the Cortez Complex for cash consideration of $525 million. The area within the Cortez Complex is owned or controlled by NGM, with the exception of the Fourmile development project which is 100% owned and operated by Barrick. The royalty is a life of mine sliding scale gross royalty payable at a rate of 0% at a gold price less than $400 per ounce, increasing to 3% at a gold price above $900 per ounce, and is payable on 40% of all production from the Cortez Complex except for the existing deposits within the Robertson property. The purchase price was funded with debt and available cash on hand.

For the year ended December 31, 2022, we received revenue of $4.5 million on production of approximately 227,000 ounces attributable to the Rio Tinto Royalty.

Lawyers Royalty Acquisition

On March 24, 2022, we acquired a 0.5% net smelter returns royalty (“NSR”) on production from the Lawyers Project, currently operated by Benchmark Metals Inc., which is located in British Columbia, Canada. As part of this transaction, we also acquired a right of first offer (“ROFO”) for an existing 2.0% NSR royalty over the Ranch Project owned by Thesis Gold, Inc. that is located adjacent to the Lawyers Project. We paid $8.0 million in cash consideration for the royalty and ROFO to Guardsmen Resources Inc. The Lawyers Project acquisition has been accounted for as an asset acquisition.

Khoemacau Silver Stream

On February 23, 2022, we made an advance payment of $10.0 million toward the option stream which increased our right to receive payable silver produced from Khoemacau from 90% to 93%, and on March 14, 2022, we made our final advance payment of $16.5 million toward the option stream which increased our right to receive payable silver produced from 93% to 100%.

Operators’ Production Estimates by Stream and Royalty Interest for Calendar 20202022

We received annual production estimates from many of the operators of our producing mines during the first calendar quarter of 2020.2022. In some instances, an operator may revise its original calendar year guidance throughout the year. The following table shows suchthese production estimates for our principal producing properties for calendar 20202022 as well as the actual production reported to us by the various operators through June 30, 2020.December 31, 2022. The estimates and production reports are prepared by the operators. We do not participate in the preparation or calculation of the operators’ estimates or production reports and have not independently assessed or verified, and disclaim all responsibility for, the accuracy of suchthis information. Please refer to Part I, Item 2, Properties, of this report for further discussion on any updates at our principal producing properties.

71

Table of Contents

Operators’ Estimated and Actual Production by Stream and Royalty Interest for Calendar 2020Year 2022

Principal ProducingProduction Stage Properties

Calendar 2020 Operator’s Production

Calendar 2020 Operator’s Production

Calendar Year 2022 Operator’s Production

Calendar Year 2022 Operator’s Production

Estimate(1)

Actual(2)

Estimate(1)

Actual(2)

Gold

Silver

Base Metals

Gold

Silver

Base Metals

Gold

Silver

Base Metals

Gold

Silver

Base Metals

Stream/Royalty


(oz.)


(oz.)


(lbs.)


(oz.)


(oz.)


(lbs.)


(oz.)


(oz.)


(lbs.)


(oz.)


(oz.)


(lbs.)

Stream:

Andacollo(3)


53,000


27,500


36,000


25,900


Mount Milligan(4)


140,000 - 160,000


69,300


190,000 - 210,000


189,000


Copper


80 - 90 Million


39.1 Million


70 - 80 Million


74 Million

Pueblo Viejo(5)

530,000 - 580,000

N/A

254,000

N/A

400,000 - 440,000

N/A

428,000

N/A

Wassa(6)

165,000 - 170,000

85,100

Khoemacau(6)

N/A

N/A

Royalty:


Cortez GSR1


66,500


61,800


Cortez GSR2


109,000


48,300


Cortez GSR3


145,700


52,400


Cortez NVR1


113,200


88,700


Cortez NVR1C

29,900

400

Peñasquito(7)


510,000

28 million


185,000

13.1 Million


Cortez(7)

280,000

300,000

Peñasquito(8)


475,000

29 Million


440,000

23.3 Million


Lead


190 million


84 Million


150 Million


112 Million

Zinc


360 million


178 Million


350 Million


297 Million

(1)Production estimates received from our operators are for calendar 2020.  There can be no assurance that production estimates received from our operators will be achieved.year 2022. Please also refer to our cautionary language regarding forward-looking statements following this MD&A, as well as the Risk Factors identified in Part I, Item 1A, of this report for information regarding factors that could affect actual results.
(2)Actual production figures shown are from our operators and cover the period January 1, 20202022, through June 30, 2020,December 31, 2022, unless otherwise noted in footnotes to this table.
(3)The estimated and actual production figures shown for Andacollo are contained gold in concentrate.
(4)The estimated and actual production figures shown for Mount Milligan are payable gold and copper in concentrate.

30

Table of Contents

(5)The estimated and actual production figures shown for Pueblo Viejo are payable gold in doré and represent Barrick’sthe 60% interest in Pueblo Viejo.  The operatorViejo held by Barrick. Barrick did not provide estimated or actual silver production.
(6)The estimated and actual production figures shown for Wassa is payable gold in doré.Khoemacau are not available through the ramp-up period.
(7)The estimated and actual production figures for Cortez represent the Cortez Legacy Zone area only.
(8)The estimated and actual gold and silver production figures shown for Peñasquito are payable gold and silver in concentrate and doré. The estimated and actual lead and zinc production figures shown are payable lead and zinc in concentrate. The actual production figure is for the period January 1, 2022 through September 30, 2022.

COVID-19 and current economic environment

Several of our operating counterparties announced temporary operational curtailments or the withdrawal or review of previously disclosed guidance due to the ongoing COVID-19 pandemic. The economic and societal impacts associated with COVID-19 are fluid and changing rapidly, and we are currently unable to predict the nature or extent of any impact on our results of operations and financial condition. We will continue to monitor any further developments that the COVID-19 pandemic may have on stream or royalty interests as part of our regular asset impairment analysis.

Historical Production

The following table discloses historical production for the past two fiscal years for the principal producing properties that are subject to our stream and royalty interests, as reported to us by the operators of the mines. We do not participate in the preparation or calculation of the operators’ production reports and have not independently assessed or verified, and disclaim all responsibility for, the accuracy of such information.

Historical Production(1) by Stream and Royalty Interest

Principal Producing Properties

For the Fiscal Years Ended June 30, 2020 and 2019

Stream/Royalty

Metal

2020

2019

Stream:


Mount Milligan


Gold


63,700

oz.


61,700

oz.

Copper

12.7

Mlbs.

8.3

Mlbs.

Andacollo


Gold


48,100

oz.


55,000

oz.

Pueblo Viejo


Gold


43,300

oz.


41,000

oz.


Silver


1.8

Moz.


2.1

Moz.

Wassa


Gold


15,000

oz.


17,500

oz.

Royalty:


Peñasquito


Gold


312,200

oz.


158,800

oz.


Silver


27.8

Moz.


16.4

Moz.


Lead


182.3

Mlbs.


117.4

Mlbs.


Zinc


393.9

Mlbs.


216.2

Mlbs.

Cortez GSR1


Gold


91,300

oz.


84,600

oz.

Cortez GSR2


Gold


82,000

oz.


12,100

oz.

Cortez GSR3


Gold


171,800

oz.


96,700

oz.

Cortez NVR1


Gold


146,500

oz.


77,400

oz.

(1)Historical production for our stream interests relates to the amount of stream metal sales for each fiscal year presented and may differ from stream deliveries discussed in Item 2, Properties, or from the operators’ public reporting. For our royalty interests, historical production relates to the payable metal amounts as reported to us by the operators of the mines subject to our royalty rate for each fiscal year presented.

Critical Accounting Policies

Listed below are the accounting policies we believe are critical to our financial statements due to the degree of uncertainty regarding the estimates or assumptions involved and the magnitude of the asset, liability, revenue or expense being reported. Please also refer to Note 2 of the notes to consolidated financial statements for a discussion on recently adopted and issued accounting pronouncements.

3172

Table of Contents

UseResults of EstimatesOperations

Year Ended December 31, 2022, Compared with Year Ended December 31, 2021 (In thousands, except share data)

Years Ended

December 31,

December 31,

2021

2022

(unaudited)

Revenue

$

603,206

$

653,568

Costs and expenses

Cost of sales (excludes depreciation, depletion and amortization)

94,642

98,467

General and administrative

34,612

29,306

Production taxes

7,021

8,399

Depreciation, depletion and amortization

178,935

189,009

Impairment of royalty interests

4,287

Total costs and expenses

319,497

325,181

Operating income

283,709

328,387

Fair value changes in equity securities

(1,503)

2,510

Interest and other income

7,832

3,019

Interest and other expense

(17,170)

(5,753)

Income before income taxes

272,868

328,163

Income tax expense

(32,926)

(53,223)

Net income and comprehensive income

239,942

274,940

Net (income) loss and comprehensive (income) loss attributable to non-controlling interests

(960)

(898)

Net income and comprehensive income attributable to Royal Gold common stockholders

$

238,982

$

274,042

Basic earnings per share

$

3.64

$

4.17

Basic weighted average shares outstanding

65,576,995

65,552,586

Diluted earnings per share

$

3.63

$

4.17

Diluted weighted average shares outstanding

65,661,748

65,624,007

Cash dividends declared per common share

$

1.425

$

1.25

For the year ended December 31, 2022, we recorded net income attributable to Royal Gold stockholders of $239.0 million, or $3.64 per basic share and $3.63 per diluted share, as compared to net income attributable to Royal Gold stockholders of $274.0 million, or $4.17 per basic and diluted share, for the year ended December 31, 2021. The preparationdecrease in net income was primarily due to lower revenue and higher interest expense as a result of higher amounts outstanding under our  financial statements,revolving credit facility compared to the prior period. This decrease was partially offset by a decrease in conformity with U.S. generally accepted accounting principles (“U.S. GAAP”), requires management to make estimates and assumptions. These estimates and assumptions affectincome tax expense as discussed in further detail below.

For the reported amountsyear ended December 31, 2022, we recognized total revenue of assets and liabilities, at the date$603.2 million, which is comprised of the financial statements, as well as the reported amountsstream revenue of revenues and expenses during the reporting period.

We rely on reserve estimates reported by the operators of the properties on which we hold stream$417.8 million and royalty interests.  These estimatesrevenue of $185.4 million, at an average gold price of $1,800 per ounce, an average silver price of $21.73 per ounce and the underlying assumptions affect the potential impairmentsan average copper price of long-lived assets and the ability$3.99 per pound, compared to realize income tax benefits associated with deferred tax assets. These estimates and assumptions also affect the rate attotal revenue of $653.6 million, which we recognizeis comprised of stream revenue or charge depreciation, depletion and amortization to earnings. On an ongoing basis, management evaluates these estimates and assumptions; however, actual amounts could differ from these estimates and assumptions. Differences between estimates and actual amounts are adjusted and recorded in the period that the actual amounts are known.

Stream and Royalty Interests in Mineral Properties and Related Depletion

Streamof $436.3 million and royalty interests include acquired stream and royalty interests in production, development and exploration stage properties. The costsrevenue of acquired stream and royalty interests are capitalized as tangible assets as such interests do not meet the definition of a financial asset under U.S. GAAP.

Production stage stream and royalty interests are depleted using the units of production method over the life of the mineral property (as stream sales occur or royalty payments are recognized), which are estimated using proven and probable reserves as provided by the operator. Development stage mineral properties, which are not yet in production, are not depleted until the property begins production. Exploration stage mineral properties, where there are no proven and probable reserves, are not depleted. At such time as the associated exploration stage mineral interests are converted to proven and probable reserves, the mineral property is depleted over its life, using proven and probable reserves. Exploration costs are expensed when incurred.

Asset Impairment

We evaluate long-lived assets for impairment whenever events or changes in circumstances indicate that the related carrying amounts of$217.3 million, at an asset or group of assets may not be recoverable. The recoverability of the carrying value of stream and royalty interests in production and development stage mineral properties is evaluated based upon estimated future undiscounted net cash flows from each stream and royalty interest using estimates of proven and probable reserves and other relevant information received from the operators. We evaluate the recoverability of the carrying value of royalty interests in exploration stage mineral properties in the event of significant decreases in theaverage gold price of gold,$1,799 per ounce, an average silver price of $25.14 per ounce and an average copper and other metals, and whenever new information regarding the mineral properties is obtained from the operator indicating that production will not likely occur or may be reduced in the future, thus potentially affecting the future recoverabilityprice of our stream or royalty interests. Impairments in the carrying value of each property are measured and recorded to the extent that the carrying value in each property exceeds its estimated fair value, which is generally calculated using estimated future discounted cash flows.

Estimates of gold, silver, copper, and other metal prices, and operators’ estimates of proven and probable reserves or mineralized material related to our stream or royalty properties are subject to certain risks and uncertainties which may affect the recoverability of our investment in these stream and royalty interests in mineral properties. It is possible that changes could occur to these estimates, which could adversely affect the net cash flows expected to be generated from these stream and royalty interests. Refer to Note 4 to consolidated financial statements for a discussion of the impairment assessment results$4.23 per pound, for the fiscal year ended June 30, 2020.

Revenue

Under U.S. GAAP, a performance obligation is a promise in a contract to transfer control of a distinct good or service (or integrated package of goods and/or services) to a customer. A contract’s transaction price is allocated to each distinctDecember 31, 2021.

3273

Table of Contents

performance obligationRevenue and recognized as revenue when, or as, a performance obligation is satisfied. In accordance with this guidance, revenuethe corresponding production attributable to our stream interests and royalty interests is generally recognized at the point in time that control of the related metal production transfers to our customers. The amount of revenue we recognize further reflects the consideration to which we are entitled under the respective stream or royalty agreement. A more detailed summary of our revenue recognition policies for our stream and royalty interests, for the year ended December 31, 2022 compared to the year ended December 31, 2021 is discussed below.as follows:

Revenue and Reported Production Subject to our Stream and Royalty Interests

Year Ended December 31, 2022 and 2021

(In thousands, except reported production in oz. and lbs.)

Year Ended

Year Ended

December 31, 2022

December 31, 2021

Reported

Reported

Stream/Royalty


Metal(s)


Revenue


Production(1)


Revenue


Production(1)

Stream(2):

Mount Milligan

$

180,543

$

173,114

Gold

67,800

oz.

61,400

oz.

Copper

14.8

Mlbs.

14.9

Mlbs.

Pueblo Viejo

$

85,863

$

109,716

Gold

33,200

oz.

40,600

oz.

Silver

1.2

Moz.

1.4

Moz.

Andacollo

Gold

$

47,347

26,100

oz.

$

68,965

38,100

oz.

Khoemacau

Silver

$

18,786

887,700

oz.

$

5,096

219,100

oz.

Other(3)

$

85,254

$

79,427

Gold

44,400

oz.

38,300

oz.

Silver

255,400

oz.

407,700

oz.

Total stream revenue

$

417,793

$

436,318

Royalty(2):

Cortez Legacy Zone

Gold

$

47,769

299,800

oz.

$

56,116

361,300

oz.

Cortez CC Zone

Gold

$

2,790

114,400

oz.

N/A

N/A

Peñasquito

$

43,165

$

52,959

Gold

572,600

oz.

709,600

oz.

Silver

29.7

Moz.

31.8

Moz.

Lead

146.8

Mlbs.

173.3

Mlbs.

Zinc

373.1

Mlbs.

433.3

Mlbs.

Other(3)

Various

$

91,689

N/A

$

108,175

N/A

Total royalty revenue

$

185,413

$

217,250

Total Revenue

$

603,206

$

653,568

(1)Reported production relates to the amount of metal sales, subject to our stream and royalty interests, for the year ended December 31, 2022 and 2021, and may differ from the operators’ public reporting.
(2)Refer to Item 2, Properties, for further discussion on our principal stream and royalty interests.
(3)Individually, with the exception of the Rainy River stream (5.3% for the year ended December 31, 2022 and 5.7% for the year ended December 31, 2021) and Wassa (5.2% for the year ended December 31, 2022), no stream or royalty included within the “Other” category contributed greater than 5% of our total revenue for either period.

The decrease in our total revenue for the year ended December 31, 2022, compared with year ended December 31, 2021, resulted primarily from lower gold sales at Andacollo, lower gold and silver sales at Pueblo Viejo and lower gold production at Cortez and Peñasquito. These decreases were partially offset by an increase in gold sales at Mount Milligan and Xavantina, higher silver sales at Khoemacau and $5.2 million of revenue from the newly acquired royalties at Cortez compared to the prior period.

Stream Interests

A metal stream is a purchase agreement that provides, in exchange for an upfront deposit payment, the right to purchase all or a portion74

Table of one or more of the metals produced from a mine, at a price determined for the life of the transaction by the purchase agreement. Contents

Gold and silver ounces and copper received under our metal streaming agreements are taken into inventory,pounds purchased and then sold primarily using average spot rateduring the year ended December 31, 2022 and 2021, as well as gold, silver and copper forward contracts. The sales pricein inventory as of December 31, 2022 and 2021, for these average spot rate forward contracts is determined by the average daily gold, silver or copper spot prices during the term of the contract, typically a consecutive number of trading days between ten days and three months (depending on the frequency of deliveries under the respective streaming agreement and our sales policy in effect at the time) commencing shortly after receipt and purchase of the metal. We settle our forward sales contracts via physical delivery of the metal to the purchaser (our customer) on the settlement date specified in the contract. Under our forward sales contracts, there is a single performance obligation to sell a contractually specified volume of metal to the purchaser, and we satisfy this obligation at the point in time of physical delivery. Accordingly, revenue from our metal sales is recognized on the date of settlement, which is the date that control, custody and title to the metal transfer to the purchaser.stream interests were as follows:

Year Ended

Year Ended

As of

As of

December 31, 2022

December 31, 2021

December 31, 2022

December 31, 2021

Gold Stream


Purchases (oz.)


Sales (oz.)


Purchases (oz.)


Sales (oz.)


Inventory (oz.)


Inventory (oz.)

Mount Milligan

68,900

67,800

61,600

61,400

5,200

4,100

Pueblo Viejo

32,500

33,200

38,700

40,600

7,900

8,600

Andacollo

27,700

26,200

37,600

38,100

3,800

2,200

Other

44,600

44,300

38,000

38,300

4,100

3,800

Total

173,700

171,500

175,900

178,400

21,000

18,700

Year Ended

Year Ended

As of

As of

December 31, 2022

December 31, 2021

December 31, 2022

December 31, 2021

Silver Stream


Purchases (oz.)


Sales (oz.)


Purchases (oz.)


Sales (oz.)


Inventory (oz.)


Inventory (oz.)

Pueblo Viejo

1,238,600

1,216,700

1,346,500

1,448,600

337,800

316,000

Khoemacau

951,500

887,700

261,100

219,100

105,900

42,000

Other

238,600

255,400

375,700

407,700

17,500

34,300

Total

2,428,700

2,359,800

1,983,300

2,075,400

461,200

392,300

Year Ended

Year Ended

As of

As of

December 31, 2022

December 31, 2021

December 31, 2022

December 31, 2021

Copper Stream


Purchases (Mlbs.)


Sales (Mlbs.)


Purchases (Mlbs.)


Sales (Mlbs.)


Inventory (Mlbs.)


Inventory (Mlbs.)

Mount Milligan

14.8

14.8

14.9

14.9

0.9

0.9

Royalty Interests

Royalties are non-operating interests in mining projects that provideCost of sales decreased to $94.6 million for the rightyear ended December 31, 2022, from $98.5 million for the year ended December 31, 2021. The decrease was primarily due to a percentage of revenue or metals produced from the project after deducting specified costs, if any. We are entitled to payment for our royalty interestdecrease in gold sales at Andacollo and a mining project based on a contractually specified commodity price (for example, a monthly or quarterly average spot price) for the perioddecrease in which metal production occurred. As a royalty holder, we act as a passive entity in the productiongold and operations of the mining project, and the third-party operator of the mining project is responsible for all mining activities, including subsequent marketing and delivery of all metal production to their ultimate customer. In all of our material royalty interest arrangements, we have concluded that we transfer control of our interest in the metal productionsilver sales at Pueblo Viejo when compared to the operatorprior period. This decrease was partially offset by an increase in gold sales at the point at which production occurs, and thus, the operator is our customer. We have further determined that the transfer of each unit of metal production, comprising our royalty interest,Mount Milligan when compared to the operator represents a separate performance obligation under the contract, and each performance obligation is satisfied at the point in time of metal production by the operator. Accordingly, we recognize revenue attributable to our royalty interests in the period in which metal production occurs at the specified commodity price per the agreement, net of any contractually allowable offsite treatment, refining, transportation and, if applicable, mining costs.

Metal Sales

Gold, silver and copper received under our metal streaming agreements are taken into inventory, and then sold primarily using average spot rate gold, silver and copper forward contracts. The sales price for these average spot rate forward contracts is determined by the average daily gold, silver or copper spot prices during the term of the contract, typically a consecutive number of trading days between 10 days and three months (depending on the frequency of deliveries under the respective streaming agreement and our sales activity in effect at the time) commencing shortly after receipt and purchase of the metal. Temporary modifications may be made to our metal sales guidelines from time to time as required to meet our needs. Revenue from gold, silver and copper sales is recognized on the date of the settlement, which is also the date that title to the metal passes to the purchaser.

Cost of Sales

prior period. Cost of sales, which excludes depreciation, depletion and amortization, is specific to our stream agreements and is the result of our purchase of gold, silver and copper for a cash payment. The cash payment for gold from Mount Milligan is the lesser of $435 per ounce or the prevailing market price of gold when purchased, while the cash payment for our other streams is a set contractual percentage of the gold, silver or copper (Mount Milligan) spot price near the date of metal delivery.

General and administrative costs increased to $34.6 million for year ended December 31, 2022, from $29.3 million for the year ended December 31, 2021. The increase was primarily due to higher employee related costs and non-cash stock compensation expense.

Depreciation, depletion and amortization decreased to $178.9 million for the year ended December 31, 2022, from $189.0 million for the year ended December 31, 2021. The decrease was primarily due to lower depletion rates at Mount Milligan compared to the prior period. Refer to Note 4 of our notes to consolidated financial statements for further discussion on the decrease in depletion rates at Mount Milligan. This decrease was partially offset by additional depletion from Khoemacau which produced first deliveries in the September 30, 2021 quarter.

During the year ended December 31, 2022, we recognized an impairment loss of $4.3 million on the carrying value of a non-principal exploration stage royalty due to new legal information received. Refer to Note 4 of our notes to consolidated financial statements for further discussion on the impairment.

We recognized a loss in fair value changes in equity securities of $1.5 million for the year ended December 31, 2022, compared to a gain in fair value changes in equity securities of $2.5 million for the year ended December 31, 2021. The change was primarily due to a decrease in the fair value of marketable equity securities as discussed further in Note 5 of our notes to consolidated financial statements.

Interest and other expense increased to $17.2 million for the year ended December 31, 2022, from $5.8 million for the year ended December 31, 2021. The increase in the current period was primarily attributable to higher interest expense as a

3375

Table of Contents

Exploration Costs

Exploration costs are specificresult of higher average amounts outstanding under our revolving credit facility and higher interest rates when compared to the prior period. Refer to Note 6 of our Peak Gold JV for exploration and advancement of the Peak Gold project as discussed further in Note 2notes to consolidated financial statements. Exploration costs associated with the exploration and advancement of Peak Gold are expensed when incurred.statements for further discussion on our debt.

Income Taxes

Our annualtax expense was $32.9 million for the year ended December 31, 2022, as compared to $53.2 million for the year ended December 31, 2021, which resulted in an effective tax rate is based on income, statutory tax rates in effect and tax planning opportunities available to usof 12.1% in the various jurisdictionscurrent period and 16.2% in which the Company operates. Significant judgment is required in determiningprior period. The effective tax rate for the annual tax expense, current tax assets and liabilities, deferred tax assets and liabilities, and our future taxable income, both asyear ended December 31, 2022, was primarily impacted by the release of a whole and in various tax jurisdictions, for purposes of assessing our ability to realize future benefit from ourvaluation allowance on certain foreign deferred tax assets. Actual income taxes could varyThe effective tax rate for the year ended December 31, 2021, was impacted by the release of uncertain tax positions resulting from thesea settlement agreement with a foreign tax authority and a change in estimates, due to future changespartially offset by a foreign tax rate adjustment resulting in income tax law, significant changes in the jurisdictions in which we operate or unpredicted results from the final determinationa revaluation of each year’s liability by taxing authorities.

Our deferred income taxes reflect the impact of temporary differences between the reported amounts of assets and liabilities for financial reporting purposes and such amounts measured by tax laws and regulations. In evaluating the realizability of thecertain deferred tax assets, management considers both positive and negative evidence that may exist, such as earnings history, reversal of taxable temporary differences, forecasted operating earnings and available tax planning strategies in each tax jurisdiction. A valuation allowance may be established to reduce our deferred tax assets to the amount that is considered more likely than not to be realized through the generation of future taxable income and other tax planning strategies.assets.

Our operations may involve dealing with uncertainties and judgments in the application of complex tax regulations in multiple jurisdictions. The final taxes paid are dependent upon many factors, including negotiations with taxing authorities in various jurisdictions and resolution of disputes arising from federal, state, and international tax audits. We recognize potential liabilities and record tax liabilities for anticipated tax audit issues in the United States and other tax jurisdictions based on our estimate of whether, and the extent to which, additional taxes will be due. We adjust these reserves in light of changing facts and circumstances, such as the progress of a tax audit; however, due to the complexity of some of these uncertainties, the ultimate resolution could result in a payment that is materially different from our current estimate of the tax liabilities. These differences will be reflected as increases or decreases to income tax expense in the period which they are determined. We recognize interest and penalties, if any, related to unrecognized tax benefits in income tax expense.

LiquidityResults of Operations

Year Ended December 31, 2022, Compared with Year Ended December 31, 2021 (In thousands, except share data)

Years Ended

December 31,

December 31,

2021

2022

(unaudited)

Revenue

$

603,206

$

653,568

Costs and expenses

Cost of sales (excludes depreciation, depletion and amortization)

94,642

98,467

General and administrative

34,612

29,306

Production taxes

7,021

8,399

Depreciation, depletion and amortization

178,935

189,009

Impairment of royalty interests

4,287

Total costs and expenses

319,497

325,181

Operating income

283,709

328,387

Fair value changes in equity securities

(1,503)

2,510

Interest and other income

7,832

3,019

Interest and other expense

(17,170)

(5,753)

Income before income taxes

272,868

328,163

Income tax expense

(32,926)

(53,223)

Net income and comprehensive income

239,942

274,940

Net (income) loss and comprehensive (income) loss attributable to non-controlling interests

(960)

(898)

Net income and comprehensive income attributable to Royal Gold common stockholders

$

238,982

$

274,042

Basic earnings per share

$

3.64

$

4.17

Basic weighted average shares outstanding

65,576,995

65,552,586

Diluted earnings per share

$

3.63

$

4.17

Diluted weighted average shares outstanding

65,661,748

65,624,007

Cash dividends declared per common share

$

1.425

$

1.25

For the year ended December 31, 2022, we recorded net income attributable to Royal Gold stockholders of $239.0 million, or $3.64 per basic share and Capital Resources

Overview

At June 30, 2020, we had current assets of $362.2 million$3.63 per diluted share, as compared to current liabilitiesnet income attributable to Royal Gold stockholders of $43.6$274.0 million, resultingor $4.17 per basic and diluted share, for the year ended December 31, 2021. The decrease in working capital of $318.6 million and a current ratio of 8 to 1. This compares to current assets of $154.7 million and current liabilities of $33.6 million at June 30, 2019, resulting in working capital of $121.1 million and a current ratio of approximately 5 to 1. The increase in our current rationet income was primarily attributabledue to an increase in our cashlower revenue and equivalents, which is discussed further below under “Summaryhigher interest expense as a result of Cash Flows.”

During the fiscal year ended June 30, 2020, liquidity needs were met from $340.8 million in net cash provided by operating activities and our available cash resources. As of June 30, 2020, we had $695 million available and $305 millionhigher amounts outstanding under our  revolving credit facility. Working capital, combinedfacility compared to the prior period. This decrease was partially offset by a decrease in income tax expense as discussed in further detail below.

For the year ended December 31, 2022, we recognized total revenue of $603.2 million, which is comprised of stream revenue of $417.8 million and royalty revenue of $185.4 million, at an average gold price of $1,800 per ounce, an average silver price of $21.73 per ounce and an average copper price of $3.99 per pound, compared to total revenue of $653.6 million, which is comprised of stream revenue of $436.3 million and royalty revenue of $217.3 million, at an average gold price of $1,799 per ounce, an average silver price of $25.14 per ounce and an average copper price of $4.23 per pound, for the year ended December 31, 2021.

73

Table of Contents

Revenue and the corresponding production attributable to our stream and royalty interests, for the year ended December 31, 2022 compared to the year ended December 31, 2021 is as follows:

Revenue and Reported Production Subject to our Stream and Royalty Interests

Year Ended December 31, 2022 and 2021

(In thousands, except reported production in oz. and lbs.)

Year Ended

Year Ended

December 31, 2022

December 31, 2021

Reported

Reported

Stream/Royalty


Metal(s)


Revenue


Production(1)


Revenue


Production(1)

Stream(2):

Mount Milligan

$

180,543

$

173,114

Gold

67,800

oz.

61,400

oz.

Copper

14.8

Mlbs.

14.9

Mlbs.

Pueblo Viejo

$

85,863

$

109,716

Gold

33,200

oz.

40,600

oz.

Silver

1.2

Moz.

1.4

Moz.

Andacollo

Gold

$

47,347

26,100

oz.

$

68,965

38,100

oz.

Khoemacau

Silver

$

18,786

887,700

oz.

$

5,096

219,100

oz.

Other(3)

$

85,254

$

79,427

Gold

44,400

oz.

38,300

oz.

Silver

255,400

oz.

407,700

oz.

Total stream revenue

$

417,793

$

436,318

Royalty(2):

Cortez Legacy Zone

Gold

$

47,769

299,800

oz.

$

56,116

361,300

oz.

Cortez CC Zone

Gold

$

2,790

114,400

oz.

N/A

N/A

Peñasquito

$

43,165

$

52,959

Gold

572,600

oz.

709,600

oz.

Silver

29.7

Moz.

31.8

Moz.

Lead

146.8

Mlbs.

173.3

Mlbs.

Zinc

373.1

Mlbs.

433.3

Mlbs.

Other(3)

Various

$

91,689

N/A

$

108,175

N/A

Total royalty revenue

$

185,413

$

217,250

Total Revenue

$

603,206

$

653,568

(1)Reported production relates to the amount of metal sales, subject to our stream and royalty interests, for the year ended December 31, 2022 and 2021, and may differ from the operators’ public reporting.
(2)Refer to Item 2, Properties, for further discussion on our principal stream and royalty interests.
(3)Individually, with the exception of the Rainy River stream (5.3% for the year ended December 31, 2022 and 5.7% for the year ended December 31, 2021) and Wassa (5.2% for the year ended December 31, 2022), no stream or royalty included within the “Other” category contributed greater than 5% of our total revenue for either period.

The decrease in our total revenue for the year ended December 31, 2022, compared with available capacityyear ended December 31, 2021, resulted primarily from lower gold sales at Andacollo, lower gold and silver sales at Pueblo Viejo and lower gold production at Cortez and Peñasquito. These decreases were partially offset by an increase in gold sales at Mount Milligan and Xavantina, higher silver sales at Khoemacau and $5.2 million of revenue from the newly acquired royalties at Cortez compared to the prior period.

74

Table of Contents

Gold and silver ounces and copper pounds purchased and sold during the year ended December 31, 2022 and 2021, as well as gold, silver and copper in inventory as of December 31, 2022 and 2021, for our stream interests were as follows:

Year Ended

Year Ended

As of

As of

December 31, 2022

December 31, 2021

December 31, 2022

December 31, 2021

Gold Stream


Purchases (oz.)


Sales (oz.)


Purchases (oz.)


Sales (oz.)


Inventory (oz.)


Inventory (oz.)

Mount Milligan

68,900

67,800

61,600

61,400

5,200

4,100

Pueblo Viejo

32,500

33,200

38,700

40,600

7,900

8,600

Andacollo

27,700

26,200

37,600

38,100

3,800

2,200

Other

44,600

44,300

38,000

38,300

4,100

3,800

Total

173,700

171,500

175,900

178,400

21,000

18,700

Year Ended

Year Ended

As of

As of

December 31, 2022

December 31, 2021

December 31, 2022

December 31, 2021

Silver Stream


Purchases (oz.)


Sales (oz.)


Purchases (oz.)


Sales (oz.)


Inventory (oz.)


Inventory (oz.)

Pueblo Viejo

1,238,600

1,216,700

1,346,500

1,448,600

337,800

316,000

Khoemacau

951,500

887,700

261,100

219,100

105,900

42,000

Other

238,600

255,400

375,700

407,700

17,500

34,300

Total

2,428,700

2,359,800

1,983,300

2,075,400

461,200

392,300

Year Ended

Year Ended

As of

As of

December 31, 2022

December 31, 2021

December 31, 2022

December 31, 2021

Copper Stream


Purchases (Mlbs.)


Sales (Mlbs.)


Purchases (Mlbs.)


Sales (Mlbs.)


Inventory (Mlbs.)


Inventory (Mlbs.)

Mount Milligan

14.8

14.8

14.9

14.9

0.9

0.9

Cost of sales decreased to $94.6 million for the year ended December 31, 2022, from $98.5 million for the year ended December 31, 2021. The decrease was primarily due to a decrease in gold sales at Andacollo and a decrease in gold and silver sales at Pueblo Viejo when compared to the prior period. This decrease was partially offset by an increase in gold sales at Mount Milligan when compared to the prior period. Cost of sales, which excludes depreciation, depletion and amortization, is specific to our stream agreements and is the result of our purchase of gold, silver and copper for a cash payment. The cash payment for gold from Mount Milligan is the lesser of $435 per ounce or the prevailing market price of gold when purchased, while the cash payment for our other streams is a set contractual percentage of the gold, silver or copper (Mount Milligan) spot price near the date of metal delivery.

General and administrative costs increased to $34.6 million for year ended December 31, 2022, from $29.3 million for the year ended December 31, 2021. The increase was primarily due to higher employee related costs and non-cash stock compensation expense.

Depreciation, depletion and amortization decreased to $178.9 million for the year ended December 31, 2022, from $189.0 million for the year ended December 31, 2021. The decrease was primarily due to lower depletion rates at Mount Milligan compared to the prior period. Refer to Note 4 of our notes to consolidated financial statements for further discussion on the decrease in depletion rates at Mount Milligan. This decrease was partially offset by additional depletion from Khoemacau which produced first deliveries in the September 30, 2021 quarter.

During the year ended December 31, 2022, we recognized an impairment loss of $4.3 million on the carrying value of a non-principal exploration stage royalty due to new legal information received. Refer to Note 4 of our notes to consolidated financial statements for further discussion on the impairment.

We recognized a loss in fair value changes in equity securities of $1.5 million for the year ended December 31, 2022, compared to a gain in fair value changes in equity securities of $2.5 million for the year ended December 31, 2021. The change was primarily due to a decrease in the fair value of marketable equity securities as discussed further in Note 5 of our notes to consolidated financial statements.

Interest and other expense increased to $17.2 million for the year ended December 31, 2022, from $5.8 million for the year ended December 31, 2021. The increase in the current period was primarily attributable to higher interest expense as a

75

Table of Contents

result of higher average amounts outstanding under our revolving credit facility resulted in approximately $1 billion of total liquidity at June 30, 2020.and higher interest rates when compared to the prior period. Refer to Note 6 of our notes to consolidated financial statements and below (“Recent Liquidity and Capital Resource Developments”) for further discussion on our debt. On July 2, 2020, we repaid $30 million of the outstanding borrowings under the credit facility. This payment increased the amount available under our revolving credit facility to $725 million and decreased the amount outstanding to $275 million.

34

Table of Contents

We believe that our current financial resources and funds generated from operations will be adequate to cover anticipated expenditures for debt service, general and administrativeIncome tax expense costs and capital expenditures for the foreseeable future. Our current financial resources are also available to fund dividends and for acquisitions of stream and royalty interests, including the remaining conditional funding schedule in connection with the Khoemacau silver stream acquisition. Our long-term capital requirements are primarily affected by our ongoing acquisition activities. We currently, and generally at any time, have acquisition opportunities in various stages of active review. In the event of one or more substantial stream or royalty interest or other acquisitions, we may seek additional debt or equity financing as necessary.

Please refer to our risk factors included in Part I, Item 1A of this report for a discussion of certain risks that may impact our liquidity and capital resources.

Recent Liquidity and Capital Resource Developments

Revolving Credit Facility Drawdown

On April 3, 2020, we drew an additional $200 million on our revolving credit facility. There is no immediate requirement for the additional funds. However, due to the uncertain environment caused by the COVID-19 pandemic, and the impact on certain operations where we hold a stream or royalty interest, we believe the drawdown was a prudent precautionary measure to help ensure cash is readily available to support continued business activities.  We remain committed to reducing our debt, and absent the requirement to fund any new business opportunities, we expect to further manage our debt levels once the operating environment returns to normal.

Dividend Increase

On November 19, 2019, we announced an increase in our annual dividend for calendar 2020 from $1.06 to $1.12, payable on a quarterly basis of $0.28 per share. The newly declared dividend is 6% higher than the dividend paid during calendar 2019. We have steadily increased our annual dividend since calendar 2001.

Revolving Credit Facility Amendment

On September 20, 2019, we entered into a third amendment to our revolving credit facility dated as of June 2, 2017. Under the amendment, our Swiss subsidiary RGLD Gold was added as a co-borrower and joint and several obligor, certain of the Company’s Canadian subsidiaries were added as guarantors, and certain equity pledges that previously had been granted in favor of the lenders to support the facility were released, with the result that the facility is now unsecured.

Summary of Cash Flows

Operating Activities

Net cash provided by operating activities totaled $340.8$32.9 million for the fiscal year ended June 30, 2020,December 31, 2022, as compared to $253.2$53.2 million for the fiscal year ended June 30, 2019.December 31, 2021, which resulted in an effective tax rate of 12.1% in the current period and 16.2% in the prior period. The increaseeffective tax rate for the year ended December 31, 2022, was primarily due to an increase in proceeds received from our stream interests, netimpacted by the release of cost of sales, of approximately $49.5 million and lower income taxes paid of $12.9 million.

Investing Activities

Net cash used in investing activities totaled $152.9 milliona valuation allowance on certain foreign deferred tax assets. The effective tax rate for the fiscal year ended June 30, 2020, compared to cash usedDecember 31, 2021, was impacted by the release of uncertain tax positions resulting from a settlement agreement with a foreign tax authority and a change in investing activitiesestimates, partially offset by a foreign tax rate adjustment resulting in a revaluation of $5.6 million for the fiscal year ended June 30, 2019. The increase in cash used in investingcertain deferred tax assets.

35

Table of Contents

activities was due to an increase in acquisitions of stream and royalty interests. During the fiscal year ended June 30, 2020, we made advance payments totaling $135.7 million for the Khoemacau silver stream acquisition.

Financing Activities

Net cash provided by financing activities totaled $11.8 million for the fiscal year ended June 30, 2020, compared to cash used in financing activities of $216.9 million for the fiscal year ended June 30, 2019. The decrease in cash used in financing activities is primarily due to a decrease in debt repayments (net of borrowings) when compared to the prior fiscal year.

Contractual Obligations

Our contractual obligations as of June 30, 2020, are as follows:

Payments Due by Period (in thousands)

Less than

More than

Contractual Obligations

Total

1 Year

1 - 3 Years

3 - 5 Years

5 Years

Revolving credit facility(1)


$

325,972


$

4,258


$

12,775


$

308,939


$

Operating leases

$

9,210


$

901


$

1,854


$

1,931


$

4,524

Total

$

335,182

$

5,159

$

14,629

$

310,870

$

4,524

(1)Amounts represent principal ($305 million) and estimated interest payments ($21.0 million) assuming no early extinguishment.

For information on our revolving credit facility, see Note 6 to consolidated financial statements. The above table does not include stream commitments as discussed in Note 15 to consolidated financial statements. We believe we will be able to fund all current obligations from net cash provided by operating activities.

Off-Balance Sheet Arrangements

We do not have any off-balance sheet arrangements.

Results of Operations

Fiscal Year Ended June 30, 2020,December 31, 2022, Compared with Fiscal Year Ended June 30, 2019December 31, 2021 (In thousands, except share data)

Years Ended

December 31,

December 31,

2021

2022

(unaudited)

Revenue

$

603,206

$

653,568

Costs and expenses

Cost of sales (excludes depreciation, depletion and amortization)

94,642

98,467

General and administrative

34,612

29,306

Production taxes

7,021

8,399

Depreciation, depletion and amortization

178,935

189,009

Impairment of royalty interests

4,287

Total costs and expenses

319,497

325,181

Operating income

283,709

328,387

Fair value changes in equity securities

(1,503)

2,510

Interest and other income

7,832

3,019

Interest and other expense

(17,170)

(5,753)

Income before income taxes

272,868

328,163

Income tax expense

(32,926)

(53,223)

Net income and comprehensive income

239,942

274,940

Net (income) loss and comprehensive (income) loss attributable to non-controlling interests

(960)

(898)

Net income and comprehensive income attributable to Royal Gold common stockholders

$

238,982

$

274,042

Basic earnings per share

$

3.64

$

4.17

Basic weighted average shares outstanding

65,576,995

65,552,586

Diluted earnings per share

$

3.63

$

4.17

Diluted weighted average shares outstanding

65,661,748

65,624,007

Cash dividends declared per common share

$

1.425

$

1.25

For the fiscal year ended June 30, 2020,December 31, 2022, we recorded net income attributable to Royal Gold stockholders of $199.3$239.0 million, or $3.04$3.64 per basic share and $3.03$3.63 per diluted share, as compared to net income attributable to Royal Gold stockholders of $93.8$274.0 million, or $1.43$4.17 per basic and diluted share, for the fiscal year ended June 30, 2019.December 31, 2021. The increasedecrease in our earnings per sharenet income was primarily attributabledue to (i) an increase inlower revenue (ii)and higher interest expense as a result of higher amounts outstanding under our  revolving credit facility compared to the prior period. This decrease was partially offset by a decrease in our interest expense and (iii) discrete income tax benefits recognized, primarily attributable to recent Swiss tax reform during the quarter ended September 30, 2019and the release of an uncertain tax liability resulting from a settlement agreement with a foreign tax authority. Each areexpense as discussed in further detail below.

For the fiscal year ended June 30, 2020,December 31, 2022, we recognized total revenue of $498.8$603.2 million, which is comprised of stream revenue of $359.9$417.8 million and royalty revenue of $138.9$185.4 million, at an average gold price of $1,560$1,800 per ounce, an average silver price of $16.90$21.73 per ounce and an average copper price of $2.57$3.99 per pound, compared to total revenue of $423.1$653.6 million, which is comprised of stream revenue of $305.8$436.3 million and royalty revenue of $117.2$217.3 million, at an average gold price of $1,263$1,799 per ounce, an average silver price of $15.00$25.14 per ounce and an average copper price of $2.79$4.23 per pound, for the fiscal year ended June 30, 2019.December 31, 2021.

3673

Table of Contents

Revenue and the corresponding production attributable to our stream and royalty interests, for the fiscal year ended June 30, 2020December 31, 2022 compared to the fiscal year ended June 30, 2019December 31, 2021 is as follows:

Revenue and Reported Production Subject to our Stream and Royalty Interests

Fiscal YearsYear Ended June 30, 2020December 31, 2022 and 20192021

(In thousands, except reported production in ozs.oz. and lbs.)

Year Ended

Year Ended

Year Ended

Year Ended

June 30, 2020

June 30, 2019

December 31, 2022

December 31, 2021

Reported

Reported

Reported

Reported

Stream/Royalty


Metal(s)


Revenue


Production(1)


Revenue


Production(1)


Metal(s)


Revenue


Production(1)


Revenue


Production(1)

Stream(2):

Mount Milligan

$

131,425

$

101,010

$

180,543

$

173,114

Gold

63,700

oz.

61,700

oz.

Gold

67,800

oz.

61,400

oz.

Copper

12.7

Mlbs.

8.3

Mlbs.

Copper

14.8

Mlbs.

14.9

Mlbs.

Pueblo Viejo

$

96,978

$

82,844

$

85,863

$

109,716

Gold

43,300

oz.

41,000

oz.

Gold

33,200

oz.

40,600

oz.

Silver

1.8

Moz.

2.1

Moz.

Silver

1.2

Moz.

1.4

Moz.

Andacollo

Gold

$

74,219

48,100

oz.

$

69,264

55,000

oz.

Gold

$

47,347

26,100

oz.

$

68,965

38,100

oz.

Wassa

Gold

$

23,203

15,000

oz.

$

22,098

17,500

oz.

Khoemacau

Silver

$

18,786

887,700

oz.

$

5,096

219,100

oz.

Other(3)

$

34,043

$

30,608

$

85,254

$

79,427

Gold

20,300

oz.

22,600

oz.

Gold

44,400

oz.

38,300

oz.

Silver

188,800

oz.

144,700

oz.

Silver

255,400

oz.

407,700

oz.

Total stream revenue

$

359,868

$

305,824

$

417,793

$

436,318

Royalty(2):

Cortez Legacy Zone

Gold

$

47,769

299,800

oz.

$

56,116

361,300

oz.

Cortez CC Zone

Gold

$

2,790

114,400

oz.

N/A

N/A

Peñasquito

$

25,498

$

13,865

$

43,165

$

52,959

Gold

312,200

oz.

158,800

oz.

Gold

572,600

oz.

709,600

oz.

Silver

27.8

Moz.

16.4

Moz.

Silver

29.7

Moz.

31.8

Moz.

Lead

182.3

Mlbs.

117.4

Mlbs.

Lead

146.8

Mlbs.

173.3

Mlbs.

Zinc

393.9

Mlbs.

216.2

Mlbs.

Zinc

373.1

Mlbs.

433.3

Mlbs.

Cortez

Gold

$

22,342

173,300

oz.

$

11,383

96,700

oz.

Other(3)

Various

$

91,111

N/A

$

91,984

N/A

Various

$

91,689

N/A

$

108,175

N/A

Total royalty revenue

$

138,951

$

117,232

$

185,413

$

217,250

Total revenue

$

498,819

$

423,056

Total Revenue

$

603,206

$

653,568

(1)Reported production relates to the amount of metal sales, subject to our stream and royalty interests, for the fiscal yearsyear ended June 30, 2020December 31, 2022 and 2019,2021, and may differ from the operators’ public reporting.
(2)Refer to Item 2, Properties, for further discussion on our principal stream and royalty interests.
(3)Individually, with the exception of the Rainy River stream (5.5% in fiscal(5.3% for the year 2020ended December 31, 2022 and 5.2% in fiscal5.7% for the year 2019)ended December 31, 2021) and Wassa (5.2% for the year ended December 31, 2022), no stream or royalty included within the “Other” category contributed greater than 5% of our total revenue for either period.

The increasedecrease in our total revenue for the fiscal year ended June 30, 2020,December 31, 2022, compared with the fiscal year ended June 30, 2019,December 31, 2021, resulted primarily from an increase in our stream revenue and an increase in the averagelower gold sales at Andacollo, lower gold and silver prices. The increase in our stream revenue was primarily attributable tosales at Pueblo Viejo and lower gold production at Cortez and Peñasquito. These decreases were partially offset by an increase in gold and copper sales at Mount Milligan and goldXavantina, higher silver sales at Pueblo Viejo. These increases were partially offset by lower gold salesKhoemacau and $5.2 million of revenue from the newly acquired royalties at Andacollo which was dueCortez compared to a decrease in deliveries resulting from a temporary suspension of operations during the December 2019 quarter due to a worker’s strike.prior period.

3774

Table of Contents

Gold and silver ounces and copper pounds purchased and sold during the fiscal yearsyear ended June 30, 2020December 31, 2022 and 2019,2021, as well as gold, silver and copper in inventory as of June 30, 2020December 31, 2022 and 2019,2021, for our stream interests were as follows:

Year Ended

Year Ended

As of

As of

December 31, 2022

December 31, 2021

December 31, 2022

December 31, 2021

Gold Stream


Purchases (oz.)


Sales (oz.)


Purchases (oz.)


Sales (oz.)


Inventory (oz.)


Inventory (oz.)

Mount Milligan

68,900

67,800

61,600

61,400

5,200

4,100

Pueblo Viejo

32,500

33,200

38,700

40,600

7,900

8,600

Andacollo

27,700

26,200

37,600

38,100

3,800

2,200

Other

44,600

44,300

38,000

38,300

4,100

3,800

Total

173,700

171,500

175,900

178,400

21,000

18,700

Year Ended

Year Ended

As of

As of

December 31, 2022

December 31, 2021

December 31, 2022

December 31, 2021

Silver Stream


Purchases (oz.)


Sales (oz.)


Purchases (oz.)


Sales (oz.)


Inventory (oz.)


Inventory (oz.)

Pueblo Viejo

1,238,600

1,216,700

1,346,500

1,448,600

337,800

316,000

Khoemacau

951,500

887,700

261,100

219,100

105,900

42,000

Other

238,600

255,400

375,700

407,700

17,500

34,300

Total

2,428,700

2,359,800

1,983,300

2,075,400

461,200

392,300

Year Ended

Year Ended

As of

As of

December 31, 2022

December 31, 2021

December 31, 2022

December 31, 2021

Copper Stream


Purchases (Mlbs.)


Sales (Mlbs.)


Purchases (Mlbs.)


Sales (Mlbs.)


Inventory (Mlbs.)


Inventory (Mlbs.)

Mount Milligan

14.8

14.8

14.9

14.9

0.9

0.9

Year Ended

Year Ended

As of

As of

June 30, 2020

June 30, 2019

June 30, 2020

June 30, 2019

Gold Stream


Purchases (oz.)


Sales (oz.)


Purchases (oz.)


Sales (oz.)


Inventory (oz.)


Inventory (oz.)

Mount Milligan

59,900

63,700

68,500

61,700

3,300

7,100

Andacollo

43,900

48,100

51,900

55,000

100

4,300

Pueblo Viejo

45,000

43,300

41,200

41,000

11,100

9,500

Wassa

16,500

15,000

16,600

17,500

2,900

1,500

Other

19,500

20,300

22,500

22,600

1,500

2,200

Total

184,800

190,400

200,700

197,800

18,900

24,600

Year Ended

Year Ended

As of

As of

June 30, 2020

June 30, 2019

June 30, 2020

June 30, 2019

Silver Stream

Purchases (oz.)

Sales (oz.)

Purchases (oz.)

Sales (oz.)

Inventory (oz.)

Inventory (oz.)

Pueblo Viejo

1,726,100

1,750,400

2,007,000

2,071,700

451,200

475,600

Other

175,700

188,800

148,900

144,700

23,400

36,500

Total

1,901,800

1,939,200

2,155,900

2,216,400

474,600

512,100

Year Ended

Year Ended

As of

As of

June 30, 2020

June 30, 2019

June 30, 2020

June 30, 2019

Copper Stream

Purchases (Mlbs.)

Sales (Mlbs.)

Purchases (Mlbs.)

Sales (Mlbs.)

Inventory (Mlbs.)

Inventory (Mlbs.)

Mount Milligan

12.6

12.7

9.1

8.3

0.8

0.8

Our royalty revenue increased during the fiscal year ended June 30, 2020, compared with the fiscal year ended June 30, 2019, primarily due to an increase in production at Peñasquito and Cortez and an increase in the average gold and silver prices. Refer to Part I, Item 2, Properties, for discussion and any updates on our principal producing properties.

Cost of sales increaseddecreased to $83.9$94.6 million for the fiscal year ended June 30, 2020,December 31, 2022, from $77.5$98.5 million for the fiscal year ended June 30, 2019.December 31, 2021. The increasedecrease was primarily due to increaseda decrease in gold sales at Andacollo and a decrease in gold and coppersilver sales from Mount Milligan andat Pueblo Viejo when compared to the prior period. This decrease was partially offset by an increase in gold sales from Pueblo Viejo, partially offset by a decrease in silver sales from Pueblo Viejo.at Mount Milligan when compared to the prior period. Cost of sales, which excludes depreciation, depletion and amortization, is specific to our stream agreements and is the result of RGLD Gold’sour purchase of gold, silver and copper for a cash payment. The cash payment for gold from Mount Milligan is the lesser of $435 per ounce or the prevailing market price of gold when purchased, while the cash payment for our other streams is a set contractual percentage of the gold, silver or copper (Mount Milligan) spot price near the date of metal delivery.

General and administrative costs increased to $34.6 million for year ended December 31, 2022, from $29.3 million for the year ended December 31, 2021. The increase was primarily due to higher employee related costs and non-cash stock compensation expense.

Depreciation, depletion and amortization increaseddecreased to $175.4$178.9 million for the fiscal year ended June 30, 2020,December 31, 2022, from $163.1$189.0 million for the fiscal year ended June 30, 2019.December 31, 2021. The increasedecrease was primarily attributabledue to higher gold and copper saleslower depletion rates at Mount Milligan and an increase in gold sales at Pueblo Viejo. An increasecompared to the prior period. Refer to Note 4 of our notes to consolidated financial statements for further discussion on the decrease in depletion rates at Mount Milligan asMilligan. This decrease was partially offset by additional depletion from Khoemacau which produced first deliveries in the September 30, 2021 quarter.

During the year ended December 31, 2022, we recognized an impairment loss of $4.3 million on the carrying value of a resultnon-principal exploration stage royalty due to new legal information received. Refer to Note 4 of updated reserves, as discussed in Part I, Item 2, Properties, also contributedour notes to consolidated financial statements for further discussion on the increase in our depletion expense during the current period.impairment.

We recognized a loss in fair value changes in equity securities of $1.5 million for the year ended December 31, 2022, compared to a gain in fair value changes in equity securities of $1.4$2.5 million for the fiscal year ended June 30, 2020, compared to a loss in fair value changes in equity securities of $6.8 million for the fiscal year ended June 30, 2019.December 31, 2021. The change was primarily due to an increasea decrease in the fair value of marketable equity securities as discussed further in Note 5 of our notes to the consolidated financial statements.

Interest and other expense decreasedincreased to $9.8$17.2 million for the fiscal year ended June 30, 2020,December 31, 2022, from $29.7$5.8 million for the fiscal year ended June 30, 2019.December 31, 2021. The decreaseincrease in the current period was primarily attributable to lowerhigher interest expense as a

75

Table of Contents

result of a decrease inhigher average debt amounts outstanding during the current periodunder our revolving credit facility and higher interest rates when compared to the prior period.  During the prior period, we settled the $370 million aggregate principal amount due under our convertible senior notes that matured in June 2019. Refer to Note 6 of our notes to consolidated financial statements for further discussion on our outstanding debt.

DuringIncome tax expense was $32.9 million for the fiscal year ended June 30, 2020, we recognized an income tax benefit totaling $3.7December 31, 2022, as compared to $53.2 million compared with an expense of $17.5 million duringfor the fiscal year ended June 30, 2019. ThisDecember 31, 2021, which resulted in an effective tax rate of (1.9%) during12.1% in the current period compared with 16.4%and 16.2% in the prior period. The effective tax rate for the fiscal year ended June 30, 2020December 31, 2022, was primarily impacted by the release of a valuation allowance on certain foreign deferred tax assets. The effective tax rate for the year ended December 31, 2021, was impacted by the release of uncertain tax positions resulting from a settlement agreement with a foreign tax authority and a change in estimates, partially offset by a foreign tax rate adjustment resulting in a revaluation of certain deferred tax assets.

Liquidity and Capital Resources

We use our liquidity and capital resources to fund dividends and for the acquisition of stream and royalty interests, including any conditional funding schedules. Our short-term and long-term capital requirements are primarily affected by our ongoing acquisition activities. We currently, and generally at any time, have acquisition opportunities in various stages of active review. In the event of one or more substantial stream or royalty interest or other acquisitions, we may seek additional debt or equity financing as necessary. We occasionally borrow and repay amounts under our revolving credit facility and may do so in the future. We believe that our current liquidity and capital resources will be adequate to cover our operating needs for the foreseeable future.

At December 31, 2022, we had working capital of $122.2 million, including $118.6 million of cash and equivalents. This compares to working capital of $154.6 million, including $143.6 million of cash and equivalents at December 31, 2021. The decrease in our working capital was primarily attributable to the acquisition of royalty and stream interests during the year ended December 31, 2022, which is discussed further below under “Summary of Cash Flows.”

During the year ended December 31, 2022, liquidity needs were met from $417.3 million in net cash provided by operating activities and our available cash resources. Working capital, combined with the $425 million of available capacity under our revolving credit facility, resulted in approximately $547.2 million of total liquidity at December 31, 2022. Refer to Note 6 of our notes to consolidated financial statements and below (“Recent Liquidity and Capital Resource Developments”) for further discussion on our debt.

At year ended December 31, 2022, our contractual cash obligations are solely comprised of operating leases. We believe we will be able to fund all current cash obligations from net cash provided by operating activities. For additional information on our operating leases, see Note 7 of our notes to consolidated financial statements.

Please refer to our risk factors included in Part I, Item 1A of this report for a discussion of certain risks that may impact our liquidity and capital resources.

Recent Liquidity and Capital Resource Developments

Revolving Credit Facility Drawdown

On July 2, 2022, we borrowed $500 million under our revolving credit facility for the acquisition of the Rio Tinto Royalty, and on September 6, 2022, we repaid $50 million of the outstanding borrowings. Refer to Note 3 of our notes to consolidated financial statements for further discussion on the Rio Tinto Royalty acquisition.

On December 6, 2022, we repaid $75 million of outstanding borrowings on our revolving credit facility, and on December 28, 2022 we borrowed $200 million for the acquisition of the Idaho Royalty. Refer to Note 3 of our notes to consolidated financial statements for further discussion on the acquisition of the Idaho Royalty. As of December 31, 2022, we had $575 million outstanding under our revolving credit facility.

3876

Table of Contents

Dividend Increase

On November 15, 2022, we announced an increase in our annual dividend for calendar year 2023 from $1.40 to $1.50 per share, payable on a quarterly basis of $0.375 per share. The newly declared dividend is 7% higher than the dividend paid during calendar year 2022. We have steadily increased our annual dividend for 22 years, or since calendar year 2001. We expect to pay our annual dividend using cash on hand.

Summary of Cash Flows (In thousands)

Years Ended

December 31, 

December 31, 

2021


2022


(unaudited)

Cash flows from operating activities:

Net income and comprehensive income

$

239,942

$

274,940

Adjustments to reconcile net income and comprehensive income to net cash provided by operating activities:

Depreciation, depletion and amortization

178,935

189,009

Non-cash employee stock compensation expense

8,411

6,056

Fair value changes in equity securities

1,503

(2,510)

Deferred tax (benefit) expense

(19,836)

11,371

Impairment of royalty interests

4,287

Other

979

1,663

Changes in assets and liabilities:

Royalty receivables

4,683

(9,771)

Stream inventory

(1,049)

2,292

Income tax receivable

1,849

4,023

Prepaid expenses and other assets

(3,908)

(1,956)

Accounts payable

211

3,862

Income tax payable

(3,005)

(4,248)

Uncertain tax positions

(13,268)

Other liabilities

4,343

406

Net cash provided by operating activities

$

417,345

$

461,869

Cash flows from investing activities:

Acquisition of stream and royalty interests

(922,155)

(400,381)

Khoemacau subordinated debt facility

(25,000)

Proceeds from sale of equity securities

8,651

Other

(721)

(241)

Net cash used in by investing activities

$

(922,876)

$

(416,971)

Cash flows from financing activities:

Repayment of debt

(125,000)

(300,000)

Borrowings from revolving credit facility

700,000

100,000

Net payments from issuance of common stock

(1,447)

(971)

Common stock dividends

(91,925)

(78,738)

Other

(1,062)

(3,497)

Net cash provided by (used in) financing activities

$

480,566

$

(283,206)

Net decrease in cash and equivalents

(24,965)

(238,308)

Cash and equivalents at beginning of period

143,551

381,859

Cash and equivalents at end of period

$

118,586

$

143,551

77

Table of Contents

Operating Activities

Net cash provided by operating activities totaled $417.3 million for the year ended December 31, 2022, compared to $461.9 million for the year ended December 31, 2021. The change was primarily impacted bydue to a $35.9 million decrease in cash proceeds received from our stream and royalty interests, net step-up of tax assetscost of sales, compared to the prior period.

Investing Activities

Net cash used in investing activities totaled $922.9 million for the year ended December 31, 2022, compared to net cash used in investing activities of $417.0 million for the year ended December 31, 2021. The increase over the prior period was primarily due to the enactmentGBR, Rio Tinto Royalty and Idaho Royalty acquisitions.

Financing Activities

Net cash provided by financing activities totaled $480.6 million for the year ended December 31, 2022, compared to net cash used in financing activities of $283.2 million for the year ended December 31, 2021. The change was primarily due to an increase in the debt outstanding for the year ended December 31, 2022 that was used to fund acquisitions of our new royalty interests at Cortez and the Great Bear Project compared to the prior period.

Critical Accounting Estimates

Use of Estimates

The preparation of our financial statements, in conformity with U.S. generally accepted accounting principles (“U.S. GAAP”), requires management to make estimates and assumptions. These estimates and assumptions have a significant effect on reported amounts of assets and liabilities, revenue and expenses because they result primarily from the need to make estimates and assumptions on matters that are inherently uncertain.

We rely on mineral reserve and mineral resource estimates reported by the operators of the Federal Actproperties on Tax Reformwhich we hold stream and AHV Financing in Switzerlandroyalty interests. These estimates and the releaseunderlying assumptions affect the potential impairments of long-lived assets and the ability to realize income tax benefits associated with deferred tax assets. These estimates and assumptions also affect the rate at which we recognize revenue or charge depreciation, depletion and amortization to earnings. On an ongoing basis, management evaluates these estimates and assumptions; however, actual amounts could differ from these estimates and assumptions. Differences between estimates and actual amounts are adjusted and recorded in the period that the actual amounts are known.

Stream and Royalty Interests in Mineral Properties and Related Depletion

Stream and royalty interests include acquired stream and royalty interests in production, development and exploration stage properties. The costs of acquired stream and royalty interests are capitalized as tangible assets as such interests do not meet the definition of a financial asset.

Production stage stream and royalty interests are depleted using the units of production method over the life of the mineral property (as stream sales occur or royalty payments are recognized), which are estimated using proven and probable mineral reserves as provided by the operator. Development stage mineral properties, which are not yet in production, are not depleted until the property begins production. Exploration stage mineral properties, where there are no proven and probable mineral reserves, are not depleted. When the associated exploration stage mineral interests are converted to proven and probable mineral reserves, the mineral property becomes a development stage mineral property.

78

Table of Contents

Asset Impairment

We evaluate long-lived assets for impairment whenever events or changes in circumstances indicate that the related carrying amounts of an uncertain tax liability resultingasset or group of assets may not be recoverable. The recoverability of the carrying value of stream and royalty interests in production and development stage mineral properties is evaluated based upon estimated future undiscounted net cash flows from each stream and royalty interest using estimates of proven and probable mineral reserves, mineral resources and other relevant information received from the operators. We evaluate the recoverability of the carrying value of royalty interests in exploration stage mineral properties in the event of significant decreases in the price of gold, silver, copper and other metals, and whenever new information regarding the mineral properties is obtained from the operator indicating that production will not likely occur or may be reduced in the future, thus potentially affecting the future recoverability of our stream or royalty interests. Impairments in the carrying value of each property are measured and recorded to the extent that the carrying value in each property exceeds its estimated fair value, which is generally calculated using estimated future discounted cash flows.

Estimates of gold, silver, copper, and other metal prices, and operators’ estimates of proven and probable mineral reserves or mineral resources related to our stream or royalty properties are subject to certain risks and uncertainties which may affect the recoverability of our investment in these stream and royalty interests in mineral properties. It is possible that changes could occur to these estimates, which could adversely affect the net cash flows expected to be generated from these stream and royalty interests. Refer to Note 4 of our notes to consolidated financial statements for a discussion of the impairment assessment results for the year ended December 31, 2022.

Revenue

A performance obligation is a promise in a contract to transfer control of a distinct good or service (or integrated package of goods and/or services) to a customer. A contract’s transaction price is allocated to each distinct performance obligation and recognized as revenue when, or as, a performance obligation is satisfied. In accordance with this guidance, revenue attributable to our stream and royalty interests is generally recognized at the point in time that control of the related metal production transfers to our customers, as described below. The amount of revenue we recognize further reflects the consideration to which we are entitled under the respective stream or royalty agreement. A more detailed summary of our revenue recognition policies for our stream and royalty interests is discussed below.

Stream Interests

A metal stream is a purchase agreement that provides, in exchange for an upfront deposit payment, the right to purchase all or a portion of one or more of the metals produced from a mine, at a price determined for the life of the transaction by the purchase agreement. Gold, silver and copper received under our metal stream agreements are taken into inventory, and then sold primarily using average spot rate gold, silver and copper forward contracts. The sales price for these average spot rate forward contracts is determined by the average daily gold, silver or copper spot prices during the term of the contract, typically a consecutive number of trading days between ten days and three months (depending on the frequency of deliveries under the respective stream agreement and our sales policy in effect at the time) commencing shortly after receipt and purchase of the metal. We settle our forward sales contracts via physical delivery of the metal to the purchaser (our customer) on the settlement date specified in the contract. Under our forward sales contracts, there is a single performance obligation to sell a contractually specified volume of metal to the purchaser, and we satisfy this obligation at the point in time of physical delivery. Accordingly, revenue from our metal sales is recognized on the date of settlement, which is the date that control, custody and title to the metal transfer to the purchaser.

Royalty Interests

Royalties are non-operating interests in mining projects that provide the right to a percentage of revenue or metals produced from the project after deducting specified costs, if any. We are entitled to payment for our royalty interest in a mining project based on a contractually specified commodity price (for example, a monthly or quarterly average spot price) for the period in which metal production occurred. As a royalty holder, we act as a passive entity in the production and operations of the mining project, and the third-party operator of the mining project is responsible for all mining activities, including subsequent marketing and delivery of all metal production to their ultimate customer. In all of our material

79

Table of Contents

royalty interest arrangements, we have concluded that we transfer control of our interest in the metal production to the operator at the point at which production occurs, and thus, the operator is our customer. We have further determined that the transfer of each unit of metal production, comprising our royalty interest, to the operator represents a separate performance obligation under the contract, and each performance obligation is satisfied at the point in time of metal production by the operator. Accordingly, we recognize revenue attributable to our royalty interests in the period in which metal production occurs at the specified commodity price per the agreement, with a foreign tax authority.  The effectivenet of any contractually allowable offsite treatment, refining, transportation and, if applicable, other contractually permitted costs.

Income Taxes

Our annual tax rate is based on income, statutory tax rates in effect and tax planning opportunities available to us in the various jurisdictions in which the Company operates. Significant judgment is required in determining the annual tax expense, current tax assets and liabilities, deferred tax assets and liabilities, and our future taxable income, both as a whole and in various tax jurisdictions, for purposes of assessing our ability to realize future benefit from our deferred tax assets. Actual income taxes could vary from these estimates due to future changes in income tax law, significant changes in the fiscal year ended June 30, 2019 was primarily impactedjurisdictions in which we operate or unpredicted results from the final determination of each year’s liability by true-ups related to the Tax Cuts and Jobs Act partially offset by the implementation of thetaxing authorities.

We treat global intangible low-taxed income (“GILTI”) as a period cost and therefore do not record deferred tax regime.impacts of GILTI in our consolidated financial statements. Our deferred income taxes reflect the impact of temporary differences between the reported amounts of assets and liabilities for financial reporting purposes and such amounts measured by tax laws and regulations. In evaluating the realizability of the deferred tax assets, management considers both positive and negative evidence that may exist, such as earnings history, reversal of taxable temporary differences, forecasted operating earnings and available tax planning strategies in each tax jurisdiction. A valuation allowance may be established to reduce our deferred tax assets to the amount that is considered more likely than not to be realized through the generation of future taxable income and other tax planning strategies.

Our operations may involve dealing with uncertainties and judgments in the application of complex tax regulations in multiple jurisdictions. The final taxes paid are dependent upon many factors, including negotiations with taxing authorities in various jurisdictions and resolution of disputes arising from federal, state, and international tax audits. We recognize potential liabilities and record tax liabilities for anticipated tax audit issues in the United States and other tax jurisdictions based on our estimate of whether, and the extent to which, additional taxes will be due. We adjust these reserves in light of changing facts and circumstances, such as the progress of a tax audit; however, due to the complexity of some of these uncertainties, the ultimate resolution could result in a payment that is materially different from our current estimate of the tax liabilities. These differences will be reflected as increases or decreases to income tax expense in the period which they are determined. We recognize interest and penalties, if any, related to unrecognized tax benefits in income tax expense.

Forward-Looking Statements

This report and our other public communications include “forward-looking statements” within the meaning of U.S. federal securities laws. Forward-looking statements are any statements other than statements of historical fact. Forward-looking statements are not guarantees of future performance, and actual results may differ materially from these statements.

Forward-looking statements are often identified by words like “will,” “may,” “could,” “should,” “would,” “believe,” “estimate,” “expect,” “anticipate,” “plan,” “forecast,” “potential,” “intend,” “continue,” “project,” or negatives of these words or similar expressions. Forward-looking statements include, among others, the following: statements about our expected financial performance and outlook, including sale volume, revenue, expenses, tax rates, earnings or cash flow; operators’ expected operating and financial performance, including production, deliveries, mine plans, estimates of mineral resources and mineral reserves, development, cash flows and liquidity, capital requirements and capital expenditures; planned and potential acquisitions or dispositions, including funding schedules and conditions;influence on our operators’ operations; benefits from acquisitions; receipt of metal deliveries; liquidity, capital resources, financing and dividends;stockholder returns; borrowings and repayments under our overall investmentrevolving credit facility; growing our portfolio of assets; the materiality of properties within our portfolio; impact of inadequately assessing new acquisitions; macroeconomic and market conditions including theconditions; impacts of COVID-19;climate-change; diversity and inclusion efforts; returns on investments; sufficiency of contractual protections; adoption of new accounting standards; valuation allowances;

80

Table of Contents

assumptions related to fair value of equity awards; prices for gold, silver, copper, nickel and other metals; potential impairments; orand tax changes.

Factors that could cause actual results to differ materially from these forward-looking statements include, among others, the following: a low-pricelower-price environment for gold, silver, copper, nickel or other metals; operating activities or financial performance of properties on which we hold stream or royalty interests, including variations between actual and forecasted performance, operators’ ability to complete projects on schedule and as planned, operators’ changes to mine plans and mineral reserves and mineral resources (including updated mineral reserve and mineral resource information), liquidity needs, mining and environmental hazards, labor disputes, distribution and supply chain disruptions, permitting and licensing issues, contractual issues involving our stream or royalty agreements, or operational disruptions due to COVID-19;disruptions; risks associated with doing business in foreign countries; increased competition for stream and royalty interests; environmental risks, included those caused by climate change; potential cyber-attacks, including ransomware; our ability to identify, finance, value and complete acquisitions; adverse economic and market conditions; impact of health epidemics and pandemics; changes in laws or regulations governing us, operators or operating properties; changes in management and key employees; and other factors described elsewhere in this report.report, including in Item 1A – Risk Factors. Most of these factors are beyond our ability to predict or control.

Forward-looking statements speak only as of the date on which they are made. We disclaim any obligation to update any

forward-looking statements, except as required by law. Readers are cautioned not to put undue reliance on forward-looking statements.

ITEM 7A.  QUANTITATIVE AND QUALITATIVE DISCLOSURE ABOUT MARKET RISK

Our earnings and cash flows are significantly impacted by changes in the market price of gold and other metals. Gold, silver, copper, and other metal prices can fluctuate significantly and are affected by numerous factors, such as demand, production levels, economic policies of central banks, producer hedging, world political and economic events, and the strength of the U.S. dollar relative to other currencies. Please see the risk factor entitled “Our revenue is subject to volatility in metal prices, which could negatively affect our results of operations or cash flow.” under Part I, Item 1A. Risk Factors of this report for more information about risks associated with metal price volatility.

During the fiscal year ended June 30, 2020,December 31, 2022, we reported revenue of $498.8$603.2 million, with an average gold price for the period of $1,560$1,800 per ounce (based on the LBMA Price), an average silver price forof $21.73 per ounce (based on the period of $16.90 per ounceLBMA Price), and an average copper price of $2.57$3.99 per pound. Approximately 79% of our total recognized revenues forpound (based on the fiscal year ended June 30, 2020 were attributable to gold sales from our gold producing interests, as shown withinLME Price). The table below shows the MD&A. For the fiscal year ended June 30, 2020, if the price of gold had averagedimpact that a 10% higher or lower per ounce, we would have recorded an increase or decrease in revenuethe average price of approximately $41.6 million.

Approximately 9% ofthe specified metal would have had on our total reported revenue for the fiscal year ended June 30, 2020 was attributable to silver sales from our silver producing interests. For the fiscal year ended June 30, 2020, if the price of silver had averaged 10% higher or lower per ounce, we would have recorded an increase or decrease in revenues of approximately $4.4 million.December 31, 2022:

Metal

Percentage of Total Reported Revenue Associated with Specified Metal

Amount by Which Total Reported Revenue Would Have Increased or Decreased If Price of Specified Metal Had Averaged 10% Higher or Lower in Period

Gold

73%

$45.1 million

Copper

12%

$13.2 million

Silver

11%

$3.5 million

Approximately 9% of our total reported revenue for the fiscal year ended June 30, 2020 was attributable to copper sales from our copper producing interests. For the fiscal year ended June 30, 2020, if the price of copper had averaged 10% higher or lower per pound, we would have recorded an increase or decrease in revenues of approximately $5.0 million.

3981

Table of Contents

ITEM 8.  FINANCIAL STATEMENTS AND SUPPLEMENTARY DATA

Index to Financial Statements

Page

REPORT OF INDEPENDENT REGISTERED PUBLIC ACCOUNTING FIRM (PCAOB 0042)

4183

CONSOLIDATED BALANCE SHEETS

4385

CONSOLIDATED STATEMENTS OF OPERATIONS AND COMPREHENSIVE INCOME (LOSS)

4486

CONSOLIDATED STATEMENTS OF CHANGES IN EQUITY

4587

CONSOLIDATED STATEMENTS OF CASH FLOWS

4688

NOTES TO CONSOLIDATED FINANCIAL STATEMENTS

4789

4082

Table of Contents

Report of Independent Registered Public Accounting Firm

To the Stockholders and the Board of Directors and Stockholders of Royal Gold, Inc.

Opinion on the Financial Statements

We have audited the accompanying consolidated balance sheets of Royal Gold, Inc. (the Company) as of June 30, 2020December 31, 2022 and 2019,2021, the related consolidated statements of operations and comprehensive income, (loss), changes in equity and cash flows for the year ended December 31, 2022, the six-month period ended December 31, 2021 and each of the threetwo years in the period ended June 30, 2020,2021, and the related notes (collectively referred to as the “consolidated financial statements”). In our opinion, the consolidated financial statements present fairly, in all material respects, the financial position of the Company at June 30, 2020December 31, 2022 and 2019,2021, and the results of its operations and its cash flows for the year ended December 31, 2022, the six-month period ended December 31, 2021 and each of the threetwo years in the period ended June 30, 2020,2021, in conformity with U.S. generally accepted accounting principles.

We also have audited, in accordance with the standards of the Public Company Accounting Oversight Board (United States) (PCAOB), the Company's internal control over financial reporting as of June 30, 2020,December 31, 2021, based on criteria established in Internal Control-Integrated Framework issued by the Committee of Sponsoring Organizations of the Treadway Commission (2013 framework), and our report dated August 6, 2020February 16, 2023 expressed an unqualified opinion thereon.

Basis for Opinion

These financial statements are the responsibility of the Company's management. Our responsibility is to express an opinion on the Company’s financial statements based on our audits. We are a public accounting firm registered with the PCAOB and are required to be independent with respect to the Company in accordance with the U.S. federal securities laws and the applicable rules and regulations of the Securities and Exchange Commission and the PCAOB.

We conducted our audits in accordance with the standards of the PCAOB. Those standards require that we plan and perform the audit to obtain reasonable assurance about whether the financial statements are free of material misstatement, whether due to error or fraud. Our audits included performing procedures to assess the risks of material misstatement of the financial statements, whether due to error or fraud, and performing procedures that respond to those risks. Such procedures included examining, on a test basis, evidence regarding the amounts and disclosures in the financial statements. Our audits also included evaluating the accounting principles used and significant estimates made by management, as well as evaluating the overall presentation of the financial statements. We believe that our audits provide a reasonable basis for our opinion.

Critical Audit Matter

The critical audit matter communicated below is a matter arising from the current period audit of the financial statements that was communicated or required to be communicated to the audit committee and that: (1) relates to accounts or disclosures that are material to the financial statements and (2) involved our especially challenging, subjective or complex judgments. The communication of the critical audit matter does not alter in any way our opinion on the consolidated financial statements, taken as a whole, and we are not, by communicating the critical audit matter below, providing a separate opinion on the critical audit matter or on the accounts or disclosuresto which it relates.

83

Table of Contents

Impairment Assessment of Stream and Royalty Interests in Mineral Properties

Description of the Matter

At June 30, 2020,December 31, 2022, the Company’s stream and royalty interest balance totaled $2.3$3.2 billion. As more fully described in Note 24 to the consolidated financial statements, the Company evaluates its stream and royalty interests for impairment whenever events or changes in circumstances indicate that the carrying amounts of the asset or group of assets may not be recoverable (“triggering events”). Management evaluates various qualitative factors in determining whether or not events or changes in circumstances indicate that the carrying amount of an asset or group of assets may not be recoverable. The factors considered include, among others, significant changes in estimates of forecasted gold, silver, copper and other metal prices, significant changes in operators’ estimates of proven and probable reserves and other relevant information received from the operators, which

41

Table of Contents

may include operational or legal information that indicates production from mineral interests willmay not likely occur or may be significantly reduced in the future.future or otherwise that the Company’s stream and royalty interest balance may not be recoverable.  

Auditing the Company’s impairment assessment involved our subjective judgment because, in determining whether a triggering event occurred, management uses estimates that include, among others, assumptions about forecasted gold, silver, copper and other metal prices and total future production using reserve or other relevant information reported by the operators. Significant uncertainty exists with these assumptions. Further, management’s evaluation of any new information indicating that production will likely not likely occur or may be significantly reduced in the future, or otherwise that the Company’s stream and royalty interest balance may not be recoverable, requires significant judgment.  

How We Addressed the Matter in Our Audit

We obtained an understanding, evaluated the design and tested the operating effectiveness of controls over the Company’s process over the impairment assessment. For example, we tested controls over the Company’s process for identifying and evaluating potential impairment triggers and related significant assumptions and judgments. To test the Company’s impairment assessment, our audit procedures included, among others, evaluating the significant assumptions, judgments and operating data used in the Company’s analysis. Specifically, we compared forecasted gold, silver, copper and other metal prices to available market information, and we corroborated reserve information to available operator or publicly available information. We involved our specialist and searched for and evaluated other publicly available information that corroborates or contradicts the reserve estimates or indicates that production from mineral interests will not likely occur or may be significantly reduced in the future. We also considered the professional qualifications and objectivity of management’smanagement��s specialists and the reputation of the third-party operators. Further, we evaluated the reasonableness of changes to estimated proven and probable reserves using our experience with the Company’s stream and royalty interests and industry knowledge.

/s/ Ernst & Young LLP

We have served as the Company'sCompany’s auditor since 2010.

Denver, Colorado

August 6, 2020

February 16, 2023

4284

Table of Contents

ROYAL GOLD, INC.

Consolidated Balance Sheets

As of June 30,

(In thousands, except share data)


June 30, 


June 30, 


December 31, 


December 31,


2020

2019


2022


2021

ASSETS

Cash and equivalents

$

319,128

$

119,475

$

118,586

$

143,551

Royalty receivables

27,689

20,733

49,405

54,088

Income tax receivable

2,435

2,702

3,066

4,915

Stream inventory

11,671

11,380

12,656

11,607

Prepaid expenses and other

1,227

389

2,120

1,835

Total current assets

362,150

154,679

185,833

215,996

Stream and royalty interests, net (Note 4)

2,318,913

2,339,316

3,237,402

2,443,752

Other assets

85,224

50,156

111,287

97,284

Total assets

$

2,766,287

$

2,544,151

$

3,534,522

$

2,757,032

LIABILITIES

Accounts payable

$

2,484

$

2,890

$

6,686

$

6,475

Dividends payable

18,364

17,372

24,627

22,966

Income tax payable

13,323

6,974

16,065

19,070

Other current liabilities

9,384

6,374

16,209

12,917

Total current liabilities

43,555

33,610

63,587

61,428

Debt (Note 6)

300,439

214,554

571,572

Deferred tax liabilities

86,439

88,961

138,156

87,705

Uncertain tax positions

25,427

36,573

Other long-term liabilities

8,308

-

Other liabilities

7,738

6,688

Total liabilities

464,168

373,698

781,053

155,821

Commitments and contingencies (Note 15)

Commitments and contingencies (Note 16)

EQUITY

Preferred stock, $.01 par value, 10,000,000 shares authorized; and 0 shares issued

Common stock, $.01 par value, 200,000,000 shares authorized; and 65,531,288 and 65,440,492 shares outstanding, respectively

655

655

Common stock, $.01 par value, 200,000,000 shares authorized; and 65,592,597 and 65,564,364 shares outstanding, respectfully

656

656

Additional paid-in capital

2,210,429

2,201,773

2,213,123

2,206,159

Accumulated earnings (losses)

61,133

(65,747)

Accumulated earnings

527,314

381,929

Total Royal Gold stockholders’ equity

2,272,217

2,136,681

2,741,093

2,588,744

Non-controlling interests

29,902

33,772

12,376

12,467

Total equity

2,302,119

2,170,453

2,753,469

2,601,211

Total liabilities and equity

$

2,766,287

$

2,544,151

$

3,534,522

$

2,757,032

The accompanying notes are an integral part of these consolidated financial statements.

4385

Table of Contents

ROYAL GOLD, INC.

Consolidated Statements of Operations and Comprehensive Income (Loss)

For the Years Ended June 30,

(In thousands, except share data)

For The Year Ended

June 30, 

June 30, 

June 30, 


2020


2019


2018

Revenue (Note 7)

$

498,819

$

423,056

$

459,042

Costs and expenses

Cost of sales (excludes depreciation, depletion and amortization)

83,890

77,535

83,839

General and administrative

30,195

30,488

35,464

Production taxes

3,824

4,112

2,268

Exploration costs

5,190

7,158

8,946

Depreciation, depletion and amortization

175,434

163,056

163,696

Impairment of royalty interests

1,341

239,364

Total costs and expenses

299,874

282,349

533,577

Operating income (loss)

198,945

140,707

(74,535)

Fair value changes in equity securities

1,418

(6,800)

Interest and other income

2,046

2,320

4,170

Interest and other expense

(9,813)

(29,650)

(34,214)

Income (loss) before income taxes

192,596

106,577

(104,579)

Income tax benefit (expense)

3,654

(17,498)

(14,772)

Net income (loss)

196,250

89,079

(119,351)

Net loss attributable to non-controlling interests

3,093

4,746

6,217

Net income (loss) attributable to Royal Gold common stockholders

$

199,343

$

93,825

$

(113,134)

Net income (loss)

$

196,250

$

89,079

$

(119,351)

Adjustments to comprehensive income (loss), net of tax

Unrealized change in market value of available-for-sale securities

(2,080)

Comprehensive income (loss)

196,250

89,079

(121,431)

Comprehensive loss attributable to non-controlling interests

3,093

4,746

6,217

Comprehensive income (loss) attributable to Royal Gold stockholders

$

199,343

$

93,825

$

(115,214)

Net income (loss) per share attributable to Royal Gold common stockholders:

Basic earnings (loss) per share

$

3.04

$

1.43

$

(1.73)

Basic weighted average shares outstanding

65,523,024

65,394,627

65,291,855

Diluted earnings (loss) per share

$

3.03

$

1.43

$

(1.73)

Diluted weighted average shares outstanding

65,643,390

65,505,535

65,291,855

Cash dividends declared per common share

$

1.11

$

1.05

$

0.99

Year Ended

Six Months Ended

Fiscal Years Ended

December 31, 

December 31, 

June 30,

June 30,


2022


2021


2021


2020

Revenue (Note 8)

$

603,206

$

342,952

$

615,856

$

498,819

Costs and expenses

Cost of sales (excludes depreciation, depletion and amortization)

94,642

52,329

92,898

83,890

General and administrative

34,612

15,163

28,387

30,195

Production taxes

7,021

4,412

6,743

3,824

Exploration costs

563

5,190

Depreciation, depletion and amortization

178,935

99,685

183,569

175,434

Impairment of royalty interests

4,287

1,341

Total costs and expenses

319,497

171,589

312,160

299,874

Gain on sale of Peak Gold JV interest

33,906

Operating income

283,709

171,363

337,602

198,945

Fair value changes in equity securities

(1,503)

(1,350)

6,017

1,418

Interest and other income

7,832

1,610

2,443

2,046

Interest and other expense

(17,170)

(2,787)

(6,419)

(9,813)

Income before income taxes

272,868

168,836

339,643

192,596

Income tax (expense) benefit

(32,926)

(30,008)

(36,867)

3,654

Net income and comprehensive income

239,942

138,828

302,776

196,250

Net (income) loss and comprehensive (income) loss attributable to non-controlling interests

(960)

(489)

(244)

3,093

Net income and comprehensive income attributable to Royal Gold common stockholders

$

238,982

$

138,339

$

302,532

$

199,343

Net income per share attributable to Royal Gold common stockholders:

Basic earnings per share

$

3.64

$

2.11

$

4.61

$

3.04

Basic weighted average shares outstanding

65,576,995

65,560,468

65,546,400

65,523,024

Diluted earnings per share

$

3.63

$

2.10

$

4.60

$

3.03

Diluted weighted average shares outstanding

65,661,748

65,624,567

65,627,591

65,643,390

Cash dividends declared per common share

$

1.425

$

0.65

$

1.18

$

1.11

The accompanying notes are an integral part of these consolidated financial statements.

4486

Table of Contents

ROYAL GOLD, INC.

Consolidated Statements of Changes in Equity

For the Years Ended June 30, 2020, 2019 and 2018

(In thousands, except share data)

��

Royal Gold Stockholders

Royal Gold Stockholders

Accumulated

Additional

Other

Additional

Common Shares

Paid-In

Comprehensive

Accumulated

Non-controlling

Total

Common Shares

Paid-In

Accumulated

Non-controlling

Total

Shares

Amount

Capital

Income (Loss)

(Losses) Earnings

Interests

Equity

Shares

Amount

Capital

(Losses) Earnings

Interests

Equity

Balance at June 30, 2017


65,179,527

$

652


$

2,185,796

$

879

$

88,050

$

44,887

$

2,320,264

Stock-based compensation and related share issuances


180,514


2


4,236


4,238

Distributions from non-controlling interests


2,580


432


3,012

Net loss


(113,134)


(6,217)


(119,351)

Other comprehensive loss


(2,080)


(2,080)

Dividends declared


(64,814)


(64,814)

Balance at June 30, 2018


65,360,041

$

654


$

2,192,612

$

(1,201)

$

(89,898)

$

39,102

$

2,141,269

Stock-based compensation and related share issuances


80,451


1


5,021


5,022

Distributions from (to) non-controlling interests


4,140


(584)


3,556

Net income (loss)


93,825


(4,746)


89,079

Other comprehensive income (loss)


1,201


(1,201)


Dividends declared


(68,473)


(68,473)

Balance at June 30, 2019


65,440,492

$

655


$

2,201,773

$

$

(65,747)

$

33,772

$

2,170,453


65,440,492

$

655


$

2,201,773

$

(65,747)

$

33,772

$

2,170,453

Stock-based compensation and related share issuances


90,796


4,936


4,936


90,796


4,936


4,936

Distributions from (to) non-controlling interests


3,720


(777)


2,943


3,720


(777)


2,943

Net income (loss)


199,343


(3,093)


196,250


199,343


(3,093)


196,250

Dividends declared


(72,463)


(72,463)


(72,463)


(72,463)

Balance at June 30, 2020


65,531,288

$

655


$

2,210,429

$

$

61,133

$

29,902

$

2,302,119


65,531,288

$

655


$

2,210,429

$

61,133

$

29,902

$

2,302,119

Stock-based compensation and related share issuances


19,773


1


4,263


4,264

Sale of Peak Gold JV interest

(10,829)

(16,218)

(27,047)

Distributions to non-controlling interests


(1,281)


(1,281)

Net income


302,532


244


302,776

Dividends declared


(77,416)


(77,416)

Balance at June 30, 2021


65,551,061

$

656


$

2,203,863

$

286,249

$

12,647

$

2,503,415

Stock-based compensation and related share issuances


13,303


2,296


2,296

Distributions to non-controlling interests


(669)


(669)

Net income


138,339


489


138,828

Dividends declared


(42,659)


(42,659)

Balance at December 31, 2021


65,564,364

$

656


$

2,206,159

$

381,929

$

12,467

$

2,601,211

Stock-based compensation and related share issuances


28,233


6,964


6,964

Distributions to non-controlling interests


(1,051)


(1,051)

Net income


238,982


960


239,942

Dividends declared


(93,597)


(93,597)

Balance at December 31, 2022


65,592,597

$

656


$

2,213,123

$

527,314

$

12,376

$

2,753,469

The accompanying notes are an integral part of these consolidated financial statements.

4587

Table of Contents

ROYAL GOLD, INC.

Consolidated Statements of Cash Flows

For the Years Ended June 30,

(In thousands)

Year Ended

June 30, 

June 30, 

June 30, 


2020


2019


2018

Cash flows from operating activities:

Net income (loss)

$

196,250

$

89,079

$

(119,351)

Adjustments to reconcile net income (loss) to net cash provided by operating activities:

Depreciation, depletion and amortization

175,434

163,056

163,696

Amortization of debt discount and issuance costs

1,136

15,288

15,046

Non-cash employee stock compensation expense

9,116

6,617

8,279

Fair value changes in equity securities

(1,418)

6,800

Deferred tax benefit

(32,399)

(1,745)

(32,843)

Impairment of royalty interests

1,341

239,364

Other

(148)

(2)

(197)

Changes in assets and liabilities:

Royalty receivables

(6,957)

5,623

530

Stream inventory

(291)

(2,069)

(1,428)

Income tax receivable

268

(2,663)

22,130

Prepaid expenses and other assets

(7,828)

2,793

2,813

Accounts payable

(275)

(6,426)

5,173

Income tax payable

6,349

(11,281)

12,601

Uncertain tax positions

(11,146)

3,180

7,767

Other liabilities

11,320

(15,084)

5,244

Net cash provided by operating activities

$

340,752

$

253,166

$

328,824

Cash flows from investing activities:

Acquisition of stream and royalty interests

(155,985)

(1,055)

(11,812)

Repayment of Golden Star term loan

20,000

Purchase of equity securities

(461)

(3,573)

(17,869)

Other

3,587

(967)

(909)

Net cash used in investing activities

$

(152,859)

$

(5,595)

$

(10,590)

Cash flows from financing activities:

Repayment of debt

(115,000)

(370,000)

(250,000)

Borrowings from revolving credit facility

200,000

220,000

Net payments from issuance of common stock

(4,180)

(1,595)

(4,042)

Common stock dividends

(71,471)

(67,477)

(64,118)

Contributions from non-controlling interest

3,720

4,140

Other

(1,309)

(1,914)

2,829

Net cash provided by (used in) financing activities

$

11,760

$

(216,846)

$

(315,331)

Net increase (decrease) in cash and equivalents

199,653

30,725

2,903

Cash and equivalents at beginning of period

119,475

88,750

85,847

Cash and equivalents at end of period

$

319,128

$

119,475

$

88,750

Year Ended

Six Months Ended

Fiscal Years Ended

December 31, 

December 31, 

June 30,

June 30,


2022


2021


2021


2020

Cash flows from operating activities:

Net income and comprehensive income

$

239,942

$

138,828

$

302,776

$

196,250

Adjustments to reconcile net income and comprehensive income to net cash provided by operating activities:

Depreciation, depletion and amortization

178,935

99,685

183,569

175,434

Gain on sale of Peak Gold JV interest

(33,906)

Non-cash employee stock compensation expense

8,411

3,218

5,730

9,116

Fair value changes in equity securities

1,503

1,350

(6,017)

(1,418)

Deferred tax (benefit) expense

(19,836)

2,510

456

(32,399)

Impairment of royalty interests

4,287

1,341

Other

979

1,090

971

988

Changes in assets and liabilities:

Royalty receivables

4,683

(6,846)

(19,552)

(6,957)

Stream inventory

(1,049)

6,077

(6,014)

(291)

Income tax receivable

1,849

(396)

(2,085)

268

Prepaid expenses and other assets

(3,908)

(1,374)

318

(7,828)

Accounts payable

211

76

3,237

(275)

Income tax payable

(3,005)

4,591

1,156

6,349

Uncertain tax positions

(910)

(24,518)

(11,146)

Other liabilities

4,343

884

1,030

11,320

Net cash provided by operating activities

$

417,345

$

248,783

$

407,151

$

340,752

Cash flows from investing activities:

Acquisition of stream and royalty interests

(922,155)

(281,066)

(168,147)

(155,985)

Khoemacau subordinated debt facility

(7,000)

(18,000)

Proceeds from sale of Peak Gold JV interest

49,154

Proceeds from sale of Contango shares

12,146

Proceeds from sale of equity securities

8,651

Other

(721)

(64)

(541)

3,126

Net cash used in investing activities

$

(922,876)

$

(288,130)

$

(116,737)

$

(152,859)

Cash flows from financing activities:

Repayment of debt

(125,000)

(100,000)

(305,000)

(115,000)

Borrowings from revolving credit facility

700,000

100,000

200,000

Net payments from issuance of common stock

(1,447)

(921)

(1,465)

(4,180)

Common stock dividends

(91,925)

(39,374)

(76,099)

(71,471)

Other

(1,062)

(2,723)

(1,062)

2,411

Net cash provided by (used in) financing activities

$

480,566

$

(43,018)

$

(383,626)

$

11,760

Net (decrease) increase in cash and equivalents

(24,965)

(82,365)

(93,212)

199,653

Cash and equivalents at beginning of period

143,551

225,916

319,128

119,475

Cash and equivalents at end of period

$

118,586

$

143,551

$

225,916

$

319,128

See Note 1112 for supplemental cash flow information.

The accompanying notes are an integral part of these consolidated financial statements.

4688

Table of Contents

ROYAL GOLD, INC.

NOTES TO CONSOLIDATED FINANCIAL STATEMENTS

1. THE COMPANY

Royal Gold, Inc. (“Royal Gold”, the “Company”, “we”, “us”, or “our”), together with its subsidiaries, is engaged in the business of acquiring and managing precious metals streams, royalties and similar interests. We seek to acquire existing stream and royalty interests or to finance projects that are in production or in the development (and exploration) stage in exchange for stream or royalty interests. A metal stream is a purchase agreement that provides, in exchange for an upfront deposit payment, the right to purchase all or a portion of 1one or more metals produced from a mine at a price determined for the life of the transaction by the purchase agreement. Royalties are non-operating interests in mining projects that provide the right to revenue or metals produced from the project after deducting specified costs, if any.

2. SUMMARY OF SIGNIFICANT ACCOUNTING POLICIES AND RECENTLY ADOPTED AND RECENTLY ISSUED ACCOUNTING PRONOUNCEMENTS

Summary of Significant Accounting Policies

Use of Estimates

The preparation of our financial statements in conformity with U.S. generally accepted accounting principles (“U.S. GAAP”) requires us to make estimates and assumptions that affect the reported amounts of assets and liabilities, and disclosure of contingent assets and liabilities at the dates of the financial statements, and the reported amounts of revenues and expenses during the reporting periods. Actual results could differ significantly from those estimates.

We rely on mineral reserve and mineral resource estimates reported by the operators of properties on which we hold stream and royalty interests. These estimates and the underlying assumptions affect the potential impairments of long-lived assets and the ability to realize income tax benefits associated with deferred tax assets. These estimates and assumptions also affect the rate at which we recognize revenue or charge depreciation, depletion and amortization to earnings. On an ongoing basis, management evaluates these estimates and assumptions; however, actual amounts could differ from these estimates and assumptions. Differences between estimates and actual amounts are adjusted and recorded in the period that the actual amounts are known.

Basis of Consolidation

The consolidated financial statements include the accounts of Royal Gold, Inc., its whollymajority owned subsidiaries and an entity over which control is achieved through means other than voting rights.or controlled subsidiaries. All intercompany accounts, transactions, income and expenses, and profits or losses have been eliminated on consolidation.

Peak Gold JV

Royal Gold, through its wholly owned subsidiary, Royal Alaska, LLC (“Royal Alaska”), and Contango ORE, Inc., through its wholly owned subsidiary CORE Alaska, LLC, entered into a limited liability company agreement for the Peak Gold JV, a joint venture for exploration and advancement of the Peak Gold Project located near Tok, Alaska. We havepreviously identified the Peak Gold JV as a Variable Interest Entity, with Royal Alaska as the primary beneficiary, due to the legal structure and certain related factors of the limited liability company agreement for the Peak Gold JV. Wewe determined that the Peak Gold JV should be fully consolidated at fair value initially. The fair value ofconsolidated. On September 30, 2020, we sold our non-controlling interest is $45.7 million and is based on the underlying value of the mineral property assigned to the Peak Gold JV interest, which is recorded as an exploration stage property within Stream and royalty interests, net ondiscussed in Note 3 of our notes to consolidated balance sheets.

As of June 30, 2020, and 2019, Royal Alaska held a 40% membership interest in the Peak Gold JV. Royal Alaska acts as the manager of the Peak Gold JV and will be responsible for managing, directing and controlling the overall operations

47

Table of Contents

ROYAL GOLD, INC.

NOTES TO CONSOLIDATED FINANCIAL STATEMENTS (Continued)

unless Royal Alaska is unanimously removed or resigns that position in the manner provided in the Peak Gold JV limited liability company agreement.financial statements.

Cash and Equivalents

Cash and equivalents consist of all cash balances and highly liquid investments with an original maturity of three months or less. Cash and equivalents were primarily held in cash deposit accounts as of June 30, 2020December 31, 2022 and 2019.2021.

Stream and Royalty Interests in Mineral Properties and Related Depletion

Stream and royalty interests include acquired stream and royalty interests in production, development and exploration stage properties. The costs of acquired stream and royalty interests are capitalized as tangible assets as such interests do not meet the definition of a financial asset under U.S. GAAP.asset.

89

Table of Contents

ROYAL GOLD, INC.

NOTES TO CONSOLIDATED FINANCIAL STATEMENTS (Continued)

Production stage stream and royalty interests are depleted using the units of production method over the life of the mineral property (as stream sales occur or royalty payments are recognized), which are estimated using proven and probable reserves as provided by the operator. Development stage mineral properties, which are not yet in production, are not depleted until the property begins production. Exploration stage mineral properties, where there are no proven and probable reserves, are not depleted. At such time as the associated exploration stage mineral interests are converted to proven and probable reserves, and there is no production, the mineral property is depleted over its life, using proven and probable reserves.becomes a development stage mineral property. Exploration costs are expensed when incurred.

Asset Impairment

We evaluate long-lived assets for impairment whenever events or changes in circumstances indicate that the related carrying amounts of an asset or group of assets may not be recoverable. When impairment indicators are identified, the recoverability of the carrying value of stream and royalty interests in production and development stage mineral properties is evaluated based upon estimated future undiscounted net cash flows from each stream and royalty interest using estimates of proven and probable mineral reserves, mineral resources and other relevant information received from the operators. We evaluate the recoverability of the carrying value of royalty interests in exploration stage mineral properties in the event of significant decreases in the price of gold, silver, copper and other metals, and whenever new information regarding the mineral properties is obtained from the operator indicating that production will not likely occur or may be reduced in the future, thus potentially affecting the future recoverability of our stream or royalty interests. Impairments in the carrying value of each property are measured and recorded to the extent that the carrying value in each property exceeds its estimated fair value, which is generally calculated using estimated future discounted cash flows.

Estimates of gold, silver, copper, and other metal prices, and operators’ estimates of proven and probable mineral reserves or mineralized materialmineral resources related to our stream or royalty properties are subject to certain risks and uncertainties which may affect the recoverability of our investment in these stream and royalty interests in mineral properties. It is possible that changes could occur to these estimates, which could adversely affect the net cash flows expected to be generated from these stream and royalty interests. Refer to Note 4 for discussion and the results of our impairment assessments for the year ended December 31, 2022, six months ended December 31, 2021, and fiscal years ended June 30, 2020, 20192021, and 2018.2020.

Revenue

Under U.S. GAAP, aA performance obligation is a promise in a contract to transfer control of a distinct good or service (or integrated package of goods and/or services) to a customer. A contract’s transaction price is allocated to each distinct performance obligation and recognized as revenue when, or as, a performance obligation is satisfied. In accordance with this guidance, revenue attributable to our stream interests and royalty interests is generally recognized at the point in time that control of the related metal production transfers to our customers. The amount of revenue we recognize further reflects

48

Table of Contents

ROYAL GOLD, INC.

NOTES TO CONSOLIDATED FINANCIAL STATEMENTS (Continued)

the consideration to which we are entitled under the respective stream or royalty agreement. A more detailed summary of our revenue recognition policies for our stream and royalty interests is discussed in Note 7.8.

Metal Sales

Gold, silver and copper received under our metal streamingstream agreements are taken into inventory, and then sold primarily using average spot rate gold, silver and copper forward contracts. The sales price for these average spot rate forward contracts is determined by the average daily gold, silver or copper spot prices during the term of the contract, typically a consecutive number of trading days between 10 days and three months (depending on the frequency of deliveries under the respective streamingstream agreement and our sales activity in effect at the time) commencing shortly after receipt and purchase of the metal. Revenue from gold, silver and copper sales is recognized on the date of the settlement, which is also the date that title to the metal passes to the purchaser.

90

Table of Contents

ROYAL GOLD, INC.

NOTES TO CONSOLIDATED FINANCIAL STATEMENTS (Continued)

Cost of Sales

Cost of sales, which excludes depreciation, depletion and amortization, is specific to our stream agreements and is the result of our purchase of gold, silver and copper for a cash payment. The cash payment for gold from Mount Milligan is the lesser of $435 per ounce or the prevailing market price of gold when purchased, while the cash payment for our other streams is a set contractual percentage of the gold, silver or copper spot price near the date of metal delivery.

Production Taxes

Certain royalty payments are subject to production taxes (or mining proceeds taxes), which are recognized at the time of revenue recognition. Production taxes are not income taxes and are included within the costs and expenses section in our consolidated statements of operations and comprehensive income (loss).

Exploration Costs

Exploration costs are specific to the Peak Gold JV for the exploration and advancement of the Peak Gold Project, as discussed further above under Basis of Consolidation. Costs associated with the Peak Gold JV for the exploration and advancement of the Peak Gold Project are expensed when incurred.income.

Stock-Based Compensation

We recognize all share-based payments to employees, including grants of employee stock options, stock-settled stock appreciation rights (“SSARs”), restricted stock and performance shares, in our financial statements based upon their fair values.

Income Taxes

Our annual tax rate is based on income, statutory tax rates in effect, and tax planning opportunities available to us in the various jurisdictions in which we operate. Significant judgment is required in determining the annual tax expense, current tax assets and liabilities, deferred tax assets and liabilities, and our future taxable income, both as a whole and in various tax jurisdictions, for purposes of assessing our ability to realize future benefit from our deferred tax assets. Actual income taxes could vary from these estimates due to future changes in income tax law, significant changes in the jurisdictions in which we operate or unpredicted results from the final determination of each year’s liability by taxing authorities.

We treat global intangible low-taxed income (“GILTI”) as a period cost and therefore do not record deferred tax impacts of GILTI in our consolidated financial statements. Our deferred income taxes reflect the impact of temporary differences between the reported amounts of assets and liabilities for financial reporting purposes and such amounts measured by tax laws and regulations. In evaluating the realizability of the deferred tax assets, management considers both positive and negative evidence that may exist, such as earnings history, reversal of taxable temporary differences, forecasted operating earnings and available tax planning

49

Table of Contents

ROYAL GOLD, INC.

NOTES TO CONSOLIDATED FINANCIAL STATEMENTS (Continued)

strategies in each tax jurisdiction. A valuation allowance may be established to reduce our deferred tax assets to the amount that is considered more likely than not to be realized through the generation of future taxable income and other tax planning strategies.

Our operations may involve dealing with uncertainties and judgments in the application of complex tax regulations in multiple jurisdictions. The final taxes paid are dependent upon many factors, including negotiations with taxing authorities in various jurisdictions and resolution of disputes arising from federal, state, and international tax audits. We recognize potential liabilities and recordsrecord tax liabilities for anticipated tax audit issues in the United States and other tax jurisdictions based on our estimate of whether, and the extent to which, additional taxes will be due. We adjust these reserves in light of changing facts and circumstances, such as the progress of a tax audit; however, due to the complexity of some of these uncertainties, the ultimate resolution could result in a payment that is materially different from our current estimate of the tax liabilities. These differences will be reflected as increases or decreases to income tax expense in the period which they are determined. We recognize interest and penalties, if any, related to unrecognized tax benefits in income tax expense.

Earnings per Share

Basic earnings (loss) per share is computed by dividing net income (loss) available to Royal Gold common stockholders by the weighted average number of outstanding common shares for the period, considering the effect of participating securities.

91

Table of Contents

ROYAL GOLD, INC.

NOTES TO CONSOLIDATED FINANCIAL STATEMENTS (Continued)

Diluted earnings (loss) per share reflect the potential dilution that could occur if securities or other contracts that may require issuance of common shares were converted. Diluted earnings (loss) per share is computed by dividing net income (loss) available to common stockholders by the diluted weighted average number of common shares outstanding during each fiscal year.period.

Recently Adopted and Recently Issued Accounting Standards

Recently Adopted

Leases

In February 2016,We have evaluated all the recently issued, but not yet effective, accounting standards that have been issued or proposed by the Financial Accounting Standards Board (“FASB”) issued Accounting Standards Update (“ASU”) 2016-02, Leases (Topic 842), which requires recognitionor other standards-setting bodies through the filing date of right-of-use assetsthis Annual Report on Form 10-K and lease payment liabilitiesdo not believe the future adoption of any such standards will have a material impact on the balance sheet by lessees for all leases with terms greater than twelve months. Classificationour consolidated financial statements.

3. ACQUISITIONS AND DISPOSITIONS

Acquisition of leases as either a finance or operating lease will determine the recognition, measurement and presentation of expenses. ASU 2016-02 also requires certain quantitative and qualitative disclosures about material leasing arrangements.Additional Royalty Interests on Cortez Complex

Subsequently,On December 29, 2022, we acquired two portions of a gross smelter return royalty (the “Idaho Royalty”) that together cover a large area including the Cortez mine operational area and the entirety of the Fourmile development project in July 2018,Nevada (the “Cortez Complex”) from certain holders who are successors in interest to Idaho Mining Corporation for cash consideration of $204.1 million. The area within the FASB issued ASU No. 2018-11, Leases (Topic 842): Targeted ImprovementsCortez Complex is owned or controlled by Nevada Gold Mines LLC (“ASU 2018-11”NGM”). ASU 2018-11 provides an additional modified retrospective transition method for adopting ASU 2016-02,, a joint venture between Barrick Gold Corporation (“Barrick”) and Newmont Corporation, with the exception of the Fourmile development project which eliminatesis 100% owned and operated by Barrick. The Idaho Royalty comprises a 0.24% gross royalty that covers areas including the need for adjusting prior period comparable financial statements prepared under legacy lease accounting guidance.Pipeline and Crossroads deposits and a 0.45% gross royalty that covers areas including the Cortez Hills, Goldrush, Fourmile and Robertson deposits. The Idaho Royalty is life of mine, not subject to any stepdowns or caps, and has no applicable deductions. The purchase price was funded with our available revolving credit facility (Note 6) and cash on hand.

ASU 2016-02, together with ASU 2018-11,The economic effective date for the transaction was effective JulyDecember 1, 2019. We adopted2022, and revenue of $0.7 million on production of approximately 116,000 ounces attributable to the new guidance usingroyalty was recognized in the modified retrospective approach set forth in ASU 2018-11, withfourth quarter of 2022. 

The acquisition has been accounted for as an asset acquisition and the $204.1 million cash consideration, plus direct acquisition costs, have been recorded and allocated between production and exploration stage royalty interests (Note 4) within Stream and royalty interests, net on our consolidated balance sheets. On the date of initial applicationacquisition, $73.4 million and $130.7 million was allocated to production stage and exploration stage royalty interests, respectively. The acquisition cost of the production stage portion of the Idaho Royalty will be depleted using the units of production method, which is estimated using aggregate proven and probable reserves, as provided by NGM.

Acquisition of Great Bear Royalties Corp.

On September 9, 2022, we completed the acquisition of all of the issued and outstanding shares of Great Bear Royalties Corp. (“GBR”) for cash consideration of approximately C$199.6 million (US$151.7 million) (“the Acquisition Price”). GBR’s sole material asset is a 2.0% net smelter return royalty (“Great Bear Royalty”) that covers the entirety of the Great Bear Project in the Red Lake district of Ontario, Canada, owned and operated by a subsidiary of Kinross Gold Corporation (“Kinross”). The Great Bear Royalty includes all metals produced from contiguous claims covering 9,140 hectares. Royalty payments will be made quarterly with applicable standard deductions. The purchase price was funded with available cash on July 1, 2019. Comparative reporting periods were not adjusted upon adoption.hand.

As permitted underpart of the transition guidance,acquisition and in exchange for information and access to the project provided by Kinross, we electedgranted an option (“Buyback Option”) to useKinross to purchase a 25% interest in the following practical expedientsGreat Bear Royalty (0.5% of the 2.0% royalty rate) for an amount equal to 25% of the Acquisition Price, adjusted for inflation, at transition:

To not reassess whether any expired or existing contracts were or contained leases; and
To not reassess the lease classification for any expired or existing leases.

any time from the transaction closing

5092

Table of Contents

ROYAL GOLD, INC.

NOTES TO CONSOLIDATED FINANCIAL STATEMENTS (Continued)

In addition, we elected to usedate until the following practical expedients atearlier of a construction decision for the Great Bear Project and subsequent to adoption in accordance10 years after the transaction closing date. The fair value of the Buyback Option on the transaction date using a Black-Scholes model was $2.1 million. The Buyback Option has been capitalized as a direct transaction cost with ASU 2016-02:

Not to separate non-lease from lease components, and instead account for each lease component and any associated non-lease components as a single lease component; and
Not to recognize right-of-use assets and associated liabilities for short-term contracts with lease terms of 12 months or less.

Our significant lease arrangements relate to our corporate office spacesthe Great Bear Royalty mineral interest and office equipment. Throughwill not be subsequently remeasured until the implementation process, we evaluated our lease arrangements, which included an analysis of contracts, and updating the internal controls and processes that are necessary to track and calculate the additional accounting and disclosure requirements as required upon adoption of ASU 2016-02.Buyback Option is either exercised or it expires.

We lease office spaceThe Great Bear Royalty is the sole material asset of GBR and office equipment under operating leases expiring at various dates throughrepresents substantially all the fiscal year ending June 30, 2030. The following amounts were recorded infair value of GBR’s gross assets. As a result, the consolidated balance sheets at June 30, 2020 (amounts in thousands):GBR acquisition has been accounted for as an asset acquisition and the fair values of the GBR assets acquired are shown below:

Classification

June 30, 2020

Operating Leases

Right-of-use assets - current


Prepaid expenses and other


$

823

Right-of-use assets - non-current

Other assets

7,087

Total right-of-use assets

$

7,910

Lease liabilities - current

Other current liabilities

$

901

Lease liabilities - non-current

Other long-term liabilities

8,309

Total operating lease liabilities

$

9,210

(in thousands)

Purchase Price

$

151,679

Cash

315

Other assets

293

Royalty interests in mineral property (Great Bear royalty)

151,071

Total allocated purchase price

$

151,679

MaturitiesThe $151.7 million allocated fair value of operating lease liabilities at June 30, 2020 arethe Great Bear Royalty, plus $4.4 million of direct transaction costs and deferred tax of $53.6 million have been capitalized with the Great Bear Royalty mineral interest and allocated to exploration stage royalty interests within Stream and royalty interests, net on our consolidated balance sheets. The deferred tax was recorded as follows (amounts in thousands):a gross-up to the Great Bear Royalty mineral interest as prescribed by the applicable guidance.

Fiscal Years:

Operating Leases

2021

$

1,121

2022

1,119

2023

1,106

2024

1,116

2025

1,091

Thereafter

4,799

Total lease payments

$

10,352

Less imputed interest

(1,142)

Total

$

9,210

Acquisition of Gross Royalty on Cortez Complex

Other information pertaining to leases consistOn August 2, 2022, we acquired a sliding scale gross royalty (the “Rio Tinto Royalty”) on production from an area within the Cortez Complex for cash consideration of $525 million. The area within the Cortez Complex is owned or controlled by NGM, with the exception of the following:Fourmile development project which is 100% owned and operated by Barrick. The royalty is a life of mine sliding scale gross royalty payable at a rate of 0% at a gold price less than $400 per ounce, increasing to 3% at a gold price above $900 per ounce, and is payable on 40% of all production from the Cortez Complex. Based on information available, the royalty would not cover the existing deposits within the Robertson property. At current gold prices the Rio Tinto Royalty is an effective 1.2% gross royalty on the Cortez Complex and is not subject to any stepdowns or caps. Deductions from the Rio Tinto Royalty payments are limited to third-party royalties that existed prior to the creation of the royalty in 2008, which include the existing Crossroads and Pipeline royalties owned by Royal Gold.The purchase price was funded with debt and available cash on hand.

The acquisition has been accounted for as an asset acquisition and the $525 million cash consideration, plus direct acquisition costs, have been recorded and allocated between production and exploration stage royalty interests (Note 4) within Stream and royalty interests, net on our consolidated balance sheets. On the date of acquisition, $199 million and $326 million was allocated to production stage and exploration stage royalty interests, respectively. The acquisition cost of the production stage Rio Tinto Royalty will be depleted using the units of production method, which is estimated using aggregate proven and probable reserves, as provided by NGM.

June 30, 2020

Operating Lease Term and Discount Rate

Weighted average remaining lease term in years

9

Weighted average discount rate

2.5%

The royalty became payable during the quarter ended September 30, 2022, after cumulative production of 15 million gold equivalent ounces from the Cortez Complex from a starting date of January 1, 2008. The royalty is payable within forty-five days after the end of each calendar quarter.

Lawyers Royalty Acquisition

On March 24, 2022, we acquired a 0.5% net smelter returns royalty (“NSR”) on production from the Lawyers Project, currently operated by Benchmark Metals Inc., which is located in British Columbia, Canada. As part of this transaction, we also acquired a right of first offer (“ROFO”) for an existing 2.0% NSR royalty over the Ranch Project owned by Thesis Gold, Inc. that is located adjacent to the Lawyers Project. We did not have any finance leases as of June 30, 2020. The adoption of ASU 2016-02 did not impact accumulated earnings (losses), our consolidated statements of operationspaid $8.0 million in cash consideration for the royalty and comprehensive income (loss), or our consolidated statements of cash flows.

5193

Table of Contents

ROYAL GOLD, INC.

NOTES TO CONSOLIDATED FINANCIAL STATEMENTS (Continued)

Recently Issued

In June 2016, the FASB issued ASU No. 2016-13, Financial Instruments-Credit Losses (Topic 326): Measurement of Credit Losses of Financial Instruments, which, together with subsequent amendments, changes howROFO to Guardsmen Resources Inc. The Lawyers Project acquisition has been accounted for as an entity will record credit losses from an “incurred loss” approach to an “expected loss” approach. This update is effective for annual periods beginning after December 15, 2019 (i.e. July 1, 2020 for Royal Gold) and interim financial statement periods within those years, with early adoption permitted. We are currently undergoing our assessment of the new guidance and the impact it will have on our consolidated financial statements and related disclosures. Based on procedures performed as of June 30, 2020, the adoption of the new guidance effective July 1, 2020 is not expected to have a material impact on the Company’s consolidated financial statements.

3. ACQUISITIONS

Alturas royalty acquisition

On January 29, 2020, we entered into an agreement with various private individuals for the acquisition of a net smelter return (“NSR”) royalty of up to 1.06% (gold) and up to 1.59% (copper) on mining concessions included as part of the Alturas project, which is located within the Coquimbo Region of Chile and held by Compañia Minera Salitrales Limitada, a subsidiary of Barrick Gold Corporation (“Barrick”). Totalasset acquisition. The $8.0 million cash consideration, for the royalty is up to $41 million, of which $11 million was paid on January 29, 2020.  The $11 million paid as part of the funding schedule, plus direct acquisition costs, have been recorded as an exploration stage royalty interest within Stream and royalty interests, net on our consolidated balance sheets. A future payment of up to $20 million is conditioned based on a project construction decision by Barrick and the size of the minable mineralized material on the date of the construction decision. A further future payment of up to $10 million will be made upon first production from the mining concessions.

Castelo de Sonhos royalty acquisition

In August 2019, we entered into an agreement with TriStar Gold Inc. and its subsidiaries (together “TriStar”) to acquire (i) up to a 1.5% NSR royalty on the Castelo de Sonhos gold project (“CDS”), located in Brazil, and (ii) warrants to purchase up to 19,640,000 common shares of TriStar. Total consideration is $7.5 million and is payable over 3 payments, of which $4.5 million was paid in August 2019, $1.5 million was paid in November 2019, and the final payment of $1.5 million was paid on March 30, 2020.

The CDS royalty acquisition has been accounted for as an asset acquisition. The $7.5 million paid as part of the aggregate funding schedule, plus direct acquisition costs, have been recorded as an exploration stage royalty interest(Note 4) within Stream and royalty interests, net on our consolidated balance sheets.

The warrants have been recorded within Other assets on our consolidated balance sheets and have a carrying value of approximately $4.0 million as of June 30, 2020. The warrants have been classified as a financial asset instrument and are recorded at fair value at each reporting date using the Black-Scholes model. Any change in fair value of the warrants at subsequent reporting periods will be recorded within Fair value changes in equity securities on our consolidated statements of operations and comprehensive income. As of June 30, 2020, the Company holds 19,640,000 warrants at an exercise price of C$0.25 per common share with a term of approximately five years.

Acquisition of Silver Stream on Khoemacau Copper ProjectSilver Stream

On February 25, 2019,23, 2022, we made an advance payment of $10.0 million toward the option stream which increased our wholly owned subsidiary, RGLD Gold AG (“RGLD Gold”), entered into a life of mine purchase and sale agreement withright to receive payable silver produced from Khoemacau Copper Mining (Pty.) Limited (“KCM”) forfrom 90% to 93%, and on March 14, 2022, we made our final advance payment of $16.5 million toward the purchase ofoption stream which increased our right to receive payable silver produced from 93% to 100%. Cumulative advance payments of $265 million, plus direct acquisition costs, have been recorded as a production stage stream interest within Stream and royalty interests, net on our consolidated balance sheets.

As of December 31, 2022, $25.0 million of the subordinated debt facility, and $5.5 million of accrued interest remains outstanding on the Khoemacau Projectsubordinated debt facility, and these amounts are included in Other assets in our consolidated balance sheets.

Red Chris Royalty Acquisition

On August 11, 2021, we acquired a 1.0% NSR royalty covering approximately 5,100 hectares, which includes the currently known mineralization and prospective exploration areas of the Red Chris Mine in British Columbia, Canada. We paid $165 million in cash consideration for the royalty to Glencore Canada Corporation, a wholly owned subsidiary of Glencore International AG.

The Red Chris Mine is an operating open pit mine producing gold, copper and silver, and is located on the northern edge of the Skeena Mountains. The mine is owned and operated by a joint venture, which is owned 70% by Newcrest Mining Ltd. (“Khoemacau” orNewcrest”) and 30% by Imperial Metals Corporation, in which Newcrest is the “Project”operator.

The Red Chris royalty acquisition has been accounted for as an asset acquisition. The $165 million cash consideration, plus direct acquisition costs, have been recorded and allocated between production and exploration stage royalty interests (Note 4) within Stream and royalty interests, net on our consolidated balance sheets. On the date of acquisition, $116.2 million and $48.9 million was allocated to production stage and exploration stage royalty interests, respectively. The acquisition cost of the production stage Red Chris royalty will be depleted using the units of production method, which is estimated using aggregate proven and probable reserves, as provided by Newcrest.

Xavantina (formerly “NX Gold Mine”) locatedGold Stream Acquisition

On June 30, 2021, we announced that we entered into a precious metals purchase agreement for gold produced from the operating underground Xavantina mine in BotswanaBrazil (“Xavantina Stream”) with Ero Gold Corporation, a wholly owned subsidiary of Ero Copper Corporation, and owned by KCM.  Undercertain of its affiliates (together, “Ero”).

On August 6, 2021, we made an advance payment of $100 million upon closing the transaction. In exchange for the consideration provided, we will receive 25% of the gold produced from the Xavantina mine until the delivery of 93,000 ounces, and 10% thereafter. We will pay 20% of the spot gold price for each ounce delivered until the delivery of 49,000 ounces, and 40% of the spot gold price thereafter. Per the purchase and sale agreement, subjectwe may make up to the satisfactionan additional $10 million of certain conditions, RGLD Gold will make advance payments totaling $212from the beginning of calendar 2022 through the end of calendar 2024 based on Ero meeting success-based targets related to regional exploration and mineral resource additions. As of December 31, 2022, we have made $3.2 million of additional advance payments to Ero and $6.8 million of additional advance payments remain.

The Xavantina Stream has been accounted for as an asset acquisition. The $100 million advance payment, plus direct acquisition costs, have been recorded and allocated between production and exploration stage stream interests (Note 4) within Stream and royalty interests, net on our consolidated balance sheets. On the date of acquisition, $54.9 million and

5294

Table of Contents

ROYAL GOLD, INC.

NOTES TO CONSOLIDATED FINANCIAL STATEMENTS (Continued)

$45.1 million toward the purchase of 80%was allocated to production stage and exploration stage royalty interests, respectively. The acquisition cost of the silver produced from Khoemacau until certain delivery thresholds are met (the “Base Silver Stream”). At KCM’s optionproduction stage Xavantina Gold Stream will be depleted using the units of production method, which is estimated using aggregate proven and subject to various conditions, RGLD Gold will make up to an additional $53 million in advance payments for up to the remaining 20% of the silver produced from Khoemacau (the “Option Silver Stream”). The stream rate will drop to 40% of silver produced from Khoemacau following delivery to RGLD Gold of 32 million silver ounces under the Base Silver Stream, or to 50% of the silver produced from Khoemacau following delivery of 40 million silver ounces to RGLD Gold should KCM exercise the entire Option Silver Stream. RGLD Gold will pay a cash price equal to 20% of the spot silver price for each ounce delivered under the Base Silver Stream and Option Silver Stream; however, if KCM achieves mill expansion throughput levels above 13,000 tonnes per day (30% above current mill design capacity), RGLD Gold will pay a higher ongoing cash price under the Base Silver Stream and Option Silver Stream for silver ounces delivered in excess of specific annual thresholds.probable reserves, as provided by Ero.

RGLDCôté Royalty Acquisition

On June 7, 2021, we acquired a 1.0% NSR royalty on certain claims covering the Côté Gold made its first advance paymentProject in Northern Ontario, Canada. The Côté Gold Project is owned 92.5% by the Côté Gold Joint Venture (a joint venture owned 70% by IAMGOLD Corporation and 30% by Sumitomo Metal Mining Co., Ltd.), and 7.5% by a third party. The royalty covers the Chester 3 claims, which in turn cover approximately 70% of $65.8the current reserves of the Côté Gold Project, as well as other areas outside the current project area. We acquired the royalty from a third-party royalty holder for $75 million on November 5, 2019, its second advance payment of $22.0 million on February 2, 2020, and its third advance payment of $47.9 million on April 3, 2020. On July 5, 2020, RGLD Gold made its fourth advance payment of $11.1 million, which brings the total contribution under the Base Silver Stream to $146.8 million. Further payments are subject to certain conditions and are scheduled to be made on a quarterly basis using an agreed formula and certification process as project spending progresses.in cash consideration.

Separate from the Base Silver Stream and Option Silver Stream, and subject to various conditions, RGLD Gold will make up to $25 million available to KCM toward the end of development of Khoemacau under a subordinated debt facility. Any amounts drawn by KCM under the debt facility will carry interest at LIBOR + 11% and have a term of seven years. RGLD Gold will have the right to force repayment of the debt facility upon certain events.

We haveThe Côté royalty acquisition has been accounted for the Silver Stream and Option Stream (if exercised by KCM) as an asset acquisition, consistent with the treatment of our other acquired streams.acquisition. The $135.7$75 million in advance payments for the Base Silver Stream made during our fiscal year 2020,paid, plus direct transactionacquisition costs, have been recorded and allocated between development and exploration stage royalty interest (Note 4) within Stream and royalty interest, net on our consolidated balance sheets.

Sale of Peak Gold JV Interest

On September 30, 2020, we entered into an agreement with an affiliate of Kinross Gold Corporation to sell our 40% membership interest in the Manh Choh Project (formerly known as the Peak Gold Project) for cash consideration of $49.2 million and to sell our 809,744 common shares in Contango Ore, Inc. (“Contango”), our partner in Peak Gold, LLC, the owner of the Manh Choh Project, for cash consideration of $12.1 million.

In addition to the total cash consideration of $61.3 million, we received the following royalty interests:

● An incremental 28% NSR royalty on silver produced from an area of interest which includes the current Manh Choh Project resource area. Peak Gold, LLC retains the right to acquire 50% of this royalty for consideration of $4.0 million; and

● An incremental 1% NSR royalty on certain State of Alaska mining claims acquired by a wholly owned subsidiary of Contango in the transaction, increasing our royalty on this area from 2% to 3%.

The royalties are recorded as development and exploration stage stream interest withinroyalty interests in Stream and royalty interests, net in our consolidated balance sheet as of December 31, 2022 and have a combined value of approximately $4.4 million. We recorded a gain of $33.9 million on the sale of our 40% membership interest in the Manh Choh Project during the three months ended September 30, 2020. The mark-to-market increase of $3.6 million on the sale of our 809,744 common shares in Contango is included in Fair value changes in equity securitieson our consolidated balance sheets asstatements of June 30, 2020.  Further advance payments made under the Silver Stream or Option Stream (if exercised by KCM) will be recorded as a development stage interest within Streamoperations and royalty interests, net on our consolidated balance sheetscomprehensive income and was recognized during the period the advance payment occurs.

three months ended September 30, 2020.

5395

Table of Contents

ROYAL GOLD, INC.

NOTES TO CONSOLIDATED FINANCIAL STATEMENTS (Continued)

4. STREAM AND ROYALTY INTERESTS, NET

The following summarizes our stream and royalty interests as of June 30, 2020December 31, 2022 and 2019:2021:

As of June 30, 2020 (Amounts in thousands):


Cost


Accumulated Depletion


Impairments


Net

As of December 31, 2022 (Amounts in thousands):


Cost


Accumulated Depletion


Impairments


Net

Production stage stream interests:

Mount Milligan

$

790,635

$

(236,352)

$

$

554,283

$

790,635

$

(392,804)

$

$

397,831

Pueblo Viejo

610,404

(203,935)

406,469

610,404

(289,537)

320,867

Andacollo

388,182

(110,521)

277,661

388,182

(151,870)

236,312

Khoemacau

265,911

(15,905)

250,006

Rainy River

175,727

(27,278)

148,449

175,727

(61,601)

114,126

Wassa

146,475

(67,619)

78,856

Other

215,576

(110,711)

104,865

Total production stage stream interests

2,111,423

(645,705)

1,465,718

2,446,435

(1,022,428)

1,424,007

Production stage royalty interests:

Cortez (Legacy Zone and CC Zone)

353,772

(35,276)

318,496

Voisey's Bay

205,724

(101,381)

104,343

205,724

(118,327)

87,397

Red Chris

116,187

(1,797)

114,390

Peñasquito

99,172

(44,614)

54,558

99,172

(57,772)

41,400

Holt

34,612

(23,851)

10,761

Cortez

80,681

(15,065)

65,616

Other

487,225

(403,080)

(1,341)

82,804

447,535

(398,513)

49,022

Total production stage royalty interests

907,414

(587,991)

(1,341)

318,082

1,222,390

(611,685)

610,705

Total production stage stream and royalty interests

3,018,837

(1,233,696)

(1,341)

1,783,800

3,668,825

(1,634,113)

2,034,712

Development stage stream interests:

Khoemacau

136,608

136,608

Other

12,037

12,037

12,038

12,038

Development stage royalty interests:

Côté

45,421

45,421

Other

70,952

70,952

74,225

74,225

Total development stage stream and royalty interests

219,597

219,597

131,684

131,684

Exploration stage stream interests:

Xavantina

34,253

34,253

Exploration stage royalty interests:

Cortez (Legacy Zone and CC Zone)

456,318

456,318

Great Bear

209,106

209,106

Pascua-Lama

177,690

177,690

177,690

177,690

Red Chris

48,895

48,895

Côté

29,610

29,610

Other

137,826

137,826

119,421

(4,287)

115,134

Total exploration stage royalty interests

315,516

315,516

Total exploration stage stream and royalty interests

1,075,293

(4,287)

1,071,006

Total stream and royalty interests, net

$

3,553,950

$

(1,233,696)

$

(1,341)

$

2,318,913

$

4,875,802

$

(1,634,113)

$

(4,287)

$

3,237,402

5496

Table of Contents

ROYAL GOLD, INC.

NOTES TO CONSOLIDATED FINANCIAL STATEMENTS (Continued)

As of June 30, 2019 (Amounts in thousands):


Cost


Accumulated Depletion


Net

Production stage stream interests:

Mount Milligan

$

790,635

$

(184,091)

$

606,544

Pueblo Viejo

610,404

(158,819)

451,585

Andacollo

388,182

(86,675)

301,507

Rainy River

175,727

(14,522)

161,205

Wassa

146,475

(56,919)

89,556

Total production stage stream interests

2,111,423

(501,026)

1,610,397

Total production stage stream and royalty interests

Production stage royalty interests:

Voisey's Bay

205,724

(95,564)

110,160

Peñasquito

99,172

(40,659)

58,513

Holt

34,612

(22,570)

12,042

Cortez

20,878

(12,362)

8,516

Other

487,224

(386,501)

100,723

Total production stage royalty interests

847,610

(557,656)

289,954

Total production stage stream and royalty interests

2,959,033

(1,058,682)

1,900,351

Development stage stream interests:

Other

12,038

12,038

Development stage royalty interests:

Cortez

59,803

59,803

Other

70,952

70,952

Total development stage royalty interests

130,755

130,755

Total development stage stream and royalty interests

142,793

142,793

Exploration stage royalty interests:

Pascua-Lama

177,690

177,690

Other

118,482

118,482

Total exploration stage royalty interests

296,172

296,172

Total stream and royalty interests, net

$

3,397,998

$

(1,058,682)

$

2,339,316

As of December 31, 2021 (Amounts in thousands):


Cost


Accumulated Depletion

Net

Production stage stream interests:

Mount Milligan

$

790,635

$

(336,921)

$

453,714

Pueblo Viejo

610,405

(260,321)

350,084

Andacollo

388,182

(139,035)

249,147

Khoemacau

239,411

(3,402)

236,009

Rainy River

175,727

(50,115)

125,612

Other

215,576

(89,108)

126,468

Total production stage stream interests

2,419,936

(878,902)

1,541,034

Production stage royalty interests:

Voisey's Bay

205,724

(113,602)

92,122

Red Chris

116,187

116,187

Peñasquito

99,172

(53,022)

46,150

Cortez

80,681

(23,225)

57,456

Other

447,799

(387,364)

60,435

Total production stage royalty interests

949,563

(577,213)

372,350

Total production stage stream and royalty interests

3,369,499

(1,456,115)

1,913,384

Development stage stream interests:

Other

12,037

12,037

Development stage royalty interests:

Côté

45,421

45,421

Other

54,755

54,755

Total development stage stream and royalty interests

112,213

112,213

Exploration stage stream interests:

Xavantina

30,974

30,974

Exploration stage royalty interests:

Pascua-Lama

177,690

177,690

Red Chris

48,895

48,895

Côté

29,610

29,610

Other

130,986

130,986

Total exploration stage royalty interests

418,155

418,155

Total stream and royalty interests, net

$

3,899,867

$

(1,456,115)

$

2,443,752

MountMilligan

RGLD Gold owns the right to purchase 35% of the payable gold and 18.75% of the payable copper produced from the Mount Milligan copper-gold mine in British Columbia, Canada, which is operated by an indirect subsidiary of Centerra Gold Inc. (“Centerra”). The Company’s carrying value for its stream interest at Mount Milligan is $554.3 million as of June 30, 2020.

On October 30, 2019,4, 2022, Centerra reported that issues identified with decreasing long-term gold recoveries and increased costs inGold, Inc. announced the short-to medium-term led them to record an impairment charge against their carrying valuehighlights of the Mount Milligan mine under applicable accounting standards, and that it had begun a comprehensive technical review of the operation with the objective of publishing an updated National Instrument 43-101 (“NI 43-101”) technical report.

On March 26, 2020, Centerra published an updated NI 43-101 technical reportlife of mine plan for Mount Milligan which provided, among other things, a detailed updatefour-year extension of the mine life to the life of mine plan2033 and reductionsincreases to the proven and probable reserves due to increased costs, lower expected productivities and lower process plant throughput.

Significant reductionsreserves. As a result of the increase in proven and probable reserves, or mineralized material are indicatorsthe gold and copper depletion rates on our Mount Milligan stream decreased to $416 per ounce of potentialgold and $1.06 per pound of copper as of September 30, 2022 from $703 per ounce of gold and $1.53 per pound of copper.

Impairment

In accordance with our impairment for Royal Gold’saccounting policy discussed in Note 2, impairment in the carrying value of each stream and royalty interests. As part of our regular asset impairment analysis duringinterest is measured and recorded to the quarter ended Marchextent that the carrying value in each stream and royalty interest exceeds its estimated fair value, which is generally calculated using estimated future discounted cash-flows.

5597

Table of Contents

ROYAL GOLD, INC.

NOTES TO CONSOLIDATED FINANCIAL STATEMENTS (Continued)

31, 2020, we determined that an impairment of our stream interest at Mount Milligan was not necessary as (i) the financial impairment taken by Centerra does not impact the mine operating performance, and (ii) the reduction in reserves and mineralized material at Mount Milligan resulted in updated gold and copper depletion rates that remain well below current and long-term consensus gold and copper prices. As of June 30, 2020, the gold and copper depletion rates at our Mount Milligan stream interest are $764 per ounce of gold and $1.48 per pound of copper. Depletion rates well below current and long-term consensus metal prices are a strong indicator the carrying value of our stream or royalty interests are recoverable.

Rainy River

RGLD Gold owns the right to purchase 6.50% of the gold produced from the Rainy River mine, which is located in northwestern Ontario, Canada and is operated by New Gold, Inc. (“New Gold”), until 230,000 gold ounces have been delivered, and 3.25% thereafter; and 60% of the silver produced from the Rainy River mine until 3.1 million silver ounces have been delivered, and 30% thereafter. As of June 30, 2020, approximately 38,700 ounces of gold and approximately 410,500 ounces of silver have been delivered to RGLD Gold. The Company’s carrying value for its stream interest at Rainy River is $148.5 million as of June 30, 2020.

During the quarter ended December 31, 2019, New Gold reported that it continued2022, an indicator of impairment was identified on one of our non-principal exploration stage royalty interests due to advance a comprehensive mine optimization study that would include a review of alternative open pitnew legal information received. Based on legal proceedings and underground mining scenarios at Rainy River On February 13, 2020, New Gold reported the results of the comprehensive optimization study that included an updated mine plan, which resulted in, among other things, a reduction in gold and silver reserves and the potential to extend the underground mine life beyond calendar 2028. New Gold published an updated NI 43-101 technical report for Rainy River on March 27, 2020, reflecting the updated mine plan and reserves.

Significant reductions in proven and probable reserves or mineralized material are indicators of potential impairment for the Company’s stream and royalty interests. As a result of the new information from New Gold, and as part of the Company’s regular asset impairmentsubsequent legal analysis, the Companywe determined that an impairment on its Rainy River stream interest was not necessary as of March 31, 2020 as the reduction in gold and silver reserves resulted in updated depletion rates that remain well below current and long-term consensus gold and silver prices. As of June 30, 2020, the gold and silver depletion rates at our Rainy River stream interest are $848 per ounce of gold and $11.27 per ounce of silver. Depletion rates well below current and long-term metal prices are a strong indicator the carrying value of the non-principal exploration stage royalty interest was not recoverable and an impairment of $4.3 million was necessary. At December 31, 2022, our stream orcarrying value for the non-principal exploration stage royalty interests are recoverable.interest was zero.

COVID-19 and current economic environment

Several of our operating counterparties announced temporary operational curtailments or the withdrawal or review of previously disclosed guidance due to the ongoing COVID-19 pandemic. The economic and societal impacts associated with COVID-19 are fluid and changing rapidly, and we are currently unable to predict the nature or extent of any impact on our results of operations and financial condition. We will continue to monitor any further developments that the COVID-19 pandemic may have on stream or royalty interests as part of our regular asset impairment analysis.

Impairment of royalty interests

In accordance with our impairment accounting policy discussed in Note 1, impairments in the carrying value of each royalty interests are measured and recorded to the extent that the carrying value in each royalty interest exceeds its estimated fair value, which is generally calculated using estimated future discounted cash-flows. For our regular asset impairment analysis, we did not identify the presence of any impairment indicators and did not record any impairment

56

Table of Contents

ROYAL GOLD, INC.

NOTES TO CONSOLIDATED FINANCIAL STATEMENTS (Continued)

charges for the fiscal year ended of June 30, 2019. We identified impairment indicators and recorded impairment charges for the fiscal year ended June 30, 2020, and 2018 as summarized in the following table and discussed in detail below:

Fiscal Year Ended June 30, 


2020


2019


2018

(Amounts in thousands)

Royalty:

Pascua-Lama

239,080

Other

1,341

284

Total impairment of royalty interests

$

1,341

$

$

239,364

Other

During the quarter ended June 30, 2019, we were made aware of insolvency proceedings at one of our non-principal producing properties (El Toqui).  During the quarter ended June 30, 2020, we obtained new information regarding the insolvency proceedings and determined ourthe carrying value for El Toquithe non-principal production stage royalty interest was not recoverable and an impairment of $1.3 million was necessary. Our carrying value

There were no impairment charges on any of our stream and royalty interests for El Toqui is 0 as of June 30, 2020.

Pascua-Lama

We own a 0.78% to 5.45% sliding-scale NSR royalty on gold and silver production from the Chilean portion oftransition period ended December 31, 2021 or for the Pascua-Lama project, which straddles the border between Argentina and Chile, and is owned by Barrick. We own an additional royalty equivalent to 1.09% of proceeds from copper produced from the Chilean portion of the project, net of allowable deductions, sold on or after January 1, 2017.

On January 18, 2018, Barrick reported that it is analyzing a revised sanction related to the Pascua-Lama project issued by Chile’s Superintendencia del Medio Ambiente (“SMA”) on January 17, 2018. The sanction is part of a re-evaluation process ordered by Chile’s Environmental Court in 2014 and relates to historical compliance matters at the Pascua-Lama project. According to Barrick, the SMA has not revoked Pascua-Lama’s environmental permit, but has ordered the closure of existing facilities on the Chilean side of the project, in addition to certain monitoring activities.

On February 6, 2018, in light of the SMA order to close surface facilities in Chile, and earlier plans to evaluate an underground mine, Barrick announced it reclassified Pascua-Lama’s proven and probable reserves, which are based on an open pit mine plan, as mineralized material. Barrick reported further details in its year-end results on February 14, 2018 and an update on the Pascua-Lama project at its February 22, 2018 Investor Day. A significant reduction in reserves or mineralized material are indicators of impairment.

On April 23, 2018, Barrick announced that work performed to-date on the prefeasibility study for a potential underground project has been suspended, and they will focus on adjusting the project closure plan for surface infrastructure on the Chilean side of the project. Barrick will continue to evaluate opportunities to de-risk the project while maintaining Pascua-Lama as an option for development in the future if economics improve and related risks can be mitigated.

As part of the impairment determination, the fair value for Pascua-Lama was estimated by calculating the net present value of the estimated future cash-flows, subject to our royalty interest, expected to be generated by the mining of the Pascua-Lama deposits. We applied a probability factor to our fair value calculation that Barrick will either proceed with an open-pit mine or an underground mine at Pascua. The estimates of future cash flows were derived from open-pit and underground mine models we developed using various information reported by Barrick. The metal price assumptions we used in the model were supported by consensus price estimates obtained by a number of industry analysts. The future cash flows were discounted using a discount rate which reflects specific market risk factors we associate with the Pascua-Lama royalty

57

Table of Contents

ROYAL GOLD, INC.

NOTES TO CONSOLIDATED FINANCIAL STATEMENTS (Continued)

interest. Following the impairment charge ($239.1 million) during the three months ended March 31, 2018, the Pascua-Lama royalty interest has a remaining carrying value of $177.7 million as of June 30, 2020. As a result of Barrick’s reclassification of Pascua-Lama’s reserves to mineralized material, our Pascua-Lama royalty interest was reclassified to exploration stage from development stage during our fiscal year ended June 30, 2018.2021.

5. MARKETABLE EQUITY SECURITIES

As of June 30, 2020,December 31, 2022, our marketable equity securities include 809,744 common shares of Contango Ore, Inc., 3,949,575 common shares of Battle North Gold Corporation (formerly Rubicon Minerals Corporation), and warrants to purchase up to 19,640,000 common shares of TriStar.TriStar Gold Inc. 250,000 common shares of Goldon Resources Ltd. and 1,242,500 common shares of Mountain Boy Minerals Ltd. The common shares of Goldon Resources Ltd. and Mountain Boy Minerals Ltd. were acquired as part of the GBR acquisition. Our marketable equity securities are measured at fair value (Note 12)13) each reporting period with any changes in fair value recognized in net income.income (amounts in thousands).


December 31, 

December 31,

June 30,

June 30,


2022

2021

2021

2020

Carrying value of marketable securities

$

373

$

1,733

$

3,082

$

17,863

Change in fair value of marketable securities(1)

$

(1,503)

$

(1,350)

$

6,017

$

1,418

The fair value of our marketable equity securities increased $1.4 million and decreased $6.8 million for the years ended June 30, 2020 and 2019, respectively, and these changes are included in Fair value changes in equity securities on our consolidated statements of operation and comprehensive income (loss). The carrying value of our marketable equity securities as of June 30, 2020 and June 30, 2019 was $17.9 million and $16.0 million, respectively, and is included in Other assets on our consolidated balance sheets.

(1)Period ended December 31, 2021 is for six months ended.

6. DEBT

The Company’s debt as of June 30, 2020December 31, 2022 and 20192021 consists of the following:

As of June 30, 2020

As of June 30, 2019

As of December 31, 2022

As of December 31, 2021


Principal


Debt Issuance Costs


Total


Principal


Debt Issuance Costs


Total


Principal


Debt Issuance Costs


Total


Principal


Debt Issuance Costs1


Total

(Amounts in thousands)

(Amounts in thousands)

(Amounts in thousands)

(Amounts in thousands)

Revolving credit facility

$

305,000

$

(4,561)

$

300,439

$

220,000

$

(5,446)

$

214,554

$

575,000

$

(3,428)

$

571,572

$

$

(4,408)

$

(4,408)

Total debt

$

305,000

$

(4,561)

$

300,439

$

220,000

$

(5,446)

$

214,554

$

575,000

$

(3,428)

$

571,572

$

$

(4,408)

$

(4,408)

(1) Included in Other assets on our consolidated balance sheets.

98

Table of Contents

ROYAL GOLD, INC.

NOTES TO CONSOLIDATED FINANCIAL STATEMENTS (Continued)

Revolving Credit Facility

On September 20, 2019,July 2, 2022, we entered into a third amendment toborrowed $500 million under our revolving credit facility dated as of June 2, 2017. Underfor the amendment, our Swiss subsidiary RGLD Gold was added as a co-borrower and joint and several obligor, certainacquisition of the Company’s Canadian subsidiaries were added as guarantors,Cortez Complex Royalty, and certain equity pledges that previously had been granted in favoron September 6, 2022, we repaid $50 million of the lendersoutstanding borrowings. Refer to supportNote 3 of our notes to consolidated financial statements for further discussion on the Rio Tinto Royalty acquisition.

On December 6, 2022, we repaid $75 million of outstanding borrowings on our revolving credit facility, were released, withand on December 28, 2022 we borrowed $200 million for the result beingacquisition of additional royalty interests on the facility is now unsecured.Cortez Complex. Refer to Note 3 of our notes to consolidated financial statements for further discussion on the acquisition of the Idaho Royalty.

As of June 30, 2020,December 31, 2022, we had $305$575 million of debt outstanding with an all-in rate interest rate on borrowings of 5.93% and $695$425 million available under our revolving credit facility. As of June 30, 2020, the interest rate on borrowings under the revolving credit facility was LIBOR plus 1.10% for an all-in rate of 1.29%. Interest expense recognized on the revolving credit facility for the year ended December 31, 2022, six months ended December 31, 2021 and fiscal years ended June 30, 2020, 20192021 and 20182020 was approximately $7.0$10.0 million, $1.7$1.4 million, $3.3 million and $5.7$7.0 million, respectively, and included interest on the outstanding borrowings and the amortization of the debt issuance costs. We were in compliance with each financial covenant (leverage ratio and interest coverage ratio) under the revolving credit facility as of December 31, 2022.

On July 7, 2021, we entered into a fourth amendment to our revolving credit facility dated as of June 30, 2020.2, 2017. The amendment extends the maturity date from June 3, 2024, to July 7, 2026, adds provisions to provide for the eventual replacement of LIBOR and makes certain changes to the lenders under the agreement.

Royal Gold may repay any borrowings under the revolving credit facility at any time without premium or penalty.

7. LEASES

Our significant lease arrangements relate to our office spaces. These arrangements are for leases of assets such as corporate office space and office equipment. We lease office space and office equipment under operating leases expiring at various dates through the year ending December 31, 2030. The Company’s revolving credit facility matures on June 3, 2024.following amounts were recorded in the consolidated balance sheets at December 31, 2022 (amounts in thousands):

Classification

December 31, 2022

Operating Leases

Right-of-use assets - current

Prepaid expenses and other

$

809

Right-of-use assets - non-current

Other assets

4,772

Total right-of-use assets

$

5,581

Lease liabilities - current

Other current liabilities

$

923

Lease liabilities - non-current

Other long-term liabilities

5,638

Total operating lease liabilities

$

6,561

5899

Table of Contents

ROYAL GOLD, INC.

NOTES TO CONSOLIDATED FINANCIAL STATEMENTS (Continued)

7.Maturities of operating lease liabilities at December 31, 2022 were as follows (amounts in thousands):

Fiscal Years:

Operating Leases

2023

$

1,095

2024

1,095

2025

1,020

2026

1,020

2027

1,020

Thereafter

1,900

Total lease payments

$

7,150

Less imputed interest

(589)

Total

$

6,561

Other information pertaining to leases consists of the following:

December 31, 2022

Operating Lease Term and Discount Rate

Weighted average remaining lease term in years

6.9

Weighted average discount rate

2.5%

We did not have any finance leases as of December 31, 2022.

8. REVENUE

Revenue Recognition

Under U.S. GAAP, aA performance obligation is a promise in a contract to transfer control of a distinct good or service (or integrated package of goods and/or services) to a customer. A contract’s transaction price is allocated to each distinct performance obligation and recognized as revenue when, or as, a performance obligation is satisfied. In accordance with this guidance, revenue attributable to our stream interests and royalty interests is generally recognized at the point in time that control of the related metal production transfers to our customers. The amount of revenue we recognize further reflects the consideration to which we are entitled under the respective stream or royalty agreement. A more detailed summary of our revenue recognition policies for our stream and royalty interests is discussed below.

Stream Interests

A metal stream is a purchase agreement that provides, in exchange for an upfront deposit payment, the right to purchase all or a portion of one or more of the metals produced from a mine, at a price determined for the life of the transaction by the purchase agreement. Gold, silver and copper received under our metal streamingstream agreements are taken into inventory, and then sold primarily using average spot rate gold, silver and copper forward contracts. The sales price for these average spot rate forward contracts is determined by the average daily gold, silver or copper spot prices during the term of the contract, typically a consecutive number of trading days between ten days and three months (depending on the frequency of deliveries under the respective streamingstream agreement and our sales policy in effect at the time) commencing shortly after receipt and purchase of the metal. We settle our forward sales contracts via physical delivery of the metal to the purchaser (our customer) on the settlement date specified in the contract. Under our forward sales contracts, there is a single performance obligation to sell a contractually specified volume of metal to the purchaser, and we satisfy this obligation at the point in time of physical delivery. Accordingly, revenue from our metal sales is recognized on the date of settlement, which is the date that control, custody and title to the metal transfer to the purchaser.

100

Table of Contents

ROYAL GOLD, INC.

NOTES TO CONSOLIDATED FINANCIAL STATEMENTS (Continued)

Royalty Interests

Royalties are non-operating interests in mining projects that provide the right to a percentage of revenue or metals produced from the project after deducting specified costs, if any. We are entitled to payment for our royalty interest in a mining project based on a contractually specified commodity price (for example, a monthly or quarterly average spot price) for the period in which metal production occurred. As a royalty holder, we act as a passive entity in the production and operations of the mining project, and the third-party operator of the mining project is responsible for all mining activities, including subsequent marketing and delivery of all metal production to their ultimate customer. In all of our material royalty interest arrangements, we have concluded that we transfer control of our interest in the metal production to the operator at the point at which production occurs, and thus, the operator is our customer. We have further determined that the transfer of each unit of metal production, comprising our royalty interest, to the operator represents a separate performance obligation under the contract, and each performance obligation is satisfied at the point in time of metal production by the operator. Accordingly, we recognize revenue attributable to our royalty interests in the period in which metal production occurs at the specified commodity price per the agreement, net of any contractually allowable offsite treatment, refining, transportation and, if applicable, miningother contractually permitted costs.

Royalty Revenue Estimates

For a small number of our royalty interests, we may not receive, or be entitled to receive, payment information, including production information from the operator, for the period in which metal production occurred prior to issuance of our financial statements. As a result, we may estimate revenue for these royalties based on available information, including public information, from the operator. If adequate information is not available from the operator or from other public sources before we issue our financial statements, we will recognize royalty revenue during the period in which the necessary payment information is received. Differences between estimates and actual amounts could differ significantly and are recorded in the period that the actual amounts are known. Please also refer to our “Use of Estimates” accounting policy discussed in Note 2. For the quarter ended December 31, 2022, royalty revenue that was estimated or was attributable to metal production for a period prior to December 31, 2022, was not material.

Disaggregation of Revenue

We have identified two material revenue sources in our business: stream interests and royalty interests. These identified revenue sources are consistent with our reportable segments as discussed in Note 15.

Revenue by metal type attributable to each of our revenue sources is disaggregated as follows (amounts in thousands):

Year Ended

Six Months Ended

Fiscal Years Ended

December 31, 

December 31, 

June 30,

June 30,


2022


2021


2021


2020

Stream revenue:

    Gold

$

308,302

$

165,031

$

323,980

$

294,490

    Silver

50,591

30,576

43,281

32,744

    Copper

58,900

30,944

56,728

32,634

         Total stream revenue

$

417,793

$

226,551

$

423,989

$

359,868

Royalty revenue:

    Gold

131,014

$

85,151

$

131,784

$

98,153

    Silver

13,690

8,253

16,198

9,996

    Copper

15,019

9,511

16,448

13,528

    Other

25,690

13,486

27,437

17,274

         Total royalty revenue

$

185,413

$

116,401

$

191,867

$

138,951

Total revenue

$

603,206

$

342,952

$

615,856

$

498,819

59101

Table of Contents

ROYAL GOLD, INC.

NOTES TO CONSOLIDATED FINANCIAL STATEMENTS (Continued)

Revenue by metal type attributable to each of our principal property revenue sources is disaggregated as follows (amounts in thousands):

Year Ended

Six Months Ended

Fiscal Years Ended

December 31, 


December 31, 


June 30,


June 30,

Metal(s)

2022

2021

2021

2020

Stream revenue:

    Mount Milligan

Gold & Copper

$

180,543

$

95,509

$

156,938

$

131,425

    Pueblo Viejo

Gold & Silver

85,863

52,958

115,583

96,978

    Andacollo

Gold

47,347

28,076

82,164

74,219

    Khoemacau

Silver

18,786

5,096

    Other

Gold & Silver

85,254

44,912

69,304

57,246

         Total stream revenue

$

417,793

$

226,551

$

423,989

$

359,868

Royalty revenue:

    Cortez Legacy Zone

Gold

$

47,769

$

33,768

$

36,160

$

22,342

    Cortez CC Zone

Gold

2,790

    Peñasquito

Gold, Silver, Lead & Zinc

43,165

26,432

49,688

25,498

    Other

Various

91,689

56,201

106,019

91,111

         Total royalty revenue

$

185,413

$

116,401

$

191,867

$

138,951

Total revenue

$

603,206

$

342,952

$

615,856

$

498,819

Refer to Note 15 for the geographical distribution of our revenue by reportable segment.

9. STOCK-BASED COMPENSATION

In November 2015, our stockholders approved the 2015 Omnibus Long-Term Incentive Plan (“2015 LTIP”). Under the 2015 LTIP, 2,500,000 shares of common stock have been authorized for future grants to officers, directors, key employees and other persons. The 2015 LTIP provides for the grant of stock options, unrestricted stock, restricted stock, dividend equivalent rights, SSARs and cash awards. Any of these awards may, but need not, be made as performance incentives. Stock options granted under the 2015 LTIP may be non-qualified stock options or incentive stock options.

We recognized stock-based compensation expense as follows (amounts in thousands):

Year Ended

Six Months Ended

Fiscal Years Ended

December 31,

December 31,

June 30,

June 30,


2022


2021


2021


2020

Restricted stock

$

4,515

$

2,006

$

2,668

$

5,117

Performance stock

2,685

405

1,317

1,291

Stock appreciation rights

1,179

779

1,677

2,545

Stock options

32

28

68

163

Total stock-based compensation expense

$

8,411

$

3,218

$

5,730

$

9,116

Stock-based compensation expense is included within General and administrative expense on the consolidated statements of operations and comprehensive income.

Stock Options and Stock Appreciation Rights

Stock option and SSARs awards are granted with an exercise price equal to the closing market price of our stock at the date of grant. Stock option and SSARs awards granted to officers, key employees and other persons vest based on one to three years of continuous service. Stock option and SSARs awards have 10-year contractual terms. There were no stock options or SSARs awards granted during the year ended December 31, 2022 or the six months ended December 31, 2021.

102

Table of Contents

ROYAL GOLD, INC.

NOTES TO CONSOLIDATED FINANCIAL STATEMENTS (Continued)

and are recorded in the period that the actual amounts are known. Please also refer to our “Use of Estimates” accounting policy discussed in Note 2. For the quarter ended June 30, 2020, royalty revenue that was estimated or was attributable to metal production for a period prior to June 30, 2020, was not material.

Disaggregation of Revenue

We have identified 2 material revenue sources in our business: stream interests and royalty interests. These identified revenue sources are consistent with our reportable segments as discussed in Note 14.

Revenue by metal type attributable to each of our revenue sources is disaggregated as follows (amounts in thousands):

Year Ended

June 30, 

June 30, 


2020


2019

Stream revenue:

    Gold

$

294,490

$

249,496

    Silver

32,744

33,282

    Copper

32,634

23,046

         Total stream revenue

$

359,868

$

305,824

Royalty revenue:

    Gold

$

98,153

$

78,570

    Silver

9,996

5,497

    Copper

13,528

13,808

    Other

17,274

19,357

         Total royalty revenue

$

138,951

$

117,232

Total revenue

$

498,819

$

423,056

Revenue by metal type attributable to each of our revenue sources is disaggregated as follows (amounts in thousands):

Year Ended

June 30, 

June 30, 

Metal(s)

2020

2019

Stream revenue:

    Mount Milligan

Gold & Copper

$

131,425

$

101,010

    Pueblo Viejo

Gold & Silver

96,978

82,844

    Andacollo

Gold

74,219

69,264

    Wassa

Gold

23,203

22,098

    Other

Gold & Silver

34,043

30,608

         Total stream revenue

$

359,868

$

305,824

Royalty revenue:

    Peñasquito

Gold, Silver, Lead & Zinc

$

25,498

$

13,865

    Cortez

Gold

22,342

11,383

    Other

Various

91,111

91,984

         Total royalty revenue

$

138,951

$

117,232

Total revenue

$

498,819

$

423,056

Refer to Note 14 for the geographical distribution of our revenue by reportable segment.

8. STOCK-BASED COMPENSATION

In November 2015, our shareholders approved the 2015 Omnibus Long-Term Incentive Plan (“2015 LTIP”). Under the 2015 LTIP, 2,500,000 shares of common stock have been authorized for future grants to officers, directors, key employees and other persons. The 2015 LTIP provides for the grant of stock options, unrestricted stock, restricted stock, dividend

60

Table of Contents

ROYAL GOLD, INC.

NOTES TO CONSOLIDATED FINANCIAL STATEMENTS (Continued)

equivalent rights, SSARs and cash awards. Any of these awards may, but need not, be made as performance incentives. Stock options granted under the 2015 LTIP may be non-qualified stock options or incentive stock options.

We recognized stock-based compensation expense as follows:

Fiscal Year Ended June 30, 


2020

2019


2018

(Amounts in thousands)

Stock options

$

163

$

221

$

318

Stock appreciation rights

2,545

2,025

1,988

Restricted stock

5,117

3,336

4,487

Performance stock

1,291

1,035

1,486

Total stock-based compensation expense

$

9,116

$

6,617

$

8,279

Stock-based compensation expense is included within General and administrative expense on the consolidated statements of operations and comprehensive income (loss).

Stock Options and Stock Appreciation Rights

Stock option and SSARs awards are granted with an exercise price equal to the closing market price of our stock at the date of grant. Stock option and SSARs awards granted to officers, key employees and other persons vest based on one to three years of continuous service. Stock option and SSARs awards have 10 year contractual terms.

To determine stock-based compensation expense for stock options and SSARs, the fair value of each stock option and SSAR is estimated on the date of grant using the Black-Scholes-Merton (“Black-Scholes”) option pricing model for all periods presented. The Black-Scholes model requires key assumptions in order to determine fair value. Those key assumptions duringfor the fiscal yearyears June 30, 2021, and 2020 2019 and 2018 grants are noted in the following table:

Stock Options

Year Ended

Six Months Ended

Fiscal Years Ended

Stock Options

SSARs


December 31,

December 31,

June 30,

June 30,

2020

2019


2018


2020

2019

2018


2022

2021

2021


2020


Weighted-average expected volatility


34.4

%  

36.5

%  

42.2

%  

34.6

%  

37.6

%  

42.4

%


%  

%  

39.4

%  

34.4

%  

Weighted-average expected life in years


4.5


4.5


5.5


4.7


5.2


5.4


4.4


4.5


Weighted-average dividend yield


1.0

%  

1.1

%  

1.1

%  

1.0

%  

1.1

%  

1.1

%


%  

%  

0.9

%  

1.0

%  

Weighted-average risk free interest rate


1.6

%  

2.7

%  

1.8

%  

1.6

%  

2.7

%  

1.8

%


%  

%  

0.2

%  

1.6

%  

SSARs


Year Ended

Six Months Ended

Fiscal Years Ended

December 31,

December 31,

June 30,

June 30,

2022

2021

2021

2020


Weighted-average expected volatility

%  

%  

39.2

%  

34.6

%

Weighted-average expected life in years


4.2


4.7

Weighted-average dividend yield

%  

%  

0.9

%  

1.0

%

Weighted-average risk free interest rate

%  

%  

0.2

%  

1.6

%

Our expected volatility is based on the historical volatility of our stock over the expected option term. Our expected option term is determined by historical exercise patterns along with other known employee or company information at the time of grant. The risk-free interest rate is based on the zero-coupon U.S. Treasury bond at the time of grant with a term approximate to the expected option term.

61

Table of Contents

ROYAL GOLD, INC.

NOTES TO CONSOLIDATED FINANCIAL STATEMENTS (Continued)

Stock Options

A summary of stock option activity for the fiscal year ended June 30, 2020,December 31, 2022, is presented below.


Weighted-


Weighted-


Weighted-

Average

Weighted-

Average

Average

Remaining

Aggregate

Average

Remaining

Aggregate

Number of

Exercise

Contractual

Intrinsic Value

Number of

Exercise

Contractual

Intrinsic Value

Shares

Price

Life (Years)

(in thousands)

Shares

Price

Life (Years)

(in thousands)

Outstanding at July 1, 2019


42,298

$

70.65


Outstanding at January 1, 2022


21,761

$

79.51


Granted


1,604

$

124.60


$


Forfeited


(476)

$

139.84


Exercised


(24,199)

$

72.92


(3,407)

$

62.38


Forfeited


(802)

$

124.60


Outstanding at June 30, 2020


18,901

$

70.38


6.0

$

1,020

Exercisable at June 30, 2020


15,623

$

65.96


5.5

$

912

Outstanding at December 31, 2022


17,878

$

79.51


4.1

$

632

Exercisable at December 31, 2022


17,164

$

78.73


4.0

$

632

There were no stock options granted during the year ended December 31, 2022 or the six months ended December 31, 2021. The weighted-average grant date fair value of options granted during the fiscal years ended June 30, 2021 and 2020, 2019was $41.92 and 2018, was $17.42, $24.12 and $27.12, respectively. The total intrinsic value of options exercised during the years ended December 31, 2022 and June 30, 2020 was $0.2 million and $1.3 million, respectively. There were no options exercised during the six months ended December 31, 2021 or fiscal yearsyear ended June 30, 2020, 2019 and 2018, were $1.3 million, $0.7 million, and $1.4 million, respectively.2021.

As of June 30, 2020,December 31, 2022, there was approximately $0.1 million of totalno unrecognized stock-based compensation expense related to unvested stock options, which is expected to be recognized over a weighted-average periodoptions.

103

Table of 1.5 years.Contents

ROYAL GOLD, INC.

NOTES TO CONSOLIDATED FINANCIAL STATEMENTS (Continued)

SSARs

A summary of SSARs activity for the fiscal year ended June 30, 2020,December 31, 2022, is presented below.below:


Weighted-

��   


Weighted-


Weighted-

Average

Weighted-

Average

Average

Remaining

Aggregate

Average

Remaining

Aggregate

Number of

Exercise

Contractual

Intrinsic Value

Number of

Exercise

Contractual

Intrinsic Value

Shares

Price

Life (Years)

(in thousands)

Shares

Price

Life (Years)

(in thousands)

Outstanding at July 1, 2019


175,599

$

79.20


Outstanding at January 1, 2022


184,137

$

111.15


Granted


53,616

$

124.15


$


Forfeited


(2,110)

$

139.84


Exercised


(101,823)

$

81.02


(7,121)

$

90.41


Forfeited


(4,788)

$

124.60


Outstanding at June 30, 2020


122,604

$

95.57


7.8

$

3,536

Exercisable at June 30, 2020


42,386

$

73.48


6.3

$

2,155

Outstanding at December 31, 2022


174,906

$

111.65


6.2

$

2,396

Exercisable at December 31, 2022


154,602

$

107.95


6.0

$

2,396

There were no SSARs granted during the year ended December 31, 2022 and six months ended December 31, 2021. The weighted-average grant date fair value of SSARs granted during the fiscal years ended June 30, 2021 and 2020 2019was $40.92 and 2018 was $32.33, $26.37 and $29.17, respectively.$32.33. The total intrinsic value of SSARs exercised during the fiscal years ended December 31, 2022, June 30, 2021 and 2020 2019was $0.2 million, $0.1 million and 2018, was $4.6 million, $2.8 million, and $6.4 million, respectively. There were no SSARs exercised during the six months ended December 31, 2021.

As of June 30, 2020,December 31, 2022, there was approximately $1.5$0.5 million of total unrecognized stock-based compensation expense related to unvested SSARs, which is expected to be recognized over a weighted-average period of 1.90.6 years.

Other Stock-based Compensation

Performance Shares

During the year ended December 31, 2022 and six months ended December 31, 2021, officers and certain employees were granted shares of restricted common stock that may vest based on our total shareholder return (“TSR”) compared to the TSRs of certain defined members of the Van Eck Vectors Gold Miners ETF (“GDX”) (“Granted TSRs”). The Granted TSRs may vest by linear interpolation in a range between zero shares if neither threshold TSR metric is met; to 100% of the Granted TSRs awarded if the target TSR metric is met; to 200% of Granted TSRs awarded if the maximum TSR metric is met. The Granted TSRs will expire in three years from the date of grant if the TSR market condition is met and a three year service condition is met.

During the fiscal years ended June 30, 2021 and 2020, officers and certain employees were granted shares of restricted common stock that can only be earned upon the achievement of certain pre-defined performance measures. Specifically, for performance shares granted during the fiscal years ended June 30, 2021 and 2020, one-half of the shares awarded may vest upon our achievement of annual growth in Net Gold Equivalent Ounces (“Net GEOs”) (“GEO Shares”). The second one-half of performance shares granted during the fiscal years ended June 30, 2021 and 2020 may vest based on our TSR compared to the TSRs of all members of the GDX (“Prior TSR Shares”). GEO Shares and Prior TSR Shares may vest by linear interpolation in a range between zero shares if neither threshold Net GEO and TSR metric is met; to 100% of GEO Shares and Prior TSR Shares awarded if both target Net GEO and TSR metrics are met; to 200% of the Net GEO and Prior TSR Shares awarded if both the maximum Net GEO and TSR metrics are met. The GEO Shares will expire in five years from the date of grant if the performance measure is not met, while the Prior TSR Shares will expire in three years from the date of grant if the TSR market condition and three year service condition are not met.

62104

Table of Contents

ROYAL GOLD, INC.

NOTES TO CONSOLIDATED FINANCIAL STATEMENTS (Continued)

2020, one-half of the shares awarded may vest upon our achievement of annual growth in Net Gold Equivalent Ounces (“Net GEOs”) (“GEO Shares”). The second one-half of performance shares granted in fiscal 2020 may vest based on our total shareholder return (“TSR”) compared to the TSRs of other members of the Market Vectors Gold Miners ETF (GDX) (“TSR Shares”). GEO Shares and TSR Shares may vest by linear interpolation in a range between 0 shares if neither threshold Net GEO and TSR metric is met; to 100% of GEO Shares and TSR Shares awarded if both target Net GEO and TSR metrics are met; to 200% of the Net GEO and TSR shares awarded if both the maximum Net GEO and TSR metrics are met. The GEO Shares will expire in five years from the date of grant if the performance measure is not met, while the TSR Shares will expire in three years from the date of grant if the TSR market condition and three year service condition are not met.

We measuremeasured the fair value of the GEO Shares based upon the market price of our common stock as of the date of grant. The measurement date for the GEO Shares will be determined at such time that the performance goals are attained or that it is probable they will be attained. At such time that it is probable that a performance condition will be achieved, compensation expense will be measured by the number of shares that will ultimately be earned based on the grant date market price of our common stock. For shares that were previously estimated to be probable of vesting and are no longer deemed to be probable of vesting, compensation expense is reversed during the period in which it is determined they are no longer probable of vesting. Interim recognition of compensation expense will be made at such time as management can reasonably estimate the number of shares that will be earned. GEO Shares granted in August 2020, 2019 and 2018 remain outstanding as of December 31, 2022 and the Company will continue to measure these awards for vesting until each awards expiration or performance attainment, whichever date is first.  

We measured the grant date fair value of the Granted TSRs and Prior TSR Shares using a Monte Carlo valuation model. The fair value of theour TSR Shares ($77.50 per share)awards is multiplied by the target number (100%) of TSR Sharesawards granted to determine total stock-based compensation expense. Total stock-based compensation expense of the TSR Sharesawards is amortized on a straight-line basis over the requisite service period, or three years. Stock-based compensation expense for the TSR Sharesawards is recognized provided the requisite service period is rendered, regardless of when, if ever, the TSR market condition is satisfied. We will reverse previously recognized stock-based compensation expense attributable to the TSR Sharesawards only if the requisite service period is not met.

A summary of the status of our unvested Performance Shares at maximum (200%) attainment for the fiscal year ended June 30, 2020,December 31, 2022, is presented below:


Weighted-


Weighted-

Average

Average

Number of

Grant Date

Number of

Grant Date

Shares

Fair Value

Shares

Fair Value

Outstanding at July 1, 2019


155,022

$

68.35

Outstanding at January 1, 2022


167,378

$

108.75

Granted


32,840

$

100.48


39,380

$

148.89

Forfeited


(6,480)

$

118.62

Vested


(15,753)

$

53.65


(6,830)

$

107.77

Forfeited


(15,525)

$

98.15

Non-attainment


(11,672)

$

52.79


(27,007)

$

83.16

Outstanding at June 30, 2020


144,912

$

80.59

Outstanding at December 31, 2022


166,441

$

122.05

As of June 30, 2020,December 31, 2022, total unrecognized stock-based compensation expense related to Performance Shares was approximately $1.5$4.7 million, which is expected to be recognized over the average remaining vesting period of 2.21.8 years.

Restricted Stock

Officers, non-executive directors and certain employees may be granted shares of restricted stock that vest on continued service alone (“Restricted Stock”). During fiscal 2020,the year ended December 31, 2022, officers and certain employees were granted 17,71024,090 shares of Restricted Stock. Restricted Stock granted to officers and certain employees during the year ended December 31, 2022, and six months ended December 31, 2021, vest ratably over three years from the date of grant, while Restricted Stock granted to officers and certain employees during the fiscal years ended June 30, 2021 and 2020 vest over three years beginning after a two-year holding period from the date of grant with one-thirdone-third of the shares vesting in years three, four and five, respectively.

63

Table of Contents

ROYAL GOLD, INC.

NOTES TO CONSOLIDATED FINANCIAL STATEMENTS (Continued)

Also, our non-executive directors were granted 8,3164,128 shares of Restricted Stock during fiscalthe year 2020.ended December 31, 2022. The non-executive directors’ shares of Restricted Stock vest 50% immediately and 50% one year after the date of grant.

We measure the fair value of the Restricted Stock based upon the market price of our common stock as of the date of grant. Restricted Stock is amortized over the applicable vesting period using the straight-line method. Unvested shares of Restricted Stock are subject to forfeiture upon termination of employment or service.

105

Table of Contents

ROYAL GOLD, INC.

NOTES TO CONSOLIDATED FINANCIAL STATEMENTS (Continued)

A summary of the status of our unvested Restricted Stock for the fiscal year ended June 30, 2020,December 31, 2022, is presented below:


Weighted-


Weighted-

Average

Average

Number of

Grant Date

Number of

Grant Date

Shares

Fair Value

Shares

Fair Value

Outstanding at July 1, 2019


142,969

$

77.13

Outstanding at January 1, 2022


128,058

$

111.03

Granted


26,026

$

123.72


28,218

$

126.69

Forfeited


(3,270)

$

121.06

Vested


(63,054)

$

92.90


(32,464)

$

102.38

Forfeited


(9,894)

$

121.12

Outstanding at June 30, 2020


96,047

$

90.40

Outstanding at December 31, 2022


120,542

$

116.76

As of June 30, 2020,December 31, 2022, total unrecognized stock-based compensation expense related to Restricted Stock was approximately $3.3$6.5 million, which is expected to be recognized over the weighted-average vesting period of 3.12.0 years.

9.10. EARNINGS PER SHARE (“EPS”)

Basic earnings (loss) per common share were computed using the weighted average number of shares of common stock outstanding during the period, considering the effect of participating securities. Unvested stock-based compensation awards that contain non-forfeitable rights to dividends or dividend equivalents are considered participating securities and are included in the computation of earnings per share pursuant to the two-class method. Our unvested restricted stock awards contain non-forfeitable dividend rights and participate equally with common stock with respect to dividends issued or declared. Our unexercised stock options, unexercised SSARs and unvested performance stock do not contain rights to dividends. Under the two-class method, the earnings (loss) used to determine basic earnings (loss) per common share are reduced by an amount allocated to participating securities. Use of the two-class method has an immaterial impact on the calculation of basic and diluted earnings (loss) per common share.

The following table summarizes the effects of dilutive securities on diluted EPS for the period (amounts in thousands, except share data):

Fiscal Year Ended June 30, 

Year Ended

Six Months Ended

Fiscal Years Ended

June 30, 

June 30, 

June 30, 

December 31, 

December 31, 

June 30,

June 30,


2020


2019


2018


2022


2021


2021


2020

Net income (loss) attributable to Royal Gold common stockholders

$

199,343

$

93,825

$

(113,134)

Net income attributable to Royal Gold common stockholders

$

238,982

$

138,339

$

302,532

$

199,343

Weighted-average shares for basic EPS

65,523,024

65,394,627

65,291,855

65,576,995

65,560,468

65,546,400

65,523,024

Effect of other dilutive securities

120,366

110,908

84,753

64,099

81,191

120,366

Weighted-average shares for diluted EPS

65,643,390

65,505,535

65,291,855

65,661,748

65,624,567

65,627,591

65,643,390

Basic earnings (loss) per share

$

3.04

$

1.43

$

(1.73)

Diluted earnings (loss) per share

$

3.03

$

1.43

$

(1.73)

Basic EPS

$

3.64

$

2.11

$

4.61

$

3.04

Diluted EPS

$

3.63

$

2.10

$

4.60

$

3.03

11. INCOME TAXES

For financial reporting purposes, Income before income taxes includes the following components (amounts in thousands):

Year Ended

Six Months Ended

Fiscal Years Ended

December 31, 

December 31, 

June 30,

June 30,

2022

2021

2021

2020

United States


$

86,321


$

68,239


$

130,175


$

35,446

Foreign


186,547


100,597


209,468


157,150

$

272,868

$

168,836

$

339,643

$

192,596

64106

Table of Contents

ROYAL GOLD, INC.

NOTES TO CONSOLIDATED FINANCIAL STATEMENTS (Continued)

10. INCOME TAXES

For financial reporting purposes, Income (loss) before income taxes includes the following components:

Fiscal Year Ended June 30, 

2020

2019

2018

(Amounts in thousands)

United States


$

35,446


$

(3,776)


$

(39,662)

Foreign


157,150


110,353


(64,917)

$

192,596

$

106,577

$

(104,579)

Our Income tax expense (benefit) expense consisted of:of (amounts in thousands):

Fiscal Year Ended June 30, 

Year Ended

Six Months Ended

Fiscal Years Ended

2020

2019

2018

December 31, 

December 31, 

June 30,

June 30,

(Amounts in thousands)

2022

2021

2021

2020

Current:


Federal

$

18,320

$

(6,974)

$

24,621

$

29,228

$

19,285

$

38,146

$

18,320

State


347


(13)


253


467


(503)


867


347

Foreign


10,078


26,230


22,741


23,067


8,716


(2,602)


10,078

$

28,745

$

19,243

$

47,615

$

52,762

$

27,498

$

36,411

$

28,745

Deferred and others:


Federal

$

(1,047)

$

916

$

(2,253)

$

(957)

$

104

$

376

$

(1,047)

State


(19)


17


(223)


(18)


2


(2)


(19)

Foreign


(31,333)


(2,678)


(30,367)


(18,861)


2,404


82


(31,333)

$

(32,399)

$

(1,745)

$

(32,843)

$

(19,836)

$

2,510

$

456

$

(32,399)

Total income tax (benefit) expense

$

(3,654)

$

17,498

$

14,772

Total income tax expense (benefit)

$

32,926

$

30,008

$

36,867

$

(3,654)

The provision for income taxes for the year ended December 31, 2022, six months ended December 31, 2021, and fiscal years ended June 30, 2020, 20192021, and 2018,2020 differs from the amount of income tax determined by applying the applicable United States statutory federal income tax rate to pre-tax income (net of non-controlling interest in income of consolidated subsidiary and loss from equity investment) from operations as a result of the following differences:differences (amounts in thousands):

Year Ended

Six Months Ended

Fiscal Years Ended

December 31, 

December 31, 

June 30,

June 30,

2022

2021

2021

2020

Total expense (benefit) computed by applying federal rates


$

57,303


$

35,456


$

71,325


$

40,445

State and provincial income taxes, net of federal benefit


545


518


874


304

Excess depletion


(1,907)


(1,363)


(1,812)


(1,291)

Estimates for uncertain tax positions


(910)


(26,179)


(11,146)

Statutory tax attributable to non-controlling interest


(363)


(219)


(72)


654

Effect of foreign earnings


(8,846)


(3,896)


(7,659)


(8,249)

Unrealized foreign exchange gains


853


54


(616)


(286)

Effects of Swiss income tax reform

(72,669)

Rate adjustment

1,694

Changes in estimates


119


(2,614)


(858)


24

Valuation allowance

(15,877)

833

1,284

47,840

Other


1,099


455


580


720

Total income tax expense (benefit)

$

32,926

$

30,008

$

36,867

$

(3,654)

The effective tax rate for the year ended December 31, 2022, was 12.1% which includes the release of a valuation allowance on certain foreign deferred tax assets. The effective tax rate for six months ended December 31, 2021, was 17.8% which includes the release of an uncertain tax position resulting from settlement agreements with foreign tax authorities and a change in estimates, partially offset by a foreign tax rate adjustment resulting in the revaluation of certain deferred tax assets. The effective tax rate for the fiscal year ended June 30, 2021, was 10.9%, primarily impacted by the release of uncertain tax positions resulting from settlement agreements with foreign tax authorities. The effective tax rate for the fiscal year ended June 30, 2020, was primarily impacted by the Federal Act on Tax Reform and AHV Financing in Switzerland and the release of an uncertain tax position resulting from a settlement agreement with a foreign tax authority.

Fiscal Year Ended June 30, 

2020

2019

2018

(Amounts in thousands)

Total expense (benefit) computed by applying federal rates


$

40,445


$

22,381


$

(29,343)

State and provincial income taxes, net of federal benefit


304


135


(104)

Excess depletion


(1,291)


(867)


(1,440)

Estimates for uncertain tax positions


(11,146)


3,180


8,574

Statutory tax attributable to non-controlling interest


654


1,013


1,736

Effect of foreign earnings


(8,249)


(6,921)


1,230

Effect of foreign earnings indefinitely reinvested


(19,004)

Realized foreign exchange gains


18,330

Unrealized foreign exchange gains


(286)


(38)


(1,610)

Effects of US income tax reform


30,675

Effects of Swiss income tax reform

(72,669)

Changes in estimates


24


(1,538)


(70)

Valuation allowance

47,840

(47)

6,337

Other


720


200


(539)

Total income tax (benefit) expense

$

(3,654)

$

17,498

$

14,772

65107

Table of Contents

ROYAL GOLD, INC.

NOTES TO CONSOLIDATED FINANCIAL STATEMENTS (Continued)

The current year effective tax rate includes the impact of the Federal Act on Tax Reform and AHV Financing in Switzerland and the release of an uncertain tax position resulting from a settlement agreement with a foreign tax authority.

The tax effects of temporary differences and carryforwards, which give rise to our deferred tax assets and liabilities at June 30, 2020on December 31, 2022 and 2019,2021 are as follows:follows (amounts in thousands):

2020

2019

December 31, 

December 31, 

(Amounts in thousands)

2022

2021

Deferred tax assets:


Stock-based compensation

$

1,313

$

1,118

$

1,846

$

1,490

Net operating losses


104


56


3,184


168

Foreign tax credits

17,159

11,125

33,301

28,148

Amortizable tax goodwill

67,287

52,783

57,926

Other


7,713


7,960


4,575


4,175

Total deferred tax assets


93,576


20,259


95,689


91,907

Valuation allowance


(60,604)


(12,764)


(46,844)


(62,721)

Net deferred tax assets

$

32,972

$

7,495

$

48,845

$

29,186

Deferred tax liabilities:


Mineral property basis

$

(67,639)

$

(74,360)

$

(124,373)

$

(70,922)

Unrealized foreign exchange gains


(582)


(582)


(582)


(582)

Investment in Peak Gold joint venture

(3,955)

(4,353)

Other


(346)


(150)


(143)


(199)

Total deferred tax liabilities


(72,522)


(79,445)


(125,098)


(71,703)

Total net deferred taxes

$

(39,550)

$

(71,950)

$

(76,253)

$

(42,517)

We review the measurement of our deferred tax assets at each balance sheet date. Considering all available positive and negative evidence, including but not limited to recent earnings history and forecasted future results, the Company believes it is more likely-than-not that all net deferred tax assets not currently burdened with a valuation allowance will be fully realized. As of June 30, 2020,December 31, 2022 and 2019,2021, we recorded a valuation allowance of $60.6$46.8 million and $12.8$62.7 million, respectively. The valuation allowance remaining at June 30, 2020December 31, 2022 is attributable to US foreign tax credits, Swiss amortizable tax goodwill, and capital loss and other tax attribute carryforwards in non-US subsidiaries.

At June 30, 2020As of December 31, 2022 and 2019,2021, we had $0.4a deferred tax liability for mineral property basis of $124.4 million and $70.9 million, respectively.  The increase in the deferred tax liability for mineral property was primarily attributable to book over-tax basis differences related to the acquisition of GBR (Note 3).  

As of December 31, 2022 and 2021, we had $3.2 million and $0.2 million of net operating loss carry forwards, respectively.carryforwards. The majority of the tax loss carry forwardscarryforwards are in jurisdictions that allow a twenty-year carry forwardcarry-forward period. As a result, these losses do not begin to expire until the 2038 tax year, and the Company anticipates the losses will be fully utilized.

As of June 30, 2020,December 31, 2022 and 2019,2021, we had $25.4 million and $36.5 million ofzero unrecognized tax benefits, respectively. If recognized, these unrecognized tax benefits would positively impact our effective income tax rate.benefits. A reconciliation of the beginning and ending amount of gross unrecognized tax benefits for the year ended December 31, 2022, six months ended December 31, 2021, and fiscal years ended June 30, 2021 and 2020 is as follows:follows (amounts in thousands):

2020

2019

2018

Year Ended

Six Months Ended

Fiscal Years Ended

December 31, 

December 31, 

June 30,

June 30,

(Amounts in thousands)

2022

2021

2021

2020

Total gross unrecognized tax benefits at beginning of year


$

36,547


$

36,346


$

28,542


$


$

652


$

25,389


$

36,547

Additions / Reductions for tax positions of current year


537


1,709


1,624


537

Additions / Reductions for tax positions of prior years

(694)

(912)

6,180

(60)

(812)

(694)

Reductions due to settlements with taxing authorities


(11,001)


(596)


(592)


(23,925)


(11,001)

Total amount of gross unrecognized tax benefits at end of year

$

25,389

$

36,547

$

36,346

$

$

$

652

$

25,389

108

Table of Contents

ROYAL GOLD, INC.

NOTES TO CONSOLIDATED FINANCIAL STATEMENTS (Continued)

We file income tax returns in the U.S. federal jurisdiction, and various state and foreign jurisdictions. With few exceptions, the Company is no longer subject to U.S. Federal, state and local, and non-U.S. income tax examinations by tax authorities

66

Table of Contents

ROYAL GOLD, INC.

NOTES TO CONSOLIDATED FINANCIAL STATEMENTS (Continued)

for fiscal years before 2014. As a result of possible settlements with taxing authorities in various jurisdictions, the Company believes that it is reasonably possible that the total amount of its net unrecognized income tax benefits may decrease by $24 million in the next 12 months.2019.

Our continuing practice is to recognize interest and/or penalties related to unrecognized tax benefits as part of our income tax expense. At June 30, 2020As of December 31, 2022 and 2019,2021, the amount of accrued income-tax-related interest and penalties was $12.6 million.zero. The gross unrecognized tax benefits reflected in the tabular reconciliation do not include interest and penalties and are not reduced by advanced deposits of $12.6 million made to taxing authorities.penalties.

11.12. SUPPLEMENTAL CASH FLOW INFORMATION

Our supplemental cash flow information for the year ended December 31, 2022, six months ended December 31, 2021, and fiscal years ended June 30, 2020, 20192021, and 20182020 is as follows:follows (amounts in thousands):

2020

2019

2018

Year Ended

Six Months Ended

Fiscal Years Ended

(Amounts in thousands)

December 31, 

December 31, 

June 30,

June 30,

Cash paid (received) during the period for:


2022

2021

2021

2020

Cash paid during the period for:


Interest

$

4,900

$

10,638

$

16,049

$

7,218

$

304

$

3,510

$

4,900

Income taxes, net of refunds

$

31,555

$

44,435

$

(3,058)

$

54,804

$

24,166

$

58,970

$

31,555

Non-cash investing and financing activities:


Dividends declared

$

72,463

$

68,473

$

64,814

$

93,597

$

42,659

$

77,416

$

72,463

12.13. FAIR VALUE MEASUREMENTS

Fair value is an exit price, representing the amount that would be received to sell an asset or paid to transfer a liability in an orderly transaction between market participants. As such, fair value is a market-based measurement that should be determined based on assumptions that market participants would use in pricing an asset or liability. As a basis for considering such assumptions, we utilize a three-tier fair value hierarchy, which prioritizes the inputs used in measuring fair value as follows:

Level 1: Quoted prices for identical instruments in active markets;

Level 2: Quoted prices for similar instruments in active markets; quoted prices for identical or similar instruments in markets that are not active; and model-derived valuations in which all significant inputs and significant value drivers are observable in active markets; and

Level 3: Prices or valuation techniques requiring inputs that are both significant to the fair value measurement and unobservable (supported by little or no market activity).

109

Table of Contents

ROYAL GOLD, INC.

NOTES TO CONSOLIDATED FINANCIAL STATEMENTS (Continued)

The following table sets forth our financial assets measured at fair value on a recurring basis (at least annually) by level within the fair value hierarchy.

As of June 30, 2020

Fair Value


Carrying Amount


Total


Level 1


Level 2


Level 3

Assets (amounts in thousands):

Marketable equity securities(1)

$

17,863

$

17,863

$

13,858

$

4,005

$

As of December 31, 2022

Fair Value


Carrying Value


Total


Level 1


Level 2


Level 3

Assets (amounts in thousands):

Marketable equity securities(1)

$

373

$

373

$

121

$

252

$

As of December 31, 2021

Fair Value


Carrying Value


Total


Level 1


Level 2


Level 3

Assets (amounts in thousands):

Marketable equity securities(1)

$

1,733

$

1,733

$

$

1,733

$

(1)

Included in Other assets on our consolidated balance sheets.

Our marketable equity securities classified within Level 1 of the fair value hierarchy are valued using quoted market prices in active markets multiplied by the quantity of shares held. The carrying value of our revolving credit facility (Note 6) approximates fair value as of June 30, 2020. The warrants issued by TriStar (Note 5) classified within Level 2 of the fair

67

Table of Contents

ROYAL GOLD, INC.

NOTES TO CONSOLIDATED FINANCIAL STATEMENTS (Continued)

value hierarchy are model-derived (Black-Scholes) valuations in which the significant inputs are observable in active markets. The carrying value of our revolving credit facility (Note 6) approximates fair value as of December 31, 2022.

As of June 30, 2020,December 31, 2022, we had assets that, under certain conditions, are subject to measurement at fair value on a non-recurring basis like those associated with stream and royalty interests, intangible assets and other long-lived assets. For these assets, measurement at fair value in periods subsequent to their initial recognition is applicable if any of these assets are determined to be impaired. If recognition of these assets at their fair value becomes necessary, such measurements will be determined utilizing Level 3 inputs. Refer to Note 4 for discussion of inputs used to develop fair value for those stream and royalty interests that were determined to be impaired during the fiscal years ended June 30, 2020.

13. MAJOR SOURCES OF REVENUE

Operators that contributed greater than 10% of our total revenue for any of fiscal years 2020, 2019 or 2018 were as follows (revenue amounts in thousands):

Fiscal Year Ended June 30, 2020

Fiscal Year Ended June 30, 2019

Fiscal Year Ended June 30, 2018


Percentage of

Percentage of

Percentage of


total

total

total


Operator

Revenue

revenue

Revenue

revenue

Revenue

revenue


Centerra


$

131,425


26.3

%  

$

101,011


23.9

%  

$

133,534


29.1

%

Barrick


125,458


25.2

%  


99,283


23.5

%  


108,285


23.6

%

Teck


74,219


14.9

%  


69,264


16.4

%  


57,413


12.5

%

14. SEGMENT INFORMATIONMAJOR SOURCES OF REVENUE

We manageOperators that contributed greater than 10% of our business under 2 reportable segments, consisting oftotal revenue for the acquisition and management of stream interestsyear ended December 31, 2022, six months ended December 31, 2021, and the acquisition and management of royalty interests. Royal Gold’s long-lived assets (stream and royalty interests, net) as offiscal years ended June 30, 20202022 and 2019 are geographically distributed2021 were as shown in the following table (amountsfollows (revenue amounts in thousands):

Year Ended

Six Months Ended

Fiscal Years Ended


December 31, 

December 31, 

June 30,

June 30,

2022

2021

2021

2020

Operator

Revenue

Percentage of total revenue

Revenue

Percentage of total revenue

Revenue

Percentage of total revenue

Revenue

Percentage of total revenue


Centerra


$

180,543


30.0

%  

$

95,509


27.8

%  

$

156,938


25.5

%  

$

131,425


26.3

%

Barrick

140,421


23.3

%  

89,177


26.0

%  

157,972


25.7

%  

125,458


25.2

%

Teck


47,347


7.9

%  


28,076


8.2

%  


82,164


13.3

%  


74,219


14.9

%

As of June 30, 2020

As of June 30, 2019

Total stream

Total stream

Stream

Royalty

and royalty

Stream

Royalty

and royalty


interest


interest


interests, net


interest


interest


interests, net

Canada

$

702,732

$

189,855

$

892,587

$

767,749

$

200,251

$

968,000

Dominican Republic

406,469

406,469

451,585

451,585

Chile

277,661

223,922

���

501,583

301,507

214,226

515,733

Africa

215,463

321

215,784

89,556

321

89,877

Mexico

75,951

75,951

83,748

83,748

United States

159,445

159,445

163,398

163,398

Australia

30,006

30,006

31,944

31,944

Rest of world

12,038

25,050

37,088

12,038

22,993

35,031

Total

$

1,614,363

$

704,550

$

2,318,913

$

1,622,435

$

716,881

$

2,339,316

Our reportable segments for purposes of assessing performance are shown below (amounts in thousands):

Year Ended June 30, 2020


Revenue


Cost of sales


Production taxes


Depletion


Segment gross profit

Stream interests

$

359,868

$

83,890

$

$

144,678

$

131,300

Royalty interests

138,951

3,824

30,369

104,758

Total

$

498,819

$

83,890

$

3,824

$

175,047

$

236,058

68110

Table of Contents

ROYAL GOLD, INC.

NOTES TO CONSOLIDATED FINANCIAL STATEMENTS (Continued)

Year Ended June 30, 2019


Revenue


Cost of sales


Production taxes


Depletion


Segment gross profit

Stream interests

$

305,824

$

77,535

$

$

127,770

$

100,519

Royalty interests

117,232

4,112

35,086

78,034

Total

$

423,056

$

77,535

$

4,112

$

162,856

$

178,553

Year Ended June 30, 2018


Revenue


Cost of sales


Production taxes


Depletion


Segment gross profit

Stream interests

$

324,516

$

83,839

$

$

129,662

$

111,015

Royalty interests

134,526

2,268

33,924

98,334

Total

$

459,042

$

83,839

$

2,268

$

163,586

$

209,349

A reconciliation of total segment gross profit to the consolidated Income (loss) before income taxes is shown below (amounts in thousands):

Year Ended June 30, 

2020

2019

2018

Total segment gross profit

$

236,058

$

178,553

$

209,349

Costs and expenses

General and administrative expenses

30,195

30,488

35,464

Exploration costs

5,190

7,158

8,946

Depreciation

387

200

110

Impairment of royalty interests

1,341

239,364

Operating income (loss)

198,945

140,707

(74,535)

Fair value changes in equity securities

1,418

(6,800)

Interest and other income

2,046

2,320

4,170

Interest and other expense

(9,813)

(29,650)

(34,214)

Income (loss) before income taxes

$

192,596

$

106,577

$

(104,579)

69

Table of Contents

ROYAL GOLD, INC.

NOTES TO CONSOLIDATED FINANCIAL STATEMENTS (Continued)

Our revenue by15. SEGMENT INFORMATION

We manage our business under two reportable segment forsegments, consisting of the fiscal year’s ended June 30, 2020, 2019,acquisition and 2018 ismanagement of stream interests and the acquisition and management of royalty interests. Royal Gold’s long-lived assets (stream and royalty interests, net) as of December 31, 2022 and 2021 are geographically distributed as shown in the following table (amounts in thousands):

Fiscal Year Ended June 30, 

As of December 31, 2022

As of December 31, 2021


2020


2019


2018

Total stream

Total stream

Stream interests:

Stream

Royalty

and royalty

Stream

Royalty

and royalty


interest


interest


interests, net


interest


interest


interests, net

Canada

$

158,736

$

123,152

$

142,244

$

511,957

$

620,549

$

1,132,506

$

579,326

$

412,419

$

991,745

Dominican Republic

96,978

82,844

95,055

320,867

320,867

350,083

350,083

Africa

299,722

321

300,043

297,569

321

297,890

Chile

74,219

69,264

57,413

236,312

224,116

460,428

249,147

224,116

473,263

Africa

29,935

30,564

29,804

Total stream interests

$

359,868

$

305,824

$

324,516

Royalty interests:

United States

$

48,692

$

34,845

$

39,496

823,203

823,203

107,761

107,761

Canada

30,524

32,602

24,254

Mexico

32,731

27,224

42,959

50,156

50,156

60,977

60,977

Australia

15,252

12,806

13,710

22,120

22,120

27,496

27,496

Africa

2,575

1,416

2,098

Chile

473

Rest of world

9,177

8,339

11,536

101,440

26,639

128,079

107,920

26,617

134,537

Total royalty interests

$

138,951

$

117,232

$

134,526

Total revenue

$

498,819

$

423,056

$

459,042

Total

$

1,470,298

$

1,767,104

$

3,237,402

$

1,584,045

$

859,707

$

2,443,752

Our reportable segments for purposes of assessing performance are shown below (amounts in thousands):

15. COMMITMENTS AND CONTINGENCIES

Khoemacau Silver Stream Acquisition

Year Ended December 31, 2022


Revenue


Cost of sales (1)


Production taxes


Depletion (2)


Segment gross profit

Stream interests

$

417,793

$

94,642

$

$

143,526

$

179,625

Royalty interests

185,413

7,021

34,916

143,476

Total

$

603,206

$

94,642

$

7,021

$

178,442

$

323,101

Six Months Ended December 31, 2021


Revenue


Cost of sales (1)


Production taxes


Depletion (2)


Segment gross profit

Stream interests

$

226,551

$

52,329

$

$

82,603

$

91,619

Royalty interests

116,401

4,412

16,867

95,122

Total

$

342,952

$

52,329

$

4,412

$

99,470

$

186,741

Fiscal Year Ended June 30, 2021


Revenue


Cost of sales (1)


Production taxes


Depletion (2)


Segment gross profit

Stream interests

$

423,989

$

92,898

$

$

150,594

$

180,497

Royalty interests

191,867

6,743

32,619

152,505

Total

$

615,856

$

92,898

$

6,743

$

183,213

$

333,002

Fiscal Year Ended June 30, 2020


Revenue


Cost of sales (1)


Production taxes


Depletion (2)


Segment gross profit

Stream interests

$

359,868

$

83,890

$

$

144,678

$

131,300

Royalty interests

138,951

3,824

30,369

104,758

Total

$

498,819

$

83,890

$

3,824

$

175,047

$

236,058

Pursuant to its Khoemacau silver stream transaction in February 2019, RGLD Gold made its first advance payment of $65.8 million on November 5, 2019, its second advance payment of $22.0 million on February 2, 2020, and its third advance payment of $47.9 million on April 3, 2020. As of June 30, 2020, our conditional funding schedule for $76.3 million up to $129.3 million pursuant to our Khoemacau silver stream acquisition remains subject to certain conditions. On July 5, 2020, RGLD Gold made its fourth advance payment of $11.1 million.

Ilovica Gold Stream Acquisition

As of June 30, 2020, our conditional funding schedule of $163.75 million, as part of the Ilovica gold stream acquisition in October 2014, remains subject to certain conditions.

(1)Excludes depreciation, depletion and amortization
(2)Depletion amounts are included within Depreciation, depletion and amortization on our consolidated statements of operations and comprehensive income

70111

Table of Contents

ROYAL GOLD, INC.

NOTES TO CONSOLIDATED FINANCIAL STATEMENTS (Continued)

16. QUARTERLY RESULTS OF OPERATIONS (UNAUDITED)

The followingA reconciliation of total segment gross profit to the consolidated Income before income taxes is a summary of selected quarterly financial information (unaudited). Some amountsshown below (amounts in the below table may not sum-up in total as a result of rounding.thousands):

Net income

attributable to

Operating

Royal Gold

Basic earnings

Diluted earnings

Revenue

income

stockholders

per share

per share

(Amounts in thousands except per share data)

Fiscal year 2020 quarter-ended:


September 30, 

$

118,774

$

48,781

$

70,453

$

1.07

$

1.07

December 31, 


123,643


53,307


41,321


0.63


0.63

March 31, 


136,437


52,281


38,554


0.59


0.59

June 30, 


119,965


44,576


49,015


0.75


0.75

$

498,819

$

198,945

$

199,343

$

3.04

$

3.03


Fiscal year 2019 quarter-ended:

(Amounts in thousands except per share data)

September 30, 

$

99,992

$

25,333

$

15,008

$

0.23

$

0.23

December 31, 


97,592


31,449


23,586


0.36


0.36

March 31, 


109,778


43,201


28,772


0.44


0.44

June 30, 


115,694


40,724


26,459


0.40


0.40

$

423,056

$

140,707

$

93,825

$

1.43

$

1.43

Year Ended

Six Months Ended

Fiscal Years Ended

December 31, 

December 31, 

June 30,

June 30,

2022

2022

2021

2020

Total segment gross profit

$

323,101

$

186,741

$

333,002

$

236,058

Costs and expenses

General and administrative expenses

34,612

15,163

28,387

30,195

Exploration costs

563

5,190

Depreciation

493

215

356

387

Impairment of royalty interests

4,287

1,341

Total costs and expenses

39,392

15,378

29,306

37,113

Gain on sale of Peak Gold JV interest

33,906

Operating income

283,709

171,363

337,602

198,945

Fair value changes in equity securities

(1,503)

(1,350)

6,017

1,418

Interest and other income

7,832

1,610

2,443

2,046

Interest and other expense

(17,170)

(2,787)

(6,419)

(9,813)

Income before income taxes

$

272,868

$

168,836

$

339,643

$

192,596

Our revenue by reportable segment for the year ended December 31, 2022, six months ended December 31, 2021 and fiscal years ended June 30, 2021 and 2020 is geographically distributed as shown in the following table (amounts in thousands):

Year Ended

Six Months Ended

Fiscal Years Ended

December 31, 

December 31, 

June 30,

June 30,


2022


2021


2021


2020

Stream interests:

Canada

$

212,369

$

115,544

$

190,537

$

158,736

Dominican Republic

85,863

52,958

115,583

96,978

Chile

47,347

28,075

82,164

74,219

Africa

53,787

22,228

35,705

29,935

Rest of world

18,427

7,746

Total stream interests

$

417,793

$

226,551

$

423,989

$

359,868

Royalty interests:

United States

$

81,642

$

54,046

$

68,611

$

48,692

Canada

27,210

13,756

31,671

30,524

Mexico

52,388

31,858

58,212

32,731

Australia

15,672

11,174

21,466

15,252

Africa

316

1,107

2,801

2,575

Rest of world

8,185

4,460

9,106

9,177

Total royalty interests

$

185,413

$

116,401

$

191,867

$

138,951

Total revenue

$

603,206

$

342,952

$

615,856

$

498,819

71112

Table of Contents

ROYAL GOLD, INC.

NOTES TO CONSOLIDATED FINANCIAL STATEMENTS (Continued)

16. COMMITMENTS AND CONTINGENCIES

Xavantina Exploration Payment

On March 22, 2022, we made a payment of $3.2 million of additional advance payments to a subsidiary of Ero as part of our commitment to support the achievement of success-based targets related to regional exploration and mineral resource additions. This payment has been recorded to exploration stage stream interests (Note 4) within Stream and royalty interests, net on our consolidated balance sheets. As of December 31, 2022, $6.8 million of additional advance payments remain if Ero meets certain success-based targets related to regional exploration and mineral resource additions through calendar 2024. Refer to Note 3 for further information on the Xavantina Gold Stream acquisition.

Ilovica Gold Stream Acquisition

As of December 31, 2022, our conditional funding schedule of $163.75 million, as part of the Ilovica gold stream acquisition entered into in October 2014, remains subject to certain conditions.

113

Table of Contents

ROYAL GOLD, INC.

NOTES TO CONSOLIDATED FINANCIAL STATEMENTS (Continued)

17. TRANSITION PERIOD COMPARATIVE DATA

The following table presents certain comparative financial information for the year ended December 31, 2022 and 2021, respectfully (amounts in thousands, except share data).

Years Ended

December 31,

December 31,

2021

2022

(unaudited)

Revenue

$

603,206

$

653,568

Costs and expenses

Cost of sales (excludes depreciation, depletion and amortization)

94,642

98,467

General and administrative

34,612

29,306

Production taxes

7,021

8,399

Depreciation, depletion and amortization

178,935

189,009

Impairment of royalty interests

4,287

Total costs and expenses

319,497

325,181

Operating income

283,709

328,387

Fair value changes in equity securities

(1,503)

2,510

Interest and other income

7,832

3,019

Interest and other expense

(17,170)

(5,753)

Income before income taxes

272,868

328,163

Income tax expense

(32,926)

(53,223)

Net income and comprehensive income

239,942

274,940

Net (income) loss and comprehensive (income) loss attributable to non-controlling interests

(960)

(898)

Net income and comprehensive income attributable to Royal Gold common stockholders

$

238,982

$

274,042

Basic earnings per share

$

3.64

$

4.17

Basic weighted average shares outstanding

65,576,995

65,552,586

Diluted earnings per share

$

3.63

$

4.17

Diluted weighted average shares outstanding

65,661,748

65,624,007

Cash dividends declared per common share

$

1.425

$

1.25

114

Table of Contents

ROYAL GOLD, INC.

NOTES TO CONSOLIDATED FINANCIAL STATEMENTS (Continued)

Years Ended

December 31, 

December 31, 

2021


2022


(unaudited)

Cash flows from operating activities:

Net income and comprehensive income

$

239,942

$

274,940

Adjustments to reconcile net income and comprehensive income to net cash provided by operating activities:

Depreciation, depletion and amortization

178,935

189,009

Non-cash employee stock compensation expense

8,411

6,056

Fair value changes in equity securities

1,503

(2,510)

Deferred tax (benefit) expense

(19,836)

11,371

Impairment of royalty interests

4,287

Other

979

1,663

Changes in assets and liabilities:

Royalty receivables

4,683

(9,771)

Stream inventory

(1,049)

2,292

Income tax receivable

1,849

4,023

Prepaid expenses and other assets

(3,908)

(1,956)

Accounts payable

211

3,862

Income tax payable

(3,005)

(4,248)

Uncertain tax positions

(13,268)

Other liabilities

4,343

406

Net cash provided by operating activities

$

417,345

$

461,869

Cash flows from investing activities:

Acquisition of stream and royalty interests

(922,155)

(400,381)

Khoemacau subordinated debt facility

(25,000)

Proceeds from sale of equity securities

8,651

Other

(721)

(241)

Net cash used in by investing activities

$

(922,876)

$

(416,971)

Cash flows from financing activities:

Repayment of debt

(125,000)

(300,000)

Borrowings from revolving credit facility

700,000

100,000

Net payments from issuance of common stock

(1,447)

(971)

Common stock dividends

(91,925)

(78,738)

Other

(1,062)

(3,497)

Net cash provided by (used in) financing activities

$

480,566

$

(283,206)

Net decrease in cash and equivalents

(24,965)

(238,308)

Cash and equivalents at beginning of period

143,551

381,859

Cash and equivalents at end of period

$

118,586

$

143,551

115

Table of Contents

ITEM 9. CHANGES IN AND DISAGREEMENTS WITH ACCOUNTANTS ON ACCOUNTING AND FINANCIAL DISCLOSURE

None.

ITEM 9A. CONTROLS AND PROCEDURES

(a)          Evaluation of Disclosure Controls and Procedures

Under the supervision and with the participation of our management, including our Chief Executive Officer (our principal executive officer) and Chief Financial Officer (our principal financial and accounting officer), we evaluated the effectiveness of the design and operation of our disclosure controls and procedures as of June 30, 2020.December 31, 2022. Based on this evaluation, our Chief Executive Officer and Chief Financial Officer have concluded that our disclosure controls and procedures were effective as of June 30, 2020,December 31, 2022, at the reasonable assurance level.

Management’s Report on Internal Control over Financial Reporting

Our management is responsible for establishing and maintaining adequate internal control over financial reporting. Our internal control over financial reporting is designed to provide reasonable assurance regarding the reliability of financial reporting and the preparation of financial statements for external purposes in accordance with generally accepted accounting principles.

Management assessed the effectiveness of our internal control over financial reporting as of June 30, 2020.December 31, 2022. In making this assessment, management used the criteria set forth by the Committee of Sponsoring Organizations of the Treadway Commission (COSO) in Internal Control—Integrated Framework (2013 Framework). Based on management’s assessment and those criteria, management concluded that our internal control over financial reporting was effective as of June 30, 2020.December 31, 2022.

Our independent registered public accounting firm, Ernst & Young LLP, has issued an attestation report on our internal control over financial reporting as of June 30, 2020.December 31, 2022.

Changes in Internal Control over Financial Reporting

There were no changes in our internal controls over financial reporting during our fourth fiscalthe quarter ended June 30, 2020,December 31, 2022, that materially affected, or is reasonably likely to materially affect, our internal control over financial reporting.

Inherent Limitations on Effectiveness of Controls

Our management, including our Chief Executive Officer and Chief Financial Officer, does not expect that our disclosure controls and procedures or our internal controls will prevent all error and all fraud. A control system, no matter how well conceived and operated, can provide only reasonable, not absolute, assurance that the objectives of the control system are met. Further, the design of a control system must reflect the fact that there are resource constraints and the benefits of controls must be considered relative to their costs. Because of the inherent limitations in all control systems, no evaluation of controls can provide absolute assurance that all control issues and instances of fraud, if any, within Royal Gold have been detected.

Report of Independent Registered Public Accounting Firm

To the Stockholders and the Board of Directors and Stockholders of Royal Gold, Inc.

Opinion on Internal Control overOver Financial Reporting

We have audited Royal Gold, Inc.’s internal control over financial reporting as of June 30, 2020,December 31, 2022, based on criteria established in Internal Control—Integrated Framework issued by the Committee of Sponsoring Organizations of the

72116

Table of Contents

Treadway Commission (2013 framework) (the COSO criteria). In our opinion, Royal Gold, Inc. (the Company) maintained, in all material respects, effective internal control over financial reporting as of June 30, 2020,December 31, 2022, based on the COSO criteria.

We also have audited, in accordance with the standards of the Public Company Accounting Oversight Board (United States) (PCAOB), the consolidated balance sheets of the Company as of June 30, 2020December 31, 2022 and 2019,2021, the related consolidated statements of operations and comprehensive income, (loss), changes in equity and cash flows for the year ended December 31, 2022, the six-month period ended December 31, 2021 and each of the threetwo years in the period ended June 30, 2020,2021, and the related notes,and our report dated August 6, 2020February 16, 2023 expressed an unqualified opinion thereon.

Basis for Opinion

The Company’s management is responsible for maintaining effective internal control over financial reporting and for its assessment of the effectiveness of internal control over financial reporting included in the accompanying Management’s Report on Internal Control over Financial Reporting. Our responsibility is to express an opinion on the Company’s internal control over financial reporting based on our audit. We are a public accounting firm registered with the PCAOB and are required to be independent with respect to the Company in accordance with the U.S. federal securities laws and the applicable rules and regulations of the Securities and Exchange Commission and the PCAOB.

We conducted our audit in accordance with the standards of the PCAOB. Those standards require that we plan and perform the audit to obtain reasonable assurance about whether effective internal control over financial reporting was maintained in all material respects.

Our audit included obtaining an understanding of internal control over financial reporting, assessing the risk that a material weakness exists, testing and evaluating the design and operating effectiveness of internal control based on the assessed risk, and performing such other procedures as we considered necessary in the circumstances. We believe that our audit provides a reasonable basis for our opinion.

Definition and Limitations of Internal Control Over Financial Reporting

A company’s internal control over financial reporting is a process designed to provide reasonable assurance regarding the reliability of financial reporting and the preparation of financial statements for external purposes in accordance with generally accepted accounting principles. A company’s internal control over financial reporting includes those policies and procedures that (1) pertain to the maintenance of records that, in reasonable detail, accurately and fairly reflect the transactions and dispositions of the assets of the company; (2) provide reasonable assurance that transactions are recorded as necessary to permit preparation of financial statements in accordance with generally accepted accounting principles, and that receipts and expenditures of the company are being made only in accordance with authorizations of management and directors of the company; and (3) provide reasonable assurance regarding prevention or timely detection of unauthorized acquisition, use, or disposition of the company’s assets that could have a material effect on the financial statements.

Because of its inherent limitations, internal control over financial reporting may not prevent or detect misstatements. Also, projections of any evaluation of effectiveness to future periods are subject to the risk that controls may become inadequate because of changes in conditions, or that the degree of compliance with the policies or procedures may deteriorate.

/s/ Ernst & Young LLP

Denver, Colorado

August 6, 2020February 16, 2023

ITEM 9B.  OTHER INFORMATION

None.

73117

Table of Contents

ITEM 9C.     DISCLOSURE REGARDING FOREIGN JURISDICTIONS THAT PREVENT INSPECTIONS

None.

PART III

ITEM 10.  DIRECTORS, EXECUTIVE OFFICERS AND CORPORATE GOVERNANCE

The information required by this item will be included in our Proxy Statementproxy statement for our 2020 Annual Stockholders Meeting2023 stockholders’ meeting to be filed with the SEC within 120 days after June 30, 2020,December 31, 2022, and is incorporated by reference ininto this Annual Report on Form 10-K.report.

ITEM 11.  EXECUTIVE COMPENSATION

The information required by this item will be included in our Proxy Statementproxy statement for our 2020 Annual Stockholders Meeting2023 stockholders’ meeting to be filed with the SEC within 120 days after June 30, 2020,December 31, 2022, and is incorporated by reference ininto this Annual Report on Form 10-K.report.

ITEM 12.  SECURITY OWNERSHIP OF CERTAIN BENEFICIAL OWNERS AND MANAGEMENT AND RELATED STOCKHOLDER MATTERS

The information required by this item will be included in our Proxy Statementproxy statement for our 2020 Annual Stockholders Meeting2023 stockholders’ meeting to be filed with the SEC within 120 days after June 30, 2020,December 31, 2022, and is incorporated by reference ininto this Annual Report on Form 10-K.report.

ITEM 13.  CERTAIN RELATIONSHIPS AND RELATED TRANSACTIONS AND DIRECTOR INDEPENDENCE

The information required by this item will be included in our Proxy Statementproxy statement for our 2020 Annual Stockholders Meeting2023 stockholders’ meeting to be filed with the SEC within 120 days after June 30, 2020,December 31, 2022, and is incorporated by reference ininto this Annual Report on Form 10-K.report.

ITEM 14.  PRINCIPAL ACCOUNTANT FEES AND SERVICES

The information required by this item will be included in our Proxy Statementproxy statement for our 2020 Annual Stockholders Meeting2023 stockholders’ meeting to be filed with the SEC within 120 days after June 30, 2020,December 31, 2022, and is incorporated by reference ininto this Annual Report on Form 10-K.report.

PART IV

ITEM 15. EXHIBITS AND FINANCIAL STATEMENT SCHEDULES

(a)   Financial Statements

Index to Financial Statements

Page

Report of Independent Registered Public Accounting Firm

4183

Consolidated Balance Sheets

4385

Consolidated Statements of Operations and Comprehensive Income (Loss)

4486

Consolidated Statements of Changes in Equity

4587

Consolidated Statements of Cash Flows

4688

Notes to Consolidated Financial Statements

4789

74118

Table of Contents

(b)  Exhibits

Exhibit
Number

Description

3.1

Restated Certificate of Incorporation, as amended (filed as Exhibit 3.1 to Royal Gold’s Quarterly Report on Form 10-Q filed on May 3, 2018, and incorporated herein by reference)

3.2

Amended and Restated Bylaws dated as amended onof August 28, 201423, 2022 (filed as Exhibit 3.1 to Royal Gold’s Current Report on Form 8-K on September 4, 2014,August 26, 2022, and incorporated herein by reference)

3.3

Amended and Restated Certificate of Designations of Series A Junior Participating Preferred Stock of Royal Gold, Inc. (filed as Exhibit 3.1 to Royal Gold’s Current Report on Form 8-K on September 10, 2007, and incorporated herein by reference)

3.4

Certificate of Designations, Preferences and Rights of the Special Voting Preferred Stock of Royal Gold, Inc. (filed as Exhibit 4.1 to Royal Gold’s Current Report on Form 8-K on February 23, 2010, and incorporated herein by reference)

4.1

Description of capital stock (filed as Exhibit 4.2 to Royal Gold’s Quarterly Report on Form 10-Q on November 7, 2019, and incorporated herein by reference)

10.1▲

2004 Omnibus Long-Term Incentive Plan, as amended (filed as Exhibit 10.1 to Royal Gold’s Current Report on Form 8-K filed on September 3, 2013, and incorporated herein by reference)

10.2▲

2015 Omnibus Long-Term Incentive Plan, as amended (filed as Exhibit 4.2 to Royal Gold’s Registration Statement on Form S-8 filed on July 20, 2017, and incorporated herein by reference)

10.3▲10.2▲

Royal Gold Deferred Compensation Plan for Non-Employee Directors (filed as Exhibit 4.1 to Royal Gold’s Registration Statement on Form S-8 filed on July 20, 2017, and incorporated herein by reference)

10.4▲10.3▲

Form of Employment Agreement by and between Royal Gold, Inc. and William Heissenbuttel, dated January 2, 2020 (filed as Exhibit 10.1 to Royal Gold’s Amendment No. 1 to Current Report on Form 8-K/A filed on January 3, 2020, and incorporated herein by reference).

10.5▲10.4▲

Employment Agreement by and between Royal Gold Corporation and Mark Isto effective January 2, 2020 (filed as Exhibit 10.2 to Royal Gold’s Amendment No. 1 to Current Report on Form 8-K/A on January 3, 2020, and incorporated herein by reference).

10.6▲10.5▲

Employment Contract effective January 1, 2019, by and between RGLD Gold AG and Daniel Breeze (filed as Exhibit 10.1 to Royal Gold’s Current Report on Form 8-K filed on January 7, 2019, and incorporated herein by reference).

10.6▲

Addendum to the Employment Contract, dated March 4, 2021, between RGLD Gold AG and Daniel Breeze (filed as Exhibit 10.1 to Royal Gold’s Form 8-K filed on March 8, 2021, and incorporated herein by reference)

10.7▲

Form of Employment Agreement by and between Royal Gold, Inc. and each of Paul Libner, and Randy Shefman and Laura Gill (filed as Exhibit 10.1 to Royal Gold’s Amendment No. 1 to Current Report on Form 8-K/A on January 3, 2020, and incorporated herein by reference).

75

Table of Contents

Exhibit
Number

Description

10.8▲

Form of Amended and Restated Indemnification Agreement entered into between Royal Gold, Inc. or certain subsidiaries and the directors and executive officers thereof (filed as Exhibit 10.1 to Royal Gold’s Current Report on Form 8-K on September 4, 2014, and incorporated herein by reference)

10.9▲

Retirement Agreement by and between Royal Gold, Inc. and Tony Jensen, dated January 1, 2020 (filed as Exhibit 10.2 to Royal Gold’s Amendment No. 1 to Current Report on Form 8-K/A filed on January 3, 2020, and incorporated herein by reference)

10.10▲

Retirement Agreement by and between Royal Gold, Inc. and Bruce Kirchhoff, dated January 1, 2020 (filed as Exhibit 10.3 to Royal Gold’s Amendment No. 1 to Current Report on Form 8-K/A on January 3, 2020, and incorporated herein by reference)

119

Table of Contents

Exhibit
Number

Description

10.11▲10.8▲

Form of Amendment to Employment Agreement by and between Royal Gold, Inc. and Tony Jenseneach of William Heissenbuttel, Mark Isto, Dan Breeze, Paul Libner, Randy Shefman and Laura Gill (filed as Exhibit 10.1 to Royal Gold’s Current Report on Form 8-K filed on July 8, 2016,April 11, 2022, and incorporated herein by reference)

10.12▲10.9▲

Form of [First][Second] Amendment to Employment Agreement by and between Royal Gold, Inc. and Bruce Kirchhoffeach of William Heissenbuttel, Mark Isto, Dan Breeze, Paul Libner, Randy Shefman and Laura Gill (filed as Exhibit 10.210.1 to Royal Gold’s Current Report on Form 8-K filed on July 8, 2016,May 25, 2022, and incorporated herein by reference)

10.13▲10.10▲

Form of First Amendment to EmploymentAmended and Restated Indemnification Agreement by andentered into between Royal Gold, Inc. or certain subsidiaries and eachthe directors and executive officers of Tony Jensen and Bruce KirchhoffRoyal Gold, Inc. or its wholly owned subsidiaries (filed as Exhibit 10.1 to Royal Gold’s QuarterlyCurrent Report on Form 10-Q filed8-K on February 8, 2018,16, 2023, and incorporated herein by reference)

10.14▲

Restricted Stock Unit Agreement under Royal Gold’s 2015 Omnibus Long-Term Incentive Plan in the form entered into by and between Royal Gold, Inc. and Daniel Breeze (filed as Exhibit 10.1 to Royal Gold’s Quarterly Report on Form 10-Q filed on May 2, 2019, and incorporated herein by reference)

10.15▲

Performance Share Agreement under Royal Gold’s 2015 Omnibus Long-Term Incentive Plan in the form entered into by and between Royal Gold, Inc. and Daniel Breeze (filed as Exhibit 10.2 to Royal Gold’s Quarterly Report on Form 10-Q filed on May 2, 2019, and incorporated herein by reference)

10.16▲

Stock Appreciation Rights Agreement under Royal Gold’s 2015 Omnibus Long-Term Incentive Plan in the form entered into by and between Royal Gold, Inc. and Daniel Breeze (filed as Exhibit 10.3 to Royal Gold’s Quarterly Report on Form 10-Q filed on May 2, 2019, and incorporated herein by reference)

10.17▲

Form of Incentive Stock Option Agreement under Royal Gold’s 2015 Omnibus Long-Term Incentive Plan (filed as Exhibit 10.1 to Royal Gold’s Quarterly Report on Form 10-Q filed on November 1, 2018, and incorporated herein by reference)

10.18▲10.11▲

Form of Restricted Stock Agreement under Royal Gold’s 2015 Omnibus Long-Term Incentive Plan (filed as Exhibit 10.3 to Royal Gold’s Quarterly Report on Form 10-Q filed on November 1, 2018, and incorporated herein by reference)

10.19▲10.12▲

Form of Restricted Stock Agreement under Royal Gold’s 2015 Omnibus Long-Term Incentive Plan for grants after August 1, 2021 (filed as Exhibit 10.1 to Royal Gold’s Quarterly Report on Form 10-Q filed on May 5, 2022, and incorporated herein by reference)

10.13▲

Form of Restricted Stock Unit Agreement under Royal Gold’s 2015 Omnibus Long-Term Incentive Plan (filed as Exhibit 10.4 to Royal Gold’s Quarterly Report on Form 10-Q filed on November 1, 2018, and incorporated herein by reference)

76

Table of Contents

10.14▲

Form of Restricted Stock Unit Agreement under Royal Gold’s 2015 Omnibus Long-Term Incentive Plan for grants after August 1, 2021 (filed as Exhibit
Number 10.2 to Royal Gold’s Quarterly Report on Form 10-Q filed on May 5, 2022, and incorporated herein by reference)

Description

10.20▲

10.15▲

Form of Director Restricted Stock Agreement under Royal Gold’s 2015 Omnibus Long-Term Incentive Plan (filed as Exhibit 10.5 to Royal Gold’s Quarterly Report on Form 10-Q filed on November 1, 2018, and incorporated herein by reference)

10.21▲10.16▲

Form of Director Restricted Stock Unit Agreement under Royal Gold’s 2015 Omnibus Long-Term Incentive Plan (filed as Exhibit 10.6 to Royal Gold’s Quarterly Report on Form 10-Q filed on November 1, 2018, and incorporated herein by reference)

10.22▲10.17▲

Form of Performance Share Award Agreement under Royal Gold’s 2015 Omnibus Long-Term Incentive Plan (filed as Exhibit 10.7 to Royal Gold’s Quarterly Report on Form 10-Q filed on November 1, 2018, and incorporated herein by reference)

10.23▲10.18▲

Form of Performance Share Award Agreement under Royal Gold’s 2015 Omnibus Long-Term Incentive Plan for grants after August 1, 2021 (filed as Exhibit 10.3 to Royal Gold’s Quarterly Report on Form 10-Q filed on May 5, 2022, and incorporated herein by reference)

10.19▲

Form of Incentive Stock Option Agreement under Royal Gold’s 2015 Omnibus Long-Term Incentive Plan (filed as Exhibit 10.1 to Royal Gold’s Quarterly Report on Form 10-Q filed on November 1, 2018, and incorporated herein by reference)

120

Table of Contents

Exhibit
Number

Description

10.20▲

Form of Stock Appreciation Rights Agreement under Royal Gold’s 2015 Omnibus Long-Term Incentive Plan (filed as Exhibit 10.2 to Royal Gold’s Quarterly Report on Form 10-Q filed on November 1, 2018, and incorporated herein by reference)

10.24▲

Form of Restricted Stock Unit Agreement under Royal Gold’s 2015 Omnibus Long-Term Incentive Plan (filed as Exhibit 10.58 to Royal Gold’s Annual Report on Form 10-K on August 10, 2017, and incorporated herein by reference)

10.25▲

Form of Director Restricted Stock Unit Agreement under Royal Gold’s 2015 Omnibus Long-Term Incentive Plan (filed as Exhibit 10.59 to Royal Gold’s Annual Report on Form 10-K on August 10, 2017, and incorporated herein by reference)

10.26▲

Form of Amendment to Equity Award Agreements under Royal Gold's 2004 Omnibus Long-Term Incentive Plan (filed as Exhibit 10.2 to Royal Gold’s Quarterly Report on Form 10-Q filed on April 27, 2016, and incorporated herein by reference)

10.27▲

Form of Incentive Stock Option Agreement under Royal Gold’s 2015 Omnibus Long-Term Incentive Plan (filed as Exhibit 10.57 to Royal Gold’s Annual Report on Form 10-K on August 10, 2016, and incorporated herein by reference)

10.28▲

Form of Restricted Stock Agreement under Royal Gold 2015 Omnibus Long-Term Incentive Plan (filed as Exhibit 10.58 to Royal Gold’s Annual Report on Form 10-K on August 10, 2016, and incorporated herein by reference)

10.29▲

Form of Director Restricted Stock Agreement under Royal Gold’s 2015 Omnibus Long-Term Incentive Plan (filed as Exhibit 10.59 to Royal Gold’s Annual Report on Form 10-K on August 10, 2016, and incorporated herein by reference)

10.30▲

Form of Performance Share Agreement under Royal Gold’s 2015 Omnibus Long-Term Incentive Plan (filed as Exhibit 10.60 to Royal Gold’s Annual Report on Form 10-K on August 10, 2016, and incorporated herein by reference)

10.31▲

Form of Stock Appreciation Rights Agreement under Royal Gold’s 2015 Omnibus Long-Term Incentive Plan (filed as Exhibit 10.61 to Royal Gold’s Annual Report on Form 10-K on August 10, 2016, and incorporated herein by reference)

77

Table of Contents

Exhibit
Number

Description

10.32▲

Form of Incentive Stock Option Agreement (Officer) under Royal Gold’s 2004 Omnibus Long-Term Incentive Plan (filed as Exhibit 10.2 to Royal Gold’s Current Report on Form 8-K filed on September 3, 2013, and incorporated herein by reference)

10.33▲

Form of Restricted Stock Agreement (Officer) under Royal Gold’s 2004 Omnibus Long-Term Incentive Plan (filed as Exhibit 10.4 to Royal Gold’s Current Report on Form 8-K filed on September 3, 2013, and incorporated herein by reference)

10.34▲

Form of Performance Share Agreement (Officer) under Royal Gold’s 2004 Omnibus Long-Term Incentive Plan (filed as Exhibit 10.5 to Royal Gold’s Current Report on Form 8-K filed on September 3, 2013, and incorporated herein by reference)

10.35▲

Form of Stock Appreciation Rights Agreement—Stock Settled (Officer) under Royal Gold’s 2004 Omnibus Long-Term Incentive Plan (filed as Exhibit 10.6 to Royal Gold’s Current Report on Form 8-K filed on September 3, 2013, and incorporated herein by reference)

10.36

Royalty Agreement between Royal Gold, Inc. and the Cortez Joint Venture dated April 1, 1999 (filed as part of Item 5 of Royal Gold’s Current Report on Form 8-K on April 12, 1999, and incorporated herein by reference)

10.37

Firm offer to purchase royalty interest of “Idaho Group” between Royal Gold, Inc. and Idaho Group dated July 22, 1999 (filed as Attachment A to Royal Gold’s Current Report on Form 8-K on September 2, 1999, and incorporated herein by reference)

10.38

Royalty Deed and Agreement, dated effective as of April 15, 1991, between ECM, Inc. and Royal Crescent Valley, Inc. (filed as Exhibit 10(1) to Royal Gold’s Annual Report on Form 10-K for the year ended June 30, 1991, and incorporated herein by reference)

10.39

Form of Agreement for Assignment of Partnership Interest in Crescent Valley Partners, L.P. (filed as Exhibit 10.1 to Royal Gold’s Current Report on Form 8-K on January 8, 2014, and incorporated herein by reference)

10.40

Purchase and Sale Agreement for Peñasquito and Other Royalties among Minera Kennecott S.A. DE C.V., Kennecott Exploration Company and Royal Gold, Inc., dated December 28, 2006 (filed as Exhibit 10.2 to Royal Gold’s Quarterly Report on Form 10-Q on February 9, 2007, and incorporated herein by reference)

10.41

Contract for Assignment of Rights Granted, by Minera Kennecott, S.A. de C.V. Represented in this Agreement by Mr. Dave F. Simpson, and Minera Peñasquito, S.A. de C.V., Represented in this Agreement by Attorney, Jose Maria Gallardo Tamayo (filed as Exhibit 10.4 to Royal Gold’s Quarterly Report on Form 10-Q on February 9, 2007, and incorporated herein by reference)

10.42†

Amended and Restated Purchase and Sale Agreement by and among Royal Gold, Inc., RGLD Gold AG, Thompson Creek Metals Company Inc., and Terrane Metals Corp. dated as of December 14, 2011 (filed as Exhibit 10.1 to Royal Gold’s Current Report on Form 8-K on December 15, 2011, and incorporated herein by reference)

78

Table of Contents

Exhibit
Number

Description

10.43†

First Amendment to Amended and Restated Purchase and Sale Agreement by and among Royal Gold, Inc., RGLD Gold AG, Thompson Creek Metals Company Inc., and Terrane Metals Corp. dated as of August 8, 2012 (filed as Exhibit 10.1 to Royal Gold’s Current Report on Form 8-K on August 9, 2012, and incorporated herein by reference)

10.44

Second Amendment to Amended and Restated Purchase and Sale Agreement by and among Royal Gold, Inc., RGLD Gold AG, Thompson Creek Metals Company Inc., and Terrane Metals Corp. dated as of December 11, 2014 (filed as Exhibit 10.1 to Royal Gold’s Quarterly Report on Form 10-Q on January 29, 2015, and incorporated herein by reference).

10.45

Third Amendment to Amended and Restated Purchase and Sale Agreement, dated October 20, 2016, among RGLD Gold AG, Thompson Creek Metals Company Inc., and Royal Gold, Inc. (filed as Exhibit 10.1 to Royal Gold’s Quarterly Report on Form 10-Q on November 3, 2016, and incorporated herein by reference)

10.46

Long Term Offtake Agreement, dated July 9, 2015, between Compania Minera Teck Carmen de Andacollo and RGLD Gold AG (filed as Exhibit 10.1 to Royal Gold’s Quarterly Report on Form 10-Q filed on November 5, 2015, and incorporated herein by reference)

10.47

Precious Metals Purchase and Sale Agreement, dated August 5, 2015, among RGLD Gold AG, BGC Holdings Ltd., and Barrick Gold Corporation (filed as Exhibit 10.3 to Royal Gold’s Quarterly Report on Form 10-Q filed on November 5, 2015, and incorporated herein by reference)

10.48

Intercreditor Agreement, dated October 20, 2016, among The Bank of Nova Scotia for the Senior Debt Secured Parties identified therein, RGLD Gold AG and Thompson Creek Metals Company Inc. (filed as Exhibit 10.2 to Royal Gold’s Quarterly Report on Form 10-Q on November 3, 2016, and incorporated herein by reference)

10.4910.21

Revolving Facility Credit Agreement, dated June 2, 2017, among Royal Gold, Inc., RG Mexico, Inc., the lenders from time to time party thereto, and HSBC Bank USA, National Association, as administrative agent for the lenders (filed as Exhibit 10.1 to Royal Gold’s Current Report on Form 8-K on June 6, 2017, and incorporated herein by reference)

10.5010.22

Revolving Facility Credit Agreement Amendment, dated May 15, 2018, among Royal Gold, Inc., RG Royalties, LLC (f/k/a RG Mexico, Inc.), Royal Gold International Holdings, Inc., the lenders from time to time party thereto, and the Bank of Nova Scotia, as administrative agent for the lenders (filed as Exhibit 10.38 to Royal Gold’s Annual Report on Form 10-K filed on August 9, 2018, and incorporated herein by reference)

10.5110.23

Second Amendment to Revolving Facility Credit Agreement dated June 3, 2019, among Royal Gold, Inc., RG Royalties, LLC (f/k/a RG Mexico, Inc.), Royal Gold International Holdings, Inc. RGLD UK Holdings Limited, the lenders from time to time party thereto, and the Bank of Nova Scotia, as administrative agent for the lenders (filed as Exhibit 10.1 to Royal Gold’s Current Report on Form 8-K on June 6, 2019, and incorporated herein by reference)

79

Table of Contents

Exhibit
Number

Description

10.5210.24

Amendment No. 3 to Revolving Facility Credit Agreement dated as of September 20, 2019, and entered into by and among Royal Gold, Inc., RGLD Gold AG, RG Royalties, LLC, Royal Gold International Holdings, Inc., the banks and financial institutions identified therein as a “Lender,” and The Bank of Nova Scotia as Administrative Agent for the Lenders (filed as Exhibit 10.1 to Royal Gold’s Quarterly Report on Form 10-Q filed on November 7, 2019, and incorporated herein by reference)

10.25

Amendment No. 4 to Revolving Facility Credit Agreement dated as of July 7, 2021, and entered into by and among Royal Gold, Inc., RGLD Gold AG, RG Royalties, LLC, Royal Gold International Holdings, Inc., the banks and financial institutions identified therein as a “Lender,” and The Bank of Nova Scotia as Administrative Agent for the Lenders (filed as Exhibit 10.1 to Royal Gold’s Current Report on Form 8-K filed on July 12, 2021, and incorporated herein by reference)

10.26**

Royalty Sale and Purchase Agreement dated August 1, 2022, between Royal Gold, Inc. and its wholly owned subsidiary RG Royalties, LLC, as purchaser parties, and Kennecott Royalty Company, as seller (filed as Exhibit 10.1 to Royal Gold’s Current Report on Form 8-K on August 2, 2022, and incorporated herein by reference)

21.1*

Royal Gold and Its Subsidiaries

23.1*

Consent of Independent Registered Public Accounting Firm

31.1*

Certification of President and Chief Executive Officer required bypursuant to Exchange Act Rules 13a-14(a) and 15d-14(a), as adopted pursuant to Section 302 of the Sarbanes-Oxley Act of 20022002.

31.2*

Certification of Chief Financial Officer required bypursuant to Exchange Act Rules 13a-14(a) and 15d-14(a), as adopted pursuant to Section 302 of the Sarbanes-Oxley Act of 20022002.

121

Table of Contents

Exhibit
Number

Description

32.1*

Written StatementCertification of the President and Chief Executive Officer pursuant to 18 U.S.C. Section 1350, as adopted pursuant to Section 906 of the Sarbanes-Oxley Act of 20022002.

32.2*

Written StatementCertification of the Chief Financial Officer pursuant to 18 U.S.C. Section 1350, as adopted pursuant to Section 906 of the Sarbanes-Oxley Act of 20022002.

101.INS*101*

The following financial statements from Royal Gold, Inc.’s Annual Report on Form 10-K for the year ended December 31, 2022, formatted in Inline XBRL Instance DocumentXBRL: (a) Consolidated Statements of Cash Flows, (b) Consolidated Statements of Operations, (c) Consolidated Statements of Comprehensive Income, (d) Consolidated Balance Sheets, and (e) Notes to Consolidated Financial Statements, tagged as blocks of text and including detailed tags

101.SCH*104*

The cover page from Royal Gold, Inc.’s Annual Report on Form 10-K for the year ended December 31, 2022, formatted in Inline XBRL Taxonomy Extension Schema Document

101.CAL*

Inline XBRL Taxonomy Extension Calculation Linkbase Document

101.DEF*

Inline XBRL Taxonomy Extension Definition Linkbase Document

101.LAB*

Inline XBRL Taxonomy Extension Label Linkbase Document

101.PRE*

Inline XBRL Taxonomy Extension Presentation Linkbase Document

104

Cover Page Interactive Data File (formatted(included as Inline XBRL and contained in Exhibit 101)

*

Filed or furnished herewith.

**

Certain portions of this Exhibit have been redacted pursuant to Item 601(b)(10) of Regulation S-K. The Company agrees to furnish

Supplementally an unredacted copy of this Exhibit to the SEC upon request.

Identifies a management contract or compensation plan or arrangement.

Certain portions of this exhibit have been omitted by redacting a portion of the text (indicated by asterisks in the text). This exhibit has been filed separately with the U.S. Securities and Exchange Commission pursuant to a request for confidential treatment.

ITEM 16.    FORM 10-K SUMMARY

The optionalRegistrants may voluntarily include a summary inof information required by Form 10-K under this Item 16 has16. We have elected not been included into include this Form 10-K.summary information.

80122

Table of Contents

SIGNATURES

Pursuant to the requirements of Section 13 or 15 (d) of the Securities Exchange Act of 1934, the registrant has duly caused this report to be signed on its behalf by the undersigned, thereunto duly authorized.

ROYAL GOLD, INC.

Date: August 6, 2020February 16, 2023

By:

/s/ WILLIAM H. HEISSENBUTTELWilliam Heissenbuttel

William H. Heissenbuttel

President, Chief Executive Officer and Director
(Principal Executive Officer)

Pursuant to the requirements of the Securities Exchange Act of 1934, this report has been signed below by the following persons on behalf of the registrant and in the capacities and on the dates indicated.


(Principal Executive Officer)

Date: August 6, 2020February 16, 2023

By:

/s/ WILLIAM H. HEISSENBUTTELWilliam Heissenbuttel

William H. Heissenbuttel

President, Chief Executive Officer and Director
(Principal Executive Officer)

Date: August 6, 2020February 16, 2023

By:

/s/ PAUL K. LIBNERPaul Libner

Paul K. Libner

Chief Financial Officer and Treasurer
(Principal Financial and Accounting Officer)

Date: August 6, 2020February 16, 2023

By:

/s/ WILLIAM M. HAYESWilliam Hayes

William M. Hayes

Chairman

Date: August 6, 2020February 16, 2023

By:

/s/ C. KEVIN MCARTHURFabiana Chubbs

C. Kevin McArthurFabiana Chubbs

Director

Date: August 6, 2020February 16, 2023

By:

/s/ JAMIE C. SOKALSKYKevin McArthur

Jamie C. SokalskyKevin McArthur

Director

Date: August 6, 2020February 16, 2023

By:

/s/ CHRISTOPHER M.T. THOMPSONJamie Sokalsky

Chris M.T. ThompsonJamie Sokalsky

Director

Date: August 6, 2020February 16, 2023

By:

/s/ RONALD J. VANCERonald Vance

Ronald J. Vance

Director

Date: August 6, 2020February 16, 2023

By:

/s/ SYBIL E. VEENMANSybil Veenman

Sybil E. Veenman

Director

81123