| (i) | Sales of Fuel Cell Systems and Related InfrastructureSummary of Risk Factors The risk factors detailed in Item 1A titled “Risk Factors” in this Annual Report on Form 10-K are the risks that we believe are material to our investors and a reader should carefully consider them. Those risks are not all of the risks we face and other factors not presently known to us or that we currently believe are immaterial may also affect our business if they occur. The following is a summary of the risk factors detailed in Item 1A: | ● | Our products and performance depend largely on the availability of hydrogen gas and an insufficient supply of hydrogen could negatively affect our sales and deployment of our products and services; |
| ● | Revenue from sales of fuel cell systemsWe may be unable to successfully execute and related infrastructure represents salesoperate our green hydrogen production projects;
|
| ● | We face risks associated with our plans to market, distribute and service our products and services internationally; |
| ● | The current economic downturn and weakness in the economy, market trends and other conditions affecting the profitability and financial stability of our GenDrive units, GenSure stationary backup power units, as well as hydrogen fueling infrastructure.
The Company uses a varietycustomers could negatively impact our sales growth and results of information sourcesoperations;
|
| ● | Delays in determining standalone selling prices for fuel cells systemsor not completing our product development goals may adversely affect our revenue and related infrastructure. For GenDrive fuel cells, given the nascent nature of the Company’s market, the Company considers several inputs, including prices from a limited number of standalone sales as well as the Company’s negotiations with customers. The Company also considers its costs to produce fuel cells as well as comparable list prices in estimating standalone selling prices. The Company uses applicable observable evidence from similar products in the market to determine standalone selling prices for GenSure stationary backup power units and hydrogen fueling infrastructure. The determination of standalone selling prices of the Company’s performance obligations requires significant judgment, including periodic assessment of pricing approaches and available observable evidence in the market. Once relative standalone selling prices are determined, the Company proportionately allocates the transaction price to each performance obligation within the customer arrangement based upon standalone selling price. The allocated transaction price related to fuel cell systems and spare parts is recognized as revenue at a point in time which usually occurs at shipment (and occasionally upon delivery). Revenue on hydrogen infrastructure installations is generally recognized at the point at which transfer of control passes to the customer, which usually occurs upon customer acceptance of the hydrogen infrastructure. In certain instances, control of hydrogen infrastructure installations transfers to the customer over time, and the related revenue is recognized over time as the performance obligation is satisfied. The Company uses an input method to determine the amount of revenue to recognize during each reporting period when such revenue is recognized over time, based on the costs incurred to satisfy the performance obligation.profitability;
(ii)Services performed on fuel cell systems and related infrastructure
Revenue from services performed on fuel cell systems and related infrastructure represents revenue earned on our service and maintenance contracts and sales of spare parts. The Company uses an adjusted market assessment approach to determine standalone selling prices for services. This approach considers market conditions and constraints, the Company’s market share, pricing strategies and objectives while maximizing the use of available observable inputs obtained from a limited number of historical standalone service renewal prices and negotiations with customers. The transaction price allocated to services as discussed above is generally recognized as revenue over time on a straight-line basis over the expected service period, as customers simultaneously receive and consume the benefits of routine, recurring maintenance performed throughout the contract period.
In substantially all of its commercial transactions, the Company sells extended maintenance contracts that generally provide for a five-to-ten-year service period from the date of product installation in exchange for an up-front payment. Services include monitoring, technical support, maintenance and services that provide for 97% to 98% uptime of the fleet. These services are accounted for as a separate performance obligation, and accordingly, revenue generated from these transactions, subject to the proportional allocation of transaction price, is deferred and recognized as revenue over the term of the contract, generally on a straight-line basis. Additionally, the Company may enter into annual service and extended maintenance contracts that are billed monthly. Revenue generated from these transactions is recognized as revenue on a straight-line basis over the term of the contract. Costs are recognized as incurred over the term of the contract. When costs are projected to exceed revenues over the life of the extended maintenance contract, an accrual for loss contracts is recorded. As of December 31, 2020 and 2019, the Company recorded a loss accrual of $24.0 million and $3.7 million respectively (2019 restated). Costs are estimated based upon historical experience and consider the estimated impact of the Company’s cost reduction initiatives. The actual results may differ from these estimates. See “Extended Maintenance Contracts” below.
|
Extended maintenance contracts generally do
| ● | Our products and services face intense competition; |
| ● | We may not contain customer renewal options. Upon expiration, customers may either negotiate a contract extensionbe able to expand our business or switchmanage our future growth effectively; |
| ● | Our ability to purchasing sparesource parts and maintaining the fuel cell systemsraw materials from our suppliers could be disrupted or delayed in our supply chain which could adversely affect our results of operations; |
| ● | Rising inflation rates, volatility in commodity prices, and product shortages may adversely affect our gross margins and financial results; |
| ● | We will continue to be dependent on their own.(iii)Power Purchase Agreements
Revenue from PPAs primarily represents payments received from customers who make monthly paymentscertain third-party key suppliers for components in our products and failure of a supplier to accessdevelop and supply components in a timely manner or at all, or our inability to substitute sources of these components on a timely basis or on terms acceptable to us, could impair our ability to manufacture our products or increase our cost of production;
|
| ● | We depend on a concentration of anchor customers for the Company’s GenKey solution.majority of our revenues and the loss of any of these customers would adversely affect our business, financial condition, results of operations and cash flows; |
| ● | Revenue associatedOur products use flammable fuels that are inherently dangerous substances and an actual or perceived problem with these agreements is recognizedour products could adversely affect the market’s perception of our products;
|
| ● | The reduction or elimination of government subsidies and economic incentives for alternative energy technologies, or the failure to renew such subsidies and incentives, could reduce demand for our products, lead to a reduction in our revenues and adversely impact our operating results and liquidity; |
| ● | Our inability to maintain a leadership position to drive hydrogen and green technology subsidies and foster beneficial regulatory interpretation will limit our growth in the market; |
| ● | Trade policies, treaties, and tariffs could have a material adverse effect on a straight-line basis overour business; |
| ● | Failure to improve overall service performance and scale sourcing effectively can limit growth and adversely impact our customer experience; |
| ● | Our investments in joint ventures may involve numerous risks that may affect the lifeability of the agreements as the customers receive the benefits from the Company’s performance of the services. The customers receive services ratably over the contract term.such joint ventures to make distributions to us; |
| ● | In conjunction with entering into a PPA with a customer, the Company may enter into transactions with third-party financial institutions in which it receives proceeds from the sale/leaseback transactions of the equipment andIf we cannot obtain financing to support the sale of futureour products and service revenue. to customers or our power purchase agreements with customers, such failure may adversely affect our liquidity and financial position;
|
| ● | We may require additional capital funding and such capital may not be available to us; |
| ● | We have incurred losses and anticipate continuing to incur losses; |
| ● | Our indebtedness could adversely affect our liquidity, financial condition, and our ability to fulfill our obligations and operate our business; |
| ● | The proceeds fromaccounting method for convertible debt securities that may be settled in cash could have a material effect on our reported financial results; |
| ● | The convertible note hedges may affect the financial institutionvalue of our common stock; |
| ● | We are allocated betweensubject to counterparty risk with respect to the sale of equipmentconvertible note hedge transactions; |
| ● | Certain component quality issues have resulted in adjustments to our warranty accruals and the saleaccrual for loss contracts; |
| ● | Our purchase orders may not ship, be commissioned or installed, or convert to revenue, which could have an adverse impact on our revenue and cash flow; |
| ● | We are dependent on information technology in our operations and the failure of such technology may adversely affect our business, and potential security breaches of our information technology systems, including cyber-attacks, could lead to liability or could damage our reputation and financial results; |
| ● | The implementation of a new enterprise resource planning system could cause disruption to our operations; |
| ● | Our future service revenueplans could be harmed if we are unable to attract or retain key personnel; |
| ● | We may not be able to protect important intellectual property and we could incur substantial costs defending against claims that our products infringe on the proprietary rights of others; |
| ● | We are subject to legal proceedings and legal compliance risks that could harm our business; |
| ● | Our financial results may be adversely affected by changes in accounting principles generally accepted in the United States; |
| ● | If our estimates or judgments relating to our critical accounting policies are based on assumptions that change or prove to be incorrect, our operating results could fall below expectations of investors, resulting in a decline in our stock price; |
| ● | We identified material weaknesses in our internal control over financial reporting. If we do not effectively remediate these material weaknesses or if we otherwise fail to maintain effective internal control over financial reporting, we may not be able to accurately report our financial results or prevent fraud; |
| ● | We are subject to various federal, state, and local environmental and human health and safety laws and regulations that could impose significant costs and liabilities on us; |
| ● | Our business may become subject to increased government regulation; |
| ● | Changes in tax laws or regulations or adverse outcomes resulting from examination of our income or other tax returns could adversely affect our operating results and financial condition; |
| ● | The changes in the relative standalone selling prices of equipment and service. The proceeds allocated to the sale of future services are recognized as finance obligations. The proceeds allocated to the sale of the equipment are evaluated to determine if the transaction meets the criteria for sale/leaseback accounting. To meet the sale/leaseback criteria, control of the equipment must transfer to the financial institution, which requires among other criteria the leaseback to meet the criteria for an operating lease and the Company must not have a right to repurchase the equipment (unless specific criteria are met). These transactions typically meet the criteria for sale/leaseback accounting and accordingly, the Company recognizes revenue on the sale of the equipment, and separately recognizes the leaseback obligations.
The Company recognizes a lease liability for the equipment leaseback obligation based on the present value of the future payments to the financial institutions that are attributed to the equipment leaseback. The discount rate used to determine the lease liability is the Company’s incremental borrowing rate, which is based on an analysis of the interest rates on the Company’s secured borrowings. Adjustments that considered the Company’s actual borrowing rate, inclusive of securitization,carryforward/carryback periods as well as borrowing ratesthe new limitations on use of net operating losses may significantly impact our valuation allowance assessments for companiesnet operating losses;
|
| ● | We may be unable to establish or maintain relationships with third parties for certain aspects of similar credit quality, were appliedcontinued product developments, manufacturing, distribution, sale, servicing, and the supply of key components for our products; |
| ● | We may be unable to make attractive acquisitions or successfully integrate acquired businesses, assets, or properties, and any inability to do so may disrupt our business and hinder our ability to grow, divert the attention of key personnel, disrupt our business, and impair our financial results; |
| ● | We may be unable to successfully pursue, integrate, or execute upon new business ventures; |
| ● | Our stock price and stock trading volume have been and could remain volatile, and the value of your investment could decline; |
| ● | Sales of substantial amounts of our common stock in the determinationpublic markets, or the perception that such sales might occur, could reduce the price that our common stock might otherwise attain and may dilute your voting power and your ownership interest in us; |
| ● | If securities analysts do not publish research or reports or if they publish unfavorable or inaccurate research about our business and our stock, the price of our stock and the trading volume could decline; |
| ● | Provisions in our charter documents and Delaware law may discourage or delay an acquisition of the incremental borrowing rate. The Company also recordsby a right of use asset which is amortized over the term of the leaseback. Rental expense is recognized on a straight-line basis over the life of the leaseback and is included as a cost of PPA revenue on the consolidated statements of operations.third party that stockholders may consider favorable; |
| ● | Certain of the Company’s transactions with financial institutionsWe do not meetanticipate paying any dividends on our common stock;
|
| ● | The choice of forum provisions in our amended and restated bylaws may limit a stockholder’s ability to bring a claim in a judicial forum that it finds favorable for disputes with us or any current or former director, officer, other employee, agent, or stockholder; and |
| ● | Climate change and climate change policies might affect our business, our industry, and the criteria for sale/leaseback accounting and accordingly, no equipment sale is recognized. All proceeds from these transactions are accounted for as finance obligations. The right of use assets related to these transactions are classified as equipment related to the PPAs and fuel delivered to the customers, net in the consolidated balance sheets. Costs to service the property, depreciation of the assets related to PPAs and fuel delivered to the customers, and other related costs are included in cost of PPA revenue in the consolidated statements of operations. The Company uses its transaction-date incremental borrowing rate as the interest rate for its finance obligations that arise from these transactions. No additional adjustments to the incremental borrowing rate have been deemed necessary for the finance obligations that have resulted from the failed sale/leaseback transactions.global economy.
In determining whether the sales of fuel cells and other equipment to financial institutions meet the requirements for revenue recognition under sale/leaseback accounting, the Company, as lessee, determines the classification of the lease. The Company estimates certain key inputs to the associated calculations such as: 1) discount rate used to determine the present value of future lease payments, 2) fair value of the fuel cells and equipment, and 3) useful life of the underlying asset(s):
|
Item 1. Business | ● | ASC Topic 842 requires a lessee to discount its future lease payments using the interest rate implicit in the lease or, if that rate cannot be readily determined, its incremental borrowing rate. Generally, the Company cannot determine the interest rate implicit in its leases because it does not have access to the lessor’s estimated residual value or the amount of the lessor’s deferred initial direct costs. Therefore, the Company generally uses its incremental borrowing rate to estimate the discount rate for each lease. Adjustments that considered the Company’s actual borrowing rate, inclusive of securitization, as well as borrowing rates for companies of similar credit quality were applied in the determination of the incremental borrowing rate.Background Plug is the company behind the end-to-end green hydrogen ecosystem that offers products and solutions ranging from fuel cells to electrolyzers to the production, storage and handling, transportation and dispensing of liquid green hydrogen. Plug is on a mission to make hydrogen adoption easy for its customers and is helping customers meet their business goals and decarbonize the economy. In creating the first commercially viable market for hydrogen fuel cells, the Company has deployed more than 60,000 fuel cell systems for forklifts and more than 180 fueling stations. Plug intends to deliver its green hydrogen solutions directly to its customers, and through joint venture partners into multiple environments, including material handling, e-mobility, power generation, and industrial applications. Plug is focused on delivering a number of green hydrogen solutions to customers. Its vertically integrated end-to-end solutions, which are designed to fit individual customer needs, include hydrogen production equipment or the delivery of green hydrogen fuel, whichever is preferred including: | ● | Proton exchange membrane (“PEM”) electrolyzers: Plug electrolyzers use clean electricity to split water into hydrogen and oxygen. Using electrolyzers, customers can generate hydrogen for a variety of applications. In support of the market growth and its own ambitions, Plug has built a state-of-the-art gigafactory to produce electrolyzer stacks in Rochester, New York. |
| ● | Hydrogen Liquefiers: Through the acquisition of Joule Processing LLC (“Joule”) in 2022, Plug gained core competency in liquefaction systems known for their operational efficiency, flexibility and reliability. Plug’s hydrogen liquefaction system has one of the most energy-efficient designs on the market utilizing hydrogen as the refrigerant in the main liquefaction cycle. |
| ● | Liquid hydrogen tankers: The Plug hydrogen tanker is one of the largest and lightest trailer ever manufactured, with unprecedented over-the-road payloads. |
| ● | In order for the lease to be classified as an operating lease, the present value of the future lease payments cannot exceed 90% of the fair value of the leased assets. The Company estimates the fair value of the lease assets using the sales prices.Plug also continues to offer fuel cells, electrochemical devices that combine hydrogen and oxygen to produce electricity and heat without combustion. Opened in 2023, Plug has built a 407,000-square-foot facility in Slingerlands, New York, which includes a 350,000-square-foot world-class fuel cell manufacturing facility to support the growing demand for fuel cells. Plug delivers end-to-end hydrogen solutions for supply chain and logistics applications, on-road electric vehicles, the stationary power market, and more. Plug has announced that it is currently building green hydrogen generation plants throughout the United States, including in New York, Louisiana, Georgia, California and Texas. The Company expects to begin producing liquid green hydrogen in 2023. To complete our end-to-end hydrogen ecosystem, Plug is offering high-efficiency liquefaction technology and cryogenic tanker and storage solutions to effectively deliver liquid green hydrogen to customers. We were organized as a corporation in the State of Delaware on June 27, 1997. Unless the context indicates otherwise, the terms “Company,” “Plug,” “we,” “our,” or “us” as used herein refer to Plug Power Inc. and its subsidiaries. Business Strategy Plug understands that green hydrogen is integral to addressing climate change in both the short and long term. Indeed, decarbonization is our very mission. To reach this goal, Plug’s business strategy is focused on the following: | ● | Expanding hydrogen production, with a focus on both output capabilities and geography. Plug has announced several new hydrogen plants planned for New York, Georgia, Texas California, Louisiana and Port of Antwerp-Bruges. We broke ground on the plants in New York and Georgia. Plug plans to begin producing green hydrogen in 2023. |
| ● | Scaling production through electrolyzer and fuel cell gigafactories. In 2021, Plug opened a 155,000-square-foot gigafactory in Rochester, New York. In 2022, Plug expanded manufacturing capacity at our Rochester location and broke ground on, and subsequently, opened within the year our 407,000-square-foot facility in Slingerlands, New York, which includes a 350,000-square-foot world-class fuel cell manufacturing facility to support the growing demand for fuel cells. |
| ● | Scaling Plug’s electrolyzer program to provide comprehensive and economical solutions focused on our 5-megawatt (“MW”) and 10MW offerings, and using these building blocks to reach into the gigawatt-scale electrolyzer market. |
| ● | Expanding into the on-road vehicles market, including delivery vans/light commercial vehicles with our joint venture with Renault (HyVia), while continuing to explore the aviation market (commuter and cargo planes and drones) and the expansion of available applications in the on-road vehicle market (such as yard tractors, cargo vans, buses, and Class 6, 7 or 8 trucks). |
| ● | Expanding into large-scale stationary power market, including backup and continuous power applications, including data centers, microgrids, distribution centers and electric vehicle (“EV”) charging. |
| ● | Expanding into new regions that require decarbonization, including in Europe and Asia. Plug entered into joint ventures with Renault SAS (“Renault”) in France, Acciona Generación Renovable, S.A. (“Acciona”) in Spain, and SK E&S Co., Ltd. (“SK E&S”) in South Korea. |
| ● | Partnering with or acquiring companies with solutions that play an integral role in building Plug’s green hydrogen ecosystem. In 2022, Plug acquired Joule, an engineered modular equipment process design and procurement company, and acquired two subsidiaries of Cryogenic Industrial Solutions, LLC, Alloy Custom Products, LLC and WesMor Cryogenics, LLC, to bolster the cryogenic tanker and storage tank business resulting from the 2021 acquisition of Applied Cryo Technologies. Plug also created a joint venture with Niloco Hydrogen Holdings LLC, a wholly-owned subsidiary of Olin Corporation (“Olin”), named “Hidrogenii” to support reliability of supply and speed to market for hydrogen throughout North America. |
| ● | Plug’s operating strategy objectives include decreasing product and service costs, while expanding system reliability. |
| ● | In order for a lease to be classified as an operating lease, the lease term cannot exceed 75% (major part) of the estimated useful life of the leased asset. The average estimated useful life of the fuel cells is 10 years, and the average estimated useful life of the hydrogen infrastructure is 20 years. These estimated useful lives are compared to the term of each lease to determine the appropriate lease classification.We believe continued investment in research and development is critical to the development and enhancement of innovative products, technologies, and services. Business Organization In 2022, the Company continued to evolve its organizational design to meet the growing needs of the business and product offerings and align with the strategy discussed above. Our organization is managed from a sales perspective based on “go-to-market” sales channels, emphasizing shared learning across end-user applications and common supplier/vendor relationships. These sales channels are structured to serve a range of customers for our products and services. As a result of this structure, we concluded that we have one operating and reportable segment — the design, development and sale of green hydrogen products and solutions that help customers meet their business goals while decarbonizing their operations. Our chief executive officer was identified as the chief operating decision maker (CODM). All significant operating decisions made by management are largely based upon the analysis of Plug on a total company basis, including assessments related to our incentive compensation plans. The current organizational structure is designed to help Plug achieve its goals and establish Plug as a world leader in green hydrogen solutions. Products and Services Plug is facilitating the paradigm shift to an increasingly electrified world by innovating cutting-edge hydrogen and fuel cell solutions. While we continue to develop commercially viable hydrogen and fuel cell product solutions, we have expanded our offerings to support a variety of commercial operations that can be powered with green hydrogen. We provide electrolyzers that allow customers — such as refineries, producers of chemicals, steel, fertilizer and commercial refueling stations — to generate hydrogen on-site. We are focusing our efforts on (a) industrial mobility applications, including electric forklifts and electric industrial vehicles, at multi-shift high volume manufacturing and high throughput distribution sites where we believe our products and services provide a unique combination of productivity, flexibility, and environmental benefits; (b) stationary power systems that will support critical operations, such as data centers, microgrids, and generation facilities, in either a backup power or continuous power role and replace batteries, diesel generators or the grid for telecommunication logistics, transportation, and utility customers; and (c) production of hydrogen. Plug expects to support these products and customers with an ecosystem of vertically integrated products that produce, transport, store and handle, dispense, and use hydrogen for mobility and power applications. Our current products and services include: GenDrive: GenDrive is our hydrogen fueled Proton Exchange Membrane (“PEM”) fuel cell system, providing power to material handling electric vehicles, including Class 1, 2, 3 and 6 electric forklifts, Automated Guided Vehicles (“AGVs”), and ground support equipment. GenFuel: GenFuel is our liquid hydrogen fueling delivery, generation, storage, and dispensing system. GenCare: GenCare is our ongoing “Internet of Things”-based maintenance and on-site service program for GenDrive fuel cell systems, GenSure fuel cell systems, GenFuel hydrogen storage and dispensing products and ProGen fuel cell engines. GenSure: GenSure is our stationary fuel cell solution providing scalable, modular PEM fuel cell power to support the backup and grid-support power requirements of the telecommunications, transportation, and utility sectors; GenSure High Power Fuel Cell Platform will support large scale stationary power and data center markets. GenKey: GenKey is our vertically integrated “turn-key” solution combining either GenDrive or GenSure fuel cell power with GenFuel fuel and GenCare aftermarket service, offering complete simplicity to customers transitioning to fuel cell power. ProGen: ProGen is our fuel cell stack and engine technology currently used globally in mobility and stationary fuel cell systems, and as engines in electric delivery vans. This includes Plug’s membrane electrode assembly (“MEA”), a critical component of the fuel cell stack used in zero-emission fuel cell electric vehicle engines. Electrolyzers: The design and implementation of 5 and 10MW electrolyzer systems that are modular, scalable hydrogen generators optimized for clean hydrogen production. Electrolyzers generate hydrogen from water using electricity and a special membrane and “green” hydrogen is generated by using renewable energy inputs, such as solar or wind power. Liquefaction Systems: Plug’s 15 ton-per-day and 30 ton-per-day liquefiers are engineered for high efficiency, reliability, and operational flexibility — providing consistent liquid hydrogen to customers. This design increases plant reliability and availability while minimizing parasitic losses like heat leak and seal gas losses. Cryogenic Equipment: Engineered equipment including trailers and mobile storage equipment for the distribution of liquified hydrogen, oxygen, argon, nitrogen and other cryogenic gases. We provide our products and solutions worldwide through our direct sales force, and by leveraging relationships with original equipment manufacturers (“OEMs”) and their dealer networks. Plug is currently targeting Asia, Australia, Europe, Middle East and North America for expansion in adoption. The European Union (the “EU”) has rolled out ambitious targets for the hydrogen economy as part of the EU strategy for energy integration and Plug is seeking to execute on our strategy to become one of the European leaders in the hydrogen economy. This includes a targeted account strategy for material handling, securing strategic partnerships with European OEMs, energy companies, utility leaders and accelerating its electrolyzer business. Our global strategy includes leveraging a network of integrators or contract manufacturers. Part of our long-term plan includes Plug penetrating the European and Asian hydrogen market, on-road vehicle market, and large-scale stationary market. Plug’s formation of joint ventures with HyVia and AccionaPlug S.L. in Europe and SK Plug Hyverse Co., Ltd. (“SK Plug Hyverse”), in Asia not only support this goal but are expected to provide us with a more global footprint. Plug has been successful with acquisitions, strategic partnerships and joint ventures, and we plan to continue this mix. We manufacture our commercially viable products in Latham, New York, Rochester, New York, Slingerlands, New York, Houston, Texas, Lafayette, Indiana, and Spokane, Washington, and support liquid hydrogen production and logistics in Charleston, Tennessee and Kingsland, Georgia. Markets/Geography & Customer Concentration The Company’s products and services predominantly serve the North American and European material handling markets, and primarily support large to mid-sized fleet, multi shift operations in high volume manufacturing and high throughput distribution centers. The Company has historically experienced fluctuations in its quarterly operating results, with more revenue typically recognized in the second half of the fiscal year as compared to the first half. Orders for the Company’s products and services approximated $1.2 billion at December 31, 2022. The Company’s orders at any given time are comprised of fuel cells, hydrogen installations, maintenance services, electrolyzers, liquefiers, hydrogen trailers, and hydrogen fuel deliveries. The specific elements of the orders will vary in terms of timing of delivery and can vary between 90 days to 10 years, with fuel cells and hydrogen installations being delivered near term and maintenance services and hydrogen fuel deliveries being delivered over a longer period of time. Historically, shipments made against product orders have generally occurred between ninety days and twenty-four months from the date of acceptance of the order. For the year ended December 31, 2022, Amazon.com Inc. (“Amazon”), accounted for 13.0% of our total consolidated revenues, which included a provision for warrant charge of $5.6 million. Additionally, 37.0% of our total consolidated revenues were associated primarily with two other customers. We assemble our products at our manufacturing facilities in Latham, New York, Rochester, New York, Slingerlands, New York, Houston, Texas, Lafayette, Georgia, and Spokane, Washington, and provide our services and installations at customer locations and service centers in Romeoville, Illinois and Dayton, Ohio. In addition, we have a hydrogen production plant in Charleston, Tennessee, and Kingsland, Georgia. In 2022, we opened a warehouse and logistics center in Duisberg, Germany. Working Capital Items We currently maintain inventory levels adequate for our short-term needs based upon present levels of production and for the purposes of global supply chain risk management. We consider the component parts of our different products to be generally available and current suppliers to be reliable and capable of satisfying anticipated needs. However, we have seen shortages of materials needed to produce fuel cell and hydrogen generation equipment components due to constraints in the production of global semiconductors, MEA components, and due to general supplier performance related to the COVID-19 pandemic, labor shortages, increasing energy prices, supply chain constraints and logistical challenges. These material shortages have also negatively impacted the pricing of materials and components sourced or used by the Company. Distribution, Marketing and Strategic Relationships We have developed strategic relationships with established companies in key areas including distribution, service, marketing, supply, technology development and product development. We sell our products worldwide, with a primary focus on North America, Europe, and Asia, through our direct product sales force, OEMs, and their dealer networks. We operate in Europe under the name Plug Power Europe to develop and sell hydrogen fuel cell systems for the European material handling market. Our wholly-owned subsidiary, Plug Power LA JV, LLC, created a joint venture with Niloco Hydrogen Holdings LLC, named “Hidrogenii” in the third quarter of 2022. We believe Hidrogenii will support reliability of supply and speed to market for hydrogen throughout North America, and set the foundation for broader collaboration between Plug and Olin. Hidrogenii plans to begin with the construction of a 15-ton-per-day hydrogen plant in St. Gabriel, Louisiana. Hidrogenii is owned 50% by Plug Power LA JV, LLC and 50% by Niloco Hydrogen Holdings LLC. Our wholly-owned subsidiary, Plug Power France, entered into a joint venture with Renault named HyVia in the second quarter of 2021. HyVia plans to manufacture and sell fuel cell powered electric light commercial vehicles (“FCELCVs”) and to supply hydrogen fuel and fueling stations to support the FCE-LCV market, in each case primarily in Europe. HyVia is owned 50% by Plug Power France and 50% by Renault. Our wholly-owned subsidiary, Plug Power Espana S.L. (“Plug Power Spain”), entered into a joint venture with Acciona, named AccionaPlug S.L., in the fourth quarter of 2021. AccionaPlug S.L. is owned 50% by Plug Power Spain and 50% by Acciona. The joint venture intends to develop green hydrogen projects in Spain and Portugal. Plug Power Inc. entered into a joint venture with SK E&S named SK Plug Hyverse, which was funded in the first quarter of 2022. The joint venture with SK E&S seeks to accelerate the use of hydrogen as an alternative energy source in Asian markets. Through this initiative, the two companies will collaborate to provide hydrogen fuel cell systems, hydrogen fueling stations, electrolyzers and green hydrogen to the Korean and other Asian markets. This joint venture is owned 49% by Plug Power Inc. and 51% by SK E&S. In addition, Plug’s acquisitions over the last several years are enhancing Plug’s position in the hydrogen industry, complementing the Company’s industry-leading position in the design, construction, and operation of customer-facing hydrogen fueling stations. These acquisitions are expected to further establish a pathway for Plug to transition from low-carbon to zero-carbon hydrogen solutions. Competition We experience competition in all areas of our business. The markets we address for motive and backup power are characterized by the presence of well-established battery and combustion generator products. We also face competition from integrated gas companies, and companies offering Steam Methane Reformers and electrolyzers. We believe the principal competitive factors in the markets in which we operate include product features, including size and weight, relative price and performance, lifetime operating cost, including any maintenance and support, product quality and reliability, safety, ease of use, foot print, rapid integration with existing equipment and processes, customer support design innovation, marketing and distribution capability, and service and support and corporate reputation. Intellectual Property We believe that neither we nor our competitors can achieve a significant proprietary position on the basic technologies currently used in PEM fuel cell systems. However, we believe the design and integration of our system and system components, as well as some of the low-cost manufacturing processes that we have developed, are intellectual property that can be protected. Our intellectual property portfolio covers, among other things: fuel cell components that reduce manufacturing part count; fuel cell system designs that lend themselves to mass manufacturing; improvements to fuel cell system efficiency, reliability and system life; and control strategies, such as added safety protections and operation under extreme conditions. In general, our employees are party to agreements providing that all inventions, whether patented or not, made or conceived while being our employee, which are related to or result from work or research that we perform, will remain our sole and exclusive property. We have a total of 65 issued patents currently active with the United States Patent and Trademark Office (“USPTO”), expiring between 2023 and 2040. At the close of 2022, we had 23 U.S. patent applications pending. Additionally, we have 22 trademarks registered with the USPTO expiring between 2023 and 2032, and three trademark applications pending. Government Regulation Our fuel cell, electrolyzer, and hydrogen products, their installations, and the operations at our facilities are subject to oversight and regulation at the international level, as well as federal, state, and local levels in accordance with statutes and ordinances relating to, among others, building codes, fire codes, public safety, electrical and gas pipeline connections and hydrogen siting. The level of regulation may depend, in part, upon where a system is located — both domestically and abroad. In addition, product safety standards have been established by the American National Standards Institute (“ANSI”), covering the overall fuel cell system. The class 1, 2, and 3 GenDrive products are designed with the intent of meeting the requirements of UL 2267 “Fuel Cell Power Systems for Installation in Industrial Electric Trucks” and NFPA 505 “Fire Safety Standard for Powered Industrial Trucks.” The hydrogen tanks used in these systems have been either certified to ANSI/CSA NGV2-2007 “Compressed Natural Gas Vehicle Fuel Containers” or ISO/TS 15869 “Gaseous hydrogen and hydrogen blends—Land vehicle fuel tanks.” We will continue to design our GenDrive products to meet ANSI and/or other applicable standards. We certified several models of Class 1, 2, and 3 GenDrive products to the requirements of the CE mark with guidance from a European certified body. The hydrogen tanks used in these systems are certified to the Pressure Equipment Directive by a European certified body. The GenFuel hydrogen storage and dispensing products are designed with the intent of meeting the requirements of NFPA 2 “Hydrogen Technologies Code.” We are also subject to standards as applied to the design of our electrolyzer products, both domestically and abroad. Such standards include, but are not limited to, “Hydrogen Generators Using Water Electrolysis” (ISO 22734), “Hydrogen Technologies Code” (NFPA 2), “Explosive Atmospheres” requirements (UL 60079), CE product standards within the European Commission, and AS/NZS standards for our products within each jurisdiction, as applicable. As our Company increasingly expands to new markets and jurisdiction, we also become currently subject to new and different regulations in such jurisdictions. We are subject to various federal, state, local, and non-U.S. environmental and human health and safety laws and regulations, including laws and regulations relating to the use, handling, storage, transportation, disposal and human exposure to hazardous substances and wastes, product safety, and emissions of pollution into the environment, and the remediation of contamination. Our facilities in the United States are subject to regulation by the Occupational Safety and Health Administration (“OSHA”), which regulates the protection of the health and safety of workers. In addition, the OSHA hazard communication standard requires that we maintain information about hazardous materials used or produced in our operations and that we provide this information to employees, state and local governmental authorities and local residents. We are also subject to occupational safety regulations in other countries. In addition, certain environmental laws and regulations impose liability and responsibility on present and former operators or users of facilities and sites for contamination at such facilities and sites without regard to causation or knowledge of contamination. Compliance with environmental laws and regulations can significantly increase the costs of our operations. Violations of environmental laws and regulations can subject us to additional costs and expenses, including defense costs and expenses and civil and criminal penalties. Environmental laws and regulations are becoming increasingly stringent, and compliance costs are significant and will continue to be significant in the foreseeable future. There can be no assurance that existing or future environmental and human health and safety laws and regulations will not have a material effect on our business. As our business expands — particularly as part of our green hydrogen production strategy — we will continue to evaluate the potential impact such provisions will have on our business, as applied to each relevant jurisdiction in which we conduct business. We do not believe that existing or pending climate change legislation, regulation, or international treaties or accords are reasonably likely to have a material adverse effect in the foreseeable future on our business or markets that we serve, or on our results of operations, capital expenditures or financial position. However, there is no guarantee that any such legislation, regulation, or international treaties or accords will be favorable to our business. We will continue to monitor emerging developments in this area. Other than these requirements, at this time we do not know what additional requirements, if any, each jurisdiction will impose on our products or their installation. We also do not know the extent to which any new regulations may impact our ability to distribute, install, and service our products. As we continue distributing our systems to our target markets, the federal, state, local, or foreign government entities may seek to impose regulations or competitors may seek to influence regulations through lobbying efforts. See Item 1A, “Risk Factors” for a description of these governmental regulations and other material risks to us, including, to the extent material, to our competitive position. Raw Materials and Suppliers Most components essential to our business are generally available from multiple sources. We believe there are component suppliers and manufacturing vendors whose loss to us could have a material adverse effect upon our business and financial condition. We are mitigating these potential risks by introducing alternate system architectures which we expect will allow us to diversify our supply chain with multiple fuel cell, electrolyzer stack and air supply component vendors. We are also working closely with these vendors and other key suppliers on coordinated product introduction plans, strategic inventories, and internal and external manufacturing schedules and levels. Recent cost pressures from global energy prices and inflation have negatively impacted access to our key raw materials. In cases where we have single sourced suppliers (typically due to new technology and products), we engineer or develop new supply sources while covering short- and medium-term risks with supply contracts, inventory, and development partnerships. Additionally, in January 2023, the Company entered into a strategic partnership with Johnson Matthey Hydrogen Technologies Limited, a subsidiary of Johnson Matthey PLC and a global leader in sustainable technologies (“JM”), pursuant to which JM will supply the Company catalyst coated membrane (CCM) for use in the production of fuel cells as well as catalysts and membranes for use in the production of electrolyzers. In addition, the Company and JM intend to develop their existing and new technology and commercial products and co-invest in a manufacturing facility in the United States. Research and Development Because the fuel cell industry is still in the early state of adoption, our ability to compete successfully is heavily dependent upon our ability to ensure a continual and timely flow of competitive products, services, and technologies to the marketplace. We continue to develop new products and technologies and to enhance existing products in the areas of cost, size, weight, and in supporting service solutions in order to drive further commercialization. We may also expand the range of our product offerings and intellectual property through licensing and/or acquisition of third-party business and technology. Our research and development expense totaled $99.6 million, $64.8 million, and $27.8 million during the years ended December 31, 2022, 2021, and 2020, respectively. Human Capital Resources As of December 31, 2022, we had 3,353 employees, of which 156 are temporary employees, with 2,941 located in the United States and 412 located outside of the United States. In order to facilitate talent attraction and retention, we strive to make Plug a safe, rewarding, and challenging workplace with competitive salaries. Our employees are critical to the Company’s growth, expansion, and success, and we consider our relationship with our employees to be positive. The Company is dedicated to fostering a culture of diversity and committed to hiring talented individuals from all backgrounds and perspectives to which the Company’s ultimate success is linked. Diversity, Equity & Inclusion We take tremendous pride in being an Equal Opportunity/Affirmative Action Employer and actively seek to increase the racial, gender, and ethnic diversity of our Company. At Plug, we are powered by the collective differences of our employees, customers, and stakeholders, and we value different perspectives to solve complex problems and bring innovative solutions. We promise to listen and hear inspiration from around the globe, to champion inclusivity, and respect for each other, and to celebrate our differences as we build an environment in which we are all proud to be a part. | ● | Diversity: We embrace the unique characteristics and social identities of our employees. Collectively, these individual differences enhance our culture and company achievements. We believe that our strength comes from our intellectual and social diversity and that diversity powers innovation and inspires our team. |
| ● | (iv)Fuel DeliveredEquity: All employees have equal opportunity to Customers
Revenue associated with fuel delivered to customers representsadvance. People are the salepower of hydrogen to customers that has been purchased by the Company from a third party or generated on site. The stand-alone selling price is not estimated because it is sold separatelyPlug, and therefore directly observable.
The Company purchases hydrogen fuel from suppliers in most cases (and sometimes produces hydrogen onsite) and sells to its customers. Revenue and cost of revenue related to this fuel is recorded as dispensed and is included in the respective “Fuel delivered to customers” lines on the consolidated statements of operations.
Contract costs
The Company expects that incremental commission fees paid to employees as a result of obtaining sales contractswe are recoverable and therefore the Company capitalizes them as contract costs.
Capitalized commission fees are amortized on a straight-line basis over the period of time which the transfer of goods or services to which the assets relate occur, typically ranging from 5 to 10 years. Amortization of the capitalized commission fees is included in selling, general and administrative expenses.
The Company recognizes the incremental costs of obtaining contracts as an expense when incurred if the amortization period of the assets that the Company otherwise would have recognized is one year or less. These costs are included in selling, general and administrative expenses.
Impairment of Long-Lived Assets and PPA Executory Contract Considerations
We evaluate long-lived assets on a quarterly basis to identify events or changes in circumstances (“triggering events”) that indicate the carrying value of certain assets may not be recoverable. Long-lived assets that we evaluate include right of use lease assets, equipment deployed to our PPAs, assets related primarily to our fuel delivery business and other company owned long-lived assets.
Upon the occurrence of a triggering event, long-lived assets are evaluated to determine if the carrying amounts are recoverable. The determination of recoverability is made based upon the estimated undiscounted future net cash flows of assets grouped at the lowest level for which there are identifiable cash flows independent of the cash flows of other groups. For operating assets, the Company has generally determined that the lowest level of identifiable cash flows is based on the customer sites. The assets related primarily to our fuel delivery business are considered to be their own asset group. The cash flows are estimated based on the remaining useful life of the primary asset within the asset group.
For assets related to our PPA agreements, we consider all underlying cash inflows related to our contract revenues and cash outflows relatingcommitted to the costs incurred to service the PPAs. Our cash flow estimates usedinvestment in the recoverability test, are based upon, among other things, historical results adjusted to reflect our best estimate of future cash flows and operating performance. Development of future cash flows also requires us to make assumptions and to apply judgment, including timing of future expected cash flows, future cost savings initiatives, and determining recovery values. Changes to our key assumptions related to future performance and other economic and market factors could adversely affect the outcome of our recoverability tests and cause more asset groups to be tested for impairment.
If the estimated undiscounted future net cash flows for a given asset group are less than the carrying amount of the related asset group, an impairment loss is determined by comparing the estimated fair value with the carrying amount of the asset group. The impairment loss is then allocated to the long-lived assets in the asset group based on the asset’s
relative carrying amounts. However, assets are not impaired below their then estimated fair values. Fair value is generally determined through various valuation techniques, including discounted cash flow models, quoted market values and third-party independent appraisals, as well as year-over-year trends in pricing of our new equipment and overall evaluation of our industry and market, as considered necessary. The Company considers these indicators with certain of its own internal indices and metrics in determining fair value in light of the nascent state of the Company’s market and industry. The estimate of fair value represents our best estimates of these factors and is subject to variability. Changes to our key assumptions related to future performance and other economic and market factors could adversely affect our impairment evaluation.
The Company has determined that the assets deployed for certain PPA arrangements are not recoverable based on the undiscounted estimated future cash flows of the asset group. However, the estimated fair value of the assets in the asset group equal or exceed the carrying amount of the assets or otherwise limit the amount of impairment that would have been recognized. The Company has identified the primary source of the losses as the maintenance components of the PPA arrangements and the impact of customer warrant non-cash provisions.As the PPA arrangements are considered to be executory contracts and there is no specific accounting guidance that permits loss recognition for these revenue contracts, the Company has not recognized a provision for the expected future losses under these revenue arrangements. The Company expects that it will recognize future losses for these arrangements as it continues its efforts to reduce costs of delivering the maintenance component of these arrangements. The Company has estimated total future revenues and costs for these types of arrangements based on existing contracts and leverage of the related assets. For the future estimates, the Company used service cost estimates for extended maintenance contracts and customer warrant provisions at rates consistent with experience to date. The terms for the underlying estimates vary but the average residual term on the existing contracts is 5 years. Based on the future estimates with these assumptions, the losses could approximate $120 million. This estimate includes $75 million in non-cash charges for depreciation and provision for customer warrants. Actual results could be significantly different than these estimates.
Extended Maintenance Contracts
On a quarterly basis, we evaluate any potential losses related to our extended maintenance contracts for fuel cell systems and related infrastructure that has been sold.employees. We measure impairment losses at the customer contract level. The expected revenues and expenses for these contracts include all applicable expected costs of providing services over the remaining term of the contracts and the related unearned net revenue. A loss is recognized if the sum of expected costs of providing services under the contract exceeds related unearned net revenue and is recorded as a provision for loss contracts related to service in the consolidated statement of operations. A key component of these estimates is the expected future service costs. In estimating the expected future costs, the Company considers its current service cost level and applies significant judgment related to expected cost saving initiatives. The expected future cost savings will be primarily dependent upon the success of the Company’s initiatives related to increasing stack life, achieving better economies of scale for service labor, and improvements in design and operations of infrastructure. If the expected cost saving initiatives are not realized, this will increase the costs of providing services and could adversely affect our estimated contract loss accrual. If actual service costs over the remaining term of existing extended maintenance contracts are 10% more than estimated in the determination of the loss accrual for fuel cell systems and related infrastructure at December 31, 2020, the loss accrual would have been approximately $7.1 million higher.
The following table shows the rollforward of balance in the accrual for loss contracts, including changes due to the passage of time, additions and changes in estimates (in thousands):
| | | | | | | | | | December 31, 2020 | | December 31, 2019 | | December 31, 2018 | | | | | | (as restated) | | | (as restated) | Beginning Balance | $ | 3,702 | | $ | 5,345 | | $ | — | Provision (benefit) for Loss Accrual | | 35,473 | | | (394) | | | 5,345 | Released to Service Cost of Sales | | (2,348) | | | (1,249) | | | — | Released to Provision for Warrants | | (12,814) | | | — | | | — | Ending Balance | $ | 24,013 | | $ | 3,702 | | $ | 5,345 |
Equity Instruments
Common stock warrants that meet certain applicable requirements of ASC Subtopic 815-40, Derivatives and Hedging – Contracts in Entity’s Own Equity, and other related guidance, including the ability of the Company to settle the warrants without the issuance of registered shares or the absence of rights of the grantee to require cash settlement, are
accounted for as equity instruments. The Company classifies these equity instruments within additional paid-in capital on the consolidated balance sheets.
Common stock warrants accounted for as equity instruments represent the warrants issued to Amazon and Walmart as discussed in Note 18, “Warrant Transaction Agreements.” The Company adopted FASB Accounting Standards Update 2019-08, Compensation – Stock Compensation (Topic 718) and Revenue from Contracts with Customers (Topic 606) (ASU 2019-08), which requires entities to measure and classify share-based payment awards granted to a customer by applying the guidance under Topic 718, as of January 1, 2019.
In order to calculate warrant charges, the Company used the Black-Scholes pricing model, which required key inputs including volatility and risk-free interest rate and certain unobservable inputs for which there is little or no market data, requiring the Company to develop its own assumptions. The Company estimated the fair value of unvested warrants, considered to be probable of vesting, at the time. Based on that estimated fair value, the Company determined warrant charges, which are recorded as a reduction of revenue in the consolidated statement of operations.
Recent Accounting Pronouncements
Recently Adopted Accounting Pronouncements
In June 2016, ASU 2016-13, Financial Instruments – Credit Losses (Topic 326): Measurement of Credit Losses on Financial Instruments, was issued. Also, in April 2019, Accounting Standards Update (ASU) 2019-04, Codification Improvements to Topic 326, Financial Instruments – Credit Losses, Topic 815, Derivatives and Hedging, and Topic 825, Financial Instruments, was issued to make improvements to updates 2016-01, Financial Instruments – Overall (Subtopic 825-10), 2016-13, Financial Instruments – Credit Losses (Topic 326) and 2017-12, Derivatives and Hedging (Topic 815). ASU 2016-13 significantly changes how entities account for credit losses for financial assets and certain other instruments, including trade receivables and contract assets, that are not measured at fair value through net income. The ASU requires a number of changes to the assessment of credit losses, including the utilization of an expected credit loss model, which requires consideration of a broader range of information to estimate expected credit losses over the entire lifetime of the asset, including losses where probability is considered remote. Additionally, the standard requires the estimation of lifetime expected losses for trade receivables and contract assets that are classified as current. The Company adopted these standards effective January 1, 2020 and determined the impact of the standards to be immaterial to the consolidated financial statements.
In January 2017, ASU 2017-04, Intangibles – Goodwill and Other (Topic 350), was issued to simplify how an entity is required to test goodwill for impairment by eliminating Step 2 from the goodwill impairment test. Step 2 measures a goodwill impairment loss by comparing the implied fair value of a reporting unit’s goodwill with the carrying amount of that goodwill. The Company adopted this standard effective January 1, 2020 and determined there to be no impact to the consolidated financial statements.
Recently Issued and Not Yet Adopted Accounting Pronouncements
In August 2020, the FASB issued ASU 2020-06, Debt - Debt with Conversion and Other Options (Subtopic 470-20) and Derivatives and Hedging – Contracts in Entity's Own Equity (Subtopic 815-40): Accounting for Convertible Instruments and Contracts in an Entity's Own Equity (“ASU 2020-06”). This ASU simplifies the complexity associated with applying GAAP for certain financial instruments with characteristics of liabilities and equity. More specifically, the amendments focus on the guidance for convertible instruments and derivative scope exception for contracts in an entity’s own equity. Under ASU 2020-06, the embedded conversion features are no longer separated from the host contract for convertible instruments with conversion features that are not required to be accounted for as derivatives under Topic 815, or that do not result in substantial premiums accounted for as paid-in capital. Consequently, a convertible debt instrument, such as the Company’s 3.75% Convertible Senior Notes, will be accounted for as a single liability measured at its amortized cost, as long as no other features require bifurcation and recognition as derivatives. The new guidance also requires the if-converted method to be applied for all convertible instruments and requires additional disclosures. This guidance is required to be adopted by January 1, 2022, and early adoption is permitted, but no earlier than fiscal years beginning after December 15, 2020. The Company has elected to early adopt this guidance on January 1, 2021 using the modified retrospective method. Under this transition method, the cumulative effect of accounting change removed the impact of recognizing the equity component of the Company’s convertible notes at issuance and the subsequent accounting impact of additional interest expense from debt discount amortization. The cumulative effect of the accounting change
upon adoption on January 1, 2021 increased the carrying amount of the convertible notes by $120.7 million, reduced accumulated deficit by $9.5 million and reduced additional paid-in capital by $130.2 million. Future interest expense of the convertible notes will be lower as a result of adoption of this guidance and net loss per share will be computed using the if-converted method for convertible instruments.
In March 2020, ASU 2020-04, Reference Rate Reform (Topic 848): Facilitation of the Effects of Reference Rate Reform on Financial Reporting, was issuedpledge to provide temporary optional expedientseveryone at Plug with equal opportunity to grow and exceptions todevelop, leveraging the GAAP guidance on contract modificationsunique skills and hedge accounting to ease the financial reporting burdens related to the expected market transition from the London Interbank Offered Rate (LIBOR)differences of their individual background, characteristics, and other interbank offered rates to alternative reference rates. This update was effective starting March 12, 2020 and the Company may elect to apply the amendments prospectively through December 31, 2022. The adoption of this standard does not have a material impact on the Company’s consolidated financial statements.
aspirations.
In March 2020, ASU 2020-03, Codification Improvements to Financial Instruments, was issued to make various codification improvements to financial instruments to make the standards easier to understand and apply by eliminating inconsistencies and providing clarifications. This update will be effective at various dates beginning with date of issuance of this ASU. The adoption of this standard does not have a material impact on the Company’s consolidated financial statements.
In December 2019, ASU 2019-12, Simplifying the Accounting for Income Taxes, was issued to identify, evaluate, and improve areas of GAAP for which cost and complexity can be reduced while maintaining or improving the usefulness of the information provided to users of financial statements. This update will be effective beginning after December 15, 2020. The adoption of this standard does not have a material impact on the Company’s consolidated financial statements.
Item 7A. Quantitative and Qualitative Disclosures about Market Risk
From time to time, we may invest our cash in government, government backed and interest-bearing investment-grade securities that we generally hold for the duration of the term of the respective instrument. We do not utilize derivative financial instruments, derivative commodity instruments or other market risk sensitive instruments, positions or transactions in any material fashion, except for the Capped Call purchased in May 2020, and March 2018, respectively, related to the issuance of the 3.75% Convertible Senior Notes and 5.5% Convertible Senior Notes. Additionally, the Company purchased a Common Stock forward in March 2018 in conjunction with the issuance of the 5.5% Convertible Senior Notes. That Common Stock Forward was extended upon issuance of the 3.75% Convertible Senior Notes. We are not subject to any material risks arising from changes in interest rates, foreign currency exchange rates, commodity prices, equity prices or other market changes that affect market risk sensitive instruments.
Our exposure to changes in foreign currency rates is primarily related to sourcing inventory from foreign locations and operations of HyPulsion, S.A.S., our French subsidiary that develops and sells hydrogen fuel cell systems for the European material handling market. This practice can give rise to foreign exchange risk resulting from the varying cost of inventory to the receiving location. The Company reviews the level of foreign content as part of its ongoing evaluation of overall sourcing strategies and considers the exposure to be not significant. Our HyPulsion exposure presently is mitigated by low levels of operations and its sourcing is primarily intercompany in nature and denominated in U.S. dollars.
Item 8. Financial Statements and Supplementary Data
The Company’s consolidated financial statements and related notes, together with the report of independent registered public accounting firm, appear at pages F-1 through F-83 of this Annual Report on Form 10-K for the year ended December 31, 2020 and are incorporated by reference in this Item 8.
Item 9. Changes in and Disagreements with Accountants on Accounting and Financial Disclosure
None.
Item 9A. Controls and Procedures
| (a) | Evaluation of Disclosure Controls and Procedures |
| ● | Inclusion: We maintain disclosure controlsare on a journey to cultivate inclusivity as an organization. At Plug, we are transparent and procedures that are designed to ensure that information required to be disclosed in our reportscollaborative, welcoming ideas, thoughts, and questions from everyone. We respect different strengths and viewpoints, understanding that we file or submit underare stronger together. Perspectives from the Exchange Act, is recorded, processed, summarized and reported within the time periods specified in SEC rules and forms, andcollective whole make us better, as we know that such information is accumulated and communicated to our management, including our Chief Executive Officer (our principal executive officer) and Chief Financial Officer (our principal financial officer) as appropriate, to allow for timely decisions regarding required disclosure.
Our management, with the participationwe are all part of our Chief Executive Officer and Chief Financial Officer, has evaluated the effectiveness of our disclosure controls and procedures (as defined in Rules 13a-15(e) and 15d-15(e) under the Exchange Act), as of December 31, 2020. Based on such evaluation, our Chief Executive Officer and Chief Financial Officer have concluded that as of December 31, 2020, our disclosure controls and procedures were not effective because of the material weakness in internal control over financial reporting described below.
Notwithstanding such material weakness in internal control over financial reporting, our management, including our Chief Executive Officer and Chief Financial Officer, has concluded that our consolidated financial statements as of and for the year ended December 31, 2020 and our restated consolidated balance sheets as of December 31, 2019 and the related consolidated statements of operations and consolidated statements of cash flows for the fiscal years ended December 31, 2019 and 2018, present fairly, in all material respects, our financial position, results of our operations and our cash flows for the periods presented in this Annual Report on Form 10-K, in conformity with GAAP.
| (b) | Management’s Annual Report on Internal Control over Financial Reporting |
Management is responsible for establishing and maintaining adequate internal control over financial reporting (as defined in Rules 13a-15(f) and 15d-15(f) under the Exchange Act). Our internal control over financial reporting includes controls and procedures designed to provide reasonable assurance regarding the reliability of financial reporting and the preparation of financial statements for external reporting purposes in accordance with GAAP.
The Company’s management, with the participation of our Chief Executive Officer and Chief Financial Officer, under the oversight of our Board, conducted an evaluation of the effectiveness of our internal control over financial reporting as of December 31, 2020, based on the criteria established in Internal Control -- Integrated Framework (2013) issued by the Committee of Sponsoring Organizations of the Treadway Commission. The Company acquired Giner ELX and UHG (together, the “Acquired Companies”) during 2020, and management excluded from its assessment of the effectiveness of the Company’s internal control over financial reporting as of December 31, 2020, the Acquired Companies’ internal control over financial reporting associated with total assets of $58.0 million, excluding goodwill and intangible assets of $94.9 million and total revenues of $7.8 million included in the consolidated financial statements of the Company as of and for the year ended December 31, 2020. Based on such evaluation, management concluded that, as of December 31, 2020, our internal control over financial reporting was not effective because of the material weakness described below.
A company’s internal control over financial reporting includes those policies and procedures that (1) pertain to the maintenance of records that, in reasonable detail, accurately and fairly reflect the transactions and dispositions of the assets of the company; (2) provide reasonable assurance that transactions are recorded as necessary to permit preparation of financial statements in accordance with GAAP, and that receipts and expenditures of the company are being made only in accordance with authorizations of management and directors of the company; and (3) provide reasonable assurance regarding prevention or timely detection of unauthorized acquisition, use, or disposition of the company’s assets that could have a material effect on the financial statements.
A material weakness is a deficiency, or a combination of deficiencies, in internal control over financial reporting such that there is a reasonable possibility that a material misstatement of our annual or interim financial statements will not be prevented or detected on a timely basis.
Management identified the following deficiency in internal control over financial reporting as of December 31, 2020: the Company did not maintain a sufficient complement of trained, knowledgeable resources to execute its responsibilities with respect to internal control over financial reporting for certain financial statement accounts and
disclosures. As a consequence, the Company did not conduct an effective risk assessment process that was responsive to changes in the Company's operating environment and did not design and implement effective process-level controls activities in the following areas:
| (a) | presentation of operating expenses;something bigger than ourselves. |
| (b) | accounting for lease-related transactions;The Company also strives to promote diversity on its Board of Directors (the “Board” or “Board of Directors”) and in leadership roles throughout the Company. Currently, three of the Company’s 10 directors are female, and two of the Company’s 10 directors identify as an under-represented minority. The Company’s commitment to diversity throughout the organization is further enhanced by policies related to various aspects of employment, including but not limited to, recruiting, selecting, hiring employment placement, job assignment, compensation, access to benefits, selection for training, use of facilities, and participation in Company-sponsored employee activities. To progress further on our Diversity, Equity and Inclusion (“DEI”) initiatives such as recruitment, talent development, and equitable compensation packages, we have established a Diversity, Equity and Inclusion Policy. Our DEI Policy recognizes that our individual differences – backgrounds, experiences, identities, and perspectives ��� drive the creativity and innovation fueling Plug Power’s growth. Plug supports various diversity, equity, and inclusion efforts throughout its operations, and these efforts include a focus on: | ● | Recruiting and retaining talent from diverse backgrounds; |
| ● | Creating awareness of diversity issues and benefits including training on conduct that can be perceived as discriminatory and/or harassing and how to report such behaviors; |
| ● | Supporting our employees’ learning and development, so that they can reach their full potential; |
| ● | Fostering a more supportive environment where inclusivity is expected and prioritized; and |
| ● | Embedding accountability for diversity throughout the organization. |
| (c) | identification and evaluation of impairment, accrual for loss contracts, certain expense accruals, and deemed dividends; and |
| (d) | timely identification of adjustments to physical inventory in interim periods. |
Certain of these deficiencies resulted in material misstatements that were identified and corrected in the consolidated financial statements as of and for each of the three years in the period ended December 31, 2020 and other historical periods, as further described in Note 2, “Restatement of Previously Issued Consolidated Financial Statements,” and Note 3, “Unaudited Quarterly Financial Data and Restatement of Previously Issued Unaudited Interim Condensed Consolidated Financial Statements,” to the consolidated financial statements. Because there is a reasonable possibility that material misstatement of the consolidated financial statements will not be prevented or detected on a timely basis, we concluded the deficiency represents a material weakness in our internal control over financial reporting and our internal control over financial reporting was not effective as of December 31, 2020.
The Company’s independent registered public accounting firm, KPMG LLP, who audited the consolidated financial statements included in this Annual Report on Form 10-K issued an adverse opinion on the effectiveness of the Company’s internal control over financial reporting. KPMG LLP’s report appears on page F-2 of this Annual Report on Form 10-K.
Remediation Activities
We take this material weakness seriously. We have already taken steps to remediate this material weakness and will continue to take further steps until such remediation is complete. These steps include the following:
Additionally, we work specifically with veteran recruitment firms and are proud of our efforts to hire those who have served and continue to serve in the armed forces. As of December 31, 2022, we had a 290 person veteran workforce. | a) | Hiring additional resources, including third-party resources, with the appropriate technical accounting expertise, and strengthening internal training, to assist us in identifying and addressing any complex technical accounting issues that affect our consolidated financial statements. |
Engagement | b) | We will design and implement a comprehensive and continuous risk assessment process to identify and assess risks of material misstatements and ensure that the impacted financial reporting processes and related internal controls are properly designed, maintained, and documented to respond to those risks in our financial reporting. |
We believe that listening to our employees is key to providing a work environment that is inclusive and results in a motivated and engaged workforce. We regularly conduct anonymous employee surveys to understand where we have opportunities to improve and solicit ideas from employees. Several initiatives have been launched, such as focus groups with Human Resources and leadership and hiring an employee engagement and inclusion manager to focus on these efforts. We conduct regular employee engagement surveys to measure progress and satisfaction with a range of initiatives. In our most recent survey in August 2022, employees indicated they would recommend Plug as a great place to work and they are happy working at Plug. The insights from the most recent survey allowed us to review employee feedback at each function and Business Unit level to drive impactful action, including developing specific training programs to improve and enhance technical processes and increasing team collaboration and effectively using meeting time to foster focus and clarity. Plug’s top strengths were prospects, purpose, and authenticity. Employees indicated they were excited about Plug’s future; they believe they are doing meaningful work at Plug and feel comfortable being themselves at work. | c) | We will implement more structured analysis and review procedures and documentation for the application of GAAP, complex accounting matters, and key accounting policies. |
We also believe that transparency and communication are key elements of the Company’s culture. Since the onset of the COVID-19 pandemic, a weekly all employee meeting led by our Chief Executive Officer and Executive Vice President of Human Resources provide information on safety measures as relates to the Company’s practice on COVID-19. The meeting also includes a timely business topic delivered by a subject matter expert within the Company. This provides timely information and opportunities for upcoming leaders to develop their presentation skills, and aims to align the workforce with the Company’s vision, strategy, and objectives. An open question and answer session is hosted as part of the weekly employee meeting by the Chief Executive Officer, in which employees are encouraged to submit questions and can do so anonymously if they prefer. | d) | We will augment our current estimation policies and procedures to be more robust and in-line with overall market dynamics including an evaluation of our operating environment in order to ensure operating effectiveness of certain process-level control activities. |
Community Involvement | e) | We also intend to deploy new tools and tracking mechanisms to help enhance and maintain the appropriate documentation surrounding our classification of operating expenses. |
We recognize the importance of supporting our local communities as we continue to grow as an organization. Our efforts not only provide value back to our community members but enables our employees to give back, helping them to meet their own values. We also facilitate employee donations through the United Way, supporting its four pillar objectives helping our communities, which includes the (1) ability to meet basic needs, (2) education leading to a good job, (3) income providing financial security, and (4) an ability to gain and maintain health. This system enables our employees to donate money to causes they care about in their individual communities through payroll deductions. | f) | We will report regularly to the Company’s Audit Committee on the progress and results of the remediation plan, including the identification, status, and resolution of internal control deficiencies. |
As we work to improve our internal control over financial reporting, we may modify our remediation plan and may implement additional measures as we continue to review, optimize and enhance our financial reporting controls and procedures in the ordinary course. The material weakness will not be considered remediated until the remediated controls have been operating for a sufficient period of time and can be evidenced through testing that they are operating effectively.
66
Additionally, in 2022, we launched a global volunteer time off policy to support activities that serve the communities in which we live and work in ways that are meaningful, impactful, and help those in need. Plug recognizes that participating in philanthropic activities enriches the lives of its employees and its communities. Performance Management and Incentives Our full-year performance management process begins with setting annual goals for the Company, which guide the development of functional and individual employee goals. Employees and their managers are accountable for goals and must review performance against the goals on an ongoing basis. We provide employee base wages that are competitive and consistent with employee positions, skill levels, experience, and location. Additionally, we believe that individual performance and the results of the Company are directly linked to payment of annual short-term incentive compensation. Employees may also be granted equity compensation awards with multi-year vesting for retention. Talent Our talent strategy is a balance of attracting external talent, combined with an internal mobility practice that encourages career growth and opportunity to progress within Plug. We leverage both internal and external recruitment resources and incentivize our current employees to refer talent they recommend as future employees of Plug. Enculturation of new hires begins immediately upon acceptance of an offer from Plug by leveraging technology to introduce them to the organization and their teams. A new hire onboarding program is delivered bi-weekly to continue the assimilation process and ensure that the workforce is prepared to succeed in their new career endeavor. Plug values the unique skills and competencies of our diverse workforce. A key component to planning for individual career growth aligned with organizational growth is learning and development. We offer the entire workforce a subscription to on-line learning that includes thousands of professionally created on-demand webinars and podcasts. Additionally, we have offered remote led leadership training throughout the COVID-19 pandemic with plans to continue in this new remote and hybrid environment. We also offer a tuition reimbursement program, where employees are provided support for continuing their education. On the job training, combined with face-to-face and remote skill training are utilized in many functions, as well as virtual reality skill training to ensure that skills are refreshed regularly. We use a comprehensive training matrix in certain areas and web-based learning to make sure we meet both regulatory requirements and our own standards. Besides job-specific safety training, we offer personal-development training on many topics, including sustainability and wellness. Additional development opportunities include opportunities to participate in employee led groups that develop leadership and project management capabilities while contributing to our purpose and mission. On-line participation in internally developed business-related courses called Plugology is encouraged for all employees and helps newly hired employees assimilate to the business. Compensation and Benefits As part of our commitment to our people, Plug offers employees competitive benefits, including health, vision, and dental plans, flexible spending accounts, comprehensive life insurance (including company provided life insurance), and disability coverage. Additionally, employees are offered a vacation and holiday package, an employee referral bonus program, educational assistance, and volunteer time. We also offer a comprehensive wellness program that is designed to promote long-term healthy, active lifestyles and our Fitness Reimbursement Program provides up to $1,200 per year to accommodate employees’ wellness activities. In 2022, we also launched a paid parental leave policy to aid in bonding time for new parents. At Plug, 92.9% of our employees participate in our comprehensive 401(k) package that includes a 401(k)-retirement savings plan, which offers up to a 5% match in Plug stock. To encourage savings, we auto-enroll all employees in the plan after 60 days of employment. Our portfolio reflects our values with increased priority given to socially responsible investing — the plan’s diversified investment options include two socially responsible funds. Additionally, we have an internal Step Pay Program which provides our Field Service Technicians an outlined career path of training for eight separate levels to grow their skills and compensation. The Company believes that identifying and developing the next generation of business leaders is important to its long-term success and is proud to support employees in furthering their education with tuition reimbursement plans and training. COVID-19 Health Measures While we no longer enforce our prior COVID-19 policies with respect to weekly COVID-19 testing, face coverings, or daily COVID-19 questionnaires, we continue to monitor the COVID-19 pandemic and emerging variants and remain prepared to adjust our policies and safety protocols in line with guidance from state and federal agencies. Employees are still expected to remain home if they are not feeling well and should contact our COVID team for future guidance. Furthermore, we have resumed all commercial air travel and all other non-critical travel, while also allowing employees to resume their personal travel. We have enabled third-party access to our facilities and are continuing our normal janitorial and sanitary procedures. We are no longer requiring staggered shifts in our manufacturing facilities and are offering hybrid work schedules to those whose job function enabled them to do so. The COVID-19 pandemic has caused significant transportation challenges for global suppliers and we expect that these challenges will continue to have an impact on our businesses for the foreseeable future. We continue to take proactive steps to limit the impact of these challenges and are working closely with our suppliers and transportation vendors to ensure availability of products and implement other cost savings initiatives. In addition, we continue to invest in our supply chain to improve its resilience with a focus on automation, dual sourcing of critical components and localized manufacturing when feasible. To date, there has been limited disruption to the availability of our products related to COVID-19, though it is possible that more significant disruptions could occur if these supply chain challenges continue. Available Information Our Annual Report on Form 10-K, Quarterly Reports on Form 10-Q, Current Reports on Form 8-K, including exhibits, and amendments to those reports filed or furnished pursuant to Section 13(a) or 15(d) of the Exchange Act are available free of charge, other than an investor’s own internet access charges, on the Company’s website at www.plugpower.com as soon as reasonably practicable after the Company electronically files such material with, or furnishes it to, the SEC. The information contained on our website is not included as a part of, or incorporated by reference into, this Annual Report on Form 10-K. The SEC also maintains an internet site that contains reports, proxy and information statements, and other information regarding issuers that file electronically with the SEC. The SEC’s website address is http://www.sec.gov. We may announce material business and financial information to the public about us, our products and services, and other matters through a variety of means, including filings with the SEC, press releases, public conference calls, webcasts, the investor relations section of our website (www.ir.plugpower.com) and our Twitter account at @PlugPowerInc in order to achieve broad, non-exclusionary distribution of information to the public and for complying with our disclosure obligations under Regulation FD. We encourage investors, the media, and others interested in Plug to follow the foregoing channels and review the information that we make available on such channels, in addition to following our filings with the SEC. Item 1A. Risk Factors The following risk factors should be considered carefully in addition to the other information in this Annual Report on Form 10-K. The occurrence of any of the following material risks could harm our business and future results of operations and could result in the trading price of our common stock declining and a partial or complete loss of your investment. These risks are not the only ones that we face. Additional risks not presently known to us or that we currently consider immaterial may also impair our business operations and trading price of our common stock. The discussion contained in this Annual Report on Form 10-K contains “forward-looking statements” within the meaning of Section 27A of the Securities Act and Section 21E of the Exchange Act, that involve risks and uncertainties. Refer to the section entitled “Forward-Looking Statements.” A. MARKET RISKS We may be unable to successfully execute and operate our green hydrogen production projects and such projects may cost more and take longer to complete than we expect. As part of our vertical integration strategy, the Company is developing and constructing green hydrogen production facilities at locations across the United States and Europe. Our ability to successfully complete and operate these projects is not guaranteed. These projects will impact our ability to meet and supplement the hydrogen demands for our products and services, for both existing and prospective customers. Our hydrogen production projects are dependent, in part, upon the Company’s ability to meet our internal demand for electrolyzers required for such projects. Electrolyzer demand by external customers may concurrently affect the Company’s ability to meet the internal electrolyzer demand from our hydrogen production projects. The timing and cost to complete the construction of our hydrogen production projects are subject to a number of factors outside of our control and such projects may take longer and cost more to complete and become operational than we expect. The viability and competitiveness of our green hydrogen production facilities will depend, in part, upon favorable laws, regulations, and policies related to hydrogen production. Some of these laws, regulations, and policies are nascent, and there is no guarantee that they will be favorable to our projects. Additionally, our facilities will be subject to numerous and new permitting, regulations, laws, and policies, many of which might vary by jurisdiction. Hydrogen production facilities are also subject to robust competition from well-established multinational companies in the energy industry. There is no guarantee that our hydrogen production strategy will be successful, amidst this competitive environment. Our products and performance depend largely on the availability of hydrogen gas and an insufficient supply of hydrogen could negatively affect our sales and deployment of our products and services. Our products and services depend largely on the availability of hydrogen gas. Although we are in the process of building multiple hydrogen production plants, our business could be materially and adversely affected by an inadequate availability of hydrogen or failure to secure hydrogen supply at competitive prices. There is no assurance that our hydrogen production will scale at the rate we anticipate or that we will complete hydrogen production plants on schedule. Additionally, we are dependent upon hydrogen suppliers to provide us with hydrogen gas for the commercialization of our products and services. If these fuels are not readily available or if their prices are such that energy produced by our products costs more than energy provided by other sources, then our products could be less attractive to potential users and our products’ value proposition could be negatively affected. If hydrogen suppliers elect not to participate in the material handling market, there may be an insufficient supply of hydrogen for this market that could negatively affect our sales and deployment of our products and services. We face risks associated with our plans to market, distribute, and service our products and services internationally. We market, distribute, sell and service our product offerings internationally and expect to continue investing in our international operations. We have limited experience operating internationally, including developing and manufacturing our products to comply with the commercial and legal requirements of international markets. Our success in international markets will depend, in part, on our ability and that of our partners to secure relationships with foreign sub-distributors, and our ability to manufacture products that meet foreign regulatory and commercial requirements. Additionally, our planned international operations are subject to other inherent risks, including potential difficulties in enforcing contractual obligations and intellectual property rights in foreign countries, and could be adversely affected due to, among other things, fluctuations in currency exchange rates, political and economic instability, acts or threats of terrorism, changes in governmental policies or policies of central banks, expropriation, nationalization and/or confiscation of assets, price controls, fund transfer restrictions, capital controls, exchange rate controls, taxes, unfavorable political and diplomatic developments, changes in legislation or regulations and other additional developments or restrictive actions over which we will have no control. Doing business in foreign markets requires us to be able to respond to rapid changes in market, legal, and political conditions in these countries. As we expand in international markets, including but not limited to joint ventures involving potential business activities in, Europe, South Korea, India, Vietnam, and elsewhere, we may face numerous challenges. Such challenges might include unexpected changes in regulatory requirements; potential conflicts or disputes that countries may have to deal with, among other things, data privacy requirements; labor laws and anti-competition regulations; export or import restrictions; laws and business practices favoring local companies; fluctuations in currency exchange rates; longer payment cycles and difficulties in collecting accounts receivables; difficulties in managing international operations; potentially adverse tax consequences, tariffs, customs charges, bureaucratic requirements and other trade barriers; restrictions on repatriation of earnings; and the burdens of complying with a wide variety of international laws. We face risks associated with our plans to market, distribute, and service our products and services internationally and any of these factors could adversely affect our results of operations and financial condition. The success of our international expansion will depend, in part, on our ability to succeed in navigating the different legal, regulatory, economic, social, and political environments. The current inflationary trends, economic downturn and weakness in the economy, market trends, and other conditions affecting the profitability and financial stability of our customers could negatively impact our sales growth and results of operations. The demand for our products and services is sensitive to the production activity, capital spending and demand for products and services of our customers worldwide. In recent months, we have observed increased economic uncertainty in the United States and abroad, including inflation and higher interest rates. Impacts of such economic weakness include falling overall demand for goods and services, leading to reduced profitability, reduced credit availability, higher borrowing costs, reduced liquidity, volatility in credit, equity and foreign exchange markets, and bankruptcies. These developments have led to supply chain disruption and transportation delays which have caused incremental freight charges, which have negatively impacted our business and our results of operations. In addition, as our customers react to global economic conditions and the potential for a global recession, we have seen them reduce spending on our products and take additional precautionary measures to limit or delay expenditures and preserve capital and liquidity. Reductions in spending on our solutions, delays in purchasing decisions, lack of renewals, inability to attract new customers, uncertainty about business continuity as well as pressure for extended billing terms or pricing discounts, could limit our ability to grow our business and negatively affect our operating results and financial condition. Additionally, many of our customers operate in markets that may be impacted by market uncertainty, trade and tariff policies, costs of goods sold, currency exchange rates, central bank interest rate changes, foreign competition, offshoring of production, oil and natural gas prices, geopolitical developments, labor shortages, inflation, and a variety of other factors beyond our control. Any of these factors could cause customers to idle or close facilities, delay purchases, reduce production levels, or experience reductions in the demand for their own products or services, and other conditions affecting the profitability and financial stability of our customers could negatively impact our sales growth and results of operations. Our products and services face intense competition. The markets for energy products, including PEM fuel cells, electrolyzers, and hydrogen production are intensely competitive. Our recent expansion into electrolyzer manufacturing and hydrogen production similarly faces robust competition — both from incumbent companies and new emerging business interests in the United States and abroad. Some of our competitors are much larger than we are and may have the manufacturing, marketing and sales capabilities to complete research, development, and commercialization of products more quickly and effectively than we can. There are many companies engaged in all areas of traditional and alternative energy generation in the United States and abroad, including, among others, major electric, oil, chemical, natural gas, battery, generator and specialized electronics firms, as well as universities, research institutions and foreign government-sponsored companies. These firms are engaged in forms of power generation such as advanced battery technologies, generator sets, fast charged technologies and other types of fuel cell technologies. Well established companies might similarly seek to expand into new types of energy products, including PEM fuel cells, electrolyzers, or hydrogen production. Additionally, some competitors may rely on other different competing technologies for fuel cells, electrolyzers, or hydrogen production. We believe our technologies have many advantages. In the near future, we expect the demand for our products — electrolyzers in particular — to largely offset any hypothetical market preference for competing technologies. However, changes in customer preferences, the marketplace, or government policies could favor competing technologies. The primary current value proposition for our fuel cell customers stems from productivity gains in using our solutions. Longer term, given evolving market dynamics and changes in alternative energy tax credits, if we are unable to successfully develop future products that are competitive with competing technologies in terms of price, reliability and longevity, customers may not buy our products. Technological advances in alternative energy products, battery systems or other fuel cell, electrolyzer, or hydrogen technologies may make our products less attractive or render them obsolete. Volatility in commodity prices and product shortages may adversely affect our gross margins. Some of our products contain commodity-priced materials. Commodity prices and supply levels affect our costs. For example, nickel, platinum and iridium are key materials in our PEM fuel cells, electrolyzers, and hydrogen infrastructure. Both platinum and iridium are scarce natural resources, and we are dependent upon a sufficient supply of these commodities. These resources may become increasingly difficult to source due to various cost, geopolitical, or other reasons, which in turn might have a material adverse effect on our business. While we do not anticipate significant near- or long-term shortages in the supply of platinum or iridium, a shortage could adversely affect our ability to produce commercially viable PEM fuel cells, PEM electrolyzers, or hydrogen production facilities, or raise our cost of producing such products and services. In addition, global inflationary pressures have recently increased, which could potentially increase commodity price volatility. Our ability to pass on such increases in costs in a timely manner depends on market conditions, and the inability to pass along cost increases could result in lower gross margins. We will continue to be dependent on certain third-party key suppliers for components in our products. The failure of a supplier to develop and supply components in a timely manner or at all, or our inability to obtain substitute sources of these components on a timely basis or on terms acceptable to us, could impair our ability to manufacture our products or could increase our cost of production. We rely on certain key suppliers for critical components in our products, and there are numerous other components for our products that are sole sourced. If we fail to maintain our relationships with our suppliers or build relationships with new suppliers, or if suppliers are unable to meet our demand, we may be unable to manufacture our products, or our products may be available only at a higher cost or after a delay. The Company has experienced and may continue to experience supply chain-related delays for components of product lines, hydrogen generation projects, and manufacturing facilities. In addition, to the extent that our supply partners use technology or manufacturing processes that are proprietary, we may be unable to obtain comparable components from alternative sources. Furthermore, we may become increasingly subject to domestic content sourcing requirements and Buy America preferences, as required by federal infrastructure funding and various tax incentives in the United States, and we may become subject in the future to domestic sourcing requirements that may become relevant to the European Union. Domestic content preferences potentially mandate our Company to source certain components and materials from United States-based suppliers and manufacturers. Conformity with these provisions potentially depends upon our ability to increasingly source components or materials from within the United States. An inability to meet these requirements could have a material adverse effect on the Company’s ability to successfully leverage tax incentives or compete for certain federal infrastructure funding sources imposing such mandates. In addition, the failure of a supplier to develop and supply components in a timely manner or at all, or to develop or supply components that meet our quality, quantity and cost requirements, or our inability to obtain substitute sources of these components on a timely basis or on terms acceptable to us, could impair our ability to manufacture our products or could increase our cost of production. If we cannot obtain substitute materials or components on a timely basis or on acceptable terms, we could be prevented from delivering our products to our customers within required timeframes. Any such delays have resulted and could continue to result in sales and installation delays, cancellations, penalty payments or loss of revenue and market share, any of which could have a material adverse effect on our business, results of operations, and financial condition. We depend on a concentration of pedestal customers for the majority of our revenues and the loss of any of these customers would adversely affect our business, financial condition, results of operations, and cash flows. We sell most of our products to a range of customers that include a few pedestal customers, and while we are continually seeking to expand our customer base, we expect this will continue for the next several years. Total revenue in 2022 for Amazon was $97.5 million, which included a provision for warrant charges of $5.6 million. For the year ended December 31, 2022, Amazon accounted for 14% of our total consolidated revenues. Total revenue in 2021 for Amazon was $205.1 million, which included a provision for warrant charges of $0.5 million. For the year ended December 31, 2021, Amazon accounted for 40.8% of our total consolidated revenues. Any decline in business with significant customers could have an adverse impact on our business, financial condition, and results of operations. Our future success is dependent upon the continued purchases of our products by a small number of customers. If we are unable to broaden our customer base and expand relationships with potential customers, our business will continue to be impacted by demand fluctuations due to our dependence on a small number of customers. Demand fluctuations can have a negative impact on our revenues, business, financial condition, results of operations and cash flows. Our dependence on a small number of major customers exposes us to additional risks. A slowdown, delay or reduction in a customer’s orders could result in excess inventories or unexpected quarterly fluctuations in our operating results and liquidity. Each of our major customers has significant purchasing leverage over us to require changes in sales terms including pricing, payment terms and product delivery schedules, which could adversely affect our business, financial condition, results of operations and cash flows. In addition, as of December 31, 2022, one customer comprised approximately 24.9% of the total accounts receivable balance. At December 31, 2021, one customer comprised approximately 46.6% of the total accounts receivable balance. If one of our major customers delays payment of or is unable to pay their receivables, that could have a material adverse effect on our business, financial condition, results of operations and cash flows. Rising inflation rates may adversely affect our financial results. Global inflationary pressures, particularly in the United States, have increased recently to levels not seen in recent years, which could potentially increase commodity price volatility, increased operating costs (including our labor costs) and reduced liquidity. In addition, the United States Federal Reserve has raised, and may again raise, interest rates in response to concerns about inflation, which may result in limitations on our ability to access credit or otherwise raise debt and equity capital. Our ability to pass on such increases in costs in a timely manner depends on market conditions, and the inability to pass along cost increases could result in lower gross margins. Increases in interest rates, especially if coupled with reduced government spending and volatility in financial markets, may have the effect of further increasing economic uncertainty and heightening these risks. In an inflationary environment, we may be unable to raise the sales prices of our products and services at or above the rate at which our costs increase, which could reduce our profit margins and have a material adverse effect on our financial results. We also may experience lower than expected sales and potential adverse impacts on our competitive position if there is a decrease in consumer spending or a negative reaction to our pricing. A reduction in our revenue would be detrimental to our financial condition and could also have an adverse impact on our future growth. Our ability to source parts and raw materials from our suppliers could be disrupted or delayed in our supply chain which could adversely affect our results of operations. Our operations require significant amounts of necessary parts and raw materials. We deploy a continuous, companywide process to source our parts and raw materials from fewer suppliers, and to obtain parts from suppliers in low-cost countries where possible. If we are unable to source these parts or raw materials, our operations may be disrupted, or we could experience a delay or halt in certain of our manufacturing operations. We believe that our supply management and production practices are based on an appropriate balancing of the foreseeable risks and the costs of alternative practices. Nonetheless, reduced availability or interruption in supplies, whether resulting from more stringent regulatory requirements, supplier financial condition, increases in duties and tariff costs, disruptions in transportation, an outbreak of a severe public health pandemic, such as the COVID-19 pandemic, including resurgences and the emergence of new variants, severe weather, or the occurrence or threat of wars or other conflicts, could have an adverse effect on our financial condition, results of operations and cash flows. For example, the Company has experienced supply chain issues related to the COVID-19 pandemic, including but not limited to suppliers utilizing force majeure provisions under existing contracts. Furthermore, the ongoing global economic recovery from the COVID-19 pandemic has caused significant challenges for global supply chains resulting in inflationary cost pressures, component shortages, and transportation delays. We expect that these challenges could continue to have an impact on our businesses for the foreseeable future. Our investments in joint ventures may involve numerous risks that may affect the ability of such joint ventures to make distributions to us. We currently conduct some of our operations through joint ventures, with such partners including SK E&S, Renault, Acciona, and Olin in which we share control with our joint venture participants. Investments in joint ventures may involve risks not present when a third party is not involved, including the possibility that our joint venture participants might experience business or financial stress that impact their ability to effectively operate the joint venture, or might become bankrupt or may be unable to meet their economic or other obligations, in which case joint venture may be unable to access needed growth capital without additional funding from us. In addition, our joint venture participants may have economic, tax, business or legal interests or goals that are inconsistent with ours, or those of the joint venture, and may be in a position to take actions contrary to our policies or objectives. Furthermore, joint venture participants may take actions that are not within our control, which may expose our investments in joint ventures to the risk of lower values or returns. Disputes between us and co-venturers may result in litigation or arbitration that could increase our expenses and prevent our officers and/or directors from focusing their time and efforts on our day-to-day business. In addition, we may, in certain circumstances, be liable for the actions of our co-venturers. Each of these matters could have a material adverse effect on us. We made certain assumptions and projections regarding the future of the markets served by our joint venture investments that included projected raw materiality availability and pricing, production costs, market pricing and demand for the joint venture's products. These assumptions were an integral part of the economics used to evaluate these joint venture investment opportunities prior to consummation. To the extent that actual market performance varies from our models, our ability to achieve projected returns on our joint venture investments may be impacted in a materially adverse manner. Failure by us, or an entity in which we have a joint venture interest, to adequately manage the risks associated with such joint ventures could have a material adverse effect on the financial condition or results of operations of our joint ventures and, in turn, our business and operations. In addition, should any of these risks materialize, it could have a material adverse effect on the ability of the joint venture to make future distributions to us. B. FINANCIAL AND LIQUIDITY RISKS If we cannot obtain financing to support the sale of our products and service to our customers or our power purchase agreements with customers, such failure may adversely affect our liquidity and financial position. Customers representing most of our revenue access our products through Power Purchase Agreements (“PPAs”), rather than a direct purchase. These PPA arrangements require us to finance the purchase of such products, either ourselves or through third-party financing sources. To date, we have been successful in obtaining or providing the necessary financing arrangements. There is no certainty, however, that we will be able to continue to obtain or provide adequate financing for these arrangements on acceptable terms, or at all, in the future. Failure to obtain or provide such financing may result in the loss of material customers and product sales, which could have a material adverse effect on our business, financial condition, and results of operations. Further, if we are required to continue to pledge or restrict substantial amounts of our cash to support these financing arrangements, such cash will not be available to us for other purposes, which may have a material adverse effect on our liquidity and financial position. For example, as of December 31, 2022, approximately $858.7 million of our cash is restricted to support such leasing arrangements, comprised of cash deposits and collateralizing letters of credit, which prevents us from using such cash for other purposes. We may require additional capital funding and such capital may not be available to us. As of December 31, 2022, we had cash and cash equivalents of $690.6 million, restricted cash of $858.7 million and net working capital of $2.7 billion (which is comprised of the net amount of current assets of $3.3 billion and current liabilities of $635.3 million). This compares to cash and cash equivalents of $2.5 billion, restricted cash of $650.9 million and net working capital of $4.0 billion (which is comprised of the net amount of current assets of $4.4 billion and current liabilities of $420.6 million) as of December 31, 2021. Our cash requirements relate primarily to working capital needed to operate and grow our business, including funding operating expenses, growth in inventory to support both shipments of new units and servicing the installed base, growth in equipment leased and equipment related to PPAs for customers under long-term arrangements, funding the growth in our GenKey “turn-key” solution, which includes the installation of our customers’ hydrogen infrastructure as well as delivery of the hydrogen fuel, continued expansion of our markets, such as Europe and Asia, continued development and expansion of our products, such as ProGen, payment of lease obligations under sale/leaseback financings, mergers and acquisitions, strategic investments and joint ventures, liquid hydrogen plant construction, expanding production facilities and the repayment or refinancing of our long-term debt. Our ability to meet future liquidity needs and capital requirements will depend upon numerous factors, including the timing and quantity of product orders and shipments; attaining and expanding positive gross margins across all product lines; the timing and amount of our operating expenses; the timing and costs of working capital needs; the timing and costs of building a sales base; the ability of our customers to obtain financing to support commercial transactions; our ability to obtain financing arrangements to support the sale or leasing of our products and services to customers, and the terms of such agreements that may require us to pledge or restrict substantial amounts of our cash to support these financing arrangements; the timing and costs of developing marketing and distribution channels; the timing and costs of product service requirements; the timing and costs of hiring and training product staff; the extent to which our products gain market acceptance; the timing and costs of product development and introductions; the extent of our ongoing and new research and development programs; and changes in our strategy or our planned activities. We cannot assure you that any necessary additional financing will be available on terms favorable to us, or at all. In periods when the capital and credit markets experience significant volatility, the amounts, sources and cost of capital available to us may be adversely affected. We primarily use external financing to provide working capital needed to operate and grow our business. Sufficient sources of external financing may not be available to us on cost effective terms. We have incurred losses and anticipate continuing to incur losses. We have not achieved operating profitability in any quarter since our formation and we will continue to incur net losses until we can produce sufficient revenue to cover our costs. Our net losses attributable to common stockholders were $724.0 million in 2022, $460.0 million in 2021, and $596.2 million in 2020. As of December 31, 2022, we had an accumulated deficit of $3.1 billion. We anticipate that we will continue to incur losses until we can produce and sell our products and services on a large-scale and cost-effective basis. We cannot guarantee when we will operate profitably, if ever. In order to achieve profitability, we must successfully execute our planned path to profitability in the early adoption markets on which we are focused. The profitability of our products depends largely on material and manufacturing costs and the market price of hydrogen. The hydrogen infrastructure that is needed to support our growth readiness and cost efficiency must be available and cost efficient. We must continue to shorten the cycles in our product roadmap with respect to improvement in product reliability and performance that our customers expect. We must execute on successful introduction of our products into the market. We must accurately evaluate our markets for, and react to, competitive threats in both other technologies (such as advanced batteries) and our technology field. Finally, we must continue to lower our products’ build costs and lifetime service costs. If we are unable to successfully take these steps, we may never operate profitably, and, even if we do achieve profitability, we may be unable to sustain or increase our profitability in the future. | (c) | Changes in Internal Control Over Financial ReportingOur indebtedness could adversely affect our liquidity, financial condition and our ability to fulfill our obligations and operate our business. At December 31, 2022, our total outstanding indebtedness was approximately $532.2 million, 193.9 million of the $200.0 in aggregate principal amount of 3.75% Convertible Senior Notes due June 1, 2025 (the “3.75% Convertible Senior Notes”), $9.1 million of long-term debt, and $329.2 million of finance obligations consisting primarily of debt associated with sale of future revenues and sale/leaseback financings. Our indebtedness could have negative consequences on our future operations, including: | ● | we may have difficulty satisfying our obligations with respect to our outstanding debt; |
| ● | Exclusive ofwe may have difficulty obtaining financing in the steps takenfuture for working capital, capital expenditures, acquisitions, or other purposes;
|
| ● | our vulnerability to general economic downturns and adverse industry conditions could increase; |
| ● | our flexibility in remediation activities, there were noplanning for, or reacting to, changes in our business and in our industry in general could be limited; |
| ● | our amount of debt and the Company’s internal control over financial reporting (as defined in Rules 13a-15(f) and 15d-15(f) under the Exchange Act) occurred during the quarter ended December 31, 2020amount we must pay to service our debt obligations could place us at a competitive disadvantage compared to our competitors that has materially affected, or are reasonably likely to materially affect, the Company’s internal control over financial reporting.may have less debt. |
Our ability to generate cash to repay our indebtedness is subject to the performance of our business, as well as general economic, financial, competitive, and other factors that are beyond our control. If our business does not generate sufficient cash flow from operating activities or if future borrowings are not available to us in amounts sufficient to enable us to fund our liquidity needs, our operating results, and financial condition may be adversely affected. The accounting method for convertible debt securities that may be settled in cash, such as the 3.75% Convertible Senior Notes, could have a material effect on our reported financial results. Under Accounting Standards Codification (“ASC”) 470-20, Debt with Conversion and Other Options, or ASC 470-20, an entity must separately account for the liability and equity components of the convertible debt instruments (such as the 3.75% Convertible Senior Notes that may be settled entirely or partially in cash upon conversion in a manner that reflects the issuer’s economic interest cost. The effect of ASC 470-20 on the accounting for the convertible senior notes is that the equity component is required to be included in the additional paid-in capital section of stockholders’ equity on our consolidated balance sheet at the issuance date and the value of the equity component would be treated as debt discount for purposes of accounting for the debt component of the convertible senior notes. As a result, we are required to record a non-cash interest expense as a result of the amortization of the discounted carrying value of the convertible senior notes to their face amount over the term of the convertible senior notes. As a result, we report larger net losses (or lower net income) in our financial results because ASC 470-20 requires interest to include the amortization of the debt discount, which could adversely affect our reported or future financial results or the trading price of our common stock. In addition, on January 1, 2021, we early adopted Accounting Standards Update (“ASU”) No. 2020-06, Debt—Debt with Conversion and Other Options (Subtopic 470-20) and Derivatives and Hedging—Contracts in Entity’s Own Equity (Subtopic 815-40) using the modified retrospective approach. Consequently, the 3.75% Convertible Senior Notes is now accounted for as a single liability measured at its amortized cost. This accounting change removed the impact of recognizing the equity component of the Company’s convertible notes at issuance and the subsequent accounting impact of additional interest expense from debt discount amortization. The cumulative effect of the accounting change upon adoption on January 1, 2021 increased the carrying amount of the 3.75% Convertible Senior Notes by $120.6 million, reduced accumulated deficit by $9.6 million and reduced additional paid-in capital by $130.2 million. Future interest expense of the convertible notes will be lower as a result of adoption of this guidance and net loss per share will be computed using the if-converted method for convertible instruments. The convertible note hedges may affect the value of our common stock. In conjunction with the pricing of the 3.75% Convertible Senior Notes, the Company entered into privately negotiated capped call transactions (the “3.75% Notes Capped Call”) with certain counterparties at a price of $16.3 million. The 3.75% Notes Capped Call cover, subject to anti-dilution adjustments, the aggregate number of shares of the Company’s common stock that underlie the initial 3.75% Convertible Senior Notes and is generally expected to reduce potential dilution to the Company’s common stock upon any conversion of the 3.75% Convertible Senior Notes and/or offset any cash payments the Company is required to make in excess of the principal amount of the converted notes, as the case may be, with such reduction and/or offset subject to a cap based on the cap price. The cap price of the 3.75% Notes Capped Call is initially $6.7560 per share, which represents a premium of approximately 60%over the last then-reported sale price of the Company’s common stock of $4.11 per share on the date of the transaction and is subject to certain adjustments under the terms of the 3.75% Notes Capped Call. The 3.75% Notes Capped Call becomes exercisable if the conversion option is exercised. The option counterparties and/or their respective affiliates may modify their hedge positions by entering into or unwinding various derivatives with respect to our common stock and/or purchasing or selling our common stock in secondary market transactions prior to the maturity of the 3.75% Convertible Senior Notes (and are likely to do so during any observation period related to a conversion of 3.75% Convertible Senior Notes or following any repurchase of 3.75% Convertible Senior Notes by us on any fundamental change repurchase date or otherwise). This activity could also cause or avoid an increase or a decrease in the market price of our common stock. In addition, if any such convertible note hedge transaction fails to become effective, the option counterparties may unwind their hedge positions with respect to our common stock, which could adversely affect the value of our common stock. The potential effect, if any, of these transactions and activities on the market price of our common stock will depend in part on market conditions and cannot be ascertained at this time. Any of these activities could adversely affect the value of our common stock. We are subject to counterparty risk with respect to the convertible note hedge transactions. The option counterparties are financial institutions or affiliates of financial institutions and are subject to the risk that one or more of such option counterparties may default under the convertible note hedge transactions. Our exposure to the credit risk of the option counterparties is not secured by any collateral. If any option counterparty becomes subject to bankruptcy or other insolvency proceedings, we will become an unsecured creditor in those proceedings with a claim equal to our exposure at that time under our transactions with that option counterparty. Our exposure will depend on many factors but, generally, an increase in our exposure will be correlated to an increase in our common stock market price and in the volatility of the market price of our common stock. In addition, upon a default by an option counterparty, we may suffer adverse tax consequences and dilution with respect to our common stock. We can provide no assurance as to the financial stability or viability of any option counterparty. C. OPERATIONAL RISKS We may not be able to expand our business or manage our future growth effectively. We may not be able to expand our business or manage future growth. We plan to continue to improve our manufacturing processes and build additional manufacturing production over the next five years, which will require successful execution of: | ● | expanding our existing customers and expanding to new markets; |
| ● | ensuring manufacture, delivery, and installation of our products; |
| ● | ensuring timely construction and completion of hydrogen generation projects, which may be delayed due to the Company’s inexperience with these project types, supply chain issues, and federal, state, and local permitting and regulatory issues; |
| ● | implementing and improving additional and existing administrative, financial and operations systems and procedures and controls; |
| ● | integration of acquisitions; |
| ● | hiring additional employees; |
| ● | expanding and upgrading our technological capabilities; |
| ● | managing relationships with our customers and suppliers and strategic partnerships with other third parties; |
| ● | maintaining adequate liquidity and financial resources; and |
| ● | continuing to increase our revenues from operations. |
Ensuring delivery of our products is subject to many market risks, including scarcity, significant price fluctuations, and competition. Maintaining adequate liquidity is dependent upon a variety of factors, including continued revenues from operations, working capital improvements, and compliance with our debt instruments. We may not be able to achieve our growth strategy and increase production capacity as planned during the foreseeable future. If we are unable to manage our growth effectively, we may not be able to take advantage of market opportunities, develop new products, satisfy customer requirements, execute our business plan, or respond to competitive pressures. For further information on risks associated with new business ventures, see Item I.3.E, “Risk Factors” (“Strategic Risks — We may be unable to successfully pursue new business ventures.”). Our success depends on our ability to improve our financial and operational performance and execute our business strategy. If we fail to implement our business strategy, our financial condition and results of operations could be adversely affected. Our future financial performance and success depend in large part on our ability to successfully implement our business strategy. We cannot assure you that we will be able to successfully implement our business strategy or be able to continue improving our operating results. In particular, we cannot assure you that we will be able to successfully execute our ongoing, or any future, investments, achieve operating cost savings targeted through focused improvements and capacity optimization, including improvements to service performance through scale of manufacturing and vertical integration, and opportunistically pursue strategic transactions. Implementation of our business strategy may be impacted by factors outside of our control, including competition, commodity price fluctuations, industry, legal and regulatory changes or developments and general economic and political conditions. Any failure to successfully implement our business strategy could adversely affect our financial condition and results of operations. We may, in addition, decide to alter or discontinue certain aspects of our business strategy at any time. Although we have undertaken and expect to continue to undertake productivity and manufacturing system and process transformation initiatives to improve service performance, we cannot assure you that all of these initiatives will be completed or that any estimated cost savings from such activities will be fully realized. Even when we are able to generate new efficiencies in the short- to medium-term, we may not be able to continue to reduce costs and increase productivity over the long-term. There can be no assurance if and when any of these initiatives will be successfully and fully executed or completed. Delays in or not completing our product and project development goals may adversely affect our revenue and profitability. If we experience delays in meeting our development goals (including delivery of electrolyzers to customers, as well as the completion of hydrogen generation projects), our products exhibit technical defects, or if we are unable to meet cost or performance goals (including power output), useful life and reliability, the profitable commercialization of our products will be delayed. In this event, potential purchasers of our products may choose alternative technologies and any delays could allow potential competitors to gain market advantages. We cannot assure that we will successfully meet our commercialization schedule in the future. Periodically, we may enter into contracts with our customers for certain products that have not been developed or produced. There can be no assurance that we will complete the development of these products and meet the specifications required to fulfill customer agreements and deliver products on schedule. Pursuant to such agreements, the customers would have the right to provide notice to us if, in their good faith judgment, we have materially deviated from such agreements. Should a customer provide such notice, and we cannot mutually agree to a modification to the agreement, then the customer may have the right to terminate the agreement, which could have a material adverse effect upon our future business. Item 9B. Other than our current products, which we believe to be commercially viable at this time, we do not know when or whether we will successfully complete research and development of other commercially viable products that could be critical to our future. If we are unable to develop additional commercially viable products, we may not be able to generate sufficient revenue to become profitable. The profitable commercialization of our products depends on our ability to reduce the costs of our components and subsystems, and we cannot assure you that we will be able to sufficiently reduce these costs. In addition, the profitable commercialization of our products requires achievement and verification of their overall reliability, efficiency and safety targets, and we cannot assure you that we will be able to develop, acquire or license the technology necessary to achieve these targets. We must complete additional research and development to fill our product portfolios and deliver enhanced functionality and reliability in order to manufacture additional commercially viable products in commercial quantities. In addition, while we continue to conduct tests to predict the overall life of our products, we may not have run our products over their projected useful life prior to large-scale commercialization. As a result, we cannot be sure that our products will last as long as predicted, resulting in possible warranty claims and commercial failures.
Our products use, or generate, flammable fuels that are inherently dangerous substances, which could subject our business to product safety, product liability, other claims, product recalls, negative publicity, or heightened regulatory scrutiny of our products. Our fuel cell systems use hydrogen gas in catalytic reactions. While our products do not use this fuel in a combustion process, hydrogen gas is a flammable fuel that could leak and combust if ignited by another source. Further, any such accidents involving our products or other products using similar flammable fuels could materially suppress demand for, or heighten regulatory scrutiny of, our products. Our expansion into electrolyzer manufacturing, hydrogen production, and the transport of hydrogen fuel similarly involve hydrogen in either gaseous or liquified form. Additionally, the production of hydrogen through electrolysis also results in the generation of oxygen. As a result, oxygen must be separated and controlled during the hydrogen production process. Such activities are subject to potential risks and liabilities associated with flammable gases. The risk of product liability claims and associated adverse publicity is inherent in the development, manufacturing, marketing and sale of fuel cell products, electrolyzers, hydrogen production and destruction, and in products fueled by hydrogen, which is a flammable gas. Any liability for damages resulting from malfunctions or design defects could be substantial and could materially adversely affect our business, financial condition, results of operations and prospects. In addition, an actual or perceived problem with our products could adversely affect the market’s perception of our products resulting in a decline in demand for our products, which may materially and adversely affect our business, financial condition, results of operations and prospects. See Part I, Item 3, “Legal Proceedings.” Certain component quality issues have resulted in adjustments to our warranty reserves and the accrual for loss contracts. In the past, quality issues have arisen with respect to certain components in certain products that are currently being used at customer sites. Under the terms of our extended maintenance contracts, we have had to retrofit units subject to component quality issues with replacement components to improve the reliability of our products for our customers. We recorded a provision for loss contracts related to service in the current and prior years. Though we continue to work with our vendors on these component issues to improve quality and reliability, unanticipated additional quality issues or warranty claims may arise, and additional material charges may be incurred in the future. Quality issues also could cause profitable maintenance contracts to become unprofitable. In addition, we may from time to time experience other unexpected design, manufacturing or product performance issues. We make significant investment in the continued improvement of our products and maintain appropriate warranty reserves for known and unexpected issues; however, unknown malfunctions or defects could result in unexpected material liabilities and could adversely affect our business, financial condition, results of operation, cash flows and prospects. In addition, an actual or perceived problem could adversely affect the market’s perception of our products resulting in a decline in demand for our products and could divert the attention of our management, which may materially and adversely affect our business, financial condition, results of operations, cash flows, and prospects. Our purchase orders may not ship, be commissioned or installed, or convert to revenue, which could have an adverse impact on revenue and cash flow. Some of the orders we accept from customers require certain conditions or contingencies to be satisfied, or may be cancelled, prior to shipment or prior to commissioning or installation, some of which are outside of our control. Historically for our GenDrive products, shipments made against these orders have generally occurred between 90 days and 24 months from the date of acceptance of the order. Orders for the Company’s products and services approximated $1.2 billion for the year ended December 31, 2022. The time periods from receipt of an order to shipment date and installation vary widely and are determined by a number of factors, including the terms of the customer contract and the customer’s deployment plan. There may also be product redesign or modification requirements that must be satisfied prior to shipment of units under certain of our agreements. If the redesigns or modifications are not completed, some or all of our orders may not ship or convert to revenue. In certain cases, we disclose anticipated, pending orders with prospective customers for our various products, including PEM fuel cell, electrolyzer, and green hydrogen sales; however, those prospective customers may require certain conditions or contingencies to be satisfied prior to entering into a purchase order with us, some of which are outside of our control. Such conditions or contingencies that may be required to be satisfied before we receive a purchase order may include, but are not limited to, successful product demonstrations or field trials. Converting orders into revenue is also dependent upon our customers’ ability to obtain financing. Some conditions or contingencies that are out of our control may include, but are not limited to, government tax policy, government funding programs, and government incentive programs. Additionally, some conditions and contingencies may extend for several years. We may have to compensate customers, by either reimbursement, forfeiting portions of associated revenue, or other methods depending on the terms of the customer contract, based on the failure on any of these conditions or contingencies. While not probable, this could have an adverse impact on our revenue and cash flow. We are dependent on information technology in our operations and the failure of such technology may adversely affect our business. Potential security breaches of our information technology systems, including cyber-attacks, could lead to liability or could damage our reputation and financial results. We may experience problems with the operation of our current information technology systems or the technology systems of third parties on which we rely, as well as the development and deployment of new information technology systems, that could adversely affect, or even temporarily disrupt, all or a portion of our operations until resolved. Inabilities and delays in implementing new systems can also affect our ability to realize projected or expected cost savings. Any systems failures could impede our ability to timely collect and report financial results in accordance with applicable laws. Information technology system and/or network disruptions could harm the Company’s operations. Failure to effectively prevent, detect, and recover from security breaches, including cyber-attacks, could result in the misuse of company assets, unauthorized use or publication of our trade secrets and confidential business information, disruption to the company, diversion of management resources, regulatory inquiries, legal claims or proceedings, reputational damage, loss of sales, reduction in value of our investment in research and development, among other costs to the company. We have experienced and may continue to experience attempts to gain unauthorized access to our information technology systems on which we maintain proprietary and confidential information. To date, any attempts to gain unauthorized access have been either immaterial or deflected by appropriate security measures. The risk of a security breach or disruption, particularly through cyber-attacks, or cyber intrusion, including by computer hackers, and cyber terrorists, has generally increased as cyber-attacks have become more prevalent and harder to detect and fight against. Additionally, outside parties may attempt to access our confidential information through other means, for example by fraudulently inducing our employees to disclose confidential information. We actively seek to prevent, detect, and investigate any unauthorized access. These threats are also continually evolving, and as a result, will become increasingly difficult to detect. In addition, as a result of the COVID-19 pandemic, the increased prevalence of employees working from home may exacerbate the aforementioned cybersecurity risks. Despite the implementation of network security measures, our information technology system have been and could be penetrated by outside parties. The implementation of a new enterprise resource planning system could cause disruption to our operations. We are planning to implement a new enterprise resource planning, or ERP, system which is currently scheduled to be implemented during fiscal year 2023. We may experience difficulties in implementing the new ERP system. If the implementation of the ERP system does not proceed as expected, it could impede our ability to manufacture products, order materials, generate management reports, invoice customers, and comply with laws and regulations. Any of these types of disruptions could have a material adverse effect on our net sales and profitability. In addition, the implementation of the new ERP system will require significant investment of human and financial resources. We may experience delays, increased costs and other difficulties, including potential design defects, miscalculations, testing requirements, re-work due to changes in business plans or reporting standards, and the diversion of management’s attention from day-to-day business operations. Extended delays could include operational risk, including cybersecurity risks, and other complications. If we are unable to implement the new ERP system as planned, the effectiveness of our internal control over financial reporting could be adversely affected, our ability to assess those controls adequately could be delayed, and our business, results of operations, financial condition and cash flows could be negatively impacted. Our future plans could be harmed if we are unable to attract or retain key personnel. We have attracted a highly skilled management team and specialized workforce, including scientists, engineers, researchers, manufacturing, and marketing and sales professionals. Our future success will depend, in part, on our ability to attract and retain qualified management and technical personnel. We do not know whether we will be successful in hiring or retaining qualified personnel. Furthermore, our ability to attract and retain key employees could be adversely impacted if we do not have a sufficient number of shares available under our equity incentive plan to issue to our employees, or if our stockholders do not approve requested share increases or a new equity incentive. In general, our industry continues to experience change and be subject to significant competitive pressures with respect to the retention of top talent. The loss of key employees may occur due to perceived opportunity for promotion, compensation levels or composition of compensation, work environment or other individual reasons. In addition, we have from time-to-time experienced labor shortages and other labor-related issues. Labor shortages have become more pronounced as a result of the COVID-19 pandemic. A number of factors might adversely affect the labor force available to us in one or more of our markets, including high employment levels, federal unemployment subsidies, and other government regulations, which include laws and regulations related to workers’ health and safety, wage and hour practices and immigration, and such factors can also impact the cost of labor. For example, the recently enacted Inflation Reduction Act includes certain prevailing wage requirements related to tax credit availability which may impact labor costs of the Company and our contractors and subcontractors going forward. An increase in labor costs and the unavailability of skilled labor (including apprentices) or increased turnover could have a material adverse effect on our results of operations. Our inability to hire qualified personnel on a timely basis, or the departure of key employees, could materially and adversely affect our development and profitable commercialization plans and, therefore, our business prospects, results of operations and financial condition. We may not be able to protect important intellectual property and we could incur substantial costs defending against claims that our products infringe on the proprietary rights of others. PEM fuel cell technology was first developed in the 1950s, and fuel processing technology has been practiced on a large scale in the petrochemical industry for decades. Accordingly, we do not believe that we can establish a significant proprietary position in the fundamental component technologies in these areas. However, our ability to compete effectively will depend, in part, on our ability to protect our proprietary system-level technologies, systems designs and manufacturing processes. We rely on patents, trademarks, trade secrets, and other policies and procedures related to confidentiality to protect our intellectual property. However, some of our intellectual property is not covered by any patent or patent application. Moreover, we do not know whether any of our pending patent applications will issue or, in the case of patents issued or to be issued, that the claims allowed are or will be sufficiently broad to protect our technology or processes. Even if all of our patent applications are issued and are sufficiently broad, our patents may be challenged or invalidated. We could incur substantial costs in prosecuting or defending patent infringement suits or otherwise protecting our intellectual property rights. While we have attempted to safeguard and maintain our proprietary rights, we do not know whether we have been or will be completely successful in doing so. Moreover, patent applications filed in foreign countries may be subject to laws, rules and procedures that are substantially different from those of the United States, and any resulting foreign patents may be difficult and expensive to obtain and enforce. In addition, we do not know whether the USPTO will grant federal registrations based on our pending trademark applications. Even if federal registrations are granted to us, our trademark rights may be challenged. It is also possible that our competitors or others will adopt trademarks similar to ours, thus impeding our ability to build brand identity and possibly leading to customer confusion. We could incur substantial costs in prosecuting or defending trademark infringement suits. Furthermore, we might encounter difficulties protecting intellectual property rights in foreign jurisdictions. Certain jurisdictions do not favor the enforcement of patents, trade secrets, and other intellectual property protection. Enforcement of our intellectual property and proprietary rights in foreign jurisdictions could result in substantial costs and adverse impacts to our intellectual property rights. Further, our competitors may independently develop or patent technologies or processes that are substantially equivalent or superior to ours. If we are found to be infringing third party patents, we could be required to pay substantial royalties and/or damages, and we do not know whether we will be able to obtain licenses to use such patents on acceptable terms, if at all. Failure to obtain needed licenses could delay or prevent the development, manufacture or sale of our products, and could necessitate the expenditure of significant resources to develop or acquire non-infringing intellectual property. We may need to pursue lawsuits or legal action in the future to enforce our intellectual property rights, to protect our trade secrets and domain names, and to determine the validity and scope of the proprietary rights of others. If third parties prepare and file applications for trademarks used or registered by us, we may oppose those applications and be required to participate in proceedings to determine the priority of rights to the trademark. Similarly, competitors may have filed applications for patents, may have received patents and may obtain additional patents and proprietary rights relating to products or technology that block or compete with ours. We may have to participate in interference proceedings to determine the priority of invention and the right to a patent for the technology. Litigation and interference proceedings, even if they are successful, are expensive to pursue and time consuming, and we could use a substantial amount of our management and financial resources in either case. Confidentiality agreements to which we are party may be breached, and we may not have adequate remedies for any breach. Our trade secrets may also be known without breach of such agreements or may be independently developed by competitors. Our inability to maintain the proprietary nature of our technology and processes could allow our competitors to limit or eliminate any competitive advantages we may have. We are subject to legal proceedings and legal compliance risks that could harm our business. We are currently, and in the future may continue to be, subject to commercial disputes and litigation. In connection with any disputes or litigation in which we are involved, we may incur costs and expenses in connection with defending ourselves or in connection with the payment of any settlement or judgment or compliance with any ruling in connection therewith. The expense of defending litigation may be significant. The amount of time to resolve lawsuits is unpredictable and defending ourselves may divert management’s attention from the day-to-day operations of our business, which could adversely affect our business, financial condition, results of operations and cash flows. In addition, an unfavorable outcome in any such litigation could have a material adverse effect on our business, results of operations, financial condition and cash flows. See Part I, Item 3, “Legal Proceedings.” Our financial results may be adversely affected by changes in accounting principles generally accepted in the United States. U.S. Generally Accepted Accounting Principles (“GAAP”) is subject to interpretation by the FASB, the American Institute of Certified Public Accountants, the SEC and various bodies formed to promulgate and interpret appropriate accounting principles. See Note 2, “Summary of Significant Accounting Policies,” to our consolidated financial statements included in this Annual Report on Form 10-K regarding the effect of new accounting pronouncements on our financial statements. Any difficulties in implementing these pronouncements could cause us to fail to meet our financial reporting obligations, which could result in regulatory discipline and harm investors’ confidence in us. Further, the implementation of new accounting pronouncements or a change in other principles or interpretations could have a significant effect on our financial results. If our estimates or judgments relating to our critical accounting policies are based on assumptions that change or prove to be incorrect, our operating results could fall below expectations of investors, resulting in a decline in our stock price. The preparation of financial statements in conformity with GAAP requires management to make estimates and assumptions that affect the amounts reported in our consolidated financial statements and accompanying notes. For example, our revenue recognition, loss accrual for service contracts, goodwill and impairment of long-lived assets policies are complex, and we often must make estimates and assumptions that could prove to be incorrect. We base our estimates on historical experience and on various other assumptions that we believe to be reasonable under the circumstances. Significant assumptions and estimates used in preparing our consolidated financial statements include those related to revenue recognition, loss accrual for service contracts, impairment of long-lived assets, and provision for common stock warrants. Our operating results may be adversely affected if our assumptions change or if actual circumstances differ from those in our assumptions, which could cause our operating results to fall below the expectations of investors, resulting in a decline in our stock price. We identified material weaknesses in our internal control over financial reporting. If we do not effectively remediate these material weaknesses or if we otherwise fail to maintain effective internal control over financial reporting, we may not be able to accurately report our financial results or prevent fraud. Management identified material weaknesses in our internal control over financial reporting as of December 31, 2022, 2021, 2020, 2019, and 2018. See Item 9A, “Controls and Procedures,” in this Annual Report on Form 10-K for information regarding the identified material weaknesses and our actions to date to remediate the material weaknesses. If we do not effectively remediate these material weaknesses or if we otherwise fail to maintain effective internal control over financial reporting, we may not be able to accurately report our financial results or prevent fraud. D. REGULATORY RISKS The reduction or elimination of government subsidies and economic incentives for alternative energy technologies, or the failure to renew such subsidies and incentives, could reduce demand for our products, lead to a reduction in our revenues, and adversely impact our operating results and liquidity. We believe that the near-term growth of alternative energy technologies is affected by the availability and size of government and economic incentives. Many of these government incentives expire, phase out over time, may exhaust the allocated funding, or require renewal by the applicable authority. In addition, these incentive programs could be reduced or discontinued for other reasons. The Inflation Reduction Act (“IRA”) adopted in August 2022 contains a number of tax incentive provisions including: (i) an extension and amendment of the Section 48 investment tax credit (“ITC”) for projects that “begin construction” before 2025; (ii) a new Section 48E clean electricity ITC; (iii) a new Section 45V Clean Hydrogen Production Tax Credit (“PTC”); and (iv) a new commercial clean vehicle tax credit, among other items. In many instances, the Company will have to comply with prevailing wage and apprenticeship requirements to maximize the value of these new clean energy tax credits. Furthermore, the ITC also have bonus credits for projects that are placed in service in certain “energy community” regions (specifically former oil, coal, and gas dependent geographies, and brownfield), or for projects that can meet domestic content criteria for steel, iron, and manufactured products. For example, the baseline credit amount for the ITC for qualified fuel cell properties is six percent. If a taxpayer satisfied prevailing wage and apprenticeship requirements (or is exempt therefrom), the ITC amount is multiplied by five (equal to 30%). Furthermore, if a project is placed in service in an “energy community” or can meet “domestic content" criteria, the taxpayer may be eligible for additional bonus credits beyond a 30% ITC. We believe we are well positioned to capture incentives contained in the IRA; however, this legislation was adopted in August 2022, and forthcoming interagency guidance processes are still ongoing. We have not yet seen the impact these IRA-related incentives may have on our business and operations and cannot guarantee we will realize anticipated benefits of incentives under the IRA, particularly as our Company adapts to an ongoing and nascent regulatory guidance process regarding the detailed requirements of various new energy provisions. Furthermore, changes or amendments to clean energy tax credits might be more favorable to other technologies. Any reduction, elimination, or discriminatory application of expiration of the ITC or other government subsidies and economic incentives, or the failure to renew such tax credit, governmental subsidies, or economic incentives, may result in the diminished economic competitiveness of our products to our customers and could materially and adversely affect the growth of alternative energy technologies, including our products, as well as our future operating results and liquidity. We are subject to various federal, state, and local and non-US environmental and human health and safety laws and regulations that could impose significant costs and liabilities on us. Our operations are subject to federal, state, and local environmental and human health and safety laws and regulations, including laws and regulations relating to the use, handling, storage, transportation, disposal and human exposure to hazardous substances and wastes, product safety, emissions of pollution into the environment, and human health and safety. We have incurred and expect to continue to incur, costs to comply with these laws and regulations. These costs and obligations are likely to expand and change as our Company grows, makes acquisitions, and conducts business in new locations. Furthermore, federal, state, and local governments are increasingly regulating and restricting the use of certain chemicals, substances, and materials. Some of these policy initiative could foreseeably be impactful to our business. For example, laws, regulations, or other policy initiatives might address substances found within component parts to our products, in which event our Company would be required to comply with such requirements. Our facilities in the U.S. are subject to regulation by OSHA, which regulates the protection of the health and safety of workers. In addition, the OSHA hazard communication standard requires that we maintain information about hazardous materials used or produced in our operations and that we provide this information to employees, state and local governmental authorities and local residents. We are also subject to occupational safety regulations in other countries. Our failure to comply with government occupational safety regulations, including OSHA requirements, or general industry standards relating to employee health and safety, keep adequate records or monitor occupational exposure to regulated substances could expose us to liability, enforcement, and fines and penalties, and could have a material adverse effect on our business, operating results, cash flows, or financial condition. Violation of these laws or regulations or the occurrence of an explosion or other accident in connection with our fuel cell systems at our properties or at third party locations could lead to injuries, property damage, litigation, substantial liabilities and sanctions, including fines and penalties, cleanup costs, manufacturing delays or the requirement to undertake corrective action. Further, environmental laws and human health and safety and regulations, and the administration, interpretation, and enforcement thereof, are subject to change and may become more stringent in the future, each of which could materially adversely affect our business, financial condition, and results of operations. Additionally, certain environmental laws impose liability, which can be joint and several, as well as strict, on current and previous owners and operators of real property for the cost of removal or remediation of hazardous substances and damage to natural resources. These laws often impose liability even if the owner or operator did not know of, or was not responsible for, the release of such hazardous substances. They can also assess liability on persons who arrange for hazardous substances to be sent to disposal or treatment facilities when such facilities are found to be contaminated, and such persons can be responsible for cleanup costs even if they never owned or operated the contaminated facility. Our liabilities arising from past or future releases of, or exposure to, hazardous substances may adversely affect our business, financial condition, and results of operations. Our business may become subject to increased government regulation. Our products are subject to certain federal, state, local, and non-U.S. laws and regulations, including, for example, state and local ordinances relating to building codes, fire codes, public safety, electrical and gas pipeline connections, hydrogen transportation and siting and related matters. See Item 1, “Business — Government Regulations” for additional information. In certain jurisdictions, these regulatory requirements may be more stringent than those in the United States. Further, as products are introduced into the market commercially, governments may impose new regulations. We do not know the extent to which any such regulations may impact our ability to manufacture, distribute, install and service our products. Any regulation of our products, whether at the federal, state, local or foreign level, including any regulations relating to the production, operation, installation, and servicing of our products may increase our costs and the price of our products, and noncompliance with applicable laws and regulations could subject us to investigations, sanctions, enforcement actions, fines, damages, civil and criminal penalties, or injunctions. Furthermore, certain business activities may require the Company to navigate a myriad of state or local-level laws and regulations. If any governmental sanctions are imposed, our business, operating results, and financial condition could be materially adversely affected. In addition, responding to any action will likely result in a significant diversion of management’s attention and resources and an increase in professional fees. Enforcement actions and sanctions could harm our business, operating results and financial condition. Changes in tax laws or regulations or adverse outcomes resulting from examination of our income or other tax returns could adversely affect our operating results and financial condition. We are subject to income taxes in the United States and various foreign jurisdictions. A number of factors may adversely affect our future effective tax rates, such as the jurisdictions in which our profits are determined to be earned and taxed; changes in the valuation of our deferred tax assets and liabilities; adjustments to estimated taxes upon finalization of various tax returns; changes in available tax credits, grants and other incentives; changes in stock-based compensation expense; the availability of loss or credit carryforwards to offset taxable income; changes in tax laws, regulations, accounting principles or interpretations thereof; or examinations by US federal, state or foreign jurisdictions that disagree with interpretations of tax rules and regulations in regard to positions taken on tax filings. A change in our effective tax rate due to any of these factors may adversely affect the carrying value of our tax assets and our future results from operations. In addition, as our business grows, we are required to comply with increasingly complex taxation rules and practices. We are subject to tax in multiple U.S. tax jurisdictions and in foreign tax jurisdictions as we expand internationally, which requires additional expertise to ensure compliance with various domestic and international tax laws. The development of our global tax footprint and compliance with these laws may impact how we conduct our business and affect our financial position, operating results, and cash flows. The changes in the carryforward/carryback periods as well as the new limitation on use of net operating losses (“NOLs”) may significantly impact our valuation allowance assessments for NOLs. Changes in U.S. federal income or other tax laws or the interpretation of tax laws, including the Inflation Reduction Act, as passed by Congress in August 2022, may impact our tax liabilities. As of December 31, 2022, we had federal NOL carryforwards of $1.4 billion, which begin to expire in various amounts and at various dates in 2034 through 2037 (other than federal NOL carryforwards generated after December 31, 2017, which are not subject to expiration). As of December 31, 2022, we also had federal research and development tax credit carryforwards of $14.9 million, which begin to expire in 2033. Utilization of our NOLs and research and development tax credit carryforwards may be subject to a substantial annual limitation if the ownership change limitations under Sections 382 and 383 of the Internal Revenue Code of 1986, as amended (the “Code”), and similar state provisions are triggered by changes in our ownership. In general, an ownership change occurs if there is a cumulative change in the ownership of the Company by “5-percent shareholders” that exceed 50 percentage points over a rolling three-year period. Based on studies of the changes in ownership of the Company, it has been determined that a Section 382 ownership change occurred in 2013 that limited the amount of pre-change NOLs that can be used in future years. NOLs incurred after the most recent ownership change are not subject to Section 382 of the Code and are available for use in future years. If we undergo any ownership changes, our ability to utilize our NOL carryforwards or research and development tax credit carryforwards could be further limited by Sections 382 and 383 of the Code. In addition, future changes in our stock ownership, many of which are outside of our control, could result in an ownership change under Sections 382 and 383 of the Code. Any such limitation may significantly reduce our ability to utilize our NOL carryforwards and research and development tax credit carryforwards before they expire. Our NOL carryforwards and research and development tax credit carryforwards may also be impaired under state law. Accordingly, we may not be able to utilize a material portion of our NOL carryforwards or research and development tax credit carryforwards. The Coronavirus Aid, Relief and Economic Security Act modified, among other things, rules governing NOLs. NOLs arising in tax years beginning after December 31, 2017 are subject to an 80% of taxable income limitation (as calculated before taking the NOLs into account) for tax years beginning after December 31, 2020. In addition, NOLs arising in tax years 2018, 2019, and 2020 are subject to a five year carryback and indefinite carryforward, while NOLs arising in tax years beginning after December 31, 2020 also are subject to indefinite carryforward but cannot be carried back. In future years, if and when the valuation allowance related to our NOLs is partially or fully released, the changes in the carryforward/carryback periods as well as the new limitation on use of NOLs may significantly impact our valuation allowance assessments for NOLs generated after December 31, 2017. Trade policies, treaties, and tariffs could have a material adverse effect on our business. Our business is dependent on the availability of raw materials and components for our products, particularly electrical components common in the semiconductor industry. There is continued uncertainty about the future relationship between the United States and various other countries, most significantly China, with respect to trade policies, treaties, tariffs, and taxes. Under the Biden administration, changes in U.S. administrative policy could lead to changes in existing trade agreements, greater restrictions on free trade generally, and significant increases in tariffs on goods imported into the United States, particularly tariffs on products manufactures in China and Mexico, among other possible changes. These developments, or the perception that any of them could occur, could have a material effect on global economic conditions and the stability of global financial markets, and could significantly reduce global trade and, in particular, trade between the impacted nations and the United States. This uncertainty includes: (i) the possibility of altering the existing tariffs or penalties on products manufactured outside the United States, including the U.S. government’s 25% tariff on a range of products from China; (ii) the effects stemming from the removal of such previously imposed tariffs; (iii) subsequent tariffs imposed by the United States on any other U.S. trading partners such as Russia; and (iv) potential tariffs imposed by trading partners on U.S. goods. The institution of trade tariffs on items imported by us from other countries could increase our costs, which could have a negative impact on our business. We cannot predict whether, and to what extent, there may be changes to international trade agreements or whether quotas, duties, tariffs, exchange controls or other restrictions on our products will be changed or imposed. In addition, an open conflict or war across any region could affect our ability to obtain raw materials. For example, the current military conflict between Russia and Ukraine, and related sanctions, export controls or other actions that may be initiated by nations, including the United States, the European Union or Russia (e.g., potential cyberattacks, disruption of energy flows, etc.) or potential sanctions or relevant export controls related to China or Taiwan could adversely affect our business and/or our supply chain or our business partners or customers in other countries beyond Russia and Ukraine.Although we currently maintain alternative sources for raw materials, if we are unable to source our products from the countries where we wish to purchase them, either because of the occurrence or threat of wars or other conflicts, regulatory changes or for any other reason, or if the cost of doing so increases, it could have a material adverse effect on our business, financial condition and results of operations. Disruptions in the supply of raw materials and components could temporarily impair our ability to manufacture our products for our customers or require us to pay higher prices to obtain these raw materials or components from other sources, which could have a material adverse effect on our business and our results of operations. We are exposed to fluctuations in currency exchange rates, which could negatively affect our operating results. Our contracts are primarily denominated in U.S. dollars, and therefore substantially all of our revenue is not subject to foreign currency risk. However, a strengthening of the U.S. dollar could increase the real cost of our offerings to our customers outside of the United States, which could adversely affect our operating results. In addition, an increasing portion of our operating revenues and operating expenses are earned or incurred outside of the United States, and an increasing portion of our assets is held outside of the United States. These operating revenues, expenses, and assets are denominated in foreign currencies and are subject to fluctuations due to changes in foreign currency exchange rates. If we are not able to successfully hedge against the risks associated with currency fluctuations, our operating results could be adversely affected. Additionally, global events as well as geopolitical developments, including regional conflicts in Europe, fluctuating commodity prices, trade tariff developments, and inflation have caused, and may in the future cause, global economic uncertainty and uncertainty about the interest rate environment, which could amplify the volatility of currency fluctuations. We have not engaged in the hedging of foreign currency transactions to date, so we may not be able to effectively offset the adverse financial impacts that may result from unfavorable movements in foreign currency exchange rates, which could adversely affect our operating results. E. STRATEGIC RISKS We may be unable to establish or maintain relationships with third parties for certain aspects of continued product development, manufacturing, distribution, sale, servicing, and the supply of key components for our products. We will need to maintain and may need to enter into additional strategic relationships in order to complete our current product development and commercialization plans regarding our fuel cell products, electrolyzers, hydrogen production, and potential new business markets. We may also require partners to assist in the sale, servicing, and supply of components for our current products and anticipated products, which are in development. If we are unable to identify, negotiate, enter into, and maintain satisfactory agreements with potential partners, including those relating to the supply, distribution, service and support of our current products and anticipated products, we may not be able to complete our product development and commercialization plans on schedule or at all. We may also need to scale back these plans in the absence of needed partners, which could adversely affect our future prospects for development and commercialization of future products. While we have entered into relationships with suppliers of some key components for our products, we do not know when or whether we will secure supply relationships for all required components and subsystems for our products, or whether such relationships will be on terms that will allow us to achieve our objectives. Our business prospects, results of operations, and financial condition could be harmed if we fail to secure relationships with entities that can develop or supply the required components for our products and provide the required distribution and servicing support. Additionally, the agreements governing our current relationships allow for termination by our partners under certain circumstances, some of which are beyond our control. If any of our current strategic partners were to terminate any of its agreements with us, there could be a material adverse impact on the continued development and profitable commercialization of our products and the operation of our business, financial condition, results of operations, and prospects. We may be unable to make attractive acquisitions or successfully integrate acquired businesses, assets or properties, and any inability to do so may disrupt our business and hinder our ability to grow, divert the attention of key personnel, disrupt our business, and impair our financial results. As part of our business strategy, we intend to consider acquisitions of companies, technologies, and products. We may not be able to identify such attractive acquisition opportunities. Acquisitions, involve numerous risks, any of which could harm our business, including, among other things: On May 13, 2021,
| ● | difficulty in integrating the Board amendedtechnologies, products, operations, and restatedexisting contracts of a target company and realizing the Company’s Third Amended and Restated Bylaws in order to clarify and update certain provisions as well as to (i) expressly provide for virtual stockholder meetings by remote communication (Article I, Section 4), (ii) eliminate the requirement to provide notice of any adjourned meetinganticipated benefits of the Board (Article II, Section 9), (iii) provide that sharescombined businesses; |
| ● | mistaken assumptions about volumes or the timing of all classesthose volumes, revenues or seriescosts, including synergies; |
| ● | negative perception of the Company’s stock may be uncertificated (Article IV, Section 1),acquisition by customers, financial markets or investors; |
| ● | difficulty in supporting and (iv) designate the federal district courtstransitioning customers, if any, of the United States of America astarget company; |
| ● | inability to achieve anticipated synergies or increase the exclusive jurisdiction for any litigation arising under the Securities Act (Article VI, Section 8). The Board approved the Amendedrevenue and Restated Bylaws, among other reasons, to align them with current governance practices and, in respectprofit of the exclusive federal forum provision,acquired business; |
| ● | the assumption of unknown liabilities; |
| ● | exposure to potential lawsuits; |
| ● | limitations on rights to indemnity from the seller; |
| ● | the diversion of management’s and employees’ attention from other business concerns; |
| ● | unforeseen difficulties operating in ordernew geographic areas; |
| ● | customer or key employee losses at the acquired businesses; |
| ● | the price we pay or other resources that we devote may exceed the value we realize; or |
| ● | the value we could have realized if we had allocated the purchase price or other resources to seekanother opportunity and inability to reduce any potential expenses that the Company may incur in connection with any actions or proceedings by seekinggenerate sufficient revenue to avoid the Company being required to defend any such potential actions or proceedings in multiple jurisdictions and in parallel proceedings in federal and state courts simultaneously.offset acquisition costs. |
In addition, if we finance acquisitions by issuing equity securities, our existing stockholders may be diluted. As a result, if our forecasted assumptions for these acquisitions and investments are not accurate, we may not achieve the anticipated benefits of any such acquisitions, and we may incur costs in excess of what we had anticipated. We may be unable to successfully pursue, integrate, or execute upon our new business ventures. We are developing and constructing hydrogen production plants across the United States and building relationships with green hydrogen suppliers. In 2022 and 2021, we acquired two subsidiaries of Cryogenic Industrial Solutions, LLC, which are Alloy Custom Products, LLC and WesMor Cryogenics, LLC (collectively, “CIS”), as well as the entities Joule, Applied Cryo Technologies, and Frames Holding B.V. (“Frames”). There can be no assurances that we will be able to successfully implement our new business ventures or successfully operate within this industry. The execution of the Company’s vertical integration strategy, as well as scaling its manufacturing capabilities, is impactful to the performance of the Company and customer experience. Failure to improve overall service performance and scale sourcing effectively can limit growth and adversely impact our customer experience. Each aspect of this vertical integration strategy, including manufacturing of electrolyzers, mobility fuel cell products, stationary fuel cell products, and liquefaction equipment, as well as servicing customer sites, is dependent upon the Company’s ability to integrate and execute these new business ventures. This vertical integration strategy may be unsuccessful, or the Company may be unable to successfully or timely execute its vertical integration strategy, which may adversely impact customer experience and, in turn, the Company’s operations, business, or financial results. Additionally, the ability to successfully integrate and execute these projects is dependent upon our ability to manufacture and supply each project with a sufficient number of electrolyzers. The successful integration of our electrolyzer manufacturing objectives will affect our ability to meet demands for electrolyzers — both internally for our hydrogen production projects, and externally for third-party electrolyzer customers. Furthermore, we may expend substantial time and resources in research and development for new potential markets. There is no guarantee that these research and development initiatives will be successful or implemented as commercial products. For further information on risks associated with acquisitions, see Item I.3.F “Risk Factors (“Strategic Risks — We may be unable to make attractive acquisitions or successfully integrate acquired businesses, assets or properties, and any inability to do so may disrupt our business and hinder our ability to grow, divert the attention of key personnel, disrupt our business and impair our financial results.”). F. RISKS RELATED TO THE OWNERSHIP OF OUR COMMON STOCK Our stock price and stock trading volume have been and could remain volatile, and the value of your investment could decline. The market price of our common stock has historically experienced and may continue to experience significant volatility. In 2022, the sales price of our common stock fluctuated from a high of $32.05 per share to a low of $11.49 per share. Our progress in developing and commercializing our products, our quarterly operating results, announcements of new products by us or our competitors, our perceived prospects, changes in securities analysts’ recommendations or earnings estimates, changes in general conditions in the economy or the financial markets, adverse events related to our strategic relationships, significant sales of our common stock by existing stockholders, including one or more of our strategic partners, events relating to our determination to restate certain of our previously issued consolidated financial statements, and other developments affecting us or our competitors could cause the market price of our common stock to fluctuate substantially. In addition, in recent years, the stock market has experienced significant price and volume fluctuations. This volatility has affected the market prices of securities issued by many companies for reasons unrelated to their operating performance and may adversely affect the price of our common stock. Such market price volatility could adversely affect our ability to raise additional capital. Furthermore, technical factors in the public trading market for our common stock may produce price movements that may or may not comport with macro, industry or company-specific fundamentals, including, without limitation, the sentiment of retail investors (including as may be expressed on financial trading and other social media sites), the amount and status of short interest in our securities, access to margin debt, trading in options and other derivatives on our common stock and any related hedging or other technical trading factors.In addition, we are subject to securities class action litigation filed after a drop in the price in our common stock in March 2021, which could result in substantial costs and diversion of management’s attention and resources and could harm our stock price, business, prospects, results of operations and financial condition. Sales of substantial amounts of our common stock in the public markets, or the perception that such sales might occur, could reduce the price that our common stock might otherwise attain and may dilute your voting power and your ownership interest in us. Sales of a substantial number of shares of our common stock in the public market, or the perception that such sales could occur, could adversely affect the market price of our common stock and may make it more difficult for you to sell your common stock at a time and price that you deem appropriate. As of December 31, 2022, there were approximately 39,170,766 shares of common stock issuable upon conversion of the 3.75% Convertible Senior Notes at a conversion price of $5.03 per share. In addition, as of December 31, 2022, we had outstanding options exercisable for an aggregate of 8,052,969 shares of common stock at a weighted average exercise price of $11.61 per share and 88,774,725 shares of common stock issuable upon the exercise of warrants, of which 46,131,376 were vested as of December 31, 2022. Moreover, subject to market conditions and other factors, we may conduct future offerings of equity or debt securities. Sales of substantial amounts of our common stock in the public market, or the perception that these sales could occur, could reduce the market price of our common stock to decline. In addition, the conversion of the notes or preferred stock or the exercise of outstanding options and warrants and future equity issuances will result in dilution to investors. The market price of our common stock could fall as a result of resales of any of these shares of common stock due to an increased number of shares available for sale in the market. If securities analysts do not publish research or reports or if they publish unfavorable or inaccurate research about our business and our stock, the price of our stock and the trading volume could decline. We expect that the trading market for our common stock will be affected by research or reports that industry or financial analysts publish about us or our business. There are many large, well-established companies active in our industry and portions of the markets in which we compete, which may mean that we receive less widespread analyst coverage than our competitors. If one or more of the analysts who covers us downgrades their evaluations of our company or our stock, the price of our stock could decline. If one or more of these analysts cease coverage of our company, our stock may lose visibility in the market, which in turn could cause our stock price to decline. Provisions in our charter documents and Delaware law may discourage or delay an acquisition of the Company by a third party that stockholders may consider favorable. Our amended and restated certificate of incorporation, our amended and restated bylaws, and Delaware corporate law contain provisions that could have an anti-takeover effect and make it harder for a third party to acquire us without the consent of our Board. These provisions may also discourage proxy contests and make it more difficult for our stockholders to take some corporate actions, including the election of directors. These provisions include, but are not limited to: the ability of our Board to issue shares of preferred stock in one or more series and to determine the terms of those shares, including preference and voting rights, without a stockholder vote; the exclusive right of our Board to elect a director to fill a vacancy created by the expansion of our Board or the resignation, death or removal of a director, which prevents stockholders from being able to fill vacancies on our Board; the inability of stockholders to call a special meeting of stockholders; the prohibition on stockholder action by written consent, which forces stockholder action to be taken at an annual or special meeting of our stockholders; advance notice informational and procedural requirements for nominations for election to our Board or for proposing business to be brought before a stockholder meeting, which may discourage or deter a potential acquirer from conducting a solicitation of proxies to elect the acquirer’s own slate of directors or otherwise attempting to obtain control of us; a prohibition against stockholders nominating a number of their own nominees at the annual meeting of the stockholders that exceeds the number of directors to be elected at such annual meeting; the ability of our Board of Directors, by majority vote and without shareholder approval, to amend the bylaws, which may allow our Board to take additional actions to prevent an unsolicited takeover and inhibit the ability of an acquirer to amend the bylaws to facilitate an unsolicited takeover attempt; and staggered terms for our directors, which effectively prevents stockholders from electing a majority of the directors at any one annual meeting of stockholders. In addition, as a Delaware corporation, we are subject to Section 203 of the Delaware General Corporation Law. These provisions may prohibit large stockholders, in particular those owning 15% or more of our outstanding voting stock, from merging or combining with us for a certain period of time. We do not anticipate paying any dividends on our common stock. We do not anticipate paying any cash dividends on our common stock in the foreseeable future. If we do not pay cash dividends, you would receive a return on your investment in our common stock only if the market price of our common stock is greater at the time you sell your shares than the market price at the time you bought your shares. Our amended and restated bylaws provide for an exclusive forum in the Court of Chancery of the State of Delaware for certain disputes between us and our stockholders, and the exclusive forum in the Delaware federal courts for the resolution of any complaint asserting a cause of action under the Securities Act, which may limit a stockholder’s ability to bring a claim in a forum a stockholder finds favorable. Our amended and restated bylaws provide that unless the Company consents in writing to the selection of an alternative forum, the Court of Chancery of the State of Delaware will be the sole and exclusive forum for any state law claims for: (i) any derivative action or proceeding brought on behalf of the Company, (ii) any action asserting a claim of, or a claim based on, a breach of a fiduciary duty owed by any director, officer or other employee of the Company to the Company or the Company’s stockholders, (iii) any action asserting a claim arising pursuant to any provision of the Delaware General Corporation Law or the Company’s amended and restated certificate of incorporation or amended and restated bylaws, or (iv) any other action asserting a claim governed by the internal affairs doctrine. The amended and restated bylaws further provide that unless the Company consents in writing to the selection of an alternative forum, the federal district courts of the United States of America will be the sole and exclusive forum for the resolution of any complaint asserting a cause of action arising under the Securities Act and any person or entity purchasing or otherwise acquiring or holding any interest in shares of capital stock of the Company will be deemed to have notice of and consented to these provisions. We believe these provisions may benefit us by providing increased consistency in the application of Delaware law and federal securities laws by chancellors and judges, as applicable, particularly experienced in resolving corporate disputes, efficient administration of cases on a more expedited schedule relative to other forums and protection against the burdens of multi-forum litigation. If a court were to find the choice of forum provision that is contained in our amended and restated bylaws to be inapplicable or unenforceable in an action, we may incur additional costs associated with resolving such action in other jurisdictions, which could materially adversely affect our business, results of operations, and financial condition. For example, Section 22 of the Securities Act provides that state and federal courts have concurrent jurisdiction over claims to enforce any duty or liability created by the Securities Act or the rules and regulations promulgated thereunder. Accordingly, there is uncertainty as to whether a court would enforce such a forum selection provision as written in connection with claims arising under the Securities Act. Because the choice of forum provisions in our amended and restated bylaws may have the effect of severing certain causes of action between federal and state courts, stockholders seeking to assert claims against us or any of our current or former director, officer, other employee, agent, or stockholder, may be discouraged from bringing such claims due to a possibility of increased litigation expenses arising from litigating multiple related claims in two separate courts. The choice of forum provisions may therefore limit a stockholder’s ability to bring a claim in a judicial forum that it finds favorable for disputes with us or any of our current or former director, officer, other employee, agent, or stockholder. Alternatively, if a court were to find the choice of forum provisions contained in our amended and restated bylaws to be inapplicable or unenforceable in an action, we may incur additional costs associated with resolving such action in other jurisdictions, which could harm our business, results of operations, and financial condition. Climate change and climate change policies might affect our business, our industry, and the global economy. We acknowledge the significant challenge presented by climate change, and see our transformational work in developing cost-effective, clean, renewable green hydrogen, and fuel cell energy as part of the solution. Our commitment to sustainability is deeply rooted in our products, mission, core values, and people. However, we acknowledge that climate change will potentially have wide-ranging impacts, including potential impacts to our Company. Unanticipated environmental, societal, economic, or geopolitical effects of climate change might affect business operations. For example, increasingly severe and frequent weather events might disrupt our supply chain or adversely affect our customers. Relatedly, government policies addressing climate change could similarly impact our business operations. We believe that many of these policies will be favorable for our fuel cell systems and hydrogen solutions. However, there is no guarantee that such potential changes in laws, regulations, or policies will be favorable to our Company, to existing or future customers, or to large-scale economic, environmental, or geopolitical conditions. We are firm believers that our fuel cell and hydrogen solutions along with our green hydrogen strategy will play a significant role in helping to get to the scale needed to help stop the substantial damage that may otherwise occur due to the future risks of climate change. Given the global nature of climate change, we all share the responsibility of developing or supporting new methods for generating and using energy that will curb or offset greenhouse gas emissions. Item 1B. Unresolved Staff Comments Not applicable. Item 2. Properties The following table sets forth information regarding our principal operating properties and other significant properties as of December 31, 2022, which we use of our single operating segment. In general, our operating properties are well maintained, suitably equipped, and in good operating condition: | | | | | | | | Continent | Location | | Facility | | Size | | Ownership Status | North America | | | | | | | | | New York | | | | | | | | Latham | | Manufacturing and R&D | | 159,000 sq ft | | Lease | | Rochester | | Manufacturing, R&D, & office | | 150,000 sq ft | | Lease | | Latham | | Manufacturing and warehousing | | 27,000 sq ft | | Lease | | Latham - 8BA | | Corporate offices | | 51,438 sq ft | | Lease | | Latham - 6BA | | Office | | 19,100 sq ft | | Lease | | Slingerlands | | Manufacturing and warehousing | | 350,000 sq ft | | Lease | | Washington | | | | | | | | Spokane | | Manufacturing | | 29,200 sq ft | | Lease | | Massachusetts | | | | | | | | Concord | | Manufacturing | | 33,000 sq ft | | Lease | | Ohio | | | | | | | | Dayton | | Service center | | 37,000 sq ft | | Lease | | Illinois | | | | | | | | Romeoville | | Service center | | 13,000 sq ft | | Lease | | Pennsylvania | | | | | | | | Canonsburg | | Office | | 7,600 sq ft | | Lease | | Texas | | | | | | | | Houston | | Manufacturing and office | | 175,000 sq ft | | Lease | | Magnolia | | Manufacturing and office | | 73,000 sq ft | | Lease | | Indiana | | | | | | | | LaFayette | | Manufacturing and office | | 123,000 sq ft | | Own | Europe | | | | | | | | | Netherlands | | | | | | | | Alphen aan den Rijn | | Office | | 30,000 sq ft | | Lease | | Germany | | | | | | | | Duisburg | | Office | | 47,258 sq ft | | Lease | Asia | | | | | | | | | India | | | | | | | | Shivajinagar | | Office | | 35,000 sq ft | | Lease |
See Note 21, “Commitments and Contingencies,” to the consolidated financial statements, Part II, Item 8, Financial Statements and Supplementary Data,” of this Annual Report on Form 10-K for further discussion of the leases. We believe that our facilities are sufficient to accommodate our anticipated production volumes for at least the next two years. Item 3. Legal Proceedings As previously disclosed, several actions were filed in the U.S. District Courts for the Southern District of New York and for the Central District of California asserting claims under the federal securities laws against the Company and two of its senior officers, Mr. Marsh and Mr. Middleton. On July 22, 2021, the court consolidated those actions into In re Plug Power, Inc. Securities Litigation, No. 1:21-cv-2004, pending in the U.S. District Court for the Southern District of New York (the “Securities Action”) and appointed a lead plaintiff. On October 6, 2021, lead plaintiff filed a consolidated amended complaint asserting claims on behalf of a putative class composed of all persons who purchased or otherwise acquired the Company’s securities between November 9, 2020 and March 16, 2021 (the “Amended Complaint”). The Amended Complaint asserted a claim against all defendants for alleged violations of Section 10(b) of the Securities Exchange Act of 1934 (the “Exchange Act”) and Rule 10b-5 promulgated thereunder and a claim under Section 20(a) of the Exchange Act against Mr. Marsh and Mr. Middleton as alleged controlling persons. The Amended Complaint alleged that defendants made “materially false” statements concerning (1) adjusted EBITDA; (2) fuel delivery and research and development expenses; (3) costs related to provision for loss contracts; (4) gross losses; and (5) the effectiveness of internal controls and procedures (the “accounting-related statements”), and that these alleged misstatements caused losses and damages for members of the alleged class. On December 6, 2021, defendants filed a motion to dismiss the Amended Complaint. In an opinion and order entered on September 29, 2022, the court granted defendants’ motion to dismiss the Amended Complaint in its entirety but permitted the lead plaintiff to further amend the complaint. On November 21, 2022, the lead plaintiff filed a second amended complaint purporting to assert claims under the same provisions against the same defendants on behalf of the same alleged class of purchasers of the Company’s securities (the “Second Amended Complaint”). The Second Amended Complaint largely repeated the allegations in the Amended Complaint but, in addition, alleged that various public statements during the alleged class period were false or misleading because they allegedly failed to disclose the status of discussions and considerations relating to warrants to purchase the Company’s common stock that were granted to a customer in connection with a commercial agreement. The defendants filed a motion to dismiss the Second Amended Complaint in its entirety on January 12, 2023. On March 31, 2021, Junwei Liu, an alleged Company stockholder, derivatively and on behalf of nominal defendant Plug, filed a complaint in the U.S. District Court for the Southern District of New York against certain Company directors and officers (the “Derivative Defendants”), captioned Liu v. Marsh et al., Case No. 1:21-cv-02753 (S.D.N.Y.) (the “Liu Derivative Complaint”). The Liu Derivative Complaint alleges that, between November 9, 2020 and March 1, 2021, the Derivative Defendants “made, or caused the Company to make, materially false and misleading statements concerning Plug Power’s business, operations, and prospects” by “issu[ing] positive financial information and optimistic guidance, and made assurances that the Company’s internal controls were effective,” when, “[i]n reality, the Company’s internal controls suffered from material deficiencies that rendered them ineffective.” The Liu Derivative Complaint asserts claims for (1) breach of fiduciary duties, (2) unjust enrichment, (3) abuse of control, (4) gross mismanagement, (5) waste of corporate assets, and (6) contribution under Sections 10(b) and 21D of the Exchange Act (as to the named officer defendants). The Liu Derivative Complaint seeks a judgment “[d]eclaring that Plaintiff may maintain this action on behalf of Plug”; “[d]eclaring that the [Derivative] Defendants have breached and/or aided and abetted the breach of their fiduciary duties”; “awarding to Plug Power the damages sustained by it as a result of the violations” set forth in the Liu Derivative Complaint, “together with pre-judgment and post-judgment interest thereon”; “[d]irecting Plug Power and the [Derivative] Defendants to take all necessary actions to reform and improve Plug Power’s corporate governance and internal procedures to comply with applicable laws”; and “[a]warding Plaintiff the costs and disbursements of this action, including reasonable attorneys’ and experts’ fees, costs, and expenses”; and “[s]uch other and further relief as the [c]ourt may deem just and proper.” On April 5, 2021, alleged Company stockholders Elias Levy and Camerohn X. Withers, derivatively and on behalf of nominal defendant Plug, filed a complaint in the U.S. District Court for the Southern District of New York against the Derivative Defendants named in the Liu Derivative Complaint, captioned Levy et al. v. McNamee et al., Case No. 1:21-cv-02891 (S.D.N.Y.) (the “Levy Derivative Complaint”). The Levy Derivative Complaint alleges that, from November 9, 2020 to April 5, 2021, the Derivative Defendants “breached their duties of loyalty and good faith” by failing to disclose “(1) that the Company would be unable to timely file its 2020 annual report due to delays related to the review of classification of certain costs and the recoverability of the right to use assets with certain leases; (2) that the Company was reasonably likely to report material weaknesses in its internal control over financial reporting; and (3) that, as a result of the foregoing, Defendants’ positive statements about the Company’s business, operations, and prospects were materially misleading and/or lacked a reasonable basis.” The Levy Derivative Complaint asserts claims for (1) breach of fiduciary duty (as to the named director defendants), (2) unjust enrichment (as to certain named director defendants), (3) waste of corporate assets (as to the named director defendants), and (4) violations of Sections 10(b) and 21D of the Exchange Act (as to the named officer defendants). The Levy Derivative Complaint seeks a judgment “declaring that Plaintiffs may maintain this action on behalf of the Company”; finding the Derivative Defendants “liable for breaching their fiduciary duties owed to the Company”; directing the Derivative Defendants “to take all necessary actions to reform and improve the Company’s corporate governance, risk management, and internal operating procedures to comply with applicable laws”; “awarding damages to the Company for the harm the Company suffered as a result of Defendants’ wrongful conduct”; “awarding damages to the Company for [the named officer Derivative Defendants’] violations of Sections 10(b) and 21D of the Exchange Act”; “awarding Plaintiffs the costs and disbursements of this action, including attorneys’, accountants’, and experts’ fees”; and “awarding such other and further relief as is just and equitable.” The Liu Derivative Complaint and the Levy Derivative Complaint have been consolidated in In re Plug Power Derivative Litigation, Lead Case No. 1:21-cv-02753-ER and, by stipulation approved by the Court, the cases have been stayed pending the resolution of the motion to dismiss in the Securities Action. On May 13, 2021, alleged Company stockholder Romario St. Clair, derivatively and on behalf of nominal defendant Plug, filed a complaint in the Supreme Court of the State of New York, County of New York against the Derivative Defendants named in the Liu Derivative Complaint, captioned St. Clair v. Plug Power Inc. et al., Index No. 653167/2021 (N.Y. Sup. Ct., N.Y. Cty.) (the “St. Clair Derivative Complaint”). The St. Clair Derivative Complaint alleges that, for approximately two years from March 13, 2019 onwards, the company made a number of improper statements that “failed to disclose and misrepresented the following material, adverse facts, which the [derivative] defendants knew, consciously disregarded, or were reckless in not knowing”, including: “(a) that the Company was experiencing known but undisclosed material weaknesses in its internal controls over financial reporting; (b) the Company was overstating the carrying amount of certain right of use assets and finance obligations associated with leases; (c) the Company was understating its loss accrual on certain service contracts; (d) the Company would need to take impairment charges relating to certain long-lived assets; (e) the Company was improperly classifying research and development costs versus costs of goods sold; and (f) the Company would be unable to file its annual Report for the 2020 fiscal year due to these errors.” The St. Clair Derivative Complaint asserts claims for (1) breach of fiduciary and (2) unjust enrichment. The St. Clair Derivative Complaint seeks a judgment “for the amount of damages sustained by the Company as a result of the defendants’ breaches of fiduciary duties and unjust enrichment”; “[d]irecting Plug Power to take all necessary actions to reform and improve its corporate governance and internal procedures to comply with applicable laws”;“[e]xtraordinary equitable and/or injunctive relief as permitted by law, equity, and state statutory provisions”; [a]warding to Plug Power restitution from defendants, and each of them, and ordering disgorgement of all profits, benefits, and other compensation obtained by the defendants”; [a]warding to plaintiff the costs and disbursements of the action, including reasonable attorneys’ fees, accountants’ and experts’ fees, costs, and expenses”; and “[g]ranting such other and further relief as the [c]ourt deems just and proper.” By stipulation approved by the Court, the case has been stayed pending the resolution of the motion to dismiss in the Securities Action. On June 13, 2022, alleged Company stockholder Donna Max, derivatively on behalf of the Company as nominal defendant, filed a complaint in the United States District Court for the District of Delaware against the Derivative Defendants named in the Liu Derivative Complaint, captioned Max v. Marsh, et. al., case no. 1:22-cv-00781 (D. Del.) (the “Max Derivative Complaint”). The Max Derivative Complaint alleges that, for the years 2018, 2019 and 2020, the defendants did not “assure that a reliable system of financial controls was in place and functioning effectively”; “failed to disclose errors in the Company's accounting primarily relating to (i) the reported book value of right of use assets and related finance obligations, (ii) loss accruals for certain service contracts, (iii) the impairment of certain long-lived assets, and (iv) the classification of certain expenses previously included in research and development costs”; and that certain defendants traded Company stock at “artificially inflated stock prices.” The Max Derivative Complaint asserts claims for (1) breach of fiduciary against all defendants; (2) breach of fiduciary duty for insider trading against certain defendants; and (3) contribution under Sections 10(b) and 21D of the Exchange Act against certain defendants. The Max Derivative Complaint seeks an award “for the damages sustained by [the Company]” and related relief. By stipulation approved by the Court, the case has been stayed pending the resolution of the motion to dismiss in the Securities Action. On June 29, 2022, alleged Company stockholder Abbas Khambati, derivatively on behalf of the Company as nominal defendant, filed a complaint in the Court of Chancery in the State of Delaware against the Derivative Defendants named in the Liu Derivative Complaint, Mr. Conway and Mr. Schmid, captioned Khambati v. McNamee, et. al., C.A. no. 2022-05691 (Del. Ch.) (the “Khambati Derivative Complaint”). The Khambati Derivative Complaint alleges that the defendants “deceive[d] the investing public, including stockholders of Plug Power, regarding the Individual Defendants’ management of Plug Power’s operations and the Company’s compliance with the SEC's accounting rules”; “facilitate[d” certain defendants’ sales of “their personally held shares while in possession of material, nonpublic information”; and “enhance[d] the Individual Defendants’ executive and directorial positions at Plug Power and the profits, power, and prestige that the Individual Defendants enjoyed as a result of holding these positions.” The Khambati Derivative Complaint asserts claims for (1) breach of fiduciary; and (2) disgorgement and unjust enrichment. The Khambati Derivative Complaint seeks an award “for the damages sustained by [the Company] as a result of the breaches” alleged or “disgorgement or restitution”; “disgorgement of insider trading profits” and “all profits, benefits and other compensation obtained by [defendants’] insider trading and further profits flowing therefrom”; an order “[d]irecting the Company to take all necessary actions to reform and improve its corporate governance and internal procedures”; and related relief. On July 19, 2022, alleged Company stockholder Anne D. Graziano, as Trustee of the Anne D. Graziano Revocable Living Trust, derivatively on behalf of the Company as nominal defendant, filed a complaint in the Court of Chancery in the State of Delaware against the derivative defendants named in the Khambati Derivative Complaint, captioned Graziano v. Marsh, et. al., C.A. no. 2022-0629 (Del. Ch.) (the “Graziano Derivative Complaint”). The Graziano Derivative Complaint alleges that the director defendants (i) “either knowingly or recklessly issued or caused the Company to issue the materially false and misleading statements” concerning “certain critical accounting issues”; (ii) “willfully ignored, or recklessly failed to inform themselves of, the obvious problems with the Company’s internal controls, practices, and procedures, and failed to make a good faith effort to correct the problems or prevent their recurrence”; (iii) the members of the Audit Committee failed “to prevent, correct, or inform the Board of the issuance of material misstatements and omissions regarding critical accounting issues and the adequacy of the Company’s internal controls”; (iv) “received payments, benefits, stock options, and other emoluments by virtue of their membership on the Board and their control of the Company”; (v) violated the Company’s Code of Conduct because they knowingly or recklessly engaged in and participated in making and/or causing the Company to make the materially false and misleading statements; and (vi) certain defendants “sold large amounts of Company stock while it was trading at artificially inflated prices.” The Graziano Derivative Complaint asserts claims for (1) breach of fiduciary; (2) breach of fiduciary duty against certain defendants for insider trading; (3) unjust enrichment; (4) aiding and abetting breach of fiduciary duty; and (5) waste of corporate assets. The Graziano Derivative Complaint seeks an award of “the amount of damages sustained by the Company”; seeks an order “[d]irecting Plug Power to take all necessary actions to reform and improve its corporate governance and internal procedures to comply with applicable laws and to protect Plug Power and its stockholders from a repeat of the damaging events described herein”; and related relief. The parties to the Graziano Derivative Complaint and Khambati Derivative Complaint have been consolidated in In re Plug Power, Inc. Stockholder Derivative Litigation, Consolidated C.A. No. 2022-0569 and, by stipulation approved by the Court, the cases have been stayed pending the resolution of the motion to dismiss in the Securities Action. As previously disclosed, on August 28, 2018, a lawsuit was filed on behalf of multiple individuals against the Company and five corporate co-defendants in the 9th Judicial District Court, Rapides Parish, Louisiana. The lawsuit relates to the previously disclosed May 2018 accident involving a forklift powered by the Company’s fuel cell at a Procter & Gamble facility in Louisiana. The lawsuit alleges claims against the Company and co-defendants, including Structural Composites Industries, Deep South Equipment Co., Air Products and Chemicals, Inc., Westport Power, Inc., Quality Thermistor, Inc. and Hyster-Yale Group, Inc. for claims under the Louisiana Product Liability Act (“LPLA”) including defect in construction and/or composition, design defect, inadequate warning, breach of express warranty and negligence for wrongful death and personal injuries, among other damages. Procter & Gamble intervened in that suit to recover worker’s compensation benefits paid to or for the employees/dependents. In April 2022, Plug reached a settlement with respect to the individual plaintiffs on terms well below the Company’s commercial liability insurance limits. Procter & Gamble also filed suit in the Louisiana 9th Judicial District Court for property damage, business interruption, loss of revenue, expenses, and other damages. Procter & Gamble alleges theories under the LPLA, breach of warranty and quasi-contractual claims under Louisiana law. Defendants include the Company and several of the same co-defendants from the August 2018 lawsuit, including Structural Composites Industries, Deep South Equipment Co., Hyster-Yale Group, Inc. and and Westport Power, Inc. The Company has filed a lawsuit against Structural Composites Industries, LLC, Worthington Industries, Inc. and Worthington Cylinder Corp. in the Supreme Court of Albany County, New York, related to the replacement of hydrogen storage tanks of the same model that was involved in the May 2018 accident at the Procter & Gamble facility in Louisiana. Structural Composites Industries, LLC, Worthington Industries, Inc. and Worthington Cylinder Corp. have filed a counterclaim suit, also arising out of the replacement of the tanks they manufactured. The Company continues to vigorously litigate the remaining lawsuits against Proctor & Gamble in Louisiana, and against Structural Composites Industries, LLC, Worthington Industries, Inc. and Worthington Cylinder Corp. in New York. Item 4. Mine Safety Disclosures Not applicable. PART II Item 5. Market for Registrant’s Common Equity, Related Stockholder Matters and Issuer Purchases of Equity Securities Market Information and Holders of Record. Our common stock is traded on the NASDAQ Capital Market under the symbol “PLUG.” As of February 17, 2023, there were approximately 814,679 record holders of our common stock. However, management believes that a significant number of shares are held by brokers in “street name” and that the number of beneficial stockholders of our common stock exceeds 901. Dividend Policy. We have never declared or paid cash dividends on our common stock and do not anticipate paying cash dividends in the foreseeable future. Any future determination as to the payment of dividends will depend upon capital requirements and limitations imposed by our credit agreements, if any, and such other factors as our Board may consider. Five-Year Performance Graph. Below is a line graph comparing the percentage change in the cumulative total return of the Company’s common stock, based on the market price of the Company’s common stock, with the total return of companies included within the NASDAQ Clean Edge Green Energy Index (“CELS Index”) and the companies included within the Russell 2000 Index (“RUT Index”) for the period commencing December 31, 2017 and ending December 31, 2022. The calculation of the cumulative total return assumes a $100 investment in the Company’s common stock, the CELS Index and the RUT Index on December 31, 2017 and the reinvestment of all dividends, if any. 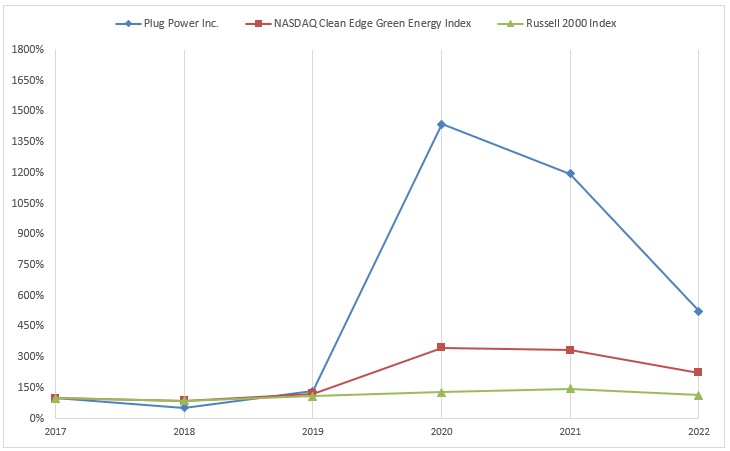
Index | 2017 | 2018 | 2019 | 2020 | 2021 | 2022 | Plug Power Inc. | $ 100.00 | $ 52.54 | $ 133.90 | $ 1,436.86 | $ 1,196.19 | $ 524.15 | NASDAQ Clean Edge Green Energy Index | $ 100.00 | $ 86.83 | $ 121.07 | $ 345.03 | $ 334.51 | $ 224.35 | Russell 2000 Index | $ 100.00 | $ 87.82 | $ 108.11 | $ 128.61 | $ 146.21 | $ 114.70 |
| ● | This graph and the accompanying text are not “soliciting material,” are not deemed filed with the SEC and are not to be incorporated by reference in any filing by us under the Securities Act or the Exchange Act, whether made before or after the date hereof and irrespective of any general incorporation language in any such filing. |
| ● | The stock price performance shown on the graph is not necessarily indicative of future price performance. |
| ● | Assuming the investment of $100 on December 31, 2017 and the reinvestment of dividends. The common stock price performance shown on the graph only reflects the change in our company’s common stock price relative to the noted indices and is not necessarily indicative of future price performance. |
Item 6. [Reserved] Not applicable. Item 7. Management’s Discussion and Analysis of Financial Condition and Results of Operations The discussion contained in this Form 10-K contains “forward-looking statements” within the meaning of Section 27A of the Securities Act and Section 21E of the Exchange Act, that involve risks and uncertainties. Our actual results could differ materially from those discussed in this Annual Report on Form 10-K. In evaluating these statements, you should review Part I, Forward-Looking Statements, Part I, Item 1A, “Risk Factors” and our consolidated financial statements and notes thereto included in Part II, Item 8, “Financial Statements and Supplementary Data,” of this Annual Report on Form 10-K. Information pertaining to fiscal year 2020 was included in the Company’s Annual Report on Form 10-K for the year ended December 31, 2020 on page 36 under Part II, Item 7, “Management’s Discussion and Analysis of Financial Position and Results of Operations,” which was filed with the SEC on May 14, 2021, as amended by the Amendment to the Annual Report on Form 10-K for the year ended December 31, 2020, which was filed with the SEC on March 14, 2022. Overview Plug is facilitating the paradigm shift to an increasingly electrified world by innovating cutting-edge hydrogen and fuel cell solutions. While we continue to develop commercially viable hydrogen and fuel cell product solutions, we have expanded our offerings to support a variety of commercial operations that can be powered with green hydrogen. We provide electrolyzers that allow customers — such as refineries, producers of chemicals, steel, fertilizer and commercial refueling stations — to generate hydrogen on-site. We are focusing our efforts on (a) industrial mobility applications, including electric forklifts and electric industrial vehicles, at multi-shift high volume manufacturing and high throughput distribution sites where we believe our products and services provide a unique combination of productivity, flexibility, and environmental benefits; (b) stationary power systems that will support critical operations, such as data centers, microgrids, and generation facilities, in either a backup power or continuous power role and replace batteries, diesel generators or the grid for telecommunication logistics, transportation, and utility customers; and (c) production of hydrogen. Plug expects to support these products and customers with an ecosystem of vertically integrated products that produce, transport, store and handle, dispense, and use hydrogen for mobility and power applications. Our current products and services include: GenDrive: GenDrive is our hydrogen fueled Proton Exchange Membrane (“PEM”) fuel cell system, providing power to material handling electric vehicles, including Class 1, 2, 3, and 6 electric forklifts, Automated Guided Vehicles (“AGVs”), and ground support equipment. GenFuel: GenFuel is our liquid hydrogen fueling delivery, generation, storage, and dispensing system. GenCare: GenCare is our ongoing “Internet of Things”-based maintenance and on-site service program for GenDrive fuel cell systems, GenSure fuel cell systems, GenFuel hydrogen storage and dispensing products and ProGen fuel cell engines. GenSure: GenSure is our stationary fuel cell solution providing scalable, modular PEM fuel cell power to support the backup and grid-support power requirements of the telecommunications, transportation, and utility sectors; GenSure High Power Fuel Cell Platform will support large scale stationary power and data center markets. GenKey: GenKey is our vertically integrated “turn-key” solution combining either GenDrive or GenSure fuel cell power with GenFuel fuel and GenCare aftermarket service, offering complete simplicity to customers transitioning to fuel cell power. ProGen: ProGen is our fuel cell stack and engine technology currently used globally in mobility and stationary fuel cell systems, and as engines in electric delivery vans. This includes Plug’s membrane electrode assembly (“MEA”), a critical component of the fuel cell stack used in zero-emission fuel cell electric vehicle engines. Liquefaction Systems: Plug’s 15 ton-per-day and 30 ton-per-day liquefiers are engineered for high efficiency, reliability, and operational flexibility — providing consistent liquid hydrogen to customers. This design increases plant reliability and availability while minimizing parasitic losses like heat leak and seal gas losses. Electrolyzers: 5 and 10 MW electrolyzer systems that are modular, scalable hydrogen generators optimized for clean hydrogen production. Electrolyzers generate hydrogen from water using electricity and a special membrane and “green” hydrogen is generated by using renewable energy inputs, such as solar or wind power. Cryogenic Equipment: Engineered equipment including trailers and mobile storage equipment for the distribution of liquified hydrogen, oxygen, argon, nitrogen and other cryogenic gases. We provide our products and solutions worldwide through our direct sales force, and by leveraging relationships with original equipment manufacturers (“OEMs”) and their dealer networks. Plug is currently targeting Asia, Europe, Middle East, and North America for expansion in adoption. The European Union has rolled out ambitious targets for the hydrogen economy and Plug is seeking to execute on its strategy to become one of the European leaders in the hydrogen economy. This includes a targeted account strategy for material handling, securing strategic partnerships with European OEMs, energy companies, utility leaders, and accelerating our electrolyzer business. Our global strategy includes leveraging a network of integrators or contract manufacturers. We manufacture our commercially viable products in Latham, New York, Rochester, New York, Slingerlands, New York, Houston, Texas, and Spokane, Washington and support liquid hydrogen generation and logistics in Charleston, Tennessee. Part of our long-term plan includes Plug penetrating the European and Asian hydrogen market, on-road vehicle market, and large-scale stationary market. Plug’s formation of joint ventures with HyVia and AccionaPlug S.L. in Europe and SK Plug Hyverse, in Asia not only support this goal but are expected to provide us with a more global footprint. Plug has been successful with acquisitions, strategic partnerships and joint ventures, and we plan to continue this mix. COVID-19 Update While we no longer enforce our prior COVID-19 policies with respect to weekly COVID-19 testing, face coverings, or daily COVID-19 questionnaires, we continue to monitor the COVID-19 pandemic and emerging variants, and remain prepared to adjust our policies and safety protocols in line with guidance from state and federal agencies. Employees are still expected to remain home if they are not feeling well and should contact our COVID team for future guidance. Furthermore, we have resumed all commercial air travel and all other non-critical travel, while also allowing employees to resume their personal travel. We have enabled third-party access to our facilities, and are continuing our normal janitorial and sanitary procedures. We are no longer requiring staggered shifts in our manufacturing facilities and are offering hybrid work schedules to those whose job function enables them to do so. The COVID-19 pandemic has caused significant transportation challenges for global suppliers and we expect that these challenges will continue to have an impact on our businesses for the foreseeable future. We continue to take proactive steps to limit the impact of these challenges and are working closely with our suppliers and transportation vendors to ensure availability of products and implement other cost savings initiatives. In addition, we continue to invest in our supply chain to improve its resilience with a focus on automation, dual sourcing of critical components and localized manufacturing when feasible. To date, there has been limited disruption to the availability of our products related to COVID-19, although the Company has experienced supply chain-related delays for components of product lines and hydrogen generation projects. It is possible that more significant disruptions could occur if these supply chain challenges continue. Strategic Investments On December 5, 2022, the Company and its wholly-owned subsidiary Plug Power Hydrogen Holdings, Inc. simultaneously entered into a definitive agreement and closed on the acquisition of two subsidiaries of Cryogenic Industrial Solutions, LLC, which are Alloy Custom Products, LLC and WesMor Cryogenics, LLC. The purchase was approximately $37.3 million, comprised of a mix of cash and the Company’s common stock, to bolster the cryogenic tanker and storage tank business. On January 14, 2022, Company and its wholly-owned subsidiary Plug Power Hydrogen Holdings, Inc. simultaneously entered into a definitive agreement and closed on the acquisition of Joule for a purchase price of approximately $69.9 million, of which $41.7 million will be based on future earnouts over the next four years. Joule is an engineered modular equipment, process design and procurement company founded in 2009 with a strong track record among the largest midstream, EPC, and oil & gas companies. Inflation, Material Availability, and Labor Shortages Throughout 2022, we continued to experience higher than expected commodity costs and supply chain costs, including logistics, procurement, manufacturing costs, energy and fuel costs, largely due to inflationary pressures. We expect this cost inflation to remain elevated through 2023. Our operations require significant amounts of necessary parts and raw materials. From time to time, the Company has encountered difficulties in obtaining certain raw materials or components necessary for production due to supply chain constraints and logistical challenges, which has also negatively impacted the pricing of materials and components sourced or used by the Company. Increased energy costs have negatively impacted margins. Additionally, conflicts abroad, such as the Russia-Ukraine conflict, may potentially contribute to issues related to supply chain disruptions and inflation impacts. There have been supply chain and logistical challenges that have resulted in supply constraints and commodity price increases on certain raw materials, and components used by the Company in production, as well as increased prices for freight and logistics, including air, sea and ground freight. Consequently, the Company has experienced supply shortages for certain raw materials or components, which could be further exacerbated by increased commodity prices as a result of additional inflationary pressures. Although we have offset a portion of these increased costs through price increases and operational efficiencies to date, there can be no assurance that we will be able to continue to do so. If we are unable to manage fluctuations through pricing actions, cost savings projects, and sourcing decisions as well as through productivity improvements, it may adversely impact our gross margins in future periods. Additionally, we have observed an increasingly competitive labor market. Tight labor markets have resulted in labor inflation and longer times to fill open positions. Increased employee turnover, changes in the availability of our workers, including as a result of COVID-19-related absences, and labor shortages in our supply chain have resulted in, and could continue to result in, increased costs which could negatively affect our financial condition, results of operations, or cash flows. Results of Operations Our primary sources of revenue are from sales of fuel cell systems, related infrastructure and equipment, services performed on fuel cell systems and related infrastructure, Power Purchase Agreements (PPAs), and fuel delivered to customers. A certain portion of our sales result from acquisitions in legacy markets, which we are working to transition to renewable solutions. Revenue from sales of fuel cell systems, related infrastructure and equipment represents sales of our GenDrive units, GenSure stationary backup power units, cryogenic stationary and on road storage, electrolyzers and hydrogen fueling infrastructure. Revenue from services performed on fuel cell systems and related infrastructure represents revenue earned on our service and maintenance contracts and sales of spare parts. Revenue from PPAs primarily represents payments received from customers who make monthly payments to access the Company’s GenKey solution. Revenue associated with fuel delivered to customers represents the sale of hydrogen to customers that has been purchased by the Company from a third party or generated on site. Provision for Common Stock Warrants On August 24, 2022, the Company and Amazon entered into the 2022 Transaction Agreement, under which the Company concurrently issued to Amazon.com NV Investment Holdings LLC, a wholly owned subsidiary of Amazon, the Amazon Warrant, to acquire the Amazon Warrant Shares, subject to certain vesting events described below. The Company and Amazon entered into the 2022 Transaction Agreement in connection with a concurrent commercial arrangement under which Amazon agreed to purchase hydrogen fuel from the Company through August 24, 2029. In 2017, in separate transactions, the Company issued to each of Amazon.com NV Investment Holdings LLC and Walmart, Inc. (“Walmart”) warrants to purchase shares of the Company’s common stock. The Company recorded a portion of the estimated fair value of the warrants as a reduction of revenue based upon the projected number of shares of common stock expected to vest under the warrants, the proportion of purchases by Amazon, Walmart and their affiliates within the period relative to the aggregate purchase levels required for vesting of the respective warrants, and the then-current fair value of the warrants. For the third tranche of the shares under Walmart’s warrant, the exercise price will be determined once the second tranche vests. For the third tranche of the Amazon Warrant Shares, see below for the exercise price and measurement dates used. The amount of provision for common stock warrants recorded as a reduction of revenue during the years ended December 31, 2022 and 2021 respectively, is shown in the table below (in thousands): | | | | | | | | | Year Ended December 31, | | | 2022 | | 2021 | | | | | | | | Sales of fuel cell systems, related infrastructure and equipment | | $ | (3,580) | | $ | — | Services performed on fuel cell systems and related infrastructure | | | (1,003) | | | (497) | Power purchase agreements | | | (3,611) | | | (3,444) | Fuel delivered to customers | | | (4,489) | | | (2,625) | Total | | $ | (12,683) | | $ | (6,566) |
Net revenue, cost of revenue, gross profit/(loss) and gross margin for the years ended December 31, 2022 and 2021 were as follows (in thousands): | | | | | | | | | | | | | | | | | | | | | | | | | | | | Cost of | | Gross | | Gross | | | Net Revenue | | Revenue | | Profit/(Loss) | | Margin | | For the year ended December 31, 2022: | | | | | | | | | | | | Sales of fuel cell systems, related infrastructure and equipment | $ | 558,932 | | $ | 468,057 | | $ | 90,875 | | 16.3 | % | Services performed on fuel cell systems and related infrastructure | | 35,280 | | | 59,365 | | | (24,085) | | (68.3) | % | Provision for loss contracts related to service | | — | | | 26,801 | | | (26,801) | | N/A | | Power purchase agreements | | 47,183 | | | 144,696 | | | (97,513) | | (206.7) | % | Fuel delivered to customers and related equipment | | 57,196 | | | 194,255 | | | (137,059) | | (239.6) | % | Other | | 2,849 | | | 2,622 | | | 227 | | 8.0 | % | Total | $ | 701,440 | | $ | 895,796 | | $ | (194,356) | | (27.7) | % | For the year ended December 31, 2021: | | | | | | | | | | | | Sales of fuel cell systems, related infrastructure and equipment | $ | 392,777 | | $ | 307,157 | | $ | 85,620 | | 21.8 | % | Services performed on fuel cell systems and related infrastructure | | 26,706 | | | 63,729 | | | (37,023) | | (138.6) | % | Provision for loss contracts related to service | | — | | | 71,988 | | | (71,988) | | N/A | | Power purchase agreements | | 35,153 | | | 102,417 | | | (67,264) | | (191.3) | % | Fuel delivered to customers and related equipment | | 46,917 | | | 127,196 | | | (80,279) | | (171.1) | % | Other | | 789 | | | 1,165 | | | (376) | | (47.7) | % | Total | $ | 502,342 | | $ | 673,652 | | $ | (171,310) | | (34.1) | % |
Net Revenue Revenue —sales of fuel cell systems, related infrastructure and equipment. Revenue from sales of fuel cell systems, related infrastructure and equipment represents sales of our GenDrive units, GenSure stationary backup power units, cryogenic stationary and on road storage, electrolyzers and hydrogen fueling infrastructure referred to at the site level as hydrogen installations.Revenue from sales of fuel cell systems, related infrastructure and equipment for the year ended December 31, 2022 increased $166.2 million, or 42.3%, to $558.9 million from $392.8 million for the year ended December 31, 2021. The total revenue generated by Applied Cryo Technologies (“ACT”) and Frames was approximately $141.0 million and $15.8 million for the year ended December 31, 2022 and 2021, respectively. A certain portion of our sales of engineered equipment from legacy oil and gas orders are from the Frames acquisition and are not expected to continue beyond current commitments. The total revenue generated by Joule and CIS was approximately $40.2 million for the year ended December 31, 2022. There was no revenue in 2021 related to the Joule and CIS acquisitions. Recorded as a reduction of revenue was a provision for common stock warrants of $3.6 million and $0 for the years ended December 31, 2022 and 2021, respectively. Revenue for GenDrive units decreased, as there were 8,274 GenDrive units recognized as revenue in 2022, as compared to 12,806 in 2021. Revenue for hydrogen infrastructure increased due primarily to mix of customers, as there were there were 44 hydrogen fueling infrastructure sites recognized as revenue during the year ended December 31, 2022, as compared to 49 in 2021. Revenue — services performed on fuel cell systems and related infrastructure. Revenue from services performed on fuel cell systems and related infrastructure represents revenue earned on our service and maintenance contracts and sales of spare parts. Revenue from services performed on fuel cell systems and related infrastructure for the year ended December 31, 2022 increased $8.6 million, or 32.1%, to $35.3 million from $26.7 million for the year ended December 31, 2021. Recorded as a reduction of revenue from services was provision for common stock warrants of $1.0 million and $0.5 million for the years ended December 31, 2022 and 2021, respectively. The increase in revenue from services performed on fuel cell systems and related infrastructure in 2022 was related to our expanding customer base and increase in the number of GenDrive units and infrastructure systems in service. The average number of GenDrive units under maintenance contracts during the year ended December 31, 2022 was 19,515, compared to 16,987 in 2021. Revenue — Power Purchase Agreements. Revenue from PPAs represents payments received from customers for power generated through the provision of equipment and service. Revenue from PPAs for the year ended December 31, 2022 increased $12.0 million, or 34.2%, to $47.2 million from $35.2 million for the year ended December 31, 2021. Recorded as a reduction of revenue was provision for common stock warrants of $3.6 million and $3.4 million for the years ended December 31, 2022 and 2021, respectively. The increase in revenue was a result of an increase in the average number of units and customer sites party to these agreements. There was an average of 25,188 units under PPAs generating revenue in 2022, compared to 19,370 in 2021. The average number of sites under PPA arrangements was 91 in 2022, compared to 61 in 2021. Revenue — fuel delivered to customers and related equipment. Revenue associated with fuel and related equipment delivered to customers represents the sale of hydrogen that has been purchased by the Company from a third party or generated on site. Revenue associated with fuel delivered to customers for the year ended December 31, 2022 increased $10.3 million, or 21.9%, to $57.2 million from $46.9 million for the year ended December 31, 2021. Recorded as a reduction of revenue was provision for common stock warrants of $4.5 million and $2.6 million for the years ended December 31, 2022 and 2021, respectively. In addition, there were 196 sites associated with fuel contracts at December 31, 2022, compared to 152 at December 31, 2021. While there has been an increase in the number of sites associated with fuel contracts, the full hydrogen supply will not commence until distribution centers are utilized at capacity. This is consistent with the increased sales of fuel cell systems, related infrastructure and equipment sales as well as increases in the level of deployment of PPA sites. Cost of Revenue Cost of revenue — sales of fuel cell systems, related infrastructure and equipment. Cost of revenue from sales of fuel cell systems, related infrastructure and equipment includes direct materials, labor costs, and allocated overhead costs related to the manufacture of our fuel cells such as GenDrive units and GenSure stationary back-up power units, cryogenic stationary and on road storage, and electrolyzers, as well as hydrogen fueling infrastructure referred to at the site level as hydrogen installations. Cost of revenue from sales of fuel cell systems, related infrastructure and equipment for the year ended December 31, 2022 increased $160.9 million, or 52.4%, to $468.1 million, compared to $307.2 million for the year ended December 31, 2021. This increase was primarily due to costs incurred by Applied Cryo, Joule, Frames, and CIS of $147.3 million, all of which were recent acquisitions by the Company. These costs were incremental in 2022 as these acquisitions occurred in the fourth quarter of 2021, the first quarter of 2022 or fourth quarter of 2022. There were 8,274 GenDrive units recognized as revenue during the year ended December 31, 2022, compared to 12,806 for the year ended December 31, 2021. There were 44 sites associated with hydrogen fueling infrastructure revenue for the year ended December 31, 2022 compared to 49 for the year ended December 31, 2021. The gross margin generated from sales of fuel cell systems, related infrastructure and equipment was 16.3% for the year ended December 31, 2022, compared to 21.8% for the year ended December 31, 2021, primarily due to: (i) increased material cost largely due to inflationary pressures, and higher labor costs given an increasingly competitive labor market and COVID-19 related staffing and coverage issues; and (ii) the margin on the equipment revenue from certain recently acquired businesses being lower than our historical equipment margins given the focus on integrating and scaling these new businesses. Cost of revenue — services performed on fuel cell systems and related infrastructure. Cost of revenue from services performed on fuel cell systems and related infrastructure includes the labor, material costs and allocated overhead costs incurred for our product service and hydrogen site maintenance contracts and spare parts. Cost of revenue from services performed on fuel cell systems and related infrastructure for the year ended December 31, 2022 decreased $4.4 million, or 6.8%, from $63.7 million for the year ended December 31, 2021 to $59.4 million for the year ended December 31, 2022. There were 19,515 units under maintenance contracts generating revenue during the year ended December 31, 2022, compared to 16,987 for the year ended December 31, 2021, on average. Gross loss decreased to (68.3%) for the year ended December 31, 2022 compared to (138.6)% for the year ended December 31, 2021. Cost of revenue and gross loss both decreased, primarily due to an increase in the release of loss accrual during 2022. Cost of revenue — provision for loss accrual. The Company recorded a provision for loss accrual during 2022 of $26.8 million, a decrease of $45.1 million over the provision for loss accrual of $72.0 million in 2021. The increased level of provision in 2021 was driven primarily by an increase in estimated projected costs to service units and an increase in the number of service contracts in 2021. The same level of increase in projected costs did not occur in 2022, as the Company has progressed on certain cost down initiatives. While the provision was lower in 2022 compared to 2021, the provision was slightly higher than expectations due to varied delays in reliability investment deployments. Cost of revenue — Power Purchase Agreements. Cost of revenue from PPAs includes depreciation of assets utilized and service costs to fulfill PPA obligations and interest costs associated with certain financial institutions for leased equipment. Cost of revenue from PPAs for the year ended December 31, 2022 increased $42.3 million, or 41.3%, to $144.7 million from $102.4 million for the year ended December 31, 2021. The increase in cost was primarily a result of an increase in the average number of units and customer sites party to these agreements. There was an average of 25,188 units under PPAs in 2022, compared to 19,370 in 2021. The average number of sites under PPA arrangements was 91 in 2022, compared to 61 in 2021. Gross loss increased to (206.7%) for the year ended December 31, 2022 compared to (191.3)% for the year ended December 31, 2021. In addition to volume, other unfavorable cost drivers included inflation and COVID-19 related issues, such as increased part costs and freight charges. Cost of revenue — fuel delivered to customers and related equipment. Cost of revenue from fuel delivered to customers and related equipment represents the purchase of hydrogen from suppliers and internally produced hydrogen that is ultimately sold to customers. Cost of revenue from fuel delivered to customers for the year ended December 31, 2022 increased $67.1 million, or 52.7%, to $194.3 million from $127.2 million for the year ended December 31, 2021. The increase was due primarily to higher volume of liquid hydrogen delivered to customer sites as a result of an increase in the number of hydrogen installations completed under GenKey agreements and higher fuel costs driven by the impact of higher natural gas prices and varied third-party vendor force majeure issues. There were 196 sites associated with fuel contracts at December 31, 2022, compared to 152 at December 31, 2021. Gross loss increased to (239.6%) during the year ended December 31, 2022 compared to (171.1)% during the year ended December 31, 2021, primarily due to the increase in cost of revenue described above, as well as a reduction of revenue resulting from an increase in the provision for common stock warrants of $4.5 million and $2.6 million for the year ended December 31, 2022 and 2021, respectively. Expenses Research and development expense. Research and development expense includes: materials to build development and prototype units, cash and non-cash compensation and benefits for the engineering and related staff, expenses for contract engineers, fees paid to consultants for services provided, materials and supplies consumed, facility related costs such as computer and network services, and other general overhead costs associated with our research and development activities. Research and development expense for the year ended December 31, 2022 increased $34.8 million, or 53.8%, to $99.6 million from $64.8 million for the year ended December 31, 2021. The overall growth in R&D investment is commensurate with the Company’s future expansion into new markets, new product lines, and varied vertical integrations. Selling, general and administrative expenses. Selling, general and administrative expenses includes cash and non-cash compensation, benefits, amortization of intangible assets and related costs in support of our general corporate functions, including general management, finance and accounting, human resources, selling and marketing, information technology and legal services. Selling, general and administrative expenses for the year ended December 31, 2022 increased $184.1 million, or 102.3%, to $363.9 million from $179.9 million for the year ended December 31, 2021. This increase was primarily related to increases in stock-based compensation of $91.7 million, as well as compensation expenses related to headcount increases and branding expenses. Impairment of long-lived assets. The Company recorded an impairment of $5.2 million for the year ended December 31, 2022, as compared to $10.2 million for the year ended December 31, 2021. The impairment of long-lived assets in both years was primarily related to right of use assets and equipment related to delivery of fuel to customers. Change in fair value of contingent consideration. The fair value of the contingent consideration is related to earnouts for the Giner ELX, Inc., United Hydrogen Group Inc, Frames, Applied Cryo, and Joule acquisitions. The change in fair value for the year ended December 31, 2022 and 2021 was $16.5 million and $11.2 million, respectively, primarily due to fair value remeasurements. Interest income. Interest income primarily consists of income generated by our investment holdings, restricted cash escrow accounts, and money market accounts. Interest income for the year ended December 31, 2022, increased $33.2 million or 822.3%, as compared to the year ended December 31, 2021, and was due to an increase in available-for-sale securities during 2021 consisting primarily of corporate bonds and U.S. Treasuries. Interest expense. Interest expense consists of interest expense related to our long-term debt, convertible senior notes, obligations under finance leases and our finance obligations. Interest expense for the year ended December 31, 2022, decreased $4.2 million, as compared to the year ended December 31, 2021. Other expense, net. Other expense, net consists of other expenses related to our foreign currency exchange losses, offset by interest and other income. Other expense, net increased $1.5 million for the year ended December 31, 2022 in comparison to 2021. Realized loss on investments, net. Realized loss on investments, net consists of the sales related to available-for-sale debt securities. For the year ended December 31, 2022, the Company had $1.4 million of net realized loss on investments as compared to $0.1 million for the year ended December 31, 2021. Change in fair value of equity securities. Change in fair value of equity securities consists of the changes in fair value for equity securities from the purchase date to the end of the period. For the year ended December 31, 2022, the Company had $18.2 million of decrease in fair value of equity securities as compared to an increase in fair value $6.7 million for the year ended December 31, 2021. Loss on equity method investments. Loss on equity method investments consists of our interest in HyVia, which is our 50/50 joint venture with Renault, AccionaPlug S.L., which is our 50/50 joint venture with Acciona, and SK Plug Hyverse, which is our 49/51 joint venture with SK E&S. For the year ended December 31, 2022, the Company recorded a loss of $20.2 million on equity method investments. These losses are driven from the start-up activities for commercial and production operations. Income Tax The Company recognized an income tax expense for the year ended December 31, 2022 of $0.8 million related to foreign current and deferred tax expense of $1.7 million and the $0.9 million reversal of U.S. net deferred tax liabilities in connection with the acquisition of Giner ELX, Inc. The Company has not changed its overall conclusion with respect to the need for a valuation allowance against its net deferred tax assets, which remain fully reserved within the United States and foreign jurisdictions, with the exception of the Netherlands. The net deferred tax asset generated from the Company’s current period NOL has been offset by a full valuation allowance because it is more likely than not that the tax benefits of the NOL carry forward will not be realized. The Company recognizes interest and penalties on the Interest and other expense, net line in the accompanying consolidated statements of operations. The Company recognized an income tax benefit for the year ended December 31, 2021 of $16.2 million primarily related to the recognition of net deferred tax liabilities in connection with the acquisition of Applied Cryo. This resulted in a corresponding reduction in our deferred tax asset valuation allowance. The Company has not changed its overall conclusion with respect to the need for a valuation allowance against its net deferred tax assets, which remain fully reserved. Liquidity and Capital Resources As of December 31, 2022, the Company had $690.6 million of cash and cash equivalents, $858.7 million of restricted cash, $1.3 billion of available-for-sale securities and $134.8 million of equity securities. The Company has continued to experience negative cash flows from operations and net losses. The Company incurred net losses attributable to common stockholders of $724.0 million, $460.0 million and $596.2 million for the years ended December 31, 2022, 2021, and 2020, respectively. The net cash (used) in operating activities for the year ended December 31, 2022, 2021, and 2020 was $828.6 million, $358.2 million, and $155.5 million, respectively. The Company’s working capital was $2.7 billion at December 31, 2022, which included cash and cash equivalents of $690.6 million and restricted cash of $159.0 million. The Company plans to invest a portion of its available cash to expand its current production and manufacturing capacity, construction of hydrogen plants and to fund strategic acquisitions and partnerships, and capital projects. Future use of the Company’s funds is discretionary and the Company believes that its working capital and cash position will be sufficient to fund its operations for at least one year after the date the financial statements are issued. The net cash used in investing activities for the year ended December 31, 2022, 2021, and 2020 was $679.4 million, $1.7 billion, and $95.4 million, respectively. This included purchases of property, plant and equipment and outflows associated with materials, labor, and overhead necessary to construct new leased property. Cash outflows related to equipment that we lease directly to customers are included in net cash used in investing activities. The net cash (used in) provided by financing activities for the year ended December 31, 2022, 2021, and 2020 was ($77.5) million, $3.6 billion, and $1.5 billion, respectively. The change was primarily driven by proceeds from public and private offerings, net of transaction costs that occurred in 2021. The Company’s significant obligations consisted of the following as of December 31, 2022: | ● | Operating and finance leases totaling $320.4 million and $46.1 million, respectively, of which $48.9 million and $8.1 million, respectively, are due within the next 12 months. These leases are primarily related to sale/leaseback agreements entered into with various financial institutions to facilitate the Company’s commercial transactions with key customers. |
| ● | Finance obligations totaling $329.2 million of which approximately $58.9 million is due within the next 12 months. Finance obligations consist primarily of debt associated with the sale of future revenues and failed sale/leaseback transactions. |
| ● | Convertible senior notes totaling $193.9 million at December 31, 2022, none of which is due within the next twelve months. See Note 15 to the consolidated financial statements, “Convertible Senior Notes,” for more details. |
The Company believes that its current working capital of $2.7 billion at December 31, 2022, which includes unrestricted cash and cash equivalents of $690.6 million, and available-for-sale securities of $1.3 billion, will provide sufficient liquidity to fund operations for a least one year after the date the financial statements are issued. Common Stock Issuances In January and February 2021, the Company issued and sold in a registered equity offering an aggregate of 32.2 million shares of its common stock at a purchase price of $65.00 per share for net proceeds of approximately $2.0 billion. Furthermore, in February 2021, the Company completed a sale of its common stock in connection with a strategic partnership with SK Holdings Co., Ltd. (“SK Holdings”). The Company sold 54,996,188 shares of its common stock to a subsidiary of SK Holdings at a purchase price of $29.29 per share, or an aggregate purchase price of approximately $1.6 billion. In November 2020, the Company issued and sold in a registered direct offering an aggregate of 43,700,000 shares of its common stock at a purchase price of $22.25 per share for net proceeds of approximately $927.3 million. In August 2020, the Company issued and sold in a registered direct offering an aggregate of 35,276,250 shares of its common stock at a purchase price of $10.25 per share for net proceeds of approximately $344.4 million. Secured Debt In March 2019, the Company entered into a loan and security agreement, as amended, with Generate Lending, LLC, providing for a secured term loan facility in the amount of $100 million (the “Term Loan Facility”). In December 2022, the Company fully repaid the outstanding balance of the Term Loan Facility. In June 2020, the Company acquired debt as part of the acquisition of United Hydrogen Group Inc. The outstanding carrying value of the debt was $9.0 million as of December 31, 2022, bearing varying interest rates ranging from 2.2% to 8.3%, and is scheduled to mature in 2026. 3.75% Convertible Senior Notes On May 18, 2020, the Company issued $200.0 million in aggregate principal amount of 3.75% Convertible Senior Notes due June 1, 2025, which is referred to herein as the 3.75% Convertible Senior Notes, in a private placement to qualified institutional buyers pursuant to Rule 144A under the Securities Act of 1933, as amended, or the Securities Act. On May 29, 2020, the Company issued an additional $12.5 million in aggregate principal amount of 3.75% Convertible Senior Notes. At issuance in May 2020, the total net proceeds from the 3.75% Convertible Senior Notes, after deducting the initial purchaser’s discount, the costs of related capped calls and other issuance costs, were approximately $189.2 million. The 3.75% Convertible Senior Notes bear interest at a rate of 3.75% per year, payable semi-annually in arrears on June 1 and December 1 of each year, beginning on December 1, 2020. The notes will mature on June 1, 2025, unless earlier converted, redeemed or repurchased in accordance with their terms. The 3.75% Convertible Senior Notes are senior, unsecured obligations of the Company and rank senior in right of payment to any of the Company’s indebtedness that is expressly subordinated in right of payment to the notes, equal in right of payment to any of the Company’s existing and future liabilities that are not so subordinated, effectively junior in right of payment to any of the Company’s secured indebtedness to the extent of the value of the collateral securing such indebtedness, and structurally subordinated to all indebtedness and other liabilities, including trade payables, of its current or future subsidiaries. Holders of the 3.75% Convertible Senior Notes may convert their notes at their option at any time prior to the close of the business day immediately preceding December 1, 2024 in the following circumstances: 1) during any calendar quarter commencing after March 31, 2021, if the last reported sale price of the Company’s common stock exceeds 130% of the conversion price for each of at least 20 trading days (whether or not consecutive) during a period of 30 consecutive trading days ending on, and including, the last trading day of the immediately preceding calendar quarter; 2) during the five business days after any five consecutive trading day period (such five consecutive trading day period, the measurement period) in which the trading price per $1,000 principal amount of the 3.75% Convertible Senior Notes for each trading day of the measurement period was less than 98% of the product of the last reported sale price of the Company’s common stock and the conversion rate on each such trading day; 3) if the Company calls any or all of the 3.75% Convertible Senior Notes for redemption, any such notes that have been called for redemption may be converted at any time prior to the close of business on the second scheduled trading day immediately preceding the redemption date; or 4) upon the occurrence of specified corporate events, as described in the indenture governing the 3.75% Convertible Senior Notes. On or after December 1, 2024, the holders of the 3.75% Convertible Senior Notes may convert all or any portion of their notes at any time prior to the close of business on the second scheduled trading day immediately preceding the maturity date regardless of the foregoing conditions. The initial conversion rate for the 3.75% Convertible Senior Notes is 198.6196 shares of the Company’s common stock per $1,000 principal amount of notes, which is equivalent to an initial conversion price of approximately $5.03 per share of the Company’s common stock, subject to adjustment upon the occurrence of specified events. Upon conversion, the Company will pay or deliver, as applicable, cash, shares of the Company’s common stock or a combination of cash and shares of the Company’s common stock, at the Company’s election. During the year ended December 31, 2022, there were no conversions. During the year ended December 31, 2021, $15.2 million of the 3.75% Convertible Senior Notes were converted and the Company issued approximately 3.0 million shares of common stock in conjunction with these conversions. In addition, following certain corporate events or following issuance of a notice of redemption, the Company will increase the conversion rate for a holder who elects to convert its notes in connection with such a corporate event or convert its notes called for redemption during the related redemption period in certain circumstances. The 3.75% Convertible Senior Notes will be redeemable, in whole or in part, at the Company’s option at any time, and from time to time, on or after June 5, 2023 and before the 41st scheduled trading day immediately before the maturity date, at a cash redemption price equal to 100% of the principal amount of the notes to be redeemed, plus accrued and unpaid interest, if any, but only if the last reported sale price per share of the Company’s common stock exceeds 130% of the conversion price then in effect for at least 20 trading days (whether or not consecutive), including at least one of the three trading days immediately preceding the date the Company sends the related redemption notice, during any 30 consecutive trading day period ending on, and including, the trading day immediately preceding the date on which the Company sends such redemption notice. If the Company undergoes a “fundamental change” (as defined in the Indenture), holders may require the Company to repurchase their notes for cash all or any portion of their notes at a fundamental change repurchase price equal to 100% of the principal amount of the notes to be repurchased, plus accrued and unpaid interest, to, but excluding, the fundamental change repurchase date. The Company accounts for the 3.75% Convertible Senior Notes as a liability. We incurred transaction costs related to the issuance of the 3.75% Convertible Senior Notes of approximately $7.0 million, consisting of initial purchasers’ discount of approximately $6.4 million and other issuance costs of $0.6 million which were recorded as debt issuance cost (presented as contra debt in the consolidated balance sheets) and are being amortized to interest expense over the term of the 3.75% Convertible Senior Notes. Based on the closing price of the Company’s common stock of $12.37 on December 30, 2022, the if-converted value of the notes was greater than the principal amount. The estimated fair value of the note at December 31, 2022 was approximately $493.0 million. Fair value estimation was primarily based on a stock exchange, active trade on December 29, 2022 of the 3.75% Senior Convertible Note. The Company considers this a Level 2 fair value measurement. Capped Call In conjunction with the pricing of the 3.75% Convertible Senior Notes, the Company entered into privately negotiated capped call transactions (the “3.75% Notes Capped Call”) with certain counterparties at a price of $16.2 million. The 3.75% Notes Capped Call covers, subject to anti-dilution adjustments, the aggregate number of shares of the Company’s common stock that underlie the initial 3.75% Convertible Senior Notes and is generally expected to reduce potential dilution to the Company’s common stock upon any conversion of the 3.75% Convertible Senior Notes and/or offset any cash payments the Company is required to make in excess of the principal amount of the converted notes, as the case may be, with such reduction and/or offset subject to a cap based on the cap price. The cap price of the 3.75% Notes Capped Call is initially $6.7560 per share, which represents a premium of approximately 60%over the last then-reported sale price of the Company’s common stock of $4.11 per share on the date of the transaction and is subject to certain adjustments under the terms of the 3.75% Notes Capped Call. The 3.75% Notes Capped Call becomes exercisable if the conversion option is exercised. The net cost incurred in connection with the 3.75% Notes Capped Call has been recorded as a reduction to additional paid-in capital in the consolidated balance sheet. 5.5% Convertible Senior Notes In March 2018, the Company issued $100.0 million in aggregate principal amount of the 5.5% Convertible Senior Notes due on March 15, 2023 (the “5.5 Convertible Senior Notes”), in a private placement to qualified institutional buyers pursuant to Rule 144A under the Securities Act. In May 2020, the Company used a portion of the net proceeds from the issuance of the 3.75% Convertible Senior Notes to finance the cash portion of the partial repurchase of the 5.5% Convertible Senior Notes, which consisted of a repurchase of approximately $66.3 million in aggregate principal amount of the 5.5% Convertible Senior Notes in privately-negotiated transactions for aggregate consideration of $128.9 million, consisting of approximately $90.2 million in cash and approximately 9.4 million shares of the Company’s common stock. The partial repurchase of the 5.5% Convertible Senior Notes resulted in a $13.2 million gain on early debt extinguishment. In the fourth quarter of 2020, $33.5 million of the remaining 5.5% Convertible Senior Notes were converted into 14.6 million shares of common stock which resulted in a gain of approximately $4.5 million which was recorded on the consolidated statement of operations on the gain (loss) on extinguishment of debt line. On January 7, 2021, the remaining aggregate principal of $160 thousand aggregate principal amount of the 5.5% Convertible Senior Notes were converted into 69,808 shares of common stock. Interest expense and amortization for the period were immaterial. Capped Call In conjunction with the pricing of the 5.5% Convertible Senior Notes, the Company entered into privately negotiated capped call transactions (the “5.5% Notes Capped Call”) with certain counterparties at a price of $16.0 million to reduce the potential dilution to the Company’s common stock upon any conversion of the 5.5% Convertible Senior Notes and/or offset any cash payments the Company is required to make in excess of the principal amount of the converted 5.5% Convertible Senior Notes, as the case may be. The net cost incurred in connection with the 5.5% Notes Capped Call has been recorded as a reduction to additional paid-in capital in the consolidated balance sheets. In conjunction with the pricing of the partial repurchase of the 5.5% Convertible Senior Notes, the Company terminated 100% of the 5.5% Notes Capped Call on June 5, 2020. As a result of the termination, the Company received $24.2 million, which was recorded in additional paid-in capital in the consolidated balance sheets. The net cost incurred in connection with the 5.5% Notes Capped Call has been recorded as a reduction to additional paid-in capital in the consolidated balance sheets. In conjunction with the partial repurchase of the 5.5% Convertible Senior Notes, the Company terminated 100% of the 5.5% Notes Capped Call on June 5, 2020. As a result of the termination, the Company received $24.2 million which was recorded in additional paid-in capital. Common Stock Forward In connection with the issuance of the 5.5% Convertible Senior Notes, the Company also entered into a forward stock purchase transaction (the “Common Stock Forward”), pursuant to which the Company agreed to purchase 14,397,906 shares of its common stock for settlement on or about March 15, 2023. In connection with the issuance of the 3.75% Convertible Senior Notes and the partial repurchase of the 5.5% Convertible Senior Notes, the Company amended and extended the maturity of the Common Stock Forward to June 1, 2025. The number of shares of common stock that the Company will ultimately repurchase under the Common Stock Forward is subject to customary anti-dilution adjustments. The Common Stock Forward is subject to early settlement or settlement with alternative consideration in the event of certain corporate transactions. The net cost incurred in connection with the Common Stock Forward of $27.5 million was recorded as an increase in treasury stock in the consolidated balance sheets. The related shares were accounted for as a repurchase of common stock. The book value of the 5.5% Notes Capped Call and Common Stock Forward are not remeasured. There were no shares of common stock settled in connection with the Common Stock Forward during the year ended December 31, 2022. During the year ended December 31, 2021, 8.1 million shares were settled and received by the Company. Common Stock Transactions Amazon Transaction Agreement in 2022 On August 24, 2022, the Company and Amazon entered into a Transaction Agreement (the “2022 Transaction Agreement”), under which the Company concurrently issued to Amazon.com NV Investment Holdings LLC, a wholly owned subsidiary of Amazon, a warrant (the “2022 Amazon Warrant”) to acquire up to 16,000,000 shares (the “2022 Amazon Warrant Shares”) of the Company’s common stock, subject to certain vesting events described below. The Company and Amazon entered into the 2022 Transaction Agreement in connection with a concurrent commercial arrangement under which Amazon agreed to purchase hydrogen fuel from the Company through August 24, 2029. Warrant 1,000,000 of the 2022 Amazon Warrant Shares vested immediately upon issuance of the 2022 Amazon Warrant. 15,000,000 of the 2022 Amazon Warrant Shares will vest in multiple tranches over the 7-year term of the 2022 Amazon Warrant based on payments made to the Company directly by Amazon or its affiliates, or indirectly through third parties, with 15,000,000 of the 2022 Amazon Warrant Shares fully vesting if Amazon-related payments of $2.1 billion are made in the aggregate. The exercise price for the first 9,000,000 2022 Amazon Warrant Shares is $22.9841 per share and the fair value on the grant date was $20.36. The exercise price for the remaining 7,000,000 2022 Amazon Warrant Shares will be an amount per share equal to 90% of the 30-day volume weighted average share price of the Company’s common stock as of the final vesting event that results in full vesting of the first 9,000,000 2022 Amazon Warrant Shares. The 2022 Amazon Warrant is exercisable through August 24, 2029. Upon the consummation of certain change of control transactions (as defined in the 2022 Amazon Warrant) prior to the vesting of at least 60% of the aggregate 2022 Amazon Warrant Shares, the 2022 Amazon Warrant will automatically vest and become exercisable with respect to an additional number of 2022 Amazon Warrant Shares such that 60% of the aggregate 2022 Amazon Warrant Shares shall have vested. If a change of control transaction is consummated after the vesting of at least 60% of the aggregate 2022 Amazon Warrant Shares, then no acceleration of vesting will occur with respect to any of the unvested 2022 Amazon Warrant Shares as a result of the transaction. The exercise price and the 2022 Amazon Warrant Shares issuable upon exercise of the Amazon Warrant are subject to customary antidilution adjustments. At December 31, 2022, 1,000,000 of the 2022 Amazon Warrant Shares issued pursuant to the 2022 Transaction Agreement had vested upon issuance. The warrant charge associated with the vested shares of $20.4 million was capitalized to contract assets in our consolidated financial statements based on the grant date fair value and is subsequently amortized ratably as a reduction to revenue based on the Company’s estimate of revenue over the term of the agreement. The grant date fair value of tranches 2 and 3 will also be amortized ratably as a reduction to revenue based on the Company’s estimate of revenue over the term of the agreement. Because the exercise price has yet to be determined, the fair value of tranche 4 will be remeasured at each reporting period end and amortized ratably as a reduction to revenue based on the Company’s estimate of revenue over the term of the agreement. The total amount of provision for common stock warrants recorded as a reduction of revenue for the 2022 Amazon Warrant during the year ended December 31, 2022 was $5.2 million. The assumptions used to calculate the valuations as of August 24, 2022 and December 31, 2022 are as follows: | | | | | | | Tranches 1-3 | | Tranche 4 | | | August 24, 2022 | | December 31, 2022 | Risk-free interest rate | | 3.15% | | 3.88% | Volatility | | 75.00% | | 75.00% | Expected average term | | 7 years | | 4 years | Exercise price | | $22.98 | | $11.13 | Stock price | | $20.36 | | $12.37 |
Amazon Transaction Agreement in 2017 On April 4, 2017, the Company and Amazon entered into a Transaction Agreement (the “2017 Transaction Agreement”), pursuant to which the Company agreed to issue to Amazon a warrant (the “2017 Amazon Warrant”) to acquire up to 55,286,696 shares of the Company’s common stock (the “2017 Amazon Warrant Shares”), subject to certain vesting events described below. The Company and Amazon entered into the 2017 Amazon Transaction Agreement in connection with existing commercial agreements between the Company and Amazon with respect to the deployment of the Company’s GenKey fuel cell technology at Amazon distribution centers. The existing commercial agreements contemplate, but do not guarantee, future purchase orders for the Company’s fuel cell technology. The vesting of the 2017 Amazon Warrant Shares was conditioned upon payments made by Amazon or its affiliates (directly or indirectly through third parties) pursuant to the existing commercial agreements. Under the terms of the 2017 Amazon Warrant, the first tranche of the 5,819,652 of the 2017 Amazon Warrant Shares vested upon execution of the 2017 Amazon Warrant, and the remaining 2017 Amazon Warrant Shares vest based on Amazon’s payment of up to $600.0 million to the Company in connection with Amazon’s purchase of goods and services from the Company. The $6.7 million fair value of the first tranche of the 2017 Amazon Warrant Shares, was recognized as selling, general and administrative expense upon execution of the 2017 Amazon Warrant. Provision for the second and third tranches of the 2017 Amazon Warrant Shares was recorded as a reduction of revenue, because they represent consideration payable to a customer. The fair value of the second tranche of the 2017 Amazon Warrant Shares was measured at January 1, 2019, upon adoption of ASU 2019-08. The second tranche of 29,098,260 of the 2017 Amazon Warrant Shares vested in four equal installments, as Amazon or its affiliates, directly or indirectly through third parties, made an aggregate of $50.0 million in payments for goods and services to the Company, up to payments totaling $200.0 million in the aggregate. The last installment of the second tranche vested on November 2, 2020. Revenue reductions of $497 thousand, $9.0 million and $4.1 million were associated with the second tranche of the 2017 Amazon Warrant Shares were recorded in 2021, 2020, and 2019, respectively, under the terms of the 2017 Amazon Warrant. Under the terms of the 2017 Amazon Warrant, the third tranche of 20,368,784 of the 2017 Amazon Warrant Shares vests in eight equal installments, as Amazon or its affiliates, directly or indirectly through third parties, made an aggregate of $50.0 million in payments for goods and services to the Company, up to payments totaling $400.0 million in the aggregate. The measurement date for the third tranche of the 2017 Amazon Warrant Shares was November 2, 2020, when their exercise price was determined, as discussed further below. The fair value of the third tranche of the 2017 Amazon Warrant Shares was determined to be $10.57 each. During 2020, revenue reductions of $24.1 million associated with the third tranche of the 2017 Amazon Warrant Shares were recorded under the terms of the 2017 Amazon Warrant, prior to the December 31, 2020 waiver described below. On December 31, 2020, the Company waived the remaining vesting conditions under the 2017 Amazon Warrant, which resulted in the immediate vesting of all the third tranche of the 2017 Amazon Warrant Shares and recognition of an additional $399.7 million reduction to revenue. The $399.7 million reduction to revenue resulting from the December 31, 2020 waiver was determined based upon a probability assessment of whether the underlying shares would have vested under the terms of the 2017 Amazon Warrant. Based upon the Company’s projections of probable future cash collections from Amazon (i.e., a Type I share based payment modification), a reduction of revenue associated with 5,354,905 of the 2017 Amazon Warrant Shares was recognized at their previously measured November 2, 2020 fair value of $10.57 per warrant. A reduction of revenue associated with the remaining 12,730,490 of the 2017 Amazon Warrant Shares was recognized at their December 31, 2020 fair value of $26.95 each, based upon the Company’s assessment that associated future cash collections from Amazon were not deemed probable (i.e., a Type III share-based payment modification). The $399.7 million reduction to revenue was recognized during the year ended December 31, 2020 because the Company concluded such amount was not recoverable from the margins expected from future purchases by Amazon under the 2017 Amazon Warrant, and no exclusivity or other rights were conferred to the Company in connection with the December 31, 2020 waiver. Additionally, for the year ended December 31, 2020, the Company recorded a reduction to the provision for warrants of $12.8 million in connection with the release of the service loss accrual. The 2017 Amazon Warrant was exercised with respect to 24,704,450 and 17,461,994 shares of the Company’s common stock as of December 31, 2022 and 2021, respectively. At both December 31, 2022 and December 31, 2021, 55,286,696 of the 2017 Amazon Warrant Shares had vested. The total amount of provision for common stock warrants recorded as a reduction of revenue for the 2017 Amazon Warrant during the years ended December 31, 2022, 2021, and 2020 was $0.4 million, $0.5 million and $420.0 million, respectively. The exercise price for the first and second tranches of the 2017 Amazon Warrant Shares was $1.1893 per share. The exercise price of the third tranche of the 2017 Amazon Warrant Shares was $13.81 per share, which was determined pursuant to the terms of the 2017 Amazon Warrant as an amount equal to 90% of the 30-day volume weighted average share price of the Company’s common stock as of November 2, 2020, the final vesting date of the second tranche of the 2017 Amazon Warrant Shares. The 2017 Amazon Warrant is exercisable through April 4, 2027. The 2017 Amazon Warrant provides for net share settlement that, if elected by the holder, will reduce the number of shares issued upon exercise to reflect net settlement of the exercise price. The 2017 Amazon Warrant provides for certain adjustments that may be made to the exercise price and the number of shares of common stock issuable upon exercise due to customary anti-dilution provisions based on future events. The 2017 Amazon Warrant is classified as an equity instrument. Fair value of the 2017 Amazon Warrant at December 31, 2020 and November 2, 2020 was based on the Black Scholes Option Pricing Model, which is based, in part, upon level 3 unobservable inputs for which there is little or no market data, requiring the Company to develop its own assumptions. All 2017 Amazon Warrant Shares were fully vested as of December 31, 2020. The Company used the following assumptions for its 2017 Amazon Warrant: | | | | | | | | | December 31, 2020 | | November 2, 2020 | Risk-free interest rate | | | 0.58% | | 0.58% | Volatility | | | 75.00% | | 75.00% | Expected average term | | | 6.26 | | 6.42 | Exercise price | | | $13.81 | | $13.81 | Stock price | | | $33.91 | | $15.47 |
Walmart Transaction Agreement On July 20, 2017, the Company and Walmart entered into a Transaction Agreement (the “Walmart Transaction Agreement”), pursuant to which the Company agreed to issue to Walmart a warrant (the “Walmart Warrant”) to acquire up to 55,286,696 shares of the Company’s common stock, subject to certain vesting events (the “Walmart Warrant Shares”). The Company and Walmart entered into the Walmart Transaction Agreement in connection with existing commercial agreements between the Company and Walmart with respect to the deployment of the Company’s GenKey fuel cell technology across various Walmart distribution centers. The existing commercial agreements contemplate, but do not guarantee, future purchase orders for the Company’s fuel cell technology. The vesting of the warrant shares conditioned upon payments made by Walmart or its affiliates (directly or indirectly through third parties) pursuant to transactions entered into after January 1, 2017 under existing commercial agreements. The majority of the Walmart Warrant Shares will vest based on Walmart’s payment of up to $600.0 million to the Company in connection with Walmart’s purchase of goods and services from the Company. The first tranche of 5,819,652 Walmart Warrant Shares vested upon the execution of the Walmart Warrant and was fully exercised as of December 31, 2020. Accordingly, $10.9 million, the fair value of the first tranche of Walmart Warrant Shares, was recorded as a provision for common stock warrants and presented as a reduction to revenue on the consolidated statements of operations during 2017. All future provision for common stock warrants is measured based on their grant-date fair value and recorded as a charge against revenue. The second tranche of 29,098,260 Walmart Warrant Shares vests in four installments of 7,274,565 Walmart Warrant Shares each time Walmart or its affiliates, directly or indirectly through third parties, make an aggregate of $50.0 million in payments for goods and services to the Company, up to payments totaling $200.0 million in the aggregate. The exercise price for the first and second tranches of Walmart Warrant Shares is $2.1231 per share. After Walmart has made payments to the Company totaling $200.0 million, the third tranche of 20,368,784 Walmart Warrant Shares will vest in eight installments of 2,546,098 Walmart Warrant Shares each time Walmart or its affiliates, directly or indirectly through third parties, make an aggregate of $50.0 million in payments for goods and services to the Company, up to payments totaling $400.0 million in the aggregate. The exercise price of the third tranche of Walmart Warrant Shares will be an amount per share equal to 90% of the 30-day volume weighted average share price of the common stock as of the final vesting date of the second tranche of Walmart Warrant Shares, provided that, with limited exceptions, the exercise price for the third tranche will not be lower than $1.1893. The Walmart Warrant is exercisable through July 20, 2027. The Walmart Warrant provides for net share settlement that, if elected by the holder, will reduce the number of shares issued upon exercise to reflect net settlement of the exercise price. The Walmart Warrant provides for certain adjustments that may be made to the exercise price and the number of shares of common stock issuable upon exercise due to customary anti-dilution provisions based on future events. The Walmart Warrant is classified as an equity instrument. The warrant had been exercised with respect to 13,094,217 shares of the Company’s common stock as of both December 31, 2022 and 2021. At December 31, 2022 and December 31, 2021, 27,643,347 and 20,368,782 of the Walmart Warrant Shares had vested, respectively. The total amount of provision for common stock warrants recorded as a reduction of revenue for the Walmart Warrant during the years ended December 31, 2022, 2021, and 2020 $7.1 million, $6.1 million, and $5.0 million, respectively. Fair value of the Walmart Warrant was based on the Black Scholes Option Pricing Model, which is based, in part, upon level 3 unobservable inputs for which there is little or no market data, requiring the Company to develop its own assumptions. Except for the third tranche, all existing unvested Walmart Warrant Shares are measured using a measurement date of January 1, 2019, the adoption date, in accordance with ASU 2019-08. The Company used the following assumptions for its Walmart Warrant: | | | | | | | January 1, 2019 | Risk-free interest rate | | | 2.63% | Volatility | | | 95.00% | Expected average term | | | 8.55 | Exercise price | | | $2.12 | Stock price | | | $1.24 |
The assumptions used to calculate the valuations of the final tranche of the Walmart Warrant as of December 31, 2022 are as follows: | | | | | December 31, 2022 | Risk-free interest rate | | 3.92% | Volatility | | 75.00% | Expected average term | | 3.5 years | Exercise price | | $11.13 | Stock price | | $12.37 |
Operating and Finance Lease Liabilities As of December 31, 2022, the Company had operating leases, as lessee, primarily associated with sale/leaseback transactions that are partially secured by restricted cash, security deposits and pledged escrows (see also Note 1 to the consolidated financial statements, “Nature of Operations”) as summarized below. These leases expire over the next one to nine years. Minimum rent payments under operating leases are recognized on a straight-line basis over the term of the lease. Leases contain termination clauses with associated penalties, the amount of which cause the likelihood of cancellation to be remote. At the end of the lease term, the leased assets may be returned to the lessor by the Company, the Company may negotiate with the lessor to purchase the assets at fair market value, or the Company may negotiate with the lessor to renew the lease at market rental rates. No residual value guarantees are contained in the leases. No financial covenants are contained within the lease, however there are customary operational covenants such as assurance the Company properly maintains the leased assets and carries appropriate insurance, etc. The leases include credit support in the form of either cash, collateral or letters of credit. See Note 21 to the consolidated financial statements, “Commitments and contingencies,” for a description of cash held as security associated with the leases. The Company has finance leases associated with its property and equipment in Latham, New York and at fueling customer locations. The fair value of this finance obligation approximated the carrying value as of December 31, 2022. Future minimum lease payments under operating and finance leases (with initial or remaining lease terms in excess of one year) as of December 31, 2022 were as follows (in thousands): | | | | | | | | | | | | | | | Finance | | Total | | | Operating Lease | | Lease | | Lease | | | Liability | | Liability | | Liabilities | 2023 | | $ | 82,019 | | $ | 10,901 | | $ | 92,920 | 2024 | | | 81,157 | | | 10,851 | | | 92,008 | 2025 | | | 76,444 | | | 13,763 | | | 90,207 | 2026 | | | 67,951 | | | 10,904 | | | 78,855 | 2027 | | | 53,741 | | | 6,947 | | | 60,688 | 2028 and thereafter | | | 96,147 | | | — | | | 96,147 | Total future minimum payments | | | 457,459 | | | 53,366 | | | 510,824 | Less imputed interest | | | (137,094) | | | (7,230) | | | (144,324) | Total | | $ | 320,365 | | $ | 46,137 | | $ | 366,500 |
Rental expense for all operating leases was $67.6 million, $38.6 million, and $22.3 million for the years ended December 31, 2022, 2021, and 2020, respectively. At December 31, 2022 and 2021, security deposits associated with sale/leaseback transactions were $5.8 million and $3.5 million, respectively, and were included in other assets in the consolidated balance sheet. Other information related to the operating leases are presented in the following table: | | | | | | | Year ended | | Year ended | | December 31, 2022 | | December 31, 2021 | Cash payments (in thousands) | $ | 63,214 | | $ | 37,463 | Weighted average remaining lease term (years) | | 6.52 | | | 5.60 | Weighted average discount rate | | 11.2% | | | 10.9% |
Finance lease costs include amortization of the right of use assets (i.e., depreciation expense) and interest on lease liabilities (i.e., interest and other expense, net in the consolidated statement of operations), and were $6.2 and $2.1 million for the year ended December 31, 2022 and 2021, respectively. At December 31, 2022 and 2021, the right of use assets associated with finance leases, net was $53.7 million and $33.9 million, respectively. The accumulated depreciation for these right of use assets was $4.7 million and $1.5 million at December 31, 2022 and 2021, respectively. Other information related to the finance leases are presented in the following table: | | | | | | | Year ended | | Year ended | | December 31, 2022 | | December 31, 2021 | Cash payments (in thousands) | $ | 9,033 | | $ | 3,648 | Weighted average remaining lease term (years) | | 3.92 | | | 4.56 | Weighted average discount rate | | 6.7% | | | 6.7% |
The Company has outstanding obligations to Wells Fargo under several Master Lease Agreements totaling $159.5 million at December 31, 2022. These outstanding obligations are included in operating lease liabilities, and finance obligations on the consolidated balance sheets. Restricted Cash In connection with certain of the above noted sale/leaseback agreements, cash of $383.7 million and $275.1 million, respectively, was required to be restricted as security as of December 31, 2022 and 2021, which will be released over the lease term. As of December 31, 2022 and 2021, the Company also had certain letters of credit backed by security deposits totaling $379.6 million and $286.0 million, respectively, that are security for the above noted sale/leaseback agreements. As of December 31, 2022 and 2021, the Company had $75.5 and $67.7 million, respectively, held in escrow related to the construction of certain hydrogen plants. The Company also had $5.0 million, $2.3 million, and $1.8 million of consideration held by our paying agent in connection with the Applied Cryo, Joule, and CIS acquisitions, respectively, reported as restricted cash as of December 31, 2022, with a corresponding accrued liability on the Company’s consolidated balance sheet. Additionally, the Company had $10.8 million in restricted cash as collateral resulting from the Frames acquisition as of December 31, 2022. PART III | |
Item 10. | Directors, Executive Officers and Corporate Governance | 72 | Item 11. | Executive Compensation | 72 | Item 12. | Security Ownership of Certain Beneficial Owners and Management and Related Stockholder Matters | 72 | Item 13. | Certain Relationships and Related Transactions, and Director Independence | 73 | Item 14. | Principal Accounting Fees and Services | 73 | Directors
Set forth below is certain information regarding the directors of the Company as of April 28, 2021. The biographies of each of the directors below contains information regarding the person’s service as a director, business experience, director positions held currently or at any time during the last five years, and information regarding the experiences, qualifications, attributes or skills that caused the Corporate Governance and Nominating Committee and the Board to determine that the person should serve as a director.
| Table of ContentsPART IV
Class I Directors
|
extensive experience with the alternative energy industry, as well as his experience in management positions.
| Andrew J. Marsh
| Age: 65
Director since 2008
Board Committee: None
Class I Director: Continuing in office until the 2021 annual meeting
| Andy Marsh joined the Company as President and Chief Executive Officer in April 2008 and has been our director since 2008. As President and Chief Executive Officer, Mr. Marsh plans and directs all aspects of the organization’s policies and objectives, and is focused on building a company that leverages Plug Power’s combination of technological expertise, talented people and focus on sales growth to continue the Company’s leadership stance in the future alternative energy economy. Mr. Marsh continues to spearhead hydrogen fuel cell innovations, and his ability to drive revenue growth landed Plug Power on Deloitte’s Technology Fast 500TM list in 2015 and 2016.
Previously, Mr. Marsh was a co-founder of Valere Power, where he served as chief executive officer and board member from the company’s inception in 2001, through its sale to Eltek ASA in 2007. Under his leadership, Valere grew into a profitable global operation with over 200 employees and $90 million in revenue derived from the sale of DC power products to the telecommunications sector. During Mr. Marsh’s tenure, Valere Power received many awards such as the Tech Titan award as the fastest growing technology company in the Dallas Fort Worth area and the Red Herring Top 100 Innovator Award. Prior to founding Valere, he spent almost 18 years with Lucent Bell Laboratories in a variety of sales and technical management positions.
Mr. Marsh is a prominent voice leading the hydrogen and fuel cell industry. Nationally, he is the Chairman of the Fuel Cell and Hydrogen Energy Association, and is a member of the Hydrogen and Fuel Cell Tactical Advisory Committee (“HTAC”). HTAC has the important responsibility to provide advice to the Department of Energy regarding its hydrogen and fuel cell program goals, strategies, and activities. Internationally, Mr. Marsh represents Plug Power in their role as supporting members of the Hydrogen Council, a global initiative of leading energy, transport and industry companies with a united vision and long-term ambition for hydrogen to foster the energy transition. Mr. Marsh holds an MSEE from Duke University and an MBA from SMU.
We believe Mr. Marsh’s qualifications to sit on our Board include his extensive experience with the alternative energy industry, as well as his experience in management positions.
| Gary K. Willis
| Age: 75
Director since 2003
Board Committees: Audit and Compensation
Class I Director: Continuing in office until the 2021 annual meeting
| Gary K. Willis has been a director of the Company since 2003. Mr. Willis previously served as the President of the Zygo Corporation (“Zygo”) from February 1992 to 1999 and the Chief Executive Officer from 1993 to 1999. Mr. Willis served as a director of Zygo from 1992 to November 2000, including as Chairman of the Board from 1998 to 2000. Zygo, which was acquired in 2014 by Ametek, Inc., was a provider of metrology, optics, optical assembly, and systems solutions to the semiconductor, optical manufacturing, and industrial/automotive markets. Prior to joining Zygo, Mr. Willis served as the President and Chief Executive Officer of The Foxboro Company, a manufacturer of process control instruments and systems. Mr. Willis holds a Bachelor of Science degree in Mechanical Engineering from Worcester Polytechnic Institute.
We believe Mr. Willis’ qualifications to sit on our Board include his extensive experience in management and director positions with similar companies, as well as his educational background in mechanical engineering.
|
Maureen O. Helmer
| Age: 64
Director since 2004
Board Committees: Audit and Corporate Governance and Nominating
Class I Director: Continuing in office until the 2021 annual meeting
| Maureen O. Helmer has been a director of the Company since 2004. Ms. Helmer is currently a member of the law firm Barclay Damon, LLP and is a senior member of the firm’s energy and telecommunications Regulatory Practice Area. Prior to joining Barclay Damon, LLP, Ms. Helmer was a member of Green & Seifter Attorneys, PLLC. From 2003 through 2006, she practiced as a partner in the law firm of Couch White, LLP and then as a solo practitioner. Ms. Helmer has advised international energy, telecommunications and industrial companies on policy and government affairs issues. In addition to serving as Chair of the New York State Public Service Commission (“PSC”) from 1998 to 2003, Ms. Helmer also served as Chair of the New York State Board on Electric Generation Siting and the Environment. Prior to her appointment as Chair, Ms. Helmer served as Commissioner of the PSC from 1997 until 1998 and was General Counsel to PSC from 1995 through 1997. From 1984 through 1995, Ms. Helmer held several positions in the New York Legislature, including Counsel to the Senate Energy Committee. She also served as a board member of the New York State Energy Research and Development Authority, the New York State Environmental Board and the New York State Disaster Preparedness Commission during her tenure as Chair of the PSC. In addition, she was Vice Chair of the Electricity Committee of the National Association of Regulatory Utility Commissioners and a member of the NARUC Board of Directors. She was also appointed to serve as a member of the New York State Cyber-Security Task Force. She formerly served as a board member of the Center for Internet Security, the Center for Economic Growth, and New York Women in Communications and Energy. Ms. Helmer earned her Bachelor of Science from the State University at Albany and her Juris Doctorate from the University of Buffalo law school. She is admitted to practice law in New York.
We believe Ms. Helmer’s qualifications to sit on our Board include her long history of experience with energy regulation, policy and government affairs and advising energy and industrial companies.
|
Class II Directors
| | George C. McNamee
| Chairman
Age: 74
Director since 1997
Board Committee: Compensation
Class II Director: Continuing in office until the 2025 annual meeting
| George C. McNamee serves as Chairman of the Company’s Board of Directors and has served as such since 1997. He was previously Chairman of First Albany Companies Inc. (now GLCH) and a Managing Partner of FA Tech Ventures, an information and energy technology venture capital firm. As an executive and director of numerous companies, Mr. McNamee has navigated technological change, rapid- growth, crisis management, team building and strategy. As a public company director, Mr. McNamee has led board special committees, chaired audit committees, chaired three boards and has been an active lead director. Mr. McNamee has previously served on several public company boards, including the boards of Mechanical Technology Inc. and the Home Shopping Network. He has been an early stage investor, director and mentor for private companies that subsequently went public including MapInfo (now Pitney Bowes), META Group (now Gartner Group) and iRobot Corporation, where he served as a director from 1999 to 2016 and as lead director for the last 11 of those years. In 2011, Mr. McNamee was the first history major awarded the Yale Science and Engineering Association Distinguished Service Award. He served as a NYSE director from 1999 to 2004 and chaired its foundation. In the aftermath of the 1987 stock market crash, he chaired the Group of Thirty Committee to reform the Clearance and Settlement System. Mr. McNamee has been active as a director or trustee of civic organizations including The Albany Academies and Albany Medical Center, whose Finance Committee he chaired for 12 years. He is also a director of several private companies, a Sterling Fellow of Yale University and a Trustee of The American Friends of Eton College. He conceived and co-authored a book on the Chicago Conspiracy Trial. He received his Bachelor of Arts degree from Yale University.
We believe Mr. McNamee’s qualifications to sit on our Board include his experience serving on technology company boards, his background in investment banking, which has given him broad exposure to many financing and merger and acquisition issues, and experience with the financial sector and its regulatory bodies.
| Johannes M. Roth
| Age: 42
Director since 2013
Board Committees: Compensation and Corporate Governance and Nominating
Class II Director: Continuing in office until the 2025 annual meeting
| Johannes M. Roth has been a director of the Company since April 2013. Mr. Roth is the founder of and, since 2006, has been Managing Director and Chairman of FiveT Capital Holding AG, an investment holding company based in Switzerland with businesses specializing in asset management, risk management and alternative investments. Since 2006, Mr. Roth has been a board member of FiveT Capital AG, Zürich, Switzerland, which advises several long-only funds and operates an asset management business for high net-worth individuals. Mr. Roth earned a master’s degree in Management and Economics from the University of Hohenheim.
We believe Mr. Roth’s qualifications to sit on our Board include his background in financial investments, financial and risk management and equity capital markets as well as his experience in management positions.
|
Table of ContentsItem 15.
Gregory L. Kenausis
| Exhibits, Financial Statement Schedules | 73 | Item 16. | Form 10-K Summary | 78 | Age: 51
Director since 2013
Board Committee: Audit
Class III Director: Continuing in office until the 2025 annual meeting
| Gregory L. Kenausis has been a director of the Company since October 2013. Dr. Kenausis is the founding partner and since 2005 has been the Chief Investment Officer of Grand Haven Capital AG, an investment firm, where he is the head of research and trading activity and is responsible for managing the fund’s operations and structure. He also has worked extensively as a business consultant with a focus on business development and strategy, as well as valuation. Dr. Kenausis earned a bachelor’s degree from Yale University and a doctoral degree from the University of Texas at Austin.
We believe Dr. Kenausis’ qualifications to sit on our Board include his background and senior level experience in financial investments, business development and strategy, management and equity capital markets.
|
Class III Directors
| | Kyungyeol Song
| Age: 48
Director since 2021
Board Committee: None
Class III Director: Continuing in office until the 2023 annual meeting
| Kyungyeol Song has been a director of the Company since February 2021. Mr. Song is the Head of Quantum Growth TF at SK E&S. Prior to his current position, Mr. Song served as the Senior Vice President in Energy Solution TF at SK E&S from February 2019 until August 2020. Mr. Song has also served as the Director of the McKinsey Energy Center from February 2007 until December 2018. Mr. Song received a Ph.D. in Control and Estimation Theory, Aeronautics and Astronautics from the Massachusetts Institute of Technology, a Master of Science in Aerospace Engineering from Seoul National University, and a Bachelor of Science degree in Aerospace Engineering from Seoul National University.
We believe Mr. Song’s qualifications to sit on our Board include his extensive experience with the renewable energy industry.
| Kimberly A. Harriman
| Age: 48
Director since 2021
Board Committee: Audit
Class III Director: Continuing in office until the 2023 annual meeting
| Kimberly A. Harriman has served as a director of the Company since February 2021. Since 2020, Ms. Harriman is the Vice President of State Government Relations & Public Affairs at Avangrid, Inc., a NYSE-listed energy provider operating in 24 states. Prior to joining Avangrid, from 2016 to December 2020, Ms. Harriman served as Senior Vice President, Public and Regulatory Affairs, for New York Power Authority, the largest public utility in the United States. Previously Ms. Harriman was General Counsel for the New York State Department of Public Service from 2014 to July 2016. Ms. Harriman received a J.D. from the Albany Law School of Union University and a Bachelor of Arts degree in Political Science and Economics from Siena College.
We believe Ms. Harriman’s qualifications to sit on our Board include her extensive experience in the energy industry, including her experience with major energy policy initiatives in New York for the past 20 years.
|
Lucas P. Schneider
| Age: 52
General Director since 2017
Board Committee: Corporate Governance and Nominating
Class III Director: Continuing in office until the 2023 annual meeting
| Lucas P. Schneider has served as a director of the Company since March 2017. Mr. Schneider is the Chief Executive Officer of Refraction AI, an autonomous last-mile delivery as a service company. Prior to his current role, Mr. Schneider was the Chief Operating Officer of Wejo, Ltd., an early-stage connected vehicle data marketplace company from 2019 to 2020. Mr. Schneider also served as the Chief Executive Officer of Silvercar, an Austin, TX-based start-up that focuses on the rental car space and other vehicle mobility applications from 2012 until December 2018. In 2017, Silvercar was acquired by Audi AG. Prior to Silvercar, Mr. Schneider was the Chief Technology Officer of Zipcar. He served at Flexcar as Chief Technology Officer and Vice President of Strategy. He has also held various positions with Ford. Mr. Schneider received a Master of Business Administration, specializing in Operations and Strategy from the Tepper School of Business at Carnegie Mellon University and a Bachelor of Science degree in Mechanical Engineering from University of Texas at Austin.
We believe Mr. Schneider’s qualifications to sit on our Board include his extensive experience in helping guide companies, ranging from start-ups to large enterprises, through major business milestones including IPOs, mergers, acquisitions, and product development.
| Jonathan Silver
| Age: 63
Director since 2018
Board Committee: Corporate Governance and Nominating
Class III Director: Continuing in office until the 2023 annual meeting
| Jonathan Silver has served as a director of the Company since June 2018. He is a Senior Advisor to Guggenheim Partners, a large asset manager and investment bank, where he works with a wide array of the firm’s clean energy and sustainability clients. Mr. Silver is considered one of the nation’s leading clean economy investors and advisors,. From 2009-2011, he led both the federal government’s $40 billion clean energy investment fund and its $20 billion fund focused on advanced vehicle technology. From 2011-2018, he was a Senior Advisor to ICF, one of the country’s largest energy and environmental consulting firms, NextEra, the nation’s largest energy provider, and Marathon Capital, a leading power industry-focused investment bank. From 2015-2019, Mr. Silver served as the Managing Partner of Tax Equity Advisors LLC, an advisory firm managing investments in solar power projects on behalf of large corporations. He currently sits on the boards of National Grid (NGG:NSYE), a global utility, the Peridot Special Purpose Acquisition Corporation and Intellihot, a leading player in the tankless water heating sector. Earlier, he served on the board of Eemax and Sol Systems. From 1999-2008, Mr. Silver was the co-founder of Core Capital Partners, a successful venture capital investor in battery technology, advanced manufacturing, telecommunications and software. From 1990 to 1992, he was a Managing Director, and the Chief Operating Officer of Tiger Management, one of the country's largest and most successful hedge funds. He has also held senior operating positions, including chief operating officer and executive vice president, in several companies. Mr. Silver began his career in 1982 at McKinsey and Company, a global management consulting firm, working on strategic issues for some of the nation’s largest financial institutions and corporations. Mr. Silver has served as a senior advisor to three U.S. Cabinet Secretaries: Commerce (1992 to 1993), Interior (1993 to 1995) and Treasury (1992 to 1994). He is on the board of Resources for the Future and has been on the boards of the American Federation of Scientists, the Wind Energy Foundation and American Forests.
We believe Mr. Silver’s qualifications to sit on our Board include his extensive experience with the alternative energy industry.
References in this Annual Report on Form 10-K to “Plug,” the “Company,” “we,” “our”, or “us” refer to Plug Power Inc., including as the context requires, its subsidiaries. PART I Forward-Looking Statements The following discussion should be read in conjunction with our consolidated financial statements and notes thereto included within this Annual Report on Form 10-K. In addition to historical information, this Annual Report on Form 10-K and the following discussion contain statements that are not historical facts and are considered forward-looking within the meaning of Section 27A of the Securities Act of 1933, as amended (the “Securities Act”), and Section 21E of the Securities Exchange Act of 1934, as amended (the “Exchange Act”). These forward-looking statements contain projections of our future results of operations or of our financial position or state other forward-looking information. In some cases you can identify these statements by forward-looking words such as “anticipate,” “believe,” “could,” “continue,” “estimate,” “expect,” “intend,” “may,” “should,” “will,” “would,” “plan,” “potential,” “project,” or the negative of such words or other similar words or phrases. We believe that it is important to communicate our future expectations to our investors. However, there may be events in the future that we are not able to accurately predict or control and that may cause our actual results to differ materially from the expectations we describe in our forward-looking statements. Investors are cautioned not to unduly rely on forward-looking statements because they involve risks and uncertainties, and actual results may differ materially from those discussed as a result of various factors, including, but not limited to: | ● | the risk that we continue to incur losses and might never achieve or maintain profitability; |
| ● | the risk that we will need to raise additional capital to fund our operations and such capital may not be available to us;Investor Agreement
Pursuant
|
| ● | the risks associated with global economic uncertainty, including inflationary pressures, rising interest rates, and supply chain disruptions; |
| ● | the risk that we may not be able to expand our business or manage our future growth effectively; |
| ● | the risk that delays in or not completing our product development and hydrogen plant construction goals may adversely affect our revenue and profitability; |
| ● | the risk that we may be unable to successfully pursue, integrate, or execute upon our new business ventures. |
| ● | the risk of dilution to our stockholders and/or stock price should we need to raise additional capital; |
| ● | the risk that our lack of extensive experience in manufacturing and marketing of certain of our products may impact our ability to manufacture and market products on a profitable and large-scale commercial basis; |
| ● | the risk that unit orders may not ship, be installed and/or converted to revenue, in whole or in part; |
| ● | the risk that a loss of one or more of our major customers, or if one of our major customers delays payment of or is unable to pay its receivables, a material adverse effect could result on our financial condition; |
| ● | the risk that a sale or issuance of a significant number of shares of stock could depress the market price of our common stock; |
| ● | the risk that our convertible senior notes, if settled in cash, could have a material effect on our financial results; |
| ● | the risk that our convertible note hedges may affect the value of our convertible senior notes and our common stock; |
| ● | the risk that negative publicity related to our business or stock could result in a negative impact on our stock value and profitability; |
| ● | the risk of potential losses related to any product liability claims or contract disputes; |
| ● | the risk of loss related to an inability to remediate the material weaknesses identified in internal control over financial reporting as of December 31, 2022, 2021, 2020, 2019, and 2018, or inability to otherwise maintain an effective system of internal control; |
| ● | the risk of loss related to an inability to maintain an effective system of internal controls; |
| ● | our ability to attract and maintain key personnel; |
| ● | the risks related to the Investor Agreement described under Part III. “Item 13. Certain Relationshipsuse of flammable fuels in our products; |
| ● | the risk that pending orders may not convert to purchase orders, in whole or in part; |
| ● | the cost and Related Party Transactions,timing of developing, marketing, and Director Independence,” Grove Energy Capital LLC (“Grove Energy”), a subsidiary of SK Holdings, selling our products;is entitled to designate one person (the “SK Designee”) to be appointed to the Board of Directors of the Company. Grove Energy has the right to require the Board to nominate a SK Designee for election to the Board by the stockholders of the |
Company at annual stockholder meetings until
| ● | the earliest of (i)risks involved with participating in joint ventures, including our ability or inability to execute our strategic growth plan through joint ventures; |
| ● | our ability to obtain financing arrangements to support the date on which Grove Energy and affiliates beneficially own less than 4.0%sale or leasing of our issuedproducts and outstanding common stock, (ii) February 24, 2023, inservices to customers; |
| ● | our ability to achieve the event thatforecasted revenue and costs on the Companysale of our products; |
| ● | the cost and SK E&S have not entered into a definitive joint venture agreementavailability of fuel and fueling infrastructures for our products; |
| ● | the risks, liabilities, and costs related to environmental, health, and safety matters; |
| ● | the risk of elimination of government subsidies and economic incentives for alternative energy products; |
| ● | market acceptance of our products and services; |
| ● | our ability to establish and maintain relationships with third parties with respect to a joint venture in Asia (the “Asia JV Agreement”),product development, manufacturing, distribution, and (iii) any expiration or termination of the Asia JV Agreement.
Grove Energy selected Mr. Song as the SK Designeeservicing, and the Boardsupply of Directors appointed Mr. Songkey product components;
|
| ● | the cost and availability of components and parts for our products; |
| ● | the risk that possible new tariffs could have a material adverse effect on our business; |
| ● | our ability to develop commercially viable products; |
| ● | our ability to reduce product and manufacturing costs; |
| ● | our ability to successfully market, distribute and service our products and services internationally; |
| ● | our ability to improve system reliability for our products; |
| ● | competitive factors, such as a directorprice competition and competition from other traditional and alternative energy companies; |
| ● | our ability to protect our intellectual property; |
| ● | the risk of the Companydependency on February 24, 2021.Executive Officers
The names and ages of all executive officers of the Companyinformation technology on our operations and the principal occupationfailure of such technology;
|
| ● | the cost of complying with current and business experience for at least future federal, state and international governmental regulations; |
| ● | our subjectivity to legal proceedings and legal compliance; |
| ● | the last five years for each are set forth below asrisks associated with past and potential future acquisitions; |
| ● | the risks associated with geopolitical instability, including the conflict between Russia and Ukraine and growing tensions between U.S. and China and neighboring regions; and |
| ● | the volatility of April 28, 2021.our stock price. |
The risks included here are not exhaustive, and additional factors could adversely affect our business and financial performance, including factors and risks included in other sections of this Annual Report on Form 10-K, including under Item 1A, “Risk Factors”. Moreover, we operate in a very competitive and rapidly changing environment. New risk factors emerge from time to time and it is not possible for management to predict all such risk factors, nor can we assess the impact of all such risk factors on our business or the extent to which any factor, or combination of factors, may cause actual results to differ materially from these contained in any forward-looking statements. While forward-looking statements reflect our good faith beliefs, they are not guarantees of future performance. These forward-looking statements speak only as of the date on which the statements were made. Except as may be required by applicable law, we do not undertake or intend to update any forward-looking statements after the date of this Annual Report on Form 10-K. Summary of Risk Factors The risk factors detailed in Item 1A titled “Risk Factors” in this Annual Report on Form 10-K are the risks that we believe are material to our investors and a reader should carefully consider them. Those risks are not all of the risks we face and other factors not presently known to us or that we currently believe are immaterial may also affect our business if they occur. The following is a summary of the risk factors detailed in Item 1A: | | | Executive Officers
| Age
| Position
| Andrew J. Marsh | ● | Our products and performance depend largely on the availability of hydrogen gas and an insufficient supply of hydrogen could negatively affect our sales and deployment of our products and services; | 65
| President, Chief Executive Officer and Director
| | 53
| Senior Vice President and Chief Financial Officer
| | 58
| Senior Vice President and Chief Operating Officer
| | 56
| General Counsel, Corporate Secretary and Senior Vice President
| | 47
| Chief Strategy Officer
| | 51
| Vice President, Global Sales
| | 53
| Corporate Controller and Chief Accounting Officer
|
| ● | Andrew J. Marsh’s biographical information canWe may be foundunable to successfully execute and operate our green hydrogen production projects;
|
| ● | We face risks associated with our plans to market, distribute and service our products and services internationally; |
| ● | The current economic downturn and weakness in “Directors” above.Paul B. Middleton joined Plug Power as Senior Vice Presidentthe economy, market trends and Chief Financial Officerother conditions affecting the profitability and financial stability of our customers could negatively impact our sales growth and results of operations;
|
| ● | Delays in 2014. Prior to Plug Power, Mr. Middleton worked at Rogers Corp., a global manufactureror not completing our product development goals may adversely affect our revenue and distributor of specialty polymer composite materials and components, from 2001 to 2014. During his tenure at Rogers Corp., Mr. Middleton served in many senior financial leadership roles, including Corporate Controller and Principal Accounting Officer, Treasurer and Interim Chief Financial Officer. Prior to Rogers Corp., Mr. Middleton managed all financial administration for the tools division of Coopers Industries from 1997 to 2001. Mr. Middleton holds a Master of Science in Accounting and a BBA from the University of Central Florida. Additionally, he is a Certified Public Accountant.Keith C. Schmid joined Plug Power as Senior Vice President and Chief Operating Officer in 2013. Mr. Schmid served as President of SPS Solutions, a power solutions and energy storage consulting firm, from 2011 to 2013. Previously, Mr. Schmid served as Chief Executive Officer of Boston-Power Incorporated, a provider of large format lithium ion battery solutions, in 2011, and as President and Chief Executive Officer of Power Distribution Incorporated, a power distribution and protection company, from 2007 to 2010. In addition, Mr. Schmid held the position of General Manager, Industrial Energy Division-Americas for Exide Technologies, a multinational lead-acid batteries manufacturing company, from 2001 to 2007. Mr. Schmid holds a Master of Science degree in Engineering and a Master in Business Administration from the University of Wisconsin-Madison.
profitability;
|
Gerard L. Conway, Jr. has served as General Counsel
| ● | Our products and Corporate Secretaryservices face intense competition; |
| ● | We may not be able to expand our business or manage our future growth effectively; |
| ● | Our ability to source parts and raw materials from our suppliers could be disrupted or delayed in our supply chain which could adversely affect our results of Plug Power since September 2004operations; |
| ● | Rising inflation rates, volatility in commodity prices, and since March 2009, has also served as Senior Vice Presidentproduct shortages may adversely affect our gross margins and financial results; |
| ● | We will continue to be dependent on certain third-party key suppliers for components in our products and failure of Plug Power. Ina supplier to develop and supply components in a timely manner or at all, or our inability to substitute sources of these components on a timely basis or on terms acceptable to us, could impair our ability to manufacture our products or increase our cost of production; |
| ● | We depend on a concentration of anchor customers for the majority of our revenues and the loss of any of these customers would adversely affect our business, financial condition, results of operations and cash flows; |
| ● | Our products use flammable fuels that capacity, Mr. Conway is responsibleare inherently dangerous substances and an actual or perceived problem with our products could adversely affect the market’s perception of our products; |
| ● | The reduction or elimination of government subsidies and economic incentives for advisingalternative energy technologies, or the Companyfailure to renew such subsidies and incentives, could reduce demand for our products, lead to a reduction in our revenues and adversely impact our operating results and liquidity; |
| ● | Our inability to maintain a leadership position to drive hydrogen and green technology subsidies and foster beneficial regulatory interpretation will limit our growth in the market; |
| ● | Trade policies, treaties, and tariffs could have a material adverse effect on legalour business; |
| ● | Failure to improve overall service performance and scale sourcing effectively can limit growth and adversely impact our customer experience; |
| ● | Our investments in joint ventures may involve numerous risks that may affect the ability of such joint ventures to make distributions to us; |
| ● | If we cannot obtain financing to support the sale of our products and service to customers or our power purchase agreements with customers, such failure may adversely affect our liquidity and financial position; |
| ● | We may require additional capital funding and such capital may not be available to us; |
| ● | We have incurred losses and anticipate continuing to incur losses; |
| ● | Our indebtedness could adversely affect our liquidity, financial condition, and our ability to fulfill our obligations and operate our business; |
| ● | The accounting method for convertible debt securities that may be settled in cash could have a material effect on our reported financial results; |
| ● | The convertible note hedges may affect the value of our common stock; |
| ● | We are subject to counterparty risk with respect to the convertible note hedge transactions; |
| ● | Certain component quality issues have resulted in adjustments to our warranty accruals and the accrual for loss contracts; |
| ● | Our purchase orders may not ship, be commissioned or installed, or convert to revenue, which could have an adverse impact on our revenue and cash flow; |
| ● | We are dependent on information technology in our operations and the failure of such as corporate law, securities, contracts, strategic alliancestechnology may adversely affect our business, and potential security breaches of our information technology systems, including cyber-attacks, could lead to liability or could damage our reputation and financial results; |
| ● | The implementation of a new enterprise resource planning system could cause disruption to our operations; |
| ● | Our future plans could be harmed if we are unable to attract or retain key personnel; |
| ● | We may not be able to protect important intellectual property. He also serves as the Compliance Officer for securities matters affecting the Company. During his tenure at Plug Power, Mr. Conway served as Vice President of Government Relations from 2005 to June 2008property and inwe could incur substantial costs defending against claims that capacity he advocated on energy issues, policies, legislation and regulationsour products infringe on the state, federal, nationalproprietary rights of others; |
| ● | We are subject to legal proceedings and international levels on behalf of the Company and the alternative energy sector. Prior to his appointment to his current position, Mr. Conway served as Associate General Counsel and Director of Government Relations for the Company beginninglegal compliance risks that could harm our business; |
| ● | Our financial results may be adversely affected by changes in July 2000. Prior to joining Plug Power, Mr. Conway spent four years as an Associate with Featherstonhaugh, Conway, Wiley & Clyne, LLP, where he concentrated in government relations, business and corporate law. Mr. Conway has more than 20 years of experience in general business, corporate real estate and government relations. Mr. Conway holds a Bachelor of Arts degree in English and Philosophy from Colgate University and a Juris Doctorate from Boston University School of Law.
Sanjay K. Shrestha joined the Company as Chief Strategy Officer in 2019. Prior to joining Plug Power, Mr. Shrestha served as the Chief Investment Officer of Sky Solar Holdings, which owned and operated solar projects in Japan, Europe and the Americas, and President of Sky Capital America, which owned and operated solar projects in North and South America, since 2015. Under his leadership, Sky Capital America built and acquired over 100MW of operating solar assets and secured a pipeline over 100MW. He also sourced various types of financing solutions to support this growth, including project debt, construction equity and long-term equity. Before global solar IPP, he led the renewables investment banking effort at FBR Capital Markets since 2013. During 2014, and under his leadership, the firm was ranked among the top renewable energy underwritersaccounting principles generally accepted in the United States. Prior to joining FBR Capital Markets, Mr. Shrestha was the global head of renewables research coverage at Lazard Capital Markets. During his tenure at Lazard Capital Markets, he was a member of the Institutional Investor All America Research team and was also ranked as one of the top five stock pickers on a global basis. Prior to Lazard Capital Markets, Mr. Shrestha was at First Albany Capital, where he built the firm’s renewables and industrial research practice. Mr. Shrestha serves as an independent director on the board of directors of Fusemachines, an artificial intelligence talent and education solutions company. Mr. Shrestha received a Bachelor of Science from The College of Saint Rose. He brings to the Company almost two decades of experience in the broader clean tech sector.
States; |
| ● | Jose Luis Crespo joined the Company as Vice President of Business and International Sales in 2014. He was promoted to Vice President of Global Sales in January of 2015 and in 2016 he was also named General Manager for Hypulsion, the Company’s wholly owned European subsidiary. Prior to joining the Company, Mr. Crespo served as Vice President of International Value Stream at Smiths Power, a supplier of power distribution, conditioning, protection and monitoring solutions for data centers, wireless communications and other criticalIf our estimates or high-value electrical systems, from 2009 to 2013. Mr. Crespo holds a Master in Business Administration from the University of Phoenix and a degree in Telecommunications Engineering from the Engineering University of Madrid, Spain.
Martin D. Hull joined Plug Power as Corporate Controller and Chief Accounting Officer in April 2015. Prior to that, he was a principal and director with the certified public accounting firm of Marvin and Company, P.C. from November 2012 to March 2015. Prior to that, Mr. Hull was with KPMG LLP, serving as partner from October 2004 to September 2012, and has a total of 24 years of public accounting experience. Mr. Hull holds a Bachelor of Business Administration with a concentration in Accounting from the University of Notre Dame.
Risk Management
Our Board of Directors plays a central role in overseeing and evaluating risk. While it is management’s responsibility to identify and manage our exposure to risk on a day-to-day basis, the Board routinely discusses these risks with management and actively oversees our risk-management procedures and protocols. The Board regularly receives reports from senior management on areas of material risk to the Company, including operational, financial, legal, regulatory and strategic risks. In addition, each of the Audit Committee, the Compensation Committee and the Corporate Governance and Nominating Committee exercises oversight and provides guidancejudgments relating to the particular risks within the purviewour critical accounting policies are based on assumptions that change or prove to be incorrect, our operating results could fall below expectations of each committee, as well as making periodic reportsinvestors, resulting in a decline in our stock price;
|
| ● | We identified material weaknesses in our internal control over financial reporting. If we do not effectively remediate these material weaknesses or if we otherwise fail to the full Board. The Board and each of these committees regularly discuss with management our major risk exposures, their potential financial impact on Plug Power and the steps we take to manage them. The Audit Committee is responsible for oversight of Company risks relating to accounting matters,maintain effective internal control over financial reporting, and legal and regulatory compliance, while the Corporate Governance and Nominating Committee is responsible for oversight of risks relatingwe may not be able to management and Board succession planning. The Compensation Committee is responsible for the oversight of risks related to compensation matters.74accurately report our financial results or prevent fraud;
|
| ● | We are subject to various federal, state, and local environmental and human health and safety laws and regulations that could impose significant costs and liabilities on us; |
| ● | Our business may become subject to increased government regulation; |
| ● | Changes in tax laws or regulations or adverse outcomes resulting from examination of our income or other tax returns could adversely affect our operating results and financial condition; |
| ● | The Chief Financial Officer and the General Counsel report to the Board regarding ongoing risk management activities at the regularly scheduled, quarterly Board meetings and may report on risk management activities more frequently, as appropriate. Additionally, risk management is a standing agenda item for the regularly scheduled, quarterly Audit Committee meetings.Board of Directors Leadership Structure
The positions of Chief Executive Officer and Chairman of the Board are currently separated, with Andrew J. Marsh serving as our Chief Executive Officer since 2008 and George C. McNamee serving as Chairman of the Board since 1997. Separating these positions allows our Chief Executive Officer to focus on the Company’s day-to-day business operations, while allowing the Chairman to lead the Board in its fundamental role of providing advice to and independent oversight of management. The Board recognizes the time, effort and energy that the Chief Executive Officer is required to devote to his positionchanges in the current business environment,carryforward/carryback periods as well as the commitment requirednew limitations on use of net operating losses may significantly impact our valuation allowance assessments for net operating losses;
|
| ● | We may be unable to serve asestablish or maintain relationships with third parties for certain aspects of continued product developments, manufacturing, distribution, sale, servicing, and the supply of key components for our Chairman. Whileproducts; |
| ● | We may be unable to make attractive acquisitions or successfully integrate acquired businesses, assets, or properties, and any inability to do so may disrupt our By-lawsbusiness and corporate governance guidelineshinder our ability to grow, divert the attention of key personnel, disrupt our business, and impair our financial results; |
| ● | We may be unable to successfully pursue, integrate, or execute upon new business ventures; |
| ● | Our stock price and stock trading volume have been and could remain volatile, and the value of your investment could decline; |
| ● | Sales of substantial amounts of our common stock in the public markets, or the perception that such sales might occur, could reduce the price that our common stock might otherwise attain and may dilute your voting power and your ownership interest in us; |
| ● | If securities analysts do not require that our Chairman and Chief Executive Officer positions be separate, the Board believes that our current leadership structure is appropriate because it provides an effective balance between strategy development and independent leadership and management oversight. If the position of Chairman is vacant,publish research or reports or if hethey publish unfavorable or she is absent,inaccurate research about our business and our stock, the Chief Executive Officer will preside, when present, at meetingsprice of stockholders and of the Board of Directors.Committees of the Board of Directors
The Board has established three standing committees: the Audit Committee, the Compensation Committee,our stock and the Corporate Governancetrading volume could decline;
|
| ● | Provisions in our charter documents and Nominating Committee.Audit Committee
Our Board has establishedDelaware law may discourage or delay an Audit Committee of the Board of Directors. The members of our Audit Committee consist of Dr. Kenausis (Chair), Mr. Willis, and Ms. Helmer. Each member of the Audit Committee qualifies as an independent director as defined in the Marketplace Rules of the National Association of Securities Dealers, Inc. (the “NASDAQ Rules”) and the applicable rules of the SEC. Our Board has determined that Dr. Kenausis qualifies as an “audit committee financial expert” as defined in the applicable rules of the SEC. Dr. Kenausis’ designation by our Board as an “audit committee financial expert” is not intended to be a representation that he is an expert for any purpose as a result of such designation, nor is it intended to impose on him any duties, obligations, or liability greater than the duties, obligations or liability imposed on him as a member of the Audit Committee and the Board in the absence of such designation.
The Audit Committee, among other matters, is responsible for (i) appointing the Company’s independent registered public accounting firm, (ii) evaluating such independent registered public accounting firm’s qualifications, independence and performance, (iii) determining the compensation for such independent registered public accounting firm, and (iv) pre-approving all audit and non-audit services. Additionally, the Audit Committee is responsible for oversight of the Company’s accounting and financial reporting processes and the integrated audit of the Company’s financial statements and internal control over financial reporting, including the work of the independent registered public accounting firm. A more complete description of the Audit Committee’s functions is set forth in the Audit Committee’s charter which is published on the “Investors” section of the Company’s website at www.plugpower.com. Our website is not incorporated into or a part of this Annual Report on Form 10-K.
Compensation Committee
The Compensation Committee consists of Messrs. Willis (Chair), Roth and McNamee, each of whom is an independent director under the NASDAQ Rules. See “Compensation Committee Report” and “Compensation Committee Interlocks and Insider Participation” for a further description of the Compensation Committee and its activities in fiscal year 2020. The Compensation Committee’s primary responsibilities include (i) reviewing, prescribing and approving compensation policies, plans and programs that are appropriate for the Company in light of all relevant circumstances, that provide incentives to achievement of the Company’s goals and objectives, that are consistent with the cultureacquisition of the Company by a third party that stockholders may consider favorable;
|
| ● | We do not anticipate paying any dividends on our common stock; |
| ● | The choice of forum provisions in our amended and restated bylaws may limit a stockholder’s ability to bring a claim in a judicial forum that it finds favorable for disputes with us or any current or former director, officer, other employee, agent, or stockholder; and |
| ● | Climate change and climate change policies might affect our business, our industry, and the global economy. |
Item 1. Business Background Plug is the company behind the end-to-end green hydrogen ecosystem that offers products and solutions ranging from fuel cells to electrolyzers to the production, storage and handling, transportation and dispensing of liquid green hydrogen. Plug is on a mission to make hydrogen adoption easy for its customers and is helping customers meet their business goals and decarbonize the economy. In creating the first commercially viable market for hydrogen fuel cells, the Company has deployed more than 60,000 fuel cell systems for forklifts and more than 180 fueling stations. Plug intends to deliver its green hydrogen solutions directly to its customers, and through joint venture partners into multiple environments, including material handling, e-mobility, power generation, and industrial applications. Plug is focused on delivering a number of green hydrogen solutions to customers. Its vertically integrated end-to-end solutions, which are designed to fit individual customer needs, include hydrogen production equipment or the delivery of green hydrogen fuel, whichever is preferred including: | ● | Proton exchange membrane (“PEM”) electrolyzers: Plug electrolyzers use clean electricity to split water into hydrogen and oxygen. Using electrolyzers, customers can generate hydrogen for a variety of applications. In support of the market growth and its own ambitions, Plug has built a state-of-the-art gigafactory to produce electrolyzer stacks in Rochester, New York. |
| ● | Hydrogen Liquefiers: Through the acquisition of Joule Processing LLC (“Joule”) in 2022, Plug gained core competency in liquefaction systems known for their operational efficiency, flexibility and reliability. Plug’s hydrogen liquefaction system has one of the most energy-efficient designs on the market utilizing hydrogen as the refrigerant in the main liquefaction cycle. |
| ● | Liquid hydrogen tankers: The Plug hydrogen tanker is one of the largest and lightest trailer ever manufactured, with unprecedented over-the-road payloads. |
Plug also continues to offer fuel cells, electrochemical devices that combine hydrogen and oxygen to produce electricity and heat without combustion. Opened in 2023, Plug has built a 407,000-square-foot facility in Slingerlands, New York, which includes a 350,000-square-foot world-class fuel cell manufacturing facility to support the growing demand for fuel cells. Plug delivers end-to-end hydrogen solutions for supply chain and logistics applications, on-road electric vehicles, the stationary power market, and more. Plug has announced that it is currently building green hydrogen generation plants throughout the United States, including in New York, Louisiana, Georgia, California and Texas. The Company expects to begin producing liquid green hydrogen in 2023. To complete our end-to-end hydrogen ecosystem, Plug is offering high-efficiency liquefaction technology and cryogenic tanker and storage solutions to effectively deliver liquid green hydrogen to customers. We were organized as a corporation in the State of Delaware on June 27, 1997. Unless the context indicates otherwise, the terms “Company,” “Plug,” “we,” “our,” or “us” as used herein refer to Plug Power Inc. and its subsidiaries. Business Strategy Plug understands that green hydrogen is integral to addressing climate change in both the short and long term. Indeed, decarbonization is our very mission. To reach this goal, Plug’s business strategy is focused on the following: | ● | Expanding hydrogen production, with a focus on both output capabilities and geography. Plug has announced several new hydrogen plants planned for New York, Georgia, Texas California, Louisiana and Port of Antwerp-Bruges. We broke ground on the plants in New York and Georgia. Plug plans to begin producing green hydrogen in 2023. |
| ● | Scaling production through electrolyzer and fuel cell gigafactories. In 2021, Plug opened a 155,000-square-foot gigafactory in Rochester, New York. In 2022, Plug expanded manufacturing capacity at our Rochester location and broke ground on, and subsequently, opened within the year our 407,000-square-foot facility in Slingerlands, New York, which includes a 350,000-square-foot world-class fuel cell manufacturing facility to support the growing demand for fuel cells. |
| ● | Scaling Plug’s electrolyzer program to provide comprehensive and economical solutions focused on our 5-megawatt (“MW”) and 10MW offerings, and using these building blocks to reach into the gigawatt-scale electrolyzer market. |
| ● | Expanding into the on-road vehicles market, including delivery vans/light commercial vehicles with our joint venture with Renault (HyVia), while continuing to explore the aviation market (commuter and cargo planes and drones) and the expansion of available applications in the on-road vehicle market (such as yard tractors, cargo vans, buses, and Class 6, 7 or 8 trucks). |
| ● | Expanding into large-scale stationary power market, including backup and continuous power applications, including data centers, microgrids, distribution centers and electric vehicle (“EV”) charging. |
| ● | Expanding into new regions that require decarbonization, including in Europe and Asia. Plug entered into joint ventures with Renault SAS (“Renault”) in France, Acciona Generación Renovable, S.A. (“Acciona”) in Spain, and SK E&S Co., Ltd. (“SK E&S”) in South Korea. |
| ● | Partnering with or acquiring companies with solutions that play an integral role in building Plug’s green hydrogen ecosystem. In 2022, Plug acquired Joule, an engineered modular equipment process design and procurement company, and acquired two subsidiaries of Cryogenic Industrial Solutions, LLC, Alloy Custom Products, LLC and WesMor Cryogenics, LLC, to bolster the cryogenic tanker and storage tank business resulting from the 2021 acquisition of Applied Cryo Technologies. Plug also created a joint venture with Niloco Hydrogen Holdings LLC, a wholly-owned subsidiary of Olin Corporation (“Olin”), named “Hidrogenii” to support reliability of supply and speed to market for hydrogen throughout North America. |
| ● | Plug’s operating strategy objectives include decreasing product and service costs, while expanding system reliability. |
We believe continued investment in research and development is critical to the development and enhancement of innovative products, technologies, and services. Business Organization In 2022, the Company continued to evolve its organizational design to meet the growing needs of the business and product offerings and align with the strategy discussed above. Our organization is managed from a sales perspective based on “go-to-market” sales channels, emphasizing shared learning across end-user applications and common supplier/vendor relationships. These sales channels are structured to serve a range of customers for our products and services. As a result of this structure, we concluded that we have one operating and reportable segment — the design, development and sale of green hydrogen products and solutions that help customers meet their business goals while decarbonizing their operations. Our chief executive officer was identified as the chief operating decision maker (CODM). All significant operating decisions made by management are largely based upon the analysis of Plug on a total company basis, including assessments related to our incentive compensation plans. The current organizational structure is designed to help Plug achieve its goals and establish Plug as a world leader in green hydrogen solutions. Products and Services Plug is facilitating the paradigm shift to an increasingly electrified world by innovating cutting-edge hydrogen and fuel cell solutions. While we continue to develop commercially viable hydrogen and fuel cell product solutions, we have expanded our offerings to support a variety of commercial operations that can be powered with green hydrogen. We provide electrolyzers that allow customers — such as refineries, producers of chemicals, steel, fertilizer and commercial refueling stations — to generate hydrogen on-site. We are focusing our efforts on (a) industrial mobility applications, including electric forklifts and electric industrial vehicles, at multi-shift high volume manufacturing and high throughput distribution sites where we believe our products and services provide a unique combination of productivity, flexibility, and environmental benefits; (b) stationary power systems that will support critical operations, such as data centers, microgrids, and generation facilities, in either a backup power or continuous power role and replace batteries, diesel generators or the grid for telecommunication logistics, transportation, and utility customers; and (c) production of hydrogen. Plug expects to support these products and customers with an ecosystem of vertically integrated products that produce, transport, store and handle, dispense, and use hydrogen for mobility and power applications. Our current products and services include: GenDrive: GenDrive is our hydrogen fueled Proton Exchange Membrane (“PEM”) fuel cell system, providing power to material handling electric vehicles, including Class 1, 2, 3 and 6 electric forklifts, Automated Guided Vehicles (“AGVs”), and ground support equipment. GenFuel: GenFuel is our liquid hydrogen fueling delivery, generation, storage, and dispensing system. GenCare: GenCare is our ongoing “Internet of Things”-based maintenance and on-site service program for GenDrive fuel cell systems, GenSure fuel cell systems, GenFuel hydrogen storage and dispensing products and ProGen fuel cell engines. GenSure: GenSure is our stationary fuel cell solution providing scalable, modular PEM fuel cell power to support the backup and grid-support power requirements of the telecommunications, transportation, and utility sectors; GenSure High Power Fuel Cell Platform will support large scale stationary power and data center markets. GenKey: GenKey is our vertically integrated “turn-key” solution combining either GenDrive or GenSure fuel cell power with GenFuel fuel and GenCare aftermarket service, offering complete simplicity to customers transitioning to fuel cell power. ProGen: ProGen is our fuel cell stack and engine technology currently used globally in mobility and stationary fuel cell systems, and as engines in electric delivery vans. This includes Plug’s membrane electrode assembly (“MEA”), a critical component of the fuel cell stack used in zero-emission fuel cell electric vehicle engines. Electrolyzers: The design and implementation of 5 and 10MW electrolyzer systems that are modular, scalable hydrogen generators optimized for clean hydrogen production. Electrolyzers generate hydrogen from water using electricity and a special membrane and “green” hydrogen is generated by using renewable energy inputs, such as solar or wind power. Liquefaction Systems: Plug’s 15 ton-per-day and 30 ton-per-day liquefiers are engineered for high efficiency, reliability, and operational flexibility — providing consistent liquid hydrogen to customers. This design increases plant reliability and availability while minimizing parasitic losses like heat leak and seal gas losses. Cryogenic Equipment: Engineered equipment including trailers and mobile storage equipment for the distribution of liquified hydrogen, oxygen, argon, nitrogen and other cryogenic gases. We provide our products and solutions worldwide through our direct sales force, and by leveraging relationships with original equipment manufacturers (“OEMs”) and their dealer networks. Plug is currently targeting Asia, Australia, Europe, Middle East and North America for expansion in adoption. The European Union (the “EU”) has rolled out ambitious targets for the hydrogen economy as part of the EU strategy for energy integration and Plug is seeking to execute on our strategy to become one of the European leaders in the hydrogen economy. This includes a targeted account strategy for material handling, securing strategic partnerships with European OEMs, energy companies, utility leaders and accelerating its electrolyzer business. Our global strategy includes leveraging a network of integrators or contract manufacturers. Part of our long-term plan includes Plug penetrating the European and Asian hydrogen market, on-road vehicle market, and large-scale stationary market. Plug’s formation of joint ventures with HyVia and AccionaPlug S.L. in Europe and SK Plug Hyverse Co., Ltd. (“SK Plug Hyverse”), in Asia not only support this goal but are expected to provide us with a more global footprint. Plug has been successful with acquisitions, strategic partnerships and joint ventures, and we plan to continue this mix. We manufacture our commercially viable products in Latham, New York, Rochester, New York, Slingerlands, New York, Houston, Texas, Lafayette, Indiana, and Spokane, Washington, and support liquid hydrogen production and logistics in Charleston, Tennessee and Kingsland, Georgia. Markets/Geography & Customer Concentration The Company’s products and services predominantly serve the North American and European material handling markets, and primarily support large to mid-sized fleet, multi shift operations in high volume manufacturing and high throughput distribution centers. The Company has historically experienced fluctuations in its quarterly operating results, with more revenue typically recognized in the second half of the fiscal year as compared to the first half. Orders for the Company’s products and services approximated $1.2 billion at December 31, 2022. The Company’s orders at any given time are comprised of fuel cells, hydrogen installations, maintenance services, electrolyzers, liquefiers, hydrogen trailers, and hydrogen fuel deliveries. The specific elements of the orders will vary in terms of timing of delivery and can vary between 90 days to 10 years, with fuel cells and hydrogen installations being delivered near term and maintenance services and hydrogen fuel deliveries being delivered over a longer period of time. Historically, shipments made against product orders have generally occurred between ninety days and twenty-four months from the date of acceptance of the order. For the year ended December 31, 2022, Amazon.com Inc. (“Amazon”), accounted for 13.0% of our total consolidated revenues, which included a provision for warrant charge of $5.6 million. Additionally, 37.0% of our total consolidated revenues were associated primarily with two other customers. We assemble our products at our manufacturing facilities in Latham, New York, Rochester, New York, Slingerlands, New York, Houston, Texas, Lafayette, Georgia, and Spokane, Washington, and provide our services and installations at customer locations and service centers in Romeoville, Illinois and Dayton, Ohio. In addition, we have a hydrogen production plant in Charleston, Tennessee, and Kingsland, Georgia. In 2022, we opened a warehouse and logistics center in Duisberg, Germany. Working Capital Items We currently maintain inventory levels adequate for our short-term needs based upon present levels of production and for the purposes of global supply chain risk management. We consider the component parts of our different products to be generally available and current suppliers to be reliable and capable of satisfying anticipated needs. However, we have seen shortages of materials needed to produce fuel cell and hydrogen generation equipment components due to constraints in the production of global semiconductors, MEA components, and due to general supplier performance related to the COVID-19 pandemic, labor shortages, increasing energy prices, supply chain constraints and logistical challenges. These material shortages have also negatively impacted the pricing of materials and components sourced or used by the Company. Distribution, Marketing and Strategic Relationships We have developed strategic relationships with established companies in key areas including distribution, service, marketing, supply, technology development and product development. We sell our products worldwide, with a primary focus on North America, Europe, and Asia, through our direct product sales force, OEMs, and their dealer networks. We operate in Europe under the name Plug Power Europe to develop and sell hydrogen fuel cell systems for the European material handling market. Our wholly-owned subsidiary, Plug Power LA JV, LLC, created a joint venture with Niloco Hydrogen Holdings LLC, named “Hidrogenii” in the third quarter of 2022. We believe Hidrogenii will support reliability of supply and speed to market for hydrogen throughout North America, and set the foundation for broader collaboration between Plug and Olin. Hidrogenii plans to begin with the construction of a 15-ton-per-day hydrogen plant in St. Gabriel, Louisiana. Hidrogenii is owned 50% by Plug Power LA JV, LLC and 50% by Niloco Hydrogen Holdings LLC. Our wholly-owned subsidiary, Plug Power France, entered into a joint venture with Renault named HyVia in the second quarter of 2021. HyVia plans to manufacture and sell fuel cell powered electric light commercial vehicles (“FCELCVs”) and to supply hydrogen fuel and fueling stations to support the FCE-LCV market, in each case primarily in Europe. HyVia is owned 50% by Plug Power France and 50% by Renault. Our wholly-owned subsidiary, Plug Power Espana S.L. (“Plug Power Spain”), entered into a joint venture with Acciona, named AccionaPlug S.L., in the fourth quarter of 2021. AccionaPlug S.L. is owned 50% by Plug Power Spain and 50% by Acciona. The joint venture intends to develop green hydrogen projects in Spain and Portugal. Plug Power Inc. entered into a joint venture with SK E&S named SK Plug Hyverse, which was funded in the first quarter of 2022. The joint venture with SK E&S seeks to accelerate the use of hydrogen as an alternative energy source in Asian markets. Through this initiative, the two companies will collaborate to provide hydrogen fuel cell systems, hydrogen fueling stations, electrolyzers and green hydrogen to the Korean and other Asian markets. This joint venture is owned 49% by Plug Power Inc. and 51% by SK E&S. In addition, Plug’s acquisitions over the last several years are enhancing Plug’s position in the hydrogen industry, complementing the Company’s industry-leading position in the design, construction, and operation of customer-facing hydrogen fueling stations. These acquisitions are expected to further establish a pathway for Plug to transition from low-carbon to zero-carbon hydrogen solutions. Competition We experience competition in all areas of our business. The markets we address for motive and backup power are characterized by the presence of well-established battery and combustion generator products. We also face competition from integrated gas companies, and companies offering Steam Methane Reformers and electrolyzers. We believe the principal competitive factors in the markets in which we operate include product features, including size and weight, relative price and performance, lifetime operating cost, including any maintenance and support, product quality and reliability, safety, ease of use, foot print, rapid integration with existing equipment and processes, customer support design innovation, marketing and distribution capability, and service and support and corporate reputation. Intellectual Property We believe that neither we nor our competitors can achieve a significant proprietary position on the basic technologies currently used in PEM fuel cell systems. However, we believe the design and integration of our system and system components, as well as some of the low-cost manufacturing processes that we have developed, are intellectual property that can be protected. Our intellectual property portfolio covers, among other things: fuel cell components that reduce manufacturing part count; fuel cell system designs that lend themselves to mass manufacturing; improvements to fuel cell system efficiency, reliability and system life; and control strategies, such as added safety protections and operation under extreme conditions. In general, our employees are party to agreements providing that all inventions, whether patented or not, made or conceived while being our employee, which are related to or result from work or research that we perform, will remain our sole and exclusive property. We have a total of 65 issued patents currently active with the United States Patent and Trademark Office (“USPTO”), expiring between 2023 and 2040. At the close of 2022, we had 23 U.S. patent applications pending. Additionally, we have 22 trademarks registered with the USPTO expiring between 2023 and 2032, and three trademark applications pending. Government Regulation Our fuel cell, electrolyzer, and hydrogen products, their installations, and the operations at our facilities are subject to oversight and regulation at the international level, as well as federal, state, and local levels in accordance with statutes and ordinances relating to, among others, building codes, fire codes, public safety, electrical and gas pipeline connections and hydrogen siting. The level of regulation may depend, in part, upon where a system is located — both domestically and abroad. In addition, product safety standards have been established by the American National Standards Institute (“ANSI”), covering the overall fuel cell system. The class 1, 2, and 3 GenDrive products are designed with the intent of meeting the requirements of UL 2267 “Fuel Cell Power Systems for Installation in Industrial Electric Trucks” and NFPA 505 “Fire Safety Standard for Powered Industrial Trucks.” The hydrogen tanks used in these systems have been either certified to ANSI/CSA NGV2-2007 “Compressed Natural Gas Vehicle Fuel Containers” or ISO/TS 15869 “Gaseous hydrogen and hydrogen blends—Land vehicle fuel tanks.” We will continue to design our GenDrive products to meet ANSI and/or other applicable standards. We certified several models of Class 1, 2, and 3 GenDrive products to the requirements of the CE mark with guidance from a European certified body. The hydrogen tanks used in these systems are certified to the Pressure Equipment Directive by a European certified body. The GenFuel hydrogen storage and dispensing products are designed with the intent of meeting the requirements of NFPA 2 “Hydrogen Technologies Code.” We are also subject to standards as applied to the design of our electrolyzer products, both domestically and abroad. Such standards include, but are not limited to, “Hydrogen Generators Using Water Electrolysis” (ISO 22734), “Hydrogen Technologies Code” (NFPA 2), “Explosive Atmospheres” requirements (UL 60079), CE product standards within the European Commission, and AS/NZS standards for our products within each jurisdiction, as applicable. As our Company increasingly expands to new markets and jurisdiction, we also become currently subject to new and different regulations in such jurisdictions. We are subject to various federal, state, local, and non-U.S. environmental and human health and safety laws and regulations, including laws and regulations relating to the use, handling, storage, transportation, disposal and human exposure to hazardous substances and wastes, product safety, and emissions of pollution into the environment, and the remediation of contamination. Our facilities in the United States are subject to regulation by the Occupational Safety and Health Administration (“OSHA”), which regulates the protection of the health and safety of workers. In addition, the OSHA hazard communication standard requires that we maintain information about hazardous materials used or produced in our operations and that we provide this information to employees, state and local governmental authorities and local residents. We are also subject to occupational safety regulations in other countries. In addition, certain environmental laws and regulations impose liability and responsibility on present and former operators or users of facilities and sites for contamination at such facilities and sites without regard to causation or knowledge of contamination. Compliance with environmental laws and regulations can significantly increase the costs of our operations. Violations of environmental laws and regulations can subject us to additional costs and expenses, including defense costs and expenses and civil and criminal penalties. Environmental laws and regulations are becoming increasingly stringent, and compliance costs are significant and will continue to be significant in the foreseeable future. There can be no assurance that existing or future environmental and human health and safety laws and regulations will not have a material effect on our business. As our business expands — particularly as part of our green hydrogen production strategy — we will continue to evaluate the potential impact such provisions will have on our business, as applied to each relevant jurisdiction in which we conduct business. We do not believe that existing or pending climate change legislation, regulation, or international treaties or accords are reasonably likely to have a material adverse effect in the foreseeable future on our business or markets that we serve, or on our results of operations, capital expenditures or financial position. However, there is no guarantee that any such legislation, regulation, or international treaties or accords will be favorable to our business. We will continue to monitor emerging developments in this area. Other than these requirements, at this time we do not know what additional requirements, if any, each jurisdiction will impose on our products or their installation. We also do not know the extent to which any new regulations may impact our ability to distribute, install, and service our products. As we continue distributing our systems to our target markets, the federal, state, local, or foreign government entities may seek to impose regulations or competitors may seek to influence regulations through lobbying efforts. See Item 1A, “Risk Factors” for a description of these governmental regulations and other material risks to us, including, to the extent material, to our competitive position. Raw Materials and Suppliers Most components essential to our business are generally available from multiple sources. We believe there are component suppliers and manufacturing vendors whose loss to us could have a material adverse effect upon our business and financial condition. We are mitigating these potential risks by introducing alternate system architectures which we expect will allow us to diversify our supply chain with multiple fuel cell, electrolyzer stack and air supply component vendors. We are also working closely with these vendors and other key suppliers on coordinated product introduction plans, strategic inventories, and internal and external manufacturing schedules and levels. Recent cost pressures from global energy prices and inflation have negatively impacted access to our key raw materials. In cases where we have single sourced suppliers (typically due to new technology and products), we engineer or develop new supply sources while covering short- and medium-term risks with supply contracts, inventory, and development partnerships. Additionally, in January 2023, the Company entered into a strategic partnership with Johnson Matthey Hydrogen Technologies Limited, a subsidiary of Johnson Matthey PLC and a global leader in sustainable technologies (“JM”), pursuant to which JM will supply the Company catalyst coated membrane (CCM) for use in the production of fuel cells as well as catalysts and membranes for use in the production of electrolyzers. In addition, the Company and JM intend to develop their existing and new technology and commercial products and co-invest in a manufacturing facility in the United States. Research and Development Because the fuel cell industry is still in the early state of adoption, our ability to compete successfully is heavily dependent upon our ability to ensure a continual and timely flow of competitive products, services, and technologies to the marketplace. We continue to develop new products and technologies and to enhance existing products in the areas of cost, size, weight, and in supporting service solutions in order to drive further commercialization. We may also expand the range of our product offerings and intellectual property through licensing and/or acquisition of third-party business and technology. Our research and development expense totaled $99.6 million, $64.8 million, and $27.8 million during the years ended December 31, 2022, 2021, and 2020, respectively. Human Capital Resources As of December 31, 2022, we had 3,353 employees, of which 156 are temporary employees, with 2,941 located in the United States and 412 located outside of the United States. In order to facilitate talent attraction and retention, we strive to make Plug a safe, rewarding, and challenging workplace with competitive salaries. Our employees are critical to the Company’s growth, expansion, and success, and we consider our relationship with our employees to be positive. The Company is dedicated to fostering a culture of diversity and committed to hiring talented individuals from all backgrounds and perspectives to which the Company’s ultimate success is linked. Diversity, Equity & Inclusion We take tremendous pride in being an Equal Opportunity/Affirmative Action Employer and actively seek to increase the racial, gender, and ethnic diversity of our Company. At Plug, we are powered by the collective differences of our employees, customers, and stakeholders, and we value different perspectives to solve complex problems and bring innovative solutions. We promise to listen and hear inspiration from around the globe, to champion inclusivity, and respect for each other, and to celebrate our differences as we build an environment in which we are all proud to be a part. | ● | Diversity: We embrace the unique characteristics and social identities of our employees. Collectively, these individual differences enhance our culture and company achievements. We believe that our strength comes from our intellectual and social diversity and that furtherdiversity powers innovation and inspires our team. |
| ● | Equity: All employees have equal opportunity to advance. People are the overall goalpower of building stockholder value;Plug, and (ii) reviewingwe are committed to the investment in our employees. We pledge to provide everyone at Plug with equal opportunity to grow and approvingdevelop, leveraging the unique skills and differences of their individual background, characteristics, and aspirations. |
| ● | Inclusion: We are on a journey to cultivate inclusivity as an organization. At Plug, we are transparent and collaborative, welcoming ideas, thoughts, and questions from everyone. We respect different strengths and viewpoints, understanding that we are stronger together. Perspectives from the collective whole make us better, as we know that we are all part of something bigger than ourselves. |
The Company also strives to promote diversity on its Board of Directors (the “Board” or “Board of Directors”) and in leadership roles throughout the Company. Currently, three of the Company’s 10 directors are female, and two of the Company’s 10 directors identify as an under-represented minority. The Company’s commitment to diversity throughout the organization is further enhanced by policies related to various aspects of employment, including but not limited to, recruiting, selecting, hiring employment placement, job assignment, compensation, access to benefits, selection for training, use of facilities, and participation in Company-sponsored employee activities. To progress further on our Diversity, Equity and Inclusion (“DEI”) initiatives such as recruitment, talent development, and equitable compensation packages, we have established a Diversity, Equity and Inclusion Policy. Our DEI Policy recognizes that our individual differences – backgrounds, experiences, identities, and perspectives ��� drive the creativity and innovation fueling Plug Power’s growth. Plug supports various diversity, equity, and inclusion efforts throughout its operations, and these efforts include a focus on: | ● | Recruiting and retaining talent from diverse backgrounds; |
| ● | Creating awareness of diversity issues and benefits including training on conduct that can be perceived as discriminatory and/or harassing and how to report such behaviors; |
| ● | Supporting our employees’ learning and development, so that they can reach their full potential; |
| ● | Fostering a more supportive environment where inclusivity is expected and prioritized; and |
| ● | Embedding accountability for diversity throughout the organization. |
Additionally, we work specifically with veteran recruitment firms and are proud of our efforts to hire those who have served and continue to serve in the armed forces. As of December 31, 2022, we had a 290 person veteran workforce. Engagement We believe that listening to our employees is key to providing a work environment that is inclusive and results in a motivated and engaged workforce. We regularly conduct anonymous employee surveys to understand where we have opportunities to improve and solicit ideas from employees. Several initiatives have been launched, such as focus groups with Human Resources and leadership and hiring an employee engagement and inclusion manager to focus on these efforts. We conduct regular employee engagement surveys to measure progress and satisfaction with a range of initiatives. In our most recent survey in August 2022, employees indicated they would recommend Plug as a great place to work and they are happy working at Plug. The insights from the most recent survey allowed us to review employee feedback at each function and Business Unit level to drive impactful action, including developing specific training programs to improve and enhance technical processes and increasing team collaboration and effectively using meeting time to foster focus and clarity. Plug’s top strengths were prospects, purpose, and authenticity. Employees indicated they were excited about Plug’s future; they believe they are doing meaningful work at Plug and feel comfortable being themselves at work. We also believe that transparency and communication are key elements of the Company’s culture. Since the onset of the COVID-19 pandemic, a weekly all employee meeting led by our Chief Executive Officer and Executive Vice President of Human Resources provide information on safety measures as relates to the Company’s practice on COVID-19. The meeting also includes a timely business topic delivered by a subject matter expert within the Company. This provides timely information and opportunities for upcoming leaders to develop their presentation skills, and aims to align the workforce with the Company’s vision, strategy, and objectives. An open question and answer session is hosted as part of the weekly employee meeting by the Chief Executive Officer, in which employees are encouraged to submit questions and can do so anonymously if they prefer. Community Involvement We recognize the importance of supporting our local communities as we continue to grow as an organization. Our efforts not only provide value back to our community members but enables our employees to give back, helping them to meet their own values. We also facilitate employee donations through the United Way, supporting its four pillar objectives helping our communities, which includes the (1) ability to meet basic needs, (2) education leading to a good job, (3) income providing financial security, and (4) an ability to gain and maintain health. This system enables our employees to donate money to causes they care about in their individual communities through payroll deductions. Additionally, in 2022, we launched a global volunteer time off policy to support activities that serve the communities in which we live and work in ways that are meaningful, impactful, and help those in need. Plug recognizes that participating in philanthropic activities enriches the lives of its employees and its communities. Performance Management and Incentives Our full-year performance management process begins with setting annual goals for the Company, which guide the development of functional and individual employee goals. Employees and their managers are accountable for goals and must review performance against the goals on an ongoing basis. We provide employee base wages that are competitive and consistent with employee positions, skill levels, experience, and location. Additionally, we believe that individual performance and the results of the Company are directly linked to payment of annual short-term incentive compensation. Employees may also be granted equity compensation awards with multi-year vesting for retention. Talent Our talent strategy is a balance of attracting external talent, combined with an internal mobility practice that encourages career growth and opportunity to progress within Plug. We leverage both internal and external recruitment resources and incentivize our current employees to refer talent they recommend as future employees of Plug. Enculturation of new hires begins immediately upon acceptance of an offer from Plug by leveraging technology to introduce them to the organization and their teams. A new hire onboarding program is delivered bi-weekly to continue the assimilation process and ensure that the workforce is prepared to succeed in their new career endeavor. Plug values the unique skills and competencies of our diverse workforce. A key component to planning for individual career growth aligned with organizational growth is learning and development. We offer the entire workforce a subscription to on-line learning that includes thousands of professionally created on-demand webinars and podcasts. Additionally, we have offered remote led leadership training throughout the COVID-19 pandemic with plans to continue in this new remote and hybrid environment. We also offer a tuition reimbursement program, where employees are provided support for continuing their education. On the job training, combined with face-to-face and remote skill training are utilized in many functions, as well as virtual reality skill training to ensure that skills are refreshed regularly. We use a comprehensive training matrix in certain areas and web-based learning to make sure we meet both regulatory requirements and our own standards. Besides job-specific safety training, we offer personal-development training on many topics, including sustainability and wellness. Additional development opportunities include opportunities to participate in employee led groups that develop leadership and project management capabilities while contributing to our purpose and mission. On-line participation in internally developed business-related courses called Plugology is encouraged for all employees and helps newly hired employees assimilate to the business. Compensation and Benefits As part of our commitment to our people, Plug offers employees competitive benefits, including health, vision, and dental plans, flexible spending accounts, comprehensive life insurance (including company provided life insurance), and disability coverage. Additionally, employees are offered a vacation and holiday package, an employee referral bonus program, educational assistance, and volunteer time. We also offer a comprehensive wellness program that is designed to promote long-term healthy, active lifestyles and our Fitness Reimbursement Program provides up to $1,200 per year to accommodate employees’ wellness activities. In 2022, we also launched a paid parental leave policy to aid in bonding time for new parents. At Plug, 92.9% of our employees participate in our comprehensive 401(k) package that includes a 401(k)-retirement savings plan, which offers up to a 5% match in Plug stock. To encourage savings, we auto-enroll all employees in the plan after 60 days of employment. Our portfolio reflects our values with increased priority given to socially responsible investing — the plan’s diversified investment options include two socially responsible funds. Additionally, we have an internal Step Pay Program which provides our Field Service Technicians an outlined career path of training for eight separate levels to grow their skills and compensation. The Company believes that identifying and developing the next generation of business leaders is important to its long-term success and is proud to support employees in furthering their education with tuition reimbursement plans and training. COVID-19 Health Measures While we no longer enforce our prior COVID-19 policies with respect to weekly COVID-19 testing, face coverings, or daily COVID-19 questionnaires, we continue to monitor the COVID-19 pandemic and emerging variants and remain prepared to adjust our policies and safety protocols in line with guidance from state and federal agencies. Employees are still expected to remain home if they are not feeling well and should contact our COVID team for future guidance. Furthermore, we have resumed all commercial air travel and all other non-critical travel, while also allowing employees to resume their personal travel. We have enabled third-party access to our facilities and are continuing our normal janitorial and sanitary procedures. We are no longer requiring staggered shifts in our manufacturing facilities and are offering hybrid work schedules to those whose job function enabled them to do so. The COVID-19 pandemic has caused significant transportation challenges for global suppliers and we expect that these challenges will continue to have an impact on our businesses for the foreseeable future. We continue to take proactive steps to limit the impact of these challenges and are working closely with our suppliers and transportation vendors to ensure availability of products and implement other cost savings initiatives. In addition, we continue to invest in our supply chain to improve its resilience with a focus on automation, dual sourcing of critical components and localized manufacturing when feasible. To date, there has been limited disruption to the availability of our products related to COVID-19, though it is possible that more significant disruptions could occur if these supply chain challenges continue. Available Information Our Annual Report on Form 10-K, Quarterly Reports on Form 10-Q, Current Reports on Form 8-K, including exhibits, and amendments to those reports filed or furnished pursuant to Section 13(a) or 15(d) of the Exchange Act are available free of charge, other than an investor’s own internet access charges, on the Company’s website at www.plugpower.com as soon as reasonably practicable after the Company electronically files such material with, or furnishes it to, the SEC. The information contained on our website is not included as a part of, or incorporated by reference into, this Annual Report on Form 10-K. The SEC also maintains an internet site that contains reports, proxy and information statements, and other information regarding issuers that file electronically with the SEC. The SEC’s website address is http://www.sec.gov. We may announce material business and financial information to the public about us, our products and services, and other matters through a variety of means, including filings with the SEC, press releases, public conference calls, webcasts, the investor relations section of our website (www.ir.plugpower.com) and our Twitter account at @PlugPowerInc in order to achieve broad, non-exclusionary distribution of information to the public and for complying with our disclosure obligations under Regulation FD. We encourage investors, the media, and others interested in Plug to follow the foregoing channels and review the information that we make available on such channels, in addition to following our filings with the SEC. Item 1A. Risk Factors The following risk factors should be considered carefully in addition to the other information in this Annual Report on Form 10-K. The occurrence of any of the following material risks could harm our business and future results of operations and could result in the trading price of our common stock declining and a partial or complete loss of your investment. These risks are not the only ones that we face. Additional risks not presently known to us or that we currently consider immaterial may also impair our business operations and trading price of our common stock. The discussion contained in this Annual Report on Form 10-K contains “forward-looking statements” within the meaning of Section 27A of the Securities Act and Section 21E of the Exchange Act, that involve risks and uncertainties. Refer to the section entitled “Forward-Looking Statements.” A. MARKET RISKS We may be unable to successfully execute and operate our green hydrogen production projects and such projects may cost more and take longer to complete than we expect. As part of our vertical integration strategy, the Company is developing and constructing green hydrogen production facilities at locations across the United States and Europe. Our ability to successfully complete and operate these projects is not guaranteed. These projects will impact our ability to meet and supplement the hydrogen demands for our products and services, for both existing and prospective customers. Our hydrogen production projects are dependent, in part, upon the Company’s ability to meet our internal demand for electrolyzers required for such projects. Electrolyzer demand by external customers may concurrently affect the Company’s ability to meet the internal electrolyzer demand from our hydrogen production projects. The timing and cost to complete the construction of our hydrogen production projects are subject to a number of factors outside of our control and such projects may take longer and cost more to complete and become operational than we expect. The viability and competitiveness of our green hydrogen production facilities will depend, in part, upon favorable laws, regulations, and policies related to hydrogen production. Some of these laws, regulations, and policies are nascent, and there is no guarantee that they will be favorable to our projects. Additionally, our facilities will be subject to numerous and new permitting, regulations, laws, and policies, many of which might vary by jurisdiction. Hydrogen production facilities are also subject to robust competition from well-established multinational companies in the energy industry. There is no guarantee that our hydrogen production strategy will be successful, amidst this competitive environment. Our products and performance depend largely on the availability of hydrogen gas and an insufficient supply of hydrogen could negatively affect our sales and deployment of our products and services. Our products and services depend largely on the availability of hydrogen gas. Although we are in the process of building multiple hydrogen production plants, our business could be materially and adversely affected by an inadequate availability of hydrogen or failure to secure hydrogen supply at competitive prices. There is no assurance that our hydrogen production will scale at the rate we anticipate or that we will complete hydrogen production plants on schedule. Additionally, we are dependent upon hydrogen suppliers to provide us with hydrogen gas for the commercialization of our products and services. If these fuels are not readily available or if their prices are such that energy produced by our products costs more than energy provided by other sources, then our products could be less attractive to potential users and our products’ value proposition could be negatively affected. If hydrogen suppliers elect not to participate in the material handling market, there may be an insufficient supply of hydrogen for this market that could negatively affect our sales and deployment of our products and services. We face risks associated with our plans to market, distribute, and service our products and services internationally. We market, distribute, sell and service our product offerings internationally and expect to continue investing in our international operations. We have limited experience operating internationally, including developing and manufacturing our products to comply with the commercial and legal requirements of international markets. Our success in international markets will depend, in part, on our ability and that of our partners to secure relationships with foreign sub-distributors, and our ability to manufacture products that meet foreign regulatory and commercial requirements. Additionally, our planned international operations are subject to other inherent risks, including potential difficulties in enforcing contractual obligations and intellectual property rights in foreign countries, and could be adversely affected due to, among other things, fluctuations in currency exchange rates, political and economic instability, acts or threats of terrorism, changes in governmental policies or policies of central banks, expropriation, nationalization and/or confiscation of assets, price controls, fund transfer restrictions, capital controls, exchange rate controls, taxes, unfavorable political and diplomatic developments, changes in legislation or regulations and other additional developments or restrictive actions over which we will have no control. Doing business in foreign markets requires us to be able to respond to rapid changes in market, legal, and political conditions in these countries. As we expand in international markets, including but not limited to joint ventures involving potential business activities in, Europe, South Korea, India, Vietnam, and elsewhere, we may face numerous challenges. Such challenges might include unexpected changes in regulatory requirements; potential conflicts or disputes that countries may have to deal with, among other things, data privacy requirements; labor laws and anti-competition regulations; export or import restrictions; laws and business practices favoring local companies; fluctuations in currency exchange rates; longer payment cycles and difficulties in collecting accounts receivables; difficulties in managing international operations; potentially adverse tax consequences, tariffs, customs charges, bureaucratic requirements and other trade barriers; restrictions on repatriation of earnings; and the burdens of complying with a wide variety of international laws. We face risks associated with our plans to market, distribute, and service our products and services internationally and any of these factors could adversely affect our results of operations and financial condition. The success of our international expansion will depend, in part, on our ability to succeed in navigating the different legal, regulatory, economic, social, and political environments. The current inflationary trends, economic downturn and weakness in the economy, market trends, and other conditions affecting the profitability and financial stability of our customers could negatively impact our sales growth and results of operations. The demand for our products and services is sensitive to the production activity, capital spending and demand for products and services of our customers worldwide. In recent months, we have observed increased economic uncertainty in the United States and abroad, including inflation and higher interest rates. Impacts of such economic weakness include falling overall demand for goods and services, leading to reduced profitability, reduced credit availability, higher borrowing costs, reduced liquidity, volatility in credit, equity and foreign exchange markets, and bankruptcies. These developments have led to supply chain disruption and transportation delays which have caused incremental freight charges, which have negatively impacted our business and our results of operations. In addition, as our customers react to global economic conditions and the potential for a global recession, we have seen them reduce spending on our products and take additional precautionary measures to limit or delay expenditures and preserve capital and liquidity. Reductions in spending on our solutions, delays in purchasing decisions, lack of renewals, inability to attract new customers, uncertainty about business continuity as well as pressure for extended billing terms or pricing discounts, could limit our ability to grow our business and negatively affect our operating results and financial condition. Additionally, many of our customers operate in markets that may be impacted by market uncertainty, trade and tariff policies, costs of goods sold, currency exchange rates, central bank interest rate changes, foreign competition, offshoring of production, oil and natural gas prices, geopolitical developments, labor shortages, inflation, and a variety of other factors beyond our control. Any of these factors could cause customers to idle or close facilities, delay purchases, reduce production levels, or experience reductions in the demand for their own products or services, and other conditions affecting the profitability and financial stability of our customers could negatively impact our sales growth and results of operations. Our products and services face intense competition. The markets for energy products, including PEM fuel cells, electrolyzers, and hydrogen production are intensely competitive. Our recent expansion into electrolyzer manufacturing and hydrogen production similarly faces robust competition — both from incumbent companies and new emerging business interests in the United States and abroad. Some of our competitors are much larger than we are and may have the manufacturing, marketing and sales capabilities to complete research, development, and commercialization of products more quickly and effectively than we can. There are many companies engaged in all areas of traditional and alternative energy generation in the United States and abroad, including, among others, major electric, oil, chemical, natural gas, battery, generator and specialized electronics firms, as well as universities, research institutions and foreign government-sponsored companies. These firms are engaged in forms of power generation such as advanced battery technologies, generator sets, fast charged technologies and other types of fuel cell technologies. Well established companies might similarly seek to expand into new types of energy products, including PEM fuel cells, electrolyzers, or hydrogen production. Additionally, some competitors may rely on other different competing technologies for fuel cells, electrolyzers, or hydrogen production. We believe our technologies have many advantages. In the near future, we expect the demand for our products — electrolyzers in particular — to largely offset any hypothetical market preference for competing technologies. However, changes in customer preferences, the marketplace, or government policies could favor competing technologies. The primary current value proposition for our fuel cell customers stems from productivity gains in using our solutions. Longer term, given evolving market dynamics and changes in alternative energy tax credits, if we are unable to successfully develop future products that are competitive with competing technologies in terms of price, reliability and longevity, customers may not buy our products. Technological advances in alternative energy products, battery systems or other fuel cell, electrolyzer, or hydrogen technologies may make our products less attractive or render them obsolete. Volatility in commodity prices and product shortages may adversely affect our gross margins. Some of our products contain commodity-priced materials. Commodity prices and supply levels affect our costs. For example, nickel, platinum and iridium are key materials in our PEM fuel cells, electrolyzers, and hydrogen infrastructure. Both platinum and iridium are scarce natural resources, and we are dependent upon a sufficient supply of these commodities. These resources may become increasingly difficult to source due to various cost, geopolitical, or other reasons, which in turn might have a material adverse effect on our business. While we do not anticipate significant near- or long-term shortages in the supply of platinum or iridium, a shortage could adversely affect our ability to produce commercially viable PEM fuel cells, PEM electrolyzers, or hydrogen production facilities, or raise our cost of producing such products and services. In addition, global inflationary pressures have recently increased, which could potentially increase commodity price volatility. Our ability to pass on such increases in costs in a timely manner depends on market conditions, and the inability to pass along cost increases could result in lower gross margins. We will continue to be dependent on certain third-party key suppliers for components in our products. The failure of a supplier to develop and supply components in a timely manner or at all, or our inability to obtain substitute sources of these components on a timely basis or on terms acceptable to us, could impair our ability to manufacture our products or could increase our cost of production. We rely on certain key suppliers for critical components in our products, and there are numerous other components for our products that are sole sourced. If we fail to maintain our relationships with our suppliers or build relationships with new suppliers, or if suppliers are unable to meet our demand, we may be unable to manufacture our products, or our products may be available only at a higher cost or after a delay. The Company has experienced and may continue to experience supply chain-related delays for components of product lines, hydrogen generation projects, and manufacturing facilities. In addition, to the extent that our supply partners use technology or manufacturing processes that are proprietary, we may be unable to obtain comparable components from alternative sources. Furthermore, we may become increasingly subject to domestic content sourcing requirements and Buy America preferences, as required by federal infrastructure funding and various tax incentives in the United States, and we may become subject in the future to domestic sourcing requirements that may become relevant to the European Union. Domestic content preferences potentially mandate our Company to source certain components and materials from United States-based suppliers and manufacturers. Conformity with these provisions potentially depends upon our ability to increasingly source components or materials from within the United States. An inability to meet these requirements could have a material adverse effect on the Company’s ability to successfully leverage tax incentives or compete for certain federal infrastructure funding sources imposing such mandates. In addition, the failure of a supplier to develop and supply components in a timely manner or at all, or to develop or supply components that meet our quality, quantity and cost requirements, or our inability to obtain substitute sources of these components on a timely basis or on terms acceptable to us, could impair our ability to manufacture our products or could increase our cost of production. If we cannot obtain substitute materials or components on a timely basis or on acceptable terms, we could be prevented from delivering our products to our customers within required timeframes. Any such delays have resulted and could continue to result in sales and installation delays, cancellations, penalty payments or loss of revenue and market share, any of which could have a material adverse effect on our business, results of operations, and financial condition. We depend on a concentration of pedestal customers for the majority of our revenues and the loss of any of these customers would adversely affect our business, financial condition, results of operations, and cash flows. We sell most of our products to a range of customers that include a few pedestal customers, and while we are continually seeking to expand our customer base, we expect this will continue for the next several years. Total revenue in 2022 for Amazon was $97.5 million, which included a provision for warrant charges of $5.6 million. For the year ended December 31, 2022, Amazon accounted for 14% of our total consolidated revenues. Total revenue in 2021 for Amazon was $205.1 million, which included a provision for warrant charges of $0.5 million. For the year ended December 31, 2021, Amazon accounted for 40.8% of our total consolidated revenues. Any decline in business with significant customers could have an adverse impact on our business, financial condition, and results of operations. Our future success is dependent upon the continued purchases of our products by a small number of customers. If we are unable to broaden our customer base and expand relationships with potential customers, our business will continue to be impacted by demand fluctuations due to our dependence on a small number of customers. Demand fluctuations can have a negative impact on our revenues, business, financial condition, results of operations and cash flows. Our dependence on a small number of major customers exposes us to additional risks. A slowdown, delay or reduction in a customer’s orders could result in excess inventories or unexpected quarterly fluctuations in our operating results and liquidity. Each of our major customers has significant purchasing leverage over us to require changes in sales terms including pricing, payment terms and product delivery schedules, which could adversely affect our business, financial condition, results of operations and cash flows. In addition, as of December 31, 2022, one customer comprised approximately 24.9% of the total accounts receivable balance. At December 31, 2021, one customer comprised approximately 46.6% of the total accounts receivable balance. If one of our major customers delays payment of or is unable to pay their receivables, that could have a material adverse effect on our business, financial condition, results of operations and cash flows. Rising inflation rates may adversely affect our financial results. Global inflationary pressures, particularly in the United States, have increased recently to levels not seen in recent years, which could potentially increase commodity price volatility, increased operating costs (including our labor costs) and reduced liquidity. In addition, the United States Federal Reserve has raised, and may again raise, interest rates in response to concerns about inflation, which may result in limitations on our ability to access credit or otherwise raise debt and equity capital. Our ability to pass on such increases in costs in a timely manner depends on market conditions, and the inability to pass along cost increases could result in lower gross margins. Increases in interest rates, especially if coupled with reduced government spending and volatility in financial markets, may have the effect of further increasing economic uncertainty and heightening these risks. In an inflationary environment, we may be unable to raise the sales prices of our products and services at or above the rate at which our costs increase, which could reduce our profit margins and have a material adverse effect on our financial results. We also may experience lower than expected sales and potential adverse impacts on our competitive position if there is a decrease in consumer spending or a negative reaction to our pricing. A reduction in our revenue would be detrimental to our financial condition and could also have an adverse impact on our future growth. Our ability to source parts and raw materials from our suppliers could be disrupted or delayed in our supply chain which could adversely affect our results of operations. Our operations require significant amounts of necessary parts and raw materials. We deploy a continuous, companywide process to source our parts and raw materials from fewer suppliers, and to obtain parts from suppliers in low-cost countries where possible. If we are unable to source these parts or raw materials, our operations may be disrupted, or we could experience a delay or halt in certain of our manufacturing operations. We believe that our supply management and production practices are based on an appropriate balancing of the foreseeable risks and the costs of alternative practices. Nonetheless, reduced availability or interruption in supplies, whether resulting from more stringent regulatory requirements, supplier financial condition, increases in duties and tariff costs, disruptions in transportation, an outbreak of a severe public health pandemic, such as the COVID-19 pandemic, including resurgences and the emergence of new variants, severe weather, or the occurrence or threat of wars or other conflicts, could have an adverse effect on our financial condition, results of operations and cash flows. For example, the Company has experienced supply chain issues related to the COVID-19 pandemic, including but not limited to suppliers utilizing force majeure provisions under existing contracts. Furthermore, the ongoing global economic recovery from the COVID-19 pandemic has caused significant challenges for global supply chains resulting in inflationary cost pressures, component shortages, and transportation delays. We expect that these challenges could continue to have an impact on our businesses for the foreseeable future. Our investments in joint ventures may involve numerous risks that may affect the ability of such joint ventures to make distributions to us. We currently conduct some of our operations through joint ventures, with such partners including SK E&S, Renault, Acciona, and Olin in which we share control with our joint venture participants. Investments in joint ventures may involve risks not present when a third party is not involved, including the possibility that our joint venture participants might experience business or financial stress that impact their ability to effectively operate the joint venture, or might become bankrupt or may be unable to meet their economic or other obligations, in which case joint venture may be unable to access needed growth capital without additional funding from us. In addition, our joint venture participants may have economic, tax, business or legal interests or goals that are inconsistent with ours, or those of the joint venture, and may be in a position to take actions contrary to our policies or objectives. Furthermore, joint venture participants may take actions that are not within our control, which may expose our investments in joint ventures to the risk of lower values or returns. Disputes between us and co-venturers may result in litigation or arbitration that could increase our expenses and prevent our officers and/or directors from focusing their time and efforts on our day-to-day business. In addition, we may, in certain circumstances, be liable for the actions of our co-venturers. Each of these matters could have a material adverse effect on us. We made certain assumptions and projections regarding the future of the markets served by our joint venture investments that included projected raw materiality availability and pricing, production costs, market pricing and demand for the joint venture's products. These assumptions were an integral part of the economics used to evaluate these joint venture investment opportunities prior to consummation. To the extent that actual market performance varies from our models, our ability to achieve projected returns on our joint venture investments may be impacted in a materially adverse manner. Failure by us, or an entity in which we have a joint venture interest, to adequately manage the risks associated with such joint ventures could have a material adverse effect on the financial condition or results of operations of our joint ventures and, in turn, our business and operations. In addition, should any of these risks materialize, it could have a material adverse effect on the ability of the joint venture to make future distributions to us. B. FINANCIAL AND LIQUIDITY RISKS If we cannot obtain financing to support the sale of our products and service to our customers or our power purchase agreements with customers, such failure may adversely affect our liquidity and financial position. Customers representing most of our revenue access our products through Power Purchase Agreements (“PPAs”), rather than a direct purchase. These PPA arrangements require us to finance the purchase of such products, either ourselves or through third-party financing sources. To date, we have been successful in obtaining or providing the necessary financing arrangements. There is no certainty, however, that we will be able to continue to obtain or provide adequate financing for these arrangements on acceptable terms, or at all, in the future. Failure to obtain or provide such financing may result in the loss of material customers and product sales, which could have a material adverse effect on our business, financial condition, and results of operations. Further, if we are required to continue to pledge or restrict substantial amounts of our cash to support these financing arrangements, such cash will not be available to us for other purposes, which may have a material adverse effect on our liquidity and financial position. For example, as of December 31, 2022, approximately $858.7 million of our cash is restricted to support such leasing arrangements, comprised of cash deposits and collateralizing letters of credit, which prevents us from using such cash for other purposes. We may require additional capital funding and such capital may not be available to us. As of December 31, 2022, we had cash and cash equivalents of $690.6 million, restricted cash of $858.7 million and net working capital of $2.7 billion (which is comprised of the net amount of current assets of $3.3 billion and current liabilities of $635.3 million). This compares to cash and cash equivalents of $2.5 billion, restricted cash of $650.9 million and net working capital of $4.0 billion (which is comprised of the net amount of current assets of $4.4 billion and current liabilities of $420.6 million) as of December 31, 2021. Our cash requirements relate primarily to working capital needed to operate and grow our business, including funding operating expenses, growth in inventory to support both shipments of new units and servicing the installed base, growth in equipment leased and equipment related to PPAs for customers under long-term arrangements, funding the growth in our GenKey “turn-key” solution, which includes the installation of our customers’ hydrogen infrastructure as well as delivery of the hydrogen fuel, continued expansion of our markets, such as Europe and Asia, continued development and expansion of our products, such as ProGen, payment of lease obligations under sale/leaseback financings, mergers and acquisitions, strategic investments and joint ventures, liquid hydrogen plant construction, expanding production facilities and the repayment or refinancing of our long-term debt. Our ability to meet future liquidity needs and capital requirements will depend upon numerous factors, including the timing and quantity of product orders and shipments; attaining and expanding positive gross margins across all product lines; the timing and amount of our operating expenses; the timing and costs of working capital needs; the timing and costs of building a sales base; the ability of our customers to obtain financing to support commercial transactions; our ability to obtain financing arrangements to support the sale or leasing of our products and services to customers, and the terms of such agreements that may require us to pledge or restrict substantial amounts of our cash to support these financing arrangements; the timing and costs of developing marketing and distribution channels; the timing and costs of product service requirements; the timing and costs of hiring and training product staff; the extent to which our products gain market acceptance; the timing and costs of product development and introductions; the extent of our ongoing and new research and development programs; and changes in our strategy or our planned activities. We cannot assure you that any necessary additional financing will be available on terms favorable to us, or at all. In periods when the capital and credit markets experience significant volatility, the amounts, sources and cost of capital available to us may be adversely affected. We primarily use external financing to provide working capital needed to operate and grow our business. Sufficient sources of external financing may not be available to us on cost effective terms. We have incurred losses and anticipate continuing to incur losses. We have not achieved operating profitability in any quarter since our formation and we will continue to incur net losses until we can produce sufficient revenue to cover our costs. Our net losses attributable to common stockholders were $724.0 million in 2022, $460.0 million in 2021, and $596.2 million in 2020. As of December 31, 2022, we had an accumulated deficit of $3.1 billion. We anticipate that we will continue to incur losses until we can produce and sell our products and services on a large-scale and cost-effective basis. We cannot guarantee when we will operate profitably, if ever. In order to achieve profitability, we must successfully execute our planned path to profitability in the early adoption markets on which we are focused. The profitability of our products depends largely on material and manufacturing costs and the market price of hydrogen. The hydrogen infrastructure that is needed to support our growth readiness and cost efficiency must be available and cost efficient. We must continue to shorten the cycles in our product roadmap with respect to improvement in product reliability and performance that our customers expect. We must execute on successful introduction of our products into the market. We must accurately evaluate our markets for, and react to, competitive threats in both other technologies (such as advanced batteries) and our technology field. Finally, we must continue to lower our products’ build costs and lifetime service costs. If we are unable to successfully take these steps, we may never operate profitably, and, even if we do achieve profitability, we may be unable to sustain or increase our profitability in the future. Our indebtedness could adversely affect our liquidity, financial condition and our ability to fulfill our obligations and operate our business. At December 31, 2022, our total outstanding indebtedness was approximately $532.2 million, 193.9 million of the $200.0 in aggregate principal amount of 3.75% Convertible Senior Notes due June 1, 2025 (the “3.75% Convertible Senior Notes”), $9.1 million of long-term debt, and $329.2 million of finance obligations consisting primarily of debt associated with sale of future revenues and sale/leaseback financings. Our indebtedness could have negative consequences on our future operations, including: | ● | we may have difficulty satisfying our obligations with respect to our outstanding debt; |
| ● | we may have difficulty obtaining financing in the future for working capital, capital expenditures, acquisitions, or other purposes; |
| ● | our vulnerability to general economic downturns and adverse industry conditions could increase; |
| ● | our flexibility in planning for, or reacting to, changes in our business and in our industry in general could be limited; |
| ● | our amount of debt and the amount we must pay to service our debt obligations could place us at a competitive disadvantage compared to our competitors that may have less debt. |
Our ability to generate cash to repay our indebtedness is subject to the performance of our business, as well as general economic, financial, competitive, and other factors that are beyond our control. If our business does not generate sufficient cash flow from operating activities or if future borrowings are not available to us in amounts sufficient to enable us to fund our liquidity needs, our operating results, and financial condition may be adversely affected. The accounting method for convertible debt securities that may be settled in cash, such as the 3.75% Convertible Senior Notes, could have a material effect on our reported financial results. Under Accounting Standards Codification (“ASC”) 470-20, Debt with Conversion and Other Options, or ASC 470-20, an entity must separately account for the liability and equity components of the convertible debt instruments (such as the 3.75% Convertible Senior Notes that may be settled entirely or partially in cash upon conversion in a manner that reflects the issuer’s economic interest cost. The effect of ASC 470-20 on the accounting for the convertible senior notes is that the equity component is required to be included in the additional paid-in capital section of stockholders’ equity on our consolidated balance sheet at the issuance date and the value of the equity component would be treated as debt discount for purposes of accounting for the debt component of the convertible senior notes. As a result, we are required to record a non-cash interest expense as a result of the amortization of the discounted carrying value of the convertible senior notes to their face amount over the term of the convertible senior notes. As a result, we report larger net losses (or lower net income) in our financial results because ASC 470-20 requires interest to include the amortization of the debt discount, which could adversely affect our reported or future financial results or the trading price of our common stock. In addition, on January 1, 2021, we early adopted Accounting Standards Update (“ASU”) No. 2020-06, Debt—Debt with Conversion and Other Options (Subtopic 470-20) and Derivatives and Hedging—Contracts in Entity’s Own Equity (Subtopic 815-40) using the modified retrospective approach. Consequently, the 3.75% Convertible Senior Notes is now accounted for as a single liability measured at its amortized cost. This accounting change removed the impact of recognizing the equity component of the Company’s convertible notes at issuance and the subsequent accounting impact of additional interest expense from debt discount amortization. The cumulative effect of the accounting change upon adoption on January 1, 2021 increased the carrying amount of the 3.75% Convertible Senior Notes by $120.6 million, reduced accumulated deficit by $9.6 million and reduced additional paid-in capital by $130.2 million. Future interest expense of the convertible notes will be lower as a result of adoption of this guidance and net loss per share will be computed using the if-converted method for convertible instruments. The convertible note hedges may affect the value of our common stock. In conjunction with the pricing of the 3.75% Convertible Senior Notes, the Company entered into privately negotiated capped call transactions (the “3.75% Notes Capped Call”) with certain counterparties at a price of $16.3 million. The 3.75% Notes Capped Call cover, subject to anti-dilution adjustments, the aggregate number of shares of the Company’s common stock that underlie the initial 3.75% Convertible Senior Notes and is generally expected to reduce potential dilution to the Company’s common stock upon any conversion of the 3.75% Convertible Senior Notes and/or offset any cash payments the Company is required to make in excess of the principal amount of the converted notes, as the case may be, with such reduction and/or offset subject to a cap based on the cap price. The cap price of the 3.75% Notes Capped Call is initially $6.7560 per share, which represents a premium of approximately 60%over the last then-reported sale price of the Company’s common stock of $4.11 per share on the date of the transaction and is subject to certain adjustments under the terms of the 3.75% Notes Capped Call. The 3.75% Notes Capped Call becomes exercisable if the conversion option is exercised. The option counterparties and/or their respective affiliates may modify their hedge positions by entering into or unwinding various derivatives with respect to our common stock and/or purchasing or selling our common stock in secondary market transactions prior to the maturity of the 3.75% Convertible Senior Notes (and are likely to do so during any observation period related to a conversion of 3.75% Convertible Senior Notes or following any repurchase of 3.75% Convertible Senior Notes by us on any fundamental change repurchase date or otherwise). This activity could also cause or avoid an increase or a decrease in the market price of our common stock. In addition, if any such convertible note hedge transaction fails to become effective, the option counterparties may unwind their hedge positions with respect to our common stock, which could adversely affect the value of our common stock. The potential effect, if any, of these transactions and activities on the market price of our common stock will depend in part on market conditions and cannot be ascertained at this time. Any of these activities could adversely affect the value of our common stock. We are subject to counterparty risk with respect to the convertible note hedge transactions. The option counterparties are financial institutions or affiliates of financial institutions and are subject to the risk that one or more of such option counterparties may default under the convertible note hedge transactions. Our exposure to the credit risk of the option counterparties is not secured by any collateral. If any option counterparty becomes subject to bankruptcy or other insolvency proceedings, we will become an unsecured creditor in those proceedings with a claim equal to our exposure at that time under our transactions with that option counterparty. Our exposure will depend on many factors but, generally, an increase in our exposure will be correlated to an increase in our common stock market price and in the volatility of the market price of our common stock. In addition, upon a default by an option counterparty, we may suffer adverse tax consequences and dilution with respect to our common stock. We can provide no assurance as to the financial stability or viability of any option counterparty. C. OPERATIONAL RISKS We may not be able to expand our business or manage our future growth effectively. We may not be able to expand our business or manage future growth. We plan to continue to improve our manufacturing processes and build additional manufacturing production over the next five years, which will require successful execution of: | ● | expanding our existing customers and expanding to new markets; |
| ● | ensuring manufacture, delivery, and installation of our products; |
| ● | ensuring timely construction and completion of hydrogen generation projects, which may be delayed due to the Company’s executive officersinexperience with these project types, supply chain issues, and management teamfederal, state, and local permitting and regulatory issues; |
| ● | implementing and improving additional and existing administrative, financial and operations systems and procedures and controls; |
| ● | integration of acquisitions; |
| ● | hiring additional employees; |
| ● | expanding and upgrading our technological capabilities; |
| ● | managing relationships with our customers and suppliers and strategic partnerships with other third parties; |
| ● | maintaining adequate liquidity and financial resources; and |
| ● | continuing to increase our revenues from operations. |
Ensuring delivery of our products is subject to many market risks, including scarcity, significant price fluctuations, and competition. Maintaining adequate liquidity is dependent upon a variety of factors, including continued revenues from operations, working capital improvements, and compliance with our debt instruments. We may not be able to achieve our growth strategy and increase production capacity as planned during the foreseeable future. If we are unable to manage our growth effectively, we may not be able to take advantage of market opportunities, develop new products, satisfy customer requirements, execute our business plan, or respond to competitive pressures. For further information on risks associated with new business ventures, see Item I.3.E, “Risk Factors” (“Strategic Risks — We may be unable to successfully pursue new business ventures.”). Our success depends on our ability to improve our financial and operational performance and execute our business strategy. If we fail to implement our business strategy, our financial condition and results of operations could be adversely affected. Our future financial performance and success depend in large part on our ability to successfully implement our business strategy. We cannot assure you that we will be able to successfully implement our business strategy or be able to continue improving our operating results. In particular, we cannot assure you that we will be able to successfully execute our ongoing, or any future, investments, achieve operating cost savings targeted through focused improvements and capacity optimization, including improvements to service performance through scale of manufacturing and vertical integration, and opportunistically pursue strategic transactions. Implementation of our business strategy may be impacted by factors outside of our control, including competition, commodity price fluctuations, industry, legal and regulatory changes or developments and general economic and political conditions. Any failure to successfully implement our business strategy could adversely affect our financial condition and results of operations. We may, in addition, decide to alter or discontinue certain aspects of our business strategy at any time. Although we have undertaken and expect to continue to undertake productivity and manufacturing system and process transformation initiatives to improve service performance, we cannot assure you that all of these initiatives will be completed or that any estimated cost savings from such activities will be fully realized. Even when we are able to generate new efficiencies in the short- to medium-term, we may not be able to continue to reduce costs and increase productivity over the long-term. There can be no assurance if and when any of these initiatives will be successfully and fully executed or completed. Delays in or not completing our product and project development goals may adversely affect our revenue and profitability. If we experience delays in meeting our development goals (including delivery of electrolyzers to customers, as well as the completion of hydrogen generation projects), our products exhibit technical defects, or if we are unable to meet cost or performance goals (including power output), useful life and reliability, the profitable commercialization of our products will be delayed. In this event, potential purchasers of our products may choose alternative technologies and any delays could allow potential competitors to gain market advantages. We cannot assure that we will successfully meet our commercialization schedule in the future. Periodically, we may enter into contracts with our customers for certain products that have not been developed or produced. There can be no assurance that we will complete the development of these products and meet the specifications required to fulfill customer agreements and deliver products on schedule. Pursuant to such agreements, the customers would have the right to provide notice to us if, in their good faith judgment, we have materially deviated from such agreements. Should a customer provide such notice, and we cannot mutually agree to a modification to the agreement, then the customer may have the right to terminate the agreement, which could have a material adverse effect upon our future business. Other than our current products, which we believe to be commercially viable at this time, we do not know when or whether we will successfully complete research and development of other commercially viable products that could be critical to our future. If we are unable to develop additional commercially viable products, we may not be able to generate sufficient revenue to become profitable. The profitable commercialization of our products depends on our ability to reduce the costs of our components and subsystems, and we cannot assure you that we will be able to sufficiently reduce these costs. In addition, the profitable commercialization of our products requires achievement and verification of their overall reliability, efficiency and safety targets, and we cannot assure you that we will be able to develop, acquire or license the technology necessary to achieve these targets. We must complete additional research and development to fill our product portfolios and deliver enhanced functionality and reliability in order to manufacture additional commercially viable products in commercial quantities. In addition, while we continue to conduct tests to predict the overall life of our products, we may not have run our products over their projected useful life prior to large-scale commercialization. As a result, we cannot be sure that our products will last as long as predicted, resulting in possible warranty claims and commercial failures. Our products use, or generate, flammable fuels that are inherently dangerous substances, which could subject our business to product safety, product liability, other claims, product recalls, negative publicity, or heightened regulatory scrutiny of our products. Our fuel cell systems use hydrogen gas in catalytic reactions. While our products do not use this fuel in a combustion process, hydrogen gas is a flammable fuel that could leak and combust if ignited by another source. Further, any such accidents involving our products or other products using similar flammable fuels could materially suppress demand for, or heighten regulatory scrutiny of, our products. Our expansion into electrolyzer manufacturing, hydrogen production, and the transport of hydrogen fuel similarly involve hydrogen in either gaseous or liquified form. Additionally, the production of hydrogen through electrolysis also results in the generation of oxygen. As a result, oxygen must be separated and controlled during the hydrogen production process. Such activities are subject to potential risks and liabilities associated with flammable gases. The risk of product liability claims and associated adverse publicity is inherent in the development, manufacturing, marketing and sale of fuel cell products, electrolyzers, hydrogen production and destruction, and in products fueled by hydrogen, which is a flammable gas. Any liability for damages resulting from malfunctions or design defects could be substantial and could materially adversely affect our business, financial condition, results of operations and prospects. In addition, an actual or perceived problem with our products could adversely affect the market’s perception of our products resulting in a decline in demand for our products, which may materially and adversely affect our business, financial condition, results of operations and prospects. See Part I, Item 3, “Legal Proceedings.” Certain component quality issues have resulted in adjustments to our warranty reserves and the accrual for loss contracts. In the past, quality issues have arisen with respect to certain components in certain products that are currently being used at customer sites. Under the terms of our extended maintenance contracts, we have had to retrofit units subject to component quality issues with replacement components to improve the reliability of our products for our customers. We recorded a provision for loss contracts related to service in the current and prior years. Though we continue to work with our vendors on these component issues to improve quality and reliability, unanticipated additional quality issues or warranty claims may arise, and additional material charges may be incurred in the future. Quality issues also could cause profitable maintenance contracts to become unprofitable. In addition, we may from time to time experience other unexpected design, manufacturing or product performance issues. We make significant investment in the continued improvement of our products and maintain appropriate warranty reserves for known and unexpected issues; however, unknown malfunctions or defects could result in unexpected material liabilities and could adversely affect our business, financial condition, results of operation, cash flows and prospects. In addition, an actual or perceived problem could adversely affect the market’s perception of our products resulting in a decline in demand for our products and could divert the attention of our management, which may materially and adversely affect our business, financial condition, results of operations, cash flows, and prospects. Our purchase orders may not ship, be commissioned or installed, or convert to revenue, which could have an adverse impact on revenue and cash flow. Some of the orders we accept from customers require certain conditions or contingencies to be satisfied, or may be cancelled, prior to shipment or prior to commissioning or installation, some of which are outside of our control. Historically for our GenDrive products, shipments made against these orders have generally occurred between 90 days and 24 months from the date of acceptance of the order. Orders for the Company’s products and services approximated $1.2 billion for the year ended December 31, 2022. The time periods from receipt of an order to shipment date and installation vary widely and are determined by a number of factors, including the terms of the customer contract and the customer’s deployment plan. There may also be product redesign or modification requirements that must be satisfied prior to shipment of units under certain of our agreements. If the redesigns or modifications are not completed, some or all of our orders may not ship or convert to revenue. In certain cases, we disclose anticipated, pending orders with prospective customers for our various products, including PEM fuel cell, electrolyzer, and green hydrogen sales; however, those prospective customers may require certain conditions or contingencies to be satisfied prior to entering into a purchase order with us, some of which are outside of our control. Such conditions or contingencies that may be required to be satisfied before we receive a purchase order may include, but are not limited to, successful product demonstrations or field trials. Converting orders into revenue is also dependent upon our customers’ ability to obtain financing. Some conditions or contingencies that are out of our control may include, but are not limited to, government tax policy, government funding programs, and government incentive programs. Additionally, some conditions and contingencies may extend for several years. We may have to compensate customers, by either reimbursement, forfeiting portions of associated revenue, or other methods depending on the terms of the customer contract, based on the failure on any of these conditions or contingencies. While not probable, this could have an adverse impact on our revenue and cash flow. We are dependent on information technology in our operations and the failure of such technology may adversely affect our business. Potential security breaches of our information technology systems, including cyber-attacks, could lead to liability or could damage our reputation and financial results. We may experience problems with the operation of our current information technology systems or the technology systems of third parties on which we rely, as well as the development and deployment of new information technology systems, that could adversely affect, or even temporarily disrupt, all or a portion of our operations until resolved. Inabilities and delays in implementing new systems can also affect our ability to realize projected or expected cost savings. Any systems failures could impede our ability to timely collect and report financial results in accordance with applicable laws. Information technology system and/or network disruptions could harm the Company’s operations. Failure to effectively prevent, detect, and recover from security breaches, including cyber-attacks, could result in the misuse of company assets, unauthorized use or publication of our trade secrets and confidential business information, disruption to the company, diversion of management resources, regulatory inquiries, legal claims or proceedings, reputational damage, loss of sales, reduction in value of our investment in research and development, among other costs to the company. We have experienced and may continue to experience attempts to gain unauthorized access to our information technology systems on which we maintain proprietary and confidential information. To date, any attempts to gain unauthorized access have been either immaterial or deflected by appropriate security measures. The risk of a security breach or disruption, particularly through cyber-attacks, or cyber intrusion, including by computer hackers, and cyber terrorists, has generally increased as cyber-attacks have become more prevalent and harder to detect and fight against. Additionally, outside parties may attempt to access our confidential information through other means, for example by fraudulently inducing our employees to disclose confidential information. We actively seek to prevent, detect, and investigate any unauthorized access. These threats are also continually evolving, and as a result, will become increasingly difficult to detect. In addition, as a result of the COVID-19 pandemic, the increased prevalence of employees working from home may exacerbate the aforementioned cybersecurity risks. Despite the implementation of network security measures, our information technology system have been and could be penetrated by outside parties. The implementation of a new enterprise resource planning system could cause disruption to our operations. We are planning to implement a new enterprise resource planning, or ERP, system which is currently scheduled to be implemented during fiscal year 2023. We may experience difficulties in implementing the new ERP system. If the implementation of the ERP system does not proceed as expected, it could impede our ability to manufacture products, order materials, generate management reports, invoice customers, and comply with laws and regulations. Any of these types of disruptions could have a material adverse effect on our net sales and profitability. In addition, the implementation of the new ERP system will require significant investment of human and financial resources. We may experience delays, increased costs and other difficulties, including potential design defects, miscalculations, testing requirements, re-work due to changes in business plans or reporting standards, and the diversion of management’s attention from day-to-day business operations. Extended delays could include operational risk, including cybersecurity risks, and other complications. If we are unable to implement the new ERP system as planned, the effectiveness of our internal control over financial reporting could be adversely affected, our ability to assess those controls adequately could be delayed, and our business, results of operations, financial condition and cash flows could be negatively impacted. Our future plans could be harmed if we are unable to attract or retain key personnel. We have attracted a highly skilled management team and specialized workforce, including scientists, engineers, researchers, manufacturing, and marketing and sales professionals. Our future success will depend, in part, on our ability to attract and retain qualified management and technical personnel. We do not know whether we will be successful in hiring or retaining qualified personnel. Furthermore, our ability to attract and retain key employees could be adversely impacted if we do not have a sufficient number of shares available under our equity incentive plan to issue to our employees, or if our stockholders do not approve requested share increases or a new equity incentive. In general, our industry continues to experience change and be subject to significant competitive pressures with respect to the retention of top talent. The loss of key employees may occur due to perceived opportunity for promotion, compensation levels or composition of compensation, work environment or other individual reasons. In addition, we have from time-to-time experienced labor shortages and other labor-related issues. Labor shortages have become more pronounced as a result of the COVID-19 pandemic. A number of factors might adversely affect the labor force available to us in one or more of our markets, including high employment levels, federal unemployment subsidies, and other government regulations, which include laws and regulations related to workers’ health and safety, wage and hour practices and immigration, and such factors can also impact the cost of labor. For example, the recently enacted Inflation Reduction Act includes certain prevailing wage requirements related to tax credit availability which may impact labor costs of the Company and our contractors and subcontractors going forward. An increase in labor costs and the unavailability of skilled labor (including apprentices) or increased turnover could have a material adverse effect on our results of operations. Our inability to hire qualified personnel on a timely basis, or the departure of key employees, could materially and adversely affect our development and profitable commercialization plans and, therefore, our business prospects, results of operations and financial condition. We may not be able to protect important intellectual property and we could incur substantial costs defending against claims that our products infringe on the proprietary rights of others. PEM fuel cell technology was first developed in the 1950s, and fuel processing technology has been practiced on a large scale in the petrochemical industry for decades. Accordingly, we do not believe that we can establish a significant proprietary position in the fundamental component technologies in these areas. However, our ability to compete effectively will depend, in part, on our ability to protect our proprietary system-level technologies, systems designs and manufacturing processes. We rely on patents, trademarks, trade secrets, and other policies and procedures related to confidentiality to protect our intellectual property. However, some of our intellectual property is not covered by any patent or patent application. Moreover, we do not know whether any of our pending patent applications will issue or, in the case of patents issued or to be issued, that the claims allowed are or will be sufficiently broad to protect our technology or processes. Even if all of our patent applications are issued and are sufficiently broad, our patents may be challenged or invalidated. We could incur substantial costs in prosecuting or defending patent infringement suits or otherwise protecting our intellectual property rights. While we have attempted to safeguard and maintain our proprietary rights, we do not know whether we have been or will be completely successful in doing so. Moreover, patent applications filed in foreign countries may be subject to laws, rules and procedures that are substantially different from those of the United States, and any resulting foreign patents may be difficult and expensive to obtain and enforce. In addition, we do not know whether the USPTO will grant federal registrations based on our pending trademark applications. Even if federal registrations are granted to us, our trademark rights may be challenged. It is also possible that our competitors or others will adopt trademarks similar to ours, thus impeding our ability to build brand identity and possibly leading to customer confusion. We could incur substantial costs in prosecuting or defending trademark infringement suits. Furthermore, we might encounter difficulties protecting intellectual property rights in foreign jurisdictions. Certain jurisdictions do not favor the enforcement of patents, trade secrets, and other intellectual property protection. Enforcement of our intellectual property and proprietary rights in foreign jurisdictions could result in substantial costs and adverse impacts to our intellectual property rights. Further, our competitors may independently develop or patent technologies or processes that are substantially equivalent or superior to ours. If we are found to be infringing third party patents, we could be required to pay substantial royalties and/or damages, and we do not know whether we will be able to obtain licenses to use such patents on acceptable terms, if at all. Failure to obtain needed licenses could delay or prevent the development, manufacture or sale of our products, and could necessitate the expenditure of significant resources to develop or acquire non-infringing intellectual property. We may need to pursue lawsuits or legal action in the future to enforce our intellectual property rights, to protect our trade secrets and domain names, and to determine the validity and scope of the proprietary rights of others. If third parties prepare and file applications for trademarks used or registered by us, we may oppose those applications and be required to participate in proceedings to determine the priority of rights to the trademark. Similarly, competitors may have filed applications for patents, may have received patents and may obtain additional patents and proprietary rights relating to products or technology that block or compete with ours. We may have to participate in interference proceedings to determine the priority of invention and the right to a patent for the technology. Litigation and interference proceedings, even if they are successful, are expensive to pursue and time consuming, and we could use a substantial amount of our management and financial resources in either case. Confidentiality agreements to which we are party may be breached, and we may not have adequate remedies for any breach. Our trade secrets may also be known without breach of such agreements or may be independently developed by competitors. Our inability to maintain the proprietary nature of our technology and processes could allow our competitors to limit or eliminate any competitive advantages we may have. We are subject to legal proceedings and legal compliance risks that could harm our business. We are currently, and in the future may continue to be, subject to commercial disputes and litigation. In connection with any disputes or litigation in which we are involved, we may incur costs and expenses in connection with defending ourselves or in connection with the payment of any settlement or judgment or compliance with any ruling in connection therewith. The expense of defending litigation may be significant. The amount of time to resolve lawsuits is unpredictable and defending ourselves may divert management’s attention from the day-to-day operations of our business, which could adversely affect our business, financial condition, results of operations and cash flows. In addition, an unfavorable outcome in any such litigation could have a material adverse effect on our business, results of operations, financial condition and cash flows. See Part I, Item 3, “Legal Proceedings.” Our financial results may be adversely affected by changes in accounting principles generally accepted in the United States. U.S. Generally Accepted Accounting Principles (“GAAP”) is subject to interpretation by the FASB, the American Institute of Certified Public Accountants, the SEC and various bodies formed to promulgate and interpret appropriate accounting principles. See Note 2, “Summary of Significant Accounting Policies,” to our consolidated financial statements included in this Annual Report on Form 10-K regarding the effect of new accounting pronouncements on our financial statements. Any difficulties in implementing these pronouncements could cause us to fail to meet our financial reporting obligations, which could result in regulatory discipline and harm investors’ confidence in us. Further, the implementation of new accounting pronouncements or a change in other principles or interpretations could have a significant effect on our financial results. If our estimates or judgments relating to our critical accounting policies are based on assumptions that change or prove to be incorrect, our operating results could fall below expectations of investors, resulting in a decline in our stock price. The preparation of financial statements in conformity with GAAP requires management to make estimates and assumptions that affect the amounts reported in our consolidated financial statements and accompanying notes. For example, our revenue recognition, loss accrual for service contracts, goodwill and impairment of long-lived assets policies are complex, and we often must make estimates and assumptions that could prove to be incorrect. We base our estimates on historical experience and on various other assumptions that we believe to be reasonable under the circumstances. Significant assumptions and estimates used in preparing our consolidated financial statements include those related to revenue recognition, loss accrual for service contracts, impairment of long-lived assets, and provision for common stock warrants. Our operating results may be adversely affected if our assumptions change or if actual circumstances differ from those in our assumptions, which could cause our operating results to fall below the expectations of investors, resulting in a decline in our stock price. We identified material weaknesses in our internal control over financial reporting. If we do not effectively remediate these material weaknesses or if we otherwise fail to maintain effective internal control over financial reporting, we may not be able to accurately report our financial results or prevent fraud. Management identified material weaknesses in our internal control over financial reporting as of December 31, 2022, 2021, 2020, 2019, and 2018. See Item 9A, “Controls and Procedures,” in this Annual Report on Form 10-K for information regarding the identified material weaknesses and our actions to date to remediate the material weaknesses. If we do not effectively remediate these material weaknesses or if we otherwise fail to maintain effective internal control over financial reporting, we may not be able to accurately report our financial results or prevent fraud. D. REGULATORY RISKS The reduction or elimination of government subsidies and economic incentives for alternative energy technologies, or the failure to renew such subsidies and incentives, could reduce demand for our products, lead to a reduction in our revenues, and adversely impact our operating results and liquidity. We believe that the near-term growth of alternative energy technologies is affected by the availability and size of government and economic incentives. Many of these government incentives expire, phase out over time, may exhaust the allocated funding, or require renewal by the applicable authority. In addition, these incentive programs could be reduced or discontinued for other reasons. The Inflation Reduction Act (“IRA”) adopted in August 2022 contains a number of tax incentive provisions including: (i) an extension and amendment of the Section 48 investment tax credit (“ITC”) for projects that “begin construction” before 2025; (ii) a new Section 48E clean electricity ITC; (iii) a new Section 45V Clean Hydrogen Production Tax Credit (“PTC”); and (iv) a new commercial clean vehicle tax credit, among other items. In many instances, the Company will have to comply with prevailing wage and apprenticeship requirements to maximize the value of these new clean energy tax credits. Furthermore, the ITC also have bonus credits for projects that are placed in service in certain “energy community” regions (specifically former oil, coal, and gas dependent geographies, and brownfield), or for projects that can meet domestic content criteria for steel, iron, and manufactured products. For example, the baseline credit amount for the ITC for qualified fuel cell properties is six percent. If a taxpayer satisfied prevailing wage and apprenticeship requirements (or is exempt therefrom), the ITC amount is multiplied by five (equal to 30%). Furthermore, if a project is placed in service in an “energy community” or can meet “domestic content" criteria, the taxpayer may be eligible for additional bonus credits beyond a 30% ITC. We believe we are well positioned to capture incentives contained in the IRA; however, this legislation was adopted in August 2022, and forthcoming interagency guidance processes are still ongoing. We have not yet seen the impact these IRA-related incentives may have on our business and operations and cannot guarantee we will realize anticipated benefits of incentives under the IRA, particularly as our Company adapts to an ongoing and nascent regulatory guidance process regarding the detailed requirements of various new energy provisions. Furthermore, changes or amendments to clean energy tax credits might be more favorable to other technologies. Any reduction, elimination, or discriminatory application of expiration of the ITC or other government subsidies and economic incentives, or the failure to renew such tax credit, governmental subsidies, or economic incentives, may result in the diminished economic competitiveness of our products to our customers and could materially and adversely affect the growth of alternative energy technologies, including our products, as well as our future operating results and liquidity. We are subject to various federal, state, and local and non-US environmental and human health and safety laws and regulations that could impose significant costs and liabilities on us. Our operations are subject to federal, state, and local environmental and human health and safety laws and regulations, including laws and regulations relating to the use, handling, storage, transportation, disposal and human exposure to hazardous substances and wastes, product safety, emissions of pollution into the environment, and human health and safety. We have incurred and expect to continue to incur, costs to comply with these laws and regulations. These costs and obligations are likely to expand and change as our Company grows, makes acquisitions, and conducts business in new locations. Furthermore, federal, state, and local governments are increasingly regulating and restricting the use of certain chemicals, substances, and materials. Some of these policy initiative could foreseeably be impactful to our business. For example, laws, regulations, or other policy initiatives might address substances found within component parts to our products, in which event our Company would be required to comply with such requirements. Our facilities in the U.S. are subject to regulation by OSHA, which regulates the protection of the health and safety of workers. In addition, the OSHA hazard communication standard requires that we maintain information about hazardous materials used or produced in our operations and that we provide this information to employees, state and local governmental authorities and local residents. We are also subject to occupational safety regulations in other countries. Our failure to comply with government occupational safety regulations, including OSHA requirements, or general industry standards relating to employee health and safety, keep adequate records or monitor occupational exposure to regulated substances could expose us to liability, enforcement, and fines and penalties, and could have a material adverse effect on our business, operating results, cash flows, or financial condition. Violation of these laws or regulations or the occurrence of an explosion or other accident in connection with our fuel cell systems at our properties or at third party locations could lead to injuries, property damage, litigation, substantial liabilities and sanctions, including fines and penalties, cleanup costs, manufacturing delays or the requirement to undertake corrective action. Further, environmental laws and human health and safety and regulations, and the administration, interpretation, and enforcement thereof, are subject to change and may become more stringent in the future, each of which could materially adversely affect our business, financial condition, and results of operations. Additionally, certain environmental laws impose liability, which can be joint and several, as well as strict, on current and previous owners and operators of real property for the cost of removal or remediation of hazardous substances and damage to natural resources. These laws often impose liability even if the owner or operator did not know of, or was not responsible for, the release of such hazardous substances. They can also assess liability on persons who arrange for hazardous substances to be sent to disposal or treatment facilities when such facilities are found to be contaminated, and such persons can be responsible for cleanup costs even if they never owned or operated the contaminated facility. Our liabilities arising from past or future releases of, or exposure to, hazardous substances may adversely affect our business, financial condition, and results of operations. Our business may become subject to increased government regulation. Our products are subject to certain federal, state, local, and non-U.S. laws and regulations, including, for example, state and local ordinances relating to building codes, fire codes, public safety, electrical and gas pipeline connections, hydrogen transportation and siting and related matters. See Item 1, “Business — Government Regulations” for additional information. In certain jurisdictions, these regulatory requirements may be more stringent than those in the United States. Further, as products are introduced into the market commercially, governments may impose new regulations. We do not know the extent to which any such regulations may impact our ability to manufacture, distribute, install and service our products. Any regulation of our products, whether at the federal, state, local or foreign level, including any regulations relating to the production, operation, installation, and servicing of our products may increase our costs and the price of our products, and noncompliance with applicable laws and regulations could subject us to investigations, sanctions, enforcement actions, fines, damages, civil and criminal penalties, or injunctions. Furthermore, certain business activities may require the Company to navigate a myriad of state or local-level laws and regulations. If any governmental sanctions are imposed, our business, operating results, and financial condition could be materially adversely affected. In addition, responding to any action will likely result in a significant diversion of management’s attention and resources and an increase in professional fees. Enforcement actions and sanctions could harm our business, operating results and financial condition. Changes in tax laws or regulations or adverse outcomes resulting from examination of our income or other tax returns could adversely affect our operating results and financial condition. We are subject to income taxes in the United States and various foreign jurisdictions. A number of factors may adversely affect our future effective tax rates, such as the jurisdictions in which our profits are determined to be earned and taxed; changes in the valuation of our deferred tax assets and liabilities; adjustments to estimated taxes upon finalization of various tax returns; changes in available tax credits, grants and other incentives; changes in stock-based compensation expense; the availability of loss or credit carryforwards to offset taxable income; changes in tax laws, regulations, accounting principles or interpretations thereof; or examinations by US federal, state or foreign jurisdictions that disagree with interpretations of tax rules and regulations in regard to positions taken on tax filings. A change in our effective tax rate due to any of these factors may adversely affect the carrying value of our tax assets and our future results from operations. In addition, as our business grows, we are required to comply with increasingly complex taxation rules and practices. We are subject to tax in multiple U.S. tax jurisdictions and in foreign tax jurisdictions as we expand internationally, which requires additional expertise to ensure compliance with various domestic and international tax laws. The development of our global tax footprint and compliance with these laws may impact how we conduct our business and affect our financial position, operating results, and cash flows. The changes in the carryforward/carryback periods as well as the new limitation on use of net operating losses (“NOLs”) may significantly impact our valuation allowance assessments for NOLs. Changes in U.S. federal income or other tax laws or the interpretation of tax laws, including the Inflation Reduction Act, as passed by Congress in August 2022, may impact our tax liabilities. As of December 31, 2022, we had federal NOL carryforwards of $1.4 billion, which begin to expire in various amounts and at various dates in 2034 through 2037 (other than federal NOL carryforwards generated after December 31, 2017, which are not subject to expiration). As of December 31, 2022, we also had federal research and development tax credit carryforwards of $14.9 million, which begin to expire in 2033. Utilization of our NOLs and research and development tax credit carryforwards may be subject to a substantial annual limitation if the ownership change limitations under Sections 382 and 383 of the Internal Revenue Code of 1986, as amended (the “Code”), and similar state provisions are triggered by changes in our ownership. In general, an ownership change occurs if there is a cumulative change in the ownership of the Company by “5-percent shareholders” that exceed 50 percentage points over a rolling three-year period. Based on studies of the changes in ownership of the Company, it has been determined that a Section 382 ownership change occurred in 2013 that limited the amount of pre-change NOLs that can be used in future years. NOLs incurred after the most recent ownership change are not subject to Section 382 of the Code and are available for use in future years. If we undergo any ownership changes, our ability to utilize our NOL carryforwards or research and development tax credit carryforwards could be further limited by Sections 382 and 383 of the Code. In addition, future changes in our stock ownership, many of which are outside of our control, could result in an ownership change under Sections 382 and 383 of the Code. Any such limitation may significantly reduce our ability to utilize our NOL carryforwards and research and development tax credit carryforwards before they expire. Our NOL carryforwards and research and development tax credit carryforwards may also be impaired under state law. Accordingly, we may not be able to utilize a material portion of our NOL carryforwards or research and development tax credit carryforwards. The Coronavirus Aid, Relief and Economic Security Act modified, among other things, rules governing NOLs. NOLs arising in tax years beginning after December 31, 2017 are subject to an 80% of taxable income limitation (as calculated before taking the NOLs into account) for tax years beginning after December 31, 2020. In addition, NOLs arising in tax years 2018, 2019, and 2020 are subject to a five year carryback and indefinite carryforward, while NOLs arising in tax years beginning after December 31, 2020 also are subject to indefinite carryforward but cannot be carried back. In future years, if and when the valuation allowance related to our NOLs is partially or fully released, the changes in the carryforward/carryback periods as well as the new limitation on use of NOLs may significantly impact our valuation allowance assessments for NOLs generated after December 31, 2017. Trade policies, treaties, and tariffs could have a material adverse effect on our business. Our business is dependent on the availability of raw materials and components for our products, particularly electrical components common in the semiconductor industry. There is continued uncertainty about the future relationship between the United States and various other countries, most significantly China, with respect to trade policies, treaties, tariffs, and taxes. Under the Biden administration, changes in U.S. administrative policy could lead to changes in existing trade agreements, greater restrictions on free trade generally, and significant increases in tariffs on goods imported into the United States, particularly tariffs on products manufactures in China and Mexico, among other possible changes. These developments, or the perception that any of them could occur, could have a material effect on global economic conditions and the stability of global financial markets, and could significantly reduce global trade and, in particular, trade between the impacted nations and the United States. This uncertainty includes: (i) the possibility of altering the existing tariffs or penalties on products manufactured outside the United States, including the U.S. government’s 25% tariff on a range of products from China; (ii) the effects stemming from the removal of such previously imposed tariffs; (iii) subsequent tariffs imposed by the United States on any other U.S. trading partners such as Russia; and (iv) potential tariffs imposed by trading partners on U.S. goods. The institution of trade tariffs on items imported by us from other countries could increase our costs, which could have a negative impact on our business. We cannot predict whether, and to what extent, there may be changes to international trade agreements or whether quotas, duties, tariffs, exchange controls or other restrictions on our products will be changed or imposed. In addition, an open conflict or war across any region could affect our ability to obtain raw materials. For example, the current military conflict between Russia and Ukraine, and related sanctions, export controls or other actions that may be initiated by nations, including the United States, the European Union or Russia (e.g., potential cyberattacks, disruption of energy flows, etc.) or potential sanctions or relevant export controls related to China or Taiwan could adversely affect our business and/or our supply chain or our business partners or customers in other countries beyond Russia and Ukraine.Although we currently maintain alternative sources for raw materials, if we are unable to source our products from the countries where we wish to purchase them, either because of the occurrence or threat of wars or other conflicts, regulatory changes or for any other reason, or if the cost of doing so increases, it could have a material adverse effect on our business, financial condition and results of operations. Disruptions in the supply of raw materials and components could temporarily impair our ability to manufacture our products for our customers or require us to pay higher prices to obtain these raw materials or components from other sources, which could have a material adverse effect on our business and our results of operations. We are exposed to fluctuations in currency exchange rates, which could negatively affect our operating results. Our contracts are primarily denominated in U.S. dollars, and therefore substantially all of our revenue is not subject to foreign currency risk. However, a strengthening of the U.S. dollar could increase the real cost of our offerings to our customers outside of the United States, which could adversely affect our operating results. In addition, an increasing portion of our operating revenues and operating expenses are earned or incurred outside of the United States, and an increasing portion of our assets is held outside of the United States. These operating revenues, expenses, and assets are denominated in foreign currencies and are subject to fluctuations due to changes in foreign currency exchange rates. If we are not able to successfully hedge against the risks associated with currency fluctuations, our operating results could be adversely affected. Additionally, global events as well as geopolitical developments, including regional conflicts in Europe, fluctuating commodity prices, trade tariff developments, and inflation have caused, and may in the future cause, global economic uncertainty and uncertainty about the interest rate environment, which could amplify the volatility of currency fluctuations. We have not engaged in the hedging of foreign currency transactions to date, so we may not be able to effectively offset the adverse financial impacts that may result from unfavorable movements in foreign currency exchange rates, which could adversely affect our operating results. E. STRATEGIC RISKS We may be unable to establish or maintain relationships with third parties for certain aspects of continued product development, manufacturing, distribution, sale, servicing, and the supply of key components for our products. We will need to maintain and may need to enter into additional strategic relationships in order to complete our current product development and commercialization plans regarding our fuel cell products, electrolyzers, hydrogen production, and potential new business markets. We may also require partners to assist in the sale, servicing, and supply of components for our current products and anticipated products, which are in development. If we are unable to identify, negotiate, enter into, and maintain satisfactory agreements with potential partners, including those relating to the supply, distribution, service and support of our current products and anticipated products, we may not be able to complete our product development and commercialization plans on schedule or at all. We may also need to scale back these plans in the absence of needed partners, which could adversely affect our future prospects for development and commercialization of future products. While we have entered into relationships with suppliers of some key components for our products, we do not know when or whether we will secure supply relationships for all required components and subsystems for our products, or whether such relationships will be on terms that will allow us to achieve our objectives. Our business prospects, results of operations, and financial condition could be harmed if we fail to secure relationships with entities that can develop or supply the required components for our products and provide the required distribution and servicing support. Additionally, the agreements governing our current relationships allow for termination by our partners under certain circumstances, some of which are beyond our control. If any of our current strategic partners were to terminate any of its agreements with us, there could be a material adverse impact on the continued development and profitable commercialization of our products and the operation of our business, financial condition, results of operations, and prospects. We may be unable to make attractive acquisitions or successfully integrate acquired businesses, assets or properties, and any inability to do so may disrupt our business and hinder our ability to grow, divert the attention of key personnel, disrupt our business, and impair our financial results. As part of our business strategy, we intend to consider acquisitions of companies, technologies, and products. We may not be able to identify such attractive acquisition opportunities. Acquisitions, involve numerous risks, any of which could harm our business, including, among other things: | ● | difficulty in integrating the Company’s needstechnologies, products, operations, and priorities evolve over time. A more complete descriptionexisting contracts of a target company and realizing the anticipated benefits of the Compensation Committee’s functions is set forthcombined businesses; |
| ● | mistaken assumptions about volumes or the timing of those volumes, revenues or costs, including synergies; |
| ● | negative perception of the acquisition by customers, financial markets or investors; |
| ● | difficulty in supporting and transitioning customers, if any, of the target company; |
| ● | inability to achieve anticipated synergies or increase the revenue and profit of the acquired business; |
| ● | the assumption of unknown liabilities; |
| ● | Compensation Committee’s charter which is published on the “Investors” section of the Company’s website at www.plugpower.com. Our website is not incorporated into or a part of this Annual Report on Form10-K.
Corporate Governance and Nominating Committee
The Governance Committee consists of Ms. Helmer (Chair) and Messrs. Roth, Schneider and Silver, each of whom is an independent director under the NASDAQ Rules. The Governance Committee’s responsibilities include (i) establishing criteria for Board and committee membership, (ii) considering director nominations consistent with the requirement that a majority of the Board be comprised of independent directors as defined in the NASDAQ Rules, (iii) identifying individuals qualifiedexposure to become Board members, and (iv) selecting the director nominees for election at each annual meeting of stockholders. The Governance Committee is also responsible for developing and recommending to the Board a set of corporate governance guidelines applicable to the Company and periodically reviewing such guidelines and recommending any changes thereto. A more complete description of the Governance Committee’s functions is set forth in the Governance Committee’s charter, which is published on the “Investors” section of the Company’s website at www.plugpower.com. Our website is not incorporated into or a part of this Annual Report on Form 10-K.
Delinquent Section 16(a) Reports
Section 16(a) of the Exchange Act requires the Company’s officers, as defined by Section 16, directors, and persons or entities who own more than 10% of a registered class of the Company’s equity securities, to file initial reports of ownership and reports of changes in ownership with the SEC. Such persons or entities are required by SEC regulations to furnish the Company with copies of all Section 16(a) forms they file. To our knowledge, based on our review of the copies of such filings and based on written representations, we believe that all such persons and entities complied on a timely basis with all Section 16(a) filing requirements during the fiscal year ended December 31, 2020, except that the following persons or entities filed the following Form 4s late on the following dates:
| ● | Keith C. Schmid filed a Form 4 on February 24, 2020 disclosing the sale of shares pursuant to a pre-established 10b5-1 trading plan and the exercise of options on February 18, 2020; |
| ● | Andrew J. Marsh, Gerard L. Conway, Jr. and Martin D. Hull each filed a Form 4 on February 24, 2020 disclosing the sale of shares pursuant to pre-established 10b5-1 trading plans and the exercise of options on February 18, 2020 and February 19, 2020; |
| ● | Johannes M. Roth and FiveT Capital Holding AG filed Form 4s on April 28, 2020 disclosing the conversion of Series C Redeemable Convertible Preferred Stock into shares of common stock on April 16, 2020 and the sale of shares of common stock on April 22, 2020 and April 23, 2020 by Five More Special Situations Fund Ltd., which receives investment advisory services from a wholly-owned subsidiary of FiveT Capital Holding AG, in which entities Mr. Roth has equity interests and which shares of common stock Mr. Roth has expressly disclaimed beneficial ownership in, except to the extent of his pecuniary interest therein, if any; |
| ● | Sanjay K. Shrestha filed a Form 4 on May 14, 2020 disclosing the vesting of restricted stock and tendering of shares to cover tax withholding obligations in connection with such vesting on May 9, 2020; |
| ● | Andrew J. Marsh, Paul B. Middleton, Keith C. Schmid and Martin D. Hull each filed a Form 4 on September 1, 2020 disclosing the vesting of restricted stock and tendering of shares to cover tax withholding obligations in connection with such vesting on August 19, 2020; |
| ● | Gerard L Conway, Jr. filed a Form 4 on September 1, 2020 disclosing the vesting of restricted stock and tendering of shares to cover tax withholding obligations in connection with such vesting on August 19, 2020 and the sale of shares pursuant to a pre-established 10b5-1 trading plan on August 27, 2020; and |
| ● | Lucas P. Schneider filed a Form 4 on May 13, 2021 disclosing the sale of shares pursuant to a pre-established 10b5-1 trading plan on July 1, 2020 and October 1, 2020.potential lawsuits; |
| ● | limitations on rights to indemnity from the seller;Code
|
| ● | the diversion of Conduct
We have adopted a code of conduct applicable to all of our directors, officersmanagement’s and employees, including our principal executive officer, principal financial officer and principal accounting officer. Our code of conduct is a “code of ethics” as definedemployees’ attention from other business concerns;
|
| ● | unforeseen difficulties operating in Item 406(b) of Regulation S-K and embodies our principles and practices relating tonew geographic areas; |
| ● | customer or key employee losses at the ethical conduct of our business and our long-standing commitment to honesty, fair dealing and full compliance with all laws affecting our business. In acquired businesses; |
| ● | the eventprice we pay or other resources that we amenddevote may exceed the value we realize; or waive certain provisions of our code of conduct in a manner that requires disclosure under applicable rules, we intend to provide such required disclosure on our website in accordancewith applicable SEC and NASDAQ Rules. Our code of ethics is available on our website at www.plugpower.com under Investor Relations. Our website is not incorporated into or a part of this Annual Report on Form 10-K.
Corporate Governance Guidelines
We have adopted corporate governance guidelines that serve as a flexible framework within which our Board of Directors and its committees operate. These guidelines cover a number of areas including Board membership criteria and director qualifications, director responsibilities, Board structure, Board member access to management and independent advisors, director compensation, director orientation and continuing education, evaluation of senior management and management succession planning. A copy of our corporate governance guidelines published on the “Investors” section of the Company’s website at www.plugpower.com. Our website is not incorporated into or a part of this Annual Report on Form 10-K.
Item 11. Executive Compensation
Compensation Discussion and Analysis
This Compensation Discussion and Analysis (“CD&A”) discusses our compensation policies and determinations that apply to our named executive officers. When we refer to our “named executive officers” we are referring to the following individuals:
| ● | Andrew J. Marsh, our President and Chief Executive Officer and a Director; |
| ● | Paul B. Middleton, our Chief Financial Officer and Senior Vice President; |
| ● | Sanjay K. Shrestha, our Chief Strategy Officer; |
| ● | Keith C. Schmid, our Chief Operating Officer and Senior Vice President; and |
| ● | Jose Luis Crespo, our Vice President-Global Sales.
|
While
| ● | the discussion invalue we could have realized if we had allocated the CD&A is focused on our named executive officers, many of our executive compensation programs apply broadly across our executive ranks. The following discussion should be read together with the compensation tablespurchase price or other resources to another opportunity and related disclosures set forth below.Executive Summary
Our Responseinability to the Covid-19 Pandemic
Like all companies, Plug Power was impacted by the Covid-19 pandemic. We rosegenerate sufficient revenue to the challenge and our response is reflective of our culture and our commitment to our employees, to our customers and to society. Below are a few highlights:
| ● | We prioritized the health and wellbeing of our employees and their families while continuing to deliver for our customers.
|
| ● | As restrictions and shutdowns were announced in countries around the world, we implemented new and imaginative ways for our employees to work at our facilities and remotely.
|
| ● | We enabled our employees to remain focused on delivering for our customers by providing personal and financial “peace of mind” by assuring job security and not implementing salary reductions or furloughs.offset acquisition costs. |
| ● | Our world-class engineers built ventilator prototypes to address the severe country-wide shortages.
|
| ● | We deployed members of our engineering, manufacturing and logistics teams to design and 3D print thousands of face shields that were donated to healthcare facilities and communities. |
In addition, if we finance acquisitions by issuing equity securities, our existing stockholders may be diluted. As a result, if our forecasted assumptions for these acquisitions and investments are not accurate, we may not achieve the anticipated benefits of any such acquisitions, and we may incur costs in excess of what we had anticipated. | ● | Our resourceful buyers sourced and coordinated personal protective equipment (PPE) distribution to hospitals. |
77
We may be unable to successfully pursue, integrate, or execute upon our new business ventures. We are developing and constructing hydrogen production plants across the United States and building relationships with green hydrogen suppliers. In 2022 and 2021, we acquired two subsidiaries of Cryogenic Industrial Solutions, LLC, which are Alloy Custom Products, LLC and WesMor Cryogenics, LLC (collectively, “CIS”), as well as the entities Joule, Applied Cryo Technologies, and Frames Holding B.V. (“Frames”). There can be no assurances that we will be able to successfully implement our new business ventures or successfully operate within this industry. The execution of the Company’s vertical integration strategy, as well as scaling its manufacturing capabilities, is impactful to the performance of the Company and customer experience. Failure to improve overall service performance and scale sourcing effectively can limit growth and adversely impact our customer experience. Each aspect of this vertical integration strategy, including manufacturing of electrolyzers, mobility fuel cell products, stationary fuel cell products, and liquefaction equipment, as well as servicing customer sites, is dependent upon the Company’s ability to integrate and execute these new business ventures. This vertical integration strategy may be unsuccessful, or the Company may be unable to successfully or timely execute its vertical integration strategy, which may adversely impact customer experience and, in turn, the Company’s operations, business, or financial results. Additionally, the ability to successfully integrate and execute these projects is dependent upon our ability to manufacture and supply each project with a sufficient number of electrolyzers. The successful integration of our electrolyzer manufacturing objectives will affect our ability to meet demands for electrolyzers — both internally for our hydrogen production projects, and externally for third-party electrolyzer customers. Furthermore, we may expend substantial time and resources in research and development for new potential markets. There is no guarantee that these research and development initiatives will be successful or implemented as commercial products. For further information on risks associated with acquisitions, see Item I.3.F “Risk Factors (“Strategic Risks — We may be unable to make attractive acquisitions or successfully integrate acquired businesses, assets or properties, and any inability to do so may disrupt our business and hinder our ability to grow, divert the attention of key personnel, disrupt our business and impair our financial results.”). F. RISKS RELATED TO THE OWNERSHIP OF OUR COMMON STOCK Our stock price and stock trading volume have been and could remain volatile, and the value of your investment could decline. The market price of our common stock has historically experienced and may continue to experience significant volatility. In 2022, the sales price of our common stock fluctuated from a high of $32.05 per share to a low of $11.49 per share. Our progress in developing and commercializing our products, our quarterly operating results, announcements of new products by us or our competitors, our perceived prospects, changes in securities analysts’ recommendations or earnings estimates, changes in general conditions in the economy or the financial markets, adverse events related to our strategic relationships, significant sales of our common stock by existing stockholders, including one or more of our strategic partners, events relating to our determination to restate certain of our previously issued consolidated financial statements, and other developments affecting us or our competitors could cause the market price of our common stock to fluctuate substantially. In addition, in recent years, the stock market has experienced significant price and volume fluctuations. This volatility has affected the market prices of securities issued by many companies for reasons unrelated to their operating performance and may adversely affect the price of our common stock. Such market price volatility could | ● | We facilitated the critical delivery operations of our customers providing essential services in the food, retail and cleaning supplies industries.
|
| ● | We engaged in corporate philanthropy by making donations to several charitable organizations, including The United Way and The No Neighbor Hungry Campaign.
|
The Covid-19 pandemic has highlighted the importance of innovative technology-driven solutions and imaginative human capital management to address an unprecedented crisis; it has also revealed just how interconnected we are as a society. We are proud of our Company’s response, and we are grateful for the extraordinary contribution of our employees to the success of Plug Power.
2020 Business and Strategic Highlights
2020 was an exceptional year for the Company. The Company successfully executed on its strategic growth pillars to reach significant milestones during 2020. 2020 results include the following achievements that impacted executive compensation:
adversely affect our ability to raise additional capital. Furthermore, technical factors in the public trading market for our common stock may produce price movements that may or may not comport with macro, industry or company-specific fundamentals, including, without limitation, the sentiment of retail investors (including as may be expressed on financial trading and other social media sites), the amount and status of short interest in our securities, access to margin debt, trading in options and other derivatives on our common stock and any related hedging or other technical trading factors.In addition, we are subject to securities class action litigation filed after a drop in the price in our common stock in March 2021, which could result in substantial costs and diversion of management’s attention and resources and could harm our stock price, business, prospects, results of operations and financial condition. | ● | Strong financial performance with a record year in gross billings. |
| ● | Deployed more than 9,800 fuel cell units powering electric vehicles in 2020 and built over 27 hydrogen stations. |
| ● | Raised approximately $1.5 billion in proceeds from equity and debt offerings in 2020, including executing the first ever convertible green bond offering in the United States as well as the largest follow-on offering in the clean energy sector. |
| ● | Ended the year with a strong balance sheet with over $1.6 billion in cash to execute on its global growth strategy and objectives. |
| ● | Completed the strategic acquisitions of United Hydrogen Group, Inc. and Giner ELX, Inc., positioning the Company as a fully vertically green hydrogen generation company. |
| ● | Announced strategic partnerships with Brookfield Energy, Apex Clean Energy and ACCIONA to source renewable electricity and build liquid green hydrogen plants. |
| ● | Continued to make strides within the Company’s fuel cell system business across its target markets and drove further adoption in core material handling, on-road and stationary power markets, adding a fourth pedestal customer, an automotive manufacturer with over 50 plants worldwide, within its core market of material handling and selecting a site for its gigafactory to drive scale. |
| ● | Released multiple new ProGen engine models, including the 125kW (on and off-road applications) and 1kW (robotics and drone applications) units. |
| ● | Continued to make progress with the Company’s partner, Lightning Systems, to build “middle-mile” delivery vehicles, producing the first electric, fuel cell-powered class-6 truck. |
| ● | Signed a memorandum of understanding with Linde to deploy pilot class-6 and class-8 vehicles on road in 2021. |
| ● | Collaborated with Gaussin to bring a commercial suite of ProGen-powered Gaussin transportation vehicles to market in 2021 as a solution to decarbonize the logistics ecosystem. |
| ● | Released the GenSure HP product designed for large-scale back-up power applications, including data centers, energy storage systems and microgrids, including manufacturing production of the GenSure HP product line commencing in December of 2020. |
In addition, the Company made significant progress in solidifying its global leadership position in green hydrogen solutions by executing term sheets for a joint venture in France with Groupe Renault, a top automotive player, and a joint venture in Asia with a subsidiary of SK Holdings to bring hydrogen solutions to Korea, China and Vietnam, which joint ventures were announced in January 2021.
Stockholder Value Creation
Below is a line graph comparing the percentage change in the cumulative total return of the Company’s common stock, based on the market price of the Company’s common stock, with the total return of companies included within the NASDAQ Clean Edge Green Energy Index (CELS) and the companies included within the Russell 2000 Index (RUT) for the period commencing December 31, 2015 and ending December 31, 2020. The calculation of the cumulative total return assumes a $100 investment in the Company’s common stock, the NASDAQ Clean Edge Green Energy Index (CELS) and the Russell 2000 Index (RUT) Index on December 31, 2015 and the reinvestment of all dividends, if any.
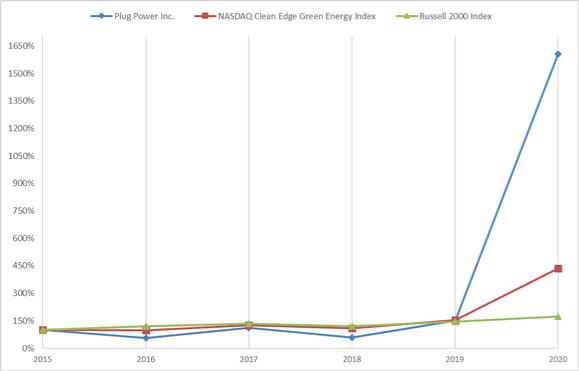
Sales of substantial amounts of our common stock in the public markets, or the perception that such sales might occur, could reduce the price that our common stock might otherwise attain and may dilute your voting power and your ownership interest in us. Sales of a substantial number of shares of our common stock in the public market, or the perception that such sales could occur, could adversely affect the market price of our common stock and may make it more difficult for you to sell your common stock at a time and price that you deem appropriate. As of December 31, 2022, there were approximately 39,170,766 shares of common stock issuable upon conversion of the 3.75% Convertible Senior Notes at a conversion price of $5.03 per share. In addition, as of December 31, 2022, we had outstanding options exercisable for an aggregate of 8,052,969 shares of common stock at a weighted average exercise price of $11.61 per share and 88,774,725 shares of common stock issuable upon the exercise of warrants, of which 46,131,376 were vested as of December 31, 2022. Moreover, subject to market conditions and other factors, we may conduct future offerings of equity or debt securities. Sales of substantial amounts of our common stock in the public market, or the perception that these sales could occur, could reduce the market price of our common stock to decline. In addition, the conversion of the notes or preferred stock or the exercise of outstanding options and warrants and future equity issuances will result in dilution to investors. The market price of our common stock could fall as a result of resales of any of these shares of common stock due to an increased number of shares available for sale in the market. If securities analysts do not publish research or reports or if they publish unfavorable or inaccurate research about our business and our stock, the price of our stock and the trading volume could decline. We expect that the trading market for our common stock will be affected by research or reports that industry or financial analysts publish about us or our business. There are many large, well-established companies active in our industry and portions of the markets in which we compete, which may mean that we receive less widespread analyst coverage than our competitors. If one or more of the analysts who covers us downgrades their evaluations of our company or our stock, the price of our stock could decline. If one or more of these analysts cease coverage of our company, our stock may lose visibility in the market, which in turn could cause our stock price to decline. Provisions in our charter documents and Delaware law may discourage or delay an acquisition of the Company by a third party that stockholders may consider favorable. Our amended and restated certificate of incorporation, our amended and restated bylaws, and Delaware corporate law contain provisions that could have an anti-takeover effect and make it harder for a third party to acquire us without the consent of our Board. These provisions may also discourage proxy contests and make it more difficult for our stockholders to take some corporate actions, including the election of directors. These provisions include, but are not limited to: the ability of our Board to issue shares of preferred stock in one or more series and to determine the terms of those shares, including preference and voting rights, without a stockholder vote; the exclusive right of our Board to elect a director to fill a vacancy created by the expansion of our Board or the resignation, death or removal of a director, which prevents stockholders from being able to fill vacancies on our Board; the inability of stockholders to call a special meeting of stockholders; the prohibition on stockholder action by written consent, which forces stockholder action to be taken at an annual or special meeting of our stockholders; advance notice informational and procedural requirements for nominations for election to our Board or for proposing business to be brought before a stockholder meeting, which may discourage or deter a potential acquirer from conducting a solicitation of proxies to elect the acquirer’s own slate of directors or otherwise attempting to obtain control of us; a prohibition against stockholders nominating a number of their own nominees at the annual meeting of the stockholders that exceeds the number of directors to be elected at such annual meeting; the ability of our Board of Directors, by majority vote and without shareholder approval, to amend the bylaws, which may allow our Board to take additional actions to prevent an unsolicited takeover and inhibit the ability of an acquirer to amend the bylaws to facilitate an unsolicited takeover attempt; and staggered terms for our directors, which effectively prevents stockholders from electing a majority of the directors at any one annual meeting of stockholders. In addition, as a Delaware corporation, we are subject to Section 203 of the Delaware General Corporation Law. These provisions may prohibit large stockholders, in particular those owning 15% or more of our outstanding voting stock, from merging or combining with us for a certain period of time. We do not anticipate paying any dividends on our common stock. We do not anticipate paying any cash dividends on our common stock in the foreseeable future. If we do not pay cash dividends, you would receive a return on your investment in our common stock only if the market price of our common stock is greater at the time you sell your shares than the market price at the time you bought your shares. Our amended and restated bylaws provide for an exclusive forum in the Court of Chancery of the State of Delaware for certain disputes between us and our stockholders, and the exclusive forum in the Delaware federal courts for the resolution of any complaint asserting a cause of action under the Securities Act, which may limit a stockholder’s ability to bring a claim in a forum a stockholder finds favorable. Our amended and restated bylaws provide that unless the Company consents in writing to the selection of an alternative forum, the Court of Chancery of the State of Delaware will be the sole and exclusive forum for any state law claims for: (i) any derivative action or proceeding brought on behalf of the Company, (ii) any action asserting a claim of, or a claim based on, a breach of a fiduciary duty owed by any director, officer or other employee of the Company to the Company or the Company’s stockholders, (iii) any action asserting a claim arising pursuant to any provision of the Delaware General Corporation Law or the Company’s amended and restated certificate of incorporation or amended and restated bylaws, or (iv) any other action asserting a claim governed by the internal affairs doctrine. The amended and restated bylaws further provide that unless the Company consents in writing to the selection of an alternative forum, the federal district courts of the United States of America will be the sole and exclusive forum for the resolution of any complaint asserting a cause of action arising under the Securities Act and any person or entity purchasing or otherwise acquiring or holding any interest in shares of capital stock of the Company will be deemed to have notice of and consented to these provisions. We believe these provisions may benefit us by providing increased consistency in the application of Delaware law and federal securities laws by chancellors and judges, as applicable, particularly experienced in resolving corporate disputes, efficient administration of cases on a more expedited schedule relative to other forums and protection against the burdens of multi-forum litigation. If a court were to find the choice of forum provision that is contained in our amended and restated bylaws to be inapplicable or unenforceable in an action, we may incur additional costs associated with resolving such action in other jurisdictions, which could materially adversely affect our business, results of operations, and financial condition. For example, Section 22 of the Securities Act provides that state and federal courts have concurrent jurisdiction over claims to enforce any duty or liability created by the Securities Act or the rules and regulations promulgated thereunder. Accordingly, there is uncertainty as to whether a court would enforce such a forum selection provision as written in connection with claims arising under the Securities Act. Because the choice of forum provisions in our amended and restated bylaws may have the effect of severing certain causes of action between federal and state courts, stockholders seeking to assert claims against us or any of our current or former director, officer, other employee, agent, or stockholder, may be discouraged from bringing such claims due to a possibility of increased litigation expenses arising from litigating multiple related claims in two separate courts. The choice of forum provisions may therefore limit a stockholder’s ability to bring a claim in a judicial forum that it finds favorable for disputes with us or any of our current or former director, officer, other employee, agent, or stockholder. Alternatively, if a court were to find the choice of forum provisions contained in our amended and restated bylaws to be inapplicable or unenforceable in an action, we may incur additional costs associated with resolving such action in other jurisdictions, which could harm our business, results of operations, and financial condition. Climate change and climate change policies might affect our business, our industry, and the global economy. We acknowledge the significant challenge presented by climate change, and see our transformational work in developing cost-effective, clean, renewable green hydrogen, and fuel cell energy as part of the solution. Our commitment to sustainability is deeply rooted in our products, mission, core values, and people. However, we acknowledge that climate change will potentially have wide-ranging impacts, including potential impacts to our Company. Unanticipated environmental, societal, economic, or geopolitical effects of climate change might affect business operations. For example, increasingly severe and frequent weather events might disrupt our supply chain or adversely affect our customers. Relatedly, government policies addressing climate change could similarly impact our business operations. We believe that many of these policies will be favorable for our fuel cell systems and hydrogen solutions. However, there is no guarantee that such potential changes in laws, regulations, or policies will be favorable to our Company, to existing or future customers, or to large-scale economic, environmental, or geopolitical conditions. We are firm believers that our fuel cell and hydrogen solutions along with our green hydrogen strategy will play a significant role in helping to get to the scale needed to help stop the substantial damage that may otherwise occur due to the future risks of climate change. Given the global nature of climate change, we all share the responsibility of developing or supporting new methods for generating and using energy that will curb or offset greenhouse gas emissions. Item 1B. Unresolved Staff Comments Not applicable. Item 2. Properties The following table sets forth information regarding our principal operating properties and other significant properties as of December 31, 2022, which we use of our single operating segment. In general, our operating properties are well maintained, suitably equipped, and in good operating condition: | | | | | | | | | | | | | | | | | | | Index | | 2015 | | 2016 | | 2017 | | 2018 | | 2019 | | 2020 | Plug Power Inc. | | $ | 100.00 | | $ | 56.87 | | $ | 111.85 | | $ | 58.77 | | $ | 149.76 | | $ | 1,607.11 | NASDAQ Clean Edge Green Energy Index | | $ | 100.00 | | $ | 96.38 | | $ | 126.05 | | $ | 109.45 | | $ | 152.61 | | $ | 434.93 | Russell 2000 Index | | $ | 100.00 | | $ | 119.48 | | $ | 135.18 | | $ | 118.72 | | $ | 146.15 | | $ | 173.86 |
| | ● | | | | | | | Continent | Location | | Facility | | Size | | Ownership Status | North America | | | | | | | | | New York | | | | | | | | Latham | | Manufacturing and R&D | | 159,000 sq ft | | Lease | | Rochester | | Manufacturing, R&D, & office | | 150,000 sq ft | | Lease | | Latham | | Manufacturing and warehousing | | 27,000 sq ft | | Lease | | Latham - 8BA | | Corporate offices | | 51,438 sq ft | | Lease | | Latham - 6BA | | Office | | 19,100 sq ft | | Lease | | Slingerlands | | Manufacturing and warehousing | | 350,000 sq ft | | Lease | | Washington | | | | | | | | Spokane | | Manufacturing | | 29,200 sq ft | | Lease | | Massachusetts | | | | | | | | Concord | | Manufacturing | | 33,000 sq ft | | Lease | | Ohio | | | | | | | | Dayton | | Service center | | 37,000 sq ft | | Lease | | Illinois | | | | | | | | Romeoville | | Service center | | 13,000 sq ft | | Lease | | Pennsylvania | | | | | | | | Canonsburg | | Office | | 7,600 sq ft | | Lease | | Texas | | | | | | | | Houston | | Manufacturing and office | | 175,000 sq ft | | Lease | | Magnolia | | Manufacturing and office | | 73,000 sq ft | | Lease | | Indiana | | | | | | | | LaFayette | | Manufacturing and office | | 123,000 sq ft | | Own | Europe | | | | | | | | | Netherlands | | | | | | | | Alphen aan den Rijn | | Office | | 30,000 sq ft | | Lease | | Germany | | | | | | | | Duisburg | | Office | | 47,258 sq ft | | Lease | Asia | | | | | | | | | India | | | | | | | | Shivajinagar | | Office | | 35,000 sq ft | | Lease |
See Note 21, “Commitments and Contingencies,” to the consolidated financial statements, Part II, Item 8, Financial Statements and Supplementary Data,” of this Annual Report on Form 10-K for further discussion of the leases. We believe that our facilities are sufficient to accommodate our anticipated production volumes for at least the next two years. Item 3. Legal Proceedings As previously disclosed, several actions were filed in the U.S. District Courts for the Southern District of New York and for the Central District of California asserting claims under the federal securities laws against the Company and two of its senior officers, Mr. Marsh and Mr. Middleton. On July 22, 2021, the court consolidated those actions into In re Plug Power, Inc. Securities Litigation, No. 1:21-cv-2004, pending in the U.S. District Court for the Southern District of New York (the “Securities Action”) and appointed a lead plaintiff. On October 6, 2021, lead plaintiff filed a consolidated amended complaint asserting claims on behalf of a putative class composed of all persons who purchased or otherwise acquired the Company’s securities between November 9, 2020 and March 16, 2021 (the “Amended Complaint”). The Amended Complaint asserted a claim against all defendants for alleged violations of Section 10(b) of the Securities Exchange Act of 1934 (the “Exchange Act”) and Rule 10b-5 promulgated thereunder and a claim under Section 20(a) of the Exchange Act against Mr. Marsh and Mr. Middleton as alleged controlling persons. The Amended Complaint alleged that defendants made “materially false” statements concerning (1) adjusted EBITDA; (2) fuel delivery and research and development expenses; (3) costs related to provision for loss contracts; (4) gross losses; and (5) the effectiveness of internal controls and procedures (the “accounting-related statements”), and that these alleged misstatements caused losses and damages for members of the alleged class. On December 6, 2021, defendants filed a motion to dismiss the Amended Complaint. In an opinion and order entered on September 29, 2022, the court granted defendants’ motion to dismiss the Amended Complaint in its entirety but permitted the lead plaintiff to further amend the complaint. On November 21, 2022, the lead plaintiff filed a second amended complaint purporting to assert claims under the same provisions against the same defendants on behalf of the same alleged class of purchasers of the Company’s securities (the “Second Amended Complaint”). The Second Amended Complaint largely repeated the allegations in the Amended Complaint but, in addition, alleged that various public statements during the alleged class period were false or misleading because they allegedly failed to disclose the status of discussions and considerations relating to warrants to purchase the Company’s common stock that were granted to a customer in connection with a commercial agreement. The defendants filed a motion to dismiss the Second Amended Complaint in its entirety on January 12, 2023. On March 31, 2021, Junwei Liu, an alleged Company stockholder, derivatively and on behalf of nominal defendant Plug, filed a complaint in the U.S. District Court for the Southern District of New York against certain Company directors and officers (the “Derivative Defendants”), captioned Liu v. Marsh et al., Case No. 1:21-cv-02753 (S.D.N.Y.) (the “Liu Derivative Complaint”). The Liu Derivative Complaint alleges that, between November 9, 2020 and March 1, 2021, the Derivative Defendants “made, or caused the Company to make, materially false and misleading statements concerning Plug Power’s business, operations, and prospects” by “issu[ing] positive financial information and optimistic guidance, and made assurances that the Company’s internal controls were effective,” when, “[i]n reality, the Company’s internal controls suffered from material deficiencies that rendered them ineffective.” The Liu Derivative Complaint asserts claims for (1) breach of fiduciary duties, (2) unjust enrichment, (3) abuse of control, (4) gross mismanagement, (5) waste of corporate assets, and (6) contribution under Sections 10(b) and 21D of the Exchange Act (as to the named officer defendants). The Liu Derivative Complaint seeks a judgment “[d]eclaring that Plaintiff may maintain this action on behalf of Plug”; “[d]eclaring that the [Derivative] Defendants have breached and/or aided and abetted the breach of their fiduciary duties”; “awarding to Plug Power the damages sustained by it as a result of the violations” set forth in the Liu Derivative Complaint, “together with pre-judgment and post-judgment interest thereon”; “[d]irecting Plug Power and the [Derivative] Defendants to take all necessary actions to reform and improve Plug Power’s corporate governance and internal procedures to comply with applicable laws”; and “[a]warding Plaintiff the costs and disbursements of this action, including reasonable attorneys’ and experts’ fees, costs, and expenses”; and “[s]uch other and further relief as the [c]ourt may deem just and proper.” On April 5, 2021, alleged Company stockholders Elias Levy and Camerohn X. Withers, derivatively and on behalf of nominal defendant Plug, filed a complaint in the U.S. District Court for the Southern District of New York against the Derivative Defendants named in the Liu Derivative Complaint, captioned Levy et al. v. McNamee et al., Case No. 1:21-cv-02891 (S.D.N.Y.) (the “Levy Derivative Complaint”). The Levy Derivative Complaint alleges that, from November 9, 2020 to April 5, 2021, the Derivative Defendants “breached their duties of loyalty and good faith” by failing to disclose “(1) that the Company would be unable to timely file its 2020 annual report due to delays related to the review of classification of certain costs and the recoverability of the right to use assets with certain leases; (2) that the Company was reasonably likely to report material weaknesses in its internal control over financial reporting; and (3) that, as a result of the foregoing, Defendants’ positive statements about the Company’s business, operations, and prospects were materially misleading and/or lacked a reasonable basis.” The Levy Derivative Complaint asserts claims for (1) breach of fiduciary duty (as to the named director defendants), (2) unjust enrichment (as to certain named director defendants), (3) waste of corporate assets (as to the named director defendants), and (4) violations of Sections 10(b) and 21D of the Exchange Act (as to the named officer defendants). The Levy Derivative Complaint seeks a judgment “declaring that Plaintiffs may maintain this action on behalf of the Company”; finding the Derivative Defendants “liable for breaching their fiduciary duties owed to the Company”; directing the Derivative Defendants “to take all necessary actions to reform and improve the Company’s corporate governance, risk management, and internal operating procedures to comply with applicable laws”; “awarding damages to the Company for the harm the Company suffered as a result of Defendants’ wrongful conduct”; “awarding damages to the Company for [the named officer Derivative Defendants’] violations of Sections 10(b) and 21D of the Exchange Act”; “awarding Plaintiffs the costs and disbursements of this action, including attorneys’, accountants’, and experts’ fees”; and “awarding such other and further relief as is just and equitable.” The Liu Derivative Complaint and the Levy Derivative Complaint have been consolidated in In re Plug Power Derivative Litigation, Lead Case No. 1:21-cv-02753-ER and, by stipulation approved by the Court, the cases have been stayed pending the resolution of the motion to dismiss in the Securities Action. On May 13, 2021, alleged Company stockholder Romario St. Clair, derivatively and on behalf of nominal defendant Plug, filed a complaint in the Supreme Court of the State of New York, County of New York against the Derivative Defendants named in the Liu Derivative Complaint, captioned St. Clair v. Plug Power Inc. et al., Index No. 653167/2021 (N.Y. Sup. Ct., N.Y. Cty.) (the “St. Clair Derivative Complaint”). The St. Clair Derivative Complaint alleges that, for approximately two years from March 13, 2019 onwards, the company made a number of improper statements that “failed to disclose and misrepresented the following material, adverse facts, which the [derivative] defendants knew, consciously disregarded, or were reckless in not knowing”, including: “(a) that the Company was experiencing known but undisclosed material weaknesses in its internal controls over financial reporting; (b) the Company was overstating the carrying amount of certain right of use assets and finance obligations associated with leases; (c) the Company was understating its loss accrual on certain service contracts; (d) the Company would need to take impairment charges relating to certain long-lived assets; (e) the Company was improperly classifying research and development costs versus costs of goods sold; and (f) the Company would be unable to file its annual Report for the 2020 fiscal year due to these errors.” The St. Clair Derivative Complaint asserts claims for (1) breach of fiduciary and (2) unjust enrichment. The St. Clair Derivative Complaint seeks a judgment “for the amount of damages sustained by the Company as a result of the defendants’ breaches of fiduciary duties and unjust enrichment”; “[d]irecting Plug Power to take all necessary actions to reform and improve its corporate governance and internal procedures to comply with applicable laws”;“[e]xtraordinary equitable and/or injunctive relief as permitted by law, equity, and state statutory provisions”; [a]warding to Plug Power restitution from defendants, and each of them, and ordering disgorgement of all profits, benefits, and other compensation obtained by the defendants”; [a]warding to plaintiff the costs and disbursements of the action, including reasonable attorneys’ fees, accountants’ and experts’ fees, costs, and expenses”; and “[g]ranting such other and further relief as the [c]ourt deems just and proper.” By stipulation approved by the Court, the case has been stayed pending the resolution of the motion to dismiss in the Securities Action. On June 13, 2022, alleged Company stockholder Donna Max, derivatively on behalf of the Company as nominal defendant, filed a complaint in the United States District Court for the District of Delaware against the Derivative Defendants named in the Liu Derivative Complaint, captioned Max v. Marsh, et. al., case no. 1:22-cv-00781 (D. Del.) (the “Max Derivative Complaint”). The Max Derivative Complaint alleges that, for the years 2018, 2019 and 2020, the defendants did not “assure that a reliable system of financial controls was in place and functioning effectively”; “failed to disclose errors in the Company's accounting primarily relating to (i) the reported book value of right of use assets and related finance obligations, (ii) loss accruals for certain service contracts, (iii) the impairment of certain long-lived assets, and (iv) the classification of certain expenses previously included in research and development costs”; and that certain defendants traded Company stock at “artificially inflated stock prices.” The Max Derivative Complaint asserts claims for (1) breach of fiduciary against all defendants; (2) breach of fiduciary duty for insider trading against certain defendants; and (3) contribution under Sections 10(b) and 21D of the Exchange Act against certain defendants. The Max Derivative Complaint seeks an award “for the damages sustained by [the Company]” and related relief. By stipulation approved by the Court, the case has been stayed pending the resolution of the motion to dismiss in the Securities Action. On June 29, 2022, alleged Company stockholder Abbas Khambati, derivatively on behalf of the Company as nominal defendant, filed a complaint in the Court of Chancery in the State of Delaware against the Derivative Defendants named in the Liu Derivative Complaint, Mr. Conway and Mr. Schmid, captioned Khambati v. McNamee, et. al., C.A. no. 2022-05691 (Del. Ch.) (the “Khambati Derivative Complaint”). The Khambati Derivative Complaint alleges that the defendants “deceive[d] the investing public, including stockholders of Plug Power, regarding the Individual Defendants’ management of Plug Power’s operations and the Company’s compliance with the SEC's accounting rules”; “facilitate[d” certain defendants’ sales of “their personally held shares while in possession of material, nonpublic information”; and “enhance[d] the Individual Defendants’ executive and directorial positions at Plug Power and the profits, power, and prestige that the Individual Defendants enjoyed as a result of holding these positions.” The Khambati Derivative Complaint asserts claims for (1) breach of fiduciary; and (2) disgorgement and unjust enrichment. The Khambati Derivative Complaint seeks an award “for the damages sustained by [the Company] as a result of the breaches” alleged or “disgorgement or restitution”; “disgorgement of insider trading profits” and “all profits, benefits and other compensation obtained by [defendants’] insider trading and further profits flowing therefrom”; an order “[d]irecting the Company to take all necessary actions to reform and improve its corporate governance and internal procedures”; and related relief. On July 19, 2022, alleged Company stockholder Anne D. Graziano, as Trustee of the Anne D. Graziano Revocable Living Trust, derivatively on behalf of the Company as nominal defendant, filed a complaint in the Court of Chancery in the State of Delaware against the derivative defendants named in the Khambati Derivative Complaint, captioned Graziano v. Marsh, et. al., C.A. no. 2022-0629 (Del. Ch.) (the “Graziano Derivative Complaint”). The Graziano Derivative Complaint alleges that the director defendants (i) “either knowingly or recklessly issued or caused the Company to issue the materially false and misleading statements” concerning “certain critical accounting issues”; (ii) “willfully ignored, or recklessly failed to inform themselves of, the obvious problems with the Company’s internal controls, practices, and procedures, and failed to make a good faith effort to correct the problems or prevent their recurrence”; (iii) the members of the Audit Committee failed “to prevent, correct, or inform the Board of the issuance of material misstatements and omissions regarding critical accounting issues and the adequacy of the Company’s internal controls”; (iv) “received payments, benefits, stock options, and other emoluments by virtue of their membership on the Board and their control of the Company”; (v) violated the Company’s Code of Conduct because they knowingly or recklessly engaged in and participated in making and/or causing the Company to make the materially false and misleading statements; and (vi) certain defendants “sold large amounts of Company stock while it was trading at artificially inflated prices.” The Graziano Derivative Complaint asserts claims for (1) breach of fiduciary; (2) breach of fiduciary duty against certain defendants for insider trading; (3) unjust enrichment; (4) aiding and abetting breach of fiduciary duty; and (5) waste of corporate assets. The Graziano Derivative Complaint seeks an award of “the amount of damages sustained by the Company”; seeks an order “[d]irecting Plug Power to take all necessary actions to reform and improve its corporate governance and internal procedures to comply with applicable laws and to protect Plug Power and its stockholders from a repeat of the damaging events described herein”; and related relief. The parties to the Graziano Derivative Complaint and Khambati Derivative Complaint have been consolidated in In re Plug Power, Inc. Stockholder Derivative Litigation, Consolidated C.A. No. 2022-0569 and, by stipulation approved by the Court, the cases have been stayed pending the resolution of the motion to dismiss in the Securities Action. As previously disclosed, on August 28, 2018, a lawsuit was filed on behalf of multiple individuals against the Company and five corporate co-defendants in the 9th Judicial District Court, Rapides Parish, Louisiana. The lawsuit relates to the previously disclosed May 2018 accident involving a forklift powered by the Company’s fuel cell at a Procter & Gamble facility in Louisiana. The lawsuit alleges claims against the Company and co-defendants, including Structural Composites Industries, Deep South Equipment Co., Air Products and Chemicals, Inc., Westport Power, Inc., Quality Thermistor, Inc. and Hyster-Yale Group, Inc. for claims under the Louisiana Product Liability Act (“LPLA”) including defect in construction and/or composition, design defect, inadequate warning, breach of express warranty and negligence for wrongful death and personal injuries, among other damages. Procter & Gamble intervened in that suit to recover worker’s compensation benefits paid to or for the employees/dependents. In April 2022, Plug reached a settlement with respect to the individual plaintiffs on terms well below the Company’s commercial liability insurance limits. Procter & Gamble also filed suit in the Louisiana 9th Judicial District Court for property damage, business interruption, loss of revenue, expenses, and other damages. Procter & Gamble alleges theories under the LPLA, breach of warranty and quasi-contractual claims under Louisiana law. Defendants include the Company and several of the same co-defendants from the August 2018 lawsuit, including Structural Composites Industries, Deep South Equipment Co., Hyster-Yale Group, Inc. and and Westport Power, Inc. The Company has filed a lawsuit against Structural Composites Industries, LLC, Worthington Industries, Inc. and Worthington Cylinder Corp. in the Supreme Court of Albany County, New York, related to the replacement of hydrogen storage tanks of the same model that was involved in the May 2018 accident at the Procter & Gamble facility in Louisiana. Structural Composites Industries, LLC, Worthington Industries, Inc. and Worthington Cylinder Corp. have filed a counterclaim suit, also arising out of the replacement of the tanks they manufactured. The Company continues to vigorously litigate the remaining lawsuits against Proctor & Gamble in Louisiana, and against Structural Composites Industries, LLC, Worthington Industries, Inc. and Worthington Cylinder Corp. in New York. Item 4. Mine Safety Disclosures Not applicable. PART II Item 5. Market for Registrant’s Common Equity, Related Stockholder Matters and Issuer Purchases of Equity Securities Market Information and Holders of Record. Our common stock is traded on the NASDAQ Capital Market under the symbol “PLUG.” As of February 17, 2023, there were approximately 814,679 record holders of our common stock. However, management believes that a significant number of shares are held by brokers in “street name” and that the number of beneficial stockholders of our common stock exceeds 901. Dividend Policy. We have never declared or paid cash dividends on our common stock and do not anticipate paying cash dividends in the foreseeable future. Any future determination as to the payment of dividends will depend upon capital requirements and limitations imposed by our credit agreements, if any, and such other factors as our Board may consider. Five-Year Performance Graph. Below is a line graph comparing the percentage change in the cumulative total return of the Company’s common stock, based on the market price of the Company’s common stock, with the total return of companies included within the NASDAQ Clean Edge Green Energy Index (“CELS Index”) and the companies included within the Russell 2000 Index (“RUT Index”) for the period commencing December 31, 2017 and ending December 31, 2022. The calculation of the cumulative total return assumes a $100 investment in the Company’s common stock, the CELS Index and the RUT Index on December 31, 2017 and the reinvestment of all dividends, if any.
Index | 2017 | 2018 | 2019 | 2020 | 2021 | 2022 | Plug Power Inc. | $ 100.00 | $ 52.54 | $ 133.90 | $ 1,436.86 | $ 1,196.19 | $ 524.15 | NASDAQ Clean Edge Green Energy Index | $ 100.00 | $ 86.83 | $ 121.07 | $ 345.03 | $ 334.51 | $ 224.35 | Russell 2000 Index | $ 100.00 | $ 87.82 | $ 108.11 | $ 128.61 | $ 146.21 | $ 114.70 |
| ● | This graph above and the accompanying text are not “soliciting material,” are not deemed filed with the SEC and are not to be incorporated by reference in any filing by us under the Securities Act or the Exchange Act, whether made before or after the date hereof and irrespective of any general incorporation language in any such filing. |
| ● | The stock price performance shown on the graph is not necessarily indicative of future price performance. |
| ● | Assuming the investment of $100 on December 31, 2015 and the reinvestment of dividends. The common stock price performance shown on the graph only reflects the change in our company’s common stock price relative to the noted indices and is not necessarily indicative of future price performance. |
Executive Compensation Program
Our goal is to retain and attract experienced and talented executive officers and to motivate them to achieve our short-term and long-term financial, operational and strategic objectives that produce and promote stockholder value. To achieve this goal, we strongly emphasize a culture of pay for performance in order to provide incentives and accountability for our executive officers in working toward the achievement of our objectives. Accordingly, we have designed our incentive compensation programs with the goal of ensuring that actual pay varies above or below targeted compensation
opportunity based
| ● | Assuming the investment of $100 on achievementDecember 31, 2017 and the reinvestment of challengingdividends. The common stock price performance goalsshown on the graph only reflects the change in our company’s common stock price relative to the noted indices and demonstrationis not necessarily indicative of meaningful individual commitmentfuture price performance. |
Item 6. [Reserved] Not applicable. Item 7. Management’s Discussion and Analysis of Financial Condition and Results of Operations The discussion contained in this Form 10-K contains “forward-looking statements” within the meaning of Section 27A of the Securities Act and Section 21E of the Exchange Act, that involve risks and uncertainties. Our actual results could differ materially from those discussed in this Annual Report on Form 10-K. In evaluating these statements, you should review Part I, Forward-Looking Statements, Part I, Item 1A, “Risk Factors” and our consolidated financial statements and notes thereto included in Part II, Item 8, “Financial Statements and Supplementary Data,” of this Annual Report on Form 10-K. Information pertaining to fiscal year 2020 was included in the Company’s Annual Report on Form 10-K for the year ended December 31, 2020 on page 36 under Part II, Item 7, “Management’s Discussion and Analysis of Financial Position and Results of Operations,” which was filed with the SEC on May 14, 2021, as amended by the Amendment to the Annual Report on Form 10-K for the year ended December 31, 2020, which was filed with the SEC on March 14, 2022. Overview Plug is facilitating the paradigm shift to an increasingly electrified world by innovating cutting-edge hydrogen and fuel cell solutions. While we continue to develop commercially viable hydrogen and fuel cell product solutions, we have expanded our offerings to support a variety of commercial operations that can be powered with green hydrogen. We provide electrolyzers that allow customers — such as refineries, producers of chemicals, steel, fertilizer and commercial refueling stations — to generate hydrogen on-site. We are focusing our efforts on (a) industrial mobility applications, including electric forklifts and electric industrial vehicles, at multi-shift high volume manufacturing and high throughput distribution sites where we believe our products and services provide a unique combination of productivity, flexibility, and environmental benefits; (b) stationary power systems that will support critical operations, such as data centers, microgrids, and generation facilities, in either a backup power or continuous power role and replace batteries, diesel generators or the grid for telecommunication logistics, transportation, and utility customers; and (c) production of hydrogen. Plug expects to support these products and customers with an ecosystem of vertically integrated products that produce, transport, store and handle, dispense, and use hydrogen for mobility and power applications. Our current products and services include: GenDrive: GenDrive is our hydrogen fueled Proton Exchange Membrane (“PEM”) fuel cell system, providing power to material handling electric vehicles, including Class 1, 2, 3, and 6 electric forklifts, Automated Guided Vehicles (“AGVs”), and ground support equipment. GenFuel: GenFuel is our liquid hydrogen fueling delivery, generation, storage, and dispensing system. GenCare: GenCare is our ongoing “Internet of Things”-based maintenance and on-site service program for GenDrive fuel cell systems, GenSure fuel cell systems, GenFuel hydrogen storage and dispensing products and ProGen fuel cell engines. GenSure: GenSure is our stationary fuel cell solution providing scalable, modular PEM fuel cell power to support the backup and grid-support power requirements of the telecommunications, transportation, and utility sectors; GenSure High Power Fuel Cell Platform will support large scale stationary power and data center markets. GenKey: GenKey is our vertically integrated “turn-key” solution combining either GenDrive or GenSure fuel cell power with GenFuel fuel and GenCare aftermarket service, offering complete simplicity to customers transitioning to fuel cell power. ProGen: ProGen is our fuel cell stack and engine technology currently used globally in mobility and stationary fuel cell systems, and as engines in electric delivery vans. This includes Plug’s membrane electrode assembly (“MEA”), a critical component of the fuel cell stack used in zero-emission fuel cell electric vehicle engines. Liquefaction Systems: Plug’s 15 ton-per-day and 30 ton-per-day liquefiers are engineered for high efficiency, reliability, and operational flexibility — providing consistent liquid hydrogen to customers. This design increases plant reliability and availability while minimizing parasitic losses like heat leak and seal gas losses. Electrolyzers: 5 and 10 MW electrolyzer systems that are modular, scalable hydrogen generators optimized for clean hydrogen production. Electrolyzers generate hydrogen from water using electricity and a special membrane and “green” hydrogen is generated by using renewable energy inputs, such as solar or wind power. Cryogenic Equipment: Engineered equipment including trailers and mobile storage equipment for the distribution of liquified hydrogen, oxygen, argon, nitrogen and other cryogenic gases. We provide our products and solutions worldwide through our direct sales force, and by leveraging relationships with original equipment manufacturers (“OEMs”) and their dealer networks. Plug is currently targeting Asia, Europe, Middle East, and North America for expansion in adoption. The European Union has rolled out ambitious targets for the hydrogen economy and Plug is seeking to execute on its strategy to become one of the European leaders in the hydrogen economy. This includes a targeted account strategy for material handling, securing strategic partnerships with European OEMs, energy companies, utility leaders, and accelerating our electrolyzer business. Our global strategy includes leveraging a network of integrators or contract manufacturers. We manufacture our commercially viable products in Latham, New York, Rochester, New York, Slingerlands, New York, Houston, Texas, and Spokane, Washington and support liquid hydrogen generation and logistics in Charleston, Tennessee. Part of our long-term plan includes Plug penetrating the European and Asian hydrogen market, on-road vehicle market, and large-scale stationary market. Plug’s formation of joint ventures with HyVia and AccionaPlug S.L. in Europe and SK Plug Hyverse, in Asia not only support this goal but are expected to provide us with a more global footprint. Plug has been successful with acquisitions, strategic partnerships and joint ventures, and we plan to continue this mix. COVID-19 Update While we no longer enforce our prior COVID-19 policies with respect to weekly COVID-19 testing, face coverings, or daily COVID-19 questionnaires, we continue to monitor the COVID-19 pandemic and emerging variants, and remain prepared to adjust our policies and safety protocols in line with guidance from state and federal agencies. Employees are still expected to remain home if they are not feeling well and should contact our COVID team for future guidance. Furthermore, we have resumed all commercial air travel and all other non-critical travel, while also allowing employees to resume their personal travel. We have enabled third-party access to our facilities, and are continuing our normal janitorial and sanitary procedures. We are no longer requiring staggered shifts in our manufacturing facilities and are offering hybrid work schedules to those whose job function enables them to do so. The COVID-19 pandemic has caused significant transportation challenges for global suppliers and we expect that these challenges will continue to have an impact on our businesses for the foreseeable future. We continue to take proactive steps to limit the impact of these challenges and are working closely with our suppliers and transportation vendors to ensure availability of products and implement other cost savings initiatives. In addition, we continue to invest in our supply chain to improve its resilience with a focus on automation, dual sourcing of critical components and localized manufacturing when feasible. To date, there has been limited disruption to the availability of our products related to COVID-19, although the Company has experienced supply chain-related delays for components of product lines and hydrogen generation projects. It is possible that more significant disruptions could occur if these supply chain challenges continue. Strategic Investments On December 5, 2022, the Company and its wholly-owned subsidiary Plug Power Hydrogen Holdings, Inc. simultaneously entered into a definitive agreement and closed on the acquisition of two subsidiaries of Cryogenic Industrial Solutions, LLC, which are Alloy Custom Products, LLC and WesMor Cryogenics, LLC. The purchase was approximately $37.3 million, comprised of a mix of cash and the Company’s common stock, to bolster the cryogenic tanker and storage tank business. On January 14, 2022, Company and its wholly-owned subsidiary Plug Power Hydrogen Holdings, Inc. simultaneously entered into a definitive agreement and closed on the acquisition of Joule for a purchase price of approximately $69.9 million, of which $41.7 million will be based on future earnouts over the next four years. Joule is an engineered modular equipment, process design and procurement company founded in 2009 with a strong track record among the largest midstream, EPC, and oil & gas companies. Inflation, Material Availability, and Labor Shortages Throughout 2022, we continued to experience higher than expected commodity costs and supply chain costs, including logistics, procurement, manufacturing costs, energy and fuel costs, largely due to inflationary pressures. We expect this cost inflation to remain elevated through 2023. Our operations require significant amounts of necessary parts and raw materials. From time to time, the Company has encountered difficulties in obtaining certain raw materials or components necessary for production due to supply chain constraints and logistical challenges, which has also negatively impacted the pricing of materials and components sourced or used by the Company. Increased energy costs have negatively impacted margins. Additionally, conflicts abroad, such as the Russia-Ukraine conflict, may potentially contribute to issues related to supply chain disruptions and inflation impacts. There have been supply chain and logistical challenges that have resulted in supply constraints and commodity price increases on certain raw materials, and components used by the Company in production, as well as increased prices for freight and logistics, including air, sea and ground freight. Consequently, the Company has experienced supply shortages for certain raw materials or components, which could be further exacerbated by increased commodity prices as a result of additional inflationary pressures. Although we have offset a portion of these increased costs through price increases and operational efficiencies to date, there can be no assurance that we will be able to continue to do so. If we are unable to manage fluctuations through pricing actions, cost savings projects, and sourcing decisions as well as through productivity improvements, it may adversely impact our gross margins in future periods. Additionally, we have observed an increasingly competitive labor market. Tight labor markets have resulted in labor inflation and longer times to fill open positions. Increased employee turnover, changes in the availability of our workers, including as a result of COVID-19-related absences, and labor shortages in our supply chain have resulted in, and could continue to result in, increased costs which could negatively affect our financial condition, results of operations, or cash flows. Results of Operations Our primary sources of revenue are from sales of fuel cell systems, related infrastructure and equipment, services performed on fuel cell systems and related infrastructure, Power Purchase Agreements (PPAs), and fuel delivered to customers. A certain portion of our sales result from acquisitions in legacy markets, which we are working to transition to renewable solutions. Revenue from sales of fuel cell systems, related infrastructure and equipment represents sales of our GenDrive units, GenSure stationary backup power units, cryogenic stationary and on road storage, electrolyzers and hydrogen fueling infrastructure. Revenue from services performed on fuel cell systems and related infrastructure represents revenue earned on our service and maintenance contracts and sales of spare parts. Revenue from PPAs primarily represents payments received from customers who make monthly payments to access the Company’s GenKey solution. Revenue associated with fuel delivered to customers represents the sale of hydrogen to customers that has been purchased by the Company from a third party or generated on site. Provision for Common Stock Warrants On August 24, 2022, the Company and Amazon entered into the 2022 Transaction Agreement, under which the Company concurrently issued to Amazon.com NV Investment Holdings LLC, a wholly owned subsidiary of Amazon, the Amazon Warrant, to acquire the Amazon Warrant Shares, subject to certain vesting events described below. The Company and Amazon entered into the 2022 Transaction Agreement in connection with a concurrent commercial arrangement under which Amazon agreed to purchase hydrogen fuel from the Company through August 24, 2029. In 2017, in separate transactions, the Company issued to each of Amazon.com NV Investment Holdings LLC and Walmart, Inc. (“Walmart”) warrants to purchase shares of the Company’s common stock. The Company recorded a portion of the estimated fair value of the warrants as a reduction of revenue based upon the projected number of shares of common stock expected to vest under the warrants, the proportion of purchases by Amazon, Walmart and their affiliates within the period relative to the aggregate purchase levels required for vesting of the respective warrants, and the then-current fair value of the warrants. For the third tranche of the shares under Walmart’s warrant, the exercise price will be determined once the second tranche vests. For the third tranche of the Amazon Warrant Shares, see below for the exercise price and measurement dates used. The amount of provision for common stock warrants recorded as a reduction of revenue during the years ended December 31, 2022 and 2021 respectively, is shown in the table below (in thousands): | | | | | | | | | Year Ended December 31, | | | 2022 | | 2021 | | | | | | | | Sales of fuel cell systems, related infrastructure and equipment | | $ | (3,580) | | $ | — | Services performed on fuel cell systems and related infrastructure | | | (1,003) | | | (497) | Power purchase agreements | | | (3,611) | | | (3,444) | Fuel delivered to customers | | | (4,489) | | | (2,625) | Total | | $ | (12,683) | | $ | (6,566) |
Net revenue, cost of revenue, gross profit/(loss) and gross margin for the years ended December 31, 2022 and 2021 were as follows (in thousands): | | | | | | | | | | | | | | | | | | | | | | | | | | | | Cost of | | Gross | | Gross | | | Net Revenue | | Revenue | | Profit/(Loss) | | Margin | | For the year ended December 31, 2022: | | | | | | | | | | | | Sales of fuel cell systems, related infrastructure and equipment | $ | 558,932 | | $ | 468,057 | | $ | 90,875 | | 16.3 | % | Services performed on fuel cell systems and related infrastructure | | 35,280 | | | 59,365 | | | (24,085) | | (68.3) | % | Provision for loss contracts related to service | | — | | | 26,801 | | | (26,801) | | N/A | | Power purchase agreements | | 47,183 | | | 144,696 | | | (97,513) | | (206.7) | % | Fuel delivered to customers and related equipment | | 57,196 | | | 194,255 | | | (137,059) | | (239.6) | % | Other | | 2,849 | | | 2,622 | | | 227 | | 8.0 | % | Total | $ | 701,440 | | $ | 895,796 | | $ | (194,356) | | (27.7) | % | For the year ended December 31, 2021: | | | | | | | | | | | | Sales of fuel cell systems, related infrastructure and equipment | $ | 392,777 | | $ | 307,157 | | $ | 85,620 | | 21.8 | % | Services performed on fuel cell systems and related infrastructure | | 26,706 | | | 63,729 | | | (37,023) | | (138.6) | % | Provision for loss contracts related to service | | — | | | 71,988 | | | (71,988) | | N/A | | Power purchase agreements | | 35,153 | | | 102,417 | | | (67,264) | | (191.3) | % | Fuel delivered to customers and related equipment | | 46,917 | | | 127,196 | | | (80,279) | | (171.1) | % | Other | | 789 | | | 1,165 | | | (376) | | (47.7) | % | Total | $ | 502,342 | | $ | 673,652 | | $ | (171,310) | | (34.1) | % |
Net Revenue Revenue —sales of fuel cell systems, related infrastructure and equipment. Revenue from sales of fuel cell systems, related infrastructure and equipment represents sales of our GenDrive units, GenSure stationary backup power units, cryogenic stationary and on road storage, electrolyzers and hydrogen fueling infrastructure referred to at the site level as hydrogen installations.Revenue from sales of fuel cell systems, related infrastructure and equipment for the year ended December 31, 2022 increased $166.2 million, or 42.3%, to $558.9 million from $392.8 million for the year ended December 31, 2021. The total revenue generated by Applied Cryo Technologies (“ACT”) and Frames was approximately $141.0 million and $15.8 million for the year ended December 31, 2022 and 2021, respectively. A certain portion of our sales of engineered equipment from legacy oil and gas orders are from the Frames acquisition and are not expected to continue beyond current commitments. The total revenue generated by Joule and CIS was approximately $40.2 million for the year ended December 31, 2022. There was no revenue in 2021 related to the Joule and CIS acquisitions. Recorded as a reduction of revenue was a provision for common stock warrants of $3.6 million and $0 for the years ended December 31, 2022 and 2021, respectively. Revenue for GenDrive units decreased, as there were 8,274 GenDrive units recognized as revenue in 2022, as compared to 12,806 in 2021. Revenue for hydrogen infrastructure increased due primarily to mix of customers, as there were there were 44 hydrogen fueling infrastructure sites recognized as revenue during the year ended December 31, 2022, as compared to 49 in 2021. Revenue — services performed on fuel cell systems and related infrastructure. Revenue from services performed on fuel cell systems and related infrastructure represents revenue earned on our service and maintenance contracts and sales of spare parts. Revenue from services performed on fuel cell systems and related infrastructure for the year ended December 31, 2022 increased $8.6 million, or 32.1%, to $35.3 million from $26.7 million for the year ended December 31, 2021. Recorded as a reduction of revenue from services was provision for common stock warrants of $1.0 million and $0.5 million for the years ended December 31, 2022 and 2021, respectively. The increase in revenue from services performed on fuel cell systems and related infrastructure in 2022 was related to our expanding customer base and increase in the number of GenDrive units and infrastructure systems in service. The average number of GenDrive units under maintenance contracts during the year ended December 31, 2022 was 19,515, compared to 16,987 in 2021. Revenue — Power Purchase Agreements. Revenue from PPAs represents payments received from customers for power generated through the provision of equipment and service. Revenue from PPAs for the year ended December 31, 2022 increased $12.0 million, or 34.2%, to $47.2 million from $35.2 million for the year ended December 31, 2021. Recorded as a reduction of revenue was provision for common stock warrants of $3.6 million and $3.4 million for the years ended December 31, 2022 and 2021, respectively. The increase in revenue was a result of an increase in the average number of units and customer sites party to these agreements. There was an average of 25,188 units under PPAs generating revenue in 2022, compared to 19,370 in 2021. The average number of sites under PPA arrangements was 91 in 2022, compared to 61 in 2021. Revenue — fuel delivered to customers and related equipment. Revenue associated with fuel and related equipment delivered to customers represents the sale of hydrogen that has been purchased by the Company from a third party or generated on site. Revenue associated with fuel delivered to customers for the year ended December 31, 2022 increased $10.3 million, or 21.9%, to $57.2 million from $46.9 million for the year ended December 31, 2021. Recorded as a reduction of revenue was provision for common stock warrants of $4.5 million and $2.6 million for the years ended December 31, 2022 and 2021, respectively. In addition, there were 196 sites associated with fuel contracts at December 31, 2022, compared to 152 at December 31, 2021. While there has been an increase in the number of sites associated with fuel contracts, the full hydrogen supply will not commence until distribution centers are utilized at capacity. This is consistent with the increased sales of fuel cell systems, related infrastructure and equipment sales as well as increases in the level of deployment of PPA sites. Cost of Revenue Cost of revenue — sales of fuel cell systems, related infrastructure and equipment. Cost of revenue from sales of fuel cell systems, related infrastructure and equipment includes direct materials, labor costs, and allocated overhead costs related to the manufacture of our fuel cells such as GenDrive units and GenSure stationary back-up power units, cryogenic stationary and on road storage, and electrolyzers, as well as hydrogen fueling infrastructure referred to at the site level as hydrogen installations. Cost of revenue from sales of fuel cell systems, related infrastructure and equipment for the year ended December 31, 2022 increased $160.9 million, or 52.4%, to $468.1 million, compared to $307.2 million for the year ended December 31, 2021. This increase was primarily due to costs incurred by Applied Cryo, Joule, Frames, and CIS of $147.3 million, all of which were recent acquisitions by the Company. These costs were incremental in 2022 as these acquisitions occurred in the fourth quarter of 2021, the first quarter of 2022 or fourth quarter of 2022. There were 8,274 GenDrive units recognized as revenue during the year ended December 31, 2022, compared to 12,806 for the year ended December 31, 2021. There were 44 sites associated with hydrogen fueling infrastructure revenue for the year ended December 31, 2022 compared to 49 for the year ended December 31, 2021. The gross margin generated from sales of fuel cell systems, related infrastructure and equipment was 16.3% for the year ended December 31, 2022, compared to 21.8% for the year ended December 31, 2021, primarily due to: (i) increased material cost largely due to inflationary pressures, and higher labor costs given an increasingly competitive labor market and COVID-19 related staffing and coverage issues; and (ii) the margin on the equipment revenue from certain recently acquired businesses being lower than our historical equipment margins given the focus on integrating and scaling these new businesses. Cost of revenue — services performed on fuel cell systems and related infrastructure. Cost of revenue from services performed on fuel cell systems and related infrastructure includes the labor, material costs and allocated overhead costs incurred for our product service and hydrogen site maintenance contracts and spare parts. Cost of revenue from services performed on fuel cell systems and related infrastructure for the year ended December 31, 2022 decreased $4.4 million, or 6.8%, from $63.7 million for the year ended December 31, 2021 to $59.4 million for the year ended December 31, 2022. There were 19,515 units under maintenance contracts generating revenue during the year ended December 31, 2022, compared to 16,987 for the year ended December 31, 2021, on average. Gross loss decreased to (68.3%) for the year ended December 31, 2022 compared to (138.6)% for the year ended December 31, 2021. Cost of revenue and gross loss both decreased, primarily due to an increase in the release of loss accrual during 2022. Cost of revenue — provision for loss accrual. The Company recorded a provision for loss accrual during 2022 of $26.8 million, a decrease of $45.1 million over the provision for loss accrual of $72.0 million in 2021. The increased level of provision in 2021 was driven primarily by an increase in estimated projected costs to service units and an increase in the number of service contracts in 2021. The same level of increase in projected costs did not occur in 2022, as the Company has progressed on certain cost down initiatives. While the provision was lower in 2022 compared to 2021, the provision was slightly higher than expectations due to varied delays in reliability investment deployments. Cost of revenue — Power Purchase Agreements. Cost of revenue from PPAs includes depreciation of assets utilized and service costs to fulfill PPA obligations and interest costs associated with certain financial institutions for leased equipment. Cost of revenue from PPAs for the year ended December 31, 2022 increased $42.3 million, or 41.3%, to $144.7 million from $102.4 million for the year ended December 31, 2021. The increase in cost was primarily a result of an increase in the average number of units and customer sites party to these agreements. There was an average of 25,188 units under PPAs in 2022, compared to 19,370 in 2021. The average number of sites under PPA arrangements was 91 in 2022, compared to 61 in 2021. Gross loss increased to (206.7%) for the year ended December 31, 2022 compared to (191.3)% for the year ended December 31, 2021. In addition to volume, other unfavorable cost drivers included inflation and COVID-19 related issues, such as increased part costs and freight charges. Cost of revenue — fuel delivered to customers and related equipment. Cost of revenue from fuel delivered to customers and related equipment represents the purchase of hydrogen from suppliers and internally produced hydrogen that is ultimately sold to customers. Cost of revenue from fuel delivered to customers for the year ended December 31, 2022 increased $67.1 million, or 52.7%, to $194.3 million from $127.2 million for the year ended December 31, 2021. The increase was due primarily to higher volume of liquid hydrogen delivered to customer sites as a result of an increase in the number of hydrogen installations completed under GenKey agreements and higher fuel costs driven by the impact of higher natural gas prices and varied third-party vendor force majeure issues. There were 196 sites associated with fuel contracts at December 31, 2022, compared to 152 at December 31, 2021. Gross loss increased to (239.6%) during the year ended December 31, 2022 compared to (171.1)% during the year ended December 31, 2021, primarily due to the increase in cost of revenue described above, as well as a reduction of revenue resulting from an increase in the provision for common stock warrants of $4.5 million and $2.6 million for the year ended December 31, 2022 and 2021, respectively. Expenses Research and development expense. Research and development expense includes: materials to build development and prototype units, cash and non-cash compensation and benefits for the engineering and related staff, expenses for contract engineers, fees paid to consultants for services provided, materials and supplies consumed, facility related costs such as computer and network services, and other general overhead costs associated with our research and development activities. Research and development expense for the year ended December 31, 2022 increased $34.8 million, or 53.8%, to $99.6 million from $64.8 million for the year ended December 31, 2021. The overall growth in R&D investment is commensurate with the Company’s future expansion into new markets, new product lines, and varied vertical integrations. Selling, general and administrative expenses. Selling, general and administrative expenses includes cash and non-cash compensation, benefits, amortization of intangible assets and related costs in support of our general corporate functions, including general management, finance and accounting, human resources, selling and marketing, information technology and legal services. Selling, general and administrative expenses for the year ended December 31, 2022 increased $184.1 million, or 102.3%, to $363.9 million from $179.9 million for the year ended December 31, 2021. This increase was primarily related to increases in stock-based compensation of $91.7 million, as well as compensation expenses related to headcount increases and branding expenses. Impairment of long-lived assets. The Company recorded an impairment of $5.2 million for the year ended December 31, 2022, as compared to $10.2 million for the year ended December 31, 2021. The impairment of long-lived assets in both years was primarily related to right of use assets and equipment related to delivery of fuel to customers. Change in fair value of contingent consideration. The fair value of the contingent consideration is related to earnouts for the Giner ELX, Inc., United Hydrogen Group Inc, Frames, Applied Cryo, and Joule acquisitions. The change in fair value for the year ended December 31, 2022 and 2021 was $16.5 million and $11.2 million, respectively, primarily due to fair value remeasurements. Interest income. Interest income primarily consists of income generated by our investment holdings, restricted cash escrow accounts, and money market accounts. Interest income for the year ended December 31, 2022, increased $33.2 million or 822.3%, as compared to the year ended December 31, 2021, and was due to an increase in available-for-sale securities during 2021 consisting primarily of corporate bonds and U.S. Treasuries. Interest expense. Interest expense consists of interest expense related to our long-term debt, convertible senior notes, obligations under finance leases and our finance obligations. Interest expense for the year ended December 31, 2022, decreased $4.2 million, as compared to the year ended December 31, 2021. Other expense, net. Other expense, net consists of other expenses related to our foreign currency exchange losses, offset by interest and other income. Other expense, net increased $1.5 million for the year ended December 31, 2022 in comparison to 2021. Realized loss on investments, net. Realized loss on investments, net consists of the sales related to available-for-sale debt securities. For the year ended December 31, 2022, the Company had $1.4 million of net realized loss on investments as compared to $0.1 million for the year ended December 31, 2021. Change in fair value of equity securities. Change in fair value of equity securities consists of the changes in fair value for equity securities from the purchase date to the end of the period. For the year ended December 31, 2022, the Company had $18.2 million of decrease in fair value of equity securities as compared to an increase in fair value $6.7 million for the year ended December 31, 2021. Loss on equity method investments. Loss on equity method investments consists of our interest in HyVia, which is our 50/50 joint venture with Renault, AccionaPlug S.L., which is our 50/50 joint venture with Acciona, and SK Plug Hyverse, which is our 49/51 joint venture with SK E&S. For the year ended December 31, 2022, the Company recorded a loss of $20.2 million on equity method investments. These losses are driven from the start-up activities for commercial and production operations. Income Tax The Company recognized an income tax expense for the year ended December 31, 2022 of $0.8 million related to foreign current and deferred tax expense of $1.7 million and the $0.9 million reversal of U.S. net deferred tax liabilities in connection with the acquisition of Giner ELX, Inc. The Company has not changed its overall conclusion with respect to the need for a valuation allowance against its net deferred tax assets, which remain fully reserved within the United States and foreign jurisdictions, with the exception of the Netherlands. The net deferred tax asset generated from the Company’s current period NOL has been offset by a full valuation allowance because it is more likely than not that the tax benefits of the NOL carry forward will not be realized. The Company recognizes interest and penalties on the Interest and other expense, net line in the accompanying consolidated statements of operations. The Company recognized an income tax benefit for the year ended December 31, 2021 of $16.2 million primarily related to the recognition of net deferred tax liabilities in connection with the acquisition of Applied Cryo. This resulted in a corresponding reduction in our deferred tax asset valuation allowance. The Company has not changed its overall conclusion with respect to the need for a valuation allowance against its net deferred tax assets, which remain fully reserved. Liquidity and Capital Resources As of December 31, 2022, the Company had $690.6 million of cash and cash equivalents, $858.7 million of restricted cash, $1.3 billion of available-for-sale securities and $134.8 million of equity securities. The Company has continued to experience negative cash flows from operations and net losses. The Company incurred net losses attributable to common stockholders of $724.0 million, $460.0 million and $596.2 million for the years ended December 31, 2022, 2021, and 2020, respectively. The net cash (used) in operating activities for the year ended December 31, 2022, 2021, and 2020 was $828.6 million, $358.2 million, and $155.5 million, respectively. The Company’s working capital was $2.7 billion at December 31, 2022, which included cash and cash equivalents of $690.6 million and restricted cash of $159.0 million. The Company plans to invest a portion of its available cash to expand its current production and manufacturing capacity, construction of hydrogen plants and to fund strategic acquisitions and partnerships, and capital projects. Future use of the Company’s funds is discretionary and the Company believes that its working capital and cash position will be sufficient to fund its operations for at least one year after the date the financial statements are issued. The net cash used in investing activities for the year ended December 31, 2022, 2021, and 2020 was $679.4 million, $1.7 billion, and $95.4 million, respectively. This included purchases of property, plant and equipment and outflows associated with materials, labor, and overhead necessary to construct new leased property. Cash outflows related to equipment that we lease directly to customers are included in net cash used in investing activities. The net cash (used in) provided by financing activities for the year ended December 31, 2022, 2021, and 2020 was ($77.5) million, $3.6 billion, and $1.5 billion, respectively. The change was primarily driven by proceeds from public and private offerings, net of transaction costs that occurred in 2021. The Company’s significant obligations consisted of the following as of December 31, 2022: | ● | Operating and contribution. | | 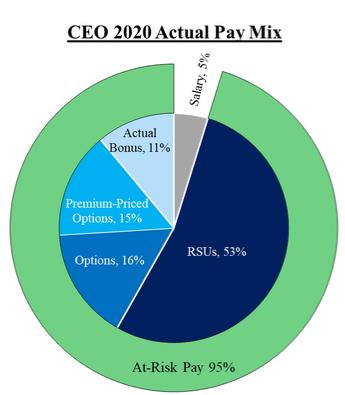
| 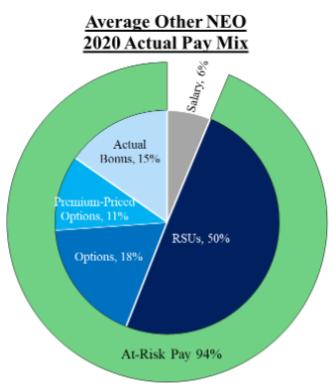
finance leases totaling $320.4 million and $46.1 million, respectively, of which $48.9 million and $8.1 million, respectively, are due within the next 12 months. These leases are primarily related to sale/leaseback agreements entered into with various financial institutions to facilitate the Company’s commercial transactions with key customers. |
Base salary reflects received base salary in fiscal 2020.
| ● | Key elementsFinance obligations totaling $329.2 million of our compensation programs includewhich approximately $58.9 million is due within the following:
next 12 months. Finance obligations consist primarily of debt associated with the sale of future revenues and failed sale/leaseback transactions.
| | | | | Compensation Element
|
| Purpose
|
| Features
| Base salary
|
| To attract and retain experienced and highly skilled executives.
|
| Fixed component of pay to provide financial stability, based on responsibilities, experience, individual contributions and peer company data.
| Annual cash incentive bonuses
|
| To promote and reward the achievement of key short-term strategic and business goals of the Company as well as individual performance; to motivate and attract executives.
|
| Variable component of pay based on annual corporate quantitative and qualitative goals.
Importantly, although performance goals were established prior to the onset of the Covid-19 pandemic, the Compensation Committee did not reduce the goals in response to the pandemic.
| Long-term equity
incentive compensation
|
| To encourage executives and other employees to focus on long-term Company performance; to drive long-term stockholder value; to promote retention; to reward outstanding Company and individual performance.
|
| Typically subject to multi-year vesting based on continued service and are primarily in the form of stock options, premium priced stock options and restricted stock, the value of which depends on the performance of our common stock price, in order to align employee interests with those of our stockholders over the longer-term.
|
| ● | Convertible senior notes totaling $193.9 million at December 31, 2022, none of which is due within the next twelve months. See Note 15 to the consolidated financial statements, “Convertible Senior Notes,” for more details. |
The Company believes that its current working capital of $2.7 billion at December 31, 2022, which includes unrestricted cash and cash equivalents of $690.6 million, and available-for-sale securities of $1.3 billion, will provide sufficient liquidity to fund operations for a least one year after the date the financial statements are issued. Common Stock Issuances In January and February 2021, the Company issued and sold in a registered equity offering an aggregate of 32.2 million shares of its common stock at a purchase price of $65.00 per share for net proceeds of approximately $2.0 billion. Furthermore, in February 2021, the Company completed a sale of its common stock in connection with a strategic partnership with SK Holdings Co., Ltd. (“SK Holdings”). The Company sold 54,996,188 shares of its common stock to a subsidiary of SK Holdings at a purchase price of $29.29 per share, or an aggregate purchase price of approximately $1.6 billion. In November 2020, the Company issued and sold in a registered direct offering an aggregate of 43,700,000 shares of its common stock at a purchase price of $22.25 per share for net proceeds of approximately $927.3 million. In August 2020, the Company issued and sold in a registered direct offering an aggregate of 35,276,250 shares of its common stock at a purchase price of $10.25 per share for net proceeds of approximately $344.4 million. Secured Debt In March 2019, the Company entered into a loan and security agreement, as amended, with Generate Lending, LLC, providing for a secured term loan facility in the amount of $100 million (the “Term Loan Facility”). In December 2022, the Company fully repaid the outstanding balance of the Term Loan Facility. In June 2020, the Company acquired debt as part of the acquisition of United Hydrogen Group Inc. The outstanding carrying value of the debt was $9.0 million as of December 31, 2022, bearing varying interest rates ranging from 2.2% to 8.3%, and is scheduled to mature in 2026. 3.75% Convertible Senior Notes On May 18, 2020, the Company issued $200.0 million in aggregate principal amount of 3.75% Convertible Senior Notes due June 1, 2025, which is referred to herein as the 3.75% Convertible Senior Notes, in a private placement to qualified institutional buyers pursuant to Rule 144A under the Securities Act of 1933, as amended, or the Securities Act. On May 29, 2020, the Company issued an additional $12.5 million in aggregate principal amount of 3.75% Convertible Senior Notes. At issuance in May 2020, the total net proceeds from the 3.75% Convertible Senior Notes, after deducting the initial purchaser’s discount, the costs of related capped calls and other issuance costs, were approximately $189.2 million. The 3.75% Convertible Senior Notes bear interest at a rate of 3.75% per year, payable semi-annually in arrears on June 1 and December 1 of each year, beginning on December 1, 2020. The notes will mature on June 1, 2025, unless earlier converted, redeemed or repurchased in accordance with their terms. The 3.75% Convertible Senior Notes are senior, unsecured obligations of the Company and rank senior in right of payment to any of the Company’s indebtedness that is expressly subordinated in right of payment to the notes, equal in right of payment to any of the Company’s existing and future liabilities that are not so subordinated, effectively junior in right of payment to any of the Company’s secured indebtedness to the extent of the value of the collateral securing such indebtedness, and structurally subordinated to all indebtedness and other liabilities, including trade payables, of its current or future subsidiaries. Holders of the 3.75% Convertible Senior Notes may convert their notes at their option at any time prior to the close of the business day immediately preceding December 1, 2024 in the following circumstances: 1) during any calendar quarter commencing after March 31, 2021, if the last reported sale price of the Company’s common stock exceeds 130% of the conversion price for each of at least 20 trading days (whether or not consecutive) during a period of 30 consecutive trading days ending on, and including, the last trading day of the immediately preceding calendar quarter; 2) during the five business days after any five consecutive trading day period (such five consecutive trading day period, the measurement period) in which the trading price per $1,000 principal amount of the 3.75% Convertible Senior Notes for each trading day of the measurement period was less than 98% of the product of the last reported sale price of the Company’s common stock and the conversion rate on each such trading day; 3) if the Company calls any or all of the 3.75% Convertible Senior Notes for redemption, any such notes that have been called for redemption may be converted at any time prior to the close of business on the second scheduled trading day immediately preceding the redemption date; or 4) upon the occurrence of specified corporate events, as described in the indenture governing the 3.75% Convertible Senior Notes. On or after December 1, 2024, the holders of the 3.75% Convertible Senior Notes may convert all or any portion of their notes at any time prior to the close of business on the second scheduled trading day immediately preceding the maturity date regardless of the foregoing conditions. The initial conversion rate for the 3.75% Convertible Senior Notes is 198.6196 shares of the Company’s common stock per $1,000 principal amount of notes, which is equivalent to an initial conversion price of approximately $5.03 per share of the Company’s common stock, subject to adjustment upon the occurrence of specified events. Upon conversion, the Company will pay or deliver, as applicable, cash, shares of the Company’s common stock or a combination of cash and shares of the Company’s common stock, at the Company’s election. During the year ended December 31, 2022, there were no conversions. During the year ended December 31, 2021, $15.2 million of the 3.75% Convertible Senior Notes were converted and the Company issued approximately 3.0 million shares of common stock in conjunction with these conversions. In addition, following certain corporate events or following issuance of a notice of redemption, the Company will increase the conversion rate for a holder who elects to convert its notes in connection with such a corporate event or convert its notes called for redemption during the related redemption period in certain circumstances. The 3.75% Convertible Senior Notes will be redeemable, in whole or in part, at the Company’s option at any time, and from time to time, on or after June 5, 2023 and before the 41st scheduled trading day immediately before the maturity date, at a cash redemption price equal to 100% of the principal amount of the notes to be redeemed, plus accrued and unpaid interest, if any, but only if the last reported sale price per share of the Company’s common stock exceeds 130% of the conversion price then in effect for at least 20 trading days (whether or not consecutive), including at least one of the three trading days immediately preceding the date the Company sends the related redemption notice, during any 30 consecutive trading day period ending on, and including, the trading day immediately preceding the date on which the Company sends such redemption notice. If the Company undergoes a “fundamental change” (as defined in the Indenture), holders may require the Company to repurchase their notes for cash all or any portion of their notes at a fundamental change repurchase price equal to 100% of the principal amount of the notes to be repurchased, plus accrued and unpaid interest, to, but excluding, the fundamental change repurchase date. The Company accounts for the 3.75% Convertible Senior Notes as a liability. We incurred transaction costs related to the issuance of the 3.75% Convertible Senior Notes of approximately $7.0 million, consisting of initial purchasers’ discount of approximately $6.4 million and other issuance costs of $0.6 million which were recorded as debt issuance cost (presented as contra debt in the consolidated balance sheets) and are being amortized to interest expense over the term of the 3.75% Convertible Senior Notes. Based on the closing price of the Company’s common stock of $12.37 on December 30, 2022, the if-converted value of the notes was greater than the principal amount. The estimated fair value of the note at December 31, 2022 was approximately $493.0 million. Fair value estimation was primarily based on a stock exchange, active trade on December 29, 2022 of the 3.75% Senior Convertible Note. The Company considers this a Level 2 fair value measurement. Capped Call In conjunction with the pricing of the 3.75% Convertible Senior Notes, the Company entered into privately negotiated capped call transactions (the “3.75% Notes Capped Call”) with certain counterparties at a price of $16.2 million. The 3.75% Notes Capped Call covers, subject to anti-dilution adjustments, the aggregate number of shares of the Company’s common stock that underlie the initial 3.75% Convertible Senior Notes and is generally expected to reduce potential dilution to the Company’s common stock upon any conversion of the 3.75% Convertible Senior Notes and/or offset any cash payments the Company is required to make in excess of the principal amount of the converted notes, as the case may be, with such reduction and/or offset subject to a cap based on the cap price. The cap price of the 3.75% Notes Capped Call is initially $6.7560 per share, which represents a premium of approximately 60%over the last then-reported sale price of the Company’s common stock of $4.11 per share on the date of the transaction and is subject to certain adjustments under the terms of the 3.75% Notes Capped Call. The 3.75% Notes Capped Call becomes exercisable if the conversion option is exercised. The net cost incurred in connection with the 3.75% Notes Capped Call has been recorded as a reduction to additional paid-in capital in the consolidated balance sheet. 5.5% Convertible Senior Notes In March 2018, the Company issued $100.0 million in aggregate principal amount of the 5.5% Convertible Senior Notes due on March 15, 2023 (the “5.5 Convertible Senior Notes”), in a private placement to qualified institutional buyers pursuant to Rule 144A under the Securities Act. In May 2020, the Company used a portion of the net proceeds from the issuance of the 3.75% Convertible Senior Notes to finance the cash portion of the partial repurchase of the 5.5% Convertible Senior Notes, which consisted of a repurchase of approximately $66.3 million in aggregate principal amount of the 5.5% Convertible Senior Notes in privately-negotiated transactions for aggregate consideration of $128.9 million, consisting of approximately $90.2 million in cash and approximately 9.4 million shares of the Company’s common stock. The partial repurchase of the 5.5% Convertible Senior Notes resulted in a $13.2 million gain on early debt extinguishment. In the fourth quarter of 2020, $33.5 million of the remaining 5.5% Convertible Senior Notes were converted into 14.6 million shares of common stock which resulted in a gain of approximately $4.5 million which was recorded on the consolidated statement of operations on the gain (loss) on extinguishment of debt line. On January 7, 2021, the remaining aggregate principal of $160 thousand aggregate principal amount of the 5.5% Convertible Senior Notes were converted into 69,808 shares of common stock. Interest expense and amortization for the period were immaterial. Capped Call In conjunction with the pricing of the 5.5% Convertible Senior Notes, the Company entered into privately negotiated capped call transactions (the “5.5% Notes Capped Call”) with certain counterparties at a price of $16.0 million to reduce the potential dilution to the Company’s common stock upon any conversion of the 5.5% Convertible Senior Notes and/or offset any cash payments the Company is required to make in excess of the principal amount of the converted 5.5% Convertible Senior Notes, as the case may be. The net cost incurred in connection with the 5.5% Notes Capped Call has been recorded as a reduction to additional paid-in capital in the consolidated balance sheets. In conjunction with the pricing of the partial repurchase of the 5.5% Convertible Senior Notes, the Company terminated 100% of the 5.5% Notes Capped Call on June 5, 2020. As a result of the termination, the Company received $24.2 million, which was recorded in additional paid-in capital in the consolidated balance sheets. The net cost incurred in connection with the 5.5% Notes Capped Call has been recorded as a reduction to additional paid-in capital in the consolidated balance sheets. In conjunction with the partial repurchase of the 5.5% Convertible Senior Notes, the Company terminated 100% of the 5.5% Notes Capped Call on June 5, 2020. As a result of the termination, the Company received $24.2 million which was recorded in additional paid-in capital. Common Stock Forward In connection with the issuance of the 5.5% Convertible Senior Notes, the Company also entered into a forward stock purchase transaction (the “Common Stock Forward”), pursuant to which the Company agreed to purchase 14,397,906 shares of its common stock for settlement on or about March 15, 2023. In connection with the issuance of the 3.75% Convertible Senior Notes and the partial repurchase of the 5.5% Convertible Senior Notes, the Company amended and extended the maturity of the Common Stock Forward to June 1, 2025. The number of shares of common stock that the Company will ultimately repurchase under the Common Stock Forward is subject to customary anti-dilution adjustments. The Common Stock Forward is subject to early settlement or settlement with alternative consideration in the event of certain corporate transactions. The net cost incurred in connection with the Common Stock Forward of $27.5 million was recorded as an increase in treasury stock in the consolidated balance sheets. The related shares were accounted for as a repurchase of common stock. The book value of the 5.5% Notes Capped Call and Common Stock Forward are not remeasured. There were no shares of common stock settled in connection with the Common Stock Forward during the year ended December 31, 2022. During the year ended December 31, 2021, 8.1 million shares were settled and received by the Company. Common Stock Transactions Amazon Transaction Agreement in 2022 On August 24, 2022, the Company and Amazon entered into a Transaction Agreement (the “2022 Transaction Agreement”), under which the Company concurrently issued to Amazon.com NV Investment Holdings LLC, a wholly owned subsidiary of Amazon, a warrant (the “2022 Amazon Warrant”) to acquire up to 16,000,000 shares (the “2022 Amazon Warrant Shares”) of the Company’s common stock, subject to certain vesting events described below. The Company and Amazon entered into the 2022 Transaction Agreement in connection with a concurrent commercial arrangement under which Amazon agreed to purchase hydrogen fuel from the Company through August 24, 2029. Warrant 1,000,000 of the 2022 Amazon Warrant Shares vested immediately upon issuance of the 2022 Amazon Warrant. 15,000,000 of the 2022 Amazon Warrant Shares will vest in multiple tranches over the 7-year term of the 2022 Amazon Warrant based on payments made to the Company directly by Amazon or its affiliates, or indirectly through third parties, with 15,000,000 of the 2022 Amazon Warrant Shares fully vesting if Amazon-related payments of $2.1 billion are made in the aggregate. The exercise price for the first 9,000,000 2022 Amazon Warrant Shares is $22.9841 per share and the fair value on the grant date was $20.36. The exercise price for the remaining 7,000,000 2022 Amazon Warrant Shares will be an amount per share equal to 90% of the 30-day volume weighted average share price of the Company’s common stock as of the final vesting event that results in full vesting of the first 9,000,000 2022 Amazon Warrant Shares. The 2022 Amazon Warrant is exercisable through August 24, 2029. Upon the consummation of certain change of control transactions (as defined in the 2022 Amazon Warrant) prior to the vesting of at least 60% of the aggregate 2022 Amazon Warrant Shares, the 2022 Amazon Warrant will automatically vest and become exercisable with respect to an additional number of 2022 Amazon Warrant Shares such that 60% of the aggregate 2022 Amazon Warrant Shares shall have vested. If a change of control transaction is consummated after the vesting of at least 60% of the aggregate 2022 Amazon Warrant Shares, then no acceleration of vesting will occur with respect to any of the unvested 2022 Amazon Warrant Shares as a result of the transaction. The exercise price and the 2022 Amazon Warrant Shares issuable upon exercise of the Amazon Warrant are subject to customary antidilution adjustments. At December 31, 2022, 1,000,000 of the 2022 Amazon Warrant Shares issued pursuant to the 2022 Transaction Agreement had vested upon issuance. The warrant charge associated with the vested shares of $20.4 million was capitalized to contract assets in our consolidated financial statements based on the grant date fair value and is subsequently amortized ratably as a reduction to revenue based on the Company’s estimate of revenue over the term of the agreement. The grant date fair value of tranches 2 and 3 will also be amortized ratably as a reduction to revenue based on the Company’s estimate of revenue over the term of the agreement. Because the exercise price has yet to be determined, the fair value of tranche 4 will be remeasured at each reporting period end and amortized ratably as a reduction to revenue based on the Company’s estimate of revenue over the term of the agreement. The total amount of provision for common stock warrants recorded as a reduction of revenue for the 2022 Amazon Warrant during the year ended December 31, 2022 was $5.2 million. The assumptions used to calculate the valuations as of August 24, 2022 and December 31, 2022 are as follows: | | | | | | | Tranches 1-3 | | Tranche 4 | | | August 24, 2022 | | December 31, 2022 | Risk-free interest rate | | 3.15% | | 3.88% | Volatility | | 75.00% | | 75.00% | Expected average term | | 7 years | | 4 years | Exercise price | | $22.98 | | $11.13 | Stock price | | $20.36 | | $12.37 |
Amazon Transaction Agreement in 2017 On April 4, 2017, the Company and Amazon entered into a Transaction Agreement (the “2017 Transaction Agreement”), pursuant to which the Company agreed to issue to Amazon a warrant (the “2017 Amazon Warrant”) to acquire up to 55,286,696 shares of the Company’s common stock (the “2017 Amazon Warrant Shares”), subject to certain vesting events described below. The Company and Amazon entered into the 2017 Amazon Transaction Agreement in connection with existing commercial agreements between the Company and Amazon with respect to the deployment of the Company’s GenKey fuel cell technology at Amazon distribution centers. The existing commercial agreements contemplate, but do not guarantee, future purchase orders for the Company’s fuel cell technology. The vesting of the 2017 Amazon Warrant Shares was conditioned upon payments made by Amazon or its affiliates (directly or indirectly through third parties) pursuant to the existing commercial agreements. Under the terms of the 2017 Amazon Warrant, the first tranche of the 5,819,652 of the 2017 Amazon Warrant Shares vested upon execution of the 2017 Amazon Warrant, and the remaining 2017 Amazon Warrant Shares vest based on Amazon’s payment of up to $600.0 million to the Company in connection with Amazon’s purchase of goods and services from the Company. The $6.7 million fair value of the first tranche of the 2017 Amazon Warrant Shares, was recognized as selling, general and administrative expense upon execution of the 2017 Amazon Warrant. Provision for the second and third tranches of the 2017 Amazon Warrant Shares was recorded as a reduction of revenue, because they represent consideration payable to a customer. The fair value of the second tranche of the 2017 Amazon Warrant Shares was measured at January 1, 2019, upon adoption of ASU 2019-08. The second tranche of 29,098,260 of the 2017 Amazon Warrant Shares vested in four equal installments, as Amazon or its affiliates, directly or indirectly through third parties, made an aggregate of $50.0 million in payments for goods and services to the Company, up to payments totaling $200.0 million in the aggregate. The last installment of the second tranche vested on November 2, 2020. Revenue reductions of $497 thousand, $9.0 million and $4.1 million were associated with the second tranche of the 2017 Amazon Warrant Shares were recorded in 2021, 2020, and 2019, respectively, under the terms of the 2017 Amazon Warrant. Under the terms of the 2017 Amazon Warrant, the third tranche of 20,368,784 of the 2017 Amazon Warrant Shares vests in eight equal installments, as Amazon or its affiliates, directly or indirectly through third parties, made an aggregate of $50.0 million in payments for goods and services to the Company, up to payments totaling $400.0 million in the aggregate. The measurement date for the third tranche of the 2017 Amazon Warrant Shares was November 2, 2020, when their exercise price was determined, as discussed further below. The fair value of the third tranche of the 2017 Amazon Warrant Shares was determined to be $10.57 each. During 2020, revenue reductions of $24.1 million associated with the third tranche of the 2017 Amazon Warrant Shares were recorded under the terms of the 2017 Amazon Warrant, prior to the December 31, 2020 waiver described below. On December 31, 2020, the Company waived the remaining vesting conditions under the 2017 Amazon Warrant, which resulted in the immediate vesting of all the third tranche of the 2017 Amazon Warrant Shares and recognition of an additional $399.7 million reduction to revenue. The $399.7 million reduction to revenue resulting from the December 31, 2020 waiver was determined based upon a probability assessment of whether the underlying shares would have vested under the terms of the 2017 Amazon Warrant. Based upon the Company’s projections of probable future cash collections from Amazon (i.e., a Type I share based payment modification), a reduction of revenue associated with 5,354,905 of the 2017 Amazon Warrant Shares was recognized at their previously measured November 2, 2020 fair value of $10.57 per warrant. A reduction of revenue associated with the remaining 12,730,490 of the 2017 Amazon Warrant Shares was recognized at their December 31, 2020 fair value of $26.95 each, based upon the Company’s assessment that associated future cash collections from Amazon were not deemed probable (i.e., a Type III share-based payment modification). The $399.7 million reduction to revenue was recognized during the year ended December 31, 2020 because the Company concluded such amount was not recoverable from the margins expected from future purchases by Amazon under the 2017 Amazon Warrant, and no exclusivity or other rights were conferred to the Company in connection with the December 31, 2020 waiver. Additionally, for the year ended December 31, 2020, the Company recorded a reduction to the provision for warrants of $12.8 million in connection with the release of the service loss accrual. The 2017 Amazon Warrant was exercised with respect to 24,704,450 and 17,461,994 shares of the Company’s common stock as of December 31, 2022 and 2021, respectively. At both December 31, 2022 and December 31, 2021, 55,286,696 of the 2017 Amazon Warrant Shares had vested. The total amount of provision for common stock warrants recorded as a reduction of revenue for the 2017 Amazon Warrant during the years ended December 31, 2022, 2021, and 2020 was $0.4 million, $0.5 million and $420.0 million, respectively. The exercise price for the first and second tranches of the 2017 Amazon Warrant Shares was $1.1893 per share. The exercise price of the third tranche of the 2017 Amazon Warrant Shares was $13.81 per share, which was determined pursuant to the terms of the 2017 Amazon Warrant as an amount equal to 90% of the 30-day volume weighted average share price of the Company’s common stock as of November 2, 2020, the final vesting date of the second tranche of the 2017 Amazon Warrant Shares. The 2017 Amazon Warrant is exercisable through April 4, 2027. The 2017 Amazon Warrant provides for net share settlement that, if elected by the holder, will reduce the number of shares issued upon exercise to reflect net settlement of the exercise price. The 2017 Amazon Warrant provides for certain adjustments that may be made to the exercise price and the number of shares of common stock issuable upon exercise due to customary anti-dilution provisions based on future events. The 2017 Amazon Warrant is classified as an equity instrument. Fair value of the 2017 Amazon Warrant at December 31, 2020 and November 2, 2020 was based on the Black Scholes Option Pricing Model, which is based, in part, upon level 3 unobservable inputs for which there is little or no market data, requiring the Company to develop its own assumptions. All 2017 Amazon Warrant Shares were fully vested as of December 31, 2020. The Company used the following assumptions for its 2017 Amazon Warrant: | | | | | | | | | December 31, 2020 | | November 2, 2020 | Risk-free interest rate | | | 0.58% | | 0.58% | Volatility | | | 75.00% | | 75.00% | Expected average term | | | 6.26 | | 6.42 | Exercise price | | | $13.81 | | $13.81 | Stock price | | | $33.91 | | $15.47 |
Walmart Transaction Agreement On July 20, 2017, the Company and Walmart entered into a Transaction Agreement (the “Walmart Transaction Agreement”), pursuant to which the Company agreed to issue to Walmart a warrant (the “Walmart Warrant”) to acquire up to 55,286,696 shares of the Company’s common stock, subject to certain vesting events (the “Walmart Warrant Shares”). The Company and Walmart entered into the Walmart Transaction Agreement in connection with existing commercial agreements between the Company and Walmart with respect to the deployment of the Company’s GenKey fuel cell technology across various Walmart distribution centers. The existing commercial agreements contemplate, but do not guarantee, future purchase orders for the Company’s fuel cell technology. The vesting of the warrant shares conditioned upon payments made by Walmart or its affiliates (directly or indirectly through third parties) pursuant to transactions entered into after January 1, 2017 under existing commercial agreements. The majority of the Walmart Warrant Shares will vest based on Walmart’s payment of up to $600.0 million to the Company in connection with Walmart’s purchase of goods and services from the Company. The first tranche of 5,819,652 Walmart Warrant Shares vested upon the execution of the Walmart Warrant and was fully exercised as of December 31, 2020. Accordingly, $10.9 million, the fair value of the first tranche of Walmart Warrant Shares, was recorded as a provision for common stock warrants and presented as a reduction to revenue on the consolidated statements of operations during 2017. All future provision for common stock warrants is measured based on their grant-date fair value and recorded as a charge against revenue. The second tranche of 29,098,260 Walmart Warrant Shares vests in four installments of 7,274,565 Walmart Warrant Shares each time Walmart or its affiliates, directly or indirectly through third parties, make an aggregate of $50.0 million in payments for goods and services to the Company, up to payments totaling $200.0 million in the aggregate. The exercise price for the first and second tranches of Walmart Warrant Shares is $2.1231 per share. After Walmart has made payments to the Company totaling $200.0 million, the third tranche of 20,368,784 Walmart Warrant Shares will vest in eight installments of 2,546,098 Walmart Warrant Shares each time Walmart or its affiliates, directly or indirectly through third parties, make an aggregate of $50.0 million in payments for goods and services to the Company, up to payments totaling $400.0 million in the aggregate. The exercise price of the third tranche of Walmart Warrant Shares will be an amount per share equal to 90% of the 30-day volume weighted average share price of the common stock as of the final vesting date of the second tranche of Walmart Warrant Shares, provided that, with limited exceptions, the exercise price for the third tranche will not be lower than $1.1893. The Walmart Warrant is exercisable through July 20, 2027. The Walmart Warrant provides for net share settlement that, if elected by the holder, will reduce the number of shares issued upon exercise to reflect net settlement of the exercise price. The Walmart Warrant provides for certain adjustments that may be made to the exercise price and the number of shares of common stock issuable upon exercise due to customary anti-dilution provisions based on future events. The Walmart Warrant is classified as an equity instrument. The warrant had been exercised with respect to 13,094,217 shares of the Company’s common stock as of both December 31, 2022 and 2021. At December 31, 2022 and December 31, 2021, 27,643,347 and 20,368,782 of the Walmart Warrant Shares had vested, respectively. The total amount of provision for common stock warrants recorded as a reduction of revenue for the Walmart Warrant during the years ended December 31, 2022, 2021, and 2020 $7.1 million, $6.1 million, and $5.0 million, respectively. Fair value of the Walmart Warrant was based on the Black Scholes Option Pricing Model, which is based, in part, upon level 3 unobservable inputs for which there is little or no market data, requiring the Company to develop its own assumptions. Except for the third tranche, all existing unvested Walmart Warrant Shares are measured using a measurement date of January 1, 2019, the adoption date, in accordance with ASU 2019-08. The Company used the following assumptions for its Walmart Warrant: | | | | | | | January 1, 2019 | Risk-free interest rate | | | 2.63% | Volatility | | | 95.00% | Expected average term | | | 8.55 | Exercise price | | | $2.12 | Stock price | | | $1.24 |
The assumptions used to calculate the valuations of the final tranche of the Walmart Warrant as of December 31, 2022 are as follows: | | | | | December 31, 2022 | Risk-free interest rate | | 3.92% | Volatility | | 75.00% | Expected average term | | 3.5 years | Exercise price | | $11.13 | Stock price | | $12.37 |
Operating and Finance Lease Liabilities As of December 31, 2022, the Company had operating leases, as lessee, primarily associated with sale/leaseback transactions that are partially secured by restricted cash, security deposits and pledged escrows (see also Note 1 to the consolidated financial statements, “Nature of Operations”) as summarized below. These leases expire over the next one to nine years. Minimum rent payments under operating leases are recognized on a straight-line basis over the term of the lease. Leases contain termination clauses with associated penalties, the amount of which cause the likelihood of cancellation to be remote. At the end of the lease term, the leased assets may be returned to the lessor by the Company, the Company may negotiate with the lessor to purchase the assets at fair market value, or the Company may negotiate with the lessor to renew the lease at market rental rates. No residual value guarantees are contained in the leases. No financial covenants are contained within the lease, however there are customary operational covenants such as assurance the Company properly maintains the leased assets and carries appropriate insurance, etc. The leases include credit support in the form of either cash, collateral or letters of credit. See Note 21 to the consolidated financial statements, “Commitments and contingencies,” for a description of cash held as security associated with the leases. The Company has finance leases associated with its property and equipment in Latham, New York and at fueling customer locations. The fair value of this finance obligation approximated the carrying value as of December 31, 2022. Future minimum lease payments under operating and finance leases (with initial or remaining lease terms in excess of one year) as of December 31, 2022 were as follows (in thousands): | | | | | | | | | | | | | | | Finance | | Total | | | Operating Lease | | Lease | | Lease | | | Liability | | Liability | | Liabilities | 2023 | | $ | 82,019 | | $ | 10,901 | | $ | 92,920 | 2024 | | | 81,157 | | | 10,851 | | | 92,008 | 2025 | | | 76,444 | | | 13,763 | | | 90,207 | 2026 | | | 67,951 | | | 10,904 | | | 78,855 | 2027 | | | 53,741 | | | 6,947 | | | 60,688 | 2028 and thereafter | | | 96,147 | | | — | | | 96,147 | Total future minimum payments | | | 457,459 | | | 53,366 | | | 510,824 | Less imputed interest | | | (137,094) | | | (7,230) | | | (144,324) | Total | | $ | 320,365 | | $ | 46,137 | | $ | 366,500 |
Rental expense for all operating leases was $67.6 million, $38.6 million, and $22.3 million for the years ended December 31, 2022, 2021, and 2020, respectively. At December 31, 2022 and 2021, security deposits associated with sale/leaseback transactions were $5.8 million and $3.5 million, respectively, and were included in other assets in the consolidated balance sheet. Other information related to the operating leases are presented in the following table: | | | | | | | Year ended | | Year ended | | December 31, 2022 | | December 31, 2021 | Cash payments (in thousands) | $ | 63,214 | | $ | 37,463 | Weighted average remaining lease term (years) | | 6.52 | | | 5.60 | Weighted average discount rate | | 11.2% | | | 10.9% |
Finance lease costs include amortization of the right of use assets (i.e., depreciation expense) and interest on lease liabilities (i.e., interest and other expense, net in the consolidated statement of operations), and were $6.2 and $2.1 million for the year ended December 31, 2022 and 2021, respectively. At December 31, 2022 and 2021, the right of use assets associated with finance leases, net was $53.7 million and $33.9 million, respectively. The accumulated depreciation for these right of use assets was $4.7 million and $1.5 million at December 31, 2022 and 2021, respectively. Other information related to the finance leases are presented in the following table: | | | | | | | Year ended | | Year ended | | December 31, 2022 | | December 31, 2021 | Cash payments (in thousands) | $ | 9,033 | | $ | 3,648 | Weighted average remaining lease term (years) | | 3.92 | | | 4.56 | Weighted average discount rate | | 6.7% | | | 6.7% |
The Company has outstanding obligations to Wells Fargo under several Master Lease Agreements totaling $159.5 million at December 31, 2022. These outstanding obligations are included in operating lease liabilities, and finance obligations on the consolidated balance sheets. Restricted Cash In connection with certain of the above noted sale/leaseback agreements, cash of $383.7 million and $275.1 million, respectively, was required to be restricted as security as of December 31, 2022 and 2021, which will be released over the lease term. As of December 31, 2022 and 2021, the Company also had certain letters of credit backed by security deposits totaling $379.6 million and $286.0 million, respectively, that are security for the above noted sale/leaseback agreements. As of December 31, 2022 and 2021, the Company had $75.5 and $67.7 million, respectively, held in escrow related to the construction of certain hydrogen plants. The Company also had $5.0 million, $2.3 million, and $1.8 million of consideration held by our paying agent in connection with the Applied Cryo, Joule, and CIS acquisitions, respectively, reported as restricted cash as of December 31, 2022, with a corresponding accrued liability on the Company’s consolidated balance sheet. Additionally, the Company had $10.8 million in restricted cash as collateral resulting from the Frames acquisition as of December 31, 2022. Critical Accounting Estimates Management’s discussion and analysis of our financial condition and results of operations are based upon our consolidated financial statements, which have been prepared in accordance with GAAP. The preparation of these consolidated financial statements requires us to make estimates and judgments that affect the reported amounts of assets, liabilities, revenues and expenses, and related disclosure of contingent assets and liabilities at the date of and during the reporting period. On an on-going basis, we evaluate our estimates and judgments, including those related to revenue recognition, valuation of long-lived assets, accrual for service loss contracts, common stock warrants. We base our estimates and judgments on historical experience and on various other factors and assumptions that are believed to be reasonable under the circumstances, the results of which form the basis for making judgments about (1) the carrying values of assets and liabilities and (2) the amount of revenue and expenses realized that are not readily apparent from other sources. Actual results may differ from these estimates under different assumptions or conditions. We believe that the following are our most critical accounting estimates and assumptions the Company must make in the preparation of our consolidated financial statements and related notes thereto. Revenue Recognition The Company enters into contracts that may contain one or a combination of fuel cell systems and infrastructure, installation, maintenance, spare parts, fuel delivery and other support services. Contracts containing fuel cell systems and related infrastructure may be sold directly to customers or provided to customers under a PPA. The Company also enters into contracts that contain electrolyzer stacks, systems, maintenance, and other support services. The Company does not include a right of return on its products other than rights related to standard warranty provisions that permit repair or replacement of defective goods. The Company accrues for anticipated standard warranty costs at the same time that revenue is recognized for the related product, or when circumstances indicate that warranty costs will be incurred, as applicable. Any prepaid amounts would only be refunded to the extent services have not been provided or the fuel cell systems or infrastructure have not been delivered. Revenue is measured based on the transaction price specified in a contract with a customer, subject to the allocation of the transaction price to distinct performance obligations as discussed below. The Company recognizes revenue when it satisfies a performance obligation by transferring a product or service to a customer. Promises to the customer are separated into performance obligations, and are accounted for separately if they are (1) capable of being distinct and (2) distinct in the context of the contract. The Company considers a performance obligation to be distinct if the customer can benefit from the good or service either on its own or together with other resources readily available to the customer and the Company’s promise to transfer the goods or service to the customer is separately identifiable from other promises in the contract. The Company allocates revenue to each distinct performance obligation based on relative standalone selling prices. Payment terms for sales of fuel cells, infrastructure, and service to customers are typically 30 to 90 days from shipment of the goods. Payment terms on electrolyzer systems are typically based on achievement of milestones over the term of the contract with the customer. Sale/leaseback transactions with financial institutions are invoiced and collected upon transaction closing. Service is prepaid upfront in a majority of the arrangements. The Company does not adjust the transaction price for a significant financing component when the performance obligation is expected to be fulfilled within a year. The Company has issued to each of Amazon.com NV Investment Holdings LLC and Walmart warrants to purchase shares of the Company’s common stock. The Company presents the provision for common stock warrants within each revenue-related line item on the consolidated statements of operations. This presentation reflects a discount that those common stock warrants represent, and therefore revenue is net of these non-cash charges. The provision of common stock warrants is allocated to the relevant revenue-related line items based upon the expected mix of the revenue for each respective contract. See Note 17 to the consolidated financial statements, “Warrant Transaction Agreements,’ for more details. Nature of goods and services The following is a description of principal activities from which the Company generates its revenue. | (i) | Sales of Fuel Cell Systems, Related Infrastructure and Equipment |
Revenue from sales of fuel cell systems, related infrastructure, and equipment represents sales of our GenDrive units, GenSure stationary backup power units, as well as hydrogen fueling infrastructure. The Company uses a variety of information sources in determining standalone selling prices for fuel cells systems and the related infrastructure. For GenDrive fuel cells, given the nascent nature of the Company’s market, the Company considers several inputs, including prices from a limited number of standalone sales as well as the Company’s negotiations with customers. The Company also considers its costs to produce fuel cells as well as comparable list prices in estimating standalone selling prices. The Company uses applicable observable evidence from similar products in the market to determine standalone selling prices for GenSure stationary backup power units and hydrogen fueling infrastructure. The determination of standalone selling prices of the Company’s performance obligations requires significant judgment, including periodic assessment of pricing approaches and available observable evidence in the market. Once relative standalone selling prices are determined, the Company proportionately allocates the transaction price to each performance obligation within the customer arrangement based upon standalone selling price. The allocated transaction price related to fuel cell systems and spare parts is recognized as revenue at a point in time which usually occurs upon delivery (and occasionally at time of shipment). Revenue on hydrogen infrastructure installations is generally recognized at the point at which transfer of control passes to the customer, which usually occurs upon customer acceptance of the hydrogen infrastructure. The Company uses an input method to determine the amount of revenue to recognize during each reporting period when such revenue is recognized over time, based on the costs incurred to satisfy the performance obligation. (ii) Sales of Electrolyzer Systems and Solutions Revenue from sales of electrolyzer systems and solutions represents sales of electrolyzer stacks and systems used to generate hydrogen for various applications including mobility, ammonia production, methanol production, power to gas, and other uses. The Company uses a variety of information sources in determining standalone selling prices for electrolyzer systems solutions. Electrolyzer stacks are typically sold on a standalone basis and the standalone selling price is the contractual price with the customer. Electrolyzer systems are sold either on a standalone basis or with an extended service agreement and other equipment. The Company uses an adjusted market assessment approach to determine the standalone selling price of electrolyzer systems when sold with extended service or other equipment. This includes considering both standalone selling prices of the systems by the Company and available information on competitor pricing on similar products. The determination of standalone selling prices of the Company’s performance obligations requires judgment, including periodic assessment of pricing approaches and available observable evidence in the market. Once relative standalone selling prices are determined, the Company proportionately allocates the transaction price to each performance obligation within the customer arrangement based upon standalone selling price. Revenue on electrolyzer systems and stacks is generally recognized at the point at which transfer of control passes to the customer, which usually occurs upon title transfer at shipment or delivery to the customer location. In certain instances, control of electrolyzer systems transfers to the customer over time, and the related revenue is recognized over time as the performance obligation is satisfied. We recognize revenue over time when contract performance results in the creation of a product for which we do not have an alternative use and the contract includes an enforceable right to payment in an amount that corresponds directly with the value of the performance completed. In these instances, we use an input measure (cost-to-total cost or percentage-of-completion method) of progress to determine the amount of revenue to recognize during each reporting period based on the costs incurred to satisfy the performance obligation. Payments received from customers are recorded within deferred revenue and customer deposits in the consolidated balance sheets until control is transferred. The related cost of such product and installation is also deferred as a component of deferred cost of revenue in the consolidated balance sheets until control is transferred. (iii) Services performed on fuel cell systems and related infrastructure Revenue from services performed on fuel cell systems and related infrastructure represents revenue earned on our service and maintenance contracts and sales of spare parts. The Company uses an adjusted market assessment approach to determine standalone selling prices for services. This approach considers market conditions and constraints, as well as objectives while maximizing the use of available observable inputs obtained from a limited number of historical standalone service renewal prices and negotiations with customers. The transaction price allocated to services as discussed above is generally recognized as revenue over time on a straight-line basis over the expected service period, as customers simultaneously receive and consume the benefits of routine, recurring maintenance performed throughout the contract period. In substantially all of its transactions, the Company sells extended maintenance contracts that generally provide for a five-to-ten-year service period from the date of product installation in exchange for an up-front payment. Services include monitoring, technical support, maintenance and related services. These services are accounted for as a separate performance obligation, and accordingly, revenue generated from these transactions, subject to the proportional allocation of transaction price, is deferred and recognized as revenue over the term of the contract, generally on a straight-line basis. Additionally, the Company may enter into annual service and extended maintenance contracts that are billed monthly. Revenue generated from these transactions is recognized as revenue on a straight-line basis over the term of the contract. Costs are recognized as incurred over the term of the contract. When costs are projected to exceed revenues over the life of the extended maintenance contract, an accrual for loss contracts is recorded. As of December 31, 2022 and 2021, the Company recorded a loss accrual of $81.1 million and $89.8 million, respectively. Costs are estimated based upon historical experience and consider the estimated impact of the Company’s cost reduction initiatives, if any. The actual results may differ from these estimates. See “Extended Maintenance Contracts” below. Extended maintenance contracts generally do not contain customer renewal options. Upon expiration, customers may either negotiate a contract extension or switch to purchasing spare parts and maintaining the fuel cell systems on their own. | (iv) | Power Purchase Agreements (“PPAs”) |
Revenue from PPAs primarily represents payments received from customers who make monthly payments to access the Company’s GenKey solution. Revenue associated with these agreements is recognized on a straight-line basis over the life of the agreements as the customers receive the benefits from the Company’s performance of the services. The customers receive services ratably over the contract term. In conjunction with entering into a PPA with a customer, the Company may enter into a separate transaction with third-party financial institutions in which the Company receives proceeds from the sale/leaseback transactions of the equipment and the sale of future service revenue. The proceeds from the financial institution are allocated between the sale of equipment and the sale of future service revenue based on the relative standalone selling prices of equipment and service. The proceeds allocated to the sale of future services are recognized as finance obligations. The proceeds allocated to the sale of the equipment are evaluated to determine if the transaction meets the criteria for sale/leaseback accounting. To meet the sale/leaseback criteria, control of the equipment must transfer to the financial institution, which requires among other criteria the leaseback to meet the criteria for an operating lease and the Company must not have a right to repurchase the equipment (unless specific criteria are met). These transactions typically meet the criteria for sale/leaseback accounting and accordingly, the Company recognizes revenue on the sale of the equipment, and separately recognizes the leaseback obligations. The Company recognizes an operating lease liability for the equipment leaseback obligation based on the present value of the future payments to the financial institutions that are attributed to the equipment leaseback. The discount rate used to determine the lease liability is the Company’s incremental borrowing rate. The Company also records a right of use asset which is amortized over the term of the leaseback. Rental expense is recognized on a straight-line basis over the life of the leaseback and is included as a cost of PPA revenue on the consolidated statements of operations. Certain of the Company’s transactions with financial institutions do not meet the criteria for sale/leaseback accounting and accordingly, no equipment sale is recognized. All proceeds from these transactions are accounted for as finance obligations. The right of use assets related to these transactions are classified as equipment related to the PPAs and fuel delivered to the customers, net in the consolidated balance sheets. The Company uses its transaction-date incremental borrowing rate as the interest rate for its finance obligations that arise from these transactions. No additional adjustments to the incremental borrowing rate have been deemed necessary for the finance obligations that have resulted from the failed sale/leaseback transactions. In determining whether the sales of fuel cells and other equipment to financial institutions meet the requirements for revenue recognition under sale/leaseback accounting, the Company, as lessee, determines the classification of the lease. The Company estimates certain key inputs to the associated calculations such as: 1) discount rate used to determine the present value of future lease payments, 2) fair value of the fuel cells and equipment, and 3) useful life of the underlying asset(s): | ● | ASC Topic 842 requires a lessee to discount its future lease payments using the interest rate implicit in the lease or, if that rate cannot be readily determined, its incremental borrowing rate. Generally, the Company cannot determine the interest rate implicit in its leases because it does not have access to the lessor’s estimated residual value or the amount of the lessor’s deferred initial direct costs. Therefore, the Company generally uses its incremental borrowing rate to estimate the discount rate for each lease. Adjustments that considered the Company’s actual borrowing rate, inclusive of securitization, as well as borrowing rates for companies of similar credit quality were applied in the determination of the incremental borrowing rate. |
| ● | In order for the lease to be classified as an operating lease, the present value of the future lease payments cannot exceed 90% of the fair value of the leased assets. The Company estimates the fair value of the lease assets using the sales prices. |
| ● | In order for a lease to be classified as an operating lease, the lease term cannot exceed 75% (major part) of the estimated useful life of the leased asset. The average estimated useful life of the fuel cells is 10 years, and the average estimated useful life of the hydrogen infrastructure is 20 years. These estimated useful lives are compared to the term of each lease to determine the appropriate lease classification. |
| (v) | Fuel Delivered to Customers |
Revenue associated with fuel delivered to customers represents the sale of hydrogen to customers that has been purchased by the Company from a third party or generated on site. The stand-alone selling price is not estimated because it is sold separately and therefore directly observable. The Company purchases hydrogen fuel from suppliers in most cases (and sometimes produces hydrogen onsite) and sells to its customers. Revenue and cost of revenue related to this fuel is recorded as dispensed and is included in the respective “Fuel delivered to customers” lines on the consolidated statements of operations. Impairment of Long-Lived Assets Property, equipment, leasehold improvements, and finite-lived intangible assets Long-lived assets, such as property, equipment, leasehold improvements, and finite-lived intangible assets, are reviewed for impairment whenever events and circumstances indicate that the carrying amount of an asset may not be recoverable. If circumstances require a long-lived asset or asset group to be tested for impairment, the Company first compares undiscounted cash flows expected to be generated by that asset or asset group to its carrying amount. If the carrying amount of the long-lived asset or asset group is not recoverable on an undiscounted cash flow basis, an impairment is recognized to the extent that the carrying amount exceeds its fair value. In making these determinations, the Company uses certain assumptions, including, but not limited to: (i) estimated fair value of the assets; and (ii) estimated, undiscounted future cash flows expected to be generated by these assets, which are based on additional assumptions such as asset utilization, length of service, the asset will be used in the Company’s operations, and (iii) estimated residual values. Fair value is determined using various valuation techniques including discounted cash flow models, quoted market values and third-party independent appraisals, as considered necessary. There was impairment of $0.8 million and $0 of property, equipment, leasehold improvements, or finite-lived intangible assets during the years ended December 31, 2022 and 2021, respectively. PPA Executory Contract Considerations We evaluate PPA assets on a quarterly basis to identify events or changes in circumstances (“triggering events”) that indicate the carrying value of certain assets may not be recoverable. PPA assets that we evaluate include right of use lease assets, equipment deployed to our PPAs, and assets related primarily to our fuel delivery business. Upon the occurrence of a triggering event, PPA assets are evaluated to determine if the carrying amounts are recoverable. The determination of recoverability is made based upon the estimated undiscounted future net cash flows of assets grouped at the lowest level for which there are identifiable cash flows independent of the cash flows of other groups. For operating assets, the Company has generally determined that the lowest level of identifiable cash flows is based on the customer sites. The assets related primarily to our fuel delivery business are considered to be their own asset group. The cash flows are estimated based on the remaining useful life of the primary asset within the asset group. For assets related to our PPA agreements, we consider all underlying cash inflows related to our contract revenues and cash outflows relating to the costs incurred to service the PPAs. Our cash flow estimates used in the recoverability test, are based upon, among other things, historical results adjusted to reflect our best estimate of future cash flows and operating performance. Development of future cash flows also requires us to make assumptions and to apply judgment, including timing of future expected cash flows, future cost savings initiatives, and determining recovery values. Changes to our key assumptions related to future performance and other economic and market factors could adversely affect the outcome of our recoverability tests and cause more asset groups to be tested for impairment. If the estimated undiscounted future net cash flows for a given asset group are less than the carrying amount of the related asset group, an impairment loss is determined by comparing the estimated fair value with the carrying amount of the asset group. The impairment loss is then allocated to the assets in the asset group based on the asset’s relative carrying amounts. However, assets are not impaired below their then estimated fair values. Fair value is generally determined through various valuation techniques, including discounted cash flow models, quoted market values and third-party independent appraisals, as well as year-over-year trends in pricing of our new equipment and overall evaluation of our industry and market, as considered necessary. The Company considers these indicators with certain of its own internal indices and metrics in determining fair value in light of the nascent state of the Company’s market and industry. The estimate of fair value represents our best estimates of these factors and is subject to variability. Changes to our key assumptions related to future performance and other economic and market factors could adversely affect our impairment evaluation. The Company has determined that the assets deployed for certain PPA arrangements, as well as certain assets related to the delivery of fuel to customers, are not recoverable based on the undiscounted estimated future cash flows of the asset group, and an expense of $4.4 million was recorded to the impairment of long-lived assets on the income statement. However, the estimated fair value of the assets in these asset groups equal or exceed the carrying amount of the assets or otherwise limit the amount of impairment that would have been recognized. The Company has identified the primary source of the losses for certain PPA arrangements to be the maintenance components of the PPA arrangements and the impact of customer warrant non-cash provisions. As the PPA arrangements are considered to be executory contracts and there is no specific accounting guidance that permits loss recognition for these revenue contracts, the Company has not recognized a provision for the expected future losses under these revenue arrangements. The Company expects that it will recognize future losses for these arrangements as it continues its efforts to reduce costs of delivering the maintenance component of these arrangements. The Company has estimated total future revenues and costs for these types of arrangements based on existing contracts and leverage of the related assets. For the future estimates, the Company used service cost estimates for extended maintenance contracts and customer warrant provisions at rates consistent with experience to date. The terms for the underlying estimates vary but the average residual term on the existing contracts is 5 years. Extended Maintenance Contracts On a quarterly basis, we evaluate any potential losses related to our extended maintenance contracts for fuel cell systems and related infrastructure that has been sold. We measure loss accruals at the customer contract level. The expected revenues and expenses for these contracts include all applicable expected costs of providing services over the remaining term of the contracts and the related unearned net revenue. A loss is recognized if the sum of expected costs of providing services under the contract exceeds related unearned net revenue and is recorded as a provision for loss contracts related to service in the consolidated statements of operations. A key component of these estimates is the expected future service costs. In estimating the expected future service costs, the Company considers its current service cost level and applies judgement related to certain cost saving estimates that have been implemented in the field. The expected future cost savings will be primarily dependent upon the success of the Company’s initiatives related to increasing stack life and achieving better economies of scale on service labor. If the expected cost saving initiatives are not realized, this will increase the costs of providing services and could adversely affect our estimated contract loss accrual. Further, as we continue to work to improve quality and reliability; however, unanticipated additional quality issues or warranty claims may arise and additional material charges may be incurred in the future. These quality issues could also adversely affect our contract loss accrual. The Company has undertaken and will soon undertake several other initiatives to extend the life and improve the reliability of its equipment. As a result of these initiatives and our additional expectation that the increase in certain costs will abate, the Company believes that its contract loss accrual is sufficient. However, if elevated service costs persist, the Company will adjust its estimated future service costs and increase its contract loss accrual estimate. If actual service costs over the remaining term of existing extended maintenance contracts are 10% more or 10% less than those estimated in the determination of the loss accrual for fuel cell systems and related infrastructure at December 31, 2022, the loss accrual would be approximately $15.2 million higher or $14.4 million lower, respectively. Common Stock Warrant Accounting The Company accounts for common stock warrants as either derivative liabilities or as equity instruments depending on the specific terms of the respective warrant agreements. Common stock warrants that meet certain applicable requirements of ASC Subtopic 815-40, Derivatives and Hedging – Contracts in Entity’s Own Equity, and other related guidance, including the ability of the Company to settle the warrants without the issuance of registered shares or the absence of rights of the grantee to require cash settlement, are accounted for as equity instruments. The Company classifies these equity instruments within additional paid-in capital on the consolidated balance sheets. Common stock warrants accounted for as equity instruments represent the warrants issued to Amazon and Walmart as discussed in Note 17, “Warrant Transaction Agreements.” The Company adopted FASB ASU 2019-08, Compensation – Stock Compensation (Topic 718) and Revenue from Contracts with Customers (Topic 606), which requires entities to measure and classify share-based payment awards granted to a customer by applying the guidance under Topic 718, as of January 1, 2019. In order to calculate warrant charges, the Company used the Black-Scholes pricing model, which required key inputs including volatility and risk-free interest rate and certain unobservable inputs for which there is little or no market data, requiring the Company to develop its own assumptions. The Company estimated the fair value of unvested warrants, considered to be probable of vesting, at the time. Based on that estimated fair value, the Company determined warrant charges, which are recorded as a reduction of revenue in the consolidated statement of operations. Recent Accounting Pronouncements Recently Adopted Accounting Pronouncements In March 2020, ASU 2020-04, Reference Rate Reform (Topic 848): Facilitation of the Effects of Reference Rate Reform on Financial Reporting, was issued to provide temporary optional expedients and exceptions to the GAAP guidance on contract modifications and hedge accounting to ease the financial reporting burdens related to the expected market transition from the London Interbank Offered Rate (LIBOR) and other interbank offered rates to alternative reference rates. This update was effective starting March 12, 2020 and the Company may elect to apply the amendments prospectively through December 31, 2022. The adoption of this standard is not expected to have a material impact on the Company’s consolidated financial statements. During the fourth quarter of fiscal year 2022, the Company adopted the optional relief guidance provided under this ASU after modifying certain debt to update the reference rate from LIBOR to Secured Overnight Financing Rate (SOFR). This caused a temporary mismatch in our interest rate swap and debt for a period of time. The application of this expedient preserves the presentation of the derivatives consistent with past presentation. In October of 2021, ASU No. 2021-08- Business Combinations (Topic 805): Accounting for Contract Assets and Contract Liabilities from Contracts with Customers was issued. The standard update provides an exception to the fair value measurement for revenue contracts acquired in a business combination. The Company has elected to early adopt the standards update as of the fourth quarter of 2021. On January 1, 2021, we early adopted ASU No. 2020-06, Debt — Debt with Conversion and Other Options (Subtopic 470-20) and Derivatives and Hedging — Contracts in Entity’s Own Equity (Subtopic 815-40) using the modified retrospective approach. Consequently, the Company’s 3.75% Convertible Senior Notes due 2025 (the “3.75% Convertible Senior Notes”) is now accounted for as a single liability measured at its amortized cost. This accounting change removed the impact of recognizing the equity component of the Company’s convertible notes at issuance and the subsequent accounting impact of additional interest expense from debt discount amortization. Future interest expense of the convertible notes will be lower as a result of adoption of this guidance and net loss per share will be computed using the if-converted method for convertible instruments. The cumulative effect of the accounting change upon adoption on January 1, 2021 increased the carrying amount of the 3.75% Convertible Senior Notes by $120.6 million, reduced accumulated deficit by $9.6 million and reduced additional paid-in capital by $130.2 million. Recently Issued and Not Yet Adopted Accounting Pronouncements In March 2020, ASU 2020-03, Codification Improvements to Financial Instruments, was issued to make various codification improvements to financial instruments to make the standards easier to understand and apply by eliminating inconsistencies and providing clarifications. This update will be effective at various dates beginning with date of issuance of this ASU. The adoption of this standard will not have a material impact on the Company’s consolidated financial statements. Item 7A. Quantitative and Qualitative Disclosures about Market Risk Equity Risk As of December 31, 2022, the Company is exposed to market risk with respect to our portfolio of marketable securities with a fair value of $134.8 million. These securities are exposed to market volatilities, changes in price and interest rates. Credit Risk As of December 31, 2022 and 2021, our cash and cash equivalents were maintained with financial institutions in which our current deposits are in excess of insured limits. We believe these institutions have sufficient assets and liquidity to conduct its operations in the ordinary course of business with little or no credit risk to us. Interest Rate Risk The risk associated with fluctuating interest rates is primarily limited to our cash equivalents and available-for-sale securities. We do not utilize derivative financial instruments, derivative commodity instruments or other market risk sensitive instruments, positions or transactions in any material fashion, except for the 5.5% Notes Capped Call and the 3.75% Notes Capped Call purchased in March 2018 and May 2020, respectively, related to the issuance of the 5.5% Convertible Senior Notes and 3.75% Convertible Senior Notes. Additionally, the Company purchased a Common Stock Forward in March 2018 in conjunction with the issuance of the 5.5% Convertible Senior Notes. That Common Stock Forward was extended upon issuance of the 3.75% Convertible Senior Notes. Foreign Currency Exchange Rate Risk Portions of our revenue and operating expenses that are incurred outside the United States are denominated in foreign currencies and are subject to fluctuations due to changes in foreign currency exchange rates, particularly changes in the Euro. Our exposure to changes in foreign currency rates is primarily related to operations of Plug Power Europe, our French subsidiary, that develops and sells hydrogen fuel cell systems for the European material handling market. Additionally, our wholly-owned subsidiary, Frames, is headquartered in the Netherlands. Fluctuations in foreign currency exchange rates may cause us to recognize transaction gains and losses in our statements of operations and comprehensive loss. We also have three joint ventures (1) an investment in HyVia, a joint venture with Renault that plans to manufacture and sell FCELCVs and to supply hydrogen fuel and fueling stations to support the FCE-LCV market primarily in Europe, (2) an investment in AccionaPlug S.L., a joint venture with Acciona, and (3) an investment in SK Hyverse, a joint venture with SK E&S. Our exposure to foreign currency can give rise to foreign exchange risk resulting from our equity method investments with HyVia and Acciona, which both operate in Europe, and SK Hyverse which operates in Asia. Our HyVia, AccionaPlug S.L. and SK Hyverse exposure presently is immaterial as we have not yet commenced commercial activities. Inflation Risk Inflationary factors, such as increases in our cost of goods sold and operating expenses, may adversely affect our operating results. Although we do not believe that inflation has had a material impact on our financial position or results of operations to date, a high rate of inflation in the future may have an adverse effect on our ability to maintain and increase our gross margin and selling and marketing and operating expenses as a percentage of our revenue if the selling prices of our products do not increase as much as or more than these increased costs. Item 8. Financial Statements and Supplementary Data The Company’s consolidated financial statements and related notes, together with the report of independent registered public accounting firm, appear at pages F-1 through F-62 of this Annual Report on Form 10-K for the year ended December 31, 2022 and are incorporated by reference in this Item 8. Item 9. Changes in and Disagreements with Accountants on Accounting and Financial Disclosure None. Item 9A. Controls and Procedures Evaluation of Disclosure Controls and Procedures We maintain disclosure controls and procedures that are designed to ensure that information required to be disclosed in our reports that we file or submit under the Exchange Act, are recorded, processed, summarized and reported within the time periods specified in SEC rules and forms, and that such information is accumulated and communicated to our management, including our Chief Executive Officer (our principal executive officer) and Chief Financial Officer (our principal financial officer) as appropriate, to allow for timely decisions regarding required disclosure. Our management, with the participation of our Chief Executive Officer and Chief Financial Officer, has evaluated the effectiveness of our disclosure controls and procedures (as defined in Rules 13a-15(e) and 15d-15(e) under the Exchange Act), as of December 31, 2022. Based on such evaluation, our Chief Executive Officer and Chief Financial Officer have concluded that as of December 31, 2022, our disclosure controls and procedures were not effective because of material weaknesses in internal control over financial reporting described below. Notwithstanding such material weaknesses in internal control over financial reporting, our management, including our Chief Executive Officer and Chief Financial Officer, has concluded that our consolidated balance sheets as of December 31, 2022 and 2021, the related consolidated statements of operations, comprehensive loss, stockholders’ equity (deficit), and cash flows for each ofyears in the three-year period ended December 31, 2022, present fairly, in all material respects, our financial position, results of our operations and our cash flows for the periods presented in this Annual Report on Form 10-K, in conformity with GAAP. Previously disclosed material weaknesses During fiscal years 2021 and 2022, with the oversight of the Audit Committee of the Board of Directors, the Company began implementing a remediation plan to address the material weaknesses identified as of December 31, 2021. The Company expanded its finance and accounting team, including hiring a number of additional individuals with the requisite technical accounting and finance knowledge and experience to assist with the enhancement and implementation of internal control policies and procedures related to the accounting matters in our business. As dedicated resources have been onboarded to address the previously disclosed material weaknesses, we are now able to conduct an effective risk assessment process that is responsive to changes in the Company’s operating environment and business. These dedicated resources have allowed us to implement enhanced process-level controls around the accounting for the a) presentation of operating expenses; b) accrual for loss contracts related to service; c) identification of adjustments to physical inventory; and d) proper capitalization of inventory costs. Lastly, due to the additional information technology resources hired, we were able to implement certain general information technology controls over our information technology system used in calculating fuel billings. Management has determined that these enhancements to our risk management process, and enhancements to certain process-level controls and information technology controls, are operating effectively and consider the risk management process, process-level and general information technology material weaknesses identified in the prior year to be remediated as of December 31, 2022. Despite the progress discussed above, during 2021 and 2022 there were several matters that hindered our ability to fully remediate all of the material weaknesses that were identified in the prior year. These include: | a) | We completed the acquisition of four private companies for approximately $400 million, with the two largest acquisitions completed late in 2021, and have established four new joint ventures. Some of the acquisitions and the joint ventures include an international footprint. These activities have resulted in delays in implementing certain control activities on a consistent basis across all of our subsidiaries. |
| b) | We experienced significant growth in our market offerings, geographic footprint, and our business operations, which has resulted in an increase in the volume of complex and non-routine transactions that require additional specialized technical accounting resources that we were not able to source in a timely manner; |
| c) | The onboarding of over 60 accounting and finance personnel since March of 2021 to address the prior year material weaknesses resulted in delays in the timeliness of executing controls, or controls activities were performed without sufficiently documented supporting evidence of their operating effectiveness. We believe that these added resources and the implementation of newly designed controls require additional time to demonstrate operating effectiveness; and |
| d) | Given the growth and increased complexity in our company and markets discussed above, we experienced delays in control testing that negatively impacted the timing of identifying deficiencies, limiting management’s ability to provide appropriate oversight, monitoring and enforcement of corrective actions. |
While we believe that our efforts have improved our internal control over financial reporting and resulted in the remediation of certain of the material weaknesses identified as of December 31, 2021, remediation of the material weaknesses as of December 31, 2022, will require further validation and testing of the design and operating effectiveness of internal controls over a sustained period of financial reporting cycles. Management’s Report on Internal Control Management is responsible for establishing and maintaining adequate internal control over financial reporting (as defined in Rules 13a-15(f) and 15d-15(f) under the Exchange Act). Our internal control over financial reporting includes controls and procedures designed to provide reasonable assurance regarding the reliability of financial reporting and the preparation of financial statements for external reporting purposes in accordance with GAAP. The Company’s management, with the participation of our Chief Executive Officer and Chief Financial Officer, under the oversight of our Board, conducted an evaluation of the effectiveness of our internal control over financial reporting as of December 31, 2022, based on the criteria established in Internal Control -- Integrated Framework (2013) issued by the Committee of Sponsoring Organizations of the Treadway Commission (“COSO”). Based on this evaluation, management determined, based upon the existence of the material weaknesses described below, that we did not maintain effective internal control over financial reporting. The Company acquired Joule Processing LLC, Alloy Custom Products, LLC and WesMor Cryogenics, LLC (together, the “Acquired Companies”) during 2022, and management excluded from its assessment of the effectiveness of the Company’s internal control over financial reporting as of December 31, 2022, the internal controls of the Acquired Companies, which represent total assets of $113.1 million (or 2.1% of our total assets exclusive of acquired intangible assets and goodwill) and total revenues of $40.2 million (or 5.7% of our consolidated revenues) included in the consolidated financial statements of the Company as of and for the year ended December 31, 2022. A company’s internal control over financial reporting includes those policies and procedures that (1) pertain to the maintenance of records that, in reasonable detail, accurately and fairly reflect the transactions and dispositions of the assets of the company; (2) provide reasonable assurance that transactions are recorded as necessary to permit preparation of financial statements in accordance with GAAP, and that receipts and expenditures of the company are being made only in accordance with authorizations of management and directors of the company; and (3) provide reasonable assurance regarding prevention or timely detection of unauthorized acquisition, use, or disposition of the company’s assets that could have a material effect on the financial statements. A material weakness is a deficiency, or a combination of deficiencies, in internal control over financial reporting such that there is a reasonable possibility that a material misstatement of our annual or interim financial statements will not be prevented or detected on a timely basis. The Company has determined certain material weaknesses exist as of December 31, 2022, in three components of internal control based on criteria established in the COSO framework. The Company has identified a deficiency in one of the principles associated with the Control Environment component of the COSO framework, specifically relating to a lack of a sufficient complement of qualified technical accounting and financial reporting personnel to perform control activities surrounding complex and non-routine transactions. Because of the need for additional technical accounting resources, the Company also identified a deficiency in the principles associated with the Control Activities component of the COSO framework, specifically relating to design and deploying control activities through internal control policies that establish what is expected and procedures that put policies into action. Additionally, management identified a deficiency in one of the principles associated with the Monitoring component of the COSO framework, specifically relating to selecting, developing, and performing ongoing evaluation to ascertain whether the components of internal controls are present and functioning. The above control deficiencies constitute material weaknesses, either individually or in the aggregate. The Company’s independent registered public accounting firm, Deloitte & Touche LLP, who audited the consolidated financial statements included in this Annual Report on Form 10-K issued an adverse opinion on the effectiveness of the Company’s internal control over financial reporting. Deloitte & Touche LLP’s report appears is included herein. 2023 Remediation Plans Management’s remediation plan to address the control deficiencies existing as of December 31, 2022, includes the following: ��� | ● | Continuing to hire qualified technical accounting and financial reporting personnel with public company experience to perform control activities surrounding complex and non-routine transactions; |
| ● | The Company will continue the process of implementing or enhancing control activities for our acquired companies; |
Executive Compensation Practices
| ● | The Compensation Committee reviews onCompany will enhance the design of its controls over non-routine, complex transactions, and control activities that involve the use of third parties; |
| ● | During the second quarter of 2022, the Company hired an ongoing basisInternal Audit Director, with experience in testing internal control over financial reporting process, who will be implementing an annual audit plan that includes monitoring and operation of internal controls, and addressing control deficiencies. The Company plans to hire additional internal audit resources with auditing internal controls to assist with the Company’s executive compensation programmonitoring of control activities; and |
| ● | We started the process to evaluate whether it supports the Company’s executive compensation objectivesimplement a new ERP system which will provide a stronger internal control infrastructure for financial reporting and is aligned with stockholder interests. Our executive compensation practices include the following, each of which the Compensation Committee believes reinforcesfor our executive compensation objectives: | | internal control procedures. | What We Do
| | What We Don’t Do
| ✓ Pay for performance by structuring a significant percentage of target annual compensation in the form of variable, at-risk compensation
|
As we continue to evaluate and work to remediate the control deficiencies that gave rise to the material weaknesses, we may determine that additional measures or time are required to address the control deficiencies or that we need to modify or otherwise adjust the remediation measures described above. We will continue to assess the effectiveness of our remediation efforts in connection with our evaluation of our internal control over financial reporting. Changes in Internal Control over Financial Reporting Except for the identification of the material weaknesses described above and the remediation of certain of the material weaknesses that existed as of December 31, 2021, there were no changes during the quarter ended December 31, 2022 in our internal control over financial reporting that have materially affected, or are reasonably likely to materially affect, our internal control over financial reporting. REPORT OF INDEPENDENT REGISTERED PUBLIC ACCOUNTING FIRM To the stockholders and the Board of Directors of Plug Power Inc. Opinion on Internal Control over Financial Reporting We have audited the internal control over financial reporting of Plug Power Inc, and subsidiaries (the “Company”) as of December 31, 2022, based on criteria established in Internal Control — Integrated Framework (2013) issued by the Committee of Sponsoring Organizations of the Treadway Commission (COSO). In our opinion, because of the effect of the material weaknesses identified below on the achievement of the objectives of the control criteria, the Company has not maintained effective internal control over financial reporting as of December 31, 2022, based on criteria established in Internal Control — Integrated Framework (2013) issued by COSO. We have also audited, in accordance with the standards of the Public Company Accounting Oversight Board (United States) (PCAOB), the consolidated financial statements as of and for the year ended December 31, 2022, of the Company and our report dated March 1, 2023, expressed an unqualified opinion on those financial statements. As described in Management’s Report on Internal Control Over Financial Reporting, management excluded from its assessment the internal control over financial reporting at Joule Processing LLC, Alloy Custom Products, LLC and WesMor Cryogenics, LLC which were acquired during 2022, and whose financial statements constitutes 2.1% of total assets, 5.7% of revenues of the consolidated financial statements as of and for the year ended December 31, 2022. Accordingly, our audit did not include the internal control over financial reporting at Joule Processing LLC, Alloy Custom Products, LLC and WesMor Cryogenics, LLC. Basis for Opinion The Company’s management is responsible for maintaining effective internal control over financial reporting and for its assessment of the effectiveness of internal control over financial reporting, included in the accompanying Management’s Report on Internal Control. Our responsibility is to express an opinion on the Company’s internal control over financial reporting based on our audit. We are a public accounting firm registered with the PCAOB and are required to be independent with respect to the Company in accordance with the U.S. federal securities laws and the applicable rules and regulations of the Securities and Exchange Commission and the PCAOB. We conducted our audit in accordance with the standards of the PCAOB. Those standards require that we plan and perform the audit to obtain reasonable assurance about whether effective internal control over financial reporting was maintained in all material respects. Our audit included obtaining an understanding of internal control over financial reporting, assessing the risk that a material weakness exists, testing and evaluating the design and operating effectiveness of internal control based on the assessed risk, and performing such other procedures as we considered necessary in the circumstances. We believe that our audit provides a reasonable basis for our opinion. Definition and Limitations of Internal Control over Financial Reporting A company’s internal control over financial reporting is a process designed to provide reasonable assurance regarding the reliability of financial reporting and the preparation of financial statements for external purposes in accordance with generally accepted accounting principles. A company’s internal control over financial reporting includes those policies and procedures that (1) pertain to the maintenance of records that, in reasonable detail, accurately and fairly reflect the transactions and dispositions of the assets of the company; (2) provide reasonable assurance that transactions are recorded as necessary to permit preparation of financial statements in accordance with generally accepted accounting principles, and that receipts and expenditures of the company are being made only in accordance with authorizations of management and directors of the company; and (3) provide reasonable assurance regarding prevention or timely detection of unauthorized acquisition, use, or disposition of the company’s assets that could have a material effect on the financial statements. Because of its inherent limitations, internal control over financial reporting may not prevent or detect misstatements. Also, projections of any evaluation of effectiveness to future periods are subject to the risk that controls may become inadequate because of changes in conditions, or that the degree of compliance with the policies or procedures may deteriorate. Material Weaknesses A material weakness is a deficiency, or a combination of deficiencies, in internal control over financial reporting, such that there is a reasonable possibility that a material misstatement of the company’s annual or interim financial statements will not be prevented or detected on a timely basis. The following material weaknesses have been identified and included in management’s assessment: a deficiency in the principle associated with the control environment component of the COSO framework which, either individually or in the aggregate, constitute a material weakness relating to a lack of a sufficient complement of qualified technical accounting and financial reporting personnel to perform control activities surrounding complex and non-routine transactions. In addition, deficiencies in the principles associated with the control activities component of the COSO framework, which, either individually or in the aggregate, constitute a material weakness relating to the design and deployment of control activities through internal control policies that establish what is expected and procedures that put policies into action. In addition, a deficiency in a principle associated with the monitoring component of the COSO framework, which, either individually or in the aggregate, constitute a material weakness relating to selecting, developing, and performing ongoing evaluation to ascertain whether the components of internal controls are present and functioning. These material weaknesses were considered in determining the nature, timing, and extent of audit tests applied in our audit of the consolidated financial statements as of and for the year ended December 31, 2022, of the Company, and this report does not affect our report on such financial statements. /s/ Deloitte & Touche LLP Rochester, NY March 1, 2023 Item 9B. Other Information On February 28, 2023, the Board of Directors (the “Board”) of the Company, in connection with the new SEC rules and changes to the Exchange Act, regarding universal proxy cards, certain recent changes to the Delaware General Corporation Law (the "DGCL"), and a periodic review of corporate governance matters, approved and adopted amended and restated bylaws of the Company (as so amended and restated, the “Fifth Amended and Restated Bylaws”), effective as of such date. The Fifth Amended and Restated Bylaws, among other things: ✓ | ● | Clarify that the Board may determine that a meeting of stockholders may be conducted solely by means of remote communication. (Article I, Section 1)Market comparison of executive compensation against a relevant peer group
✓Offer market-competitive benefits for executives that are consistent with the rest of our employees
✓Consult with an independent compensation consultant on compensation levels and practices
✓Maintain robust stock ownership guidelines
✓Have a clawback policy that applies to cash and equity incentive compensation
✓Hold an annual say-on-pay vote
✓Have a minimum vesting period of one year for equity awards, subject to certain limited exceptions
| | × Allow hedging of equity without preapproval
× Allow for re-pricing of stock options without stockholder approval
× Provide excessive perquisites
× Provide supplemental executive retirement plans
× Provide any excise tax gross-ups
× Provide single-trigger severance arrangements
|
| ● | Setting Executive Compensation
The Compensation Committee is responsible for reviewing,Address matters relating to Rule 14a-19 under the Exchange Act (the "Universal Proxy Rules"), including requiring: (a) the stockholder’s nomination notice to include a representation that it intends to solicit proxies from stockholders representing at least 67% of the voting power of shares entitled to vote on the election of directors; (b) the stockholder to comply with the Universal Proxy Rules and recommendingprovide reasonable evidence thereof prior to the stockholder meeting; and (c) the stockholder to use a proxy card color other than white, which is reserved for the exclusive use of the Board. (Article I, Sections 2 and 6)
|
| ● | Enhance the informational and procedural requirements in connection with stockholder proposals and stockholder director nominations, including: (a) requiring additional information about the stockholder making the director nomination or proposal; (b) requiring additional information about the stockholder proposed business and/or director nominee; and (c) providing that the number of nominees a stockholder may nominate for election at the annual meeting of the stockholders may not exceed the number of directors to be elected at such annual meeting. (Article I, Section 2) |
| ● | Modify the provisions relating to adjournment procedures and availability of lists of stockholders entitled to vote at stockholder meetings, in each case, to reflect recent amendments to the DGCL. (Article I, Sections 4 and 8) |
| ● | Provide that any proxies received for disqualified or withdrawn Board for approval,nominees will be treated as abstentions. (Article I, Section 6) |
| ● | Clarify the compensationpowers of our executive officers,the chair of a stockholder meeting, including our named executive officers. The Compensation Committee is composed entirely of non-employee directors who are “independent” as that term is defined in the applicable NASDAQ Rules. In making its recommendations regarding executive compensation, our Compensation Committee annually reviews the performance of our executives with our Chief Executive Officer, and our Chief Executive Officer makes recommendations to our Compensation Committee with respect to the appropriate base salary, annual incentive bonuseschair’s ability to prescribe rules and performance measures, and grants of long-term equity incentive awardsregulations for each of our executives other than himself. The Chairmanthe conduct of the Compensation Committee makes recommendations tomeeting. (Article I, Section 9) |
| ● | Clarify the Compensation Committee with respect to the Chief Executive Officer’s compensation. The Compensation Committee makes its determination regarding executive compensation and then makes a recommendation tomanner in which vacancies on the Board for approval. Themay be filled. (Article II, Section 4) |
| ● | Establish that the Board discussesmay designate a presiding director who presides over Board meetings. (Article II, Section 14) |
| ● | Provide that the Compensation Committee’s recommendations and ultimately approvesBoard (or a committee thereof) may fix the compensation of the executive officers.In setting executive base salariesCompany’s officers and annual cash bonusesthat any one person may hold any number of officer roles. (Article III, Section 1)
|
| ● | Amend the director resignation and granting equity incentive awards,removal provisions to grant the Compensation CommitteeBoard authority with respect to compensation following a resignation or removal. (Article III, Section 5) |
| ● | Provide that the Company may enter into stock transfer agreements, as permitted by the DGCL. (Article IV, Section 3) |
| ● | Modify the provisions related to the indemnification of directors and officers, including the permissibility of advancement of expenses and the contractual nature of indemnification. (Article V) |
| ● | Clarify that the Board consider compensationdetermines the Company’s fiscal year. (Article VI, Section 1) |
| ● | Add a federal forum provision to designate the federal district courts as the exclusive forum for comparable positionsmatters arising under the Securities Act of 1933, as amended, and the Exchange Act. (Article VI, Section 8) |
| ● | Make various other updates, including ministerial and conforming changes and changes to clarify the Company’s ability to conduct business by means of remote communication. |
The foregoing description of the Fifth Amended and Restated Bylaws is qualified in its entirety by the full text of the Fifth Amended and Restated Bylaws filed as Exhibit 3.9 hereto and incorporated herein by reference. Item 9C. Disclosure Regarding Foreign Jurisdictions that Prevent Inspections Not applicable.
PART III Item 10. Directors, Executive Officers and Corporate Governance The information required under this item is incorporated herein by reference from the Company’s definitive proxy statement pursuant to Regulation 14A, which proxy statement will be filed with Securities and Exchange Commission not later than 120 days after the close of the Company’s fiscal year ended December 31, 2022. Code of Conduct We have adopted a code of conduct applicable to all of our directors, officers and employees, including our principal executive officer, principal financial officer, principal accounting officer or controller, or persons performing similar functions. Our code of conduct is a “code of ethics” as defined in Item 406(b) of Regulation S-K and embodies our principles and practices relating to the ethical conduct of our business and our long-standing commitment to honesty, fair dealing and full compliance with all laws affecting our business. In the event that we amend or waive certain provisions of our code of conduct in a manner that requires disclosure under applicable rules, we intend to provide such required disclosure on our website in accordance with applicable SEC and NASDAQ Rules. Our code of ethics is available on our website at www.plugpower.com under Investor Relations — Governance — Governance Documents — Code of Conduct. Our website is not incorporated into or a part of this Annual Report on Form 10-K. Item 11. Executive Compensation The information required under this item is incorporated herein by reference from the Company’s definitive proxy statement pursuant to Regulation 14A, which proxy statement will be filed with Securities and Exchange Commission not later than 120 days after the close of the Company’s fiscal year ended December 31, 2022. Item 12. Security Ownership of Certain Beneficial Owners and Management and Related Stockholder Matters Except for the information regarding securities authorized for issuance under equity compensation plans (which is set forth below), the information required under this item is incorporated herein by reference from the Company’s definitive proxy statement pursuant to Regulation 14A, which proxy statement will be filed with Securities and Exchange Commission not later than 120 days after the close of the Company’s fiscal year ended December 31, 2022. Securities Authorized for Issuance Under Equity Compensation Plans The following table gives information, as of December 31, 2022, about the shares of our common stock that may be issued upon the exercise of options and restricted stock under the Company’s 2021 Stock Option and Incentive Plan, as amended, (the “2021 Stock Option Plan”): | | | | | | | | | | | Number of shares to be issued upon exercise of outstanding options, warrants and rights | | Weighted average exercise price of outstanding options, warrants and rights | | Number of shares remaining for future issuance under equity compensation plans (excluding shares reflected in column (a)) | | Plan Category | | (a) | | (b) (1) | | (c) | | Equity compensation plans approved by security holders | | 26,830,251 | (2) | $ | 17.76 | | 13,218,775 | | Equity compensation plans not approved by security holders | | 768,018 | (3) | $ | 4.26 | | — | | Total | | 27,598,269 | | | | | 13,218,775 | |
| (1) | The weighted-average exercise price is calculated solely based on outstanding options. |
| (2) | Represents 19,851,548 shares underlying outstanding options issued under the 2021 Stock Option Plan and 6,978,703 shares underlying outstanding options issued under the 2011 Stock Option Plan. The amounts reported in the market,table do not include 4,837,722 shares of restricted stock granted under the historical compensation levels2021 Stock Option Plan and 1,351,987 shares of our executives, individual performance as compared to our expectations and objectives, our desire to motivate our employees to achieve short and long-term results that are inrestricted stock granted under the best interests of our stockholders, and a long-term commitment to our Company.812011 Stock Option Plan.
|
Independent Compensation Consultant
For purposes of evaluating 2020 compensation for each of our named executive officers and making 2020 compensation decisions, our Compensation Committee retained Radford as its independent compensation consultant. Radford has not performed services for the Company other than consulting services related to the compensation and benefits of our executives and directors. Radford assisted the Compensation Committee in the development of a compensation peer group and provided their market analysis of the various components of compensation for the named executive officer positions, including base salary, annual cash bonus and equity compensation.
Our Compensation Committee has analyzed whether the work of Radford raised any conflict of interest, taking into account relevant factors in accordance with SEC guidelines. Based on its analysis, our Compensation Committee determined that the engagement of Radford does not create any conflict of interest pursuant to the SEC guidelines and NASDAQ Rules.
Peer Group Selection and Market Data
In evaluating the total compensation of our named executive officers, our Compensation Committee, using information provided by Radford, established a peer group of publicly traded companies. Developing a compensation peer group for the Company for compensation comparison purposes is challenging because there are few pure fuel cell peer companies that are publicly-traded, stand-alone, U.S.-based and size-appropriate. Nonetheless, we strive to establish a peer group that provides appropriate compensation data for evaluating the competitiveness of our compensation program and we believe that the mix of companies in the technology and fuel cell industries that comprise our compensation peer group provides appropriate reference points for compensation and performance comparisons. However, the companies in our peer group have historically differed from the companies used as peers by some proxy advisory firms. These differences in the composition of compensation peer groups can result in substantial differences in how such firms view our compensation relative to our peers.
Our 2020 peer group was selected based on a balance of the following criteria:
| ● | size-appropriate companies that operate in similar industries; |
| ● | companies against which we believe we compete for executive talent; and |
| ● | public companies based in the United States whose compensation and financial data are available in proxy statements or through widely available compensation surveys. |
It is important to note that while any one individual peer company will not be fully reflective of Plug Power’s size, business model and industry, the peer group, as a whole, aims to reasonably represent Plug Power’s competitive market for executive talent, business characteristics, and business stage.
Based on these criteria, our peer group for 2020, as approved by our Compensation Committee, was comprised of the following 22 companies:
| | |
| 2020 Peer Group
|
| Acacia Communications, Inc.
| Cree, Inc.
| Power Integrations, Inc.
| AeroVironment, Inc.
| FuelCell Energy, Inc.
| Rogers Corp.
| Ambarella, Inc.
| Inphi Corporation
| Semtech Corp.
| Ballard Power Systems Inc.
| Lattice Semiconductor Corp.
| Silicon Laboratories, Inc.
| Bloom Energy Corp.
|
MACOM Technology Solutions Holdings, Inc.
| SolarEdge Technologies, Inc.
| Brooks Automation, Inc.
| MaxLinear, Inc.
| Sunrun, Inc.
| Canadian Solar Inc.
| Mercury Systems, Inc.
|
| Chart Industries, Inc.
| NetScout Systems, Inc.
|
|
Based on data compiled by Radford at the time of the peer group review, our revenues and market capitalization margin were at the 12th and 49th percentiles, respectively, in relation to the peer group.
As an additional reference, our Compensation Committee also uses data from the Radford Global Technology executive compensation survey (the “Radford Survey”) to evaluate the competitive market generally when formulating its recommendation for the total direct compensation packages for our executive officers. The Radford Survey provides compensation market intelligence and is widely used within the technology industry.
Due to the nature of our business, we also compete for executive talent with companies outside our peer group, including public companies that are larger and more established than we are or that possess greater resources than we do, and with smaller private companies that may be able to offer greater compensation potential.
In setting compensation, the Compensation Committee considers each executive’s level and job performance, his duties and responsibilities at the Company compared to the duties and responsibilities of executive officers in similar positions at the peer group companies and in the survey data, other circumstances unique to the Company, and evaluates whether the compensation elements and levels provided to our executives are generally appropriate relative to their responsibilities at the Company and compensation elements and levels provided to their counterparts in the peer group or within survey data. The Compensation Committee considers both objective and subjective criteria to evaluate Company and individual performance, which allows it to exercise informed judgment and not rely solely on rigid benchmarks. Accordingly, the Compensation Committee does not formulaically tie compensation decisions to any particular percentile level of total compensation paid to executives at the peer group companies or survey data.
Looking ahead to 2021 − Our peer group for 2021, as approved by our Compensation Committee, is comprised of the following 22 companies:
| | |
| 2021 Peer Group
|
| AeroVironment, Inc.
| FuelCell Energy, Inc.
| Rogers Corp.
| Ambarella International, L.P.
| Generac Holdings Inc.
| Semtech Corp.
| Ballard Power Systems, Inc.
| Inphi Corp.
| Silicon Laboratories, Inc.
| Bloom Energy Corp.
| Lattice Semiconductor Corp.
| SolarEdge Technologies, Inc.
| Brooks Automation, Inc.
| MACOM Technology Solutions Holdings, Inc.
| SunPower Corp.
| Chart Industries, Inc.
| MaxLinear, Inc.
| Sunrun Inc.
| Cree, Inc.
| Monolithic Power Systems, Inc.
|
| Enphase Energy, Inc.
| Power Integrations, Inc.
|
|
Our revenues and market capitalization margin were at the 23rd and 100th percentiles, respectively, in relation to the peer group.
Role of Stockholder Say-on-Pay
We pay careful attention to any feedback we receive from our stockholders about our executive compensation program. At our 2020 Annual Meeting of Stockholders, we conducted our annual non-binding, advisory vote on the compensation of our named executive officers, commonly referred to as a “say-on-pay” vote, in accordance with the Dodd-Frank Wall Street Reform and Consumer Protection Act of 2010. Approximately 81% of the votes cast by stockholders on this proposal were cast in support of the compensation paid to our named executive officers. Although the results of the say-on-pay vote are advisory and not binding on the Company, the Board or the Compensation Committee, we value the opinions of our stockholders and take the results of the say-on-pay vote into account when making decisions regarding the compensation of our named executive officers.
Our Executive Compensation Program
The primary components of our executive compensation program are base salary, annual cash incentive bonuses and long-term equity incentive compensation. Consistent with the emphasis we place on pay-for-performance, annual performance-based bonuses and long-term equity incentive compensation in the form of stock options, premium priced stock options and restricted stock constitute a significant portion of our total executive compensation.
Within the context of the overall objectives of our compensation programs, our Compensation Committee and Board of Directors determined the specific amounts of compensation to be paid to each of our executives in 2020 based on a number of factors, including:
| ● | Our executives’ and Company performance during 2020 in general and as measured against pre-established performance goals; |
| ● | The nature, scope and level of our executives’ responsibilities; |
| ● | Our executives’ effectiveness in leading the Company’s initiatives to increase customer and stockholder value, productivity and revenue growth; |
| ● | The individual experience and skills of, and expected contributions from, our executives; |
| ● | Our executive’s contribution to the Company’s commitment to corporate responsibility, including our executive’s success in creating a culture of unyielding integrity and compliance with applicable law and the Company’s ethics policies; |
| ● | The amounts of compensation being paid to our other executives; |
| ● | Our executives’ contribution to our business performance and financial results; |
| ● | Our executives’ historical compensation at our Company; and |
| ● | Any contractual commitments we have made to our executives regarding compensation. |
Each of the primary elements of our executive compensation is discussed in detail below and the compensation paid to our named executive officers in 2020 is discussed under each element. In the descriptions below, we have identified particular compensation objectives which we have designed our executive compensation programs to serve; however, we have designed our compensation programs to complement each other and to collectively serve all of our executive compensation objectives described above. Accordingly, whether or not specifically mentioned below, we believe that, as a part of our overall executive compensation, each element to a greater or lesser extent serves each of our objectives.
Base Salary
Base salaries are the smallest component of each executive officer’s total direct compensation and represent a fixed amount paid to each executive for performing his or her normal duties and responsibilities. Our executives’ base salaries reflect the initial base salaries that we negotiated with each of our executives at the time of his initial employment or promotion and our subsequent adjustments to these amounts to reflect market increases, the growth and stage of development of our Company, our executives’ performance and increased experience, any changes in our executives’ roles and responsibilities, and other factors. The following table sets forth the annual base salaries for our named executive officers for each of 2019 and 2020, as well as the percentage increase year-over-year. Consistent with our pay-for-performance philosophy, the increases are merit based in recognition of strong performance and contribution:
| | | | |
|---|
Name | 2019
Base Salary
($) | 2020
Base Salary
($)(1) | Increase
(%) | |
|---|
Andrew J. Marsh | 600,000 | 676,442 | 12.7% | ● Mr. Marsh’s last salary increase was in 2014 | Paul B. Middleton | 375,000 | 387,188 | 3.3% | ● Mr. Middleton’s last salary increase was in 2014 | Sanjay K. Shrestha | 306,538 | 338,222 | 10.3% | ● Mr. Shrestha’s first salary increase since hire in 2019 to reflect additional responsibilities in connection with leadership of our Energy Solutions Business | Keith C. Schmid | 391,000 | 393,317 | 2.5% | ● Mr. Schmid’s last salary increase was in 2015 | Jose Luis Crespo | 220,000 | 227,692 | 3.5% | ● Mr. Crespo’s last salary increase was in 2014 |
| (1) | The reported amounts reflect the effective annual base salaries for 2020 which are a composite of (a) base salaries in effect from January 1, 2020 to September 28, 2020, which were as follows: Andrew J. Marsh – $651,923; Paul B. Middleton – $386,250; Sanjay K. Shrestha – $325,962; Keith C. Schmid – $391,000; and Jose Luis Crespo – $226,922 and (b) base salary increases in effect from September 29, 2020 through December 31, 2020, which were as follows: Andrew J. Marsh – $750,000; Paul B. Middleton – $390,000; Sanjay K. Shrestha – $375,000; Keith C. Schmid – $400,000; and Jose Luis Crespo – $230,000. |
Annual Cash Incentive Bonuses
Our named executive officers are eligible to receive annual cash incentive bonuses based on our pay-for-performance incentive compensation program. Annual bonuses for 2020 were based upon Company performance as measured against pre-established performance goals, including financial measures, achievement of strategic objectives, and other factors as described in more detail below. The primary objective of this program is to motivate and reward our named executive officers for meeting Company performance goals that drive the long-term success of our business.
At the beginning of the year (and prior to the onset of the pandemic), the Compensation Committee and the Board established threshold, target and stretch attainment levels for each of our named executive officers based on a percentage of his base salary. The threshold level for each performance goal is considered reasonably difficult for the executive to attain, and our expectation for baseline performance before any bonus will be paid. The target attainment level is considered challenging for the executive to attain, and the executive would need to exceed expectations to achieve this level. The stretch attainment level is considered exceptionally challenging for the executive to attain, and the executive would need to significantly outperform to achieve this level. The table below sets forth, for each named executive officer,
the threshold, target and stretch annual bonus opportunity, both as a percentage of the named executive officer’s year-end base salary and in dollars.
| | | | | | | Name | 2020 Threshold Annual Bonus
(%) | 2020 Threshold Annual Bonus ($) | 2020 Target Annual Bonus (% ) | 2020 Target Annual Bonus
($) | 2020 Stretch Annual Bonus
(% ) | 2020 Stretch Annual Bonus
($) | Andrew J. Marsh | 65% | 487,500 | 100% | 750,000 | 135% | 1,012,500 | Paul B. Middleton | 65% | 253,500 | 100% | 390,000 | 135% | 526,500 | Sanjay K. Shrestha | 65% | 243,750 | 100% | 375,000 | 135% | 506,250 | Keith C. Schmid | 65% | 260,000 | 100% | 400,000 | 135% | 540,000 | Jose Luis Crespo | 100% | 230,000 | 200% | 460,000 | 400% | 920,000 |
At the beginning of each year the Compensation Committee and the Board select performance metrics and approve Company performance goals. The 2020 metrics and goals were established prior to the onset of the Covid-19 pandemic; however, notwithstanding the potential business disruption that was expected as a result of the pandemic, the goals were not decreased to address the pandemic. The actual amounts of annual incentive bonuses for 2020 were determined based on achievement of these pre-established corporate objectives. The 2020 Company goals approved by our Board and Compensation Committee, the relative weightings assigned to each goal at the beginning of the year, and the performance against these Company goals for 2020 are set forth below.
| | | | | | | | | | | 2020 Annual Incentive Goals | | Relative Weighting | | | Actual Achievement for 2020 (as a % of target) | | | Weighted Performance | | Gross Billings Threshold: $230 Million Target: $310 Million Stretch: $341 Million | | 35% | | | 126% | | | 44% | | Adjusted Operating EBITDA Threshold: $27 Million Target: $36 Million Stretch: $48.5 Million | | 35% | | | 108% | | | 38% | | Key Strategic Initiatives Threshold: Three
Target: Four Stretch: Five | | 30% | | | 135% | | | 40.5% | | 2020 Company Goal Achievement | | 100% | | | | | | | 122.5% | |
| ● | Gross Billings. Gross billings is a measure of topline performance and is based on the invoice value of equipment deployed and services rendered. Invoice value of equipment is measured on a relative basis using cash value within contracts with customers and it is attributed to the period in which the equipment is deployed. To that amount, the Company adds the invoice value for services rendered in the period. These services include fuel provided, extended warranty contracts serviced, and power provided under PPAs. The significant estimates and assumptions underlying gross billings include the allocation of revenue, excluding the provision for warrants, based on relative stand-alone selling prices used in the Company’s GAAP revenue numbers. |
| ● | Adjusted Operating EBITDA. Adjusted Operating EBITDA is a measure of operating performance based on operating income (loss), plus stock-based compensation, plus depreciation and amortization, plus right-of-use asset depreciation and interest associated with PPA financings, plus costs associated with acquisitions, restructuring and other charges. |
| ● | Rationale for Metric Adjustments. In measuring Gross Billings and Adjusted Operating EBITDA for purposes of our annual cash incentive plan, the Compensation Committee focuses on the fundamentals of the underlying business performance and adjusts for items that are not indicative of core performance. The purpose of these adjustments is to ensure that the measurement of performance reflects factors that management can directly control and that payout levels are not artificially inflated or impaired by factors unrelated to the core operation of the business. Accordingly, the calculation of these metrics for compensatory purposes may differ from the calculation for external financial reporting purposes. |
After completion of the fiscal year, initially the Chief Executive Officer and other members of management, as appropriate, make a recommendation to the Compensation Committee for each executive’s bonus amount based the level of attainment of each of the Company goals (with the exception of the Chief Executive Officer himself whose level of attainment is evaluated by the Compensation Committee directly).
The Compensation Committee determined the 2020 annual cash incentive awards for the named executive officers using the following framework:
70%Financial Performance
Payout: 0 - 135%
30% Key Strategic Initiatives
Payout: 0 - 135%
Extraordinary Personal Contribution
Overall Payout Cap of 200%
| ● | 2020 Financial Performance Achievement. The financial performance was formulaically calculated and earned at 117% of target. |
| ● | 2020 Key Strategic Initiatives. The Compensation Committee determined that five of the six pre-established strategic initiatives were achieved, resulting in achievement at 135% of target. The five strategic initiatives achieved in 2020 were: |
| - | New multi-site customer in material handling |
| - | Commencing development of the Rochester Innovation Center |
| - | Launching large scale green hydrogen platform |
| - | Establishing pilot program with three large fuel cell electric vehicles’ customers |
| - | Establishing a strategic relationship with a large original equipment manufacturer/fuel provider |
| ● | 2020 Personal Contribution. While the financial and strategic achievements noted above are impressive, it is even more so given that it was accomplished in the face of the uncertainty and business disruption caused by the Covid-19 pandemic. In addition to driving the business forward with numerous other successful initiatives (see discussion under Executive Summary - 2020 Business and Strategic Highlights), the management team worked tirelessly to ensure that the Company addressed the special needs of our employees, our customers and our communities during this period. After discussion and consideration, the Compensation Committee determined that it would be appropriate to recognize and reward the named executive officers for their extraordinary contribution during 2020. |
The Board, after review and discussion and recommendation from the Compensation Committee, determined the final level of attainment for each of the performance goals and the amount of each executive’s annual incentive bonus. The actual cash incentive bonus amounts paid to our named executive officers with respect to performance in 2020 as well as the actual cash incentive bonus amounts as a percentage of target are set forth in the table below. In addition, as all our
employees participated in the same annual bonus program as the named executive officers, all employees similarly earned a 200% bonus payout in recognition of their extraordinary contributions during 2020.
| | | | | |
|---|
Name | 2020
Target Bonus
($) | 2020 Financial/
Strategic
Performance
Achievement
(%) | 2020 Recognition
for Personal
Contribution
(%) | 2020
Actual Bonus
Payment ($) | 2020
Bonus Payment
(% of 2020 Target
Bonus
Opportunity) |
|---|
Andrew J. Marsh | 750,000 | 122.5% | 77.5% | 1,500,000 | 200% | Paul B. Middleton | 390,000 | 122.5% | 77.5% | 780,000 | 200% | Sanjay K. Shrestha | 375,000 | 122.5% | 77.5% | 750,000 | 200% | Keith C. Schmid | 400,000 | 122.5% | 77.5% | 800,000 | 200% | Jose Luis Crespo | 460,000 | 122.5% | 77.5% | 920,000 | 200% |
Long-Term Equity Incentive Compensation
Historically, we have granted long-term equity incentive awards in the form of stock options and restricted stock to executives as part of our total compensation package. In 2020, we chose to use a combination of stock options, premium priced stock options, and restricted stock. Consistent with our emphasis on pay-for-performance, these awards represent a significant portion of total executive compensation. Based on the stage of our Company’s development and the incentives we aim to provide to our executives, we have chosen to use either stock options or a combination of stock options and restricted stock for our long-term equity incentive awards. Our decisions regarding the amount and type of long-term equity incentive compensation and relative weighting of these awards among total executive compensation are based on our understanding of market practices of similarly situated companies and our negotiations with our executives in connection with their initial employment or promotion by our Company.
Stock option awards and premium priced stock option awards provide our executive officers with the right to purchase shares of Common Stock at a fixed exercise price typically for a period of up to ten years. Stock options generally vest over three years, beginning with one-third vesting on the first anniversary of the grant date, one-third vesting on the second anniversary of the grant date and the final one-third vesting on the third anniversary of the grant date, subject to continued service to the Company and acceleration in certain circumstances. Stock option awards are made pursuant to our Third Amended and Restated 2011 Stock Option and Incentive Plan (the “2011 Plan”). Except as may otherwise be provided in the applicable stock option award agreement, stock option awards become fully exercisable upon a “change of control” (as defined in the 2011 Plan). The exercise price of each stock option is equal to, or, in the case of premium priced stock options, in excess of, the closing price of Common Stock on the NASDAQ Capital Market as of the option grant date.
Restricted stock awards provide our executive officers with a long-term incentive alternative to the stock option awards. Restricted stock awards generally vest in equal annual installments over three years from the date of grant, subject to continued employment with the Company.
We consider a number of factors in determining the number of shares subject to stock options and the number of shares of restricted stock, if any, to grant to our executives, including:
| ● | the number of shares subject to, and exercise price of, outstanding options, both vested and unvested, held by our named executive officers and the number of shares subject to unvested restricted stock awards held by our named executive officers; |
| ● | the vesting schedule of the unvested stock options and restricted stock awards held by our named executive officers; and |
| ● | the amount and percentage of our total equity held by our named executive officers. |
The table below sets forth information regarding stock options and premium priced stock options (reflecting a 17.5% premium above the grant date exercise price) granted to our named executive officers in 2020:
| | | | | Name | Number of Shares Subject to Premium Priced Stock Options (#) | Exercise Price Per Share of 17.5% Premium Priced Stock Options ($) | Number of Shares Subject to Non-Premium Priced Stock Options) (#) | Exercise Price Per Share of Non-Premium Priced Stock Options ($) | Andrew J. Marsh | 275,000 | 15.51 | 275,000 | 13.20 | Paul B. Middleton | 100,000 | 15.51 | 100,000 | 13.20 | Sanjay K. Shrestha | 112,500 | 15.51 | 112,500 | 13.20 | Keith C. Schmid | 100,000 | 15.51 | 100,000 | 13.20 | Jose Luis Crespo | − | − | 175,000 | 13.20 |
The table below sets forth information regarding restricted stock awards granted to our named executive officers in 2020:
| | | | | | Name
|
| Number of Restricted Shares (#)
|
|
| Andrew J. Marsh
|
|
| 550,000
|
|
| Paul B. Middleton
|
|
| 200,000
|
|
| Sanjay K. Shrestha
|
|
| 225,000
|
|
| Keith C. Schmid
|
|
| 200,000
|
|
| Jose Luis Crespo
|
|
| 175,000
|
|
|
Broad-Based Benefits
All full-time employees, including our named executive officers, are eligible to participate in our health and welfare benefit programs, including medical, dental, and vision care coverage, disability insurance and life insurance, and our 401(k) plan on the same basis as other employees.
Currently, we do not view perquisites or other personal benefits as a significant component of our executive compensation program. Accordingly, we do not provide perquisites to our named executive officers, except in situations where we believe it is appropriate to assist an individual in the performance of his duties, to make him more efficient and effective, and for recruitment and retention purposes.
Employment Agreements
The named executive officers are subject to employment agreements that provide for severance benefits upon certain qualifying terminations of employment with the Company. The Compensation Committee considers these severance benefits to be an important part of the executive compensation program and consistent with competitive market practice. Consistent with market practices, the employment agreements do not include change in control-related tax gross-ups. Additional information regarding the employment arrangements with each of our named executive officers, including a quantification of benefits that would have been received by each named executive officer had his employment terminated on December 31, 2020, is provided under “Employment Agreements” and “Potential Payments upon Termination or Change in Control.”
Relationship of Executive Compensation to Risk
The Compensation Committee considers whether the design of the Company’s executive compensation program encourages senior executives to engage in excessive risk-taking. The Compensation Committee reviews the overall program design, as well as the balance between short-term and long-term compensation, the metrics used to measure
performance and the award opportunity under the Company’s incentive compensation program, and the implementation of other administrative features designed to mitigate risk such as vesting requirements, stock ownership guidelines and our clawback policy, each as described in this Compensation Discussion and Analysis. Based on its review, the Compensation Committee believes that the Company’s executive compensation program is aligned to the interests of stockholders, appropriately rewards pay for performance, and does not promote unnecessary or excessive risk.
Stock Ownership Guidelines
The Board has adopted stock ownership guidelines for executives, including our named executive officers, and these guidelines are also considered when granting long-term equity incentive awards to executives. The ownership guidelines provide a target level of Company equity holdings with which named executive officers are expected to comply within five (5) years or the date the individual is first appointed as an executive. The target stock holdings are determined as a multiple of the named executive officer’s base salary (5x for the Chief Executive Officer and 3x for the other named executive officers) and then converted to a fixed number of shares using a 200-day average stock price. The following shares are included in determining compliance with the stock ownership guidelines: (i) shares owned outright by the executive or his immediate family members residing in the same household; (ii) shares held in the Plug Power Inc. Savings and Retirement Plan; (iii) restricted stock issued as part of an executive’s annual or other bonus (whether or not vested); (iv) shares acquired upon the exercise of employee stock options; (v) shares underlying unexercised employee stock options times a factor of 33%; and (vi) shares held in trust. The named executive officers who are required to be in compliance with the stock ownership guidelines are in compliance.
Prohibition Against Hedging
The Company maintains an internal “Insider Trading Policy” that is applicable to our executive officers and directors. Among other things, the policy prohibits any employee of the Company (including directors or executive officers) from (i) engaging in short sales of the Company’s securities and from trading in puts, calls or options in respect of the Company’s securities, (ii) buying or selling puts, calls or other derivative securities of the Company or engaging in any other hedging transactions with respect to the Company’s securities or (iii) purchasing any securities of the Company with money borrowed from a bank, brokerage firm or other person for the purchase of purchasing securities or using the Company’s securities as collateral in a margin account.
Clawback Policy
In March 2019, our Compensation Committee and Board of Directors adopted a Policy for Recoupment of Incentive Compensation that covers incentive compensation paid to our executive officers who are subject to the reporting requirements of Section 16 of the Exchange Act. The policy provides that if we are required to prepare an accounting restatement due to our material non-compliance with any financial reporting requirement and/or intentional misconduct by a covered executive, our Compensation Committee may require the covered executive to repay to us any excess compensation received by the covered executive during the covered period. For purposes of this policy, excess compensation means any annual cash bonus and long-term equity incentive compensation received by a covered executive during the three-year period preceding the publication of the restated financial statement that the Compensation Committee determines was in excess of the amount that such covered executive would have received had such annual cash bonus and long-term equity incentive compensation been calculated based on the financial results reported in the restated financial statement.
Tax and Accounting Considerations
Deductibility of Executive Compensation
Generally, Section 162(m) of the Code disallows a federal income tax deduction for public corporations of remuneration in excess of $1 million paid in any fiscal year to certain specified executive officers. For taxable years beginning before January 1, 2018 (i) these executive officers consisted of a public corporation’s principal executive officer and up to three other executive officers (other than the principal financial officer) whose compensation is required to be disclosed to stockholders under the Exchange Act, because they are the corporation’s most highly-compensated executive officers and (ii) qualifying “performance-based compensation” was not subject to this deduction limit if specified requirements were met.
Pursuant to the Tax Cuts and Jobs Act of 2017, for taxable years beginning after December 31, 2017, the remuneration of a public corporation’s principal financial officer is also subject to the deduction limit. In addition, subject to certain transition rules (which apply to remuneration provided pursuant to written binding contracts which were in effect on November 2, 2017 and which are not subsequently materially modified), for taxable years beginning after December 31, 2017, the exemption from the deduction limit for “performance-based compensation” is no longer available. Consequently, for fiscal years beginning after December 31, 2017, all remuneration in excess of $1 million paid to a specified executive will not be deductible.
In designing our executive compensation program and determining the compensation of our executive officers, including our named executive officers, the Compensation Committee considers a variety of factors, including the potential impact of the Section 162(m) deduction limit. However, the Compensation Committee will not necessarily limit executive compensation to that which is or may be deductible under Section 162(m) of the Code. The Compensation Committee will consider various alternatives to preserving the deductibility of compensation payments and benefits to the extent consistent with its compensation goals. The Compensation Committee believes that our stockholders’ interests are best served if its discretion and flexibility in awarding compensation is not restricted, even though some compensation awards may result in non-deductible compensation expense.
Taxation of “Parachute” Payments
Sections 280G and 4999 of the Code provide that executive officers and directors who hold significant equity interests and certain other service providers may be subject to significant additional taxes if they receive payments or benefits in connection with a change in control of the Company that exceed certain prescribed limits, and that the Company (or a successor) may forfeit a deduction on the amounts subject to this additional tax. We have not agreed to provide any executive officer, including any named executive officers, or director with a “gross-up” or other reimbursement payment for any tax liability that the executive officer or director might owe as a result of the application of Sections 280G or 4999 of the Code.
Section 409A of the Internal Revenue Code
Section 409A of the Code imposes additional significant taxes in the event that an executive officer, director or service provider receives “deferred compensation” that does not satisfy the requirements of Section 409A of the Code. Although we do not maintain a nonqualified deferred compensation plan, Section 409A of the Code may apply to certain severance arrangements, bonus arrangements and equity awards. We aim to structure all our severance arrangements, bonus arrangements and equity awards in a manner to either avoid the application of Section 409A or, to the extent doing so is not possible, to comply with the applicable requirements of Section 409A of the Code.
Accounting for Stock-Based Compensation
We follow FASB ASC Topic 718 for our stock-based compensation awards. FASB ASC Topic 718 requires us to measure the compensation expense for all share-based payment awards made to our employees and non-employee members of our Board, including options to purchase shares of our Common Stock and other stock awards, based on the grant date “fair value” of these awards. This calculation is performed for accounting purposes and reported in the executive compensation tables required by the federal securities laws, even though the recipient of the awards may never realize any value from their awards.
Compensation Committee Report
The following Report of the Compensation Committee of the Board of Directors will not be deemed incorporated by reference by any general statement incorporating by reference this Form 10-K into any of the Company’s filings under the Securities Act or the Exchange Act, except to the extent that the Company specifically incorporates this information by reference, and will not otherwise be deemed filed under such Acts.
The Compensation Committee reviews and evaluates individual executive officers and recommends or determines the compensation for each executive officer. The Compensation Committee also oversees management’s decisions concerning the performance and compensation of other Company officers, administers the Company’s incentive compensation and other stock-based plans, evaluates the effectiveness of its overall compensation programs, including oversight of the Company’s benefit, perquisite and employee equity programs, and reviews the Company’s management succession plans. A more complete description of the Compensation Committee’s functions is set forth in the Compensation Committee’s charter which is published on the “Investors” section of the Company’s website at www.plugpower.com. Each member of the Compensation Committee is an independent director as defined in the NASDAQ Rules.
In general, the Board and the Compensation Committee design compensation to attract, retain and motivate a superior executive team, reward individual performance, relate compensation to Company goals and objectives and align the interests of the executive officers with those of the Company’s stockholders. The Board and the Compensation Committee rely upon their judgment about each individual—and not on rigid guidelines or formulas, or short-term changes in business performance—in determining the amount and mix of compensation elements for each senior executive officer. Key factors affecting such judgments include: the executive’s performance compared to the goals and objectives established for the executive at the beginning of the year; the nature, scope and level of the executive’s responsibilities; the executive’s contribution to the Company’s financial results; the executive’s effectiveness in leading the Company’s initiatives to increase customer value, productivity and revenue growth; and the executive’s contribution to the Company’s commitment to corporate responsibility, including the executive’s success in creating a culture of unyielding integrity and compliance with applicable law and the Company’s ethics policies.
The Compensation Committee has reviewed the Compensation Discussion and Analysis and discussed that analysis with management. Based on its review and discussions with management, the Compensation Committee recommended to our Board of Directors that the Compensation Discussion and Analysis be included in the Company’s Annual Report on Form 10-K for the fiscal year ended December 31, 2020 and the Company’s Proxy Statement relating to the Company’s 2021 annual meeting of stockholders. This report on executive compensation is provided by the undersigned members of the Compensation Committee of the Board of Directors.
Gary K. Willis (Chairman)
George C. McNamee
Johannes M. Roth
2020 Summary Compensation Table
The following table sets forth the total compensation awarded to, earned by and paid during the fiscal years indicated for each of our named executive:
| | | | | | | | | Name and Principal Position | Year | Salary
($) | Bonus
($)(1) | Stock
Awards
($)(2) | Option
Awards
($)(3) | Non-Equity
Incentive Plan
Compensation
($)(4) | All Other
Compensation
($) | Total
($) | Andrew J. MarshPresident, Chief Executive Officer and Director | 2020 | 676,442 | 581,250 | 7,260,000 | 4,178,075(5) | 918,750 | 15,555(6)(7) | 13,630,072 | | 2019 | 600,000 | - | 1,449,500 | 999,700(8) | 631,200 | 15,170 | 3,695,570 | | 2018 | 600,000 | - | 980,000 | 775,000 | 300,000 | 14,920 | 2,669,920 | Paul B. MiddletonChief Financial Officer and Senior Vice President | 2020 | 387,188 | 302,250 | 2,640,000 | 1,519,300(9) | 477,750 | 15,555(6)(7) | 5,342,043 | | 2019 | 375,000 | - | 557,500 | 384,500(10) | 394,500 | 15,170 | 1,726,670 | | 2018 | 375,000 | - | 392,000 | 310,000 | 187,500 | 14,920 | 1,279,420 | Sanjay K. Shrestha Chief Strategy Officer | 2020 | 338,222 | 290,625 | 2,970,000 | 1,709,213(11) | 459,375 | 15,361(6)(12) | 5,782,796 | | 2019(13) | 306,538 | - | 346,500 | 249,150 | 300,000 | 9,033 | 1,211,221 | Keith C. SchmidChief Operating Officer and Senior Vice President | 2020 | 393,317 | 310,000 | 2,640,000 | 1,519,300(9) | 490,000 | 15,555(6)(7) | 5,368,172 | | 2019 | 391,000 | - | 557,500 | 384,500(10) | 411,332 | 15,170 | 1,759,502 | | 2018 | 391,000 | - | 490,000 | 387,500 | 195,500 | 14,920 | 1,478,920 | Jose Luis CrespoVice President-Global Sales | 2020 | 227,692 | 356,501 | 2,310,000 | 1,368,150 | 563,500 | 15,026(6)(14) | 4,840,869 | | 2019 | 220,000 | - | 446,000 | 307,600(5) | 505,340 | 14,668 | 1,493,608 | | 2018 | 220,000 | - | 392,000 | 310,000 | 220,000 | 14,691 | 1,156,691 |
(1)
| As discussed in greater detail in the CD&A, while the Company’s 2020 financial and strategic achievements were impressive, it was even more so given that it was accomplished in the face of the uncertainty and business disruption caused by the Covid-19 pandemic. In addition to driving the business forward with numerous other successful initiatives (see discussion under Executive Summary - 2020 Business and Strategic Highlights), the management team worked tirelessly to ensure that the Company addressed the special needs of our employees,
|
our customers and our communities during this period. After discussion and consideration, the Compensation Committee determined that it would be appropriate to recognize and reward all our employees (including the named executive officers) for their extraordinary commitment and contribution to the Company by paying an additional cash bonus equal to 77.5% of the relevant target bonus.
(2)
| This column represents the aggregate grant date fair value of the stock award computed in accordance with FASB ASC Topic 718. Pursuant to SEC rules, the amounts shown exclude the impact of estimated forfeitures. Fair value is calculated using the closing price of Plug Power stock on the date of grant. For additional information on stock awards, refer to note 18 of the Company’s consolidated financial statements in this Annual Report on Form 10-K. These amounts reflect the Company’s accounting expense for these awards, excluding the impact of estimated forfeitures, and do not correspond to the actual value that will be recognized by our named executive officers.
|
(3)
| This column represents the aggregate grant date fair value of the option award computed in accordance with FASB ASC Topic 718. Pursuant to SEC rules, the amounts shown exclude the impact of estimated forfeitures. For additional information on the valuation assumptions with respect to option awards, refer to note 18 of the Company’s consolidated financial statements in this Annual Report on Form 10-K. These amounts reflect the Company’s accounting expense, excluding the impact of estimated forfeitures, for these awards, and do not correspond to the actual value that will be recognized by our named executive officers.
|
(4)
| This column represents the amount of bonuses earned by executives under our annual cash incentive plan. As discussed in the CD&A, the metrics and goals for 2020 were established prior to the onset of the Covid-19 pandemic; however, notwithstanding the potential business disruption that was expected as a result of the pandemic, the goals were not decreased to address the pandemic.
|
(5)
| Includes a premium priced stock option with a grant date fair value of $2,028,125.
|
(6)
| Includes the Company’s share of contributions on behalf of each of Messrs. Marsh, Middleton, Shrestha, Schmid and Crespo to the Plug Power 401(k) savings plan in the amount of $14,250 in 2020.
|
(7)
| Includes the Company’s share of contributions on behalf of Messrs. Marsh, Middleton and Schmid in the amount of $1,305 for life insurance premiums in 2020.
|
(8)
| Includes a premium priced stock option with a grant date fair value of $490,750.
|
(9)
| Includes a premium priced stock option with a grant date fair value of $737,500.
|
(10)
| Includes a premium priced stock option with a grant date fair value of $188,750.
|
(11)
| Includes a premium priced stock option with a grant date fair value of $829,688.
|
(12)
| Includes the Company’s share of contributions on behalf of Mr. Shrestha in the amount of $1,111 for life insurance premiums in 2020.
|
(13)Mr. Shrestha joined the Company as a Chief Strategy Officer on April 15, 2019.
(14)
| Includes the Company’s share of contributions on behalf of Mr. Crespo in the amount of $776 for life insurance premiums in 2020.
|
Pay Ratio Disclosure
Pursuant to a mandate of the Dodd-Frank Wall Street Reform and Consumer Protection Act (the “Dodd-Frank Act”), the SEC adopted a rule requiring annual disclosure of the ratio of the median employee’s annual total compensation to the total annual compensation of the principal executive officer (“PEO”). The PEO of our Company is Mr. Marsh.
We believe that our compensation philosophy must be consistent and internally equitable to motivate our employees to create shareholder value. The purpose of the required disclosure is to provide a measure of the equitability
of pay within the organization. We are committed to internal pay equity, and our Compensation Committee monitors the relationship between the pay our PEO receives and the pay our non-executive employees receive.
For 2020, the annual total compensation of Mr. Marsh, our PEO, of $13,630,072 as shown in the Summary Compensation Table above, was approximately 203 times the annual total compensation of $67,062 of the median employee calculated in the same manner. We identified the median employee using the amount reported as compensation on the employee’s Form W-2 for the year ended December 31, 2020 for all individuals who were employed by us on December 31, 2020, the last day of our payroll year (whether employed on a full-time, part-time, or seasonal basis).
Grants of Plan-Based Awards
The following table sets forth information concerning the grants of plan-based awards to the Company’s named executive officers during the year ended December 31, 2020.
| | | | | | | | | | Estimated Future Payouts
Under Non-Equity
Incentive Plan Awards(2) | All Other
Stock
Awards:
Number of
Shares or Stock Units(#)(3) | All Other
Option
Awards:
Number of
Securities
Underlying
Options (#)(4) | Exercise or
Base Price
of Option
Awards ($/Sh)(5) | Grant
Date
Fair Value
of Stock
and Option
Awards(6) ($) | Name | Grant Date (1) | Threshold ($) | Target ($) | | | | | | - | 487,500 | 750,000 | | | | | | 09/28/20 | - | - | 550,000 | - | | 7,260,000 | | 09/28/20 | - | - | - | 275,000 | 13.20 | 2,149,950 | | 09/28/20 | - | - | - | 275,000(7) | 15.51 | 2,028,125 | | | 253,500 | 390,000 | | | | | | 09/28/20 | - | - | 200,000 | - | | 2,640,000 | | 09/28/20 | - | - | - | 100,000 | 13.20 | 781,800 | | 09/28/20 | - | - | - | 100,000(7) | 15.51 | 737,500 | | - | 243,750 | 375,000 | | | | | | 09/28/20 | - | - | 225,000 | - | | 2,970,000 | | 09/28/20 | - | - | - | 112,500 | 13.20 | 879,525 | | 09/28/20 | - | - | - | 112,500(7) | 15.51 | 829,688 | | - | 260,000 | 400,000 | | | | | | 09/28/20 | - | - | 200,000 | - | | 2,640,000 | | 09/28/20 | - | - | - | 100,000 | 13.20 | 781,800 | | 09/28/20 | - | - | - | 100,000(7) | 15.51 | 737,500 | | - | 230,000 | 460,000 | | | | | | 09/28/20 | - | - | 175,000 | - | | 2,310,000 | | 09/28/20 | - | - | - | 175,000 | 13.20 | 1,368,150 | | 09/28/20 | - | - | - | | | |
(1)
| Each grant was approved by our Compensation Committee on the grant date indicated.
|
(2)
| The amounts reported represent the threshold and target amounts of potential cash payouts under our annual incentive bonus program. The actual amounts paid for fiscal year 2020 are disclosed in the “Non-Equity Incentive Plan Compensation” column of the 2020 Summary Compensation Table above.
|
(3)
| This column shows the number of restricted shares granted in 2020 to our named executive officers. The restrictions lapse ratably in three equal annual installments, beginning one year from the date of grant, subject to the executive’s continued service to us through the applicable vesting date.
|
(4)
| This column shows the number of shares subject to stock options granted in 2020 to our named executive officers. These options vest and become exercisable ratably in three equal annual installments, beginning one year from the date of grant, subject to the executive’s continued service to us through the applicable vesting date.
|
(5)
| This column shows the per share exercise price for the stock options granted.
|
(6)
| This column represents the aggregate grant date fair value of the stock awards and option awards computed in accordance with FASB ASC Topic 718. Pursuant to SEC rules, the amounts shown exclude the impact of
|
estimated forfeitures. For additional information on the valuation assumptions with respect to option awards, refer to note 18 of the Company’s consolidated financial statements in this Annual Report on Form 10-K. These amounts reflect the Company’s accounting expense for these awards, excluding the impact of estimated forfeitures, and do not correspond to the actual value that will be recognized by our named executive officers.
(7)
| These represent premium priced stock options with exercise prices approximately 17.5% greater than the closing price of our common stock on the date of grant.
|
Outstanding Equity Awards at Fiscal Year-End
The following table provides information on the holdings of stock and option awards by our named executive officers as of December 31, 2020. There were no other stock or option awards held by our named executive officers as of December 31, 2020. For additional information about the awards, see the description of equity incentive compensation in the section titled “Compensation Discussion and Analysis.”
| | | | | | | | | | Option Awards(1)(2) | Stock Awards(1)(2) | Name | Grant Date | Number of
Securities
Underlying
Unexercised
Options (#)
Exercisable | Number of
Securities
Underlying
Unexercised
Options (#)
Unexercisable | Option
Exercise
Price ($) | Option
Expiration
Date | Number of
Shares or Units of Stock That Have Not Vested(#) | Market Value of Shares or Units of Stock That Have Not Vested($)(3) | | 4/13/11 | 106,600 | — | 6.10 | 4/13/21 | — | — | | 8/31/17 | 466,668 | — | 2.14 | 8/31/27 | — | — | | 8/28/18 | — | 166,667 | 1.96 | 8/28/28 | — | — | | 8/28/18 | — | — | — | — | 166,667 | 5,651,678 | | 8/19/19 | — | 216,667 | 2.23 | 8/19/29 | — | — | | 8/19/19 | — | — | — | — | 433,333 | 14,694,322 | | 8/19/19 | — | 216,667 | 2.62 | 8/19/29 | — | — | | 9/28/20 | — | 275,000 | 13.20 | 9/28/30 | — | — | | 9/28/20 | — | — | — | — | 550,000 | 18,650,500 | | 9/28/20 | — | 275,000 | 15.51 | 9/28/30 | — | — | | 8/28/18 | — | 66,667 | 1.96 | 8/28/28 | — | — | | 8/28/18 | — | — | — | — | 66,667 | 2,260,678 | | 8/19/19 | — | 83,333 | 2.23 | 8/19/29 | — | — | | 8/19/19 | — | — | — | — | 166,667 | 5,651,678 | | 8/19/19 | — | 83,333 | 2.62 | 8/19/29 | — | — | | 9/28/20 | — | 100,000 | 13.20 | 9/28/30 | — | — | | 9/28/20 | — | — | — | — | 200,000 | 6,782,000 | | 9/28/20 | — | 100,000 | 15.51 | 9/28/30 | — | — | | 5/9/19 | — | 100,000 | 2.31 | 5/09/29 | — | — | | 5/9/19 | — | — | — | — | 100,000 | 3,391,000 | | 9/28/20 | — | 112,500 | 13.20 | 9/28/30 | — | — | | 9/28/20 | — | — | — | — | 225,000 | 7,629,750 | | 9/28/20 | — | 112,500 | 15.51 | 9/28/30 | — | — | | 10/23/13 | 100,000 | — | 0.57 | 10/23/23 | — | — | | 8/28/18 | 1 | 83,333 | 1.96 | 8/28/28 | — | — | | 8/28/18 | — | — | — | — | 83,333 | 2,825,822 | | 8/19/19 | 41,667 | 83,333 | 2.23 | 8/19/29 | — | — | | 8/19/19 | — | — | — | — | 166,667 | 5,651,678 | | 8/19/19 | 41,667 | 83,333 | 2.62 | 8/19/29 | — | — | | 9/28/20 | — | 100,000 | 13.20 | 9/28/30 | — | — | | 9/28/20 | — | — | — | — | 200,000 | 6,782,000 | | 9/28/20 | — | 100,000 | 15.51 | 9/28/30 | — | — | | 8/28/18 | 1 | 66,667 | 1.96 | 8/28/28 | — | — | | 8/28/18 | — | — | — | — | 66,667 | 2,260,678 | | 8/19/19 | — | 66,667 | 2.23 | 8/19/29 | — | — | | 8/19/19 | — | — | — | — | 133,333 | 4,521,322 | | 8/19/19 | — | 66,667 | 2.62 | 8/19/29 | — | — | | 9/28/20 | — | 175,000 | 13.20 | 9/28/30 | — | — | | 9/28/20 | — | — | — | — | 175,000 | 5,934,250 |
(1) | All equity awards were granted pursuant to our 2011 Plan. |
(2) | Each equity award vests over a three year period with one-third (1/3) of the shares subject to the award vesting on each of the first three anniversaries of the grant date, subject to the executive’s continued service to us through each applicable vesting date. |
| (3) | This column represents the market value of the unvested restricted stock awards calculated based on the closing price of our common stock ($33.91) on December 31, 2020, the last business date of fiscal year 2020. |
Options Exercised and Stock Vested
The following table sets forth information with respect to each of our named executive officers that exercised stock options or vested in restricted stock during the year ended December 31, 2020.
Option Exercises and Stock Vested - 2020
| | | | | | Option Awards | Stock Awards | Name | Number of
Shares
Acquired on
Exercise | Value
Realized
on Exercise(1)($) | Number of
Shares
Acquired on
Vesting | Value
Realized
on Vesting(1)($) | | 4,570,831 | 34,704,898 | 383,333 | 5,135,829 | | 1,566,667 | 26,878,515 | 149,999 | 2,008,820 | | 50,000 | 467,618 | 50,000 | 215,500 | | 2,016,666 | 36,728,171 | 166,667 | 2,226,671 | | 1,224,998 | 13,861,700 | 133,333 | 1,781,329 |
(1) | The value realized on exercise is equal to the difference between the closing price of the stock on the exercise date less the per share exercise price, multiplied by the number of shares for which the option was being exercised. |
(2) | Amounts disclosed in this column were calculated based on the fair market value of the shares on the date of vesting. |
Employment Agreements
The Company and Mr. Marsh are parties to an employment agreement which renews automatically for successive one-year terms unless Mr. Marsh or the Company gives notice to the contrary. Mr. Marsh receives an annual base salary of $750,000 and is eligible to: (i) receive an annual incentive bonus targeted at an amount equal to one hundred percent (100%) of his annual base salary; (ii) participate in all savings and retirement plans; and (iii) participate in all benefit plans and executive perquisites. Mr. Marsh’s employment may be terminated by the Company with or without “Cause,” as defined in the agreement, or by Mr. Marsh for “Good Reason,” as defined in the agreement, or without Good Reason upon written notice of termination to the Company. If Mr. Marsh’s employment is terminated by the Company without Cause, the Company is obligated to pay Mr. Marsh a lump sum equal to the sum of the following amounts:
| (a)
| one (1) times annual base salary, and
|
| (b)
| one (1) times the annual incentive bonus for the immediately preceding fiscal year.
|
In addition, as of the date of termination, any restricted stock, stock options and other stock awards held by Mr. Marsh will accelerate vesting as if he had remained an employee for an additional twelve (12) months following the date of termination. Further, subject to Mr. Marsh’s copayment of premium amounts at the active employees’ rate, Mr. Marsh will be eligible to continue to participate in the Company’s group health, dental, vision and life insurance programs for twelve (12) months following his termination.
The agreement also provides that if, within twelve (12) months after a “Change in Control,” as defined in the agreement, the Company terminates Mr. Marsh’s employment without Cause or Mr. Marsh terminates his employment for Good Reason, then he is entitled to:
(i)receive a lump sum payment equal to three (3) times the sum of (i) his current annual base salary plus (ii) his average annual incentive bonus over the three (3) fiscal years prior to the Change in Control (or his annual incentive bonus for the fiscal year immediately preceding to the Change in Control, if higher),
(ii)accelerated vesting of his stock options and other stock-based awards that would have vested had he remained an active employee for twelve (12) months following his termination, and
(iii)subject to Mr. Marsh’s copayment of premium amounts at the active employees’ rate, continued participation in the Company’s group health, dental, vision and life insurance programs for twelve (12) months following such termination.
The Company and Messrs. Middleton, Shrestha, Schmid and Crespo are each parties to an employment agreement pursuant to which, if the executive’s employment is terminated by the Company without “Cause,” as defined in the applicable agreement, the Company is obligated to pay the executive a lump sum amount equal to one (1) times his annual base salary. In addition, as of the date of termination, any restricted stock, stock options and other stock awards held by the executive will accelerate vesting as if he had remained an employee for an additional twelve (12) months following the date of termination. Further, subject to the executive’s copayment of premium amounts at the active employees’ rate, the Company is required to continue paying its share of the premiums for the executive’s participation in the Company’s group health plans for twelve (12) months following his termination.
The employment agreements also provide that if, within twelve (12) months after a “Change in Control,” as defined in the applicable agreement, the Company terminates such executive’s employment without Cause or the executive terminates his employment for “Good Reason” as defined in the applicable agreement, then such executive shall be entitled to:
| (i)
| receive a lump sum payment equal to the sum of (i) his average annual base salary over the three (3) fiscal years immediately prior to the Change in Control (or the executive’s annual base salary in effect immediately prior to the Change in Control, if higher) and (ii) his average annual bonus over the three (3) fiscal years prior to the Change in Control (or the executive’s annual bonus in effect immediately prior to the Change in Control, if higher),
|
| (ii)
| accelerated vesting of his stock options and other stock-based awards that would have vested had he remained an active employee for twelve (12) months following his termination (or, in the case of Mr. Middleton, full accelerated vesting of all stock options and other stock-based awards held by him), and
|
| (iii)
| subject to the executive’s copayment of premium amounts at the active employees’ rate, continued payment by the Company of its share of the premiums for the executive’s participation in the Company’s group health plans for twelve (12) months following the date of termination.
|
Potential Payments Upon Termination or Change in Control
The Company and Messrs. Marsh, Middleton, Shrestha, Schmid and Crespo are parties to employment agreements, respectively, that provide for a potential payment upon termination of employment other than for “Cause” as discussed above in “Employment Agreements.”
Such payments by the Company to any of the executives are subject to the executive signing a general release of claims in a form and manner satisfactory to the Company. An executive is not entitled to receive any such payment in the event he breaches the Employee Patent, Confidential Information and Non-Compete Agreement referenced in the executive’s respective agreement or any non-compete, non-solicit or non-disclosure covenants in any agreement between the Company and such executive. We agreed to provide severance payments to such executives in these circumstances based on our negotiations with each of our executives at the time they joined our Company, or as negotiated subsequent to hiring, and in order to provide a total compensation package that we believed to be competitive. Additionally, we believe that providing severance upon a termination of employment without Cause can help to encourage our executives to take
the risks that we believe are necessary for our Company to succeed and also recognizes the longer hiring process typically involved in hiring a senior executive.
If Mr. Marsh had been terminated without Cause on December 31, 2020 and such termination was not within twelve (12) months following a Change in Control, the approximate value of the severance package, including, as mentioned above in “Employment Agreements,” salary, benefits and accelerated vesting of equity awards, under his employment agreement would have been $36,440,468. If Mr. Middleton, Mr. Shrestha, Mr. Schmid, or Mr. Crespo had been terminated without Cause on December 31, 2020 and such termination was not within twelve (12) months following a Change in Control, the approximate value of the severance packages, including, as mentioned above in “Employment Agreements,” salary, benefits and accelerated vesting of equity awards, under the employment agreement for such named executive officer would have been as follows: Mr. Middleton—$14,257,236, Mr. Shrestha—$8,029,183, Mr. Schmid—$15,383,037, and Mr. Crespo—$12,709,207.
The Company and Messrs. Marsh, Middleton, Shrestha, Schmid, and Crespo are parties to employment agreements, respectively, that provide for a potential payment upon a termination of employment by the Company without Cause or a resignation by the executive for Good Reason within twelve (12) months following a Change in Control, as discussed above in “Employment Agreements.” Such payments by the Company to any of the executives are subject to the executive signing a general release of claims in a form and manner satisfactory to the Company. An executive is not entitled to receive any such payment in the event he breaches the Employee Patent, Confidential Information and Non-Compete Agreement referenced in the executive’s respective agreement or any non-compete, non-solicit or non-disclosure covenants in any agreement between the Company and such executive.
We agreed to provide payments to these executives in these circumstances in order to provide a total compensation package that we believed to be competitive. Additionally, the primary purpose of our equity-based incentive awards is to align the interests of our executives and our stockholders and provide our executives with strong incentives to increase stockholder value over time. As change in control transactions typically represent events where our stockholders are realizing the value of their equity interests in our Company, we believe it is appropriate for our executives to share in this realization of stockholder value, particularly where their employment is terminated in connection with the change in control transaction. We believe that this will also help to better align the interests of our executives with our stockholders in pursuing and engaging in these transactions.
If a Change in Control had occurred on December 31, 2020 and on that date the employment of Mr. Marsh, Mr. Middleton, Mr. Shrestha, Mr. Schmid, or Mr. Crespo had been terminated by the Company without Cause or the executive had resigned for Good Reason, the value of the of the severance packages, including, as mentioned above in “Employment Agreements,” salary, benefits and accelerated vesting of equity awards, under the employment agreements for each such named executive officer would have been as follows: Mr. Marsh—$39,102,106, Mr. Middleton—$14,204,736, Mr. Shrestha—$7,978,702, Mr. Schmid—$15,329,191, and Mr. Crespo—$12,678,245. The employment agreements provide for a modified cutback such that, any payments or benefits payable under the employment agreements or otherwise would be subject to the excise tax imposed by Section 4999 of the Code, the executive will receive the greater after-tax amount of either: (i) the full payment or (ii) a reduced payment that does not give rise to the excise tax imposed by Section 4999 of the Code. The foregoing numbers do not reflect any cutback. None of the executives are entitled to any tax gross-up payments related to severance payments or otherwise.
Director Compensation
The Compensation Committee periodically reviews the Company’s Non-Employee Director Compensation Plan (the “Plan”) to ensure that the compensation aligns the directors’ interests with the long-term interests of the stockholders and that the structure of the compensation is simple, transparent and easy for stockholders to understand. The Compensation Committee also considers whether the Plan fairly compensates the Company’s directors when considering the work required in a company of the size and scope of the Company, and looks at peer group compensation for directors to determine whether our director compensation is reasonable and competitive in relation to our peers. Employee directors do not receive additional compensation for their services as directors.
During 2020, pursuant to the Plan, upon initial election or appointment to the Board, each non-employee director received a non-qualified stock option to purchase a number of shares equal to $150,000 divided by the closing price of our common stock on the grant date, with an exercise price equal to fair market value of the Common Stock on the grant date and that becomes fully vested and exercisable on the first anniversary of the grant date. In 2020, each director received an
annual equity grant comprised of (i) a non-qualified stock option for a number of shares equal to $62,500 divided by the closing price of our common stock on the date of grant and (ii) a number of shares of restricted common stock equal to $62,500 divided by the closing price of our common stock on the grant date. The stock option portion of the grant has an exercise price equal to the fair market value of our common stock on the grant date and becomes fully vested and exercisable on the first anniversary of the grant date. The restricted common stock grant becomes fully vested on the first anniversary of the grant date.
During 2020, under the Plan, each non-employee director was paid an annual retainer of $40,000 ($85,000 for any non-employee Chairman) for his or her services. Committee members received additional annual retainers for their service on committees of the Board in accordance with the following table:
Committee | | Chairman ($) | | Member ($) | | Audit Committee | | | 20,000 | | | 15,000 | | Compensation Committee | | | 15,000 | | | 5,000 | | Corporate Governance and Nominating Committee | | | 10,000 | | | 5,000 | |
These additional payments for service on a committee are due to the workload and broad-based responsibilities of the committees. The total amount of the annual retainer is paid in a combination of 50% cash and 50% common stock, provided that the director may elect to receive a greater portion (up to 100%) of the total retainer in common stock. All common stock issued for the annual retainers is fully vested at the time of issuance and is valued at its fair market value on the date of issuance. Non-employee directors are also reimbursed for their direct expenses associated with their attendance at Board meetings.
The Compensation Committee regularly reviews non-employee director compensation in comparison to our industry peer group, and considers growth in our market capitalization and sales, and other relevant factors including periodic independent market assessments. The Plan was amended by the Board in September 2020, effective as of January 1, 2021, to provide for (i) an increase in the annual retainer payable for service on the Board, and (ii) an increase in the value of the stock option and restricted stock awards granted to non-employee directors upon initial election to the Board and annually. The adjustments to the annual retainer and equity grants were designed to be competitive with our 2020 peer group.
Effective January 1, 2021, pursuant to the Plan, upon initial election or appointment to the Board, each non-employee director (other than Mr. Song) will receive a non-qualified stock option to purchase a number of shares equal to $225,000 divided by the closing price of our common stock on the grant date, with an exercise price equal to fair market value of our common stock on the grant date and that becomes fully vested and exercisable on the first anniversary of the grant date. Each year of a non-employee director’s tenure, the director (other than Mr. Song) will receive an equity grant comprised of (i) a non-qualified stock option for a number of shares equal to $112,500 divided by the closing price of our common stock on the date of the grant and (ii) a number of shares of restricted common stock equal to $112,500 divided by the closing price of our common stock on the grant date. The stock option portion of the grant will have an exercise price equal to the fair market value of our common stock on the grant date and become fully vested and exercisable on the first anniversary of the grant date. The restricted common stock grant will become fully vested on the first anniversary of the grant date.
Effective January 1, 2021, under the Plan, each non-employee director (other than Mr. Song) will be paid an annual retainer of $60,000 ($125,000 for any non-employee Chairman) for his or her services. Committee members will receive additional annual retainers for their service on committees of the Board in accordance with the following table:
Committee | | Chairman ($) | | Member ($) | Audit Committee | | | 20,000 | | | 15,000 | Compensation Committee | | | 15,000 | | | 5,000 | Corporate Governance and Nominating Committee | | | 10,000 | | | 5,000 |
Mr. Song will not receive any compensation as director (cash or equity) pursuant to the terms of the Investor Agreement.
Non-Employee Director Compensation Table
The following table shows the compensation received or earned by each of our non-employee directors in fiscal year 2020. Mr. Marsh, who is our President and Chief Executive Officer, did not receive any additional compensation for his service as a director. The compensation received by Mr. Marsh, as a named executive officer, is presented in “Executive Compensation—2020 Summary Compensation Table” above.
| | | | | Name | Fees Earned
or Paid in
Cash(1) ($) | Stock
Awards(2)
($) | Option
Awards(3)
($) | Total ($) | | 70,000 | 62,500 | 36,145 | 168,645 | | 90,000 | 62,500 | 36,145 | 188,645 | | 60,000 | 62,500 | 36,145 | 158,645 | | 50,000 | 62,500 | 36,145 | 148,645 | | 65,000 | 62,500 | 36,145 | 163,645 | | 45,000 | 62,500 | 36,145 | 143,645 | | 45,000 | 62,500 | 36,145 | 143,645 |
(1) Each of the following non-employee directors elected to receive all or a portion of their annual retainers in common stock in lieu of cash in the following amounts: Gary K. Willis ($35,000), George C. McNamee ($45,000), Gregory L. Kenausis ($30,000), Johannes M. Roth ($50,000), Maureen O. Helmer ($32,500), Jonathan Silver ($28,125) and Lucas P. Schneider ($22,500).
(2) This column represents the aggregate grant date fair value of the stock award computed in accordance with FASB ASC Topic 718. Pursuant to SEC rules, the amounts shown exclude the impact of estimated forfeitures. Fair value is calculated using the closing price of our common stock on the date of grant. Stock awards granted to directors as part of their annual retainer are fully vested upon grant and annual restricted stock awards made to directors vest in full on the first anniversary of the grant date. For additional information on stock awards, refer to note 18 of the Company’s consolidated financial statements in this Annual Report on Form 10-K. These amounts reflect the Company’s accounting expense for these awards, and do not necessarily correspond to the actual value that will be recognized by the non-employee directors. As of December 31, 2020, the following non-employee directors each held 12,807 shares of restricted stock: Gary K. Willis, George C. McNamee, Gregory L. Kenausis, Johannes M. Roth, Maureen O Helmer, Jonathan Silver and Lucas P. Schneider.
(3) This column represents the aggregate grant date fair value of the option award computed in accordance with FASB ASC Topic 718. Pursuant to SEC rules, the amounts shown exclude the impact of estimated forfeitures. For additional information on the valuation assumptions with respect to option awards, refer to note 18 of the Company’s consolidated financial statements in this Annual Report on Form 10-K. These amounts reflect the Company’s accounting expense for these awards, and do not necessarily correspond to the actual value that will be recognized by the non-employee directors. As of December 31, 2020, the non-employee directors held options to purchase the following numbers of shares of common stock: Jonathan Silver (12,807), Gary K. Willis (170,827), George C. McNamee (128,827), Gregory L. Kenausis (233,827), Johannes M. Roth (243,827), Maureen O. Helmer (39,863) and Lucas P. Schneider (200,179).
Compensation Committee Interlocks and Insider Participation
During 2020, Messrs. Willis (Chairman), McNamee, and Roth served as members of the Compensation Committee. None of the members of our Compensation Committee was an employee or officer of the Company during 2020, a former officer of the Company, or had any other relationships with us requiring disclosure herein. None of our executive officers currently serves or has served as a director or member of the compensation committee (or other committee serving an equivalent function) of any other entity whose executive officers served as one of our directors or a member of the Compensation Committee.
Item 12. Security Ownership of Certain Beneficial Owners and Management and Related Stockholder Matters
Principal Stockholders
The following table sets forth information regarding the beneficial ownership of our common stock as of April 28, 2021:
| ● | all persons known by us to have beneficially owned 5% or more of our common stock; |
| ● | each director of the Company; |
| ● | the named executive officers; and |
| ● | all directors and executive officers as a group. |
The beneficial ownership of the stockholders listed below is based on publicly available information and from representations of such stockholders.
| | | | Shares Beneficially Owned(2) | Name and Address of Beneficial Owner(1) | Number | Percentage (%) | Grove Energy Capital LLC(3) | 54,966,188 | 9.7% | BlackRock, Inc.(4)………………………………………………………………... | 47,161,335 | 8.3% | | 40,465,986 | 7.1% | | 293,598 | * | | 38,260 | * | | 330,909 | * | | 383,776 | * | | 101,721 | * | | − | * | | 153,501 | * | | 323,217 | * | | 978,723 | * | | 471,197 | * | | 320,574 | * | Jonathan Silver(14)…………………………………………………………….. | 55,695 | * | | − | * | | 582,018 | * | All executive officers and directors as a group (16 persons)(17) | 4,141,698 | 0.7% |
*Represents less than 1% of the outstanding shares of our common stock.
(1)
| Unless otherwise indicated, we believe that each stockholder named in the table above has sole voting and investment power with respect to all shares beneficially owned by them. Unless otherwise indicated by footnote, the mailing address for each stockholder is c/o Plug Power Inc. 968 Albany Shaker Road, Latham, New York 12110.
|
(2)
| The number of shares beneficially owned by each stockholder is determined under rules promulgated by the SEC and includes voting or investment power with respect to securities. Under Rule 13d-3 under the Exchange Act, beneficial ownership includes any shares to which the individual or entity has sole or shared voting power or investment power and includes any shares as to which the individual or entity has the right to acquire beneficial ownership within 60 days of April 28, 2021, through the exercise of any warrant, stock option or other right. The inclusion in this table of such shares, however, does not constitute an admission that the named stockholder is a direct or indirect beneficial owner of such shares. The number of shares of our common stock outstanding used in calculating the percentage for each listed person includes the shares of common stock underlying options,
|
warrants or other rights held by such person that are exercisable within 60 days of April 28, 2021 but excludes shares of common stock underlying options, warrants or other rights held by any other person. Percentage of beneficial ownership is based on 568,317,504 shares of common stock outstanding as of April 28, 2021. Unless otherwise indicated, each of the stockholders has sole voting and investment power with respect to the shares of common stock beneficially owned by the stockholder.
(3)
| Information is based on a Schedule 13D filed with the SEC on March 8, 2021. Grove Energy Capital LLC is owned by Plutus Capital NY, Inc., a Delaware corporation (“Plutus”), and PNES Investments, LLC, a Delaware limited liability company (“PNES”). Plutus is wholly-owned by SK Holdings, a company organized under the laws of the Republic of Korea, and PNES is wholly-owned by SK E&S Americas, Inc., a Delaware corporation (“SK E&S Americas”). SK E&S Americas is wholly-owned by SK E&S Co., Ltd., a company organized under the laws of the Republic of Korea (“SK E&S”). 90% of the issued and outstanding common stock of SK E&S is owned by SK Holdings. The address of the principal business office of Grove Energy Capital LLC is 55 East 59th Street, New York, NY 10022.
|
(4)
| Information is based on a Schedule 13G/A filed with the SEC on January 27, 2021. BlackRock, Inc. reported sole voting power over 46,314,057 shares of common stock and sole dispositive power over 47,161,335 shares of common stock. The address of the principal business office of BlackRock, Inc. is 55 East 52nd Street, New York, NY 10055.
|
(5)
| Information is based on a Schedule 13G filed with the SEC on February 10, 2021. The Vanguard Group reported shared voting power over 905,146 shares of common stock, sole dispositive power over 39,203,572 shares of common stock and shared dispositive power over 1,262,414 shares of common stock. The address of the principal business office of The Vanguard Group is 100 Vanguard Blvd, Malvern, PA 19355.
|
(6)Includes 100,000 shares of common stock issuable upon exercise of outstanding options.
(7)Includes 183,335 shares of common stock issuable upon exercise of outstanding options.
(8)Includes 1 share of common stock issuable upon exercise of outstanding options.
(9)Includes 39,863 shares of common stock issuable upon exercise of outstanding options.
(10)Includes 233,827 shares of common stock issuable upon exercise of outstanding options.
(11)
| Includes 88,827 shares of common stock issuable upon exercise of outstanding options, and 300,000 shares of common stock held by a family trust.
|
(12)Includes 243,827 shares of common stock issuable upon exercise of outstanding options.
(13)Includes 200,179 shares of common stock issuable upon exercise of outstanding options.
(14)Includes 12,807 shares of common stock issuable upon exercise of outstanding options.
(15)
| Dr. Kyungyeol Song is an employee of SK E&S and will not receive any equity awards pursuant to the terms of the Investor Agreement.
|
(16)Includes 170,827 shares of common stock issuable upon exercise of outstanding options.
(17)Includes 1,273,493 shares of common stock issuable upon exercise of outstanding options.
Securities Authorized for Issuance Under Equity Compensation Plans
The following table gives information, as of December 31, 2020, about the shares of our common stock that may be issued upon the exercise of options and restricted stock under the Company’s 1999 Stock Option and Incentive Plan, as amended (the “1999 Stock Option Plan”), and the Company’s Third Amended and Restated 2011 Stock Option and Incentive Plan (the “2011 Stock Option Plan”):
| | | | | | | | | | | | | | | | Number of shares | | | | | | | | | remaining for future | | | | Number of shares to be | | Weighted average | | issuance under equity | | | | issued upon exercise of | | exercise price of | | compensation plans | | | | outstanding options, | | outstanding options, | | (excluding shares | | | | warrants and rights | | warrants and rights | | reflected in column (a)) | | Plan Category | | (a) | | (b) (1) | | (c) | | Equity compensation plans approved by security holders | | 15,234,454 | (2) | $ | 3.65 | | 848,909 | (3) | Equity compensation plans not approved by security holders | | 924,686 | (4) | $ | 4.12 | | — | | Total | | 16,159,140 | | | | | 848,909 | |
(1) | The weighted-average exercise price is calculated solely based on outstanding options. |
(2) | Represents 121,019 outstanding options issued under the 1999 Stock Option Plan, 9,238,793 outstanding options issued under the 2011 Stock Option Plan and 5,874,642 shares of restricted stock granted under the 2011 Stock Option Plan. |
(3) | Includes shares available for future issuance under the 2011 Stock Option Plan. |
Included in equity compensation plans not approved by stockholders are shares granted to new employees as an inducement to joinfor key positions within the Company pursuant to Rule 5635(c)(4) of the NASDAQ Rules.
Item 13. Certain Relationships and Related Transactions, and Director Independence
Investor Agreement
Pursuant to the Investor Agreement described under Part III. “Item 13. Certain Relationships and Related Party Transactions, and Director Independence,” Grove Energy, a subsidiary of SK Holdings, is entitled to designate one SK Designee to be appointed to the Board. Grove Energy has the right to require the Board to nominate a SK DesigneeCompany. No specific shares have been allocated for election to the Boardthis purpose, but rather equity awards are approved by the stockholders of the Company at annual stockholder meetings until the earliest of (i) the date on which Grove Energy and affiliates beneficially own less than 4.0% of our issued and outstanding common stock, (ii) February 24, 2023, in the event that the Company and SK E&S have not entered into the Asia JV Agreement, and (iii) any expiration or termination of the Asia JV Agreement.
Related Party Transaction Policy
The Board has adopted a written related party transaction policy that requires the Company’s General Counsel, together with outside counsel as necessary, to evaluate potential transactions to which the Company is a participant and in which a related party or an affiliate of a related party has an interest prior to the Company entering into any such transaction to determine whether such contemplated transaction requires the approval of the Board, the Audit Committee, both or neither. The policy defines a “related party” as: (i) the Company’s directors or executive officers, (ii) the Company’s director nominees, (iii) security holders known to the Company to beneficially own more than 5% of any class of the Company’s voting securities, or (iv) the immediate family members of any of the persons listed in items (i) - (iii).
Other than as otherwise disclosed herein, since January 1, 2020, there was no transaction or series of similar transactions to which the Company was or will be a party in which the amount involved exceeded or will exceed$120,000 and in which any related party had or will have a direct or indirect material interest.
Director Independence
The Board of Directors has determined that Messes. Helmer and Harriman, Dr. Kenausis and Messrs. McNamee, Willis, Silver, Roth, Song and Schneider are independent directors as defined in Rule 5605(a)(2) under the NASDAQ Rules.
specific circumstances.
Item 14. Principal Accounting Fees and Services
|
Item 13. Certain Relationships and Related Transactions, and Director Independence
The following table presents fees for professional services rendered by KPMG LLP for the integrated audit of the Company’s annual financial statements and internal control over financial reporting and fees billed for other services rendered by KPMG LLP:
| | | | 2020 | 2019 | | $3,096,900 | $1,064,325 | | $30,000 | $30,000 | | — | — | | — | — | | $3,126,900 | $1,094,325 |
In the above table, and in accordance with SEC definitions and rules: (1) “audit fees” are fees for professional services for the audit of the Company’s consolidated financial statements included in Form 10-K, audit of the Company’s internal controls over financial reporting, review of unaudited interim consolidated financial statements included in Form 10-Qs, or for services that are normally provided by the accountant in connection with statutory and regulatory filings or engagements; (2) “audit-related fees” are fees for assurance and related services that are reasonably related to the performance of the audit or review of the Company’s consolidated financial statements; (3) “tax fees” are fees for tax compliance, tax advice, and tax planning; and (4) “all other fees” are fees for any services not included in the first three categories.
The Audit Committee pre-approved all audit and audit-related services provided to the Company by KPMG LLP during fiscal year 2020.
The information required under this item is incorporated herein by reference from the Company’s definitive proxy statement pursuant to Regulation 14A, which proxy statement will be filed with Securities and Exchange Commission not later than 120 days after the close of the Company’s fiscal year ended December 31, 2022. Item 14. Principal Accounting Fees and Services Our independent public accounting firm is Deloitte & Touche LLP, Rochester, New York, United States, PCAOB Audit ID 34. The information required under this item is incorporated herein by reference from the Company’s definitive proxy statement pursuant to Regulation 14A, which proxy statement will be filed with Securities and Exchange Commission not later than 120 days after the close of the Company’s fiscal year ended December 31, 2022. PART IV Item 15. Exhibits and Financial Statement Schedules 15(a)(1) Financial Statements The financial statements and notes are listed in the Index to Consolidated Financial Statements on page F-1 of this Annual Report on Form 10-K.
15(a)(2) Financial Statement Schedules
The financial statement schedules are listed in the Index to Consolidated Financial Statements on page F-1 of this Annual Report on Form 10-K.
All other schedules not filed herein have been omitted as they are not applicable, or the required information or equivalent information has been included in the Consolidated Financial Statements or the notes thereto.
15(a)(3) Exhibits
The following exhibits are filed as part of and incorporated by reference into this Annual Report on Form 10-K.
| | |
|---|
Exhibit No.
|
| Description
|
|---|
|
|
| 2.1
|
| Agreement and Plan of Merger, dated June 22, 2020, by and among Plug Power Inc., Giner ELX, Inc., Giner ELX Sub, LLC, Giner ELX Merger Sub, Inc. and Giner, Inc., as the representative of the stockholders of Giner ELX, Inc. (filed as Exhibit 2.1 to Plug Power Inc.’s Current Report on Form 8-K filed on June 23, 2020 and incorporated by reference herein)
|
|
|
| 2.2
|
| Agreement and Plan of Merger, dated June 18, 2020, by and among Plug Power Hydrogen Holdings, Inc., UHG Merger Sub, Inc., United Hydrogen Group Inc. and Vladimir Prerad, as the representative of the stockholders of United Hydrogen Group Inc. (filed as Exhibit 2.2 to Plug Power Inc.’s Current Report on Form 8-K filed on June 23, 2020 and incorporated by reference herein)
|
|
|
| 3.1
| | Amended and Restated Certificate of Incorporation of Plug Power Inc. (filed as Exhibit 3.1 to Plug Power Inc.’s Annual Report on Form 10-K for the year ended December 31, 2008 and incorporated by reference herein)
|
|
|
| 3.2
|
| Certificate of Amendment to Amended and Restated Certificate of Incorporation of Plug Power Inc. (filed as Exhibit 3.3 to Plug Power Inc.’s Annual Report on Form 10-K for the year ended December 31, 2008 and incorporated by reference herein)
|
|
|
| 3.3
|
| Second Certificate of Amendment of Amended and Restated Certificate of Incorporation of Plug Power Inc. (filed as Exhibit 3.1 to Plug Power Inc.’s Current Report on Form 8-K filed on May 19, 2011 and incorporated by reference herein)
|
|
|
| 3.4
|
| Third Certificate of Amendment of Amended and Restated Certificate of Incorporation of Plug Power Inc. (filed as Exhibit 3.1 to Plug Power Inc.’s Current Report on Form 8-K filed on July 25, 2014 and incorporated by reference herein)
|
|
|
| 3.5
|
| Certificate of Correction to Third Certificate of Amendment of Amended and Restated Certificate of Incorporation of Plug Power Inc. (filed as Exhibit 3.9 to Plug Power Inc.’s Annual Report on Form 10-K for the year ended December 31, 2016 and incorporated by reference herein)
|
|
|
| 3.6
|
| Fourth Certificate of Amendment of Amended and Restated Certificate of Incorporation of Plug Power Inc. (filed as Exhibit 3.1 to Plug Power Inc.’s Current Report on Form 8-K filed on June 30, 2017 and incorporated by reference herein)
|
|
|
| 3.7
|
| Certificate of Designations, Preferences and Rights of a Series of Preferred Stock of Plug Power Inc. classifying and designating the Series A Junior Participating Cumulative Preferred Stock. (filed as Exhibit 3.1 to Plug Power Inc.’s Registration Statement on Form 8-A filed on June 24, 2009 and incorporated by reference herein)
|
|
|
| 3.8
|
| Certificate of Designations, Preferences and Rights of a Series of Preferred Stock of Plug Power Inc. classifying and designating the Series C Redeemable Convertible Preferred Stock. (filed as Exhibit 3.1 to Plug Power Inc.’s Current Report on Form 8-K filed on May 20, 2013 and incorporated by reference herein)
|
|
|
| 3.9*
|
| Fourth Amended and Restated By-laws of Plug Power Inc.
|
|
|
| 3.10
|
| Certificate of Designations, Preferences and Rights of a Series of Preferred Stock of Plug Power Inc. classifying and designating the Series E Convertible Preferred Stock (filed as Exhibit 3.1 to Plug Power Inc.’s Current Report on Form 8-K filed on November 2, 2018 and incorporated by reference herein)
|
105
15(a)(2) Financial Statement Schedules Schedules have been omitted as they are not applicable, or the required information or equivalent information has been included in the Consolidated Financial Statements or the notes thereto. 15(a)(3) Exhibits The following exhibits are filed as part of and incorporated by reference into this Annual Report on Form 10-K. | | |
|---|
Exhibit No.
| | | |
|---|
Exhibit No. | | Description |
|---|
| | | 2.1 | | Agreement and Plan of Merger, dated June 22, 2020, by and among Plug Power Inc., Giner ELX, Inc., Giner ELX Sub, LLC, Giner ELX Merger Sub, Inc. and Giner, Inc., as the representative of the stockholders of Giner ELX, Inc. (filed as Exhibit 2.1 to Plug Power Inc.’s Current Report on Form 8-K filed on June 23, 2020 and incorporated by reference herein) | | | | 2.2 | | Agreement and Plan of Merger, dated June 18, 2020, by and among Plug Power Hydrogen Holdings, Inc., UHG Merger Sub, Inc., United Hydrogen Group Inc. and Vladimir Prerad, as the representative of the stockholders of United Hydrogen Group Inc. (filed as Exhibit 2.2 to Plug Power Inc.’s Current Report on Form 8-K filed on June 23, 2020 and incorporated by reference herein) | | | | 3.1 | | Amended and Restated Certificate of Incorporation of Plug Power Inc. (filed as Exhibit 3.1 to Plug Power Inc.’s Annual Report on Form 10-K for the year ended December 31, 2008 and incorporated by reference herein) | | | | 3.2 | | Certificate of Amendment to Amended and Restated Certificate of Incorporation of Plug Power Inc. (filed as Exhibit 3.3 to Plug Power Inc.’s Annual Report on Form 10-K for the year ended December 31, 2008 and incorporated by reference herein) | | | | 3.3 | | Second Certificate of Amendment of Amended and Restated Certificate of Incorporation of Plug Power Inc. (filed as Exhibit 3.1 to Plug Power Inc.’s Current Report on Form 8-K filed on May 19, 2011 and incorporated by reference herein) | | | | 3.4 | | Third Certificate of Amendment of Amended and Restated Certificate of Incorporation of Plug Power Inc. (filed as Exhibit 3.1 to Plug Power Inc.’s Current Report on Form 8-K filed on July 25, 2014 and incorporated by reference herein) | | | | 3.5 | | Certificate of Correction to Third Certificate of Amendment of Amended and Restated Certificate of Incorporation of Plug Power Inc. (filed as Exhibit 3.9 to Plug Power Inc.’s Annual Report on Form 10-K for the year ended December 31, 2016 and incorporated by reference herein) | | | | 3.6 | | Fourth Certificate of Amendment of Amended and Restated Certificate of Incorporation of Plug Power Inc. (filed as Exhibit 3.1 to Plug Power Inc.’s Current Report on Form 8-K filed on June 30, 2017 and incorporated by reference herein) | | | | 3.7 | | Fifth Certificate of Amendment of Amended and Restated Certificate of Incorporation of Plug Power Inc. (filed as Exhibit 3.7 to Plug Power Inc.’s Quarterly Report on Form 10-Q filed on August 5, 2021 and incorporated by reference herein) | | | | 3.8 | | Certificate of Designations, Preferences and Rights of a Series of Preferred Stock of Plug Power Inc. classifying and designating the Series A Junior Participating Cumulative Preferred Stock. (filed as Exhibit 3.1 to Plug Power Inc.’s Registration Statement on Form 8-A filed on June 24, 2009 and incorporated by reference herein) | | | | 3.9* | | Fifth Amended and Restated Bylaws of Plug Power Inc. | | | | 4.1 | | Specimen certificate for shares of common stock, $.01 par value, of Plug Power Inc. (filed as Exhibit 4.1 to Plug Power Inc.’s Registration Statement on Form S-1 (File Number 333-86089) and incorporated by reference herein) | | | |
| | |
|---|
Exhibit No. | | Description |
|---|
4.2 | | Indenture, dated as of May 18, 2020, between Plug Power Inc. and Wilmington Trust, National Association (filed as Exhibit 4.1 to Plug Power Inc.’s Current Report on Form 8-K filed on May 19, 2020 and incorporated by reference herein) | | | | 4.3 | | Form of 3.75% Convertible Senior Notes due June 1, 2025 (filed as Exhibit 4.1 to Plug Power Inc.’s Current Report on Form 8-K filed on May 19, 2020 and incorporated by reference herein) | | | | 4.4 | | Warrant to Purchase Common Stock, issued April 4, 2017, between Plug Power Inc. and Amazon.com NV Investment Holdings LLC (filed as Exhibit 4.1 to Plug Power Inc.’s Current Report on Form 8-K filed on April 5, 2017 and incorporated by reference herein) | | | | 4.5 | | Warrant to Purchase Common Stock, issued July 20, 2017, between Plug Power Inc. and Wal-Mart Stores, Inc. (filed as Exhibit 4.1 to Plug Power Inc.’s Current Report on Form 8-K filed on July 21, 2017 and incorporated by reference herein) | | | | 4.6 | | Warrant to Purchase Common Stock, issued August 24, 2022, between Plug Power Inc. and Amazon.com NV Investment Holdings LLC (filed as Exhibit 4.1 to Plug Power Inc.’s Current Report on Form 8-K filed August 25, 2022 and incorporated by reference herein). | | | | 4.7 | | Description of the Registrant's securities registered under Section 12 of the Securities Exchange Act of 1934 (filed as Exhibit 4.6 to Plug Power Inc.’s Annual Report on Form 10-K filed on May 14, 2021 and incorporated by reference herein) | | | | 10.1# | | Employee Stock Purchase Plan (filed as Exhibit 10.34 to Plug Power Inc.’s Registration Statement on Form S-1 (File Number 333-86089) and incorporated by reference herein) | | | | 10.2# | | Form of Director Indemnification Agreement (filed as Exhibit 10.2 to Plug Power Inc.’s Annual Report on Form 10-K filed on May 14, 2021 and incorporated by reference herein) | | | | 10.3# | | Form of Officer Indemnification Agreement (filed as Exhibit 10.3 to Plug Power Inc.’s Annual Report on Form 10-K filed on May 14, 2021 and incorporated by reference herein) | | | | 10.4# | | Employment Agreement, dated as of April 7, 2008, between Andrew Marsh and Plug Power Inc. (filed as Exhibit 10.1 to Plug Power Inc.’s Current Report on Form 8-K filed on April 7, 2008 and incorporated by reference herein) | | | | 10.5# | | Executive Employment Agreement, dated as of May 5, 2008, between Gerard L. Conway, Jr. and Plug Power Inc. (filed as Exhibit 10.1 to Plug Power Inc.’s Quarterly Report on Form 10-Q filed on August 7, 2008 and incorporated by reference herein) | | | | 10.6# | | Executive Employment Agreement, dated as of October 23, 2013, between Keith C. Schmid and Plug Power Inc. (filed as Exhibit 99.2 to Plug Power Inc.’s Current Report on Form 8-K filed on October 29, 2013 and incorporated by reference herein) | | | | 10.7# | | Executive Employment Agreement, dated as of November 6, 2014, between Paul B. Middleton and Plug Power Inc. (filed as Exhibit 99.2 to Plug Power Inc.’s Current Report on Form 8-K filed on November 12, 2014 and incorporated by reference herein) | | | | 10.8# | | Executive Employment Agreement, dated as of April 16, 2019, between Sanjay Shrestha and Plug Power Inc. (filed as Exhibit 10.1 to Plug Power Inc.’s Quarterly Report on Form 10-Q filed on May 9, 2022 and incorporated by reference herein) | | | | 4.3
|
| Form of 3.75% Convertible Senior Notes due June 1, 2025 (filed as Exhibit 4.2 to Plug Power Inc.’s Current Report on Form 8-K filed on May 19, 2020 and incorporated by reference herein)
|
|
|
| 4.4
|
| Warrant to Purchase Common Stock, issued April 4, 2017, between Plug Power Inc. and Amazon.com NV Investment Holdings LLC (filed as Exhibit 4.1 to Plug Power Inc.’s Current Report on Form 8-K filed on April 5, 2017 and incorporated by reference herein)
|
|
|
| 4.5
|
| Warrant to Purchase Common Stock, issued July 20, 2017, between Plug Power Inc. and Wal-Mart Stores, Inc. (filed as Exhibit 4.1 to Plug Power Inc.’s Current Report on Form 8-K filed on July 21, 2017 and incorporated by reference herein)
|
|
|
| 4.6*
|
| Description of the Registrant's securities registered under Section 12 of the Securities Exchange Act of 1934
|
|
|
| 10.1#
|
| Employee Stock Purchase Plan (filed as Exhibit 10.34 to Plug Power Inc.’s Registration Statement on Form S-1 (File Number 333-86089) and incorporated by reference herein)
|
|
|
| 10.2#*
|
| Form of Director Indemnification Agreement
|
|
|
| 10.3#*
|
| Form of Officer Indemnification Agreement
|
|
|
| 10.4#
|
| Employment Agreement, dated as of April 7, 2008, between Andrew Marsh and Plug Power Inc. (filed as Exhibit 10.1 to Plug Power Inc.’s Current Report on Form 8-K filed on April 7, 2008 and incorporated by reference herein)
|
|
|
| 10.5#
|
| Executive Employment Agreement, dated as of May 5, 2008, between Gerard L. Conway, Jr. and Plug Power Inc. (filed as Exhibit 10.1 to Plug Power Inc.’s Quarterly Report on Form 10-Q filed on August 7, 2008 and incorporated by reference herein)
|
|
|
| 10.6#
|
| Executive Employment Agreement, dated as of October 23, 2013, between Keith C. Schmid and Plug Power Inc. (filed as Exhibit 99.2 to Plug Power Inc.’s Current Report on Form 8-K filed on October 29, 2013 and incorporated by reference herein)
|
|
|
| 10.7#
|
| Executive Employment Agreement, dated as of November 6, 2014, between Paul B. Middleton and Plug Power Inc. (filed as Exhibit 99.2 to Plug Power Inc.’s Current Report on Form 8-K filed on November 12, 2014 and incorporated by reference herein)
|
|
|
| 10.8#
|
| Form of Incentive Stock Option Agreement (filed as Exhibit 10.2 to Plug Power Inc.’s Quarterly Report on Form 10-Q filed on August 11, 2011 and incorporated by reference herein)
|
|
|
| 10.9#
|
| Form of Non-Qualified Stock Option Agreement for Employees (filed as Exhibit 10.3 to Plug Power Inc.’s Quarterly Report on Form 10-Q filed on August 11, 2011 and incorporated by reference herein)
|
|
|
| 10.10#
|
| Form of Non-Qualified Stock Option Agreement for Independent Directors (filed as Exhibit 10.4 to Plug Power Inc.’s Quarterly Report on Form 10-Q filed on August 11, 2011
|
106
| | | 10.10#* | | TableExecutive Employment Agreement, dated as of ContentsJune 1, 2021, between David Mindnich and Plug Power Inc.
| | |
|---|
Exhibit No.
|
| Description
|
|---|
|
|
| 10.11#
|
| Form of Restricted Stock Award Agreement (filed as Exhibit 10.5 to Plug Power Inc.’s Quarterly Report on Form 10-Q filed on August 11, 2011 and incorporated by reference herein)
|
|
|
| 10.12
|
| Purchase and Sale Agreement dated as of January 24, 2013, between Plug Power Inc. and 968 Albany Shaker Road Associates, LLC (filed as Exhibit 10.1 to Plug Power Inc.’s Current Report on Form 8-K filed on April 1, 2013 and incorporated by reference herein)
|
|
|
| 10.13
|
| Amendment to Purchase and Sale Agreement dated as of March 13, 2013 between Plug Power Inc. and 968 Albany Shaker Road Associates, LLC (filed as Exhibit 10.2 to Plug Power Inc.’s Current Report on Form 8-K filed on April 1, 2013 and incorporated by reference herein)
|
|
|
| 10.14
|
| Stock Purchase Agreement dated as of January 6, 2021, between Plug Power Inc., Grove Energy Capital LLC, Plutus Capital NY, Inc., and SK E&S Americas, Inc. (filed as exhibit 10.1 to Plug Power Inc.’s Current Report on Form 8-K filed on January
| | | | 10.11# | | Executive Employment Agreement, dated as of December 7, 2021 and incorporated by reference herein) |
|
|
| 10.15
|
| Investor Agreement, dated as of February 24, 2021, between Plug Power Inc., Grove Energy Capital LLC, SK Holdings, Co., Ltd. and SK E&S Co., Ltd. (filed as Exhibit 10.1 to Plug Power Inc.’s Current Report on Form 8-K filed on February 25, 2021 and incorporated by reference herein)
|
|
|
| 10.16
|
| Transaction Agreement, dated as of April 4, 2017, between Plug Power Inc. and Amazon.com, Inc. (filed as Exhibit 10.1 to Plug Power Inc.’s Current Report on Form 8-K filed on April 5, 2017 and incorporated by reference herein)
| |
|
| 10.17
|
| Transaction Agreement, dated as of July 20, 2017, between Plug Power Inc. and Wal-Mart Stores, Inc. (filed as Exhibit 10.1 to Plug Power Inc.’s Current Report on Form 8-K filed on July 21, 2017 and incorporated by reference herein)
| |
|
| 10.18
|
| Master Lease Agreement, dated as of June 30, 2017, between Plug Power Inc. and Wells Fargo Equipment Finance, Inc. (filed as Exhibit 10.2 to Plug Power Inc.’s Current Report on Form 8-K filed on July 21, 2017 and incorporated by reference herein)
| |
|
| 10.19
|
| Base Call Option Confirmation, dated as of May 13, 2020, between Plug Power Inc. and Morgan Stanley & Co. LLC. (filed as Exhibit 10.1 to Plug Power Inc.’s Current Report on Form 8-K filed on May 19, 2020 and incorporated by reference herein)
| |
|
| 10.20
|
| Base Call Option Confirmation, dated as of May 13, 2020, between Plug Power Inc. and Wells Fargo Bank, National Association. (filed as Exhibit 10.2 to Plug Power Inc.’s Current Report on Form 8-K filed on May 19, 2020 and incorporated by reference herein)
|
|
|
| 10.21
|
| Forward Stock Purchase Transaction Confirmation, dated as of March 22, 2018, between Plug Power Inc. and Morgan Stanley & Co, LLC (filed as Exhibit 10.1 to Plug Power Inc.’s Current Report on Form 8-K filed on March 28, 2018 and incorporated by reference herein)
|
|
|
| 10.22
|
| Amendment to Forward Stock Purchase Transaction, dated as of May 13, 2020, between Plug Power Inc. and Morgan Stanley & Co. LLC. (filed as Exhibit 10.3 to Plug Power Inc.’s Current Report on Form 8-K filed on May 19, 2020, between Dirk Ole Hoefelmann and Plug Power Inc. (filed as Exhibit 10.2 to Plug Power Inc.’s Quarterly Report on Form 10-Q filed on May 9, 2022 and incorporated by reference herein)
| | | | 10.12# | | Form of Non-Qualified Stock Option Agreement for Company Employees (filed as Exhibit 10.9 to Plug Power Inc.’s Annual Report on Form 10-K filed on March 1, 2022 and incorporated by reference herein) | | | | 10.13# | | Form of Non-Qualified Stock Option Agreement for Non-Employee Directors (filed as Exhibit 10.10 to Plug Power Inc.’s Annual Report on Form 10-K filed on March 1, 2022 and incorporated by reference herein) | | | | 10.14# | | Form of Non-Qualified Stock Option Agreement for Non-U.S. Optionees (filed as Exhibit 10.2 to Plug Power Inc.’s Quarterly Report on Form 10-Q filed on November 8, 2022 and incorporated by reference herein) | | | | 10.15# | | Form of Restricted Stock Award Agreement for Company Employees (filed as Exhibit 10.11 to Plug Power Inc.’s Annual Report on Form 10-K filed on March 1, 2022 and incorporated by reference herein) | | | | 10.16# | | Form of Restricted Stock Award Agreement for Non-Employee Directors (filed as Exhibit 10.12 to Plug Power Inc.’s Annual Report on Form 10-K filed on March 1, 2022 and incorporated by reference herein) | | | | 10.17# | | Form of Restricted Stock Unit Award Agreement for Non-U.S. Grantees (filed as Exhibit 10.2 to Plug Power Inc.’s Quarterly Report on Form 10-Q filed on November 8, 2022 and incorporated by reference herein) | | | | 10.18# | | Form of Performance-Based Non-Qualified Stock Option Agreement for Executives Residing in the States of New York or New Jersey (filed as Exhibit 10.13 to Plug Power Inc.’s Annual Report on Form 10-K filed on March 1, 2022 and incorporated by reference herein) | | | | 10.19# | | Form of Performance-Based Non-Qualified Stock Option Agreement for Chief Executive Officer (filed as Exhibit 10.14 to Plug Power Inc.’s Annual Report on Form 10-K filed on March 1, 2022 and incorporated by reference herein) | | | | 10.20 | | Purchase and Sale Agreement dated as of January 24, 2013, between Plug Power Inc. and 968 Albany Shaker Road Associates, LLC (filed as Exhibit 10.1 to Plug Power Inc.’s Current Report on Form 8-K filed on April 1, 2013 and incorporated by reference herein) | | | | 10.21 | | Amendment to Purchase and Sale Agreement dated as of March 13, 2013 between Plug Power Inc. and 968 Albany Shaker Road Associates, LLC (filed as Exhibit 10.2 to Plug Power Inc.’s Current Report on Form 8-K filed on April 1, 2013 and incorporated by reference herein) | | | | 10.22 | | Investor Agreement, dated as of February 24, 2021, between Plug Power Inc., Grove Energy Capital LLC, SK Holdings, Co., Ltd. and SK E&S Co., Ltd. (filed as Exhibit 10.1 to Plug Power Inc.’s Current Report on Form 8-K filed on February 25, 2021 and incorporated by reference herein) | | | | 10.23 | | Transaction Agreement, dated as of April 4, 2017, between Plug Power Inc. and Amazon.com, Inc. (filed as Exhibit 10.1 to Plug Power Inc.’s Current Report on Form 8-K filed on April 5, 2017 and incorporated by reference herein) | | | |
| | |
|---|
Exhibit No. | | Description |
|---|
10.24 | | Transaction Agreement, dated as of July 20, 2017, between Plug Power Inc. and Wal-Mart Stores, Inc. (filed as Exhibit 10.1 to Plug Power Inc.’s Current Report on Form 8-K filed on July 21, 2017 and incorporated by reference herein) | | | | 10.25 | | Transaction Agreement, dated as of August 24, 2022, between Plug Power Inc. and Amazon.com, Inc. (filed as Exhibit 10.1 to Plug Power Inc.’s Current Report on Form 8-K filed August 25, 2022 and incorporated by reference herein) | | | | 10.26 | | Master Lease Agreement, dated as of June 30, 2017, between Plug Power Inc. and Wells Fargo Equipment Finance, Inc. (filed as Exhibit 10.2 to Plug Power Inc.’s Current Report on Form 8-K filed on July 21, 2017 and incorporated by reference herein) | | | | 10.27 | | Base Call Option Confirmation, dated as of May 13, 2020, between Plug Power Inc. and Morgan Stanley & Co. LLC. (filed as Exhibit 10.1 to Plug Power Inc.’s Current Report on Form 8-K filed on May 19, 2020 and incorporated by reference herein) | | | | 10.28 | | Base Call Option Confirmation, dated as of May 13, 2020, between Plug Power Inc. and Wells Fargo Bank, National Association. (filed as Exhibit 10.2 to Plug Power Inc.’s Current Report on Form 8-K filed on May 19, 2020 and incorporated by reference herein) | | | | 10.29 | | Forward Stock Purchase Transaction Confirmation, dated as of March 22, 2018, between Plug Power Inc. and Morgan Stanley & Co, LLC (filed as Exhibit 10.1 to Plug Power Inc.’s Current Report on Form 8-K filed on March 28, 2018 and incorporated by reference herein) | | | | 10.30 | | Amendment to Forward Stock Purchase Transaction, dated as of May 13, 2020, between Plug Power Inc. and Morgan Stanley & Co. LLC. (filed as Exhibit 10.3 to Plug Power Inc.’s Current Report on Form 8-K filed on May 19, 2020 and incorporated by reference herein) | | | | 10.31 | | At Market Issuance Sales Agreement, dated April 13, 2020, by and between Plug Power Inc. and B. Riley FBR, Inc. (filed as Exhibit 1.1 to Plug Power Inc.’s Current Report on Form 8-K filed on April 13, 2020 and incorporated by reference herein) | | | | 10.32 | | First Amended and Restated Master Lease Agreement, dated as of July 30, 2018, between Plug Power Inc. and Wells Fargo Equipment Finance, Inc. (filed as Exhibit 10.4 to Plug Power Inc.’s Quarterly Report on Form 10-Q filed on May 8, 2019 and incorporated by reference herein) | | | | 10.33# | | 2021 Stock Option and Incentive Plan (filed as Appendix B to Plug Power Inc.’s Schedule 14A Proxy Statement filed on July 9, 2021 and incorporated by reference herein) | | | | 10.34# | | Amendment No. 1 to the 2021 Stock Option and Incentive Plan (filed as Appendix A to Plug Power Inc.’s Schedule 14A Proxy Statement filed on May 2, 2022 and incorporated by reference herein) | | | | 10.35 | | Master Lease Agreement, dated as of April 10, 2019, between Plug Power Inc. and Wells Fargo Equipment Finance, Inc. (filed as Exhibit 10.31 to Plug Power Inc.’s Annual Report on Form 10-K filed on May 14, 2021 and incorporated by reference herein) | | | | 21.1* | | List of Subsidiaries of Plug Power Inc. | | | | 23.1* | | Consent of Deloitte & Touche LLP | | | | 23.2* | | Consent of KPMG LLP | | | | 24.1* | | Power of Attorney (incorporated by reference to the signature page of this Annual Report on Form 10-K) | | | |
*Submitted electronically herewith. #Indicates a management contract or any compensatory plan, contract or arrangement. ** | The certifications furnished in Exhibit 32 hereto are deemed to be furnished with this Annual Report on Form 10-K and will not be deemed to be “filed” for purposes of Section 18 of the Securities Exchange Act of 1934, as amended, except to the extent that the registrant specifically incorporates it by reference. |
Item16. Form 10-K Summary Not applicable. | | |
|---|
Exhibit No.
|
| Description
|
|---|
|
|
| 10.24
|
| Loan and Security Agreement dated March 29, 2019, among Plug Power Inc., Emerging Power Inc., Emergent Power Inc., and Generate Lending, LLC (filed as Exhibit 10.1 to Plug Power Inc.’s Current Report on Form 8-K filed on April 3, 2019 and incorporated by reference herein)
|
|
|
| 10.25
|
| First Amendment to Loan and Security Agreement dated March 29, 2019, among Plug Power Inc. and Emerging Power Inc., Emergent Power Inc., and Generate Lending, LLC (filed as Exhibit 10.2 to Plug Power Inc.’s Current Report on Form 8-K filed on April 3, 2019 and incorporated by reference herein)
|
|
|
| 10.26
|
| First Amended and Restated Master Lease Agreement, dated as of July 30, 2018, between Plug Power Inc. and Wells Fargo Equipment Finance, Inc. (filed as Exhibit 10.4 to Plug Power Inc.’s Current Report on Form 10-Q filed on May 8, 2019 and incorporated by reference herein)
|
|
|
| 10.27#
|
| Third Amended and Restated 2011 Stock Option and Incentive Plan (filed as Exhibit 10.1 to Plug Power Inc.’s Current Report on Form 8-K filed on May 15, 2019 and incorporated by reference herein)
|
|
|
| 10.28
|
| Third Amendment to Loan and Security Agreement, dated September 6, 2019, among Plug Power Inc. and Emerging Power Inc., Emergent Power Inc., and Generate Lending, LLC (filed as Exhibit 10.3 to Plug Power Inc.’s Current Report on Form 8-K filed on September 9, 2019 and incorporated by reference herein)
|
|
|
| 10.29
|
| Fourth Amendment to Loan and Security Agreement, dated November 27, 2019, among Plug Power Inc. and Emerging Power Inc., Emergent Power Inc., and Generate Lending, LLC (filed as Exhibit 10.1 to Plug Power Inc.’s Current Report on Form 8-K filed on December 2, 2019 and incorporated by reference herein)
|
|
|
| 10.30
|
| Sixth Amendment to Loan and Security Agreement, dated as of May 13, 2020, by and among Plug Power Inc., Emerging Power Inc., Emergent Power Inc. and Generate Lending, LLC (filed as Exhibit 10.1 to Plug Power Inc.’s Current Report on Form 8-K filed on May 14, 2020 and incorporated by reference herein)
|
|
|
| 10.31*
|
| Master Lease Agreement, dated as of April 10, 2019, between Plug Power Inc. and Wells Fargo Equipment Finance, Inc.
|
|
|
| 10.32*
|
| Master Lease Agreement, dated as of July 20, 2020, between Plug Power Inc. and Wells Fargo Equipment Finance, Inc.
|
|
|
| 23.1*
|
| Consent of KPMG LLP
|
|
|
| 24.1*
|
| Power of Attorney (incorporated by reference to the signature page of this report on Form 10-K)
|
|
|
| 31.1*
|
| Rule 13a-14(a)/15d-14(a) Certification of Chief Executive Officer pursuant to Section 302 of the Sarbanes-Oxley Act of 2002
|
|
|
| 31.2*
|
| Rule 13a-14(a)/15d-14(a) Certification of Chief Financial Officer pursuant to Section 302 of the Sarbanes Oxley Act of 2002
|
|
|
| 32.1**
|
| Section 1350 Certification of Chief Executive Officer pursuant to Section 906 of the Sarbanes Oxley Act of 2002
|
|
|
| 32.2**
|
| Section 1350 Certification of Chief Financial Officer pursuant to Section 906 of the Sarbanes Oxley Act of 2002
|
|
|
| 101.INS*
|
| XBRL Instance Document.
|
|
|
| 101.SCH*
|
| XBRL Taxonomy Extension Schema Document.
|
| | |
|---|
Exhibit No.
|
| Description
|
|---|
|
|
| 101.INS*
|
| Inline XBRL Instance Document (1)
|
|
|
| 101.SCH*
|
| XBRL Taxonomy Extension Schema Document (1)
|
|
|
| 101.CAL*
|
| XBRL Taxonomy Extension Calculation Linkbase Document (1)
|
|
|
| 101.DEF*
|
| XBRL Taxonomy Extension Definition Linkbase Document (1)
| 101.LAB*
|
| XBRL Taxonomy Extension Labels Linkbase Document (1)
|
|
|
| 101.PRE*
|
| XBRL Taxonomy Extension Presentation Linkbase Document (1)
|
|
|
| 104
|
| Cover Page Interactive Data File (embedded within the Inline XBRL document) (1)
|
(1)Filed herewith.
*Submitted electronically herewith.
Item16. Form 10-K Summary
Not Applicable.
POWER OF ATTORNEY KNOW ALL MEN BY THESE PRESENTS that each individual whose signature appears below constitutes and appoints each of Andrew Marsh, Paul B. Middleton and Gerard L. Conway, Jr. such person’s true and lawful attorney-in-fact and agent with full power of substitution, for such person and in such person’s name, place and stead, in any and all capacities, to sign any and all amendments to this Annual Report on Form 10-K, and to file the same, with all exhibits thereto, and all documents in connection therewith, with the Securities and Exchange Commission, granting unto each said attorney-in-fact and agent full power and authority to do and perform each and every act and thing requisite and necessary to be done in and about the premises, as fully to all intents and purposes as such person might or could do in person, hereby ratifying and confirming all that any said attorney-in-fact and agent, or any substitute or substitutes of any of them, may lawfully do or cause to be done by virtue hereof. Date: May 13, 2021March 1, 2023 Pursuant to the requirements of the Securities Exchange Act of 1934, this report has been signed below by the following persons on behalf of the registrant and in the capacities and on the dates indicated. /s/ ANDREW MARSH | | President, Chief Executive Officer and Director | | May 13, 2021March 1, 2023
| Andrew Marsh | | (Principal Executive Officer) | | | | | | | |
|
|
|
|
| /s/ PAUL B. MIDDLETON | | Chief Financial Officer | | May 13, 2021March 1, 2023
| Paul B. Middleton | | (Principal Financial Officer) | | |
|
|
|
|
| | | | | | /s/ MARTIN D. HULL | | Controller & Chief Accounting Officer | | May 13, 2021March 1, 2023
| Martin D. Hull | | (Principal Accounting Officer) | | | | | | | |
|
|
|
|
| /s/ LUCAS P. SCHNEIDER | | Director | | May 13, 2021March 1, 2023
| Lucas P. Schneider | | | | |
|
|
|
|
| | | | | | /s/ MAUREEN O. HELMER | | Director | | May 13, 2021March 1, 2023
| Maureen O. Helmer | | | | | | | | | |
|
|
|
|
| /s/ JONATHAN M. SILVER | | Director | | May 13, 2021March 1, 2023
| Jonathan M. Silver | | | | |
|
|
|
|
| | | | | | /s/ GREGORY L. KENAUSIS | | Director | | May 13, 2021March 1, 2023
| Gregory L. Kenausis | | | | |
|
|
|
|
| | | | | | /s/ GEORGE C. MCNAMEE | | Director | | May 13, 2021March 1, 2022
| George C. McNamee | | | | | | | | | |
|
|
|
|
|
|
|
|
|
| /s/ JOHANNES MINHO ROTHJEAN A. BUA | | Director | | May 13, 2021March 1, 2023
| Johannes Minho RothJean A. Bua
| | | | |
|
|
|
|
|
|
|
|
|
| | | | | | /s/ GARY K. WILLIS | | Director | | May 13, 2021
March 1, 2023
| Gary K. Willis | | | | |
/s/ KYUNGYEOL SONG | | Director | | May 13, 2021
March 1, 2023
| Kyungyeol Song | | | | | | | | | | /s/ KIMBERLY A. HARRIMANKAVITA MAHTANI | | Director | | May 13, 2021
March 1, 2023
| Kimberly A. HarrimaKavita Mahtani
| | | | |
INDEX TO CONSOLIDATED FINANCIAL STATEMENTS | | | Page | Report of Independent Registered Public Accounting Firm (Deloitte & Touche LLP, PCAOB ID 34) | F-2 | Report of Independent Registered Public Accounting Firm (KPMG LLP, PCAOB ID 185) | F-5 | Consolidated balance sheets as of December 31, 20202022 and 20192021 | F-7F-6
| Consolidated statements of operations for the years ended December 31, 2020, 2019,2022, 2021, and 20182020 | F-8F-7
| Consolidated statements of comprehensive loss for the years ended December 31, 2020, 2019,2022, 2021, and 20182020 | F-9F-8
| Consolidated statements of stockholders’ equity (deficit) for the years ended December 31, 2020, 2019,2022, 2021, and 20182020 | F-10F-9
| Consolidated statements of cash flows for the years ended December 31, 2020, 2019,2022, 2021, and 20182020 | F-11F-10
| Notes to consolidated financial statements | F-12F-11
|
REPORT OF INDEPENDENT REGISTERED PUBLIC ACCOUNTING FIRM To the stockholders and the Board of Directors of Plug Power Inc. Opinion on the Financial Statements We have audited the accompanying consolidated balance sheet of Plug Power Inc. and subsidiaries (the "Company") as of December 31, 2022, the related consolidated statements of operations, comprehensive loss, stockholders' equity, and cash flows, for the period ended December 31, 2022, and the related notes (collectively referred to as the "financial statements"). In our opinion, the consolidated financial statements present fairly, in all material respects, the financial position of the Company as of December 31, 2022 and the results of its operations and its cash flows for the period then ended, in conformity with accounting principles generally accepted in the United States of America. We have also audited, in accordance with the standards of the Public Company Accounting Oversight Board (United States) (PCAOB), the Company's internal control over financial reporting as of December 31, 2022, based on criteria established in Internal Control — Integrated Framework (2013) issued by the Committee of Sponsoring Organizations of the Treadway Commission and our report dated March 1, 2023 expressed an adverse opinion on the Company's internal control over financial reporting. Basis for Opinion These financial statements are the responsibility of the Company's management. Our responsibility is to express an opinion on the Company's financial statements based on our audits. We are a public accounting firm registered with the PCAOB and are required to be independent with respect to the Company in accordance with the U.S. federal securities laws and the applicable rules and regulations of the Securities and Exchange Commission and the PCAOB. We conducted our audits in accordance with the standards of the PCAOB. Those standards require that we plan and perform the audit to obtain reasonable assurance about whether the financial statements are free of material misstatement, whether due to error or fraud. Our audits included performing procedures to assess the risks of material misstatement of the financial statements, whether due to error or fraud, and performing procedures that respond to those risks. Such procedures included examining, on a test basis, evidence regarding the amounts and disclosures in the financial statements. Our audits also included evaluating the accounting principles used and significant estimates made by management, as well as evaluating the overall presentation of the financial statements. We believe that our audits provide a reasonable basis for our opinion. Critical Audit Matters The critical audit matters communicated below are matters arising from the current-period audit of the financial statements that were communicated or required to be communicated to the audit committee and that (1) relate to accounts or disclosures that are material to the financial statements and (2) involved our especially challenging, subjective, or complex judgments. The communication of critical audit matters does not alter in any way our opinion on the financial statements, taken as a whole, and we are not, by communicating the critical audit matters below, providing separate opinions on the critical audit matters or on the accounts or disclosures to which they relate. Standalone Selling Price — Refer to Notes 2 and 18 of the financial statements Critical Audit Matter Description The Company’s contracts with customers generally contain multiple performance obligations, and the total transaction price is allocated for purposes of recognizing revenue based on relative standalone selling prices. The Company estimates standalone selling prices for fuel cells and infrastructure by considering several inputs, including prices from a limited number of standalone sales as well as the Company’s negotiations with customers. The Company also considers its costs to produce fuel cells as well as comparable list prices in estimating standalone selling prices. For services performed on fuel cells and infrastructure, the Company uses an adjusted market assessment approach that considers market conditions and constraints, pricing strategies and objectives while maximizing the use of available observable inputs obtained from a limited number of historical standalone service renewal prices and negotiations with customers. The Company recognized net revenue from the sales of fuel cells of $207.7 million, sale of hydrogen infrastructure of $141.5 million and sales of services of $35.3 million for the year ended December 31, 2022. We identified the evaluation of the sufficiency of audit evidence obtained related to the standalone selling prices for fuel cells and infrastructure and services as a critical audit matter. Significant auditor judgment was required to evaluate the appropriateness of the estimate of standalone selling prices for fuel cells, infrastructure, as well as services performed on fuel cells and infrastructure, because of the nature of the technology, its emerging market acceptance and the Company’s limited history of selling these products and services on a standalone basis. How the Critical Audit Matter Was Addressed in the Audit Our audit procedures related to Standalone Selling Price included the following, among others: | ● | We obtained an understanding of the Company’s process to estimate standalone selling prices by conducting a business process walkthrough. This included obtaining an understanding related to the assessment of the relevance and reliability of the inputs mentioned above. |
| ● | We performed sensitivity analyses of the significant assumptions used in the model to evaluate the change in standalone selling price resulting from changes in the significant assumptions. |
| ● | We applied auditor judgment to determine the nature and extent of procedures to be performed over standalone selling prices. |
| ● | We inquired of personnel to understand the Company’s pricing strategies, negotiations with customers, and prices that customers are willing to pay for fuel cells and services. |
| ● | We evaluated the Company’s estimates of standalone selling prices by comparing those estimates to supporting documentation, such as a selection of historical sales transactions, correspondence with customers, and industry research. |
| ● | We evaluated the accuracy and completeness of the data used by the Company by agreeing historical prices to executed sales transactions and to third-party information where applicable. |
| ● | We evaluated the sufficiency of audit evidence obtained over standalone selling prices by assessing the results of procedures performed, including the appropriateness of the nature of such evidence |
Loss accrual for service contracts — Refer to Note 2 of the financial statements The Company records an accrual for loss contracts if the sum of expected costs of providing maintenance services for fuel cell systems and related infrastructure exceeds the related unearned net revenues over the remaining contract term. The Company recorded an accrual for loss contracts of $81.1 million as of December 31, 2022. Maintenance costs are estimated in determining the accrual for loss contracts based upon current service cost levels. We identified the evaluation of maintenance cost projections in the accrual for loss contracts related to service as a critical audit matter. A high degree of auditor judgment was required to evaluate the expected remaining service costs required to fulfill the related customer maintenance contracts. Changes in the expected costs of providing maintenance services could have had a significant effect on the amount of the recorded accrual for loss contracts. How the Critical Audit Matter Was Addressed in the Audit Our audit procedures related to Loss Accrual for Service Contracts included the following, among others: | ● | We obtained an understanding of the Company’s process to estimate the loss accrual for service contracts by conducting a business process walkthrough. This included obtaining an understanding related to the assessment of the relevance and reliability of the inputs mentioned above. |
| ● | We inquired of operational and financial personnel to understand the technical elements of the Company’s expected future cost of providing maintenance services related to these service contracts. |
| ● | We obtained and agreed the projected revenue associated with loss contracts and evaluated the accuracy and completeness of the information. |
| ● | We obtained underlying documentation supporting the projected cost and compared the information to the Company’s analysis of historical cost of providing maintenance services and evaluated the accuracy and completeness of the information. |
| ● | We recalculated the mathematical accuracy of the loss accrual for service contracts. |
| ● | We obtained the Company’s analysis supporting the range of the possible loss accrual for service contracts, which was developed based on potential changes in assumptions. |
| ● | We performed sensitivity analyses to related to the historical cost information used to develop the estimate of future costs. |
/s/ Deloitte & Touche LLP Rochester, NY March 1, 2023 We have served as the Company's auditor since 2022. Report of Independent Registered Public Accounting Firm To the Stockholders and Board of Directors
Plug Power Inc.: Opinion on the Consolidated Financial Statements We have audited the accompanying consolidated balance sheetssheet of Plug Power Inc. and subsidiaries (the Company) as of December 31, 2020 and 2019,2021, the related consolidated statements of operations, comprehensive loss, stockholders’ equity, (deficit), and cash flows for each of the years in the three-yeartwo-year period ended December 31, 2020,2021, and the related notes (collectively, the consolidated financial statements). In our opinion, the consolidated financial statements present fairly, in all material respects, the financial position of the Company as of December 31, 2020 and 2019,2021, and the results of its operations and its cash flows for each of the years in the three-yeartwo-year period ended December 31, 2020,2021, in conformity with U.S. generally accepted accounting principles. We also have audited, in accordance with the standards of the Public Company Accounting Oversight Board (United States) (PCAOB), the Company’s internal control over financial reporting as of December 31, 2020, based on criteria established in Internal Control – Integrated Framework (2013) issued by the Committee of Sponsoring Organizations of the Treadway Commission, and our report dated May 13, 2021 expressed an adverse opinion on the effectiveness of the Company’s internal control over financial reporting.
Restatement of Previously Issued Financial Statements
As discussed in Note 2 to the consolidated financial statements, the 2019 and 2018 financial statements have been restated to correct misstatements.
Basis for Opinion These consolidated financial statements are the responsibility of the Company’s management. Our responsibility is to express an opinion on these consolidated financial statements based on our audits. We are a public accounting firm registered with the PCAOBPublic Company Accounting Oversight Board (United States) (PCAOB) and are required to be independent with respect to the Company in accordance with the U.S. federal securities laws and the applicable rules and regulations of the Securities and Exchange Commission and the PCAOB. We conducted our audits in accordance with the standards of the PCAOB. Those standards require that we plan and perform the audit to obtain reasonable assurance about whether the consolidated financial statements are free of material misstatement, whether due to error or fraud. Our audits included performing procedures to assess the risks of material misstatement of the consolidated financial statements, whether due to error or fraud, and performing procedures that respond to those risks. Such procedures included examining, on a test basis, evidence regarding the amounts and disclosures in the consolidated financial statements. Our audits also included evaluating the accounting principles used and significant estimates made by management, as well as evaluating the overall presentation of the consolidated financial statements. We believe that our audits provide a reasonable basis for our opinion. Critical Audit Matters
The critical audit matters communicated below are matters arising from the current period audit of the consolidated financial statements that were communicated or required to be communicated to the audit committee and that: (1) relate to accounts or disclosures that are material to the consolidated financial statements and (2) involved our especially challenging, subjective, or complex judgments. The communication of critical audit matters does not alter in any way our opinion on the consolidated financial statements, taken as a whole, and we are not, by communicating the critical audit matters below, providing separate opinions on the critical audit matters or on the accounts or disclosures to which they relate.
Stand-alone selling price
As discussed in Notes 4 and 19 to the consolidated financial statements, the Company’s contracts with customers generally contain multiple performance obligations, and the total transaction price is allocated for purposes of recognizing revenue based on relative standalone selling prices. The Company estimates standalone selling prices for fuel cells by considering several inputs, including prices from a limited number of standalone sales as well as the Company’s negotiations with customers. The Company also considers its costs to produce fuel cells as well as comparable list prices in estimating standalone selling prices. For services performed on fuel cells and infrastructure, the Company uses an adjusted market assessment approach that considers market conditions and constraints, the Company’s market share, pricing strategies and objectives while maximizing the use of available observable inputs obtained from a limited number of historical standalone service renewal prices and negotiations with customers. The Company recognized net revenue from the sales of fuel cells of $(55.1) million and sales of services of $(9.8) million for the year ended December 31, 2020./s/ KPMG LLP
We identified the evaluation of the sufficiency of audit evidence obtained related to the standalone selling prices for fuel cells and services as a critical audit matter. Significant auditor judgment was required to evaluate the appropriateness of the estimate of standalone selling prices for fuel cells as well as services performed on fuel cells and infrastructure, because of the nature of the technology, its emerging market acceptance and the Company’s limited history of selling these products and services on a standalone basis. The following are the primary procedures we performed to address this critical audit matter. We evaluated the design and tested the operating effectiveness of certain internal controls related to the Company’s process to estimate standalone selling prices. This included controls related to the assessment of the relevance and reliability of the inputs mentioned above. We applied auditor judgment to determine the nature and extent of procedures to be performed over standalone selling prices. We inquired of operational and financial personnel to understand the Company’s pricing strategies, negotiations with customers, and prices that customers are willing to pay for fuel cells and services. We evaluated the Company’s estimates of standalone selling prices by comparing those estimates to supporting documentation, such as a selection of historical sales transactions, correspondence with customers, and industry research. We evaluated the sufficiency of audit evidence obtained over standalone selling prices by assessing the results of procedures performed, including the appropriateness of the nature of such evidence.
Evaluation of a waiver of warrant vesting conditions
As discussed in Note 18 to the consolidated financial statements, in April 2017, the Company issued warrants to a customer to acquire up to 55,286,696 shares of the Company’s common stock, the vesting of which was conditioned upon payments made by the customer for the future purchase of goods and services from the Company. On December 31, 2020, the Company waived the warrants’ remaining vesting conditions (the Waiver), which resulted in the immediate vesting of all remaining unvested warrants and recognition of a $399.7 million reduction to revenue. The amount of the revenue reduction was determined by the Company’s assessment of the number of warrants that were considered probable of vesting under the terms of the original arrangement, based on projections of probable future cash collections.
We identified the evaluation of the accounting for and impact of the Waiver as a critical audit matter. A high degree of auditor judgment was required to evaluate the appropriate accounting for the Waiver as a different accounting conclusion could have had a material effect on the consolidated financial statements. Also, the Company’s assessment of the number of warrants that were considered probable of vesting immediately prior to the waiver required significant auditor judgment. Specifically, subjective auditor judgment was required to evaluate the Company’s projections of probable future cash collections from the customer under the terms of the original arrangement used to determine the probability of vesting.
The following are the primary procedures we performed to address this critical audit matter. We evaluated the design and tested the operating effectiveness of certain internal controls over the Company’s accounting for the Waiver, including controls over the Company’s process for accounting for the Waiver and the estimate of probable future cash collections from the customer. We evaluated the Company’s assessment of the accounting for the Waiver, including the determination that the Waiver resulted an immediate reduction to revenue. We obtained and read the Waiver agreement and inquired of key executives involved in the Waiver transaction as well as the board of directors. To evaluate management’s assessment of the number of warrants that were considered probable of vesting under the terms of the original arrangement, we compared the amount of projected probable future cash collections from the customer to either (1) purchase orders received from the customer for fuel cells, infrastructure and service, or (2) historical fuel purchases by the customer.
Maintenance cost projections in the accrual for loss contracts
As discussed in Note 4 to the consolidated financial statements, the Company records an accrual for loss contracts if the sum of expected costs of providing maintenance services for fuel cell systems and related infrastructure exceeds related unearned net revenues over the remaining contract term. The Company recorded an accrual for loss contracts of $24.0 million as of December 31, 2020. Maintenance costs are estimated in determining the accrual for loss contracts based upon current service cost levels and the estimated impact of the Company’s expected cost savings initiatives. Estimating the impact of the expected cost savings initiatives requires significant judgment. The estimated accrual for loss contracts is sensitive to changes in the assumed cost savings.
We identified the evaluation of maintenance cost projections in the accrual for loss contracts as a critical audit matter. A high degree of auditor judgment was required to evaluate the expected remaining service costs required to fulfill the related customer maintenance contracts. Specifically, assessing the likelihood of achieving as well as the expected impact of the cost savings initiatives required challenging auditor judgment. Minor changes in the expected costs of providing maintenance services could have had a significant effect on the amount of the recorded accrual for loss contracts.
The following are the primary procedures we performed to address this critical audit matter. We inquired of operational and financial personnel to understand the technical elements of planned operational changes and how and when those initiatives are expected to result in cost savings relative to the Company’s current cost of providing maintenance services. We obtained underlying documentation supporting expected cost savings associated with certain initiatives, and actual cost savings realized in 2020 in connection with one customer site and compared them to the Company’s analysis of expected costs of providing maintenance services utilized in the accrual for loss contracts. We performed sensitivity analyses to assess the impact of possible changes to the expected costs of providing maintenance services on the Company’s estimated accrual for loss contracts.

We have served as the Company’s auditor since 2001.
Albany, NY
May 13, 2021
Report of Independent Registered Public Accounting Firm
To the Stockholders and Board of Directors
Plug Power Inc.:
Opinion on Internal Control Over Financial Reporting
We have audited Plug Power Inc. and subsidiaries’ (the Company) internal control over financial reporting as of December 31, 2020, based on criteria established in Internal Control – Integrated Framework (2013) issued by the Committee of Sponsoring Organizations of the Treadway Commission. In our opinion, because of the effect of the material weakness, described below, on the achievement of the objectives of the control criteria, the Company has not maintained effective internal control over financial reporting as of December 31, 2020, based on criteria established in Internal Control – Integrated Framework (2013) issued by the Committee of Sponsoring Organizations of the Treadway Commission.
We also have audited, in accordance with the standards of the Public Company Accounting Oversight Board (United States) (PCAOB), the consolidated balance sheets of the Company as of December 31, 2020 and 2019, the related consolidated statements of operations, comprehensive loss, stockholders’ equity (deficit), and cash flows for each of the years in the three-year period ended December 31, 2020, and the related notes (collectively, the consolidated financial statements), and our report dated May 13, 2021 expressed an unqualified opinion on those consolidated financial statements.from 2001 to 2022.
A material weakness is a deficiency, or a combination of deficiencies, in internal control over financial reporting, such that there is a reasonable possibility that a material misstatement of the company’s annual or interim financial statements will not be prevented or detected on a timely basis. The following material weakness has been identified and included in management’s assessment:Albany, New York
March 1, 2022
The Company did not maintain a sufficient complement of trained, knowledgeable resources to execute their responsibilities with respect to internal control over financial reporting for certain financial statement accounts and disclosures. As a consequence, the Company did not conduct an effective risk assessment process that was responsive to changes in the Company's operating environment and did not design and implement effective process-level controls activities in the following areas:
— | presentation of operating expenses |
— | accounting for lease-related transactions |
— | identification and evaluation of impairment, accrual for loss contracts, certain expense accruals, and deemed dividends; and |
— | timely identification of adjustments to physical inventory in interim periods |
The material weakness was considered in determining the nature, timing, and extent of audit tests applied in our audit of the 2020 consolidated financial statements, and this report does not affect our report on those consolidated financial statements.
The Company acquired Giner ELX, Inc. and United Hydrogen Group Inc. (the Acquired Companies) during 2020, and management excluded from its assessment of the effectiveness of the Company’s internal control over financial reporting as of December 31, 2020, the Acquired Companies’ internal control over financial reporting associated with total assets of $58.0 million, excluding goodwill and intangible assets of $94.9 million, and total revenues of $7.8 million included in the consolidated financial statements of the Company as of and for the year ended December 31, 2020. Our audit of internal control over financial reporting of the Company also excluded an evaluation of the internal control over financial reporting of the Acquired Companies.
Basis for Opinion
The Company’s management is responsible for maintaining effective internal control over financial reporting and for its assessment of the effectiveness of internal control over financial reporting, included in the accompanying Management’s Annual Report on Internal Control over Financial Reporting. Our responsibility
is to express an opinion on the Company’s internal control over financial reporting based on our audit. We are a public accounting firm registered with the PCAOB and are required to be independent with respect to the Company in accordance with the U.S. federal securities laws and the applicable rules and regulations of the Securities and Exchange Commission and the PCAOB.
We conducted our audit in accordance with the standards of the PCAOB. Those standards require that we plan and perform the audit to obtain reasonable assurance about whether effective internal control over financial reporting was maintained in all material respects. Our audit of internal control over financial reporting included obtaining an understanding of internal control over financial reporting, assessing the risk that a material weakness exists, and testing and evaluating the design and operating effectiveness of internal control based on the assessed risk. Our audit also included performing such other procedures as we considered necessary in the circumstances. We believe that our audit provides a reasonable basis for our opinion.
Definition and Limitations of Internal Control Over Financial Reporting
A company’s internal control over financial reporting is a process designed to provide reasonable assurance regarding the reliability of financial reporting and the preparation of financial statements for external purposes in accordance with generally accepted accounting principles. A company’s internal control over financial reporting includes those policies and procedures that (1) pertain to the maintenance of records that, in reasonable detail, accurately and fairly reflect the transactions and dispositions of the assets of the company; (2) provide reasonable assurance that transactions are recorded as necessary to permit preparation of financial statements in accordance with generally accepted accounting principles, and that receipts and expenditures of the company are being made only in accordance with authorizations of management and directors of the company; and (3) provide reasonable assurance regarding prevention or timely detection of unauthorized acquisition, use, or disposition of the company’s assets that could have a material effect on the financial statements.
Because of its inherent limitations, internal control over financial reporting may not prevent or detect misstatements. Also, projections of any evaluation of effectiveness to future periods are subject to the risk that controls may become inadequate because of changes in conditions, or that the degree of compliance with the policies or procedures may deteriorate.
Albany, NY
May 13, 2021
PLUG POWER INC. AND SUBSIDIARIES CONSOLIDATED BALANCE SHEETS As of December 31, 20202022 and 20192021 (In thousands, except share and per share amounts) | | | | | | | | | | | | | | | 2020 | | 2019 (as restated) | | 2022 | | 2021 | Assets | | | | | | | | | | | | | Current assets: | | | | | | | | | | | | | Cash and cash equivalents | | $ | 1,312,404 | | $ | 139,496 | | $ | 690,630 | | $ | 2,481,269 | Restricted cash | | | 64,041 | | | 54,813 | | | 158,958 | | | 118,633 | Available-for-sale securities, at fair value
(amortized cost $1,355,614 and allowance for credit losses of $0 at December 31, 2022 and amortized cost $1,242,933 and allowance for credit losses of $0 at December 31, 2021) | | | | 1,332,943 | | | 1,240,265 | Equity securities | | | | 134,836 | | | 147,995 | Accounts receivable | | | 43,041 | | | 25,768 | | | 129,450 | | | 92,675 | Inventory | | | 139,386 | | | 72,391 | | | 645,636 | | | 269,163 | Contract assets | | | | 62,456 | | | 38,637 | Prepaid expenses and other current assets | | | 44,324 | | | 21,192 | | | 150,389 | | | 59,888 | Total current assets | | | 1,603,196 | | | 313,660 | | | 3,305,298 | | | 4,448,525 | | | | | | | | | | | | | | Restricted cash | | | 257,839 | | | 175,191 | | | 699,756 | | | 532,292 | Property, plant, and equipment, net | | | 74,549 | | | 14,959 | | Property, plant and equipment, net | | | | 719,793 | | | 255,623 | Right of use assets related to finance leases, net | | | 5,724 | | | 1,714 | | | 53,742 | | | 32,494 | Right of use assets related to operating leases, net | | | 117,016 | | | 63,266 | | | 360,287 | | | 212,537 | Equipment related to power purchase agreements and fuel delivered to customers, net | | | 75,807 | | | 67,769 | | | 89,293 | | | 72,902 | Contract assets | | | | 41,831 | | | 120 | Goodwill | | | 72,387 | | | 8,842 | | | 248,607 | | | 220,436 | Intangible assets, net | | | 39,251 | | | 5,539 | | | 207,725 | | | 158,208 | Investments in non-consolidated entities and non-marketable equity securities | | | | 31,250 | | | 12,892 | Other assets | | | 5,513 | | | 8,573 | | | 6,694 | | | 4,047 | Total assets | | $ | 2,251,282 | | $ | 659,513 | | $ | 5,764,276 | | $ | 5,950,076 | | | | | | | | | | | | | | Liabilities, Redeemable Preferred Stock, and Stockholders’ Equity | | | | | | | | Liabilities and Stockholders’ Equity | | | | | | | | Current liabilities: | | | | | | | | | | | | | Accounts payable | | $ | 50,198 | | $ | 40,376 | | $ | 191,895 | | $ | 92,307 | Accrued expenses | | | 46,083 | | | 14,409 | | | 156,430 | | | 79,237 | Deferred revenue | | | 23,275 | | | 11,691 | | Deferred revenue and other contract liabilities | | | | 131,813 | | | 116,377 | Operating lease liabilities | | | 14,314 | | | 9,428 | | | 48,861 | | | 30,822 | Finance lease liabilities | | | 903 | | | 226 | | | 8,149 | | | 4,718 | Finance obligations | | | 32,717 | | | 24,667 | | | 58,925 | | | 42,040 | Current portion of long-term debt | | | 25,389 | | | 26,461 | | | 5,142 | | | 15,252 | Other current liabilities | | | 29,487 | | | 6,704 | | Contingent consideration, loss accrual for service contracts, and other current liabilities | | | | 34,060 | | | 39,800 | Total current liabilities | | | 222,366 | | | 133,962 | | | 635,275 | | | 420,553 | Deferred revenue | | | 32,944 | | | 23,170 | | | | | | | | | | Deferred revenue and other contract liabilities | | | | 98,085 | | | 66,713 | Operating lease liabilities | | | 99,624 | | | 50,937 | | | 271,504 | | | 175,635 | Finance lease liabilities | | | 4,493 | | | 2,011 | | | 37,988 | | | 24,611 | Finance obligations | | | 148,836 | | | 119,422 | | | 270,315 | | | 211,644 | Convertible senior notes, net | | | 85,640 | | | 110,431 | | | 193,919 | | | 192,633 | Long-term debt | | | 150,013 | | | 85,708 | | | 3,925 | | | 112,794 | Other liabilities | | | 40,447 | | | 2,818 | | Contingent consideration, loss accrual for service contracts, and other liabilities | | | | 193,051 | | | 139,797 | Total liabilities | | | 784,363 | | | 528,459 | | | 1,704,062 | | | 1,344,380 | | | | | | | | | | | | | | Redeemable preferred stock: | | | | | | | | Series C redeemable convertible preferred stock, $0.01 par value per share (aggregate involuntary liquidation preference $16,664); 10,431 shares authorized; Issued and outstanding: 0 at December 31, 2020 and 2,620 at December 31, 2019 | | | — | | | 709 | | Series E convertible preferred stock, $0.01 par value per share; Shares authorized: 35,000 at both December 31, 2020 and December 31, 2019; Issued and outstanding: 0 at December 31, 2020 and 500 at December 31, 2019 | | | — | | | 441 | | Stockholders’ equity: | | | | | | | | | | | | | Common stock, $0.01 par value per share; 750,000,000 shares authorized; Issued: 473,977,469 at December 31, 2020 and 318,637,560 at December 31, 2019 | | | 4,740 | | | 3,186 | | Common stock, $0.01 par value per share; 1,500,000,000 shares authorized; Issued (including shares in treasury): 608,421,785 at December 31, 2022 and 594,729,610 at December 31, 2021 | | | | 6,084 | | | 5,947 | Additional paid-in capital | | | 3,446,650 | | | 1,506,953 | | | 7,297,306 | | | 7,070,710 | Accumulated other comprehensive income | | | 2,451 | | | 1,288 | | Accumulated other comprehensive loss | | | | (26,004) | | | (1,532) | Accumulated deficit | | | (1,946,488) | | | (1,350,307) | | | (3,120,911) | | | (2,396,903) | Less common stock in treasury: 15,926,068 at December 31, 2020 and 15,259,045 at December 31, 2019 | | | (40,434) | | | (31,216) | | Less common stock in treasury: 18,076,127 at December 31, 2022 and 17,074,710 at December 31, 2021 | | | | (96,261) | | | (72,526) | Total stockholders’ equity | | | 1,466,919 | | | 129,904 | | | 4,060,214 | | | 4,605,696 | Total liabilities, redeemable preferred stock, and stockholders’ equity | | $ | 2,251,282 | | $ | 659,513 | | Total liabilities and stockholders’ equity | | | $ | 5,764,276 | | $ | 5,950,076 |
See notes to consolidated financial statements. PLUG POWER INC. AND SUBSIDIARIES CONSOLIDATED STATEMENTS OF OPERATIONS For the years ended December 31, 2020, 20192022, 2021 and 20182020 (In thousands, except share and per share amounts) | | | | | | | | | | | | | | | | 2019 | | 2018 | | | | | | | | | | | | 2020 | | (as restated) | | (as restated) | | 2022 | | 2021 | | 2020 | Net revenue: | | | | | | | | | | | | | | | | | | | Sales of fuel cell systems and related infrastructure | | $ | (94,295) | | $ | 149,920 | | $ | 107,175 | | Sales of fuel cell systems, related infrastructure and equipment | | | $ | 558,932 | | $ | 392,777 | | $ | (94,295) | Services performed on fuel cell systems and related infrastructure | | | (9,801) | | | 25,217 | | | 22,002 | | | 35,280 | | | 26,706 | | | (9,801) | Power Purchase Agreements | | | 26,620 | | | 25,553 | | | 22,569 | | Fuel delivered to customers | | | (16,072) | | | 29,099 | | | 22,469 | | Power purchase agreements | | | | 47,183 | | | 35,153 | | | 26,620 | Fuel delivered to customers and related equipment | | | | 57,196 | | | 46,917 | | | (16,072) | Other | | | 311 | | | 186 | | | — | | | 2,849 | | | 789 | | | 311 | Net revenue | | | (93,237) | | | 229,975 | | | 174,215 | | | 701,440 | | | 502,342 | | | (93,237) | Cost of revenue: | | | | | | | | | | | | | | | | | | | Sales of fuel cell systems and related infrastructure | | | 171,404 | | | 97,915 | | | 85,205 | | Sales of fuel cell systems, related infrastructure and equipment | | | | 468,057 | | | 307,157 | | | 171,404 | Services performed on fuel cell systems and related infrastructure | | | 42,524 | | | 34,582 | | | 32,271 | | | 59,365 | | | 63,729 | | | 42,524 | Provision (benefit) for loss contracts related to service | | | 35,473 | | | (394) | | | 5,345 | | Power Purchase Agreements | | | 64,640 | | | 41,777 | | | 41,361 | | Fuel delivered to customers | | | 61,815 | | | 45,247 | | | 36,037 | | Provision for loss contracts related to service | | | | 26,801 | | | 71,988 | | | 35,473 | Power purchase agreements | | | | 144,696 | | | 102,417 | | | 64,640 | Fuel delivered to customers and related equipment | | | | 194,255 | | | 127,196 | | | 61,815 | Other | | | 323 | | | 200 | | | — | | | 2,622 | | | 1,165 | | | 323 | Total cost of revenue | | | 376,179 | | | 219,327 | | | 200,219 | | | 895,796 | | | 673,652 | | | 376,179 | | | | | | | | | | | | | | | | | | | | Gross (loss) profit | | | (469,416) | | | 10,648 | | | (26,004) | | Gross loss | | | | (194,356) | | | (171,310) | | | (469,416) | | | | | | | | | | | | | | | | | | | | Operating expenses: | | | | | | | | | | | | | | | | | | | Research and development | | | 27,848 | | | 15,059 | | | 12,750 | | | 99,579 | | | 64,762 | | | 27,848 | Selling, general and administrative | | | 79,348 | | | 43,202 | | | 37,685 | | | 363,929 | | | 179,852 | | | 79,348 | Impairment of long-lived assets | | | 6,430 | | | — | | | — | | | 5,218 | | | 10,224 | | | 6,430 | Change in fair value of contingent consideration | | | 1,160 | | | — | | | — | | | 16,468 | | | 11,176 | | | 1,160 | Total operating expenses | | | 114,786 | | | 58,261 | | | 50,435 | | | 485,194 | | | 266,014 | | | 114,786 | | | | | | | | | | | | | | | | | | | | Operating loss | | | (584,202) | | | (47,613) | | | (76,439) | | | (679,550) | | | (437,324) | | | (584,202) | | | | | | | | | | | | | | | | | | | | Interest and other expense, net | | | (60,484) | | | (35,691) | | | (22,750) | | Gain (loss) on extinguishment of debt | | | 17,686 | | | (518) | | | — | | Change in fair value of common stock warrant liability | | | — | | | 79 | | | 4,286 | | Interest income | | | | 37,259 | | | 4,040 | | | 765 | Interest expense | | | | (39,037) | | | (43,225) | | | (60,510) | Other expense, net | | | | (2,303) | | | (765) | | | (739) | Realized loss on investments, net | | | | (1,395) | | | (81) | | | — | Change in fair value of equity securities | | | | (18,159) | | | 6,738 | | | — | Gain/(loss) on extinguishment of debt | | | | (986) | | | — | | | 17,686 | Loss on equity method investments | | | | (20,166) | | | (5,704) | | | — | Other gain | | | | 1,168 | | | 159 | | | — | | | | | | | | | | | | | | | | | | | | Loss before income taxes | | $ | (627,000) | | $ | (83,743) | | $ | (94,903) | | $ | (723,169) | | $ | (476,162) | | $ | (627,000) | | | | | | | | | | | | | | | | | | | | Income tax benefit | | | 30,845 | | | — | | | 9,295 | | Income tax expense/(benefit) | | | | 839 | | | (16,197) | | | (30,845) | | | | | | | | | | | | | | | | | | | | Net loss attributable to the Company | | $ | (596,155) | | $ | (83,743) | | $ | (85,608) | | $ | (724,008) | | $ | (459,965) | | $ | (596,155) | | | | | | | | | | | | | | | | | | | | Preferred stock dividends declared, deemed dividends and accretion of discount | | | (26) | | | (1,812) | | | (52) | | Preferred stock dividends declared | | | | — | | | — | | | (26) | | | | | | | | | | | | Net loss attributable to common stockholders | | $ | (596,181) | | $ | (85,555) | | $ | (85,660) | | | (724,008) | | | (459,965) | | | (596,181) | | | | | | | | | | | | | | | | | | | | Net loss per share: | | | | | | | | | | | | | | | | | | | Basic and diluted | | $ | (1.68) | | $ | (0.36) | | $ | (0.39) | | $ | (1.25) | | $ | (0.82) | | $ | (1.68) | | | | | | | | | | | | | | | | | | | | Weighted average number of common stock outstanding | | | 354,790,106 | | | 237,152,780 | | | 218,882,337 | | | 579,716,708 | | | 558,182,177 | | | 354,790,106 |
See notes to consolidated financial statements. PLUG POWER INC. AND SUBSIDIARIES CONSOLIDATED STATEMENTS OF COMPREHENSIVE LOSS For the years ended December 31, 2020, 20192022, 2021 and 20182020 (In thousands) | | | | | | | | | | | | | | | 2019 | | 2018 | | | 2020 | | (as restated) | | (as restated) | Net loss attributable to the Company | | $ | (596,155) | | $ | (83,743) | | $ | (85,608) | Other comprehensive gain (loss) - foreign currency translation adjustment | | | 1,163 | | | (296) | | | (610) | Comprehensive loss attributable to the Company | | $ | (594,992) | | $ | (84,039) | | $ | (86,218) | | | | | | | | | | | Preferred stock dividends declared, deemed dividends and accretion of discount | | | (26) | | | (1,812) | | | (52) | Comprehensive loss attributable to common stockholders | | $ | (595,018) | | $ | (85,851) | | $ | (86,270) |
| | | | | | | | | | | | 2022 | | 2021 | | 2020 | | | | | | | | | | | Net loss attributable to the Company | | $ | (724,008) | | $ | (459,965) | | $ | (596,155) | Other comprehensive (loss)/gain: | | | | | | | | | | Foreign currency translation (loss)/gain | | | (4,468) | | | (1,315) | | | 1,163 | Change in net unrealized loss on available-for-sale securities | | | (20,004) | | | (2,668) | | | — | Comprehensive loss attributable to the Company, net of tax | | $ | (748,480) | | $ | (463,948) | | $ | (594,992) | | | | | | | | | | | Preferred stock dividends declared | | | — | | | — | | | (26) | Comprehensive loss attributable to common stockholders | | $ | (748,480) | | $ | (463,948) | | $ | (595,018) |
See notes to consolidated financial statements. PLUG POWER INC. AND SUBSIDIARIES CONSOLIDATED STATEMENTS OF STOCKHOLDERS’ EQUITY (DEFICIT) For the years ended December 31, 2020, 20192022, 2021 and 20182020 (In thousands, except share amounts) | | | | | | | | | | | | | | | | | | | | | | | | | | | | | | | | | | | | | | | | | | | | | | | | | Accumulated | | | | | | | | | | | | | | | | | | Accumulated | | | | | | | | | | | | | | | | | Additional | | Other | | | | | | | | Total | | | | | | | Additional | | Other | | | | | | | | | | Total | | | Common Stock | | Paid-in | | Comprehensive | | Treasury Stock | | Accumulated | | Stockholders’ | | Common Stock | | Paid-in | | Comprehensive | | Treasury Stock | | Accumulated | | Stockholders’ | | | Shares | | Amount | | Capital | | Income | | Shares | | Amount | | Deficit | | Equity (Deficit) | | Shares | | Amount | | Capital | | Income (Loss) | | Shares | | Amount | | Deficit | | Equity | December 31, 2017, as restated | | 229,073,517 | | $ | 2,291 | | $ | 1,250,899 | | $ | 2,194 | | 587,151 | | $ | (3,102) | | $ | (1,182,053) | | $ | 70,229 | | Cumulative effect from the adoption of ASC 842, as restated | | | | | | | | | | | | | | | 1,200 | | | 1,200 | | Net loss attributable to the Company, as restated | | — | | | — | | | — | | | — | | — | | | — | | | (85,608) | | | (85,608) | | Other comprehensive loss | | — | | | — | | | — | | | (610) | | — | | | — | | | — | | | (610) | | Stock-based compensation | | 741,216 | | | 8 | | | 8,763 | | | — | | — | | | — | | | — | | | 8,771 | | Stock dividend | | 29,762 | | | — | | | 52 | | | — | | — | | | — | | | (52) | | | — | | Public offerings, common stock, net | | 3,804,654 | | | 38 | | | 6,978 | | | — | | — | | | — | | | — | | | 7,016 | | Stock option exercises | | 511,412 | | | 5 | | | 168 | | | — | | 17,606 | | | (35) | | | — | | | 138 | | Equity component of convertible senior notes, net of issuance costs and income tax benefit, as restated | | — | | | — | | | 28,586 | | | — | | — | | | — | | | — | | | 28,586 | | Purchase of capped call | | — | | | — | | | (16,000) | | | — | | — | | | — | | | — | | | (16,000) | | Purchase of common stock forward | | — | | | — | | | — | | | — | | 14,397,906 | | | (27,500) | | | — | | | (27,500) | | Exercise of warrants | | 100 | | | — | | | — | | | — | | — | | | — | | | — | | | — | | Provision for common stock warrants | | — | | | — | | | 10,190 | | | — | | — | | | — | | | — | | | 10,190 | | December 31, 2018, as restated | | 234,160,661 | | $ | 2,342 | | $ | 1,289,636 | | $ | 1,584 | | 15,002,663 | | $ | (30,637) | | $ | (1,266,513) | | $ | (3,588) | | Net loss attributable to the Company, as restated | | — | | | — | | | — | | | — | | — | | | — | | | (83,743) | | | (83,743) | | Other comprehensive loss, as restated | | — | | | — | | | — | | | (296) | | — | | | — | | | — | | | (296) | | Stock-based compensation | | 1,876,503 | | | 19 | | | 10,871 | | | — | | — | | | — | | | — | | | 10,890 | | Stock dividend | | 19,286 | | | — | | | 52 | | | — | | — | | | — | | | (52) | | | — | | Public offerings, common stock, net, as restated | | 62,333,585 | | | 622 | | | 157,722 | | | — | | — | | | — | | | — | | | 158,344 | | Stock option exercises | | 1,151,307 | | | 12 | | | 1,784 | | | — | | 256,382 | | | (579) | | | — | | | 1,217 | | Exercise of warrants | | 5,250,750 | | | 53 | | | 14,099 | | | — | | — | | | — | | | — | | | 14,152 | | Provision for common stock warrants | | — | | | — | | | 6,513 | | | — | | — | | | — | | | — | | | 6,513 | | Accretion of discount, preferred stock | | — | | | — | | | (1,978) | | | — | | — | | | — | | | — | | | (1,978) | | Conversion of preferred stock | | 13,845,468 | | | 138 | | | 28,254 | | | — | | — | | | — | | | — | | | 28,392 | | December 31, 2019, as restated | | 318,637,560 | | $ | 3,186 | | $ | 1,506,953 | | $ | 1,288 | | 15,259,045 | | $ | (31,216) | | $ | (1,350,307) | | $ | 129,904 | | December 31, 2019 | | | 318,637,560 | | $ | 3,186 | | $ | 1,506,953 | | $ | 1,288 | | 15,259,045 | | $ | (31,216) | | $ | (1,350,307) | | $ | 129,904 | Net loss attributable to the Company | | — | | | — | | | — | | | — | | — | | | — | | | (596,155) | | | (596,155) | | — | | | — | | | — | | | — | | — | | | — | | | (596,155) | | | (596,155) | Other comprehensive gain | | — | | | — | | | | | | 1,163 | | — | | | — | | | — | | | 1,163 | | — | | | — | | | | | | 1,163 | | — | | | — | | | — | | | 1,163 | Stock-based compensation | | 439,649 | | | 4 | | | 17,131 | | | — | | — | | | — | | | — | | | 17,135 | | 439,649 | | | 4 | | | 17,131 | | | — | | — | | | — | | | — | | | 17,135 | Stock dividend | | 5,156 | | | — | | | 26 | | | — | | — | | | — | | | (26) | | | — | | 5,156 | | | — | | | 26 | | | — | | — | | | — | | | (26) | | | — | Public offerings, common stock, net | | 78,976,250 | | | 790 | | | 1,270,872 | | | — | | — | | | — | | | — | | | 1,271,662 | | 78,976,250 | | | 790 | | | 1,270,872 | | | — | | — | | | — | | | — | | | 1,271,662 | Stock option exercises | | 18,056,200 | | | 181 | | | 41,060 | | | — | | 667,023 | | | (9,218) | | | — | | | 32,023 | | 18,056,200 | | | 181 | | | 41,060 | | | — | | 667,023 | | | (9,218) | | | — | | | 32,023 | Equity component of 3.75% Convertible Senior Notes issued, net of issuance costs and income tax expense | | — | | | — | | | 100,761 | | | — | | — | | | — | | | — | | | 100,761 | | — | | | — | | | 100,761 | | | — | | — | | | — | | | — | | | 100,761 | Purchase of capped calls | | — | | | — | | | (16,253) | | | — | | — | | | — | | | — | | | (16,253) | | — | | | — | | | (16,253) | | | — | | — | | | — | | | — | | | (16,253) | Termination of capped calls | | — | | | — | | | 24,158 | | | — | | — | | | — | | | — | | | 24,158 | | — | | | — | | | 24,158 | | | — | | — | | | — | | | — | | | 24,158 | Exercise of warrants | | 5,180,457 | | | 52 | | | (52) | | | — | | — | | | — | | | — | | | — | | 5,180,457 | | | 52 | | | (52) | | | — | | — | | | — | | | — | | | — | Provision for common stock warrants | | — | | | — | | | 439,915 | | | — | | — | | | — | | | — | | | 439,915 | | — | | | — | | | 439,915 | | | — | | — | | | — | | | — | | | 439,915 | Accretion of discount, preferred stock | | — | | | — | | | (29) | | | — | | — | | | — | | | — | | | (29) | | — | | | — | | | (29) | | | — | | — | | | — | | | — | | | (29) | Conversion of preferred stock | | 2,998,526 | | | 30 | | | 1,149 | | | — | | — | | | — | | | — | | | 1,179 | | 2,998,526 | | | 30 | | | 1,149 | | | — | | — | | | — | | | — | | | 1,179 | Conversion of 5.5% and 7.5% Convertible Senior Notes | | 30,615,615 | | | 306 | | | 62,247 | | | — | | — | | | — | | | — | | | 62,553 | | 30,615,615 | | | 306 | | | 62,247 | | | — | | — | | | — | | | — | | | 62,553 | Repurchase of 5.5% Convertible Senior Notes, net of income tax benefit | | 9,409,591 | | | 94 | | | (50,864) | | | — | | — | | | — | | | — | | | (50,770) | | 9,409,591 | | | 94 | | | (50,864) | | | — | | — | | | — | | | — | | | (50,770) | Shares issued for acquisitions | | 9,658,465 | | | 97 | | | 49,576 | | | — | | — | | | — | | | — | | | 49,673 | | Common stock issued for acquisitions | | | 9,658,465 | | | 97 | | | 49,576 | | | — | | — | | | — | | | — | | | 49,673 | December 31, 2020 | | 473,977,469 | | $ | 4,740 | | $ | 3,446,650 | | $ | 2,451 | | 15,926,068 | | $ | (40,434) | | $ | (1,946,488) | | $ | 1,466,919 | | 473,977,469 | | $ | 4,740 | | $ | 3,446,650 | | $ | 2,451 | | 15,926,068 | | $ | (40,434) | | $ | (1,946,488) | | $ | 1,466,919 | Net loss attributable to the Company | | | — | | | — | | | — | | | — | | — | | | — | | | (459,965) | | | (459,965) | Cumulative impact of Accounting Standards Update 2020-06 adoption | | | — | | | — | | | (130,185) | | | — | | — | | | — | | | 9,550 | | | (120,635) | Other comprehensive loss | | | — | | | — | | | | | | (3,983) | | — | | | — | | | — | | | (3,983) | Stock-based compensation | | | 100,662 | | | 1 | | | 76,469 | | | — | | — | | | — | | | — | | | 76,470 | Public offerings, common stock, net | | | 32,200,000 | | | 322 | | | 2,022,897 | | | — | | — | | | — | | | — | | | 2,023,219 | Private offerings, common stock, net | | | 54,966,188 | | | 549 | | | 1,564,065 | | | — | | — | | | — | | | — | | | 1,564,614 | Stock option exercises | | | 5,097,667 | | | 51 | | | 7,469 | | | — | | — | | | — | | | — | | | 7,520 | Stock exchanged for tax withholding | | | — | | | — | | | — | | | — | | 1,148,642 | | | (32,092) | | | — | | | (32,092) | Exercise of warrants | | | 24,210,984 | | | 242 | | | 15,203 | | | — | | — | | | — | | | — | | | 15,445 | Provision for common stock warrants | | | — | | | — | | | 6,142 | | | — | | — | | | — | | | — | | | 6,142 | Conversion of 5.5% Convertible Senior Notes | | | 69,808 | | | 1 | | | 159 | | | — | | — | | | — | | | — | | | 160 | Conversion of 3.75% Convertible Senior Notes | | | 3,016,036 | | | 30 | | | 15,155 | | | — | | — | | | — | | | — | | | 15,185 | Common stock issued for acquisitions | | | 1,090,796 | | | 11 | | | 46,686 | | | — | | — | | | — | | | — | | | 46,697 | December 31, 2021 | | | 594,729,610 | | $ | 5,947 | | $ | 7,070,710 | | $ | (1,532) | | 17,074,710 | | $ | (72,526) | | $ | (2,396,903) | | $ | 4,605,696 | Net loss attributable to the Company | | | — | | | — | | | — | | | — | | — | | | — | | | (724,008) | | | (724,008) | Other comprehensive loss | | | — | | | — | | | — | | | (24,472) | | — | | | — | | | — | | | (24,472) | Stock exchanged for tax withholding | | | — | | | — | | | — | | | — | | 1,001,417 | | | (23,735) | | | — | | | (23,735) | Stock-based compensation | | | 584,545 | | | 6 | | | 179,621 | | | — | | — | | | — | | | — | | | 179,627 | Issuance of common stock under restricted stock award | | | 5,148,459 | | | 51 | | | (51) | | | ��� | | — | | | — | | | — | | | — | Stock option exercises | | | 757,424 | | | 8 | | | 2,293 | | | — | | — | | | — | | | — | | | 2,301 | Exercise of warrants | | | 6,793,479 | | | 68 | | | (68) | | | — | | — | | | — | | | — | | | — | Common stock issued for acquisitions | | | 408,268 | | | 4 | | | 6,103 | | | — | | — | | | — | | | — | | | 6,107 | Provision for common stock warrants | | | — | | | — | | | 38,698 | | | — | | — | | | — | | | — | | | 38,698 | December 31, 2022 | | | 608,421,785 | | $ | 6,084 | | $ | 7,297,306 | | $ | (26,004) | | 18,076,127 | | $ | (96,261) | | $ | (3,120,911) | | $ | 4,060,214 |
See notes to consolidated financial statements. PLUG POWER INC. AND SUBSIDIARIES CONSOLIDATED STATEMENTS OF CASH FLOWS For the years ended December 31, 2020, 20192022, 2021 and 20182020 (In thousands) | | | | | | | | | | | | 2020 | | 2019 | | 2018 | | | | | | (as restated) | | (as restated) | Operating Activities | | | | | | | | | | Net loss attributable to the Company | | $ | (596,155) | | $ | (83,743) | | $ | (85,608) | Adjustments to reconcile net loss to net cash used in operating activities: | | | | | | | | | | Depreciation of long-lived assets | | | 14,434 | | | 11,938 | | | 11,832 | Amortization of intangible assets | | | 1,135 | | | 698 | | | 693 | Stock-based compensation | | | 17,135 | | | 10,890 | | | 8,771 | (Gain) loss on extinguishment of debt | | | (17,686) | | | 518 | | | — | Provision for bad debts and other assets | | | 700 | | | 1,981 | | | 1,626 | Amortization of debt issuance costs and discount on convertible senior notes | | | 17,061 | | | 9,006 | | | 6,347 | Provision for common stock warrants | | | 425,047 | | | 6,513 | | | 10,190 | Loss on disposal of leased assets | | | — | | | 212 | | | — | Fair value adjustment to contingent consideration | | | (1,160) | | | — | | | — | Impairment of long-lived assets | | | 6,430 | | | — | | | — | Change in fair value of common stock warrant liability | | | — | | | (79) | | | (4,286) | Deferred income tax benefit | | | (30,845) | | | — | | | (9,295) | Loss (benefit) on service contracts | | | 33,125 | | | (1,643) | | | 5,345 | Changes in operating assets and liabilities that provide (use) cash: | | | | | | | | | | Accounts receivable | | | (15,701) | | | 10,594 | | | (14,666) | Inventory | | | (63,389) | | | (24,633) | | | 19,193 | Prepaid expenses and other assets | | | (18,401) | | | (8,110) | | | (4,654) | Accounts payable, accrued expenses, and other liabilities | | | 51,880 | | | 17,234 | | | (10,160) | Deferred revenue | | | 20,914 | | | (4,700) | | | 6,322 | Net cash used in operating activities | | | (155,476) | | | (53,324) | | | (58,350) | Investing activities | | | | | | | | | | Purchases of property, plant and equipment | | | (22,526) | | | (5,683) | | | (5,142) | Purchase of intangible assets | | | (1,957) | | | (2,404) | | | (929) | Purchases of equipment related to PPA and equipment related to fuel delivered to customers | | | (25,738) | | | (6,532) | | | (13,501) | Net cash paid for acquisitions | | | (45,113) | | | — | | | — | Proceeds from sale of leased assets | | | — | | | 375 | | | — | Net cash used in investing activities | | | (95,334) | | | (14,244) | | | (19,572) | Financing activities | | | | | | | | | | Proceeds from issuance of preferred stock and warrants, net of transaction costs | | | — | | | 14,089 | | | 30,934 | Proceeds from public offerings, net of transaction costs | | | 1,271,714 | | | 158,343 | | | 7,195 | Proceeds from exercise of stock options | | | 32,023 | | | 1,217 | | | 138 | Payments for redemption of preferred stock | | | — | | | (4,040) | | | — | Proceeds from issuance of convertible senior notes, net | | | 205,098 | | | 39,052 | | | 95,856 | Repurchase of convertible senior notes | | | (90,238) | | | — | | | — | Purchase of capped calls and common stock forward | | | (16,253) | | | — | | | (43,500) | Proceeds from borrowing of long-term debt, net of transaction costs | | | — | | | 119,186 | | | — | Proceeds from termination of capped calls | | | 24,158 | | | — | | | — | Principal payments on long-term debt | | | (48,020) | | | (25,345) | | | (16,190) | Proceeds from finance obligations | | | 65,259 | | | 83,668 | | | 76,175 | Proceeds from long-term debt, net | | | 99,000 | | | — | | | — | Repayments of finance obligations | | | (27,212) | | | (59,196) | | | (30,531) | Net cash provided by financing activities | | | 1,515,529 | | | 326,974 | | | 120,077 | Effect of exchange rate changes on cash | | | 65 | | | (59) | | | (57) | Increase in cash, cash equivalents and restricted cash | | | 1,264,784 | | | 259,347 | | | 42,098 | Cash, cash equivalents, and restricted cash beginning of period | | | 369,500 | | | 110,153 | | | 68,055 | Cash, cash equivalents, and restricted cash end of period | | $ | 1,634,284 | | $ | 369,500 | | $ | 110,153 | | | | | | | | | | | Supplemental disclosure of cash flow information | | | | | | | | | | Cash paid for interest | | $ | 28,942 | | $ | 19,180 | | $ | 13,057 | | | | | | | | | | | Summary of non-cash investing and financing activity | | | | | | | | | | Recognition of right of use assets | | $ | 55,651 | | | 52,924 | | $ | 41,679 | Net tangible assets acquired in a business combination | | | 8,751 | | | — | | | — | Intangible assets acquired in a business combination | | | 32,268 | | | — | | | — | Conversion of convertible notes to common stock | | | 62,553 | | | — | | | — | Net transfers between inventory and long-lived assets | | | — | | | — | | | 18,175 | Conversion of preferred stock to common stock | | | 1,179 | | | 28,392 | | | — |
See notes to consolidated financial statements.
1. Nature of Operations
Description of Business
Plug Power is facilitating the paradigm shift to an increasingly electrified world by innovating cutting-edge hydrogen and fuel cell solutions. In our core business, we provide and continue to develop commercially-viable hydrogen and fuel cell product solutions to replace lead-acid batteries in electric material handling vehicles and industrial trucks for some of the world’s largest retail-distribution and manufacturing businesses. We are focusing our efforts on industrial mobility applications, including electric forklifts and electric industrial vehicles, at multi-shift high volume manufacturing and high throughput distribution sites where we believe our products and services provide a unique combination of productivity, flexibility, and environmental benefits. Additionally, we manufacture and sell fuel cell products to replace batteries and diesel generators in stationary backup power applications. These products have proven valuable with telecommunications, transportation, and utility customers as robust, reliable, and sustainable power solutions.
Our current products and services include:
GenDrive: GenDrive is our hydrogen fueled PEM fuel cell system providing power to material handling electric vehicles, including class 1, 2, 3 and 6 electric forklifts, Automated Guided Vehicles (“AGVs”) and ground support equipment;
GenFuel: GenFuel is our liquid hydrogen fueling delivery, generation, storage, and dispensing system;
GenCare: GenCare is our ongoing ‘internet of things’-based maintenance and on-site service program for GenDrive fuel cell systems, GenSure fuel cell systems, GenFuel hydrogen storage and dispensing products and ProGen fuel cell engines;
GenSure: GenSure is our stationary fuel cell solution providing scalable, modular Proton Exchange Membrane (PEM) fuel cell power to support the backup and grid-support power requirements of the telecommunications, transportation, and utility sectors; GenSure High Power Fuel Cell Platform will support large scale stationary power and data center markets.
GenKey: GenKey is our vertically integrated “turn-key” solution combining either GenDrive or GenSure fuel cell power with GenFuel fuel and GenCare aftermarket service, offering complete simplicity to customers transitioning to fuel cell power;
ProGen: ProGen is our fuel cell stack and engine technology currently used globally in mobility and stationary fuel cell systems, and as engines in electric delivery vans. This includes the Plug Power MEA (membrane electrode assembly), a critical component of the fuel cell stack used in zero-emission fuel cell electric vehicle engines; and
GenFuel Electrolyzers: GenFuel electrolyzers are modular, scalable hydrogen generators optimized for clean hydrogen production. Electrolyzers generate hydrogen from water using electricity and a special membrane and “green” hydrogen is generated by using renewable energy inputs, such as solar or wind power.
We provide our products worldwide through our direct product sales force, and by leveraging relationships with original equipment manufacturers (“OEMs”) and their dealer networks. Plug Power is targeting Asia and Europe for expansion in adoption. Europe has rolled out ambitious targets for the hydrogen economy and Plug Power is executing on its strategy to become one of the European leaders. This includes a targeted account strategy for material handling as well as securing strategic partnerships with European original equipment manufacturers, or OEMs, energy companies, utility leaders and accelerating our electrolyzer business. We manufacture our commercially viable products in Latham, New York, Rochester, New York and Spokane, Washington and support liquid hydrogen generation and logistics in Charleston, Tennessee.
Liquidity
During 2020, the Company issued and sold 79.0 million shares in two separate, registered equity offerings, resulting in net proceeds of approximately $1.3 billion. See Note 16, “Stockholders’ Equity, as restated.” In May 2020, the Company issued $212.5 million in aggregate principal amount of 3.75% Convertible Senior Notes due June 1, 2025, in a private placement to qualified institutional buyers. See Note 15, “Convertible Senior Notes,” as amended.
As of December 31, 2020, the Company had $1.3 billion of cash and cash equivalents and $321.9 million of restricted cash. In January and February 2021, the Company issued and sold in another registered equity offering an aggregate of 32.2 million shares of its common stock at a purchase price of $65.00 per share for net proceeds of approximately $1.8 billion. Furthermore in February 2021, the Company completed the previously announced sale of its common stock in connection with a strategic partnership with SK Holdings Co., Ltd. (“SK Holdings”) to accelerate the use of hydrogen as an alternative energy source in Asian markets. The Company sold 54,996,188 shares of its common stock to a subsidiary of SK Holdings at a purchase price of $29.2893 per share, or an aggregate purchase price of approximately $1.6 billion. See Note 23, “Subsequent Events,” for more details.
The Company has continued to experience negative cash flows from operations and net losses. The Company incurred net losses attributable to common stockholders of $596.2 million, $85.6 million and $85.7 million for the years ended December 31, 2020, 2019, and 2018, respectively. The Company’s cash used in operations totaled $155.5 million, $53.3 million, and $58.4 million for the year ended December 31, 2020, 2019 and 2018, and has an accumulated deficit of $1.9 billion at December 31, 2020.
The Company’s significant obligations consisted of the following as of December 31, 2020:
| (i) | Operating and finance leases totaling $113.9 million and $5.4 million, respectively, of which $14.3 million and $903 thousand, respectively, are due within the next 12 months. These leases are primarily related to sale/leaseback agreements entered into with various financial institutions to facilitate the Company’s commercial transactions with key customers. |
| (ii) | Finance obligations totaling $181.6 million of which approximately $32.7 million is due within the next 12 months. Finance obligations consist primarily of debt associated with the sale of future revenues and failed sale/leaseback transactions. |
| (iii) | Long-term debt, primarily related to the Company’s loan and security agreement (Loan Agreement) with Generate Lending, LLC (Generate Capital) totaling $175.4 million of which $25.4 million is classified as short term on the consolidated balance sheets. See Note 14, “Long-Term Debt”, for more details. |
| (iv) | Convertible senior notes totaling $85.6 million at December 31, 2020. See Note 15, “Convertible Senior Notes, as restated” for more details. |
The Company believes that its current working capital of $1.4 billion at December 31, 2020, which includes unrestricted cash and cash equivalents of $1.3 billion, together with proceeds from the January 2021 registered equity offering and SK group investment, will provide sufficient liquidity to fund operations for a least one year after the date the financial statements are issued.
The Company plans to invest a portion of its available cash to expand its current production and manufacturing capacity and to fund strategic acquisitions and partnerships and capital projects. Future use of the Company’s funds is discretionary and the Company believes that its future working capital and cash position will be sufficient to fund operations even after these growth investments.
2. Restatement of Previously Issued Consolidated Financial Statements
Restatement Background
On March 12, 2021, management in concurrence with the Company’s Audit Committee of the Board of Directors (the “Audit Committee”), concluded that our 2019 and 2018 consolidated financial statements, included in our Annual Reports on Form 10-K as of and for the fiscal years ended December 31, 2019 and 2018, and our unaudited consolidated financial statements as of and for each of the first three quarterly periods in 2020 and all quarterly periods in 2019, included in our Quarterly Reports on Form 10-Q for the respective periods, (collectively the “Prior Period Financial Statements”) should no longer be relied upon due to misstatements that are described below, and that we would restate such financial statements to make the necessary accounting corrections. In addition, we have restated the statement of operations for the three months ended December 31, 2019, which was previously disclosed as a note in its form 10-K for the year ended December 31, 2019. Details of the restated consolidated financial statements as of and for the fiscal years ended December 31, 2019 and 2018 are provided below (“Restatement Items”). In addition, details of the restated interim financial information for each of the quarterly periods in fiscal 2019 and for the first three quarters of fiscal 2020, are presented in Note 3, “Unaudited Quarterly Financial data and Restatement of Previously Issued Unaudited Interim Condensed Consolidated Financial Statements”. The Company evaluated the materiality of these errors both qualitatively and quantitatively in accordance with Staff Accounting Bulletin (“SAB”) No. 99, Materiality and SAB No. 108, Considering the Effects of Prior Year Misstatements in Current Year Financial Statements, and determined the effect of these corrections were material to the Prior Period Financial Statements. As a result of the material misstatements, we have restated our Prior Period Financial Statements, in accordance with ASC 250, Accounting Changes and Error Corrections (the “Restated Financial Statements”).
The Restatements Items reflect adjustments to correct errors on the balance sheets to reduce the carrying amount of certain right of use assets and lease liabilities associated with leases, increase the loss accrual relating to service contracts, a reclassification of costs resulting in a decrease in Operating expenses - Research and development expense and a corresponding increase in Cost of revenue, the recording of a deemed dividend, and correction of a cumulative adjustment upon adoption of a new accounting standard to a correction of an error. The nature and impact of these adjustments are described below and also detailed in the tables below. Also see Note 3, “Unaudited Quarterly Financial Data and Restatement of Previously Issued Unaudited Interim Condensed Consolidated Financial Statements,” for the impact of these adjustments on each of the quarterly periods.
Restatement Items
Right of use assets relating to operating leases – The Company incorrectly calculated the lease liability and the related right of use asset associated with sale/leaseback transactions. The Company sells equipment to financial institutions and leases it back. The Company then uses these assets to fulfill its obligations under Power Purchase Agreements (“PPAs”). There are two elements to the transactions with financial institutions – a sale (and leaseback) of equipment and a debt component. The debt component of the proceeds received from the financial institution relates to the sale of future revenues to be generated from the related PPA. The lease liability and corresponding right of use asset should be based on the present value of the portion of the future payments to the third-party financial institution that represent the lease component (i.e. excluding the portion representing the debt service repayments). Historically, the Company incorrectly included the entire repayment amount when determining the lease liability and corresponding right of use asset. The Company separately recorded a debt obligation related to the cash received for the sale of future revenues. The result of the correction is that at inception of the lease, the lease liability and the corresponding right of use asset were reduced to exclude the double-counting of the debt portion of the obligation. The corrections at December 31, 2019 resulted in the reduction of both the lease liability and right of use asset of $112.7 million. Similar adjustments were made for the balance sheets for the quarterly periods of 2019 and 2020. The lease liability for operating leases and related right of use asset are both presented separately on the consolidated balance sheets. The overall impact on the consolidated statements of operations was not significant to any of the periods presented and related to depreciation, interest expense, and cost of sales.
Loss accrual provision – The Company did not properly estimate the loss accrual related to its extended maintenance contracts. As a result of the error in classification of research and development costs discussed below, the Company
did not consider all relevant historical costs when estimating future service costs when determining whether a loss accrual for extended maintenance contracts was necessary. Additionally, the Company did not consider the service costs related to hydrogen infrastructure, nor the provision for warrants, when estimating the need for a loss accrual on extended maintenance contracts. When properly considering these costs, additional loss accruals for extended maintenance contracts were required to be recorded. The corrections resulted in a ($1.6) million benefit for loss accrual for the year ended December 31, 2019, inclusive of the partial release of the 2018 loss accrual, and a provision for loss accrual of $5.3 million for the year ended December 31, 2018.
Research and development expense – The Company did not properly present certain costs related to related to research and development activities. Some of these costs were presented as research and development costs and should have been classified as costs of revenue. Correction of this error resulted in an increase in gross loss of $19.5 million and $21.2 million for the years ended December 31, 2019 and 2018, respectively. The tables below provide a summary of the adjustments between cost of revenue and research and development.
| | | | | | | | | As of December 31, 2019 | | As of December 31, 2018 | | | Restatement | | Restatement | | | Adjustments | | Adjustments | Cost of revenue: | | | | | | | Services performed on fuel cell systems and related infrastructure | | $ | 6,986 | | $ | 7,954 | Power Purchase Agreements | | | 2,539 | | | 4,264 | Sales of fuel cell systems and related infrastructure | | | 1,121 | | | 614 | Fuel delivered to customers | | | 8,846 | | | 8,325 | Total cost of revenue | | | 19,492 | | | 21,157 | | | | | | | | Research and development | | | (19,492) | | | (21,157) |
Series E Redeemable Convertible Preferred Stock Deemed Dividend – During 2019, the Company did not properly account for certain conversions of its Series E Redeemable Convertible Preferred Stock Deemed Dividend as a repurchase settled in common stock. The correction of this error resulted in the Company recording a deemed dividend during 2019 for approximately $1.8 million. This error correction had no impact on total equity and increased the net loss attributable to shareholders by $1.8 million.
Adoption of ASC 842 – The Company determined that the $3.4 million amount previously reported as the cumulative effect of adoption of ASC 842 on January 1, 2018 is actually a correction of errors made in lease accounting through December 31, 2017, under the prior accounting standards. Accordingly, the accumulated deficit at December 31, 2017 has been restated to reflect this accounting.
Other adjustments
In addition to the Restatement Items, the Company has corrected other adjustments. While these other adjustments are quantitatively immaterial, individually and in the aggregate, because we are correcting for the material errors, we have decided to correct these other adjustments as well.
Reclassifications have been made, whenever necessary, to prior period financial statements to conform to the current period presentation for the years ended December 31, 2019 and 2018.
Summary impact of Restatement Items and Other Adjustments to Prior Period Financial Statements
The following tables present the effect of the Restatement Items, as well as other adjustments, on the Company’s consolidated balance sheets for the periods indicated (in thousands, except per share):
| | | | | | | | | | | | | | As of December 31, 2019 | | | | | As previously | | Restatement | | | | Restatement | | | Reported | | Adjustments | | | As Restated | | References | Assets | | | | | | | | | | | | Current assets: | | | | | | | | | | | | Cash and cash equivalents | | $ | 139,496 | | $ | — | | $ | 139,496 | | | Restricted cash | | | 54,813 | | | — | | | 54,813 | | | Accounts receivable | | | 25,448 | | | 320 | | | 25,768 | | d | Inventory | | | 72,391 | | | — | | | 72,391 | | | Prepaid expenses and other current assets | | | 21,192 | | | — | | | 21,192 | | | Total current assets | | | 313,340 | | | 320 | | | 313,660 | | | | | | | | | | | | | | | Restricted cash | | | 175,191 | | | — | | | 175,191 | | | Property, plant, and equipment, net | | | 14,959 | | | — | | | 14,959 | | | Right of use assets related to finance leases, net | | | — | | | 1,714 | | | 1,714 | | a | Right of use assets related to operating leases, net | | | — | | | 63,266 | | | 63,266 | | a, b | Equipment related to power purchase agreements and fuel delivered to customers, net | | | 244,740 | | | (176,971) | | | 67,769 | | a, b | Goodwill | | | 8,842 | | | — | | | 8,842 | | | Intangible assets, net | | | 5,539 | | | — | | | 5,539 | | | Other assets | | | 8,573 | | | — | | | 8,573 | | | Total assets | | $ | 771,184 | | $ | (111,671) | | $ | 659,513 | | | | | | | | | | | | | | | Liabilities, Redeemable Preferred Stock, and Stockholders’ Equity | | | | | | | | | | | | Current liabilities: | | | | | | | | | | | | Accounts payable | | $ | 40,376 | | $ | — | | $ | 40,376 | | | Accrued expenses | | | 14,213 | | | 196 | | | 14,409 | | d | Deferred revenue | | | 11,691 | | | — | | | 11,691 | | | Operating lease liabilities | | | — | | | 9,428 | | | 9,428 | | a, b | Finance lease liabilities | | | — | | | 226 | | | 226 | | a | Finance obligations | | | 49,507 | | | (24,840) | | | 24,667 | | a, b | Current portion of long-term debt | | | 26,461 | | | — | | | 26,461 | | | Other current liabilities | | | 8,543 | | | (1,839) | | | 6,704 | | b, c | Total current liabilities | | | 150,791 | | | (16,829) | | | 133,962 | | | Deferred revenue | | | 23,369 | | | (199) | | | 23,170 | | d | Operating lease liabilities | | | — | | | 50,937 | | | 50,937 | | a, b | Finance lease liabilities | | | — | | | 2,011 | | | 2,011 | | a | Finance obligations | | | 265,228 | | | (145,806) | | | 119,422 | | a, b | Convertible senior notes, net | | | 110,246 | | | 185 | | | 110,431 | | d | Long-term debt | | | 85,708 | | | — | | | 85,708 | | | Other liabilities | | | 13 | | | 2,805 | | | 2,818 | | c | Total liabilities | | | 635,355 | | | (106,896) | | | 528,459 | | | | | | | | | | | | | | | Redeemable preferred stock: | | | | | | | | | | | | Series C redeemable convertible preferred stock, $0.01 par value per share (aggregate involuntary liquidation preference $16,664); 10,431 shares authorized; Issued and outstanding: 2,620 at December 31, 2019 | | | 709 | | | — | | | 709 | | | Series E convertible preferred stock, $0.01 par value per share; Shares authorized: 35,000 at December 31, 2019; Issued and outstanding: 500 at December 31, 2019 | | | 441 | | | — | | | 441 | | | Stockholders’ equity: | | | | | | | | | | | | Common stock, $0.01 par value per share; 750,000,000 shares authorized; Issued: 318,637,560 at December 31, 2019 | | | 3,186 | | | — | | | 3,186 | | | Additional paid-in capital | | | 1,507,116 | | | (163) | | | 1,506,953 | | d | Accumulated other comprehensive income | | | 1,400 | | | (112) | | | 1,288 | | d | Accumulated deficit | | | (1,345,807) | | | (4,500) | | | (1,350,307) | | | Less common stock in treasury: 15,259,045 at December 31, 2019 | | | (31,216) | | | — | | | (31,216) | | | Total stockholders’ equity | | | 134,679 | | | (4,775) | | | 129,904 | | | Total liabilities, redeemable preferred stock, and stockholders’ equity | | $ | 771,184 | | $ | (111,671) | | $ | 659,513 | | |
As of December 31, 2019
| (a) | The "as previously reported" balances for equipment related to power purchase agreements and fuel delivered to customers, net (previously captioned leased assets, net) and the current and long-term finance obligations have been reclassified to conform to current period presentations, as follows at December 31, 2019: |
| ● | $176.0 million was reclassified from equipment related to power purchase agreements and fuel delivered to customers, net to right of use assets related to operating leases, net; |
| ● | $1.7 million was reclassified from equipment related to power purchase agreements and fuel delivered to customers, net to right of use asset related to finance leases, net; |
| ● | $25.8 million was reclassified from current finance obligations to current operating lease liabilities; |
| ● | $145.5 million was reclassified from non-current finance obligations to non-current operating lease liabilities; |
| ● | $226 thousand was reclassified from current finance obligations to current finance lease liabilities, respectively; and |
| ● | $2.0 million was reclassified from non-current finance obligations to non-current finance lease liabilities |
| (b) | The correction of the misstatement associated with the right of use assets relating to operating leases resulted in the following at December 31, 2019: |
| ● | the right of use assets related to operating leases, net had a decrease of $112.7 million; |
| ● | equipment related to power purchase agreements and lessor property, net had an increase of $767 thousand; |
| ● | current operating lease liabilities had a decrease of $16.4 million; |
Notes to Consolidated Financial Statements (Continued)
| ● | non-current operating lease liabilities had a decrease of $94.6 million; |
| ● | the current finance obligations had a $1.2 million increase; |
| ● | the non-current finance obligation had an increase of $1.7 million; and |
| ● | other current liabilities decreased $2.7 million. |
| (c) | Loss accrual provision: The correction of this misstatement resulted in an increase of $897 thousand to other current liabilities and an increase of $2.8 million to other long-term liabilities at December 31, 2019. |
| (d) | Other adjustments: Immaterial adjustments at December 31, 2019 resulted in an increase to accounts receivable of $320 thousand. An increase to accrued expenses of $196 thousand. A decrease to deferred revenue of $199 thousand. An increase in convertible senior notes, net of $185 thousand, and a decrease of $163 thousand to additional paid in capital and a $112 thousand decrease to accumulated other comprehensive income. |
The following tables present the effect of the Restatement Items, as well as other adjustments, on the Company’s consolidated statements of operations for the periods indicated (in thousands, except share and per share amounts):
| | | | | | | | | | | | | | | | | | | | | | | | | | For the Year Ended December 31, 2019 | | | | | As Previously | | Restatement | | | | | Restatement | | | Reported | | Adjustments | | | As Restated | References | Net revenue: | | | | | | | | | | | | Sales of fuel cell systems and related infrastructure | | $ | 149,884 | | $ | 36 | | $ | 149,920 | | d | Services performed on fuel cell systems and related infrastructure | | | 25,217 | | | — | | | 25,217 | | | Power Purchase Agreements | | | 25,853 | | | (300) | | | 25,553 | | d | Fuel delivered to customers | | | 29,099 | | | — | | | 29,099 | | | Other | | | 186 | | | — | | | 186 | | | Net revenue | | | 230,239 | | | (264) | | | 229,975 | | | Cost of revenue: | | | | | | | | | | | | Sales of fuel cell systems and related infrastructure | | | 96,859 | | | 1,056 | | | 97,915 | | a, d | Services performed on fuel cell systems and related infrastructure | | | 28,801 | | | 5,781 | | | 34,582 | | a, c,d | Benefit for loss contracts related to service | | | — | | | (394) | | | (394) | | c | Power Purchase Agreements | | | 40,056 | | | 1,721 | | | 41,777 | | a, b,d | Fuel delivered to customers | | | 36,357 | | | 8,890 | | | 45,247 | | a, d | Other | | | 200 | | | — | | | 200 | | | Total cost of revenue | | | 202,273 | | | 17,054 | | | 219,327 | | | | | | | | | | | | | | | Gross profit | | | 27,966 | | | (17,318) | | | 10,648 | | | | | | | | | | | | | | | Operating expenses: | | | | | | | | | | | | Research and development | | | 33,675 | | | (18,616) | | | 15,059 | | a,d | Selling, general and administrative | | | 44,333 | | | (1,131) | | | 43,202 | | b,d | Total operating expenses | | | 78,008 | | | (19,747) | | | 58,261 | | | | | | | | | | | | | | | Operating loss | | | (50,042) | | | 2,429 | | | (47,613) | | | | | | | | | | | | | | | Interest and other expense, net | | | (35,502) | | | (189) | | | (35,691) | | b,d | Change in fair value of common stock warrant liability | | | 79 | | | — | | | 79 | | | Gain (loss) on extinguishment of debt | | | — | | | (518) | | | (518) | | d | | | | | | | | | | | | | Loss before income taxes | | $ | (85,465) | | $ | 1,722 | | $ | (83,743) | | | | | | | | | | | | | | | Income tax benefit | | | — | | | — | | | — | | | | | | | | | | | | | | | Net loss attributable to the Company | | $ | (85,465) | | $ | 1,722 | | $ | (83,743) | | | | | | | | | | | | | | | Preferred stock dividends declared, deemed dividends and accretion of discount | | | (52) | | | (1,760) | | | (1,812) | | e | Net loss attributable to common stockholders | | $ | (85,517) | | $ | (38) | | $ | (85,555) | | | | | | | | | | | | | | | Net loss per share: | | | | | | | | | | | | Basic and diluted | | $ | (0.36) | | | | | $ | (0.36) | | | | | | | | | | | | | | | Weighted average number of common stock outstanding | | | 237,152,780 | | | | | | 237,152,780 | | |
For the year ended December 31, 2019
| (a) | Research and development: The correction of this misstatement resulted in a net decrease of $19.5 million to research and development, and an increase of $1.1 million to the cost of revenue of fuel cell systems and related infrastructure, an increase of $7 million to the cost of revenue of services performed on fuel cell systems and related infrastructure, an increase of $2.5 million to the cost of power purchase agreements and an increase in the cost of fuel delivered to customers of $8.9 million at December 31, 2019. |
| (b) | Right of use asset: The correction of this misstatement resulted in a net decrease to cost of revenue for power purchase agreements of $747 thousand. An increase to selling, general, and administrative expense of $25 thousand, and an increase to interest and other expense, net of $522 thousand. |
| (c) | Loss accrual provision: The correction of this misstatement resulted in a net decrease to cost of revenue for services performed on fuel cell systems and related infrastructure of $1.2 million and a net decrease to the provision for loss contracts related to service of $394 thousand for the period ended December 31, 2019. |
| (d) | Other adjustments: Immaterial adjustments for the period ended December 31, 2019 resulted in the following: a net increase of $36 thousand to revenue from sales of fuel cell systems and related infrastructure. A net decrease to revenue from power purchase agreements of $300 thousand. A net decrease of $65 thousand to the cost of revenue for sales of fuel cell systems and related infrastructure. A net increase to the cost of revenue for services performed on fuel cell systems and related infrastructure of $44 thousand. A net decrease to cost of revenue for power purchase agreements of $70 thousand. A net increase of $44 thousand to cost of revenue related to fuel delivered to customers. A net increase to research and development expense of $876 thousand. A net decrease to selling general and administrative expense of $1.1 million, a net increase to interest and other expense, net of $185 thousand and an increase of $518 thousand loss on the extinguisment of debt (which was previously reported as interest and other expense, net of $518 thousand). |
| (e) | Series E redeemable convertible preferred stock deemed dividend: The correction of this misstatement resulted in a net increase of $1.8 million to preferred stock dividends declared, deemed dividends and accretion of discount. |
| | | | | | | | | | | | | | For the Year Ended December 31, 2018 | | | | | As Previously | | Restatement | | | | | Restatement | | | Reported | | Adjustments | | | As Restated | References | Net revenue: | | | | | | | | | | | | Sales of fuel cell systems and related infrastructure | | $ | 107,292 | | $ | (117) | | $ | 107,175 | | d | Services performed on fuel cell systems and related infrastructure | | | 22,002 | | | — | | | 22,002 | | | Power Purchase Agreements | | | 22,869 | | | (300) | | | 22,569 | | d | Fuel delivered to customers | | | 22,469 | | | — | | | 22,469 | | | Net revenue | | | 174,632 | | | (417) | | | 174,215 | | | Cost of revenue: | | | | | | | | | | | | Sales of fuel cell systems and related infrastructure | | | 84,439 | | | 766 | | | 85,205 | | a,d | Services performed on fuel cell systems and related infrastructure | | | 23,698 | | | 8,573 | | | 32,271 | | a, d | Provision for loss contracts related to service | | | — | | | 5,345 | | | 5,345 | | c | Power Purchase Agreements | | | 36,161 | | | 5,200 | | | 41,361 | | a, b | Fuel delivered to customers | | | 27,712 | | | 8,325 | | | 36,037 | | a | Total cost of revenue | | | 172,010 | | | 28,209 | | | 200,219 | | | | | | | | | | | | | | | Gross (loss) profit | | | 2,622 | | | (28,626) | | | (26,004) | | | | | | | | | | | | | | | Operating expenses: | | | | | | | | | | | | Research and development | | | 33,907 | | | (21,157) | | | 12,750 | | a | Selling, general and administrative | | | 38,198 | | | (513) | | | 37,685 | | d | Total operating expenses | | | 72,105 | | | (21,670) | | | 50,435 | | | | | | | | | | | | | | | Operating loss | | | (69,483) | | | (6,956) | | | (76,439) | | | | | | | | | | | | | | | Interest and other expense, net | | | (22,135) | | | (615) | | | (22,750) | | b | Change in fair value of common stock warrant liability | | | 4,286 | | | — | | | 4,286 | | | | | | | | | | | | | | | Loss before income taxes | | $ | (87,332) | | $ | (7,571) | | $ | (94,903) | | | | | | | | | | | | | | | Income tax benefit | | | 9,217 | | | 78 | | | 9,295 | | d | | | | | | | | | | | | | Net loss attributable to the Company | | $ | (78,115) | | $ | (7,493) | | $ | (85,608) | | | | | | | | | | | | | | | Preferred stock dividends declared, deemed dividends and accretion of discount | | | (52) | | | — | | | (52) | | | Net loss attributable to common stockholders | | $ | (78,167) | | $ | (7,493) | | $ | (85,660) | | | | | | | | | | | | | | | Net loss per share: | | | | | | | | | | | | Basic and diluted | | $ | (0.36) | | | | | $ | (0.39) | | | | | | | | | | | | | | | Weighted average number of common stock outstanding | | | 218,882,337 | | | | | | 218,882,337 | | |
For the year ended December 31, 2018
| (a) | Research and development: The correction of this misstatement resulted in a net decrease of $21.2 million to research and development, and an increase of $614 thousand to the cost of sales of fuel cell systems and related infrastructure, an increase of $8.0 million to the cost of services performed on fuel cell systems and related infrastructure, an increase of $4.2 million to the cost of power purchase agreements and an increase in the cost of fuel delivered to customers of $8.3 million at December 31, 2018. |
| (b) | Right of use asset: The correction of this misstatement resulted in a net increase to cost of revenue for power purchase agreements of $937 thousand, and an increase to interest and other expense, net of $615 thousand. |
| (c) | Loss accrual provision: The correction of this misstatement resulted in a net increase to the provision for loss contracts related to service of $5.3 million for the period ended December 31, 2018. |
| (d) | Other adjustments: Immaterial adjustments for the period ended December 31, 2018 resulted in the following: a net decrease of $117 thousand to revenue from sales of fuel cell systems and related infrastructure. A net decrease to revenue from power purchase agreements of $300 thousand. A net increase of $152 thousand to the cost of revenue for sales of fuel cell systems and related infrastructure. A net increase to the cost of revenue for services performed on fuel cell systems and related infrastructure of $619 thousand. A net decrease to selling general and administrative expense of $513 thousand and an increase to the income tax benefit of $78 thousand. |
The following tables present the effect of the Restatement Items, as well as other adjustments, on the Company’s consolidated statements of comprehensive loss for the periods indicated (in thousands):
| | | | | | | | | | | | | | | | | | | | | | | For the year ended December 31, 2019 | | For the year ended December 31, 2018 | | | | | As Previously | | Cumulative | | | | As Previously | | Cumulative | | | | | Restatement | | | Reported | | Adjustments | | As Restated | | Reported | | Adjustments | | | As Restated | | References | | | | | | | | | | | | | | | | | | | | | | Net loss attributable to the Company | | $ | (85,465) | | $ | 1,722 | | $ | (83,743) | | $ | (78,115) | | $ | (7,493) | | $ | (85,608) | | | Other comprehensive loss - foreign currency translation adjustment | | | (184) | | | (112) | | | (296) | | | (610) | | | — | | | (610) | | b | Comprehensive loss attributable to the Company | | $ | (85,649) | | $ | 1,610 | | $ | (84,039) | | $ | (78,725) | | $ | (7,493) | | $ | (86,218) | | | | | | | | | | | | | | | | | | | | | | | | Preferred stock dividends declared, deemed dividends and accretion of discount | | | (52) | | | (1,760) | �� | | (1,812) | | | (52) | | | — | | | (52) | | a | Comprehensive loss attributable to common stockholders | | | (85,701) | | | (150) | | | (85,851) | | | (78,777) | | | (7,493) | | | (86,270) | | |
For the year ened December 31, 2019 and 2018
| (a) | Series E convertible preferred stock deemed dividend: The correction of this misstatement resulted in a net decrease of $1.8 million to preferred stock dividends declared, deemed dividends and accretion of discount to the period ended December 31, 2019. |
| (b) | Other adjustments: Immaterial adjustment for the period ended December 31, 2019 resulted in a net increase of $112 thousand for the other comprehensive loss related to the foreign currency translation adjustment. |
The following tables present the effect of the Restatement Items, as well as other adjustments, on the Company’s consolidated statements of stockholders’ equity (deficit) for the periods indicated (in thousands, except share amounts):
| | | | | | | | | | | | | | | | | | | | | | | | | | | | | | | | | | | Accumulated | | | | | | | | | | | | | | | | | | | | Additional | | Other | | | | | | | Total | | | | | Common Stock | | Paid-in | | Comprehensive | | Treasury Stock | | Accumulated | | Stockholders’ | | Restatement | | | Shares | | Amount | | Capital | | Income | | Shares | | Amount | | Deficit | | Equity (Deficit) | | References | BALANCE - December 31, 2017 (As Previously Reported) | | 229,073,517 | | $ | 2,291 | | $ | 1,250,899 | | $ | 2,194 | | 587,151 | | $ | (3,102) | | $ | (1,178,636) | | $ | 73,646 | | | Cumulative adjustments | | — | | | — | | | — | | | — | | — | | | — | | | (3,417) | | | (3,417) | | a,b | BALANCE - December 31, 2017 (As Restated) | | 229,073,517 | | | 2,291 | | | 1,250,899 | | | 2,194 | | 587,151 | | | (3,102) | | | (1,182,053) | | | 70,229 | | | | | | | | | | | | | | | | | | | | | | | | | | | | BALANCE - December 31, 2018 (As Previously Reported) | | 234,160,661 | | $ | 2,342 | | $ | 1,289,714 | | $ | 1,584 | | 15,002,663 | | $ | (30,637) | | $ | (1,260,290) | | $ | 2,713 | | | Cumulative adjustments | | — | | | — | | | (78) | | | — | | — | | | — | | | (6,223) | | | (6,301) | | a,b | BALANCE - December 31, 2018 (As Restated) | | 234,160,661 | | | 2,342 | | | 1,289,636 | | | 1,584 | | 15,002,663 | | | (30,637) | | | (1,266,513) | | | (3,588) | | | | | | | | | | | | | | | | | | | | | | | | | | | | BALANCE - December 31, 2019 (As Previously Reported) | | 318,637,560 | | $ | 3,186 | | $ | 1,507,116 | | $ | 1,400 | | 15,259,045 | | $ | (31,216) | | $ | (1,345,807) | | $ | 134,679 | | | Cumulative adjustments | | — | | | — | | | (163) | | | (112) | | — | | | — | | | (4,500) | | | (4,775) | | a,b | BALANCE - December 31, 2019 (As Restated) | | 318,637,560 | | $ | 3,186 | | $ | 1,506,953 | | $ | 1,288 | | 15,259,045 | | $ | (31,216) | | $ | (1,350,307) | | $ | 129,904 | | |
As of December 31, 2019 and 2018
| (a) | Restatement Items: The correction of material misstatements resulted in a net increase in accumulated deficit of $4.5 million, $6.2 million and $3.4 million as of December 31, 2019, 2018 and 2017, respectively. |
| (b) | Other adjustments: Immaterial adjustments resulted in the following: for the period ended December 31, 2019, there was a net increase of $112 thousand for the other comprehensive loss related to the foreign currency translation adjustment and a net decrease of $163 thousand in additional paid-in capital; and for the period ended December 31, 2018, there was a net decrease in additional paid-in capital of $78 thousand. |
The following tables present the effect of the Restatement Items, as well as other adjustments, on the Company’s consolidated statements of cashflows for the periods indicated (in thousands):
| | | | | | | | | | | | | | For the Year Ended December 31, 2019 | | | | | As previously | | Restatement | | | | Restatement | | | Reported | | Adjustments | | | As Restated | References | Operating Activities | | | | | | | | | | | | Net loss attributable to the Company | | $ | (85,465) | | $ | 1,722 | | $ | (83,743) | | a | Adjustments to reconcile net loss to net cash used in operating activities: | | | | | | | | | | | | Depreciation of long-lived assets | | | 11,989 | | | (51) | | | 11,938 | | b, d | Amortization of intangible assets | | | 698 | | | — | | | 698 | | | Stock-based compensation | | | 10,890 | | | — | | | 10,890 | | | Loss on extinguishment of debt | | | — | | | 518 | | | 518 | | d | Provision for bad debts and other assets | | | 1,981 | | | — | | | 1,981 | | | Amortization of debt issuance costs and discount on convertible senior notes | | | 8,821 | | | 185 | | | 9,006 | | d | Provision for common stock warrants | | | 6,513 | | | — | | | 6,513 | | | Loss on disposal of leased assets | | | 212 | | | — | | | 212 | | | Change in fair value of common stock warrant liability | | | (79) | | | — | | | (79) | | | Benefit on service contracts | | | — | | | (1,643) | | | (1,643) | | c | Changes in operating assets and liabilities that provide (use) cash: | | | | | | | | | | | | Accounts receivable | | | 10,646 | | | (52) | | | 10,594 | | d | Inventory | | | (24,481) | | | (152) | | | (24,633) | | d | Prepaid expenses, and other assets | | | (8,110) | | | — | | | (8,110) | | | Accounts payable, accrued expenses, and other liabilities | | | 19,879 | | | (2,645) | | | 17,234 | | b, d | Deferred revenue | | | (5,016) | | | 316 | | | (4,700) | | d | Net cash used in operating activities | | | (51,522) | | | (1,802) | | | (53,324) | | | Investing Activities | | | | | | | | | | | | Purchases of property, plant and equipment | | | (5,683) | | | — | | | (5,683) | | | Purchase of intangible assets | | | (2,404) | | | — | | | (2,404) | | | Purchases of equipment related to PPA and equipment related to fuel delivered to customers | | | (6,532) | | | — | | | (6,532) | | | Proceeds from sale of leased assets | | | 375 | | | — | | | 375 | | | Net cash used in investing activities | | | (14,244) | | | — | | | (14,244) | | | Financing Activities | | | | | | | | | | | | Proceeds from issuance of preferred stock and warrants, net of transaction costs | | | 14,089 | | | — | | | 14,089 | | | Proceeds from public offerings, net of transaction costs | | | 158,428 | | | (85) | | | 158,343 | | d | Proceeds from exercise of stock options | | | 1,217 | | | — | | | 1,217 | | | Payments for redemption of preferred stock | | | (4,040) | | | — | | | (4,040) | | | Proceeds from issuance of convertible senior notes, net | | | 39,052 | | | — | | | 39,052 | | | Proceeds from borrowing of long-term debt, net of transaction costs | | | 119,186 | | | — | | | 119,186 | | | Principal payments on long-term debt | | | (24,827) | | | (518) | | | (25,345) | | d | Proceeds from finance obligations | | | 83,668 | | | — | | | 83,668 | | | Repayments of finance obligations | | | (61,713) | | | 2,517 | | | (59,196) | | b | Net cash provided by financing activities | | | 325,060 | | | 1,914 | | | 326,974 | | | Effect of exchange rate changes on cash | | | 53 | | | (112) | | | (59) | | d | Increase in cash, cash equivalents and restricted cash | | | 259,347 | | | — | | | 259,347 | | | Cash, cash equivalents, and restricted cash beginning of period | | | 110,153 | | | — | | | 110,153 | | | Cash, cash equivalents, and restricted cash end of period | | $ | 369,500 | | $ | — | | $ | 369,500 | | | | | | | | | | | | | | | Supplemental disclosure of cash flow information | | | | | | | | | | | | Cash paid for interest | | $ | 19,180 | | $ | — | | | 19,180 | | | | | | | | | | | | | | | Summary of non-cash investing and financing activity | | | | | | | | | | | | Recognition of right of use assets | | $ | 127,370 | | $ | (74,446) | | $ | 52,924 | | b | Conversion of preferred stock to common stock | | | 28,392 | | | — | | | 28,392 | | |
For the year ended December 31, 2019
| (a) | Refer to descriptions of the adjustments and their impact on net loss in the Consolidated Statement of Operations sections for the year ended December 31, 2019 above. |
| (b) | Right of use asset: The correction of this misstatement resulted in a net decrease to operating cashflows of $2.7 million and a net increase to cash provided by financing activities of $2.5 million for the period ended December 31, 2019. In addition there was a net decrease of $74.4 million to the non-cash investing and financing activity related to the recognition of the right of use asset. |
| (c) | Provision for loss contracts related to service: The correction of this misstatement resulted in a net decrease to operating cashflows of $1.6 million for the period ended December 31 2019. |
| (d) | Other adjustments: Immaterial adjustments resulted in an net increase to operating cashflows of $906 thousand, a decrease to cash provided by financing activites of $603 thousand and a decrease to effect of exchange rate changes on cash of $112 thousand, for the period ended December 31 2019 |
| | | | | | | | | | | | | | For the Year Ended December 31, 2018 | | | | | As previously | | Restatement | | | | Restatement | | | Reported | | Adjustments | | | As Restated | References | Operating Activities | | | | | | | | | | | | Net loss attributable to the Company | | $ | (78,115) | | $ | (7,493) | | $ | (85,608) | | a | Adjustments to reconcile net loss to net cash used in operating activities: | | | | | | | | | | | | Depreciation of long-lived assets | | | 11,014 | | | 818 | | | 11,832 | | b, d | Amortization of intangible assets | | | 693 | | | — | | | 693 | | | Stock-based compensation | | | 8,771 | | | — | | | 8,771 | | | Provision for bad debts and other assets | | | 1,626 | | | — | | | 1,626 | | | Amortization of debt issuance costs and discount on convertible senior notes | | | 6,347 | | | — | | | 6,347 | | | Provision for common stock warrants | | | 10,190 | | | — | | | 10,190 | | | Change in fair value of common stock warrant liability | | | (4,286) | | | — | | | (4,286) | | | Income tax benefit | | | (9,217) | | | (78) | | | (9,295) | | d | Loss on service contracts | | | — | | | 5,345 | | | 5,345 | | c | Changes in operating assets and liabilities that provide (use) cash: | | | | | | | | | | | | Accounts receivable | | | (14,398) | | | (268) | | | (14,666) | | d | Inventory | | | 19,041 | | | 152 | | | 19,193 | | d | Prepaid expenses, and other assets | | | (4,654) | | | — | | | (4,654) | | | Accounts payable, accrued expenses, and other liabilities | | | (10,266) | | | 106 | | | (10,160) | | d | Deferred revenue | | | 5,637 | | | 685 | | | 6,322 | | d | Net cash used in operating activities | | | (57,617) | | | (733) | | | (58,350) | | | Investing Activities | | | | | | | | | | | | Purchases of property, plant and equipment | | | (5,142) | | | — | | | (5,142) | | | Purchases of equipment related to PPA and equipment related to fuel delivered to customers | | | (13,501) | | | — | | | (13,501) | | | Purchase of intangible assets | | | (929) | | | — | | | (929) | | | Net cash used in investing activities | | | (19,572) | | | — | | | (19,572) | | | Financing Activities | | | | | | | | | | | | Proceeds from issuance of preferred stock and warrants, net of transaction costs | | | 30,934 | | | — | | | 30,934 | | | Proceeds from public offerings, net of transaction costs | | | 7,195 | | | — | | | 7,195 | | | Proceeds from exercise of stock options | | | 138 | | | — | | | 138 | | | Proceeds from issuance of convertible senior notes, net | | | 95,856 | | | — | | | 95,856 | | | Purchase of capped calls and common stock forward | | | (43,500) | | | — | | | (43,500) | | | Principal payments on long-term debt | | | (16,190) | | | — | | | (16,190) | | | Proceeds from finance obligations | | | 76,175 | | | — | | | 76,175 | | | Repayments of finance obligations | | | (31,264) | | | 733 | | | (30,531) | | b | Net cash provided by financing activities | | | 119,344 | | | 733 | | | 120,077 | | | Effect of exchange rate changes on cash | | | (57) | | | — | | | (57) | | | Increase in cash, cash equivalents and restricted cash | | | 42,098 | | | — | | | 42,098 | | | Cash, cash equivalents, and restricted cash beginning of period | | | 68,055 | | | — | | | 68,055 | | | Cash, cash equivalents, and restricted cash end of period | | $ | 110,153 | | $ | — | | $ | 110,153 | | | | | | | | | | | | | | | Supplemental disclosure of cash flow information | | | | | | | | | | | | Cash paid for interest | | $ | 13,057 | | $ | — | | | 13,057 | | | | | | | | | | | | | | | Summary of non-cash investing and financing activity | | | | | | | | | | | | Recognition of right of use assets | | $ | 79,057 | | $ | (37,378) | | $ | 41,679 | | b | Net transfers between inventory and long-lived assets | | | 18,175 | | | — | | | 18,175 | | |
For the year ended December 31, 2018
| (a) | Refer to descriptions of the adjustments and their impact on net loss in the Consolidated Statement of Operations and Consolidated Balance Sheets sections for the year ended December 31, 2018 above. |
| (b) | Right of use asset: The correction of this misstatement resulted in a net increase to operating cashflows of $818 thousand and a net increase to financing cash flows of $733 thousand for the period ended December 31, 2018. In addition, there was a net decrease of $37.4 million to the non-cash investing and financing activity related to the recognition of the right of use asset |
| (c) | Provision for loss contracts related to service: The correction of this misstatement resulted in a net increase to operating cashflows of $5.3 million for the period ended December 31 2018. |
| (d) | Other adjustments: Immaterial adjustments resulted in an net increase to cash used in operating cash flows of $597 thousand for the period ended December 31 2018. |
3.Unaudited Quarterly Financial data andRestatement of Previously Issued Unaudited Interim Condensed Consolidated Financial Statements
The following tables below include corrections to the prior period results, and include the Restatement Items and other adjustments included in Note 2, “Restatement of Previously Issued Consolidated Financial Statements,” as well as the following:
Bonus Accrual – There was a $5.3 million understatement of bonus expense and related payroll expense for the three months ended September 30, 2020 due to the Company not properly estimating the bonus expense for the nine month period ended September 30, 2020.
Right of Use assets and lease liabilities – There was a $2.4 million understatement of right of use assets and lease liabilities at September 30, 2020 due to the Company not properly recognizing lease liabilities and right of use assets for certain leases that renewed during the third quarter of 2020.
Loss accrual provision – There was a $21.0 understatement of the provision for loss contracts as of September 30, 2020 due to the Company not properly estimating the loss accrual related to extended maintenance contracts.
The summary of the quarterly statement of operations are presented as follows:
| | | | | | | | | | | | | | | | Quarters ended | | | | As Restated | | | | | | | March 31, | | June 30, | | September 30, | | December 31, | | | | 2020 | | 2020 | | 2020 | | 2020 | | Net revenue: | | | | | | | | | | | | | | Sales of fuel cell systems and related infrastructure | | $ | 20,468 | | $ | 47,746 | | $ | 83,662 | | $ | (246,171) | | Services performed on fuel cell systems and related infrastructure | | | 6,521 | | | 6,236 | | | 6,829 | | | (29,387) | | Power Purchase Agreements | | | 6,421 | | | 6,579 | | | 6,629 | | | 6,991 | | Fuel delivered to customers | | | 7,333 | | | 7,372 | | | 9,831 | | | (40,608) | | Other | | | 76 | | | 62 | | | 97 | | | 76 | | Net revenue | | | 40,819 | | | 67,995 | | | 107,048 | | | (309,099) | | Gross loss | | | (9,703) | | | (15) | | | (28,584) | | | (431,114) | | Operating expenses | | | 15,883 | | | 26,517 | | | 25,726 | | | 46,660 | | Operating loss | | | (25,586) | | | (26,532) | | | (54,310) | | | (477,774) | | Net loss attributable to common stockholders | | | (37,445) | | | (9,414) | | | (65,217) | | | (484,105) | | Loss per share: | | | | | | | | | | | | | | Basic and Diluted | | $ | (0.12) | | $ | (0.03) | | $ | (0.18) | | $ | (1.35) | |
| | | | | | | | | | | | | | | | Quarters ended | | | | As Restated | | | | March 31, | | June 30, | | September 30, | | December 31, | | | | 2019 | | 2019 | | 2019 | | 2019 | | Net revenue: | | | | | | | | | | | | | | Sales of fuel cell systems and related infrastructure | | $ | 2,550 | | $ | 38,702 | | $ | 38,883 | | $ | 69,785 | | Services performed on fuel cell systems and related infrastructure | | | 6,343 | | | 5,341 | | | 6,205 | | | 7,328 | | Power Purchase Agreements | | | 6,035 | | | 6,334 | | | 6,520 | | | 6,664 | | Fuel delivered to customers | | | 6,582 | | | 7,089 | | | 7,649 | | | 7,779 | | Other | | | — | | | — | | | 135 | | | 51 | | Net revenue | | | 21,510 | | | 57,466 | | | 59,392 | | | 91,607 | | Gross (loss) profit | | | (7,740) | | | 6,142 | | | 4,500 | | | 7,746 | | Operating expenses | | | 12,227 | | | 17,221 | | | 13,958 | | | 14,855 | | Operating loss | | | (19,967) | | | (11,079) | | | (9,458) | | | (7,109) | | Net loss attributable to common stockholders | | | (30,560) | | | (17,351) | | | (18,366) | | | (19,277) | | Loss per share: | | | | | | | | | | | | | | Basic and Diluted | | $ | (0.14) | | $ | (0.08) | | $ | (0.08) | | $ | (0.07) | |
Summary impact of Restatement Items to previously reported unaudited interim condensed consolidated financial information
The following tables present the Restatement Items, as well as other adjustments, on the Company’s unaudited interim condensed consolidated balance sheets for the periods indicated (in thousands, except per share):
| | | | | | | | | | | | | | As of September 30, 2020 | | | | | As previously | | Restatement | | | | | Restatement | | | Reported | | Adjustments | | As Restated | | References | Assets | | | | | | | | | | | | Current assets: | | | | | | | | | | | | Cash and cash equivalents | | $ | 448,140 | | $ | — | | $ | 448,140 | | | Restricted cash | | | 55,704 | | | — | | | 55,704 | | | Accounts receivable | | | 113,133 | | | 372 | | | 113,505 | | e | Inventory | | | 134,306 | | | (103) | | | 134,203 | | e | Prepaid expenses and other current assets | | | 26,731 | | | — | | | 26,731 | | | Total current assets | | | 778,014 | | | 269 | | | 778,283 | | | | | | | | | | | | | | | Restricted cash | | | 227,528 | | | — | | | 227,528 | | | Property, plant, and equipment, net | | | 64,820 | | | — | | | 64,820 | | | Right of use assets related to finance leases, net | | | — | | | 2,335 | | | 2,335 | | a | Right of use assets related to operating leases, net | | | — | | | 90,184 | | | 90,184 | | a, b | Equipment related to power purchase agreements and fuel delivered to customers, net | | | 309,475 | | | (237,584) | | | 71,891 | | a, b | Goodwill | | | 71,962 | | | (140) | | | 71,822 | | e | Intangible assets, net | | | 39,169 | | | 400 | | | 39,569 | | e | Other assets | | | 9,661 | | | — | | | 9,661 | | | Total assets | | $ | 1,500,629 | | $ | (144,536) | | $ | 1,356,093 | | | | | | | | | | | | | | | Liabilities, Redeemable Preferred Stock, and Stockholders’ Equity | | | | | | | | | | | | Current liabilities: | | | | | | | | | | | | Accounts payable | | $ | 58,793 | | $ | — | | $ | 58,793 | | | Accrued expenses | | | 32,031 | | | 5,917 | | | 37,948 | | d, e | Deferred revenue | | | 17,226 | | | — | | | 17,226 | | | Operating lease liabilities | | | — | | | 10,609 | | | 10,609 | | a, b | Finance lease liabilities | | | — | | | 374 | | | 374 | | a | Finance obligations | | | 63,692 | | | (32,343) | | | 31,349 | | a, b | Current portion of long-term debt | | | 74,829 | | | — | | | 74,829 | | | Other current liabilities | | | 17,280 | | | 3,803 | | | 21,083 | | b, c | Total current liabilities | | | 263,851 | | | (11,640) | | | 252,211 | | | Deferred revenue | | | 29,648 | | | (137) | | | 29,511 | | e | Operating lease liabilities | | | — | | | 74,422 | | | 74,422 | | a, b | Finance lease liabilities | | | — | | | 2,384 | | | 2,384 | | a | Finance obligations | | | 337,150 | | | (196,488) | | | 140,662 | | a, b | Convertible senior notes, net | | | 105,088 | | | — | | | 105,088 | | | Long-term debt | | | 120,380 | | | — | | | 120,380 | | | Other liabilities | | | 27,068 | | | 18,102 | | | 45,170 | | c | Total liabilities | | | 883,185 | | | (113,357) | | | 769,828 | | | | | | | | | | | | | | | Stockholders’ equity: | | | | | | | | | | | | Common stock, $0.01 par value per share; 750,000,000 shares authorized; Issued: 406,123,816 at September 30, 2020 | | | 4,061 | | | — | | | 4,061 | | | Additional paid-in capital | | | 2,083,199 | | | (30) | | | 2,083,169 | | e | Accumulated other comprehensive income | | | 1,958 | | | (112) | | | 1,846 | | e | Accumulated deficit | | | (1,431,340) | | | (31,037) | | | (1,462,377) | | | Less common stock in treasury | | | (40,434) | | | — | | | (40,434) | | | Total stockholders’ equity | | | 617,444 | | | (31,179) | | | 586,265 | | | Total liabilities, redeemable preferred stock, and stockholders’ equity | | $ | 1,500,629 | | $ | (144,536) | | $ | 1,356,093 | | |
As of September 30, 2020
(a)The "as previously reported" balances for equipment related to power purchase agreements and fuel delivered to customers, net (previously captioned leased assets, net) and the current and long-term finance obligations have been reclassified to conform to current period presentations, as follows at September 30, 2020:
| ● | $235.8 million was reclassified from equipment related to power purchase agreements and fuel delivered to customers, net to the right of use assets related to operating leases, net: |
| ● | $2.3 million was reclassified from equipment related to power purchase agreements and fuel delivered to customers, net to the right of use asset related to finance leases, net; |
| ● | $32.7 million was reclassified from current finance obligations to current operating lease liabilities; |
| ● | $195.1 million was reclassified from non-current finance obligations to non-current operating lease liabilities; |
| ● | $374 thousand was reclassified from current finance obligations to current finance lease liabilities; and |
| ● | $2.4 million was reclassified from non-current finance obligations to non-current finance lease liabilities. |
(b) The correction of the misstatement associated with the right of use assets relating to operating leases resulted in the following at September 30, 2020:
| ● | the right of use assets related to operating leases, net had a decrease of $145.6 million; |
| ● | equipment related to power purchase agreements and fuel delivered to customers, net had an increase of $535 thousand; |
| ● | current operating lease liabilities had a decrease of $22.1 million; |
| ● | non-current operating lease liabilities had a decrease of $120.6 million; |
| ● | the current and non current finance obligations had an increase of $788 thousand and $1.0 million, respectively; and |
| ● | other current liabilities had a decrease of $2.6 million |
(c) Loss accrual provision: The correction of this misstatement resulted in an increase of $6.4 million to other current liabilities and an increase of $18.1 million to other long-term liabilities at September 30, 2020.
(d) Bonus accrual: Adjustments related to the under accrual for bonus expenses resulted in an increase in accrued expenses of $5.3 million at September 30, 2020.
(e) Other adjustments: Immaterial adjustments at September 30, 2020 resulted in the following: An increase to accounts receivable of $372 thousand and a decrease to inventory of $103 thousand. A decrease to goodwill of $140 thousand, and an increase to intangible assets of $400 thousand. An increase in accrued expenses of $703 thousand, a net, a decrease to deferred revenue of $137 thousand, a decrease to additional paid in capital of $30 thousand and a decrease to accumulated other comprehensive income of $112 thousand.
| | | | | | | | | | | | | | As of June 30, 2020 | | | | | As previously | | Restatement | | | | | Restatement | | | Reported | | Adjustments | | As Restated | | References | Assets | | | | | | | | | | | | Current assets: | | | | | | | | | | | | Cash and cash equivalents | | $ | 152,492 | | $ | — | | $ | 152,492 | | | Restricted cash | | | 50,634 | | | — | | | 50,634 | | | Accounts receivable | | | 45,522 | | | 260 | | | 45,782 | | d | Inventory | | | 114,571 | | | — | | | 114,571 | | | Prepaid expenses and other current assets | | | 31,436 | | | — | | | 31,436 | | | Total current assets | | | 394,655 | | | 260 | | | 394,915 | | | | | | | | | | | | | | | Restricted cash | | | 180,127 | | | — | | | 180,127 | | | Property, plant, and equipment, net | | | 60,018 | | | — | | | 60,018 | | | Right of use assets related to finance leases, net | | | — | | | 2,389 | | | 2,389 | | a | Right of use assets related to operating leases, net | | | — | | | 71,789 | | | 71,789 | | a, b | Equipment related to power purchase agreements and fuel delivered to customers, net | | | 274,721 | | | (206,293) | | | 68,428 | | a, b | Goodwill | | | 70,402 | | | (140) | | | 70,262 | | d | Intangible assets, net | | | 38,574 | | | 400 | | | 38,974 | | d | Other assets | | | 11,817 | | | — | | | 11,817 | | | Total assets | | $ | 1,030,314 | | $ | (131,595) | | $ | 898,719 | | | | | | | | | | | | | | | Liabilities, Redeemable Preferred Stock, and Stockholders’ Equity | | | | | | | | | | | | Current liabilities: | | | | | | | | | | | | Accounts payable | | $ | 39,812 | | $ | — | | $ | 39,812 | | | Accrued expenses | | | 23,320 | | | 597 | | | 23,917 | | d | Deferred revenue | | | 14,902 | | | — | | | 14,902 | | | Operating lease liabilities | | | — | | | 9,453 | | | 9,453 | | a, b | Finance lease liabilities | | | — | | | 345 | | | 345 | | a | Finance obligations | | | 57,695 | | | (28,901) | | | 28,794 | | a, b | Current portion of long-term debt | | | 50,933 | | | — | | | 50,933 | | | Other current liabilities | | | 21,692 | | | (2,274) | | | 19,418 | | b, c | Total current liabilities | | | 208,354 | | | (20,780) | | | 187,574 | | | Deferred revenue | | | 25,038 | | | (190) | | | 24,848 | | d | Operating lease liabilities | | | — | | | 58,410 | | | 58,410 | | a, b | Finance lease liabilities | | | — | | | 2,465 | | | 2,465 | | a | Finance obligations | | | 300,653 | | | (169,000) | | | 131,653 | | a, b | Convertible senior notes, net | | | 142,704 | | | 185 | | | 142,889 | | d | Long-term debt | | | 101,844 | | | — | | | 101,844 | | | Other liabilities | | | 11,756 | | | 2,720 | | | 14,476 | | c | Total liabilities | | | 790,349 | | | (126,190) | | | 664,159 | | | | | | | | | | | | | | | Stockholders’ equity: | | | | | | | | | | | | Common stock, $0.01 par value per share; 750,000,000 shares authorized; Issued: 348,201,792 at June 30, 2020 | | | 3,482 | | | — | | | 3,482 | | | Additional paid-in capital | | | 1,658,532 | | | (94) | | | 1,658,438 | | d | Accumulated other comprehensive income | | | 1,271 | | | (112) | | | 1,159 | | d | Accumulated deficit | | | (1,391,961) | | | (5,199) | | | (1,397,160) | | | Less common stock in treasury | | | (31,359) | | | — | | | (31,359) | | | Total stockholders’ equity | | | 239,965 | | | (5,405) | | | 234,560 | | | Total liabilities, redeemable preferred stock, and stockholders’ equity | | $ | 1,030,314 | | $ | (131,595) | | $ | 898,719 | | |
As of June 30, 2020
(a) The "as previously reported" balances for equipment related to power purchase agreements and fuel delivered to customers, net (previously captioned leased assets, net) and the current and long-term finance obligations have been reclassified to conform to current period presentations, as follows at June 30, 2020:
| ● | $204.7 million was reclassified from equipment related to power purchase agreements and fuel delivered to customers, net to right of use assets related to operating leases, net; |
| ● | $2.4 million was reclassified from equipment related to power purchase agreements and fuel delivered to customers, net to right of use asset related to finance leases, net; |
| ● | $29.5 million was reclassified from current finance obligations to current operating lease liabilities; |
| ● | $169.0 million was reclassified from non-current finance obligations to non-current operating lease liabilities; |
| ● | $345 thousand was reclassified from current finance obligations to current finance lease liabilities; and |
| ● | $2.4 million was reclassified from non-current finance obligations to non-current finance lease liabilities. |
(b) The correction of the misstatement associated with the right of use assets relating to operating leases resulted in the following at June 30, 2020:
| ● | the right of use assets related to operating leases, net had a decrease of $132.9 million; |
| ● | equipment related to power purchase agreements and fuel delivered to customers, net had an increase of $837 thousand; |
| ● | current operating lease liabilities had a decrease of $20.1 million; |
| ● | non-current operating lease liabilities had a decrease of $110.6 million; |
| ● | the current and non current finance obligations had an increase of $898 thousand and $2.4 million, respectively; and |
| ● | other current liabilities had a decrease of $3.5 million. |
(c) Loss accrual provision: The correction of this misstatement resulted in a net increase of $1.3 million to other current liabilities and a net increase of $2.7 million to other long-term liabilities at June 30, 2020.
(d) Other adjustments: Immaterial adjustments at June 30, 2020 resulted in the following: An increase to accounts receivable of $260 thousand, a decrease to goodwill of $140 thousand, and an increase to intangible assets of $400 thousand. An increase in accrued expenses of $597 thousand, a decrease to deferred revenue of $190 thousand, an increase of $185 thousand to convertible senior notes, a decrease to additional paid in capital of $94 thousand and a decrease to accumulated other comprehensive income of $112 thousand.
| | | | | | | | | | | | | | As of March 31, 2020 | | | | | As previously | | Restatement | | | | | Restatement | | | Reported | | Adjustments | | As Restated | | References | Assets | | | | | | | | | | | | Current assets: | | | | | | | | | | | | Cash and cash equivalents | | $ | 74,340 | | $ | — | | $ | 74,340 | | | Restricted cash | | | 56,804 | | | — | | | 56,804 | | | Accounts receivable | | | 24,437 | | | 297 | | | 24,734 | | d | Inventory | | | 92,972 | | | — | | | 92,972 | | | Prepaid expenses and other current assets | | | 28,500 | | | — | | | 28,500 | | | Total current assets | | | 277,053 | | | 297 | | | 277,350 | | | | | | | | | | | | | | | Restricted cash | | | 176,070 | | | — | | | 176,070 | | | Property, plant, and equipment, net | | | 16,591 | | | — | | | 16,591 | | | Right of use assets related to finance leases, net | | | — | | | 1,707 | | | 1,707 | | a | Right of use assets related to operating leases, net | | | — | | | 64,812 | | | 64,812 | | a, b | Equipment related to power purchase agreements and fuel delivered to customers, net | | | 252,802 | | | (184,400) | | | 68,402 | | a, b | Goodwill | | | 8,673 | | | — | | | 8,673 | | | Intangible assets, net | | | 5,296 | | | 400 | | | 5,696 | | d | Other assets | | | 12,059 | | | — | | | 12,059 | | | Total assets | | $ | 748,544 | | $ | (117,184) | | $ | 631,360 | | | | | | | | | | | | | | | Liabilities, Redeemable Preferred Stock, and Stockholders’ Equity | | | | | | | | | | | | Current liabilities: | | | | | | | | | | | | Accounts payable | | $ | 35,503 | | $ | — | | $ | 35,503 | | | Accrued expenses | | | 14,273 | | | 597 | | | 14,870 | | d | Deferred revenue | | | 11,557 | | | — | | | 11,557 | | | Operating lease liabilities | | | — | | | 8,959 | | | 8,959 | | a, b | Finance lease liabilities | | | — | | | 204 | | | 204 | | a | Finance obligations | | | 52,047 | | | (25,838) | | | 26,209 | | a, b | Current portion of long-term debt | | | 27,819 | | | — | | | 27,819 | | | Other current liabilities | | | 10,423 | | | (1,977) | | | 8,446 | | b, c | Total current liabilities | | | 151,622 | | | (18,055) | | | 133,567 | | | Deferred revenue | | | 22,912 | | | (228) | | | 22,684 | | d | Operating lease liabilities | | | — | | | 52,165 | | | 52,165 | | a, b | Finance lease liabilities | | | — | | | 1,953 | | | 1,953 | | a | Finance obligations | | | 272,171 | | | (150,849) | | | 121,322 | | a, b | Convertible senior notes, net | | | 112,878 | | | 185 | | | 113,063 | | d | Long-term debt | | | 79,119 | | | — | | | 79,119 | | | Other liabilities | | | 13 | | | 2,373 | | | 2,386 | | c | Total liabilities | | | 638,715 | | | (112,456) | | | 526,259 | | | | | | | | | | | | | | | Redeemable preferred stock: | | | | | | | | | | | | Redeemable preferred stock: Series C redeemable convertible preferred stock, $0.01 par value per share (aggregate involuntary liquidation
preference $16,664); 10,431 shares authorized; Issued and outstanding: 2,620 at March 31, 2020 | | | 709 | | | — | | | 709 | | | Stockholders’ equity: | | | | | | | | | | | | Common stock, $0.01 par value per share; 750,000,000 shares authorized; Issued: 322,220,469 at March 31, 2020 | | | 3,222 | | | — | | | 3,222 | | | Additional paid-in capital | | | 1,519,257 | | | (163) | | | 1,519,094 | | d | Accumulated other comprehensive income | | | 1,164 | | | (112) | | | 1,052 | | d | Accumulated deficit | | | (1,383,299) | | | (4,453) | | | (1,387,752) | | | Less common stock in treasury | | | (31,224) | | | — | | | (31,224) | | | Total stockholders’ equity | | | 109,120 | | | (4,728) | | | 104,392 | | | Total liabilities, redeemable preferred stock, and stockholders’ equity | | $ | 748,544 | | $ | (117,184) | | $ | 631,360 | | |
As of March 31, 2020
(a) The "as previously reported" balances for equipment related to power purchase agreements and fuel delivered to customers, net (previously captioned leased assets, net) and the current and long-term finance obligations have been reclassified to conform to current period presentations, as follows at March 31, 2020:
| ● | $183.4 million was reclassified from equipment related to power purchase agreements and fuel delivered to customers, net to right of use assets related to operating leases, net; |
| ● | $1.7 million was reclassified from equipment related to power purchase agreements and fuel delivered to customers, net to right of use asset related to finance leases, net; |
| ● | $26.6 million was reclassified from current finance obligations to current operating lease liabilities; |
| ● | $151.0 million was reclassified from non-current finance obligations to non-current operating lease liabilities; |
| ● | $204 thousand was reclassified from current finance obligations to current finance lease liabilities; and |
| ● | $1.9 million was reclassified from non-current finance obligations to non-current finance lease liabilities. |
(b) The correction of the misstatement associated with the right of use assets relating to operating leases resulted in the following at March 31, 2020:
| ● | the right of use assets related to operating leases, net had a decrease of $118.6 million; |
| ● | equipment related to power purchase agreements and fuel delivered to customers, net had an increase of $725 thousand; |
| ● | current operating lease liabilities had a decrease of $17.7 million; |
| ● | non-current operating lease liabilities had a decrease of $99.0 million; |
| ● | the current finance obligations and non-current finance obligations had an increase of $1.0 million and $2.0 million, respectively; and |
| ● | other current liabilities had a decrease of $3.2 million. |
(c) Loss accrual provision: The correction of this misstatement resulted in an increase of $1.2 million to other current liabilities and an increase of $2.4 million to other long-term liabilities at March 31, 2020.
(d) Other adjustments: Immaterial adjustments at March 31, 2020 resulted in the following: An increase to accounts receivable of $297 thousand. An increase to intangible assets of $400 thousand. An increase in accrued expenses of $597 thousand, a decrease to deferred revenue of $228 thousand, an increase of $185 thousand to convertible senior notes, net, a decrease to additional paid in capital of $163 thousand and a decrease to accumulated other comprehensive income of $112 thousand.
| | | | | | | | | | | | | | As of September 30, 2019 | | | | | As previously | | Restatement | | | | | Restatement | | | Reported | | Adjustments | | As Restated | | References | Assets | | | | | | | | | | | | Current assets: | | | | | | | | | | | | Cash and cash equivalents | | $ | 43,275 | | $ | — | | $ | 43,275 | | | Restricted cash | | | 35,720 | | | — | | | 35,720 | | | Accounts receivable | | | 24,392 | | | 345 | | | 24,737 | | d | Inventory | | | 80,601 | | | — | | | 80,601 | | | Prepaid expenses and other current assets | | | 12,804 | | | — | | | 12,804 | | | Total current assets | | | 196,792 | | | 345 | | | 197,137 | | | | | | | | | | | | | | | Restricted cash | | | 119,322 | | | — | | | 119,322 | | | Property, plant, and equipment, net | | | 14,990 | | | — | | | 14,990 | | | Right of use assets related to finance leases, net | | | — | | | 1,720 | | | 1,720 | | a | Right of use assets related to operating leases, net | | | — | | | 47,016 | | | 47,016 | | a, b | Equipment related to power purchase agreements and fuel delivered to customers, net | | | 202,034 | | | (134,786) | | | 67,248 | | a, b | Goodwill | | | 8,606 | | | — | | | 8,606 | | | Intangible assets, net | | | 5,113 | | | — | | | 5,113 | | | Other assets | | | 9,152 | | | — | | | 9,152 | | | Total assets | | $ | 556,009 | | $ | (85,705) | | $ | 470,304 | | | | | | | | | | | | | | | Liabilities, Redeemable Preferred Stock, and Stockholders’ Deficit | | | | | | | | | | | | Current liabilities: | | | | | | | | | | | | Accounts payable | | $ | 36,851 | | $ | — | | $ | 36,851 | | | Accrued expenses | | | 9,457 | | | — | | | 9,457 | | | Deferred revenue | | | 11,480 | | | — | | | 11,480 | | | Operating lease liabilities | | | — | | | 8,666 | | | 8,666 | | a, b | Finance lease liabilities | | | — | | | 310 | | | 310 | | a | Finance obligations | | | 41,112 | | | (20,643) | | | 20,469 | | a, b | Current portion of long-term debt | | | 17,202 | | | — | | | 17,202 | | | Other current liabilities | | | 10,238 | | | (1,865) | | | 8,373 | | b, c | Total current liabilities | | | 126,340 | | | (13,532) | | | 112,808 | | | Deferred revenue | | | 22,444 | | | (231) | | | 22,213 | | d | Operating lease liabilities | | | — | | | 36,599 | | | 36,599 | | a, b | Finance lease liabilities | | | — | | | 2,068 | | | 2,068 | | a | Finance obligations | | | 208,465 | | | (108,796) | | | 99,669 | | a, b | Common stock warrant liability | | | 98 | | | — | | | 98 | | | Convertible senior notes, net | | | 107,760 | | | 185 | | | 107,945 | | d | Long-term debt | | | 78,840 | | | — | | | 78,840 | | | Other liabilities | | | 13 | | | 2,821 | | | 2,834 | | c | Total liabilities | | | 543,960 | | | (80,886) | | | 463,074 | | | | | | | | | | | | | | | Redeemable preferred stock, $.01 par value | | | | | | | | | | | | Series C redeemable convertible preferred stock, $0.01 par value per share 10,431 shares authorized; Issued
and outstanding: 2,620 at September 30, 2019 | | | 709 | | | — | | | 709 | | | Series E redeemable convertible preferred stock, $0.01 par value per share; Shares authorized: 35,000 at
September 30, 2019; Issued and outstanding: 28,269 at September 30, 2019 | | | 25,746 | | | — | | | 25,746 | | | Stockholders’ deficit: | | | | | | | | | | | | Common stock, $0.01 par value per share; 750,000,000 shares authorized; Issued: 253,982,578 at September 30, 2019 | | | 2,540 | | | — | | | 2,540 | | | Additional paid-in capital (1) | | | 1,340,859 | | | (78) | | | 1,340,781 | | d | Accumulated other comprehensive income | | | 929 | | | — | | | 929 | | | Accumulated deficit (1) | | | (1,327,518) | | | (4,741) | | | (1,332,259) | | | Less common stock in treasury | | | (31,216) | | | — | | | (31,216) | | | Total stockholders’ deficit | | | (14,406) | | | (4,819) | | | (19,225) | | | Total liabilities, redeemable preferred stock, and stockholders’ deficit | | $ | 556,009 | | $ | (85,705) | | $ | 470,304 | | |
(1) The "as previously reported" balances include a decrease in additional paid-in capital of $6.5 million and an increase of $6.5 million to accumulated deficit due to the impact of the adoption of ASU 2019-08 of January 1, 2019.
As of September 30, 2019
(a) The "as previously reported" balances for equipment related to power purchase agreements and fuel delivered to customers, net (previously captioned leased assets, net) and the current and long-term finance obligations have been reclassified to conform to current period presentations, as follows at September 30, 2019:
| ● | $133.7 million was reclassified from equipment related to power purchase agreements and fuel delivered to customers, net to right of use assets related to operating leases, net; |
| ● | $1.7 million was reclassified from equipment related to power purchase agreements and fuel delivered to customers, net to right of use asset related to finance leases, net; |
| ● | $21.1 million was reclassified from current finance obligations to current operating lease liabilities; |
| ● | $109.3 million was reclassified from non-current finance obligations to non-current operating lease liabilities; |
| ● | $310 thousand was reclassified from current finance obligations to current finance lease liabilities; and |
| ● | $2.1 million was reclassified from non-current finance obligations to non-current finance lease liabilities. |
(b) The correction of the misstatement associated with the right of use assets relating to operating leases resulted in the following at September 30, 2019:
| ● | the right of use assets related to operating leases, net had a decrease of $86.7 million; |
| ● | equipment related to power purchase agreements and fuel delivered to customers, net had an increase of $655 thousand; |
Notes to Consolidated Financial Statements (Continued)
| ● | current operating lease liabilities had a decrease of $12.4 million; |
| ● | non-current operating lease liabilities had a decrease of $72.7 million; |
| ● | the current and non-current finance obligations had a increase of $752 thousand and an increase $2.6 million; and |
| ● | other current liabilities had a decrease of $3.0 million. |
(c) Loss accrual provision: The correction of this misstatement resulted in a net increase of $1.2 million to other current liabilities and a net increase of $2.8 million to other long-term liabilities at September 30, 2019.
(d) Other adjustments: Immaterial adjustments at September 30, 2019 resulted in the following: Adjustments related to increases in accounts receivable of $345 thousand, decrease in deferred revenue of $231 thousand, increase in convertible senior notes of $185 thousand and decrease in additional paid in capital of $78 thousand.
| | | | | | | | | | | | | | As of June 30, 2019 | | | | | As previously | | Restatement | | | | | Restatement | | | Reported | | Adjustments | | As Restated | | References | Assets | | | | | | | | | | | | Current assets: | | | | | | | | | | | | Cash and cash equivalents | | $ | 19,845 | | $ | — | | $ | 19,845 | | | Restricted cash | | | 19,400 | | | — | | | 19,400 | | | Accounts receivable | | | 26,592 | | | 252 | | | 26,844 | | d | Inventory | | | 73,190 | | | — | | | 73,190 | | | Prepaid expenses and other current assets | | | 14,001 | | | — | | | 14,001 | | | Total current assets | | | 153,028 | | | 252 | | | 153,280 | | | | | | | | | | | | | | | Restricted cash | | | 96,082 | | | — | | | 96,082 | | | Property, plant, and equipment, net | | | 14,228 | | | — | | | 14,228 | | | Right of use assets related to finance leases, net | | | — | | | 1,726 | | | 1,726 | | a | Right of use assets related to operating leases, net | | | — | | | 39,679 | | | 39,679 | | a, b | Equipment related to power purchase agreements and fuel delivered to customers, net | | | 170,455 | | | (101,473) | | | 68,982 | | a, b | Goodwill | | | 8,961 | | | — | | | 8,961 | | | Intangible assets, net | | | 5,398 | | | — | | | 5,398 | | | Other assets | | | 8,842 | | | — | | | 8,842 | | | Total assets | | $ | 456,994 | | $ | (59,816) | | $ | 397,178 | | | | | | | | | | | | | | | Liabilities, Redeemable Preferred Stock, and Stockholders’ Deficit | | | | | | | | | | | | Current liabilities: | | | | | | | | | | | | Accounts payable | | $ | 36,946 | | $ | — | | $ | 36,946 | | | Accrued expenses | | | 4,522 | | | — | | | 4,522 | | | Deferred revenue | | | 11,730 | | | — | | | 11,730 | | | Operating lease liabilities | | | — | | | 7,512 | | | 7,512 | | a, b | Finance lease liabilities | | | — | | | 266 | | | 266 | | a | Finance obligations | | | 30,663 | | | (18,208) | | | 12,455 | | a, b | Current portion of long-term debt | | | 15,928 | | | — | | | 15,928 | | | Other current liabilities | | | 3,017 | | | 688 | | | 3,705 | | b, c | Total current liabilities | | | 102,806 | | | (9,742) | | | 93,064 | | | Deferred revenue | | | 24,519 | | | (393) | | | 24,126 | | d | Common stock warrant liability | | | 525 | | | — | | | 525 | | | Operating lease liabilities | | | — | | | 30,631 | | | 30,631 | | a, b | Finance lease liabilities | | | — | | | 2,123 | | | 2,123 | | a | Finance obligations | | | 157,531 | | | (80,615) | | | 76,916 | | a, b | Convertible senior notes, net | | | 66,844 | | | — | | | 66,844 | | | Long-term debt | | | 83,776 | | | — | | | 83,776 | | | Other liabilities | | | 13 | | | 3,320 | | | 3,333 | | c | Total liabilities | | | 436,014 | | | (54,676) | | | 381,338 | | | | | | | | | | | | | | | Redeemable preferred stock: | | | | | | | | | | | | Series C redeemable convertible preferred stock, $0.01 par value per share (aggregate involuntary liquidation
preference $16,664); 10,431 shares authorized; Issued and outstanding: 2,620 at both June 30, 2019 | | | 709 | | | — | | | 709 | | | Series E redeemable convertible preferred stock, $0.01 par value per share (aggregate involuntary liquidation
preference $35,000 at June 30, 2019); Shares authorized: 35,000 at June 30,
2019; Issued and outstanding: 35,000 at June 30, 2019 | | | 30,926 | | | — | | | 30,926 | | | Stockholders’ deficit: | | | | | | | | | | | | Common stock, $0.01 par value per share; 750,000,000 shares authorized; Issued: 246,975,173 at June 30, 2019 | | | 2,470 | | | — | | | 2,470 | | | Additional paid-in capital (1) | | | 1,325,459 | | | (78) | | | 1,325,381 | | d | Accumulated other comprehensive income | | | 1,460 | | | — | | | 1,460 | | | Accumulated deficit (1) | | | (1,309,363) | | | (5,062) | | | (1,314,425) | | | Less common stock in treasury | | | (30,681) | | | — | | | (30,681) | | | Total stockholders’ deficit | | | (10,655) | | | (5,140) | | | (15,795) | | | Total liabilities, redeemable preferred stock, and stockholders’ deficit | | $ | 456,994 | | $ | (59,816) | | $ | 397,178 | | |
(1) The "as previously reported" balances include a decrease in additional paid-in capital of $3.5 million and an increase of $3.5 million to accumulated deficit due to the impact of the adoption of ASU 2019-08 of January 1, 2019.
As of June 30, 2019
(a) The "as previously reported" balances for equipment related to power purchase agreements and fuel delivered to customers, net (previously captioned leased assets, net) and the current and long-term finance obligations have been reclassified to conform to current period presentations, as follows at June 30, 2019:
| ● | $100.3 million was reclassified from equipment related to power purchase agreements and fuel delivered to customers, net to right of use assets related to operating leases, net; |
| ● | $1.7 million was reclassified from equipment related to power purchase agreements and fuel delivered to customers, net to right of use asset related to finance leases, net; |
| ● | $16.6 million was reclassified from current finance obligations to current operating lease liabilities; |
| ● | $80.6 million was reclassified from non-current finance obligations to non-current operating lease liabilities; |
| ● | $266 thousand was reclassified from current finance obligations to current finance lease liabilities; and |
| ● | $2.1 million was reclassified from non-current finance obligations to non-current finance lease liabilities. |
(b) The correction of the misstatement associated with the right of use assets relating to operating leases resulted in the following at June 30, 2019:
| ● | the right of use assets related to operating leases, net had a decrease of $60.6 million; |
| ● | equipment related to power purchase agreements and fuel delivered to customers, net had an increase of $543 thousand; |
| ● | current operating lease liabilities had a decrease of $9.1 million; |
| ● | non-current operating lease liabilities had a decrease of $50.0 million; |
| ● | the current and non-current finance obligations had a decrease of $1.4 million and an increase of $2.2 million; and |
| ● | other current liabilities had a decrease of $464 thousand. |
(c) Loss accrual provision: The correction of this misstatement resulted in a net increase of $1.2 million to other current liabilities and a net increase of $3.3 million to other long-term liabilities at June 30, 2019.
(d) Other adjustments: Immaterial adjustments at June 30, 2019 resulted in the following: Adjustments related to increases in accounts receivable of $252 thousand, a decrease in deferred revenue of $393 thousand, and a decrease in additional paid in capital of $78 thousand.
| | | | | | | | | | | | | | As of March 31, 2019 | | | | | As previously | | Restatement | | | | | Restatement | | | Reported | | Adjustments | | As Restated | | References | Assets | | | | | | | | | | | | Current assets: | | | | | | | | | | | | Cash and cash equivalents | | $ | 39,336 | | $ | — | | $ | 39,336 | | | Restricted cash | | | 19,297 | | | — | | | 19,297 | | | Accounts receivable | | | 32,062 | | | 245 | | | 32,307 | | d | Inventory | | | 65,474 | | | — | | | 65,474 | | | Prepaid expenses and other current assets | | | 10,296 | | | — | | | 10,296 | | | Total current assets | | | 166,465 | | | 245 | | | 166,710 | | | | | | | | | | | | | | | Restricted cash | | | 50,598 | | | — | | | 50,598 | | | Property, plant, and equipment, net | | | 13,615 | | | — | | | 13,615 | | | Right of use assets related to finance leases, net | | | — | | | 1,733 | | | 1,733 | | a | Right of use assets related to operating leases, net | | | — | | | 33,599 | | | 33,599 | | a, b | Equipment related to power purchase agreements and fuel delivered to customers, net | | | 141,889 | | | (70,961) | | | 70,928 | | a, b | Goodwill | | | 8,886 | | | — | | | 8,886 | | | Intangible assets, net | | | 3,677 | | | — | | | 3,677 | | | Other assets | | | 11,069 | | | — | | | 11,069 | | | Total assets | | $ | 396,199 | | $ | (35,384) | | $ | 360,815 | | | | | | | | | | | | | | | Liabilities, Redeemable Preferred Stock, and Stockholders’ Deficit | | | | | | | | | | | | Current liabilities: | | | | | | | | | | | | Accounts payable | | $ | 31,688 | | $ | — | | $ | 31,688 | | | Accrued expenses | | | 6,509 | | | — | | | 6,509 | | | Deferred revenue | | | 11,736 | | | — | | | 11,736 | | | Operating lease liabilities | | | — | | | 7,042 | | | 7,042 | | a, b | Finance lease liabilities | | | — | | | 236 | | | 236 | | a | Finance obligations | | | 23,997 | | | (12,969) | | | 11,028 | | a, b | Current portion of long-term debt | | | 12,559 | | | — | | | 12,559 | | | Other current liabilities | | | 2,271 | | | 1,474 | | | 3,745 | | c | Total current liabilities | | | 88,760 | | | (4,217) | | | 84,543 | | | Deferred revenue | | | 25,835 | | | (469) | | | 25,366 | | d | Operating lease liabilities | | | — | | | 25,657 | | | 25,657 | | a, b | Finance lease liabilities | | | — | | | 2,142 | | | 2,142 | | a | Finance obligations | | | 111,195 | | | (56,331) | | | 54,864 | | a, b | Common stock warrant liability | | | 2,231 | | | — | | | 2,231 | | | Convertible senior notes, net | | | 65,025 | | | — | | | 65,025 | | | Long-term debt | | | 72,676 | | | — | | | 72,676 | | | Other liabilities | | | 17 | | | 3,729 | | | 3,746 | | c | Total liabilities | | | 365,739 | | | (29,489) | | | 336,250 | | | | | | | | | | | | | | | Redeemable preferred stock: | | | | | | | | | | | | Series C redeemable convertible preferred stock, $0.01 par value per share (aggregate involuntary liquidation preference $16,664); 10,431 shares authorized; Issued and outstanding: 2,620 at March 31, 2019 | | | 709 | | | — | | | 709 | | | Series E redeemable convertible preferred stock, $0.01 par value per share (aggregate involuntary liquidation
preference $35,000 at March 31, 2019); Shares authorized: 35,000 at March
31, 2019 ; Issued and outstanding: 35,000 at March 31, 2019 | | | 30,931 | | | — | | | 30,931 | | | Stockholders’ deficit: | | | | | | | | | | | | Common stock, $0.01 par value per share; 750,000,000 shares authorized; Issued:
244,537,235 at March 31, 2019 | | | 2,445 | | | — | | | 2,445 | | | Additional paid-in capital (1) | | | 1,316,893 | | | (78) | | | 1,316,815 | | d | Accumulated other comprehensive income | | | 1,374 | | | — | | | 1,374 | | | Accumulated deficit (1) | | | (1,291,255) | | | (5,817) | | | (1,297,072) | | | Less common stock in treasury | | | (30,637) | | | — | | | (30,637) | | | Total stockholders’ deficit | | | (1,180) | | | (5,895) | | | (7,075) | | | Total liabilities, redeemable preferred stock, and stockholders’ deficit | | $ | 396,199 | | $ | (35,384) | | $ | 360,815 | | |
(1) The "as previously reported" balances include a decrease in additional paid-in capital of $3.0 million and an increase of $3.0 million to accumulated deficit due to the impact of the adoption of ASU 2019-08 of January 1, 2019.
As of March 31, 2019
(a) The "as previously reported" balances for equipment related to power purchase agreements and fuel delivered to customers, net (previously captioned leased assets, net) and the current and long-term finance obligations have been reclassified to conform to current period presentations, as follows at March 31, 2019:
| ● | $69.7 million was reclassified from equipment related to power purchase agreements and fuel delivered to customers, net to right of use assets related to operating leases, net; |
| ● | $1.7 million was reclassified from equipment related to power purchase agreements and fuel delivered to customers, net to right of use asset related to finance leases, net; |
| ● | $13.1 million was reclassified from current finance obligations to current operating lease liabilities; |
| ● | $54.2 million was reclassified from non-current finance obligations to non-current operating lease liabilities; |
| ● | $236 thousand was reclassified from current finance obligations to current finance lease liabilities; and |
Notes to Consolidated Financial Statements (Continued)
| ● | $2.1 million was reclassified from non-current finance obligations to non-current finance lease liabilities. |
(b) The correction of the misstatement associated with the right of use assets relating to operating leases resulted in the following at March 31, 2019:
| ● | the right of use assets related to operating leases, net had a decrease of $36.1 million; |
| ● | equipment related to power purchase agreements and fuel delivered to customers, net had an increase of $432 thousand; |
| ● | current operating lease liabilities had a decrease of $6.1 million; |
| ● | non-current operating lease liabilities had a decrease of $28.6 million; and |
| ● | the current and non-current finance obligations had an increase of $360 thousand and $19 thousand. |
(c) Loss accrual provision: The correction of this misstatement resulted in an increase of $1.5 million to other current liabilities and an increase of $3.7 million to other long-term liabilities at March 31, 2019.
(d) Other adjustments: Immaterial adjustments at March 31, 2019 resulted in the following: Adjustments related to increases in accounts receivable of $245 thousand, a decrease in deferred revenue of $469 thousand, and decrease in additional paid in capital of $78 thousand.
The following tables present the effect of the Restatement Items, as well as other adjustments, on the Company’s unaudited interim condensed consolidated statements of operations for the periods indicated (in thousands, except per share):
| | | | | | | | | | | | | | | | | | | | | | | | For the three months ended September 30, 2020 | | | For the nine months ended September 30, 2020 | | | | | As Previously | | Restatement | | | As | | | As Previously | | Restatement | | | As | | Restatement | | | Reported | | Adjustments | | Restated | | | Reported | | Adjustments | | Restated | | References | Net revenue: | | | | | | | | | | | | | | | | | | | | | | Sales of fuel cell systems and related infrastructure | | $ | 83,528 | | $ | 134 | | $ | 83,662 | | | $ | 151,661 | | $ | 215 | | $ | 151,876 | | e | Services performed on fuel cell systems and related infrastructure | | | 6,829 | | | — | | | 6,829 | | | | 19,586 | | | — | | | 19,586 | | | Power Purchase Agreements | | | 6,704 | | | (75) | | | 6,629 | | | | 19,854 | | | (225) | | | 19,629 | | e | Fuel delivered to customers | | | 9,831 | | | — | | | 9,831 | | | | 24,536 | | | — | | | 24,536 | | | Other | | | 97 | | | — | | | 97 | | | | 235 | | | — | | | 235 | | | Net revenue | | | 106,989 | | | 59 | | | 107,048 | | | | 215,872 | | | (10) | | | 215,862 | | | Cost of revenue: | | | | | | | | | | | | | | | | | | | | | | Sales of fuel cell systems and related infrastructure | | | 68,509 | | | 919 | | | 69,428 | | | | 115,929 | | | 1,361 | | | 117,290 | | a,d,e | Services performed on fuel cell systems and related infrastructure | | | 7,074 | | | 2,106 | | | 9,180 | | | | 21,746 | | | 5,554 | | | 27,300 | | a,b,d | Provision for loss contracts related to service | | | 4,306 | | | 20,841 | | | 25,147 | | | | 4,306 | | | 21,642 | | | 25,948 | | b | Power Purchase Agreements | | | 14,087 | | | 657 | | | 14,744 | | | | 42,034 | | | 1,985 | | | 44,019 | | a,c,e | Fuel delivered to customers | | | 14,172 | | | 2,830 | | | 17,002 | | | | 32,267 | | | 7,065 | | | 39,332 | | a,d | Other | | | 131 | | | — | | | 131 | | | | 275 | | | — | | | 275 | | | Total cost of revenue | | | 108,279 | | | 27,353 | | | 135,632 | | | | 216,557 | | | 37,607 | | | 254,164 | | | | | | | | | | | | | | | | | | | | | | | | | Gross loss | | | (1,290) | | | (27,294) | | | (28,584) | | | | (685) | | | (37,617) | | | (38,302) | | | | | | | | | | | | | | | | | | | | | | | | | Operating expenses: | | | | | | | | | | | | | | | | | | | | | | Research and development | | | 11,964 | | | (4,578) | | | 7,386 | | | | 32,133 | | | (15,100) | | | 17,033 | | a,d | Selling, general and administrative | | | 14,277 | | | 2,933 | | | 17,210 | | | | 46,948 | | | 3,015 | | | 49,963 | | c,d | Change in fair value of contingent consideration | | | — | | | 1,130 | | | 1,130 | | | | — | | | 1,130 | | | 1,130 | | f | Total operating expenses | | | 26,241 | | | (515) | | | 25,726 | | | | 79,081 | | | (10,955) | | | 68,126 | | | | | | | | | | | | | | | | | | | | | | | | | Operating loss | | | (27,531) | | | (26,779) | | | (54,310) | | | | (79,766) | | | (26,662) | | | (106,428) | | | | | | | | | | | | | | | | | | | | | | | | | Interest and other expense, net | | | (17,241) | | | (310) | | | (17,551) | | | | (42,022) | | | (837) | | | (42,859) | | c | Change in fair value of contingent consideration | | | (1,130) | | | 1,130 | | | — | | | | (1,130) | | | 1,130 | | | — | | f | Gain on extinguishment of debt | | | — | | | — | | | — | | | | 13,222 | | | — | | | 13,222 | | | | | | | | | | | | | | | | | | | | | | | | | Loss before income taxes | | $ | (45,902) | | $ | (25,959) | | $ | (71,861) | | | $ | (109,696) | | $ | (26,369) | | $ | (136,065) | | | | | | | | | | | | | | | | | | | | | | | | | Income tax benefit | | | 6,523 | | | 121 | | | 6,644 | | | | 24,182 | | | (167) | | | 24,015 | | e | | | | | | | | | | | | | | | | | | | | | | | Net loss attributable to the Company | | $ | (39,379) | | $ | (25,838) | | $ | (65,217) | | | $ | (85,514) | | $ | (26,536) | | $ | (112,050) | | | | | | | | | | | | | | | | | | | | | | | | | Preferred stock dividends declared, deemed dividends and accretion of discount | | | — | | | — | | | — | | | | (19) | | | (7) | | | (26) | | e | | | | | | | | | | | | | | | | | | | | | | | Net loss attributable to common shareholders | | $ | (39,379) | | $ | (25,838) | | $ | (65,217) | | | $ | (85,533) | | $ | (26,543) | | $ | (112,076) | | | | | | | | | | | | | | | | | | | | | | | | | Net loss per share: | | | | | | | | | | | | | | | | | | | | | | Basic and diluted | | $ | (0.11) | | | | | $ | (0.18) | | | $ | (0.26) | | | | | $ | (0.34) | | | | | | | | | | | | | | | | | | | | | | | | | Weighted average number of common shares outstanding | | | 371,010,544 | | | | | | 371,010,544 | | | | 330,949,265 | | | | | | 330,949,265 | | |
For the three months ended September 30, 2020
| (a) | Research and development: The correction of this misstatement resulted in a net decrease of $5.5 million to research and development, and an increase of $232 thousand to the cost of sales of fuel cell systems and related infrastructure, an increase of $1.5 million to the cost of service performed on fuel cell systems and related infrastructure, an increase of $955 thousand to the cost of Power Purchase Agreements and an increase in the cost of fuel delivered to customers of $2.8 million for the three months ended September 30, 2020. |
| (b) | Provision for loss contracts related to service: The correction of this misstatement resulted in a net increase of $20.8 million to the provision for loss contracts and a $315 thousand decrease in the cost of services performed on fuel cell systems and related infrastructure for the three months ended September 30, 2020. |
| (c) | Right of use asset: The correction of this misstatement resulted in a net decrease of $280 thousand to the cost of Power Purchase Agreements and a net decrease of $56 thousand to selling, general and administrative expenses, and net increase in interest and other expense of $310 thousand for the three months ended September 30, 2020. |
| (d) | Bonus Accrual: Adjustments related to the under accrual for bonus expenses resulted in an increase in cost of sales of fuel cell systems and related infrastructure of $584 thousand, increase in cost of services performed on fuel cell systems and related infrastructure of $930 thousand, increase in cost of fuel delivered to customers of $56 thousand, an increase in research and development expense of $872 thousand, and an increase in selling and general administration expenses of $2.9 million for the three months ended September 30, 2020. |
| (e) | Other adjustments: Immaterial adjustments for the three months ended September 30, 2020 resulted in a net increase of $134 thousand to revenue from the sales of fuel cell and systems and related infrastructure, a net decrease of $75 thousand in revenue from Power Purchase Agreements and a net decrease of $18 thousand in cost of revenue related to Power Purchase Agreements, an increase of $103 thousand in the cost of revenue related to the sales of fuel cell systems and related infrastructure and an increase to the income tax benefit of $121 thousand. |
| (f) | Contingent Consideration: The correction of this misstatement resulted in a reclassification of $1.1 million to operating expenses. |
For the nine months ended September 30, 2020
| (a) | Research and development: The correction of this misstatement resulted in a net decrease of $15.9 million to research and development, and an increase of $674 thousand to the cost of sales of fuel cell systems and related infrastructure, an increase of $5.5 million to the cost of service performed on fuel cell systems and related infrastructure, and increase of $2.8 million to the cost of Power Purchase Agreements and an increase in the cost of fuel delivered to customer of $7 million for the nine months ended September 30 2020. |
| (b) | Provision for loss contracts related to service: The correction of this misstatement resulted in a net increase of $21.6 million to the provision for loss contracts and a $839 thousand decrease in the cost of services performed on fuel cell systems and related infrastructure for the nine months ended September 30, 2020. |
| (c) | Right of use asset: The correction of this misstatement resulted in a net decrease of $788 thousand to the cost of Power Purchase Agreements and a net decrease of $138 thousand to selling, general and administrative expenses, and a net increase of $837 thousand in interest and other expenses for the nine months ended September 30, 2020. |
| (d) | Bonus Accrual: Adjustments related to the under accrual for bonus expenses resulted in an increase in cost of sales of fuel cell systems and related infrastructure of $584 thousand, increase in cost of services performed on fuel cell systems and related infrastructure of $931 thousand, increase in cost of fuel delivered to customers of $56 thousand, an increase in research and development expense of $872 thousand, and an increase in selling and general administration expenses of $2.9 million for the nine months ended September 30, 2020. |
| (e) | Other adjustments: Immaterial adjustments for the nine months ended September 30, 2020 resulted in a net increase of $215 thousand to revenue from the sales of fuel cell and systems and related infrastructure a net decrease of $225 thousand in revenue from power purchase agreements and a net decrease of $54 thousand in cost of revenue related to Power Purchase Agreements, an increase of $103 thousand in the cost of revenue related to the sales of fuel cell systems and related infrastructure, a decrease to the income tax benefit of $167 thousand and an increase in preferred stock dividends declared, deemed dividends and accretion of discount of $7 thousand. |
| (f) | Contingent Consideration: The correction of this misstatement resulted in a reclassification of $1.1 million to operating expenses. |
| | | | | | | | | | | | | | | | | | | | | | | For the three months ended June 30, 2020 | | For the six months ended June 30, 2020 | | | | | As Previously | | Restatement | | | As | | As Previously | | Restatement | | | As | | Restatement | | | Reported | | Adjustments | | Restated | | Reported | | Adjustments | | Restated | | References | Net revenue: | | | | | | | | | | | | | | | | | | | | | Sales of fuel cell systems and related infrastructure | | $ | 47,746 | | $ | — | | $ | 47,746 | | $ | 68,133 | | $ | 81 | | $ | 68,214 | | d | Services performed on fuel cell systems and related infrastructure | | | 6,236 | | | — | | | 6,236 | | | 12,757 | | | — | | | 12,757 | | | Power Purchase Agreements | | | 6,654 | | | (75) | | | 6,579 | | | 13,150 | | | (150) | | | 13,000 | | d | Fuel delivered to customers | | | 7,372 | | | — | | | 7,372 | | | 14,705 | | | — | | | 14,705 | | | Other | | | 62 | | | — | | | 62 | | | 138 | | | — | | | 138 | | | Net revenue | | | 68,070 | | | (75) | | | 67,995 | | | 108,883 | | | (69) | | | 108,814 | | | Cost of revenue: | | | | | | | | | | | | | | | | | | | | | Sales of fuel cell systems and related infrastructure | | | 33,676 | | | 212 | | | 33,888 | | | 47,420 | | | 442 | | | 47,862 | | a | Services performed on fuel cell systems and related infrastructure | | | 6,491 | | | 1,282 | | | 7,773 | | | 14,672 | | | 3,448 | | | 18,120 | | a,b | Provision for loss contracts related to service | | | — | | | 706 | | | 706 | | | — | | | 801 | | | 801 | | b | Power Purchase Agreements | | | 13,704 | | | 800 | | | 14,504 | | | 27,947 | | | 1,328 | | | 29,275 | | a, c, d | Fuel delivered to customers | | | 9,060 | | | 2,016 | | | 11,076 | | | 18,095 | | | 4,235 | | | 22,330 | | a | Other | | | 63 | | | — | | | 63 | | | 144 | | | — | | | 144 | | | Total cost of revenue | | | 62,994 | | | 5,016 | | | 68,010 | | | 108,278 | | | 10,254 | | | 118,532 | | | | | | | | | | | | | | | | | | | | | | | | Gross (loss) profit | | | 5,076 | | | (5,091) | | | (15) | | | 605 | | | (10,323) | | | (9,718) | | | | | | | | | | | | | | | | | | | | | | | | Operating expenses: | | | | | | | | | | | | | | | | | | | | | Research and development | | | 9,757 | | | (4,884) | | | 4,873 | | | 20,169 | | | (10,522) | | | 9,647 | | a | Selling, general and administrative | | | 21,658 | | | (14) | | | 21,644 | | | 32,671 | | | 82 | | | 32,753 | | c | Total operating expenses | | | 31,415 | | | (4,898) | | | 26,517 | | | 52,840 | | | (10,440) | | | 42,400 | | | | | | | | | | | | | | | | | | | | | | | | | | | | | | | | | | | | | | | | | | | | | Operating loss | | | (26,339) | | | (193) | | | (26,532) | | | (52,235) | | | 117 | | | (52,118) | | | | | | | | | | | | | | | | | | | | | | | | Interest and other expense, net | | | (13,198) | | | (264) | | | (13,462) | | | (24,781) | | | (527) | | | (25,308) | | c | Gain on extinguishment of debt | | | 13,222 | | | — | | | 13,222 | | | 13,222 | | | — | | | 13,222 | | | | | | | | | | | | | | | | | | | | | | | | Loss before income taxes | | $ | (26,315) | | $ | (457) | | $ | (26,772) | | $ | (63,794) | | $ | (410) | | $ | (64,204) | | | | | | | | | | | | | | | | | | | | | | | | Income tax benefit | | | 17,659 | | | (288) | | | 17,371 | | | 17,659 | | | (288) | | | 17,371 | | d | | | | | | | | | | | | | | | | | | | | | | Net loss attributable to the Company | | $ | (8,656) | | $ | (745) | | $ | (9,401) | | $ | (46,135) | | $ | (698) | | $ | (46,833) | | | | | | | | | | | | | | | | | | | | | | | | Preferred stock dividends declared, deemed dividends and accretion of discount | | | (13) | | | — | | | (13) | | | (19) | | | (7) | | | (26) | | d | | | | | | | | | | | | | | | | | | | | | | Net loss attributable to common stockholders | | $ | (8,669) | | $ | (745) | | $ | (9,414) | | $ | (46,154) | | $ | (705) | | $ | (46,859) | | | | | | | | | | | | | | | | | | | | | | | | Net loss per share: | | | | | | | | | | | | | | | | | | | | | Basic and diluted | | $ | (0.03) | | | | | $ | (0.03) | | $ | (0.15) | | | | | $ | (0.15) | | | | | | | | | | | | | | | | | | | | | | | | Weighted average number of common shares outstanding | | | 316,645,050 | | | | | | 316,645,050 | | | 310,918,626 | | | | | | 310,918,626 | | |
For the three months ended June 30, 2020
| (a) | Research and development: The correction of this misstatement resulted in a net decrease of $ 4.9 million to research and development, and an increase of $212 thousand to the cost of sales of fuel cell systems and related infrastructure, an increase of $1.6 million to the cost of service performed on fuel cell systems and related infrastructure, an increase of $1.1 million to the cost of Power Purchase Agreements and an increase in the cost of fuel delivered to customers of $2.0 million for the three months ended June 30, 2020. |
| (b) | Provision for loss contracts related to service: The correction of this misstatement resulted in a net increase of $706 thousand to the provision for loss contracts and a $315 thousand decrease in the cost of services performed on fuel cell systems and related infrastructure for the three months ended June 30, 2020. |
| (c) | Right of use asset: The correction of this misstatement resulted in a net decrease of $255 thousand to the cost of Power Purchase Agreements and a net decrease of $14 thousand to selling, general and administrative expenses, and a net increase to interest and other expenses of $264 thousand for the three months ended June 30, 2020. |
| (d) | Other adjustments: Immaterial adjustments for the three months ended June 30, 2020 resulted in a net decrease of $75 thousand from revenue from Power Purchase Agreements, a net decrease of $18 thousand in the cost of Power Purchase Agreements and a net decrease of $288 thousand in income tax benefit. |
For the six months ended June 30, 2020
| (a) | Research and development: The correction of this misstatement resulted in a net decrease of $10.5 million to research and development, and an increase of $442 thousand to the cost of sales of fuel cell systems and related infrastructure, an increase of $4.0 million to the cost of service performed on fuel cell systems and related infrastructure, an increase of $1.9 million to the cost of Power Purchase Agreements and an increase in the cost of fuel delivered to customers of $4.2 million for the six months ended June 30, 2020. |
| (b) | Provision for loss contracts related to service: The correction of this misstatement resulted in a net increase of $801 thousand to the provision for loss contracts and a $524 thousand decrease in the cost of services performed on fuel cell systems and related infrastructure for the six months ended June 30, 2020. |
| (c) | Right of use asset: The correction of this misstatement resulted in a net decrease of $508 thousand to the cost of Power Purchase Agreements, a net increase of $82 thousand to selling, general and administrative expenses and a net increase of $527 thousand to interest and other expenses for the six months ended June 30, 2020. |
| (d) | Other adjustments: Immaterial adjustments for the six months ended June 30, 2020 resulted in a net increase of $81 thousand to revenue from the sales of fuel cell and systems and related infrastructure, a net decrease of $150 thousand in revenue from Power Purchase Agreements, a net decrease of $36 thousand in cost of revenue related to Power Purchase Agreements and a decrease to the income tax benefit of $288 thousand. A net decrease of $7 thousand related to preferred stock dividends. |
��
| | | | | | | | | | | | | | For the three months ended March 31, 2020 | | | | | As Previously | | Restatement | | | | | Restatement | | | Reported | | Adjustments | | As Restated | | References | Net revenue: | | | | | | | | | | | | Sales of fuel cell systems and related infrastructure | | $ | 20,387 | | $ | 81 | | $ | 20,468 | | d | Services performed on fuel cell systems and related infrastructure | | | 6,521 | | | — | | | 6,521 | | | Power Purchase Agreements | | | 6,496 | | | (75) | | | 6,421 | | d | Fuel delivered to customers | | | 7,333 | | | — | | | 7,333 | | | Other | | | 76 | | | — | | | 76 | | | Net revenue | | | 40,813 | | | 6 | | | 40,819 | | | Cost of revenue: | | | | | | | | | | | | Sales of fuel cell systems and related infrastructure | | | 13,744 | | | 230 | | | 13,974 | | a | Services performed on fuel cell systems and related infrastructure | | | 8,181 | | | 2,166 | | | 10,347 | | a,b | Provision for loss contracts related to service | | | — | | | 95 | | | 95 | | b | Power Purchase Agreements | | | 14,243 | | | 528 | | | 14,771 | | a,c,d | Fuel delivered to customers | | | 9,035 | | | 2,219 | | | 11,254 | | a | Other | | | 81 | | | — | | | 81 | | | Total cost of revenue | | | 45,284 | | | 5,238 | | | 50,522 | | | | | | | | | | | | | | | Gross loss | | | (4,471) | | | (5,232) | | | (9,703) | | | | | | | | | | | | | | | Operating expenses: | | | | | | | | | | | | Research and development | | | 10,412 | | | (5,638) | | | 4,774 | | a | Selling, general and administrative | | | 11,013 | | | 96 | | | 11,109 | | c | Total operating expenses | | | 21,425 | | | (5,542) | | | 15,883 | | | | | | | | | | | | | | | Operating loss | | | (25,896) | | | 310 | | | (25,586) | | | | | | | | | | | | | | | Interest and other expense, net | | | (11,583) | | | (263) | | | (11,846) | | c | Gain (loss) on extinguishment of debt | | | — | | | — | | | — | | | Loss before income taxes | | $ | (37,479) | | $ | 47 | | $ | (37,432) | | | | | | | | | | | | | | | Income tax benefit | | | — | | | — | | | — | | | | | | | | | | | | | | | Net loss attributable to the Company | | $ | (37,479) | | $ | 47 | | $ | (37,432) | | | | | | | | | | | | | | | Preferred stock dividends declared, deemed dividends and accretion of discount | | | (13) | | | — | | | (13) | | | | | | | | | | | | | | | Net loss attributable to common stockholders | | $ | (37,492) | | $ | 47 | | $ | (37,445) | | | | | | | | | | | | | | | Net loss per share: | | | | | | | | | | | | Basic and diluted | | $ | (0.12) | | | | | $ | (0.12) | | | | | | | | | | | | | | | Weighted average number of common shares outstanding | | | 305,192,201 | | | | | | 305,192,201 | | |
For the three months ended March 31, 2020
| a) | Research and development: The correction of this misstatement resulted in a net decrease of $5.6 million to research and development, and an increase of $230 thousand to the cost of sales of fuel cell systems and related infrastructure, an increase of $2.4 million to the cost of service performed on fuel cell systems and related infrastructure, and increase of $799 thousand to the cost of Power Purchase Agreements and an increase in the cost of fuel delivered to customer of $2.2 million for the three months ended March 31, 2020. |
| b) | Provision for loss contracts related to service: The correction of this misstatement resulted in a net increase of $95 thousand to the provision for loss contracts and a net decrease of $224 thousand in the costs of services performed on fuel cell systems and related infrastructure for the three months ended March 31, 2020. |
| c) | Right of use asset: The correction of this misstatement resulted in a net decrease of $253 to the cost of power purchase agreements, a net increase of $96 thousand to selling, general and administrative expenses, and a net increase in interest and other expenses of $262 thousand for the three months ended March 31, 2020. |
| d) | Other adjustments: Immaterial adjustments for the three months ended June 30, 2020 resulted in a net decrease of $75 thousand from revenue from Power Purchase Agreements and a net increase of $81 thousand from revenue related to fuel cell systems and related infrastructure. |
| | | | | | | | | | | | | | | For the three months ended December 31, 2019 | | | | | | As Previously | | Restatement | | | As | | Restatement | | | | Reported | | Adjustments | | Restated | | References | | Net revenue: | | | | | | | | | | | | | Sales of fuel cell systems and related infrastructure | | $ | 69,767 | | $ | 18 | | $ | 69,785 | | e | | Services performed on fuel cell systems and related infrastructure | | | 7,328 | | | — | | | 7,328 | | | | Power Purchase Agreements | | | 6,739 | | | (75) | | | 6,664 | | e | | Fuel delivered to customers | | | 7,779 | | | — | | | 7,779 | | | | Other | | | 51 | | | — | | | 51 | | | | Net revenue | | | 91,664 | | | (57) | | | 91,607 | | | | Cost of revenue: | | | | | | | | | | | | | Sales of fuel cell systems and related infrastructure | | | 46,419 | | | 672 | | | 47,091 | | a, e | | Services performed on fuel cell systems and related infrastructure | | | 9,999 | | | 1,607 | | | 11,606 | | a, b, e | | Provision for loss contracts related to service | | | — | | | 13 | | | 13 | | b | | Power Purchase Agreements | | | 11,992 | | | 309 | | | 12,301 | | a, e | | Fuel delivered to customers | | | 10,422 | | | 2,378 | | | 12,800 | | a, e | | Other | | | 50 | | | — | | | 50 | | | | Total cost of revenue | | | 78,882 | | | 4,979 | | | 83,861 | | | | | | | | | | | | | | | | | Gross loss | | | 12,782 | | | (5,036) | | | 7,746 | | | | | | | | | | | | | | | | | Operating expenses: | | | | | | | | | | | | | Research and development | | | 9,341 | | | (4,459) | | | 4,882 | | a, e | | Selling, general and administrative | | | 10,982 | | | (1,009) | | | 9,973 | | e | | Total operating expenses | | | 20,323 | | | (5,468) | | | 14,855 | | | | | | | | | | | | | | | | | Operating loss | | | (7,541) | | | 432 | | | (7,109) | | | | | | | | | | | | | | | | | Interest and other expense, net | | | (10,806) | | | (193) | | | (10,999) | | d | | Change in fair value of common stock warrant liability | | | 72 | | | — | | | 72 | | | | | | | | | | | | | | | | | Loss before income taxes | | $ | (18,275) | | $ | 239 | | $ | (18,036) | | | | | | | | | | | | | | | | | Income tax benefit | | | — | | | — | | | — | | | | | | | | | | | | | | | | | Net loss attributable to the Company | | $ | (18,275) | | $ | 239 | | $ | (18,036) | | | | | | | | | | | | | | | | | Preferred stock dividends declared, deemed dividends and accretion of discount | | | (13) | | | (1,228) | | | (1,241) | | f | | | | | | | | | | | | | | | Net loss attributable to common shareholders | | $ | (18,288) | | $ | (989) | | $ | (19,277) | | | | | | | | | | | | | | | | | Net loss per share: | | | | | | | | | | | | | Basic and diluted | | $ | (0.07) | | | | | $ | (0.07) | | | | | | | | | | | | | | | | | Weighted average number of common shares outstanding | | | 260,053,150 | | | | | | 260,053,150 | | | |
For the three months ended December 31, 2019
| (a) | Research and development: The correction of this misstatement resulted in a net decrease of $5.3 million to research and development, an increase of $585 thousand to the cost of sales of fuel cell systems and related infrastructure, an increase of $1.9 million to the costs of services performed on fuel cell systems and related infrastructure, an increase in cost of Power Purchase Agreements of $564 thousand and an increase in the cost of fuel delivered to customers of $2.3 million for the three months ended December 31, 2019. |
| (b) | Provision for loss contracts related to service: The correction of this misstatement resulted in an increase of $13 thousand to the provision for loss contracts related to service and a decrease of $289 thousand to costs of services performed on fuel cell systems and related infrastructure for the three months ended December 31, 2019. |
| (c) | Right of use asset: The correction of the misstatement resulted in net decrease of $237 thousand of costs related to Power Purchase Agreements for the three months ended December 31, 2019. |
| (d) | Interest Expense: The correction of this misstatement resulted in an increase of $193 thousand to interest and other expense, net for the three months ended December 31, 2019. |
| (e) | Other adjustments: Immaterial adjustments for the three months ended December 31, 2019 resulted in the following: Adjustments related to an increase in sales of fuel cells and related infrastructure of $18 thousand, an increase $87 thousand in cost of revenue for sales of fuel cell systems and related infrastructure, an increase of $44 thousand in cost of services performed on fuel cells and related infrastructure, a decrease in sales related to Power Purchase Agreements of $75 thousand, a decrease in cost of Power Purchase Agreements of $18 thousand, an increase of $44 thousand in cost of fuel delivered to customers, anincrease of $876 thousand in research and development expenses and a decrease of $1.0 million in selling general and administrative costs. |
| (f) | Series E redeemable convertible preferred stock deemed dividend: The correction of this misstatement resulted in a net increase of $1.3 million to preferred stock dividends declared, deemed dividends and accretion of discount. |
| | | | | | | | | | | | | | | | | | | | | | | | For the three months ended September 30, 2019 | | | For the nine months ended September 30, 2019 | | | | | As Previously | | Restatement | | | As | | | As Previously | | Restatement | | | As | | Restatement | | | Reported | | Adjustments | | Restated | | | Reported | | Adjustments | | Restated | | References | Net revenue: | | | | | | | | | | | | | | | | | | | | | | Sales of fuel cell systems and related infrastructure | | $ | 38,877 | | $ | 6 | | $ | 38,883 | | | $ | 80,117 | | $ | 18 | | $ | 80,135 | | e | Services performed on fuel cell systems and related infrastructure | | | 6,205 | | | — | | | 6,205 | | | | 17,889 | | | — | | | 17,889 | | | Power Purchase Agreements | | | 6,595 | | | (75) | | | 6,520 | | | | 19,114 | | | (225) | | | 18,889 | | e | Fuel delivered to customers | | | 7,649 | | | — | | | 7,649 | | | | 21,320 | | | — | | | 21,320 | | | Other | | | 135 | | | — | | | 135 | | | | 135 | | | — | | | 135 | | | Net revenue | | | 59,461 | | | (69) | | | 59,392 | | | | 138,575 | | | (207) | | | 138,368 | | | Cost of revenue: | | | | | | | | | | | | | | | | | | | | | | Sales of fuel cell systems and related infrastructure | | | 24,990 | | | 193 | | | 25,183 | | | | 50,440 | | | 384 | | | 50,824 | | a | Services performed on fuel cell systems and related infrastructure | | | 6,461 | | | 1,341 | | | 7,802 | | | | 18,802 | | | 4,174 | | | 22,976 | | a, b | Provision (benefit) for loss contracts related to service | | | — | | | (206) | | | (206) | | | | — | | | (407) | | | (407) | | b | Power Purchase Agreements | | | 10,353 | | | 461 | | | 10,814 | | | | 28,064 | | | 1,412 | | | 29,476 | | a, c, e | Fuel delivered to customers | | | 9,160 | | | 1,989 | | | 11,149 | | | | 25,935 | | | 6,512 | | | 32,447 | | a | Other | | | 150 | | | — | | | 150 | | | | 150 | | | — | | | 150 | | | Total cost of revenue | | | 51,114 | | | 3,778 | | | 54,892 | | | | 123,391 | | | 12,075 | | | 135,466 | | | | | | | | | | | | | | | | | | | | | | | | | Gross profit | | | 8,347 | | | (3,847) | | | 4,500 | | | | 15,184 | | | (12,282) | | | 2,902 | | | | | | | | | | | | | | | | | | | | | | | | | Operating expenses: | | | | | | | | | | | | | | | | | | | | | | Research and development | | | 8,028 | | | (4,465) | | | 3,563 | | | | 24,334 | | | (14,157) | | | 10,177 | | a | Selling, general and administrative | | | 10,400 | | | (5) | | | 10,395 | | | | 33,351 | | | (122) | | | 33,229 | | c | Total operating expenses | | | 18,428 | | | (4,470) | | | 13,958 | | | | 57,685 | | | (14,279) | | | 43,406 | | | | | | | | | | | | | | | | | | | | | | | | | Operating loss | | | (10,081) | | | 623 | | | (9,458) | | | | (42,501) | | | 1,997 | | | (40,504) | | | | | | | | | | | | | | | | | | | | | | | | | Interest and other expense, net | | | (7,972) | | | (301) | | | (8,273) | | | | (24,178) | | | (514) | | | (24,692) | | d | Change in fair value of common stock warrant liability | | | 427 | | | — | | | 427 | | | | 7 | | | — | | | 7 | | | Loss on extinguishment of debt | | | (518) | | | — | | | (518) | | | | (518) | | | — | | | (518) | | | | | | | | | | | | | | | | | | | | | | | | | Loss before income taxes | | $ | (18,144) | | $ | 322 | | $ | (17,822) | | | $ | (67,190) | | $ | 1,483 | | $ | (65,707) | | | | | | | | | | | | | | | | | | | | | | | | | Income tax benefit | | | — | | | — | | | — | | | | — | | | — | | | — | | | | | | | | | | | | | | | | | | | | | | | | | Net loss attributable to the Company | | $ | (18,144) | | $ | 322 | | $ | (17,822) | | | $ | (67,190) | | $ | 1,483 | | $ | (65,707) | | | | | | | | | | | | | | | | | | | | | | | | | Preferred stock dividends declared, deemed dividends and accretion of discount | | | (13) | | | (531) | | | (544) | | | | (39) | | | (531) | | | (570) | | f | | | | | | | | | | | | | | | | | | | | | | | Net loss attributable to common shareholders | | $ | (18,157) | | $ | (209) | | $ | (18,366) | | | $ | (67,229) | | $ | 952 | | $ | (66,277) | | | | | | | | | | | | | | | | | | | | | | | | | Net loss per share: | | | | | | | | | | | | | | | | | | | | | | Basic and diluted | | $ | (0.08) | | | | | $ | (0.08) | | | $ | (0.29) | | | | | $ | (0.29) | | | | | | | | | | | | | | | | | | | | | | | | | Weighted average number of common shares outstanding | | | 236,759,521 | | | | | | 236,759,521 | | | | 229,519,323 | | | | | | 229,519,323 | | |
For the three months ended September 30, 2019
| (a) | Research and development: The correction of this misstatement resulted in a net decrease of $4.5 million to research and development, and an increase of $193 thousand to the cost of sales of fuel cell systems and related infrastructure, an increase of $1.6 million to the cost of service performed on fuel cell systems and related infrastructure, an increase in cost of Power Purchase Agreements of $654 thousand and an increase in the cost of fuel delivered to customers of $2.0 million for the three months ended September 30, 2019. |
| (b) | Provision for loss contracts related to service: The correction of this misstatement resulted in benefit of $206 thousand to the provision for loss contracts related to service and a decrease of $288 thousand to costs of services performed on fuel cell systems and related infrastructure for the three months ended September 30, 2019. |
| (c) | Right of use asset: The correction of the misstatement resulted in net decrease of $175 thousand of cost related to power purchase agreements and a decrease of $5 thousand in selling general and administrative expenses for the three months ended September 30, 2019. |
| (d) | Interest Expense: The correction of this misstatement resulted in an increase of $301 thousand to interest and other expense, net for the three months ended September 30, 2019. |
| (e) | Other adjustments: Immaterial adjustments for the three months ended September 30, 2019 resulted in the following: Adjustments related to an increase in sales of fuel cells and related infrastructure of $6 thousand, a decrease in sales related to Power Purchase Agreements of $75 thousand and a decrease in cost of Power Purchase Agreements of $18 thousand. |
| (f) | Series E redeemable convertible preferred stock deemed dividend: The correction of this misstatement resulted in a net increase of $531 thousand to preferred stock dividends declared, deemed dividends and accretion of discount. |
For the nine months ended September 30, 2019
| (a) | Research and development: The correction of this misstatement resulted in a net decrease of $14.2 million to research and development, an increase of $384 thousand to the cost of sales of fuel cell systems and related infrastructure, an increase of $5.1 million to the costs of services performed on fuel cell systems and related infrastructure, increase in cost of Power Purchase Agreements of $2.0 million and an increase in the cost of fuel delivered to customers of $6.5 million for the nine months ended September 30, 2019. |
| (b) | Provision for loss contracts related to service: The correction of this misstatement resulted in benefit of $407 thousand to the provision for loss contracts related to service and a decrease of $960 thousand to costs of service performed on fuel cell systems and related infrastructure for the nine months ended September 30, 2019. |
| (c) | Right of use asset: The correction of the misstatement resulted in a net decrease of $150 thousand of costs related to power purchase agreements and a decrease of $122 thousand in selling general and administrative expenses for the nine months ended September 30, 2019. |
| (d) | Interest Expense: The correction of this misstatement resulted in increase of of $514 thousand to interest and other expense, net for the nine months ended September 30, 2019. |
| (e) | Other adjustments: Immaterial adjustments for the nine months ended September 30, 2019 resulted in the following: Adjustments related to an increase in sales of fuel cells and related infrastructure of $18 thousand, a decrease in sales related to Power Purchase Agreements of $225 thousand and a decrease in cost of Power Purchase Agreements of $53 thousand. |
| (f) | Series E redeemable convertible preferred stock deemed dividend: The correction of this misstatement resulted in a net increase of $531 thousand to preferred stock dividends declared, deemed dividends and accretion of discount. |
| | | | | | | | | | | | | | | | | | | | | | | | For the three months ended June 30, 2019 | | | For the six months ended June 30, 2019 | | | | | As Previously | | Restatement | | | As | | | As Previously | | Restatement | | | As | | Restatement | | | Reported | | Adjustments | | Restated | | | Reported | | Adjustments | | Restated | | References | Net revenue: | | | | | | | | | | | | | | | | | | | | | | Sales of fuel cell systems and related infrastructure | | $ | 38,696 | | $ | 6 | | $ | 38,702 | | | $ | 41,240 | | $ | 12 | | $ | 41,252 | | e | Services performed on fuel cell systems and related infrastructure | | | 5,341 | | | — | | | 5,341 | | | | 11,684 | | | — | | | 11,684 | | | Power Purchase Agreements | | | 6,409 | | | (75) | | | 6,334 | | | | 12,519 | | | (150) | | | 12,369 | | e | Fuel delivered to customers | | | 7,089 | | | — | | | 7,089 | | | | 13,671 | | | — | | | 13,671 | | | Other | | | — | | | — | | | — | | | | — | | | — | | | — | | | Net revenue | | | 57,535 | | | (69) | | | 57,466 | | | | 79,114 | | | (138) | | | 78,976 | | | Cost of revenue: | | | | | | | | | | | | | | | | | | | | | | Sales of fuel cell systems and related infrastructure | | | 23,129 | | | 200 | | | 23,329 | | | | 25,450 | | | 191 | | | 25,641 | | a, e | Services performed on fuel cell systems and related infrastructure | | | 6,218 | | | 2,165 | | | 8,383 | | | | 12,341 | | | 2,833 | | | 15,174 | | a, b | Provision (benefit) for loss contracts related to service | | | — | | | (363) | | | (363) | | | | — | | | (201) | | | (201) | | b | Power Purchase Agreements | | | 8,713 | | | 116 | | | 8,829 | | | | 17,711 | | | 951 | | | 18,662 | | a, e | Fuel delivered to customers | | | 8,854 | | | 2,292 | | | 11,146 | | | | 16,775 | | | 4,523 | | | 21,298 | | a | Total cost of revenue | | | 46,914 | | | 4,410 | | | 51,324 | | | | 72,277 | | | 8,297 | | | 80,574 | | | | | | | | | | | | | | | | | | | | | | | | | Gross loss | | | 10,621 | | | (4,479) | | | 6,142 | | | | 6,837 | | | (8,435) | | | (1,598) | | | | | | | | | | | | | | | | | | | | | | | | | Operating expenses: | | | | | | | | | | | | | | | | | | | | | | Research and development | | | 8,933 | | | (5,325) | | | 3,608 | | | | 16,306 | | | (9,692) | | | 6,614 | | a | Selling, general and administrative | | | 13,627 | | | (14) | | | 13,613 | | | | 22,951 | | | (117) | | | 22,834 | | c | Total operating expenses | | | 22,560 | | | (5,339) | | | 17,221 | | | | 39,257 | | | (9,809) | | | 29,448 | | | | | | | | | | | | | | | | | | | | | | | | | Operating loss | | | (11,939) | | | 860 | | | (11,079) | | | | (32,420) | | | 1,374 | | | (31,046) | | | | | | | | | | | | | | | | | | | | | | | | | Interest and other expense, net | | | (7,861) | | | (104) | | | (7,965) | | | | (16,206) | | | (213) | | | (16,419) | | d | Change in fair value of common stock warrant liability | | | 1,706 | | | — | | | 1,706 | | | | (420) | | | — | | | (420) | | | | | | | | | | | | | | | | | | | | | | | | | Loss before income taxes | | $ | (18,094) | | $ | 756 | | $ | (17,338) | | | $ | (49,046) | | $ | 1,161 | | $ | (47,885) | | | | | | | | | | | | | | | | | | | | | | | | | Income tax benefit | | | — | | | — | | | — | | | | — | | | — | | | — | | | | | | | | | | | | | | | | | | | | | | | | | Net loss attributable to the Company | | $ | (18,094) | | $ | 756 | | $ | (17,338) | | | $ | (49,046) | | $ | 1,161 | | $ | (47,885) | | | | | | | | | | | | | | | | | | | | | | | | | Preferred stock dividends declared, deemed dividends and accretion of discount | | | (13) | | | — | | | (13) | | | | (26) | | | — | | | (26) | | | | | | | | | | | | | | | | | | | | | | | | | Net loss attributable to common shareholders | | $ | (18,107) | | $ | 756 | | $ | (17,351) | | | $ | (49,072) | | $ | 1,161 | | $ | (47,911) | | | | | | | | | | | | | | | | | | | | | | | | | Net loss per share: | | | | | | | | | | | | | | | | | | | | | | Basic and diluted | | $ | (0.08) | | | | | $ | (0.08) | | | $ | (0.22) | | | | | $ | (0.21) | | | | | | | | | | | | | | | | | | | | | | | | | Weighted average number of common shares outstanding | | | 231,114,868 | | | | | | 231,114,868 | | | | 225,899,224 | | | �� | | | 225,899,224 | | |
For the three months ended June 30, 2019
| (a) | Research and development: The correction of this misstatement resulted in a net decrease of $5.3 million to research and development, an increase of $200 thousand to the cost of sales of fuel cell systems and related infrastructure, an increase of $2.5 million to the cost of service performed on fuel cell systems and related infrastructure, an increase in cost of Power Purchase Agreements of $299 thousand,and an increase in the cost of fuel delivered to customers of $2.3 million for the three months ended June 30, 2019. |
| (b) | Provision for loss contracts related to service: The correction of this misstatement resulted in benefit of of $363 thousand to the provision for loss contracts related to service and a decrease of $369 thousand to costs of services performed on fuel cell systems and related infrastructure for the three months ended June 30, 2019. |
| (c) | Right of use asset: The correction of the misstatement resulted in net decrease of $165 thousand of revenue related to cost of power purchase agreements, and a decrease of $14 thousand in selling general and administrative for the three months ended June 30, 2019. |
| (d) | Interest Expense: The correction of this misstatement resulted in increase of of $104 thousand to interest and other expense, net for the three months ended June 30, 2019. |
| (e) | Other adjustments: Immaterial adjustments for the three months ended March 31, 2019 resulted in the following: Adjustments related to an increase in sales of fuel cells and related infrastructure of $6 thousand, a decrease in sales related to Power Purchase Agreements of $75 thousand, and a decrease in cost of Power Purchase Agreements of $18 thousand. |
For the six months ended June 30, 2019
| (a) | Research and development: The correction of this misstatement resulted in a net decrease of $9.7 million to research and development, and an increase of $343 thousand to the cost of sales of fuel cell systems and related infrastructure, an increase of $3.5 million to the cost of service performed on fuel cell systems and related infrastructure, an increase in cost of Power Purchase Agreements of $1.3 million, and an increase in the cost of fuel delivered to customers of $4.5 million for the six months ended June 30, 2019. |
| (b) | Provision for loss contracts related to service:The correction of this misstatement resulted in benefit of of $201 thousand to the provision for loss contracts related to service and a decrease of $672 thousand to cost service performed on fuel cell systems and related infrastructure for the six months ended June 30, 2019. |
| (c) | Right of use asset: The correction of the misstatement resulted in net decrease of $335 thousand of cost related to power purchase agreements and a decrease of $117 thousand in selling general and administrative for the six months ended June 30, 2019. |
| (d) | Interest Expense: The correction of this misstatement resulted in increase of $213 thousand to interest and other expense, net for the six months ended June 30, 2019. |
| (e) | Other adjustments: Immaterial adjustments for the six months ended June 30, 2019 resulted in the following: Adjustments related to an increase in sales of fuel cells and related infrastructure of $12 thousand, a decrease in sales related to Power Purchase Agreements of $150 thousand, a decrease of $152 thousand in the cost of revenue for sales of fuel cells and related infrastructure and decrease in cost of Power Purchase Agreements of $35 thousand. |
| | | | | | | | | | | | | | For the three months ended March 31, 2019 | | | | | As Previously | | Restatement | | | As | | Restatement | | | Reported | | Adjustments | | Restated | | References | Net revenue: | | | | | | | | | | | | Sales of fuel cell systems and related infrastructure | | $ | 2,544 | | $ | 6 | | $ | 2,550 | | e | Services performed on fuel cell systems and related infrastructure | | | 6,343 | | | — | | | 6,343 | | | Power Purchase Agreements | | | 6,110 | | | (75) | | | 6,035 | | e | Fuel delivered to customers | | | 6,582 | | | — | | | 6,582 | | | Net revenue | | | 21,579 | | | (69) | | | 21,510 | | | Cost of revenue: | | | | | | | | | | | | Sales of fuel cell systems and related infrastructure | | | 2,321 | | | (9) | | | 2,312 | | a, e | Services performed on fuel cell systems and related infrastructure | | | 6,123 | | | 668 | | | 6,791 | | a, b | Provision for loss contracts related to service | | | — | | | 162 | | | 162 | | b | Power Purchase Agreements | | | 8,998 | | | 835 | | | 9,833 | | a, c, e | Fuel delivered to customers | | | 7,921 | | | 2,231 | | | 10,152 | | a | Total cost of revenue | | | 25,363 | | | 3,887 | | | 29,250 | | | | | | | | | | | | | | | Gross loss | | | (3,784) | | | (3,956) | | | (7,740) | | | | | | | | | | | | | | | Operating expenses: | | | | | | | | | | | | Research and development | | | 7,373 | | | (4,367) | | | 3,006 | | a | Selling, general and administrative | | | 9,324 | | | (103) | | | 9,221 | | c, e | Total operating expenses | | | 16,697 | | | (4,470) | | | 12,227 | | | | | | | | | | | | | | | Operating loss | | | (20,481) | | | 514 | | | (19,967) | | | | | | | | | | | | | | | Interest and other expense, net | | | (8,345) | | | (109) | | | (8,454) | | d | Change in fair value of common stock warrant liability | | | (2,126) | | | — | | | (2,126) | | | | | | | | | | | | | | | | | | | | | | | | | | | Loss before income taxes | | $ | (30,952) | | $ | 405 | | $ | (30,547) | | | | | | | | | | | | | | | Income tax benefit | | | — | | | — | | | — | | | | | | | | | | | | | | | Net loss attributable to the Company | | $ | (30,952) | | $ | 405 | | $ | (30,547) | | | | | | | | | | | | | | | Preferred stock dividends declared, deemed dividends and accretion of discount | | | (52) | | | 39 | | | (13) | | f | | | | | | | | | | | | | Net loss attributable to common shareholders | | $ | (31,004) | | $ | 444 | | $ | (30,560) | | | | | | | | | | | | | | | Net loss per share: | | | | | | | | | | | | Basic and diluted | | $ | (0.14) | | | | | $ | (0.14) | | | | | | | | | | | | | | | Weighted average number of common shares outstanding | | | 220,605,068 | | | | | | 220,605,068 | | |
For the three months ended March 31, 2019
| (a) | Research and development: The correction of this misstatement resulted in a net decrease of $4.4 million to research and development, an increase of $143 thousand to the cost of sales of fuel cell systems and related infrastructure, an increase of $971 thousand to the cost of service performed on fuel cell systems and related infrastructure, an increase in cost of power purchase agreements of $1.0 million and an increase in the cost of fuel delivered to customers of $2.2 million for the three months ended March 31, 2019. |
| (b) | Provision for loss contracts related to service: The correction of this misstatement resulted in a decrease of $303 thousand in services performed on fuel cell systems and related infrastructure and a net increase of $162 thousand to the provision for loss contracts related to service for the three months ended March 31, 2019. |
| (c) | Right of use asset: The correction of the misstatement resulted in a net decrease of $167 thousand of cost related to power purchase agreements and increase of $3 thousand to selling general and administrative expenses, for the three months ended March 31, 2019. |
| (d) | Interest Expense: The correction of this misstatement resulted in an increase of $109 thousand to interest and other expense, net for the three months ended March 31, 2019. |
| (e) | Other adjustments: Immaterial adjustments for the three months ended March 31, 2019 resulted in the following: Adjustments related to an increase in sales of fuel cells and related infrastructure of $6 thousand, a decrease in sales related to Power Purchase Agreements of $75 thousand, decrease of $106 thousand on selling general and administrative expenses and a decrease of $152 thousand in cost of sales of fuel cell systems and related infrastructure and a decrease in cost of power purchase agreements of $18 thousand. |
(f)Series E redeemable convertible preferred stock deemed dividend: The correction of this misstatement resulted in a net decrease of $39 thousand to preferred stock dividends declared, deemed dividends and accretion of discount.
The following tables present the effect of the Restatement Items, as well as other adjustments, on the Company’s unaudited interim condensed consolidated statements of comprehensive loss indicated (in thousands, except per share):
| | | | | | | | | | | | | | | | | | | | | | As Restated | | | | Three Months | | | Three Months | | | Six Months | | | Three Months | | | Nine Months | | | Three Months | | | | Ended | | | Ended | | | Ended | | | Ended | | | Ended | | | Ended | | | | March 31, 2019 | | | June 30, 2019 | | | June 30, 2019 | | | September 30, 2019 | | | September 30, 2019 | | | December 30, 2019 | | | | | | | | | | | | | | | | | | | | Net loss attributable to the Company | | | (30,547) | | | (17,338) | | | (47,885) | | | (17,822) | | | (65,707) | | | (18,036) | Other comprehensive gain (loss) - foreign currency translation adjustment | | | (210) | | | 86 | | | (124) | | | (531) | | | (655) | | | 296 | Comprehensive loss attributable to the Company | | $ | (30,757) | | $ | (17,252) | | $ | (48,009) | | $ | (18,353) | | $ | (66,362) | | $ | (17,740) | | | | | | | | | | | | | | | | | | | | Preferred stock dividends declared, deemed dividends and accretion of discount | | | (13) | | | (13) | | | (26) | | | (544) | | | (570) | | | (1,241) | Comprehensive loss attributable to common stockholders | | $ | (30,770) | | $ | (17,265) | | $ | (48,035) | | $ | (18,897) | | $ | (66,932) | | $ | (18,981) |
| | | | | | | | | | | | | | | | | | | | | | For the three months ended September 30, 2020 | | For the nine months ended September 30, 2020 | | | | As Previously | | | Cumulative | | | As | | As Previously | | | Cumulative | | | As | | | | Reported | | | Adjustments | | | Restated | | Reported | | | Adjustments | | | Restated | | | | | | | | | | | | | | | | | | | | Net loss attributable to the Company | | $ | (39,379) | | | (25,838) | | | (65,217) | | $ | (85,514) | | | (26,536) | | | (112,050) | Other comprehensive gain - foreign currency translation adjustment | | | 687 | | | — | | | 687 | | | 558 | | | — | | | 558 | Comprehensive loss attributable to the Company | | $ | (38,692) | | $ | (25,838) | | $ | (64,530) | | $ | (84,956) | | $ | (26,536) | | $ | (111,492) | | | | | | | | | | | | | | | | | | | | Preferred stock dividends declared, deemed dividends and accretion of discount | | | — | | | — | | | — | | | (19) | | | (7) | | | (26) | Comprehensive loss attributable to common stockholders | | | (38,692) | | | (25,838) | | | (64,530) | | | (84,975) | | | (26,543) | | | (111,518) |
| | | | | | | | | | | | | | | | | | | | | | For the three months ended June 30, 2020 | | For the six months ended June 30, 2020 | | | | As Previously | | | Cumulative | | | As | | As Previously | | | Cumulative | | | As | | | | Reported | | | Adjustments | | | Restated | | Reported | | | Adjustments | | | Restated | | | | | | | | | | | | | | | | | | | | Net loss attributable to the Company | | $ | (8,656) | | | (745) | | | (9,401) | | $ | (46,135) | | | (698) | | | (46,833) | Other comprehensive gain (loss) - foreign currency translation adjustment | | | 107 | | | — | | | 107 | | | (129) | | | — | | | (129) | Comprehensive loss attributable to the Company | | $ | (8,549) | | $ | (745) | | $ | (9,294) | | $ | (46,264) | | $ | (698) | | $ | (46,962) | | | | | | | | | | | | | | | | | | | | Preferred stock dividends declared, deemed dividends and accretion of discount | | | (13) | | | — | | | (13) | | | (19) | | | (7) | | | (26) | Comprehensive loss attributable to common stockholders | | | (8,562) | | | (745) | | | (9,307) | | | (46,283) | | | (705) | | | (46,988) |
| | | | | | | | | | | | For the three months ended March 31, 2020, | | | As Previously Reported | | Cumulative Adjustments | | As Restated | | | | | | | | | | | Net loss attributable to the Company | | $ | (37,479) | | | 47 | | | (37,432) | Other comprehensive loss - foreign currency translation adjustment | | | (236) | | | — | | | (236) | Comprehensive loss attributable to the Company | | $ | (37,715) | | $ | 47 | | $ | (37,668) | | | | | | | | | | | Preferred stock dividends declared, deemed dividends and accretion of discount | | | (13) | | | — | | | (13) | Comprehensive loss attributable to common stockholders | | $ | (37,728) | | $ | 47 | | $ | (37,681) |
| | | | | | | | | | | 2022 | | 2021 | | 2020 | | Operating activities | | | | | | | | | | Net loss | $ | (724,008) | | $ | (459,965) | | $ | (596,155) | | Adjustments to reconcile net loss to net cash used in operating activities: | | | | | | | | | | Depreciation of long-lived assets | | 30,402 | | | 20,900 | | | 14,434 | | Amortization of intangible assets | | 21,195 | | | 2,469 | | | 1,135 | | Stock-based compensation | | 179,627 | | | 76,470 | | | 17,135 | | (Gain)/loss on extinguishment of debt | | 986 | | | — | | | (17,686) | | Amortization of debt issuance costs and discount on convertible senior notes | | 2,710 | | | 3,018 | | | 17,061 | | Provision for common stock warrants recorded as a reduction to revenue | | 12,683 | | | 6,566 | | | 425,047 | | Deferred income tax expense (benefit) | | 170 | | | (16,197) | | | (30,845) | | Impairment of long-lived assets | | 5,218 | | | 10,224 | | | 6,430 | | (Benefit)/loss on service contracts | | (8,645) | | | 63,124 | | | 33,125 | | Fair value adjustment to contingent consideration | | 16,468 | | | 11,176 | | | (1,160) | | Net realized loss on investments | | 1,395 | | | 81 | | | — | | Amortization of premium on available-for-sale securities | | 990 | | | 9,232 | | | — | | Lease origination costs | | (8,815) | | | (10,410) | | | — | | Provision for bad debts and other assets | | — | | | — | | | 700 | | Loss on disposal of assets | | 268 | | | — | | | — | | Change in fair value for equity securities | | 18,159 | | | (6,738) | | | — | | Loss on equity method investments | | 20,166 | | | 5,704 | | | — | | Changes in operating assets and liabilities that provide (use) cash: | | | | | | | | | | Accounts receivable | | (30,920) | | | (27,601) | | | (15,701) | | Inventory | | (363,709) | | | (98,791) | | | (63,389) | | Contract assets | | (39,515) | | | (10,608) | | | — | | Prepaid expenses and other assets | | (92,521) | | | (32,392) | | | (18,401) | | Accounts payable, accrued expenses, and other liabilities | | 88,458 | | | 24,908 | | | 51,880 | | Deferred revenue and other contract liabilities | | 40,615 | | | 70,654 | | | 20,914 | | Net cash used in operating activities | | (828,623) | | | (358,176) | | | (155,476) | | | | | | | | | | | | Investing activities | | | | | | | | | | Purchases of property, plant and equipment | | (436,610) | | | (172,166) | | | (22,526) | | Purchase of intangible assets | | — | | | (928) | | | (1,957) | | Purchases of equipment related to power purchase agreements and equipment related to fuel delivered to customers | | (27,263) | | | (20,172) | | | (25,738) | | Purchase of available-for-sale securities | | (838,622) | | | (3,159,372) | | | — | | Proceeds from sales of available-for-sale securities | | 475,676 | | | 778,038 | | | — | | Proceeds from maturities of available-for-sale securities | | 247,879 | | | 1,129,088 | | | — | | Purchase of equity securities | | (5,000) | | | (169,793) | | | — | | Proceeds from sales of equity securities | | — | | | 28,536 | | | — | | Net cash paid for acquisitions | | (56,906) | | | (136,526) | | | (45,113) | | Cash paid for non-consolidated entities and non-marketable equity securities | | (38,524) | | | (17,596) | | | — | | Net cash used in investing activities | | (679,370) | | | (1,740,891) | | | (95,334) | | | | | | | | | | | | Financing activities | | | | | | | | | | Proceeds from exercise of warrants, net of transaction costs | | — | | | 15,445 | | | — | | Payments of contingent consideration | | (2,667) | | | (1,541) | | | — | | Proceeds from public and private offerings, net of transaction costs | | — | | | 3,587,833 | | | 1,271,714 | | Payments of tax withholding on behalf of employees for net stock settlement of stock-based compensation | | (23,735) | | | (32,092) | | | — | | Proceeds from exercise of stock options | | 2,301 | | | 7,520 | | | 32,023 | | Proceeds from issuance of convertible senior notes, net | | — | | | — | | | 205,098 | | Repurchase of convertible senior notes | | — | | | — | | | (90,238) | | Purchase of capped calls and common stock forward | | — | | | — | | | (16,253) | | Proceeds from long-term debt, net | | — | | | — | | | 99,000 | | Proceeds from the termination of capped calls | | — | | | — | | | 24,158 | | Principal payments on long-term debt | | (121,389) | | | (48,681) | | | (48,020) | | Proceeds from finance obligations | | 122,886 | | | 108,925 | | | 65,259 | | Principal repayments of finance obligations and finance leases | | (54,853) | | | (39,630) | | | (27,212) | | Net cash (used in) provided by financing activities | | (77,457) | | | 3,597,779 | | | 1,515,529 | | Effect of exchange rate changes on cash | | 2,600 | | | (802) | | | 65 | | (Decrease)/increase in cash and cash equivalents | | (1,790,639) | | | 1,168,865 | | | 1,172,908 | | Increase in restricted cash | | 207,789 | | | 329,045 | | | 91,876 | | Cash, cash equivalents, and restricted cash beginning of period | | 3,132,194 | | | 1,634,284 | | | 369,500 | | Cash, cash equivalents, and restricted cash end of period | $ | 1,549,344 | | $ | 3,132,194 | | $ | 1,634,284 | | | | | | | | | | | | Supplemental disclosure of cash flow information | | | | | | | | | | Cash paid for interest, net of capitalized interest of $13.1 million, $4.8 million and $0 | $ | 35,520 | | $ | 19,327 | | $ | 28,942 | | | | | | | | | | | | Summary of non-cash activity | | | | | | | | | | Recognition of right of use asset - finance leases | $ | 25,650 | | $ | 28,180 | | $ | — | | Recognition of right of use asset - operating leases | | 178,222 | | | 110,337 | | | 55,651 | | Net tangible assets (liablities) acquired (assumed) in a business combination | | 5,342 | | | (26,066) | | | 8,751 | | Common stock issued for acquisitions | | 6,107 | | | 46,697 | | | — | | Intangible assets acquired in a business combination | | 73,952 | | | 120,962 | | | 32,268 | | Conversion of convertible senior notes to common stock | | — | | | 15,345 | | | 62,553 | | Net transfers between inventory and long-lived assets | | 1,619 | | | 6,297 | | | — | | Accrued purchase of fixed assets, cash to be paid in subsequent period | | 62,320 | | | 14,006 | | | — | | Settlement of liability from acquisitions | | — | | | 7,100 | | | — | | Conversion of preferred stock to common stock | | — | | | — | | | 1,179 | |
| | | | | | | | | | | | | | | | | | | | | For the three months ended September 30, 2019 | | For the nine months ended September 30, 2019 | | | | As Previously | | | Cumulative | | | As | | As Previously | | | Cumulative | | | As | | | | Reported | | | Adjustments | | | Restated | | Reported | | | Adjustments | | | Restated | | | | | | | | | | | | | | | | | | | | Net loss attributable to the Company | | $ | (18,144) | | | 322 | | | (17,822) | | $ | (67,190) | | | 1,483 | | | (65,707) | Other comprehensive gain (loss) - foreign currency translation adjustment | | | (531) | | | — | | | (531) | | | (655) | | | — | | | (655) | Comprehensive loss attributable to the Company | | $ | (18,675) | | $ | 322 | | $ | (18,353) | | $ | (67,845) | | $ | 1,483 | | $ | (66,362) | | | | | | | | | | | | | | | | | | | | Preferred stock dividends declared, deemed dividends and accretion of discount | | | (13) | | | (531) | | | (544) | | | (39) | | | (531) | | | (570) | Comprehensive loss attributable to common stockholders | | | (18,688) | | | (209) | | | (18,897) | | | (67,884) | | | 952 | | | (66,932) |
See notes to consolidated financial statements | | | | | | | | | | | | | | | | | | | | | For the three months ended June 30, 2019 | | For the six months ended June 30, 2019 | | | As Previously | | | Cumulative | | | As | | As Previously | | | Cumulative | | | As | | | Reported | | | Adjustments | | | Restated | | Reported | | | Adjustments | | | Restated | | | | | | | | | | | | | | | | | | | | Net loss attributable to the Company | | $ | (18,094) | | | 756 | | | (17,338) | | $ | (49,046) | | | 1,161 | | | (47,885) | Other comprehensive gain (loss) - foreign currency translation adjustment | | | 86 | | | — | | | 86 | | | (124) | | | — | | | (124) | Comprehensive loss attributable to the Company | | $ | (18,008) | | $ | 756 | | $ | (17,252) | | $ | (49,170) | | $ | 1,161 | | $ | (48,009) | | | | | | | | | | | | | | | | | | | | Preferred stock dividends declared, deemed dividends and accretion of discount | | | (13) | | | — | | | (13) | | | (26) | | | — | | | (26) | Comprehensive loss attributable to common stockholders | | | (18,021) | | | 756 | | | (17,265) | | | (49,196) | | | 1,161 | | | (48,035) |
| | | | | | | | | | | | For the three months ended March 31, 2019, | | | As Previously Reported | | Cumulative Adjustments | | As Restated | | | | | | | | | | | Net loss attributable to the Company | | $ | (30,952) | | | 405 | | | (30,547) | Other comprehensive gain (loss) - foreign currency translation adjustment | | | (210) | | | — | | | (210) | Comprehensive loss attributable to the Company | | $ | (31,162) | | $ | 405 | | $ | (30,757) | | | | | | | | | | | Preferred stock dividends declared, deemed dividends and accretion of discount | | | (52) | | | 39 | | | (13) | Comprehensive loss attributable to common stockholders | | $ | (31,214) | | | 444 | | $ | (30,770) |
The following tables present the effect of the Restatement Items, as well as other adjustments, on the Company’s unaudited interim condensed consolidated statements of stockholders’ equity (in thousands, except per share):
| | | | | | | | | | | | | | | | | | | | | | | | | | | | | | | | | | Accumulated | | | | | | | | | | | | | | | | | | | Additional | | Other | | | | | | | | | | Total | | | | Common Stock | | Paid-in | | Comprehensive | | Treasury Stock | | Accumulated | | Stockholders’ | | | | Shares | | Amount | | Capital | | Income | | Shares | | Amount | | Deficit | | Equity | | | | | | | | | | | | | | | | | | | | | | | | | | BALANCE - March 31, 2020 (As Previously Reported) | | 322,220,469 | | $ | 3,222 | | $ | 1,519,257 | | $ | 1,164 | | 15,261,007 | | $ | (31,224) | | $ | (1,383,299) | | $ | 109,120 | | Cumulative adjustments | | — | | | — | | | (163) | | | (112) | | — | | | — | | | (4,453) | | | (4,728) | | BALANCE - March 31, 2020 (As Restated) | | 322,220,469 | | | 3,222 | | | 1,519,094 | | | 1,052 | | 15,261,007 | | | (31,224) | | | (1,387,752) | | | 104,392 | | | | | | | | | | | | | | | | | | | | | | | | | | BALANCE - June 30, 2020 (As Previously Reported) | | 348,201,792 | | $ | 3,482 | | $ | 1,658,532 | | $ | 1,271 | | 15,292,591 | | $ | (31,359) | | $ | (1,391,961) | | $ | 239,965 | | Cumulative adjustments | | — | | | — | | | (94) | | | (112) | | — | | | — | | | (5,199) | | | (5,405) | | BALANCE - June 30, 2020 (As Restated) | | 348,201,792 | | | 3,482 | | | 1,658,438 | | | 1,159 | | 15,292,591 | | | (31,359) | | | (1,397,160) | | | 234,560 | | | | | | | | | | | | | | | | | | | | | | | | | | BALANCE - September 30, 2020 (As Previously Reported) | | 406,123,816 | | $ | 4,061 | | $ | 2,083,199 | | $ | 1,958 | | 15,926,068 | | $ | (40,434) | | $ | (1,431,340) | | $ | 617,444 | | Cumulative adjustments | | — | | | — | | | (30) | | | (112) | | — | | | — | | | (31,037) | | | (31,179) | | BALANCE - September 30, 2020 (As Restated) | | 406,123,816 | | $ | 4,061 | | $ | 2,083,169 | | $ | 1,846 | | 15,926,068 | | $ | (40,434) | | $ | (1,462,377) | | $ | 586,265 | |
1. Nature of Operations Description of Business Plug is facilitating the paradigm shift to an increasingly electrified world by innovating cutting-edge hydrogen and fuel cell solutions. While we continue to develop commercially viable hydrogen and fuel cell product solutions, we have expanded our offerings to support a variety of commercial operations that can be powered with green hydrogen. We provide electrolyzers that allow customers — such as refineries, producers of chemicals, steel, fertilizer and commercial refueling stations — to generate hydrogen on-site. We are focusing our efforts on (a) industrial mobility applications, including electric forklifts and electric industrial vehicles, at multi-shift high volume manufacturing and high throughput distribution sites where we believe our products and services provide a unique combination of productivity, flexibility, and environmental benefits; (b) stationary power systems that will support critical operations, such as data centers, microgrids, and generation facilities, in either a backup power or continuous power role and replace batteries, diesel generators or the grid for telecommunication logistics, transportation, and utility customers; and (c) production of hydrogen. Plug expects to support these products and customers with an ecosystem of vertically integrated products that produce, transport, store and handle, dispense, and use hydrogen for mobility and power applications. Our current products and services include: GenDrive: GenDrive is our hydrogen fueled Proton Exchange Membrane (“PEM”) fuel cell system, providing power to material handling electric vehicles, including Class 1, 2, 3 and 6 electric forklifts, Automated Guided Vehicles (“AGVs”), and ground support equipment. GenFuel: GenFuel is our liquid hydrogen fueling delivery, generation, storage, and dispensing system. GenCare: GenCare is our ongoing “Internet of Things”-based maintenance and on-site service program for GenDrive fuel cell systems, GenSure fuel cell systems, GenFuel hydrogen storage and dispensing products and ProGen fuel cell engines. GenSure: GenSure is our stationary fuel cell solution providing scalable, modular PEM fuel cell power to support the backup and grid-support power requirements of the telecommunications, transportation, and utility sectors; GenSure High Power Fuel Cell Platform will support large scale stationary power and data center markets. GenKey: GenKey is our vertically integrated “turn-key” solution combining either GenDrive or GenSure fuel cell power with GenFuel fuel and GenCare aftermarket service, offering complete simplicity to customers transitioning to fuel cell power. ProGen: ProGen is our fuel cell stack and engine technology currently used globally in mobility and stationary fuel cell systems, and as engines in electric delivery vans. This includes Plug’s membrane electrode assembly (“MEA”), a critical component of the fuel cell stack used in zero-emission fuel cell electric vehicle engines. Electrolyzers: The design and implementation of 5 and 10MW electrolyzer systems that are modular, scalable hydrogen generators optimized for clean hydrogen production. Electrolyzers generate hydrogen from water using electricity and a special membrane and “green” hydrogen is generated by using renewable energy inputs, such as solar or wind power. Liquefaction Systems: Plug’s 15 ton-per-day and 30 ton-per-day liquefiers are engineered for high efficiency, reliability, and operational flexibility — providing consistent liquid hydrogen to customers. This design increases plant reliability and availability while minimizing parasitic losses like heat leak and seal gas losses. Cryogenic Equipment: Engineered equipment including trailers and mobile storage equipment for the distribution of liquified hydrogen, oxygen, argon, nitrogen and other cryogenic gases. We provide our products and solutions worldwide through our direct sales force, and by leveraging relationships with original equipment manufacturers (“OEMs”) and their dealer networks. Plug is currently targeting Asia, Australia, Europe, Middle East and North America for expansion in adoption. The European Union (the “EU”) has rolled out ambitious targets for the hydrogen economy as part of the EU strategy for energy integration and Plug is seeking to execute on our strategy to become a leader in the European hydrogen economy. Plug intends to implement a targeted account strategy for material handling, securing strategic partnerships with European OEMs, energy companies, utility leaders and accelerating our electrolyzer business. Our global strategy includes leveraging a network of integrators or contract manufacturers. We manufacture our commercially viable products in Latham, New York, Rochester, New York, Slingerlands, New York, Houston, Texas., Lafayette, Indiana, and Spokane, Washington, and support liquid hydrogen production and logistics in Charleston, Tennessee and Kingsland, Georgia. In addition, our wholly-owned subsidiary, Plug Power LA JV, LLC, created a joint venture with Niloco Hydrogen Holdings LLC, a wholly-owned subsidiary of Olin Corporation (“Olin”), named “Hidrogenii” in the third quarter of 2022. We believe Hidrogenii will support reliability of supply and speed to market for hydrogen throughout North America, and set the foundation for broader collaboration between Plug and Olin. Hidrogenii plans to begin with the construction of a 15-ton-per-day hydrogen plant in St. Gabriel, Louisiana. Hidrogenii is owned 50% by Plug Power LA JV, LLC and 50% by Niloco Hydrogen Holdings LLC. As of December 31, 2022, there has been no activity related to this joint venture. | | | | | | | | | | | | | | | | | | | | | | | | | | | | | | | | | | Accumulated | | | | | | | | | | | | | | | | | | | Additional | | Other | | | | | | | | | | Total | | | | Common Stock | | Paid-in | | Comprehensive | | Treasury Stock | | Accumulated | | Stockholders’ | | | | Shares | | Amount | | Capital | | Income | | Shares | | Amount | | Deficit | | Equity (Deficit) | | | | | | | | | | | | | | | | | | | | | | | | | | BALANCE - March 31, 2019 (As Previously Reported) | | 244,537,235 | | $ | 2,445 | | $ | 1,316,893 | | $ | 1,374 | | 15,002,663 | | $ | (30,637) | | $ | (1,291,255) | | $ | (1,180) | | Cumulative adjustments | | — | | | — | | | (78) | | | — | | — | | | — | | | (5,817) | | | (5,895) | | BALANCE - March 31, 2019 (As Restated) | | 244,537,235 | | | 2,445 | | | 1,316,815 | | | 1,374 | | 15,002,663 | | | (30,637) | | | (1,297,072) | | | (7,075) | | | | | | | | | | | | | | | | | | | | | | | | | | BALANCE - June 30, 2019 (As Previously Reported) | | 246,975,173 | | $ | 2,470 | | $ | 1,325,459 | | $ | 1,460 | | 15,020,437 | | $ | (30,681) | | $ | (1,309,363) | | $ | (10,655) | | Cumulative adjustments | | — | | | — | | | (78) | | | — | | — | | | — | | | (5,062) | | | (5,140) | | BALANCE - June 30, 2019 (As Restated) | | 246,975,173 | | | 2,470 | | | 1,325,381 | | | 1,460 | | 15,020,437 | | | (30,681) | | | (1,314,425) | | | (15,795) | | | | | | | | | | | | | | | | | | | | | | | | | | BALANCE - September 30, 2019 (As Previously Reported) | | 253,982,578 | | $ | 2,540 | | $ | 1,340,859 | | $ | 929 | | 15,259,045 | | $ | (31,216) | | $ | (1,327,518) | | $ | (14,406) | | Cumulative adjustments | | — | | | — | | | (78) | | | — | | — | | | — | | | (4,741) | | | (4,819) | | BALANCE - September 30, 2019 (As Restated) | | 253,982,578 | | $ | 2,540 | | $ | 1,340,781 | | $ | 929 | | 15,259,045 | | $ | (31,216) | | $ | (1,332,259) | | $ | (19,225) | |
Our wholly-owned subsidiary, Plug Power France, entered into a joint venture with Renault named HyVia, a French société par actions simplifiée (“HyVia”) in the second quarter 2021. HyVia plans to manufacture and sell fuel cell powered electric light commercial vehicles (“FCELCVs”) and to supply hydrogen fuel and fueling stations to support the FCE-LCV market, in each case primarily in Europe. HyVia is owned 50% by Plug Power France and 50% by Renault. Our wholly-owned subsidiary, Plug Power Espana S.L. (“Plug Power Spain”), entered into a joint venture with Acciona Generación Renovable, S.A. (“Acciona”), named AccionaPlug S.L., in the fourth quarter 2021. AccionaPlug S.L. plans to develop, operate, and maintain green hydrogen projects throughout Spain and Portugal. AccionaPlug S.L. is owned 50% by Plug Power Spain and 50% by Acciona. This joint venture was funded equally by Acciona and the Company, but has not yet commenced any related activities. Plug Power Inc. entered into a joint venture with SK E&S named SK Plug Hyverse Co. Ltd. (“SK Plug Hyverse”), which was funded in the first quarter of 2022. The joint venture with SK E&S seeks to accelerate the use of hydrogen as an alternative energy source in Asian markets. Through this initiative, the two companies will collaborate to provide hydrogen fuel cell systems, hydrogen fueling stations, electrolyzers and green hydrogen to the Korean and other Asian markets. This joint venture is owned 49% by Plug Power Inc. and 51% by SK E&S. Liquidity As of December 31, 2022, the Company had $690.6 million of cash and cash equivalents, $858.7 million of restricted cash, $1.3 billion of available-for-sale securities and $134.8 million of equity securities. In January and February 2021, the Company issued and sold in a registered equity offering an aggregate of 32.2 million shares of its common stock at a purchase price of $65.00 per share for net proceeds of approximately $2.0 billion. Furthermore, in February 2021, the Company completed a sale of its common stock in connection with a strategic partnership with SK Holdings Co., Ltd. (“SK Holdings”) to accelerate the use of hydrogen as an alternative energy source in Asian markets. The Company sold 54,996,188 shares of its common stock to a subsidiary of SK Holdings at a purchase price of $29.29 per share, or an aggregate purchase price of approximately $1.6 billion. The Company has continued to experience negative cash flows from operations and net losses. The Company incurred net losses attributable to common stockholders of $724.0 million, $460.0 million and $596.2 million for the years ended December 31, 2022, 2021, and 2020, respectively. The net cash used in operating activities for the year ended December 31, 2022, 2021, and 2020 was $828.6 million, $358.2 million, and $155.5 million, respectively. The Company’s working capital was $2.7 billion at December 31, 2022, which included cash and cash equivalents of $690.6 million and restricted cash of $159.0 million. The Company plans to invest a portion of its available cash to expand its current production and manufacturing capacity, construction of hydrogen plants and to fund strategic acquisitions and partnerships, and capital projects. Future use of the Company’s The following tables presentfunds is discretionary and the effect ofCompany believes that its working capital and cash position will be sufficient to fund its operations for at least one year after the Restatement Items, as well as other adjustments, ondate the Company’s unaudited interim condensed consolidatedfinancial statements of cash flows (in thousands):are issued.
| | | | | | | | | | | | As Restated | | | | Three Months Ended | | | Six Months Ended | | | Nine Months Ended | | | March 31, 2020 | | June 30, 2020 | | September 30, 2020 | Operating Activities | | | | | | | | | | Net loss attributable to the Company | | $ | (37,432) | | $ | (46,833) | | $ | (112,050) | Adjustments to reconcile net loss to net cash used in operating activities: | | | | | | | | | | Depreciation of long-lived assets | | | 2,991 | | | 6,069 | | | 9,860 | Amortization of intangible assets | | | 175 | | | 398 | | | 835 | Stock-based compensation | | | 3,045 | | | 6,188 | | | 9,258 | Gain on extinguishment of debt | | | — | | | (13,222) | | | (13,222) | Amortization of debt issuance costs and discount on convertible senior notes | | | 2,716 | | | 6,528 | | | 12,183 | Provision for common stock warrants | | | 2,566 | | | 7,983 | | | 25,198 | Fair value adjustment to contingent consideration | | | — | | | — | | | 1,130 | Income tax benefit | | | — | | | (17,371) | | | (24,015) | Loss (benefit) on service contracts | | | (128) | | | 277 | | | 25,110 | Changes in operating assets and liabilities that provide (use) cash: | | | | | | | | | | Accounts receivable | | | 1,034 | | | (18,333) | | | (86,056) | Inventory | | | (20,581) | | | (37,983) | | | (57,615) | Prepaid expenses, and other assets | | | (10,794) | | | (11,887) | | | (4,956) | Accounts payable, accrued expenses, and other liabilities | | | (3,374) | | | 3,903 | | | 41,125 | Deferred revenue | | | (620) | | | 2,392 | | | 16,709 | Net cash used in operating activities | | | (60,402) | | | (111,891) | | | (156,506) | Investing Activities | | | | | | | | | | Purchases of property, plant and equipment | | | (2,507) | | | (5,009) | | | (11,265) | Purchase of intangible assets | | | — | | | — | | | (1,638) | Purchases of equipment related to PPA and equipment related to fuel delivered to customers | | | (3,848) | | | (6,256) | | | (13,699) | Net cash paid for acquisitions | | | — | | | (45,286) | | | (45,113) | Net cash used in investing activities | | | (6,355) | | | (56,551) | | | (71,715) | Financing Activities | | | | | | | | | | Proceeds from public offerings, net of transaction costs | | | — | | | (269) | | | 344,398 | Proceeds from exercise of stock options | | | 6,104 | | | 15,798 | | | 23,335 | Proceeds from issuance of convertible senior notes, net | | | — | | | 205,100 | | | 205,098 | Repurchase of convertible senior notes | | | — | | | (90,238) | | | (90,238) | Purchase of capped calls and common stock forward | | | — | | | (16,253) | | | (16,253) | Proceeds from termination of capped calls | | | — | | | 24,158 | | | 24,158 | Principal payments on long-term debt | | | (5,315) | | | (21,626) | | | (27,845) | Proceeds from long-term debt, net | | | — | | | 49,000 | | | 99,000 | Repayments of finance obligations | | | (5,343) | | | (11,129) | | | (19,038) | Proceeds from finance obligations | | | 9,024 | | | 27,678 | | | 47,568 | Net cash provided by financing activities | | | 4,470 | | | 182,219 | | | 590,183 | Effect of exchange rate changes on cash | | | 1 | | | (24) | | | (90) | Increase in cash, cash equivalents and restricted cash | | | (62,286) | | | 13,753 | | | 361,872 | Cash, cash equivalents, and restricted cash beginning of period | | | 369,500 | | | 369,500 | | | 369,500 | Cash, cash equivalents, and restricted cash end of period | | $ | 307,214 | | $ | 383,253 | | $ | 731,372 | | | | | | | | | | | Supplemental disclosure of cash flow information | | | | | | | | | | Cash paid for interest | | $ | 5,155 | | $ | 9,466 | | $ | 16,975 | | | | | | | | | | | Summary of non-cash investing and financing activity | | | | | | | | | | Recognition of right of use assets | | $ | 340 | | $ | 6,836 | | $ | 25,857 | Conversion of preferred stock to common stock | | | 441 | | | 441 | | | 43,058 |
| | | | | | | | | | | | As Restated | | | | Three Months Ended | | | Six Months Ended | | | Nine Months Ended | | | March 31, 2019 | | June 30, 2019 | | September 30, 2019 | Operating Activities | | | | | | | | | | Net loss attributable to the Company | | $ | (30,547) | | $ | (47,885) | | $ | (65,707) | Adjustments to reconcile net loss to net cash used in operating activities: | | | | | | | | | | Depreciation of long-lived assets | | | 2,748 | | | 5,433 | | | 8,858 | Amortization of intangible assets | | | 175 | | | 338 | | | 518 | Stock-based compensation | | | 2,497 | | | 5,123 | | | 7,927 | Loss on extinguishment of debt | | | 518 | | | 518 | | | 518 | Provision for bad debts and other assets | | | 307 | | | 907 | | | 1,253 | Amortization of debt issuance costs and discount on convertible senior notes | | | 2,469 | | | 4,340 | | | 6,442 | Provision for common stock warrants | | | 1,193 | | | 2,209 | | | 3,706 | Loss on disposal of leased assets | | | — | | | 212 | | | 212 | Change in fair value of common stock warrant liability | | | 2,126 | | | 420 | | | (7) | Benefit on service contracts | | | (142) | | | (873) | | | (1,366) | Changes in operating assets and liabilities that provide (use) cash: | | | | | | | | | | Accounts receivable | | | 5,001 | | | 9,864 | | | 11,625 | Inventory | | | (17,716) | | | (25,431) | | | (32,843) | Prepaid expenses, and other assets | | | 1,018 | | | (460) | | | 427 | Accounts payable, accrued expenses, and other liabilities | | | (2,887) | | | 662 | | | 10,164 | Deferred revenue | | | (2,459) | | | (3,705) | | | (5,868) | Net cash used in operating activities | | | (35,699) | | | (48,328) | | | (54,141) | Investing Activities | | | | | | | | | | Proceeds from sale of equity interest in joint venture | | | | | | | | | | Purchases of property, plant and equipment | | | (1,468) | | | (2,844) | | | (4,635) | Purchase of intangible assets | | | — | | | (1,860) | | | (1,860) | Purchases of equipment related to PPA and equipment related to fuel delivered to customers | | | (806) | | | (1,987) | | | (2,851) | Proceeds from sale of leased assets | | | — | | | 375 | | | 375 | Net cash used in investing activities | | | (2,274) | | | (6,316) | | | (8,971) | Financing Activities | | | | | | | | | | Proceeds from issuance of preferred stock, net of transaction costs | | | (3) | | | (8) | | | (37) | Proceeds from public offerings, net of transaction costs | | | 23,498 | | | 28,265 | | | 38,098 | Proceeds from exercise of stock options | | | 81 | | | 205 | | | (116) | Payments for redemption of preferred stock | | | — | | | — | | | (4,040) | Proceeds from issuance of convertible senior notes, net | | | — | | | — | | | 39,052 | Principal payments on long-term debt | | | (17,671) | | | (18,039) | | | (21,704) | Proceeds from long-term debt, net | | | 84,761 | | | 99,546 | | | 99,496 | Repayments of finance obligations | | | (53,580) | | | (55,712) | | | (56,603) | Proceeds from finance obligations | | | — | | | 25,609 | | | 57,249 | Net cash provided by financing activities | | | 37,086 | | | 79,866 | | | 151,395 | Effect of exchange rate changes on cash | | | (35) | | | (48) | | | (119) | Increase (decrease) in cash, cash equivalents and restricted cash | | | (922) | | | 25,174 | | | 88,164 | Cash, cash equivalents, and restricted cash beginning of period | | | 110,153 | | | 110,153 | | | 110,153 | Cash, cash equivalents, and restricted cash end of period | | $ | 109,231 | | $ | 135,327 | | $ | 198,317 | | | | | | | | | | | Supplemental disclosure of cash flow information | | | | | | | | | | Cash paid for interest | | $ | 4,858 | | $ | 8,673 | | $ | 8,673 | | | | | | | | | | | Summary of non-cash investing and financing activity | | | | | | | | | | Recognition of right of use assets | | $ | 2,000 | | $ | 11,689 | | $ | 29,903 | Conversion of preferred stock to common stock | | | — | | | — | | | 1,883 |
The Company’s significant obligations consisted of the following as of December 31, 2022: | | | | | | | | | | | | | | For the Nine Months Ended September 30, 2020 | | | | | | As previously | | | Restatement | | | As | | Restatement | | | | Reported | | | Adjustments | | | Restated | | References | Operating Activities | | | | | | | | | | | | Net loss attributable to the Company | | $ | (85,514) | | $ | (26,536) | | $ | (112,050) | | a | Adjustments to reconcile net loss to net cash used in operating activities: | | | | | | | | | | | | Depreciation of long-lived assets | | | 9,381 | | | 479 | | | 9,860 | | b, e | Amortization of intangible assets | | | 835 | | | — | | | 835 | | | Stock-based compensation | | | 9,258 | | | — | | | 9,258 | | | Gain on extinguishment of debt | | | (13,222) | | | — | | | (13,222) | | | Amortization of debt issuance costs and discount on convertible senior notes | | | 12,183 | | | — | | | 12,183 | | | Provision for common stock warrants | | | 25,198 | | | — | | | 25,198 | | | Fair value adjustment to contingent consideration | | | 1,130 | | | — | | | 1,130 | | | Income tax benefit | | | (24,182) | | | 167 | | | (24,015) | | e | Loss on service contracts | | | 4,306 | | | 20,804 | | | 25,110 | | c | Changes in operating assets and liabilities that provide (use) cash: | | | | | | | | | | | | Accounts receivable | | | (86,004) | | | (52) | | | (86,056) | | e | Inventory | | | (57,718) | | | 103 | | | (57,615) | | e | Prepaid expenses, and other assets | | | (4,956) | | | — | | | (4,956) | | | Accounts payable, accrued expenses, and other liabilities | | | 35,748 | | | 5,377 | | | 41,125 | | b, d, e | Deferred revenue | | | 16,647 | | | 62 | | | 16,709 | | e | Net cash used in operating activities | | | (156,910) | | | 404 | | | (156,506) | | | Investing Activities | | | | | | | | | | | | Purchases of property, plant and equipment | | | (11,265) | | | — | | | (11,265) | | | Purchase of intangible assets | | | (1,638) | | | — | | | (1,638) | | | Purchases of equipment related to PPA and equipment related to fuel delivered to customers | | | (13,699) | | | — | | | (13,699) | | | Net cash paid for acquisitions | | | (45,113) | | | — | | | (45,113) | | | Net cash used in investing activities | | | (71,715) | | | — | | | (71,715) | | | Financing Activities | | | | | | | | | | | | Proceeds from public offerings, net of transaction costs | | | 344,398 | | | — | | | 344,398 | | | Proceeds from exercise of stock options | | | 23,335 | | | — | | | 23,335 | | | Proceeds from issuance of convertible senior notes, net | | | 205,098 | | | — | | | 205,098 | | | Repurchase of convertible senior notes | | | (90,238) | | | — | | | (90,238) | | | Purchase of capped calls and common stock forward | | | (16,253) | | | — | | | (16,253) | | | Proceeds from termination of capped calls | | | 24,158 | | | — | | | 24,158 | | | Principal payments on long-term debt | | | (27,845) | | | — | | | (27,845) | | | Proceeds from long-term debt, net | | | 99,000 | | | — | | | 99,000 | | | Repayments of finance obligations | | | (18,634) | | | (404) | | | (19,038) | | b | Proceeds from finance obligations | | | 47,568 | | | — | | | 47,568 | | | Net cash provided by financing activities | | | 590,587 | | | (404) | | | 590,183 | | | Effect of exchange rate changes on cash | | | (90) | | | — | | | (90) | | | Increase in cash, cash equivalents and restricted cash | | | 361,872 | | | — | | | 361,872 | | | Cash, cash equivalents, and restricted cash beginning of period | | | 369,500 | | | — | | | 369,500 | | | Cash, cash equivalents, and restricted cash end of period | | $ | 731,372 | | $ | — | | $ | 731,372 | | | | | | | | | | | | | | | Supplemental disclosure of cash flow information | | | | | | | | | | | | Cash paid for interest | | $ | 16,975 | | $ | — | | | 16,975 | | | | | | | | | | | | | | | Summary of non-cash investing and financing activity | | | | | | | | | | | | Recognition of right of use assets | | $ | 56,377 | | $ | (30,520) | | $ | 25,857 | | b | Conversion of convertible notes to common stock | | | 42,873 | | | 185 | | | 43,058 | | e |
For the nine months ended September 30, 2020
| (a)● | Refer to descriptionOperating and finance leases totaling $320.4 million and $46.1 million, respectively, of which $48.9 million and $8.1 million, respectively, are due within the adjustments and their impact on net loss in the Consolidated Statement of Operations sections for the nine months ended September 30, 2020 above. |
| (b) | Right of use asset: The correction of this misstatement resulted in an increase to operating cash flows of $591 thousand and a decrease to financing cash flows of $404 thousand for the nine months ended September 30,2020. In addition, the adjustments resulted in a decrease of $30.5 million to the non-cash investing and financing activitynext 12 months. These leases are primarily related to sale/leaseback agreements entered into with various financial institutions to facilitate the recognition of the right of use asset. |
| (c) | Provision for loss contracts related to service: The correction of this misstatement resulted in an increase within operating cash flows of $20.8 million for the nine months ended September 30, 2020. |
| (d) | Bonus accrual: Adjustments related to the under accrual for bonus expenses resulted in an increase within operating cash flows of $5.3 million for the nine months ended September 30, 2020. |
| (e) | Other adjustments: Immaterial adjustments resulted in an increase to operating cash flows of $226 thousand for the nine months ended September 30, 2020. In addition, there was an increase of $185 thousand in conversion of convertible notes to common stock. |
| | | | | | | | | | | | | | For the Six Months Ended June 30, 2020 | | | | | | As previously | | | Restatement | | | As | | Restatement | | | | Reported | | | Adjustments | | | Restated | | References | Operating Activities | | | | | | | | | | | | Net loss attributable to the Company | | $ | (46,135) | | $ | (698) | | $ | (46,833) | | a | Adjustments to reconcile net loss to net cash used in operating activities: | | | | | | | | | | | | Depreciation of long-lived assets | | | 5,783 | | | 286 | | | 6,069 | | b, d | Amortization of intangible assets | | | 398 | | | — | | | 398 | | | Stock-based compensation | | | 6,188 | | | — | | | 6,188 | | | Gain on extinguishment of debt | | | (13,222) | | | — | | | (13,222) | | | Amortization of debt issuance costs and discount on convertible senior notes | | | 6,528 | | | — | | | 6,528 | | | Provision for common stock warrants | | | 7,983 | | | — | | | 7,983 | | | Income tax benefit | | | (17,659) | | | 288 | | | (17,371) | | d | Loss on service contracts | | | — | | | 277 | | | 277 | | c | Changes in operating assets and liabilities that provide (use) cash: | | | | | | | | | | | | Accounts receivable | | | (18,393) | | | 60 | | | (18,333) | | d | Inventory | | | (37,983) | | | — | | | (37,983) | | | Prepaid expenses, and other assets | | | (11,817) | | | (70) | | | (11,887) | | d | Accounts payable, accrued expenses, and other liabilities | | | 4,699 | | | (796) | | | 3,903 | | b, d | Deferred revenue | | | 2,383 | | | 9 | | | 2,392 | | d | Net cash used in operating activities | | | (111,247) | | | (644) | | | (111,891) | | | Investing Activities | | | | | | | | | | | | Purchases of property, plant and equipment | | | (5,009) | | | — | | | (5,009) | | | Purchases of equipment related to PPA and equipment related to fuel delivered to customers | | | (6,256) | | | — | | | (6,256) | | | Net cash paid for acquisitions | | | (45,286) | | | — | | | (45,286) | | | Net cash used in investing activities | | | (56,551) | | | — | | | (56,551) | | | Financing Activities | | | | | | | | | | | | Proceeds from public offerings, net of transaction costs | | | (269) | | | — | | | (269) | | | Proceeds from exercise of stock options | | | 15,798 | | | — | | | 15,798 | | | Proceeds from issuance of convertible senior notes, net | | | 205,100 | | | — | | | 205,100 | | | Repurchase of convertible senior notes | | | (90,238) | | | — | | | (90,238) | | | Purchase of capped calls and common stock forward | | | (16,253) | | | — | | | (16,253) | | | Proceeds from termination of capped calls | | | 24,158 | | | — | | | 24,158 | | | Principal payments on long-term debt | | | (21,626) | | | — | | | (21,626) | | | Proceeds from long-term debt, net | | | 49,000 | | | — | | | 49,000 | | | Repayments of finance obligations | | | (11,783) | | | 654 | | | (11,129) | | b,d | Proceeds from finance obligations | | | 27,678 | | | — | | | 27,678 | | | Net cash provided by financing activities | | | 181,565 | | | 654 | | | 182,219 | | | Effect of exchange rate changes on cash | | | (14) | | | (10) | | | (24) | | | Increase in cash, cash equivalents and restricted cash | | | 13,753 | | | — | | | 13,753 | | | Cash, cash equivalents, and restricted cash beginning of period | | | 369,500 | | | — | | | 369,500 | | | Cash, cash equivalents, and restricted cash end of period | | $ | 383,253 | | $ | — | | $ | 383,253 | | | | | | | | | | | | | | | Supplemental disclosure of cash flow information | | | | | | | | | | | | Cash paid for interest | | $ | 9,466 | | $ | — | | | 9,466 | | | | | | | | | | | | | | | Summary of non-cash investing and financing activity | | | | | | | | | | | | Recognition of right of use assets | | $ | 26,922 | | $ | (20,086) | | $ | 6,836 | | b | Conversion of preferred stock to common stock | | | 441 | | | — | | | 441 | | |
As of June 30, 2020
| (a) | Refer to description of the adjustments and their impact on net loss in the Consolidated Statement of Operations sections for the six months ended June 30, 2020 above. |
| (b) | Right of use asset: The correction of this misstatement resulted in a decrease to operating cash flows of $553 thousand and a decrease financing cash flows of $222 thousand for the six months ended June 30, 2020. In addition, the adjustments resulted in a decrease of $20.1 million to the non-cash investing and financing activity related to the recognition of the right of use asset. |
| (c) | Provision for loss contracts related to service: The correction of this misstatement resulted in an increase to operating cash flows of $277 thousand for the six months ended June 30, 2020. |
| (d) | Other adjustments: Immaterial adjustments resulted in an increase to operating cash flows of $330 thousand for the six months ended June 30, 2020.Company’s commercial transactions with key customers. |
| | | | | | | | | | | | | | For the Three Months Ended March 31, 2020 | | | | | | As previously | | | Restatement | | | As | | Restatement | | | | Reported | | | Adjustments | | | Restated | | References | Operating Activities | | | | | | | | | | | | Net loss attributable to the Company | | $ | (37,479) | | $ | 47 | | $ | (37,432) | | a | Adjustments to reconcile net loss to net cash used in operating activities: | | | | | | | | | | | | Depreciation of long-lived assets | | | 2,850 | | | 141 | | | 2,991 | | b, d | Amortization of intangible assets | | | 175 | | | — | | | 175 | | | Stock-based compensation | | | 3,045 | | | — | | | 3,045 | | | Amortization of debt issuance costs and discount on convertible senior notes | | | 2,716 | | | — | | | 2,716 | | | Provision for common stock warrants | | | 2,566 | | | — | | | 2,566 | | | Benefit on service contracts | | | — | | | (128) | | | (128) | | c | Changes in operating assets and liabilities that provide (use) cash: | | | | | | | | | | | | Accounts receivable | | | 1,011 | | | 23 | | | 1,034 | | d | Inventory | | | (20,581) | | | — | | | (20,581) | | | Prepaid expenses, and other assets | | | (10,794) | | | — | | | (10,794) | | | Accounts payable, accrued expenses, and other liabilities | | | (2,933) | | | (441) | | | (3,374) | | b | Deferred revenue | | | (591) | | | (29) | | | (620) | | d | Net cash used in operating activities | | | (60,015) | | | (387) | | | (60,402) | | | Investing Activities | | | | | | | | | | | | Purchases of property, plant and equipment | | | (2,507) | | | — | | | (2,507) | | | Purchases of equipment related to PPA and equipment related to fuel delivered to customers | | | (3,848) | | | — | | | (3,848) | | | Net cash used in investing activities | | | (6,355) | | | — | | | (6,355) | | | Financing Activities | | | | | | | | | | | | Proceeds from exercise of stock options | | | 6,104 | | | — | | | 6,104 | | | Principal payments on long-term debt | | | (5,315) | | | — | | | (5,315) | | | Repayments of finance obligations | | | (5,730) | | | 387 | | | (5,343) | | b | Proceeds from finance obligations | | | 9,024 | | | — | | | 9,024 | | | Net cash provided by financing activities | | | 4,083 | | | 387 | | | 4,470 | | | Effect of exchange rate changes on cash | | | 1 | | | — | | | 1 | | | Increase in cash, cash equivalents and restricted cash | | | (62,286) | | | — | | | (62,286) | | | Cash, cash equivalents, and restricted cash beginning of period | | | 369,500 | | | — | | | 369,500 | | | Cash, cash equivalents, and restricted cash end of period | | $ | 307,214 | | $ | — | | $ | 307,214 | | | | | | | | | | | | | | | Supplemental disclosure of cash flow information | | | | | | | | | | | | Cash paid for interest | | $ | 5,155 | | $ | — | | | 5,155 | | | | | | | | | | | | | | | Summary of non-cash investing and financing activity | | | | | | | | | | | | Recognition of right of use assets | | $ | 6,189 | | $ | (5,849) | | $ | 340 | | b | Conversion of preferred stock to common stock | | | 441 | | | — | | | 441 | | |
As of March 31, 2020
| (a)● | Refer to descriptionFinance obligations totaling $329.2 million of which approximately $58.9 million is due within the adjustmentsnext 12 months. Finance obligations consist primarily of debt associated with the sale of future revenues and their impact on net loss in the Consolidated Statement of Operations sections for the three months ended March 31, 2020 above. |
| (b) | Right of use asset: The correction of this misstatement resulted in a decrease to operating cash flows of $282 thousand and an increase to financing cash flows of $387 thousand for the three months ended March 31, 2020. In addition, the adjustments resulted in a decrease of $5.8 million to the non-cash investing and financing activity related to the recognition of the right of use asset. |
| (c) | Provision for loss contracts related to service: The correction of this misstatement resulted in a decrease to operating cash flows of $128 thousand for the three months ended March 31, 2020. |
| (d) | Other adjustments: Immaterial adjustments resulted in a deccrease to operating cash flows of $24 thousand for the period ended March 31, 2020. |
| | | | | | | | | | | | | | For the Nine Months Ended September 30, 2019 | | | | | | As previously | | | Restatement | | | As | | Restatement | | | | Reported | | | Adjustments | | | Restated | | References | Operating Activities | | | | | | | | | | | | Net loss attributable to the Company | | $ | (67,190) | | $ | 1,483 | | $ | (65,707) | | a | Adjustments to reconcile net loss to net cash used in operating activities: | | | | | | | | | | | | Depreciation of long-lived assets | | | 8,944 | | | (86) | | | 8,858 | | b, d | Amortization of intangible assets | | | 518 | | | — | | | 518 | | | Stock-based compensation | | | 7,927 | | | — | | | 7,927 | | | Loss on extinguishment of debt | | | — | | | 518 | | | 518 | | d | Provision for bad debts and other assets | | | 1,253 | | | — | | | 1,253 | | | Amortization of debt issuance costs and discount on convertible senior notes | | | 6,257 | | | 185 | | | 6,442 | | d | Provision for common stock warrants | | | 3,706 | | | — | | | 3,706 | | | Change in fair value of common stock warrant liability | | | (7) | | | — | | | (7) | | | Loss on disposal of leased assets | | | 212 | | | — | | | 212 | | | Benefit on service contracts | | | — | | | (1,366) | | | (1,366) | | c | Changes in operating assets and liabilities that provide (use) cash: | | | | | | | | | | | | Accounts receivable | | | 11,702 | | | (77) | | | 11,625 | | d | Inventory | | | (32,691) | | | (152) | | | (32,843) | | d | Prepaid expenses, and other assets | | | 427 | | | — | | | 427 | | | Accounts payable, accrued expenses, and other liabilities | | | 13,293 | | | (3,129) | | | 10,164 | | b, d | Deferred revenue | | | (6,152) | | | 284 | | | (5,868) | | d | Net cash used in operating activities | | | (51,801) | | | (2,340) | | | (54,141) | | | Investing Activities | | | | | | | | | | | | Purchases of property, plant and equipment | | | (4,635) | | | — | | | (4,635) | | | Purchase of intangible assets | | | (1,860) | | | — | | | (1,860) | | | Purchases of equipment related to PPA and equipment related to fuel delivered to customers | | | (2,851) | | | — | | | (2,851) | | | Proceeds from sale of leased assets | | | 375 | | | — | | | 375 | | | Net cash used in investing activities | | | (8,971) | | | — | | | (8,971) | | | | | | | | | | | | | | | Financing Activities | | | | | | | | | | | | Proceeds from issuance of preferred stock, net of transaction costs | | | (37) | | | — | | | (37) | | | Proceeds from public offerings, net of transaction costs | | | 38,098 | | | — | | | 38,098 | | | Proceeds from exercise of stock options | | | (116) | | | — | | | (116) | | | Payments for redemption of preferred stock | | | (4,040) | | | — | | | (4,040) | | | Proceeds from issuance of convertible senior notes, net | | | 39,052 | | | — | | | 39,052 | | | Principal payments on long-term debt | | | (21,186) | | | (518) | | | (21,704) | | d | Proceeds from long-term debt, net | | | 99,496 | | | — | | | 99,496 | | | Repayments of finance obligations | | | (59,461) | | | 2,858 | | | (56,603) | | b | Proceeds from finance obligations | | | 57,249 | | | — | | | 57,249 | | | Net cash provided by financing activities | | | 149,055 | | | 2,340 | | | 151,395 | | | Effect of exchange rate changes on cash | | | (119) | | | — | | | (119) | | | Increase in cash, cash equivalents and restricted cash | | | 88,164 | | | — | | | 88,164 | | | Cash, cash equivalents, and restricted cash beginning of period | | | 110,153 | | | — | | | 110,153 | | | Cash, cash equivalents, and restricted cash end of period | | $ | 198,317 | | $ | — | | $ | 198,317 | | | | | | | | | | | | | | | Supplemental disclosure of cash flow information | | | | | | | | | | | | Cash paid for interest | | $ | 8,673 | | $ | — | | | 8,673 | | | | | | | | | | | | | | | Summary of non-cash investing and financing activity | | | | | | | | | | | | Recognition of right of use assets | | $ | 78,626 | | $ | (48,723) | | $ | 29,903 | | b | Conversion of preferred stock to common stock | | | 1,883 | | | — | | | 1,883 | | |
For the nine months ended September 30, 2019
| (a) | Refer to description of the adjustments and their impact on net loss in the Consolidated Statement of Operations sections for the nine months ended September 30, 2019 above. |
| (b) | Right of use asset: The correction of this misstatement resulted in a decrease to operating cash flows of $3.1 million and an increase to financing cash flows of $2.9 million for the nine months ended September 30, 2019. In addition, the adjustments resulted in a decrease of $48.7 million to the non-cash investing and financing activity related to the recognition of the right of use asset. |
| (c) | Provision for loss contracts related to service: The correction of this misstatement resulted in a decrease to operating cash flows of $1.4 million for the nine months ended September 30, 2019. |
| (d) | Other adjustments: Immaterial adjustments resulted in an increase to operating cash flows of $600 thousand and a decrease to financing cash flows of $518 thousand for the period ended nine months ended September 30, 2019.failed sale/leaseback transactions. |
| | | | | | | | | | | | | | For the Six Months Ended June 30, 2019 | | | | | | As previously | | | Restatement | | | As | | Restatement | | | | Reported | | | Adjustments | | | Restated | | References | Operating Activities | | | | | | | | | | | | Net loss attributable to the Company | | $ | (49,046) | | $ | 1,161 | | $ | (47,885) | | a | Adjustments to reconcile net loss to net cash used in operating activities: | | | | | | | | | | | | Depreciation of long-lived assets | | | 5,496 | | | (63) | | | 5,433 | | b, d | Amortization of intangible assets | | | 338 | | | — | | | 338 | | | Stock-based compensation | | | 5,123 | | | — | | | 5,123 | | | Loss on extinguishment of debt | | | — | | | 518 | | | 518 | | d | Amortization of debt issuance costs and discount on convertible senior notes | | | 4,340 | | | — | | | 4,340 | | | Provision for common stock warrants | | | 2,209 | | | — | | | 2,209 | | | Provision for bad debts and other | | | 907 | | | — | | | 907 | | | Loss on disposal of assets | | | 212 | | | — | | | 212 | | | Change in fair value of common stock warrant liability | | | 420 | | | — | | | 420 | | | Benefit on service contracts | | | — | | | (873) | | | (873) | | c | Changes in operating assets and liabilities that provide (use) cash: | | | | | | | | | | | | Accounts receivable | | | 9,848 | | | 16 | | | 9,864 | | d | Inventory | | | (25,280) | | | (151) | | | (25,431) | | d | Prepaid expenses, and other assets | | | (460) | | | — | | | (460) | | | Accounts payable, accrued expenses, and other liabilities | | | 1,232 | | | (570) | | | 662 | | b, d | Deferred revenue | | | (3,827) | | | 122 | | | (3,705) | | d | Net cash used in operating activities | | | (48,488) | | | 160 | | | (48,328) | | | Investing Activities | | | | | | | | | | | | Purchases of property, plant and equipment | | | (2,844) | | | — | | | (2,844) | | | Purchase of intangible assets | | | (1,860) | | | — | | | (1,860) | | | Purchases of equipment related to PPA and equipment related to fuel delivered to customers | | | (1,987) | | | — | | | (1,987) | | | Proceeds from sale of leased assets | | | 375 | | | — | | | 375 | | | Net cash used in investing activities | | | (6,316) | | | — | | | (6,316) | | | | | | | | | | | | | | | Financing Activities | | | | | | | | | | | | Proceeds from issuance of preferred stock, net of transaction costs | | | (8) | | | — | | | (8) | | | Proceeds from public offerings, net of transaction costs | | | 28,265 | | | — | | | 28,265 | | | Proceeds from exercise of stock options | | | 205 | | | — | | | 205 | | | Principal payments on long-term debt | | | (17,521) | | | (518) | | | (18,039) | | d | Proceeds from long-term debt, net | | | 99,546 | | | — | | | 99,546 | | | Repayments of finance obligations | | | (56,070) | | | 358 | | | (55,712) | | b | Proceeds from finance obligations | | | 25,609 | | | — | | | 25,609 | | | Net cash provided by financing activities | | | 80,026 | | | (160) | | | 79,866 | | | Effect of exchange rate changes on cash | | | (48) | | | — | | | (48) | | | Increase in cash, cash equivalents and restricted cash | | | 25,174 | | | — | | | 25,174 | | | Cash, cash equivalents, and restricted cash beginning of period | | | 110,153 | | | — | | | 110,153 | | | Cash, cash equivalents, and restricted cash end of period | | $ | 135,327 | | $ | — | | $ | 135,327 | | | | | | | | | | | | | | | Supplemental disclosure of cash flow information | | | | | | | | | | | | Cash paid for interest | | $ | 8,673 | | $ | — | | | 8,673 | | | | | | | | | | | | | | | Summary of non-cash investing and financing activity | | | | | | | | | | | | Recognition of right of use assets | | $ | 34,530 | | $ | (22,841) | | $ | 11,689 | | b |
For the six months ended June 30, 2019
| (a)● | Refer to descriptionConvertible senior notes totaling $193.9 million at December 31, 2022, none of which are due within the adjustments and their impact on net loss in the Consolidated Statement of Operations sectionsnext twelve months. See Note 15, “Convertible Senior Notes,” for the six months ended June 30, 2019 above.more details. |
| (b) | Right of use asset: The correction of this misstatement resulted in a decrease to operating cash flows of $492 thousand and an increase to financing cash flows of $358 thousand for the six ended June 30, 2019. In addition, the adjustments resulted in a decrease of $22.8 million to the non-cash investing and financing activity related to the recognition of the right of use asset. |
| (c) | Provision for loss contracts related to service: The correction of this misstatement resulted in a decrease to operating cash flows of $873 thousand for the six months ended June 30, 2019. |
| (d) | Other adjustments: Immaterial adjustments resulted in an increase to operating cash flows of $364 thousand and a decrease in financing cash flows of $518 thousand for the six months ended June 30, 2019. |
| | | | | | | | | | | | | | For the Three Months Ended March 31, 2019 | | | | | | As previously | | | Restatement | | | As | | Restatement | | | | Reported | | | Adjustments | | | Restated | | References | Operating Activities | | | | | | | | | | | | Net loss attributable to the Company | | $ | (30,952) | | $ | 405 | | $ | (30,547) | | a | Adjustments to reconcile net loss to net cash used in operating activities: | | | | | | | | | | | | Depreciation of long-lived assets | | | 2,776 | | | (28) | | | 2,748 | | b, d | Amortization of intangible assets | | | 175 | | | — | | | 175 | | | Stock-based compensation | | | 2,497 | | | — | | | 2,497 | | | Loss on extinguishment of debt | | | — | | | 518 | | | 518 | | d | Provision for bad debts and other assets | | | 307 | | | — | | | 307 | | | Amortization of debt issuance costs and discount on convertible senior notes | | | 2,469 | | | — | | | 2,469 | | | Provision for common stock warrants | | | 1,193 | | | — | | | 1,193 | | | Change in fair value of common stock warrant liability | | | 2,126 | | | — | | | 2,126 | | | Benefit on service contracts | | | — | | | (142) | | | (142) | | c | Changes in operating assets and liabilities that provide (use) cash: | | | | | | | | | | | | Accounts receivable | | | 4,978 | | | 23 | | | 5,001 | | d | Inventory | | | (17,564) | | | (152) | | | (17,716) | | d | Prepaid expenses, and other assets | | | 1,018 | | | — | | | 1,018 | | | Accounts payable, accrued expenses, and other liabilities | | | (2,781) | | | (106) | | | (2,887) | | d | Deferred revenue | | | (2,505) | | | 46 | | | (2,459) | | d | Net cash used in operating activities | | | (36,263) | | | 564 | | | (35,699) | | | Investing Activities | | | | | | | | | | | | Purchases of property, plant and equipment | | | (1,468) | | | — | | | (1,468) | | | Purchases of equipment related to PPA and equipment related to fuel delivered to customers | | | (806) | | | — | | | (806) | | | Net cash used in investing activities | | | (2,274) | | | — | | | (2,274) | | | | | | | | | | | | | | | Financing Activities | | | | | | | | | | | | Proceeds from issuance of preferred stock, net of transaction costs | | | (3) | | | — | | | (3) | | | Proceeds from public offerings, net of transaction costs | | | 23,498 | | | — | | | 23,498 | | | Proceeds from exercise of stock options | | | 81 | | | — | | | 81 | | | Principal payments on long-term debt | | | (17,153) | | | (518) | | | (17,671) | | d | Proceeds from long-term debt, net | | | 84,761 | | | — | | | 84,761 | | | Repayments of finance obligations | | | (53,534) | | | (46) | | | (53,580) | | b | Net cash provided by financing activities | | | 37,650 | | | (564) | | | 37,086 | | | Effect of exchange rate changes on cash | | | (35) | | | — | | | (35) | | | Decrease in cash, cash equivalents and restricted cash | | | (922) | | | — | | | (922) | | | Cash, cash equivalents, and restricted cash beginning of period | | | 110,153 | | | — | | | 110,153 | | | Cash, cash equivalents, and restricted cash end of period | | $ | 109,231 | | $ | — | | $ | 109,231 | | | | | | | | | | | | | | | Supplemental disclosure of cash flow information | | | | | | | | | | | | Cash paid for interest | | $ | 4,858 | | $ | — | | | 4,858 | | | | | | | | | | | | | | | Summary of non-cash investing and financing activity | | | | | | | | | | | | Recognition of right of use assets | | $ | — | | $ | 2,000 | | $ | 2,000 | | b |
Forfund operations for a least one year after the three months ended March 31, 2019date the financial statements are issued.
| (a) | Refer to description of the adjustments and their impact on net loss in the Consolidated Statement of Operations sections for the three months ended March 31, 2019 above. |
| (b) | Right of use asset: The correction of this misstatement resulted in a decrease to operating cashflows of $12 thousand and a decrease to financing cashflow of $46 thousand for the three months ended March 31,2019. In addition, the adjustments resulted in an increase of $2.0 million to the non-cash investing and financing activity related to the recognition of the right of use asset. |
| (c) | Provision for loss contracts related to service: The correction of this misstatement resulted in a decrease to operating cashflows of $142 thousand for the three months ended March 31, 2020. |
| (d) | Other adjustments: Immaterial adjustments resulted in an increase to operating activities of $312 thousand and a decrease in financing cashflows of $518 thousand for the three months ended March 30, 2019. |
4.2. Summary of Significant Accounting Policies
Principles of Consolidation The consolidated financial statements include the financial statements of the Company and its wholly-owned subsidiaries. All significant intercompanyIntercompany balances and transactions have been eliminated in consolidation. In addition, we include our share of the results of our joint ventures HyVia, AccionaPlug S.L. and SK Plug Hyverse, using the equity method based on our economic ownership interest and our ability to exercise significant influence over the operating and financial decisions of HyVia, AccionaPlug S.L., SK Plug Hyverse. Use of Estimates The consolidated financial statements of the Company have been prepared in conformity with U.S. generally accepted accounting principles, which require management to make estimates and assumptions that affect the reported amounts of assets and liabilities and disclosure of contingent assets and liabilities at the date of the consolidated financial statements and the reported amounts of revenues and expenses during the reporting period. On an on-going basis, we evaluate our estimates and judgments, including those related to revenue recognition, valuation of inventories, goodwill and intangible assets, valuation of long-lived assets, accrual for service loss contracts, operating and finance leases, product warranty accruals, unbilled revenue, common stock warrants, income taxes, and contingencies. We base our estimates and judgments on historical experience and on various other factors and assumptions that are believed to be reasonable under the circumstances, the results of which form the basis for making judgments about (1) the carrying values of assets and liabilities and (2) the amount of revenue and expenses realized that are not readily apparent from other sources. Actual results may differ from these estimates under different assumptions or conditions. Leases The Company is a lessee in noncancelable (1) operating leases, primarily related to sale/leaseback transactions with financial institutions for deployment of the Company’s products at certain customer sites, and (2) finance leases. The Company accounts for leases in accordance with Accounting Standards Codification (ASC) Topic 842, Leases (ASC Topic 842), as amended. The Company determines if an arrangement is or contains a lease at contract inception. The Company recognizes a right of use asset and a lease liability at the lease commencement date. For operating leases, the lease liability is initially measured at the present value of the unpaid lease payments at the lease commencement date. For finance leases, the lease liability is initially measured in the same manner and date as for operating leases and is subsequently measured at amortized cost using the effective interest method. Key estimates and judgments include how the Company determines (1) the discount rate it uses to discount the unpaid lease payments to present value, (2) the lease term, and (3) the lease payments. | ● | ASC Topic 842 requires a lessee to discount its unpaid lease payments using the interest rate implicit in the lease or, if that rate cannot be readily determined, its incremental borrowing rate. Generally, the Company cannot determine the interest rate implicit in the lease because it does not have access to the lessor’s estimated residual value or the amount of the lessor’s deferred initial direct costs. Therefore, the Company generally uses its incremental borrowing rate as the discount rate for the lease. The Company’s incremental borrowing rate for a lease is the rate of interest it would have to pay on a collateralized basis to borrow an amount equal to the lease payments under similar terms. Adjustments that considered the Company’s actual borrowing rate, inclusive of securitization, as well as borrowing rates for companies of similar credit quality, were applied in the determination of the incremental borrowing rate. |
| ● | The lease term for all of the Company’s leases includes the noncancelable period of the lease, plus any additional periods covered by either a Company option to extend (or not to terminate) the lease that the Company is reasonably certain to exercise, or an option to extend (or not to terminate) the lease controlled by the lessor. |
| ● | Lease payments included in the measurement of the lease liability comprise fixed payments, and for certain finance leases, the exercise price of a Company option to purchase the underlying asset if the Company is reasonably certain at lease commencement to exercise the option. |
The right of use asset is initially measured at cost, which comprises the initial amount of the lease liability adjusted for lease payments made at or before the lease commencement date, plus any initial direct costs incurred less any lease incentives received. For operating leases, the right of use asset is subsequently measured throughout the lease term at the carrying amount of the lease liability, plus initial direct costs, plus (minus) any prepaid (accrued) lease payments, less the unamortized balance of lease incentives received. Lease expense for lease payments is recognized on a straight-line basis over the lease term. For finance leases, the right of use asset is subsequently amortized using the straight-line method from the lease commencement date to the earlier of the end of the useful life of the underlying asset or the end of the lease term unless the lease transfers ownership of the underlying asset to the Company or the Company is reasonably certain to exercise an option to purchase the underlying asset. In those cases, the right of use asset is amortized over the useful life of the underlying asset. Amortization of the right of use asset is recognized and presented separately from interest expense on the lease liability. The Company’s leases do not contain variable lease payments. Right of use assets for operating and finance leases are periodically reviewed for impairment losses. The Company uses the long-lived assets impairment guidance in ASC Subtopic 360-10, Property, Plant and Equipment –— Overall, to determine whether ana right of use asset is impaired, and if so, the amount of the impairment loss to recognize. The Company monitors for events or changes in circumstances that require a reassessment of its leases. When a reassessment results in the remeasurement of a lease liability, a corresponding adjustment is made to the carrying amount of the corresponding right of use asset. Operating and finance lease right of use assets are presented separately on the Company’s consolidated balance sheets. The current portions of operating and finance lease liabilities are also presented separately within current liabilities and the long-term portions are presented separately within noncurrent liabilities on the consolidated balance sheets. The Company has elected not to recognize right of use assets and lease liabilities for short-term leases that have a lease term of 12 months or less. The Company recognizes the lease payments associated with its short-term leases as an expense on a straight-line basis over the lease term. Revenue Recognition The Company enters into contracts that may contain one or a combination of fuel cell systems and infrastructure, installation, maintenance, spare parts, fuel delivery and other support services. Contracts containing fuel cell systems and related infrastructure may be sold directly to customers or provided to customers under a PPA, discussed further below.PPA. The Company also enters into contracts that contain electrolyzer stacks, systems, maintenance, and other support services. The Company does not include a right of return on its products other than rights related to standard warranty provisions that permit repair or replacement of defective goods. The Company accrues for anticipated standard warranty costs at the same time that revenue is recognized for the related product, or when circumstances indicate that warranty costs will be incurred, as applicable. Any prepaid amounts would only be refunded to the extent services have not been provided or the fuel cell systems or infrastructure have not been delivered. Revenue is measured based on the transaction price specified in a contract with a customer, subject to the allocation of the transaction price to distinct performance obligations as discussed below. The Company recognizes revenue when it satisfies a performance obligation by transferring a product or service to a customer. Promises to the customer are separated into performance obligations, and are accounted for separately if they are (1) capable of being distinct and (2) distinct in the context of the contract. The Company considers a performance obligation to be distinct if the customer can benefit from the good or service either on its own or together with other resources readily available to the customer and the Company’s promise to transfer the goods or service to the customer is separately identifiable from other promises in the contract. The Company allocates revenue to each distinct performance obligation based on relative standalone selling prices. Payment terms for sales of fuel cells, infrastructure, and service to customers are typically 30 to 90 days.days from shipment of the goods. Payment terms on electrolyzer systems are typically based on achievement of milestones over the term of the contract with the customer. Sale/leaseback transactions with financial institutions are invoiced and collected upon transaction closing. Service is prepaid upfront in a majority of the arrangements. The Company does not adjust the transaction price for a significant financing component when the performance obligation is expected to be fulfilled within a year. In 2017, in separate transactions, theThe Company has issued to each of Amazon.com NV Investment Holdings LLC and Walmart warrants to purchase shares of the Company’s common stock. The Company presents the provision for common stock warrants within each revenue-related line item on the consolidated statements of operations. This presentation reflects a discount that those common stock warrants represent, and therefore revenue is net of these non-cash charges. The provision of common stock warrants is allocated to the relevant revenue-related line items based upon the expected mix of the revenue for each respective contract. See Note 18,17, “Warrant Transaction Agreements,’ for more details.
Nature of goods and services The following is a description of principal activities from which the Company generates its revenue. | (j)(i) | Sales of Fuel Cell Systems, and Related Infrastructure and Equipment |
Revenue from sales of fuel cell systems, and related infrastructure, and equipment represents sales of our GenDrive units, GenSure stationary backup power units, as well as hydrogen fueling infrastructure. The Company uses a variety of information sources in determining standalone selling prices for fuel cells systems and the related infrastructure. For GenDrive fuel cells, given the nascent nature of the Company’s market, the Company considers several inputs, including prices from a limited number of standalone sales as well as the Company’s negotiations with customers. The Company also considers its costs to produce fuel cells as well as comparable list prices in estimating standalone selling prices. The Company uses applicable observable evidence from similar products in the market to determine standalone selling prices for GenSure stationary backup power units and hydrogen fueling infrastructure. The determination of standalone selling prices of the Company’s performance obligations requires significant judgment, including periodic assessment of pricing approaches and available observable evidence in the market. Once relative standalone selling prices are determined, the Company proportionately allocates the transaction price to each performance obligation within the customer arrangement based upon standalone selling price. The allocated transaction price related to fuel cell systems and spare parts is recognized as revenue at a point in time which usually occurs at shipmentupon delivery (and occasionally upon delivery)at time of shipment). Revenue on hydrogen infrastructure installations is generally recognized at the point at which transfer of control passes to the customer, which usually occurs upon customer acceptance of the hydrogen infrastructure. In certain instances, control of hydrogen infrastructure installations transfers to the customer over time, and the related revenue is recognized over time as the performance obligation is satisfied. The Company uses an input method to determine the amount of revenue to recognize during each reporting period when such revenue is recognized over time, based on the costs incurred to satisfy the performance obligation. (ii) Sales of Electrolyzer Systems and Solutions Revenue from sales of electrolyzer systems and solutions represents sales of electrolyzer stacks and systems used to generate hydrogen for various applications including mobility, ammonia production, methanol production, power to gas, and other uses. (ii)
The Company uses a variety of information sources in determining standalone selling prices for electrolyzer systems solutions. Electrolyzer stacks are typically sold on a standalone basis and the standalone selling price is the contractual price with the customer. Electrolyzer systems are sold either on a standalone basis or with an extended service agreement and other equipment. The Company uses an adjusted market assessment approach to determine the standalone selling price of electrolyzer systems when sold with extended service or other equipment. This includes considering both standalone selling prices of the systems by the Company and available information on competitor pricing on similar products. The determination of standalone selling prices of the Company’s performance obligations requires judgment, including periodic assessment of pricing approaches and available observable evidence in the market. Once relative standalone selling prices are determined, the Company proportionately allocates the transaction price to each performance obligation within the customer arrangement based upon standalone selling price. Revenue on electrolyzer systems and stacks is generally recognized at the point at which transfer of control passes to the customer, which usually occurs upon title transfer at shipment or delivery to the customer location. In certain instances, control of electrolyzer systems transfers to the customer over time, and the related revenue is recognized over time as the performance obligation is satisfied. We recognize revenue over time when contract performance results in the creation of a product for which we do not have an alternative use and the contract includes an enforceable right to payment in an amount that corresponds directly with the value of the performance completed. In these instances, we use an input measure (cost-to-total cost or percentage-of-completion method) of progress to determine the amount of revenue to recognize during each reporting period based on the costs incurred to satisfy the performance obligation. Payments received from customers are recorded within deferred revenue and customer deposits in the consolidated balance sheets until control is transferred. The related cost of such product and installation is also deferred as a component of deferred cost of revenue in the consolidated balance sheets until control is transferred. (iii) Services performed on fuel cell systems and related infrastructure Revenue from services performed on fuel cell systems and related infrastructure represents revenue earned on our service and maintenance contracts and sales of spare parts. The Company uses an adjusted market assessment approach to determine standalone selling prices for services. This approach considers market conditions and constraints, the Company’s market share, pricing strategies andas well as objectives while maximizing the use of available observable inputs obtained from a limited number of historical standalone service renewal prices and negotiations with customers. The transaction price allocated to services as discussed above is generally recognized as revenue over time on a straight-line basis over the expected service period, as customers simultaneously receive and consume the benefits of routine, recurring maintenance performed throughout the contract period.
In substantially all of its commercial transactions, the Company sells extended maintenance contracts that generally provide for a five-to-ten-year service period from the date of product installation in exchange for an up-front payment. Services include monitoring, technical support, maintenance and services that provide for 97% to 98% uptime of the fleet.related services. These services are accounted for as a separate performance obligation, and accordingly, revenue generated from these transactions, subject to the proportional allocation of transaction price, is deferred and recognized as revenue over the term of the contract, generally on a straight-line basis. Additionally, the Company may enter into annual service and extended maintenance contracts that are billed monthly. Revenue generated from these transactions is recognized as revenue on a straight-line basis over the term of the contract. Costs are recognized as incurred over the term of the contract. When costs are projected to exceed revenues over the life of the extended maintenance contract, an accrual for loss contracts is recorded. As of December 31, 20202022 and 2019,2021, the Company recorded a loss accrual of $24.0$81.1 million and $3.7$89.8 million, respectively (2019 restated).respectively. Costs are estimated based upon historical experience and consider the estimated impact of the Company’s cost reduction initiatives.initiatives, if any. The actual results may differ from these estimates. See “Extended Maintenance Contracts” below. Extended maintenance contracts generally do not contain customer renewal options. Upon expiration, customers may either negotiate a contract extension or switch to purchasing spare parts and maintaining the fuel cell systems on their own. (iii)Power Purchase Agreements
| (iv) | Power Purchase Agreements (“PPAs”) |
Revenue from PPAs primarily represents payments received from customers who make monthly payments to access for the Company’s GenKey solution. Revenue associated with these agreements is recognized on a straight-line basis over the life of the agreements as the customers receive the benefits from the Company’s performance of the services. The customers receive services ratably over the contract term. In conjunction with entering into a PPA with a customer, the Company may enter into transactionsa separate transaction with third-party financial institutions in which itthe Company receives proceeds from the sale/leaseback transactions of the equipment and the sale of future service revenue. The proceeds from the financial institution are allocated between the sale of equipment and the sale of future service revenue based on the relative standalone selling prices of equipment and service. The proceeds allocated to the sale of future services are recognized as finance obligations. The proceeds allocated to the sale of the equipment are evaluated to determine if the transaction meets the criteria for sale/leaseback accounting. To meet the sale/leaseback criteria, control of the equipment must transfer to the financial institution, which requires among other criteria the leaseback to meet the criteria for an operating lease and the Company must not have a right to repurchase the equipment (unless specific criteria are met). These transactions typically meet the criteria for sale/leaseback accounting and accordingly, the Company recognizes revenue on the sale of the equipment, and separately recognizes the leaseback obligations. The Company recognizes aan operating lease liability for the equipment leaseback obligation based on the present value of the future payments to the financial institutions that are attributed to the equipment leaseback. The discount rate used to determine the lease liability is the Company’s incremental borrowing rate, which is based on an analysis of the interest rates on the Company’s secured borrowings. Adjustments that considered the Company’s actual borrowing rate, inclusive of securitization, as well as borrowing rates for companies of similar credit quality, were applied in the determination of the incremental borrowing rate. The Company also records a right of use asset which is amortized over the term of the leaseback. Rental expense is recognized on a straight-line basis over the life of the leaseback and is included as a cost of PPA revenue on the consolidated statements of operations. Certain of the Company’s transactions with financial institutions do not meet the criteria for sale/leaseback accounting and accordingly, no equipment sale is recognized. All proceeds from these transactions are accounted for as finance obligations. The right of use assets related to these transactions are classified as equipment related to the PPAs and fuel delivered to the customers, net in the consolidated balance sheets. Costs to service the property, depreciation of the assets related to PPAs and fuel delivered to the customers, and other related costs are included in cost of PPA revenue in the consolidated statements of operations. The Company uses its transaction-date incremental borrowing rate as the interest rate for its finance obligations that arise from these transactions. No additional adjustments to the incremental borrowing rate have been deemed necessary for the finance obligations that have resulted from the failed sale/leaseback transactions. In determining whether the sales of fuel cells and other equipment to financial institutions meet the requirements for revenue recognition under sale/leaseback accounting, the Company, as lessee, determines the classification of the lease. The Company estimates certain key inputs to the associated calculations such as: 1) discount rate used to determine the present value of future lease payments, 2) fair value of the fuel cells and equipment, and 3) useful life of the underlying asset(s): | ● | ASC Topic 842 requires a lessee to discount its future lease payments using the interest rate implicit in the lease or, if that rate cannot be readily determined, its incremental borrowing rate. Generally, the Company cannot determine the interest rate implicit in its leases because it does not have access to the lessor’s estimated residual value or the amount of the lessor’s deferred initial direct costs. Therefore, the Company generally uses its incremental borrowing rate to estimate the discount rate for each lease. Adjustments that considered the Company’s actual borrowing rate, inclusive of securitization, as well as borrowing rates for companies of similar credit quality were applied in the determination of the incremental borrowing rate. |
| ● | In order for the lease to be classified as an operating lease, the present value of the future lease payments cannot exceed 90% of the fair value of the leased assets. The Company estimates the fair value of the lease assets using the sales prices. |
| ● | In order for a lease to be classified as an operating lease, the lease term cannot exceed 75% (major part) of the estimated useful life of the leased asset. The average estimated useful life of the fuel cells is 10 years, and the average estimated useful life of the hydrogen infrastructure is 20 years. These estimated useful lives are compared to the term of each lease to determine the appropriate lease classification. |
| (v) | (iv)Fuel Delivered to Customers
|
Revenue associated with fuel delivered to customers represents the sale of hydrogen to customers that has been purchased by the Company from a third party or generated on site. The stand-alone selling price is not estimated because it is sold separately and therefore directly observable. The Company purchases hydrogen fuel from suppliers in most cases (and sometimes produces hydrogen onsite) and sells to its customers. Revenue and cost of revenue related to this fuel is recorded as dispensed and is included in the respective “Fuelfuel delivered to customers”customers and related equipment lines on the consolidated statements of operations. Contract costs The Company expects that incremental commission fees paid to employees as a result of obtaining sales contracts are recoverable and therefore the Company capitalizes them as contract costs. Capitalized commission fees are amortized on a straight-line basis over the period of time which the transfer of goods or services to which the assets relate occur, typically ranging from 5 to 10 years. Amortization of the capitalized commission fees is included in selling, general and administrative expenses. The Company recognizes the incremental costs of obtaining contracts as an expense when incurred if the amortization period of the assets that the Company otherwise would have recognized is one year or less. These costs are included in selling, general and administrative expenses. Capitalized contract costs at December 31, 2022 and 2021 were $0.6 million and $0.4 million, respectively. Cash and Cash Equivalents For purposes of the consolidated statements of cash flows, the Company considers all highly-liquid debt instruments with original maturities of three months or less to be cash equivalents. At December 31, 2020 and 2019,2022, cash equivalents consistconsisted of U.S. Treasury securities with original maturities of three months or less, and money market accounts.funds. Due to their short-term nature, the carrying amounts reported in the consolidated balance sheets approximate the fair value of cash and cash equivalents. The Company’s cash and cash equivalents are deposited with financial institutions located in the U.S. and may at times exceed insured limits. Restricted Cash Restricted cash consists primarily of cash that serves as support for leasing arrangements. Any cash that is legally restricted from use is classified as restricted cash. If the purpose of restricted cash relates to acquiring a long-term asset, liquidating a long-term liability, or is otherwise unavailable for a period longer than one year from the balance sheet date, the restricted cash is included in other long-term assets. Otherwise, restricted cash is included in other current assets in the Consolidated Balance Sheets. Available-for-sale securities Available-for-sale securities is comprised of U.S. Treasury securities, certificates of deposit and corporate bonds, with original maturities greater than three months. We consider these securities to be available for use in our current operations, and therefore classify them as current even if we do not dispose of the securities in the following year. Available-for-sale securities are recorded at fair value as of each balance sheet date. As of each balance sheet date, unrealized gains and losses, with the exception of credit related losses, are recorded to accumulated other comprehensive loss. Any credit related losses are recognized as a credit loss allowance on the balance sheet with a corresponding adjustment to the statement of operations. Realized gains and losses are due to the sale and maturity of securities classified as available-for-sale and includes the loss from accumulated other comprehensive loss reclassifications for previously unrealized losses on available-for-sale debt securities. Equity securities Equity securities are comprised of fixed income and equity market index mutual funds. Equity securities are valued at fair value with changes in the fair value recognized in our consolidated statements of operations. We consider these securities to be available for use in our current year operations, and therefore classify them as current even if we do not dispose of the securities in the following year. Investments in non-consolidated entities and non-marketable equity securities The Company accounts for its investments in non-consolidated entities, such as HyVia, AccionaPlug S.L., and SK Plug Hyverse, as equity method investments. Included in “Investments in non-consolidated entities and non-marketable equity securities” on the consolidated balance sheet are equity investments without readily determinable fair values (“non-marketable equity securities”). Non-marketable equity securities that do not qualify for equity method accounting are measured at cost, less any impairment and adjusted for changes resulting from observable price changes in orderly transactions for the identical or similar investments of the same issuer. Our investment in non-marketable equity securities was $8.8 million and $5.0 million as of December 31, 2022 and 2021, respectively. Common Stock Warrant Accounting The Company accounts for common stock warrants as either derivative liabilities or as equity instruments depending on the specific terms of the respective warrant agreements. Common stock warrants that meet certain applicable requirements of ASC Subtopic 815-40, Derivatives and Hedging – Contracts in Entity’s Own Equity, and other related guidance, including the ability of the Company to settle the warrants without the issuance of registered shares or the absence of rights of the grantee to require cash settlement, are accounted for as equity instruments. The Company classifies these equity instruments within additional paid-in capital on the consolidated balance sheets. Common stock warrants accounted for as equity instruments represent the warrants issued to Amazon and Walmart as discussed in Note 17, “Warrant Transaction Agreements.” The Company adopted FASB ASU 2019-08, Compensation – Stock Compensation (Topic 718) and Revenue from Contracts with Customers (Topic 606), which requires entities to measure and classify share-based payment awards granted to a customer by applying the guidance under Topic 718, as of January 1, 2019. In order to calculate warrant charges, the Company used the Black-Scholes pricing model, which required key inputs including volatility and risk-free interest rate and certain unobservable inputs for which there is little or no market data, requiring the Company to develop its own assumptions. The Company estimated the fair value of unvested warrants, considered to be probable of vesting, at the time. Based on that estimated fair value, the Company determined warrant charges, which are recorded as a reduction of revenue in the consolidated statement of operations. Accounts Receivable Accounts receivable are stated at the amount billed or billable to customers and are ordinarily due between 30 and 6090 days after the issuance of the invoice. Receivables are reserved or written off based on individual credit evaluation and specific circumstances of the customer. The allowance for expected credit losses for current accounts receivable is based primarily on past collections experience relative to the length of time receivables are past due; however, when available evidence reasonably supports an assumption that counterparty credit risk over the expected payment period will differ from current and historical payment collections, a forecasting adjustment will be reflected in the allowance for expected credit losses. The allowance for doubtful accounts and related receivable are reduced when the amount is deemed uncollectible. As of December 31, 2020,2022, and 2019,2021, the allowance for doubtful accounts was $172$43 thousand and $249$39 thousand, respectively. Inventory Inventories are valued at the lower of cost, determined on a first-in, first-out basis, and net realizable value. All inventory, including spare parts inventory held at service locations, is not relieved until the customer has received the product, at which time the customer obtains control of the goods. We maintain inventory levels adequate for our short-term needs within the next twelve months based upon present levels of production. An allowance for potential non-saleable inventory due to excess stock or obsolescence is based upon a detailed review of inventory, past history, and expected usage. Property, Plant and Equipment Property, plant and equipment are originally recorded at cost or, if acquired as part of a business combination, at fair value. Maintenance and repairs are expensed as costs are incurred. Depreciation on plant and equipment, which includes depreciation on one of the Company’s primary manufacturing facility,facilities, which is accounted for as a financing obligation, is calculated on the straight-line method over the estimated useful lives of the assets. Gains and losses resulting from the sale of property and equipment are recorded in current operations. Included within machinery and equipment is certain equipment related to our hydrogen plants. The Company records depreciation and amortization over the following estimated useful lives: | | | Leasehold improvements | | 5 ‑ 10 – 30 years
| Software, machineryMachinery and equipment
| 2 – 30 years | Software | 1 ‑ 15 – 5 years |
Gains and losses resulting from the sale of property and equipment are recorded in current operations.
Equipment related to PPAs and Fuel Delivered to Customers Equipment related to PPAs and fuel delivered to customers primarily consists of the assets deployed related to PPAs and sites where we deliver fuel to customers. customers as well as equipment related to failed sale/leaseback transactions. Equipment is depreciated over its useful life. Depreciation expense is recorded on a straight-line basis and is included in cost of revenue for PPAs or cost of fuel delivered to customers, respectively, in the consolidated statements of operations. Impairment of Long-Lived Assets Property, equipment, leasehold improvements, and finite-lived intangible assets Long-lived assets, such as property, equipment, leasehold improvements, and finite-lived intangible assets are reviewed for impairment whenever events and circumstances indicate that the carrying amount of an asset may not be recoverable. If circumstances require a long-lived asset or asset group to be tested for impairment, the Company first compares undiscounted cash flows expected to be generated by that asset or asset group to its carrying amount. If the carrying amount of the long-lived asset or asset group is not recoverable on an undiscounted cash flow basis, an impairment is recognized to the extent that the carrying amount exceeds its fair value. In making these determinations, the Company uses certain assumptions, including, but not limited to: (i) estimated fair value of the assets; and (ii) estimated, undiscounted future cash flows expected to be generated by these assets, which are based on additional assumptions such as asset utilization, length of service, the asset will be used in the Company’s operations, and (iii) estimated residual values. Fair value is determined using various valuation techniques including discounted cash flow models, quoted market values and third-party independent appraisals, as considered necessary. There was impairment of $0.8 million and $0 of property, equipment, leasehold improvements, or finite-lived intangible assets during the years ended December 31, 2022 and 2021, respectively. PPA Executory Contract Considerations We evaluate long-livedPPA assets on a quarterly basis to identify events or changes in circumstances (“triggering events”) that indicate the carrying value of certain assets may not be recoverable. Long-livedPPA assets that we evaluate include right of use lease assets, equipment deployed to our PPA’s,PPAs, and assets related primarily to our fuel delivery business and other company owned long-lived assets. business. Upon the occurrence of a triggering event, long-livedPPA assets are evaluated to determine if the carrying amounts are recoverable. The determination of recoverability is made based upon the estimated undiscounted future net cash flows of assets grouped at the lowest level for which there are identifiable cash flows independent of the cash flows of other groups. For operating assets, the Company has generally determined that the lowest level of identifiable cash flows is based on the customer sites. The assets related primarily to our fuel delivery business are considered to be their own asset group. The cash flows are estimated based on the remaining useful life of the primary asset within the asset group. For assets related to our PPA agreements, we consider all underlying cash inflows related to our contract revenues and cash outflows relating to the costs incurred to service the PPA’s.PPAs. Our cash flow estimates used in the recoverability test, are based upon, among other things, historical results adjusted to reflect our best estimate of future cash flows and operating performance. Development of future cash flows also requires us to make assumptions and to apply judgment, including timing of future expected cash flows, future cost savings initiatives, and determining recovery values. Changes to our key assumptions related to future performance and other economic and market factors could adversely affect the outcome of our recoverability tests and cause more asset groups to be tested for impairment. If the estimated undiscounted future net cash flows for a given asset group are less than the carrying amount of the related asset group, an impairment loss is determined by comparing the estimated fair value with the carrying amount of the asset group. The impairment loss is then allocated to the long-lived assets in the asset group based on the asset’s relative carrying amounts. However, assets are not impaired below their then estimated fair values. Fair value is generally determined through various valuation techniques, including discounted cash flow models, quoted market values and third-party independent appraisals, as well as year-over-year trends in pricing of our new equipment and overall evaluation of our industry and market, as considered necessary. The Company considers these indicators with certain of its own internal indices and metrics in determining fair value in light of the nascent state of the Company’s market and industry. The estimate of fair value represents our best estimates of these factors and is subject to variability. Changes to our key assumptions related to future performance and other economic and market factors could adversely affect our impairment evaluation. The Company has determined that the assets deployed for certain PPA arrangements, as well as certain assets related to the delivery of fuel to customers, are not recoverable based on the undiscounted estimated future cash flows of the asset group.group, and an expense $4.4 million was recorded to the impairment of long-lived assets on the income statement. However, the estimated fair value of the assets in thethese asset groupgroups equal or exceed the carrying amount of the assets or otherwise limit the amount of impairment that would have been recognized. The Company has identified the primary source of the losses asfor certain PPA arrangements to be the maintenance components of the PPA arrangements and the impact of customer warrant non-cash provisions. As the PPA arrangements are considered to be executory contracts and there is no specific accounting guidance that permits loss recognition for these revenue contracts, the Company has not recognized a provision for the expected future losses under these revenue arrangements. The Company expects that it will recognize future losses for these arrangements as it continues its efforts to reduce costs of delivering the maintenance component of these arrangements. The Company has estimated total future revenues and costs for these types of arrangements based on existing contracts and leverage of the related assets. For the future estimates, the Company used service cost estimates for extended maintenance contracts and customer warrant provisions at rates consistent with experience to date. The terms for the underlying estimates vary but the average residual term on the existing contracts is 5 years. Intangible Assets Intangible assets consist of acquired technology, customer relationships and trademarks, and are amortized using a straight-line method over their useful lives. Additionally, the intangible assets are reviewed for impairment when certain triggering events occur. Extended Maintenance Contracts On a quarterly basis, we evaluate any potential losses related to our extended maintenance contracts for fuel cell systems and related infrastructure that has been sold. We measure loss accruals at the customer contract level. The expected revenues and expenses for these contracts include all applicable expected costs of providing services over the remaining term of the contracts and the related unearned net revenue. A loss is recognized if the sum of expected costs of providing services under the contract exceeds related unearned net revenue and is recorded as a provision for loss contracts related to service in the consolidated statementstatements of operations. A key component of these estimates is the expected future service costs. In estimating the expected future service costs, the Company considers its current service cost level and applies significant judgmentjudgement related to expectedcertain cost saving initiatives.estimates that have been implemented in the field. The expected future cost savings will be primarily dependent upon the success of the Company’s initiatives related to increasing stack life and achieving better economies of scale on service labor, and improvements in design and operations of infrastructure.labor. If the expected cost saving initiatives are not realized, this will increase the costs of providing services and could adversely affect our estimated contract loss accrual. Further, as we continue to work to improve quality and reliability; however, unanticipated additional quality issues or warranty claims may arise and additional material charges may be incurred in the future. These quality issues could also adversely affect our contract loss accrual. The Company has undertaken and will soon undertake several other initiatives to extend the life and improve the reliability of its equipment. As a result of these initiatives and our additional expectation that the increase in certain costs will abate, the Company believes that its contract loss accrual is sufficient. However, if elevated service costs persist, the Company will adjust its estimated future service costs and increase its contract loss accrual estimate. The following table shows the roll forward of balances in the accrual for loss contracts, including changes due to the provision (benefit) for loss accrual, loss accrual acquired from acquisition, releases to service cost of sales, and releases due to the provision for warrants and foreign currency translation adjustment (in thousands): | | | | | | | | | | December 31, 2020 | | December 31, 2019 | | December 31, 2018 | | | | | | (as restated) | | | (as restated) | Beginning Balance | $ | 3,702 | | $ | 5,345 | | $ | — | Provision (benefit) for Loss Accrual | | 35,473 | | | (394) | | | 5,345 | Released to Service Cost of Sales | | (2,348) | | | (1,249) | | | — | Released to Provision for Warrants | | (12,814) | | | — | | | — | Ending Balance | $ | 24,013 | | $ | 3,702 | | $ | 5,345 |
| | | | | | | | | | December 31, 2022 | | December 31, 2021 | | December 31, 2020 | Beginning balance | $ | 89,773 | | $ | 24,013 | | $ | 3,702 | Provision for loss accrual | | 23,295 | | | 71,988 | | | 35,473 | Loss accrual acquired from acquisition | | — | | | 2,636 | | | — | Releases to service cost of sales | | (35,446) | | | (8,864) | | | (2,348) | Increase/(decrease) to loss accrual related to customer warrants | | 3,506 | | | — | | | (12,814) | Foreign currency translation adjustment | | (62) | | | — | | | — | Ending balance | $ | 81,066 | | $ | 89,773 | | $ | 24,013 |
Goodwill and indefinite-lived intangible asset Goodwill is an asset representing the future economic benefits arising from other assets acquired in a business combination that are not individually identified and separately recognized. Goodwill is reviewed for impairment at least annually. The indefinite-lived intangible asset represents in-process research and development for cumulative research and development efforts associated with dry stack electrolyzer technology acquired in connection with the Giner ELX, Inc. acquisition. The Company has the option to perform a qualitative assessment to determine whether it is more-likely-than-not that the fair value of a reporting unit is less than its carrying amount. If this is the case, the quantitative goodwill impairment test is required. If it is more-likely-than-not that the fair value of a reporting unit is greater than its carrying amount, the quantitative goodwill impairment test is not required. The indefinite-lived intangible asset is tested for impairment annually, and more frequently when there is a triggering event. Annually, or when there is a triggering event, the Company first performs a qualitative assessment by evaluating all relevant events and circumstances to determine if it is more likely than not that the indefinite-lived intangible asset is impaired; this includes considering any potential effect on significant inputs to determining the fair value of the indefinite-lived intangible asset. When it is more likely than not that the indefinite-lived intangible asset is impaired, then the Company calculates the fair value of the intangible asset and performs a quantitative impairment test.
The Company performs an impairment review of goodwill and the indefinite lived intangible asset on an annual basis at December 1,October 31, and when a triggering event is determined to have occurred between annual impairment tests. Due to the proximity of the fourth quarter 2022 interim goodwill impairment analysis date to the annual assessment date, and to allow for a greater amount of time to analyze the assessment of goodwill in advance of our annual report filing deadline in future years, we updated our accounting policy to shift the annual impairment test from December 1 to October 31 in 2022 and future fiscal years. This change in date of the annual impairment test is not deemed material as the new measurement date October 31 is in relative close proximity to the previous measurement date and the year-end balance sheet date, is not expected to materially impact the goodwill analysis, and allows for more timely financial reporting on these estimates.
For the years ended December 31, 2020, 2019,2022, 2021, and 2018,2020, the Company performed a qualitative assessment of goodwill for its single reporting unit based on multiple factors including market capitalization and determined that it is not more likely than not that the fair value of its reporting unit is less than the carrying amount. For the year ended December 31, 2020, the Company performed a qualitative assessment of its indefinite lived intangible asset and determined that it is not more likely than not that its fair value is less than the carrying amount. Intangible Assets
Intangible assets consist of acquired technology, customer relationships and trademarks, and are amortized using a straight-line method over their useful lives of 5–10 years. Additionally, the intangible assets are reviewed for impairment when certain triggering events occur.
Fair Value Measurements The Company records the fair value of assets and liabilities in accordance with ASC 820, Fair Value Measurement (“ASC 820”). ASC 820 defines fair value as the price received to sell an asset or paid to transfer a liability in an orderly transaction between market participants at the measurement date and in the principal or most advantageous market for that asset or liability. The fair value should be calculated based on assumptions that market participants would use in pricing the asset or liability, not on assumptions specific to the entity. In addition to defining fair value, ASC 820 expands the disclosure requirements around fair value and establishes a fair value hierarchy for valuation inputs. The hierarchy prioritizes the inputs into three levels based on the extent to which inputs used in measuring fair value are observable in the market. Each fair value measurement is reported in one of the three levels, which is determined by the lowest level input that is significant to the fair value measurement in its entirety. These levels are: | ● | Level 1 — quoted prices (unadjusted) in active markets for identical assets or liabilities. |
| ● | Level 2 — quoted prices for similar assets and liabilities in active markets or inputs that are observable |
for the asset or liability, either directly or indirectly through market corroboration, for substantially the full term of the financial instrument. | ● | Level 3 — unobservable inputs reflecting management’s own assumptions about the inputs used in |
pricing the asset or liability at fair value.
The following table summarizes the carrying amount and estimated fair value of the Company’s financial instruments at December 31, 2020 and 2019 (in thousands):
| | | | | | | | | | | | | Carrying | | Fair | | Fair Value Measurements | As of December 31, 2020 | | Amount | | Value | | Level 1 | | Level 2 | | Level 3 | Contingent consideration | $ | 9,760 | $ | 9,760 | $ | — | $ | — | $ | 9,760 | Convertible senior notes | | 85,640 | | 1,272,766 | | — | | 1,272,766 | | — | Long-term debt | | 175,402 | | 175,402 | | — | | — | | 175,402 | Finance obligations | | 181,553 | | 181,553 | | — | | — | | 181,553 | | | | | | | | | | | | | | | | | | | | | | | | | Carrying | | Fair | | Fair Value Measurements | As of December 31, 2019 | | Amount | | Value | | Level 1 | | Level 2 | | Level 3 | Convertible senior notes | $ | 110,431 | $ | 188,775 | $ | — | $ | 135,320 | $ | 53,455 | Long-term debt | | 112,169 | | 112,169 | | — | | — | | 112,169 | Finance obligations | | 144,089 | | 144,089 | | — | | — | | 144,089 |
Equity Instruments
Common stock warrants that meet certain applicable requirements of ASC Subtopic 815-40, Derivatives and Hedging – Contracts in Entity’s Own Equity, and other related guidance, including the ability of the Company to settle the warrants without the issuance of registered shares or the absence of rights of the grantee to require cash settlement, are accounted for as equity instruments. The Company classifies these equity instruments within additional paid-in capital on the consolidated balance sheets.
Common stock warrants accounted for as equity instruments represent the warrants issued to Amazon and Walmart as discussed in Note 18, “Warrant Transaction Agreements.” The Company adopted FASB ASU 2019-08, Compensation – Stock Compensation (Topic 718) and Revenue from Contracts with Customers (Topic 606), which requires entities to measure and classify share-based payment awards granted to a customer by applying the guidance under Topic 718, as of January 1, 2019.
In order to calculate warrant charges, the Company used the Black-Scholes pricing model, which required key inputs including volatility and risk-free interest rate and certain unobservable inputs for which there is little or no market data, requiring the Company to develop its own assumptions. The Company estimated the fair value of unvested warrants, considered to be probable of vesting, at the time. Based on that estimated fair value, the Company determined warrant charges, which are recorded as a reduction of revenue in the consolidated statement of operations.
Redeemable Preferred Stock
We account for redeemable preferred stock as temporary equity in accordance with applicable accounting guidance in FASB ASC Topic 480, Distinguishing Liabilities from Equity. Dividends on the redeemable preferred stock are accounted for as an increase in the net loss attributable to common stockholders.
Income Taxes Income taxes are accounted for under the asset and liability method. Deferred tax assets and liabilities are recognized for the future tax consequences attributable to differences between the financial statement carrying amounts of existing assets and liabilities and their respective tax basis and operating loss and tax credit carryforwards. Deferred tax assets and liabilities are measured using enacted tax rates expected to apply to taxable income in the years in which those temporary differences are expected to be recovered or settled. The effect on deferred tax assets and liabilities of a change in tax rates is recognized in the period that includes the enactment date. A valuation allowance is recorded to reduce the carrying amounts of deferred tax assets if it is more likely than not that such assets will not be realized. The Company accounts for uncertain tax positions in accordance with FASB ASC No. 740-10-25, Income Taxes-Overall-Recognition. The Company recognizes in its consolidated financial statements the impact of a tax position only if that position is more likely than not to be sustained on audit, based on the technical merits of the position. The Company recognizes interest and penalties on the Interest and otherOther expense, net line in the accompanying consolidated statements of operations. Foreign Currency Translation Foreign currency translation adjustments arising from conversion of the Company’s foreign subsidiary’s financial statements to U.S. dollars for reporting purposes are included in accumulated other comprehensive income in stockholders’ equity on the consolidated balance sheets. Transaction gains and losses resulting from the effect of exchange rate changes on transactions denominated in currencies other than the functional currency of the Company’s operations give rise to realized foreign currency transaction gains and losses, and are included in interest and other income and interest and other expense, respectively, in the consolidated statements of operations. Research and Development Costs related to research and development activities by the Company are expensed as incurred. Certain research and development expenses have been reclassified for 2018, 2019 and 2020, including interim periods during 2019 and 2020 (see Note 2, “Restatement of Previously Issued Consolidated Financial Statements,” and Note 3 “Unaudited Quarterly Financial data and Restatement of Previously Issued Unaudited Interim Condensed Consolidated Financial Statements). Stock-Based Compensation The Company maintains employee stock-based compensation plans, which are described more fully in Note 20,19, “Employee Benefit Plans.”
Stock-based compensation represents the cost related to stock-based awards granted to employees and directors. The Company measures stock-based compensation cost at grant-date, based on the fair value of the award, and recognizes the cost as expense on a straight-line basis over the option’s requisite service period. Forfeitures are recognized as they occur. The Company estimates the fair value of stock-based awards using a Black-Scholes valuation model. Stock-based compensation expense is recorded in cost of revenue associated with sales of fuel cell systems, and related infrastructure and equipment, cost of revenue for services performed on fuel cell systems and related infrastructure, research and development expense and selling, general and administrative expenses in the consolidated statements of operations based on the employees’ respective function. Beginning in September 2021, the Company also issued performance stock option awards that include a market condition. The grant date fair value of performance stock options is estimated using a Monte Carlo simulation model and the cost is recognized using the accelerated attribution method. The Company records deferred tax assets for awards that result in deductions on the Company’s income tax returns, based upon the amount of compensation cost recognized and the Company's statutory tax rate. Differences between the deferred tax assets recognized for financial reporting purposes and the actual tax deduction reported on the Company's the deferred tax assets recognized for financial reporting purposes and the actual tax deduction reported on the Company's income tax return are recorded in the income statement. NaN tax benefit orTax expense (benefit) for stock-based compensation has been recorded during the yearsyear ended December 31, 2020, 2019 and 2018 since the Company remains in a full valuation allowance position.2022 was $0.8 million.
Convertible Senior Notes The Company accounts for its convertible senior notes with separate liability and equity components. The carrying amount of the liability component was initially determined by estimating the fair value of a similar debt instrument that does not have an associated convertible feature. The carrying amount of the equity component representing the conversion option was determined by deducting the estimated fair value of the liability component from the par value of the convertible senior notes, as a whole as of the date of issuance. This difference represents a debt discount that issingle liability measured at amortized to interest expense, with a corresponding increase to the carrying amount of the liability component, over the term of the convertible senior notes usingcost. The Company uses the effective interest rate method. The equity component is not remeasured as long as it continuesmethod to meetamortize the conditions for equity classification. The Company has allocateddebt issuance costs incurred to the liability and equity components. Issuance costs attributable to the liability component are being amortized tointerest expense over the respective term of the convertible senior notes, and issuance costs attributable to the equity components were netted with the respective equity component in additional paid-in capital.
Use of Estimates
The consolidated financial statements of the Company have been prepared in conformity with U.S. generally accepted accounting principles, which require management to make estimates and assumptions that affect the reported amounts of assets and liabilities and disclosure of contingent assets and liabilities at the date of the consolidated financial statements and the reported amounts of revenues and expenses during the reporting period. Actual results could differ from those estimates.
Reclassifications
Reclassifications are made, whenever necessary, to prior period financial statements to conform to the current period presentation.notes.
Subsequent Events The Company evaluates subsequent events at the date of the balance sheet as well as conditions that arise after the balance sheet date but before the consolidated financial statements are issued. The effects of conditions that existed at the balance sheet date are recognized in the consolidated financial statements. Events and conditions arising after the balance sheet date but before the consolidated financial statements are issued are evaluated to determine if disclosure is required to keep the consolidated financial statements from being misleading. To the extent such events and conditions exist, if any, disclosures are made regarding the nature of events and the estimated financial effects for those events and conditions. See Note 23, “Subsequent Events.” Recent Accounting Pronouncements Recently Adopted Accounting Pronouncements
In June 2016, ASU 2016-13, Financial Instruments – Credit Losses (Topic 326): Measurement of Credit Losses on Financial Instruments, was issued. Also, in April 2019, Accounting Standards Update (ASU) 2019-04, Codification Improvements to Topic 326, Financial Instruments—Credit Losses, Topic 815, Derivatives and Hedging, and Topic 825, Financial Instruments, was issued to make improvements to updates 2016-01, Financial Instruments – Overall (Subtopic 825-10), 2016-13, Financial Instruments – Credit Losses (Topic 326) and 2017-12, Derivatives and Hedging (Topic 815). ASU 2016-13 significantly changes how entities account for credit losses for financial assets and certain other instruments, including trade receivables and contract assets, that are not measured at fair value through net income. The ASU requires a number of changes to the assessment of credit losses, including the utilization of an expected credit loss model, which requires consideration of a broader range of information to estimate expected credit losses over the entire lifetime of the asset, including losses where probability is considered remote. Additionally, the standard requires the estimation of lifetime
expected losses for trade receivables and contract assets that are classified as current. The Company adopted these standards effective January 1, 2020 and determined the impact of the standards to be immaterial to the consolidated financial statements.
In January 2017, ASU 2017-04, Intangibles – Goodwill and Other (Topic 350), was issued to simplify how an entity is required to test goodwill for impairment by eliminating Step 2 from the goodwill impairment test. Step 2 measures a goodwill impairment loss by comparing the implied fair value of a reporting unit’s goodwill with the carrying amount of that goodwill. The Company adopted this standard effective January 1, 2020 and determined there to be no impact to the consolidated financial statements.
Recently Issued and Not Yet Adopted Accounting Pronouncements
In August 2020, the FASB issued ASU 2020-06, Debt - Debt with Conversion and Other Options (Subtopic 470-20) and Derivatives and Hedging - Contracts in Entity's Own Equity (Subtopic 815-40): Accounting for Convertible Instruments and Contracts in an Entity's Own Equity (“ASU 2020-06”). This ASU simplifies the complexity associated with applying GAAP for certain financial instruments with characteristics of liabilities and equity. More specifically, the amendments focus on the guidance for convertible instruments and derivative scope exception for contracts in an entity’s own equity. Under ASU 2020-06, the embedded conversion features are no longer separated from the host contract for convertible instruments with conversion features that are not required to be accounted for as derivatives under Topic 815, or that do not result in substantial premiums accounted for as paid-in capital. Consequently, a convertible debt instrument, such as the Company’s 3.75% Convertible Senior Notes, will be accounted for as a single liability measured at its amortized cost, as long as no other features require bifurcation and recognition as derivatives. The new guidance also requires the if-converted method to be applied for all convertible instruments and requires additional disclosures. This guidance is required to be adopted by January 1, 2022, and early adoption is permitted, but no earlier than fiscal years beginning after December 15, 2020. The Company has elected to early adopt this guidance on January 1, 2021 using the modified retrospective method. Under this transition method, the cumulative effect of accounting change removed the impact of recognizing the equity component of the Company’s convertible notes at issuance and the subsequent accounting impact of additional interest expense from debt discount amortization. The cumulative effect of the accounting change upon adoption on January 1, 2021 increased the carrying amount of the convertible notes by $120.7 million, reduced accumulated deficit by $9.5 million and reduced additional paid-in capital by $130.2 million. Future interest expense of the convertible notes will be lower as a result of adoption of this guidance and net loss per share will be computed using the if-converted method for convertible instruments.
In March 2020, ASU 2020-04, Reference Rate Reform (Topic 848): Facilitation of the Effects of Reference Rate Reform on Financial Reporting, was issued to provide temporary optional expedients and exceptions to the GAAP guidance on contract modifications and hedge accounting to ease the financial reporting burdens related to the expected market transition from the London Interbank Offered Rate (LIBOR) and other interbank offered rates to alternative reference rates. This update was effective starting March 12, 2020 and the Company may elect to apply the amendments prospectively through December 31, 2022. The adoption of this standard doesis not expected to have a material impact on the Company’s consolidated financial statements. During the fourth quarter of fiscal year 2022, the Company adopted the optional relief guidance provided under this ASU after modifying certain debt to update the reference rate from LIBOR to SOFR. This caused a temporary mismatch in our interest rate swap and debt for a period of time. The application of this expedient preserves the presentation of the derivatives consistent with past presentation. In October of 2021, ASU No. 2021-08- Business Combinations (Topic 805): Accounting for Contract Assets and Contract Liabilities from Contracts with Customers was issued. The standard update provides an exception to the fair value measurement for revenue contracts acquired in a business combination. The Company has elected to early adopt the standards update as of the fourth quarter of 2021. On January 1, 2021, we early adopted ASU No. 2020-06, Debt — Debt with Conversion and Other Options (Subtopic 470-20) and Derivatives and Hedging — Contracts in Entity’s Own Equity (Subtopic 815-40) using the modified retrospective approach. Consequently, the Company’s 3.75% Convertible Senior Notes due 2025 (the “3.75% Convertible Senior Notes”) is now accounted for as a single liability measured at its amortized cost. This accounting change removed the impact of recognizing the equity component of the Company’s convertible notes at issuance and the subsequent accounting impact of additional interest expense from debt discount amortization. Future interest expense of the convertible notes will be lower as a result of adoption of this guidance and net loss per share will be computed using the if-converted method for convertible instruments. The cumulative effect of the accounting change upon adoption on January 1, 2021 increased the carrying amount of the 3.75% Convertible Senior Notes by $120.6 million, reduced accumulated deficit by $9.6 million and reduced additional paid-in capital by $130.2 million. Recently Issued and Not Yet Adopted Accounting Pronouncements In March 2020, ASU 2020-03, Codification Improvements to Financial Instruments, was issued to make various codification improvements to financial instruments to make the standards easier to understand and apply by eliminating inconsistencies and providing clarifications. This update will be effective at various dates beginning with date of issuance of this ASU. The adoption of this standard doeswill not have a material impact on the Company’s consolidated financial statements. In3. Acquisitions
Alloy Custom Products, LLC and WesMor Cryogenics, LLC On December 2019, Accounting Standards Update (ASU) 2019-12,Simplifying5, 2022, the AccountingCompany acquired two subsidiaries of Cryogenic Industrial Solutions, LLC, Alloy Custom Products, LLC, and WesMor Cryogenics, LLC (collectively, “CIS”). The CIS acquisition will allow the Company to increase its production capabilities for Income Taxes,stainless steel and aluminum cryogenic transport truck-mounted cryogenic pressure vessels, cryogenic transport trailers, and other mobile storage containers. The fair value of consideration paid by the Company in connection with the CIS acquisition was issued to identify, evaluate, and improve areas of GAAP for which cost and complexity can be reduced while maintaining or improvingas follows (in thousands): | | | Cash | $ | 30,700 | Due to Cryogenic Industrial Solutions, LLC | | 500 | Plug Power Inc. Common Stock | | 6,107 | Total consideration | $ | 37,307 |
The following table summarizes the usefulnesspreliminary allocation of the purchase price to the estimated fair value of the net assets acquired, excluding goodwill (in thousands): | | | Cash | $ | 267 | Accounts receivable | | 5,038 | Inventory | | 11,120 | Prepaid expenses and other assets | | 464 | Property, plant and equipment | | 3,887 | Right of use asset | | 1,538 | Identifiable intangible assets | | 13,430 | Lease liability | | (1,562) | Accounts payable, accrued expenses and other liabilities | | (3,826) | Deferred revenue | | (6,193) | Total net assets acquired, excluding goodwill | $ | 24,163 |
The preliminary allocation of the purchase price is still considered provisional due to the finalization of the valuation for the assets acquired and liabilities assumed and related tax liabilities, if any, in relation to the CIS acquisition. Therefore, the fair values of the assets acquired and liabilities assumed are subject to change as we obtain additional information providedfor valuation assumptions such as market demand for CIS product lines to userssupport forecasted financial data, which will not exceed 12 months from the date of financial statements. This update will be effective beginning after December 15, 2020. acquisition. The adoptionfair value of this standard doesthe tradename totaling $6.2 million was calculated using the relief from royalty approach which is a variant of the income approach, and was assigned a useful life of fifteen years. The fair value of the customer relationships totaling $7.1 million was calculated using the multi-period excess earnings method (“MPEEM”) approach which is a variant of the income approach, and was assigned a useful life of fifteen years. The basic principle of the MPEEM approach is that a single asset, in isolation, is not havecapable of generating cash flow for an enterprise. Several assets are brought together and exploited to generate cash flow. The fair value of the non-compete agreements was $0.2 million with a material impact on the Company’s consolidated financial statements.useful life of five years. 5. AcquisitionsThe goodwill was primarily attributed to the value of synergies created with the Company’s current and future offerings and the value of the assembled workforce. Goodwill and intangible assets are not deductible for income tax purposes. Goodwill associated with the CIS acquisition was calculated as follows (in thousands):
| | | Consideration paid | $ | 37,307 | Less: net assets acquired | | (24,163) | Total goodwill recognized | $ | 13,144 |
The acquisition of CIS contributed $3.7 million to total consolidated revenue for the year ended December 31, 2022. Giner ELX Inc. AcquisitionJoule Processing LLC
On June 22, 2020,January 14, 2022, the Company acquired 100% of the outstanding shares of Giner ELX, Inc.Joule Processing LLC (“Giner ELX”Joule”). Giner ELX is developer of electrolysis hydrogen generators which can be used for a variety of applications, including on-site refueling of hydrogen fuel cells., an engineered modular equipment, process design and procurement company founded in 2009. The fair value of consideration paid by the Company in connection with the Giner ELXJoule acquisition was as follows (in thousands): | | | | | Cash | $ | 25,820 | | 28,140 | Plug Power Stock | | 19,263 | | Contingent consideration | | 7,790 | | 41,732 | Total consideration | $ | 52,873 | $ | 69,872 |
The contingent consideration represents the estimated fair value associated with earn-out payments of up to $16.0$130.0 million that the sellers are eligible to receive.receive in cash or shares of the Company’s common stock (at the Company’s election). Of the total earnout consideration, $8.0$90.0 million is related to the achievement of the Allagash earn-out, $2.0certain financial performance and $40 million is associated with the receipt of certain customer opportunities (purchase orders or other contracts) by December 31, 2021, and $6.0 million is associated withrelated to the achievement of certain revenue targets for years 2021 through 2023. The Allagash earn-out is achieved when the Company has produced at least 2 PEM electrolyzer stacks of one megawatt each, utilizing the dry build process and meets certain technical specifications as more fully described in the merger agreement. To be fully paid, the Allagash earn-out needs to be satisfied by July 31, 2023 and is reduced by approximately 8.33% each month beyond this date. In addition to the above, should the earn-out revenue exceed 150% of the 2023 target, the sellers will receive warrants with a value of $5.0 million and if the earn-out revenue exceeds 200% of the 2023 revenue target, the sellers will receive warrants with a value of $10.0 million. The warrants are exercisable within two years of issuance.
In connection with the Giner ELX acquisition, the Company revised the acquisition-date fair value of contingent consideration liabilities which were determined to be measurement period adjustments and resulted in an increase in other liabilities and goodwill of $0.7 million for the year ended December 31, 2020.operational milestones.
The following table summarizes the final allocation of the purchase price to the estimated fair value of the net assets acquired, excluding goodwill (in thousands): | | | Accounts receivable | $ | 1,237 | Inventory | | 4,108 | Prepaid expenses and other assets | | 669 | Property, plant and equipment | | 596 | Identifiable intangibles | | 29,930 | Accounts payable, accrued expenses and other liabilities | | (1,621) | Deferred revenue | | (2,350) | Deferred tax liability, net | | (5,889) | Total net assets acquired, excluding goodwill | $ | 26,680 |
Identifiable intangibles consisted of developed technology, non-compete agreements, estimated in-process research and development (“IPR&D”), and customer relationships.
The fair value of acquired backlog and non-complete agreements was nominal.
| | | Current assets | $ | 2,672 | Property, plant and equipment | | 493 | Right of use asset | | 182 | Identifiable intangible assets | | 60,522 | Lease liability | | (374) | Current liabilities | | (2,612) | Contract liability | | (3,818) | Total net assets acquired, excluding goodwill | $ | 57,065 |
The fair value of the developed technology totaling $59.2 million included in the identifiable intangible assets was calculated using the MPEEM approach. Therefore, to determine cash flow from the developed technology over its useful life of 15 years, one must deduct the related expenses incurred for the exploitation of other assets used for the generation of overall cash flow. The fair value of the tradename totaling $0.8 million was calculated using the relief from royalty approach which is a variant of the income approach, and was assigned a useful life of four years. The fair value of the non-compete agreements was $0.5 million with a useful life of six years. In addition to identifiable intangible assets, the fair value of acquired IPR&Dwork in process and finished goods inventory, included in inventory, was estimated based on the estimated selling price less costs to be incurred and a market participant profit rate. In connection with the acquisition, the Company recorded on its consolidated balance sheet a liability of $41.7 million representing the fair value of contingent consideration payable, and is recorded in the consolidated balance sheet in the loss accrual for service contracts and other liabilities. The fair value of this contingent consideration was $53.2 million as of December 31, 2022, and as a result a $11.5 million increase was recorded in the consolidated statement of operations for the year ended December 31, 2022. Included in the purchase price consideration are contingent earn-out payments as described above. Due to the nature of the earn-outs, a scenario based analysis using the probability of achieving the milestone expectations was used to determine the fair value of the contingent consideration. These fair value measurements were based on unobservable inputs and are considered to be Level 3 financial instruments. The goodwill was primarily attributed to the value of synergies created with the Company’s current and future offerings and the value of the assembled workforce. Goodwill and intangible assets are not deductible for income tax purposes. Goodwill associated with the Joule acquisition was calculated as follows (in thousands): | | | Consideration paid | $ | 28,140 | Contingent consideration | | 41,732 | Less: net assets acquired | | (57,065) | Total goodwill recognized | $ | 12,807 |
During the year ended December 31, 2022, the Company recorded a measurement period adjustment to decrease goodwill by $0.1 million due to the payment of a hold back liability, which was recorded in accrued expenses in the condensed consolidated balance. The acquisition of Joule contributed $36.5 million to total consolidated revenue for the year ended December 31, 2022, respectively. Applied Cryo Technologies Acquisition On November 22, 2021, the Company acquired 100% of the outstanding shares of Applied Cryo Technologies, Inc. (“Applied Cryo”). Applied Cryo is a manufacturer of engineered equipment servicing multiple applications, including cryogenic trailers and mobile storage equipment for the oil and gas markets and equipment for the distribution of liquified hydrogen, oxygen, argon, nitrogen and other cryogenic gases. The fair value of consideration paid by the Company in connection with the Applied Cryo acquisition was as follows (in thousands): | | | Cash | $ | 98,559 | Plug Power Inc. Common Stock | | 46,697 | Contingent consideration | | 14,000 | Settlement of preexisting relationship | | 2,837 | Total consideration | $ | 162,093 |
Included in the $98.6 million of cash consideration above, $5.0 million is consideration held by our paying agent in connection with this acquisition reported as restricted cash, with a corresponding accrued liability as of December 31, 2022 on the Company’s consolidated balance sheet. We expect that this will be settled in the first half of 2023. The contingent consideration represents the estimated fair value associated with earn-out payments of up to $30.0 million that the sellers are eligible to receive in the form of cash or shares of the Company’s Common Stock (at the Company’s election). Of the total earnout consideration, $15.0 million is related to the dry stackachievement of certain production targets during the period of January 1, 2022 through July 1, 2024, and $15.0 million is associated with the achievement of certain cost targets during the same period. The following table summarizes the final allocation of the purchase price to the estimated fair value of the net assets acquired, excluding goodwill (in thousands): | | | Cash | $ | 1,180 | Accounts receivable | | 4,123 | Inventory | | 24,655 | Prepaid expenses and other assets | | 1,506 | Property, plant and equipment | | 4,515 | Right of use asset | | 2,788 | Identifiable intangible assets | | 70,484 | Lease liability | | (2,672) | Accounts payable, accrued expenses and other liabilities | | (7,683) | Deferred tax liability | | (16,541) | Deferred revenue | | (12,990) | Total net assets acquired, excluding goodwill | $ | 69,365 |
During the year ended December 31, 2022, the Company recorded a measurement period adjustment to decrease goodwill by $0.5 million due to a release of escrow, which was recorded to accrued expenses in the condensed consolidated balance sheet. Identifiable intangible assets consisted of developed technology, non-compete agreements, backlog, tradename, and customer relationships. The fair value of the developed technology totaling $29.0$26.3 million was calculated using the relief from royalty approach which is a variant of the income approach. The application of the relief from royalty approach involves estimating the value of an intangible asset by quantifying the present value of the stream of market derived royalty payments that the owner of the intangible asset is exempted or ‘relieved’ from paying. The fair value of the tradename totaling $13.7 million was calculated using the relief from royalty approach. The fair value of the acquired customer relationships totaling $26.6 million was calculated using the multi-period excess earnings method (“MPEEM”) approach which is a variant of the income approach. The basic principle of the MPEEM approach is that a single asset, in isolation, is not capable of generating cash flow for an enterprise. Several assets are brought together and exploited to generate cash flow. Therefore, to determine cash flow from the exploitation of IPR&D,customer relationships, one must deduct the related expenses incurred for the exploitation of other assets used for the generation of overall cash flow and revenues.flow. The fair value of IPR&Dthe customer relationships was estimated by discounting the net cash flow derived from the expected revenues attributable to the acquired IPR&D.customer relationships. The fair value of the acquired customer relationships totaling $0.4 millionnon-compete agreements and backlog was calculated using a distributor method approach, which is a variant of the income approach. The fair value of wet stack technology totaling $0.4 million was determined using the relief from royalty method.$3.9 million. In addition to identifiable intangible assets, the fair value of acquired work in process and finished goods inventory was estimated based on the estimated selling price less costs to be incurred and a market participant profit rate. Additionally, the fair value of the deferred revenue was determined using a cost build-up approach. The direct cost of fulfilling the obligation plus a normal profit margin was used to determine the value of the assumed deferred revenue liability. Included in the purchase consideration are threefour contingent earn-out payments (as described above): the Allagashfirst production earn-out, second production earn-out, the customer opportunities,first cost earn-out, and the revenue targets.second cost earn-out. Due to the nature of the Allagash and customer opportunities,earn-outs, as outlined in the purchase agreement, a scenario based method (“SBM”) was used to value these contingent payments as the payments are milestone based in nature. These fair value measurements were based on unobservable inputs and are considered to be level 3 financial instruments. The revenue targets are achieved when certain revenue thresholds are met, and the catch-up provision creates path-dependency. As such, the revenue earn-out was valued using a Monte Carlo Simulation. In connection with the acquisition, the Company recorded on its consolidated balance sheet aan initial liability of $7.8$14.0 million representing the fair value of contingent consideration payable.payable, and is recorded in the consolidated balance sheet in the loss accrual for service contracts and other liabilities. The fair value of this contingent consideration was remeasured$15.9 million as of December 31, 2020, 2022, and was estimated to be $9.6 million. Thisas a result a $1.9 million increase in fair value of $1.8 million, which was primarily due to a change in the discount rate offset by a decrease in the discount period, was recorded as an expense in the consolidated statement of operations for the year ended December 31, 2020. 2022. Included in Giner ELX’s net assets acquired are net deferred tax liabilities of $5.9 million. In connection ofwith the acquisition of these net deferred tax liabilities, the Company reduced its valuation allowance by $5.2$16.5 million and recognized a tax benefit $5.2$16.5 million during the year ended December 31, 2020.2021.
Goodwill associated with the Giner ELX acquisition was calculated as follows (in thousands):
| | | Consideration paid | $ | 52,873 | Less: net assets acquired | | (26,680) | Total goodwill recognized | $ | 26,193 |
The goodwill consists of the Company’s increased capabilities in green hydrogen supply through the production of electrolyzers. The synergies with the Company’s production of hydrogen storage and dispensing equipment are important to the Company as the demand for green hydrogen is expected to increase.
United Hydrogen Group Inc. Acquisition
On June 18, 2020, the Company acquired 100% of the outstanding shares of United Hydrogen Group Inc. (“UHG”). UHG produces and sells liquid hydrogen.
The fair value of consideration paid by the Company in connection with the UHG acquisition was as follows (in thousands):
| | | Cash | $ | 19,293 | Plug Power Stock | | 30,410 | Contingent consideration | | 1,110 | Total consideration | $ | 50,813 |
Included in cash and common stock in the above table is $1.0 million of cash and $6.5 million of common stock that was paid in April 2020 to purchase a convertible note in UHG. This convertible note included terms that allowed for
reductionThe goodwill was primarily attributed to the value of synergies created with the Company’s current and future offerings and the value of the purchase price if the Company were to complete the acquisition of UHG. As such, this note was cancelled in conjunctionassembled workforce. Goodwill and intangible assets are not deductible for income tax purposes. Goodwill associated with the closing of this acquisition. Applied Cryo acquisition was calculated as follows (in thousands):
| | | Consideration paid | $ | 162,093 | Less: net assets acquired | | (69,365) | Total goodwill recognized | $ | 92,728 |
Frames Holding B.V. Acquisition A portionOn December 9, 2021, the Company acquired 100% of the purchase priceoutstanding shares of UHGFrames Holding B.V. (“Frames”). Frames, a leader in turnkey systems integration for the energy section, designs, builds, and delivers processing equipment, separation technologies, flow control and safeguarding systems, renewable energy and water solutions.
The fair value of consideration paid by the Company in connection with the Frames acquisition was as follows (in thousands): | | | Cash | $ | 94,541 | Contingent consideration | | 29,057 | Settlement of preexisting relationship | | 4,263 | Total consideration | $ | 127,861 |
The contingent consideration represents the estimated fair value associated with earn-out payments of up to €30.0 million that the sellers are eligible to receive in the form of contingent consideration.cash. The contingent consideration is contingent on future performance related to two discrete milestones associated with the expansion of the liquefication capacity of the Charleston, Tennessee liquid hydrogen plant (the “Charleston Plant”). The Company’s liability for this contingent consideration was measured at fair value based on the Company’s expectations of achieving the expansion milestone. The expected performance was assessed by management which was discounted to present value in order to derive a fair value of the contingent consideration. This fair value measurement was based on unobservable inputs and is considered a level 3 financial instrument. Due to the milestone nature of the payments, a scenario based method (“SBM”) was used to value these contingent payments.
The estimated fair value of the contingent consideration as of the acquisition date was $1.1 million. Subsequently, a payment of $300 thousand was made to the sellers as a result of achieving the first milestone related to the expansionachievement of certain production targets during the liquefication capacityfour years following the closing date and is payable in two equal installments. The first target is achieved when the Company has shipped or has made ready for shipment 100MW of containerized electrolyzer systems, or non-containerized electrolyzer systems or arrays. The remaining targets are achieved when the Charleston Plant. A reductionCompany has shipped or has made ready for shipment an additional 50MW of the contingent consideration liabilitycontainerized electrolyzer systems, or non-containerized electrolyzer systems or arrays, with a maximum of $610 thousand was also recorded subsequent to the acquisition due to a reduction in the probability assessment that the second expansion milestone will be met. As of December 31, 2020, the remaining contingent consideration liability related to the UHG acquisition was $200 thousand.additional 150MW.
The following table summarizes the final allocation of the purchase price to the estimated fair value of the net assets acquired, excluding goodwill (in thousands): | | | | | Cash | | $ | 45,394 | Accounts receivable | $ | 444 | | 17,910 | Inventory | | 89 | | 34 | Prepaid expenses and other assets | | 1,152 | | 3,652 | Property, plant and equipment | | 41,244 | | 709 | Leased property | | 796 | | Identifiable intangible asset | | 2,338 | | Long-term debt | | (11,336) | | Unfavorable customer contract | | (15,757) | | Accounts payable, accrued expenses, deferred revenue and finance obligations | | (4,631) | | Right of use asset | | | 1,937 | Contract asset | | | 9,960 | Identifiable intangible assets | | | 50,478 | Lease liability | | | (1,937) | Contract liability | | | (22,737) | Accounts payable, accrued expenses and other liabilities | | | (18,465) | Deferred tax liability | | | (10,644) | Provision for loss contracts | | | (2,636) | Warranty provisions | | | (7,566) | Total net assets acquired, excluding goodwill | $ | 14,339 | $ | 66,089 |
The identifiable intangible asset consistedDuring the year ended December 31, 2022, the Company recorded a measurement period adjustment of developed technology, as described below in Note 10, “Intangible Assets and Goodwill.” The fair valuean increase to goodwill by $6.6 million due to the recording of the developed technology totaling $2.3 million was calculated usingdeferred tax liabilities surrounding the relief from royalty approach which is a variant of the income approach. The application of the relief from royalty approach involves estimating the value of antangible and intangible asset by quantifying the present value of the stream of market derived royalty payments that the owner of the intangible asset is exempted or ‘relieved’ from paying.assets acquired.
Additionally, the Company estimated the fair value of an unfavorable customer contract. The fair value of the acquired unfavorable customer contract was calculated using a with and with-out analysis which is a variant of the income approach. Cash flows were calculated using pricing per terms of the existing contract and then compared to cash flows using expected market pricing. The difference between the two cash flows was used to determine the fair value of the contract. Further, the Company assumed interest-bearing debt. The fair value of the assumed debt was calculated using the discounted cash flow method.
In connection with the UHG acquisition, the Company finalized the valuation of an unfavorable customer contract and long-term debt which resulted in an increase in other liabilities of $1.9 million, a decrease in long-term debt of $1.7 million, and an increase in goodwill of $0.2 million.
Goodwill associated with the UHG acquisition was calculated as follows (in thousands):
| | | Consideration paid | $ | 50,813 | Less: net assets acquired | | (14,339) | Total goodwill recognized | $ | 36,474 |
The Company now has capabilities in liquid hydrogen generation, liquefactionIdentifiable intangible assets consisted of developed technology, non-compete agreements, backlog, tradename, and distribution logistics, which is important in a growing hydrogen market.
Goodwill recorded in connection with the acquisitions is not deductible for tax purposes. customer relationships.
The resultsfair value of the Giner ELXdeveloped technology totaling $5.3 million was calculated using the relief from royalty approach which is a variant of the income approach. The fair value of the tradename totaling $11.6 million was calculated using the relief from royalty approach. The fair value of the acquired customer relationships totaling $27.2 million was calculated using the MPEEM approach which is a variant of the income approach. The fair value of the customer relationships was estimated by discounting the net cash flow derived from the expected revenues attributable to the acquired customer relationships. The fair value of the non-compete agreements totaling $4.9 million was calculated using the with and UHG are includedwithout income approach. The fair value of the backlog was $1.4 million. Included in the purchase consideration are four contingent earn-out payments (as described above). Due to the nature of the earn-outs, as outlined in the purchase agreement, a scenario based analysis using the probability of achieving the milestone expectations was used to determine the fair value of the contingent consideration. These fair value measurements were based on unobservable inputs and are considered to be level 3 financial instruments. In connection with the acquisition, the Company recorded on its consolidated balance sheet a liability of $29.1 million representing the fair value of contingent consideration payable, and is recorded in the consolidated balance sheet in the loss accrual for service contracts and other liabilities. The fair value of this contingent consideration was $31.0 million as of December 31, 2022, of which $3.4 million was due to an increase in the fair value of the liability and was recorded in the consolidated statement of operations, offset by $1.7 million due to the foreign currency translation. Included in Frames’ net assets acquired are net deferred tax liabilities of $10.6 million. The goodwill was primarily attributed to the value of synergies created with the Company’s current and future offerings and the value of the assembled workforce. Goodwill and intangible assets are not deductible for income tax purposes. Goodwill associated with the Frames acquisition was calculated as follows (in thousands): | | | Consideration paid | $ | 127,861 | Less: net assets acquired | | (66,089) | Total goodwill recognized | $ | 61,772 |
Purchased goodwill is not expected to be deductible for tax purposes. The acquisition of Frames would have contributed $75.7 million and $3.8 million to total consolidated financial statementsrevenue and net income for the year ended December 31, 2020 from their respective dates of acquisition. Revenues from Giner ELX and UHG included in2021, respectively, had the Company’sacquisition occurred on January 1, 2021. The following table reflects the unaudited pro forma results of operations for the year ended December 31, 2020 totaled $3.6 million and $4.2 million, respectively.2021 assuming that the Frames acquisition had occurred on January 1, 2021 (in thousands): | | | | For the year ended | | December 31, 2021 | Revenue | $ | 570,502 | Net loss | $ | (456,510) |
NeitherNone of the Giner ELX acquisition nor the UHG acquisition wasCIS, Joule or Applied Cryo acquisitions were material to our consolidated results of operations or financial position and, therefore, pro forma financial information is not presented.
4. Investments The fair values of the Company’s investments are based upon prices provided by an independent pricing service. Management has assessed and concluded that these prices are reasonable and has not adjusted any prices received from the independent provider. The amortized cost, gross unrealized gains and losses, fair value of those investments classified as available-for-sale, and allowance for credit losses at December 31, 2022 are summarized as follows (in thousands): | | | | | | | | | | | | | | | | December 31, 2022 | | Amortized | | Gross | | Gross | | Fair | | Allowance for | | Cost | | Unrealized Gains | | Unrealized Losses | | Value | | Credit Losses | Corporate bonds | $ | 200,735 | | $ | 7 | | $ | (7,109) | | $ | 193,633 | | | — | U.S. Treasuries | | 1,154,879 | | | 111 | | | (15,680) | | | 1,139,310 | | | — | Total | $ | 1,355,614 | | $ | 118 | | $ | (22,789) | | $ | 1,332,943 | | $ | — |
The amortized cost, gross unrealized gains and losses, fair value of those investments classified as available-for-sale, and allowance for credit losses at December 31, 2021 are summarized as follows (in thousands): | | | | | | | | | | | | | | | | December 31, 2021 | | Amortized | | Gross | | Gross | | Fair | | Allowance for | | Cost | | Unrealized Gains | | Unrealized Losses | | Value | | Credit Losses | Corporate bonds | $ | 228,614 | | $ | — | | $ | (2,232) | | $ | 226,382 | | | — | U.S. Treasuries | | 1,014,319 | | | 20 | | | (456) | | | 1,013,883 | | | — | Total | $ | 1,242,933 | | $ | 20 | | $ | (2,688) | | $ | 1,240,265 | | $ | — |
The following table summarizes the fair value and gross unrealized losses on securities classified as available-for-sale, and length of time that the individual securities have been in a continuous loss position as of December 31, 2022 (in thousands): | | | | | | | | | | | | | | | | | | | December 31, 2022 | | Less than 12 months | | 12 months or greater | | Total | | Fair Value of | | | | Fair Value of | | | | Fair Value of | | | | Investments with | | Gross Unrealized | | Investments with | | Gross Unrealized | | Investments with | | Gross Unrealized | | Unrealized Losses | | Losses | | Unrealized Losses | | Losses | | Unrealized Losses | | Losses | Corporate bonds | $ | 39,047 | | $ | (1,186) | | $ | 152,837 | | $ | (5,924) | | $ | 191,884 | | $ | (7,110) | U.S. Treasuries | | 491,633 | | | (969) | | | 356,610 | | | (14,710) | | | 848,243 | | | (15,679) | Total available-for-sale securities | $ | 530,680 | | $ | (2,155) | | $ | 509,447 | | $ | (20,634) | | $ | 1,040,127 | | $ | (22,789) |
The aggregate fair value of available-for-sale securities in an unrealized loss position at December 31, 2021 was $969.0 million. No available-for-sale securities had been in a continuous unrealized loss position for greater than 12 months in 2021. We regularly review available-for-sale securities for declines in fair values that we determine to be credit related. In order to determine whether an allowance for credit losses was required, we considered factors such as whether amounts related to securities have become uncollectible, whether we intend to sell a security, and whether it is more likely than not that we will be required to sell a security prior to recovery. The Company also reviewed the declines in market value related to our available-for-sale securities and determined that these declines were due to fluctuations in interest rates. As of December 31, 2022, the Company did not have an allowance for credit losses related to available-for-sale securities. The cost, gross unrealized gains and losses, and fair value of those investments classified as equity securities at December 31, 2022 are summarized as follows (in thousands): | | | | | | | | | | | | | December 31, 2022 | | | | | Gross | | Gross | | Fair | | | Cost | | Unrealized Gains | | Unrealized Losses | | Value | Fixed income mutual funds | $ | 70,257 | | $ | — | | $ | (2,620) | | $ | 67,637 | Exchange traded mutual funds | | 75,999 | | | — | | | (8,800) | | | 67,199 | Total | $ | 146,256 | | $ | — | | $ | (11,420) | | $ | 134,836 |
The cost, gross unrealized gains and losses, and fair value of those investments classified as equity securities at December 31, 2021 are summarized as follows (in thousands): | | | | | | | | | | | | | December 31, 2021 | | | | | Gross | | Gross | | Fair | | | Cost | | Unrealized Gains | | Unrealized Losses | | Value | Fixed income mutual funds | $ | 70,247 | | $ | — | | $ | (574) | | $ | 69,673 | Exchange traded mutual funds | | 71,010 | | | 7,312 | | | — | | | 78,322 | Total | $ | 141,257 | | $ | 7,312 | | $ | (574) | | $ | 147,995 |
A summary of the amortized cost and fair value of investments classified as available-for-sale, by contractual maturity, as of December 31, is as follows (in thousands): | | | | | | | | | | | | | December 31, 2022 | | December 31, 2021 | | | Amortized | | Fair | | | Amortized | | Fair | Maturity: | | Cost | | Value | | | Cost | | Value | Less than 12 months | $ | 1,045,120 | | $ | 1,039,333 | | $ | 670,584 | | $ | 670,306 | 12 months or greater | | 310,494 | | | 293,610 | | | 572,349 | | | 569,959 | Total | $ | 1,355,614 | | $ | 1,332,943 | | $ | 1,242,933 | | $ | 1,240,265 |
Accrued interest income was $3.0 million and $3.7 at December 31, 2022 and 2021, respectively, and is included within the balance for prepaid expenses and other current assets in the consolidated balance sheets. Equity Method Investments As of December 31, 2022 and December 31, 2021, the Company accounted for the following investments in the investee’s common stock under the equity method, which are included in the investments in non-consolidated entities and non-marketable equity securities on the consolidated balance sheets (amounts in thousands): | | | | | | | | | | | | | | | | | As of December 31, 2022 | | As of December 31, 2021 | | | Formation | | Common Stock | | Carrying | | Common Stock | | Carrying | Investee | | Date | | Ownership % | | Value | | Ownership % | | Value | HyVia | | Q2 2021 | | 50% | | $ | 11,281 | | 50% | | $ | 6,545 | AccionaPlug S.L. | | Q4 2021 | | 50% | | | 2,225 | | 50% | | | 526 | SK Plug Hyverse | | Q1 2022 | | 49% | | | 8,937 | | N/A | | | — | | | | | | | $ | 22,443 | | | | $ | 7,071 |
5. Fair value measurements Securities reported at fair value utilizing Level 1 inputs represent assets whose fair value is determined based upon observable unadjusted quoted market prices for identical assets in active markets. Level 2 securities represent assets whose fair value is determined using observable market information such as previous day trade prices, quotes from less active markets or quoted prices of securities with similar characteristics. Available-for-sale securities are characterized as Level 1 assets, such as U.S. Treasuries, and Level 2 assets, as value of the corporate bonds are determined using observable market inputs. Equity securities are characterized as Level 1 assets, as their fair values are determined using active markets for identical assets. There were no transfers between Level 1, Level 2, or Level 3 for the year ended December 31, 2022. Financial instruments not recorded at fair value on a recurring basis include equity method investments that have not been remeasured or impaired in the current period, such as our investments in HyVia, AccionaPlug S.L., and SK Plug Hyverse. During the year ended December 31, 2022, the Company contributed approximately $25.0 million, $0.8 million and $8.3 million, respectively, to HyVia, AccionaPlug S.L. and SK Plug Hyverse. The following table summarizes the carrying amount and estimated fair value of the Company’s financial instruments at December 31, 2022 and 2021 (in thousands): | | | | | | | | | | | | | As of December 31, 2022 | | | Carrying | | Fair | | Fair Value Measurements | | | Amount | | Value | | Level 1 | | Level 2 | | Level 3 | Assets | | | | | | | | | | | Cash equivalents | $ | 212,577 | $ | 212,577 | $ | 212,577 | $ | — | $ | — | Corporate bonds | | 193,633 | | 193,633 | | — | | 193,633 | | — | U.S. Treasuries | | 1,139,310 | | 1,139,310 | | 1,139,310 | | — | | — | Equity securities | | 134,836 | | 134,836 | | 134,836 | | — | | — | | | | | | | | | | | | Liabilities | | | | | | | | | | | Contingent consideration | | 116,165 | | 116,165 | | — | | — | | 116,165 |
| | | | | | | | | | | | | As of December 31, 2021 | | | Carrying | | Fair | | Fair Value Measurements | | | Amount | | Value | | Level 1 | | Level 2 | | Level 3 | Assets | | | | | | | | | | | Cash equivalents | $ | 115,241 | $ | 115,241 | $ | 115,241 | $ | — | $ | — | Corporate bonds | | 226,382 | | 226,382 | | — | | 226,382 | | — | U.S. Treasuries | | 1,013,883 | | 1,013,883 | | 1,013,883 | | — | | — | Equity securities | | 147,995 | | 147,995 | | 147,995 | | — | | — | Swaps and forward contracts | | 70 | | 70 | | 70 | | — | | — | | | | | | | | | | | | Liabilities | | | | | | | | | | | Contingent consideration | | 62,297 | | 62,297 | | — | | — | | 62,297 | Swaps and forward contracts | | 981 | | 981 | | 981 | | — | | — |
The liabilities measured at fair value on a recurring basis that have unobservable inputs and are therefore categorized as Level 3 are related to contingent consideration. The fair value as of December 31, 2022 is comprised of $100.1 million related to the acquisitions of Frames, Applied Cryo, and Joule, as well as $16.1 million from two acquisitions in 2020. Giner ELX, Inc. was acquired in June 2020, the remaining contingent consideration of $14.5 million as of December 31, 2022 is related to the achievement of the dry build electrolyzer stack earnout and the achievement of certain revenue targets for years 2022 through 2023. United Hydrogen Group Inc. was acquired in June 2020, and included in the purchase price was contingent consideration based on the future performance related to the expansion of the liquefication capacity of the Charleston, Tennessee liquid hydrogen plant. The Company’s liability for this contingent consideration was measured at fair value based on the Company’s expectations of achieving the expansion milestone. In the audited consolidated balance sheets, contingent consideration is recorded in the contingent consideration, loss accrual for service contracts, and other liabilities financial statement line item, and is comprised of the following unobservable inputs for the year ending December 31, 2022: | | | | | | | Financial Instrument | | Fair Value | Valuation Technique | Unobservable Input | Range (weighted average) | Contingent Consideration | | $ | 85,269 | Scenario based method | Credit spread | 15.73% - 15.74% | | | | | | Discount rate | 19.85% - 20.68% | | | | 11,310 | Monte carlo simulation | Credit spread | 15.74% | | | | | | Discount rate | 20.00%-20.30% | | | | | | Revenue volatility | 45.29% | | | | 19,586 | Monte carlo simulation | Credit spread | 15.73% | | | | | | Revenue volatility | 35.7% - 23.1% (35.0%) | | | | | | Gross profit volatility | 106.7% - 23.2% (60.0%) | | | | 116,165 | | | |
In the audited consolidated balance sheets, contingent consideration is recorded in the contingent consideration, loss accrual for service contracts, and other liabilities financial statement line item, and is comprised of the following unobservable inputs for the year ending December 31, 2021: | | | | | | | Financial Instrument | | Fair Value | Valuation Technique | Unobservable Input | Range (weighted average) | Contingent Consideration | | $ | 49,927 | Scenario based method | Credit spread | 12.31% - 12.57% | | | | | | Discount rate | 12.45% - 13.13% | | | | 12,370 | Monte carlo simulation | Credit spread | 12.40% | | | | | | Discount rate | 12.46%-13.18% | | | | | | Revenue volatility | 48.60% | | | | 62,297 | | | |
The change in the carrying amount of Level 3 liabilities for the year ended December 31, 2022 was as follows (in thousands): | | | | Year ended | | December 31, 2022 | Beginning Balance at December 31, 2021 | | 62,297 | Payments | | (2,667) | Additions due to acquisitions | | 41,732 | Fair value adjustments | | 16,468 | Foreign currency translation adjustment | | (1,665) | Ending balance at December 31, 2022 | | 116,165 |
6. Earnings Per Share as restated Basic earnings per common stock are computed by dividing net loss attributable to common stockholders by the weighted average number of common stock outstanding during the reporting period. DilutedAfter January 1, 2021, the date of the adoption of ASU 2020-06, in periods when we have net income, the shares of our common stock subject to the convertible notes outstanding during the period will be included in our diluted earnings per share reflectsunder the potential dilution that could occur if securities or other contracts to issue common stock (such as stock options, unvested restricted stock, common stock warrants, and preferred stock) were exercised or converted into common stock or resulted in the issuance of common stock (net of any assumed repurchases) that then shared in the earnings of the Company, if any. This is computed by dividing net earnings by the combination of dilutive common stock equivalents, which is comprised of shares issuable under outstanding warrants, the conversion of preferred stock, and the Company’s share-based compensation plans, and the weighted average number of common stock outstanding during the reporting period.if-converted method. Since the Company is in a net loss position, all common stock equivalents would be considered to be anti-dilutive and are therefore not included in the determination of diluted earnings per share. Accordingly, basic and diluted loss per share are the same. The following table provides the components of the calculations of basic and diluted earnings per share (in thousands, except share amounts):
| | | | | | | | | | | | | Year ended December 31, | | | | | | | 2019 | | | 2018 | | | | 2020 | | (as restated) | | | (as restated) | | Numerator: | | | | | | | | | | | Net loss attributable to common stockholders | | $ | (596,181) | | $ | (85,555) | | $ | (85,660) | | Denominator: | | | | | | | | | | | Weighted average number of common stock outstanding | | | 354,790,106 | | | 237,152,780 | | | 218,882,337 | |
The potentially dilutive securities are summarized as follows:
| | | | | | | | | At December 31, | | | 2020 | | 2019 | | 2018 | Stock options outstanding (1) | | 10,284,498 | | 23,013,590 | | 21,957,150 | Restricted stock outstanding (2) | | 5,874,642 | | 4,608,560 | | 2,347,347 | Common stock warrants (3) | | 104,753,740 | | 110,573,392 | | 115,824,142 | Preferred stock (4) | | — | | 2,998,527 | | 17,933,591 | Convertible Senior Notes (5) | | 42,256,610 | | 59,133,896 | | 43,630,020 | Number of dilutive potential shares of common stock | | 163,169,490 | | 200,327,965 | | 201,692,250 |
(1) | During the years ended December 31, 2020, 2019, and 2018, the Company granted 3,509,549, 3,221,892, and 2,679,667 stock options, respectively. |
(2) | During the years ended December 31, 2020, 2019, and 2018, the Company granted 3,227,149, 3,201,892, and 2,367,347 shares of restricted stock, respectively. |
The following table provides the components of the calculations of basic and diluted earnings per share (in thousands, except share amounts): | | | | | | | | | | | | | Year ended December 31, | | | | 2022 | | 2021 | | 2020 | | Numerator: | | | | | | | | | | | Net loss attributable to common stockholders | | $ | (724,008) | | $ | (459,965) | | $ | (596,181) | | Denominator: | | | | | | | | | | | Weighted average number of common stock outstanding | | | 579,716,708 | | | 558,182,177 | | | 354,790,106 | |
The potentially dilutive securities are summarized as follows: | | | | | | | | | At December 31, | | | 2022 | | 2021 | | 2020 | Stock options outstanding (1) | | 27,598,269 | | 23,806,909 | | 10,284,498 | Restricted stock outstanding (2) | | 6,276,376 | | 4,851,873 | | 5,874,642 | Common stock warrants (3) | | 88,774,725 | | 80,017,181 | | 104,753,740 | Convertible Senior Notes (4) | | 39,170,766 | | 39,170,766 | | 42,256,610 | Number of dilutive potential shares of common stock | | 161,820,136 | | 147,846,729 | | 163,169,490 |
| (1) | During the years ended December 31, 2022, 2021, and 2020, the Company granted 4,761,724, 16,502,335, and 3,509,549, stock options, respectively. |
| (2) | During the years ended December 31, 2022, 2021, and 2020, the Company granted 4,289,682, 1,894,356, and 3,227,149, shares of restricted stock, respectively. |
| (3) | In April 2017,August 2022, the Company issued a warrant to acquire up to 55,286,69616,000,000 shares of the Company’s common stock as part of a transaction agreement with Amazon, subject to certain vesting events, as described in Note 18,17, “Warrant Transaction Agreements.” The warrant had not beenno shares exercised of the Company’s common stock as of December 31, 2020.2022. |
In April 2017, the Company issued a warrant to acquire up to 55,286,696 of the Company’s common stock as part of a transaction agreement with Amazon, subject to certain vesting events, as described in Note 17, “Warrant Transaction Agreements.” The warrant was exercised with respect to 24,704,450 shares and 17,461,994 shares of the Company’s common stock as of December 31, 2022 and 2021, respectively. In July 2017, the Company issued a warrant to acquire up to 55,286,696 of the Company’s common stock as part of a transaction agreement with Walmart, subject to certain vesting events, as described in Note 18,17, “Warrant Transaction Agreements.” The warrant had been exercised with respect to 5,819,65213,094,217 shares of the Company’s common stock as of December 31, 2020.2022 and 2021. | (4) | The preferred stock amount represents the dilutive potential on the shares of common stock as a result of the conversion of the Series C Redeemable Convertible Preferred Stock (Series C Preferred Stock) and Series E Convertible Preferred Stock (Series E Preferred Stock), based on the conversion price of each preferred stock as of December 31 2019, and 2018, respectively. Of the 10,431 shares of Series C Preferred Stock issued on May 16, 2013, all shares had been converted to common stock as of December 31, 2020. On November 1, 2018, the Company issued 35,000 shares of Series E Preferred Stock. As of December 31, 2019, 30,462 shares of the Series E Preferred Stock had been converted to common stock and 4,038 shares were redeemed for cash. All of the remaining Series E Preferred Stock were converted to either common stock or cash, in January 2020. |
(5) | In March 2018, the Company issued $100.0 million in aggregate principal amount of the 5.5% Convertible Senior Notes. In September 2019, the Company issued the $7.5%Notes due 2023 (the “5.5% Convertible Senior Note, which was fully converted into 16.0 million shares on July 1, 2020.Notes”). In May 2020, the Company issued the 3.5% Convertible Senior Notes and repurchased $66.3 million of the 5.5% Convertible Senior Notes. InNotes due 2023 (the “5.5% Convertible Senior Notes”) and in the fourth quarter of 2020, $33.5 million of the remaining 5.5% Convertible Senior Notes were converted into approximately 14.6 million shares of common stock. As of December 31, 2020, approximatelyThe remaining $160 thousand aggregate principal amount of the 5.5% Convertible Senior Notes remained outstanding, allwere converted into 69,808 shares of common stock in January 2021. In September 2019, the Company issued $40.0 million in aggregate principal amount of the 7.5% Convertible Senior Note due 2023 (the “7.5% Convertible Senior Note”), which was fully converted into 16.0 million shares of common stock on July 1, 2020. In May 2020, the Company issued $212.5 million in January 2021.aggregate principal amount of the 3.75% Convertible Senior Notes. During 2021, $15.2 million of the 3.75% Convertible Senior Notes were converted into 3,016,036 shares of common stock. There were no other conversions for the year ended December 31, 2022. |
7. Inventory as restated Inventory as of December 31, 20202022 and 2019 as restated,2021, consists of the following (in thousands): | | | | | | | | | | | | | | | | December 31, 2020 | | December 31, 2019 | | December 31, | | December 31, | | | | | | | | (as restated) | | 2022 | | 2021 | | Raw materials and supplies - production locations | | $ | 92,221 | | $ | 48,011 | | $ | 450,432 | | $ | 187,449 | | Raw materials and supplies - customer locations | | | 12,405 | | | 9,241 | | | 18,860 | | | 16,294 | | Work-in-process | | | 29,349 | | | 12,529 | | | 112,231 | | | 58,341 | | Finished goods | | | 5,411 | | | 2,610 | | | 64,113 | | | 7,079 | | Inventory | | $ | 139,386 | | $ | 72,391 | | $ | 645,636 | | $ | 269,163 | |
As of December 31, 2022 and 2021, the reserve for excess and obsolete inventory was $5.4 million and $3.5 million, respectively. Inventory is primarily comprised of raw materials, work-in-process, and finished goods. The increase in inventory is primarily due to a combination of new product offerings, as well as increased revenue and orders. 8. Property, Plant and Equipment Property, plant and equipment at December 31, 20202022 and 20192021 consists of the following (in thousands): | | | | | | | | | | | | | | | | | | | | | | | | | | | | | | | | December 31, 2020 | | December 31, 2019 | | | December 31, 2022 | | December 31, 2021 | Land | | | 1,165 | | | — | | | $ | 1,772 | | $ | 1,165 | Construction in progress | | | | 575,141 | | | 169,415 | Leasehold improvements | | $ | 1,121 | | $ | 862 | | | | 21,363 | | | 2,099 | Software, machinery and equipment | | | 94,449 | | | 31,514 | | | Property, plant, and equipment | | | 96,735 | | | 32,376 | | | Software, machinery, and equipment | | | | 169,633 | | | 112,068 | Property, plant and equipment | | | | 767,909 | | | 284,747 | Less: accumulated depreciation | | | (22,186) | | | (17,417) | | | | (48,116) | | | (29,124) | Property, plant, and equipment, net | | $ | 74,549 | | $ | 14,959 | | | Property, plant and equipment, net | | | $ | 719,793 | | $ | 255,623 |
Construction in progress is primarily comprised of construction of five hydrogen production plants, the Gigafactory in Rochester, NY, and our facility in the Slingerlands, NY. Completed assets are transferred to their respective asset classes, and depreciation begins when an asset is ready for its intended use. Interest on outstanding debt is capitalized during periods of capital asset construction and amortized over the useful lives of the related assets. For the years ended December 31, 2022 and 2021, we capitalized $13.1 million and $5.5 million of interest. Depreciation expense related to property, plant and equipment was $4.8$19.0 million, $3.6$6.9 million, and $2.6$4.8 million for the years ended December 31, 2020, 2019,2022, 2021, and 2018,2020, respectively. 9. Equipment Related to Power Purchase Agreements and Fuel Delivered to Customers, net as restated Equipment related to power purchase agreements and fuel delivered to customers, net, at December 31, 20202022 and 20192021 consists of the following (in thousands): | | | | | | | | | | | | | | | | | | December 31, 2019 | | December 31, | | December 31, | | | | December 31, 2020 | | (as restated) | | 2022 | | 2021 | | Equipment related to power purchase agreements and fuel delivered to customers | | | 92,736 | | | 81,194 | | $ | 109,683 | | $ | 89,641 | | Less: accumulated depreciation | | | (16,929) | | | (13,425) | | | (20,390) | | | (16,739) | | Equipment related to power purchase agreements and fuel delivered to customers, net | | $ | 75,807 | | $ | 67,769 | | | 89,293 | | | 72,902 | |
As of December 31, 2020,2022 and 2021, the Company had deployed assets at customer sites that had associated PPAs. These PPAs expire over the next one to ten years. PPAs contain termination clauses with associated penalties, the amount of which cause the likelihood of cancellation to be remote. Depreciation expense is $7.9$6.9 million, $7.4 million and $6.3$7.9 million for the years ended December 31, 20202022, 2021 and 20192020, respectively. The Company recorded an impairment of $1.5 million and $10.2 million for the years ended December 31, 2022 and 2021, respectively. The Company terminated its contractual relationship with a fuel provider effective March 31, 2021. The Company has historically leased fuel tanks from this provider. As a result of this termination, the Company recognized approximately $17.0 million of various costs for the year ended December 31, 2021, primarily for removal of tanks, reimbursement of unamortized installation costs, costs to temporarily provide customers with fuel during the transition period, and certain other contract settlement costs, which were recorded in the Company’s consolidated statement of operations as cost of revenue — fuel delivered to customers. The Company also purchased certain fuel tanks that were previously under operating leases from the fuel provider during 2021 and included in equipment related to power purchase agreements and fuel delivered to customers. In 2022, there were no such vendor terminations. 10. Intangible Assets and Goodwill The gross carrying amount and accumulated amortization of the Company’s acquired identifiable intangible assets as of December 31, 20202022 are as follows (in thousands): | | | | | | | | | | | | | | | | | | | | | | | | | | Weighted Average | | Gross Carrying | | Accumulated | | | | | Weighted Average | | Gross Carrying | | Accumulated | | | | | | | Amortization Period | | Amount | | Amortization | | Total | | Amortization Period | | Amount | | Amortization | | Total | | Acquired technology | | 10 years | | $ | 13,697 | | $ | (4,042) | | $ | 9,655 | | 14 years | | $ | 104,221 | | $ | (12,754) | | $ | 91,467 | | Dry stack electrolyzer technology | | | 10 years | | | 29,000 | | | (2,417) | | | 26,583 | | Customer relationships, Non-compete agreements, Backlog & Trademark | | 6 years | | | 890 | | | (294) | | | 596 | | 13 years | | | 102,521 | | | (12,846) | | | 89,675 | | In process research and development | | Indefinite | | | 29,000 | | | — | | | 29,000 | | | | | | $ | 43,587 | | $ | (4,336) | | $ | 39,251 | | | | $ | 235,742 | | $ | (28,017) | | $ | 207,725 | |
The gross carrying amount and accumulated amortization of the Company’s acquired identifiable intangible assets as of December 31, 20192021 are as follows (in thousands): | | | | | | | | | | | | | | | | | | | | | | | | | | Weighted Average | | Gross Carrying | | Accumulated | | | | | Weighted Average | | Gross Carrying | | Accumulated | | | | | | | Amortization Period | | Amount | | Amortization | | Total | | Amortization Period | | Amount | | Amortization | | Total | | Acquired technology | | 9 years | | $ | 8,244 | | $ | (2,815) | | $ | 5,429 | | 13 years | | $ | 45,530 | | $ | (5,392) | | $ | 40,138 | | Trademark | | 9 years | | | 320 | | | (210) | | | 110 | | Customer relationships, Non-compete agreements, Backlog & Trademark | | | 12 years | | | 90,497 | | | (1,427) | | | 89,070 | | In process research and development | | | Indefinite | | | 29,000 | | | — | | | 29,000 | | | | | | $ | 8,564 | | $ | (3,025) | | $ | 5,539 | | | | $ | 165,027 | | $ | (6,819) | | $ | 158,208 | |
The change in the gross carrying amount of the acquired technology from December 31, 20192021 to December 31, 20202022, was primarily due to changes in acquisitionsthe acquisition of UHGJoule and Giner ELX, American Fuel Cell (AFC) milestone payments and foreign currency translation, as discussed below.
The Company’s in-process research and development is related toCIS, the developmentaddition of the dry build process associated with electrolyzer stacks, as part ofstack related to the Giner ELX acquisition, of Giner ELX. The related intangible asset is not currently amortized, as research and development is ongoing. Upon completion of the dry build process, amortization will commence based upon the estimated useful life of the underlying asset. See Note 5, “Acquisitions” for more details.changes in foreign currency translation.
Also, inAmortization expense for acquired identifiable intangible assets for the years ended December 31, 2022, 2021 and 2020 the Company acquired technology as part of the acquisition of UHG. The technology relates to the chemical process of manufacturing liquid hydrogen from chlor-alkali waste stream. See Note 5 “Acquisitions”, for more details.was $21.2 million, $2.5 million and $1.1 million, respectively.
In 2019, the Company acquired intellectual property from EnergyOr for $1.5 million. In addition, the Company agreed to pay the sellers a royalty based on future sales of relevant applications, not to exceed $3.0 million, by May 22, 2025. These royalties are added to the intangible asset balance, as incurred. To date, no royalties have been earned.
As of December 31, 2020, as part of the agreement to acquire the intellectual property from AFC, the Company paid AFC milestone payments of $2.9 million.
Amortization expense for acquired identifiable intangible assets for the years ended December 31, 2020, 2019 and 2018 was $1.1 million, $0.7 million and $0.7 million, respectively.
Estimated amortization expense for subsequent years was as follows (in thousands): | | | | | | | 2021 | | | 1,878 | | 2022 | | | 1,478 | | 2023 | | | 1,478 | | $ | 19,033 | 2024 | | | 1,456 | | | 18,973 | 2025 and thereafter | | | 3,961 | | 2025 | | | | 18,204 | 2026 | | | | 16,635 | 2027 | | | | 16,628 | 2028 and thereafter | | | | 118,252 | Total | | $ | 10,251 | | $ | 207,725 |
Goodwill was $72.4$248.6 million and $8.8$220.4 million as of December 31, 20202022 and 20192021 respectively, which primarily increased $62.6$26.1 million as a result of the Giner ELXJoule and UHGCIS acquisitions, and increased $900 thousanddecreased $3.8 million due to translation gainadjustments for HypulsionPlug Power Europe and Frames goodwill. There were 0no impairments during the fiscal years ended December 31, 20202022, 2021 and 2019.2020. The change in the carrying amount of goodwill for the year ended December 31, 2022 was as follows (in thousands): | | | Beginning balance at December 31, 2021 | $ | 220,436 | Acquisitions | | 26,087 | Measurement period adjustments | | 5,868 | Foreign currency translation adjustment | | (3,784) | Ending balance at December 31, 2022 | $ | 248,607 |
11. Accrued Expenses as restated Accrued expenses at December 31, 20202022 and 20192021 consist of (in thousands): | | | | | | | | | | | | | | | | | | | 2019 | | | | | | | | | 2020 | | (as restated) | | | 2022 | | 2021 | Accrued payroll and compensation related costs | | $ | 29,167 | | $ | 2,932 | | | $ | 18,231 | | $ | 22,005 | Accrual for capital expenditures | | | | 53,089 | | | 6,735 | Accrued accounts payable | | | 11,750 | | | 7,254 | | | | 53,899 | | | 36,701 | Accrued sales and other taxes | | | 3,665 | | | 905 | | | | 15,112 | | | 10,632 | Accrued interest | | | 649 | | | 2,374 | | | | 421 | | | 429 | Accrued other | | | 852 | | | 944 | | | | 15,678 | | | 2,735 | Total | | $ | 46,083 | | $ | 14,409 | | | $ | 156,430 | | $ | 79,237 |
12. Operating and Finance Lease Liabilities as restated As of December 31, 2020,2022, the Company had operating leases, as lessee, primarily associated with sale/leaseback transactions that are partially secured by restricted cash, security deposits and pledged escrows (see also Note 1, “Nature of Operations”) as summarized below. These leases expire over the next one to nine years. Minimum rent payments under operating leases are recognized on a straight-line basis over the term of the lease. Leases contain termination clauses with associated penalties, the amount of which cause the likelihood of cancellation to be remote. At the end of the lease term, the leased assets may be returned to the lessor by the Company, the Company may negotiate with the lessor to purchase the assets at fair market value, or the Company may negotiate with the lessor to renew the lease at market rental rates. No residual value guarantees are contained in the leases. No financial covenants are contained within the lease, however there are customary operational covenants such as assurance the Company properly maintains the leased assets and carries appropriate insurance, etc. The leases include credit support in the form of either cash, collateral or letters of credit. See Note 22,21, “Commitments and contingencies, as restated,” for a description of cash held as security associated with the leases. The Company has finance leases associated with its property and equipment in Latham, New York and at fueling customer locations. The fair value of this finance obligation approximated the carrying value as of December 31, 2020.
The Company has finance leases associated with its property and equipment in Latham, New York and at fueling customer locations. The fair value of this finance obligation approximated the carrying value as of December 31, 2022. Future minimum lease payments under operating and finance leases (with initial or remaining lease terms in excess of one year) as of December 31, 20202022 were as follows (in thousands): | | | | | | | | | | | | | | | | | | | | | | Finance | | Total | | | | | Finance | | Total | | | Operating Lease | | Lease | | Lease | | Operating Lease | | Lease | | Lease | | | Liability | | Liability | | Liabilities | | Liability | | Liability | | Liabilities | 2021 | $ | 28,536 | | $ | 1,261 | | $ | 29,797 | | 2022 | | 27,138 | | | 1,234 | | | 28,372 | | 2023 | | 26,464 | | | 1,210 | | | 27,674 | | $ | 82,019 | | $ | 10,901 | | $ | 92,920 | 2024 | | 25,947 | | | 1,293 | | | 27,240 | | | 81,157 | | | 10,851 | | | 92,008 | 2025 and thereafter | | 50,362 | | | 1,721 | | | 52,083 | | 2025 | | | | 76,444 | | | 13,763 | | | 90,207 | 2026 | | | | 67,951 | | | 10,904 | | | 78,855 | 2027 | | | | 53,741 | | | 6,947 | | | 60,688 | 2028 and thereafter | | | | 96,147 | | | — | | | 96,147 | Total future minimum payments | | 158,447 | | | 6,719 | | | 165,166 | | | 457,459 | | | 53,366 | | | 510,824 | Less imputed interest | | (44,509) | | | (1,323) | | | (45,832) | | | (137,094) | | | (7,230) | | | (144,324) | Total | $ | 113,938 | | $ | 5,396 | | $ | 119,334 | | $ | 320,365 | | $ | 46,137 | | $ | 366,500 |
Rental expense for all operating leases was $22.3$67.6 million, $14.6$38.6 million, and $10.2$22.3 million for the years ended December 31, 2022, 2021, and 2020, 2019 and 2018, respectively.
The gross profit on sale/leaseback transactions for all operating leases was $61.0 million, $26.2 million and $16.4 million for the years ended December 31, 2020, 2019 and 2018, respectively. Right of use assets obtained in exchange for new operating lease liabilities was $58.5 million and $37.7 million for the years ended December 31, 2020 and 2019, respectively.
At December 31, 20202022 and 2019, the right of use assets associated with operating leases was $117.0 million and $63.3 million, respectively. The accumulated depreciation for these right of use assets was $48.6 million and $23.6 million at December 31, 2020 and 2019, respectively.
At December 31, 2020 and 2019, the right of use assets associated with finance leases was $5.7 million and $1.7 million, respectively. The accumulated depreciation for these right of use assets was $102 thousand and $32 thousand at December 31, 2020 and 2019, respectively.
At December 31, 2020 and 2019,2021, security deposits associated with sale/leaseback transactions were $5.8 million and $6.0$3.5 million, respectively, and were included in other assets in the consolidated balance sheet.
Other information related to the operating leases are presented in the following table: | | | | | | | | | | | | Year ended | | | Year ended | Year ended | | Year ended | | | December 31, 2020 | | | December 31, 2019 | December 31, 2022 | | December 31, 2021 | Cash payments (in thousands) | $ | 22,626 | | $ | 14,055 | $ | 63,214 | | $ | 37,463 | Weighted average remaining lease term (years) | | 6.0 | | | 5.0 | | 6.52 | | | 5.60 | Weighted average discount rate | | 11.7% | | | 12.1% | | 11.2% | | | 10.9% |
Finance lease costs include amortization of the right of use assets (i.e., depreciation expense) and interest on lease liabilities (i.e., interest and other expense net in the consolidated statement of operations), and were immaterial$6.2 million and $2.1 million for the yearsyear ended December 31, 20192022 and 2018. 2021. RightAt December 31, 2022 and 2021, the right of use assets obtained in exchange for newassociated with finance lease liabilities were $4.1leases, net was $53.7 million and $0.1$32.5 million, respectively. The accumulated depreciation for the years endedthese right of use assets was $4.7 million and $1.5 million at December 31, 20202022 and 2019,2021, respectively.
Other information related to the finance leases are presented in the following table: | | | | | | | Year ended | | Year ended | | December 31, 2022 | | December 31, 2021 | Cash payments (in thousands) | $ | 9,033 | | $ | 3,648 | Weighted average remaining lease term (years) | | 3.92 | | | 4.56 | Weighted average discount rate | | 6.7% | | | 6.7% |
Other information related to the finance leases are presented in the following table:
| | | | | | | | Year ended | | | Year ended | | | December 31, 2020 | | | December 31, 2019 | Cash payments (in thousands) | $ | 471 | | $ | 255 | Weighted average remaining lease term (years) | | 5.6 | | | 7.7 | Weighted average discount rate | | 8.2% | | | 8.8% |
13. Finance Obligation as restated The Company has sold future services to be performed associated with certain sale/leaseback transactions and recorded the balance as a finance obligation. The outstanding balance of this obligation at December 31, 20202022 was $157.7 $312.1million, $24.7$55.4 million and $132.9$256.6 million of which was classified as short-term and long-term, respectively, on the accompanying consolidated balance sheet. The outstanding balance of this obligation at December 31, 20192021 was $112.4$236.6 million, $16.8$37.5 million and $95.6$199.1 million of which was classified as short-term and long-term, respectively.respectively, on the accompanying consolidated balance sheet. The amount is amortized using the effective interest method. Interest expense recorded related to finance obligations for the year ended December 31, 2022 and 2021 was $29.7 million and $21.0 million, respectively. The fair value of this finance obligation approximated the carrying value as of both December 31, 2020.2022 and 2021. In prior periods, the Company entered into sale/leaseback transactions that were accounted for as financing transactions and reported as part of finance obligations. The outstanding balance of finance obligations related to sale/leaseback transactionsthis obligation at December 31, 20202022 was $23.9$17.2 million, $8.0$3.5 million and $15.9$13.7 million of which was classified as short-term and long-term, respectively on the accompanying consolidated balance sheet. The outstanding balance of this obligationfinance obligations related to sale/leaseback transactions at December 31, 20192021 was $31.7$17.0 million, $7.9$4.5 million and $23.8$12.5 million of which was classified as short-term and long-term, respectively on the accompanying consolidated balance sheet. The fair value of this finance obligation approximated the carrying value as of both December 31, 20202022 and December 31, 2019.2021. Future minimum payments under finance obligations notes above as of December 31, 20202022 were as follows (in thousands): | | | | | | | | | | | | | | | | | | | | | | | | | Total | | | | | | | | Total | | | Sale of Future | | | Sale/leaseback | Finance | | Sale of future | | Sale/leaseback | | Finance | | | revenue - debt | | | financings | Obligations | | revenue - debt | | financings | | Obligations | 2021 | $ | 41,670 | | $ | 9,327 | | $ | 50,997 | | 2022 | | 39,268 | | | 4,975 | | | 44,243 | | 2023 | | 39,268 | | | 3,149 | | | 42,417 | | $ | 88,161 | | $ | 4,468 | | $ | 92,629 | 2024 | | 39,268 | | | 16,154 | | | 55,422 | | | 88,161 | | | 10,223 | | | 98,384 | 2025 and thereafter | | 53,385 | | | — | | | 53,385 | | 2025 | | | | 82,904 | | | 1,319 | | | 84,223 | 2026 | | | | 66,181 | | | 1,319 | | | 67,500 | 2027 | | | | 49,610 | | | 1,319 | | | 50,929 | 2028 and thereafter | | | | 34,634 | | | 1,345 | | | 35,979 | Total future minimum payments | | 212,859 | | | 33,605 | | | 246,464 | | | 409,651 | | | 19,993 | | | 429,644 | Less imputed interest | | (55,158) | | | (9,753) | | | (64,911) | | | (97,577) | | | (2,827) | | | (100,404) | Total | $ | 157,701 | | $ | 23,852 | | $ | 181,553 | | $ | 312,074 | | $ | 17,166 | | $ | 329,240 |
Other information related to the above finance obligations are presented in the following table: | | | | | | | | | | | | | Year ended | | | Year ended | Year ended | | Year ended | | | December 31, 2020 | | | December 31, 2019 | December 31, 2022 | | December 31, 2021 | Cash payments (in thousands) | $ | 44,245 | | $ | 76,244 | $ | 72,377 | | $ | 57,016 | Weighted average remaining term (years) | | 5.0 | | | 5.3 | | 4.84 | | | 5.03 | Weighted average discount rate | | 11.3% | | | 11.2% | | 11.1% | | | 10.8% |
14. Long-Term Debt In March 2019, the Company entered into a loan and security agreement, as amended, (the ”Loan Agreement”), with Generate Lending, LLC, (“Generate Capital”), providing for a secured term loan facility in the amount of $100 million (the “Term Loan Facility”). TheIn December 2022, the Company usedfully repaid the proceeds to pay off in full the Company’s previous loan with NY Green Bank a Divisionoutstanding balance of the New York State Energy Research & Development (“Green-Bank Loan”) and terminate and re-purchase certain equipment leases with Generate Plug Power SLB II, LLC. In connection with this transaction, the Company recognizedTerm Loan Facility, which resulted in a recording of a loss on the extinguishment of debt of approximately $0.5$1.0 million duringon the year ended December 31, 2019. This loss was recorded in gain (loss) on extinguishment of debt, in the Company’s consolidated statement of operations. The Company borrowed an incremental $20 million in November 2019. Additionally, during the year ended December 31,In June 2020, the Company under another series of amendments to the Loan Agreement, borrowed an incremental $100 million. Asacquired debt as part of the amendment to the Loan Agreement, the Company’s interest rate on the secured term loan facility was reduced to 9.50% from 12.00% per annum, and the maturity date was extended to October 31, 2025 from October 6, 2022. On December 31, 2020, theacquisition of United Hydrogen Group Inc. The outstanding balance under the Term Loan Facility was $165.8 million.
The Loan Agreement includes covenants, limitations, and events of default customary for similar facilities. Interest and a portioncarrying value of the principal amountdebt is payable on a quarterly basis. Principal payments will be funded in part by releases of restricted cash, as described in Note 22, “Commitments and Contingencies, as restated.” Based on the amortization schedule$9.0 million as of December 31, 2020, the aforementioned loan balance under the Term Loan Facility will be fully paid by October 31, 2025.2022. The Company is in compliance with, or has obtained waivers for, all debt covenants.
The Term Loan Facility is secured by substantially all of the Company’s and the guarantor subsidiaries’ assets, including, among other assets, all intellectual property, all securities in domestic subsidiaries and 65% of the securities in foreign subsidiaries, subject to certain exceptions and exclusions.
The Loan Agreement provides that if there is an event of default due to the Company’s insolvency or if the Company fails to perform in any material respect the servicing requirements for fuel cell systems under certain customer agreements, which failure would entitle the customer to terminate such customer agreement, replace the Company or withhold the payment of any material amount to the Company under such customer agreement, then Generate Capital has the right to cause Proton Services Inc., a wholly owned subsidiary of the Company, to replace the Company in performing the maintenance services under such customer agreement.
Additionally, $1.75 million was paid to an escrow account related to additional fees due in connection with the Green-Bank Loan if the Company does not meet certain New York State employment and fuel cell deployment targets by March 2021.
The amount of escrow expected to be received of $700 thousand was recorded in short-term other assetsoutstanding principal on the Company’s consolidated balance sheets as of December 31, 2020. During the year ended December 31, 2020, the Company received $250 thousand from escrow related to the New York state employment targets. The Company also received $700 thousand related to the New York State employment targets in March 2021. The Company did not meet the deployment targets and charged-off $800 thousand to interest expense during December, 2020.
As of December 31, 2020 the Term Loan Facility requires the principal balance as of each of the following dates not to exceed the following (in thousands):
| | | December 31, 2021
|
| 127,317
| December 31, 2022
|
| 93,321
| December 31, 2023
|
| 62,920
| December 31, 2024
|
| 33,692
| December 31, 2025
|
| —
|
debt is
$11.4 million and the unamortized debt discount is $2.4 million, bearing varying interest rates ranging from 2.2% to 8.3%, and is scheduled to mature in 2026. As of December 31, 2022, the principal balance is due at each of the following dates is the following (in thousands): | | | | December 31, 2023 | | $ | 5,960 | December 31, 2024 | | | 3,357 | December 31, 2025 | | | 1,200 | December 31, 2026 | | | 900 | | | $ | 11,417 |
15. Convertible Senior Notes 3.75% Convertible Senior Notes On May 18, 2020, the Company issued $200.0 million in aggregate principal amount of 3.75% Convertible Senior Notes due June 1, 2025, which is referred to herein as the 3.75% Convertible Senior Notes, in a private placement to qualified institutional buyers pursuant to Rule 144A under the Securities Act of 1933, as amended, or the Securities Act. On May 29, 2020, the Company issued an additional $12.5 million in aggregate principal amount of 3.75% Convertible Senior Notes. At issuance in May 2020, the total net proceeds from the 3.75% Convertible Senior Notes were as follows: | | | | Amount | | (in thousands) | Principal amount | $ | 212,463 | Less initial purchasers' discount | | (6,374) | Less cost of related capped calls | | (16,253) | Less other issuance costs | | (617) | Net proceeds | $ | 189,219 |
The 3.75% Convertible Senior Notes bear interest at a rate of 3.75% per year, payable semi-annually in arrears on June 1 and December 1 of each year, beginning on December 1, 2020. The notes will mature on June 1, 2025, unless earlier converted, redeemed or repurchased in accordance with their terms. The 3.75% Convertible Senior Notes are senior, unsecured obligations of the Company and rank senior in right of payment to any of the Company’s indebtedness that is expressly subordinated in right of payment to the notes, equal in right of payment to any of the Company’s existing and future liabilities that are not so subordinated, including the Company’s $100 million in aggregate principal amount of the 5.5% Convertible Senior Notes due 2023, which is referred to herein as the 5.5% Convertible Senior Notes, effectively junior in right of payment to any of the Company’s secured indebtedness to the extent of the value of the collateral securing such indebtedness, and structurally subordinated to all indebtedness and other liabilities, including trade payables, of its current or future subsidiaries. Holders of the 3.75% Convertible Senior Notes may convert their notes at their option at any time prior to the close of the business day immediately preceding December 1, 2024 in the following circumstances: | 1) | during any calendar quarter commencing after DecemberMarch 31, 2020,2021, if the last reported sale price of the Company’s common stock exceeds 130% of the conversion price for each of at least 20 trading days (whether or not consecutive) during a period of 30 consecutive trading days ending on, and including, the last trading day of the immediately preceding calendar quarter; |
| 2) | during the five business days after any five consecutive trading day period (such five consecutive trading day period, the measurement period) in which the trading price per $1,000 principal amount of the 3.75% Convertible Senior Notes for each trading day of the measurement period was less than 98% of the product of the last reported sale price of the Company’s common stock and the conversion rate on each such trading day; |
| 3) | if the Company calls any or all of the 3.75% Convertible Senior Notes for redemption, any such notes that have been called for redemption may be converted at any time prior to the close of business on the second scheduled trading day immediately preceding the redemption date; or |
| 4) | upon the occurrence of specified corporate events, as described in the indenture governing the 3.75% Convertible Senior Notes. |
On or after December 1, 2024, the holders of the 3.75% Convertible Senior Notes may convert all or any portion of their notes at any time prior to the close of business on the second scheduled trading day immediately preceding the maturity date regardless of the foregoing conditions. The initial conversion rate for the 3.75% Convertible Senior Notes is 198.6196 shares of the Company’s common stock per $1,000 principal amount of notes, which is equivalent to an initial conversion price of approximately $5.03 per share of the Company’s common stock, subject to adjustment upon the occurrence of specified events. Upon conversion, the Company will pay or deliver, as applicable, cash, shares of the Company’s common stock or a combination of cash and shares of the Company’s common stock, at the Company’s election. During January and February ofthe year ended December 31, 2022, there were no conversions. During the year ended December 31, 2021, $15.2 million of the 3.75% Convertible Senior Notes have beenwere converted and the Company has issued approximately 3.0 million shares of common stock in conjunction with these conversions. In addition, following certain corporate events or following issuance of a notice of redemption, the Company will increase the conversion rate for a holder who elects to convert its notes in connection with such a corporate event or convert its notes called for redemption during the related redemption period in certain circumstances. The 3.75% Convertible Senior Notes will be redeemable, in whole or in part, at the Company’s option at any time, and from time to time, on or after June 5, 2023 and before the 41st scheduled trading day immediately before the maturity date, at a cash redemption price equal to 100% of the principal amount of the notes to be redeemed, plus accrued and unpaid interest, if any, but only if the last reported sale price per share of the Company’s common stock exceeds 130% of the conversion price then in effect for at least 20 trading days (whether or not consecutive), including at least one of the three trading days immediately preceding the date the Company sends the related redemption notice, during any 30 consecutive trading day period ending on, and including, the trading day immediately preceding the date on which the Company sends such redemption notice. If the Company undergoes a “fundamental change” (as defined in the Indenture), holders may require the Company to repurchase their notes for cash all or any portion of their notes at a fundamental change repurchase price equal to 100% of the principal amount of the notes to be repurchased, plus accrued and unpaid interest, to, but excluding, the fundamental change repurchase date. In accountingThe Company accounts for the issuance of the 3.75% Convertible Senior Notes the Company separated the notes into liability and equity components. The initial carrying amount of the liability component of approximately $75.2 million, net of costs incurred, was calculated by measuring the fair value ofas a similar liability that does not have an associated convertible feature. The carrying amount of the equity component of approximately $130.3 million, net of costs incurred, representing the conversion option, was determined by deducting the fair value of the liability component from the par value of the 3.75% Convertible Senior Notes. The difference between the principal amount of the 3.75% Convertible Senior Notes and the liability component (the debt discount) is amortized to interest expense using the effective interest method over the term of the 3.75% Convertible Senior Notes. The effective interest rate is approximately 29.0%. The equity component of the 3.75% Convertible Senior Notes is included in additional paid-in capital in the consolidated balance sheets and is not remeasured as long as it continues to meet the conditions for equity classification.
liability. We incurred transaction costs related to the issuance of the 3.75% Convertible Senior Notes of approximately $7.0 million, consisting of initial purchasers’ discount of approximately $6.4 million and other issuance costs of $0.6 million. In accounting for the transaction costs, we allocated the total amount incurred to the liability and equity components using the same proportions as the proceeds from the 3.75% Convertible Senior Notes. Transaction costs attributable to the liability component were approximately $2.6 million which were recorded as debt issuance cost (presented as contra debt in the consolidated balance sheets) and are being amortized to interest expense over the term of the 3.75% Convertible Senior Notes. The transaction costs attributable to the equity component were approximately $4.4 million and were netted with the equity component in stockholders’ equity. The 3.75% Convertible Senior Notes consisted of the following (in thousands): | | | | December 31, | | 2020 | Principal amounts: | | | Principal | $ | 212,463 | Unamortized debt discount (1) | | (124,655) | Unamortized debt issuance costs (1) | | (2,295) | Net carrying amount | $ | 85,513 | Carrying amount of the equity component (2) | $ | 130,249 |
| | | | | | | | | December 31, | | December 31, | | | 2022 | | 2021 | Principal amounts: | | | | | | | Principal | | $ | 197,278 | | $ | 197,278 | Unamortized debt issuance costs (1) | | | (3,359) | | | (4,645) | Net carrying amount | | $ | 193,919 | | $ | 192,633 |
| 1) | Included in the consolidated balance sheets within the 3.75% Convertible Senior Notes, net and amortized over the remaining life of the notes using the effective interest rate method. |
Table of Contents Notes to Consolidated Financial Statements (Continued) | 3) | Included in the consolidated balance sheets within additional paid-in capital, net of the associated income tax benefit of $29.8 million. |
The following table summarizes the total interest expense and effective interest rate related to the 3.75% Convertible Senior Notes (in thousands, except for effective interest rate): | | | | | | | | | | December 31, | | | December 31, | | | | 2022 | | | 2021 | | Interest expense | | $ | 7,398 | | $ | 7,446 | | Amortization of debt issuance costs | | | 1,286 | | | 1,670 | | Total | | | 8,684 | | | 9,116 | | | | | | | | | | Effective interest rate | | | 4.5% | | | 4.5% | |
Based on the closing price of the Company’s common stock of $33.91$12.37 on December 31, 2020,30, 2022, the if-converted value of the notes was greater than the principal amount. The estimated fair value of the note at December 31, 20202022 was approximately $1.3 billion.$493.0 million. Fair value estimation was primarily based on a stock exchange, active trade on December 29, 20202022 of the 3.75% Senior Convertible Note. The Company considers this a Level 1 fair value measurement. Refer to Note 4, “Summary of Significant Accounting Policies.” Capped Call In conjunction with the pricing of the 3.75% Convertible Senior Notes, the Company entered into privately negotiated capped call transactions (the “3.75% Notes Capped Call”) with certain counterparties at a price of $16.2 million. The 3.75% Notes Capped Call covers, subject to anti-dilution adjustments, the aggregate number of shares of the Company’s common stock that underlie the initial 3.75% Convertible Senior Notes and is generally expected to reduce potential dilution to the Company’s common stock upon any conversion of the 3.75% Convertible Senior Notes and/or offset any cash payments the Company is required to make in excess of the principal amount of the converted notes, as the case may be, with such reduction and/or offset subject to a cap based on the cap price. The cap price of the 3.75% Notes Capped Call is initially $6.7560 per share, which represents a premium of approximately 60% over the last then-reported sale price of the Company’s common stock of $4.11 per share on the date of the transaction and is subject to certain adjustments under the terms of the 3.75% Notes Capped Call. The 3.75% Notes Capped Call becomes exercisable if the conversion option is exercised. The net cost incurred in connection with the 3.75% Notes Capped Call has been recorded as a reduction to additional paid-in capital in the consolidated balance sheet. 7.5% Convertible Senior Note
In September 2019, the Company issued $40.0 million aggregate principal amount of 7.5% Convertible Senior Note due on January 5, 2023, which is referred to herein as the 7.5% Convertible Senior Note, in exchange for net proceeds of $39.1 million, in a private placement to an accredited investor pursuant to Rule 144A under the Securities Act. There were no required principal payments prior to the maturity of the 7.5% Convertible Senior Note. Upon maturity of the 7.5% Convertible Senior Note, the Company was required to repay 120% of $40.0 million, or $48.0 million. The 7.5% Convertible Senior Note bore interest at 7.5% per year, payable quarterly in arrears on January 5, April 5, July 5 and October 5 of each year beginning on October 5, 2019 and was to mature on January 5, 2023 unless earlier converted or repurchased in accordance with its terms. The 7.5% Convertible Senior Note was unsecured and did not contain any financial covenants or any restrictions on the payment of dividends, or the issuance or repurchase of common stock by the Company.
On July 1, 2020, the 7.5% Convertible Senior Note automatically converted into 16.0 million shares of common stock.
5.5% Convertible Senior Notes In March 2018, the Company issued $100$100.0 million in aggregate principal amount of the 5.5% Convertible Senior Notes due on March 15, 2023, which is referred to herein as the 5.5% Convertible Senior Notes, in a private placement to qualified institutional buyers pursuant to Rule 144A under the Securities Act. In May 2020, the Company used a portion of the net proceeds from the issuance of the 3.75% Convertible Senior Notes to finance the cash portion of the partial repurchase of the 5.5% Convertible Senior Notes, which consisted of a repurchase of approximately $66.3 million in aggregate principal amount of the 5.5% Convertible Senior Notes in privately-negotiated transactions for aggregate consideration of $128.9 million, consisting of approximately $90.2 million in cash and approximately 9.4 million shares of the Company’s common stock. Of the $128.9 million in aggregate consideration, $35.5 million and $93.4 million were allocated to the debt and equity components, respectively, utilizing an effective discount rate of 29.8% to determine the fair value of the liability component. As of the repurchase date, the carrying value of the 5.5% Convertible Senior Notes that were repurchased, net of unamortized debt discount and issuance costs, was $48.7 million. The partial repurchase of the 5.5% Convertible Senior Notes resulted in a $13.2 million gain on early debt extinguishment. In the fourth quarter of 2020, $33.5 million of the remaining 5.5% Convertible Senior Notes were converted into 14.6 million shares of common stock which resulted in a gain of approximately $4.5 million which was recorded on the consolidated statement of operations on the gain (loss) on extinguishment of debt line. As On January 7, 2021, the remaining aggregate principal of December 31, 2020, approximately $160 thousand aggregate principal amount of the 5.5% Convertible Senior Notes remained outstanding, all of which were converted into 69,808 shares of common stock in January 2021.
In accountingstock. Interest expense and amortization for the issuance of the notes, the Company separated the 5.5% Convertible Senior Notes into liability and equity components. The initial carrying amount of the liability component of approximately $58.2 million, net of costs incurred, was calculated by measuring the fair value of a similar liability that does not have an associated convertible feature. The carrying amount of the equity component of approximately $37.7 million, net of costs incurred, representing the conversion option, was determined by deducting the fair value of the liability component from the par value of the 5.5% Convertible Senior Notes. The difference between the principal amount of the 5.5% Convertible Senior Notes and the liability component (the debt discount) is amortized to interest expense using the effective interest method over the term of the 5.5% Convertible Senior Notes. The effective interest rate is approximately 16.0%. The equity component of the 5.5% Convertible Senior Notes is included in additional paid-in capital in the consolidated balance sheets and is not remeasured as long as it continues to meet the conditions for equity classification.
We incurred transaction costs related to the issuance of the 5.5% Convertible Senior Notes of approximately $4.1 million, consisting of initial purchasers’ discount of approximately $3.3 million and other issuance costs of $0.9 million. In accounting for the transaction costs, we allocated the total amount incurred to the liability and equity components using the same proportions as the proceeds from the 5.5% Convertible Senior Notes. Transaction costs attributable to the liability componentperiod were approximately $2.4 million, were recorded as debt issuance cost (presented as contra debt in the consolidated balance sheets) and are being amortized to interest expense over the term of the 5.5% Convertible Senior Notes. The transaction costs attributable to the equity component were approximately $1.7 million and were netted with the equity component in stockholders’ equity.immaterial.
The 5.5% Convertible Senior Notes consisted of the following (in thousands):
| | | | | | | | | | | | | December 31, | | December 31, | | 2020 | | | 2019 | Principal amounts: | | | | | | Principal | $ | 160 | | $ | 100,000 | Unamortized debt discount (1) | | (32) | | | (27,818) | Unamortized debt issuance costs (1) | | (1) | | | (1,567) | Net carrying amount | $ | 127 | | $ | 70,615 | Carrying amount of the equity component (2) | $ | — | | $ | 37,702 |
| 1) | Included in the consolidated balance sheets within the 5.5% Convertible Senior Notes, net and amortized over the remaining life of the 5.5% Convertible Senior Notes using the effective interest rate method. |
| 2) | Included in the consolidated balance sheets within additional paid-in capital, net of $1.7 million in equity issuance costs and associated income tax benefit of $9.2 million, at December 31, 2019. |
Capped Call In conjunction with the pricing of the 5.5% Convertible Senior Notes, the Company entered into privately negotiated capped call transactions (the “5.5% Notes Capped Call”) with certain counterparties at a price of $16.0 million. The 5.5% Notes Capped Call covers, subject to anti-dilution adjustments, the aggregate number of shares of the Company’s common stock that underlie the initial 5.5% Convertible Senior Notes and is generally expectedmillion to reduce the potential dilution to the Company’s common stock upon any conversion of the 5.5% Convertible Senior Notes and/or offset any cash payments the Company is required to make in excess of the principal amount of the converted 5.5% Convertible Senior Notes, as the case may be,be. The net cost incurred in connection with suchthe 5.5% Notes Capped Call has been recorded as a reduction and/or offset subject to a cap based onadditional paid-in capital in the cap price. The cap priceconsolidated balance sheets. In conjunction with the pricing of the partial repurchase of the 5.5% Convertible Senior Notes, the Company terminated 100% of the 5.5% Notes Capped Call is initially $3.82 per share, which representson June 5, 2020. As a premium of 100% over the last then-reported sale priceresult of the Company’s common stock of $1.91 per share ontermination, the date ofCompany received $24.2 million, which was recorded in additional paid-in capital in the transaction and is subject to certain adjustments under the terms of the 5.5% Notes Capped Call. The 5.5% Notes Capped Call becomes exercisable if the conversion option is exercised.consolidated balance sheets. The net cost incurred in connection with the 5.5% Notes Capped Call has been recorded as a reduction to additional paid-in capital in the consolidated balance sheets. In conjunction with the partial repurchase of the 5.5% Convertible Senior Notes, the Company terminated 100% of the 5.5% Notes Capped Call on June 5, 2020. As a result of the termination, the Company received $24.2 million which was recorded in additional paid-in capital. Common Stock Forward In connection with the issuance of the 5.5% Convertible Senior Notes, the Company also entered into a forward stock purchase transaction or the Common(the “Common Stock Forward,Forward”), pursuant to which the Company agreed to purchase 14,397,906 shares of its common stock for settlement on or about March 15, 2023. In connection with the issuance of the 3.75% Convertible Senior Notes and the partial payoffrepurchase of the 5.5% Convertible Senior Notes, the Company amended and extended the maturity of the Common Stock Forward to June 1, 2025. The number of shares of common stock that the Company will ultimately repurchase under the Common Stock Forward is subject to customary anti-dilution adjustments. The Common Stock Forward is subject to early settlement or settlement with alternative consideration in the event of certain corporate transactions. The net cost incurred in connection with the Common Stock Forward of $27.5 million has beenwas recorded as an increase in treasury stock in the consolidated balance sheets. The related shares were accounted for as a repurchase of common stock. The book value of the 5.5% Notes Capped Call and Common Stock Forward isare not remeasured.
During the fourth quarter There were no shares of 2020,common stock settled in connection with the Common Stock Forward was partiallyduring the year ended December 31, 2022. During the year ended December 31, 2021, 8.1 million shares were settled and as a result,received by the Company received 4.4 million shares of its common stock.
9.
Company.
16. Stockholders’ Equity Preferred Stock The Company has authorized 5.0 million shares of preferred stock, par value $0.01 per share. The Company’s amended and restated certificate of incorporation provides that shares of preferred stock may be issued from time to time in one or more series. The Company’s Board of Directors is authorized to fix the voting rights, if any, designations, powers, preferences, qualifications, limitations, and restrictions thereof, applicable to the shares of each series.
The Company has authorized Series A Junior Participating Cumulative Preferred Stock, par value $0.01 per share. As of December 31, 20202022 and December 31, 2019,2021, there were 0no shares of Series A Junior Participating Cumulative Preferred Stock issued and outstanding. See Note 17, “Redeemable Convertible Preferred Stock,” for a description of the Company’s Series C Preferred Stock and Series E Preferred Stock. Common Stock and Warrants The Company has one class of common stock, par value $.01 per share. Each share of the Company’s common stock is entitled to 1one vote on all matters submitted to stockholders. In February 2021, the Company completed the previously announced sale of its common stock in connection with a strategic partnership with SK Holdings to accelerate the use of hydrogen as an alternative energy source in Asian markets. The Company sold 54,966,188 shares of its common stock to a subsidiary of SK Holdings at a purchase price of $29.2893 per share, or an aggregate purchase price of approximately $1.6 billion. In January and February 2021, the Company issued and sold in a registered equity offering an aggregate of 32.2 million shares of its common stock at a purchase price of $65.00 per share for net proceeds of approximately $1.8$2.0 billion. See Note 23, “Subsequent Events,” for more information. In November 2020, the Company issued and sold in a registered direct offering an aggregate of 43,700,000 shares of its common stock at a purchase price of $22.25 per share for net proceeds of approximately $927.3 million. In August 2020, the Company issued and sold in a registered direct offering an aggregate of 35,276,250 shares of its common stock at a purchase price of $10.25 per share for net proceeds of approximately $344.4 million. In December 2019, the Company issued and sold in a registered public offering an aggregate of 46 million shares of its common stock at a purchase price of $2.75 per share for net proceeds of approximately $120.4 million.
In March 2019, the Company issued and sold in a registered direct offering an aggregate of 10 million shares of its common stock at a purchase price of $2.35 per share. The net proceeds to the Company were approximately $23.5 million.
There were 458,051,920590,345,658 and 303,378,515577,654,900 shares of common stock outstanding as of December 31, 20202022 and December 31, 2019,2021, respectively. On August 24, 2022, the Company and Amazon.com, Inc. (“Amazon”) entered into a Transaction Agreement (the “2022 Transaction Agreement”), under which the Company concurrently issued to Amazon.com NV Investment Holdings LLC, a wholly owned subsidiary of Amazon, a warrant (the “Amazon Warrant”) to acquire up to 16,000,000 shares of the Company’s common stock (the “Amazon Warrant Shares”), subject to certain vesting events described below. The Company and Amazon entered into the 2022 Transaction Agreement in connection with a concurrent commercial arrangement under which Amazon agreed to purchase hydrogen fuel from the Company through August 24, 2029. At December 31, 2022, 1,000,000 of the Amazon Warrant Shares issued pursuant to the 2022 Transaction Agreement had vested upon issuance. During 2017, warrants to purchase up to 110,573,392 shares of common stock were issued in connection with transaction agreements with Amazon and Walmart, as discussed in Note 18,17, “Warrant Transaction Agreements.” At December 31, 2020 and December 31, 2019, 68,380,913 and 26,188,434 of the warrant shares had vested, respectively, and are therefore exercisable. These warrants are measured at fair value at the time of grant or modification and are classified as equity instruments on the consolidated balance sheets. Refer to Note 23, “Subsequent Events.” At Market Issuance SalesAccumulated Other Comprehensive Loss
Accumulated Other Comprehensive Loss comprises the following (in thousands): | | | | | | | | | | | | | | | Gains and Losses on | | Unrealized Gains and Losses | | | | | | | | | on Available-For-Sale | | on Available-For-Sale | | Foreign Currency | | | | | | Securities | | Securities | | Items | | Total | Balance at December 31, 2021 | | $ | (150) | | $ | (67) | | $ | (1,315) | | $ | (1,532) | Other comprehensive loss before reclassifications | | | — | | | — | | | — | | | — | Amounts reclassified from accumulated other comprehensive loss | | | (599) | | | 599 | | | — | | | — | Net current-period other comprehensive loss | | | — | | | (20,004) | | | (4,468) | | | (24,472) | Balance at December 31, 2022 | | $ | (749) | | $ | (19,472) | | $ | (5,783) | | $ | (26,004) | | | | | | | | | | | | | | Balance at December 31, 2020 | | $ | — | | $ | 2,451 | | $ | — | | $ | 2,451 | Other comprehensive loss before reclassifications | | | — | | | — | | | — | | | — | Amounts reclassified from accumulated other comprehensive loss | | | (150) | | | 150 | | | — | | | — | Net current-period other comprehensive loss | | | — | | | (2,668) | | | (1,315) | | | (3,983) | Balance at December 31, 2021 | | $ | (150) | | $ | (67) | | $ | (1,315) | | $ | (1,532) |
17. Warrant Transaction Agreements Amazon Transaction Agreement in 2022 On April 13, 2020,August 24, 2022, the Company and Amazon entered into the At Market Issuance Salesa Transaction Agreement with B. Riley Financial (“B. Riley”(the “2022 Transaction Agreement”) as sales agent, pursuant to, under which the Company may offer and sell, from timeconcurrently issued to time through B. Riley,Amazon.com NV Investment Holdings LLC, a wholly owned subsidiary of Amazon, a warrant (the “2022 Amazon Warrant”) to acquire up to 16,000,000 shares (the “2022 Amazon Warrant Shares”) of Companythe Company’s common stock, having an aggregate offering price of upsubject to $75.0 million. As of the date of this filing, the Company has not issued any shares of common stock pursuant to the At Market Issuance Sales Agreement.
Prior to December 31, 2019, the Company entered into a previous At Market Issuance Sales Agreement with B. Riley, which was terminated in the fourth quarter of 2019. Under this At Market Issuance Sales Agreement, for the year ended December 31, 2019, the Company issued 6.3 million shares of common stock, resulting in net proceeds of $14.5 million and for the year ended December 31, 2018, the Company issued 3.8 million shares of common stock, resulting in net proceeds of $7.0 million.
certain vesting events described below. The
17. Redeemable Convertible Preferred Stock, as restatedCompany and Amazon entered into the 2022 Transaction Agreement in connection with a concurrent commercial arrangement under which Amazon agreed to purchase hydrogen fuel from the Company through August 24, 2029.
Series E Preferred StockWarrant
In November 2018,1,000,000 of the 2022 Amazon Warrant Shares vested immediately upon issuance of the 2022 Amazon Warrant. 15,000,000 of the 2022 Amazon Warrant Shares will vest in multiple tranches over the 7-year term of the 2022 Amazon Warrant based on payments made to the Company issueddirectly by Amazon or its affiliates, or indirectly through third parties, with 15,000,000 of the 2022 Amazon Warrant Shares fully vesting if Amazon-related payments of $2.1 billion are made in the aggregate. The exercise price for the first 9,000,000 2022 Amazon Warrant Shares is $22.9841 per share and the fair value on the grant date was $20.36. The exercise price for the remaining 7,000,000 2022 Amazon Warrant Shares will be an aggregateamount per share equal to 90% of 35,000 sharesthe 30-day volume weighted average share price of the Company’s Series E Preferred Stock in a private placement to certain accredited investors in reliance on Section 4(a)(2)common stock as of the Securities Act.final vesting event that results in full vesting of the first 9,000,000 2022 Amazon Warrant Shares. The Company received net proceeds of approximately $30.9 million, after deducting placement agent fees and expenses payable by the Company. The Company2022 Amazon Warrant is required to redeem the Series E Preferred Stock in 13 monthly installments in the amount of $2.7 million each from May 2019exercisable through May 2020. The Company had 0 and 500 shares of Series E Preferred Stock outstanding at December 31, 2020 and 2019, respectively. The remaining 500 shares were converted to common stock in January 2020.August 24, 2029.
During 2019,Upon the consummation of certain conversionschange of control transactions (as defined in the 2022 Amazon Warrant) prior to the vesting of at least 60% of the Series E preferred stock resultedaggregate 2022 Amazon Warrant Shares, the 2022 Amazon Warrant will automatically vest and become exercisable with respect to an additional number of 2022 Amazon Warrant Shares such that 60% of the aggregate 2022 Amazon Warrant Shares shall have vested. If a change of control transaction is consummated after the vesting of at least 60% of the aggregate 2022 Amazon Warrant Shares, then no acceleration of vesting will occur with respect to any of the unvested 2022 Amazon Warrant Shares as a result of the transaction. The exercise price and the 2022 Amazon Warrant Shares issuable upon exercise of the Amazon Warrant are subject to customary antidilution adjustments.
At December 31, 2022, 1,000,000 of the 2022 Amazon Warrant Shares issued pursuant to the 2022 Transaction Agreement had vested upon issuance. The warrant charge associated with the vested shares of $20.4 million was capitalized to contract assets in our consolidated financial statements based on the grant date fair value and is subsequently amortized ratably as a deemed dividend of approximately $1.8 million that is reflectedreduction to revenue based on the Company’s consolidated statementestimate of operationsrevenue over the term of the agreement. The total amount amortized during the year 2022 was $0.5 million. The grant date fair value of tranches 2 and 3 will also be amortized ratably as Preferreda reduction to revenue based on the Company’s estimate of revenue over the term of the agreement. Because the exercise price has yet to be determined, the fair value of tranche 4 will be remeasured at each reporting period end and amortized ratably as a reduction to revenue based on the Company’s estimate of revenue over the term of the agreement. The total amount of provision for common stock dividends declared, deemed dividends and accretionwarrants recorded as a reduction of discount.revenue for the 2022 Amazon Warrant during the year ended December 31, 2022 was $5.2 million. Series C Preferred StockThe assumptions used to calculate the valuations as of August 24, 2022 and December 31, 2022 are as follows:
In April 2020, 870 shares of Series C Preferred Stock were converted to 923,819 shares of common stock. In May 2020, the remaining the 1,750 shares of Series C Preferred Stock were converted into 1,858,256 shares of common stock.
18. Warrant Transaction Agreements
| | | | | | | Tranches 1-3 | | Tranche 4 | | | August 24, 2022 | | December 31, 2022 | Risk-free interest rate | | 3.15% | | 3.88% | Volatility | | 75.00% | | 75.00% | Expected average term | | 7 years | | 4 years | Exercise price | | $22.98 | | $11.13 | Stock price | | $20.36 | | $12.37 |
Amazon Transaction Agreement in 2017 On April 4, 2017, the Company and Amazon entered into a Transaction Agreement (the “Amazon“2017 Transaction Agreement”), pursuant to which the Company agreed to issue to Amazon.com NV Investment Holdings LLC, a wholly owned subsidiary of Amazon a warrant (the “Amazon“2017 Amazon Warrant”) to acquire up to 55,286,696 shares of the Company’s common stock (the “Amazon“2017 Amazon Warrant Shares”), subject to certain vesting events described below. The Company and Amazon entered into the 2017 Amazon Transaction Agreement in connection with existing commercial agreements between the Company and Amazon with respect to the deployment of the Company’s GenKey fuel cell technology at Amazon distribution centers. The existing commercial agreements contemplate, but do not guarantee, future purchase orders for the Company’s fuel cell technology. The vesting of the 2017 Amazon Warrant Shares was conditioned upon payments made by Amazon or its affiliates (directly or indirectly through third parties) pursuant to the existing commercial agreements. Under the terms of the original2017 Amazon Warrant, the first tranche of the 5,819,652 of the 2017 Amazon Warrant Shares vested upon execution of the 2017 Amazon Warrant, and the remaining 2017 Amazon Warrant Shares vest based on Amazon’s payment of up to $600.0 million to the Company in connection with Amazon’s purchase of goods and services from the Company. The $6.7 million fair value of the first tranche of the 2017 Amazon Warrant Shares, was recognized as selling, general and administrative expense upon execution of the 2017 Amazon Warrant. Provision for the second and third tranches of the 2017 Amazon Warrant Shares iswas recorded as a reduction of revenue, because they represent consideration payable to a customer. The fair value of the second tranche of the 2017 Amazon Warrant Shares was measured at January 1, 2019, upon adoption of ASU 2019-08. The second tranche of 29,098,260 of the 2017 Amazon Warrant Shares vested in 4four equal installments, as Amazon or its affiliates, directly or indirectly through third parties, made an aggregate of $50.0 million in payments for goods and services to the Company, up to payments totaling $200.0 million in the aggregate. The last installment of the second tranche vested on November 2, 2020. Revenue reductions of $497 thousand, $9.0 million and $4.1 million and $9.8 millionwere associated with the second tranche of the 2017 Amazon Warrant Shares were recorded in 2021, 2020, 2019 and 2018,2019, respectively, under the terms of the original2017 Amazon Warrant. Under the terms of the original2017 Amazon Warrant, the third tranche of 20,368,784 of the 2017 Amazon Warrant Shares vests in 8eight equal installments, as Amazon or its affiliates, directly or indirectly through third parties, made an aggregate of $50.0 million in payments for goods and services to the Company, up to payments totaling $400.0 million in the aggregate. The measurement date for the third tranche of the 2017 Amazon Warrant Shares was November 2, 2020, when their exercise price was determined, as discussed further below. The fair value of the third tranche of the 2017 Amazon Warrant Shares was determined to be $10.57 each. During 2020, revenue reductions of $24.1 million associated with the third tranche of the 2017 Amazon Warrant Shares were recorded under the terms of the original2017 Amazon Warrant, prior to the December 31, 2020 waiver described below. On December 31, 2020, the Company waived the remaining vesting conditions under the 2017 Amazon Warrant, which resulted in the immediate vesting of all the third tranche of the 2017 Amazon Warrant Shares and recognition of an additional $399.7 million reduction to revenue. The $399.7 million reduction to revenue resulting from the December 31, 2020 waiver was determined based upon a probability assessment of whether the underlying shares would have vested under the terms of the original2017 Amazon Warrant. Based upon the Company’s projections of probable future cash collections from Amazon (i.e., a Type I share based payment modification), a reduction of revenue associated with 5,354,905 of the 2017 Amazon Warrant Shares was recognized at their previously measured November 2, 2020 fair value of $10.57 per warrant. A reduction of revenue associated with the remaining 12,730,490 of the 2017 Amazon Warrant Shares was recognized at their December 31, 2020 fair value of $26.95 each, based upon the Company’s assessment that associated future cash collections from Amazon were not deemed probable (i.e., a Type III share basedshare-based payment modification). The $399.7 million reduction to revenue was recognized during the year ended December 31, 2020 because the Company concluded such amount was not recoverable from the margins expected from future purchases by Amazon under the 2017 Amazon Warrant, and no exclusivity or other rights were conferred to the Company in connection with the December 31, 2020 waiver. Additionally, for the year ended December 31, 2020, the Company recorded a reduction to the provision for warrants of $12.8 million in connection with the release of the service loss accrual. The 2017 Amazon Warrant was exercised with respect to 24,704,450 and 17,461,994 shares of the Company’s common stock as of December 31, 2022 and 2021, respectively. At both December 31, 20202022 and December 31, 2019,2021, 55,286,696 and 20,368,782 of the 2017 Amazon Warrant Shares had vested, respectively.vested. The total amount of provision for common stock warrants recorded as a reduction of revenue for the 2017 Amazon Warrant during the years ended December 31, 2022, 2021, and 2020 and 2019 and 2018 was $420.0$0.4 million, $4.1$0.5 million and $9.8$420.0 million, respectively. The exercise price for the first and second tranches of the 2017 Amazon Warrant Shares iswas $1.1893 per share. The exercise price of the third tranche of the 2017 Amazon Warrant Shares iswas $13.81 per share, which was determined pursuant to the terms of the 2017 Amazon Warrant as an amount equal to ninety percent (90%)90% of the 30-day volume weighted average share price of the Company’s common stock as of November 2, 2020, the final vesting date of the second tranche of the 2017 Amazon Warrant Shares. The 2017 Amazon Warrant is exercisable through April 4, 2027. The 2017 Amazon Warrant provides for net share settlement that, if elected by the holder, will reduce the number of shares issued upon exercise to reflect net settlement of the exercise price. The 2017 Amazon Warrant provides for certain adjustments that may be made to the exercise price and the number of shares of common stock issuable upon exercise due to customary anti-dilution provisions based on future events. The 2017 Amazon Warrant is classified as an equity instrument. Fair value of the 2017 Amazon Warrant at December 31, 2020 and November 2, 2020 was based on the Black Scholes Option Pricing Model, which is based, in part, upon level 3 unobservable inputs for which there is little or no market data, requiring the Company to develop its own assumptions. All 2017 Amazon Warrant Shares were fully vested as of December 31, 2020. The Company used the following assumptions for its 2017 Amazon Warrant: | | | | | | | | | | | | December 31, 2020 | | November 2, 2020 | | | December 31, 2020 | | November 2, 2020 | Risk-free interest rate | | 0.58% | | 0.58% | | | 0.58% | | 0.58% | Volatility | | 75.00% | | 75.00% | | | 75.00% | | 75.00% | Expected average term | | 6.26 | | 6.42 | | | 6.26 | | 6.42 | Exercise price | | $13.81 | | $13.81 | | | $13.81 | | $13.81 | Stock price | | $33.91 | | $15.47 | | | $33.91 | | $15.47 |
Walmart Transaction Agreement On July 20, 2017, the Company and Walmart entered into a Transaction Agreement (the “Walmart Transaction Agreement”), pursuant to which the Company agreed to issue to Walmart a warrant (the “Walmart Warrant”) to acquire up to 55,286,696 shares of the Company’s common stock, subject to certain vesting events (the “Walmart Warrant Shares”). The Company and Walmart entered into the Walmart Transaction Agreement in connection with existing commercial agreements between the Company and Walmart with respect to the deployment of the Company’s GenKey fuel cell technology across various Walmart distribution centers. The existing commercial agreements contemplate, but do not guarantee, future purchase orders for the Company’s fuel cell technology. The vesting of the warrant shares conditioned upon payments made by Walmart or its affiliates (directly or indirectly through third parties) pursuant to transactions entered into after January 1, 2017 under existing commercial agreements. The majority of the Walmart Warrant Shares will vest based on Walmart’s payment of up to $600.0 million to the Company in connection with Walmart’s purchase of goods and services from the Company. The first tranche of 5,819,652 Walmart Warrant Shares vested upon the execution of the Walmart Warrant and was fully exercised as of December 31, 2020. Accordingly, $10.9 million, the fair value of the first tranche of Walmart Warrant Shares, was recorded as a provision for common stock warrants and presented as a reduction to revenue on the consolidated statements of operations during 2017. All future provision for common stock warrants is measured based on their grant-date fair value and recorded as a charge against revenue. The second tranche of 29,098,260 Walmart Warrant Shares vests in 4four installments of 7,274,565 Walmart Warrant Shares each time Walmart or its affiliates, directly or indirectly through third parties, make an aggregate of $50.0 million in payments for goods and services to the Company, up to payments totaling $200.0 million in the aggregate. The exercise price for the first and second tranches of Walmart Warrant Shares is $2.1231 per share. After Walmart has made payments to the Company totaling $200.0 million, the third tranche of 20,368,784 Walmart Warrant Shares will vest in 8eight installments of 2,546,098 Walmart Warrant Shares each time Walmart or its affiliates, directly or indirectly through third parties, make an aggregate of $50.0 million in payments for goods and services to the Company, up to payments totaling $400.0 million in the aggregate. The exercise price of the third tranche of Walmart Warrant Shares will be an amount per share equal to ninety percent (90%)90% of the 30-day volume weighted average share price of the common stock as of the final vesting date of the second tranche of Walmart Warrant Shares, provided that, with limited exceptions, the exercise price for the third tranche will not be no lower than $1.1893. The Walmart Warrant is exercisable through July 20, 2027. The Walmart Warrant provides for net share settlement that, if elected by the holder, will reduce the number of shares issued upon exercise to reflect net settlement of the exercise price. The Walmart Warrant provides for certain adjustments that may be made to the exercise price and the number of shares of common stock issuable upon exercise due to customary anti-dilution provisions based on future events. The Walmart Warrant is classified as an equity instrument. The warrant had been exercised with respect to 13,094,217 shares of the Company’s common stock as of both December 31, 2022 and 2021. At December 31, 20202022 and December 31, 2019, 13,094,2172021, 27,643,347 and 5,819,65220,368,782 of the Walmart Warrant Shares had vested, respectively. The total amount of provision for common stock warrants recorded as a reduction of revenue for the Walmart Warrant during the years ended December 31, 2022, 2021, and 2020 2019 and 2018 was $5.0$7.1 million, $2.4$6.1 million, and $0.4$5.0 million, respectively. Fair value of the Walmart Warrant was based on the Black Scholes Option Pricing Model, which is based, in part, upon level 3 unobservable inputs for which there is little or no market data, requiring the Company to develop its own assumptions. Except for the third tranche, all existing unvested Walmart Warrant Shares are measured using a measurement date of January 1, 2019, the adoption date, in accordance with ASU 2019-08. The Company used the following assumptions for its Walmart Warrant: | | | | | | | January 1, 2019 | Risk-free interest rate | | | 2.63% | Volatility | | | 95.00% | Expected average term | | | 8.55 | Exercise price | | | $2.12 | Stock price | | | $1.24 |
The assumptions used to calculate the valuations of the final tranche of the Walmart Warrant as of December 31, 2022 are as follows: | | | | | December 31, 2022 | Risk-free interest rate | | 3.92% | Volatility | | 75.00% | Expected average term | | 3.5 years | Exercise price | | $11.13 | Stock price | | $12.37 |
19.18. Revenue as restated
Disaggregation of revenue The following table provides information about disaggregation of revenue (in thousands): | | | | | | | | | | | | | | | | | | | Major products/services lines | | | | | | | | | | | | | | | | | | | | | Year ended December 31, | | Year Ended December 31, | | | | | | 2019 | | 2018 | | 2022 | | 2021 | | 2020 | | | 2020 | | (as restated) | | (as restated) | | Sales of fuel cell systems | | $ | (55,091) | | $ | 130,757 | | $ | 75,029 | | $ | 207,691 | | $ | 225,229 | | $ | (55,091) | Sale of hydrogen infrastructure | | | (39,204) | | | 19,163 | | | 32,146 | | Sales of hydrogen infrastructure | | | | 141,528 | | | 135,055 | | | (43,391) | Sales of electrolyzers | | | | 28,463 | | | 16,667 | | | 4,187 | Sales of engineered equipment | | | | 93,489 | | | 7,571 | | | — | Services performed on fuel cell systems and related infrastructure | | | (9,801) | | | 25,217 | | | 22,002 | | | 35,280 | | | 26,706 | | | (9,801) | Power Purchase Agreements | | | 26,620 | | | 25,553 | | | 22,569 | | | 47,183 | | | 35,153 | | | 26,620 | Fuel delivered to customers | | | (16,072) | | | 29,099 | | | 22,469 | | Fuel delivered to customers and related equipment | | | | 57,196 | | | 46,917 | | | (16,072) | Sales of cryogenic equipment | | | | 87,761 | | | 8,255 | | | — | Other | | | 311 | | | 186 | | | — | | | 2,849 | | | 789 | | | 311 | Net revenue | | $ | (93,237) | | $ | 229,975 | | $ | 174,215 | | $ | 701,440 | | $ | 502,342 | | $ | (93,237) |
Contract balances The following table provides information about receivables, contract assets, and contract liabilities from contracts with customers (in thousands): | | | | | | | | | | | | | | December 31, | | December 31, | | | 2020 | | 2019 | | 2022 | | 2021 | Accounts receivable | | $ | 43,041 | | $ | 25,768 | | $ | 129,450 | | $ | 92,675 | Contract assets | | | 18,189 | | | 13,251 | | | 104,287 | | | 38,757 | Contract liabilities | | | 76,285 | | | 40,743 | | Deferred revenue and contract liabilities | | | | 229,898 | | | 183,090 |
Contract assets relate to contracts for which revenue is recognized on a straight-line basis, however billings escalate over the life of a contract. Contract assets also include amounts recognized as revenue in advance of billings to customers, which are dependent upon the satisfaction of another performance obligation. These amounts are included in prepaid expenses and othercontract assets on the consolidated balance sheet. The deferred revenue and contract liabilities relate to the advance consideration received from customers for services that will be recognized over time (primarily fuel cell and related infrastructure services). ContractDeferred revenue and contract liabilities also include advance consideration received from customers prior to delivery of products. These amounts are included within deferred revenue and other contract liabilities on the consolidated balance sheet. Significant changes in the contract assets and the contract liabilities balances during the period are as follows (in thousands): | | | | | | | | Contract assets | | Year ended | | | December 31, 2020 | Transferred to receivables from contract assets recognized at the beginning of the period | | $ | (5,483) | Revenue recognized and not billed as of the end of the period | | | 10,421 | Net change in contract assets | | $ | 4,938 |
| | | | | | | | | | Contract assets | | | | | December 31, 2022 | | December 31, 2021 | Transferred to receivables from contract assets recognized at the beginning of the period | | $ | (33,394) | | $ | (14,638) | Contract assets assumed as part of acquisition | | | — | | | 9,960 | Contract assets related to warrants | | | 26,455 | | | — | Revenue recognized and not billed as of the end of the period | | | 72,469 | | | 25,246 | Net change in contract assets | | $ | 65,530 | | $ | 20,568 |
| | | | | | | | | | Contract liabilities | | Year ended | | Deferred revenue and contract liabilities | | | | | | December 31, 2020 | | December 31, 2022 | | December 31, 2021 | Increases due to cash received, net of amounts recognized as revenue during the period | | $ | 100,492 | | $ | 200,347 | | $ | 182,052 | Contract liabilities assumed as part of acquisitions | | | 2,350 | | | 10,011 | | 35,727 | Revenue recognized that was included in the contract liability balance as of the beginning of the period | | | (67,300) | | | (163,550) | | | (110,974) | Net change in contract liabilities | | $ | 35,542 | | Net change in deferred revenue and contract liabilities | | | $ | 46,808 | | $ | 106,805 |
Estimated future revenue The following table includes estimated revenue included in the backlog expected to be recognized in the future (sales(sales of fuel cell systems, equipment, and hydrogen installations are expected to be recognized as revenue within one year; sales of services, PPAs, and fuel and PPAs are expected to be recognized as revenue over five to seventen years) related to performance obligations that are unsatisfied (or partially unsatisfied) at the end of the reporting period, including provision for common stock warrants (in thousands): | | | | | | Estimated future revenue | | | | | | | | | | | December 31, | | December 31, | | | 2020 | | 2022 | Sales of fuel cell systems | | $ | 16,209 | | $ | 38,234 | Sale of hydrogen installations and other infrastructure | | | 28,282 | | Sales of hydrogen installations and other infrastructure | | | | 31,876 | Sales of electrolyzers | | | | 303,038 | Sales of engineered equipment | | | | 18,500 | Services performed on fuel cell systems and related infrastructure | | | 75,467 | | | 126,814 | Power Purchase Agreements | | | 178,450 | | | 375,802 | Fuel delivered to customers | | | 65,704 | | Other rental income | | | 3,294 | | Fuel delivered to customers and related equipment | | | | 93,798 | Sales of cryogenic equipment | | | | 193,644 | Total estimated future revenue | | $ | 367,406 | | $ | 1,181,706 |
Contract costs
Contract costs consists of capitalized commission fees and other expenses related to obtaining or fulfilling a contract.
Capitalized contract costs at December 31, 2020 and 2019 were $1.5 million and $0.5, respectively.
20.19. Employee Benefit Plans
2011 and 2021 Stock Option and Incentive Plan On May 12, 2011, the Company’s stockholders approved the 2011 Stock Option and Incentive Plan (the “2011 Plan”). The 2011 Plan provided for the issuance of up to a maximum number of shares of common stock equal to the sum of (i) 1,000,000, plus (ii) the number of shares of common stock underlying any grants pursuant to the 2011 Plan or the Plug Power Inc. 1999 Stock Option and Incentive Plan that are forfeited, canceled, repurchased or are terminated (other than by exercise). The shares may bewere issued pursuant to stock options, stock appreciation rights, restricted stock awards and certain other equity-based awards granted to employees, directors and consultants of the Company. NaNNo further grants may be made under the 2011 Plan after May 12, 2021. Through various amendments to the 2011 Plan approved by the Company’s stockholders, the number of shares of the Company’s common stock authorized for issuance under the 2011 Plan hashad been increased to 42.4 million. ForIn July 2021, the 2021 Stock Option Incentive Plan (the “2021 Plan”) was approved by the Company’s stockholders. The 2021 Plan provides for the issuance of up to a maximum number of shares of common stock equal to the sum of (i) 22,500,000 shares, plus the 473,491 shares remaining under the 2011 Plan as of the effective date of that the 2021 Plan, plus (iii) shares underlying any awards under the 2021 Plan and the 2011 Plan that are forfeited, canceled, cash-settled or otherwise terminated, other than by exercise. In June 2022, the Company’s stockholders approved an increase in the number of shares of the Company’s common stock authorized for issuance under the 2021 Plan to 40,030,000. Stock-based compensation costs recognized, excluding the Company’s matching contributions to the Plug Power Inc. 401(k) Savings & Retirement Plan and quarterly Board compensation, were approximately $169.8 million, $72.4 million and $14.4 million for the years ended December 31, 2020, 2019,2022, 2021, and 2018, the Company recorded expense of approximately $14.4 million, $8.8 million, and $7.4 million,2020, respectively, in connection with the Third Amended2011 and Restated 2011 Stock Option and Incentive Plan.
At December 31, 2020, there were outstanding options to purchase approximately 10.2 million shares of Common Stock and 0.8 million shares available for future awards under the 2011 Plan, including adjustments for other types of2021 Plans.
share-based
The components and classification of stock-based compensation expense, excluding the Company’s matching contributions to the Plug Power Inc. 401(k) Savings & Retirement Plan and quarterly Board compensation, were as follows (in thousands): | | | | | | | | | | Year ended December 31, | | 2022 | | 2021 | | 2020 | Cost of sales | $ | 7,259 | | $ | 1,965 | | $ | 324 | Research and development | | 6,369 | | | 5,983 | | | 1,624 | Selling, general and administrative | | 156,127 | | | 64,443 | | | 12,444 | | $ | 169,755 | | $ | 72,391 | | $ | 14,392 |
Option Awards The Company issues options that become exercisable based on time and/or market conditions, and are classified as equity awards. Service Stock Options for employees issued under this plan generally vest in equal annual installments over three years and expire ten years after issuance. Options granted to members of the Board generally vest one year after issuance. Awards To date, optionsservice-based stock option awards (“Service Stock Options”) granted under the 2011 Planand 2021 Plans have vesting provisions ranging from one to three years in duration and expire ten years after issuance.
Compensation cost associated with employee stock options represented approximately $6.8 million, $6.0 million, Service Stock Options for employees issued under these plans generally vest in equal annual installments over three years and $6.4 millionexpire ten years after issuance. Service Stock Options granted to members of the total share-based payment expense recorded for the years ended December 31, 2020, 2019, and 2018, respectively.Board generally vest one year after issuance. The Company estimates the fair value of stock optionsthe Service Stock Options using a Black-Scholes valuation model, and the resulting fair value is recorded as compensation cost on a straight-line basis over the option vesting period. Key inputs and assumptions used to estimate the fair value of stock optionsthe Service Stock Options include the grant price of the award, the expected option term, volatility of the Company’s stock, an appropriate risk-free rate, and the Company’s dividend yield. Estimates of fair value are not intended to predict actual future events or the value ultimately realized by employees who receive equity awards, and subsequent events are not indicative of the reasonableness of the original estimates of fair value made by the Company. The assumptions made for purposes of estimating fair value under the Black-Scholes model for the 3,261,724, 1,942,335, and 3,509,549 3,221,892 and 2,679,667 optionsService Stock Options granted during the years ended December 31, 2020, 2019,2022, 2021, and 2018,2020, respectively were as follows:
| | | | | | | | | | | | | | | | December 31, | | December 31, | | December 31, | | | 2020 | | 2019 | | 2018 | | 2022 | | 2021 | | 2020 | Expected term of options (years) | | 6 | | 6 | | 6 | | 5 | | 3-5 | | 6 | Risk free interest rate | | 0.37% - 1.37% | | 1.52% - 2.53% | | 2.81% - 2.88% | | 1.26% - 4.34% | | 0.61% - 1.23% | | 0.37% - 1.37% | Volatility | | 64.19% - 68.18% | | 69.32% - 87.94% | | 98.31% - 98.89% | | 73.38% - 85.97% | | 72.46% - 76.60% | | 64.19% - 68.18% |
There was 0no expected dividend yield for the employee stock optionsService Stock Options granted. Beginning in the second quarter of 2021, the expected term is based on the Company’s historical experience with employee early exercise behavior. The estimated stock price volatility is derived from the Company’s actual historic stock prices over the expected term, which represents the Company’s best estimate of expected volatility. Prior to this, the Company used the simplified method in determining its expected term of all its stock optionService Stock Option grants in all periods presented. The simplified method was used because the Company doesdid not believe historical exercise data providesprovided a reasonable basis for the expected term of its grants, due primarily toas a result of the limited number of Service Stock Option exercises that had historically occurred. The following table reflects the Service Stock Option activity for the year ended December 31, 2022: | | | | | | | | | | | | | | | | | | Weighted | | | | | | | | Weighted | | Average | | | | | | | | Average | | Remaining | | Aggregate | | | | | Exercise | | Contractual | | Intrinsic | | Shares | | Price | | Terms | | Value | Options outstanding at December 31, 2021 | $ | 9,786,909 | | $ | 11.65 | | | 7.70 | | $ | 172,412 | Options exercisable at December 31, 2021 | | 4,724,624 | | | 4.37 | | | 6.50 | | | 112,715 | Options unvested at December 31, 2021 | | 5,062,285 | | | 18.44 | | | 8.80 | | | 59,697 | Granted | | 3,261,724 | | | 20.25 | | | — | | | — | Exercised | | (757,424) | | | 2.96 | | | — | | | — | Forfeited | | (212,940) | | | 24.25 | | | — | | | — | Options outstanding at December 31, 2022 | $ | 12,078,269 | | $ | 14.34 | | | 7.57 | | $ | 42,835 | Options exercisable at December 31, 2022 | | 6,661,969 | | | 8.41 | | | 6.40 | | | 42,182 | Options unvested at December 31, 2022 | $ | 5,416,300 | | $ | 21.63 | | | 9.01 | | $ | 653 |
The weighted average grant-date fair value of the Service Stock Options granted during for the years ended December 31, 2022, 2021 and 2020 was $13.39, $19.80, and $7.22 per share, respectively. The total intrinsic fair value of Service Stock Options exercised during the years ended December 31, 2022, 2021, and 2020, was approximately $15.1 million, $115.5 million, and $145.0 million. The fair value of Service Stock Options vested during the years ended December 31, 2022, 2021, and 2020 was $22.6 million, $11.0 million, and $5.9 million, respectively. Compensation cost associated with Service Stock Options represented approximately $27.5 million, $17.4 million, and $41.5 million of the total share-based payment expense recorded for the years ended December 31, 2022, 2021 and 2020, respectively. As of December 31, 2022 and 2021, there was approximately $59.8 million and $46.2 million of unrecognized compensation cost related to Service Stock Options to be recognized over a weighted average remaining period of 2.11 years. Performance Stock Option Awards The Company grants performance-based stock option exercises that occurred. The Company expectsawards (“Performance Stock Options”) to cease using the simplified methodCompany’s Chief Executive Officer and certain other executive officers. These Performance Stock Options are subject to both market conditions tied to the achievement of stock price hurdles and time-based vesting; therefore, a Monte Carlo Simulation was utilized to determine itsthe grant date fair value with the associated expense recognized over the requisite service period. The Performance Stock Options performance-based conditions will be satisfied as the volume weighted average price of the Company’s common stock during any 30 consecutive trading day period in the relevant performance period following the grant date of the stock options (“VWAP”) equals or exceeds certain levels. These levels range between $35 and $100. The Performance Stock Options granted have a required service periods ranging between 2 and 3 years. The Performance Stock Options will vest and become exercisable ratably over the service period. There will be no interpolation for the Chief Executive Officer’s Performance Stock Option if the VWAP falls between any two stock price hurdles, except in the event of a change in control. For awards granted to other executives if the VWAP falls between two of the stock price hurdles, an incremental number of shares will be earned based on linear interpolation in $1 increments. Failure to achieve any of the stock price hurdles applicable to a Performance Stock Option during the required performance period will result in the applicable shares not becoming exercisable and being forfeited. The Performance Stock Options have a maximum term of seven years from the grant date. Key inputs and assumptions used to estimate the fair value of Performance Stock Options include the grant price of the awards, the expected option term, VWAP hurdle rates, volatility of the Company’s stock, an appropriate risk-free rate, and the Company’s dividend yield. Estimates of fair value are not intended to predict actual future events or the value ultimately realized by employees who receive equity awards, and subsequent events are not indicative of the reasonableness of the original estimates of fair value made by the Company. The following table presents key assumptions used to estimate the fair value of the performance stock option awards granted in 2022 and 2021: | | | | | | | December 31, | | December 31, | | 2022 | | 2021 | Remaining VWAP performance period (years) | | 3 | | | 3 | Risk- free interest rate | | 3.10% | | | 1.12% | Expected volatility | | 75.00% | | | 70.00% | Closing stock price on grant date | $ | 26.38 | | $ | 26.92 |
The expected term for stock optionwas determined based on term features within the grants in 2021.that decreases the overall grant pool if options are exercised early (0-3 years) reducing the maximum future payout and the Company’s historical experience with employee early exercise behavior. The estimated stock price volatility was derived from the Company’s actual historic stock prices over the past sixfive years, which represents the Company’s best estimate of expected volatility. A summary of stock optionThe following table reflects the Performance Stock Option activity for the year ended December 31, 20202022. Solely for the purposes of this table, the number of shares is as follows (in thousands except share amounts):based on participants earning the maximum number of shares underlying the Performance Stock Options (i.e., 200% of the target number of shares).
| | | | | | | | | | | | | | | | | | | | | | | | | | | Weighted | | | | | | | | | Weighted | | | | | | | | Weighted | | Average | | | | | | | Weighted | | Average | | | | | | | | Average | | Remaining | | Aggregate | | | | Average | | Remaining | | Aggregate | | | | | Exercise | | Contractual | | Intrinsic | | | | Exercise | | Contractual | | Intrinsic | | | Shares | | Price | | Terms | | Value | | Shares | | Price | | Terms | | Value | Options outstanding at December 31, 2019 | | 23,013,590 | | $ | 2.48 | | 6.6 | | $ | 22,277 | | Options outstanding at December 31, 2021 | | | 14,020,000 | | $ | 26.92 | | 6.70 | | $ | 18,336 | Options exercisable at December 31, 2021 | | | — | | | — | | — | | | — | Options unvested at December 31, 2021 | | | 14,020,000 | | | 26.92 | | 6.70 | | | 18,336 | Granted | | 3,509,549 | | | 12.79 | | — | | | — | | 1,500,000 | | | 26.38 | | 6.64 | | | — | Exercised | | (16,159,742) | | | 2.55 | | — | | | — | | — | | | — | | — | | | — | Forfeited | | (73,249) | | | 6.32 | | — | | | — | | — | | | — | | — | | | — | Expired | | (5,650) | | | 4.78 | | — | | | — | | Options outstanding at December 31, 2020 | | 10,284,498 | | $ | 5.78 | | 7.8 | | $ | 289,316 | | Options exercisable at December 31, 2020 | | 4,084,124 | | | 2.31 | | 5.8 | | | 129,068 | | Options unvested at December 31, 2020 | | 6,200,374 | | $ | 8.07 | | 9.1 | | $ | 160,248 | | Options outstanding at December 31, 2022 | | | 15,520,000 | | $ | 26.87 | | 5.81 | | $ | — | Options exercisable at December 31, 2022 | | | 1,391,000 | | | 26.92 | | 5.73 | | | — | Options unvested at December 31, 2022 | | | 14,129,000 | | $ | 26.86 | | 5.82 | | $ | — |
The weighted average grant-date fair value of optionsPerformance Stock Options granted during the years ended December 31, 2020, 2019,2022 and 20182021 was $7.22, $1.67,$9.73 and $1.55,$12.70, respectively. There were no Performance Stock Options exercised during the years ended December 31, 2022 and 2021. As of December 31, 2022, there were 2,782,000 unvested shares underlying Performance Stock Options for which the employee requisite service period has not been rendered but are expected to vest. The aggregate intrinsic value of these unvested Performance Stock Options is $0 as of December 31, 2022. The weighted average remaining contractual term of these unvested Performance Stock Options was 5.73 years as of December 31, 2022. Compensation cost associated with Performance Stock Options represented approximately $95.7 and $27.8 million of the total share-based payment expense recorded for the years ended December 31, 2022 and 2021, respectively. As of December 31, 2020,2022, there was approximately $8.1$70.4 million of unrecognized compensation cost related to stock option awardsPerformance Stock Options to be recognized over the next threea weighted average remaining period of 1.88 years. The total fair value of stock options that vested during the years ended December 31, 2020 and 2019 was approximately $5.9 million and $6.1 million, respectively. Restricted Stock Awards Restricted stock awards generally vest in equal installments over a period of one to three years. Restricted stock awards are valued based on the closing price of the Company’s common stock on the date of grant, and compensation cost is recorded on a straight-line basis over the share vesting period. The Company recorded expense associated with its restricted stock awards of approximately $7.6$46.5 million, $2.8$27.2 million, and $966 thousand,$7.6 million, for the years ended December 31, 2022, 2021, and 2020, respectively. Additionally, for the years ended December 31, 2022, 2021, and 2020, there was $110.3 million, $74.5 million, and $41.5 million, respectively, of unrecognized compensation cost related to restricted stock awards to be recognized over a weighted average remaining period of 2.16 years. 2020, 2019, and 2018, respectively. Additionally, for the years ended December 31, 2020, 2019, and 2018, there was $41.5 million, $8.4 million, and $3.9 million respectively, of unrecognized compensation cost related to restricted stock awards to be recognized over the next three years.
A summary of restricted stock award activity for the year ended December 31, 20202022 is as follows (in thousands except share amounts): | | | | | | | | | | | | | | | | | | | | Aggregate | | | | | Weighted | | Aggregate | | | | | | Intrinsic | | | | | Average Grant Date | | Intrinsic | | | | Shares | | Value | | | Shares | | Fair Value | | Value | | Unvested restricted stock at December 31, 2019 | | 4,608,560 | | $ | — | | | Unvested restricted stock at December 31, 2021 | | | 4,851,873 | | $ | 21.59 | | $ | 136,968 | | Granted | | 3,227,149 | | | — | | | 4,289,682 | | | 20.28 | | | — | | Vested | | (1,896,901) | | | — | | | (2,628,397) | | | (13.96) | | | — | | Forfeited | | (64,166) | | | | | | (236,782) | | | 23.84 | | | — | | Unvested restricted stock at December 31, 2020 | | 5,874,642 | | $ | 199,209 | | | Unvested restricted stock at December 31, 2022 | | | 6,276,376 | | $ | 21.56 | | $ | 77,639 | |
The weighted average grant-date fair value of the restricted stock awards granted during the years ended December 31, 2022, 2021, and 2020, was $20.28, $32.35, and $12.61, respectively. The total fair value of restricted stock awards vested for the years ended December 31, 2022, 2021, and 2020 was $36.7 million, $76.0 million, and $23.3 million, respectively. 401(k) Savings & Retirement Plan The Company offers a 401(k) Savings & Retirement Plan to eligible employees meeting certain age and service requirements. This plan permits participants to contribute 100% of their salary, up to the maximum allowable by the Internal Revenue Service regulations. Participants are immediately vested in their voluntary contributions plus actual earnings or less actual losses thereon. Participants are vested in the Company’s matching contribution based on years of service completed. Participants are fully vested upon completion of three years of service. During 2018, the Company began funding its matching contribution in a combination of cash and common stock. Accordingly, theThe Company has issued 403,474 shares and 841,539442,056 shares of common stock, 90,580 shares of common stock, and 403,474 shares of common stock pursuant to the Plug Power Inc. 401(k) Savings & Retirement Plan during 2020the years ended December 31, 2022, 2021, and 2019,2020, respectively. The Company’s expense for this plan was approximately $2.6$9.2 million, $1.9$4.3 million, and $1.8$2.6 million for the years ended December 31, 2022, 2021, and 2020, 2019, and 2018, respectively. Non-Employee Director Compensation Each non-employee director is paid an annual retainer for their services,his or her service, in the form of either cash or stock compensation. This annual retainer is paid in four quarterly installments. The Company granted 36,175, 114,285,21,886, 12,258, and 107,38936,175 shares of common stock to non-employee directors as quarterly compensation for the years ended December 31, 2020, 2019,2022, 2021 and 2018,2020, respectively. All common stock issued related to this annual retainer that is paid quarterly, is fully vested at the time of issuance and is valued at fair value on the date of issuance. The Company’s share-based compensation expense for this planin connection with non-employee director quarterly compensation was approximately $228$390 thousand, $243$372 thousand and $261$228 thousand for the years ended December 31, 2022, 2021, and 2020, 2019, and 2018, respectively.
21.20. Income Taxes as restated
The components of loss before income taxes and the income tax (expense) benefit for the years ended December 31, 2020, 2019,2022, 2021, and 2018,2020, by jurisdiction, are as follows (in thousands): | | | | | | | | | | | | | | | | | | | | | | | | | | | | | | | | | | | | | | | | | 2019 | | 2018 | | | | | | | | | | | | | | | | | | | | | | | | | | | | | | | | 2020 | | (as restated) | | (as restated) | | | 2022 | | 2021 | | 2020 | | | | U.S. | | Foreign | | Total | | U.S. | | Foreign | | Total | | U.S. | | Foreign | | Total | | | U.S. | | Foreign | | Total | | U.S. | | Foreign | | Total | | U.S. | | Foreign | | Total | | Loss before income taxes | | $ | (624,302) | | $ | (2,698) | | $ | (627,000) | | $ | (82,188) | | $ | (1,555) | | $ | (83,743) | | $ | (93,497) | | $ | (1,407) | | $ | (94,903) | | | $ | (697,342) | | $ | (25,827) | | $ | (723,169) | | $ | (466,825) | | $ | (9,337) | | $ | (476,162) | | $ | (624,302) | | $ | (2,698) | | $ | (627,000) | | Income tax benefit | | | 30,845 | | | — | | | 30,845 | | | — | | | — | | | — | | | 9,295 | | | — | | | 9,295 | | | Income tax (expense) benefit | | | | 868 | | | (1,707) | | | (839) | | | 16,540 | | | (343) | | | 16,197 | | | 30,845 | | | — | | | 30,845 | | Net loss attributable to the Company | | $ | (593,457) | | $ | (2,698) | | $ | (596,155) | | $ | (82,188) | | $ | (1,555) | | $ | (83,743) | | $ | (84,201) | | $ | (1,407) | | $ | (85,608) | | | $ | (696,474) | | $ | (27,534) | | $ | (724,008) | | $ | (450,285) | | $ | (9,680) | | $ | (459,965) | | $ | (593,457) | | $ | (2,698) | | $ | (596,155) | |
The significant components of current and deferred income tax expense (benefit) for the years ended December 31, 2022, 2021, and 2020, by jurisdiction, are as follows (in thousands): | | | | | | | | | | | | | | | | | | | | | | | | | | | | | | | 2022 | | 2021 | | 2020 | | | | U.S. | | Foreign | | Total | | U.S. | | Foreign | | Total | | U.S. | | Foreign | | Total | | Current income tax (benefit) expense | | $ | — | | $ | 668 | | $ | 668 | | $ | — | | $ | — | | $ | — | | $ | — | | $ | — | | $ | — | | Deferred tax (benefit) expense | | | (42,705) | | | 6,968 | | | (35,737) | | | (51,999) | | | 1,064 | | | (50,935) | | | (31,408) | | | (67) | | | (31,475) | | Net operating loss carryforward generated | | | (92,030) | | | 4,332 | | | (87,698) | | | (105,498) | | | (2,038) | | | (107,536) | | | (51,849) | | | (438) | | | (52,287) | | Valuation allowance increase (decrease) | | | 133,867 | | | (10,261) | | | 123,606 | | | 140,957 | | | 1,317 | | | 142,274 | | | 52,412 | | | 505 | | | 52,917 | | Expense (benefit) for income taxes | | $ | (868) | | | 1,707 | | $ | 839 | | $ | (16,540) | | $ | 343 | | $ | (16,197) | | $ | (30,845) | | $ | — | | $ | (30,845) | |
The Company’s effective income tax rate differed from the federal statutory rate as follows: | | | | | | | | | | 2022 | | 2021 | | 2020 | | U.S. Federal statutory tax rate | | (21.0) | % | (21.0) | % | (21.0) | % | Deferred state taxes | | 0.0 | % | (0.6) | % | (2.3) | % | Common stock warrant liability | | 0.0 | % | (6.0) | % | 13.4 | % | Section 162M Disallowance | | 1.9 | % | 1.1 | % | 0.0 | % | Equity Compensation | | (0.7) | % | (4.3) | % | 0.0 | % | Provision to return and deferred tax asset adjustments | | 4.6 | % | (1.3) | % | 0.0 | % | Change in U.S. Federal/Foreign statutory tax rate | | 0.0 | % | 0.3 | % | 0.0 | % | Other, net | | 0.6 | % | (1.5) | % | (3.5) | % | Change in valuation allowance | | 14.8 | % | 29.9 | % | 8.4 | % | | | 0.1 | % | (3.4) | % | (5.0) | % |
Deferred income taxes reflect the net tax effects of temporary differences between the carrying amounts of certain assets and liabilities for financial reporting and the amounts used for income tax purposes. The Company has recorded a net deferred tax liability in other non-current liabilities, at December 31, 2022 and 2021 of approximately $11.5 million The significant components of deferred income tax expense (benefit) for the years ended December 31, 2020, 2019, and 2018, by jurisdiction, are as follows (in thousands):
| | | | | | | | | | | | | | | | | | | | | | | | | | | | | | | | | 2019 | | 2018 | | | | 2020 | | (as restated) | | (as restated) | | | | U.S. | | Foreign | | Total | | U.S. | | Foreign | | Total | | U.S. | | Foreign | | Total | | Deferred tax (benefit) expense | | $ | (31,408) | | $ | (67) | | $ | (31,475) | | $ | (10,621) | | $ | (426) | | $ | (11,047) | | $ | (11,745) | | $ | 933 | | $ | (10,812) | | Net operating loss carryforward generated | | | (51,849) | | | (438) | | | (52,287) | | | (5,099) | | | (270) | | | (5,369) | | | (10,321) | | | (665) | | | (10,986) | | Valuation allowance increase (decrease) | | | 52,412 | | | 505 | | | 52,917 | | | 15,720 | | | 696 | | | 16,416 | | | 12,771 | | | (268) | | | 12,503 | | Benefit for income taxes | | $ | (30,845) | | $ | — | | $ | (30,845) | | $ | — | | $ | — | | $ | — | | $ | (9,295) | | $ | — | | $ | (9,295) | |
The Company’s effective income tax rate differed from the federal statutory rate as follows:
| | | | | | | | | | 2020 | | 2019 | | 2018 | | U.S. Federal statutory tax rate | | (21.0) | % | (21.0) | % | (21.0) | % | Deferred state taxes | | (2.3) | % | 1.4 | % | (1.9) | % | Common stock warrant liability | | 13.4 | % | — | % | (1.0) | % | Other, net | | (3.4) | % | (0.5) | % | 0.9 | % | Change in valuation allowance | | 8.4 | % | 20.1 | % | 13.2 | % | | | (4.9) | % | 0.0 | % | (9.8) | % |
Deferred income taxes reflect the net tax effects of temporary differences between the carrying amounts of certain assets and liabilities for financial reporting and the amounts used for income tax purposes.$5.0 million, respectively. Significant components of the Company’s deferred tax assets and liabilities as of December 31, 20202022 and 20192021 are as follows (in thousands):
| | | | | | | | | | | | | | | | | | | | | | | | | | | | | | | | | | | | | | | U.S. | | Foreign | | Total | | U.S. | | Foreign | | Total | | | | | 2019 | | | | 2019 | | | | 2019 | | 2022 | | 2021 | | 2022 | | 2021 | | 2022 | | 2021 | | | 2020 | | (as restated) | | 2020 | | (as restated) | | 2020 | | (as restated) | | Intangible assets | | $ | — | | $ | — | | $ | 1,197 | | $ | 1,197 | | $ | 1,197 | | $ | 1,197 | | Deferred revenue | | | 16,082 | | | 7,922 | | | 192 | | | 129 | | | 16,274 | | | 8,051 | | | 33,172 | | | 24,514 | | | 137 | | | 146 | | | 33,309 | | | 24,660 | Interest expense | | | 21,183 | | | 10,216 | | | — | | | — | | | 21,183 | | | 10,216 | | | 31,368 | | | 29,095 | | | — | | | — | | | 31,368 | | | 29,095 | Other reserves and accruals | | | 5,087 | | | 1,504 | | | — | | | — | | | 5,087 | | | 1,504 | | | 26,591 | | | 23,398 | | | 287 | | | 7,332 | | | 26,878 | | | 30,730 | Tax credit carryforwards | | | 4,360 | | | 2,590 | | | 1,253 | | | 1,253 | | | 5,613 | | | 3,843 | | | 14,949 | | | 8,960 | | | — | | | 1,289 | | | 14,949 | | | 10,249 | Amortization of stock-based compensation | | | 3,900 | | | 9,081 | | | — | | | — | | | 3,900 | | | 9,081 | | | 30,217 | | | 13,904 | | | — | | | — | | | 30,217 | | | 13,904 | Non-compensatory warrants | | | 5,020 | | | 4,322 | | | — | | | — | | | 5,020 | | | 4,322 | | | 6,268 | | | 4,115 | | | — | | | — | | | 6,268 | | | 4,115 | Capitalized research & development expenditures | | | 30,870 | | | 22,601 | | | 4,483 | | | 4,483 | | | 35,353 | | | 27,084 | | | 60,588 | | | 37,912 | | | — | | | 4,613 | | | 60,588 | | | 42,525 | Right of use liability (operating leases) | | | 27,715 | | | 22,647 | | | — | | | — | | | 27,715 | | | 22,647 | | | 32,616 | | | 6,118 | | | 259 | ��� | | 485 | | | 32,875 | | | 6,603 | Net operating loss carryforwards | | | 110,978 | | | 54,438 | | | 10,014 | | | 9,576 | | | 120,992 | | | 64,014 | | | 297,790 | | | 205,760 | | | 7,720 | | | 12,052 | | | 305,510 | | | 217,812 | Total deferred tax asset | | | 225,195 | | | 135,321 | | | 17,139 | | | 16,638 | | | 242,334 | | | 151,959 | | | 533,559 | | | 353,776 | | | 8,403 | | | 25,917 | | | 541,962 | | | 379,693 | Valuation allowance | | | (154,467) | | | (102,055) | | | (17,127) | | | (16,622) | | | (171,594) | | | (118,677) | | | (429,291) | | | (295,424) | | | (8,183) | | | (18,444) | | | (437,474) | | | (313,868) | Net deferred tax assets | | $ | 70,728 | | $ | 33,266 | | $ | 12 | | $ | 16 | | $ | 70,740 | | $ | 33,282 | | $ | 104,268 | | $ | 58,352 | | $ | 220 | | $ | 7,473 | | $ | 104,488 | | $ | 65,825 | Intangible assets | | | (7,360) | | | (15) | | | — | | | — | | | (7,360) | | | (15) | | | (29,731) | | | (23,244) | | | (9,938) | | | (11,098) | | | (39,669) | | | (34,342) | Convertible debt | | | (27,420) | | | (6,592) | | | — | | | — | | | (27,420) | | | (6,592) | | | (26,989) | | | (27,346) | | | — | | | — | | | (26,989) | | | (27,346) | Right of use asset (operating leases) | | | (27,684) | | | (23,040) | | | — | | | — | | | (27,684) | | | (23,040) | | | (40,194) | | | (247) | | | (260) | | | (485) | | | (40,454) | | | (732) | Other reserves and accruals | | | — | | | — | | | (12) | | | (16) | | | (12) | | | (16) | | Property, plant and equipment and right of use assets | | | (9,191) | | | (3,619) | | | — | | | — | | | (9,191) | | | (3,619) | | | (7,383) | | | (8,489) | | | (1,500) | | | — | | | (8,883) | | | (8,489) | Deferred tax liability | | $ | (71,655) | | $ | (33,266) | | $ | (12) | | $ | (16) | | $ | (71,667) | | $ | (33,282) | | $ | (104,297) | | $ | (59,326) | | $ | (11,699) | | $ | (11,583) | | $ | (115,996) | | $ | (70,909) | Net | | $ | (927) | | $ | — | | $ | — | | $ | — | | $ | (927) | | $ | — | | $ | (29) | | $ | (974) | | $ | (11,479) | | $ | (4,110) | | $ | (11,508) | | $ | (5,084) |
The Company has recorded a valuation allowance, as a result of uncertainties related to the realization of its net deferred tax asset, at December 31, 20202022 and 20192021 of approximately $171.6$437.5 million and $118.7$313.9 million, respectively. A reconciliation of the current year change in valuation allowance is as follows (in thousands): | | | | | | | | | | | | | U.S. | | Foreign | | Total | | Increase in valuation allowance for current year increase in net operating losses | | $ | 51,848 | | $ | | | $ | 51,848 | | Increase (decrease) in valuation allowance for current year net increase (decrease) in deferred tax assets other than net operating losses | | | (5,742) | | | 133 | | | (5,609) | | Decrease in valuation allowance as a result of foreign currency fluctuation | | | 6,306 | | | — | | | 6,306 | | Increase in valuation allowance due to change in tax rates | | | — | | | 372 | | | 372 | | Net increase in valuation allowance | | $ | 52,412 | | $ | 505 | | $ | 52,917 | |
| | | | | | | | | | | | | U.S. | | Foreign | | Total | | Increase (decrease) in valuation allowance for current year increase in net operating losses | | $ | 119,784 | | | (5,924) | | $ | 113,860 | | Increase (decrease) in valuation allowance for current year net increase in deferred tax assets other than net operating losses | | | 22,081 | | | (12,265) | | | 9,816 | | Increase (decrease) in valuation allowance due to change in tax rates | | | (7,998) | | | 7,928 | | | (70) | | Net increase (decrease) in valuation allowance | | $ | 133,867 | | $ | (10,261) | | $ | 123,606 | |
Thethe Company’s Netherlands subsidiary, all deferred tax assets have beenare offset by a full valuation allowance because it is more likely than not that the tax benefits of the net operating loss carryforwards and other deferred tax assets maywill not be realized due to cumulative losses.realized.
Under Section 382 of the Internal Revenue Code of 1986, as amended (the “Code”), the use of loss carryforwards may be limited if a change in ownership of a company occurs. If it is determined that due to transactions involving the Company’s shares owned by its 5 percent or greater stockholders a change of ownership has occurred under the provisions of Section 382 of the Code, the Company's federal and state NOL carryforwards could be subject to significant Section 382 limitations. Based on studies of the changes in ownership of the Company, it has been determined that an ownership change under Section 382 of the Code occurred in 2013 that limited the amount of pre-change NOL that can be used in future years to $13.5 million. These NOL carryforwards will expire, if unused, at various dates from 2020 through 2033. NOLs of $450.9 million incurred after the most recent ownership change are not subject to Section 382 of the Code and are available for use in future years. Accordingly, theThe Company's deferred tax assets include $464.4 million$1.4 billion of U.S. net operating loss carryforwards. The NOL carryforwards available at December 31, 2020,2022, include $205.2 million of NOL that was generated in 2020, $25.0 million of net operating loss that was generated in 2019 and $43.4 million$1.2 billion of NOL that was generated in 2018 through 2022, that do not expire (2019 and 2018 as restated).expire. The remainder, if unused, will expire at various dates from 20322034 through 2037. Based on analysis of stock transactions, an ownership change as defined under Section 382 of the Code occurred in 2013, which imposes a $13.5
million limit on the utilization of pre-change losses that can be used to offset taxable income in future years. The pre-change NOL carryforwards will expire, if unused, at various dates from 2021 through 2033. The Company continuously analyzes stock transactions and has determined that no ownership changes have occurred since 2013 that would further limit the utilization of NOLs. Therefore, NOLs of $1.4 billion incurred in post-change years are not subject to limitation. Approximately $4.4$14.9 million of research credit carryforwards generated after the most recent IRC Section 382 ownership change are included in the Company's deferred tax assets. Due to limitations under IRC Section 382, research credit carryforwards existing prior to the most recent IRC Section 382 ownership change will not be used and are not reflected in the Company's gross deferred tax asset at December 31, 2020.2022. The remaining credit carryforwards will expire during the periods 2033 through 2040.2042. At December 31, 2020,2022, the Company has unused Canadian net operating loss carryforwards of approximately $14.0$1.3 million. The net operating loss carryforwards if unused will expire at various dates from 2026between 2040 through 2034.2043. At December 31, 2020,2022, the Company has no remaining Scientific Research and Experimental Development (“SR&ED”) expenditures of $17.2 million available to offset future taxable income. These SR&ED expenditures have no expiry date. At December 31, 2020, the Company has Canadianor ITC credit carryforwards of $1.3 million available to offset future income tax. These credit carryforwards if unused will expire at various dates from 2022 through 2028. carryforwards. At December 31, 2020,2022, the Company has unused French net operating loss carryforwards of approximately $21.3$27.3 million. The net operating loss may carryforward indefinitely or until the Company changes its activity. At December 31, 2022, the Company no longer has Netherlands net operating loss carryforwards. As the carryforward amount of $2.9 million as of December 31, 2021 was utilized in the current year. As of December 31, 2020,2022, the Company has 0no un-repatriated foreign earnings or unrecognized tax benefits. The Inflation Reduction Act of 2022 (IRA) was signed into law on August 16, 2022. Key provisions under the IRA include a 15% corporate alternative minimum tax imposed on certain large corporations and the extension and expansion of clean energy tax incentives. The 15% corporate alternative minimum tax is not expected to affect the Company in the near future. The Company is in the process of evaluating the impact of the clean energy tax incentives on its businesses and is awaiting U.S. Department of the Treasury and Internal Revenue Service guidance. The Company files income tax returns in the U.S. federal jurisdiction and various state and foreign jurisdictions. In the normal course of business, the Company is subject to examination by taxing authorities. Open tax years in the USU.S. range from 20172019 and forward. Open tax years in the foreign jurisdictions range from 2010 to 2019.2012 and forward. However, upon examination in subsequent years, if net operating losses carryforwards and tax credit carryforwards are utilized, the US and foreign jurisdictions can reduce net operating loss carryforwards and tax credit carryforwards utilized in the year being examined if they do not agree with the carryforward amount. As of December 31, 2020,2022, the Company was not under audit in the U.S. or non-U.S. taxing jurisdictions. The Company recognized an income tax benefitTax Cuts and Jobs Act of 2017 requires taxpayers to capitalize and amortize research and development costs pursuant to Internal Revenue Code ("IRC") Section 174. The requirement was effective for the year endedCompany beginning after December 31, 2020 of $30.8 million resulting from2021. We recorded a source of future taxable income attributable to the net credit to additional paid-in capital of $25.6 million related to the issuance of the 3.75% Convertible Senior Notes, offset by the partial extinguishment of the 5.5% Convertible Senior Notes and $5.2 million of income tax benefit for the year ended December 31, 2020 related to the recognition of net deferred tax liabilities in connection with the Giner ELX acquisition. This resulted in a corresponding reduction in our deferred tax asset of approximately $19.0 million due to Section 174 capitalization. We note that the Company is currently in a full valuation allowance. allowance as it relates to the U.S. taxing jurisdiction as a result there is no impact to cash taxes payable. The Company has not changed its overall conclusion with respect to the need for a valuation allowance against its net deferred tax assets, which remain fully reserved.reserved, with the exception of $20.0 million of DTAs recorded in the Netherlands, which do not require a reserve as the Netherlands entity has approximately $31.5 million of DTLs that provide a sufficient source of income to support realization of its DTAs. 22.21. Commitments and Contingencies as restated
Restricted Cash In connection with certain of the above noted sale/leaseback agreements, cash of $169.0$383.7 million and $275.1 million, respectively, was required to be restricted as security as of December 31, 2020,2022 and 2021, which restricted cash will be released over the lease term. As of December 31, 2020,2022 and 2021, the Company also had certain letters of credit backed by security deposits totaling $152.4$379.6 million and $286.0 million, respectively, that are security for the above noted sale/leaseback agreements. As of December 31, 2022 and 2021, the Company had $75.5 million and $67.7 million, respectively, held in escrow related to the construction of certain hydrogen plants. The Company also had letters$5.0 million, $2.3 million, and $1.8 million of creditconsideration held by our paying agent in connection with the aggregate amountApplied Cryo, Joule, and CIS acquisitions, respectively, reported as restricted cash as of $0.5 million at December 31, 2020 associated2022, with a finance obligationcorresponding accrued liability on the Company’s consolidated balance sheet. The Company had $10.0 million of consideration held by our paying agent in connection with the Applied Cryo reported as restricted cash as of December 31, 2021, with a corresponding accrued liability on the Company’s consolidated balance sheet. Additionally, the Company had $10.8 million and $12.2 million in restricted cash as collateral resulting from the sale/leasebackFrames acquisition as of its building. We consider cash collateralizing this letter of credit as restricted cash.December 31, 2022 and 2021, respectively. Litigation Legal matters are defended and handled in the ordinary course of business. Liabilities for loss contingencies arising from claims, assessments, litigation, fines, and penalties and other sources are recorded when it is probable that a liability has been incurred and the amount can be reasonably estimated. Legal costs incurred in connection with loss contingencies are expensed as incurred. The Company has not recorded any accruals related to any legal matters. Concentrations of credit risk Concentrations of credit risk with respect to receivables exist due to the limited number of select customers with whom the Company has initial commercial sales arrangements. To mitigate credit risk, the Company performs appropriate evaluation of a prospective customer’s financial condition. At December 31, 2020, 3 customers2022, one customer comprised approximately 73.9%24.9% of the total accounts receivable balance. At December 31, 2019, 2 customers2021, one customer comprised approximately 62.6%46.6% of the total accounts receivable balance. For the year ended December 31, 2022, three customers accounted for 51.2% of total consolidated revenues. For the year ended December 31, 2021, three customers accounted for 75.7% of total consolidated revenues. On December 31, 2020, the Company waived the remaining vesting conditions under the Amazon Warrant, which resulted in a reduction in revenue of $399.7 million, which resulted in negative consolidated revenue of $93.2 million for the year ended December 31, 2020. See Note 18,17, “Warrant Transaction Agreements,” to the consolidated financial statements for further information. Total revenue in 2020 for this customer was negative $310.1 million. For the year ended December 31, 2020, this customer accounted for (332.4)% of our total consolidated revenues which included a provision for warrant charge of $420.0 million, which was recorded as a reduction of revenue. Additionally, 156.2% of our total consolidated revenues were associated primarily with 2two other customers. For the year ended December 31, 2019 49.7% of total consolidated revenues were associated primarily with 2 customers, as restated. For the year ended December 31, 2018 66.8% of total consolidated revenues were associated primarily with 2 customers, as restated. For purposes of assigning a customer to a sale/leaseback transaction completed with a financial institution, the Company considers the end user of the assets to be the ultimate customer. At December 31, 2020, 3 customers comprised approximately 73.9% of the total accounts receivable balance. At December 31, 2019, 2 customers comprised approximately 62.6% of the total accounts receivable balance. 23. Subsequent Events22. Segment and Geographic Area Reporting
Capital Raise
In JanuaryOur organization is managed from a sales perspective based on “go-to-market” sales channels, emphasizing shared learning across end-user applications and February 2021,common supplier/vendor relationships. These sales channels are structured to serve a range of customers for our products and services. As a result of this structure, we concluded that we have one operating and reportable segment — the Company issueddesign, development and sold in a registered equity offering an aggregatesale of 32,200,000 shares of its common stock at a purchase price of $65.00 per share for net proceeds of approximately $1.8 billion.
3.75% Convertible Senior Notes
During Januarygreen hydrogen products and February of 2021, $15.2 million ofsolutions that help customers meet their business goals while decarbonizing their operations. Our chief executive officer was identified as the 3.75% Convertible Senior Notes were converted and the Company has issued 3.0 million shares in conjunction with these conversions.
chief operating decision maker (CODM). All significant operating decisions made by management are
Strategic Investmentlargely based upon the analysis of Plug on a total company basis, including assessments related to our incentive compensation plans.
| | | | | | | | | | | | | | | | | | Revenues | | Long-Lived Assets | | | Year ended December 31, | | As of December 31, | | | 2022 | | 2021 | | 2020 | | 2022 | | 2021 | North America | | $ | 579,218 | | $ | 476,246 | | $ | (100,523) | | $ | 1,209,900 | | $ | 570,777 | Europe | | | 46,033 | | | 20,814 | | | 3,929 | | | 13,215 | | | 2,608 | Asia | | | 50,498 | | | 718 | | | 147 | | | — | | | — | Other | | | 25,691 | | | 4,564 | | | 3,210 | | | — | | | 171 | Total | | $ | 701,440 | | $ | 502,342 | | $ | (93,237) | | $ | 1,223,115 | | $ | 573,556 |
In February 2021, the Company completed the previously announced sale23. Subsequent Events
We have evaluated events as of its common stock in connection with a strategic partnership with SK Holdings to accelerate the use of hydrogen as an alternative energy source in Asian markets. The Company sold 54,966,188 shares of its common stock to a subsidiary of SK Holdings at a purchase price of $29.2893 per share, or an aggregate purchase price of approximately $1.6 billion.March 1, 2023 and have not identified any subsequent events.
SIGNATURES Pursuant to the requirements of Section 13 or 15(d) of the Securities Exchange Act of 1934, the registrant has duly caused this report to be signed on its behalf by the undersigned, thereunto duly authorized. | | | | PLUG POWER INC. | | | | | | | | By: | /s/ ANDREW MARSH | | | Andrew Marsh | | | President, Chief Executive Officer and Director |
Date: May 13, 2021March 1, 2023 |
|---|
|
|
|
|
|
|
|
|
| |
|
|
|
|
|
|
|