Table of Contents

UNITED STATES

SECURITIES AND EXCHANGE COMMISSION

Washington, D.C. 20549

Form 10-K

Form 10-K

ANNUAL REPORT PURSUANT TO SECTION 13 OR 15(d) OF THE SECURITIES EXCHANGE ACT OF 1934

For the fiscal year ended December 31, 2021

or2023

or

TRANSITION REPORT PURSUANT TO SECTION 13 OR 15(d) OF THE SECURITIES EXCHANGE ACT OF 1934

For the transition period from to .

Commission File Number: 001-36739


STORE CAPITAL CORPORATIONLLC

(Exact name of registrant as specified in its charter)

Maryland

45-2280254

Delaware

88-4051712

(State or other jurisdiction of

incorporation or organization)

(I.R.S. Employer

Identification No.)

8377 East Hartford Drive, Suite 100, Scottsdale, Arizona85255

(Address of principal executive offices) (Zip Code)

Registrant’s telephone number, including area code: (480) 256-1100

Securities Registered Pursuant to Section 12(b) of the Act:

Title of each class

Trading Symbol(s)

Name of each exchange on which registered

Common StockNone

STORNone

New York Stock ExchangeNone

Securities Registered Pursuant to Section 12(g) of the Act: None

Indicate by check mark if the registrant is a well-known seasoned issuer, as defined in Rule 405 of the Securities Act. Yes No No  

Indicate by check mark if the registrant is not required to file reports pursuant to Section 13 or Section 15(d) of the Act. Yes  Yes No

Indicate by check mark whether the registrant (1) has filed all reports required to be filed by Section 13 or 15(d) of the Securities Exchange Act of 1934 during the preceding 12 months (or for such shorter period that the registrant was required to file such reports), and (2) has been subject to such filing requirements for the past 90 days. Yes No No  

Note: The registrant is a voluntary filer of reports required to be filed by certain companies under Sections 13 or 15(d) of the Securities Exchange Act of 1934.

Indicate by check mark whether the registrant has submitted electronically every Interactive Data File required to be submitted pursuant to Rule 405 of Regulation S-T (§232.405 of this chapter) during the preceding 12 months (or for such shorter period that the registrant was required to submit such files). Yes  Yes No

Indicate by check mark whether the registrant is a large accelerated filer, an accelerated filer, a non-accelerated filer, a smaller reporting company, or an emerging growth company. See the definitions of “large accelerated filer,” “accelerated filer,” “smaller reporting company,” and “emerging growth company” in Rule 12b-2 of the Exchange Act.

Large accelerated filer

Accelerated filer

Non-accelerated filer

Smaller reporting company

Non-accelerated filer

Smaller reporting company

Emerging growth company

If an emerging growth company, indicate by check mark if the registrant has elected not to use the extended transition period for complying with any new or revised financial accounting standards provided pursuant to Section 13(a) of the Exchange Act.

Indicate by check mark whether the registrant has filed a report on and attestation to its management’s assessment of the effectiveness of its internal control over financial reporting under Section 404(b) of the Sarbanes-Oxley Act (15 U.S.C. 7262(b)) by the registered public accounting firm that prepared or issued its audit report. Yes No

If securities are registered pursuant to Section 12(b) of the Act, indicate by check mark whether the financial statements of the registrant included in the filing reflect the correction of an error to previously issued financial statements.

Indicate by check mark whether any of those error corrections are restatements that required a recovery analysis of incentive-based compensation received by any of the registrant’s executive officers during the relevant recovery period pursuant to §240.10D-1(b). ☐

Indicate by check mark whether the registrant is a shell company (as defined in Rule 12b-2 of the Exchange Act). Yes No

As ofOn June 30, 2021 (the last business day2023, none of the registrant’s most recently completed second fiscal quarter), the aggregate market value of the registrant’s shares of commonvoting stock $0.01 par value, held by non-affiliates of the registrant was $9.3 billion based on the last reported sale price of $34.51 per share on the New York Stock Exchange on June 30, 2021.held by non-affiliates.

As of February 22, 2022March 8, 2024 there were 274,775,929 shares1,125 units of the registrant’s common stockequity outstanding.

Documents Incorporated by Reference

Portions of Part III of this Form 10-K are incorporated by reference from the registrant’s definitive proxy statement for its 2022 Annual Meeting of Stockholders to be filed with the Securities and Exchange Commission no later than 120 days after the end of the registrant’s fiscal year.


Table of Contents

TABLE OF CONTENTS

Page
Number

PART I

Item 1.

Business

2

Item 1A.

Risk Factors

145

Item 1B.

Unresolved Staff Comments

2814

Item 1C.

Cybersecurity

14

Item 2.

Properties

2815

Item 3.

Legal Proceedings

3115

Item 4.

Mine Safety Disclosures

31

16

PART II

Item 5.

Market for Registrant’s Common Equity, Related Stockholder Matters and Issuer Purchases of Equity Securities

3116

Item 6.

Reserved[Reserved]

3216

Item 7.

Management’s Discussion and Analysis of Financial Condition and Results of Operations

3316

Item 7A.

Quantitative and Qualitative Disclosures About Market Risk

4829

Item 8.

Financial Statements and Supplementary Data

5030

Item 9.

Changes in and Disagreements with Accountants on Accounting and Financial Disclosure

7868

Item 9A.

Controls and Procedures

7868

Item 9B.

Other Information

7868

Item 9C.

Disclosure Regarding Foreign Jurisdictions that Prevent Inspections

78

69

PART III

Item 10.

Directors, Executive Officers and Corporate Governance

7969

Item 11.

Executive Compensation

7972

Item 12.

Security Ownership of Certain Beneficial Owners and Management and Related Stockholder Matters

7982

Item 13.

Certain Relationships and Related Transactions, and Director Independence

7982

Item 14.

Principal Accountant Fees and Services

79

83

PART IV

Item 15.

Exhibits and Financial Statement Schedules

8085

Item 1616..

Form 10-K Summary

8489


PART I

Table of Contents

PART I

In this Annual Report on Form 10-K, or this Annual Report, we referreferences to “we,” “us,” “our,” “the Company,” “STORE” or “STORE Capital, are references to STORE Capital Corporation, a Maryland corporation, prior to, and to STORE Capital LLC, a Delaware limited liability company, upon and following the completion of the Merger, and references to the “Merger” are references to the Merger as “we,” “us,” “our,” “the Company,” “S|T|O|R|E” or “STORE Capital, unless we specifically state otherwise or the context indicates otherwise.defined in Item 1 below.

Forward-Looking Statements

This Annual Report contains forward-looking statements within the meaning of Section 27A of the Securities Act of 1933, as amended, or the Securities Act, and Section 21E of the Securities Exchange Act of 1934, as amended, or the Exchange Act. Such forward-looking statements include, without limitation, statements concerning our business and growth strategies, investment, financing and leasing activities and trends in our business, including trends in the market for long-term, triple-net leases of freestanding, single-tenant properties, and expected liquidity needs and sources (including the ability to obtain financing or raise capital). Words such as “estimate,” “anticipate,” “expect,” “believe,” “intend,” “may,” “will,” “should,” “seek,” “approximately” or “plan,” or the negative of these words, and phrases or similar words or phrases that are predictions of or indicate future events or trends and that do not relate solely to historical matters, are intended to identify forward-looking statements. You can also identify forward-looking statements by discussions of strategy, plans or intentions of management.

Forward-looking statements involve numerous risks and uncertainties, and you should not rely on them as predictions of future events. Forward-looking statements depend on assumptions, data or methods that may be incorrect or imprecise, and we may not be able to realize them. The following risks, among others, which may be further heightened by the potential adverse effects of the ongoing COVID-19 pandemic and federal, state and/or local regulatory guidelines and private business actions to control it, could cause actual results and future events to differ materially from those set forth or contemplated in the forward-looking statements:

real estate risks, including fluctuations in real estate values and the general economic climate in local markets and competition for customers in such markets;
actual or perceived threats associated with the COVID-19 pandemic or other public health crises;
rental rates that are unable to keep up with the pace of inflation;
the performance and financial condition of our customers;
real estate acquisition risks, including our ability to identify and complete acquisitions and/or failure of such acquisitions to perform in accordance with projections;
the competitive environment in which we operate;
decreased rental rates or increased vacancy rates;
potential defaults (including bankruptcy or insolvency) on, or non-renewal of, leases by customers;
our ability to raise debt and equity capital on attractive terms;
financing risks, including the risks that our cash flows from operations may be insufficient to meet required payments of principal and interest and that we may be unable to refinance our existing debt upon maturity or obtain new financing on attractive terms at all;
lack of or insufficient amounts of insurance;
potential natural disasters and other liabilities and costs associated with the impact of climate change;
the impact of changes in the tax code as a result of federal tax legislation and uncertainty as to how such changes may be applied;
real estate risks, including fluctuations in real estate values and the general economic climate in local markets and competition for customers in such markets;
rental rates that are unable to keep up with the pace of inflation;
the performance and financial condition of our customers;
real estate acquisition risks, including our ability to identify and complete acquisitions and/or failure of such acquisitions to perform in accordance with projections;
the competitive environment in which we operate;
decreased rental rates or increased vacancy rates;
potential defaults (including bankruptcy or insolvency) on, or non-renewal of, leases by customers;
our ability to raise debt capital on attractive terms;
financing risks, including the risks that our cash flows from operations may be insufficient to meet required payments of principal and interest and that we may be unable to refinance our existing debt upon maturity or obtain new financing on attractive terms at all;
potential natural disasters and other liabilities and costs associated with the impact of climate change;
litigation, including costs associated with defending claims against us as a result of incidents on our properties, and any adverse outcomes;
possible environmental liabilities, including costs, fines or penalties that may be incurred due to necessary remediation of contamination of properties presently owned or previously owned by us;
potential changes in the law or governmental regulations that affect us and interpretations of those laws and regulations, including changes in real estate and zoning or real estate investment trust tax laws; and
the factors included in this report, including those set forth under the headings “Business,” “Risk Factors” and “Management’s Discussion and Analysis of Financial Condition and Results of Operations.”

1


our ability to maintain our qualification as a real estate investment trust;

our ability to retain key personnel;
litigation, including costs associated with defending claims against us as a result of incidents on our properties, and any adverse outcomes;
possible environmental liabilities, including costs, fines or penalties that may be incurred due to necessary remediation of contamination of properties presently owned or previously owned by us;
potential changes in the law or governmental regulations that affect us and interpretations of those laws and regulations, including changes in real estate and zoning or real estate investment trust tax laws; and
the factors included in this report, including those set forth under the headings “Business,” “Risk Factors” and “Management’s Discussion and Analysis of Financial Condition and Results of Operations.”

You are cautioned not to place undue reliance on forward-looking statements, which speak only as of the date of the document in which they are contained. While forward-looking statements reflect our good faith beliefs, they are not guarantees of future performance. We undertake no obligation to publicly release the results of any revisions to any forward-looking statement that may be made to reflect events or circumstances after the date as of which that forward-looking statement speaks or to reflect the occurrence of unanticipated events, except as required by law.

Item 1. BUSINESSBUSINESS

OverviewThe Merger

On September 15, 2022, STORE Capital Corporation, a Maryland corporation, Ivory Parent, LLC, a Delaware limited liability company (“Parent”) and Ivory REIT, LLC, a Delaware limited liability company (“Merger Sub” and, together with Parent, the “Parent Parties”), entered into an Agreement and Plan of Merger (the “Merger Agreement”). The Parent Parties are affiliates of GIC, a global institutional investor, and funds managed by Blue Owl Capital. On February 3, 2023 (the “Closing Date”), pursuant to the terms and subject to the conditions set forth in the Merger Agreement, STORE Capital Corporation merged with and into Merger Sub (the “Merger”) with Merger Sub surviving (the “Surviving Entity”) and the separate existence of STORE Capital Corporation ceased. Immediately following the completion of the Merger, the Surviving Entity changed its name to STORE Capital LLC. References herein to “we”, the “Company,” “STORE,” or “STORE Capital” are references to STORE Capital Corporation prior to the Merger and to STORE Capital LLC upon and following the Merger. As of the Closing Date of the Merger, the common equity of the Company is no longer publicly traded.

Overview

General. S|T|O|R|ESTORE is an internally managed net-lease real estate investment trust, or REIT, that is a leader in the acquisition, investment and management of Single Tenant Operational Real Estate, or STORE Properties,"STORE Properties", which is our target market and the inspiration for our name. A STORE Property is a real property location at which a company operates its business and generates sales and profits, which makes the location a profit center and, therefore, fundamentally important to that business.

S|T|O|R|E is one of the largest and fastest-growing net-lease REITs and our Our portfolio is highly diversified. As of December 31, 2021,diversified and our 2,866 property locations were operated by 556 customers across the United States. Our customers operate across a wide variety of industries within the service, service-oriented retail and manufacturing sectors of the U.S. economy, with restaurants, early childhood education, metal fabrication, automotive repair and maintenance and health clubs representing the top industries in our portfolio.

2

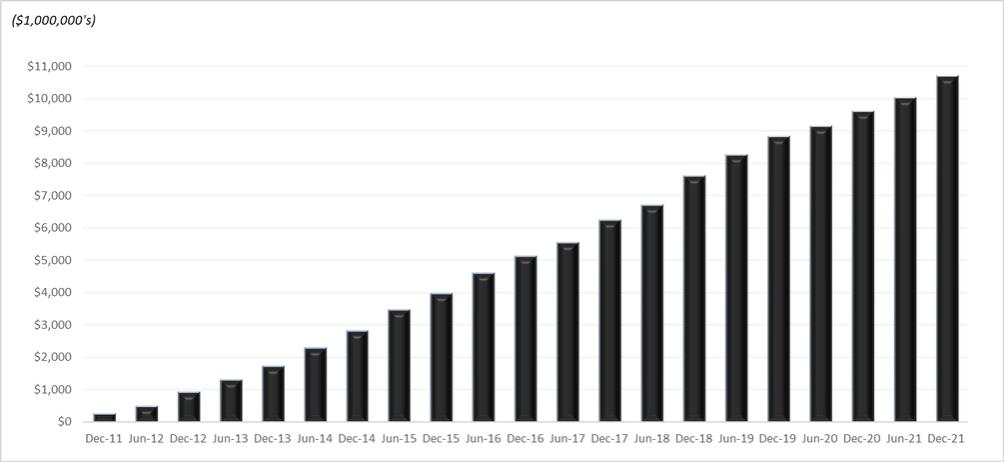
The following table depicts the growth in our investment portfolio since our inception in 2011.

Our Total Investment Portfolio at Period End

Graphic

Taxation as a Real Estate Investment Trust. We haveSTORE Capital Corporation elected to be taxed as a real estate investment trust, or a REIT, under the Internal Revenue Code of 1986, as amended, or the Code, commencing with ourits initial taxable year ended December 31, 2011. STORE Capital LLC has elected to be taxed as a REIT under the Internal Revenue Code of 1986, as amended, commencing with its initial taxable year ended December 31, 2022. To continue to qualify as a REIT, we must continue to meet certain tests which, among other things, require that our assets consist primarily of real estate assets, our income be derived primarily from real estate assets, and that we distribute at least 90% of our REIT taxable income (other than our net capital gains) to our stockholdersmembers annually.

The Net-Lease Model and Sustainability. S|T|O|R|ESTORE is a net-lease REIT. Accordingly, we acquire STORE Properties from business owners, and then lease the properties back to the business owners under net-leases, substantially all of which are triple-net. Under a triple-net lease, our customer (the tenant) is solely responsible for operating the business conducted at the property subject to the lease, keeping the property and improvements in good order and repair, remodeling and updating the building as it deems appropriate to maximize business value, and paying the insurance, property taxes and other property-related expenses. Under the triple-net lease model, therefore, S|T|O|R|ESTORE is not a real estate operator; rather, we provide real estate financing solutions to customers seeking a long-term, lower-costmore efficient cost alternative to real estate ownership. Following our acquisition of a property, it is our customer, and not S|T|O|R|E,STORE, that controls the property, including with respect to decisions as to when and how to implement environmentally sustainable practices at a given property. However, as the property owner, we nevertheless recognize that the operation of commercial real estate assets can have a meaningful impact on the environment, particularly with respect to resource consumption and waste generation, and on the health of building occupants. Accordingly, at S|T|O|R|E, we believe that being conscious of, and seeking to address, environmental impacts within our control, and supporting our tenant customers to do the same in their businesses, plays a role in building and sustaining successful enterprises and, thus, is material to the success of our own business.

Our Corporate Responsibility. We define success by our ability to make a positive difference for all of our many stakeholders. S|T|O|R|E’sSTORE’s beginning was inspired by our belief that we could make a positive difference for real estate intensive businesses across the U.S. by delivering innovative and superior real estate capital solutions. That belief has guided our efforts to bring much needed capital and liquidity opportunities to middle-market and larger businesses which, in turn, have brought value creation and growth to our most integral stakeholders: our customers, stockholdersowners and employees. For our many customers, S|T|O|R|E’sSTORE’s real estate lease solutions have contributed to their prospects for wealth creation and to their ability to grow, create jobs and contribute to many communities across the country. In turn, meeting the needs of our customers provides an extraordinary investment opportunity that we believe holds the promise ofcreates sustainable long-term wealth creation for our many stockholders.wealth. We are committed to operating our business responsibly,

3

guarding our valuable reputation and creating long-term and sustainable value for our company through a robust business model and attentiveness to our many stakeholders. S|T|O|R|ESTORE is committed to playing an important

2


role for middle-market and larger companies across the U.S. in order to help them succeed, while making a positive impact on our collective communities, both today and for future generations.

2021 Highlights

During the year ended December 31, 2021, we invested approximately $1.5 billion in 336 property locations.
As of December 31, 2021, our total gross investment in real estate had reached approximately $10.7 billion, of which $6.8 billion was unencumbered. Our long-term outstanding debt totaled $4.3 billion at December 31, 2021, and, at that date, approximately $2.5 billion of our total long-term debt was secured debt and approximately $3.9 billion of our investment portfolio served as collateral for these outstanding borrowings.
For the year ended December 31, 2021, we declared dividends totaling $1.490 per share of common stock to our stockholders. In the third quarter of 2021 we raised our quarterly dividend 6.9% from our previous quarterly dividend amount.
During 2021, we raised aggregate net proceeds of $243.7 million from sales of shares under our “at the market,” or ATM, equity offering program. As of December 31, 2021, we had the ability to offer and sell up to an additional $539.2 million of our shares of common stock under our $900.0 million ATM authorization established in November 2020.
In June 2021, we marked our tenth issuance of net-lease mortgage notes under our STORE Master Funding debt program; we issued a total of $515.0 million of net-lease mortgage notes, of which $337.0 million are rated AAA with the remainder rated A+. The weighted average coupon rate of the notes is 2.80%. As part of this issuance, the Company prepaid, without penalty, $86.7 million of STORE Master Funding Series 2013-1 Class A-2 notes in May 2021 and $83.3 million of STORE Master Funding Series 2013-2 Class A-2 in July 2021; the two prepaid note classes bore a weighted average interest rate of 4.98% and were scheduled to mature in 2023.
In November 2021, we completed our fourth public debt offering, issuing $375.0 million in aggregate principal amount of unsecured, investment-grade rated 2.70% Senior Notes, due in December 2031. In conjunction with the $375.0 million public debt offering, we prepaid, without penalty, $85.9 million of STORE Master Funding Series 2013-3 Class A-2 notes, which were scheduled to mature in 2023 and bore a coupon rate of 5.21%.

Our Target Market and Asset Class

We are a leader in providingprovide real estate financing solutions principally to middle-market and larger businesses that own single tenant profit-center real estate locations on which they conduct their businesses and generate revenues and profits, which we refer to as Single Tenant Operational Real Estate or “STORE Properties.” Our customers operate these STORE Properties and operate within the broad-based service, service-oriented retail and manufacturing sectors of the U.S. economy. We have designed our net-lease solutions to provide a long-term, lower-costcost efficient way to improve our customers’ capital structures and, thus, be a preferred alternative to real estate ownership. We estimate the market for STORE Properties to approximate $3.9 trillion in market value and to include more than 2.0 million properties.

We define middle-market companies as those having approximate annual gross revenues of between $10 million and $1.0 billion, although approximately 21% of our customers have annual revenues in excess of $1.0 billion. At December 31, 2021, the median annual revenues of our 556 customers was approximately $62 million and, on a weighted average basis, our average customer had revenues of approximately $1 billion. Most of our customers do not have credit ratings, although some have ratings from rating agencies that service insurance companies or fixed-income investors. Most of these non-rated companies either prefer to be unrated or are simply too small to issue debt rated by a nationally recognized rating agency in a cost-efficient manner.

The financing marketplace for STORE Properties is highly fragmented, with few participants addressing the long-term capital needs of middle-market and larger non-rated companies. While we believe our net-lease financing solutions can add value to a wide variety of companies, we believe the largest underserved market and, therefore, our greatest opportunity, is non-rated, bank-dependent, middle-market and larger companies that generally have less access to efficient sources of long-term capital.

4

Our customers typically have the choice either to own or to lease the real estate they use in their daily businesses. They choose to lease for various reasons, including the potential to lower their cost of capital, as leasing supplants traditional financing options that tie up the equity in their real estate. Leasing is also viewed as an attractive alternative to our customers because it generally locks in scheduled payments, at lower levels and for longer periods, than traditional financing options; these factors are viewed favorably relative to the amounts funded.

Whether companies elect toBecause STORE Properties are profit-center locations, payment of rent or ownunder our lease contracts is supported not only by the credit quality of the tenant and the residual value of the real estate, they use in their businesses is most often a financial decision. For the few highly capitalized large companies that possess investment-grade credit ratings, real estate leasing tends to be viewed as a substitute for corporate borrowings that they could otherwise access (so long as they remain highly ratedbut also and equitized). With real estate leases often bearing rental costs that exceed corporate term borrowing costs, such companies elect to rent for strategic reasons. Such reasons may include the long-term flexibility to vacate properties that are no longer strategic, the permanence of lease capital which lessens potential refinancing risk should corporate credit ratings deteriorate, the lack of corporate financial covenants associated with leasing and the ability to harness developers to effectively outsource their real estate development needs. The primary motivations for S|T|O|R|E’s middle-market and larger customers tend to be different. For such companies, real estate leasing solutions offer the potential to lower their cost of capital. In addition to this primary economic motivation, our tenants also seek lease assignability, property substitution rights, property closure rights and S|T|O|R|E’s assistance with property expansion and lease contract modification. Our real estate leasing solutions offer tenants such flexibility, which, in turn, offers the potential for further tenant wealth creation. We believe that our customers select us as their landlord of choice principally as a result of our service, comparative business flexibility and the tailored net-lease solutions we provide.

We believe the demand for our net-lease solutions has grown, in part, as a result of the current bank regulatory environment. In our view, the increased scrutiny and regulation of the banking industry in response to the collapse of the housing and mortgage industries from 2007 to 2009, particularly the Dodd-Frank Wall Street Reform and Consumer Protection Act of 2010, or the Dodd-Frank Act, and the Basel Accords issuedprimarily by the Basel Committee on Banking Supervision, have constrained real estate lending practices and limited desirable term debt real estate borrowing options. Real estate leasing today represents a highly desirable component of corporate capitalization strategies due, in part, to the unavailability of long-term, fixed rate commercial real estate mortgage financing with important features such as affordable prepayment and modification options or loan assignability.

S|T|O|R|E was formed to capitalize on a large market opportunity resulting from the widespread need amongst middle-market and larger companies for efficient corporate real estate capital solutions. We believe our opportunities include both gaining market share from the fragmented network of net-lease capital providers and growing the market by creating demand for our net-lease solutions that meet the long-term real estate capital needs of these companies.

The estimated $3.9 trillion market of STORE Properties is divided into three primary industry sectors and various industry sub-sectors. The primary sectors and their proportion of this market are service at 47%, retail at 42% and manufacturing at 11%. The sub-sectors included within each primary sector are summarized in the table below.

Service

Retail

Manufacturing

Restaurants

Big box retail

Industrial profit-centers

Education

Specialty retail

Light manufacturing

Fitness centers

Grocery

Automotive services

Drug stores

Family entertainment

Automotive (new and used)

5

Within the sub-sectors, the market for STORE Properties is further subdivided into a wide variety of industries within the service, retail and manufacturing sectors, such as:

Automotive parts stores

Movie theaters

Cold storage facilities

Office supplies retailers

Department stores

Pet care facilities

Discount stores

Rental centers

Early childhood education

Secondary education

Family entertainment facilities

Supermarkets

Fast food restaurants

Truck stops

Full service restaurants

Wholesale clubs

Furniture stores

Although many of these industries are represented within our diverse property portfolio, S|T|O|R|E primarily targets service sector properties that represent a broad array of everyday services (such as restaurants and early childhood education facilities) that are not readily available online and that are located near customers targetedprofits produced by the business operating onoperations at the property. Although not our primary focus, the retail sector assetslocations we target are primarily located in retail corridors, also tend to be internet resistant and include a high experiential component, such as furniture and hunting and fishing stores. In the manufacturing sector, we typically target properties that represent a broad array of industries, are located in industrial parks near customers and suppliers, and are operated by businesses that produce everyday necessities. As of December 31, 2021, our portfolio of investments in STORE Properties was diversified across approximately 120 industries, of which 65% was in the service sector, 15% was in the retail sector and 20% was in the manufacturing sector, based on revenue.own (e.g. unit-level profitability).

Our Asset Class: STORE PropertiesCreating Superior Lease Contracts

STORE Properties are a unique asset class that inspired the formation of S|T|O|R|E and our company name. STORE (Single Tenant Operational Real Estate) Properties are profit-center real estate locations on which our customers conduct their businesses and generate revenues and profits. The defining characteristic of STORE Properties is the number of sources that support the payment of our rent: STORE Properties have the following three sources, whereas all other commercial real estate assets have just two.

Unit-Level Profitability. STORE Properties are distinguished by the primary source that supports the payment of rent, which is the profits produced by the business operations at the real estate locations we own, which we refer to as unit-level profitability. While it is a common perception that the tenant under a lease is the primary source of the rent payment (as distinguished from the business unit operating at the leased site), we have observed a historic pattern in which tenants in corporate insolvencies seek to vacate unprofitable locations while retaining profitable ones, which indicates that the profitability of a property location is the main indicator of a tenant’s long-term ability to pay the rent on that property. Because insolvent tenants historically retain profitable locations while seeking to vacate unprofitable ones, a key component of our business includes requiring our customers to produce and submit to us unit-level financial statements of the businesses they operate at our properties. As of December 31, 2021, approximately 98% of the properties in our portfolio are subject to unit-level financial reporting requirements. Without access to these unit-level financial reports, it is difficult to accurately assess our customer’s business and, thus, the quality of the most important, and primary, source for our rent payments.
Customer Credit Quality. In addition to the unit-level profitability of the businesses operated on the real estate we own, our customers’ overall financial health, or credit quality, serves as a secondary source supporting rent payments. Our customer’s credit can become the primary source if our unit is not profitable and our customer is required to divert cash flows from its other profitable locations or utilize other resources to pay our rents. However, we have seen that customer credit quality tends to be subject to greater volatility over time than unit-level profitability, because customer credit quality is not only a function of the unit-level profitability of the operations at our locations, but also of the profitability of the other properties and assets owned by our customer or other third parties. Corporate financial health is also a function of many other

6

decisions, such as optional changes in capital structure or growth strategies, as well as conditions in the marketplace for our customers’ products and services, that can change over time and that may have profound impacts on customer creditworthiness.
Real Estate Residual Value. The final source supporting the payment of rent, common to all real estate investments, is the residual value of the underlying real estate, which gives us the opportunity to receive rents from substitute tenants in the event our property becomes vacant. For S|T|O|R|E, this means more than just looking at comparable lease rates and transactions. Studies we have completed underscore the importance of investing in properties at or below their as-new replacement costs. We also review the local markets in which our properties are located and seek to have rents that are at or below prevailing market rents on a per square foot basis for comparable properties. Taking these steps protects S|T|O|R|E and our customers by making it easier for us to assign, sell or sublease properties that our customers may want to sell, reposition or vacate as part of their capital efficiency strategies.

Creating Investment-Grade Contracts

From our inception in 2011, we have emphasized and uniquely disclosed information regarding the net-lease contracts we create with our tenants. We believe that our net-lease contracts, and not simply tenant or real estate quality, are central to our potential to deliver superior long-term risk-adjusted rates of return to our stockholders.return. Contract quality embodies tenant and real estate characteristics, together with other investment attributes we believe are highly material. Contract attributes include the prices we pay for the real estate we own, inclusive of the prices relative to new construction cost. As of December 31, 2021, our average investment approximated 80% of replacement cost, a statistic that has been relatively stable since 2015. Other important contract attributes include the ability to receive unit-level financial statements, which allows us to evaluate unit-level cash flows relative to the rents we receive. As of December 31, 2021, the weighted average ability of the properties we own to cover our rents, which we refer to as the “4-wall coverage ratio,” approximated 4.6:1 (the median 4-wall coverage ratio approximated 3.1:1). In addition, we calculate a coverage ratio, inclusive of an allowance for indirect costs, for each of the properties we own which we refer to as the “unit fixed charge coverage ratio.” As of December 31, 2021, the weighted average unit fixed charge coverage ratio approximated 3.6:1 (the median unit fixed charge coverage ratio was 2.5:1). Likewise, over many years of providing real estate net-lease capital, we have determined that tenant alignments of interest are highly important. Such alignments of interest can include full parent company recourse, credit enhancements in the form of guarantees, cross default provisions and the use of master leases. Master leases, which comprise most of our multi-property net-lease contracts, are individual lease contracts that bind multiple properties and offer landlords greater security in the event of tenant insolvency and bankruptcy. Whereas individual property leases provide tenants with the opportunity to evaluate the desirability and viability of each individual property they rent in the event of a bankruptcy, master leases bind multiple properties, permitting landlords to benefit from aggregate property performance and limiting tenants’ ability to pick and choose which leases to retain. As of December 31, 2021, 94% of our multi-property net-lease contracts were in the form of master leases. Contract economic terms are also highly important because they can enhance margins of safety. During 2021, our weighted average initial lease rate was 7.5%, with annual contractual lease escalations averaging an added 1.9% of contract rents for new assets added during the year. We believe that our initial yields, on average, range from 10% to 15% above those expected by investors seeking real estate investment opportunities through the broker auction market, which provides us greater flexibility to preserve and enhance returns. Other important tenant contract considerations include contractual lease escalations, indemnification provisions, lease renewal rights, and the ability to sublease and assign leases, as well as qualitative considerations, such as alternative real estate use assessment and the composition of a tenant’s capitalization structure.

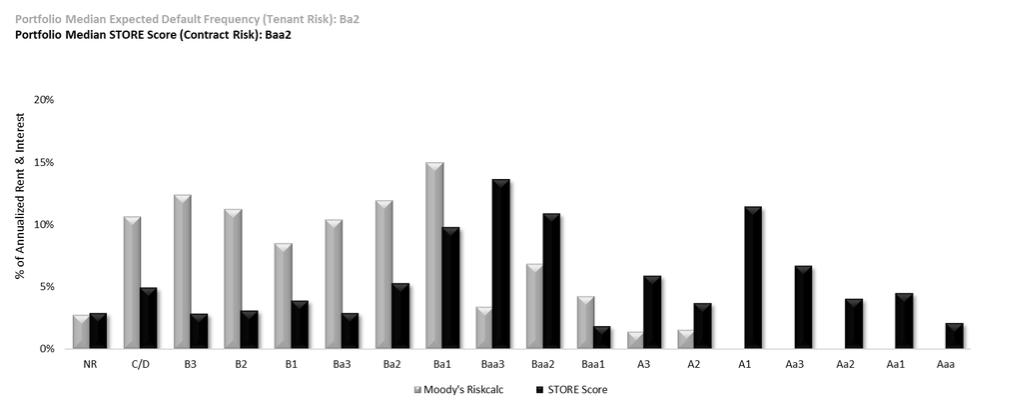
Since our November 2014 initial public offering, S|T|O|R|E’s extensive contract attribute disclosure has uniquely includedOur Business Process

We operate a tenant credit quality distribution chart, employing computed implied credit ratings applied to regularly received tenant financial statements using Moody’s Analytics RiskCalc. Since tenant credit ratings are merely one component of contract risk, we developed a means to deliver a base quantitative contract quality estimate. Our approach was to modify risk of tenant insolvency, as estimated by the Moody’s algorithm, by our own estimate of the likelihood of property closure, based on the regularly monitored profitability of the properties bound by each lease contract we create. To accomplish this, we established a simple range of property closure likelihood ranging from 10% to 100% based upon property profitability ranges from breakeven to a computed ability to cover our rents twice over. Multiplying tenant estimated insolvency probability (Moody’s Analytics RiskCalc) by our estimate of the probability of property closure results in a contract risk measurement that we call the STORE Score and which we regularly and uniquely disclose.

7

Graphic

Our Competitive Strengths

We have a market-leading platform for the acquisition of, investment in and management of STORE Properties that simultaneously creates value for stockholdersthrough four core competencies.

Investment Origination. A STORE hallmark is our ability to directly market our real estate lease solutions to middle-market and customerslarger companies nation-wide, utilizing a team of experienced relationship managers.
Investment Underwriting. Our investment underwriting approach centers on evaluations of unit-level and corporate-level financial performance, together with detailed real estate valuation assessments, which is reflective of the characteristics of the STORE Property asset class.
Investment Documentation. The purchase documentation process includes the validation of investment underwriting through our five corporate competencies.

Investment Origination. We founded S|T|O|R|E to fill a need for efficient long-term real estate capital for middle-market and larger customers. We do this principally through a solutions-oriented approach that includes the use of lease contracts that address our customers’ needs and that strive to provide superior value for our customers over other financial options they may have to capitalize their businesses. A S|T|O|R|E hallmark is our ability to directly market our real estate lease solutions to middle-market and larger companies nation-wide, harnessing a geographically focused team of experienced relationship managers at our home office. Approximately 80% of our investments, by dollar volume, have been originated by our internal origination team through direct new customer solicitations and a strong level of repeat business from existing customers. By creating demand for our services, we maintain a large pipeline of investment opportunities, which we estimate to be $13.1 billion as of December 31, 2021. Our objectives are to be highly selective and to achieve higher rates of return than our stockholders could achieve if they sought to acquire profit-center real estate on their own.
Investment Underwriting. Our investment underwriting approach centers on evaluations of unit-level and corporate-level financial performance, together with detailed real estate valuation assessments, which is reflective of the characteristics of the STORE Property asset class. We have combined our underwriting approach with our portfolio management systems to capture and track computed customer credit ratings as well as the performance of the businesses conducted at the properties we own (unit-level performance). Our focus on STORE Properties, which are profit-centers for our tenants, enables us to create lease contracts having payment performance characteristics that are generally materially superior to the implied credit ratings of our diverse tenant base. Through our underwriting and portfolio management approach, we track, measure and report investment performance, with the investment underwriting goal to create a diverse portfolio centered on investment-grade quality contracts.
Investment Documentation. Because we believe purchase and lease contracts are the principal determinants of investment risk, we have always emphasized the importance of our investment documentation. The purchase documentation process includes the validation of investment underwriting through our due diligence process, which includes our initiation and receipt of third-party real estate valuations, title insurance, property condition assessments and environmental reports. When we are satisfied with the results and outcome of our pre-acquisition due diligence process, we purchase the property under a purchase agreement and enter into a lease with the seller. Our lease documents incorporate lessons learned over decades to forge balanced
due diligence process, which includes our initiation and receipt of third-party real estate valuations, title insurance, property condition assessments and environmental reports. When we are satisfied with the results and outcome of our pre-acquisition due diligence process, we purchase the property under a purchase agreement and enter into a lease with the seller.

83


contracts characterized by important alignments of interest, including strong enforcement provisions. Altogether, our documentation process, like our approach to investment underwriting, is integral to investment quality and designed to offer our investors a value that most could not create for themselves.
Portfolio Management. Net-lease real estate investment portfolios require
Portfolio Management. Net-lease real estate investing requires active management of the investment portfolio to realize superior risk-adjusted rates of return. S|T|O|R|E is virtually paperless and we can access detailed information on our large diversified portfolio from practically anywhere and at any time, allowing us to monitor unit-level profit and loss statements, customer corporate financial statements and the timely payment of property taxes and insurance in order to gauge portfolio quality. Having such systems is central to our ability to effectively monitor and reduce customer credit risk at the property level, which, in turn, allows us to place greater focus on effectively managing the minority of investments that may have higher risks. We believe these systems, when combined with our high degree of financial and operating flexibility, allow us to realize better stockholder risk-adjusted rates of return on our invested capital.
Financial Reporting and Treasury. We consider and evaluate our corporate financing strategies with the same emphasis as our real estate investment strategies. Under our financing strategy, borrowings must: prudently improve stockholder returns; be structured to provide portfolio flexibility and minimize our exposure to changes in long-term interest rates; be structured to optimize our cost of financing in a way that will enhance investor rates of return; and contribute to corporate governance by enhancing corporate flexibility. Our senior leadership team has extensive experience with diverse liability strategies. Today, we are one of the few REITs able to employ our own AAA rated borrowing source, while simultaneously maintaining investment-grade corporate credit ratings. We have designed and implemented strategies that add value to our investors by offering a more efficient means to finance real estate than they could otherwise do on their own. At the same time, the flexibility we derive from our liability strategies can also result in important flexibility for our customers.

Our Business and Growth Strategies

Our objective is to continue to create stockholder value through sustained investment and management activities designed to increase distributable cash flows and deliver attractive risk-adjusted rates of return from a growing, diversereturn. STORE monitors unit-level profit and loss statements, customer corporate financial statements and the timely payment of property taxes and insurance in order to evaluate portfolio of STORE Properties. To accomplish this, our principal business and growth strategies are as follows:

Focus on Middle-Market and Larger Companies Operating STORE Properties. quality.We believe we have selected the most attractive investment opportunity within the net-lease market, STORE Properties, and targeted the most attractive customer type within that market, middle-market and larger non-investment-grade-rated companies. We focus on this market given its strong fundamentals and the limited long-term financing solutions available to the companies in it. Within the net-lease market for STORE Properties, our value proposition is most compelling to middle-market and larger, bank-dependent companies, most of which are not rated by any nationally recognized rating agency due to their size or capital markets preferences, but who have strong credit metrics and operate within broad-based industries having the potential for sustained relevance.
Realize Stable Income and Internal Growth. We seek to make investments that generate strong and stable current income as a result of the difference, or spread, between the rate we earn on our assets (primarily our lease revenues) and the rate we pay on our liabilities (primarily our long-term debt). We augment that income with internal growth. We seek to realize superior internal growth through a combination of (1) a target dividend payout ratio that permits a meaningful level of free cash flow reinvestment and (2) cash generated from the estimated 1.8% weighted average annual escalation of base rent and interest in our portfolio (as of December 31, 2021, as if the escalations in all of our leases were expressed on an annual basis). We benefit from contractual rent escalations, as approximately 99% of our leases and loans (as of December 31, 2021, by base rent and interest) have escalations that are either fixed (14% of our leases and loans) or based on the Consumer Price Index, or CPI (85% of our leases and loans). A final means of internal growth is the accretive redeployment of cash realized from the occasional sale of real estate. During 2021, we divested real estate which had an initial cost of $368.9 million and collected $356.0 million in proceeds on these sales which we

9

were able to redeploy. We believe these three means of internal growth will enable strong cash flow growth without relying exclusively on future common stock issuances to fund new portfolio investments.
Capitalize on Direct Origination Capabilities for External Growth. As the market leader in STORE Property investment originations, we plan to complement our internal growth with external growth driven by continued new investments funded through future equity issuances and borrowings to expand our platform and raise investor cash flows.
Actively Manage our Balance Sheet to Maximize Capital Efficiency. Weseek funding sources that enable us to lock in long-term investment spreads and limit interest rate sensitivity. We also seek to maintain a prudent balance between the use of debt (which includes our own STORE Master Funding program, unsecured term notes, commercial mortgage-backed securities borrowings, insurance borrowings, bank borrowings and possibly preferred stock issuances) and equity financing. We are currently rated Baa2, BBB and BBB rating by Moody’s Investors Service, S&P Global Ratings and Fitch Ratings, respectively. As of December 31, 2021, our secured and unsecured long-term debt had an aggregate outstanding principal balance of $4.3 billion, a weighted average maturity of approximately seven years and a weighted average interest rate of 3.9%.
Increase our portfolio diversity. As of December 31, 2021, we had invested approximately $10.7 billion in 2,866 property locations, substantially all of which are profit centers for our customers. Our portfolio is highly diversified; built on an average transaction size of approximately $9.5 million, we now have over 550 customers (having added an average of approximately 13 net new customers quarterly since inception) operating across approximately 855 different brand names, or business concepts, across 49 states and 120 industry groups. Our largest customer represented 3.0% of our portfolio as of December 31, 2021, based on base rent and interest. Our portfolio’s diversity decreases the impact on us of an adverse event affecting a specific customer, industry or region, thereby increasing the stability of our cash flows. We expect that additional acquisitions in the future will further increase the diversity of our portfolio and, from time to time, we may sell properties in our portfolio to improve overall portfolio credit quality or diversity.
Engage with our tenants. Our experienced relationship managers provide tailored lease solutions to our customers that address our customers’ needs and that strive to provide superior value for our customers over other financial options they may have to capitalize their businesses. The direct relationships we develop with our customers give us greater insights into their businesses and allow us to proactively help them grow their businesses or work with them to help solve problems that may arise from time to time. For example, during 2020 and in connection with the shutdowns and other disruptions resulting from the COVID-19 pandemic, we worked with a number of our tenants on short-term rent deferral arrangements, including through a structured rent relief program under which we allowed such tenants to defer a portion of their rent, with repayment primarily structured through short-term, interest-bearing notes. These efforts allowed our customers to avoid lease defaults while giving their businesses time to recover and gave us the ability to continue to receive our contractual rent.

Beyond our regular engagement with our customers on business matters, in 2019, we initiated a tenant outreach program designed to gauge our tenants’ current sustainability practices, provide them with sustainability education and support resources, and encourage them to engage in sustainable practices, including reducing power usage, saving water, assessing building equipment, and implementing other energy-efficiency upgrades. We believe that effective encouragement of sustainability initiatives, particularly related to energy, water and indoor environmental quality, can lead to the adoption of practices that can drive business and real estate value appreciation, decrease operating costs and mitigate regulatory risks.  

Environmental Stewardship

We are committed to environmental sustainability and the mitigation of environmental risks in connection with the development of our property portfolio. This commitment reflects the fact that the properties we acquire are subject to both state and federal environmental regulations, but, more importantly, it aligns with our belief that being conscious of, and seeking to address and manage, environmental risks within our control, and supporting our customers to do the same in

10

their businesses, plays a role in building and sustaining successful enterprises; and, thus, is material to the success of our own business.

Our environmental initiatives and partnerships focus on energy savings and carbon footprint reduction in our customers’ facilities. As we are a triple-net lease REIT, without direct control of physical locations, our primary strategy includes educating ourselves and our customers on evolving environmental strategies, soliciting feedback, and gathering environmental data from our customers. This includes developing relationships between our customers and ESG vendor partners,vendors of sustainability solutions, and supporting our tenants in thetheir implementation of greensustainability programs including energy efficiency and carbon reduction programs.

As part of our attentiveness to environmental concerns, we:

Continuously seek to understand the environmental risks and opportunities associated with our business practices;
Undertake initiatives to promote greater environmental awareness among our employees and evaluate opportunities to enhance our processes; and
Promote awareness and engage with our tenants regarding sustainability practices and solutions.

Acquisition Process. Our commitment to environmental sustainability begins before we acquire a real estate asset and involves, among other factors, a consideration of the environmental risk associated with our tenants and with prior users of the real estate asset. We then analyze environmental matters in each step of our three-phase property acquisition process:

When assessing a target property, we engage a nationally recognized and insured environmental engineer to perform a Phase I environmental site assessment against current industry standards and evaluate any recognized environmental conditions (RECs) identified in the assessment. We also conduct separate, property-level condition and sustainable practices assessments through an independent third party.
When we identify a REC, we take appropriate mitigating action, which may include conducting a Phase II environmental assessment, submitting the property into a voluntary clean-up program, purchasing an environmental insurance policy, and remediating the REC in accordance with regulatory requirements,
When we are satisfied with the results and outcome of our pre-acquisition due diligence process, we purchase the property and enter into a lease with the seller pursuant to which the seller agrees to certain covenants and indemnities that typically require the seller to comply with applicable environmental laws and remediate or take other corrective action should any environmental issues arise.

We may take additional actions in situations where a target property may be subject to risks associated with climate change, particularly as a result of being located in a geographic area susceptible to floods, hurricanes, tornados, earthquakes or other climate-related occurrences. These additional steps and actions may include: (i) maintaining comprehensive environmental insurance coverage for specified properties in our portfolio to ensure that there are financial resources available to conduct safe and timely remediation in the event of an unforeseen environmental issue; and (ii) preparing for climate-related natural disasters by requiring our tenants to carry insurance, including fire, wind/hail, earthquake, flood and other extended coverage where appropriate given the relative risk of loss, geographic location and industry best practices.

Building Sustainable Tenant Relationships. Despite owning our properties subject to triple-net leases, under which our tenants control all business operations at the properties, we strive to positively influence the sustainability practices of our tenants. We expect that such efforts will foster relationships with our tenants that effectively encourage sustainability initiatives, particularly related to energy, water and indoor environmental quality, which can lead to the adoption of

11

practices that should drive business and real estate value appreciation, decrease operating costs and mitigate regulatory risks.

Our primary strategy includes educating ourselves and our customers on evolving environmental strategies, soliciting feedback, and gathering environmental data from our customers. This includes developing relationships between our customers and ESG vendor partners, and supporting our tenants in the implementation of green programs including energy efficiency and carbon reduction programs. To advance this effort, we:

Seek out information to help us develop our initiatives by attending conferences and educational webinars and meeting with various ESG experts, consultants and national ESG oriented vendors, with our goal being to have the most current ESG information resources and a strong network of national vendors to meet our customer’s information, consulting and tailored-solution needs;
Conduct inspections of up to 20% of our properties annually to collect data on types and prevalence of sustainability features implemented at the properties, such as programmable thermostats, LED lighting, energy efficient windows, air filtration and energy efficient water heaters, in order to gauge our performance relative to long-term sustainability initiatives. We initiated our annual property inspection process to aid our portfolio managers and developers in evaluating the sustainability features of existing properties and informing the acquisition analysis process for target properties. We believe our innovative investment analysis process is responsive to increasing market demands for sustainable features in our portfolio properties. We expect that this survey data will provide a baseline framework in which we can develop and improve on the sustainability features already implemented at such properties.

We supplement our annual property inspections with an annual tenant outreach survey from which we collect further data on sustainability features implemented by our participating tenants at their leased properties and assess our customers’ corporate responsibility priorities, progress and interest in partnering on projects. The data collected from our survey allows us to provide our tenants with education, ideas and support for property-level sustainability solutions, and provides us with a forum to encourage them to pursue sustainable practices and explore technological solutions. This survey has allowed us to engage directly with our tenants most interested in reducing their carbon footprint and related environmental impact and focus our discussions and consultant introductions to those that that best meet the needs and interests of those tenants.

In addition to the survey, we work with ESG vendors and consultants to identify real estate in our portfolio that meets requirements for select initiatives such as solar and electric car chargers. We then proactively reach out to targeted tenants to educate them about the benefits of the select initiative and to assess their interest in learning more and meeting with a consultant for a review of their options. We believe that ongoing tenant engagement and collaboration on environmentally focused property initiatives should create a long-term culture of sustainable tenant relationships.

Human Capital Management

We believe that to continue to deliverdelivering strong financial results, we must execute on a human capital strategy that prioritizes, among other things: (i) establishing a work environment that: attracts, develops, and retains top talent; (ii) affording our employees an engaging work experience that allows for career development and opportunities for meaningful civic involvement; (iii) evaluating compensation and benefits, and rewarding outstanding performance; (iv) engaging with, and obtaining feedback from, our employees on their workplace experiences; (v) enabling every employee at every level to be treated with dignity and respect, to be free from discrimination and harassment, and to devote their full attention and best efforts to performing their job to the best of their respective abilities; and (vi) communicating with our board of directors on key topics.

As part of our efforts to achieve these priorities:

We seek to foster a diverse and vibrant workplace of individuals who possess a broad range of experiences, backgrounds and skills, starting at the top. At the management level, our non-executive Chairman of the Board, our Chief Executive Officer and our Chief Financial Officer are women and, overall, 37.5% of our board of directors, 40% of our executive officers, and 50% of our officers at the level of senior vice president

12

We empower our employees through employee-run engagement committees that develop and influence new employee onboarding, personal growth and professional development programs, company social and team-building events and health and wellness programs.

Table of Contents

We actively support charitable organizations that promote education and social well-being and we encourage our employees to personally volunteer with organizations that are meaningful to them.
and above are women. We have a deep management bench that, collectively, is fully capable of professionally operating the business and fulfilling the S|T|O|R|E vision.
We empower our employees through employee-run engagement committees that develop and influence new employee onboarding, personal growth and professional development programs, company social and team-building events and health and wellness programs.
We actively support charitable organizations that promote education and social well-being and we encourage our employees to personally volunteer with organizations that are meaningful to them.
We seek to identify future leaders and equip them with the tools for management roles within our company. Our board periodically reviews with our Chief Executive Officer the identity, skills and characteristics of those persons who could succeed to senior and executive management team positions.
We seek to identify future leaders and equip them with the tools for management roles within our Company.

As of December 31, 2021,2023, we had 117121 full-time employees, an increase of 10.4% over the total at December 31, 2020, all of whom are located in our single office in Scottsdale, Arizona. None of our employees are subject to a collective bargaining agreement. We consider our employee relations to be good.

Competition

We face competition in the acquisition and financing of STORE Properties from numerous investors, including, but not limited to, traded and non-traded public REITs, private equity investors and other institutional investment funds, as well as private wealth management advisory firms that serve high net worth investors (also known as family offices), some of which have greater financial resources than we do, a greater ability to borrow funds to acquire properties and the willingness to accept more risk. We also believe that competition for real estate financing comes from middle-market business owners themselves, many of whom maintain a preference to own, rather than lease, the real estate they use in their businesses. The competition we face may increase the demand for STORE Properties and, therefore, reduce the number of suitable acquisition opportunities available to us or increase the price we must pay to acquire STORE Properties. This competition will increase if investments in real estate become more attractive relative to other forms of investment..

Insurance

Our leases and loan agreements typically require our customers to maintain insurance of the types and in the amounts that are usual and customary for similar commercial properties, including commercial general liability, fire and extended loss insurance provided by reputable companies, with commercially reasonable exclusions, deductibles and limits, all as verified by our independent insurance consultant.

Separately, we purchase contingent liability insurance, in excess of our customers’ liability coverage, to provide us with additional security in the event of a catastrophic claim.

Regulations and Requirements

Our properties are subject to various laws and regulations, including regulations relating to fire and safety requirements, as well as affirmative and negative contractual covenants and, in some instances, common area obligations. We believe that each of our customers has the necessary permits and approvals to operate and conduct their businesses on our properties. Moreover, our properties are subject to Title III of the Americans with Disabilities Act of 1990 and similar state and local laws and regulations (collectively, the “ADA”

4


“ADA”). Our customers have primary responsibility for complying with these regulations and other requirements pursuant to our lease and loan agreements; however, we may have liability in certain circumstances if our tenants do not comply with such laws and regulations. As of January 31, 2022,2024, we are not aware of any ADA non-compliance that we believe would have a material adverse effect on the results of our operations.

Additionally, our properties are subject to environmental laws and regulations, which may give rise to liabilities related to the presence, handling or discharge of hazardous materials that may emanate from properties that we purchase, regardless of fault. We mitigate the possible liabilities from such laws and regulations by undertaking extensive environmental due diligence and by entering into leases with the sellers of our properties, pursuant to which the sellers agree to certain covenants and indemnities that typically require the sellers to comply with applicable environmental laws

13

Table of Contents

and regulations and remediate or take other corrective action should any environmental issues arise. We believe the costscost of capital expenditures related to environmental liabilities will not have a material impact on the results of our operations, as such costs are typically borne by the sellers, previous owners, and tenants of our properties.

About Us

We wereSTORE Capital Corporation was incorporated under the laws of Maryland on May 17, 2011. Since our initial public offering in November 2014, shares of our common stock have tradedSTORE Capital LLC, the successor by merger to STORE Capital Corporation was formed under the ticker symbol “STOR”laws of Delaware on the New York Stock Exchange, or NYSE.August 30, 2022. Our offices are located at 8377 E. Hartford Drive, Suite 100, Scottsdale, Arizona 85255. We currently lease approximately 27,80034,500 square feet of office space from an unaffiliated third party. Our telephone number is (480) 256-1100 and our website is www.storecapital.com.

Available Information

We electronically file with the Securities and Exchange Commission, or the SEC, our annual reports on
Form 10-K, quarterly reports on Form 10-Q and current reports on Form 8-K, pursuant to Section 13(a) of the Exchange Act. You may obtain a free copy of our annual reports on Form 10-K, quarterly reports on Form 10-Q and current reports on Form 8-K, and amendments to those reports, on the day of filing with the SEC on our website, or by sending an email message to info@storecapital.com.

Item 1A. RISK FACTORSFACTORS

There are many factors that affect our business, financial condition, operating results, cash flows and distributions, as well as the market price for our securities.distributions. The following is a description of important factors that may cause our actual results of operations in future periods to differ materially from those currently expected or discussed in forward-looking statements set forth in this Annual Report. The risks and uncertainties described below are not the only risks we face. Additional risks and uncertainties not presently known to us or that we may currently deem immaterial also may impair our business operations. Forward-looking statements and such risks, uncertainties and other factors speak only as of the date of this Annual Report, and we expressly disclaim any obligation or undertaking to update or revise any forward-looking statement contained herein, to reflect any change in our expectations with regard thereto, or any other change in events, conditions or circumstances on which any such statement is based, except to the extent otherwise required by law. See “Forward-Looking Statements.”

Risks Related to Our Business and Operations

The value of our real estate is subject to fluctuation, and risks related to investing in real estate may have an adverse effect on our financial condition.

We are subject to all of the general risks associated with the ownership of real estate. While the revenues from our leases are not directly dependent upon the value of the underlying real estate, significant declines in real estate values could adversely affect us in many ways, including a decline in the residual values of properties at lease expiration, possible lease abandonments by our customers and a decline in the attractiveness of triple-net lease transactions to potential sellers. Moreover, significant declines in real estate values may also affect our ability to execute leases on attractive terms with potential tenants. In addition, we periodically review our real estate assets for impairment based on the projected operating cash flow of the property over our anticipated holding period. Impairment charges have a direct impact on our results of operation. A financial failure or other default by a customer will likely reduce or eliminate the operating cash flow generated by that customer’s leased property and might decrease the value of that property and result in a non-cash impairment charge. Also, to the extent we purchase real estate in an unstable market, we are subject to the risk that if the real estate market ceases to attract the same level of capital investment in the future that it attracts at the time of our purchases, or the number of companies seeking to acquire properties decreases, the value of our investments may not appreciate or may decrease significantly below the amounts we paid.

14

Table of Contents

Actual or perceived threats associated with the COVID-19 pandemic or other public health crises could have a material adverse effect on our results of operations and our customers’ businesses.

There is substantial uncertainty with respect to the duration and severity of the COVID-19 pandemic and how it will impact real estate, businesses and global markets in the years to come. The continued spread of COVID-19 may impact states where our properties are located, and preventative measures that may be taken in response to current and future outbreaks of COVID-19, or other public health crises, including “shelter-in-place” or “stay-at-home” orders issued by local, state or federal authorities, may have a material adverse effect on our and our customers’ businesses, results of operations, liquidity and ability to access capital markets, and may affect our ability as a net-lease REIT to acquire properties or lease properties to our customers, who may be unable, as a result of economic downturns occasioned by the COVID-19 pandemic or other public health crises, to make rental payments when due.

Contingent rent escalators may expose us to inflation risk and can hinder our growth and profitability.

A substantial portion of our leases contain variable-rate contingent rent escalators that periodically increase the base rent payable by the customer. Our leases with rent escalators indexed to future increases in the Consumer Price Index (“CPI”) primarily adjust over a one-year period but may adjust over multiple-year periods. Generally, these escalators increase rent at the lesser of (i) 1 to 1.25 times the change in the CPI over a specified period or (ii) a fixed percentage. Under this formula,As a result of these escalators, during periods of deflation or

5


low inflation, small increases or decreases in the CPI may cause us to receive lower rental revenues than we would receive under leases with fixed-rate rent escalators. Conversely, when inflation is higher, contingent rent increases may not keep up with the rate of inflation. Higher inflation may also have an adverse impact on our customers if increases in their operating expenses exceed increases in revenue, which may adversely affect our customers’ ability to satisfy their financial obligations to us.

The success of our business depends upon the success of our customers’ businesses, and bankruptcy laws will limit our remedies in the event of customer defaults.

We lease substantially all of our properties to customers who operate businesses at the leased properties. We underwrite and evaluate investment risk on the basis that the profitability of these businesses is the primary source that supports the payments on our leases and loans, which we refer to as “unit-level profitability.” We believe the success of our investments materially depends upon whether our customers generate unit level profitability at the locations we acquire and lease back or finance. Economic conditions are cyclical, and developments that discourage consumer spending or cause a downturn in the national economy, or the regional and local economies where our properties are located, could impair our customers’ ability to meet their lease obligations, resulting in customer defaults or non-renewals under their leases, and reduce demand for our net-lease solutions, forcing us to offer concessions or reduced rental rates when re-leasing these properties.

If any of our customers struggle financially, they may decline to extend or renew their leases, miss rental payments or declare bankruptcy. Claims for unpaid future rent are rarely paid in full and are subject to statutory limitations that would likely cause us to receive rental revenues substantially below the contractually specified rent. We are often subject to this risk because our triple-net leases generally involve a single tenant, but this risk is magnified when we lease multiple properties to a single customer under a master lease. Federal bankruptcy laws may prohibit us from evicting bankrupt customers solely upon bankruptcy, and we may not recover the premises promptly from the tenant or from a trustee or debtor-in-possession in bankruptcy proceedings. We may also be unable to re-lease a terminated or rejected space on comparable terms, or at all, or sell a vacant space upon a customers’customer’s bankruptcy. We will be responsible for all of the operating costs at vacant properties until they are sold or re-let, if at all.re-let.

Some service and service-oriented retail customers may be susceptible to e-commerce pressures.

Most of our portfolio is leased to, or financed by, customers operating service or service-oriented retail businesses. Restaurants, early childhood education, metal fabrication, automotive repairService and maintenance and health clubs represent the largest industries in our portfolio. Service andservice-oriented retail businesses using physical outlets face increasing competition from online retailers and service providers. While we believe the businesses in our portfolio are relatively insulated from e-commerce pressures, these businesses may face increased competition from alternative online providers given the rapidly changing business conditions spurred by technological innovation, changing consumer preferences and non-traditional competitors.

15

Table of Contents

There can be no assurance that our customers’ businesses will remain competitive with e-commerce providers in the future; any failure to do so would impair their ability to meet their lease obligations to us and materially and adversely affect us.

Geographic, market sector or industry concentrations within our portfolio may negatively affect our financial results.

Our operating performance is impacted by the economic conditions affecting the specific locales, market sectors and industries in which we have concentrations of properties. Our target market is middle-market companies that operate their businesses out of one or more locations that generate unit level profitability for the business, and as of December 31, 2021, we derived the largest amount of our base rent and interest from the following five states: Texas (11.3%), Illinois (6.3%), California (5.9%), Georgia (5.5%) and Florida (5.3%). As a result of these concentrations, local economic, market sector, and industry conditions, changes in state or local governmental rules and regulations, acts of nature, epidemics, pandemics and public health crises and actions taken in response thereto, and other factors affecting those states, market sectors or industries could result in an adverse effect on our customers’ businesses and their ability to meet their obligations to us. Additionally, a failure to increase demand for our products by, among other ways, failing to convince middle-market and larger companies to sell and lease back their properties, or an increase in the availability of properties for rent, could materially and adversely affect us. In particular, as of December 31, 2021, properties representing 12.0% of the dollar amount of our investment portfolio were dedicated to, and also 12.0% of our base rent and interest was derived from, customers operating in the restaurant industry. As we continue to acquire properties, our portfolio may become more concentrated by customer, industry or geographic area. A less diverse portfolio could cause us to be more sensitive to the bankruptcy of fewer customers, changes in consumer trends of a particular industry and a general economic downturn in a particular geographic area.

Failure of our underwriting and risk management procedures to accurately evaluate a potential customer’s credit risk could materially and adversely affect our operating results and financial position.

Our success depends in part on the creditworthiness of our middle-market and larger customers who generally are not rated by any nationally recognized rating agency. We analyze creditworthiness using Moody’s Analytics RiskCalc, our methodology of estimating probability of lease rejection and the STORE Score,our proprietary ‘Probability of Default’ model, each of which may fail to adequately assess a particular customer’s default risk. An expected default frequency (“EDF”) score from Moody’s Analytics RiskCalc lacks the extensive company participation required to obtain a credit rating published by a nationally recognized statistical rating organization such as Moody’s Investors Services, Inc. (“Moody’s”) or S&P Global Ratings, a division of S&P Global, Inc. (“S&P”), and may not be as indicative of creditworthiness. Substantially all of our customers are required to provide corporate-level financial information to us periodically or

6


at our request. EDF scores and the financial ratios we calculate are based on unverified financial information from our customers, may reflect only a limited operating history and include various estimates and judgments made by the party preparing the financial information. The probability of lease rejection we assign to a particular investment may be inaccurate and may not incorporate significant risks of which we are unaware, which may cause us to invest in properties and lease them to customers who ultimately default, and we may be unable to recover our investment by re-leasing or selling the related property, on favorable terms, or at all.

We may be unable to identify and complete acquisitions of suitable properties, which may impede our growth.

Our ability to continue to acquire properties we believe to be suitable and compatible with our growth strategy may be constrained by numerous factors, including the following:

We may be unable to locate properties that will produce a sufficient spread between our cost of capital and the lease rate we can obtain from a customer, which will decrease our profitability.
Our ability to grow requires that we overcome many customers’ preference to own, rather than lease, their real estate and convince customers that it is in their best interests to lease, rather than own, their STORE Properties, either of which we may not be able to accomplish.
We may be unable to reach an agreement with a potential customer due to failed negotiations or our discovery of previously unknown matters, conditions or liabilities during our real property, legal and financial due diligence review with respect to a transaction and may be forced to abandon the opportunity after incurring significant costs and diverting management’s attention.

16

Our ability to grow requires that we overcome many customers’ preference to own, rather than lease, their real estate and convince customers that it is in their best interests to lease, rather than own, their properties, either of which we may not be able to accomplish.

TableWe may be unable to reach an agreement with a potential customer due to failed negotiations or our discovery of Contents

previously unknown matters, conditions or liabilities during our real property, legal and financial due diligence review with respect to a transaction and may be forced to abandon the opportunity after incurring significant costs and diverting management’s attention.
We may fail to obtain sufficient equity, adequate capital resources or other financing available to complete acquisitions on favorable terms or at all.
We may fail to obtain sufficient financing to complete acquisitions on favorable terms or at all.

We typically acquire only a small percentage (approximately 10%) of all properties that we evaluate (which we refer to as our “pipeline”). To the extent any of the foregoing decreases our pipeline or otherwise impacts our ability to continue to acquire suitable properties, our ability to grow our business will be adversely affected.

We face significant competition for customers, which may negatively impact the occupancy and rental rates of our properties, reduce the number of acquisitions we are able to complete or increase the cost of these acquisitions.

We compete with numerous developers, owners and operators of properties that often own similar properties in similar markets, and if our competitors offer lower rents than we are offering, we may be pressured to lower our rents or to offer more substantial rent abatements, customer improvements, early termination rights, below-market renewal options or other lease incentive payments in order to remain competitive. Competition for customers could negatively impact the occupancy and rental rates of ourSTORE properties.

We also face competition for acquisitions of real property from investors, including traded and non-traded public REITs, private equity investors and other institutional investment funds, as well as private wealth management advisory firms, some of which have greater financial resources, a greater ability to borrow funds to acquire properties, the ability to offer more attractive terms to prospective customers and the willingness to accept greater risk or lower returns than we can prudently manage. This competition may increase the demand for STORE Properties and, therefore, reduce the number of, or increase the price for, suitable acquisition opportunities, all of which could materially and adversely affect us.

As leases expire, we may be unable to renew those leases or re-lease the space on favorable terms or at all.

As of December 31, 2021, leases and loans representing approximately 23.3% of our base rent and interest will expire prior to 2032. We may not be able to renew leases or re-lease spaces without interruptions in rental revenue, at or above our current rental rates or without offering substantial rent abatements, customer improvement allowances, early termination rights or below market renewal options, and the terms of renewal, extension or re-lease may be less favorable to us than the prior lease. Because some of our properties are specifically designed for a particular customer’s business, we may be required to renovate the property, decrease the rent we charge or provide other concessions in order to lease the property to another prospective customer. If we need to sell such properties, we may have difficulty selling them to a third party due to the property’s unique design.

7


Some of our customers operate under franchise or license agreements, which, if terminated or not renewed prior to the expiration of their leases with us, would likely impair their ability to pay us rent.

ManySome of our customers operate their businesses under franchise or license agreements, which generally have terms that end earlier than the respective expiration dates of the related leases. In addition, a customer’s rights as a franchisee or licensee typically may be terminated by the franchisor and the customer may be precluded from competing with the franchisor or licensor upon termination. A franchisor’s or licensor’s termination or refusal to renew a franchise or license agreement would impact the customer’s ability to make payments under its lease or loan with us. We typically have no notice or cure rights with respect to such a termination and have no rights to assignment of any such agreement, which may have an adverse effect on our ability to mitigate losses arising from a default by a terminated franchisee on any of our leases or loans.

If a customer defaults under either the ground lease or mortgage loan of a hybrid lease, we may be required to undertake foreclosure proceedings on the mortgage before we can re-lease or sell the property.

In certain circumstances, we may enter into hybrid leases with customers. A hybrid lease is a modified sale-leaseback transaction, where the customer sells us land and then we lease the land back to the customer under a ground lease and simultaneously make a mortgage loan to the customer secured by the improvements the customer continues to own. If a customer defaults under a hybrid lease, we may: (i) evict the customer under the ground lease and assume ownership of the improvements; or (ii) if required by a court, foreclose on the mortgage loan that is secured by the improvements. Under a ground lease, we, as the ground lessor, generally become the owner of the improvements on the land at lease maturity or if the customer defaults. If, upon default, a court requires us to foreclose on the mortgage, rather

17

Table of Contents

than evicting the customer, we might encounter delays and expenses in obtaining possession of the improvements, which in turn could delay our ability to promptly sell or re-lease the property.

Defaults by customers on mortgages we hold could lead to losses on our investments.

From time to time, we make or assume commercial mortgage loans. We have also made a limited number of investments on properties we own or finance in the form of loans secured by equipment or other fixtures owned by our customers. In the event of a default, we would not earn interest or receive a return of the principal of our loan and may also experience delays and costs in enforcing our rights as lender. Foreclosure and other similar proceedings used to enforce payment of real estate loans are generally subject to principles of equity, which are designed to relieve the indebted party from the legal effect of that party’s default. Foreclosure and other similar laws may limit our right to obtain a deficiency judgment against the defaulting party after a foreclosure or sale, and may lead to a loss or delay in the payment on loans we hold. If we do have to foreclose on a property, we may receive less in the foreclosure sale than the amount the customer owes us or that is needed to cover the costs to foreclose, repossess and sell the property.

Some of our customers rely on government funding, and their failure to continue to qualify for such funding could adversely impact their ability to make timely lease payments to us.

Some of our customers operate businesses that depend on government funding or reimbursements, such as customers in the education, healthcare and childcare related industries, which may require them to satisfy certain licensure or certification requirements in order to qualify for these government payments. The amount and timing of these government payments depend on various factors that often are beyond our or our customers’ control. We will likely continue to invest in properties leased by customers operating in these industries and acquire other businesses in industries that rely significantly on government payments. If these customers fail to receive necessary government funding or fail to comply with related regulations, their cash flow could be materially affected, which may cause them to default on their leases and adversely impact our business.

Construction and renovation risks could adversely affect our profitability.

In certain instances, we provide financing to our customers for the construction and/or renovation of their properties. We are therefore subject to the risks that this construction or renovation may not be completed. Construction and renovation costs for a property may exceed a customer’s original estimates due to increased costs of materials or labor, or other unexpected costs. A customer may also be unable to complete construction or renovation of a property on schedule, which could result in increased debt service expenses or construction costs. These additional expenses may affect the ability of the customer to make payments to us.

8


Our ability to fully control the maintenance of our net-leased properties may be limited.

Because our customers are the tenants of our net-leased properties and are responsible for the day-to-day maintenance and management of our properties, after lease expiration, we may incur expenses for deferred maintenance or other liabilities if a property is not adequately maintained. We visit our properties periodically, but these visits are not comprehensive inspections and deferred maintenance items may go unnoticed. Our leases generally provide for recourse against a customer in these instances, but bankrupt or financially troubled customers may be more likely to defer maintenance, and it may be more difficult to enforce remedies against such customers. We may not always be able to ascertain the financial circumstances of a given customer or forestall deterioration in the condition of a property.

Failure to qualify as a REIT could adversely affect our financial condition.

Our qualification as a REIT requires us to satisfy numerous highly technical and complex requirements for which there are only limited judicial or administrative interpretations, and which involve the determination of various factual matters and circumstances not entirely within our control. No guarantee can be made that we will be able to continue to be qualified as a REIT in the future. If we fail to qualify as a REIT in any taxable year, we would be subject to federal income tax (and state and local taxes) on our taxable income at the regular corporate rate and be unable to deduct dividends when computing our taxable income. Also, unless the Internal Revenue Service granted us relief under certain statutory provisions, we could not re-elect REIT status until the fifth calendar year after the year in which we first failed to qualify as a REIT. The additional tax liability from such a failure could adversely affect our financial condition.

To the extent state taxing authorities treat us as a “captive” REIT, our state income tax obligations may increase and we will be required to calculate deferred income taxes attributable to temporary differences between tax and financial reporting.

Following the Merger, the Company's new ownership structure and status as a privately held REIT caused multiple state income tax jurisdictions to view the Company as a “captive” REIT, a term which generally refers to a REIT of which 50% of the voting power or value of the beneficial interest or shares is owned by a single entity treated as an association taxable as a corporation. Within the jurisdictions where the Company is treated as a captive REIT, the dividends paid deduction may be disallowed, resulting in state income tax liabilities to which the Company was not previously subject when it was publicly traded. Based on the projected increase in income tax liabilities related to STORE Capital's new status as a captive REIT in multiple state tax jurisdictions, the Company, in addition to its existing obligation to compute current income tax expense, is now in a position where it needs to calculate deferred income taxes attributable to its temporary differences. While current income taxes are based upon the current period's income taxable for state tax reporting purposes, deferred income taxes (benefits) are provided for certain income and expenses, which are recognized in different periods for tax and financial reporting purposes. Deferred tax assets and liabilities are computed for differences between the U.S. generally accepted accounting principles (“GAAP”) and tax basis of assets and liabilities that could result in taxable or deductible amounts in the future based on enacted tax laws and rates applicable to the period in which the differences are expected to affect taxable income. The additional tax liability may impact the operations of the business.

Risks Related to the Financing of Our Business

Our growth depends on external sources of debt and equity capital, which are outside of our control and affect our ability to seize strategic opportunities, satisfy debt obligations and make distributions to our stockholders.members.

We rely on third-party sources to fund our debt and equity capital needs. Our access to third-party sources of capital depends, in part, on general market conditions, the market’s perception of our growth potential, our current debt levels, our credit ratings, our current and expected future earnings, and our cash flows and cash distributions, and the market price per share of our common stock.distributions.

18

Table of Contents

In addition, in order to maintain our qualification as a REIT, we are generally required under the Code to, among other things, distribute annually at least 90% of our net REIT taxable income, determined without regard to the dividends paid deduction and excluding any net capital gain, and we will be subject to income tax at the regular corporate rate to the extent that we distribute less than 100% of our REIT taxable income, determined without regard to the dividends paid deduction and including any net capital gain. Because of these distribution requirements, without access to third-party sources of capital, we may not be able to acquire properties when strategic opportunities exist, meet the capital and operating needs of our existing properties, satisfy our debt service obligations or make the cash distributions to our stockholdersmembers necessary to maintain our qualification as a REIT.

9


Current market conditions, including increases in interest rates, could adversely affect our ability to refinance existing indebtedness or obtain additional financing for growth on acceptable terms or at all.

In periods during which credit markets experience significant price volatility, displacement and liquidity disruptions, liquidity in the financial markets can be impacted, making financing terms for customers less attractive, and in certain cases, rendering certain types of debt financing unavailable. In such periods, we may be unable to obtain debt financing on favorable terms, or at all, or fully refinance maturing indebtedness with new indebtedness. Furthermore, if prevailing interest rates or other factors at the time of refinancing result in higher interest rates upon refinancing, then the interest expense relating to that refinanced indebtedness would increase, and the increased interest rates could cause our interest costs and overall costs of capital to increase.

Our operating results and financial condition could be adversely affected if we or our subsidiaries are unable to make required payments on our debt.

Our charter and bylaws do not limit the amount or percentage of indebtedness that we may incur, and weWe are subject to risks normally associated with debt financing, including the risk that our cash flows will be insufficient to meet required payments of principal and interest. If we are unable to make debt service payments as required on loans secured by properties we own, a lender could foreclose on the property or properties securing its debt. This could cause us to lose part or all of our investment. In addition, a significant portion of our investment portfolio consists of assets owned by our consolidated, bankruptcy remote, special purpose entity subsidiaries (“SPEs”) that have been pledged to secure the long-term borrowings of those SPEs. We or our other consolidated subsidiaries are the equity owners of our SPEs, which entitles us to the excess cash flows after debt service and all other required payments are made on the debt of our SPEs. If our SPEs fail to make the required payments on such indebtedness or fail to maintain the required debt service coverage ratios, distributions of excess cash flows to us may be reduced or suspended and the indebtedness may become immediately due and payable. If our SPEs are unable to pay the accelerated indebtedness, the pledged assets could be foreclosed upon and distributions of excess cash flows to us may be suspended or terminated, which could reduce the value of our portfolio and revenues available for distribution to our stockholders.members.

Our hedging strategies may not be successful in mitigating our risks associated with interest rates and could reduce theour overall returns on an investment in our company.net return.

We attempt to mitigate our exposure to interest rate risk by entering into long-term fixed-rate financing through the combination of periodic debt offerings under our secured and unsecured debt program andprograms including our STORE Master Funding program, our asset-backed securities conduit, through discrete non-recourse secured borrowings, through insurance company and bank borrowings, by laddering our borrowing maturities and by using leases that generally provide for rent escalations during the term of the lease. However, the weighted average term of our borrowings does not match the weighted average term of our investments, and the methods we employ to mitigate our exposure to changes in interest rates involve risks, including the risk that the debt markets are volatile and tend to reflect the conditions of the then current economic climate. Our efforts may not be effective in reducing our exposure to interest rate changes, which may increase our cost of capital and reduce the net returns we earn on our portfolio.

We depend on the asset backed securities (“ABS”) and the commercial mortgage-backed securities (“CMBS”) marketsmarket for a substantial portion of our long-term debt financing.

Historically, we have raised a significant amount of long-term debt capital through our STORE Master Funding program, which accesses the ABS market, and, to a lesser extent, through the CMBS market. Our ABS debt is issued by

19

Table of Contents

our SPEs, which issue multiple series of investment grade ABS notes from time to time as additional collateral is added to the collateral pool. Our CMBS debt is generally first mortgage debt incurred by other SPEs. Our ABS and CMBS debt is generally non-recourse, but there are customary limited exceptions to recourse for matters such as fraud, misrepresentation, gross negligence or willful misconduct, misapplication of payments, bankruptcy and environmental liabilities.

We have generally used the proceeds from these ABS and CMBS financings to repay debt and fund real estate acquisitions. Our obligations under these loans are generally secured by liens on certain of our properties. In the case of our STORE Master Funding program, subject to certain conditions and limitations, we may substitute real estate collateral for assets in the collateral pool from time to time. No assurance can be given that the ABS or the CMBS marketsmarket or financing facilities with similar flexibility to substitute collateral will be available to us in the future.

A disruption in the financial markets for ABS or CMBS debt may affect our ability to obtain long-term debt, which, in turn, may force us to acquire real estate assets at a lower than anticipated growth rate and negatively affect our return on equity. Furthermore, a reduction in the difference, or spread, between the rate we earn on our assets (primarily the lease rates we charge our customers) and the rate we pay on our liabilities (primarily the interest rates on our debt) could have a material and adverse effect on our financial condition.

10


A downgrade in our credit ratings could have a material adverse effect on our business and financial condition.

The credit ratings assigned to us and our debt, which are subject to ongoing evaluation by the rating agencies who have published them, could change based upon, among other things, our historical and projected business, prospects, liquidity, results of operations and financial condition, or the real estate industry generally. If any credit rating agency downgrades or lowers our credit rating, places any such rating on a so-called “watch list” for a possible downgrading or lowering or otherwise indicates a negative outlook for that rating, it could materially adversely affect the market price of our debt securities, and our common stock, as well as our costs and availability of debt capital.

The agreements governing some of our indebtedness contain restrictions and covenants which may limit our ability to enter into or obtain funding for certain transactions, operate our business or make distributions to our common stockholders.members.

The agreements governing some of our indebtedness contain restrictions and covenants, including financial covenants, that limit or will limit our ability to operate our business. These covenants, as well as any additional covenants to which we may be subject in the future because of additional indebtedness, could cause us to forego investment opportunities, reduce or eliminate distributions to our common stockholdersmembers or obtain financing on less than favorable terms. The covenants and other restrictions under our debt agreements may affect our ability to incur indebtedness, create liens on assets, sell or substitute assets, modify certain terms of our leases, prepay debt with higher interest rates, manage our cash flows and make distributions to our common stockholders.members. Additionally, these restrictions may adversely affect our operating and financial flexibility and may limit our ability to respond to changes in our business or competitive environment, all of which may materially and adversely affect us.

General Real Estate Risks

Real estate investments are relatively illiquid and property vacancies could result in significant capital expenditures.

We may desire to sell a property in the future because of changes in market conditions, poor customer performance or default under any mortgage we hold, or to avail ourselves of other opportunities. We may also be required to sell a property in the future to meet debt obligations or avoid a default. Particularly with respect to certain types of real estate assets, such as movie theaters, that cannot always be sold quickly, we may be unable to realize our investment objective by sale, other disposition or refinancing at attractive prices within any given period of time or may otherwise be unable to complete any exit strategy. In addition, as a REIT, the Code limits our ability to dispose of properties in ways that are not applicable to other types of real estate companies. In particular, the tax laws applicable to REITs effectively require that we hold our properties for investment, rather than primarily for sale in the ordinary course of business, which may cause us to forgo or defer sales of properties that otherwise would be in our best interest. We may be required to invest in the restoration or modification of a property before we can sell it. The inability to respond promptly to changes in

20

Table of Contents

the performance of our property portfolio could adversely affect our financial condition and ability to service our debt and pay dividendsmake distributions to our stockholders.members.

The loss of a customer, either through lease expiration or customer bankruptcy, may require us to spend significant amounts of capital to renovate the property before it is suitable for a new customer and cause us to incur significant costs in the form of ongoing expenses for property maintenance, taxes, insurance and other expenses.

Uninsured losses relating to real property may adversely affect our returns.

Our contracts generally require our customers to maintain insurance customary for similar types of commercial property. Depending on the location of the property or nature of its use, losses of a catastrophic nature may be covered by insurance policies held by our customers with limitations, such as large deductibles or copayments, that a customer may not be able to meet. In addition, factors such as inflation, changes in building codes and ordinances, environmental considerations, public safety threats and others may result in insurance proceeds that are insufficient to repair or replace a damaged or destroyed property. In the event of a substantial or comprehensive loss of any of our properties, we may not be able to rebuild such property to its existing specifications without significant capital expenditures, which may exceed any amounts received under insurance policies, due to the upgrades needed to meet zoning and building code requirements. The loss of our capital investment in, or anticipated future returns from, our properties due to material uninsured losses could materially and adversely affect us.

Compliance with the Americans with Disabilities Act and fire, safety and other regulations may require us to make significant unanticipated expenditures that could materially and adversely affect us.11


Our properties are subject to the Americans with Disabilities Act (“ADA”), which requires public accommodations to meet federal requirements related to access and use by disabled persons. Compliance with the ADA, or future legislation, could require us to modify the properties we own or may purchase to remove architectural and communication barriers and may restrict renovations on our properties. Failure to comply with the ADA could result in the imposition of fines or an award of damages to private litigants, as well as costs to make modifications to attain compliance. Our customers are generally required to maintain and repair our properties in compliance with the ADA and other similar laws and regulations, but we could be held liable as the owner of the property in the event of a customer’s non-compliance. Any required modifications could involve greater expenditures than anticipated or the modifications might be made on a more accelerated basis than anticipated, either of which could adversely affect the ability of our customers to cover such costs.

Our properties are also subject to various laws and regulations relating to fire, safety and other regulations, and in some instances, common area obligations. Our customers have primary responsibility for compliance with these regulations but may not have the financial ability to fully maintain compliance, which may cause them to be unable to pay rent on time or default. If this were to occur, we would be required to make substantial capital expenditures to comply with these regulations, which we may not be able to recoup from our customers. We may also face owner liability for failure to comply with these regulations, which may lead to the imposition of fines or an award of damages to private litigants.

Environmentally hazardous conditions may adversely affect our operating results.

Our properties may be subject to known and unknown environmental liabilities under various federal, state and local laws and regulations relating to human health and the environment, some of which may impose joint and several liability on certain statutory classes of persons, including owners or operators, for the costs of investigation or remediation of contaminated properties. These laws and regulations apply to past and present business operations on the properties, and the use, storage, handling and recycling or disposal of hazardous substances or wastes. We may be liable regardless of our knowledge of the contamination, the timing of the contamination, the cause of the contamination or the party responsible for the contamination. Our customers generally must indemnify us from all or most environmental compliance costs, but if a customer fails to, or cannot, comply, we may be required to pay such costs. These costs could be substantial, and because these potential environmental liabilities are generally uncapped, these costs could significantly exceed the property’s value. There can be no assurance that our environmental due diligence efforts will reveal all environmental conditions at the properties in our pipeline.

21

Table of Contents

Under the laws of many states, contamination on a site may give rise to a lien on the site for clean-up costs. Several states will grant priority to a “super lien” for clean-up costs over all existing liens, including those of existing mortgages. If any of the properties on which we have a mortgage are or become contaminated and subject to a super lien, we may not be able to recover the full value of our investment.

Certain federal, state and local laws, regulations and ordinances govern the use, removal and/or replacement of underground storage tanks in the event of a release on, or an upgrade or redevelopment of, certain properties. Such laws, as well as common law standards, may impose liability for any releases of hazardous substances associated with the underground storage tanks and may allow third parties to seek recovery from the owners or operators of such properties for damages associated with such releases.

In a few states, transfers of some types of sites are conditioned upon cleanup of contamination prior to transfer, including in cases where a lender has become the owner of the site through a foreclosure, deed in lieu of foreclosure or otherwise. If any of our properties in these states are subject to such contamination, we may be subject to substantial clean-up costs before we are able to sell or otherwise transfer the property. Additionally, certain federal, state and local laws, regulations and ordinances govern the removal, encapsulation or disturbance of asbestos containing materials (“ACMs”) in the event of the remodeling, renovation or demolition of a building. Such laws, as well as common law standards, may impose liability for releases of ACMs and may impose fines and penalties against us or our customers for failure to comply with these requirements or allow third parties to seek recovery from us or our customers.

In addition, our properties may contain or develop harmful mold, exposure to which may cause a variety of adverse health effects. Exposure to mold at any of our properties could require us to undertake a costly remediation program to contain or remove the mold and could subject us to liability if property damage or health concerns arise.

If we or our customers become subject to any of the above-mentioned environmental risks, we may be materially and adversely affected.

We may be subject to liabilities and costs associated with the impacts of climate change.

The impacts of climate change on our properties or operations are highly uncertain and would be particular to the geographic areas in which we operate, including Florida, Georgia and Texas.operate. Such impacts may result from increased frequency of natural disasters, changes in rainfall and storm patterns and intensities, water shortages, changing sea levels, rising energy and environmental costs, and changing temperatures, which may impact our or our tenants’ ability to obtain property insurance on acceptable terms. While 99%most all of our leases are triple-net, and generally impose responsibility on our tenants for the property-level operating costs and require our tenants to indemnify us for environmental liabilities, there can be no assurance that a given tenant will be able to satisfy its payment obligations to us under its lease if climate change adversely impacts a particular property.

Certain provisions of our leases or loan agreements may be unenforceable, which could adversely impact us.

Our rights and obligations with respect to our leases, mortgage loans or other loans are governed by written agreements. A court could determine that one or more provisions of such an agreement are unenforceable, such as a particular remedy (including rights to indemnification), a loan prepayment provision or a provision governing our security interest in the underlying collateral of a customer. We could be adversely impacted if, for example, this were to happen with respect to a master lease governing our rights relating to multiple properties.

Risks Related to Our Tax Status and Other Tax Related Matters

Failure to qualify as a REIT would reduce our net earnings available for investment or distribution.

Our qualification as a REIT requires us to satisfy numerous highly technical and complex requirements for which there are only limited judicial or administrative interpretations, and which involve the determination of various factual matters and circumstances not entirely within our control. No guarantee can be made that we will be able to continue to be qualified as a REIT in the future. If we fail to qualify as a REIT in any taxable year, we would be subject to federal income tax and increased state and local taxes on our taxable income at the regular corporate rate and be unable to deduct dividends when computing our taxable income. Also, unless the Internal Revenue Service (“IRS”) granted us relief under

22

Table of Contents

certain statutory provisions, we could not re-elect REIT status until the fifth calendar year after the year in which we first failed to qualify as a REIT. The additional tax liability from such a failure would reduce or eliminate the amount of cash available for investment or distribution to our common stockholders, which would likely have a significant adverse effect on the value of our securities and our ability to raise additional capital, and we would no longer be required to make distributions to our common stockholders.

Potential tax law changes could affect our ability to qualify as a REIT and could adversely affect our stockholders.

U.S. federal income tax laws governing REITs and other corporations and the administrative interpretations of those laws may be amended at any time, potentially with retroactive effect. The federal government may enact significant reform of the Code, including significant changes to taxation of business entities, tax deferred exchanges and the deductibility of interest expense. There is a substantial lack of clarity around the likelihood, timing and details of any such tax reform and the impact of any potential tax reform on us or an investment in our securities. Future legislation, new regulations, administrative interpretations or court decisions could adversely affect our ability to qualify as a REIT or adversely affect our stockholders.

Even if we qualify as a REIT for purposes of the Code, we may be subject to other tax liabilities that reduce our cash flow and our ability to make distributions to our common stockholders.

As a REIT, we are subject to annual distribution requirements, which limit the amount of cash we may retain for other business purposes, including amounts to fund our growth. We generally must distribute annually at least 90% of our net REIT taxable income to our stockholders, excluding any net capital gain, in order for our distributed earnings to not be subject to corporate income tax. Additionally, we will be subject to a 4% nondeductible excise tax on the amount, if any, by which distributions we pay in any calendar year are less than the sum of 85% of our ordinary income, 95% of our capital gain net income and 100% of our undistributed income from prior years. If we have net income from the sale of foreclosure property that we hold primarily for sale to customers in the ordinary course of business or other non-qualifying income from foreclosure property, we must pay a tax on that income at the corporate income tax rate. Further, if we sell an asset, other than foreclosure property, that we hold primarily for sale to customers in the ordinary course of business, our gain would be subject to the 100% “prohibited transaction” tax unless such sale were made by our wholly owned taxable REIT subsidiary, or if we qualify for a safe harbor from such tax. We do not intend to engage in prohibited transactions. We cannot assure you, however, that we will only make sales that satisfy the requirements of the safe harbors or that the IRS will not successfully assert that one or more of such sales are prohibited transactions, as this determination is generally a question of the facts and circumstances regarding a particular transaction, and we have not sought, and do not intend to seek, a ruling from the IRS regarding any such dispositions.

We intend to make distributions to our common stockholders to comply with the requirements of the Code. However, differences in timing between the recognition of taxable income and the actual receipt of cash could require us to sell assets or borrow funds on a short-term or long-term basis in order to meet the 90% distribution requirement of the Code when the prevailing market conditions are not favorable for these borrowings.

Dividends paid by REITs generally do not qualify for reduced tax rates.

In general, the maximum U.S. federal income tax rate for dividends that constitute “qualified dividend income” paid to individuals, trusts and estates is 20%. Unlike dividends received from non-REIT corporations, our distributions are generally not eligible for reduced federal income tax rates, unless they are attributable to dividends received by the REIT from other corporations otherwise eligible for the reduced rate. Beginning in 2018 and for taxable years prior to 2026, non-corporate stockholders may generally deduct up to 20% of the aggregate amount of ordinary dividends distributed by us, subject to certain limitations, which would reduce the maximum marginal effective tax rate for individuals on the receipt of such ordinary dividends to 29.6%. Although these rules do not adversely affect the taxation of REITs or dividends payable by REITs, investors who are individuals, trusts or estates may perceive investments in REITs to be relatively less attractive than investments in the stocks of non-REIT corporations that pay dividends, which could materially and adversely affect the trading price of our common stock.

23

Table of Contents

Recharacterization of sale-leaseback transactions may cause us to lose our REIT status.12

The IRS may take the position that certain sale-leaseback transactions that we characterize as leases are not true leases for federal income tax purposes but are, instead, financing arrangements or loans. If a sale-leaseback transaction were so re-characterized, we might fail to satisfy the Code’s REIT asset tests, income tests or distribution requirements and consequently lose our REIT status effective with the year of recharacterization unless we elect to make an additional distribution that subsequently enables us to maintain our REIT status. Alternatively, the amount of our REIT taxable income could be re-calculated, which might also cause us to fail to meet the Code’s distribution requirements for a taxable year.

We could face possible state and local tax audits and adverse changes in state and local tax laws.

As a REIT, we are generally not subject to federal income taxes, but we are subject to certain state and local taxes, which change from time to time and may result in an increase in our tax liability. A shortfall in tax revenues for states and municipalities in which we own properties may lead to an increase in the frequency and size of such changes in tax laws. If such changes occur, we may be required to pay additional state and local taxes. These increased tax costs could adversely affect our financial condition and the amount of cash available for the payment of distributions to our common stockholders. In the ordinary course of business, our SPEs may also become subject to tax audits. If our SPEs become the subject of state or local tax audits, the ultimate result of such audits could have an adverse effect on our financial condition.

Risks Related to Our Organization and Structure

Our Board may change our investment or financing strategy, or leverage policies, without stockholder consent.

Our Board has the overall authority to oversee our operations and determine our major corporate policies. This authority includes significant flexibility. For example, our Board can, among other things: (i) change any of our strategies, policies or procedures with respect to property acquisitions and divestitures, including the creditworthiness standards with respect to our customers, subject to provisions in our charter; (ii) prevent the ownership, transfer and/or accumulation of shares in order to protect our status as a REIT or for any other reason deemed to be in the best interests of us and our stockholders; or (iii) determine that it is no longer in our best interests to continue to qualify as a REIT. Any of these actions could increase our operating expenses, impact our ability to make distributions or reduce the value of our assets without the consent of our stockholders.

Our Board’s power to increase or decrease the number of authorized shares of stock, classify and reclassify unissued stock and issue stock without stockholder approval may negatively impact our existing stockholders.

Our charter authorizes us to issue up to 375,000,000 shares of common stock and up to 125,000,000 shares of preferred stock. Our charter authorizes our Board, without stockholder approval, to amend our charter to increase or decrease the aggregate number of shares of stock or the number of shares of any class or series of stock that we are authorized to issue, to authorize us to issue authorized but unissued shares of our common stock or preferred stock, to classify or reclassify any unissued shares of our common stock or preferred stock into one or more classes or series of stock and to set the terms of such newly classified or reclassified shares. Accordingly, our Board could authorize the issuance of shares of capital stock that could have the effect of delaying, deferring or preventing a change in control of us that our existing stockholders may view as favorable, with preferences, conversion or other rights, voting powers or rights, restrictions, limitations as to dividends or other distributions, qualifications, or terms or conditions of redemption that are senior to, or otherwise conflict with, the rights of our common stockholders. In addition, our Board may increase our authorized stock in order to issue additional shares in connection with future financings and other transactions. These additional issuances could dilute the ownership interests of our existing stockholders.

Limitations on share ownership and limitations on the ability of our stockholders to effect a change in control of us limit the transferability of our stock and may prevent takeovers that are beneficial to our stockholders.

To qualify as a REIT, no more than 50% in value of our outstanding capital stock may be owned by five or fewer individuals, including entities specified in the Code, during the last half of any taxable year, and this capital stock must be beneficially owned by 100 or more persons during at least 335 days of a taxable year of 12 months or during a proportionate part of a shorter taxable year. To comply with these requirements, our charter contains stock ownership and

24

Table of Contents

transfer restrictions such as, for example, a provision that generally limits ownership by any person of more than 9.8% (in value or by number of shares, whichever is more restrictive) of our outstanding common stock, unless our Board exempts the person from such ownership limitation, and transfers in violation of such limitation may be void. These restrictive provisions may have the effect of delaying, deferring or preventing a change of control that does not threaten our REIT status, including those that involve a premium price for our stockholders or that might otherwise be in our stockholders’ best interests.

Our rights and the rights of our stockholders to take action against our directors and officers are limited.

As permitted by Maryland law, our charter limits the liability of our directors and officers to stockholders for monetary damages, except for liability resulting from actual receipt of an improper benefit or profit in money, property or services, or active and deliberate dishonesty by the director or officer that was established by a final judgment as being material to the cause of action adjudicated. As a result, we and our stockholders have limited rights against our directors and officers. Accordingly, if good faith actions taken by any of our directors or officers impede our performance, our ability and the ability of our stockholders to recover damages from such directors or officers will be limited. In addition, our charter authorizes us to obligate our company, and our bylaws require us, to indemnify our directors and officers for actions taken by them in those and certain other capacities to the maximum extent permitted by Maryland law.

Risks Related to Ownership of Our Common Stock

Changes in market conditions and volatility of stock prices could adversely affect the market price of our common stock.

Our stock price experiences price and volume fluctuation, often without regard to our operating performance. As a result, investors in our common stock may experience a decrease in the value of their shares, including decreases unrelated to our actual operating performance or prospects. A number of factors could negatively affect the price per share of our common stock, many of which are out of our control, including:

general market and economic conditions;
actual or anticipated variations in our quarterly operating results or dividends, or those of our competitors;
changes in our funds from operations, adjusted funds from operations or earnings estimates, including as a result of changes in the financial condition, liquidity, results of operations and prospects of our customers;
difficulties or inability to access capital or extend or refinance existing debt;
publication of research reports about us, our competitors, our customers or the real estate industry;
the market’s perception of REITs as an equity security and changes in market valuations of REITs;
a change in ratings issued by analysts or nationally recognized statistical rating organizations;
adverse market reaction to additional debt we may incur or equity-related securities we may issue;
strategic decisions by us or our competitors, such as acquisitions, divestments, spin-offs, joint ventures, strategic investments or changes in business strategy;
governmental regulatory action and changes in tax laws; and
the issuance of additional shares of our common stock, or the perception that such sales might occur.

25

Table of Contents


Increases in market interest rates may have an adverse effect on the value of our common stock if prospective purchasers of our common stock expect a higher dividend yield, and increased borrowing costs may decrease our funds available for distribution to our common stockholders.

The market price of our common stock will generally be influenced by the dividend yield on our common stock relative to market interest rates. An increase in market interest rates, which are currently relatively low, may lead prospective investors to expect a higher dividend yield. However, higher market interest rates would likely increase our borrowing costs and potentially decrease funds available for distribution. Thus, higher market interest rates could cause the market price of our common stock to decrease.

Future offerings of debt, which would be senior to our common stock upon liquidation, or preferred equity securities, which may be senior to our common stock for purposes of dividend distributions or upon liquidation, may adversely affect the market price of our common stock.

In the future, we may issue debt or preferred equity securities. Upon liquidation, holders of our debt securities and shares of preferred stock with a liquidation preference, and lenders with respect to other borrowings, will receive distributions of our available assets prior to the holders of our common stock. Additional equity offerings may dilute the holdings of our existing stockholders or otherwise reduce the market price of our common stock, or both. Holders of our common stock are not entitled to preemptive rights or other protections against dilution. Our preferred stock, if issued, could have a preference on liquidating distributions or a preference on distribution payments that could limit our ability to make distributions to holders of our common stock. Because our decision to issue securities in any future offering will depend on market conditions and other factors beyond our control, we cannot predict or estimate the amount, timing or nature of our future offerings. Thus, our stockholders bear the risk that future offerings may reduce the market price of our common stock and dilute their stock holdings in us.

A substantial portion of our total outstanding common stock may be sold into the market at any time, which could cause the market price of our common stock to drop significantly, even if our business is doing well, and make it difficult for us to sell equity securities in the future.

The market price of our common stock could decline as a result of actual or anticipated sales of a large number of shares of our common stock. These sales, or the possibility that these sales may occur, also might make it difficult for us to sell equity securities in the future at times or prices that we deem appropriate. We filed a registration statement on Form S-8 under the Securities Act to register the offer and sale of up to 7,314,221 shares of our common stock or securities convertible into or exchangeable for shares of our common stock that may be issued pursuant to our 2012 Long-Term Incentive Plan and our 2015 Omnibus Equity Incentive Plan, and recipients of those shares may generally freely resell them in the open market, subject to certain limitations governing our affiliates. In addition, as we continue to issue additional equity securities periodically to finance our growth, including through our “at the market” offering programs, these issuances will dilute the interests of our existing stockholders and could adversely affect the value of their investments. If our performance or prospects decline and we are unable to access the equity markets when needed in the future, our ability to grow our business will be adversely impacted.

We may change the dividend policy for our common stock in the future.

The decision to declare and pay dividends on our common stock, as well as the form, timing and amount of any such future dividends, is at our Board’s sole discretion and will depend on our earnings, cash flows, liquidity, financial condition, capital requirements, contractual prohibitions or other limitations governing our indebtedness, the annual distribution requirements under the REIT provisions of the Code, state law and other relevant factors. Any change in our dividend policy could have a material adverse effect on the market price of our common stock.

Other General Risks

We face risks associated with security breaches through cyber-attacks, cyber intrusions or otherwise, as well as other significant disruptions of our IT networks and related systems.

While we do not collect or maintain the types of information that are most often targeted in cyber-attacks, such as credit card data, bank account information, or sensitive personal information, we nevertheless face risks associated with

26

Table of Contents

security breaches through cyber-attacks, malware, computer viruses and malicious codes, ransomware, unauthorized access attempts, denial of service attacks, phishing, social engineering, bad actors with access to systems inside our organization, and other significant disruptions of our IT networks and related systems. The risk of a security breach has generally increased as the number, intensity and sophistication of attempted attacks and intrusions from around the world have increased. Our IT networks and related systems are essential to the operation of our business, the availability and integrity of our data and our ability to perform day-to-day operations, and security breaches or system interruptions could result in misstated financial reports, violations of loan covenants, missed reporting deadlines, our inability to monitor our compliance with the rules and regulations regarding our qualification as a REIT, unauthorized access to, and destruction, loss, theft, misappropriation or release of proprietary, confidential, sensitive or otherwise valuable information of ours or others, the diversion of management attention and resources to remedy any resulting damages, liability for claims for breach of contract, damages, credits, penalties or termination of leases or other agreements, or damage to our reputation among our customers, lenders, vendors and investors generally.

We rely on information systems across our operations and corporate functions, in particular our finance and accounting departments, and depend on such systems to ensure payment of obligations, collection of cash, data warehousing to support analytics, and other various processes and procedures, and there can be no assurance that our security efforts will be effective in deterring security breaches or disruptions. Even the most well protected information, networks, systems and facilities remain potentially vulnerable because the techniques, tools and tactics used in such attempted security breaches evolve and generally are not recognized until launched against a target, and in some cases are designed to not be detected and, in fact, may not be detected. Accordingly, we may be unable to anticipate these techniques or to implement adequate security barriers, disaster recovery or other preventative or corrective measures, and thus it is impossible for us to entirely counteract this risk or fully mitigate the harms after such an attack. And as we periodically upgrade our IT systems, we face the risk that these systems may not function properly and expose us to increased cybersecurity breaches and failures, which would expose us to reputational, competitive, operational, financial and business harm, as well as potential litigation and regulatory action.

We depend on key personnel; the loss of their full service could impair our ability to operate successfully.

We rely on the experience, efforts and abilities of senior leadership and other key personnel. We cannot guarantee the continued employment of any of the members of our senior leadership team or key personnel, each of whom could be difficult to replace, given their extensive knowledge and experience. The loss of services of one or more members of our senior leadership team, or our inability to attract and retain highly qualified personnel, could adversely affect our business and be negatively perceived in the capital markets, diminish our investment opportunities and weaken our relationships with lenders, business partners, and customers.

We are subject to litigation which could materially and adversely affect us.

From time to time, we are subject to litigation in connection with the ordinary course operation of our business, including instances in which we are named as defendants in lawsuits arising out of accidents causing personal injuries or other events that occur on the properties operated by our customers. We generally seek to have our customers defend, and assume liability for, such matters involving their properties. In other cases, we may defend ourselves, invoke our insurance coverage or the coverage of our customers, and/or invoke our indemnification rights included in our leases. Resolution of these types of matters against us may result in significant legal fees and/or require us to pay significant fines, judgments or settlements, which, to the extent uninsured or in excess of insured limits, or not subject to indemnification, could adversely impact our earnings and cash flows. We also may become subject to litigation relating to our financing and other transactions. Certain types of litigation, if determined adversely to us, may affect the availability or cost of some of our insurance coverage, which could expose us to increased risks that would be uninsured and materially and adversely impact our ability to attract directors and officers.

13


Future federal, state and local rules or regulations may adversely affect our and our customers’ results of operations.

Compliance with future federal, state and local governmental rules or regulations, or stricter interpretation of existing governmental rules or regulations, may result in new costs, new liabilities, restrictions on current business activities and could cause a material and adverse effect on our and our customers’ results of operation. There is no way to

27

Table of Contents

predict what governmental rules or regulations will be enacted in the future, how future rules or regulations will be administered or interpreted or how future rules or regulations will affect our or our customers’ businesses.

Item 1B. UNRESOLVED STAFF COMMENTS

None.COMMENTS

None.

Item 1C. Cybersecurity

Our board of directors recognizes the critical importance of maintaining the trust and confidence of our customers, clients, business partners and employees. Our board of directors is actively involved in oversight of our Company’s risk management, and cybersecurity represents an important component of our overall approach to risk management. Our cybersecurity policies, standards, processes and practices are fully integrated into our risk management approach and are based on recognized frameworks established by the Committee of Sponsoring Organizations of the Treadway Commission 2013 Framework. In general, our Company seeks to address cybersecurity risks through a comprehensive, cross-functional approach that is focused on preserving the confidentiality, security and availability of the information that we collect and store by identifying, preventing and mitigating cybersecurity threats and effectively responding to cybersecurity incidents if they occur.

Risk Management and Strategy

As one of the critical elements of our overall risk management approach, our cybersecurity program is focused on the following key areas:

Governance: As discussed in more detail under the heading “Governance” below, our board of directors’ oversight of cybersecurity risk management is supported by our Senior Vice President of Information Technology, who leads our cybersecurity team, which is responsible for publishing cybersecurity policies and standards, conducting annual risk assessments and ensuring our compliance.

Collaborative Approach: We have implemented a comprehensive, cross-functional approach to identifying, preventing and mitigating cybersecurity threats and incidents, while also implementing controls and procedures that would provide for the prompt escalation of certain cybersecurity incidents so that decisions regarding the public disclosure and reporting of such incidents can be made by management in a timely manner.

Technical Safeguards: We deploy technical safeguards that are designed to protect our information systems from cybersecurity threats, including firewalls, intrusion prevention and detection systems, antimalware functionality and access controls, which are evaluated and improved through vulnerability assessments, audits and cybersecurity threat intelligence.

Incident Response and Recovery Planning: We have established and maintained comprehensive incident response and recovery plans that fully address our response to a cybersecurity incident, and such plans are tested and evaluated on a regular basis.

Third-Party Risk Management: We maintain a comprehensive, risk-based approach to identifying and overseeing cybersecurity risks presented by third parties, including vendors, service providers and other external users of our systems, as well as the systems of third parties that could adversely impact our business in the event of a cybersecurity incident affecting those third-party systems.

Education and Awareness: We provide regular, mandatory training for personnel regarding cybersecurity threats as a means to equip our personnel with effective tools to address cybersecurity threats, and to communicate our evolving information security policies, standards, processes and practices. Further, we perform ongoing phishing simulations to help employees recognize, avoid and report potential threats that could compromise critical business data and systems. Additional mandatory training is provided to employees who engage in potentially compromising activities during these simulations.

14


We engage in the periodic assessment and testing of our policies, standards, processes and practices that are designed to address cybersecurity threats and incidents. These efforts include a wide range of activities, including audits, assessments, threat modeling, vulnerability testing and other exercises focused on evaluating the effectiveness of our cybersecurity measures and planning. We may engage third parties to perform assessments on our cybersecurity measures, including information security maturity assessments, audits and independent reviews of our information security control environment and operating effectiveness. The results of such assessments, audits and reviews are reported to those charged with governance by our Senior Vice President of Information Technology, and we adjust our cybersecurity policies, standards, processes and practices as necessary based on the information provided by these activities.

Governance

Our board of directors oversees our risk management approach, including the management of risks arising from cybersecurity threats. Our board of directors receives periodic presentations and reports on cybersecurity risks, which address a wide range of topics, including recent developments, evolving standards, vulnerability assessments, third-party and independent reviews, the threat environment, technological trends and information security considerations arising with respect to our peers and third parties. Our board of directors also receives prompt and timely information regarding any cybersecurity incident that meets established reporting thresholds, as well as ongoing updates regarding any such incident until it has been addressed. On a periodic basis, our board of directors discusses our Company’s approach to cybersecurity risk management with management.

Our board of directors, in connection with management led by our Senior Vice President of Information Technology, work collaboratively across our Company to implement a program designed to protect our information systems from cybersecurity threats and to promptly respond to any cybersecurity incidents in accordance with our incident response and recovery plans. To facilitate the success of our cybersecurity risk management program, multidisciplinary teams throughout our Company are deployed to address cybersecurity threats and respond to cybersecurity incidents. Through ongoing communications with these teams, our board of directors monitors the prevention, detection, mitigation, and remediation of cybersecurity threats and incidents in real-time and report such threats and incidents to management when appropriate.

Our Senior Vice President of Information Technology has served in his role since January 2020 and has managed STORE’s Information Technology department since joining the Company in January of 2015. In these roles, he has been instrumental in the evolution and implementation of our business systems and technical infrastructure as well as the development and enforcement of Sarbanes-Oxley (SOX) compliance processes and reporting. Prior to joining STORE, he was the Chief Information Officer for Southwest Network, a non-profit organization for mental and behavioral health services serving the greater Phoenix, Arizona community. He has over 35 years of experience in the information technology industry serving in several technical and leadership positions.

Cybersecurity Threats

As of the date of this Annual Report on Form 10-K, we do not believe that any risks from cybersecurity threats have had or are reasonably likely to have a material effect on us, our business strategy, results of operations, or financial condition.


Item 2. PROPERTIE
SPROPERTIES

As of December 31, 2021,2023, our total investment in real estate and loans approximated $10.7was approximately $14.7 billion, representing investments in 2,8663,206 property locations, substantially all of which are profit centers for our customers. These investments generate cash flows from approximately 775 contracts predominantly structured as net leases. The weighted average non-cancelablenon‑cancelable remaining term of our leases was approximately 13.413.7 years.

Our real estate portfolio is highly diversified. As of December 31, 2021, our 2,866 property locations were operated by 556 customers across the United States. Our customers are typically established regional and national operators, with approximately 50% of our base rent and interest coming from customers with over $200 million in annual revenues. Our largest customer represented approximately 3.0% of our portfolio at December 31, 2021, and our top ten largest customers represented 18.4% of base rent and interest. Our customers operate their businesses across approximately 855 brand names or business concepts in 120 industries.

The following tables summarize the diversification of our real estate portfolio based on the percentage of base rent and interest, annualized based on rates in effect on December 31, 2021, for all of our leases, loans and direct financing receivables in place as of that date.

28

Table of Contents

Diversification by Customer

As of December 31, 2021, our property locations were operated by 556 customers and the following table identifies our ten largest customers:


% of


Base Rent

Number


and

of


Customer

Interest

Properties


Spring Education Group Inc. (Stratford School/Nobel Learning Communities)


3.0

%

28

LBM Acquisition, LLC (Building materials distribution)

3.0

156

Fleet Farm Group LLC

2.2

9

Cadence Education, Inc. (Early childhood/elementary education)

2.0

68

Dufresne Spencer Group Holdings, LLC (Ashley Furniture HomeStore)

1.6

25

CWGS Group, LLC (Camping World/Gander Outdoors)


1.4


20

Great Outdoors Group, LLC (Cabela's)

1.4

9

Zips Holdings, LLC


1.3

46

American Multi-Cinema, Inc.

1.3

14

At Home Stores LLC

1.2

11

All other (546 customers)


81.6


2,480

Total


100.0

%

2,866

Diversification by Industry

As of December 31, 2021 our customers’ business concepts were diversified across approximately 120 industries within the service, retail and manufacturing sectors of the U.S. economy. The following table summarizes those industries into 79 industry groups:


% of

Building


Base Rent

Number

Square


and

of

Footage 


Customer Industry Group

Interest

Properties

(in thousands)


Service:

Restaurants—full service


7.0

%  

349


2,428

Restaurants—limited service


5.0

396


1,256

Early childhood education centers


6.2

267


2,858

Automotive repair and maintenance


5.4

223


1,217

Health clubs


5.1

90


3,090

Pet care facilities


3.4

184


1,715

Lumber & construction materials wholesalers

3.4

167

6,865

Behavioral health facilities

3.3

84

1,557

All other service (31 industry groups)


26.0

559


25,980

Total service


64.8

2,319


46,966

Retail:

Farm and ranch supply

3.4

41

4,136

Total retail (17 industry groups)


11.8

199

9,410

Total retail


15.2

240


13,546

Manufacturing:

Metal fabrication

5.9

109

14,130

All other manufacturing (21 industry groups)

14.1

198

25,503

Total manufacturing


20.0

307


39,633

Total


100.0

%  

2,866


100,145

29

Table of Contents

Diversification by Geography

Our portfolio is also highly diversified by geography, as our property locations can be found in every state except Hawaii. The following table details the top ten geographical locations of the properties as of December 31, 2021:

% of


Base Rent


and

Number of


State

Interest 

Properties


Texas


11.3

%   

344

Illinois


6.3

180

California


5.9

80

Georgia

5.5

165

Florida


5.3

156

Ohio


5.1

142

Wisconsin


5.0

78

Arizona


4.3

90

Tennessee


3.6

120

Minnesota


3.3

87

All other (39 states) (1)


44.4

1,424

Total


100.0

%  

2,866

(1)Includes one property in Ontario, Canada which represents less than 0.1% of base rent and interest.

Contract Expirations

The following table sets forth the schedule of our lease, loan and direct financing receivable expirations as of December 31, 2021:


% of


Base Rent


and

Number of


Year of Lease Expiration or Loan Maturity (1)

Interest

Properties (2)


2022

0.5

%

22

2023


1.1

10

2024


0.7

22

2025


1.1

24

2026


1.5

54

2027


1.7

54

2028


3.0

68

2029


5.1

160

2030


3.6

147

2031

5.0

209

Thereafter


76.7

2,081

Total


100.0

%  

2,851

(1)Expiration year of contracts in place as of December 31, 2021, excluding any tenant option renewal periods.
(2)Excludes 15 properties which were vacant and not subject to a lease as of December 31, 2021.

30

Table of Contents

Item 3. LEGAL PROCEEDINGSPROCEEDINGS

We are subject to various legal proceedings and claims that arise in the ordinary course of our business, including instances in which we are named as defendants in lawsuits arising out of accidents causing personal injuries or other events that occur on the properties operated by our customers. These matters are generally covered by insurance and/or by our customers pursuant to our contractual indemnification rights that we include in our leases. Management believes that the final outcome of such matters will not have a material adverse effect on our financial position, results of operations or liquidity.

15


Item 4. MINE SAFETY DISCLOSURESDISCLOSURES

Not Applicable.

PART II

Item 5. MARKET FOR REGISTRANT’S COMMON STOCK, RELATED STOCKHOLDER MATTERS AND ISSUER PURCHASES OF EQUITY SECURITIES

OurThere is no established public trading market for our common stock is listed on the NYSE under the symbol “STOR”.

On February 22, 2022, there were 131 holders of record of the 274,775,929 outstanding sharesequity. 100.0% of our common stock. Because many ofequity is beneficially owned by our shares of common stock are held by brokers and other institutions on behalf of stockholders, we are unable to estimate the total number of stockholders represented by these record holders. We have determined that, for federal income tax purposes, approximately 84.6% of distributions paid in 2021 represented taxable income and 15.4% represented a return of capital.two members.

Distributions

The Company pays regular quarterly distributions to holders of its common stock. Future distributionsDistributions will be at the discretion of our Board of Directors and will depend on our actual funds from operations, financial condition and capital requirements, and the annual distribution requirements under the REIT provisions of the Code and other factors.

Issuer Purchases of Equity Securities

The restricted stock and restricted stock unit awards granted under our equity incentive plans permit our employees to elect to satisfy the minimum statutory tax withholding obligation due upon vesting by allowing the Company to repurchase an amount of shares otherwise deliverable on the vesting date having a fair market value equal to the withholding obligation. All of the shares repurchased by us during the fourth quarter of 2021 were in connection with this tax withholding obligation. During the three months ended December 31, 2021, the Company repurchased the following shares of its common stock:

Period

Total
Number of Shares Purchased

Average Price Paid Per Share

October 1, 2021 through October 31, 2021

-

$

-

November 1, 2021 through November 30, 2021

4,734

$

34.45

December 1, 2021 through December 31, 2021

-

$

-

Total

4,734

$

34.45

31

Table of Contents

Stock Performance Graph

The following performance chart compares, for the five-year period commencing December 31, 2016 and ending December 31, 2021, the cumulative total stockholder return on our common stock with that of the Standard & Poor’s 500 Composite Stock Index, or the S&P 500, and the MSCI U.S. REIT Index. The chart assumes $100.00 was invested on December 31, 2016 and assumes the reinvestment of any dividends. The historical stock price performance reflected in the following graph is not necessarily indicative of future stock price performance.

Graphic

Period Ending


Index

12/31/2016


12/31/2017


12/31/2018

12/31/2019


12/31/2020


12/31/2021


STORE Capital Corporation

100


110.71


126.26

172.63


166.65


176.30

S&P 500

100


121.83


116.49

153.17


181.35


233.41

MSCI US REIT (RMS)

100


105.07


100.27

126.18


116.62


166.84

The performance graph and the related chart and text are being furnished solely to accompany this Annual Report on Form 10-K pursuant to Item 201(e) of Regulation S-K, and are not being filed for purposes of Section 18 of the Exchange Act and are not to be incorporated by reference into any filing of ours, whether made before or after the date hereof, regardless of any general incorporation language in such filing.

Item 6. [Reserved.]Reserved]

32

Table of Contents

Item 7. MANAGEMENT’S DISCUSSIONDISCUSSION AND ANALYSIS OF FINANCIAL CONDITION AND RESULTS OF OPERATIONS

The following discussion and analysis of our financial condition and results of operations should be read together with the “Business” section, as well as the consolidated financial statements and related notes in Part II, Item 8 in this Annual Report on Form 10-K. Some of the information contained in this discussion and analysis or set forth elsewhere in this report,Annual Report, including information with respect to our plans and strategies for our business, includes forward-lookingforward‑looking statements that involve risks and uncertainties. You should read “Item 1A. Risk Factors” and the “Forward-Looking“Forward‑Looking Statements” sections of this Annual Report on Form 10-K for a discussion of important factors that could cause actual results to differ materially from the results described in or implied by these forward-lookingforward‑looking statements.

In 2019, the Financial Accounting Standards Board issued ASU 2019-07, Codification Updates to SEC Sections-Amendments to SEC Paragraphs Pursuant to SEC Final Rule Releases No. 33-10532, Disclosure Update and Simplification, which makes a number of changes meant to simplify certain disclosures in financial condition and results of operations, particularly by eliminating year-to-year comparisons between prior periods previously disclosed. In complying with the relevant aspects of the rule covering the current year annual report,Annual Report, we include disclosures on our cash flows and results of operations for fiscal year 20212023 versus 20202022 only. For discussion of our fiscal year 20202022 compared to our fiscal year 2019,2021, see “Item 7. Management’s Discussion and Analysis of Financial Condition and Results of Operations” in our Annual Report filed with the SEC for the fiscal year ended December 31, 2020.2022.

OverviewThe Merger

We were formedOn September 15, 2022, STORE Capital Corporation, a Maryland corporation, Ivory Parent, LLC, a Delaware limited liability company (“Parent”) and Ivory REIT, LLC, a Delaware limited liability company (“Merger Sub” and, together with Parent, the “Parent Parties”), entered into an Agreement and Plan of Merger (the “Merger Agreement”). The Parent Parties are affiliates of GIC, a global institutional investor, and funds managed by Blue Owl Capital. On February 3, 2023 (the “Closing Date”), pursuant to the terms and subject to the conditions set forth in 2011the Merger Agreement, STORE Capital Corporation merged with and into Merger Sub (the “Merger”) with Merger Sub surviving (the “Surviving Entity”) and the separate existence of STORE Capital Corporation ceased. Immediately following the completion of the Merger, the Surviving Entity changed its name to STORE Capital LLC. As of the Closing Date of the Merger, the common equity of the Company is no longer publicly traded.

Following the Merger, we are a Delaware limited liability company organized as an internally managed real estate investment trust, or REIT. As a REIT, we will generally not be subject to federal income tax to the extent that we distribute all our taxable income to our members and meet other requirements.

For the periods prior to the Merger, we present the results of operations for STORE Capital Corporation and its wholly owned subsidiaries (the “Predecessor”). For the periods after the Merger, we present the results of operations for STORE Capital LLC and its wholly owned subsidiaries (the “Successor”). The twelve months ended December 31, 2023 (the “Combined Period”) include the

16


results of operations for the Predecessor during the period of January 1, 2023 through February 2, 2023 and the results of operations for the Successor during the period February 3, 2023 through December 31, 2023.

Overview

We invest in and manage Single Tenant Operational Real Estate, or STORE Property, which is our target market and the inspiration for our name. A STORE Property is a property location at which a company operates its business and generates sales and profits, which makes the location a profit center and, therefore, fundamentally important to that business. Due to the long-term nature of our leases, we focus our acquisition activity on properties that operate in industries we believe have long-term relevance, the majority of which are service industries. Our customers operate their businesses under a wide range of brand names or business concepts. As of December 31, 2021, over 850 brand names or business concepts in approximately 120 industries were represented in our investment portfolio. By acquiring the real estate from the operators and then leasing the real estate back to them, the operators become our long-termlong‑term tenants, and we refer to them as our customers. Through the execution of these sale-leaseback transactions, we fill a need for our customers by providing them a source of long-termlong‑term capital that enables them to avoid the need to incur debt and/or employ equity in order to finance the real estate that is essential to their business.

We are a Maryland corporation organized as an internally managed real estate investment trust, or REIT. As a REIT, we will generally not be subject to federal income tax to the extent that we distribute all our taxable income to our stockholders and meet other requirements.

Our shares of common stock have been listed on the New York Stock Exchange since our initial public offering, or IPO, in November 2014 and trade under the ticker symbol “STOR.”

Since our inception in 2011, we have selectively originated over $12.6 billion of real estate investments. As of December 31, 2021, our investment portfolio totaled approximately $10.7 billion, consisting of investments in 2,866 property locations across the United States. All of the real estate we acquire is held by our wholly or majority owned subsidiaries, many of which are special purpose bankruptcy remote entities formed to facilitate the financing of our real estate. We predominantly acquire our single-tenantsingle‑tenant properties directly from our customers in sale-leasebacksale‑leaseback transactions where our customers sell us their operating properties and then simultaneously enter into long-term triple-netlong‑term triple‑net leases with us to lease the properties back. Accordingly, our properties are fully occupied and under lease from the moment we acquire them.

We generate our cash from operations primarily through the monthly lease payments, or “base rent,”rent”, we receive from our customers under their long-termlong‑term leases with us. We also receive interest payments on loans receivable, which are a smallsmaller part of our portfolio. We refer to the monthly scheduled lease and interest payments due from our customers as “base rent and interest.”interest”. Most of our leases contain lease escalations every year or every several years that are based on the lesser of the increase in the Consumer Price Index or a stated percentage, (if such contracts are expressed on an annual basis, currently averaging approximately 1.8%), which allows the monthly lease payments we receive to increase

33

Table over the life of Contents

somewhat in an inflationary economic environment.the lease contracts. As of December 31, 2021,2023, approximately 99%98% of our leases (based on base rent) were “triple-net” leases, which means that our customers are responsible for all the operating costs such as maintenance, insurance and property taxes associated with the properties they lease from us, including any increases in those costs that may occur as a result of inflation. The remaining leases have some landlord responsibilities, generally related to maintenance and structural component replacement that may be required on such properties in the future, although we do not currently anticipate incurring significant capital expenditures or property-level operating costs under such leases. Because our properties are single-tenantsingle‑tenant properties, almost all of which are under long-termlong‑term leases, it is not necessary for us to perform any significant ongoing leasing activities on our properties. As of December 31, 2021, the weighted average remaining term of our leases (calculated based on base rent) was approximately 13.4 years, excluding renewal options, which are exercisable at the option of our tenants upon expiration of their base lease term. Leases approximating 99% of our base rent as of that date provide for tenant renewal options (generally two to four five-year options) and leases approximating 11% of our base rent provide our tenants the option, at their election, to purchase the property from us at a specified time or times (generally at the greater of the then fair market value or our cost, as defined in the lease contracts).

We have a dedicated an internal team to reviewthat reviews and analyzeanalyzes ongoing tenantcustomer financial performance, both at the corporate level and with respect to each property we own, in order to identify properties that may no longer be part of our long-term strategic plan. As part of that continuous active-management process,plan and as such, we may from time to time decide to sell properties where we believe the property no longer fits within our plan. Because generally we have been able to acquire assets and originate new leases at lease rates above the online commercial real estate auction marketplace, we have been able to sell these assets on both opportunistic and strategic bases, typically for a gain. This gain acts to partially offset any possible losses we may experience in the real estate portfolio.properties.

COVID-19 Pandemic

Since early 2020, the world has been impacted by the COVID-19 pandemic. At various times, the COVID-19 pandemic has primarily impacted us through government-mandated limits (i.e., required closures or limits on operations and social distancing requirements) imposed on our tenants’ businesses and continuing public perceptions regarding safety, which have impacted certain tenants’ ability to pay their rent to us. In addition, although 99% of our leases are triple net, meaning that our tenants are generally responsible for the property-level operating costs such as taxes, insurance and maintenance, we may be required to make the property tax payment on behalf of the tenant if they are unable to do so.

We have worked directly with our impacted tenants during the COVID-19 pandemic to help them continue to meet their rent payment obligations to us, including providing short-term rent deferral arrangements. These arrangements included a structured rent relief program through which we allowed tenants that were highly and adversely impacted by the COVID-19 pandemic to defer the payment of their rent on a short-term basis. During 2020, we recognized net revenue aggregating approximately $57.1 million related to these deferral arrangements and collected $9.9 million in repayments of the amounts deferred. During the year ended December 31, 2021, we recognized an additional $8.3 million of net revenue related to deferral arrangements and collected $33.4 million in repayments of amounts deferred. We expect that the majority of our remaining receivable will be collected before the end of 2022.

As government-mandated restrictions have been lifted, our tenants have increased their business activity and their ability to meet their financial obligations to us under their lease contracts. As a result, our rent and interest collections have returned to pre-pandemic levels, and, essentially all of our properties are open for business.

The Company continues to closely watch for unpredictable factors that could impact its business going forward, including the duration of the COVID-19 pandemic; governmental, business and individual actions in response to the COVID-19 pandemic, including the vaccination process (and related government mandates); and the overall impact on broad economic activity.

Liquidity and Capital Resources

As of December 31, 2021,2023, our investment portfolio stood atwas approximately $10.7$14.7 billion, consisting of investments in 2,8663,206 property locations. Substantially all of our cash from operations is generated by our investment portfolio.

34

Table of Contents

Our primary cash expenditures are the principal and interest payments we make on the debt we use to finance our real estate investment portfolio and the general and administrative expenses of managing the portfolio and operating our business. Since substantially all our leases are triple net, our tenants are generally responsible for the maintenance, insurance and property taxes associated with the properties they lease from us. When a property becomes vacant through a tenant default or expiration of the lease term with no tenant renewal, we incur the property costs not paid by the tenant, as well as those property costs accruing during the time it takes to locate a substitute tenant or sell the property. As of December 31, 2021, the weighted average remaining term of our leases was approximately 13.4 years and the contracts related to just 22 properties, representing 0.5% of our annual base rent and interest, are due to expire during 2022; 77% of our leases have ten years or more remaining in their base lease term. As of December 31, 2021, 15 of our 2,866 properties were vacant and not subject to a lease, which represents a 99.5% occupancy rate. We expect to incur some property-level operating costs from time to time in periods during which properties that become vacant are being remarketed. In addition, we may recognize an expense for certain property costs, such as real estate taxes billed in arrears, if we believe the tenant is likely to vacate the property before making payment on those obligations or may be unable to pay such costs in a timely manner. Property costs are generally not significant to our operations, but the amount of property costs can vary quarter to quarter based on the timing of property vacancies and the level of underperforming properties. We may advance certain property costs on behalf of our tenants but expect that the majority of these costs will be reimbursed by the tenant and do not anticipate that they will be significant to our operations.

17


We intend to continue to grow through additional real estate investments. To accomplish this objective, we must continue to identify real estate acquisitions that are consistent with our underwriting guidelines and raise future additional capital to make such acquisitions. We acquire real estate with a combination of debt and equity capital, proceeds from the sale of properties and cash from operations that is not otherwise distributed to our stockholdersmembers in the form of dividends. When we sell properties, we generally reinvest the cash proceeds from those sales in new property acquisitions.distributions. We also periodically commit to fund the construction of new properties for our customers or to provide them funds to improve and/or renovate properties we lease to them. These additional investments will generally result in increases to the rental revenue or interest income due under the related contracts. As of December 31, 2021, we had commitments to our customers to fund improvements to owned or mortgaged real estate properties totaling approximately $160.7 million, of which $143.5 million is expected to be funded in the next twelve months.

Financing Strategy

Our debt capital is initially provided on a short-term, temporary basis through a multi-year, variable-ratevariable‑rate unsecured revolving credit facility with a group of banks. We manage our long-term leverage position through the strategic and economic issuance of long-term fixed-rate debt on both a secured and unsecured basis. By matching the expected cash inflows from our long-termlong‑term real estate leases with the expected cash outflows of our long-term fixed-ratelong‑term fixed‑rate debt, we “lock in,”in”, for as long as is economically feasible, the expected positive difference between our scheduled cash inflows on the leases and the cash outflows on our debt payments. By locking in this difference, or spread, we seek to reduce the risk that increases in interest rates would adversely impact our profitability. In addition, we may use various financial instruments designed to mitigate the impact of interest rate fluctuations on our cash flows and earnings, including hedging strategies such as interest rate swaps and caps, depending on our analysis of the interest rate environment and the costs and risks of such strategies. We also ladder our debt maturities in order to minimize the gap between our free cash flow (which we define as our cash from operations less dividends plus proceeds from our sale of properties)distributions) and our annual debt maturities;maturities.

Unsecured Revolving Credit Facility

In connection with the completion of the Merger on February 3, 2023, we have no significant debt maturities until 2024.

Asrepaid in full all amounts outstanding under, and terminated, our previous revolving credit facility agreement. Concurrently, we entered into a new unsecured credit agreement with a group of lenders, which initially provided for a senior unsecured revolving credit facility of up to $500.0 million. In March, October and December 2023, we entered into incremental amendments that increased our existing unsecured revolving credit facility by a total of $253.9 million, so that, as of December 31, 2021, all our long-term debt was fixed-rate debt and our weighted average debt maturity was 6.8 years. As part of our long-term debt strategy,2023, we develop and maintain broad access to multiple debt sources. We believe that having access to multiple debt markets increases our financing flexibility because different debt markets may attract different kinds of investors, thus expanding our access to a larger pool of potential debt investors. Also, a particular debt market may be more competitive than another at any particular point in time.

The long-term debt we have issued to date is comprised of both secured non-recourse borrowings, the vast majority of which is investment-grade rated, and senior investment-grade unsecured borrowings. We are currently rated Baa2, BBB and BBB by Moody’s Investors Service, S&P Global Ratings and Fitch Ratings, respectively. In October 2021, S&P Global Ratings raised its outlook on the Company to positive from stable and affirmed its BBB issuer credit rating. In conjunction with our investment-grade debt strategy, we target a level of debt net of cash and cash equivalents that

35

Table of Contents

approximates 5½ to 6 times our estimated annualized amount of earnings (excluding gains or losses on sales of real estate and provisions for impairment) before interest, taxes, depreciation and amortization (based on our current investment portfolio). Our leverage, expressed as the ratio of debt (net of cash and cash equivalents) to the cost of our investment portfolio, was approximately 40% at December 31, 2021.

Our secured non-recourse borrowings are obtained through multiple debt markets – primarily the asset-backed securities debt market. The vast majority of our secured non-recourse borrowings were made through an investment-grade-rated debt program we designed, which we call our Master Funding debt program. By design, this program provides flexibility not commonly found in most secured non-recourse debt and which is described in Non-recourse Secured Debt below. To a lesser extent, we may also obtain fixed-rate non-recourse mortgage financing through the commercial mortgage-backed securities debt market or from banks and insurance companies secured by specific properties we pledge as collateral.

Our goal is to employ a prudent blend of secured non-recourse debt through our flexible Master Funding debt program, paired with senior unsecured debt that uses our investment grade credit ratings. By balancing the mix of secured and unsecured debt, we can effectively leverage those properties subject to the secured debt in the range of 60%-70% and, at the same time, target a more conservative level of overall corporate leverage by maintaining a large pool of properties that are unencumbered. As of December 31, 2021, our secured non-recourse borrowings had a loan-to-cost ratio of approximately 63% and approximately 36% of our investment portfolio serves as collateral for this long-term debt. The remaining 64% of our portfolio properties, aggregating approximately $6.8 billion at December 31, 2021, are unencumbered and this unencumbered pool of properties provides us the flexibility to access long-term unsecured borrowings. The result is that our growing unencumbered pool of properties can provide higher levels of debt service coverage on the senior unsecured debt than would be the case if we employed only unsecured debt at our overall corporate leverage level. We believe this debt strategy can lead to a lower cost of capital for the Company, especially as we can issue AAA rated debt from our Master Funding debt program, as described further below.

The availability of debt to finance commercial real estate in the United States can, at times, be impacted by economic and other factors that are beyond our control. An example of adverse economic factors occurred during the recession of 2007 to 2009 when availability of debt capital for commercial real estate was significantly curtailed. We seek to reduce the risk that long-term debt capital may be unavailable to us by maintaining the flexibility to issue long-term debt in multiple debt capital markets, both secured and unsecured, and by limiting the period between the time we acquire our real estate and the time we finance our real estate with long-term debt. In addition, we have arrangedborrowing capacity under our unsecured revolving credit facility of up to have a multi-year term with extension options in order$753.9 million.

The current facility is scheduled to reduce the risk that short term real estate financing would not be available to us. As we continue to grow our real estate portfolio, we also intend to continue to manage our debt maturities to reduce the risk that a significant amount of our debt will mature in any single year in the future. Because our long-term secured debt generally requires monthly payments of principal, in addition to the monthly interest payments, the resulting principal amortization also reduces our refinancing risk upon maturity of the debt. As our outstanding debt matures, we may refinance the maturing debt as it comes due or choose to repay it using cash and cash equivalents or our unsecured revolving credit facility. For example, as part of our fourth issuance of senior unsecured public notes in November 2021, we prepaid, without penalty, $85.9 million of STORE Master Funding Series 2013-3 Class A-2 notes. Similar to this prepayment transaction, we may prepay other existing long-term debt in circumstances where we believe it would be economically advantageous to do so.

Unsecured Revolving Credit Facility

Typically, we use our $600 million unsecured revolving credit facility to acquire our real estate properties, until those borrowings are sufficiently large to warrant the economic issuance of long-term fixed-rate debt, the proceeds from which we use to repay the amounts outstanding under our revolving credit facility. As of December 31, 2021, we had $130.0 million outstanding under our unsecured revolving credit facility.

In June 2021, we recast this unsecured revolving credit facility to increase the accordion feature from $800 million to $1.0 billion, which now gives us a maximum borrowing capacity of $1.6 billion. The amended facility matures in June 2025February 2027 and includes two six-month extension options, subject to certain conditions.conditions and the payment of a 0.075% extension fee. Borrowings under the facility require monthly payments of interest at a rate selected by us of either (1) LIBORSOFR plus an adjustment of 0.10%, plus a credit spread ranging from 0.70%1.00% to 1.40%1.45%, or (2) the Base Rate, as defined in the credit agreement, plus a credit spread ranging from 0.00% to

36

Table of Contents

0.40% 0.45%. The credit spread used is based on our credit ratingconsolidated total leverage ratio as defined in the credit agreement. We are also required to pay a facility fee on the total commitment amount ranging from 0.10%0.15% to 0.30%. The amendment reduced based on our consolidated total leverage ratio. Currently, the currently applicable credit spread for LIBOR-basedSOFR-based borrowings by 15 basis points to 0.85%is 1.10% and the facility fee remains atis 0.20%. The amendedOur credit agreement does allowallows for a further reduction in the pricing for LIBOR-based borrowingsof one basis point if certain environmental sustainability metrics are met.

In May 2023, we entered into two interest rate swap agreements with an aggregate notional amount of $325.0 million that effectively convert a portion of the outstanding borrowings on the unsecured revolving credit facility to an all-in fixed rate of 4.524%. In November 2023, we entered into four additional interest rate swap agreements with an aggregate notional amount of $330.0 million which were initially designated to our unsecured revolving credit facility and redesignated to our $592.5 million term loan upon issuance in December 2023 (as further discussed below). Additionally, in December 2023, we entered into one additional interest rate swap agreement with a notional amount of $50.0 million. As of December 31, 2023, three interest rate swaps with an aggregate notional amount of $375.0 million remain designated to our unsecured revolving credit facility and effectively convert the outstanding borrowings to an all-in fixed rate of 4.595%.

Under the terms of the facility, we are subject to various restrictive financial and nonfinancial covenants which, among other things, require us to maintain certain leverage ratios, cash flow and debt service coverage ratios and secured borrowing ratios. Certain of these ratios are based on our pool of unencumbered assets, which aggregated approximately $6.8$9.9 billion at December 31, 2021.2023. The facility is recourse to us, and, as of December 31, 2021,2023, we were in compliance with the financial and nonfinancial covenants under the facility.

18


Senior Unsecured Term Debt

In November 2021, we completedUpon completion of the Merger, our fourth issuance of underwritten public senior unsecured notes issuing an aggregate principal amount of $375.0 million with a coupon rate of 2.70%,were assumed by STORE Capital LLC and as of December 31, 2021,2023, we had an aggregate principal amount of $1.4 billion of underwritten public senior unsecured notes outstanding. These senior unsecured notes bear a weighted average coupon rate of 3.63% and interest on these notes is paid semi-annually. The supplemental indentures governing our public notes contain various restrictive covenants, including limitations on our ability to incur additional secured and unsecured indebtedness. As of December 31, 2021,2023, we were in compliance with these covenants.

Prior to ourthe inaugural issuance of public debt in March 2018, our unsecured long-term debt had been issued through the private placement of notes to institutional investorsinvestors. Upon the completion of the Merger, the unsecured private notes were assumed by STORE Capital LLC and through groupswe were required to offer to repurchase the remaining $300.0 million in aggregate principal amount of lenders who also participatesuch privately placed notes. Following the closing of the repurchase offer period, in our unsecured revolving credit facility;March 2023 we repurchased $185.6 million in aggregate principal amounts of such notes and recognized $4.8 million of accelerated amortization of debt discounts associated with the repurchase which is recorded as loss on extinguishment of debt on the consolidated statements of operations. As of December 31, 2023, we had an aggregate principal amount of $114.4 million of privately placed notes outstanding. The financial covenants of the privately placed notes are similar to those in our current unsecured revolving credit facility, and, as of December 31, 2021,2023, we were in compliance with these covenants. We repaid our remaining $100 million bank

In April 2022, we entered into a term loan agreement under which we borrowed an aggregate $600.0 million of floating-rate, unsecured term loans; the loans consisted of a $400.0 million five-year loan and a $200.0 million seven-year loan. In December 2022, we entered into a term loan agreement with an initial commitment of $100.0 million of unsecured, floating-rate, short-term borrowings and an incremental borrowing feature that allowed us to request up to an additional $100.0 million of term loan borrowings after December 31, 2022.

In connection with the completion of the Merger on February 3, 2023, we repaid all amounts outstanding under, and terminated, both April 2022 term loans; we also paid a $0.7 million prepayment penalty at the time of repayment which is recorded as loss on extinguishment of debt on the consolidated statements of operations. In addition, we repaid $130.0 million of outstanding borrowings on the December 2022 term loan at maturity. Concurrently, on February 3, 2023, we entered into an unsecured credit agreement with a group of lenders which provided for an unsecured, variable-rate term loan with initial borrowings of $600.0 million. In March, October and December 2023, we entered into incremental amendments to this credit agreement which enabled us to borrow an additional $321.1 million of the same class of notes, so that, as of December 31, 2023, we had total term loan borrowings of $921.1 million.

The term loan with respect to this class of notes matures in April 2021 at its maturity2027 and the relatedinterest rate resets daily at Daily Simple SOFR plus an adjustment of 0.10%, plus a spread ranging from 1.10% to 1.70% based on our consolidated total leverage ratio as defined in the credit agreement. As of December 31, 2023, our spread was 1.25%. Our credit agreement allows for a further reduction in the pricing of one basis point if certain environmental sustainability metrics are met.

Our seven existing interest rate swap agreements expired.were redesignated to the new term loan and effectively convert the initial borrowings of $600.0 million on the variable-rate term loan to a fixed rate of 3.88% for the remaining term of the loan. In connection with each amendment, we entered into interest rate swap agreements to convert the incremental borrowings to fixed interest rates. In March 2023, we entered into one interest rate swap agreement with a notional amount of $200.0 million that effectively converts the incremental borrowings to a fixed interest rate of 5.17% for the remaining term of the loan. In November 2023, we entered into two interest rate swap agreements with a notional amount of $46.1 million that effectively converts the incremental borrowings to a fixed rate of 5.63% for the remaining term of the loan. In December 2023, we entered into one interest rate swap agreement with a notional amount of $75.0 million that effectively converts the incremental borrowings to a fixed rate of 5.08% for the remaining term of the loan. As of December 31, 2023, the all-in fixed rate of the term loan is 4.3469%.

In December 2023, we amended our existing credit agreement to increase the capacity for all revolving commitments and term loans under the agreement from $2.5 billion of up to $3.2 billion. In addition, all lenders included in the agreement consented to the incurrence of future incremental term loans under the agreement that mature earlier or that have a weighted average life to maturity shorter than the classes of term loans and revolving commitments outstanding prior to the effectiveness of such amendment.

Upon effectiveness of this amendment, we entered into incremental agreements pursuant to which we borrowed an additional unsecured, variable-rate term loan in the aggregate principal amount of $592.5 million. The term loan with respect to this second class of notes has an initial maturity of July 2026, two 12-month extension options and the interest rate resets daily at Daily Simple SOFR

19


plus an adjustment of 0.10%, plus a spread ranging from 1.20% to 1.80% based on our consolidated total leverage ratio as defined in the credit agreement. As of December 31, 2023, our spread was 1.35%. In connection with the incremental amendment, four of our existing interest rate swap agreements with an aggregate notional amount of $330.0 million were redesignated from the unsecured revolving credit facility to the term loan. Additionally, in December 2023, we entered into two additional interest rate swap agreements with an aggregate notional amount of $262.5 million. As of December 31, 2023, the all-in fixed rate of the term loan is 5.4520%.

In January 2024, we entered into an incremental amendment of the existing credit agreement pursuant to which we borrowed additional amounts with respect to the second class of notes in the aggregate principal amount of $135.0 million for total outstanding term loan borrowings with respect to this second class of notes of $727.5 million. We also entered into one interest rate swap agreement with a notional amount of $135.0 million which effectively converts the total incremental borrowings to a fixed rate of 5.01%.

The aggregate outstanding principal amount of our unsecured senior notes and term loans payable was $1.8$3.1 billion as of December 31, 20212023 and the following is a summary, by year, of the scheduled payments of both principal and interest for these notes (in thousands).


Total Senior Unsecured


Public Notes


Term Loans


Other Unsecured Notes


Term Debt


Principal


Interest


Principal


Interest


Principal


Interest


Principal


Interest


2024


$


$

51,687


$


$

72,381


$

32,400


$

5,435


$

32,400


$

129,503


2025


51,688


73,347


3,879


128,914


2026


51,687


592,500


(a)


59,798


82,000


1,368


674,500


112,853


2027


51,688


921,100


16,460


921,100


68,148


2028


350,000


39,175


350,000


39,175


2029


350,000


23,123


350,000


23,123


2030


350,000


18,600


350,000


18,600


2031


375,000


9,281


375,000


9,281


Total


$

1,425,000


$

296,929


$

1,513,600


$

221,986


$

114,400


$

10,682


$

3,053,000


$

529,597


Total Senior Unsecured

Public Notes

Other Unsecured Notes

Term Debt

Principal

Interest

Principal

Interest

Principal

Interest

2022

$

-

$

51,687

$

75,000

$

18,103

$

75,000

$

69,790

2023

-

51,688

-

14,700

-

66,388

2024

-

51,687

100,000

14,264

100,000

65,951

2025

-

51,688

-

9,460

-

61,148

2026

-

51,687

200,000

3,153

200,000

54,840

2027

-

51,688

-

-

-

51,688

2028

350,000

39,175

-

-

350,000

39,175

2029

350,000

23,123

-

-

350,000

23,123

2030

350,000

18,600

-

-

350,000

18,600

2031

375,000

9,281

-

-

375,000

9,281

Total

$

1,425,000

$

400,304

$

375,000

$

59,680

$

1,800,000

$

459,984

(a)
In January 2024, we borrowed an additional term loan in an aggregate principal amount of $135.0 million for total outstanding borrowings with respect to this second class of notes of $727.5 million.

Non-recourse Secured DebtTerm Loan Facility

On February 3, 2023, in connection with the completion of the Merger, we along with certain of our consolidated special purpose entities entered into a credit agreement which provided for a secured term loan of $2.0 billion.The secured term loan facility was set to mature in February 2025 and included two six-month extension options, subject to certain conditions and the payment of a 0.25% extension fee. The secured term loan facility was secured by a collateral pool of properties owned by our consolidated special purpose entities and was generally non-recourse to us, subject to certain customary limited exceptions. Collateral was released upon repayments made on the secured term loan facility. The secured term loan facility was guaranteed by the Company.

Borrowings outstanding under the secured term loan facility required monthly payments of interest at a floating-rate equal to one-month Term SOFR, plus a spread of 2.75%. Upon repayment of the secured term loan facility, we were subject to an exit fee equal to 1.0% of the amount repaid. In connection with entering into the secured term loan facility, we entered into three interest rate swap agreements with an aggregate notional amount of $750.0 million that effectively converted a portion of the borrowings on the secured facility to a fixed interest rate of 7.60%. As of December 31, 2021,2023, two of the interest rate swaps had matured and the third was cancelled in conjunction with the final repayment of the secured term loan facility.

In March, May, October and November 2023, we paid down the secured term loan facility by $515.0 million, $525.0 million, $46.1 million and $205.8 million, respectively. In December 2023, we paid off the remaining $708.1 million, which constituted repayment in full of all indebtedness, liabilities and other obligations outstanding under, and terminated, the credit agreement. In conjunction with the paydowns, we paid exit fees totaling $20.0 million and recognized accelerated amortization of deferred financing costs and debt discount totaling $10.6 million and $31.8 million, respectively. The exit fees and accelerated amortization are included in the loss on extinguishment of debt on the consolidated statements of operations.

20


Non-recourse Secured Debt

As of December 31, 2023, approximately 33%31% of our real estate investment portfolio served as collateral for outstanding borrowings under our STORE Master Funding debt program. We believe our STORE Master Funding program allows for flexibility not commonly found in non-recourse debt, often making it preferable to traditional debt issued in the commercial mortgage-backed securities market. Under the program, STORE Capital serves as both master and special servicer for the collateral pool, allowing for active portfolio monitoring and prompt issue resolution. In addition, features of the program allowing for the sale or substitution of collateral, provided certain criteria are met, facilitate active portfolio management. Through this debt program, we arrange for bankruptcy remote, special purpose entity subsidiaries to issue multiple series of investment-grade asset-backed net-leaseinvestment‑grade asset‑backed net‑lease mortgage notes, or ABS notes, from

37

Table of Contents

time to time as additional collateral is added to the collateral pool and leverage can be added in incremental note issuances based on the value of the collateral pool.

The ABS notes are generally issued by our wholly owned special purpose entity subsidiaries to institutional investors through the asset backed securities market. These ABS notes are typically issued in two classes, Class A and Class B. At the time of issuance, the Class A notes generally represent approximately 70% of the appraised value of the underlying real estate collateral owned by the issuing subsidiaries and are currently rated AAA or A+AA by S&P Global Ratings. The Series 2018-1 transaction in October 2018 marked our inaugural issuance of AAA rated notes and our Series 2019-1 transaction in November 2019 marked our first issuance of 15-year notes. We believe these two precedent transactions both broadened the market for our STORE Master Funding debt program and gave us access to lower cost secured debt. In late June 2021,May 2023, our consolidated special purpose entities issued the tenth series, Series 2021-1,2023-1 of net-leasenet lease mortgage notes under the STORE Master Funding debt program consisting of $515$528.0 million of 5-year notes issued in fourtwo Class A tranches as summarized below:

Note Class

Rating (a)

Amount
(in millions)


Coupon Rate

Term


Maturity Date

Class A-1

AAA

$

168.5

2.12

%

7 years

June 2028

Class A-2

AAA

168.5

2.96

%

12 years

June 2033

Class A-3

A+

89.0

2.86

%

7 years

June 2028

Class A-4

A+

89.0

3.70

%

12 years

June 2033

Total / Weighted Average Coupon Rate

$

515.0

2.80

%

________________________________________

(a)By S&P Global Ratings.

The Series 2021-1 transaction served to further our belief that the market for the STORE Master Funding program is broadening. In conjunction with this transaction, we prepaid, without penalty, $86.7 million of STORE Master Funding Series 2013-1, Class A-2 notes in May 2021 and $83.3 million of Series 2013-2, Class A-2 notes in July 2021. These two prepaid note classes bore a weighted average interestcoupon rate of 4.98%6.44%. A portion ofIn connection with the net proceeds were also used to paydown balances on our unsecured revolving credit facility.

The Class B notes, which are subordinated to the Class A notes as to principal repayment, represent approximately 5% of the appraised value of the underlying real estate collateral and are currently rated BBB by S&P Global Ratings. As of December 31, 2021, there was an aggregate $190.0issuance, we repaid $525.0 million in aggregate principal amount of Class B notes outstanding. We have historically retained these Class B notes and they are held by one of our bankruptcy remote, special purpose entity subsidiaries. The Class B notes are not reflected in our financial statements because they eliminate in consolidation. Since the Class B notes are considered issued and outstanding, they provide us with additional financial flexibility in that we may sell them to a third party in the future or use them as collateral for short term borrowings as we have done from time to time in the past.

The ABS notes outstanding at December 31, 2021 totaled $2.3 billion in Class A principal amount and were supported by a collateral pool of approximately $3.6 billion representing 1,152 property locations operated by 211 customers. The amount of debt that can be issued in any new series is determined by the structure of the transaction and the aggregate amount of collateral in the pool at the time of issuance. In addition, the issuance of each new series of notes is subject to the satisfaction of several conditions, including that there is no event of default on the existing note series and that the issuance will not result in an event of default on, or the credit rating downgrade of, the existing note series.

A significant portion of our cash flow is generated by the special purpose entities comprising our STORE Master Funding debt program. For the year ended December 31, 2021, excess cash flow, after payment of debt service and servicing and trustee expenses, totaled $137 million on cash collections of $270 million, which represents an overall ratio of cash collections to debt service, or debt service coverage ratio (as defined in the program documents), of greater than 2.0 to 1 on the STORE Master Funding program. If at any time the debt service coverage ratio generated by the collateral pool is less than 1.3 to 1, excess cash flow from the STORE Master Funding entities will be deposited into a reserve account to be used for payments to be made on the net lease mortgage notes, to the extent there is a shortfall. We currently expect to remain above program minimum debt service coverage ratios for the foreseeable future.

38

Table of Contents

To a lesser extent, we also may obtain debt in discrete transactions through other bankruptcy remote, special purpose entity subsidiaries, which debt is solely secured by specific real estate assets and is generally non-recourse to us (subject to certain customary limited exceptions). These discrete borrowings are generally in the form of traditional mortgage notes payable, with principal and interest payments due monthly and balloon payments due at their respective maturity dates, which typically range from seven to ten years from the date of issuance. Our secured borrowings contain various covenants customarily found in mortgage notes, including a limitation on the issuing entity’s ability to incur additional indebtedness on the underlying real estate. Certain of the notes also require the posting of cash reserves with the lender or trustee if specified coverage ratios are not maintained by the special purpose entity or the tenant.secured term loan facility.

The aggregate outstanding principal amount of our secured mortgage notes payable was $2.5$2.7 billion as of December 31, 20212023 and the scheduled maturities, including balloon payments, and scheduled interest payments on our aggregate secured mortgage notes payable are as follows (in thousands):

STORE Master Funding

Non-recourse Net-lease Mortgage Notes

Other Non-recourse Mortgage Notes

Total Non-recourse Mortgage Debt

Principal

Balloons (1)

Interest

Principal

Balloons

Interest

Principal

Balloons

Interest

2022

$

20,279

$

-

$

87,013

$

4,155

$

34,114

$

8,208

$

24,434

$

34,114

$

95,221

2023

20,571

-

86,198

2,994

22,182

6,372

23,565

22,182

92,570

2024

19,852

318,585

79,685

2,479

8,329

5,273

22,331

326,914

84,958

2025

17,482

256,612

63,301

2,555

-

4,997

20,037

256,612

68,298

2026

16,005

279,014

57,297

1,921

53,128

3,807

17,926

332,142

61,104

Thereafter

28,844

1,295,278

184,570

11,364

36,044

8,519

40,208

1,331,322

193,089

Total

$

123,033

$

2,149,489

$

558,064

$

25,468

$

153,797

$

37,176

$

148,501

$

2,303,286

$

595,240

________________________________________

(1)Debt is prepayable, without penalty, 24 or 36 months prior to scheduled maturity.


STORE Master Funding


Non-recourse Net-lease Mortgage Notes


Other Non-recourse Mortgage Notes


Total Non-recourse Mortgage Notes


Principal


Balloons (a)


Interest


Principal


Balloons


Interest


Principal


Balloons


Interest


2024


$

22,315


$

185,469


$

111,299


$

2,231


$

8,329


$

5,058


$

24,546


$

193,798


$

116,357


2025


20,122


256,612


96,966


2,295


4,794


22,417


256,612


101,760


2026


18,719


279,014


91,204


1,649


53,128


3,615


20,368


332,142


94,819


2027


10,917


460,472


76,275


945


2,074


11,862


460,472


78,349


2028


4,604


763,615


38,385


987


2,033


5,591


763,615


40,418


Thereafter


16,770


586,211


116,657


5,327


36,044


3,269


22,097


622,255


119,926


Total


$

93,447


$

2,531,393


$

530,786


$

13,434


$

97,501


$

20,843


$

106,881


$

2,628,894


$

551,629


(a)
Debt is prepayable, without penalty, 24 or 36 months prior to scheduled maturity.

Debt Summary

As of December 31, 2021,2023, our aggregate secured and unsecured long-termterm debt had an outstanding principal balance of $4.3$6.2 billion, a weighted average maturity of 6.84.7 years and a weighted average interest rate of 3.9%4.3%. The following is a summary of the outstanding balance of our borrowings as well as a summary of the portion of our real estate investment portfolio that is either pledged as collateral for these borrowings or is unencumbered as of December 31, 2021:2023:

Gross Investment Portfolio Assets


Special Purpose


Outstanding

Entity

All Other


(In millions)

Borrowings

Subsidiaries

Subsidiaries

Total


STORE Master Funding net-lease mortgage notes payable

$

2,273


$

3,563


$


$

3,563

Other mortgage notes payable


179


327


327

Total non-recourse debt


2,452


3,890


3,890

Unsecured notes and term loans payable

1,800

Unsecured credit facility

130

Total unsecured debt (including revolving credit facility)

1,930

Unencumbered real estate assets


5,521


1,338


6,859

Total debt

$

4,382

$

9,411

$

1,338

$

10,749


Gross Investment Portfolio Assets


Special Purpose


Outstanding


Entity


All Other


(In millions)


Borrowings


Subsidiaries


Subsidiaries


Total


STORE Master Funding net-lease mortgage notes payable


$

2,625


$

4,654


$


$

4,654


Other mortgage notes payable


111


251


251


Total non-recourse secured debt


2,736


4,905


4,905


Unsecured notes and term loans payable


3,053


Unsecured revolving credit facility


375


Total unsecured debt (including revolving credit facility)


3,428


Unencumbered real estate assets


8,569


1,328


9,897


Total


$

6,164


$

13,474


$

1,328


$

14,802


21


Our decision to use either senior unsecured term debt, STORE Master Funding or other non-recoursenon‑recourse traditional mortgage loan borrowings depends on our view of the most strategic blend of unsecured versus secured debt that is needed to maintain our targeted level of overall corporate leverage as well as on borrowing costs, debt terms, debt flexibility and the tenant and industry diversification levels of our real estate assets. As we continue to acquireOur acquisition of real estate we expect to balance the overall degree of leverage on our portfolio by growing our pool of portfolio assets that are unencumbered. Our growing pool of unencumbered assets will increase our financial flexibility by providing us with additional assets that can support senior unsecured financing or that can serve as substitute collateral for existing debt. Should market factors, which are beyond our control, adversely impact our access to these debt sources at economically feasible rates, our ability to grow through additional real estate acquisitions will be limited to any undistributed amounts available from our operations and anyequity contributions from our members.

For additional equity capital raises.

39

Table of Contentsdetails and terms regarding these debt instruments, see Note 4 to the December 31, 2023 consolidated financial statements.

Equity

We accessEquity

STORE Capital Corporation historically accessed the equity markets in various ways. As part of these efforts, we haveit established “at the market” equity distribution programs, or ATM programs, pursuant to which, from time to time, we mayit could offer and sell registered shares of our common stock through a group of banks acting as our sales agents. Most recently, in November 2020, weSTORE Capital Corporation established a $900$900.0 million ATM program (the 2020“2020 ATM Program)Program”).

The following tables outline For the period from January 1, 2023 to February 2, 2023, there were no common stock issuances under ourthe 2020 ATM Program. The 2020 ATM Program (in millions exceptwas terminated upon the closing of the Merger.

Pursuant to the terms and conditions of the Merger Agreement, at or immediately prior to the effective time of the Merger, each share andof our common stock, par value $0.01 per share, information):other than shares held by STORE Capital, the Parent Parties or any of their respective wholly-owned subsidiaries, issued and outstanding immediately prior to the merger effective time, were automatically cancelled and converted into the right to receive an amount in cash equal to $32.25 per share, without interest.

Year Ended December 31, 2021

ATM Program

Shares Sold

Weighted Average Price per Share

Gross Proceeds


Sales Agents' Commissions


Other Offering Expenses


Net Proceeds

$900 million 2020 ATM Program

7,322,471

$

33.84

$

247.8

$

(3.7)

$

(0.4)

$

243.7

Inception of Program Through December 31, 2021

ATM Program

Shares Sold

Weighted Average Price per Share

Gross Proceeds


Sales Agents' Commissions


Other Offering Expenses


Net Proceeds

$900 million 2020 ATM Program

10,841,531

$

33.28

$

360.8

$

(5.4)

$

(0.6)

$

354.8

In connection with the Merger, we issued 1,000 common units to our common members for an aggregate cash amount of $8.3 billion. Prior to the Merger, 125 Series A Preferred Units were issued to our preferred members for an aggregate cash amount of $125,000. In accordance with our operating agreement, our common members receive distributions monthly and are subject to capital calls. Our preferred members receive distributions bi-annually and are not subject to capital calls.

Cash Flows

Substantially all our cash from operations is generated by our investment portfolio. As shown in the following table, net cash provided by operating activities for the Combined Period was $30.0 million less than the same period in 2021 increased2022. The decrease is primarily driven by $151.8a $118.0 million over 2020, primarily as a result of the increase in the size of our real estate investment portfolio, which generatedcash paid for interest in 2023 as compared to 2022, partially offset by additional rental revenue and interest income as well asgenerated by the impactincrease in size of our real estate portfolio. During the higher level of rent deferral arrangements granted to tenants in 2020 versus 2021. OurCombined Period, our investments in real estate, loans and financing receivables were primarily funded with a combination of borrowings on our revolving credit facility and capital contributions from our members. The acquisition of STORE Capital was primarily funded with equity from our members and the proceeds of the secured term loan facility. investment activity during 2021 were $434.4 million more than 2020. We intentionally reduced our investment activitythe same period in early 2020 due to the volatility in the capital markets stemming from the COVID-19 pandemic. During 2021, our investment activity2022 was primarily funded with a combination of cash from operations, borrowings on our revolving credit facility, net proceeds received from the sale of real estate properties,our term loan borrowings, proceeds from the issuance of stock proceeds from the issuance of long-term debt in June and November of 2021 and borrowings on our revolving credit facility. Investment activity during 2020 was primarily funded with a combination of cash from operations, proceeds from the issuance of stock, proceeds from the issuance of long-term debt and proceeds from the sale of real estate properties. Net cash provided by

Our financing activities was lowerprovided $10.9 billion of net cash during 2021the Combined Period as compared to 2020.$648.4 million during the same period in 2022. Financing activities in 2021 include2023 included the proceeds fromaggregate $1.5 billion of bank term loans we entered into throughout the issuanceyear and the $528.0 million of the Series 2021-1 notes under ourSTORE Master Funding debt program and the completion of our fourth public issuance of senior unsecuredSeries 2023-1 notes issued in May 2023 offset by $185.6

22


million of aggregate debt repayments on our unsecured privately placed notes. Equity raises from our members totaled $9.3 billion and cash distributions totaled $510.0 million for the repayment of our last $100 million bank term loan and three tranches of Master Funding notes in May, July and November of 2021;period from February 3, 2023 through December 31, 2023.


Successor


Predecessor


(In thousands)


Period from
February 3, 2023
through
December 31, 2023


Period from
January 1, 2023
through
February 2, 2023


Year Ended
December 31, 2022


Increase
(Decrease)(a)


Net cash provided by operating activities


$

585,027


$

59,380


$

674,415


$

(30,008

)

Net cash used in investing activities


(11,178,772

)


(129,025

)


(1,353,096

)


(9,954,701

)

Net cash provided by financing activities


10,843,972


67,988


648,436


10,263,524


Net change in cash, cash equivalents and restricted cash


$

250,227


$

(1,657

)


$

(30,245

)


$

278,815


(a)
Change represents the increased level of long-term debt issuance activities in 2021 were more than offset by higher stock issuance activities in 2020. We paid dividendsCombined Period compared to our stockholders totaling $398.0 million and $353.2 million during 2021 and 2020, respectively; we increased our quarterly dividend in the third quarter of 2021 by 6.9% to an annualized $1.54 per common share.

Year Ended December 31,

Increase

(In thousands)

2021

2020

(Decrease)

Net cash provided by operating activities


$

583,373

$

431,586

$

151,787


Net cash used in investing activities


(1,129,819)


(811,857)


(317,962)

Net cash provided by financing activities


439,919


445,466

(5,547)

Net (decrease) increase in cash, cash equivalents and restricted cash

$

(106,527)

$

65,195

$

(171,722)

year ended December 31, 2022.

As of December 31, 2021,2023, we had liquidity of $64.0$239.5 million on our balance sheet. Management believes that our current cash balance, the $470.0$378.9 million of immediate borrowing capacity available as of December 31, 2023 on our unsecured revolving credit facility, theand cash generated by our operations as well as the $1.0 billion of liquidity available to us under the accordion feature of our recently amended credit facility, is more than sufficient to fund our operations for the foreseeable futurenext twelve months and beyond and allow us to acquire the real estate for which we currently have made commitments. In order to continue to grow our real

40

Table of Contents

estate portfolio in the future, beyond the excess cash generated by our operations and our ability to borrow, we would expect to raise additional equity capital through the sale offrom our common stock.members.

Recently Issued Accounting Pronouncements

See Note 2 to the December 31, 20212023 consolidated financial statements.

Critical Accounting Policies and Estimates

The preparation of financial statements in conformity with U.S. generally accepted accounting principles, or GAAP, requires our management to use judgment in the application of accounting policies, including making estimates and assumptions. We base estimates on the best information available to us at the time, on our experience and on various other assumptions believed to be reasonable under the circumstances. These estimates affect the reported amounts of assets and liabilities, disclosure of contingent assets and liabilities at the date of the financial statements and the reported amounts of revenues and expenses during the reporting periods. If our judgment or interpretation of the facts and circumstances relating to various transactions or other matters had been different, it is possible that different accounting would have been applied, resulting in a different presentation of our consolidated financial statements. From time to time, we reevaluate our estimates and assumptions. In the event estimates or assumptions prove to be different from actual results, adjustments are made in subsequent periods to reflect more current estimates and assumptions about matters that are inherently uncertain.

Our discussion and analysis of our historical financial condition and results of operations is based upon our consolidated financial statements, which are prepared in accordance with U.S. generally accepted accounting principles, or GAAP. The preparation of financial statements in conformity with GAAP requires management to make estimates and assumptions that affect the reported amounts of assets and liabilities, the disclosure of contingent assets and liabilities and the reported amounts of revenues and expenses during the reporting period. Although management believes its estimates are reasonable, actual results could differ materially from those estimates. The accounting policies discussed below are considered critical because changes to certain judgments and assumptions inherent in these policies could affect the financial statements. For more information on our accounting policies, please refer to the notes to our consolidated financial statements.

Accounting for Real Estate Investments

Classification and Cost

We record the acquisition of real estate properties at cost, including acquisition and closing costs. We allocate the cost of real estate properties to the tangible and intangible assets and liabilities acquired based on their estimated relative fair values. Intangible assets and liabilities acquired may include the value of existing in-place leases, above-market or below-market lease value of in-place leases and ground lease-related intangibles, as applicable. Management uses multiple sources to estimate fair value, including

23


independent appraisals and information obtained about each property as a result of its pre-acquisitionpre‑acquisition due diligence and its marketing and leasing activities. Certain of our lease contracts allow our tenantscustomers the option, at their election, to purchase the leased property from us at a specified time or times (generally at the greater of the then-fairthen‑fair market value or our cost, as defined in the lease contracts). Subsequent to the adoption of Accounting Standards Update (ASU)(“ASU”) 2016-02, Leases (Topic 842)(ASC Topic 842)842”) on January 1, 2019, for real estate assets acquired through a sale-leaseback transaction and subject to a lease contract which contains a purchase option, we will account for such an acquisition as a financing arrangement and record the investment in loans and financing receivables on the consolidated balance sheet.

In-placeIn‑place lease intangibles are valued based on management’s estimates of lost rent and carrying costs during the time it would take to locate a tenant if the property were vacant, considering current market conditions and costs to execute similar leases. In estimating lost rent and carrying costs, management considers market rents, real estate taxes, insurance, costs to execute similar leases (including leasing commissions) and other related costs.

The fair value of any above-marketabove‑market or below-marketbelow‑market lease is estimated based on the present value of the difference between the contractual amounts to be paid pursuant to the in-placein‑place lease and management’s estimate of current market lease rates for the property, measured over a period equal to the remaining term of the lease.

Impairment

We review our real estate investments and related lease intangibles periodically for impairment whenever events or changes in circumstances indicate that the carrying amount of an asset may not be recoverable through operations. Such events or changes in circumstances may include an expectation to sell certain assets in accordance with our long-term strategic plans. Management considers factors such as expected future undiscounted cash flows, capitalization and discount rates, terminal value, tenant improvements, market trends (such as the effects of leasing demand and competition) and other factors including bona fide purchase offers received from third parties in making this assessment. If an asset is determined to be impaired, the impairment is calculated as the amount by which the carrying value of the asset exceeds its

41

Table of Contents

estimated fair value. Estimating future cash flows is highly subjective and such estimates could differ materially from actual results.

Accounting for the Merger

The Merger was accounted for using the asset acquisition method of accounting in accordance with the Financial Accounting Standards Board’s (“FASB”) Accounting Standards Codification (“ASC”) Topic 805, Business Combinations (“ASC Topic 805”), which requires that the cost of an acquisition be allocated on a relative fair value basis to the assets purchased and the liabilities assumed. The estimated fair values of assets acquired and liabilities assumed were primarily based on information that was available as of the Closing Date. The methodology used to estimate the fair values to apply purchase accounting includes significant and highly subjective assumptions including capitalization rates, market rents, expected future cash flows and discount rates for real estate investment valuation and market interest rates for long-term debt valuation.

24


Results of Operations

Overview

As of December 31, 2021,2023, our real estate investment portfolio had grown to approximately $10.7$14.7 billion, consisting of investments in 2,8663,206 property locations in 49 states, operated by more than 550 customers in various industries.states. Approximately 94%93% of the real estate investment portfolio represents commercial real estate properties subject to long-termlong‑term leases, approximately 6%7% represents mortgage loan and financing receivables on commercial real estate properties and a nominal amount represents loans receivable secured by our tenants’customers’ other assets.

Year Ended December 31, 2021Combined Period 2023 Compared to Year Ended December 31, 20202022

Year Ended

December 31,

Increase


Successor


Predecessor


(In thousands)

2021


2020


(Decrease)


Period from
February 3, 2023
through
December 31, 2023


Period from
January 1, 2023
through
February 2, 2023


Year Ended
December 31, 2022


Increase
(Decrease)


Total revenues

$

782,664


$

694,268


$

88,396


$

951,900


$

81,184


$

910,172


$

122,912


Expenses:


Interest


170,974


169,706


1,268


362,605


19,080


189,549


192,136


Property costs


18,244


22,025


(3,781)


16,873


1,348


14,696


3,525


General and administrative


84,097


49,685


34,412


55,035


5,679


62,555


(1,841

)

Merger-related


895


12,248


(11,353

)

Depreciation and amortization


265,813


242,925


22,888


533,637


27,789


308,084


253,342


Provisions for impairment

24,979

23,003

1,976


25,265


16,428


8,837


Total expenses


564,107


507,344


56,763


993,415


54,791


603,560


444,646


Other income:

Net gain on dispositions of real estate


46,655


22,774


23,881

Income from non-real estate, equity method investment

3,949

3,500

449

Income before income taxes

269,161

213,198

55,963

Other (loss) income:


(Loss) gain on dispositions of real estate


(6,680

)


97


19,224


(25,807

)

Loss on extinguishment of debt


(67,897

)


(67,897

)

Income from non-real estate,
equity method investments


2,949


(2,949

)

(Loss) income before income taxes


(116,092

)


26,490


328,785


(418,387

)

Income tax expense


813


584


229


22,567


703


884


22,386


Net income

$

268,348

$

212,614

$

55,734

Net (loss) income


(138,659

)


25,787


327,901


(440,773

)

Less: Net loss attributable to noncontrolling interests


(60

)


(60

)

Net (loss) income attributable to controlling interests


$

(138,599

)


$

25,787


$

327,901


$

(440,713

)

Revenues

The increase in revenues yearperiod over yearperiod was driven primarily by the growth in the size of our real estate investment portfolio, which generated additional rental revenues and interest income. Our real estate investment portfolio grew from 3,084 properties as of December 31, 2022 to 3,206 properties at December 31, 2023 and by approximately $9.6 billion$724.9 million in gross investment amount, representing 2,634 properties atexcluding fair value adjustments resulting from the end of 2020Merger, to approximately $10.7 billion in gross investment amount representing 2,866 properties at December 31, 2021. The weighted averagetotal real estate investment amounts outstanding during the years were approximately $10.0 billion in 2021 and $9.2 billion in 2020.investments of $14.7 billion. Our real estate investments were made throughout the yearsperiods presented and were not all outstanding for the entire period; accordingly, a portion of the increase in revenues between yearsperiods is related to recognizing arevenue for the full year of revenueperiods in 20212023 on acquisitions that were made during 2020.2022. Similarly, the full revenue impact of acquisitions made during 20212023 will not be seen until 2022.2024. A smaller component of the increase in revenues between yearsperiods is related to rent escalations recognized on our lease contracts; over time, these rent increases can provide a strong source of revenue growth. Additionally, during 2021, primarilythe Combined Period, amortization from lease intangibles recorded as a result of the Merger represented a net increase in connection withrental revenue of $5.5 million.

During the sale of certain properties,Combined Period and 2022, we collected $1.8$0.5 million and $5.1 million, respectively, in lease termination fee income, primarily related to certain property sales, which isare included in other income. Similarly, otherOther income in 2020for the Combined Period also includes $0.6$3.6 million of lease termination feeinterest income associated with property sales and $2.5 million of other lease related income.generated on bank cash holdings.

As previously noted, we worked directly with certain of our tenants during the COVID-19 pandemic to help them continue to meet their rent payment obligations to us, including providing short-term rent deferral arrangements, which allowed tenants that were highly and adversely impacted by the COVID-19 pandemic to defer the payment of their rent on a short-term basis. As restrictions have been lifted and impacted tenants have increased their business activities, our monthly rent and interest collections have increased and deferrals have significantly decreased. During the years ended December 31, 2021 and 2020, we recognized net revenue aggregating approximately $8.3 million and $57.1 million,

42

Table of Contents

respectively, related to deferral arrangements. We collected $33.4 million and $9.9 million of deferred revenue-related receivables during the years ended December 31, 2021 and 2020, respectively. As a result of the rent collections we received during 2021 on our rent deferral arrangements, part of the revenue increase between years is due to release of collection reserves in 2021 versus the establishment of reserves in 2020. We expect that the majority of our remaining receivables related to these rent deferral arrangements will be collected before the end of 2022.

The majority of our investments are made through sale-leaseback transactions in which we acquire the real estate from the owner-operators and then simultaneously lease the real estate back to them through long-term leases based on the tenant’s business needs. The initial rental or capitalization rates we achieve on sale-leaseback transactions, calculated as the initial annualized base rent divided by the purchase price of the properties, vary from transaction to transaction based on many factors, such as the terms of the

25


lease, the property type including the property’s real estate fundamentals and the market rents in the area on the various types of properties we target across the United States. There are also online commercial real estate auction marketplaces for real estate transactions; properties acquired through these online marketplaces are often subject to existing leases and offered by third party sellers. In general, because we provide tailored customer lease solutions in sale-leaseback transactions, our lease rates historically have been higher and subject to less short-term market influences than what we have seen in the auction marketplace as a whole. In addition, since our real estate lease contracts are a substitute for both borrowings and equity that our customers would otherwise have to commit to their real estate locations, we believe there is a relationship between lease rates and market interest rates and that lease rates are also influenced by overall capital availability. Due to the market disruption occurring as a result of the COVID-19 pandemic, the weighted average lease rate attained on our new investments during 2020 was 8.1% as compared to 7.5% during 2021. We are seeing some capitalization rate compression across the industry and we currently estimate that the weighted average lease rates we are able to attain may continue to compress as we move into 2022.

Interest Expense

We fund the growth in our real estate investment portfolio primarily with excess cash flow from our operations after dividends and principal payments on debt,members’ contributions, net proceeds from periodic sales of real estate and net proceeds from equity issuances and proceeds from issuances of long-debt.term fixed-rate debt. We typically use our unsecured revolving credit facility to temporarily finance the properties we acquire.

The following table summarizes our interest expense.

For the Year Ended


December 31,


(Dollars in thousands)

2021


2020


Interest expense - credit facility

$

607


$

4,419


Interest expense - credit facility fees

1,217

1,220

Interest expense - long-term debt (secured and unsecured)


159,853


155,991

Capitalized interest

(823)

(751)

Amortization of deferred financing costs and other


10,120


8,827

Total interest expense

$

170,974

$

169,706

Credit facility:

Average debt outstanding

$

56,101

$

250,342

Average interest rate during the period (excluding facility fees)


1.1

%  


1.8

%  

Long-term debt (secured and unsecured):

Average debt outstanding

$

3,873,226

$

3,639,735

Average interest rate during the period


4.1

%  


4.3

%  

The increase in average outstanding long-term debt was the primary driverexpense for the increase inperiods presented:


Successor


Predecessor


(Dollars in thousands)


Period from
February 3, 2023
through
December 31, 2023


Period from
January 1, 2023
through
February 2, 2023


Year Ended
December 31, 2022


Interest expense - credit facility


$

18,640


$

2,697


$

6,218


Interest expense - credit facility fees


1,190


110


1,217


Interest expense - secured and unsecured debt


262,840


15,799


174,911


Capitalized interest


(2,895

)


(240

)


(2,306

)

Amortization of debt discounts, deferred
  financing costs and other


82,830


714


9,509


Total interest expense


$

362,605


$

19,080


$

189,549


Credit facility:


Average debt outstanding


$

390,816


$

559,848


$

196,627


Average interest rate during the period
   (excluding facility fees)


5.2

%


5.3

%


3.2

%


Secured and unsecured debt:


Average debt outstanding


$

6,073,933


$

4,670,146


$

4,526,992


Average interest rate during the period


4.7

%


3.7

%


3.9

%

Interest expense associated with our secured and unsecured debt increased from 2022 as a result of the increased debt outstanding and increased interest expense on long-term debt. Long-termrates. During the Combined Period, we had average secured and unsecured debt added during 2021 primarily consistedoutstanding of $515.0 million of STORE Master Funding Series 2021-1 notes, which bear$5.9 billion at a weighted average interest rate of 2.80%, issued in late June 2021 and $375 million of 2.70% senior unsecured notes issued in November 2021. Long-term debt repaid in full, without penalties, during 2021 included our remaining $100 million bank term loan, $86.7 million of STORE Master Funding Series 2013-1 Class A-2 notes in May 2021; $83.3 million of Series 2013-2, Class A-2 notes in July 2021, and $85.9 million of STORE Master Funding

43

Table of Contents

Series 2013-3 Class A-2 notes in November 2021. The three series of STORE Master Funding notes that were repaid were scheduled4.7% as compared to mature in 2023 and bore a weighted average interest rate of 5.06%. As a result of STORE Master Funding debt prepayments in both 2021 and 2020, we recognized $1.7 million and $0.4 million, respectively, in accelerated amortization of deferred financing costs. As of December 31, 2021, we had $4.3$4.5 billion of long-term debt outstanding withat a weighted average interest rate of 3.9%.

We typically use our revolving credit during the comparable period in 2022. The primary driver of the increases in 2023 is the addition of $2.0 billion of secured, floating rate term loan facility on a short-term, temporary basis to acquire real estate properties until those borrowings are sufficiently large to warrant the economic issuance of long-term fixed-rate debt, the proceeds ofin February 2023, which we generally use to paypaid down throughout 2023 and paid off in full in December 2023. The weighted average interest rate of the amountssecured term loan facility for the period outstanding under our revolving credit facility. in 2023 was 7.68%. Additionally, in May 2023, we issued $528.0 million of STORE Master Funding Series 2023-1 notes at a weighted average coupon rate of 6.44%.

Interest expense associated with our revolving credit facility decreasedincreased from 2020 when we had2022 as a result of the full amountincreased interest rate and increased level of average borrowings outstanding on the revolver during a large portion of2023. During the year. In June 2021,Combined Period, we amended ourhad average borrowings outstanding on the revolving credit agreement which includedfacility of $406.1 million at a reductionweighted average interest rate of 15 basis points on5.2% as compared to $196.6 million average borrowings outstanding at a weighted average interest rate of 3.2% during the LIBOR-based borrowings made on the facility.comparable period in 2022. As of December 31, 2021,2023, we had $130.0$375.0 million of borrowings outstanding under our revolving credit facility.

Amortization of deferred financing costs and other during the Combined Period increased relative to the comparable period in 2022 due to the amortization of deferred financing costs and debt discounts associated with new debt issuances and amortization of debt discounts recorded as a result of purchase accounting.

26


Property Costs

Approximately 99%98% of our leases are triple net, meaning that our tenants are generally responsible for the property-level operating costs such as taxes, insurance and maintenance. Accordingly, we generally do not expect to incur property-level operating costs or capital expenditures, except during any period when one or more of our properties is no longer under lease or when our tenant is unable to meet their lease obligations. Our need to expend capital on our properties is further reduced due to the fact that some of our tenants will periodically refresh the property at their own expense to meet their business needs or in connection with franchisor requirements. As of December 31, 2021,2023, we owned 1524 properties that were vacant and not subject to a lease and the lease contracts related to just 1526 properties we own are due to expire during 2022.2024. We expect to incur some property costs related to the vacant properties until such time as those properties are either leased or sold. The amount of property costs can vary quarter to quarter based on the timing of property vacancies and the level of underperforming properties. Property costs were higher in 2020 as compared to 2021 primarily as a result of a higher amount of property tax accruals made during the COVID-19 pandemic for tenants not expected to pay those obligations.

As of December 31, 2021,2023, we had entered into operating ground leases as part of several real estate investment transactions. The ground lease payments made by our tenants directly to the ground lessors are presented on a gross basis in the condensed consolidated statementstatements of income,operations, both as rental revenues and as property costs. For the few lease contracts where we collect property taxes from our tenants and remit those taxes to governmental authorities, we reflect those payments on a gross basis as both rental revenue and as property costs.

44

Table of Contents

The following is a summary of property costs (in thousands):

Year Ended December 31,


2021

2020


Property-level operating costs (a)

$

11,820


$

16,640

Ground lease-related intangibles amortization expense

469

469

Operating ground lease payments made by STORE Capital

427

263

Operating ground lease payments made by STORE Capital tenants

2,651

2,097

Operating ground lease straight-line rent expense

237

48

Property taxes payable from tenant impounds


2,640


2,508

Total property costs

$

18,244

$

22,025


Successor


Predecessor


Period from
February 3, 2023
through
December 31, 2023


Period from
January 1, 2023
through
February 2, 2023


Year Ended
December 31, 2022


Property-level operating costs (a)


$

10,301


$

784


$

7,826


Ground lease-related intangibles amortization expense


39


469


Operating ground lease payments made by STORE Capital


384


33


367


Operating ground lease payments made by STORE Capital tenants


2,444


185


2,607


Operating ground lease straight-line rent expense


402


55


280


Property taxes payable from tenant impounds


3,342


252


3,147


Total property costs


$

16,873


$

1,348


$

14,696


(a)
Property-level operating costs primarily include those expenses associated with vacant or nonperforming properties, property management costs for the few properties that have specific landlord obligations and the cost of performing property site inspections from time to time.
(a)

Property-level operating costs primarily include those expenses associated with vacant or nonperforming properties, property management costs for the few properties that have specific landlord obligations and the cost of performing property site inspections from time to time.

General and Administrative Expenses

General and administrative expenses include compensation and benefits; professional fees such as portfolio servicing, legal, accounting and rating agency fees; and general office expenses such as insurance, office rent and travel costs. General and administrative costs totaled $84.1$60.7 million in 2021 asfor the Combined Period compared to $49.7$62.6 million in 2020. Expenses for 2021 included approximately $6.9 million of severance costs related to the departure of our former Executive Chairman and approximately $890,000 of transition costs related to the appointment of our Chief Financial Officer; during 2020, expenses included $2.0 million of executive severance costs. Expenses also included amounts related to staff additions; our employee base grew from 106 employees atyear ended December 31, 2020 to 117 employees as of December 31, 2021.2022.

General and administrative expenses for 2020 were less than expected due to the reversal, in the first quarter at the onset of the COVID-19 pandemic, of $6.7 million of previously recognized stock-based compensation expense. The reversal derecognized all prior period expense recorded for certain performance-based restricted stock unit awards (RSUs) granted in 2018 and 2019 that were not expected to vest as the achievement of the performance metrics related to the compound annual growth rate of AFFO per share was deemed not probable at that point in time and previously recognized expense was required to be reversed or derecognized.

General and administrative expenses for 2021 included a cumulative catch-up adjustment of $10.1 million of noncash stock-based compensation expense recognized in the first quarter related to 1) the reinstatement of expense derecognized in the first quarter of 2020, plus 2) the expense related to 2020 and the first quarter of 2021 as a portion of the related performance-based RSUs granted in 2018 and 2019 were now expected to vest. In addition, during the fourth quarter of 2021, we recognized $3.2 million of accelerated amortization of certain stock-based compensation awards associated with executive severance and retirement arrangements.

Excluding noncash, stock-based compensation expense and executive severance and transition costs from both periods, general and administrative expenses was 0.44% of average portfolio investment assets in 2021 as compared to 0.47% in 2020. We expect that general and administrative expenses will continue to rise in some measure as our real estate investment portfolio grows. Certain expenses, such as property related insurance costs and the costs of servicing the properties and loans comprising our real estate portfolio, increase in direct proportion to the increase in the size of the portfolio. However, general and administrative expenses as a percentage of the portfolio have decreased over time due to efficiencies and economies of scale.

Merger-related Expenses

Merger-related expenses include legal fees, investment banking fees and other costs incurred as a result of the Merger. For the period from January 1, 2023 through February 2, 2023 merger related expenses totaled $0.9 million. Merger-related expenses totaled $12.2 million in 2022.

Depreciation and Amortization Expense

Depreciation and amortization expense, which increases in proportion to the increase in the size of our real estate portfolio, rose from $242.9$308.1 million in 20202022 to $265.8$561.4 million for the Combined Period. Depreciation and amortization also increased as a result of

27


both the increase in 2021.the value of our real estate portfolio and shorter average remaining useful lives applied to the real estate portfolio as a result the Merger.

45

Table of Contents

Provisions for Impairment

During 2021,the Combined Period, we recognized provisions for impairment aggregating $25.0 million; of this amount, $21.8$17.6 million representedin provisions for the impairment of real estate and $3.2$7.7 million representedin net provisions for credit losses related to our loans and financing receivables. During 2020,The provisions for credit losses recorded in the Combined Period include $4.4 million recorded as a result of the Merger as required by ASU 2016-13, Financial Instruments — Credit Losses: Measurement of Credit Losses on Financial Instruments and is partially offset bya reduction of $2.1 million associated with the sale of certain loans and financing receivables. For the year ended December 31, 2022, we recognized an aggregate $23.0$16.0 million ofin provisions for the impairment consisting of $22.0 million of impairments of real estate and $1.0had a reduction of $0.3 million ofin provisions for credit losses.losses related to our loans and financing receivables.

Net(Loss) Gain on Dispositions of Real Estate

As part of our ongoing active portfolio management process, we sell properties from time to time in order to enhance the diversity and quality of our real estate portfolio and to take advantage of opportunities to recycle capital. During 2021,the Combined Period, we recognized a $46.7$6.6 million aggregate net loss on the sale of 25 properties and 23 loans and financing receivables. In comparison, during 2022, we recognized a $19.2 million aggregate net gain on the sale of 103 properties. In comparison, during 2020, we recognized a $22.8 million aggregate net gain on the sale of 7760 properties. The net proceeds from the dispositions of real estate during 20212023 aggregated $356$74.5 million as compared to an aggregate original investment amount of $369$79.9 million. For properties sold during 2020,2022, net proceeds aggregated $215$196 million as compared to an aggregate original investment amount of $236$212 million. As noted earlier, during 2021During 2023 and 2020,2022, we also collected $1.8$4.4 million and $0.6$4.2 million, respectively, of early lease termination payments in connection with certain property sales.

Loss on Extinguishment of Debt

During the Combined Period, we recognized loss on the extinguishment of debt of $67.9 million, associated with the prepayments made on certain debt during the period. Loss on extinguishment of debt includes $20.0 million of exit fees, $31.8 million in accelerated amortization of debt discount and $10.6 million in accelerated amortization of deferred financing costs related to the repayment of the secured term loan facility, $4.8 million of accelerated amortization of debt discounts associated with the repurchase of privately placed notes and a $0.7 million prepayment penalty associated with the repayment of the April 2022 term loans. No such losses were recorded during the comparable period in 2022.

Net (Loss) Income

For the Combined Period, our net loss was $112.8 million as compared to net income of $327.9 million for the year ended December 31, 2021, our net income was $268.3 million reflecting an increase from $212.6 million in 2020.2022. The change in net (loss) income for the Combined Period is primarily comprisedthe result of a net increaseincreases in depreciation and amortization, interest expense, and loss on extinguishment of debt partially offset by increases resulting from the growth in our real estate investment portfolio, which generated additional rental revenues and interest income, and an increased net gain on dispositions of real estate offset by increases in general and administrative and depreciation and amortization expenses as noted above.

Non-GAAP Measures

Our reported results are presented in accordance with U.S. generally accepted accounting principles, or GAAP. We also disclose Funds from Operations, or FFO, and Adjusted Funds from Operations, or AFFO, both of which are non-GAAP measures. We believe these two non-GAAP financial measures are useful to investors because they are widely accepted industry measures used by analysts and investors to compare the operating performance of REITs. FFO and AFFO do not represent cash generated from operating activities and are not necessarily indicative of cash available to fund cash requirements; accordingly, they should not be considered alternatives to net income as a performance measure or to cash flows from operations as reported on a statement of cash flows as a liquidity measure and should be considered in addition to, and not in lieu of, GAAP financial measures.

We compute FFO in accordance with the definition adopted by the Board of Governors of the National Association of Real Estate Investment Trusts, or NAREIT. NAREIT defines FFO as GAAP net income, excluding gains (or losses) from extraordinary items and sales of depreciable property, real estate impairment losses, and depreciation and amortization expense from real estate assets, including the pro rata share of such adjustments of unconsolidated subsidiaries.

To derive AFFO, we modify the NAREIT computation of FFO to include other adjustments to GAAP net income related to certain revenues and expenses that have no impact on our long-term operating performance, such as straight-line rents, amortization of deferred financing costs and stock-based compensation. In addition, in deriving AFFO, we exclude certain other costs not related to our ongoing operations, such as the amortization of lease-related intangibles and executive severance and transition costs.

FFO is used by management, investors and analysts to facilitate meaningful comparisons of operating performance between periods and among our peers primarily because it excludes the effect of real estate depreciation and amortization and net gains (or losses) on sales, which are based on historical costs and implicitly assume that the value of real estate diminishes predictably over time, rather than fluctuating based on existing market conditions. Management believes that AFFO provides more useful information to investors and analysts because it modifies FFO to exclude certain additional revenues and expenses such as straight-line rents, including construction period rent deferrals, and the amortization of deferred financing costs, stock-based compensation, lease-related intangibles and executive severance and

46

Table of Contents

transition costs, as such items have no impact on long-term operating performance. As a result, we believe AFFO to be a more meaningful measurement of ongoing performance that allows for greater performance comparability. Therefore, we disclose both FFO and AFFO and reconcile them to the most appropriate GAAP performance metric, which is net income. STORE Capital’s FFO and AFFO may not be comparable to similarly titled measures employed by other companies.

The following is a reconciliation of net income (which we believe is the most comparable GAAP measure) to FFO and AFFO.

Year Ended December 31,

(In thousands)


2021


2020


2019


Net Income


$

268,348


$

212,614


$

284,975


Depreciation and amortization of real estate assets

265,561

242,636

221,665

Provision for impairment of real estate

21,800

21,978

18,751

Net gain on dispositions of real estate


(46,655)


(22,774)


(84,142)

Funds from Operations (a)


509,054


454,454


441,249

Adjustments:

Straight-line rental revenue:

Fixed rent escalations accrued


(8,432)


(8,087)


(6,021)

Construction period rent deferrals

3,635

1,940

1,604

Amortization of:

Equity-based compensation (b)


32,228


4,665


11,703

Deferred financing costs and other (c)

10,120

8,827

9,689

Lease-related intangibles and costs


3,037


3,034


2,856

Provision for loan losses

3,179

1,025

Lease termination fees

(1,785)

(602)

(4,096)

Capitalized interest

(822)

(751)

(1,600)

Executive severance and transition costs (d)

7,780

1,980

1,956

Income from non-real estate, equity method investment

(3,949)

(3,500)

Loss on defeasance/extinguishment of debt

735

Adjusted Funds from Operations (a)

$

554,045

$

462,985

$

458,075

28


(a)FFO and AFFO for the years ended December 31, 2021 and 2020, include approximately $8.3 million and $57.1 million, respectively, of net revenue that is subject to the short-term deferral arrangements entered into in response to the COVID-19 pandemic. We account for these deferral arrangements as rental revenue and a corresponding increase in receivables, which are included in other assets, net on the consolidated balance sheet. For the years ended December 31, 2021 and 2020, FFO and AFFO exclude $33.4 million and $9.9 million, respectively, collected under these short-term deferral arrangements.
(b)For the year ended December 31, 2021, includes $3.2 million of accelerated amortization of certain stock-based compensation awards associated with executive severance and retirement arrangements.
(c)For the years ended December 31, 2021, 2020 and 2019, includes $1.7 million, $0.4 million and $1.1 million, respectively, of accelerated amortization of deferred financing costs primarily related to the prepayment of debt.
(d)For the year ended December 31, 2021, includes approximately $6.9 million of cash severance costs related to the departure of our former Executive Chairman and approximately $890,000 of cash transition costs (primarily comprised of an inducement bonus, relocation expenses and search firm expenses) related the appointment of our Chief Financial Officer.

47

Table of Contents

Item 7A. Quantitative and Qualitative Disclosures About Market Risk

Our interest rate risk management objective is to limit the impact of future interest rate changes on our earnings and cash flows. We seek to match the cash inflows from our long-termlong‑term leases with the expected cash outflows on our long-termlong‑term debt. To achieve this objective, our consolidated subsidiaries primarily borrow on a fixed-ratefixed‑rate basis for longer-termlonger‑term debt issuances. At December 31, 2021,2023, all our long-termlong‑term debt carried a fixed interest rate or was effectively converted to a fixed rate for the term of the debt and the weighted average long-term debt maturity was approximately 6.84.7 years. We are exposed to interest rate risk between the time we enter into a sale-leasebacksale‑leaseback transaction and the time we finance the related real estate with long-term fixed-ratelong‑term fixed‑rate debt. In addition, when that long-termlong‑term debt matures, we may have to refinance the real estate at a higher interest rate. Market interest rates are sensitive to many factors that are beyond our control.

We address interest rate risk by employing the following strategies to help insulate us from any adverse impact of rising interest rates:

We seek to minimize the time period between acquisition of our real estate and the ultimate financing of that real estate with long-term fixed-rate debt.
By using serial issuances of long-term debt, we intend to ladder out our debt maturities to avoid a significant amount of debt maturing during any single period and to minimize the gap between free cash flow and annual debt maturities; free cash flow includes cash from operations less dividends plus proceeds from our sales of properties.
We seek to minimize the time period between acquisition of our real estate and the ultimate financing of that real estate with long‑term fixed‑rate debt.
By using serial issuances of long-term debt, we intend to ladder out our debt maturities to avoid a significant amount of debt maturing during any single period and to minimize the gap between free cash flow and annual debt maturities; free cash flow includes cash from operations less member distributions plus proceeds from our sales of properties.
Our secured long‑term debt generally provides for some amortization of the principal balance over the term of the debt, which serves to reduce the amount of refinancing risk at debt maturity to the extent that we can refinance the reduced debt balance over a revised long-term amortization schedule.
We seek to maintain a large pool of unencumbered real estate assets to give us the flexibility to choose among various secured and unsecured debt markets when we are seeking to issue new long-term debt.
We may also use derivative instruments, such as interest rate swaps, caps and treasury lock agreements, as cash flow hedges to limit our exposure to interest rate movements with respect to various debt instruments.

Although our long-term debt generally provides for some amortization of the principal balance over the term of the debt, which serves to reduce the amount of refinancing risk at debt maturity to the extent that we can refinance the reduced debt balance over a revised long-term amortization schedule.

We seek to maintain a large pool of unencumbered real estate assets to give us the flexibility to choose among various secured and unsecured debt markets when we are seeking to issue new long-term debt.
We may also use derivative instruments, such as interest rate swaps, caps and treasury lock agreements, as cash flow hedges to limit our exposure to interest rate movements with respect to various debt instruments.

Although all our long-term debt carries a fixed rate, we often temporarily fund our property acquisitions with oura revolving credit facility, which carries a variable rate. During the year ended December 31, 2021,Combined Period, we had average daily outstanding borrowings of $56.1$390.8 million on our variable-raterevolving credit facility. As of December 31, 2023 we had borrowings of $375.0 million outstanding on the unsecured revolving credit facility and three interest rate swaps with an aggregate notional amount of $375.0 million which bears interest based on one-month LIBOR, plus a credit spreadeffectively convert the outstanding borrowings to an all-in fixed rate of 0.85% based on our current credit rating.4.595%.

We monitor our potential market interest rate risk exposures using a sensitivity analysis. Our sensitivity analysis estimates the exposure to market risk sensitive instruments noted above assuming a hypothetical adverse change in interest rates. Based on the results of our sensitivity analysis, which assumes a 1% adverse change in interest rates on variable rate debt expected to be outstanding during 2024, the estimated market risk exposure for our variable-ratevariable‑rate debt was approximately $561,000,is estimated to be $0.2 million, or less than 0.1% of net cash provided by operating activities, for the year ended December 31, 2021.Combined Period. In addition, we may use various financial instruments designed to mitigate the impact of interest rate fluctuations on our cash flows and earnings, including hedging strategies, depending on our analysis of the interest rate environment and the costs and risks of such strategies. We do not use derivative instruments for trading or speculative purposes. See Note 2 to our Consolidated Financial Statements for further information on derivatives.

In July 2017, the Financial Conduct Authority, or FCA (the authority that regulates LIBOR), first announced that it intended to stop compelling banks to submit rates for the calculation of LIBOR. Subsequently, the Alternative Reference Rates Committee, or ARRC, identified the Secured Overnight Financing Rate, or SOFR, as the preferred alternative to LIBOR for use in derivatives and other financial contracts. On March 5, 2021, the FCA announced that U.S. Dollar (USD) LIBOR will no longer be published after June 30, 2023. This latest announcement has several implications, including setting the spread that may be used to automatically convert contracts from USD LIBOR to SOFR. Additionally, banking regulators are encouraging banks to discontinue new LIBOR debt issuances by December 31, 2021.

The Company anticipates that LIBOR will continue to be available at least until June 30, 2023. Any changes adopted by the FCA or other governing bodies in the method used for determining LIBOR may result in a sudden or prolonged increase or decrease in reported LIBOR. If that were to occur, our interest payments could change. In addition,29

48


uncertainty about the extent and manner of future changes may result in interest rates and/or payments that are higher or lower than if LIBOR were to remain available in its current form.

At December 31, 2021, the Company’s $600 million unsecured revolving credit facility, which matures in June 2025, is its only contract indexed to LIBOR; as a result, during the recent amendment of this credit facility, alternative reference rate transition language was added to the credit agreement in anticipation of the LIBOR transition. While we expect LIBOR to be available in substantially its current form until June 30, 2023, it is possible that LIBOR will become unavailable prior to that point. This could result, for example, if sufficient banks decline to make submissions to the LIBOR administrator. In that case, the transition to an alternative reference rate could be accelerated.

49

Item 8. FINANCIAL STATEMENTS AND SUPPLEMENTARY DATA

Report of Independent Registered Public Accounting Firm

To the StockholdersMembers and the Board of Directors of STORE Capital CorporationLLC

Opinion on the Financial Statements

We have audited the accompanying consolidated balance sheetssheet of STORE Capital LLC as of December 31, 2023 (Successor) and the consolidated balance sheet of STORE Capital Corporation (the Company) as of December 31, 2021 and 2020,2022 (Predecessor) (collectively, the Company), the related consolidated statements of income,operations, comprehensive income stockholders'(loss), members’ equity and cash flows for the period from February 3, 2023 through December 31, 2023 (Successor), and related consolidated statements of operations, comprehensive income (loss), stockholders’ equity and cash flows for the periods from January 1, 2023 through February 2, 2023, and each of the threetwo years in the period ended December 31, 2021,2022 (Predecessor), and the related notes and financial statement schedules listed in the Index at Item 15(a) (collectively referred to as the consolidated financial statements). In our opinion, the consolidated financial statements present fairly, in all material respects, the financial position of the CompanySTORE Capital LLC at December 31, 20212023 (Successor) and 2020,the financial position of STORE Capital Corporation at December 31, 2022 (Predecessor), and the results of itstheir operations and itstheir cash flows for the periods from February 3, 2023 through December 31, 2023 (Successor), January 1, 2023 through February 2, 2023, and each of the threetwo years in the period ended December 31, 2021,2022 (Predecessor), in conformity with U.S. generally accepted accounting principles.

We also have audited, in accordance with the standards of the Public Company Accounting Oversight Board (United States) (PCAOB), the Company's internal control over financial reporting as of December 31, 2021, based on criteria established in Internal Control-Integrated Framework issued by the Committee of Sponsoring Organizations of the Treadway Commission 2013 framework and our report dated February 24, 2022 expressed an unqualified opinion thereon.

Basis for Opinion

These financial statements are the responsibility of the Company's management. Our responsibility is to express an opinion on the Company’s financial statements based on our audits. We are a public accounting firm registered with the PCAOBPublic Company Accounting Oversight Board (United States) (PCAOB) and are required to be independent with respect to the Company in accordance with the U.S. federal securities laws and the applicable rules and regulations of the Securities and Exchange Commission and the PCAOB.

We conducted our audits in accordance with the standards of the PCAOB.PCAOB and in accordance with auditing standards generally accepted in the United States of America. Those standards require that we plan and perform the audit to obtain reasonable assurance about whether the financial statements are free of material misstatement, whether due to error or fraud. Our audits included performing procedures to assess the risks of material misstatement of the financial statements, whether due to error or fraud, and performing procedures that respond to those risks. Such procedures included examining, on a test basis, evidence regarding the amounts and disclosures in the financial statements. Our audits also included evaluating the accounting principles used and significant estimates made by management, as well as evaluating the overall presentation of the financial statements. We believe that our audits provide a reasonable basis for our opinion.

Critical Audit Matters

The critical audit matters communicated below are matters arising from the current period audit of the financial statements that were communicated or required to be communicated to the audit committee and that: (1) relate to accounts or disclosures that are material to the financial statements and (2) involved our especially challenging, subjective or complex judgments. The communication of critical audit matters does not alter in any way our opinion on the consolidated financial statements, taken as a whole, and we are not, by communicating the critical audit matters below, providing separate opinions on the critical audit matters or on the accounts or disclosures to which they relate.

Acquisition of real estate investments

Description of the Matter

As described in Notes 2 and 3 to the financial statements, the Company recorded $1.3 billion$427 million in acquisitions to real estate during 2021.2023. Auditing the Company’s accounting for the 20212023 acquisitions was complex and required specialized skills and knowledge due to the estimation involved in the allocation of the purchase price to the assets acquired, including land, buildings, improvements and intangible lease assets. The Company utilized multiple sources to estimate such values including third party appraisers and other data such as market rents and comparables.

5030


How We Addressed the Matter in Our Audit

We obtained an understanding and tested the design and operating effectiveness of controls over the accounting for acquisitions process, including controlsunderstanding over the initiation and approval of purchases, inputs and assumptions used in the valuation estimates, and allocation of value among the assets acquired. For a sample of acquisitions, we read the purchase agreements, evaluated the significant assumptions and methodsmethodologies used in developing the allocation estimates, and tested the recording of the assets acquired.

Our audit procedures included evaluating whether any intangible assets were properly identified and the appropriateness of market data and other significant assumptions, including land comparables and replacement costs. We reviewed the valuations completed by third party appraisers including a review of the underlying market data utilized. We further compared the allocations to those historically recognized by the Company and reviewed for any allocation outliers in the population. We involved valuation specialists to assist in the evaluation of significant assumptions used and the appropriateness of the approachmethodologies selected and the qualifications of the third-party appraisers.

Real estate impairment

Description of the Matter

The Company reviews its real estate investments for impairment whenever events or changes in circumstances indicate that the carrying amount of an asset group may not be recoverable. As more fully described in Note 2 to the financial statements, during 2021,2023, the Company recorded impairment losses on certain real estate assets. Based on the factors impacting a property’s value, such as vacancy, undiscounted cash flows from the lease, and market trends as well as hold versus sale scenarios, the Company evaluated certain properties for recoverability and determined that specific assets were impaired. As a result, the Company recognized $21.8$17.6 million in impairment losses, which represented the amount by which the carrying values exceeded the estimated fair values of these assets.

How We Addressed the Matter in Our Audit

Auditing the Company's identification and measurement of impairment was complex as estimates underlying the determination of recoverability and fair value involved a high degree of subjectivity. Significant assumptions used in the Company’s undiscounted cash flow analyses and fair value estimates were market comparable values, bona fide purchase offers on the properties, market rents, tenant improvements and terminal values.

We obtained an understanding and tested the design and operating effectiveness of controls over the Company’s processes to identify indicators of impairment and measure the fair value of the real estate assets that were impaired. Our audit procedures also included, among others, evaluating the significant assumptions used to estimate the undiscounted cash flows, including market rents and comparables, tenant conditions and hold or sell strategies. We tested undiscounted cash flow analyses and fair value measurement through review of market transactions, purchase agreements, market rents, tenant improvements and capitalization rates. We also involved a valuation specialist to assist in our evaluation of certain assumptions, such as market rents, capitalization rates or comparable market property values withoutwhen there was not an active purchase agreement.

Valuation and accounting for STORE Capital Corporation merger

Description of the Matter

As described in Note 10 to the consolidated financial statements, on February 3, 2023, the Company entered into a merger resulting in STORE Capital LLC as the surviving entity. Auditing the Company’s accounting for the merger was complex and required specialized skills and knowledge due to estimation involved in the allocation of the total consideration to the assets acquired and liabilities assumed based upon their relative fair values. The significant assumptions used to estimate the values of the real estate investments assumed included capitalization rates, market rents, expected future cash flows, discount rates and other valuation assumptions. The significant assumptions used to estimate the values of the loans receivable and debt included market interest rates and other valuation assumptions.

31


How We Addressed the Matter in Our Audit

We obtained an understanding over the accounting for the merger, including processes over the inputs and assumptions used in the valuation estimates, and allocation of fair value among the assets acquired and liabilities assumed.

Our audit procedures including evaluating the identification of assets acquired and liabilities assumed, and the appropriateness of market data and other significant assumptions, including capitalization rates, discount rates, market rental rates, and market interest rates. We reviewed the valuations completed by the management specialist and evaluated the appropriateness of the approach selected, qualifications of the management specialist, and the underlying market data utilized. We involved our valuation specialists to assist in the evaluation of the significant assumptions and methodologies used in developing the fair value estimates for real estate investments, loans receivable, and debt.

/s/ Ernst & Young LLP

We have served as the Company’s auditor since 2011.

Phoenix, Arizona

February 24, 2022

March 14, 2024

32


51

Report of Independent Registered Public Accounting Firm

To the Stockholders and the Board of Directors of STORE Capital Corporation

Opinion on Internal Control Over Financial Reporting

We have audited STORE Capital Corporation’s internal control over financial reporting as of December 31, 2021, based on criteria established in Internal Control—Integrated Framework issued by the Committee of Sponsoring Organizations of the Treadway Commission (2013 framework) (the COSO criteria). In our opinion, STORE Capital Corporation (the Company) maintained, in all material respects, effective internal control over financial reporting as of December 31, 2021, based on the COSO criteria.

We also have audited, in accordance with the standards of the Public Company Accounting Oversight Board (United States) (PCAOB), the consolidated balance sheets of the Company as of December 31, 2021 and 2020, the related consolidated statements of income, comprehensive income, stockholders’ equity and cash flows for each of the three years in the period ended December 31, 2021, and the related notes and the financial statement schedules listed in the Index at Item 15(a) and our report dated February 24, 2022 expressed an unqualified opinion thereon.

Basis for Opinion

The Company’s management is responsible for maintaining effective internal control over financial reporting and for its assessment of the effectiveness of internal control over financial reporting included in the accompanying Management’s Report on Internal Control over Financial Reporting. Our responsibility is to express an opinion on the Company’s internal control over financial reporting based on our audit. We are a public accounting firm registered with the PCAOB and are required to be independent with respect to the Company in accordance with the U.S. federal securities laws and the applicable rules and regulations of the Securities and Exchange Commission and the PCAOB.

We conducted our audit in accordance with the standards of the PCAOB. Those standards require that we plan and perform the audit to obtain reasonable assurance about whether effective internal control over financial reporting was maintained in all material respects.

Our audit included obtaining an understanding of internal control over financial reporting, assessing the risk that a material weakness exists, testing and evaluating the design and operating effectiveness of internal control based on the assessed risk, and performing such other procedures as we considered necessary in the circumstances. We believe that our audit provides a reasonable basis for our opinion.

Definition and Limitations of Internal Control Over Financial Reporting

A company’s internal control over financial reporting is a process designed to provide reasonable assurance regarding the reliability of financial reporting and the preparation of financial statements for external purposes in accordance with generally accepted accounting principles. A company’s internal control over financial reporting includes those policies and procedures that (1) pertain to the maintenance of records that, in reasonable detail, accurately and fairly reflect the transactions and dispositions of the assets of the company; (2) provide reasonable assurance that transactions are recorded as necessary to permit preparation of financial statements in accordance with generally accepted accounting principles, and that receipts and expenditures of the company are being made only in accordance with authorizations of management and directors of the company; and (3) provide reasonable assurance regarding prevention or timely detection of unauthorized acquisition, use, or disposition of the company’s assets that could have a material effect on the financial statements.

Because of its inherent limitations, internal control over financial reporting may not prevent or detect misstatements. Also, projections of any evaluation of effectiveness to future periods are subject to the risk that controls may become inadequate because of changes in conditions, or that the degree of compliance with the policies or procedures may deteriorate.

/s/ Ernst & Young LLPLLC

Phoenix, Arizona

February 24, 2022

52

STORE Capital Corporation

Consolidated Balance Sheets

(In thousands, except share and per share data)


December 31,


2021

2020


Assets

Investments:

Real estate investments:

Land and improvements

$

3,133,402

$

2,807,153

Buildings and improvements


6,802,918


6,059,513

Intangible lease assets


54,971


61,634

Total real estate investments


9,991,291


8,928,300

Less accumulated depreciation and amortization


(1,159,292)


(939,591)


8,831,999


7,988,709

Real estate investments held for sale, net


25,154


22,304

Operating ground lease assets

33,318

34,683

Loans and financing receivables, net


697,269


650,321

Net investments


9,587,740


8,696,017

Cash and cash equivalents


64,269


166,381

Other assets, net


121,073


141,942

Total assets

$

9,773,082

$

9,004,340

Liabilities and stockholders’ equity

Liabilities:

Credit facility

$

130,000

$

Unsecured notes and term loans payable, net

1,782,813

1,509,612

Non-recourse debt obligations of consolidated special purpose entities, net


2,425,708


2,212,634

Dividends payable

105,415

95,801

Operating lease liabilities

37,637

39,317

Accrued expenses, deferred revenue and other liabilities


147,380


131,198

Total liabilities


4,628,953


3,988,562

Stockholders’ equity:

Common stock, $0.01 par value per share, 375,000,000 shares authorized, 273,806,225 and 266,112,676 shares issued and outstanding, respectively


2,738


2,661

Capital in excess of par value


5,745,692


5,475,889

Distributions in excess of retained earnings


(602,137)


(459,977)

Accumulated other comprehensive loss


(2,164)


(2,795)

Total stockholders’ equity


5,144,129


5,015,778

Total liabilities and stockholders’ equity

$

9,773,082

$

9,004,340


Successor


Predecessor


December 31,
2023


December 31,
2022


Assets


Investments:


Real estate investments:


Land and improvements


$

3,805,685


$

3,455,443


Buildings and improvements


9,373,309


7,743,454


Intangible lease assets


615,327


61,968


Total real estate investments


13,794,321


11,260,865


Less accumulated depreciation and amortization


(531,351

)


(1,438,107

)


13,262,970


9,822,758


Operating ground lease assets


52,068


31,872


Loans and financing receivables, net


1,103,931


787,106


Net investments


14,418,969


10,641,736


Cash and cash equivalents


239,477


35,137


Other assets, net


90,041


158,097


Total assets


$

14,748,487


$

10,834,970


Liabilities and equity


Liabilities:


Credit facility


$

375,000


$

555,000


Unsecured notes and term loans payable, net


2,839,708


2,397,406


Non-recourse debt obligations of consolidated special purpose entities, net


2,568,474


2,238,470


Intangible lease liabilities, net


140,516


Operating lease liabilities


49,481


36,873


Accrued expenses, deferred revenue and other liabilities


176,110


180,903


Total liabilities


6,149,289


5,408,652


Equity:


Members’ equity


8,730,569


Common stock, $0.01 par value per share, 375,000,000 shares
   authorized,
282,684,998 shares issued and outstanding as of December 31, 2022


2,827


Capital in excess of par value


6,003,331


Distributions in excess of retained earnings


(609,361

)

Accumulated deficit


(138,599

)


Accumulated other comprehensive (loss) income


(816

)


29,521


Total members’ and stockholders’ equity


8,591,154


5,426,318


Noncontrolling interest


8,044


Total equity


8,599,198


5,426,318


Total liabilities and equity


$

14,748,487


$

10,834,970


See accompanying notes.

33


53

STORE Capital CorporationLLC

Consolidated Statements of IncomeOperations

(In thousands, except share and per share data)

Year Ended December 31,


2021

2020

2019


Successor


Predecessor


Period from
February 3, 2023
through
December 31, 2023


Period from
January 1, 2023
through
February 2, 2023


Year Ended
December 31, 2022


Year Ended
December 31, 2021


Revenues:


Rental revenues

$

729,061

$

644,498

$

625,415


$

870,707


$

75,008


$

846,420


$

729,061


Interest income on loans and financing receivables


50,821


45,288


33,826


76,467


5,326


56,776


50,821


Other income


2,782


4,482


6,473


4,726


850


6,976


2,782


Total revenues


782,664


694,268


665,714


951,900


81,184


910,172


782,664


Expenses:


Interest


170,974


169,706


158,381


362,605


19,080


189,549


170,974


Property costs


18,244


22,025


10,793


16,873


1,348


14,696


18,244


General and administrative


84,097


49,685


54,274


55,035


5,679


62,555


84,097


Merger-related


895


12,248


Depreciation and amortization


265,813


242,925


221,975


533,637


27,789


308,084


265,813


Provisions for impairment

24,979

23,003

18,751


25,265


16,428


24,979


Total expenses


564,107


507,344


464,174


993,415


54,791


603,560


564,107


Other income:

���

Net gain on dispositions of real estate


46,655


22,774


84,142

Income from non-real estate, equity method investment

3,949

3,500

Income before income taxes

269,161

213,198

285,682

Other (loss) income:


(Loss) gain on dispositions of real estate


(6,680

)


97


19,224


46,655


Loss on extinguishment of debt


(67,897

)


Income from non-real estate, equity method investments


2,949


3,949


(Loss) income before income taxes


(116,092

)


26,490


328,785


269,161


Income tax expense


813


584


707


22,567


703


884


813


Net income

$

268,348

$

212,614

$

284,975

Net income per share of common stock—basic and diluted

$

0.99

$

0.84

$

1.24

Net (loss) income


(138,659

)


25,787


327,901


268,348


Less: Net loss attributable to noncontrolling interests


(60

)


Net (loss) income attributable to controlling interests


$

(138,599

)


$

25,787


$

327,901


$

268,348


Net income per share of common stock


Basic


$

0.09


$

1.17


$

0.99


Diluted


$

0.09


$

1.17


$

0.99


Weighted average common shares outstanding:


Basic


270,105,269


252,534,580


229,734,497


282,238,151


280,105,477


270,105,269


Diluted


270,105,269


252,651,040


230,289,541


282,338,405


280,105,477


270,105,269


See accompanying notes.

34


54

STORE Capital CorporationLLC

Consolidated Statements of Comprehensive Income (Loss)

(In thousands)

Year Ended December 31,


2021

2020

2019


Net income


$

268,348


$

212,614


$

284,975


Other comprehensive income (loss):

Unrealized losses on cash flow hedges


(3)


(1,437)


(1,142)

Cash flow hedge losses (gains) reclassified to interest expense


634


978


(1,053)

Total other comprehensive income (loss)


631


(459)


(2,195)

Total comprehensive income

$

268,979

$

212,155

$

282,780


Successor


Predecessor


Period from
February 3, 2023
through
December 31, 2023


Period from
January 1, 2023
through
February 2, 2023


Year Ended
December 31, 2022


Year Ended
December 31, 2021


Net (loss) income


$

(138,659

)


$

25,787


$

327,901


$

268,348


Other comprehensive (loss) income:


Unrealized gains (losses) on cash flow hedges


17,410


(10,531

)


30,393


(3

)

Cash flow hedge (gains) losses reclassified to interest expense


(18,226

)


(894

)


1,292


634


Total other comprehensive (loss) income


(816

)


(11,425

)


31,685


631


Total comprehensive (loss) income


(139,475

)


14,362


359,586


268,979


Comprehensive (loss) income attributable to noncontrolling interests


(60

)


Comprehensive (loss) income attributable to controlling interests


$

(139,415

)


$

14,362


$

359,586


$

268,979


See accompanying notes.

35


55

STORE Capital CorporationLLC

Consolidated Statements of Stockholders’ Equity

For the Years Ended December 31, 2021, 20202022 and 2019for the period from January 1, 2023 through February 2, 2023

(In thousands, except share and per share data)

Distributions

Accumulated


Capital in

in Excess of

Other

Total


Common Stock

Excess of

Retained

Comprehensive

Stockholders’


Shares

Par Value

Par Value

Earnings

Income (Loss)

Equity


Balance at December 31, 2018


221,071,838

$

2,211

$

4,129,082

$

(267,651)

$

(141)

$

3,863,501

Net income


284,975


284,975

Other comprehensive loss


(2,195)


(2,195)

Issuance of common stock, net of costs of $9,422


18,474,875

185

650,336


650,521

Equity-based compensation


443,330

4

11,698

27


11,729

Shares repurchased under stock compensation plan

(167,143)

(2)

(3,184)

(1,846)

(5,032)

Common dividends declared ($1.36 per common share) and dividend equivalents on restricted stock units


(318,114)


(318,114)

Balance at December 31, 2019


239,822,900


2,398


4,787,932


(302,609)


(2,336)


4,485,385

Adoption of ASC Topic 326, cumulative adjustment

(2,465)

(2,465)

Net income


212,614


212,614

Other comprehensive loss


(459)


(459)

Issuance of common stock, net of costs of $9,558


25,696,396

257

686,129


686,386

Equity-based compensation


732,511

6

4,659

5


4,670

Shares repurchased under stock compensation plan

(139,131)

(2,831)

(2,366)

(5,197)

Common dividends declared ($1.42 per common share) and dividend equivalents on restricted stock units


(365,156)


(365,156)


Predecessor


Distributions


Accumulated


Capital in


in Excess of


Other


Total


Common Stock


Excess of


Retained


Comprehensive


Stockholders’


Shares


Par Value


Par Value


Earnings


Income (Loss)


Equity


Balance at December 31, 2020


266,112,676


2,661


5,475,889


(459,977)


(2,795)


5,015,778


266,112,676


$

2,661


$

5,475,889


$

(459,977

)


$

(2,795

)


$

5,015,778


Net income


268,348


268,348


268,348


268,348


Other comprehensive income


631


631


631


631


Issuance of common stock, net of costs of $4,109


7,322,471

73

243,598


243,671

Issuance of common stock, net of costs of $4,109


7,322,471


73


243,598


243,671


Equity-based compensation


659,210

7

32,223

172


32,402


659,210


7


32,223


172


32,402


Shares repurchased under stock compensation plan

(288,132)

(3)

(6,018)

(3,488)

(9,509)


(288,132

)


(3

)


(6,018

)


(3,488

)


(9,509

)

Common dividends declared ($1.49 per common share) and dividend equivalents on restricted stock units


(407,192)


(407,192)

Common dividends declared ($1.49 per common share)
and dividend equivalents on restricted stock units


(407,192

)


(407,192

)

Balance at December 31, 2021


273,806,225

$

2,738

$

5,745,692

$

(602,137)

$

(2,164)

$

5,144,129


273,806,225


2,738


5,745,692


(602,137

)


(2,164

)


5,144,129


Net income


327,901


327,901


Other comprehensive income


31,685


31,685


Issuance of common stock, net of costs of $3,268


8,607,771


86


249,520


249,606


Equity-based compensation


473,798


3


12,426


112


12,541


Shares repurchased under stock compensation plan


(202,796

)


(4,307

)


(1,964

)


(6,271

)

Common dividends declared ($1.18 per common share)
and dividend equivalents on restricted stock units


(333,273

)


(333,273

)

Balance at December 31, 2022


282,684,998


2,827


6,003,331


(609,361

)


29,521


5,426,318


Net income


25,787


25,787


Other comprehensive loss


(11,425

)


(11,425

)

Common stock issuance costs


Equity-based compensation


975


975


Shares repurchased under stock compensation plan


Common dividends declared


Balance at February 2, 2023


282,684,998


$

2,827


$

6,004,306


$

(583,574

)


$

18,096


$

5,441,655


See accompanying notes.

36


56

STORE Capital CorporationLLC

Consolidated Statement of Members’ Equity

For the period from February 3, 2023 through December 31, 2023

(In thousands, except share and per share data)


Successor


Accumulated


Other


Total


Non-


Members’ Units


Members’ Equity


Comprehensive


Members’


controlling


Total


Common


Preferred


Common


Preferred


Income (loss)


Equity


Interest


Equity


Balance at February 3, 2023


$


$


$


$


$


$


Members’ contributions


1,000


125


9,251,844


125


9,251,969


9,251,969


Members’ distributions


(510,000

)


(15

)


(510,015

)


(510,015

)

Net (loss) income


(138,614

)


15


(138,599

)


(60

)


(138,659

)

Other comprehensive loss


(816

)


(816

)


(816

)

Contributions from noncontrolling interest


8,104


8,104


Non-cash distribution to members


(11,385

)


(11,385

)


(11,385

)

Balance at December 31, 2023


1,000


125


$

8,591,845


$

125


$

(816

)


$

8,591,154


$

8,044


$

8,599,198


See accompanying notes.

37


STORE Capital LLC

Consolidated Statements of Cash Flows

(In thousands)


Successor


Predecessor


Period from
February 3, 2023
through
December 31, 2023


Period from
January 1, 2023
through
February 2, 2023


Year Ended
December 31, 2022


Year Ended
December 31, 2021


Operating activities


Net (loss) income


$

(138,659

)


$

25,787


$

327,901


$

268,348


Adjustments to net (loss) income:


Depreciation and amortization


533,637


27,789


308,084


265,813


Amortization of debt discounts, deferred financing costs and other noncash interest expense


82,830


715


9,509


10,120


Amortization of equity-based compensation


975


12,430


32,228


Provisions for impairment


25,265


16,428


24,979


Net loss (gain) on dispositions of real estate


6,680


(97

)


(19,224

)


(46,655

)

Income from non-real estate, equity method investments


(2,949

)


(3,949

)

Distribution received from non-real estate, equity method investment


468


120


Loss on extinguishment of debt


67,897


Noncash revenue and other


(11,787

)


(77

)


(4,423

)


(9,907

)

Changes in operating assets and liabilities:


Other assets


(2,175

)


(2,876

)


4,455


32,459


Accrued expenses, deferred revenue and other liabilities


21,339


7,164


21,736


9,817


Net cash provided by operating activities


585,027


59,380


674,415


583,373


Investing activities


Acquisition of and additions to real estate


(508,224

)


(48,063

)


(1,457,503

)


(1,379,902

)

Investment in loans and financing receivables


(598,990

)


(82,112

)


(158,676

)


(125,049

)

Collections of principal on loans and financing receivables


74,408


468


67,922


19,160


Proceeds from dispositions of real estate


73,799


682


195,629


355,972


Proceeds from sale of loans and financing receivables to related party


327,454


Contribution made to non-real estate, equity method investment


(468

)


Acquisition of STORE Capital Corporation


(10,547,219

)


Net cash used in investing activities


(11,178,772

)


(129,025

)


(1,353,096

)


(1,129,819

)

Financing activities


Borrowings under credit facility


1,266,500


70,000


1,183,000


665,000


Repayments under credit facility


(891,500

)


(25,000

)


(758,000

)


(535,000

)

Borrowings under unsecured notes and term loans payable


1,513,600


40,000


690,000


374,539


Repayments under unsecured notes and term loans payable


(185,600

)


(75,000

)


(100,000

)

Borrowings under secured term loan facility


1,957,750


Repayments under secured term loan facility


(2,000,000

)


Borrowings under non-recourse debt obligations of consolidated special purpose entities


527,925


514,785


Repayments under non-recourse debt obligations of consolidated special purpose entities


(35,548

)


(15,906

)


(192,559

)


(301,078

)

Financing costs and prepayment penalties paid


(59,213

)


(1,106

)


(3,272

)


(14,433

)

Members’ contributions


9,251,969


Members’ distributions


(510,015

)


Proceeds from the issuance of non-controlling interests


8,104


Proceeds from the issuance of common stock


252,873


247,780


Stock issuance costs paid


(3,268

)


(4,162

)

Shares repurchased under stock compensation plans


(6,271

)


(9,507

)

Dividends paid


(439,067

)


(398,005

)

Net cash provided by financing activities


10,843,972


67,988


648,436


439,919


Net increase (decrease) in cash, cash equivalents and restricted cash


250,227


(1,657

)


(30,245

)


(106,527

)

Cash, cash equivalents and restricted cash, beginning of period


39,804


70,049


176,576


Cash, cash equivalents and restricted cash, end of period


$

250,227


$

38,147


$

39,804


$

70,049


Reconciliation of cash, cash equivalents and restricted cash:


Cash and cash equivalents


$

239,477


$

33,096


$

35,137


$

64,269


Restricted cash included in other assets


10,750


5,051


4,667


5,780


Total cash, cash equivalents and restricted cash


$

250,227


$

38,147


$

39,804


$

70,049


Supplemental disclosure of noncash investing and financing activities:


Accrued tenant improvements included in real estate investments


$

24,516


$


$

21,118


$

25,077


Tenant funded improvements to real estate investments


10,550


Acquisition of real estate assets from borrowers under loans and financing receivables


8,945


42,782


Accrued financing and stock issuance costs


62


54


79


Noncash distribution to members


11,385


Supplemental disclosure of cash flow information:


Cash paid during the period for interest, net of amounts capitalized


$

283,814


$

11,488


$

177,294


$

159,805


Cash paid during the period for income and franchise taxes


12,592


20


2,937


2,441


Year Ended December 31,


2021

2020

2019


Operating activities


Net income

$

268,348

$

212,614

$

284,975

Adjustments to net income:

Depreciation and amortization


265,813


242,925


221,975

Amortization of deferred financing costs and other noncash interest expense


10,120


8,827


9,689

Amortization of equity-based compensation


32,228


4,665


11,703

Provisions for impairment

24,979

23,003

18,751

Net gain on dispositions of real estate


(46,655)


(22,774)


(84,142)

Income from non-real estate, equity method investment

(3,949)

(3,500)

Distributions received from equity method investment

120

Gain on defeasance/extinguishment of debt

735

Noncash revenue and other


(9,907)


(53,139)


(1,865)

Payments made in settlement of cash flow hedges

(6,735)

Changes in operating assets and liabilities:

Other assets

32,459

(6,837)

(5,608)

Accrued expenses, deferred revenue and other liabilities


9,817


25,802


8,856

Net cash provided by operating activities


583,373


431,586


458,334

Investing activities

Acquisition of and additions to real estate


(1,379,902)


(917,038)


(1,451,269)

Investment in loans and financing receivables


(125,049)


(153,545)


(253,552)

Collections of principal on loans and financing receivables


19,160


46,618


16,377

Proceeds from dispositions of real estate


355,972


212,108


438,631

Net cash used in investing activities


(1,129,819)


(811,857)


(1,249,813)

Financing activities

Borrowings under credit facility


665,000

600,000

822,100

Repayments under credit facility


(535,000)


(600,000)


(957,100)

Borrowings under unsecured notes and term loans payable

374,539

348,453

347,410

Repayments under unsecured notes and term loans payable

(100,000)

(100,000)

Borrowings under non-recourse debt obligations of consolidated special purpose entities


514,785


549,596

Repayments under non-recourse debt obligations of consolidated special purpose entities


(301,078)


(127,659)


(228,252)

Financing costs paid


(14,433)


(3,330)


(12,206)

Proceeds from the issuance of common stock


247,780


695,944


659,943

Stock issuance costs paid

(4,162)

(9,540)

(9,459)

Shares repurchased under stock compensation plans

(9,507)

(5,198)

(5,032)

Dividends paid

(398,005)

(353,204)

(307,157)

Net cash provided by financing activities


439,919


445,466


859,843

Net (decrease) increase in cash, cash equivalents and restricted cash


(106,527)


65,195


68,364

Cash, cash equivalents and restricted cash, beginning of period


176,576


111,381


43,017

Cash, cash equivalents and restricted cash, end of period

$

70,049

$

176,576

$

111,381

Reconciliation of cash, cash equivalents and restricted cash:

Cash and cash equivalents

$

64,269

$

166,381

$

99,753

Restricted cash included in other assets

5,780

10,195

11,628

Total cash, cash equivalents and restricted cash

$

70,049

$

176,576

$

111,381

Supplemental disclosure of noncash investing and financing activities:

Accrued tenant improvements included in real estate investments

$

25,077

$

22,087

$

17,464

Seller financing provided to purchaser of real estate sold

3,176

9,000

Acquisition of real estate assets from borrowers under loans and financing receivables

42,782

30,585

13,574

Non-recourse debt obligation assumed in conjunction with acquisition of property

6,215

Accrued financing and stock issuance costs

79

138

80

Supplemental disclosure of cash flow information:

Cash paid during the period for interest, net of amounts capitalized

$

159,805

$

160,091

$

142,933

Cash paid during the period for income and franchise taxes

2,441

2,366

2,362

See accompanying notes.

38


57

STORE Capital CorporationLLC

Notes to Consolidated Financial Statements

December 31, 20212023

1. Organization

STORE Capital Corporation (STORE Capital or the Company) was incorporated under the laws of Maryland on May 17, 2011 to acquire single-tenantsingle‑tenant operational real estate to be leased on a long-term,long‑term, net basis to companies that operate across a wide variety of industries within the service, service-oriented retail and manufacturing sectors of the United States economy. From time to time, it also providesprovided mortgage financing to its customers.

On November 21, 2014, the Company completed the initial public offering (IPO) of its common stock. The shares began tradingtraded on the New York Stock Exchange onfrom November 18, 2014 through the Closing Date, as defined below, under the ticker symbol “STOR”.

On September 15, 2022, STORE Capital Corporation, Ivory Parent, LLC, a Delaware limited liability company (“Parent”) and Ivory REIT, LLC, a Delaware limited liability company (“Merger Sub” and, together with Parent, the “Parent Parties”), entered into an Agreement and Plan of Merger (the “Merger Agreement”). The Parent Parties are affiliates of GIC, a global institutional investor, and funds managed by Blue Owl Capital. On February 3, 2023 (the “Closing Date”), pursuant to the terms and subject to the conditions set forth in the Merger Agreement, STORE Capital Corporation merged with and into Merger Sub (the “Merger”) with Merger Sub surviving (the “Surviving Entity”), and the separate existence of STORE Capital Corporation ceased. Immediately following the completion of the Merger, the Surviving Entity changed its name to STORE Capital LLC. References herein to "we, " "us," "our," the “Company” or “STORE Capital” are references to STORE Capital Corporation prior to the Merger and to STORE Capital LLC upon and following the Merger. As of the Closing Date of the Merger, the common equity of the Company is no longer publicly traded.

STORE Capital Corporation elected to be taxed as a real estate investment trust (“REIT”) for federal income tax purposes beginning with its initial taxable year ended December 31, 2011. STORE Capital LLC has made an election to qualify, and believes it is operating in a manner to continue to qualify, as a real estate investment trust (REIT)REIT for federal income tax purposes beginning with its initial taxable year ended December 31, 2011.2022. As a REIT, itthe Company will generally not be subject to federal income taxes to the extent that it distributes all of its taxable income to its stockholdersmembers and meets other specific requirements.

2. Summary of Significant Accounting Principles

Basis of Accounting and Principles of Consolidation

The accompanying audited consolidated financial statements have been prepared in accordance with U.S. generally accepted accounting principles (GAAP)(“GAAP”) and the rules and regulations of the U.S. Securities and Exchange Commission (SEC)(“SEC”).

These consolidated statements include the accounts of STORE Capital Corporation and its wholly-owned subsidiaries which are wholly owned and special purpose entities that it controlled by the Company through its voting interest.interest for the periods prior to the Merger. For the periods after the Merger, these consolidated statements include the accounts of STORE Capital LLC, its wholly-owned subsidiaries, special purpose entities, and variable interest entities (“VIEs”) that it controls through its voting interest or other means. One of the Company’s wholly owned subsidiaries, STORE Capital Advisors, LLC, provides all of the general and administrative services for the day-to-dayday‑to‑day operations of the consolidated group, including property acquisition and lease origination, real estate portfolio management and marketing, accounting and treasury services. The remaining subsidiaries were formed to acquire and hold real estate investments or to facilitate non-recoursenon‑recourse secured borrowing activities. Generally, the initial operations of the real estate subsidiaries are funded by an interest-bearinginterest‑bearing intercompany loan from STORE Capital, and such intercompany loan is repaid when the subsidiary issues long-termlong‑term debt secured by its properties. All intercompany account balances and transactions have been eliminated in consolidation.

Certain of the Company’s wholly owned consolidated subsidiaries were formed asare special purpose entities.entities or VIEs. Each special purpose entity or VIE is a separate legal entity and is the sole owner of its assets and liabilities. The assets of the special purpose entities or VIEs may only be used to settle the liabilities of such entity and are not available to pay or otherwise satisfy obligations to the creditors of any owner or affiliate of the applicable special purpose entity.entity or VIE. At December 31, 20212023 and 2020,2022, these special purpose entities held assets totaling $8.5$12.9 billion and $7.7$9.5 billion, respectively, and had third‑party liabilities totaling $2.8 billion and $2.4 billion, respectively

39


and at December 31, 2023 these VIEs held assets totaling $267.9 million and third-party liabilities totaling $2.6 billion and $2.3 billion, respectively.$3.1 million. These assets and liabilities are included in the accompanying consolidated balance sheets.

The Company is required to continually evaluate its VIE relationships and consolidate these entities when it is determined to be the primary beneficiary of their operations. A VIE is broadly defined as an entity where either: (i) the equity investment at risk is insufficient to finance that entity’s activities without additional subordinated financial support, (ii) substantially all of an entity’s activities either involve or are conducted on behalf of an investor that has disproportionately few voting rights, or (iii) the equity investors as a group lack any of the following: (a) the power through voting or similar rights to direct the activities of an entity that most significantly impact the entity’s economic performance, (b) the obligation to absorb the expected losses of an entity, or (c) the right to receive the expected residual returns of an entity.

The designation of an entity as a VIE is reassessed upon certain events, including, but not limited to: (i) a change to the contractual arrangements of the entity or in the ability of a party to exercise its participation or kick-out rights, (ii) a change to the capitalization structure of the entity, or (iii) acquisitions or sales of interests that constitute a change in control.

A variable interest holder is considered to be the primary beneficiary of a VIE if it has the power to direct the activities of a VIE that most significantly impact the entity’s economic performance and has the obligation to absorb losses of, or the right to receive benefits from, the entity that could potentially be significant to the VIE. The Company qualitatively assesses whether it is (or is not) the primary beneficiary of a VIE. Consideration of various factors includes, but is not limited to, which activities most significantly impact the entity’s economic performance and the ability to direct those activities, the variable interest holder’s form of ownership interest, the variable interest holder’s representation on the VIE’s governing body, the size and seniority of the variable interest holder’s investment, the variable interest holder’s ability and the rights of other investors to participate in policy making decisions, the variable interest holder’s ability to manage its ownership interest relative to the other interest holders, and the variable interest holder’s ability to replace the VIE manager and/or liquidate the entity.

For its investments in entities that are not considered to be VIEs, the Company evaluates the type of ownership rights held by each party with an interest in the entity to determine if the Company holds a controlling financial interest. The assessment of whether the Company holds a controlling financial interest is made at inception of the entity and continually reassessed.

Consolidated VIE

The Company holds a 95% ownership interest in and is the managing member of a joint venture entity formed in December 2023 that owns and leases real estate to lessees that are affiliates of the noncontrolling interest holder. The Company also provided a $105.2 million intercompany loan to the joint venture. The Company classifies the joint venture as a VIE, as the equity holders do not have the obligation to absorb all future losses of the joint venture due to a provision that protects the equity holders from certain losses if an event of default occurs under the leases. The Company consolidates the joint venture as the primary beneficiary because it has the ability to control the activities that most significantly impact the VIE’s economic performance. The assets of the joint venture primarily consist of leased properties (net lease real estate accounted for as financing arrangements), rents receivable, and cash and cash equivalents; its obligations primarily consist of debt service payments, which are eliminated in consolidation.

Accounting for the Merger

As further described in Note 10 to these consolidated financial statements, the Merger was accounted for using the asset acquisition method of accounting in accordance with the Financial Accounting Standards Board’s (“FASB”) Accounting Standards Codification (“ASC”) Topic 805, Business Combinations (“ASC Topic 805”), which requires that the cost of an acquisition be allocated on a relative fair value basis to the assets purchased and the liabilities assumed. Direct transaction costs incurred by STORE Capital LLC as the acquirer and amounts transferred to reimburse STORE Capital Corporation for costs incurred as the acquiree to sell the business are included in the consideration transferred and capitalized as a component of the cost of the assets acquired. An assembled workforce intangible asset is recorded at the acquisition date if it is part of the asset group acquired. Goodwill is not recognized in an asset acquisition and consideration transferred in excess over the fair value of the net assets acquired, if any, is allocated on a relative fair value basis to the identifiable assets and liabilities.

As noted above, the consolidated financial statements of STORE Capital LLC reflect the recording of assets and liabilities at fair value as of the date of the Merger. The Merger resulted in the termination of the prior reporting entity and a corresponding creation of a new reporting entity. Accordingly, the Company’s consolidated financial statements and transactional records prior to the Closing

40


Date, or February 3, 2023, reflect the historical accounting basis of assets and liabilities and are labeled “Predecessor” while such records subsequent to the Closing Date reflect the fair value of assets acquired and liabilities assumed in the Company’s consolidated financial statements and are labeled “Successor.” This change in reporting entity is represented in the consolidated financial statements by a black line that appears between “Predecessor” and “Successor” on the statements and in the relevant notes. The black line signifies that the amounts shown for the periods prior to and subsequent to the Merger are not comparable.

Use of Estimates

The preparation of financial statements in conformity with GAAP requires management to make estimates and assumptions that affect the reported amounts of assets and liabilities, the disclosure of contingent assets and liabilities and the reported amounts of revenues and expenses during the reporting period. Although management believes its estimates are reasonable, actual results could differ from those estimates.

Segment Reporting

The Financial Accounting Standards Board’s (FASB) Accounting Standards Codification (ASC)FASB’s ASC Topic 280, Segment Reporting, established standards for the manner in which enterprises report information about operating segments. The Company views its operations as 1one reportable segment.

58

Investment Portfolio

STORE Capital invests in real estate assets through 3three primary transaction types as summarized below. At the beginning of 2019, the Company adopted Accounting Standards Update (ASU)(“ASU”) 2016-02, Leases (Topic 842) (ASC Topic 842)842”) which had an impact on certain accounting related to the Company’s investment portfolio.

Real Estate Investments – investments are generally made through sale-leaseback transactions in which the Company acquires the real estate from the owner-operators and then leases the real estate back to them through long-term leases which are generally classified as operating leases; the operators become the Company’s long-term tenants (its customers). Certain
Real Estate Investments – investments are generally made in one of two ways, either through sale-leaseback transactions in which the Company acquires the real estate from the owner-operators and then leases the real estate back to them, or through acquisitions from third-party sellers in connection with which a new lease is entered into with the tenant. Both approaches result in long-term leases which are generally classified as operating leases and, in both cases, the operators become the Company’s long‑term tenants (its customers). In certain instances, the terms of the lease result in classification as a finance lease instead of an operating lease. Furthermore, certain of the lease contracts that are specifically associated with a sale-leaseback transaction may contain terms, such as a tenant purchase option, which results in the transaction being accounted for as a financing arrangement due to the adoption of ASC Topic 842 rather than as an investment in real estate subject to an operating lease.
Mortgage Loans Receivable – investments are made by issuing mortgage loans to the owner-operators of the real estate that serve as the collateral for the loans and the operators become long-term borrowers and customers of the Company. On occasion, the Company may also make other types of loans to its customers, such as equipment loans.
Hybrid Real Estate Investments – investments are made through modified sale-leaseback transactions, where the Company acquires land from the owner-operators, leases the land back through long-term leases and simultaneously issues mortgage loans to the operators secured by the buildings and improvements on the land. Prior to 2019, these hybrid real estate investment transactions were generally accounted for as direct financing leases. Subsequent to the adoption of ASC Topic 842, new or modified hybrid real estate investment transactions are generally accounted for as operating leases of the land and mortgage loans on the buildings and improvements.

Impact of the COVID-19 Pandemic

Since the beginning of the novel coronavirus (COVID-19) pandemic in early 2020, the Company has provided to certain tenants rent deferral arrangements in the form of both short-term notes and lease modifications. The FASB provided accounting relief under which concessions provided to tenants in direct response to the COVID-19 pandemic are not required to be evaluated or accounted for as lease modifications in accordance with ASC Topic 842. The Company elected to apply this accounting relief to the rent deferral arrangements it has entered into with its tenants, which primarily affected the timing (but not the amount) of lease and loan paymentsa financing arrangement, due to the Company under its contracts. ForCompany’s adoption of ASC Topic 842 rather than as an investment in real estate subject to an operating or finance lease.

Mortgage Loans Receivable – investments are made by issuing mortgage loans to the years ended December 31, 2021owner-operators of the real estate that serves as the collateral for the loans and 2020,the operators become long-term borrowers and customers of the Company. On occasion, the Company recognized $8.3 millionmay also make other types of loans to its customers, such as equipment loans.
Hybrid Real Estate Investments – investments are made through modified sale-leaseback transactions, where the Company acquires land from the owner-operators, leases the land back through long-term leases and $57.1 million of net revenue associated with these deferral arrangements with a corresponding increase in receivables that are included in other assets, netsimultaneously issues mortgage loans to the operators secured by the buildings and improvements on the consolidated balance sheet. Duringland. Prior to 2019, these hybrid real estate investment transactions were generally accounted for as direct financing leases. Subsequent to the years ended December 31, 2021 and 2020, the Company collected $33.4 million and $9.9 million adoption of ASC Topic 842, new or modified hybrid real estate investment transactions are generally accounted for as operating leases of the receivables related to these deferral arrangements.land and mortgage loans on the buildings and improvements.

Accounting for Real Estate Investments

Classification and Cost

STORE Capital records the acquisition of real estate properties at cost, including acquisition and closing costs. The Company allocates the cost of real estate properties to the tangible and intangible assets and liabilities acquired based on their estimated relative fair values. Intangible assets and liabilities acquired may include the value of existing in-place leases, above-market or below-market lease value of in-place leases and ground lease-related intangibles, as applicable. Management uses multiple sources to estimate fair value, including independent appraisals and information obtained about each property as a result of its pre-acquisitionpre‑acquisition due diligence and its marketing and leasing activities. Certain of the Company’s lease contracts allow its tenants the option, at their election, to purchase the leased property from the Company at a specified time or times (generally at the greater of the then-fairthen‑fair market value or the Company’s cost, as defined in the lease contracts). Subsequent to the adoption of ASC Topic 842, for real estate assets acquired

41


through a sale-leaseback transaction and subject to a lease contract whichthat contains a purchase option, the Company accounts for such an acquisition as a financing arrangement and records the investment in loans and financing receivables on the consolidated balance sheet; should the purchase option later expire or be removed from the lease contract, the Company would derecognize the asset accounted for as a financing arrangement and recognize the transferred leased asset in real estate investments.

In-placeIn‑place lease intangibles are valued based on management’s estimates of lost rent and carrying costs during the time it would take to locate a tenant if the property were vacant, considering current market conditions and costs to execute similar leases. In estimating

59

lost rent and carrying costs, management considers market rents, real estate taxes, insurance, costs to execute similar leases (including leasing commissions) and other related costs. The value assigned to in-placein‑place leases is amortized on a straight-linestraight‑line basis as a component of depreciation and amortization expense typically over the remaining term of the related leases.

The fair value of any above-marketabove‑market or below-marketbelow‑market lease is estimated based on the present value of the difference between the contractual amounts to be paid pursuant to the in-placein‑place lease and management’s estimate of current market lease rates for the property, measured over a period equal to the remaining term of the lease. Capitalized above-marketabove‑market lease intangibles are amortized over the remaining term of the respective leases as a decrease to rental revenue. Below-marketBelow‑market lease intangibles are amortized as an increase in rental revenue over the remaining term of the respective leases plus the fixed-ratecontractual renewal periods on those leases, if any. Should a lease terminate early, the unamortized portion of any related lease intangible is immediately recognized in operations.

The Company’s real estate portfolio is depreciated using the straight-linestraight‑line method over the estimated remaining useful life of the properties, which generally ranges from 3020 to 40 years for buildings and is generally 10 to 15 years for land improvements. Properties classified as held for sale are recorded at the lower of their carrying value or their fair value, less anticipated selling costs. Any properties classified as held for sale are not depreciated.

Revenue Recognition

STORE Capital leases real estate to its tenants under long-long‑term net leases that are predominantly classified as operating leases. The Company’s leases generally provide for rent escalations throughout the lease terms. For leases that provide for specific contractual escalations, rental revenue is recognized on a straight-linestraight‑line basis so as to produce a constant periodic rent over the term of the lease. Accordingly, straight-line operating lease receivables, calculated as the aggregate difference between the rental revenue recognized on a straight-linestraight‑line basis and scheduled rents, represent unbilled rent receivables that the Company will receive only if the tenants make all rent payments required through the expiration of the leases; these receivables are included in other assets, net on the consolidated balance sheets. The Company reviews its straight-line operating lease receivables for collectibility on a contract by contract basis and any amounts not considered substantially collectible are written off against rental revenues. As of December 31, 20212023 and 2020,2022, the Company had $39.4$13.3 million and $34.6$46.9 million, respectively, of straight-line operating lease receivables. Leases that have contingent rent escalators indexed to future increases in the Consumer Price Index (CPI)(“CPI”) may adjust over a one-year period or over multiple-yearmultiple‑year periods. Generally,Often, these escalators increase rent at the lesser of (a) 1 to 1.25 times the increase in the CPI over a specified period or (b) a fixed percentage. Because of the volatility and uncertainty with respect to future changes in the CPI, the Company’s inability to determine the extent to which any specific future change in the CPI is probable at each rent adjustment date during the entire term of these leases and the Company’s view that the multiplier does not represent a significant leverage factor, increases in rental revenue from leases with this type of escalator are recognized only after the changes in the rental rates have actually occurred.

In addition to base rental revenue, certain leases also have contingent rentals that are based on a percentage of the tenant’s gross sales; the Company recognizes contingent rental revenue when the threshold upon which the contingent lease payment is based is actually reached. Approximately 3.5%3.3% of the Company’s investment portfolio is subject to leases that provide for contingent rent based on a percentage of the tenant’s gross sales (for most of these leases, the contingent rent payment is for a temporary period);sales; historically, contingent rent recognized has been less than 2.0%2.0% of rental revenues.

The Company reviews its operating lease receivables for collectibility on a regular basis, taking into consideration changes in factors such as the tenant’s payment history, the financial condition of the tenant, business conditions in the industry in which the tenant operates and economic conditions in the area where the property is located. In the event that the collectibility of lease payments with respect to any tenant is not probable, a direct write-offwrite‑off of the receivable is made and any future rental revenue is recognized only when the tenant makes a rental payment or when collectibility is again deemed probable.

Direct costs incremental to successful lease origination, offset by any lease origination fees received, are deferred and amortized over the related lease term as an adjustment to rental revenue. The Company periodically commits to fund the construction of new properties for its customers; rental revenue collected during the construction period is deferred and amortized over the remaining lease term when the construction project is complete. Substantially all of the Company’s leases are triple net, which means that the lessees

42


are directly responsible for the payment of all property operating expenses, including property taxes, maintenance and insurance. For a few lease contracts, the Company collects property taxes from its customers and remits those taxes to governmental authorities. Subsequent to the adoption of ASC Topic 842, these property tax payments are presented on a gross basis as part of both rental revenues and property costs in the consolidated statements of income.operations.

60

Impairment

STORE Capital reviews its real estate investments and related lease intangibles periodically for impairment whenever events or changes in circumstances indicate that the carrying amount of an asset may not be recoverable through operations. Such events or changes in circumstances may include an expectation to sell certain assets in accordance with the Company’s long-term strategic plans. Management considers factors such as expected future undiscounted cash flows, capitalization and discount rates, terminal value, tenant improvements, market trends (such as the effects of leasing demand and competition) and other factors including bona fide purchase offers received from third parties in making this assessment. These factors are classified as Level 3 inputs within the fair value hierarchy, discussed in Fair Value Measurement below. If an asset is determined to be impaired, the impairment is calculated as the amount by which the carrying value of the asset exceeds its estimated fair value. Estimating future cash flows is highly subjective and such estimates could differ materially from actual results.

DuringFor the year endedperiod from February 3, 2023 through December 31, 2021,2023, the Company recognized an aggregate provision for impairment of real estate of $21.8$17.6 million. For the assets impaired in 2021,2023, the estimated aggregate fair value of the impaired real estate assets at the time of impairment aggregated $78.2$48.3 million.No impairment of real estate was recognized during the period from January 1, 2023 through February 2, 2023. The Company recognized aggregate provisions for the impairment of real estate of $22.0$16.0 million and $18.8$21.8 million during the years ended December 31, 20202022 and 2019,2021, respectively.

Accounting for Loans and Financing Receivables

Loans Receivable – Classification, Cost and Revenue Recognition

STORE Capital holds its loans receivable, which are primarily mortgage loans secured by real estate, for long-termlong‑term investment. Loans receivable are carried at amortized cost, including related unamortized discounts or premiums, if any.

The Company recognizes interest income on loans receivable using the effective-interest method applied on a loan-by-loanloan‑by‑loan basis. Direct costs associated with originating loans are offset against any related fees received and the balance, along with any premium or discount, is deferred and amortized as an adjustment to interest income over the term of the related loan receivable using the effective interest method. A loan receivable is placed on nonaccrual status when the loan has become more than 60 days past due, or earlier if management determines that full recovery of the contractually specified payments of principal and interest is doubtful. While on nonaccrual status, interest income is recognized only when received. As of December 31, 20212023 and 2020,2022, the Company had loans receivable with an aggregate outstanding principal balance of $28.8$54.8 million and $39.9$31.8 million, respectively, on nonaccrual status.

Sales-Type and Direct Financing Receivables – Classification, Cost and Revenue Recognition

Sales-type lease receivables are recorded at their net investment, determined as the present value of both the aggregate minimum lease payments and the estimated residual value of the leased property. Direct financing receivables include hybrid real estate investment transactions completed prior to 2019. The Company recorded the direct financing receivables at their net investment, determined as the aggregate minimum lease payments and the estimated residual value of the leased property less unearned income. The unearned income is recognized over the life of the related contracts so as to produce a constant rate of return on the net investment in the asset. Subsequent to the adoption of ASC Topic 842, existing direct financing receivables will continue to be accounted for in the same manner, unless the underlying contracts are modified.

Impairment and Provision for Credit Losses

Effective January 1, 2020, theThe Company adoptedaccounts for provision of credit losses in accordance with ASU 2016-13, Financial Instruments — Credit Losses (Topic 326)(“Topic 326”): Measurement of Credit Losses on Financial Instruments (ASC(“ASC Topic 326)326”) which changed how the Company measures credit losses for loans and financing receivables.

. In accordance with ASC Topic 326, the Company evaluates the collectibility of its loans and financing receivables at the time each financing receivable is issued and subsequently on a quarterly basis utilizing an expected credit loss model based on credit quality indicators. The primary credit quality indicator is the implied credit rating associated with each borrower, utilizing 2two categories, investment grade and non-investment

43


grade. The Company computes implied credit ratings based on regularly received borrower financial statements using Moody’s Analytics RiskCalc. The Company considers the implied credit ratings, loan and financing receivable term to maturity and underlying collateral value and quality, if any, to calculate the expected credit loss over the remaining life of the receivable. Loans are written off against the allowance for credit loss when all or a portion of the principal amount is determined to be uncollectible. For the period from February 3, 2023 through December 31, 2023 and the years ended December 31,2022 and 2021, and 2020, the Company recognized an estimated $3.2$7.7 million, $0.4 million and $1.0$3.2 million, respectively, of net provisions for credit losses related to its loans and financing receivables; the provision for credit losses is included in provisions for impairment on the consolidated statements of income.

61

Prior to2.1 million associated with the adoptionsale of ASC Topic 326,certain loans and financing receivables and the Company periodically evaluateddid not write off any loans receivable. For the collectibilityyear ended December 31, 2022, the Company wrote off $3.7 million of its loans receivable including accrued interest, by analyzing the underlying property level economics and trends, collateral value and quality and other relevant factors in determining the adequacy of its allowanceagainst previously established reserves for loancredit losses. A loan was determined to be impaired when, in management’s judgment based on current information and events, it was probable that the Company would be unable to collect all amounts due according to the contractual terms of the loan agreement. Specific allowances for loan losses were provided for impaired loans on an individual loan basis in the amount by which the carrying value exceeded the estimated fair value of the underlying collateral less disposition costs. The Company did not recognize write off any loan loss provisionsloans during the year ended December 31, 2019.2021.

Accounting for Operating Ground Lease Assets

As part of certain real estate investment transactions, the Company may enter into long-term operating ground leases as a lessee. The Company is required to recognize an operating ground lease (or right-of-use) asset and related operating lease liability for each of these operating ground leases. Operating ground lease assets and operating lease liabilities are recognized based on the present value of the lease payments. The Company uses its estimated incremental borrowing rate, which is the estimated rate at which the Company could borrow on a collateralized basis with similar payments over a similar term, in determining the present value of the lease payments.

Many of these operating lease contracts include options for the Company to extend the lease; the option periods are included in the minimum lease term only if it is reasonably likely the Company will exercise the option(s). Rental expense for the operating ground lease contracts is recognized in property costs on a straight-line basis over the lease term. Some of the contracts have contingent rent escalators indexed to future increases in the CPI and a few contracts have contingent rentals that are based on a percentage of the gross sales of the property; these payments are recognized in expense as incurred. The payment obligations under these contracts are typically the responsibility of the tenants operating on the properties, in accordance with the Company’s leases with the respective tenants. As a result, the Company also recognizes sublease rental revenue on a straight-line basis over the term of the Company’s sublease with the tenant; the sublease income is included in rental revenues.

Cash and Cash Equivalents

Cash and cash equivalents include cash and highly liquid investment securities with maturities at acquisition of three months or less. The Company invests cash primarily in money-marketmoney‑market funds of a major financial institution, consisting predominantly of U.S. Government obligations.

Restricted Cash

Restricted cash may include reserve account deposits held by lenders, including deposits required to be used for future investment in real estate assets, escrow deposits and cash proceeds from the sale of assets held by a qualified intermediary to facilitate tax-deferred exchange transactions under Section 1031 of the Internal Revenue Code. The Company had $5.8$10.8 million and $10.2$4.7 million of restricted cash at December 31, 20212023 and 2020,2022, respectively, which are included in other assets, net, on the consolidated balance sheets.

Deferred Financing and Other Debt Costs

Financing costs related to the issuance of the Company’s long-term debt are deferred and amortized as an increase to interest expense over the term of the related debt instrument using the effective-interest method and are reported as a reduction of the related debt balance on the consolidated balance sheets. Deferred financingCosts paid to a lender as part of a debt issuance are recorded as a debt discount and amortized as an increase to interest expense over the term of the related debt instrument using the effective-interest method and are reported as a reduction of the related debt balance on the consolidated balance sheets. Financing costs related to the establishment of the Company'sCompany’s credit facility are deferred and amortized to interest expense over the term of the credit facility and are included in other assets, net, on the consolidated balance sheets.

44


Derivative Instruments and Hedging Activities

The Company may enter into derivative contracts as part of its overall financing strategy to manage the Company’s exposure to changes in interest rates associated with current and/or future debt issuances. The Company does not use derivatives for trading or speculative purposes. The use of derivative financial instruments carries certain risks, including the risk that the counterparties to these contractual arrangements are not able to perform under the agreements. To mitigate this risk, the Company enters into derivative financial instruments only with counterparties with high credit ratings and with major financial institutions with which the Company may also have other financial relationships. The Company does not anticipate that any of the counterparties will fail to meet their obligations.

62

The Company records its derivatives on the balance sheet at fair value. All derivatives subject to a master netting arrangement in accordance with the associated master International Swap and Derivatives Association agreement have been presented on a net basis by counterparty portfolio for purposes of balance sheet presentation and related disclosures. The accounting for changes in the fair value of derivatives depends on the intended use of the derivative, whether the Company has elected to apply hedge accounting and whether the hedging relationship has satisfied the criteria necessary to apply hedge accounting. Derivatives qualifying as a hedge of the exposure to variability in expected future cash flows, or other types of forecasted transactions, are considered cash flow hedges. Hedge accounting generally provides for the matching of the earnings effect of the hedged forecasted transactions in a cash flow hedge. The changes in the fair value of derivatives designated and that qualify as cash flow hedges isare recorded in accumulated other comprehensive income (loss). Amounts reported in accumulated other comprehensive income (loss) related to cash flow hedges are reclassified to operations as an adjustment to interest expense as interest payments are made on the hedged debt transaction.

As of December 31, 2021,2023, the Company had 020 interest rate swap agreements in place. Eleven of the interest rate swap agreements have an aggregate notional value of $921.1 million, with ten maturing in May 2027 and one maturing in May 2029, are designated cash flow hedges of the Company’s $921.1 million variable-rate bank unsecured term loan which matures in April 2027 (Note 4). Three interest rate swap agreements with an aggregate notional value of $375.0 million maturing in February 2027 are designated cash flow hedges of the Company’s variable-rate unsecured revolving credit facility which matures in February 2027 (Note 4). Six interest rate swap agreements with an aggregate notional value of $592.5 million, two with maturities in February 2027, and four with maturities in July 2028, are designated cash flow hedges of the Company’s $592.5 million floating-rate bank incremental unsecured term loan which matures in July 2026 (Note 4). As of December 31, 2022, the Company had seven derivative instruments in place.

Fair Value Measurement

The Company estimates the fair value of financial and non-financial assets and liabilities based on the framework established in fair value accounting guidance. Fair value is defined as the price that would be received to sell an asset or paid to transfer a liability in an orderly transaction between market participants at the measurement date (an exit price). The hierarchy described below prioritizes inputs to the valuation techniques used in measuring the fair value of assets and liabilities. This hierarchy maximizes the use of observable inputs and minimizes the use of unobservable inputs by requiring the most observable inputs to be used when available. The hierarchy is broken down into three levels based on the reliability of inputs as follows:

Level 1—Quoted market prices in active markets for identical assets and liabilities that the Company has the ability to access.
Level 2—Significant inputs that are observable, either directly or indirectly. These types of inputs would include quoted prices for similar assets or liabilities in active markets, quoted prices for identical assets in inactive markets and market-corroborated inputs.
Level 3—Inputs that are unobservable and significant to the overall fair value measurement of the assets or liabilities. These types of inputs include the Company’s own assumptions.
Level 1—Quoted market prices in active markets for identical assets and liabilities that the Company has the ability to access.
Level 2—Significant inputs that are observable, either directly or indirectly. These types of inputs would include quoted prices for similar assets or liabilities in active markets, quoted prices for identical assets in inactive markets and market‑corroborated inputs.
Level 3—Inputs that are unobservable and significant to the overall fair value measurement of the assets or liabilities. These types of inputs include the Company’s own assumptions.

Share-basedShare‑based Compensation

DirectorsHistorically, directors and key employees of the Company havehad been granted long-termlong‑term incentive awards, including restricted stock awards (RSAs)(“RSAs”) and restricted stock unit awards (RSUs)(“RSUs’), which provideprovided such directors and employees with equity interests as an

45


incentive to remain in the Company’s service and to alignaligned their interests with those of the Company’s stockholders.

The Company estimates the fair value As of RSAs based on the closing price per share of the common stock onMerger, the date of grant and recognizes that amount in general and administrative expense ratably over the vesting period at the greater of the amount amortized on a straight-line basis or the amount vested.

The Company’s RSUs granted in 2017 contain a market condition and a service condition and RSUs granted in 2018 through 2021 contain both a market condition and a performance condition as well as a service condition. The Company values the RSUs with a market condition using a Monte Carlo simulation model and values the RSUs with a performance condition based on the fair value of the awards expected to be earned and recognizes those amounts in general and administrative expense on a tranche-by-tranche basis ratably over the vesting periods.no longer has any equity incentives outstanding.

Income Taxes

As a REIT, the Company generally will not be subject to federal income tax. It is still subject, however, to state and local income taxes and to federal income and excise tax on its undistributed income. STORE Investment Corporation is the Company’s wholly owned taxable REIT subsidiary (TRS)(“TRS”) created to engage in non-qualifyingnon‑qualifying REIT activities. The TRS is subject to federal, state and local income taxes.

The Company provides for income taxes and the related accounts under the asset and liability method. Deferred tax assets and liabilities are determined based on the difference between the financial statement and tax basis of assets and liabilities using enacted tax rates expected to be in effect during the year in which the basis differences reverse. Valuation allowances are established when management determines it is more likely than not that some portion, or all, of the deferred tax assets will not be realized.

63Related Party Transactions

TableIn December 2023, the Company sold certain loans and financing receivables with an aggregate carrying value of Contents$332.0 million for an aggregate purchase price of $327.5 million to PCSD Ivory Private Limited, an entity affiliated with GIC, the Company's majority member. The purchase price was based upon a third party valuation obtained by GIC. The Company recognized a $4.7 million aggregate net loss on the sale which is recorded in the (loss) gain on dispositions of real estate on the consolidated statements of operations.

In connection with the sale, the Company entered into a service contract with PCSD Ivory Private Limited and agreed to perform certain loan servicing and other administrative services with respect to the mortgage loan portfolio on behalf of PCSD Ivory Private Limited in exchange for a servicing fee. The fee income will be recorded as other income on the consolidated statements of operations. No such amounts were recorded for the period from January 1, 2023 through February 2, 2023 or the period from February 3, 2023 through December 31, 2023.

Net Income Per Common Share

Net income per common share has been computed for STORE Capital Corporation pursuant to the guidance in the FASB ASC Topic 260, Earnings Per Share. The guidance requires the classification of the Company’s unvested restricted common shares, which contain rights to receive non-forfeitablenon‑forfeitable dividends, as participating securities requiring the two-classtwo‑class method of computing net income per common share. The following table is a reconciliation of the numerator and denominator used in the computation of basic and diluted net income per common share (dollars in thousands):

Year Ended December 31,


2021

2020

2019


Numerator:


Net income

$

268,348

$

212,614

$

284,975

Less: earnings attributable to unvested restricted shares


(659)


(776)


(403)

Net income used in basic and diluted income per share

$

267,689

$

211,838

$

284,572

Denominator:

Weighted average common shares outstanding


270,693,243


253,055,331


230,030,535

Less: Weighted average number of shares of unvested restricted stock


(587,974)


(520,751)


(296,038)

Weighted average shares outstanding used in basic income per share


270,105,269


252,534,580


229,734,497

Effects of dilutive securities:

Add: Treasury stock method impact of potentially dilutive securities (a)


116,460


555,044

Weighted average shares outstanding used in diluted income per share


270,105,269


252,651,040


230,289,541


Predecessor


Period from
January 1, 2023
through
February 2, 2023


Year Ended
December 31, 2022


Year Ended
December 31, 2021


Numerator:


Net income


$

25,787


$

327,901


$

268,348


Less: Earnings attributable to unvested restricted shares


(41

)


(558

)


(659

)

Net income used in basic and diluted income per share


$

25,746


$

327,343


$

267,689


Denominator:


Weighted average common shares outstanding


282,684,998


280,559,061


270,693,243


Less: Weighted average number of shares of unvested restricted stock


(446,847

)


(453,584

)


(587,974

)

Weighted average shares outstanding used in basic income per share


282,238,151


280,105,477


270,105,269


Effects of dilutive securities:


Add: Treasury stock method impact of potentially dilutive securities (a)


100,254


Weighted average shares outstanding used in diluted income per share


282,338,405


280,105,477


270,105,269


(a)
For the period from January 1, 2023 to February 2, 2023 and the years ended December 31, 2022 and 2021, excludes 197,026 shares, 121,112 shares and 225,424 shares, respectively, related to unvested restricted shares as the effect would have been antidilutive.
(a)For the years ended December 31, 2021, 2020 and 2019, excludes 225,424 shares, 127,136 shares and 122,224 shares, respectively, related to unvested restricted shares as the effect would have been antidilutive.

46


Recent Accounting Pronouncements

From time to time, new accounting pronouncements are issued by the FASB or the SEC. The Company adopts the new pronouncements as of the specified effective date. When permitted, the Company may elect to early adopt the new pronouncements. Unless otherwise discussed, these new accounting pronouncements include technical corrections to existing guidance or introduce new guidance related to specialized industries or entities and, therefore, will have minimal, if any, impact on the Company’s financial position, results of operations or cash flows upon adoption.

In March 2020,November 2023, the FASB issued ASU 2020-04, Reference Rate Reform2023-07, Segment Reporting (Topic 848)280): Facilitation of the Effects of Reference Rate Reform on Financial Reporting. ASU 2020-04 contains practical expedientsImprovements to Reportable Segment Disclosures, effective for reference rate reform related activities that impact debt, leases, derivativesfiscal years, beginning after December 15, 2023 and other contracts. The guidance in ASU 2020-04 is optional and may be elected over time as reference rate reform activities occur. During the first quarter of 2020,interim periods within fiscal years beginning after December 15, 2024. While STORE only has one reportable segment, the Company elected to applyis currently evaluating the hedge accounting expedients related to probability andpotential impact the assessmentsadoption of effectiveness forASU 2023-07 will have on its future LIBOR-indexed cash flows to assume that the index upon which future hedged transactions will be based matches the index on the corresponding derivatives. Application of these expedients preserves the presentation of derivatives consistent with past presentation. The Company continues to evaluate the impact of the guidance and may apply other elections as applicable as additional changes in the market occur.disclosures.

In April 2020,December 2023, the FASB issued a Staff Question & Answer (“Q&A”) which was intendedASU 2023-09, Income Taxes (Topic 740):Improvements to reduce the challenges ofIncome Tax Disclosures effective for annual periods beginning after December 15, 2024. The Company is currently evaluating the enforceable rights and obligationspotential impact the adoption of leases for concessions granted to lessees in responseASU 2023-09 will have on the consolidated financial statements or notes to the COVID-19 pandemic. The Q&A allows both lessors and lessees to elect not to evaluate whether concessions provided in response to the COVID-19 pandemic are lease modifications. This relief is subject to certain conditions being met, including ensuring the total lease payments are substantially the same or less as compared to the original lease payments prior to the concession being granted. The Company, as lessor, has elected to apply such relief and will therefore not evaluate whether lease concessions that were granted in response to the COVID-19 pandemic meet the definition of a lease modification. The Company, as a lessee, has not received any concessions under its ground or other lease agreements resulting from the COVID-19 pandemic.

consolidated financial statements.

64

3. Investments

At December 31, 2021,2023, STORE Capital had investments in 2,8663,206 property locations representing 2,8113,168 owned properties (of which 72144 are accounted for as financing arrangements and 236 are accounted for as direct financing receivables)sales-type leases),24 properties where all the related land is subject to an operating ground lease and 3114 properties which secure mortgage loans. The gross investment portfolio totaled $10.7$14.8 billion at December 31, 20212023 and consisted of the gross acquisition cost of the real estate investments totaling $10.0$13.6 billion, including an offset by intangible lease liabilities totaling $148.7 million, loans and financing receivables with an aggregate carrying amount of $697.3 million$1.1 billion and operating ground lease assets totaling $33.3$52.1 million. As of December 31, 2021,2023, approximately 36%33% of these investments are assets of consolidated special purpose entity subsidiaries and are pledged as collateral under the non-recoursenon‑recourse obligations of these special purpose entities (Note 4).

47


The gross dollar amount of the Company’s investments includes the investment in land, buildings, improvements and lease intangibles related to real estate investments as well as the carrying amount of the loans and financing receivables and operating ground lease assets. During 2019, 2020For the period from January 1, 2023 to February 2, 2023, for the period from February 3, 2023 through December 31, 2023 and for the years ended December 31, 2022 and 2021, the Company had the following gross real estate and other investment activity (dollars in thousands):


Number of


Dollar


Investment

Amount of


Locations

Investments


Gross investments, December 31, 2018


2,255


7,605,070

Acquisition of and additions to real estate (a)(b)(c)


305


1,440,399

Investment in loans and direct financing receivables (d)


48


262,552

Sales of real estate


(95)


(415,736)

Principal collections on loans and direct financing receivables (e)


(9)


(29,952)

Operating ground lease assets, net (f)

24,254

Provisions for impairment

(18,751)

Other (c)


(12,915)

Gross investments, December 31, 2019


2,504


8,854,921

Acquisition of and additions to real estate (a)(g)


203


959,842

Investment in loans and direct financing receivables (d)


11


156,721

Sales of real estate


(72)


(222,556)

Principal collections on loans and direct financing receivables (e)


(12)


(80,521)

Net change in operating ground lease assets (f)

10,429

Provisions for impairment

(23,003)

Adoption of expected credit loss standard (ASC Topic 326)

(2,465)

Other


(13,602)

Gross investments, December 31, 2020


2,634


9,639,766

Acquisition of and additions to real estate (a)(e)(h)


307

1,427,278

Investment in loans and direct financing receivables (e)


29

125,049

Sales of real estate


(103)

(339,658)

Principal collections on loans and direct financing receivables (e)


(1)

(61,942)

Net change in operating ground lease assets (f)

(1,365)

Provisions for impairment

(24,979)

Other

(15,212)

Gross investments, December 31, 2021 (i)


10,748,937

Less accumulated depreciation and amortization (i)


(1,161,197)

Net investments, December 31, 2021


2,866

$

9,587,740


Successor


Predecessor


Number of


Dollar


Number of


Dollar


Investment


Amount of


Investment


Amount of


Locations


Investments


Locations


Investments


Gross investments, December 31, 2020


2,634


$

9,639,766


Acquisition of and additions to real estate (a)(b)(c)


307


1,427,278


Investment in loans and direct financing receivables


29


125,049


Sales of real estate


(103

)


(339,658

)

Principal collections on loans and direct financing receivables (b)


(1

)


(61,942

)

Net change in operating ground lease assets (d)


(1,365

)

Provisions for impairment


(24,979

)

Other


(15,212

)

Gross investments, December 31, 2021


2,866


10,748,937


Acquisition of and additions to real estate (a)(b)(e)(f)


256


1,475,499


Investment in loans and direct financing receivables


28


158,676


Sales of real estate


(60

)


(197,530

)

Principal collections on loans and direct financing receivables (b)


(6

)


(76,868

)

Net change in operating ground lease assets (d)


(1,446

)

Provisions for impairment


(16,428

)

Other


(10,997

)

Gross investments, December 31, 2022


3,084


12,079,843


Acquisition of and additions to real estate (a)(g)


19


42,452


Investment in loans and direct financing receivables


1


82,112


Sales of real estate


(1

)


(760

)

Principal collections on loans and direct financing receivables


(2

)


(468

)

Net change in operating ground lease assets (d)


(125

)

Other


4,430


Gross investments, February 2, 2023


3,101


$

12,207,484


Gross investments, February 3, 2023


3,101


$

14,201,731


Acquisition of and additions to real estate (a)(h)


112


517,624


Investment in loans and direct financing receivables


40


598,990


Sales of real estate, loans and direct financing receivables (i)


(40

)


(404,939

)


Principal collections on loans and direct financing receivables


(7

)


(74,408

)


Net change in operating ground lease assets (d)


(737

)


Provisions for impairment


(25,265

)


Other


(11,362

)


Gross investments, December 31, 2023 (j)


14,801,634


Less accumulated depreciation and amortization (j)


(523,181

)


Net investments, December 31, 2023


3,206


$

14,278,453


(a)
For years ended December 31, 2021 and 2022, the period from January 1, 2023 through February 2, 2023 and the period from February 3, 2023 through December 31, 2023 includes $0.8 million, $2.3 million, $0.2 million and $2.9 million, respectively, of interest capitalized to properties under construction.
(a)Includes $1.6 million during 2019, $0.8 million during 2020 and $0.8 million during 2021 of interest capitalized to properties under construction.
(b)Excludes $36.5 million of tenant improvement advances disbursed in 2019 which were accrued as of December 31, 2018.
(c)During the year ended December 31, 2019, the Company completed a $21.2 million substitution transaction in which 10 properties the Company owned and leased to a single tenant were substituted for 10 other properties the tenant previously owned and are now leased to that same tenant; the Company recognized a $3.9 million non-cash gain on this transaction which is included in net gain on dispositions of real estate in the consolidated statement of income.
(d)For the years ended December 31, 2019 and 2020 includes $9.0 million and $3.2 million, respectively, related to mortgage loans made to the purchasers of a real estate properties sold.
(b)
For the years ended December 31, 2021, and 2022 includes $42.8 million, and $8.9 million, respectively of non-cash principal collection transactions in which the Company acquired the underlying collateral property (buildings and improvements) and leased them back to a customer.
(c)
Excludes $21.2 million of tenant improvement advances disbursed in 2021 which were accrued as of December 31, 2020.
(d)
Represents amortization recognized on operating ground lease assets for the years ended December 31, 2021 and 2022 and for the periods from January 1, 2023 through February 2, 2023 and February 3, 2023 through December 31, 2023.
(e)
Excludes $22.6 million of tenant improvement advances disbursed in 2022 which were accrued as of December 31, 2021.
(f)
Includes $10.6 million of tenant funded improvements during 2022.
(g)
Excludes $5.2 million of tenant improvement advances disbursed from January 1, 2023 to February 2, 2023 which were accrued as of December 31, 2022.
(h)
Excludes $15.1 million of tenant improvement advances disbursed from February 3, 2023 to December 31, 2023 which were accrued as of February 2, 2023.
(i)
Includes the sale of certain loans and financing receivables with an aggregate carrying value of $332.0 million to a related party.
(j)
Includes the below-market lease liabilities ($148.7 million) and the accumulated amortization ($8.2 million) of the liabilities recorded on the consolidated balance sheets as intangible lease liabilities as of December 31, 2023.

6548


(e)For the years ended December 31, 2019, 2020, and 2021 includes $13.6 million, $30.6 million, and $42.8 million, respectively of non-cash principal collection transactions in which the Company acquired the underlying collateral property (buildings and improvements) and leased them back to the borrowers.
(f)During the year ended December 31, 2019, includes $20.0 million of operating ground lease (or right-of-use) assets recognized upon initial adoption of ASC Topic 842 and $4.3 million of activity (new operating ground lease assets recognized net of amortization); during the year ended December 31, 2020, includes new operating ground lease assets recognized net of amortization and during the year ended December 31, 2021, represents amortization.
(g)Excludes $16.9 million of tenant improvement advances disbursed in 2020 which were accrued as of December 31, 2019.
(h)Excludes $21.2 million of tenant improvement advances disbursed in 2021 which were accrued as of December 31, 2020.
(i)Includes the dollar amount of investments ($27.1 million) and the accumulated depreciation and amortization ($1.9 million) related to real estate investments held for sale at December 31, 2021.

The following table summarizes the revenues the Company recognized from its investment portfolio (in thousands):

Year Ended December 31,


2021

2020

2019


Rental revenues:


Operating leases (a)(c)

$

728,477

$

644,733

$

625,477

Sublease income - operating ground leases (b)

2,809

2,096

2,227

Amortization of lease related intangibles and costs


(2,225)


(2,331)


(2,289)

Total rental revenues

$

729,061

$

644,498

$

625,415

Interest income on loans and financing receivables:

Mortgage and other loans receivable (c)

$

24,959

$

18,097

$

13,866

Sale-leaseback transactions accounted for as financing arrangements


17,883


15,376

��


5,785

Direct financing receivables


7,979


11,815


14,175

Total interest income on loans and financing receivables

$

50,821

$

45,288

$

33,826


Successor


Predecessor


Period from
February 3, 2023
through
December 31, 2023


Period from
January 1, 2023
through
February 2, 2023


Year Ended
December 31, 2022


Year Ended
December 31, 2021


Rental revenues:


Operating leases (a)(c)


$

862,891


$

75,005


$

845,880


$

728,477


Sublease income - operating ground leases (b)


2,577


234


2,812


2,809


Amortization of lease related intangibles and costs


5,239


(231

)


(2,272

)


(2,225

)

Total rental revenues


$

870,707


$

75,008


$

846,420


$

729,061


Interest income on loans and financing receivables:


Mortgage and other loans receivable


$

33,885


$

2,434


$

26,667


$

24,959


Sale-leaseback transactions accounted for as
   financing arrangements


31,760


2,444


24,140


17,883


Sales-type and direct financing receivables


10,822


448


5,969


7,979


Total interest income on loans and financing receivables


$

76,467


$

5,326


$

56,776


$

50,821


(a)
For the period from February 3, 2023 through December 31, 2023, the period from January 1, 2023 through February 2, 2023 and the years ended December 31, 2022 and 2021, includes $3.3 million, $252,000, $3.1 million and $2.6 million, respectively, of property tax tenant reimbursement revenue and includes $1.0 million, $24,000, $1.0 million and $11.2 million, respectively, of variable lease revenue.
(a)For the years ended December 31, 2021, 2020 and 2019, includes $2.6 million, $2.5 million and $2.6 million, respectively, of property tax tenant reimbursement revenue and includes variable lease revenue of $11.2 million, $4.0 million and $123,000 for the years ended December 31, 2021, 2020 and 2019, respectively.
(b)Represents total revenue recognized for the sublease of properties subject to operating ground leases to the related tenants; includes both payments made by the tenants to the ground lessors and straight-line revenue recognized for scheduled increases in the sublease rental payments.
(c)For the years ended December 31, 2021 and 2020, includes $8.3 million and $57.1 million, respectively, of revenue that has been recognized related to rent and financing relief arrangements granted as a result of the COVID-19 pandemic with a corresponding increase in receivables which are included in other assets, net on the consolidated balance sheet.
(b)
Represents total revenue recognized for the sublease of properties subject to operating ground leases to the related tenants; includes both payments made by the tenants to the ground lessors and straight-line revenue recognized for scheduled increases in the sublease rental payments.
(c)
For the years ended December 31, 2022 and 2021, includes $1.5 million and $8.3 million, respectively, of revenue that has been recognized related to rent and financing relief arrangements granted as a result of the COVID-19 pandemic with a corresponding increase in receivables which are included in other assets, net on the consolidated balance sheet.

The Company has elected to account for the lease and nonlease components in its lease contracts as a single component if the timing and pattern of transfer for the separate components are the same and, if accounted for separately, the lease component would classify as an operating lease.

Significant Credit and Revenue Concentration

STORE Capital’s real estate investments are leased or financed to 556615 customers who operate their businesses across 137 industries geographically dispersed throughout 49 states. The primary sectors of the U.S. economy and their proportionate dollar amount of STORE Capital’s investment portfolio at December 31, 2023 are service at 61%, service-oriented retail at 14% and manufacturing at 25%. Only 1one state, Texas (11%(11%), accounted for 10%10% or more of the total dollar amount of STORE Capital’s investment portfolio at December 31, 2021. NaN2023. None of the Company’s customers represented more than 10%10% of the Company’s real estate investment portfolio at December 31, 2021,2023, with the largest customer representing 2.9%2.6% of the total investment portfolio. On an annualized basis, as of December 31, 2021,2023, the largest customer represented 3.0%approximately 2.5% of the Company’s total investment portfolio revenues and the Company’s customers operated their businesses across approximately 855 concepts; the largest of these concepts represented 2.2% of the Company’s total investment portfolio revenues.

66

The following table shows information regarding the diversification of the Company’s total investment portfolio among the different industries in which its tenants and borrowers operate as of December 31, 2021 (dollars in thousands):


Percentage of


Number of

Dollar

Total Dollar


Investment

Amount of

Amount of


Locations

Investments

Investments


Restaurants


745


$

1,289,432


12

%  

Early childhood education centers


267

630,758


6

Metal fabrication


109

612,591


6

Automotive repair and maintenance


223

570,851


5

Health clubs


90

539,279


5

Furniture stores


59

403,899


4

Farm and ranch supply stores


41

377,293


3

All other service industries


994

3,834,493


36

All other retail industries


140

1,046,502


10

All other manufacturing industries


198

1,443,839


13

Total


2,866


$

10,748,937


100

%  

.

Real Estate Investments

The weighted average remaining noncancelable lease term of the Company’s operating leases with its tenants at December 31, 20212023 was approximately 13.413.7 years. Substantially all the leases are triple net, which means that the lessees are responsible for the payment of all property operating expenses, including property taxes, maintenance and insurance; therefore, the Company is generally not responsible for repairs or other capital expenditures related to the properties while the triple-net leases are in effect. At December 31, 2021, 152023, 24 of the Company’s properties were vacant and not subject to a lease.

49


Scheduled future minimum rentals to be received under the remaining noncancelable term of the operating leases in place as of December 31, 20212023 are as follows (in thousands):

2022

$

806,925

2023

806,159

2024


797,889

2025


794,250

2026


787,264

Thereafter


6,808,984

Total future minimum rentals (a)

$

10,801,471

2024


$

957,206


2025


955,946


2026


948,413


2027


936,972


2028


917,439


Thereafter


7,786,944


Total future minimum rentals (a)


$

12,502,920


(a)
Excludes future minimum rentals to be received under lease contracts associated with sale-leaseback transactions accounted for as financing arrangements. See Loans and Financing Receivables section below.
(a)Excludes future minimum rentals to be received under lease contracts associated with sale-leaseback transactions accounted for as financing arrangements. See Loans and Financing Receivables section below.

Substantially all the Company’s leases include 1one or more renewal options (generally 2two to 4 fourfive-year options). Since lease renewal periods are exercisable at the option of the lessee, the preceding table presents future minimum lease payments due during the initial lease term only. In addition, the future minimum lease payments presented above do not include any contingent rentals such as lease escalations based on future changes in CPI.

67

Intangible Lease Assets

The following details intangible lease assets and related accumulated amortization at December 31 (in thousands):


2021


2020


Successor


Predecessor


2023


2022


In-place leases


$

35,522


$

37,440


$

577,808


$

42,519


Ground lease-related intangibles

19,449

19,449


19,449


Above-market leases

4,745


37,519


Total intangible lease assets

54,971

61,634


615,327


61,968


Accumulated amortization

(25,285)

(27,935)


(51,650

)


(27,278

)

Net intangible lease assets


$

29,686


$

33,699


$

563,677


$

34,690


Aggregate lease intangible asset amortization included in depreciation and amortization expense was $3.5$50.7 million, $4.3$0.3 million, and $5.4$3.7 million, duringfor the yearsperiod from February 3, 2023 through December 31, 2023, the period from January 1, 2023 through February 2, 2023 and for the year ended December 31, 2021, 2020 and 2019,2022 respectively. The amount amortized as a decrease to rental revenue for capitalized above-marketabove‑market lease intangibles was $0.2$2.8 million $1.0 millionduring the period from February 3, 2023 through December 31, 2023. For the period from January 1, 2023 through February 2, 2023 and $1.1 million for the yearsyear ended December 31, 2021, 2020 and 2019, respectively.2022, there was no amortization of above-market lease intangibles.

Based on the balance of the intangible lease assets as of December 31, 2021,2023, the aggregate amortization expense is expected to be $3.2 million in 2022, $2.8 million in 2023, $2.3$52.9 million in 2024, $1.8$50.6 million in 2025, and $1.7$48.9 million in 2026.2026, $47.2 million in 2027, $44.7 million in 2028 and $284.6 million thereafter. The amount expected to be amortized as a decrease to rental revenue is expected to be $2.9 million in 2024, $2.8 million in 2025, $2.8 million in 2026, $2.8 million in 2027, $2.6 million in 2028 and $20.9 million thereafter. The weighted average remaining amortization period is approximately seven12.4 years for the in-placein‑place lease intangibles, and approximately 4214.3 years for the amortizing ground lease-relatedabove market lease intangibles.

Intangible Lease Liabilities

The following details intangible lease liabilities and related accumulated amortization (in thousands) as of December 31, 2023. There were no intangible lease liabilities as of December 31, 2022.


Below-market leases


$

148,686


Accumulated amortization


(8,170

)

Net intangible lease liabilities


$

140,516


50


Lease intangible liabilities are amortized as an increase to rental revenues. For the period from February 3, 2023 through December 31, 2023, amortization was $8.3 million. Based on the balance of the intangible liabilities at December 31, 2023, the amortization included in rental revenue is expected to be $8.9 million in 2024, $8.9 million in 2025, $8.8 million in 2026, $8.7 million in 2027, $8.4 million in 2028 and $96.8 million thereafter. The weighted average remaining amortization period, including extension periods, is approximately 23.1 years.

Operating Ground Lease Assets

As of December 31, 2021,2023, STORE Capital had operating ground lease assets aggregating $33.3$52.1 million. Typically, the lease payment obligations for these leases are the responsibility of the tenants operating on the properties, in accordance with the Company’s leases with those respective tenants. The Company recognized total lease cost for these operating ground lease assets of $3.3$3.2 million, $2.4$273,000, $3.3 million, and $2.3$3.3 million duringfor the period from February 3, 2023 through December 31, 2023 the period from January 1, 2023 through February 2, 2023 and for the years ended December 31, 2022, and 2021 2020, and 2019, respectively. For the years ended December 31, 2021, 2020, and 2019 theThe Company also recognized, in rental revenues, $2.8 million, $2.1 million, and $2.2 million, respectively, of sublease revenue associated with its operating ground leases.leases of $2.6 million, $234,000, $2.8 million and $2.8 million for the period from February 3, 2023 through December 31, 2023 and the period from January 1, 2023 through February 2, 2023 and for the years ended December 31, 2022 and 2021 respectively. The Company’s ground leases have remaining terms ranging from one year to 9088 years, some of which have one or more options to extend the lease for terms ranging from three years to ten years.years. The weighted average remaining non-cancelable lease term for the ground leases was 22 years at December 31, 2021.2023. The weighted average discount rate used in calculating the operating lease liabilities was 5.7%.5.8 %.

The future minimum lease payments to be paid under the operating ground leases as of December 31, 20212023 were as follows (in thousands):


Ground


Ground

Leases

Leases

Paid by

Paid by

STORE Capital's

STORE Capital

Tenants (a)

Total


2022

$

401

$

2,607

$

3,008

2023

4,149

2,629

6,778

2024


55


2,711


2,766

2025


57


2,395


2,452

2026


57


2,232


2,289

Thereafter


3,071


44,509


47,580

Total lease payments

7,790

57,083

64,873

Less imputed interest


(2,922)


(28,293)


(31,215)

Total operating lease liabilities - ground leases

$

4,868

$

28,790

$

33,658


Ground


Ground


Leases


Leases


Paid by


Paid by


STORE Capital's


STORE Capital


Tenants (a)


Total


2024


$

55


$

2,711


$

2,766


2025


57


2,725


2,782


2026


57


2,731


2,788


2027


57


2,731


2,788


2028


57


2,761


2,818


Thereafter


3,316


100,262


103,578


Total lease payments


3,599


113,921


117,520


Less imputed interest


(2,975

)


(68,681

)


(71,656

)

Total operating lease liabilities - ground leases


$

624


$

45,240


$

45,864


(a)
STORE Capital’s tenants, who are generally sub-tenants under the ground leases, are responsible for paying the rent under these ground leases. In the event the tenant fails to make the required ground lease payments, the Company would be primarily responsible for the payment, assuming the Company does not re-tenant the property or sell the leasehold interest. Of the total $113.9 million commitment, $79.6 million is due for periods beyond the current term of the Company’s leases with the tenants. Amounts exclude contingent rent due under three leases where the ground lease payment, or a portion thereof, is based on the level of the tenant's sales.
(a)STORE Capital’s tenants, who are generally sub-tenants under the ground leases, are responsible for paying the rent under these ground leases. In the event the tenant fails to make the required ground lease payments, the Company would be primarily responsible for the payment, assuming the Company does not re-tenant the property or sell the leasehold interest. Of the total $57.1 million commitment, $19.0 million is due

6851


for periods beyond the current term of the Company’s leases with the tenants. Amounts exclude contingent rent due under 3 leases where the ground lease payment, or a portion thereof, is based on the level of the tenant’s sales.

Loans and Financing Receivables

The Company’s loans and financing receivables are summarized below (dollars in thousands):

Interest

Maturity

December 31,


Type

Rate (a)

Date

2021

2020


NaN mortgage loans receivable

7.95

%  

2022 - 2026

$

114,911

$

101,793

NaN mortgage loans receivable


8.62

%  

2032 - 2037


14,444


14,673

NaN mortgage loans receivable (b)


8.60

%  

2051 - 2060


216,547


185,525

Total mortgage loans receivable


345,902


301,991

Equipment and other loans receivable

7.89

%  

2022 - 2029

25,409

31,636

Total principal amount outstanding—loans receivable


371,311


333,627

Unamortized loan origination costs


1,046


1,206

Sale-leaseback transactions accounted for as financing arrangements (c)

7.71

%  

2034 - 2043

255,483

204,469

Direct financing receivables


78,637


117,047

Allowance for credit and loan losses (d)

(9,208)

(6,028)

Total loans and financing receivables

$

697,269

$

650,321


Successor


Predecessor


Type


Interest
Rate (a)


Maturity
Date


December 31,
2023


December 31,
2022


Nine mortgage loans receivable (b)


8.83%


2024 - 2056


125,093


345,675


Equipment and other loans receivable


7.97%


2024 - 2036


13,958


15,842


Total principal amount outstanding—loans receivable


139,051


361,517


Unamortized loan origination costs


61


1,011


Unamortized loan premium


664


Sale-leaseback transactions accounted for as
   financing arrangements (c)


8.43%


2034 - 2122


839,902


369,604


Sales-type and direct financing receivables


131,969


60,899


Allowance for credit and loan losses (d)


(7,716

)


(5,925

)

Total loans and financing receivables


$

1,103,931


$

787,106


(a)
Represents the weighted average interest rate as of the balance sheet date.
(a)Represents the weighted average interest rate as of the balance sheet date.
(b)NaN of these mortgage loans allow for prepayment in whole, but not in part, with penalties ranging from 20% to 70% depending on the timing of the prepayment.
(c)In accordance with ASC Topic 842, represents sale-leaseback transactions accounted for as financing arrangements rather than as investments in real estate subject to operating leases. Interest rate shown is the weighted average initial rental or capitalization rate on the leases; the leases mature between 2034 and 2043 and the purchase options expire between 2024 and 2041.
(d)Balance includes $2.5 million of loan loss reserves recognized prior to December 31, 2019, $2.5 million credit loss reserves recognized upon the adoption of ASC Topic 326 on January 1, 2020, and $4.2 million of credit losses recognized since the adoption of ASC Topic 326.
(b)
One of these mortgage loans allows for prepayment in whole, but not in part, with penalties ranging from 20% to 70% depending on the timing of the prepayment.
(c)
In accordance with ASC Topic 842, represents sale-leaseback transactions accounted for as financing arrangements rather than as investments in real estate subject to operating leases. Interest rate shown is the weighted average initial rental or capitalization rate on the leases; the leases mature between 2034 and 2122 and the purchase options expire between 2024 and 2073.
(d)
Balance includes $7.7 million of net credit losses recognized during the period from February 3, 2023 through December 31, 2023 which includes a reduction of $2.1 million associated with the sale of certain loans and financing receivables.

Loans Receivable

At December 31, 2021,2023, the Company held 4421 loans receivable with an aggregate carrying amount of $364.8$138.8 million. NaNNine of the loans are mortgage loans secured by land and/or buildings and improvements on the mortgaged property; the interest rates on 12five of the mortgage loans are subject to increases over the term of the loans. NaNTwo of the mortgage loans are shorter-term loans (maturing prior to 2027)2036) that generally require monthly interest-only payments of principal and interest with a balloon payment at maturity. The remaining mortgage loans receivable generally requirerequires the borrowers to make monthly principal and interest payments based on a 40-year20 to 40-year amortization period with a balloon payments,payment, if any, at maturity or earlier upon the occurrence of certain other events. The equipment and other loans generally require the borrower to make monthly interest-onlyprincipal and interest payments with a balloon payment, if any, at maturity.

69

The long-term mortgage loans receivable generally allow for prepayments in whole but not in part, without penalty or with penalties ranging from 1%1% to 20%15%, depending on the timing of the prepayment, except as noted in the table above. All other loans receivable allow for prepayments in whole or in part without penalty. Absent prepayments, scheduled maturities are expected to be as follows (in thousands):


Scheduled


Principal

Balloon

Total

Payments

Payments

Payments


2022

$

3,135

$

30,680

$

33,815

2023

3,290

81,631

84,921

2024


2,157


2,157

2025


2,042


510


2,552

2026


2,061


20,371


22,432

Thereafter


174,588


50,846


225,434

Total principal payments

$

187,273

$

184,038

$

371,311


Scheduled


Principal


Balloon


Total


Payments


Payments


Payments


2024


$

1,316


$

13,997


$

15,312


2025


1,174


1,174


2026


1,297


359


1,655


2027


1,167


311


1,479


2028


1,122


1,593


2,715


Thereafter


64,924


51,792


116,716


Total principal payments


$

71,000


$

68,051


$

139,051


Sale-Leaseback Transactions Accounted for as Financing Arrangements

As of December 31, 20212023 and 2020,2022, the Company had $255.5$839.9 million and $204.5$369.6 million, respectively, of investments acquired through sale-leaseback transactions accounted for as financing arrangements rather than as investments in real estate subject to an

52


operating lease; revenue from these arrangements is recognized in interest income rather than as rental revenue. The scheduled future minimum rentals to be received under these agreements (which will be reflected in interest income) as of December 31, 2021,2023, were as follows (in thousands):

2022

$

19,939

2023

20,016

2024


20,150

2025


20,291

2026


20,384

Thereafter


259,114

Total future scheduled payments

$

359,894

2024


$

66,762


2025


67,683


2026


68,705


2027


69,757


2028


70,839


Thereafter


2,550,346


Total future scheduled payments


$

2,894,092


Sales-Type and Direct Financing Receivables

As of December 31, 20212023 and 2020,2022, the Company had $78.6$132.0 million and $117.0$60.9 million, respectively, of investments accounted for as sales-type leases or direct financing leases that were recorded under previous accounting guidance; the components of these investments were as follows (in thousands):

2021

2020

Minimum lease payments receivable

$

159,371


$

242,694

Estimated residual value of leased assets


8,938


14,800

Unearned income


(89,672)


(140,447)

Net investment

$

78,637

$

117,047


Successor


Predecessor


December 31,
2023


December 31,
2022


Minimum lease payments receivable


$

365,516


$

119,839


Estimated residual value of leased assets


1,521


6,889


Unearned income


(235,067

)


(65,829

)

Net investment


$

131,969


$

60,899


As of December 31, 2021,2023, the future minimum lease payments to be received under the direct financingsales-type lease receivables areexpectedtoaverage approximately $8.0 $11.4million for each of the next five years and $111.7$308.0 million thereafter.

Provision for Credit Losses

In accordance with ASC Topic 326, the Company evaluates the collectibility of its loans and financing receivables at the time each financing receivable is issued and subsequently on a quarterly basis utilizing an expected credit loss model based on credit quality indicators. The Company groups individual loans and financing receivables based on the implied credit rating associated with each borrower. Based on credit quality indicators as of December 31, 2021, $102.42023, $120.0 million of loans and financing receivables were categorized as investment grade and $603.0$991.0 million were categorized as non-investment grade. During the year endedperiod from February 3, 2023 through December 31, 2021,2023, there were $3.2$7.7 million of net provisions for credit losses recognized 0which includes a reduction of $2.1 million associated with the sale of certain loans and financing receivables, no write-offs charged against the allowance and 0no recoveries of amounts previously written off.

70

As of December 31, 2021,2023, the year of origination for loans and financing receivables with a credit quality indicator of investment grade was NaN$3.7 million in 2023, $14.8 million in 2022, $8.2 million in 2021, $2.5 millionnone in 2020, $55.5$93.0 million in 2019 NaN in 2018 and 2017$ and $44.40.3 million prior to 2017.2019. The year of origination for loans and financing receivables with a credit quality indicator of non-investment grade was $64.6$648.4 million in 2023, $77.7 million in 2022, $61.6 million in 2021, $174.4$12.3 million in 2020, $176.9$128.4 million in 2019 $25.4 million in 2018, $50.9 million in 2017 and $110.8$62.6 million prior to 2017.2019.

4. Debt

Credit Facility

TheIn connection with the completion of the Merger on February 3, 2023, the Company has anrepaid all amounts outstanding under, and terminated, the previous unsecured revolving credit facility agreement. At the time of repayment, the outstanding balance on the previous unsecured revolving credit facility was $600.0 million. Concurrently, the Company entered into a credit agreement (the “Unsecured Credit Agreement”) with a group of lenders thatwhich initially provided for a senior unsecured revolving credit facility of up

53


to $500.0 million (the “Unsecured Revolving Credit Facility”) and an unsecured, variable-rate term loan which is used to partially fund real estate acquisitions pendingdiscussed in more detail in the issuance of long-term, fixed-rate debt.section titled “Unsecured Notes and Term Loans Payable, net” below. In June 2021,March, October and December 2023, the Company amendedentered into incremental amendments of the credit facility;existing Unsecured Credit Agreement which increased the amended facility has immediate availability of $600 million and an accordion feature of $1.0 billion, which allows the sizecapacity of the facility by an aggregate amount of $253.9 million, respectively, to be increased up to $1.6 billion.an immediate borrowing availability of $753.9 million as of December 31, 2023. The facilityUnsecured Revolving Credit Facility matures in June 2025February 2027 and includes 2 twosix-month extension options, subject to certain conditions and the payment of a 0.0625%0.075% extension fee. At December 31, 2021,2023, the Company had $130.0$375.0 million of borrowings outstanding on the facility.

Borrowings under the facilityUnsecured Revolving Credit Facility require monthly payments of interest at a rate selected by the Company of either (1) LIBORSOFR plus an adjustment of 0.10% plus a credit spread ranging from 0.70%1.00% to 1.40%1.45%, or (2) the Base Rate, as defined in the credit agreement,Unsecured Credit Agreement, plus a credit spread ranging from 0.00%0.00% to 0.40%0.45%. The credit spread used is based on the Company’s credit ratingconsolidated total leverage ratio as defined in the credit agreement.Unsecured Credit Agreement. The Company is required to pay a facility fee on the total commitment amount ranging from 0.10%0.15% to 0.30%.0.30% based on the Company’s consolidated total leverage ratio. Currently, the applicable credit spread for LIBOR-basedSOFR-based borrowings is 0.85%1.10% and the facility fee is 0.20%0.20%.

In May 2023, the Company entered into two interest rate swap agreements with an aggregate notional amount of $325.0 million that effectively converted a portion of the outstanding borrowings on the Unsecured Revolving Credit Facility to an all-in fixed rate of 4.524%. In November 2023, the Company entered into four additional interest rate swap agreements with an aggregate notional amount of $330.0 million which were initially designated to the Unsecured Revolving Credit Facility and redesignated to the December 2023 Unsecured Term Loan, as defined in the section titled “Unsecured Notes and Term Loans Payable, net” below, upon issuance in December 2023. Additionally, in December 2023, the Company entered into one interest rate swap agreement with a notional value of $50.0 million. As of December 31, 2023, three interest rate swaps with an aggregate notional amount of $375.0 million remain designated to the Unsecured Revolving Credit Facility and effectively convert the outstanding borrowings to an all-in fixed rate of 4.595%.

Under the terms of the facility,Unsecured Credit Agreement, the Company is subject to various restrictive financial and nonfinancial covenants which, among other things, require the Company to maintain certain leverage ratios, cash flow and debt service coverage ratios and secured borrowing ratios. Certain of these ratios are based on the Company’s pool of unencumbered assets, which aggregated approximately $6.8$9.9 billion at December 31, 2021.

2023. The facility is recourse to the Company and, as of December 31, 2021,2023, the Company was in compliance with the covenants under the facility.

The Unsecured Credit Agreement also includes capacity for uncommitted incremental term loans and revolving commitments, whether in the form of additional facilities or an increase to the existing facilities, up to an aggregate amount for all revolving commitments and term loans under the Unsecured Credit Agreement of $3.2 billion as amended in December 2023.

At December 31, 20212023 and 2020,December 31, 2022, unamortized financing costs related to the Company’s credit facility totaled $3.7$6.0 million and $1.1$2.6 million, respectively, and are included in other assets, net, on the consolidated balance sheets.

Unsecured Notes and Term Loans Payable, net

ThePrior to the Merger, the Company has completed 4four public offerings of ten-year unsecured notes (Public Notes)(“Public Notes”). In March 2018, February 2019 and November 2020, the Company completed public offerings of $350$350.0 million each in aggregate principal amount. In November 2021, the Company completed a public offering of $375$375.0 million in aggregate principal amount. The Public Notes have coupon rates of 4.50%4.50%, 4.625%4.625%, 2.75%2.75%, and 2.70%2.70%, respectively, and interest is payable semi-annually in arrears in March and September of each year for the 2018 and 2019 Public Notes, May and November of each year for the 2020 Public Notes, and June and December of each year for the 2021 Public Notes. The notes were issued at 99.515%, 99.260%, 99.558%, and 99.877%, respectively, of their principal amounts.

The supplemental indentures governing the Public Notes contain various restrictive covenants, including limitations on the Company’s ability to incur additional secured and unsecured indebtedness. As of December 31, 2021,2023, the Company was in compliance with these covenants. The Public Notes can be redeemed, in whole or in part, at par within three months of their maturity date or at a redemption price equal to the sum of (i) the principal amount of the notes being redeemed plus accrued and unpaid interest and (ii) the make-whole premium, as defined in the supplemental indentures governing these notes.

The Company has entered into Note Purchase Agreements (NPAs)(“NPAs”) with institutional purchasers that provided for the private placement of 3three series of senior unsecured notes initially aggregating $375$375.0 million (the Notes)“Notes”). In November 2022, the

54


Company repaid its $75.0 million Series A senior unsecured notes at maturity which bore an interest rate of 4.95%. Upon completion of the Merger and pursuant to the NPAs, the Company was required to offer to prepay the remaining $300.0 million in outstanding aggregate principal amounts of Notes. Following the closing of the repurchase offer period in March 2023, the Company repurchased $185.6 million in aggregate principal amounts of such Notes. The Company recognized $4.8 million of accelerated amortization of debt discounts as a result of the repurchases which is included in the loss on extinguishment of debt on the consolidated statements of operations. At December 31, 2023, the Company had $114.4 million of Notes outstanding.

Interest on the Notes is payable semi-annually in arrears in May and November of each year. On each interest payment date, the interest rate on each series of Notes may be increased by 1.0%1.0% should the Company’s Applicable Credit Rating (as defined in the NPAs) fail to be an investment-grade credit rating; the increased interest rate would remain in effect until the next interest payment date on which the Company obtains an investment grade credit rating. The Company may prepay at any time all, or any part, of any series of Notes, in an amount not less than 5%5% of the aggregate principal

71

amount of the series then outstanding in the case of a partial prepayment, at 100%100% of the principal amount so prepaid plus a Make-Whole Amount (as defined in the NPAs). The Notes are senior unsecured obligations of the Company.

The NPAs contain a number of financial covenants that are similar to the covenants contained in the Company’s unsecured creditUnsecured Revolving Credit facility as summarized above. Subject to the terms of the NPAs and the Notes, upon certain events of default, including, but not limited to, (i) a payment default under the Notes, and (ii) a default in the payment of certain other indebtedness by the Company or its subsidiaries, all amounts outstanding under the Notes will become due and payable at the option of the purchasers. As of December 31, 2021,2023, the Company was in compliance with its covenants under the NPAs.

In April 2016,2022, the Company entered into a $100term loan agreement under which the Company borrowed an aggregate $600.0 million floating-rate,of variable-rate, unsecured term loans; the loans consisted of a $400.0 million five-year term loan. loan and a $200.0 million seven-year loan (“April 2022 Term Loans”). On February 3, 2023, in connection with the completion of the Merger, the Company repaid all indebtedness, liabilities and other obligations outstanding under, and terminated, the April 2022 Term Loans. At the time of repayment, the aggregate borrowings under the April 2022 Term Loans were $600.0 million. The Company also incurred a $0.7 million prepayment penalty at the time of repayment which is included in the loss on extinguishment of debt on the consolidated statements of operations.

In December 2022, the Company entered into a term loan agreement with a total initial commitment of $100.0 million of unsecured, variable-rate, short-term term borrowings (the “December 2022 Term Loan”). The December 2022 Term Loan matured at the earlier of March 31, 2023 or the consummation of the Merger. The term loan agreement included an incremental borrowing feature that allowed the Company to request up to an additional $100.0 million of term borrowings after December 31, 2022. In connection with the completion of the Merger, on February 3, 2023, the Company repaid $130.0 million of outstanding borrowings on the December 2022 Term Loan at maturity.

In connection with the completion of the Merger, the Company entered into the Unsecured Credit Agreement, which provided for the Company’s Unsecured Revolving Credit Facility, as discussed above, and an unsecured, variable-rate term loan with initial borrowings of $600.0 million (the “February 2023 Unsecured Term Loan”). In March, October, and December 2023, the Company entered into incremental amendments of the existing Unsecured Credit Agreement which increased the February 2023 Unsecured Term Loan by $200.0 million, $46.1 million, and $75.0 million, respectively, for total borrowings of $921.1 million as of December 31, 2023.

The Unsecured Term Loan matures in April 2027 and the interest rate resets daily at Daily Simple SOFR plus an adjustment of 0.10% plus a spread ranging from 1.10% to 1.70% based on the Company’s consolidated total leverage ratio as defined in the Unsecured Credit Agreement. At December 31, 2023, the spread applicable to the Company was 1.25%. Seven of the Company’s cash flow hedges, with an aggregate notional amount of $600.0 million were redesignated as cash flow hedges of the Unsecured Term Loan and effectively convert the initial $600.0 million of borrowings to a fixed rate of 3.88% for the remaining term of the loan. In March 2023, the Company entered into one interest rate swap agreement with a notional amount of $200.0 million that effectively converts the March 2023 incremental borrowings to a fixed interest rate of 5.17% for the remaining term of the loan. In October 2023, the Company entered into two interest rate swap agreements with a notional amount of $46.1 million that effectively converts the incremental borrowings to a fixed rate of 5.63% for the remaining term of the loan. In December 2023, the Company entered into one interest rate swap agreement with a notional amount of $75.0 million that effectively converts the incremental borrowings to a fixed rate of 5.08% for the remaining term of the loan. As of December 31, 2023, the all-in fixed rate of the term loan atis 4.3469%.

55


In December 2023, the Company amended the existing Unsecured Credit Agreement to increase the capacity for all revolving commitments and term loans under the agreement from $2.5 billion up to $3.2 billion. In addition, all lenders included in the agreement consented to the Company’s incurrence of future incremental term loans under the agreement that mature earlier or that have a weighted average life to maturity in April 2021shorter than the classes of term loans and revolving commitments outstanding prior to the effectiveness of such amendment.

In December 2023, upon effectiveness of this amendment, the Company entered into incremental amendments to the Unsecured Credit Agreement which provide for an unsecured, variable-rate term loan with borrowings of $592.5 million (“December 2023 Unsecured Term Loan”). The December 2023 Unsecured Term Loan has an initial maturity of July 2026, two 12-month extensions and the relatedinterest rate resets daily at Daily Simple SOFR plus an adjustment of 0.10%, plus a credit spread ranging from 1.20% to 1.80% based on the Company’s consolidated total leverage ratio as defined in the Credit Agreement. As of December 31, 2023, the Company’s spread was 1.35%. In connection with the incremental amendments, four of the Company’s existing interest rate swap agreements expired.with an aggregate notional amount of $330.0 million were redesignated from the Unsecured Revolving Credit Facility to the December 2023 Unsecured Term Loan. Additionally, in December 2023, the Company entered into two additional interest rate swap agreements with an aggregate notional amount of $262.5 million. As of December 31, 2023, the all-in fixed rate of December 2023 Unsecured Term Loan is 5.4520%.

In January 2024, the Company entered into an incremental amendment of the existing Unsecured Credit Agreement which provided for an increase to the December 2023 Unsecured Term Loan of $135.0 million for total term loan borrowings of $727.5 million. The Company also entered into one interest rate swap agreement with a notional amount of $135.0 million which effectively converts the total incremental borrowings to a fixed rate of 5.01%.

As noted above, under the terms of the Unsecured Credit Agreement, the Company is subject to various restrictive financial and nonfinancial covenants which, among other things, require the Company to maintain certain leverage ratios, cash flow and debt service coverage ratios and secured borrowing ratios. As of December 31, 2023, the Company was in compliance with these covenants. The Unsecured Term Loans are senior unsecured obligations of the Company, require monthly interest payments and may be prepaid without premium or penalty at any time.

56


The Company’s senior unsecured notes and term loans payable are summarized below (dollars in thousands):

Maturity

Interest

December 31,


Date

Rate

2021

2020


Notes Payable:

Series A issued November 2015

Nov. 2022

4.95

%  

$

75,000

$

75,000

Series B issued November 2015

Nov. 2024

5.24

%  

100,000

100,000

Series C issued April 2016

Apr. 2026

4.73

%  

200,000

200,000

Public Notes issued March 2018

Mar. 2028

4.50

%  

350,000

350,000

Public Notes issued February 2019

Mar. 2029

4.625

%  

350,000

350,000

Public Notes issued November 2020

Nov. 2030

2.75

%  

350,000

350,000

Public Notes issued November 2021

Dec. 2031

2.70

%  

375,000

Total notes payable

1,800,000

1,425,000

Term Loans:

Term Loan issued April 2016

100,000

Total term loans

100,000

Unamortized discount

(4,740)

(4,867)

Unamortized deferred financing costs


(12,447)


(10,521)

Total unsecured notes and term loans payable, net

$

1,782,813

$

1,509,612

Non-recourse


Outstanding Balance


Successor


Predecessor


Maturity
Date


Interest
Rate


December 31,
2023


December 31,
2022


Notes Payable:


Series B issued November 2015


Nov. 2024


5.24

%


32,400


100,000


Series C issued April 2016


Apr. 2026


4.73

%


82,000


200,000


Public Notes issued March 2018


Mar. 2028


4.50

%


350,000


350,000


Public Notes issued February 2019


Mar. 2029


4.625

%


350,000


350,000


Public Notes issued November 2020


Nov. 2030


2.75

%


350,000


350,000


Public Notes issued November 2021


Dec. 2031


2.70

%


375,000


375,000


Total notes payable


1,539,400


1,725,000


Term Loans:


Term Loan issued December 2022


90,000


Term Loan issued April 2022


400,000


Term Loan issued April 2022


200,000


Term Loan issued February 2023 (a)


Apr. 2027


4.3469% (c)


921,100


Term Loan issued December 2023 (b)


Jul. 2026


5.4520% (d)


592,500


Total term loans


1,513,600


690,000


Unamortized discount


(200,875

)


(4,113

)

Unamortized deferred financing costs


(12,417

)


(13,481

)

Total unsecured notes and term loans payable, net


$

2,839,708


$

2,397,406


(a)
Term loan was issued in February 2023 with initial borrowings of $600.0 million. The term loan was amended in March, October and December 2023 to increase total term loan borrowings to $800.0 million, $846.1 million and $921.1 million, respectively.
(b)
Term loan was issued December 2023 with borrowings of $592.5 million and amended in January 2024 to increase the total term loan borrowings to $727.5 million.
(c)
Loan is a floating-rate loan which resets daily at Daily Simple SOFR + an adjustment of 0.10% + the applicable spread which was 1.25% at December 31, 2023. The Company has entered into eleven interest rate swap agreements that effectively convert the floating rate to the weighted-average fixed rate noted as of December 31, 2023.
(d)
Loan is a floating-rate loan which resets daily at Daily Simple SOFR + an adjustment of 0.10% + the applicable spread which was 1.35% at December 31, 2023. The Company has entered into six interest rate swap agreements that effectively convert the floating rate to the weighted-average fixed rate noted as of December 31, 2023.

Secured Term Loan Facility, net

On February 3, 2023, in connection with the completion of the Merger, the Company and certain of its consolidated special purpose entities entered into a credit agreement (the “Credit Agreement”) which provided for a secured term loan of $2.0 billion (the “Secured Term Loan Facility”).The Secured Term Loan Facility was set to mature in February 2025 and included twosix-month extension options, subject to certain conditions and the payment of a 0.25% extension fee.

Borrowings outstanding under the Secured Term Loan Facility required monthly payments of interest at a floating-rate equal to one-month Term SOFR, plus a spread of 2.75%. Upon repayment of the Secured Term Loan Facility, the Company was subject to an exit fee equal to 1.0% of the amount repaid. In connection with entering into the Secured Term Loan Facility, the Company entered into three interest rate swap agreements with an aggregate notional amount of $750.0 million that effectively converted a portion of the borrowings to a fixed interest rate of 7.60%. As of December 31, 2023, two of the interest rate swaps had matured and the third was cancelled in conjunction with the full repayment of the secured term loan facility.

In March, May, October and November 2023, the Company paid down the Secured Term Loan Facility by $515.0 million, $525.0 million, $46.1 million and $205.8 million, respectively. In December 2023, the Company paid off the remaining $708.1 million, which constituted repayment in full all indebtedness, liabilities and other obligations outstanding under, and terminated, the Credit Agreement. In conjunction with the paydowns, the Company paid exit fees totaling $20.0 million and recognized accelerated amortization of deferred financing costs and debt discounts totaling $10.6 million and $31.8 million, respectively. The exit fees and accelerated amortization are included in the loss on extinguishment of debt on the consolidated statements of operations.

57


The Secured Term Loan Facility was secured by a collateral pool of properties owned by consolidated special purpose entities of the Company and was generally non-recourse to the Company, subject to certain customary limited exceptions. Collateral was released upon repayments made on the Secured Term Loan Facility. The Secured Term Loan Facility was guaranteed by the Company.

Non‑recourse Debt Obligations of Consolidated Special Purpose Entities, net

During 2012, the Company implemented its STORE Master Funding debt program pursuant to which certain of its consolidated special purpose entities issue multiple series of non-recourse net-leasenon‑recourse net‑lease mortgage notes from time to time that are collateralized by the assets and related leases (collateral) owned by these entities. One of the principal features of the program is that, as additional series of notes are issued, new collateral is contributed to the collateral pool, thereby increasing the size and diversity of the collateral pool for the benefit of all noteholders, including those who invested in prior series. Another feature of the program is the ability to substitute collateral from time to time subject to meeting certain prescribed conditions and criteria. The notes issued under this program are generally segregated into Class A amortizing notes and Class B non-amortizingnon‑amortizing notes. The Company has retained the Class B notes which aggregate $190.0$210.0 million at December 31, 2021.2023.

The Class A notes require monthly principal and interest payments with a balloon payment due at maturity and these notes may be prepaid at any time, subject to a yield maintenance prepayment premium if prepaid more than 24 or 36 months prior to maturity. As of December 31, 2021,2023, the aggregate collateral pool securing the net-leasenet‑lease mortgage notes was comprised primarily of single-tenant commercial real estate properties with an aggregate investment amount of approximately $3.6$4.6 billion.

In conjunction with the June 2021 issuance of the STORE Master Funding Series 2021-1 notes, the Company prepaid, without penalty, the Series 2013-1, Class A-2 notes in May 2021 and the Series 2013-2, Class A-2 notes in July 2021; these notes had an aggregate outstanding balance of $170.0 million at the time of prepayment, were scheduled to mature in 2023, and bore interest rates of 4.65% and 5.33%, respectively. In conjunction with the issuance of the November 2021 Public Notes, the Company prepaid, without penalty, the Series 2013-3, Class A-2 notes in November 2021; this note had an aggregate outstanding balance of $86.0 million at the time of prepayment, was scheduled to mature in 2023, and bore an interest rate of 5.21%. At December 31, 2021, the Company recognized $1.7 million of accelerated amortization of deferred financing costs associated with the Series 2013-1, Series 2013-2, and Series 2013-3 debt prepayments.

72

A number of additional consolidated special purpose entity subsidiaries of the Company have financed their real estate properties with traditional first mortgage debt. The notes generally require monthly principal and interest payments with balloon payments due at maturity. In general, these mortgage notes payable can be prepaid in whole or in part upon payment of a yield maintenance premium. The mortgage notes payable are collateralized by real estate properties owned by these consolidated special purpose entity subsidiaries with an aggregate investment amount of approximately $326.7$251.3 million at December 31, 2021.2023.

The mortgage notes payable, which are obligations of the consolidated special purpose entities described in Note 2, contain various covenants customarily found in mortgage notes, including a limitation on the issuing entity’s ability to incur additional indebtedness on the underlying real estate. Although this mortgage debt generally is non-recourse,non‑recourse, there are customary limited exceptions to recourse for matters such as fraud, misrepresentation, gross negligence or willful misconduct, misapplication of payments, bankruptcy and environmental liabilities. Certain of the mortgage notes payable also require the posting of cash reserves with the lender or trustee if specified coverage ratios are not maintained by the Company or one of its tenants.

58


The Company’s non-recourse debt obligations of consolidated special purpose entity subsidiaries are summarized below (dollars in thousands):

Maturity

Interest

December 31,


Date

Rate

2021

2020


Outstanding Balance


Successor


Predecessor


Maturity
Date


Interest
Rate


December 31,
2023


December 31,
2022


Non-recourse net-lease mortgage notes:


$102,000 Series 2013-1, Class A-2


4.65

%  


87,607

$97,000 Series 2013-2, Class A-2


5.33

%  


84,473

$100,000 Series 2013-3, Class A-2


5.21

%  


87,775

$140,000 Series 2014-1, Class A-2


Apr. 2024 (a)


5.00

%  


134,692


135,392

$150,000 Series 2018-1, Class A-1

Oct. 2024 (a)

3.96

%  

142,051

143,552


Oct. 2024 (b)


3.96

%


139,052


140,552


$50,000 Series 2018-1, Class A-3

Oct. 2024 (a)

4.40

%  

48,917

49,417


Oct. 2024 (b)


4.40

%


47,917


48,417


$270,000 Series 2015-1, Class A-2

Apr. 2025 (a)

4.17

%  

260,999

262,350


Apr. 2025 (b)


4.17

%


258,300


259,650


$200,000 Series 2016-1, Class A-1 (2016)

Oct. 2026 (a)

3.96

%  

180,190

184,350


Oct. 2026 (b)


3.96

%


171,355


175,861


$82,000 Series 2019-1, Class A-1

Nov. 2026 (a)

2.82

%

78,590

80,172


Nov. 2026 (b)


2.82

%


77,770


78,180


$46,000 Series 2019-1, Class A-3

Nov. 2026 (a)

3.32

%

45,521

45,751


Nov. 2026 (b)


3.32

%


45,061


45,291


$135,000 Series 2016-1, Class A-2 (2017)

Apr. 2027 (a)

4.32

%  

123,046

125,798


Apr. 2027 (b)


4.32

%


117,201


120,182


$228,000 Series 2018-1, Class A-2

Oct. 2027 (b)

4.29

%  

215,918

218,198


Oct. 2027 (c)


4.29

%


211,358


213,638


$164,000 Series 2018-1, Class A-4

Oct. 2027 (b)

4.74

%  

160,447

162,087


Oct. 2027 (c)


4.74

%


157,167


158,807


$346,000 Series 2023-1, Class A-1


May 2028 (b)


6.19

%


344,991


$182,000 Series 2023-1, Class A-2


May 2028 (b)


6.92

%


181,469


$168,500 Series 2021-1, Class A-1

Jun. 2028 (a)

2.12

%  

168,079


Jun. 2028 (b)


2.12

%


166,394


167,236


$89,000 Series 2021-1, Class A-3

Jun. 2028 (a)

2.86

%  

88,778


Jun. 2028 (b)


2.86

%


87,887


88,333


$168,500 Series 2021-1, Class A-2

Jun. 2033 (b)

2.96

%  

168,079


Jun. 2033 (c)


2.96

%


166,394


167,236


$89,000 Series 2021-1, Class A-4

Jun. 2033 (b)

3.70

%  

88,778


Jun. 2033 (c)


3.70

%


87,887


88,333


$244,000 Series 2019-1, Class A-2

Nov. 2034 (b)

3.65

%

233,854

238,559


Nov. 2034 (c)


3.65

%


231,414


232,634


$136,000 Series 2019-1, Class A-4

Nov. 2034 (b)

4.49

%

134,583

135,263


Nov. 2034 (c)


4.49

%


133,223


133,903


Total non-recourse net-lease mortgage notes

2,272,522

2,040,744


2,624,840


2,118,253


Non-recourse mortgage notes:


$16,100 note issued February 2014


4.83

%  


13,539

$13,000 note issued May 2012


May 2022


5.195

%  


9,961


10,355

$26,000 note issued August 2012


Sept. 2022


5.05

%  


20,085


20,867

$6,400 note issued November 2012


Dec. 2022


4.707

%  


4,938


5,133

$11,895 note issued March 2013


Apr. 2023


4.7315

%  


9,309


9,666

$17,500 note issued August 2013


Sept. 2023


5.46

%  


14,212


14,695

$6,944 notes issued March 2013 (a)


4.50

%


5,103


$11,895 note issued March 2013 (a)


4.73

%


8,935


$17,500 note issued August 2013 (f)


5.46

%


13,701


$10,075 note issued March 2014


Apr. 2024


5.10

%  


8,808


9,004


Apr. 2024 (d)


5.10

%


8,386


8,602


$65,000 note issued June 2016

Jul. 2026

4.75

%

59,223

60,409


Jul. 2026 (d)


4.75

%


56,674


57,980


$41,690 note issued March 2019

Mar. 2029

4.80

%

41,291

41,690


Mar. 2029 (e)


4.80

%


40,001


40,662


$6,944 notes issued March 2013


Apr. 2038


4.50

% (c)


5,332


5,549

$6,350 notes issued March 2019 (assumed in December 2020)

Apr. 2049

4.64

%

6,106

6,215


Apr. 2049 (d)


4.64

%


5,874


5,993


Total non-recourse mortgage notes

179,265

197,122


110,935


140,976


Unamortized discount


(496)


(386)


(164,326

)


(395

)

Unamortized deferred financing costs


(25,583)


(24,846)


(2,975

)


(20,364

)

Total non-recourse debt obligations of consolidated special purpose entities, net

$

2,425,708

$

2,212,634


$

2,568,474


$

2,238,470


(a)
(a)Prepayable, without penalty, 24 months prior to maturity.
(b)Prepayable, without penalty, 36 months prior to maturity.
(c)Interest rate is effective until March 2023 and will reset to the lender’s then prevailing interest rate.

73

Notes were repaid, without penalty, in January 2023.
(b)
Prepayable, without penalty, 24 months prior to maturity.
(c)
(d)
Prepayable, without penalty, three months prior to maturity.
(e)
Prepayable, without penalty, four months prior to maturity.
(f)
Mortgage note was repaid, without penalty, in September 2023.

Long-term Debt Maturity ScheduleCredit Risk Related Contingent Features

The Company has agreements with derivative counterparties, which provide generally that the Company could be declared in default on its derivative obligations if the Company defaults on the underlying indebtedness.As of December 31, 2021,2023, the termination value of the Company’s interest rate swaps that were in a liability position was approximately $10.4 million, which includes accrued interest but excludes any adjustment for nonperformance risk.

59


Debt Maturity Schedule

As of December 31, 2023, the scheduled maturities, including balloon payments, on the Company’s aggregate long-term debt obligations are as follows (in thousands):


Scheduled


Principal


Balloon


Payments


Payments


Total


2024


$

24,546


$

226,198


$

250,744


2025


22,417


256,612


279,029


2026


20,368


1,006,642


1,027,010


2027


11,862


1,381,572


1,393,434


2028


5,591


1,113,615


1,119,206


Thereafter


22,097


1,697,255


1,719,352


$

106,881


$

5,681,894


$

5,788,775


Scheduled


Principal

Balloon

Payments

Payments

Total


2022

$

24,434

$

109,114

$

133,548

2023

23,565

22,182

45,747

2024


22,331


426,914


449,245

2025


20,037


256,612


276,649

2026


17,926


532,142


550,068

Thereafter


40,208


2,756,322


2,796,530

$

148,501

$

4,103,286

$

4,251,787

5. Income Taxes

As a REIT, the Company generally will not be subject to federal income tax. It is still subject, however, to state and local income taxes and to federal income and excise tax on its undistributed income. STORE Investment Corporation is the Company’s wholly owned taxable REIT subsidiary (“TRS”) created to engage in non-qualifying REIT activities. The Company’s totalTRS is subject to federal, state and local income taxes.

Following the Merger, the Company's new ownership structure and status as a privately held REIT caused multiple state income tax jurisdictions to view the Company as a captive REIT. Within the jurisdictions where the Company is treated as a captive REIT, the dividends paid deduction may be disallowed, resulting in state income tax liabilities to which the Company was not previously subject when it was publicly traded.

Based on the projected increase in income tax liabilities related to STORE Capital's new status as a captive REIT in multiple state tax jurisdictions, the Company, in addition to its existing obligation to compute current income tax expense, (benefit)is now in a position where it needs to calculate deferred income taxes attributable to its temporary differences. While current income taxes are based upon the current period's income taxable for state tax reporting purposes, deferred income taxes (benefits) are provided for certain income and expenses, which are recognized in different periods for tax and financial reporting purposes. Deferred tax assets and liabilities are computed for differences between the financial statement and tax basis of assets and liabilities that will result in taxable or deductible amounts in the future based on enacted tax laws and rates applicable to the period in which the differences are expected to affect taxable income, and net operating loss (“NOL”) carryforwards.

The components of the Company's income tax provision are listed below (in thousands):


Successor


Predecessor


Period from
February 3, 2023
through
December 31, 2023


Period from
January 1, 2023
through
February 2, 2023


Year Ended
December 31, 2022


Year Ended
December 31, 2021


Current state income tax


$

6,776


$

703


$

884


$

813


Deferred state income tax


15,791


Total income tax expense


$

22,567


$

703


$

884


$

813


60


A reconciliation of the expected tax computed at the U.S. statutory federal income tax rate to the total benefit for income taxes is shown below (in thousands):


Successor


Period from February 3, 2023
through December 31, 2023 (a)


Amount


Percent


Income (loss) before taxes

$

(116,092

)

100.0%


Income tax benefit at federal statutory rate


(24,379

)


21.0%

State taxes, net of federal benefit


(1,109

)


1.0%

Income excluded from US taxation


24,379


(21.0)%

Difference and changes in tax rates


(86

)


0.1%

Return to provision and other


255


(0.2)%

Change in valuation allowance


23,507


(20.3)%

Tax on income


$

22,567


(19.4)%

(a)
The Company’s income tax expense was immaterial for the period from January 1, 2023 to February 2, 2023 and for the years ended December 31, 2022 and 2021, therefore a reconciliation was not presented for such periods.

As required by ASC Topic 740, Income Taxes, management of the Company has evaluated the evidence bearing upon the realizability of its deferred tax assets, which is ultimately dependent upon the sources of future taxable income during the periods temporary differences become deductible. Based on the weight of available evidence, both positive and negative, management has determined that it is "more-likely-than-not" that the Company will not realize the benefits of some of its deferred tax assets. In connection with the Merger, a deferred tax asset of $2.9 million and a valuation allowance of $2.9 million was identified. Thereafter, during the Successor period February 3, 2023 through December 31, 2023, the valuation allowance increased by $23.5 million to $26.4 million, primarily as a result of management’s assessment of the realizability of deferred tax assets related to property and equipment.

Significant components of the Company's deferred tax assets and liabilities were as follows (in thousands):

Year ended December 31,


2021


2020


2019


Federal income tax

$

$

(4)

$

42

State income tax


813


588


665

Total current income tax expense

$

813

$

584

$

707


Successor


December 31,


2023


Deferred tax assets:


Property and equipment, net

$

25,870


Other deferred tax asset


2,359


Total deferred tax assets


28,229


Less valuation allowance


(26,417

)

Net deferred tax asset


1,812


Deferred tax liabilities:


Intangible assets


(9,001

)

Ground lease assets


(1,133

)

Debt discount and deferred financing costs


(7,469

)

Total deferred tax liabilities


(17,603

)

Net deferred tax liability


$

(15,791

)

The Company’s deferred income tax expense and itsCompany had no ending balance in deferred tax assets andor liabilities were immaterial for 2021, 2020 and 2019.the year ended December 31, 2022.

The Company files federal, state and local income tax returns. Certain state income tax returns filed for 20172019 and tax returns filed for 20182020 through 2021 remain2023 are subject to examination. The Company has a net operating loss carryforward (NOL) for income tax purposes of $1.5 million that was generated during the year ended December 31, 2011 and, therefore, has no impact on income tax expense for the three years ended December 31, 2021. This loss is available to reduce future REIT taxable income until it expires in 2031. At this time, the Company does not believe it is likely it will use the NOL to reduce future taxable income; therefore, any deferred tax asset associated with such NOL has been fully reserved.

Management of the Company determines whether any tax positions taken or expected to be taken meet the “more-likely-than-not” threshold of being sustainedexamination by the applicable federal, state or local tax authority.these jurisdictions. As of December 31, 2021 and 2020,2023, management concluded that there is 0no tax liability relating to uncertain income tax positions. The Company’s policy is to recognize interest related to any underpayment of income taxes as interest expense and to recognize any penalties as operating expenses.general and administrative expense. There was 0no accrual for interest or penalties at December 31, 2021 and 2020.2023 or December 31, 2022.

61


The Company’s common stock distributions were characterized for federal income tax purposes as follows (per share)share for Predecessor periods):

Year ended December 31,


2021

2020

2019


Ordinary income dividends


$

1.1606


$

1.0677


$

1.2244

Capital gain dividends


0.0785


0.0180


0.0965

Return of capital


0.2259


0.3243


0.0034

Total

$

1.4650

$

1.4100

$

1.3243


Successor (a)


Predecessor (b)


Period from
February 3, 2023
through
December 31, 2023


Period from
January 1, 2023
through
February 2, 2023


Year Ended
December 31, 2022


Year Ended
December 31, 2021


Ordinary income dividends


$

284,026,090


$


$

1.1550


$

1.1606


Capital gain dividends


0.0785


Return of capital


225,973,910


0.2259


Cash liquidation distributions


32.2500


0.4100


Total


$

510,000,000


$

32.2500


$

1.5650


$

1.4650


(a)
For the Successor period ending December 31, 2023, there were 1,000 common shares authorized, issued and outstanding. Successor preferred shares and distributions thereon are excluded from the table above.
(b)
For the Predecessor periods ending February 2, 2023, December 31, 2022 and December 31, 2021, there were 375,000,000 common shares authorized and 282,684,998, 282,684,998 and 273,806,225 shares issued and outstanding, respectively.

6. Equity

Stockholders’ Equity (Predecessor)

74

6. Stockholders’ Equity

In November 2020, the Company established its fifth “at the market” equity distribution program, or ATM program, pursuant to which, from time to time, it maycould offer and sell up to $900$900.0 million of registered shares of common stock through a group of banks acting as its sales agents (the 2020“2020 ATM Program)Program”).

The following tables outline For the period from January 1, 2023 to February 2, 2023, there were no common stock issuances under the 2020 ATM Program. Upon closing of the Merger, on February 3, 2023, the 2020 ATM Program (in millions exceptwas terminated.

Pursuant to the terms and conditions of the Merger Agreement, at or immediately prior to, as applicable, the effective time of the Merger, each share andof common stock of the Company, par value $0.01 per share information):

Year Ended December 31, 2021

ATM Program

Shares Sold

Weighted Average Price per Share

Gross Proceeds


Sales Agents' Commissions


Other Offering Expenses


Net Proceeds

$900 million 2020 ATM Program

7,322,471

$

33.84

$

247.8

$

(3.7)

$

(0.4)

$

243.7

Inception of Program Through December 31, 2021

ATM Program

Shares Sold

Weighted Average Price per Share

Gross Proceeds


Sales Agents' Commissions


Other Offering Expenses


Net Proceeds

$900 million 2020 ATM Program

10,841,531

$

33.28

$

360.8

$

(5.4)

$

(0.6)

$

354.8

(“Common Stock”), other than shares of Common Stock held by STORE Capital, the Parent Parties or any of their respective wholly-owned subsidiaries, issued and outstanding immediately prior to the merger effective time, was automatically cancelled and converted into the right to receive an amount in cash equal to the Merger Consideration, without interest.

Members’ Equity (Successor)

In connection with the Merger, the Company issued 1,000 common units (“Common Units”) to its members for an aggregate cash amount of $8.3 billion. Prior to the Merger, the Company issued 125 Series A Preferred Units (the “Preferred Units”) for an aggregate cash amount of $125,000. The issuance of the Preferred Units was made through a private placement in reliance on Section 4(a)(2) of the Securities Act of 1933, as amended, and the rules and regulations promulgated thereunder.

In accordance with the Company’s operating agreement, members holding Preferred Units (“Preferred Members”) receive distributions bi-annually and Members holding Common Units (“Common Members”) may receive distributions monthly. Common Members may be subject to capital calls. Except for their initial capital contribution, no Preferred Members may make any additional capital contributions. Additionally, no Preferred Members have the right to demand a withdrawal, reduction or return of its capital contributions or receive interest thereon.

The Preferred Units rank senior to the Common Units of the Company declared dividends payableand to common stockholders totaling $405.2 million, $364.0 million,all other membership interests and $316.8 million duringequity securities issued by the years ended December 31, 2021, 2020Company with respect to distribution and 2019, respectively.redemption rights and rights upon liquidation, dissolution or winding up of the Company.

62


7. Long-TermLong‑Term Incentive Plans

In November 2014, the Company’s Board of Directors approved the adoption of the STORE Capital Corporation 2015 Omnibus Equity Incentive Plan (the 2015 Plan)“2015 Plan”), which permitspermitted the issuance of up to 6,903,076 shares of common stock, which represented 6%6% of the number of issued and outstanding shares of the Company’s common stock upon the completion of the IPO. As of December 31, 2021, 3,117,839 shares are available for grant under the 2015 Plan.

In 2012, the Company’s Board of Directors established the STORE Capital Corporation 2012 Long-TermLong‑Term Incentive Plan (the 2012 Plan)“2012 Plan”) which permitspermitted the issuance of up to 1,035,400 shares of common stock. As of December 31, 2021, 252,907 shares remain available for grant underDuring 2022, the 2012 Plan.Plan expired.

Both the 2015 and 2012 Plans allowallowed for awards to officers, directors and key employees of the Company in the form of restricted shares of the Company’s common stock and other equity-based awards including performance-basedperformance‑based grants.

The following table summarizes the restricted stock award (RSA)(“RSA”) activity:

2021

2020

2019


Weighted

Weighted

Weighted


Number of

Average Share

Number of

Average Share

Number of

Average Share


Shares

Price (1)

Shares

Price (1)

Shares

Price (1)


Outstanding non-vested shares, beginning of year


639,554


$

23.69


285,238


$

27.70


331,001


$

24.10

Shares granted


195,278

$

34.03


491,009

$

22.63


131,158

$

32.35

Shares vested


(313,518)

$

26.58


(130,642)

$

28.15


(162,315)

$

24.24

Shares forfeited


(83,890)

$

25.09


(6,051)

$

30.89


(14,606)

$

26.84

Outstanding non-vested shares, end of year


437,424

$

25.96


639,554

$

23.69


285,238

$

27.70


Predecessor


Period from
January 1, 2023 through
February 2, 2023


2022


2021


Weighted


Weighted


Weighted


Number of


Average Share


Number of


Average Share


Number of


Average Share


Shares


Price (a)


Shares


Price (a)


Shares


Price (a)


Outstanding non-vested shares,
   beginning of year


446,847


$

27.79


437,424


$

25.96


639,554


$

23.69


Shares granted


-


233,147


29.47


195,278


34.03


Shares vested


32.25


(166,770

)


26.32


(313,518

)


26.58


Shares forfeited


-


(56,954

)


24.93


(83,890

)


25.09


Outstanding non-vested shares,
   end of period


446,847


(b)

$


446,847


$

27.79


437,424


$

25.96


(a)
Grant date fair value
(1)Grant date fair value
(b)
In connection with the completion of the Merger on February 3, 2023, the 446,847 outstanding RSAs became fully vested.

The Company grantshistorically granted RSAs to its officers, directors and key employees. Generally, restricted shares granted to the Company’s employees vestvested in 25%25% increments in February or May of each year. The other independent directors receivereceived annual grants that vestvested at the end of each term served. As permitted, the Company does not estimate a forfeiture rate for non-vested shares. Accordingly, unexpected forfeitures will lower share-based compensation expense during the applicable period. Under the terms of the 2015 and 2012 Plans, the

75

Company pays non-refundable dividends to the holders of non-vested shares. Applicable accounting guidance requires that the dividends paid to holders of these non-vested shares be charged as compensation expense to the extent that they relate to non-vested shares that do not or are not expected to vest. The Company estimatesestimated the fair value of RSAs at the date of grant and recognizesrecognized that amount in expense over the vesting period as the greater of the amount amortized on a straight-linestraight‑line basis or the amount vested. The fair value of the RSAs iswere based on the closing price per share of the Company’s common stock on the date of the grant.

Under the terms of the Merger Agreement, effective immediately prior to the merger effective time, each outstanding award of restricted stock automatically became fully vested and all restrictions and repurchase rights thereon lapsed, with the result that all shares of common stock represented thereby were considered outstanding for all purposes under the merger agreement and received an amount in cash equal to $32.25 per share (the ‘Merger Consideration”), less required withholding taxes.

The Company hashad granted restricted stock unit awards (RSUs)(“RSUs”) with (a) both a market and a performance condition or (b) a market condition to its executive officers; these awards also containcontained a service condition. The number of common shares to be earned from each grant rangeranged from 0zero to 100%100% of the total RSUs granted over a three-year performance period.

63


The following table summarizes the RSU activity:

Number of RSUs


2021

2020

2019


Predecessor


Period from
January 1, 2023
through
February 2, 2023


2022


2021


Number of RSUs


Number of RSUs


Non-vested and outstanding, beginning of year


1,298,175


1,203,018


1,015,861


1,222,038


1,005,754


1,298,175


RSUs granted


846,896


534,141


628,909


629,307


846,896


RSUs vested


(468,466)


(376,961)


(284,775)


(217,987

)


(468,466

)

RSUs forfeited

(338,839)

(62,023)

(156,977)


(338,839

)

RSUs not earned

(332,012)


(195,036

)


(332,012

)

Non-vested and outstanding, end of year


1,005,754


1,298,175


1,203,018

Non-vested and outstanding, end of period


1,222,038


(a)


1,222,038


1,005,754


(a)
In connection with the completion of the Merger on February 3, 2023, 506,136 outstanding performance-based RSUs became earned and vested in accordance with the actual level of performance of STORE or a minimum of target as of the date of the Merger Agreement and 715,902 shares were forfeited.

For the 2021 and 2022 grants, 75%75% of the common shares to be earned iswas based on the Company’s total shareholder return (TSR)(“TSR”) measured against a market index and 25%25% of shares to be earned is based on the growth in a key Company performance indicator over a three-year period. For the 2018 through 2020 grants, oneone-half -half of the common shares to be earned iswas based on the Company’s TSR measured against a market index and oneone-half -half of the number of shares to be earned is based on the growth in a key Company performance indicator over a three-year period. For the 2017 grants, one-half of the number of common sharesThe 2018 through 2022 awards were to be earned was based on the Company’s TSR measured against the benchmark TSR of a peer group or market index and vest 100one-half of the number of shares to be earned was based on the Company’s TSR measured against pre-determined thresholds. The TSR is a measure of stock price appreciation plus dividends paid during the measurement period. To the extent market and service conditions were met, the earned RSUs from each grant awarded in 2017 vested 50%% at the end of the three-year performance period and, subject to continued employment, 50% at the end of onethree-year additional year. The 2018 through 2021 awards vest 100% at the end of the three-year performance period to the extent market, performance and service conditions are met. The RSUs accrueaccrued dividend equivalents which are paid only if the award vests. During the years ended December 31, 2021, 20202022 and 2019,2021, the Company accrued dividend equivalents expected to be paid on earned awards of $1.3 million, $1.2$0.9 million and $1.3$1.3 million, respectively; during the years ended December 31, 2021, 20202022 and 2019,2021, the Company paid $2.4 million, $1.1$1.3 million and $1.3$2.4 million, respectively, of these accrued dividend equivalents to its executive officers.

Under the terms of the Merger Agreement, effective immediately prior to the merger effective time, outstanding awards of performance-based RSUs automatically became earned and vested with (a) approximately 53% of the maximum number of shares of common stock subject to the award vesting for performance-based RSUs granted in 2020, (b) approximately 50% of the maximum number of shares of common stock subject to the award vesting for performance-based RSUs granted in 2021 and (c) approximately 33% of the maximum number of shares of common stock subject to the award vesting for performance-based RSUs granted in 2022, and thereafter were cancelled and, in exchange therefor, each holder of any such cancelled vested performance-based RSUs ceased to have any rights with respect thereto, except the right to receive as of the merger effective time, in consideration for the cancellation of such vested performance unit and in settlement therefore, an amount in cash equal to the product of (1) the Merger Consideration and (2) the number of so-determined earned performance shares subject to such vested performance-based RSUs, without interest, less required withholding taxes. In addition, on the Closing Date, each holder of performance-based RSUs received an amount equivalent to all cash dividends that would have been paid on the number of so-determined earned shares of the Company’s common stock subject to such performance-based RSUs as if they had been issued and outstanding from the date of grant up to, and including, the merger effective time, less required withholding taxes.

The Company previously valued the RSUs with a performance condition based on the closing price per share of the Company’s common stock on the date of the grant multiplied by the number of awards expected to be earned. The Company valued the RSUs with a market condition using a Monte Carlo simulation model on the date of grant which resulted in grant date fair values of $7.8 million, $5.4$6.7 million and $5.6$7.8 million for the 2022 and 2021 2020 and 2019 and, respectively. No RSUs were granted during the period from January 1, 2023 to February 2, 2023. The estimated fair value iswas amortized to expense on a tranche-by-tranche basis ratably over the vesting periods.

64


The following assumptions were used in the Monte Carlo simulation for computing the grant date fair value of the RSUs with a market condition for each grant year:

2021

2020

2019


2022


2021


Volatility


46.01

%


19.31

%

21.14

%


45.79

%


46.01

%


Risk-free interest rate

0.25

%

1.42

%

2.38

%


1.77

%


0.25

%


Dividend yield


0.00

%


0.00

%

0.00

%


0.00

%


0.00

%


The 2015 and 2012 Plans each allowallowed the Company’s employees to elect to satisfy the minimum statutory tax withholding obligation due upon vesting of RSAs and RSUs by allowing the Company to repurchase an amount of shares otherwise deliverable on the vesting date having a fair market value equal to the withholding obligation. During the years ended December 31, 2021, 20202022 and 2019,2021, the Company repurchased an aggregate 288,132 shares, 139,131202,796 shares and 167,143288,132 shares, respectively, in connection with this tax withholding obligation. No shares were repurchased during the period from January 1, 2023 to February 2, 2023.

Compensation expense for equity-basedequity‑based payments totaled $32.2$1.0 million, $4.7$12.4 million and $11.7$32.2 million for period from January 1, 2023 through February 2, 2023 and the years ended December 31, 2021, 20202022 and 2019,2021, respectively, and is included in general and administrative expenses. AtIn conjunction with the accelerated vesting of outstanding equity awards, the compensation expense for equity-based payments was $16.4 million which was presented “on-the-line” at the closing of the Merger.

During 2023, the Company replaced the historical stock compensation program with a long-term cash incentive program. Certain members of management were granted long-term cash-based incentive awards that vest at the end of a three-year performance period ending December 31, 2021, STORE2025 based on the achievement of specified corporate performance metrics and are paid following certification of achievement of such metrics. Employees were granted time-based cash awards that vest and are paid out ratably over a three-year period.

76

Capital had $16.0 million of unrecognized compensation cost related to non-vested equity-based compensation arrangements which will be recognized through February 2024.

8. Commitments and Contingencies

The Company is subject to various legal proceedings and claims that arise in the ordinary course of its business. Management believes that the final outcome of such matters will not have a material adverse effect on the Company’s financial position or results of operations.

In the normal course of business, the Company enters into various types of commitments to purchase real estate properties. These commitments are generally subject to the Company’s customary due diligence process and, accordingly, a number of specific conditions must be met before the Company is obligated to purchase the properties. As of December 31, 2021,2023, the Company had commitments to its customers to fund improvements to owned or mortgaged real estate properties totaling approximately $160.7$185.9 million, of which $143.5$132.4 million is expected to be funded in the next twelve months. These additional investments will generally result in increases to the rental revenue or interest income due under the related contracts.

The Company has entered into a lease agreementagreements with an unrelated third party for its corporate office space that will expire in July 2027;2027 and July 2029; the lease allowsleases each allow for 1 one five-year renewal period at the option of the Company. DuringFor the period from February 3, 2023 through December 31, 2023, the period from January 1, 2023 through February 2, 2023 and the years ended December 31, 2021, 20202022 and 2019,2021, total rent expense was $735,000, $737,000,$874,000, $77,000, $829,000 and $724,000,$735,000, respectively, which is included in general and administrative expense on the consolidated statements of income.operations. At December 31, 2021,2023, the Company’s future minimum rental commitment under this noncancelable operating lease, excluding the renewal option period, was approximately $791,000 in 2022, $805,000 in 2023, $819,000$994,000 in 2024, $834,000$1.0 million in 2025, $848,000$1.0 million in 2026, $701,000 in 2027, $188,000 in 2028 and $500,000$104,000 thereafter. Upon adoption of ASC Topic 842, the Company recorded a right-of-use asset and lease liability related to this lease; at December 31, 2021,2023, the balance of the right-of-use asset was $3.5$3.2 million, which is included in other assets, net on the consolidated balance sheet,sheets, and the balance of the related lease liability was $4.0$3.6 million.

The Company has employment agreements with each of its executive officers that provide for minimum annual base salaries, and annual cash and equity incentive compensation based on the satisfactory achievement of reasonable performance criteria and objectives to be adopted by the Company’s Board of Directors each year.on and annual and multi-year basis. In the event an executive officer’s employment terminates under certain circumstances, the Company would be liable for cash severance, and continuation of healthcare benefits and, in some instances, accelerated vesting of equity awards that he or she has been awarded as partunder the terms of the Company’s incentive compensation program.employee agreements.

65


The Company has a defined contribution retirement savings plan qualified under Section 401(a) of the Internal Revenue Code (the 401(k) Plan). The 401(k) Plan is available to employees who have completed at least six consecutive months of service or, if earlier, one year30 days of service with the Company. STORE Capital provides a matching contribution in cash, up to a maximum of 4%4% of compensation, which vests immediately. TheFor the period from February 3, 2023 through December 31, 2023, January 1, 2023 through February 2, 2023 and the years ended December 31, 2022 and 2021, the matching contributions made by the Company totaled approximately $603,000 in 2021, $515,000 in 2020,$704,000, $21,000, $614,000 and $478,000 in 2019.$603,000, respectively.

9. Fair Value of Financial Instruments

The Company’s derivatives are required to be measured at fair value in the Company’s consolidated financial statements on a recurring basis. Derivatives are measured under a market approach, using prices obtained from a nationally recognized pricing service and pricing models with market observable inputs such as interest rates and equity index levels. These measurements are classified as Level 2 within the fair value hierarchy. The Company has elected to present the fair value of derivative assets and liabilities within the Company’sconsolidated balance sheets on a net basis by counterparty. The net derivative instruments was a liability of $0.4 million at December 31, 2020;assets are included in other assets and the Company had 0 derivatives outstanding at December 31, 2021. Derivativenet derivative liabilities are included in accrued expenses, deferred revenue and other liabilities in the consolidated balance sheets.

The following tables summarize the net derivative balances recorded on the consolidated balance sheets.sheets and provides information as if the Company had not elected to offset the asset and liability balances of the derivative instruments with each of its counterparties in accordance with the associated master International Swap and Derivatives Association (in thousands):


Successor


Predecessor


December 31,
2023


December 31,
2022


Derivative assets:


Net derivative assets presented in the consolidated balance sheet


$

20,208


$

31,440


Gross amount of eligible offsetting recognized derivative liabilities


6,262


Gross amount of derivative assets


26,470


31,440


Derivative liabilities:


Net derivative liabilities presented in the consolidated balance sheet


$

(4,815

)


$


Gross amount of eligible offsetting recognized derivative assets


(6,262

)


Gross amount of derivative liabilities


(11,077

)


In addition to the disclosures for assets and liabilities required to be measured at fair value at the balance sheet date, companies are required to disclose the estimated fair values of all financial instruments, even if they are not carried at their fair value. The fair values of financial instruments are estimates based on market conditions and perceived risks at December 31, 20212023 and 2020.2022. These estimates require management’s judgment and may not be indicative of the future fair values of the assets and liabilities.

Financial assets and liabilities for which the carrying values approximate their fair values include cash and cash equivalents, restricted cash, accounts receivable, accounts payable and tenant deposits. Generally, these assets and liabilities are short-termshort‑term in duration and are recorded at fair value on the consolidated balance sheets. The Company believes the carrying value of the borrowings on its credit

77

facility approximate fair value based on their nature, terms and variable interest rate. Additionally, the Company believes the current carrying values of its fixed-ratefixed‑rate loans receivable approximate fair values based on market quotes for comparable instruments or discounted cash flow analyses using estimates of the amount and timing of future cash flows, market rates and credit spreads.

The estimated fair values of the Company’s aggregate long-term debt obligations have been derived based on market observable inputs such as interest rates and discounted cash flow analyses using estimates of the amount and timing of future cash flows, market rates and credit spreads. These measurements are classified as Level 2 within the fair value hierarchy. At December 31, 2021,2023, these debt obligations had an aggregate carrying value of $4,208.5 million$5.4 billion and an estimated fair value of $4,478.4 million.$5.3 billion. At December 31, 2020,2022, these debt obligations had an aggregate carrying value of $3,722.2 million$4.6 billion and an estimated fair value of $4,047.6 million.$4.1 billion.

10. Merger

On February 3, 2023, pursuant to the terms and subject to the conditions set forth in the Merger Agreement, STORE Capital Corporation merged with and into Merger Sub and the separate existence of STORE Capital Corporation ceased. Immediately

66


following the completion of the Merger, the Surviving Entity changed its name to STORE Capital LLC. As a result of the Merger and subsequent delisting of the Company’s Common Stock from the New York Stock Exchange, the common equity of the Company is no longer publicly traded.

Consideration and Purchase Price Allocation

The Merger was accounted for using the asset acquisition method of accounting in accordance with ASC Topic 805 which requires that the cost of an acquisition be allocated on a relative fair value basis to the assets acquired and the liabilities assumed. The following table summarizes the total consideration transferred in the purchase of STORE Capital Corporation (amounts in thousands):

Consideration Type


Cash paid to former shareholders and equity award holders


$

9,142,744


Extinguishment of historical debt


1,331,698


Capitalized transaction costs


110,924


Total consideration


$

10,585,366


The following table summarizes the estimated fair values assigned to the assets acquired and liabilities assumed (amounts in thousands):

Assets acquired:


Land and improvements


$

3,620,509


Buildings and improvements


9,105,004


Intangible lease assets


620,034


Operating ground lease assets


52,805


Loans and financing receivables


952,039


Cash and cash equivalents


28,005


Other assets


71,209


Total assets acquired


14,449,605


Liabilities assumed:


Unsecured notes and term loans payable


1,725,000


Non-recourse debt obligations of consolidated
   special purpose entities


2,243,323


Below market value of debt


(430,908

)

Intangible lease liabilities


148,660


Operating lease liabilities


50,516


Other liabilities


127,648


Total liabilities assumed


3,864,239


Fair value of net assets acquired


$

10,585,366


Fair Value Measurement

The estimated fair values of assets acquired and liabilities assumed were primarily based on information that was available as of the Closing Date. The methodology used to estimate the fair values to apply purchase accounting and the ongoing financial statement impact, if any, are summarized below.

Real estate investments, including sale-leaseback transactions accounted for as financing arrangements, investments in sales-type leases and direct financing receivables – the Company engaged third party valuation specialists to calculate the fair value of the real estate acquired by the Company using standard valuation methodologies, including the cost and market approaches. The remaining useful lives for real estate assets, excluding land, were reset based on the effective age of an asset compared to its overall average life, as determined by the valuation specialists.
Intangible lease assets and liabilities – the Company engaged third party valuation specialists to calculate the fair value of in-place lease assets based on estimated costs the Company would incur to replace the lease. In-place lease assets are amortized to expense over the remaining life of the lease. Above-market lease assets and below-market lease liabilities were recorded at the discounted difference between the contractual cash flows and the market cash flows for each lease

67


using a market-based, risk related discount rate. Above-market and below-market lease assets and liabilities are amortized as a decrease and increase to rental revenue, respectively, over the remaining life of the lease.
Operating ground lease assets and liabilities – the Company engaged third party valuation specialists to calculate the fair value of operating ground lease assets and liabilities based on the present value of future lease payments and an adjustment for the off-market component by comparing market to contract rent.
Loans receivable – the Company engaged third party valuation specialists to calculate the fair value of loans receivable based on the net present value of future payments to be received discounted at a market rate. The above-market value of the loans receivable is recorded as a loan premium and reported as an increase of the related loan balance on the consolidated balance sheets. The premium is amortized as a decrease to interest income over the remaining term of the loan receivable.
Assumed debt – the Company engaged third party valuation specialists to calculate the fair value of the outstanding debt assumed using standard valuation methodology, including the market approach. The below-market value of debt is recorded as a debt discount and reported as a reduction of the related debt balance on the consolidated balance sheets. The discount is amortized as an increase to interest expense over the remaining term of the related debt instrument.
Other assets and liabilities – the carrying values of cash, restricted cash, accounts receivable, prepaids and other assets, accounts payable, accrued expenses and other liabilities represented the fair values.

Item 9. CHANGES IN AND DISAGREEMENTSDISAGREEMENTS WITH ACCOUNTANTS ON ACCOUNTING AND FINANCIAL DISCLOSURE

None.

Item 9A. CONTROLS AND PROCEDURESPROCEDURES

Disclosure Controls and Procedures

As of the end of the period covered by this Annual Report on Form 10-K, we carried out an evaluation, under the supervision and with the participation of our management, including our Chief Executive Officer and our Chief FinancialAccounting Officer, of the effectiveness of the design and operation of our disclosure controls and procedures (as such term is defined in Rules 13a-15(e) and 15d-15(e) under the Exchange Act). Based on that evaluation, our Chief Executive Officer and our Chief FinancialAccounting Officer concluded that, as of the end of the period covered by this Annual Report on Form 10-K, the Company’s disclosure controls and procedures were effective.

Management’s Report on Internal Control over Financial Reporting

The management of the Company is responsible for establishing and maintaining adequate internal control over financial reporting (as such term is defined in Rules 13a-15(f) and 15d-15(f) under the Exchange Act) for the Company. Under the supervision and with the participation of management, the Chief Executive Officer and Chief FinancialAccounting Officer of the Company conducted an evaluation of the effectiveness of the internal control over financial reporting based on the framework in Internal Control — Integrated Framework issued by the Committee of Sponsoring Organizations (2013 Framework) (COSO)(“2013 Framework”) (“COSO”). Based on such evaluation, management concluded that the Company’s internal control over financial reporting was effective as of December 31, 2021.2023.

The Company’s internal control over financial reporting as of December 31, 2021 has been audited by Ernst & Young LLP, an independent registered public accounting firm, as stated in their report which is included herein. Ernst & Young LLP has issued an attestation report on the effectiveness of our internal control over financial reporting as of December 31, 2021. This report is included under “Item 8. Financial Statements and Supplementary Data” in this Annual Report on Form 10-K.

Changes in Internal Control over Financial Reporting

There have not been any changes in the Company’s internal control over financial reporting (as such term is defined in Rules 13a-15(f) and 15d-15(f) under the Exchange Act) during the fourth fiscal quarter to which this report relates that materially affected, or are reasonably likely to materially affect, the internal control over financial reporting of the Company.

Item 9B. OTHER INFORMATION

None.INFORMATION

None.

68


Item 9C. DISCLOSURE REGARDING FOREIGN JURISDICTIONS THAT PREVENT INSPECTIONS

Not applicable.

78

PART IIIIII

Item 10. DIRECTORS, EXECUTIVEEXECUTIVE OFFICERS AND CORPORATE GOVERNANCE

Executive Officers and Directors

The following table sets forth information regarding our executive officers and directors:

Name

Age

Position(s)

Mary B. Fedewa

58

President, Chief Executive Officer and Director

Adam Gallistel

48

Director

Jesse Hom

40

Director

Daniel Santiago

35

Director

Marc Zahr

44

Director

Michael Reiter

46

Director

Craig A. Barnett

46

Executive Vice President – Credit & Real Estate Underwriting

Chad A. Freed

50

Executive Vice President – General Counsel, Chief Compliance Officer and Secretary

Tyler S. Maertz

45

Executive Vice President - Acquisitions

Lori Markson

51

Executive Vice President – Portfolio Operations

David Alexander McElyea

49

Executive Vice President – Portfolio Management & Business Analytics

Ashley A. Dembowski

39

Senior Vice President – Chief Accounting Officer

Set forth below is biographical information with respect to each of our directors and executive officers as of the date of this Annual Report. With respect to the directors, the following information also describes the specific experience, qualifications, attributes and skills that qualify each director to serve on STORE’s Board.

Directors

Mary B. Fedewa co-founded STORE in May 2011 and has served as STORE’s Chief Executive Officer and President since April 2021 and September 2020, respectively, having previously served as STORE’s Chief Operating Officer from October 2017 to September 2020, as Executive Vice President – Acquisitions, Assistant Secretary and Assistant Treasurer from May 2011 to October 2017, and as a director since 2016. Ms. Fedewa has over 20 years of experience in a broad range of financial services. Prior to co-founding STORE, Ms. Fedewa spent several years investing as principal in single-tenant commercial real estate for private real estate companies. From 2004 to 2007, Ms. Fedewa was a Managing Director Nominations underof Acquisitions at Spirit Finance Corporation (later renamed Spirit Realty Capital, Inc. and subsequently acquired by Realty Income Corporation (NYSE: O)) (“Spirit”), a real estate investment trust (“REIT”), originating net-lease transactions in a variety of industries across the heading “Governance – Proposal No. 1-ElectionUnited States. Prior to Spirit, Ms. Fedewa held numerous positions within GE Capital, including as a Senior Vice President of Directors,”GE Capital Franchise Finance Corporation (“GE Franchise Finance”), which was the information regarding successor company to Franchise Finance Corporation of America (“FFCA”), a Scottsdale, Arizona-based REIT acquired by GE Capital in 2001. Throughout her GE Capital tenure, Ms. Fedewa held leadership positions within Mortgage Insurance, Private Label Financing and Commercial Finance. While at GE Capital, Ms. Fedewa was awarded a Six Sigma Black Belt and also served as a GE Quality Leader. Ms. Fedewa attended North Carolina State University, where she graduated summa cum laude with a B.A. degree in Business Management with a concentration in Finance.

Adam Gallistel has served as a director since February 2023. Mr. Gallistel joined GIC in 2004 and is a Managing Director and Regional Head of Americas, Real Estate. Mr. Gallistel leads GIC’s real estate equity and debt investment activities across the Americas. He is a member of GIC’s Real Estate Investment Committee, which oversees GIC’s global real estate investments. Mr. Gallistel is also the Head of GIC’s New York Office, which has over 225 employees. Prior to joining GIC, Mr. Gallistel held positions at LaSalle Investment Management and The Concord Group. Mr. Gallistel holds a bachelor’s degree in History from the University of Pennsylvania and an M.B.A., with honors, from Columbia Business School. Mr. Gallistel currently serves on the boards of CoreSite and PREA and is an Executive Committee member of the Samuel Zell & Robert Lurie Real Estate Center of the University of Pennsylvania’s Wharton School of Business.

69


Jesse Hom has served as a director since February 2023. Mr. Hom joined GIC in 2008 and is a Managing Director and Global Head of Real Estate Credit and Capital Markets. Mr. Hom focuses on driving performance and growth across both GIC’s Real Estate credit and equity businesses. Prior to joining GIC, Mr. Hom was an investment banking analyst at JP Morgan, where he focused on origination and structuring for their CMBS structured products group. Mr. Hom serves as a board member at Safehold Inc. (NYSE: SAFE) and several other private real estate companies. Mr. Hom holds a bachelor’s degree in Real Estate Finance from the School of Hotel Administration at Cornell University.

Daniel Santiagohas served as a director since February 2023. Mr. Santiago joined GIC in 2014 and is a Senior Vice President on the Americas Real Estate Investment team, where he leads the region’s net lease real estate investments and relationships in the triple net lease space. Prior to his current position, Mr. Santiago oversaw GIC Americas’ public REIT investments across several sectors, such as triple net lease, industrial, malls, strips, multifamily, office, healthcare, hospitality, datacenters and self-storage. Prior to joining GIC, Mr. Santiago was an investment banking analyst at Credit Suisse Brazil. Mr. Santiago holds a bachelor’s degree in Economics from the São Paulo School of Economics (“EESP-FGV”).

Marc Zahrhas served as a director since February 2023. Mr. Zahr is the Founder, President and Chairman of the Board of Trustees of Blue Owl Real Estate Net Lease Trust, a private REIT, a member of the Blue Owl Capital Inc.’s Executive Committee, and a member of the firm’s Board of Directors. As the Head of the Blue Owl Real Estate division, Mr. Zahr is responsible for the overall direction and leadership of all real estate related activities. He manages and oversees the firm’s investment activities which include sourcing, underwriting and negotiating all acquisitions. Mr. Zahr also leads the real estate Investment Committees and new product development. Mr. Zahr was honored as one of Crain’s Chicago Business’s 40 Under 40 for 2018. Prior to Blue Owl, Mr. Zahr served as Vice President at American Realty Capital where he was responsible for the analytics and acquisition activities within the company’s real estate portfolios. Mr. Zahr also served as a Fixed Income Trader at TM Associates and an Associate at Merrill Lynch. Mr. Zahr received a B.A. in Communications from the University of Dayton.

Michael Reiterhas served as a director since February 2023. Mr. Reiter is the Chief Operating Officer of Blue Owl Real Estate, a member of the Board of Trustees of Blue Owl Real Estate Net Lease Trust, a private REIT, and a member of the real estate Investment Committees. Mr. Reiter is responsible for the oversight, implementation and execution of the Company’s capital markets, business development, investment and asset management activities. Prior to Blue Owl, Mr. Reiter served as a Managing Director in the Real Estate Investment Management division at Cantor Fitzgerald. Mr. Reiter was a member of the Board of Trustees of Plymouth Industrial REIT, Inc. and a Senior Vice President and Head of Capital Markets at VEREIT, Inc. and American Realty Capital, where he was responsible for real estate acquisitions, capital markets and business development. Mr. Reiter commenced his career as a Certified Public Accountant at Ernst & Young as a Manager in the real estate advisory and assurance practices. Mr. Reiter received his B.S. in Economics from the University of Wisconsin, Madison and his M.S. in Accounting, cum laude, from the University of Notre Dame.

Executive Officers under

Craig A. Barnett has served as STORE’s Executive Vice President – Credit & Real Estate Underwriting since January 2024, having previously served as Executive Vice President – Underwriting & Portfolio Management from September 2020 through December 2023. Prior to his appointment as an Executive Vice President, Mr. Barnett served in various leadership roles at STORE for nearly 11 years, most recently as Senior Vice President – Portfolio Management. After joining STORE as a senior underwriter in 2011, Mr. Barnett played an integral role in growing STORE’s transaction volume to over $9.0 billion. Mr. Barnett has nearly 20 years of broad-based commercial real estate and REIT experience, including portfolio and investment management, capital transactions, investment analysis, underwriting and valuation. Prior to joining STORE, he was a Vice President of Franchise Capital Advisors and held leadership positions at GE Capital and FFCA. Mr. Barnett received a B.S. degree in Finance from Arizona State University’s W.P. Carey School of Business.

Chad A. Freed has served as STORE’s Executive Vice President – General Counsel, Chief Compliance Officer and Secretary since August 2019. Prior to joining STORE, Mr. Freed served as the heading “Executive CompensationGeneral Counsel, Executive Vice President of Corporate Development of Universal Technical Institute, Inc. (NYSE: UTI) (UTI”), an education company, from June 2015 to August 2019. Mr. Freed previously served as UTI’s General Counsel, Senior Vice President of Business Development from March 2009 to June 2015, as Senior Vice President, General Counsel from February 2005 to March 2009 and as inside legal counsel and Corporate Secretary since March 2004. Prior to joining UTI, Mr. Freed was a Senior Associate in the Corporate Finance and Securities department at Bryan Cave LLP. Mr. Freed received his Juris Doctor from Tulane University and a B.S. degree in International Business and French from Pennsylvania State University.

70


Tyler S. Maertz has served as STORE’s Executive Vice PresidentAcquisitions since September 2020. Prior to his appointment, Mr. Maertz served in various capacities at STORE, having joined STORE shortly after inception as the initial member of STORE’s direct acquisitions team, most recently as Senior Managing Director – Western Territory. Mr. Maertz served in various positions with GE Capital for 11 years prior to joining STORE, including as a member of the sales team at GE Franchise Finance, actively managing the customer relationships for a portfolio of assets approaching $1 billion, and leading the Financial Planning & Analysis group at GE Franchise Finance. Mr. Maertz graduated with honors from GE’s Financial Management Program, a renowned leadership training program. Mr. Maertz received a Bachelor of Business Administration degree in Finance & Accounting from the University of Notre Dame and an M.B.A. degree from Arizona State University’s W.P. Carey School of Business, and is a CFA charterholder.

Lori Markson has served as STORE’s Executive Officers,”Vice President – Portfolio Operations since February 2022 having previously served as Senior Vice President – Portfolio Operations and in various other leadership roles at STORE from 2016 to February 2022. Ms. Markson has 25 years of broad-based commercial lending and real estate experience, including underwriting, asset management, operations and valuation. Prior to joining STORE, she had a 15-year career at GE Franchise Finance where she served as Managing Director of Underwriting and Portfolio Management and Vice President of Underwriting. Prior to GE Franchise Finance, Ms. Markson held positions in commercial real estate underwriting and loan origination. Ms. Markson earned a B.A. degree in Economics from The University of California, Los Angeles.

David Alexander McElyea has served as STORE’s Executive Vice President – Portfolio Management & Business Analytics since January 2024, having previously served as Executive Vice President – Data Analytics & Business Strategy from February 2022 through December 2023 and as Senior Vice President – Business Analytics from October 2021 to February 2022. In his capacity, Mr. McElyea oversees the information regardingmanagement of STORE’s investment portfolio and the development of STORE’s advanced analytics models and the ongoing development of its enterprise business intelligence platform. Mr. McElyea has 20 years of experience in analytic roles within the financial services industry. Prior to joining STORE, Mr. McElyea spent four years with OneAZ Credit Union, most recently in the role of Chief Data Analytics Officer, and prior to that, Mr. McElyea spent five years with American Express Company in marketing science and analytics roles. Mr. McElyea earned a B.A. degree in Economics from Arizona State University and an M.B.A. degree from Arizona State University’s W.P. Carey School of Business.

Ashley A. Dembowski has served as STORE’s Senior Vice President – Chief Accounting Officer since April 2022, having previously served as STORE’s Corporate Controller and Vice President – Director of Accounting since joining the STORE in June of 2020. In these roles, Ms. Dembowski serves as the Company’s principal financial officer, leading STORE’s corporate accounting team in all aspects of the monthly close and financial accounting and the audit and Sarbanes-Oxley (SOX) compliance processes and working closely with executive management and department leaders. Prior to joining the STORE, Ms. Dembowski was a Senior Manager in the audit practice of Ernst & Young LLP (“EY”). During her 12+ year tenure with EY, Ms. Dembowski served a variety of private and public clients primarily in the real estate sector, including REITs, and has extensive experience in the application of GAAP accounting standards and technical accounting, SEC reporting, and SOX standards, leading over 20 professionals through all aspects of audit execution. Ms. Dembowski is a Certified Public Accountant and a member of the American Institute of Certified Public Accountants. Ms. Dembowski earned a Bachelor of Science degree in Accountancy from Arizona State University.

Role of Our Board

Our Board serves as the ultimate decision-making body of STORE playing a critical role in the strategic planning process and strategy. Our Board selects and oversees the members of our senior management team, who are charged by our Board with conducting the day-to-day business of STORE.

Our Board is comprised of representatives appointed by each of our members in accordance with the terms of our operating agreement. The term of any director will begin at his or her appointment and will continue until removed by or as a result of death, voluntary resignation or action by the common member designating such director. In the event of removal of a director, the resulting vacancy shall be filled by the member that designated the removed director.

As of the date of this Annual Report, the Company’s Board does not have any standing committees.

71


Code of Ethics

Our Board has adopted a Code of Business Conduct and Ethics underthat apply to all our directors, officers and employees. A current version of this code is available free of charge by contacting Chad A. Freed, our Executive Vice President – General Counsel, Chief Compliance Officer and Secretary, at 8377 East Hartford Drive, Suite 100, Scottsdale, Arizona 85255.

Changes to Security Holder Director Nomination Procedures

Following the heading “Governance – Additional Corporate Governance Features,” andclosing of the information regardingMerger, board members are appointed pursuant to the Audit Committee under the heading “Governance – Board and Committee Governance” in the Company’s 2022 Proxy Statement is incorporated herein by reference.provisions of our operating agreement.

Item 11. EXECUTIVE COMPENSATIONCOMPENSATION

COMPENSATION DISCUSSION AND ANALYSIS

2023 Executive Compensation

In this section, we describe the material components of the executive compensation program for the Company’s Named Executive Officers (“NEOs”), whose compensation is set forth in the Summary Compensation Table below. We also provide an overview of the Company’s executive compensation philosophy and executive compensation program.

For 2023, the Company’s NEOs were:

 Named Executive Officer

Title as of December 31, 2023

Mary B. Fedewa

Chief Executive Officer and President

Chad A. Freed

Executive Vice President – General Counsel, Chief Compliance Officer and Secretary

Craig A. Barnett

Executive Vice President – Credit & Real Estate Underwriting

Tyler S. Maertz

Executive Vice President – Acquisitions

Ashley A. Dembowski

Senior Vice President – Chief Accounting Officer

Compensation Philosophy and Objectives

For 2023, following the closing of the Merger, our Board approved a program that contained a competitive annual base salary but that was weighted towards variable at-risk pay elements through the use of short-term and long-term cash incentives. Under this program, NEOs are required to contribute to STORE’s achievement of measurable financial performance metrics in order to increase their cash compensation. Each element of the 2023 compensation program is discussed in more detail below.

How We Determine Compensation

Following the closing of the Merger, our Board oversees the design, development and implementation of the executive compensation program and is primarily responsible for reviewing and approving the compensation policies and the compensation paid to the NEOs. Our Chief Executive Officer works closely with the Board to provide input into the compensation program design.

72


Components of 2023 Compensation

The information regarding directorcomponents of the NEOs’ 2023 compensation were set forth in agreements entered into upon the closing of the Merger. For 2023, the compensation of the NEOs consisted of three principal components:

Compensation Element

Purpose of Compensation Element

Key Features of Compensation Element

Base Salary

• A stable means of cash compensation designed to provide competitive compensation that reflects the contributions and skill levels of each executive.

• Paid in cash
• The Board reviews base salaries each year and may raise them in its sole discretion.

Short-Term Incentives

• The annual cash bonus program is designed to motivate the executive officers to achieve performance goals established by the Board that reinforces the Company's annual business plan and assists STORE in attracting and retaining qualified executives.

• The threshold, target and maximum dollar amounts for short-term incentive compensation are set by the Board.
• Paid each year in cash following certification of achievement of goals for the applicable year.

Long-Term Incentives

• The long-term cash incentive program motivates the executive officers to achieve longer-term performance goals established by the Board, supports the Company’s long term strategic incentives and helps to maintain the competitiveness of the total compensation package.

• For Ms. Fedewa and Messrs. Freed, Barnett and Maertz, to vest as of the end of a three-year performance period ending December 31, 2025 and paid following certification of achievement of the stated performance metrics. For 2023, Ms. Dembowski participated in a separate program for certain participants below the level of Executive Vice President in which the participants were granted time-based cash awards that vest and are paid out ratably over a three-year period.

Set forth below is a discussion of each of the principal components of 2023 compensation for the NEOs.

Base Salary

The following table shows the 2023 base salaries of the current NEOs:

Name

Base Salary

Mary B. Fedewa

$

795,000

Chad. A. Freed

420,000

Craig A. Barnett

391,875

Tyler S. Maertz

365,750

Ashley A. Dembowski

282,994

Short-Term Incentives

For 2023, the Board approved the following threshold, target and maximum cash bonus award opportunities, expressed as a percentage of base salary, which the NEOs were eligible to receive under the heading “Governance – 2021 Director Compensation”annual cash bonus program. Straight line interpolation is used to determine awards for results in between performance levels:


Payout Opportunities


(as a percentage of base salary)


Name


Threshold


Target


Maximum


Mary B. Fedewa


75.0

%


150.0

%


300.0

%

Chad. A. Freed


37.5

%


75.0

%


150.0

%

Craig A. Barnett


37.5

%


75.0

%


150.0

%

Tyler S. Maertz


37.5

%


75.0

%


150.0

%

Ashley A. Dembowski


56.3

%


75.0

%


93.8

%

73


The compensation program as adopted by the Board provided that all of the NEOs would be eligible to earn annual cash bonuses based on STORE’s achievement of identified corporate performance metrics (as described in more detail below).

The corporate performance metrics in effect for the 2023 annual incentive program included (as applicable to each NEO participant):

Metric

Definition

Net Origination Volume

The dollar value of the Company’s acquisition gross volume (equal to the sum of (a) the aggregate purchase price for all properties acquired, and (b) the aggregate principal amount of all loans or construction draws funded by the Company) during such year less the dollar value of the Company’s property dispositions (equal to the aggregate purchase price received by the Company for all properties sold and aggregate amount of all loans re-paid) during such year.

Average Levered Equity Spread on New Originations

The weighted average equity spread for the Company, taken as a whole, annually via weighting it by deal size. The equity spread of each acquisition of any property is determined by: (a) the capitalization rate on the sale-leaseback transaction for such property, calculated as the initial annualized base rent and interest divided by the purchase price of such property, less (b) the Company’s cost of funds.

Portfolio Lease Term

The weighted average (based on annual base rent and interest) remaining lease term of all leases in effect as of December 31 of the applicable performance period.

Portfolio Bad Debt

The number, expressed as a percentage, equal to (a) the total contracted cash base rent and interest payable on all leases in effect during the applicable year (or such shorter period during such year during which such leases were in effect) less the actual cash rent and interest received on such leases during such period, divided by (b) the total contracted cash base rent and interest on all leases in effect during the applicable year.

Portfolio Bad Debt (Amendments and Re-lets)

The number, expressed as a percentage, equal to: (A + B) / C, where:
   A = Pre-amendment total contracted annual cash base rent and interest on all leases that were amended during the applicable year minus post-amendment annual cash base rent and interest;
   B = Prior total contracted annual cash base rent and interest on all leases that were relet during the applicable year minus post-relet annual cash base rent and interest; and
   C = total contracted annual cash base rent and interest for such applicable year.

Levered Cash Yield

The number, expressed as a percentage, equal to (a) the Company’s annual net operating income (annual owed cash base rent and interest minus bad debt) for the applicable year less (i) the Company’s general and administrative expenses for such year, less (ii) the Company’s total interest expense for such year and less (iii) maintenance capex and operational expenses, divided by (b) the average invested equity over the course of such year.

The percentage that each of the foregoing metrics was weighed varied among the NEOs depending upon their position and the relative importance that each such metric represented as to a particular NEO’s job duties. In addition, the Board of Directors adopted threshold, target and maximum goal levels for each corporate performance metric.

2023 Payouts

The following table shows the actual payouts for each NEO for 2023:

NEO


Actual Payout


% of Maximum
Bonus Opportunity


Mary B. Fedewa


$

2,378,428


99.7

%

Chad. A. Freed


628,264


99.7

%

Craig A. Barnett


560,950


95.4

%

Tyler S. Maertz


523,553


95.4

%

Ashley A. Dembowski


224,980


84.8

%

Long-Term Incentives

During 2023, we granted long-term cash incentives to the Named Executive Officers. For Ms. Fedewa and Messrs. Freed, Barnett and Maertz, these cash-based awards vest at the end of a three-year performance period ending December 31, 2025 based on

74


the achievement of specified corporate performance metrics. The corporate performance metrics in effect for the 2023 long-term incentive grants included:

Metric

Definition

Portfolio Lease Term

The weighted average (based on annual base rent and interest) remaining lease term of all leases in effect as of December 31 of the applicable performance period.

Levered Cash on Cash Yield

The average of the Levered Cash Yield for the performance period.

Volume Adjusted Levered Equity Spread

Net Origination Volume for the performance period, multiplied by the Average Levered Equity Spread on New Originations for the performance period.

Median Portfolio 4-Wall

The median 4-wall coverage ratio for all Company tenants based on the most recently received financial statements as of December 31 of the applicable performance period.

3 Year Vehicle IRR

The levered net internal rate of return over the performance period.

For 2023, Ms. Dembowski participated in a separate program for certain participants below the level of Executive Vice President in which the participants were granted time-based cash awards that vest and are paid out ratably over a three-year period.

401(k) Plan

We have established a 401(k) retirement savings plan (the “401(k) Plan”) for the Company’s employees who satisfy certain eligibility requirements. The NEOs are eligible to participate in the 401(k) Plan on the same terms as other full-time employees. The Internal Revenue Code of 1986, as amended, allows eligible employees to defer a portion of their compensation within prescribed limits, generally on a pre- or post-tax basis, through contributions to the 401(k) Plan. Currently, we match contributions made by participants in the 401(k) plan up to a specified percentage of the employee contributions, and these matching contributions are fully vested as of the date on which the contribution is made. We believe that providing a vehicle for retirement savings though the 401(k) Plan, and making fully vested matching contributions, adds to the overall desirability of the executive compensation package and provides further incentives to employees, including the NEOs, in accordance with the compensation policies.

Severance and Change in Control Arrangements

The NEOs are eligible for severance payments and benefits in the event of an involuntary termination of employment without “cause” or for “good reason,” as provided in their respective employment agreements entered into upon the closing of the Merger.

For detailed information on the estimated potential payments and benefits payable to the NEOs in the event of their termination of employment under the subheadings “Compensation Discussion and Analysis,” “Compensation Committee Report on Executive Compensation,” “Compensation Committee Interlocks and Insider Participation,” “Compensation Tables,” and “Payments uponemployment agreements, see the section titled “Potential Payments Upon Termination or Change in Control”Control.”

Perquisites and Other Personal Benefits

We do not provide the NEOs with perquisites or other personal benefits, except for a long-term disability policy (not to exceed $15,000 per year or such higher amount as is subsequently approved by the Board), reimbursement for the costs of an annual physical (not to exceed $2,500 per year or such higher amounts as is subsequently approved by the Board), and reimbursement for the monthly dues at a fitness or country club (not to exceed $1,000 per month or such higher amounts as is subsequently approved by the Board). These items are provided because we believe that they serve a necessary business purpose and represent an immaterial element of the executive compensation program. The value of these perquisites is reported in the Summary Compensation Table.

We do not provide tax reimbursements or any other tax payments, including excise tax “gross-ups,” to any of the executive officers.

75


BOARD REPORT ON EXECUTIVE COMPENSATION

The Board of Directors has reviewed the disclosures in the section titled “Compensation Discussion and Analysis” contained in this Annual Report and has discussed such disclosures with the management of the Company. Based on such review and discussion, the Board of Directors recommended that the “Compensation Discussion and Analysis” be included in this Annual Report on Form 10-K for the year ended December 31, 2023.

The Board of Directors

Mary B. Fedewa

Adam Gallistel

Jesse Hom

Daniel Santiago

Marc Zahr

Michael Reiter

76


COMPENSATION TABLES

Summary Compensation Table

The following table sets forth for each of the Named Executive Officers the compensation amounts paid or earned for the fiscal years ended December 31, 2023, 2022 and 2021.

  Name and Principal Position


Year


Salary


Bonus


Stock Awards (b)(c)


Non-Equity Incentive Plan Compensation (d)


All Other Compensation (e)


Total


Mary B. Fedewa


2023


$

795,000


$


$


$

2,378,428


$

36,035


$

3,209,463


Chief Executive Officer and President


2022


795,000


4,988,030


2,378,428


37,535


8,198,993


2021


705,139


(a)


4,535,096


1,756,265


31,935


7,028,435


Chad A. Freed


2023


420,000


628,264


28,839


1,077,103


Executive Vice President – General Counsel,


2022


420,000


980,761


628,264


27,839


2,056,864


Chief Compliance Officer and Secretary


2021


400,000


926,330


508,117


28,810


1,863,257


Craig A. Barnett


2023


391,875


560,950


16,962


969,787


Executive Vice President – Credit &


2022


375,000


818,395


560,950


17,947


1,772,292


Real Estate Underwriting


2021


375,000


789,464


476,360


16,836


1,657,660


Tyler S. Maertz


2023


365,750


523,553


17,302


906,605


Executive Vice President – Acquisitions


2022


350,000


763,820


523,553


17,598


1,654,971


2021


357,821


744,693


444,603


16,101


1,563,218


Ashley A. Dembowski


2023


282,994


279,980


13,200


576,174


Senior Vice President – Chief


2022


261,099


206,250


165,000


12,200


644,549


Accounting Officer


2021


215,000


161,250


80,000


11,600


467,850


a)
The amount shown for Ms. Fedewa for 2021 gives effect to a salary increase from $650,000 to $725,000, effective April 15, 2021, following her promotion to Chief Executive Officer and President.
b)
The amounts included in this column reflect the aggregate grant date fair value of both restricted stock and RSUs calculated in accordance with FASB ASC Topic 718. The fair value reflects the expected future cash flows of dividends and therefore dividends on unvested shares are not separately disclosed. The amounts in this column for each fiscal year exclude the effect of any estimated forfeitures of such awards. The basis for the calculation of these amounts is included in Note 7 to the December 31, 2023 consolidated financial statements.
c)
The performance RSUs granted in 2021 and 2022 to the NEOs included a performance condition based on STORE’s Compounded AFFO Per Share Growth. In accordance with FASB ASC Topic 718, the amounts in this column for 2021 and 2022 reflect the aggregate grant date fair value of the RSUs assuming the expected level of performance conditions will be achieved.
d)
The amounts included in this column represent the annual cash incentive earned in the year indicated and paid in the following year and for Ms. Dembowski also includes 33% of her time-based cash awards that vest and are paid out ratably over a three-year period. The performance-based long-term cash incentive awards granted to Ms. Fedewa and Messrs. Freed, Barnett and Maertz were not earned as of December 31, 2023 and are therefore not reflected in this column. The cash incentive amounts awarded to the NEOs for 2023 are described in more detail in the section titled “Executive Compensation” under the principal heading “Executive Compensation”headings “Short-Term Incentives” and “Long-Term Incentives.”
e)
The following table sets forth the amounts of other compensation, including perquisites and other personal benefits, paid to, or on behalf of, the NEOs included in the “All Other Compensation” column. Perquisites and other personal benefits are valued on the basis of the aggregate incremental cost to us.

Name


Year


Disability Insurance Premium


Annual Physical


Club Dues


401(k) Match


Total


Mary B. Fedewa


2023


$

8,335


$

2,500


$

12,000


$

13,200


$

36,035


2022


8,335


5,000


12,000


12,200


37,535


2021


8,335


-


12,000


11,600


31,935


Chad A. Freed


2023


3,639


12,000


13,200


28,839


2022


3,639


12,000


12,200


27,839


2021


5,210


12,000


11,600


28,810


Craig A. Barnett


2023


3,272


490


13,200


16,962


2022


5,306


-


441


12,200


17,947


2021


3,913


1,323


11,600


16,836


Tyler S. Maertz


2023


3,059


1,043


13,200


17,302


2022


5,398


12,200


17,598


2021


4,501


11,600


16,101


Ashley A. Dembowski


2023


13,200


13,200


2022


12,200


12,200


2021


11,600


11,600


77


Grants of Plan-Based Awards

The following table shows information regarding grants of non-equity plan-based awards made by us during 2023 to the NEOs.


Estimated Possible Payouts Under Non-Equity Incentive Plan Awards (a)


Name


Threshold


Target


Maximum


Mary B. Fedewa


$

5,167,500


$

14,906,250


$

43,526,250


Chad A. Freed


1,056,300


3,011,400


8,719,200


Craig A. Barnett


930,703


2,645,157


7,641,565


Tyler S. Maertz


868,657


2,468,814


7,132,128


Ashley A. Dembowski


324,184


377,246


430,307


a)
The amounts reported in these columns represent the range of possible and future payouts under cash incentive awards that were granted to the NEOs in 2023 under the Company’s 2022 Proxy Statementshort-term annual cash incentive program and its long-term cash incentive plan. The cash awards are described in more detail in the section titled “2023 Executive Compensation” under the headings “Short-Term Incentives” and “Long-Term Incentives.” The actual cash amounts paid in February 2024 to the NEOs for performance under the 2023 annual cash bonus program and in connection with the vesting of time-based cash awards granted in 2023 are reported in the “Non-Equity Incentive Plan Compensation” column of the Summary Compensation Table above.

The table below shows the breakdown between the possible future payouts under the short-term annual incentive program (consisting of the annual cash bonus amounts and, in the case of Ms. Dembowski, the vesting of time-based cash awards granted in 2023) and the estimated future payouts under the long-term cash incentive plan. Under the long-term cash incentive plan, awards are granted once every three years. The awards granted to Ms. Fedewa and Messrs. Freed, Barnett and Maertz in 2023 vest as of the end of a three-year performance period ending December 31, 2025 and amounts earned, if any, will be paid at one time in 2026 following certification of achievement of the stated performance metrics. It is incorporated hereinanticipated that new awards would then be granted in 2026 for potential payout in 2029.


Short-Term Incentives
(annual cash bonus program)


Name


Threshold


Target


Maximum


Mary B. Fedewa


$

596,250


$

1,192,500


$

2,385,000


Chad A. Freed


157,500


315,000


630,000


Craig A. Barnett


146,953


293,906


587,813


Tyler S. Maertz


137,156


274,313


548,625


Ashley A. Dembowski


159,184


212,246


265,307


Long-Term Incentives


Name


Threshold


Target


Maximum


Mary B. Fedewa


$

4,571,250


$

13,713,750


$

41,141,250


Chad A. Freed


898,800


2,696,400


8,089,200


Craig A. Barnett


783,750


2,351,251


7,053,752


Tyler S. Maertz


731,500


2,194,501


6,583,503


Ashley A. Dembowski


165,000


165,000


165,000


Pension Benefits and Nonqualified Deferred Compensation

There were no deferred compensation or defined benefit plans in place for 2023.

POTENTIAL PAYMENTS UPON TERMINATION OR CHANGE IN CONTROL

During 2023, Ms. Fedewa and Messrs. Freed, Barnett and Maertz were party to employment agreements (each, an “Employment Agreement,” and collectively, the “Employment Agreements”) with STORE Capital Advisors, LLC, an Arizona limited liability company and wholly owned subsidiary of STORE (“STORE Capital Advisors”), and STORE, as the guarantor of the obligations of STORE Capital Advisors thereunder. The Employment Agreements have terms that run through February 2, 2026 and are subject to automatic one-year renewal terms unless either party gives the other not less than ninety (90) days’ advance notice of nonrenewal. The Employment Agreements include provisions that required STORE or its successors to pay or provide certain compensation and benefits to the NEOs in the event of certain terminations of employment.

78


Types of Compensation Payable upon Termination of Employment

The table below reflects the types of compensation payable pursuant to the Employment Agreements to Ms. Fedewa and Messrs. Freed, Barnett and Maertz in the event of a termination of the NEO’s employment under the various circumstances described below (in addition to any base salary, incentive bonus and other benefits that have been earned and accrued prior to the date of termination and reimbursement of expenses incurred prior to the date of termination):

Termination Scenario

Cash Severance

LTIP

Other Benefits(a)

Death or Disability

Pro rata portion of target incentive bonus for which the NEO was eligible in the year of termination.

A cash payment equal to the pro rata portion of the LTIP payment that the executive would have received for any performance period that had not been completed as of the date of such termination if the executive had continued in employment through the end of the performance period, if any, based on the Board’s determination of actual performance for the entire performance period (the “Pro-Rated LTIP Payments”).

For a period of up to 18 months, the excess of (1) the amount the NEO was required to pay monthly to maintain coverage under COBRA over (2) the amount the NEO would have paid monthly if he or she had continued to participate in the Company’s medical and health benefits plan.

Without “Cause”(b) or for “Good Reason”(c)

An amount equal to the sum of:
(i) for Ms. Fedewa, 1.5 times her base salary in effect on the date of termination and, for each other NEO, 1.0 times his base salary in effect on the date of termination, plus
(ii) the target incentive bonus for which the NEO was eligible in the year of termination

Pro-Rated LTIP Payments, as defined above.

For a period of up to 12 months, the excess of (i) the amount the NEO was required to pay monthly to maintain coverage under COBRA over (ii) the amount the NEO would have paid monthly if he or she had continued to participate in the Company’s medical and health benefits plan.

a)
Payable to the extent the NEO (or his or her eligible dependents in the event of the NEO’s death) is eligible for and elects continued coverage for himself or herself and his or her eligible dependents in accordance with COBRA.
b)
For all NEOs party to an Employment Agreement, “Cause” means the NEO’s (i) refusal or neglect, in the reasonable judgment of our Board, to perform substantially all of his or her employment-related duties, which refusal or neglect is not cured within 20 days of receipt of written notice by reference.us; (ii) personal dishonesty, incompetence or breach of fiduciary duty which, in any case, has a material adverse impact on our business or reputation or any of our affiliates, as determined in our Board’s reasonable discretion; (iii) violation of any material written policy that is not cured without resulting in financial or reputational harm to us within 20 days of receipt of written notice by us (iv) conviction of or entering a plea of guilty or nolo contendere (or any applicable equivalent thereof) to a crime constituting a felony (or a crime or offense of equivalent magnitude in any jurisdiction); (v) willful violation of any federal, state or local law, rule or regulation that has a material adverse impact on our business or reputation or any of our affiliates, as determined in our Board’s reasonable discretion; or (vi) any material breach of the NEO’s non-competition, non-solicitation or confidentiality covenants.
c)
For all NEOs party to an Employment Agreement, “Good Reason” means termination of employment by the NEO on account of any of the following actions or omissions taken without the NEO’s written consent: (i) a material reduction of, or other material adverse change in, the NEO’s duties or responsibilities or the assignment to the NEO of any duties or responsibilities that are materially inconsistent with his or her position; (ii) a material reduction in the NEO’s base salary, the target percentage with respect to the NEO’s cash bonus or the target long term incentive cash grant; (iii) a requirement that the primary location at which the NEO performs his or her duties be changed to a location that is outside of a 35-mile radius of Scottsdale, Arizona or a substantial increase in the amount of travel that the NEO is required to do because of a relocation of our headquarters from Scottsdale, Arizona; (iv) a material breach by us of the NEO’s Employment Agreement; or (v) a failure by us, in the event of a Change in Control (as defined in the Employment Agreements), to obtain from any successor to us an agreement to assume and perform the NEO’s Previous Employment Agreement. A termination for “good reason” will not be effective until (i) the NEO provides us with written notice specifying each basis for the NEO’s determination that “good reason” exists and (ii) we fail to cure or resolve the NEO’s issues within 30 days of receipt of such notice.

79


Potential Payments upon Termination

The following table shows the estimated payments that are payable to each NEO under the Employment Agreements if a termination “without cause” or resignation for “good reason,” had occurred on December 31, 2023.

Name


Benefit


Death or Disability


Termination without Cause or Resignation for Good Reason (a)


Mary B. Fedewa


Cash Severance


$

1,192,500


$

2,385,000


Long-term Incentive Plan


4,571,250


4,571,250


Health Benefits


16,562


11,042


Total


5,780,312


6,967,292


Chad A. Freed


Cash Severance


315,000


735,000


Long-term Incentive Plan


898,800


898,800


Health Benefits


21,292


14,195


Total


1,235,092


1,647,995


Craig Barnett


Cash Severance


293,906


685,781


Long-term Incentive Plan


783,750


783,750


Health Benefits


21,308


14,205


Total


1,098,964


1,483,736


Tyler S. Maertz


Cash Severance


274,313


640,063


Long-term Incentive Plan


731,500


731,500


Health Benefits


21,292


14,195


Total


1,027,105


1,385,758


Ashley A. Dembowski


Cash Severance


Long-term Incentive Plan


Health Benefits


Total


a)
If a NEO was terminated for “cause” or resigned without “good reason” on December 31, 2023, the NEO would have been entitled to receive only his or her base salary, cash bonus and any other compensation-related payments that had been earned but not yet paid, and unreimbursed expenses that were owed as of the date of the termination, in each case that were related to any period of employment preceding the NEO’s termination date. The NEO would not have been entitled to any additional payments.

OTHER COMPENSATION MATTERS

As required by Section 953(b) of the Dodd-Frank Act and Item 402(u) of Regulation S-K, we are providing the following information about the relationship of the annual total compensation of our employees and the annual total compensation of Ms. Fedewa, STORE Capital LLC’s Chief Executive Officer for 2023. The pay ratio included in this information is a reasonable estimate calculated in a manner consistent with Item 402(u) of Regulation S-K.

For 2023, the median of the annual total compensation (inclusive of base salary, bonus and other items, as discussed below) of all employees of the company (other than our Chief Executive Officer) was $140,071. The total annualized compensation of Ms. Fedewa, as reported above in the Summary Compensation Table, was $3,209,463.

Based on this information, for 2023, the ratio of the annual total compensation of Ms. Fedewa, the Chief Executive Officer for fiscal 2023, to the median of the annual total compensation of all employees was 22.9 to 1. To identify the median of the annual total compensation of all our employees, as well as to determine the annual total compensation of our median employee, we took the following steps:

We determined that, as of December 31, 2023, our employee population consisted of 121 individuals, all of whom were full-time employees located in the United States. We selected December 31, 2023 as the date upon which we would identify the “median employee” because it enabled us to make such identification in a reasonably efficient and economical manner.
To identify the “median employee” from our employee population, we compared the amount of total compensation of our employees as reflected in our payroll records and reported to the Internal Revenue Service on Form W-2 for 2023. We identified our median employee using this compensation measure, which was consistently applied to all our employees

80


included in the calculation. Since all our employees are located in the United States, as is our Chief Executive Officer, we did not make any cost-of-living adjustments in identifying the “median employee.”
Once we identified our median employee, we combined all the elements of such employee’s compensation for 2023 in accordance with the requirements of Item 402(c)(2)(x) of Regulation S-K, resulting in annual total compensation of $140,071. The difference between such employee’s base salary and the employee’s annual total compensation represents the employee’s annual bonus and company matching contributions on behalf of the employee to our 401(k) employee savings plan. Since we do not maintain a defined benefit or other actuarial plan for our employees, and do not otherwise provide a plan for payments or other benefits at, following or in connection with retirement, the “median employee’s” annual total compensation did not include amounts attributable to those types of arrangements.

Supplemental Pay Ratio

Under the long-term incentive plan for our NEOs, these cash-based awards vest at the end of the three-year performance period ending December 31, 2025 and are paid following certification of achievement of the stated performance metrics. Since no portion of these awards were earned in 2023, Ms. Fedewa’s total annualized compensation for 2023 for purposes of the pay ratio disclosed above does not include any amounts related to the long-term incentive plan. This same outcome will be reflected in the 2024 pay ratio. For 2025, assuming achievement of the performance metrics for the long-term incentive plan, all three years of that award will be paid at once, resulting in a material increase in the pay ratio for that year.

We understand that the CEO pay ratio is intended to provide greater transparency to annual CEO pay and how it compares to the pay of the median employee. As such, we are providing a supplemental ratio that compares the CEO’s regular annual pay, including an estimate of the annualized portion of the long-term incentive plan assuming achievement of the performance metrics at the target level, to the pay of the median-paid employee as we believe that this supplemental ratio reflects a more representative comparison. The resulting supplemental CEO pay ratio is 55.5 to 1.

2023 Director Compensation

In this section, we describe the material components of the director compensation program for STORE Capital Corporation’s 2023 Board of Directors. During the period from January 1, 2023 through February 2, 2023, the following individuals served on the STORE Capital Corporation’s Board of Directors:

Jawad Ahsan

William F. Hipp

Joseph M. Donovan

Tawn Kelley

David M. Edwards

Catherine D. Rice

Mary B. Fedewa (a)

Quentin P. Smith, Jr.

Morton H. Fleischer

a)
The compensation of Ms. Fedewa, the Company’s President and Chief Executive Officer, is discussed above under the heading “2023 Executive Compensation”.

The following table sets forth the elements of the director compensation program in effect in for the period from January 1, 2023 through February 2, 2023:

Compensation Element


Position


Annual Fee


Cash Fees:


Non-Executive Chairman:


$

140,000


Other Non-Employee Directors:


$

85,000


Board and Committee Meeting Fees:


All Non-Employee Directors:


None


Committee Chair Fee:


Audit:


$

20,000


Compensation:


$

15,000


Investment:


$

15,000


Nominating and Corporate Governance:


$

12,500


In 2023, each director earned a pro-rata portion of their annual cash fees. In addition, Messrs. Donovan, Smith and Hipp earned a pro-rata portion of annual fees of $20,000, $15,000, and $15,000, respectively, for their service as the chairs of the Audit,

81


Compensation, and Investment Committees, respectively. In addition, Ms. Kelley earned a pro-rata portion of annual fees of $12,500 for her service as chair of the Nominating and Corporate Governance Committee.

The following table shows the compensation earned, and paid on February 3, 2023 in connection with the Merger, to the non-employee directors who served on the STORE Capital Corporation Board during 2023:

  Name


Fees earned


Jawad Ahsan


$

8,028


Joseph M. Donovan


9,917


David M. Edwards


8,028


Morton H. Fleischer


8,028


William F. Hipp


9,444


Tawn Kelley


14,403


Catherine D. Rice


8,028


Quentin P. Smith, Jr.


9,444


Subsequent to the Merger, in accordance with the Operating Agreement of STORE Capital LLC, except for compensation paid by the Company to any independent director as approved by the Board, no Board Member shall be entitled to receive any compensation from the Company for services rendered as a Director. For the period from February 3, 2023 through December 31, 2023, there were no independent directors serving on the Board of Directors.

Item 12. SECURITY OWNERSHIPOWNERSHIP OF CERTAIN BENEFICIAL OWNERS AND MANAGEMENT AND RELATED STOCKHOLDER MATTERS

The following table shows information regarding sharewithin our knowledge with respect to the beneficial ownership under the heading “Ownership of Our Stock – Beneficial Ownershipour units of Our Common Stock by Certain Beneficial Ownerscommon equity as of March 1, 2024, for each person or group of affiliated persons whom we know to beneficially own more than 5% of our common equity. As of March 1, 2024, our directors and Management” in the Company’s 2022 Proxy Statementexecutive officers do not hold beneficial ownership of our common equity. The table is incorporated herein by reference.based on 1,000 units of our common equity outstanding.

Name of Greater than Five Percent Beneficial Owners


Common Equity Units Beneficially Owned Number


Percentage of Common Equity Owned

Ivory Parent, LLC
   8377 E Hartford Drive Ste 100
   Scottsdale, AZ 85255


510


51


%

Ivory SuNNNs LLC
   280 Park Avenue, 9th Floor
   New York, New York 10017


490


49


%

Securities Authorized for Issuance Under Equity Compensation Plans

The following information reflects certain information aboutPursuant to the terms of the Merger Agreement, in connection with the completion of the Merger, our equity incentive plan was terminated effective February 3, 2023. As such, no securities were issued under our equity incentive plan during 2023 and no equity compensation plansplan exists as of December 31, 2021:2023.

Number of securities

Number of securities

to be issued upon

Weighted-average

available for future issuance

exercise of

exercise price of

under equity compensation

outstanding options,

outstanding options,

plans (excluding securities

Plan category

warrants and rights

warrants and rights

reflected in column (a))

(a)

(b)

(c)

Equity compensation plans approved by stockholders

3,370,746

(1)

Equity compensation plans not approved by stockholders

Total

3,370,746

(1)Represents 3,117,839 shares available for future issuance under the STORE Capital Corporation 2015 Omnibus Equity Incentive Plan and 252,907 shares available for future issuance under the STORE Capital Corporation 2012 Long-Term Incentive Plan.

Item 13. CERTAIN RELATIONSHIPSRELATIONSHIPS AND RELATED TRANSACTIONS AND DIRECTOR INDEPENDENCE

The information regarding director independence and related party transactions underIndependence Determinations

At the heading “Governance – Director Independenceclosing of the Merger, the Company delisted its common stock on the NYSE. As a result, the Company is no longer required to comply with the NYSE’s corporate governance requirements, including the requirement that a majority of its Board be comprised of; independent directors.

82


Certain Relationships and Related Party Transactions”Transactions

Our Board has adopted a written statement of policy regarding transactions with related parties (our “Related Person Policy”). Our Related Person Policy requires that a “related person” (as defined in paragraph (a) of Item 404 of Regulation S-K under the Securities Act of 1933, as amended) must promptly disclose to our Chief Compliance Officer any transaction in which the amount involved exceeds $1,000 and in which any related person had or will have a direct or indirect material interest and all material facts with respect thereto. Following a determination of whether the proposed transaction is material to STORE (with any transaction in which the amount involved exceeds $50,000 being deemed material for purposes of our Related Person Policy), our Chief Compliance Officer will report the transaction to our Board for its approval.

In December 2023, the Company sold certain loans and financing receivables with an aggregate carrying value of $332.0 million for an aggregate purchase price of $327.5 million to PCSD Ivory Private Limited, an entity affiliated with GIC, the Company's majority member. The purchase price was based upon a third party valuation obtained by GIC. The Company recognized a $4.7 million aggregate net loss on the sale which is recorded in the Company's 2022 Proxy Statement(loss) gain on disposition of real estate on the consolidated statements of operations. As part of this transaction, in January 2024 PCSD Ivory Private Limited collected 100% of the interest owed for the period December 1, 2023 to December 31, 2023. STORE’s pro rata portion of interest owed for December 2023 and collected in January 2024 is incorporated herein by reference.$1.1 million which is recorded as a receivable and included in other assets on the consolidated balance sheet.

In connection with the sale, the Company entered into a service contract with PCSD Ivory Private Limited and agreed to perform certain loan servicing and other administrative services with respect to the mortgage loan portfolio on behalf of PCSD Ivory Private Limited in exchange for a servicing fee. The fee income will be recorded as other income on the consolidated statements of operations. No such amounts were recorded for the period from January 1, 2023 through February 2, 2023 or the period from February 3, 2023 through December 31, 2023.

During 2023, STORE Capital LLC entered into Administrative Management Services Agreements (“Service Agreements”) with certain affiliated entities including Ivory Parent, LLC, Waterparks LLC and Ivory Parent Waterparks, LLC. Under these Service Agreements, the Company agrees to render certain services, including but not limited to, maintenance of the books and records in exchange for a fee equal to the costs incurred to provide the services plus eight percent. Fees earned for the period from February 3, 2023 to December 31, 2023 were $42,000 and are recorded on the consolidated statement of operations as other income. These amounts remained payable to STORE as of December 31, 2023 and are recorded as a receivable and included in other assets on the consolidated balance sheet.

Item 14. PRINCIPAL ACCOUNTANTACCOUNTANT FEES AND SERVICES

The information regarding following table sets forth the aggregate fees paid by us to Ernst & Young LLP (“EY”) for professional services rendered:


Year Ended
December 31,


2023


2022


Audit fees (a)


$

1,584,000


$

1,261,650


Audit-related fees (b)


140,000


58,500


Tax fees (c)


800,624


362,278


All other fees


3,408


Total


$

2,524,624


$

1,685,836


a)
Audit Fees, Audit-Related Fees, fees consist of fees incurred in connection with the audit of our annual financial statements, as well as services related to SEC matters, including review of registration statements filed and related issuances of agreed-upon procedures letters, consents and other services.
b)
Audit-related fees consist of fees for attestation services rendered by EY related to the issuances of notes through our STORE Master Funding debt program and fees for services rendered by EY related to the Merger.
c)
Tax Fees,fees consist of fees for professional services rendered by EY for tax compliance, tax advice and tax planning.

In 2023, our Audit Committee for the period from January 1, 2023 through February 2, 2023 and our Board of Directors for the period from February 3, 2023 through December 31, 2023 determined that the provision of services to us described in the foregoing table were compatible with maintaining the independence of EY. All Other Fees(100%) of the services described in the foregoing table with

83


respect to us and our subsidiaries were approved by our Audit Committee in conformity with our pre-approval policy (as described below).

Historically, the Audit Committee and now Board of Directors, selects STORE’s independent registered public accounting firm and separately pre-approves all audit services it will provide to STORE. Our Audit Committee and now Board of Directors also reviewed and separately pre-approved all audit-related, tax and other services rendered by our independent registered public accounting firm in accordance with our Audit Committee’s charter and the Audit Committee’s policies and proceduresBoard of Directors policy on pre-approval of auditaudit-related, tax and permissible non-auditother services. In its review of these services and related fees and terms, our Audit Committee and Board of Directors considered, among other things, the possible effect of the performance of such services on the independence of our independent auditors under the heading “Audit Matters” in the Company's 2022 Proxy Statement is incorporated herein by reference.registered public accounting firm.

None of the services described above were approved pursuant to the de minimis exception provided in Rule 2-01(c)(7)(i)(C) of Regulation S-X promulgated by the SEC.

84


79

PART IVIV

Item 15. EXHIBITSEXHIBITS AND FINANCIAL STATEMENT SCHEDULES

(a) The following documents are filed as part of this Annual Report:

1. Financial Statements. (see Item 8)

Reports of Independent Registered Public Accounting Firm (PCAOB ID 42)

Consolidated Balance Sheets as of December 31, 20212023 and 20202022

Consolidated Statements of IncomeOperations for the period January 1, 2023 through February 2, 2023, the period February 3, 2023 through December 31, 2023 and the years ended December 31, 2021, 20202022 and 20192021

Consolidated Statements of Comprehensive Income for the period January 1, 2023 through February 2, 2023, the period February 3, 2023 through December 31, 2023 and the years ended December 31, 2021, 20202022 and 20192021

Consolidated Statements of Stockholders’ Equity for the period January 1, 2023 through February 2, 2023 and the years ended December 31, 2021, 20202022 and 20192021

Consolidated Statements of Members' Equity for the period February 3, 2023 through December 31, 2023

Consolidated Statements of Cash Flows for the period January 1, 2023 through February 2, 2023, the period February 3, 2023 through December 31, 2023 and the years ended December 31, 2021, 20202022 and 20192021

Notes to Consolidated Financial Statements

2. Financial Statement Schedules. (see schedules beginning on page F-1)

Schedule III—Real Estate and Accumulated Depreciation

Schedule IV—Mortgage Loans on Real Estate

All other schedules are omitted since the required information is not present or is not present in amounts sufficient to require submission of the schedule, or because the information required is included in the consolidated financial statements and notes thereto.

3. Exhibits.

The exhibits listed below are filed as part of this Annual Report. References under the caption “Location” to exhibits or other filings indicate that the exhibit or other filing has been filed, that the indexed exhibit and the exhibit referred to are the same and that the exhibit referred to is incorporated by reference. Management contracts and compensatory plans or arrangements filed as exhibits to this Annual Report are identified by an asterisk.

85


Exhibit

Description

Location

3.12.1

ArticlesAgreement and Plan of AmendmentMerger, dated as of September 15, 2022, by and Restatement ofamong Ivory Parent, LLC, Ivory REIT, LLC, and STORE Capital Corporation filed with the State Department of Assessments and Taxation of the State of Maryland on June 5, 2018.Corporation.

Exhibit 3.12.1 to the Company’s QuarterlyCurrent Report on Form 10-Q for the quarter ended June 30, 20188-K filed with the SEC on AugustFebruary 3, 2018.2023.

3.23.1

FourthThird Amended and Restated BylawsLimited Liability Company Agreement of STORE Capital Corporation, effective May 30, 2019.LLC, dated as of February 3, 2023.

Exhibit 3.1 to the Company’s Current Report on Form 8-K filed with the SEC on May 31, 2019.February 3, 2023.

4.13.2

FormFirst Amendment to Third Amended and Restated Limited Liability Company Agreement of Common Stock Certificate.STORE Capital LLC, dated as of June 7, 2023.

Filed herewith.

3.3

Second Amendment to Third Amended and Restated Limited Liability Company Agreement of STORE Capital LLC, dated as of February 6, 2024.

Filed herewith.

3.4

Certificate of Formation of STORE Capital LLC, dated August 30, 2022, as amended effective February 3, 2023.

Exhibit 4.13.2 to the Company’s Current Report on Form 8-K filed with the SEC on November 21, 2014.February 3, 2023.

4.24.1

Description of the Company’s Common Stock.

Exhibit 4.2 to the Company’s Annual Report on Form 10-K for the fiscal year ended December 31, 2019 filed with the SEC on February 21, 2020.

80

4.3

EighthNinth Amended and Restated Master Indenture dated as of June 29, 2021,May 31, 2023, by and among STORE Master Funding I, LLC, STORE Master Funding II, LLC, STORE Master Funding III, LLC, STORE Master Funding IV, LLC, STORE Master Funding V, LLC, STORE Master Funding VI, LLC, STORE Master Funding VII, LLC and STORE Master Funding XIV, LLC, STORE Master Fund XIX, LLC, STORE Master Funding XX, LLC and STORE Master Funding XXIV, LLC, collectively as Issuers, and Citibank, N.A., as Indenture Trustee, relating to Net-Lease Mortgage Notes.

Exhibit 4.1 to the Company’s Current Report on Form 8-K filed with the SEC on June 30, 2021.2, 2023.

4.44.2

Series 2013-1 Indenture Supplement dated as of March 27, 2013, by and among STORE Master Funding I, LLC and STORE Master Funding II, LLC, collectively as Issuers, and Citibank, N.A., as Indenture Trustee.

Exhibit 4.3 to Amendment No. 1 to the Company’s Registration Statement on Form S-11 filed with the SEC on September 23, 2014.

4.5

Series 2013-2 Indenture Supplement dated as of July 25, 2013, by and among STORE Master Funding I, LLC, STORE Master Funding II, LLC, and STORE Master Funding III, LLC, collectively as Issuers, and Citibank, N.A., as Indenture Trustee.

Exhibit 4.4 to Amendment No. 1 to the Company’s Registration Statement on Form S-11 filed with the SEC on September 23, 2014.

4.6

Series 2013-3 Indenture Supplement dated as of December 3, 2013, by and among STORE Master Funding I, LLC, STORE Master Funding II, LLC, STORE Master Funding III, LLC, and STORE Master Funding IV, LLC, collectively as Issuers, and Citibank, N.A., as Indenture Trustee.

Exhibit 4.5 to Amendment No. 1 to the Company’s Registration Statement on Form S-11 dated and filed with the SEC on September 23, 2014.

4.7

Series 2014-1 Indenture Supplement dated as of May 6, 2014, by and among STORE Master Funding I, LLC, STORE Master Funding II, LLC, STORE Master Funding III, LLC, STORE Master Funding IV, LLC, and STORE Master Funding V, LLC, collectively as Issuers, and Citibank, N.A., as Indenture Trustee.

Exhibit 4.6 to Amendment No. 1 to the Company’s Registration Statement on Form S-11 filed with the SEC on September 23, 2014.

4.8

Series 2015-1 Indenture Supplement dated as of April 16, 2015, by and among STORE Master Funding I, LLC, STORE Master Funding II, LLC, STORE Master Funding III, LLC, STORE Master Funding IV, LLC, STORE Master Funding V, LLC and STORE Master Funding VI, LLC, collectively as Issuers, and Citibank, N.A., as Indenture Trustee.

Exhibit 4.2 to the Company’s Current Report on Form 8-K filed with the SEC on April 20, 2015.

4.3

4.9

Series 2016-1 Indenture Supplement dated as of October 18, 2016, by and among STORE Master Funding I, LLC, STORE Master Funding II, LLC, STORE Master Funding III, LLC, STORE Master Funding IV, LLC, STORE Master Funding V, LLC STORE Master Funding VI, LLC, and STORE Master Funding VII, LLC, collectively as Issuers, and Citibank, N.A., as Indenture Trustee.

Exhibit 4.2 to the Company’s Current Report on Form 8-K filed with the SEC on October 21, 2016.

4.104.4

Series 2018-1 Indenture Supplement dated as of October 22, 2018, by and among STORE Master Funding I, LLC, STORE Master Funding II, LLC, STORE Master Funding III, LLC, STORE Master Funding IV, LLC, STORE Master Funding V, LLC, STORE Master Funding VI, LLC and STORE Master Funding VII, LLC, collectively as Issuers, and Citibank, N.A., as Indenture Trustee.

Exhibit 4.2 to the Company’s Current Report on Form 8-K filed with the SEC on October 23, 2018.

8186


4.114.5

Series 2019-1 Indenture Supplement dated as of November 13, 2019, by and among STORE Master Funding I, LLC, STORE Master Funding II, LLC, STORE Master Funding III, LLC, STORE Master Funding IV, LLC, STORE Master Funding V, LLC, STORE Master Funding VI, LLC, STORE Master Funding VII, LLC and STORE Master Funding XIV, LLC, collectively as Issuers, and Citibank, N.A., as Indenture Trustee.

Exhibit 4.2 to the Company’s Current Report on Form 8-K filed with the SEC on November 14, 2019.

4.124.6

Series 2021-1 Indenture Supplement, dated as of June 29, 2021, by and among STORE Master Funding I, LLC, STORE Master Funding II, LLC, STORE Master Funding III, LLC, STORE Master Funding IV, LLC, STORE Master Funding V, LLC, STORE Master Funding VI, LLC, STORE Master Funding VII, LLC, STORE Master Funding XIV, LLC, STORE Master Funding XIX, LLC and STORE Master Funding XX, LLC, collectively as Issuers, and Citibank, N.A., as Indenture Trustee.

Exhibit 4.2 to the Company’s Current Report on Form 8-K filed with the SEC on June 30, 2021.

4.134.7

Series 2023-1 Indenture Supplement, dated as of March 15, 2018, by and between STORE Capital Corporation and Wilmington Trust, National Association.

Exhibit 4.1 to the Company’s Current Report on Form 8-K filed with the SEC on March 15, 2018.

4.14

Supplemental Indenture No. 1, dated as of March 15, 2018, by and between STORE Capital Corporation and Wilmington Trust, National Association.

Exhibit 4.2 to the Company’s Current Report on Form 8-K filed with the SEC on March 15, 2018.

4.15

Supplemental Indenture No. 2, dated as of February 28, 2019, by and between STORE Capital Corporation and Wilmington Trust, National Association.

Exhibit 4.1 to the Company’s Current Report on Form 8-K filed with the SEC on February 28, 2019.

4.16

Supplemental Indenture No. 3 dated as of November 18, 2020, by and between STORE Capital Corporation and Wilmington Trust Company (including form of Note).

Exhibit 4.1 to the Company’s Current Report on Form 8-K filed with the SEC on November 18, 2020.

4.17

Supplemental Indenture No. 4 dated as of November 17, 2021, by and between STORE Capital Corporation and Wilmington Trust Company.

Exhibit 4.1 to the Company’s Current

Report on Form 8-K filed with the SEC on November 17, 2021.

10.1

*

STORE Capital Corporation 2015 Omnibus Equity Incentive Plan.

Exhibit 10.3 to the Company’s Current Report on Form 8-K filed with the SEC on November 26, 2014.

10.2

*

STORE Capital Corporation 2012 Long-Term Incentive Plan.

Exhibit 10.7 to Amendment No. 1 to the Company’s Registration Statement on Form S-11 filed with the SEC on September 23, 2014.

10.3

*

Form of 2012 Long-Term Incentive Award Plan Restricted Stock Award Grant Agreement.

Exhibit 10.8 to Amendment No. 1 to the Company’s Registration Statement on Form S-11 filed with the SEC on September 23, 2014.

10.4

*

Form of Indemnification Agreement by and between STORE Capital Corporation and each of its directors and executive officers.

Exhibit 10.10 to the Company’s Current Report on Form 8-K filed with the SEC on November 26, 2014.

10.5

*

Employment Agreement dated as of November 2, 2017, by and among STORE Capital Corporation, STORE Capital Advisors, LLC, and Catherine Long.

Exhibit 10.9 to the Company’s Annual Report on Form 10-K for the fiscal year ended DecemberMay 31 2017 filed with the SEC on February 23, 2018.

82

10.6

*

Employment Agreement dated as of April 15, 2021, by and among STORE Capital Corporation, STORE Capital Advisors, LLC, and Mary Fedewa.

Exhibit 10.1 to the Company’s Current Report on Form 8-K filed with the SEC April 15, 2021.

10.7

*

Employment Agreement dated as of April 15, 2021, by and among STORE Capital Corporation, STORE Capital Advisors, LLC, and Christopher H. Volk.

Exhibit 10.2 to the Company’s Current Report on Form 8-K filed with the SEC April 15, 2021.

10.8

*

Employment Agreement dated as of April 15, 2021, by and among STORE Capital Corporation, STORE Capital Advisors, LLC, and Chad A. Freed.

Exhibit 10.3 to the Company’s Current Report on Form 8-K filed with the SEC April 15, 2021.

10.9

*

Employment Agreement dated as of April 15, 2021, by and among STORE Capital Corporation, STORE Capital Advisors, LLC, and Tyler Maertz.

Exhibit 10.4 to the Company’s Current Report on Form 8-K filed with the SEC April 15, 2021.

10.10

*

Employment Agreement dated as of October 18, 2021, by and among STORE Capital Corporation, STORE Capital Advisors, LLC, and Sherry L. Rexroad.

Filed herewith.

10.11

*

Form of 2015 Omnibus Equity Incentive Plan Restricted Share Award Agreement.

Exhibit 10.1 to the Company’s Current Report on Form 8-K filed with the SEC on March 30, 2015.

10.12

*

Form of 2015 Omnibus Equity Incentive Plan Restricted Share Award Agreement for Directors (2019).

Exhibit 10.12 to the Company’s Annual Report on Form 10-K for the fiscal year ended December 31, 2018 filed with the SEC on February 22, 2019

10.13

*

Form of 2015 Omnibus Equity Incentive Plan Restricted Share Unit Award Agreement.

Exhibit 10.2 to the Company’s Current Report on Form 8-K filed with the SEC on March 30, 2015.

10.14

*

Form of 2015 Omnibus Equity Incentive Plan Restricted Share Unit Award Agreement (2018).

Exhibit 10.1 to the Company’s Quarterly Report on Form 10-Q for the quarter ended March 31, 2018 filed with the SEC on May 4, 2018.

10.15

*

Form of 2015 Omnibus Equity Incentive Plan Restricted Share Unit Award Agreement (2019).

Exhibit 10.2 to the Company’s Quarterly Report on Form 10-Q for the quarter ended March 31, 2019 filed with the SEC on May 3, 2019.

10.16

*

Retirement Succession Policy.

Filed herewith.

10.17

Note Purchase Agreement dated as of November 19, 2015, by and among STORE Capital Corporation and the Purchasers identified therein.

Exhibit 10.1 to the Company’s Current Report on Form 8-K filed with the SEC on November 23, 2015.

10.18

Note Purchase Agreement dated as of April 28, 2016, by and among STORE Capital Corporation and the Purchasers identified therein.

Exhibit 10.1 to the Company’s Current Report on Form 8-K filed with the SEC on May 2, 2016.

83

10.19

Second Amended and Restated Credit Agreement, dated as of June 3, 2021, by and among STORE Capital Corporation, as Borrower, KeyBank National Association, as Administrative Agent, KeyBanc Capital Markets Inc. and Wells Fargo Securities, LLC, as Joint Lead Arrangers and Joint Bookrunners, Wells Fargo Bank, National Association, as Syndication Agent, and BMO Harris Bank, N.A., Capital One, National Association, Regions Bank, Truist Bank, U.S. Bank National Association, as Co-Documentation Agents, and the other Lenders party thereto.

Exhibit 10.1 to the Company’s Current Report on Form 8-K filed with the SEC on June 8, 2021.

10.20

Seventh Amended and Restated Property Management and Servicing Agreement, dated as of June 29, 2021,2023, by and among STORE Master Funding I, LLC, STORE Master Funding II, LLC, STORE Master Funding III, LLC, STORE Master Funding IV, LLC, STORE Master Funding V, LLC, STORE Master Funding VI, LLC, STORE Master Funding VII, LLC, STORE Master Funding XIV, LLC, STORE Master Funding XIX, LLC and STORE Master Funding XX, LLC and STORE Master Funding XXIV, LLC, collectively as Issuers, and Citibank, N.A., as Indenture Trustee.

Exhibit 4.2 to the Company’s Current Report on Form 8-K filed with the SEC on June 2, 2023.

4.8

Indenture, dated as of March 15, 2018, by and between STORE Capital Corporation and Wilmington Trust, National Association.

Exhibit 4.1 to the Company’s Current Report on Form 8-K filed with the SEC on March 15, 2018.

4.9

Supplemental Indenture No. 1, dated as of March 15, 2018, by and between STORE Capital Corporation and Wilmington Trust, National Association.

Exhibit 4.2 to the Company’s Current Report on Form 8-K filed with the SEC on March 15, 2018.

4.10

Supplemental Indenture No. 2, dated as of February 28, 2019, by and between STORE Capital Corporation and Wilmington Trust, National Association.

Exhibit 4.1 to the Company’s Current Report on Form 8-K filed with the SEC on February 28, 2019.

4.11

Supplemental Indenture No. 3 dated as of November 18, 2020, by and between STORE Capital Corporation and Wilmington Trust Company (including form of Note).

Exhibit 4.1 to the Company’s Current Report on Form 8-K filed with the SEC on November 18, 2020.

4.12

Supplemental Indenture No. 4 dated as of November 17, 2021, by and between STORE Capital Corporation and Wilmington Trust Company.

Exhibit 4.1 to the Company’s Current Report on Form 8-K filed with the SEC on November 17, 2021.

4.13

Supplemental Indenture No. 5, dated as of February 3, 2023, by and between Ivory REIT, LLC, STORE Capital Corporation and Wilmington Trust Company, as Trustee.

Exhibit 4.1 to the Company’s Current Report on Form 8-K filed with the SEC on February 3, 2023.

10.1

*

Employment Agreement, effective as of February 3, 2023, by and among STORE Capital LLC (formerly known as Ivory REIT, LLC), STORE Capital Advisors, LLC, and Mary B. Fedewa.

Exhibit 10.1 to the Company’s Annual Report on Form 10-K filed with the SEC on March 22, 2023.

10.2

*

Employment Agreement, effective as of February 3, 2023, by and among STORE Capital LLC, STORE Capital Advisors, LLC, and Chad A. Freed.

Exhibit 10.2 to the Company’s Annual Report on Form 10-K filed with the SEC on March 22, 2023.

87


10.3

*

Employment Agreement, effective as of February 3, 2023, by and among STORE Capital LLC, STORE Capital Advisors, LLC, and Tyler S. Maertz.

Exhibit 10.3 to the Company’s Annual Report on Form 10-K filed with the SEC on March 22, 2023.

10.4

*

Employment Agreement, effective as of February 3, 2023, by and among STORE Capital LLC, STORE Capital Advisors, LLC, and Craig A. Barnett.

Exhibit 10.4 to the Company’s Annual Report on Form 10-K filed with the SEC on March 22, 2023.

10.5

Eighth Amended and Restated Property Management and Servicing Agreement, dated as of May 31, 2023, by and among STORE Master Funding I, LLC, STORE Master Funding II, LLC, STORE Master Funding III, LLC, STORE Master Funding IV, LLC, STORE Master Funding V, LLC, STORE Master Funding VI, LLC, STORE Master Funding VII, LLC, STORE Master Funding XIV, LLC, STORE Master Funding XIX, LLC and STORE Master Funding XX, LLC and STORE Master Funding XXIV, LLC, collectively as Issuers, STORE Capital Corporation,LLC, as Property Manager and Special Servicer, KeyBank National Association, as Back-Up Manager, and Citibank, N.A., as Indenture Trustee.

Exhibit 10.1 to the Company’s Current Report on Form 8-K filed with the SEC on June 30, 20212, 2023.

2110.6

Credit Agreement, dated as of February 3, 2023, by and among Ivory REIT, LLC (renamed STORE Capital LLC following the Merger Effective Time), KeyBank National Association, as Administrative Agent, and the other lenders and parties identified therein.

Exhibit 10.3 to the Company’s Current Report on Form 8-K filed with the SEC on February 3, 2023.

10.7

Incremental Amendment No. 1, dated as of March 8, 2023, by and among STORE Capital LLC, KeyBank National Association, as Administrative Agent, and the other lenders identified therein.

Exhibit 10.1 to the Company’s Current Report on Form 8-K filed with the SEC on March 14, 2023.

10.8

Incremental Amendment No. 2, dated as of October 4, 2023, by and among STORE Capital LLC, KeyBank National Association, as Administrative Agent, and the other lenders identified therein.

Filed herewith.

10.9

Incremental Amendment No. 3, dated as of December 14, 2023, by and among STORE Capital LLC, KeyBank National Association, as Administrative Agent, and the other lenders identified therein.

Filed herewith.

10.10

First Amendment and Consent, dated as of December 14, 2023, by and among STORE Capital LLC, KeyBank National Association, as Administrative Agent, and the other lenders identified therein.

Filed herewith.

10.11

Incremental Amendment No. 4, dated as of December 20, 2023, by and among STORE Capital LLC, KeyBank National Association, as Administrative Agent, and the other lenders identified therein.

Filed herewith.

10.12

Incremental Amendment No. 5, dated as of January 9, 2024, by and among STORE Capital LLC, KeyBank National Association, as Administrative Agent, and the other lenders identified therein.

Filed herewith.

10.13

*

Amendment to Employment Agreement dated January 2, 2024, by and between STORE Capital LLC and Craig Barnett.

Filed herewith.

21

List of Subsidiaries.

Filed herewith.

2331.1

Consent of Independent Registered Public Accounting Firm.

Filed herewith.

31.1

Rule 13a-14(a) Certification of the ChiefPrincipal Executive Officer.

Filed herewith.

31.2

Rule 13a-14(a) Certification of the ChiefPrincipal Financial Officer.

Filed herewith.

32.1

Section 1350 Certification of the ChiefPrincipal Executive Officer.

Filed herewith.

88


32.2

Section 1350 Certification of the ChiefPrincipal Financial Officer.

Filed herewith.

101

The following financial statements from STORE Capital Corporation’sLLC’s Annual Report on Form 10-K for the fiscal year ended December 31, 2021,2023, are formatted in Inline Extensible Business Reporting Language: (i) consolidated balance sheets, (ii) consolidated statements of comprehensive income, (iii) consolidated statements of cash flows, and (iv) notes to consolidated financial statements.

Filed herewith.

104

Cover Page Interactive Data File (embedded within the Inline XBRL document).

Filed herewith.

*Indicates management contract or compensatory plan.

Item 16. Form 10-K Summary

None.

None.

89


84

SIGNATURES

Pursuant to the requirements of Section 13 or 15 (d) of the Securities Exchange Act of 1934, the registrant has duly caused this Report to be signed on its behalf by the undersigned, thereunto duly authorized.

STORE CAPITAL CORPORATIONLLC

Date: February 24, 2022March 14, 2024

By:

/s/ Mary B. Fedewa

Mary B. Fedewa

President and Chief Executive Officer

Pursuant to the requirements of the Securities Exchange Act of 1934, this Report has been signed below on February 24, 2022March 14, 2024 by the following persons on behalf of the registrant and in the capacities and on the dates indicated.

Signature

Title

Date

/s/Mary B. Fedewa

President, Chief Executive Officer and Director

February 24, 2022

Mary Fedewa

(Principal Executive Officer)

March 14, 2024

Mary B. Fedewa

(Principal Executive Officer)

Executive Vice President, Chief Financial Officer, Treasurer and

/s/Sherry L. Rexroad

Assistant Secretary

February 24, 2022

Sherry L. Rexroad

(Principal Financial Officer)

/s/Ashley A. Dembowski

Senior Vice President – Chief Accounting Officer

/s/Stacy M. LaFrance

Senior Vice President, Chief Accounting Officer and Assistant Treasurer

February 24, 2022

Stacy M. LaFrance

(Principal Accounting Officer)

March 14, 2024

Ashley A. Dembowski

(Principal Financial Officer and Principal Accounting Officer)

/s/Tawn Kelley

/s/Adam Gallistel

Chairman of the Board of Directors

February 24, 2022

Tawn Kelley

March 14, 2024

Adam Gallistel

Director

February 24, 2022

Jawad A. Ahsan

/s/Joseph M. Donovan

Director

February 24, 2022

Joseph M. Donovan

/s/Jesse Hom

Director

Director

February 24, 2022

David M. Edwards

March 14, 2024

Jesse Hom

/s/Morton H. Fleischer

Director

February 24, 2022

Morton H. Fleischer

/s/William F. Hipp

Director

February 24, 2022

William F. Hipp

/s/Daniel Santiago

Director

/s/Catherine D. Rice

Director

February 24, 2022

Catherine D. Rice

March 14, 2024

Daniel Santiago

/s/Quentin P. Smith, Jr.

Director

February 24, 2022

Quentin P. Smith, Jr.

/s/Marc Zahr

Director

March 14, 2024

Marc Zahr

/s/Michael Reiter

Director

March 14, 2024

Michael Reiter

90


85

STORE Capital CorporationLLC

Schedule III - Real Estate and Accumulated Depreciation

(Dollars in Thousands)

Descriptions (a)

Initial Cost to Company

Costs Capitalized Subsequent to Acquisition

Gross amount at December 31, 2021 (b) (c)

Tenant Industry


Number of Properties


Number of States


Encumbrances


Land &
Improvements


Building &
Improvements


Land &
Improvements


Building &
Improvements


Land &
Improvements


Building &
Improvements


Total


Accumulated
Depreciation
 (d) (e)


Years Constructed


Years 
Acquired

SERVICE INDUSTRIES:

Restaurants -- Full Service

163

28

$

-

$

122,072

$

204,090

$

2,071

$

17,049

$

124,143

$

221,139

$

345,282

$

(40,324)

1892 - 2019

2011 - 2021

Restaurants -- Full Service

170

32

(f)

150,929

218,631

5,450

22,084

156,379

240,715

397,094

(75,367)

1880 - 2017

2011 - 2021

Restaurants -- Full Service

5

2

5,332

5,123

5,981

-

-

5,123

5,981

11,104

(2,391)

1994 - 2006

2012

Restaurants -- Limited Service

195

24

-

125,502

170,646

2,321

13,325

127,823

183,971

311,794

(23,279)

1938 - 2019

2011 - 2021

Restaurants -- Limited Service

197

25

(f)

75,310

98,920

2,238

7,721

77,548

106,641

184,189

(40,271)

1929 - 2021

2011 - 2021

Child Day Care Services

85

19

-

68,498

150,354

2,778

9,503

71,276

159,857

231,133

(24,266)

1779 - 2018

2012 - 2021

Child Day Care Services

183

25

(f)

118,862

232,733

10,051

34,173

128,913

266,906

395,819

(55,359)

1910 - 2021

2011 - 2021

Health Clubs

32

13

-

48,174

109,758

10,298

36,178

58,472

145,936

204,408

(19,330)

1973 - 2021

2012 - 2021

Health Clubs

55

17

(f)

74,254

149,205

9,521

65,185

83,775

214,390

298,165

(35,357)

1961 - 2020

2011 - 2021

Health Clubs

1

1

6,106

2,770

5,454

-

1,761

2,770

7,215

9,985

(343)

1995

07/12/1905

Automotive Repair and Maintenance

157

21

-

123,321

192,066

9,541

29,232

132,862

221,298

354,160

(25,789)

1900 - 2021

2015 - 2021

Automotive Repair and Maintenance

56

14

(f)

45,551

96,397

294

2,456

45,845

98,853

144,698

(15,444)

1960 - 2020

2011 - 2021

Lumber and Other Construction Materials Merchant Wholesalers

149

21

-

137,539

173,782

-

1

137,539

173,783

311,322

(31,968)

1798 - 2009

2016 - 2021

Lumber and Other Construction Materials Merchant Wholesalers

15

3

(f)

27,616

15,997

-

-

27,616

15,997

43,613

(5,811)

1940 - 2006

2013 - 2021

Movie Theaters

18

12

-

48,134

75,682

4,899

49,296

53,033

124,978

178,011

(24,858)

1972 - 2019

2014 - 2019

Movie Theaters

11

7

(f)

25,218

45,393

4,114

29,899

29,332

75,292

104,624

(17,854)

1989 - 2016

2011 - 2016

Movie Theaters

5

1

20,085

15,708

24,322

-

-

15,708

24,322

40,030

(10,759)

1995 - 2010

2012

Elementary and Secondary Schools

6

2

-

40,985

72,203

5,774

36,539

46,759

108,742

155,501

(8,224)

1956 - 2018

2015 - 2020

Elementary and Secondary Schools

3

3

(f)

20,609

17,287

-

-

20,609

17,287

37,896

(3,489)

1945 - 1991

2012 - 2021

Elementary and Secondary Schools

2

1

9,961

7,537

12,397

1,218

4,622

8,755

17,019

25,774

(5,522)

1987 - 1990

2012

Other Personal Services

40

12

-

33,543

34,959

11,902

41,235

45,445

76,194

121,639

(8,807)

1965 - 2021

2016 - 2021

Other Personal Services

38

17

(f)

24,134

45,559

2,346

2,105

26,480

47,664

74,144

(15,829)

1930 - 2012

2011 - 2018

Residential Intellectual and Developmental Disability, Mental Health, and Substance Abuse Facilities

16

8

-

51,533

124,315

-

7,058

51,533

131,373

182,906

(10,480)

1870 - 2019

2016 - 2021

Commercial and Industrial Machinery and Equipment Rental and Leasing

11

5

-

12,149

18,380

-

-

12,149

18,380

30,529

(3,636)

1927 - 2017

2017 - 2020

Commercial and Industrial Machinery and Equipment Rental and Leasing

39

19

(f)

50,037

63,346

4,809

4,408

54,846

67,754

122,600

(8,306)

1955 - 2019

2013 - 2021

Descriptions (a)


Initial Cost to Company


Costs Capitalized
Subsequent to Acquisition


Gross amount at December 31, 2023 (b) (c)


Property Location


Number of Properties


Encumbrances


Land &
Improvements


Building &
Improvements


Land &
Improvements


Building &
Improvements


Land &
Improvements


Building &
Improvements


Total


Accumulated
Depreciation
 (d) (e)


Years
Constructed


Years
Acquired


Alabama


40


$


$

36,318


$

95,657


$


$

5,752


$

36,318


$

101,409


$

137,727


$

(5,526

)


1935-2017


2023


Alabama


18


(f)


16,171


33,354


16,171


33,354


49,525


(1,613

)


1964-2014


2023


Alaska


9


9,996


25,117


9,996


25,117


35,113


(975

)


1953-2005


2023


Alaska


1


(f)


738


1,105


738


1,105


1,843


(85

)


2005


2023


Arizona


49


70,644


192,469


4,011


10,364


74,655


202,833


277,488


(8,530

)


1946-2021


2023


Arizona


42


(f)


82,122


197,936


82,122


197,936


280,058


(8,499

)


1976-2023


2023


Arkansas


30


36,734


66,862


36,734


66,862


103,596


(3,429

)


1920-2011


2023


Arkansas


20


(f)


14,474


33,402


14,474


33,402


47,876


(1,912

)


1950-2012


2023


California


39


140,956


290,393


1,101


7,622


142,057


298,015


440,072


(14,276

)


1930-2022


2023


California


40


(f)


71,862


95,797


8,284


71,862


104,081


175,943


(4,769

)


1940-2020


2023


Colorado


28


50,012


194,461


8,242


50,012


202,703


252,715


(10,497

)


1967-2016


2023


Colorado


15


(f)


19,044


39,084


1,255


4,213


20,299


43,297


63,596


(1,644

)


1953-2023


2023


Connecticut


23


18,868


57,970


18,868


57,970


76,838


(2,910

)


1850-2022


2023


Connecticut


9


(f)


6,757


17,490


6,757


17,490


24,247


(995

)


1860-1998


2023


Delaware


1


4,179


5,059


4,179


5,059


9,238


(395

)


1973


2023


District of Columbia


1


1,514


315


1,514


315


1,829


(38

)


1930


2023


Florida


Florida - Jacksonville


10


9,146


21,715


(2

)


(6

)


9,144


21,709


30,853


(1,026

)


1961-2018


2023


Florida - Jacksonville


8


(f)


10,578


33,471


10,578


33,471


44,049


(1,253

)


1972-2014


2023


Florida - Other


98


157,483


259,224


993


157,483


260,217


417,700


(12,311

)


1950-2022


2023


Florida - Other


50


(f)


54,096


146,750


54,096


146,750


200,846


(7,123

)


1950-2014


2023


Georgia


Georgia - Fitzgerald


1


7,564


36,442


7,564


36,442


44,006


(1,657

)


1980


2023


Georgia - Augusta


7


15,817


24,507


288


1,449


16,105


25,956


42,061


(1,256

)


1973-2015


2023


Georgia - Other


67


91,577


245,283


4


155


91,581


245,438


337,019


(13,963

)


1939-2022


2023


Georgia - Other


98


(f)


92,965


206,015


92,965


206,015


298,980


(10,446

)


1960-2021


2023


Idaho


15


25,179


55,115


432


25,179


55,547


80,726


(2,835

)


1946-2008


2023


Idaho


7


(f)


14,164


37,663


14,164


37,663


51,827


(1,246

)


2005-2021


2023


Illinois


Illinois - Chicago


6


19,149


20,293


19,149


20,293


39,442


(1,042

)


1920-2015


2023


Illinois - Chicago


7


(f)


12,453


29,707


7,270


12,453


36,977


49,430


(1,267

)


1886-2021


2023


Illinois - Albion


5


11,358


38,145


11,358


38,145


49,503


(2,129

)


1950-1998


2023


Illinois - Other


139


103,362


289,714


(11

)


2,529


103,351


292,243


395,594


(14,847

)


1870-2019


2023


Illinois - Other


43


(f)


67,215


149,832


112


3,996


67,327


153,828


221,155


(8,124

)


1880-2015


2023


Indiana


63


82,863


181,043


800


82,863


181,843


264,706


(9,051

)


1927-2019


2023


Indiana


35


(f)


32,184


72,473


32,184


72,473


104,657


(3,937

)


1959-2013


2023


F-1


Descriptions (a)


Initial Cost to Company


Costs Capitalized
Subsequent to Acquisition


Gross amount at December 31, 2023 (b) (c)


Property Location


Number of Properties


Encumbrances


Land &
Improvements


Building &
Improvements


Land &
Improvements


Building &
Improvements


Land &
Improvements


Building &
Improvements


Total


Accumulated
Depreciation
 (d) (e)


Years
Constructed


Years
Acquired


Iowa


18


24,603


52,777


24,603


52,777


77,380


(2,752

)


1915-2009


2023


Iowa


17


(f)


12,688


40,077


12,688


40,077


52,765


(2,198

)


1960-2013


2023


Kansas


28


20,169


74,500


20,169


74,500


94,669


(3,285

)


1969-2019


2023


Kansas


4


(f)


3,443


8,742


3,443


8,742


12,185


(456

)


1987-2018


2023


Kentucky


36


39,749


107,915


39,749


107,915


147,664


(5,125

)


1907-2020


2023


Kentucky


34


(f)


23,109


53,539


23,109


53,539


76,648


(2,936

)


1972-2023


2023


Louisiana


7


4,071


12,630


4,071


12,630


16,701


(662

)


1968-2014


2023


Louisiana


30


(f)


33,442


53,491


33,442


53,491


86,933


(3,018

)


1981-2020


2023


Maine


17


20,448


59,130


20,448


59,130


79,578


(3,720

)


1798-2011


2023


Maine


4


(f)


1,234


2,096


1,234


2,096


3,330


(165

)


1979-1993


2023


Maryland


7


9,613


11,901


9,613


11,901


21,514


(625

)


1963-2007


2023


Maryland


5


(f)


7,657


18,403


7,657


18,403


26,060


(999

)


1950-2007


2023


Massachusetts


32


63,091


146,366


63,091


146,366


209,457


(6,863

)


1850-2009


2023


Massachusetts


10


(f)


25,050


35,590


25,050


35,590


60,640


(1,914

)


1955-1988


2023


Michigan


96


116,358


326,455


1,632


116,358


328,087


444,445


(18,232

)


1862-2022


2023


Michigan


32


(f)


24,704


73,332


2,841


6,222


27,545


79,554


107,099


(4,703

)


1876-2012


2023


Minnesota


48


84,211


183,704


84,211


183,704


267,915


(9,868

)


1905-2018


2023


Minnesota


39


(f)


44,816


110,946


77


776


44,893


111,722


156,615


(6,197

)


1951-2021


2023


Minnesota


1


11,479


7,058


17,075


7,058


17,075


24,133


(931

)


2015


2023


Mississippi


30


25,699


72,155


60


(117

)


25,759


72,038


97,797


(4,264

)


1932-2010


2023


Mississippi


14


(f)


17,663


51,034


17,663


51,034


68,697


(2,762

)


1965-2009


2023


Mississippi


6


40,001


17,132


67,651


17,132


67,651


84,783


(3,841

)


1989-2001


2023


Missouri


73


60,883


185,385


1,144


1,042


62,027


186,427


248,454


(9,091

)


1928-2019


2023


Missouri


21


(f)


27,149


52,941


27,149


52,941


80,090


(2,569

)


1971-2022


2023


Montana


1


3,326


16,881


3,326


16,881


20,207


(665

)


2009


2023


Montana


3


(f)


5,318


11,882


5,318


11,882


17,200


(833

)


1920-2020


2023


Nebraska


10


11,350


15,072


11,350


15,072


26,422


(660

)


1961-2022


2023


Nebraska


14


(f)


7,402


25,817


931


996


8,333


26,813


35,146


(1,136

)


1910-2015


2023


Nevada


8


14,103


19,370


677


14,103


20,047


34,150


(793

)


1980-2021


2023


Nevada


5


(f)


9,063


20,653


1,085


9,063


21,738


30,801


(1,099

)


1960-2009


2023


Nevada


1


5,874


3,347


9,570


(1

)


(94

)


3,346


9,476


12,822


(596

)


1995


2023


New Hampshire


8


10,013


25,556


10,013


25,556


35,569


(1,513

)


1960-2001


2023


New Hampshire


4


(f)


2,473


8,933


2,473


8,933


11,406


(388

)


1973-2003


2023


New Jersey


6


7,041


6,809


7,041


6,809


13,850


(358

)


1970-2008


2023


New Jersey


8


(f)


8,545


40,891


8,545


40,891


49,436


(2,376

)


1930-2015


2023


New Mexico


6


10,485


28,178


10,485


28,178


38,663


(1,253

)


1946-2009


2023


New Mexico


4


(f)


5,579


8,029


5,579


8,029


13,608


(397

)


1955-2019


2023


F-2


Descriptions (a)


Initial Cost to Company


Costs Capitalized
Subsequent to Acquisition


Gross amount at December 31, 2023 (b) (c)


Property Location


Number of Properties


Encumbrances


Land &
Improvements


Building &
Improvements


Land &
Improvements


Building &
Improvements


Land &
Improvements


Building &
Improvements


Total


Accumulated
Depreciation
 (d) (e)


Years
Constructed


Years
Acquired


New York


24


40,937


168,999


40,937


168,999


209,936


(6,605

)


1892-2016


2023


New York


15


(f)


15,109


36,391


15,109


36,391


51,500


(2,322

)


1950-2014


2023


North Carolina


82


64,519


148,186


730


1,747


65,249


149,933


215,182


(7,416

)


1942-2022


2023


North Carolina


63


(f)


45,100


99,516


45,100


99,516


144,616


(5,042

)


1950-2018


2023


North Dakota


1


5,176


32,387


5,176


32,387


37,563


(1,169

)


1993


2023


North Dakota


3


(f)


2,823


13,596


2,823


13,596


16,419


(608

)


1984-2013


2023


North Dakota


1


13,620


6,711


23,927


6,711


23,927


30,638


(1,475

)


1995


2023


Ohio


Ohio - Columbus


11


15,956


49,326


15,956


49,326


65,282


(1,795

)


1961-2019


2023


Ohio - Columbus


8


(f)


5,903


16,162


5,903


16,162


22,065


(948

)


1970-2014


2023


Ohio - Other


76


Unencumbered


90,989


273,675


1


674


90,990


274,349


365,339


(14,981

)


1856-2018


2023


Ohio - Other


62


(f)


62,322


189,168


62,322


189,168


251,490


(12,177

)


1915-2020


2023


Oklahoma


27


25,881


54,187


25,881


54,187


80,068


(2,996

)


1965-2020


2023


Oklahoma


34


(f)


40,192


69,343


40,192


69,343


109,535


(4,227

)


1946-2011


2023


Oregon


6


5,252


14,460


5,252


14,460


19,712


(735

)


1924-2010


2023


Oregon


5


(f)


11,252


17,466


11,252


17,466


28,718


(1,311

)


1965-1985


2023


Pennsylvania


70


75,170


230,006


1,570


75,170


231,576


306,746


(12,561

)


1885-2018


2023


Pennsylvania


33


(f)


37,336


71,229


37,336


71,229


108,565


(4,410

)


1865-2020


2023


Pennsylvania


1


8,386


5,262


11,733


5,262


11,733


16,995


(875

)


1960-1960


2023


Rhode Island


7


5,560


17,559


5,560


17,559


23,119


(739

)


1930-2015


2023


Rhode Island


6


(f)


6,093


13,369


6,093


13,369


19,462


(701

)


1968-1995


2023


South Carolina


55


44,041


149,168


322


7,758


44,363


156,926


201,289


(8,438

)


1912-2024


2023


South Carolina


39


(f)


31,494


70,449


31,494


70,449


101,943


(3,340

)


1973-2019


2023


South Dakota


12


22,431


68,490


22,431


68,490


90,921


(2,953

)


1948-2020


2023


South Dakota


6


(f)


8,447


30,069


8,447


30,069


38,516


(1,699

)


1968-2014


2023


Tennessee


52


68,930


202,238


5,711


7,865


74,641


210,103


284,744


(10,062

)


1889-2023


2023


Tennessee


67


(f)


71,654


149,261


4,161


71,654


153,422


225,076


(8,185

)


1968-2019


2023


Texas


Texas - Abilene


1


7,065


36,904


7,065


36,904


43,969


(1,129

)


2009


2023


Texas - Abilene


1


(f)


792


2,793


792


2,793


3,585


(194

)


1961


2023


Texas - Amarillo


4


5,425


17,573


320


5,175


5,745


22,748


28,493


(924

)


1977-2016


2023


Texas - Amarillo


1


(f)


379


389


379


389


768


(18

)


1954


2023


Texas - Arlington


2


2,031


5,975


2,031


5,975


8,006


(348

)


1964-1997


2023


Texas - Arlington


4


(f)


3,816


13,367


3,816


13,367


17,183


(659

)


1945-2010


2023


Texas - Austin


4


6,932


14,733


6,932


14,733


21,665


(572

)


1991-2017


2023


Texas - Austin


1


(f)


2,461


5,388


2,461


5,388


7,849


(231

)


2006


2023


Texas - Corpus Christi


5


9,968


20,928


9,968


20,928


30,896


(1,272

)


1964-2017


2023


Texas - Corpus Christi


2


(f)


1,835


2,685


1,835


2,685


4,520


(128

)


1975-2016


2023


F-3


Descriptions (a)


Initial Cost to Company


Costs Capitalized
Subsequent to Acquisition


Gross amount at December 31, 2023 (b) (c)


Property Location


Number of Properties


Encumbrances


Land &
Improvements


Building &
Improvements


Land &
Improvements


Building &
Improvements


Land &
Improvements


Building &
Improvements


Total


Accumulated
Depreciation
 (d) (e)


Years
Constructed


Years
Acquired


Texas - Cypress


2


2,168


5,110


248


11


2,416


5,121


7,537


(197

)


2012-2017


2023


Texas - Cypress


1


(f)


4,335


8,688


4,335


8,688


13,023


(276

)


2019


2023


Texas - Forney


2


4,678


8,885


4,678


8,885


13,563


(333

)


2006-2017


2023


Texas - Forney


1


(f)


1,091


2,921


1,091


2,921


4,012


(127

)


2004


2023


Texas - Fort Worth


5


9,619


22,361


9,619


22,361


31,980


(912

)


1989-2014


2023


Texas - Fort Worth


2


(f)


6,470


14,367


6,470


14,367


20,837


(609

)


1998-2021


2023


Texas - Frisco


4


6,408


13,316


6,408


13,316


19,724


(530

)


2003-2018


2023


Texas - Frisco


2


(f)


5,272


6,679


5,272


6,679


11,951


(302

)


1996-2008


2023


Texas - Harlingen


4


4,078


11,812


4,078


11,812


15,890


(647

)


1993-2014


2023


Texas - Harlingen


1


(f)


1,184


3,798


1,184


3,798


4,982


(119

)


2018


2023


Texas - Houston


23


32,409


48,930


282


9


32,691


48,939


81,630


(2,368

)


1965-2021


2023


Texas - Houston


10


(f)


24,292


42,428


24,292


42,428


66,720


(2,250

)


1965-2016


2023


Texas - Humble


2


5,464


14,206


112


344


5,576


14,550


20,126


(455

)


2009-2016


2023


Texas - Humble


3


(f)


2,170


4,937


2,170


4,937


7,107


(211

)


1982-2012


2023


Texas - Irving


3


4,893


8,791


4,893


8,791


13,684


(517

)


1983-2005


2023


Texas - Irving


1


(f)


2,452


6,756


2,452


6,756


9,208


(321

)


1982


2023


Texas - Katy


4


5,030


7,154


264


(51

)


5,294


7,103


12,397


(440

)


1984-2016


2023


Texas - Katy


1


(f)


1,844


4,121


1,844


4,121


5,965


(247

)


2015


2023


Texas - League City


2


7,428


15,930


7,428


15,930


23,358


(577

)


2011-2016


2023


Texas - Lubbock


2


3,601


8,576


3,601


8,576


12,177


(349

)


1994-2005


2023


Texas - Lubbock


5


(f)


12,726


24,156


12,726


24,156


36,882


(1,233

)


1980-2014


2023


Texas - McAllen


3


2,986


5,516


2,986


5,516


8,502


(317

)


1976-2015


2023


Texas - McAllen


4


(f)


7,885


12,606


7,885


12,606


20,491


(600

)


1955-2015


2023


Texas - Mesquite


2


1,883


7,626


1,883


7,626


9,509


(293

)


1987-2008


2023


Texas - Mesquite


1


(f)


2,656


6,281


2,656


6,281


8,937


(263

)


1973


2023


Texas - San Antonio


12


16,152


21,890


16,152


21,890


38,042


(1,234

)


1945-2017


2023


Texas - San Antonio


5


(f)


10,934


16,290


10,934


16,290


27,224


(831

)


1985-2017


2023


Texas - Yoakum


1


3,665


20,107


3,665


20,107


23,772


(775

)


1971


2023


Texas - Other


152


141,213


276,229


3,144


2,232


144,357


278,461


422,820


(14,905

)


1920-2023


2023


Texas - Other


60


(f)


70,645


150,901


70,645


150,901


221,546


(7,946

)


1950-2018


2023


Utah


10


24,887


41,572


24,887


41,572


66,459


(2,240

)


1972-2021


2023


Utah


5


(f)


5,754


14,046


5,754


14,046


19,800


(620

)


1961-2013


2023


F-4


Descriptions (a)


Initial Cost to Company


Costs Capitalized
Subsequent to Acquisition


Gross amount at December 31, 2023 (b) (c)


Property Location


Number of Properties


Encumbrances


Land &
Improvements


Building &
Improvements


Land &
Improvements


Building &
Improvements


Land &
Improvements


Building &
Improvements


Total


Accumulated
Depreciation
 (d) (e)


Years
Constructed


Years
Acquired


Vermont


5


1,754


3,015


1,754


3,015


4,769


(199

)


1950-1997


2023


Vermont


2


(f)


565


1,024


565


1,024


1,589


(84

)


1983-1998


2023


Virginia


36


47,764


132,637


47,764


132,637


180,400


(6,433

)


1921-2022


2023


Virginia


15


(f)


12,850


37,121


12,850


37,121


49,971


(1,765

)


1928-2008


2023


Washington


11


17,454


38,092


17,454


38,092


55,545


(2,662

)


1910-2004


2023


Washington


11


(f)


29,172


34,104


544


29,172


34,648


63,821


(2,287

)


1948-2009


2023


West Virginia


12


10,056


27,909


10,056


27,909


37,964


(1,329

)


1953-2007


2023


West Virginia


11


(f)


7,835


16,173


7,835


16,173


24,008


(1,011

)


1970-2009


2023


Wisconsin - Colby


1


5,261


34,573


5,261


34,573


39,834


(2,142

)


1976


2023


Wisconsin - Other


63


102,271


332,783


1,103


625


103,374


333,408


436,783


(17,224

)


1911-2021


2023


Wisconsin - Other


28


(f)


28,371


88,108


28,371


88,108


116,479


(4,864

)


1917-2022


2023


Wisconsin - Other


3


31,575


18,497


53,410


18,497


53,410


71,907


(3,344

)


1966-1992


2023


Wyoming


3


1,446


3,559


1,446


3,559


5,004


(127

)


1975-2009


2023


Wyoming


4


(f)


7,199


16,642


(239

)


7,199


16,403


23,602


(634

)


1980-2022


2023


3,042


110,935


3,781,638


9,266,570


24,047


106,739


3,805,685


9,373,309


13,178,994


(479,243

)


(a)
As of December 31, 2023, we had investments in 3,192 single-tenant real estate property locations including 3,168 owned properties and 24 ground lease interests; 144 of our owned properties are accounted for as financing arrangements and six are accounted for as sales-type leases and are excluded from the table above. Initial costs exclude intangible lease assets totaling $615.3 million.
(b)
The aggregate cost for federal income tax purposes is approximately $15.0 billion.

F-5


F-1

(c)
The following is a reconciliation of total real estate carrying value for the period from February 3, 2023 through December 31, 2023, the period from January 1, 2023 through February 2, 2023 and for the years ended December 31, 2022 and 2021:

Descriptions (a)

Initial Cost to Company

Costs Capitalized Subsequent to Acquisition

Gross amount at December 31, 2021 (b) (c)

Tenant Industry


Number of Properties


Number of States


Encumbrances


Land &
Improvements


Building &
Improvements


Land &
Improvements


Building &
Improvements


Land &
Improvements


Building &
Improvements


Total


Accumulated
Depreciation
 (d) (e)


Years Constructed


Years 
Acquired

Other Professional, Scientific, and Technical Services

56

19

-

28,567

44,346

1,268

6,076

29,835

50,422

80,257

(7,465)

1910 - 2011

2016 - 2020

Other Professional, Scientific, and Technical Services

50

17

(f)

20,683

44,134

-

-

20,683

44,134

64,817

(10,343)

1950 - 2014

2014 - 2019

Outpatient Care Centers

45

15

-

22,507

58,895

2,159

11,227

24,666

70,122

94,788

(10,394)

1930 - 2020

2013 - 2021

Outpatient Care Centers

15

5

(f)

7,211

20,308

3,579

18,675

10,790

38,983

49,773

(7,161)

1928 - 2006

2013 - 2020

Offices of Physicians

18

7

-

10,401

39,623

2,019

2,917

12,420

42,540

54,960

(4,537)

1885 - 2016

2015 - 2021

Offices of Physicians

29

5

(f)

17,033

60,989

22

327

17,055

61,316

78,371

(6,475)

1865 - 2017

2017 - 2021

Family Entertainment Centers

4

4

-

19,475

41,904

1,712

1,385

21,187

43,289

64,476

(5,881)

1913 - 2017

2015 - 2020

Family Entertainment Centers

8

3

(f)

16,688

32,880

1,872

6,294

18,560

39,174

57,734

(9,906)

1993 - 2015

2011 - 2018

Wholesale Automobile Auction

8

6

(f)

67,108

41,453

6,086

2,661

73,194

44,114

117,308

(16,058)

1972 - 2015

2012 - 2019

Warehousing and Storage

10

2

(f)

30,439

75,326

-

-

30,439

75,326

105,765

(6,976)

1947 - 2000

2017 - 2021

Commercial and Industrial Machinery and Equipment Repair and Maintenance

2

1

-

1,331

8,578

-

-

1,331

8,578

9,909

(79)

1971 - 1985

2021

Commercial and Industrial Machinery and Equipment Repair and Maintenance

20

12

(f)

23,793

55,500

-

-

23,793

55,500

79,293

(1,870)

1965 - 1993

2020 - 2021

Metal and Mineral Merchant Wholesalers

13

9

-

18,407

40,540

-

-

18,407

40,540

58,947

(4,298)

1962 - 2001

2015 - 2020

Metal and Mineral Merchant Wholesalers

8

4

(f)

5,382

15,270

-

-

5,382

15,270

20,652

(5,295)

1957 - 1995

2013

Corporate Aircraft Repair and Maintenance Facilities

2

2

-

3,798

53,841

-

-

3,798

53,841

57,639

(7,621)

1988 - 2018

2015 - 2018

Corporate Aircraft Repair and Maintenance Facilities

1

1

(f)

1,883

14,234

-

-

1,883

14,234

16,117

(2,509)

1988

2014

Psychiatric and Substance Abuse Hospitals

3

3

-

3,226

17,623

81

11,530

3,307

29,153

32,460

(3,304)

1980 - 2007

2016 - 2021

Psychiatric and Substance Abuse Hospitals

14

1

-

18,919

16,161

39

931

18,958

17,092

36,050

(797)

1951 - 2020

2020 - 2021

Medical and Diagnostic Laboratories

3

3

-

4,026

13,055

-

-

4,026

13,055

17,081

(2,075)

1959 - 1999

2016 - 2017

Medical and Diagnostic Laboratories

17

2

(f)

7,063

43,259

-

-

7,063

43,259

50,322

(9,823)

1985 - 2011

2014 - 2018

Consumer Goods Rental

2

2

-

746

1,857

-

-

746

1,857

2,603

(387)

1970 - 1988

07/08/1905

Consumer Goods Rental

12

9

(f)

14,187

40,414

764

6,492

14,951

46,906

61,857

(10,303)

1880 - 2018

2013 - 2021

Machinery, Equipment, and Supplies Merchant Wholesalers

15

11

-

6,989

19,778

-

6

6,989

19,784

26,773

(4,250)

1972 - 2014

2014 - 2017

Machinery, Equipment, and Supplies Merchant Wholesalers

28

11

(f)

10,222

24,075

-

-

10,222

24,075

34,297

(6,925)

1920 - 2014

2013 - 2017

Colleges, Universities, and Professional Schools

4

2

-

3,165

24,070

766

4,161

3,931

28,231

32,162

(6,920)

1995 - 2015

2014

Colleges, Universities, and Professional Schools

1

1

14,212

4,528

22,213

-

-

4,528

22,213

26,741

(4,394)

2008

2013

Offices of Dentists

41

10

-

15,223

36,168

36

522

15,259

36,690

51,949

(2,140)

1946 - 2014

2016 - 2021


Successor


Predecessor


Period from
February 3, 2023
through
December 31, 2023


Period from
January 1, 2023
through
February 2, 2023


Year Ended December 31, 2022


Year Ended December 31, 2021


Balance, beginning of period

$

12,725,295


$

11,198,897


$

9,936,320


$

8,866,666


Additions


Acquisitions


386,842


39,920


1,333,088


1,300,142


Improvements


130,787


2,532


135,781


143,665


Other (i)


29,078


Deductions


Provision for impairment of real estate


(17,853

)


(16,050

)


(21,800

)

Other


(3,859

)


(8,750

)


(12,876

)

Cost of real estate sold


(75,155

)


(760

)


(181,492

)


(312,418

)

Reclasses to held for sale


(27,059

)

Balance, end of period


$

13,178,994


$

11,236,730


$

11,198,897


$

9,936,320


F-2

Descriptions (a)

Initial Cost to Company

Costs Capitalized Subsequent to Acquisition

Gross amount at December 31, 2021 (b) (c)

Tenant Industry


Number of Properties


Number of States


Encumbrances


Land &
Improvements


Building &
Improvements


Land &
Improvements


Building &
Improvements


Land &
Improvements


Building &
Improvements


Total


Accumulated
Depreciation
 (d) (e)


Years Constructed


Years 
Acquired

Amusement and Theme Parks

5

3

-

27,934

-

1,858

392

29,792

392

30,184

(1,930)

1950 - 2012

2015 - 2016

Amusement and Theme Parks

1

1

(f)

3,864

13,408

329

2,176

4,193

15,584

19,777

(4,694)

2009

2015

All Other Service

97

30

-

115,876

204,653

5,855

29,311

121,731

233,964

355,695

(40,559)

1856 - 2018

2014 - 2021

All Other Service

28

13

(f)

22,718

105,850

444

4,427

23,162

110,277

133,439

(15,504)

1860 - 2014

2014 - 2021

All Other Service

1

1

9,309

807

13,794

-

620

807

14,414

15,221

(3,081)

2008

2012

TOTAL SERVICE INDUSTRIES

2,213

65,005

2,009,307

3,602,056

118,514

523,960

2,127,821

4,126,016

6,253,837

(737,017)

RETAIL INDUSTRIES:

Furniture Stores

35

12

-

54,426

202,881

2,660

20,205

57,086

223,086

280,172

(25,151)

1924 - 2019

2014 - 2020

Furniture Stores

26

10

(f)

49,132

87,607

896

6,906

50,028

94,513

144,541

(24,284)

1946 - 2017

2011 - 2019

Furniture Stores

2

1

4,938

4,733

5,995

-

-

4,733

5,995

10,728

(2,010)

2006

2012

Farm and Ranch Supply Stores

37

8

-

68,910

126,308

33,053

56,248

101,963

182,556

284,519

(33,793)

1967 - 2020

2015 - 2019

Farm and Ranch Supply Stores

5

3

59,223

32,348

67,758

-

-

32,348

67,758

100,106

(17,944)

1966 - 2015

2016

Car Dealers

38

15

-

94,324

164,743

797

3,250

95,121

167,993

263,114

(12,537)

1961 - 2021

2015 - 2021

Car Dealers

2

2

(f)

4,114

6,700

-

-

4,114

6,700

10,814

(1,248)

1946 - 1977

2017

Other Motor Vehicle Dealers

13

11

-

32,485

40,883

9,199

17,966

41,684

58,849

100,533

(10,241)

1992 - 2019

2013 - 2021

Other Motor Vehicle Dealers

19

14

(f)

42,744

73,301

19,291

20,480

62,035

93,781

155,816

(23,799)

1974 - 2021

2012 - 2021

All Other Retail

30

15

-

54,819

153,114

29

1,111

54,848

154,225

209,073

(22,418)

1960 - 2016

2012 - 2019

All Other Retail

29

12

(f)

63,802

149,127

60

733

63,862

149,860

213,722

(34,128)

1955 - 2019

2011 - 2020

TOTAL RETAIL INDUSTRIES

236

64,161

501,837

1,078,417

65,985

126,899

567,822

1,205,316

1,773,138

(207,553)

MANUFACTURING INDUSTRIES:

Architectural and Structural Metals Manufacturing

19

10

-

38,800

113,432

114

1,670

38,914

115,102

154,016

(4,074)

1950 - 2005

2018 - 2021

Architectural and Structural Metals Manufacturing

16

12

(f)

9,778

47,695

-

664

9,778

48,359

58,137

(3,853)

1950 - 2007

2019 - 2020

Motor Vehicle Parts Manufacturing

17

7

-

30,140

106,776

-

-

30,140

106,776

136,916

(6,550)

1950 - 1998

2018 - 2021

Motor Vehicle Parts Manufacturing

6

3

(f)

6,619

27,969

-

-

6,619

27,969

34,588

(5,444)

1968 - 2003

2017 - 2020

Plastics Product Manufacturing

14

10

-

23,467

85,529

718

4,050

24,185

89,579

113,764

(15,453)

1965 - 2001

2015 - 2021

Plastics Product Manufacturing

4

3

(f)

6,637

22,008

-

-

6,637

22,008

28,645

(6,471)

1966 - 1999

2013 - 2018

Machine Shops; Turned Product; and Screw, Nut, and Bolt Manufacturing

30

12

-

26,872

83,476

-

-

26,872

83,476

110,348

(15,913)

1908 - 2008

2015 - 2021

Machine Shops; Turned Product; and Screw, Nut, and Bolt Manufacturing

2

2

(f)

3,663

9,878

-

-

3,663

9,878

13,541

(481)

1950

2020

(i) Represents owned land previously recorded as direct financing leases under previous accounting guidance that was modified and transferred to an operating leases of the land during the period from February 3, 2023 to December 31, 2023.

(d)
The following is a reconciliation of accumulated depreciation for the period from February 3, 2023 through December 31, 2023, the period from January 1, 2023 through February 2, 2023 and for the years ended December 31, 2022 and 2021:


Successor


Predecessor


Period from
February 3, 2023
through
December 31, 2023


Period from
January 1, 2023
through
February 2, 2023


Year Ended December 31, 2022


Year Ended December 31, 2021


Balance, beginning of period

$


$

(1,410,829

)

$

(1,134,007

)

$

(911,656

)

Additions


Depreciation expense


(482,246

)


(27,482

)


(304,588

)


(262,566

)

Deductions


Accumulated depreciation associated with real estate sold


3,003


173


19,016


25,434


Other


8,750


12,876


Reclasses to held for sale


1,905


Balance, end of period


$

(479,243

)


$

(1,438,138

)


$

(1,410,829

)


$

(1,134,007

)

F-3

(e)
The Company's real estate assets are depreciated using the straight-line method over the estimated useful lives of the properties, which generally ranges from 20 to 40 years for buildings and improvements and is 10 to 15 years for land improvements.
(f)
Property is collateral for non-recourse debt obligations totaling $2.6 billion issued under the Company’s STORE Master Funding debt program.

Descriptions (a)

Initial Cost to Company

Costs Capitalized Subsequent to Acquisition

Gross amount at December 31, 2021 (b) (c)

Tenant Industry


Number of Properties


Number of States


Encumbrances


Land &
Improvements


Building &
Improvements


Land &
Improvements


Building &
Improvements


Land &
Improvements


Building &
Improvements


Total


Accumulated
Depreciation
 (d) (e)


Years Constructed


Years 
Acquired

Household and Institutional Furniture and Kitchen Cabinet Manufacturing

2

2

-

6,894

28,460

-

-

6,894

28,460

35,354

(4,595)

1966 - 1995

2018

Household and Institutional Furniture and Kitchen Cabinet Manufacturing

6

1

41,291

15,385

48,917

-

-

15,385

48,917

64,302

(6,771)

1989 - 2001

2018

Aerospace Product and Parts Manufacturing

13

7

-

17,139

51,368

1,393

9,203

18,532

60,571

79,103

(9,338)

1953 - 2001

2016 - 2021

Aerospace Product and Parts Manufacturing

1

1

(f)

1,219

3,750

-

-

1,219

3,750

4,969

(623)

2004

2017

Other Food Manufacturing

7

5

-

17,666

51,087

1

12,196

17,667

63,283

80,950

(2,686)

1908 - 2001

2019 - 2021

Forging and Stamping

9

7

-

19,508

54,628

-

-

19,508

54,628

74,136

(10,363)

1906 - 1996

2017 - 2018

Forging and Stamping

2

2

(f)

1,959

4,588

-

-

1,959

4,588

6,547

(1,654)

1958 - 1999

2014

Foundries

5

3

-

8,465

22,650

-

1

8,465

22,651

31,116

(2,088)

1909 - 1978

2019 - 2020

Foundries

11

7

(f)

8,496

20,486

2,064

12,701

10,560

33,187

43,747

(9,411)

1948 - 1998

2013 - 2021

Dairy Product Manufacturing

4

2

-

3,511

28,290

2,481

8,490

5,992

36,780

42,772

(4,934)

1976 - 2000

2016 - 2021

Dairy Product Manufacturing

1

1

(f)

5,631

8,561

-

-

5,631

8,561

14,192

(155)

1960

2021

Resin, Synthetic Rubber, and Artificial Synthetic Fibers and Filaments Manufacturing

3

3

-

11,622

37,359

-

7,312

11,622

44,671

56,293

(3,206)

1954 - 1983

2018 - 2021

Semiconductor and Other Electronic Component Manufacturing

4

4

-

16,932

22,924

-

-

16,932

22,924

39,856

(3,858)

1967 - 1999

2016 - 2018

Semiconductor and Other Electronic Component Manufacturing

1

1

8,808

4,398

11,502

-

-

4,398

11,502

15,900

(5,545)

1960

2013

Bakeries and Tortilla Manufacturing

2

2

-

2,281

29,838

-

-

2,281

29,838

32,119

(1,666)

1976 - 1993

2019 - 2021

Bakeries and Tortilla Manufacturing

2

2

(f)

3,455

14,126

-

-

3,455

14,126

17,581

(1,012)

1994 - 2001

2019

Fruit and Vegetable Preserving and Specialty Food Manufacturing

5

5

-

11,546

37,267

-

-

11,546

37,267

48,813

(3,490)

1870 - 1992

2020

Medical Equipment and Supplies Manufacturing

5

4

-

7,505

40,644

-

-

7,505

40,644

48,149

(8,824)

1954 - 2001

2014 - 2016

Agricultural, Construction, and Mining Machinery Manufacturing

5

5

-

10,330

37,212

-

-

10,330

37,212

47,542

(1,420)

1968 - 2001

2015 - 2021

All Other Manufacturing

74

25

-

75,914

290,933

841

14,982

76,755

305,915

382,670

(40,258)

1924 - 2008

2014 - 2021

All Other Manufacturing

19

13

(f)

34,315

58,964

-

-

34,315

58,964

93,279

(9,301)

1950 - 2000

2011 - 2021

TOTAL MANUFACTURING INDUSTRIES

289

50,099

430,147

1,400,317

7,612

71,269

437,759

1,471,586

1,909,345

(189,437)

2,738

$

179,265

$

2,941,291

$

6,080,790

$

192,111

$

722,128

$

3,133,402

$

6,802,918

$

9,936,320

$

(1,134,007)

(a)As of December 31, 2021, we had investments in 2,835 single-tenant real estate property locations including 2,811 owned properties and 24 ground lease interests; 72 of our owned properties are accounted for as financing arrangements and 23 are accounted for as direct financing receivables and are excluded from the table above. In addition, 2 of the owned properties are considered to be held for sale at December 31, 2020 and are excluded from the table above. Initial costs exclude intangible lease assets totaling $55.0 million.
(b)The aggregate cost for federal income tax purposes is approximately $10,235.6 million.

F-4

(c)The following is a reconciliation of total real estate carrying value for the years ended December 31, 2021, 2020 and 2019:

Year ended December 31,


2021


2020


2019

Balance, beginning of year


$

8,866,666


$

8,175,034


$

7,168,720

Additions

Acquisitions

1,300,142

834,023

1,293,793

Improvements

143,665

130,051

149,963

Deductions

Provision for impairment of real estate

(21,800)

(21,978)

(18,201)

Other

(12,876)

(11,184)

(8,419)

Cost of real estate sold

(312,418)

(212,818)

(410,822)

Reclasses to held for sale

(27,059)

(26,462)

Balance, end of year


$

9,936,320


$

8,866,666


$

8,175,034

(d)The following is a reconciliation of accumulated depreciation for the years ended December 31, 2021, 2020 and 2019:

Year ended December 31,


2021


2020


2019

Balance, beginning of year


$

(911,656)


$

(711,176)


$

(556,690)

Additions

Depreciation expense

(262,566)

(238,853)

(216,726)

Deductions

Accumulated depreciation associated with real estate sold

25,434

23,031

53,821

Other

12,876

11,184

8,419

Reclasses to held for sale

1,905

4,158

Balance, end of year


$

(1,134,007)


$

(911,656)


$

(711,176)

(e)The Company's real estate assets are depreciated using the straight-line method over the estimated useful lives of the properties, which generally ranges from 30 to 40 years for buildings and improvements and is 15 years for land improvements.
(f)Property is collateral for non-recourse debt obligations totaling $2.3 billion issued under the Company’s STORE Master Funding debt program.

See report of independent registered public accounting firm.

F-6


F-5

STORE Capital CorporationLLC

Schedule IV - Mortgage Loans on Real Estate

As of December 31, 20212023

(Dollars in thousands)


Final


Periodic 


Final 


Outstanding


Carrying


Interest 

Maturity

Payment

Payment

Prior

face amount of

 amount of


Description

Rate

Date

Terms

 Terms

 Liens

mortgages

mortgages (c)


First mortgage loans:


NaN movie theater properties located in North Carolina (a)

8.35

%  

(b)

Interest only

Balloon of $12.4 million

NaN

$

12,411

$

9,994

NaN restaurant property located in Nashville, TN

6.35

%  

12/2/2022

Interest only

Balloon of $3.2 million

NaN

3,176

3,165

NaN health club property located in Washington (a)


7.91

%  

6/1/2022


Interest only


Balloon of $7.1 million


NaN


7,079


7,073

NaN restaurant properties located in Indiana


10.00

%  

12/31/2022


Principal & Interest


Balloon of $0.5 million


NaN


513


511

NaN elementary school properties in California and Virginia

8.00

%  

12/31/2023

Interest only

Balloon of $70.8 million

NaN

70,775

70,352

NaN metal tank manufacturing properties located in Illinois, Tennessee and Texas

7.90

%  

12/31/2026

Interest only

Balloon of $21.0 million

NaN

21,000

20,959

NaN restaurant properties located in Louisiana

8.49

%  

7/1/2032

Principal & Interest

Balloon of $1.9 million

NaN

2,095

2,098

NaN restaurant properties located in Mississippi

8.55

%  

7/1/2032

Principal & Interest

Balloon of $5.1 million

NaN

5,544

5,547

NaN restaurant properties located in Montana

9.16

%  

11/1/2036

Principal & Interest

Balloon of $3.6 million

NaN

4,064

4,042

NaN used merchandise property in Maryland

8.06

%  

9/1/2037

Principal & Interest

Fully amortizing

NaN

2,741

2,727

NaN automotive repair and maintenance properties located in Nebraska, Pennsylvania and Texas

8.25

%  

6/30/2051

30,170

30,219

NaN restaurant properties located in Tennessee

8.25

%  

8/31/2053

Principal & Interest

Fully amortizing

NaN

3,572

3,571

NaN hunting and fishing property located in California

7.90

%  

5/31/2054

Principal & Interest

Balloon of $6.0 million

NaN

16,959

16,789

NaN floral/nursery merchant wholesaler properties located in California

8.35

%  

11/30/2054

Principal & Interest

Fully amortizing

NaN

25,263

25,035

NaN mortgage loans secured by 1 recreation property located in Colorado

8.50

%  

2/28/2055

Principal & Interest

Fully amortizing

NaN

30,537

30,830

NaN manufacturing properties in California

9.00

%  

5/31/2055

Interest only

Balloon of $33.2 million

NaN

33,200

32,933

13 restaurant properties in Florida, Kansas and Missouri

7.60

%  

8/31/2055

Principal & Interest

Fully amortizing

NaN

9,928

9,926

NaN restaurant properties located in Ohio

8.28

%  

12/31/2055

Principal & Interest

Fully amortizing

NaN

3,056

3,036

Leasehold interest in an amusement park property located in Ontario, Canada

9.72

%  

8/1/2056

Principal & Interest

Fully amortizing

NaN

22,162

22,045

NaN family entertainment property located in Texas

8.25

%  

6/30/2058

Principal & Interest

Fully amortizing

NaN

4,547

4,503

NaN family entertainment properties located in Texas

8.20

%  

6/30/2058

Principal & Interest

Fully amortizing

NaN

22,847

22,670

NaN family entertainment property located in Texas

10.20

%  

6/30/2060

Principal & Interest

Fully amortizing

NaN

7,977

7,963

NaN recreation property located in Utah

9.25

%  

12/11/2060

Principal & Interest

Fully amortizing

NaN

6,286

6,329


$

345,902

$

342,317


Final


Periodic


Final


Outstanding


Carrying


Interest


Maturity


Payment


Payment


Prior


face amount of


amount of


Description


Rate


Date


Terms


Terms


Liens


mortgages (c)


mortgages (c)


First mortgage loans:


Two movie theater properties located in North Carolina (a)


8.35

%


(b)


Interest only


Balloon of $9.7 million


None


$

9,723


$

9,705


One restaurant properties located in Montana (a)


9.43

%


11/1/2036


Principal & Interest


Balloon of $2.1 million


None


2,362


2,364


Two restaurant properties located in Alabama


7.50

%


02/28/2055


Principal & Interest


Fully amortizing


None


3,528


3,596


Four restaurant properties located in Indiana


7.50

%


12/31/2055


Principal & Interest


Fully amortizing


None


3,102


3,101


Three restaurant properties located in Ohio (a)


8.62

%


12/31/2055


Principal & Interest


Fully amortizing


None


2,975


2,991


One athletic club in Chicago, IL (a)


7.60

%


1/31/2056


Principal & Interest


Fully amortizing


None


15,159


15,501


Leasehold interest in an amusement park property located in Ontario, Canada


10.06

%


8/1/2056


Principal & Interest


Fully amortizing


None


25,632


25,339


Six manufacturing properties in Illinois, Michigan, Oklahoma, and Texas


7.50

%


10/01/2043


Principal & Interest


Balloon of $22.2 million


None


32,616


32,480


One manufacturing property in New Jersey


10.25

%


11/01/2048


Principal & Interest


Balloon of $27.5 million


None


29,996


29,706


$

125,093


$

124,783


F-6

The following shows changes in the carrying amounts of mortgage loans receivable during the period from February 3, 2023 through December 31, 2023, the period from January 1, 2023 through February 2, 2023 and for the years ended December 31, 2021, 20202022 and 20192021 (in thousands):

Year ended December 31,


2021


2020


2019


Balance, beginning of year

$

301,355

$

202,557

$

156,603

Additions:

New mortgage loans (d)


75,666


132,542


74,681

Other: Capitalized loan origination costs


98


155


54

Deductions:

Collections of principal (e)


(32,046)


(32,151)


(28,701)

Other: Provisions for loan losses

(2,704)

(1,670)

Other: Amortization of loan origination costs


(52)


(78)


(80)

Balance, end of year

$

342,317

$

301,355

$

202,557


Successor


Predecessor


Period from
February 3, 2023
through
December 31, 2023


Period from
January 1, 2023
through
February 2, 2023


Year Ended December 31, 2022


Year Ended December 31, 2021


Balance, beginning of period


$

359,124


$

342,420


$

342,317


$

301,355


Additions:


New and additions to mortgage loans


92,699


7,703


68,912


75,666


Other: Capitalized loan origination costs


220


-


85


98


Deductions:


Collections of principal (d)


(26,489

)


-


(69,279

)


(32,046

)

Sale of loans to related party


(299,142

)


-


-


-


Other: Amortization of premiums on notes receivable


(619

)


-


-


-


Other: (Provisions for) reduction in loan losses


(1,006

)


-


503


(2,704

)

Other: Amortization of loan origination costs


(4

)


(5

)


(118

)


(52

)

Balance, end of period


$

124,783


$

350,118


$

342,420


$

342,317


(a)
Loan was on nonaccrual status as of December 31, 2023.
(a)
Loan was on nonaccrual status as of December 31, 2021.
(b)Loan matured prior to December 31, 2021 and the Company has been in negotiations with the borrower regarding a resolution.
(c)The aggregate cost for federal income tax purposes is $346.8 million.
(d)For the year ended December 31, 2021, new mortgage loans includes $19.8 million of mortgage loans previously classified as deferred financing receivables.
(e)For the years ended December 31, 2021, 2020 and 2019, collections of principal include non-cash principal collections aggregating $30.8
Loan matured prior to December 31, 2023 and the Company has been in negotiations with the borrower regarding a resolution.
(c)
The aggregate cost for federal income tax purposes is $125.8 million.
(d)
For the years ended December 31, 2022 and 2021, collections of principal include non-cash principal collections aggregating $8.9 million and $30.8 million, respectively, related to loans receivable transactions in which the Company acquired the underlying mortgaged property.

 million, $23.4 million and $13.6 million, respectively, related to loan receivable transactions in which the Company acquired the underlying mortgaged property.

See report of independent registered public accounting firm.

F-7

F-7