SECURITIES AND EXCHANGE COMMISSION
xAnnual Report pursuant to Section 13 or 15(d) of the Securities Exchange Act of 1934
For the fiscal year ended
December 31,, 2021 2023
oTransition report pursuant to Section 13 or 15(d) of the Securities Exchange Act of 1934 For the transition period from to
Commission File Number: 001-40361
(Exact name of registrant as specified in its charter)
|
Delaware | 11095 Viking Drive, | |
Delaware
| 6625 West 78th Street, Suite 300
| 83-1608463
|
(State or other jurisdiction of | Minneapolis, Eden Prairie, Minnesota55439-2604
55344 | (I.R.S. Employer |
incorporation or organization) | (Address of principal executive offices, including zip code) | Identification No.) |
(Registrant’s telephone number, including area code)
Securities registered pursuant to Section 12(b) of the Act:
| | | | | | | | |
Title of each class | Trading Symbol(s) | Name of each exchange on which registered |
Common Stock, par value $0.0001 | AGTI | The New York Stock Exchange |
Securities registered pursuant to Section 12(g) of the Act: None
Indicate by check mark if the registrant is a well-known seasoned issuer, as defined in Rule 405 of the Securities Act. Yes ☐o No ☒x Indicate by check mark if the registrant is not required to file reports pursuant to Section 13 or Section 15(d) of the Act. Yes ☐o No ☒x Indicate by check mark whether the registrant (1) has filed all reports required to be filed by Section 13 or 15(d) of the Securities Exchange Act of 1934 during the preceding 12 months (or for such shorter period that the registrant was required to file such reports), and (2) has been subject to such filing requirements for the past 90 days. Yes ☒x No ☐o Indicate by check mark whether the registrant has submitted electronically every Interactive Data File required to be submitted pursuant to Rule 405 of Regulation S-T (§ 232.405 of this chapter) during the preceding 12 months (or for such shorter period that the registrant was required to submit such files). Yes ☒x No ☐o Indicate by check mark whether the registrant is a large accelerated filer, an accelerated filer, a non-accelerated filer, a smaller reporting company or an emerging growth company. See the definitions of “large accelerated filer,” “accelerated filer,” “smaller reporting company,” and “emerging growth company” in Rule 12b-2 of the Exchange Act.
| | | | | | | | | | | | | | | | | |
Large accelerated filer☐ | o | Accelerated filer☐ | x | Emerging growth company☐ | o |
Non-accelerated filer☒ | o | Smaller reporting company☐ |
|
o | |
|
If an emerging growth company, indicate by check mark if the registrant has elected not to use the extended transition period for complying with any new or revised financing accounting standards provided pursuant to Section 13(a) of the Exchange Act. ☐o
Indicate by check mark whether the registrant has filed a report on and attestation to its management’s assessment of the effectiveness of its internal control overfinancial reporting under Section 404(b) of the Sarbanes-Oxley Act (15 U.S.C. 7262(b)) by the registered public accounting firm that prepared or issued its audit report.
☐x
If securities are registered pursuant to Section 12(b) of the Act, indicate by check mark whether the financial statements of the registrant included in the filing reflect the correction of an error to previously issued financial statements. o
Indicate by check mark whether any of those error corrections are restatements that required a recovery analysis of incentive-based compensation received by any of the registrant’s executive officers during the relevant recovery period pursuant to §240.10D-1(b). o
Indicate by check mark whether the registrant is a shell company (as defined in Rule 12b-2 of the Exchange Act). Yes ☐o No ☒x The aggregate market value of the voting and non-voting common equity held by non-affiliates of the registrant as of June 30,
2021,2023, the last business day of the registrant's most recently completed second fiscal quarter, was approximately
$694,928,895$582,763,154 based upon the closing price reported for such date on the New York Stock Exchange.
The number of shares of common stock, $0.0001 par value, outstanding as of February
28, 202229, 2024 was
131,121,028.135,652,249.
DOCUMENTS INCORPORATED BY REFERENCE
Portions of the registrant’s Definitive Proxy Statement relating to the Annual Meeting of Stockholders are incorporated by reference into Part III of this Annual Report on Form 10-K where indicated. Such Definitive Proxy Statement will be filed with the Securities and Exchange Commission within 120 days after the end of the registrant’s fiscal year ended December 31,
2021.
2023.
NOTE REGARDING FORWARD-LOOKING STATEMENTS
This Annual Report on Form 10-K contains forward-looking statements within the meaning of the Private Securities Litigation Reform Act of 1995. All statements other than statements of historical fact included in this Form 10-K are forward-looking statements. Forward-looking statements give our current expectations and projections relating to our financial condition, results of operations, plans, objectives, future performance and business. You can identify forward-looking statements by the fact that they do not relate strictly to historical or current facts. These statements may include words such as “anticipate”, “estimate”, “expect”, “project”, “plan”, “intend”, “believe”, “may”, “will”, “should”, “can have”, “likely” and other words and terms of similar meaning in connection with any discussion of the timing or nature of future operating or financial performance or other events. All forward-looking statements are subject to risks and uncertainties that may cause actual results to differ materially from those that we expected, including:
| ● | effects from political and policy changes that could limit our growth opportunities; |
| ● | effects from the continued COVID-19 pandemic on our business and the economy; |
| ● | our potential inability to maintain existing contracts or contract terms with, or enter into new contracts with, our customers; |
| ● | cancellations by or disputes with customers; |
| ● | our potential failure to maintain our reputation, including by protecting intellectual property; |
| ● | effects of a global economic downturn on our customers and suppliers; |
| ● | a decrease in our customers’ patient census or services; |
| ● | competitive practices by our competitors that could cause us to lose market share, reduce our prices or increase our expenditures; |
| ● | the bundling of products and services by our competitors, some of which we do not offer; |
| ● | consolidation in the healthcare industry, which may lead to a reduction in the prices we charge; |
| ● | adverse developments with supplier relationships; |
| ● | the potential inability to change the manner in which healthcare providers traditionally procure medical equipment; |
| ● | our potential inability to attract and retain key personnel; |
| ● | our potential inability to make attractive acquisitions or successfully integrate acquire businesses; |
| ● | impairment charges for goodwill or other long-lived assets; |
| ● | an increase in expenses related to our pension plan; |
| ● | the fluctuation of our cash flow; |
| ● | credit risks relating to home care providers and nursing homes; |
| ● | potential claims related to the medical equipment that we outsource and service; |
| ● | the incurrence of costs that we cannot pass through to our customers; |
| ● | a failure of our management information systems; |
| ● | limitations inherent in all internal controls systems over financial reporting; |
| ● | our failure to keep up with technological changes; |
| ● | our failure to coordinate the management of our equipment; |
| ● | challenges to our tax positions or changes in taxation laws; |
| ● | litigation that may be costly to defend; |
| ● | uncertainty surrounding healthcare reform initiatives; |
| ● | federal privacy laws that may subject us to more stringent penalties; |
• market volatility of our common stock as a result of our leadership transition;
• the risk that the leadership transition may not provide the results that the company expects;
• imbalances in our selling mix;
• effects from political and policy changes that could limit our growth opportunities;
• our ability to maintain existing contracts or contract terms with, or enter into new contracts with customers;
• cancellations by or disputes with customers;
• our ability to maintain our reputation, including by protecting intellectual property;
• effects of a global economic downturn on our customers and suppliers;
• competitive practices by our competitors that could cause us to lose market share, reduce our prices or increase our expenditures;
• the bundling of products and services by our competitors, some of which we do not offer;
• consolidation in the healthcare industry;
• adverse developments with supplier relationships;
• our potential inability to attract and retain key personnel;
• our potential inability to make attractive acquisitions or successfully integrate acquire businesses;
• our need for substantial cash to operate and expand our business as planned;
• our substantial outstanding debt and debt service obligations;
• restrictions imposed by the terms of our debt;
• a decrease in the number of patients our customers are serving;
• our ability to effect change in the manner in which health care providers traditionally procure medical equipment;
• the absence of long-term commitments with customers;
• our ability to renew contracts with group purchasing organizations and integrated delivery networks;
• changes in reimbursement rates and policies by third-party payors;
• the impact of health care reform initiatives;
• the impact of significant regulation of the health care industry and the need to comply with those regulations;
• difficulties or delays in our continued expansion into certain of our businesses/geographic markets and developments of new businesses/geographic markets;
• additional credit risks in increasing business with home care providers and nursing homes, impacts of equipment product recalls or obsolescence;
• impairment charges for goodwill or other long-lived assets;
• an increase in expenses related to our pension plan;
• potential claims related to the medical equipment that we outsource and service;
• incurrence of costs that we cannot pass through to our customers;
• a failure of our management information systems;
• limitations inherent in all internal controls systems over financial reporting;
• our failure to keep up with technological changes;
• our failure to coordinate the management of our equipment;
• challenges to our tax positions or changes in taxation laws;
• litigation that may be costly to defend;
• federal privacy laws that may subject us to more stringent penalties;
• our contracts with the federal government that subject us to additional oversight;
• effects of high interest rates; and
• potential recall or obsolescence of our large fleet of medical equipment.
| ● | our relationship with healthcare facilities and marketing practices that are subject to federal Anti-Kickback Statute and similar state laws; |
| ● | our contracts with the federal government that subject us to additional oversight; |
| ● | the impact of changes in third-party payor reimbursement for healthcare items and services on our customers’ ability to pay for our services; |
| ● | the highly regulated environment our customers operate in; and |
| ● | potential recall or obsolescence of our large fleet of medical equipment. |
We derive many of our forward-looking statements from our operating budgets and forecasts, which are based on many detailed assumptions. While we believe that our assumptions are reasonable, we caution that it is very difficult to predict the impact of known factors, and it is impossible for us to anticipate all factors that could affect our actual results. Important factors that could cause actual results to differ materially from our expectations, or cautionary statements, are disclosed under “Risk Factors” and “Management’s Discussion and Analysis of Financial Condition and Results of Operations” in this Form 10-K and elsewhere in our filings with the SEC. All written and oral forward-looking statements attributable to us, or persons acting on our behalf, are expressly qualified in their entirety by these cautionary statements as well as other cautionary statements that are made from time to time in our other SEC filings and public communications. You should evaluate all forward-looking statements made in this Form 10-K in the context of these risks and uncertainties.
We caution you that the important factors referenced above may not contain all of the factors that are important to you. In addition, we cannot assure you that we will realize the results or developments we expect or anticipate or, even if substantially realized, that they will result in the consequences or affect us or our operations in the way we expect. The forward-looking statements included in this Form 10-K are made only as of the date hereof. We undertake no obligation to update or revise any forward-looking statement as a result of new information, future events or otherwise, except as otherwise required by law.
Unless otherwise specified, the terms “we”, “our”, “us” and the “Company” refer to Agiliti, Inc. and, where appropriate, its consolidated subsidiaries. The term “THL” refers to Thomas H. Lee Partners, L.P., our principal stockholder, and the term “THL Stockholder” refers to THL Agiliti LLC, an affiliate of Thomas H. Lee Partners, L.P.
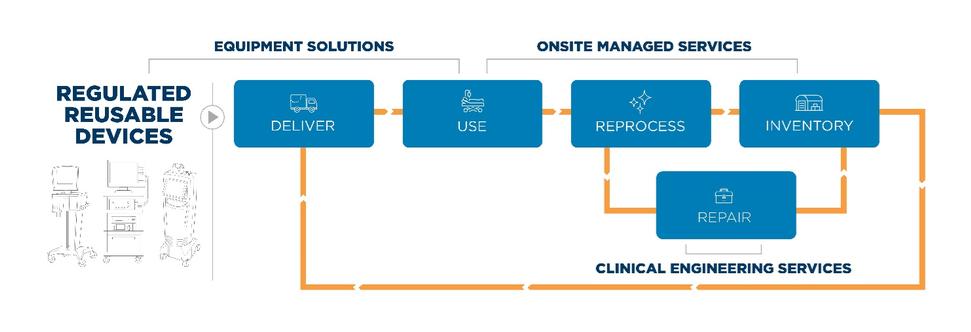
Agiliti, Inc. is an essential service provider to the U.S. healthcare industry with solutions that help support a more efficient, safe and sustainable healthcare delivery system. We ensure healthcare providers have the critical medical equipment they need to care for patients—wherever and whenever it’s needed—with a service model that helps lower costs, reduce waste, and maintain the highest quality standard of medical device management in the industry. We are motivated by a belief that every interaction has the power to change a life, which forms the cornerstone of how we approach our work and frames the lens through which we view our responsibility to make a difference for the customers, patients, and communities we serve.
We believe we are one of the leading experts in the manufacturing, management, maintenance, and mobilization of mission-critical, regulated, reusable medical devices. We offer healthcare providers a comprehensive suite of medical equipment management and service solutions that help reduce capital and operating expenses, optimize medical equipment utilization, reduce waste, enhance staff productivity, and bolster patient safety.
We commenced operations in 1939, originally incorporated in Minnesota in 1954 and reincorporated in Delaware in 2001.
In our more than
8085 years of experience ensuring healthcare providers have high-quality, expertly maintained equipment to serve their patients, we’ve established a nationwide operating footprint that supports our offering. This at-scale, local market service and logistics infrastructure positions us to reach customers across the entire healthcare continuum—from individual facilities to the largest and most complex healthcare systems.
Our ability to rapidly mobilize, track, repair and redeploy equipment during times of peak need or emergent events has made us a service provider of choice for city, state and the federal government in the management of emergency equipment stockpiles.Our diverse customer base includes more than
9,00010,000 national, regional, and local acute care hospitals, health systems and integrated delivery networks
("IDN"), and alternate site providers (such as surgery centers, specialty hospitals, home care providers, long-term acute care hospitals, and skilled nursing facilities). We serve the federal government as well as a number of city and state governments providing management and maintenance of emergency equipment stockpiles, and we are an outsourced service provider to medical device manufacturers supporting critical device remediation and repair services. We deliver our solutions through our nationwide network of more than 150 service centers and
seven ISO 13485 Certified Centers of Excellence,
amonga majority of which
are certified to ISO 13485:2016. At our facilities, we employ a team of more than
700800 specialized biomed repair technicians, more than 4,000 field-based service operators who work onsite within customer facilities or in our local service centers, and over 200 field sales and account managers. Our fees are primarily paid directly by our customers rather than by direct reimbursement from third-party payors, such as private insurers, Medicare, or Medicaid.
The U.S. healthcare industry continues to face transformative pressure that affects how provider organizations conduct business and serve their patients. Across the healthcare system, providers face compounding financial and operational challenges, including cost pressure from payors, nursing and clinical staff shortages, rising costs of drugs and supplies, increasing regulatory oversight, and advances in medical technology that generally result in higher prices for newer equipment and a higher cost of managing that equipment over its lifecycle. Given there is little that providers can do to change external dynamics, there is increased focus on areas within their enterprise that they can control. In our
experience, one area that most hospitals and health systems identify for operational and cost improvement is the management and maintenance of medical equipment.
Healthcare facilities have been shown to own large quantities of reusable capital equipment ranging from multi-million dollar highly technical devices (e.g. MRIs) to lower cost, high volume devices (e.g. infusion pumps) required for patient care, treatment, and diagnosis. In our experience, providers often face challenges in managing their medical equipment
inventory effectively. For example, hospitals typically utilize roughly 42% of their owned medical equipment inventory at any given time, yet caregivers report that they routinely lack access to readily available patient-ready equipment. Nurses report spending an average of 20 minutes per shift searching for equipment, and often less than 37% of their time on direct patient care. Operational silos that naturally occur among hospital departments create inadvertent breakdowns within equipment management workflows, from the administrators who order equipment, to the support staff who clean/reprocess and deliver the equipment, to the nurses and doctors who use the equipment.
Further, the repair and maintenance of this highly technical equipment continues to increase in complexity and cost. Over a period of 15 years from 1995 to 2010 there was a 62% increase in the number of medical devices per hospital bed and a 90% increase in costs related to maintaining this
equipment (between 1995 and 2010).equipment. Given the increasingly complex nature of these devices and stringent regulatory mandates guiding their upkeep, specialized technical knowledge is required to repair and maintain them. Most healthcare facilities struggle to employ the in-house capabilities and resources needed to ensure timely, routine maintenance and rapid testing, repair, and turnaround of their medical inventory which may impact time-to-therapy and patient safety, while driving up capital replacement costs on equipment that could have otherwise been kept operational with proper maintenance.
Finally, the healthcare system experiences seasonality in patient volumes, resulting in peak-need demand for specialized medical equipment (e.g. ventilators, specialty beds, infusion pumps). Given the common breakdowns in managing and maintaining their inventory during times of normal operation, hospitals face additional burden on equipment availability during times of peak need and will procure supplemental equipment through additional acquisition channels to fill this gap.
These challenges drive up significant costs and time delays within individual hospital facilities, but when multiplied across several hospitals and alternate site facilities within an integrated delivery network,
(“IDN”), the losses increase significantly. An average 2,500 bed IDN has been shown to waste more than $11 million annually on inefficient equipment maintenance and unnecessary capital purchases, while clinicians lose valuable patient time and productivity hours managing equipment needs.
These dynamics, supported by the following trends, further support the essential nature of our work:
Focus on reducing costs and increasing operational efficiency. Hospitals and other healthcare facilities continue to experience substantial pressure to conserve capital, reduce operating expenses, and become more operationally efficient. We expect these pressures to continue in the future and believe that we will always be on the right side of healthcare reform. Our comprehensive, end-to-end solutions offer customers a way to realize costs savings while enhancing operational improvements for medical equipment access and availability, thereby improving their organizational efficiency and financial viability. Demand for better patient safety and outcomes. Hospitals across the U.S. are focused on improving patient safety and outcomes, which includes efforts to minimize hospital-acquired conditions (e.g. infections, patient falls, and pressure injuries) and increase nursing time at the patient bedside. Hospitals turn to us to assist them in managing their equipment in ways that have been shown to to help them to minimize these incidents and ensure necessary equipment is available when and where it is needed, for patient care, thereby improving patient safety and time to therapy and supporting optimal patient outcomes. Caregiver retention and satisfaction. Hospitals continue to experience pressure and risk related to nursing and other caregiver retention and job satisfaction pressures. According to reports from the World Health Organization,McKinsey & Company, the United States is expected to haveface a nurse shortage of 500,000between 200,000 and 450,000 nurses by 2025. Adding non-patient care duties, such as searching for, cleaning, and managing equipment, adds to nurse workload and contributes to clinician dissatisfaction and turnover.
We expect that with these internal pressures, hospitals will increasingly turn to our programs to outsource healthcare technology management duties and related management processes to allow nurses more time to spend on patient care, resulting in improved job satisfaction.
Increased capital and operating expense pressures and regulatory compliance. Hospitals continue to experience restricted capital and operating budgets, while the cost and complexity of medical equipment increases. Furthermore, the increasing complexity and sophistication of medical equipment brings with it more recordkeeping requirements and regulatory scrutiny in its use and maintenance. We expect that hospitals will increasingly look to us to support the management and maintenance of their capital equipment inventory to achieve capital and operating expense savings, operating efficiencies and regulatory compliance.
As a critical outsource partner to more than
9,00010,000 U.S. healthcare customers, including most leading providers nationwide, we’ve tailored our solution offering and service model to address the unique challenges and opportunities we witness among our customers related to the effective management of medical equipment.
Our services help eliminate significant capital and operating costs associated with the ownership and lifecycle management of mission-critical medical equipment. In addition to optimizing use of providers’ owned equipment, we provide ready access and increase the on-patient utilization of supplemental medical equipment to address fluctuations in patient census and patient acuity. By partnering with Agiliti, providers have the benefits of:
Cost savings and lower total costs of equipment ownership
• | ● | Increased utilization of both customer-owned and supplemental equipment |
| ● | Lower overall total cost of equipment ownership by combining our solutions to solve challenges across the end-to-end equipment management process |
| ● | Optimized management and logistics of provider-owned equipment through tracking, monitoring, reprocessing, maintaining, and ensuring equipment is safety-tested and redeployed for use |
| ● | Reduced maintenance and repair costs through the use of our proprietary technology, flexible staffing models, parts pool, equipment capabilities and diverse skill mix of knowledgeable equipment technicians and our commitment to quality |
| ● | Benefits of specialized technician labor to augment clinical biomed staff, having been shown to help reduce service costs and provide required technical proficiency to address more complex equipment types |
| ● | Access to our extensive data and expertise on the cost, performance, features and functions of all major items of medical equipment |
| ● | Assistance with capital planning, vendor management and regulatory compliance |
Increased utilization of both customer-owned and supplemental equipment •Lower overall total cost of equipment ownership by combining our solutions to solve challenges across the end-to-end equipment management process
•Optimized management and logistics of provider-owned equipment through tracking, monitoring, reprocessing, maintaining, and ensuring equipment is safety-tested and redeployed for use
•Reduced maintenance and repair costs through the use of our proprietary technology, flexible staffing models, parts pool, equipment capabilities, diverse skill mix of knowledgeable equipment technicians, and our commitment to quality
•Benefits of specialized technician labor to augment clinical biomed staff, having been shown to help reduce service costs and provide required technical proficiency to address more complex equipment types
•Access to our extensive data and expertise on the cost, performance, features, and functions of all major items of medical equipment
•Assistance with capital planning, vendor management, and regulatory compliance
More time to spend with patients and confidence in the availability of patient-ready medical equipment
| ● | Increased productivity and satisfaction among nursing staff achieved by eliminating certain non-clinical work tasks and saving an average 300-bed hospital over 28,000 caregiver hours annually, allowing more time to focus on patient care responsibilities |
| ● | Improved time-to-therapy for patients at risk for falls, skin breakdown and bariatric safety by expediting delivery of therapeutic equipment direct to the patient room |
| ● | Access to supplemental moveable medical equipment, surgical equipment and next generation technology without the expense of acquisition on a pay-per-procedure basis |
•Improved time-to-therapy for patients at risk for falls, skin breakdown, and bariatric safety by expediting delivery of therapeutic equipment direct to the patient room
Improved regulatory compliance, risk management and extended use life
• | ● | Optimal maintenance intervals and parts replacement to extend equipment use life, reduce waste and lower obsolescence risk |
| ● | Compliance with regulatory and recordkeeping requirements and adherence to manufacturers’ specifications on the reprocessing and maintenance of medical equipment |
| ● | Equipment quality assurance through the use of our comprehensive quality management system (“QMS”) based on the quality standards recognized worldwide for medical devices: 21 CFR 820 and ISO 13485:2016 |
| ● | Risk mitigation and lower costs associated with product recalls or device modifications |
Optimal maintenance intervals and parts replacement to extend equipment use life, reduce waste, and lower obsolescence risk •Compliance with regulatory and recordkeeping requirements and adherence to manufacturers’ specifications on the reprocessing and maintenance of medical equipment
•Equipment quality assurance through the use of our comprehensive quality management system (“QMS”) based on the quality standards recognized worldwide for medical devices: 21 CFR 820 and ISO 13485:2016
•Risk mitigation and lower costs associated with product recalls or device modifications
Technical expertise and supplemental staffing to sustain optimal equipment workflow
• | ● | Reduced administrative and time burdens on clinical staff related to managing and locating available equipment and coordinating among multiple vendors |
| ● | Specialized technical and clinical specialists that directly interact with and work alongside customers to optimize equipment outsourcing solutions |
Reduced administrative and time burdens on clinical staff related to managing and locating available equipment and coordinating among multiple vendors •Specialized technical and clinical specialists that directly interact with and work alongside customers to optimize equipment outsourcing solutions
We participateparticipate in a $14 billionthe U.S. medical equipment services market comprised of the services we offer through our onsite managed services, clinical engineering services, and equipment solutions service lines. We believe that this market will grow at mid-single digits annually.Per
According to the Centers for Medicare and Medicaid Services (“CMS”), as of
2020,2022, healthcare spending reached
$4.1$4.5 trillion, or
$12,530$13,493 per person, and accounted for
19.7%17.3% of the U.S. GDP. Spending is expected to grow at an average annual rate of 5.4% from
2019-2028,2022-2031, due to secular tailwinds including an aging population, rising acuity, and prevalence of chronic conditions.
There is a fundamental shift in the needs of health systems, hospitals, and alternate site providers to move from supplemental and peak need sourcing of medical equipment toward more comprehensive onsite inventory management and maintenance solutions. As healthcare facilities look to balance the challenge of providing better care at lower costs, they are more open to third party partnerships that outsource critical but non-core support functions. The move toward full outsourcing is not unlike trends in similar services at hospitals including food service, laundry, professional staffing, and technology.
We believe there are several key macro trends that will drive increased demand for our products and services:
Favorable demographic trends. According to the U.S. Census Bureau, individuals aged 65 and older in the United States comprise the fastest growing segment of the population. This segment is expected to grow to approximately 8195 million individuals by 2040.2060. This represents a 44%93.9% increase in the 65-and-older segment of the population over the next 20 years.as compared to 2016. As a result, over time, the number of patients and the volume of hospital admissions are expected to grow. The aging population and increasing life expectancy are driving demand for healthcare services. Increase in chronic disease and obesity. According to the Center for Disease Control and Prevention (“CDC”), six in ten Americans live with at least one chronic disease, like heart disease and stroke, cancer, or diabetes. These conditions often require specialty equipment to support therapeutic intervention in inpatient and outpatient care settings. In addition, obesity in the U.S. increased to 42.4%41.9% of the population between 2017-2018,2017-2020, up from 30.5% in 2000between 1999-2000 (CDC). This population demands greater access to specialty bariatric equipment to support care and minimize the incidence of injury during a hospital stay.
Increased mergers & acquisitions. We have seen that hospitals and healthcare systems continue to expand their covered network and acquire alternate care delivery settings in order to care for patient populations in the most cost-
effectivecost-effective way. In our experience, providers are increasingly seeking partners that provide comprehensive services and that can quickly adapt to changing health system infrastructure and growth. Working with one vendor that can operate at a nationwide and system-wide scale is attractive to cities, states, and IDNs who operate, manage, and maintain equipment inventories across multiple locations.
Centralizing shared services across the IDN. Health systems with duplicateduplicative services across multiple facilities in close proximity have an increased risk of unnecessary variation, greater costs, and suboptimal outcomes. Many health systems have centralized and consolidated non-clinical services as a shared service, including billing, reimbursement, supply chain, human resources, IT, etc. We have witnessed a growing trend among IDNs to centralize and consolidate equipment maintenance and logistics among member facilities. In our experience, because most health systems do not currently have the storage, technical, or transportation resources for managing a shared equipment management function, they will seek third party support to optimize equipment utilization, redeploy equipment where needed, and reduce overall equipment costs. Increase in infection control risks. Infection control remains an essential priority for hospitals and health systems as a way to limit the spread of hospital-acquired infections. This has further escalated asinfections and broad transmission of infectious diseases during a top priority due to the COVID-19 pandemic. Most focus in this area is around hand hygiene, the proper use of personal protective equipment (PPE)("PPE"), and the reprocessing and sterilization of critical and semi-critical medical devices (e.g. surgical instruments, endoscopes). Often overlooked is the reprocessing of non-critical medical devices, such as infusion pumps and ventilators, that are commonly touched by caregivers and patients. If not properly cleaned and sanitized between patient use, these devices can pose increased infection control risks. We expect an increase in demand of onsite equipment management programs to address proper reprocessing of these types of devices and help lower infection risks and allow clinicians to spend more time at the patient bedside and less time cleaning equipment.
We provide a comprehensive offering for the manufacturing, management, maintenance, and mobilization of critical medical devices, built on an integrated service platform. Our solutions help reduce the cost and complexity of acquiring, managing, and maintaining medical equipment inventories. The integrated nature of our offerings within our end-to-end
service framework ensures we maximize value to over
9,00010,000 customers nationwide as we address more aspects of the equipment lifecycle continuum.
While customers may initially engage with us across one aspect of our service lines within this framework, we employ a variety of land-and-expand tactics to grow our relationships and customer share-of-wallet over time. These tactics include:
| ● | Gateway solutions which offer an entry point to the economic buyer and include peak needs equipment, surgical lasers and equipment, specialty beds and surfaces and supplemental clinical engineering services; |
| ● | Vertical solutions which provide a deeper level of service with clinical offerings tailored to specific patient needs (e.g. bariatrics, wound management, falls management) and clinical engineering programs for broad equipment categories (general biomedical devices, diagnostic imaging equipment, surgical instruments); |
| ● | Comprehensive, connected solutions through onsite managed services and outsourced clinical engineering services that connect previously fragmented customer workflow processes to drive operational efficiencies, realize improved clinician and equipment productivity, lower total cost of ownership, ensure regulatory compliance, reduce waste, improve time to therapy and allow customers to effectively lower costs; and |
| ● | Comprehensive logistics, management and clinical engineering solutions that allow IDNs to manage equipment inventories across multiple locations, and supports city, state and federal government agencies in managing and maintaining equipment stockpiles. |
•Gateway solutions which offer an entry point to the economic buyer and include peak need equipment, surgical lasers and equipment, specialty beds and surfaces, and supplemental clinical engineering services;
•Vertical solutions which provide a deeper level of service with clinical offerings tailored to specific patient needs (e.g. bariatrics, wound management, falls management) and clinical engineering programs for broad equipment categories (general biomedical devices, diagnostic imaging equipment, surgical instruments);
•Comprehensive, connected solutions through onsite managed services and outsourced clinical engineering services that connect previously fragmented customer workflow processes to drive operational efficiencies, realize improved clinician and equipment productivity, lower total cost of ownership, ensure regulatory compliance, reduce waste, improve time to therapy, and allow customers to effectively lower costs; and
•Comprehensive logistics, management and clinical engineering solutions that allow IDNs to manage equipment inventories across multiple locations, and supports city, state, and federal government agencies in managing and maintaining equipment stockpiles.
We deploy our solution offering across three primary service lines:
On-Site Managed Services: Onsite Managed Services are comprehensive programs that assume full responsibility for the management, reprocessing, and logistics of medical equipment at individual facilities and IDNs, with the added benefit of enhancing equipment utilization and freeing more clinician time for patient care. This solution monitors and adjusts equipment quantities and availability to address fluctuations in patient census and acuity. Our more than 1,600than 1,300 onsite employees work 24/7 in customer facilities, augmenting clinical support by integrating proven equipment management processes, utilizing our proprietary management software and conducting daily rounds, and unit-based training to ensure equipment is being used and managed properly, overall helping to optimize day-to-day operations and care outcomes. We assume full responsibility for ensuring equipment is available when and where it is needed, removing equipment when no longer in use, and decontaminating, testing, and servicing equipment as needed between each patient use. Revenue attributable to such customers represented 29% of our total revenue for both the years ended December 31, 20212023 and 2020.2022 represented 22% and 23% of our total revenue, respectively.
Clinical Engineering Services: Clinical Engineering Services provides maintenance, repair, and remediation solutions for all types of medical equipment, including general biomedical equipment, diagnostic imaging equipment, and surgical equipment through supplemental and outsourced offerings. Our supplemental offering helps customers manage their equipment repair and maintenance backlog, assist with remediation and regulatory reporting, and temporarily fill open biotechnical positions. With our outsourced offering, we assume full management, staffing, and clinical engineering service responsibilities for individual or system-wide customer sites. The outsourced model deploys a dedicated, on-site team to coordinate the management of customer-owned equipment utilizing our proprietary information systems, third party vendors of services and parts, and a broad range of professional services for capital equipment planning and regulatory compliance. We leverageemploy more than 700 technical resources from800 technicians across our overmore than 150 local market service centers and seven Centers of Excellence towho can flex staff in and out of customer facilities on an as-needed basis, ensuring customers pay only for time spent directly servicing their equipment by an appropriately qualified technician. We use flex staffing for our supplemental clinical engineering solution and to augment support when additional technicians are needed to supplement our outsourced services during peak workload. We contract our Clinical Engineering Services with acute care and alternate site facilities across the U.S., as well as with the federal government and any medical device manufacturers that require a broad logistical
footprint to support their large-scale service needs. Revenue attributable to such customers for the years ended December 31, 20212023 and 20202022 represented 37%39% and 33%38% of our total revenue, respectively. Equipment Solutions:Equipment Solutions primarily provides supplemental, peak need, and per-case rental of general biomedical, specialty, and surgical equipment to acute care hospitals and alternate site providers in the U.S., including some of the nation’s premier healthcare institutions and integrated delivery networks. We contract for Equipment Solutions services directly with customers or through our contractual arrangements with hospital systems and alternate site providers. We consistently achieve high customer satisfaction ratings, as evidenced by our Net PromotorPromoter Score ("NPS") of 5540 for the year ended December 31, 2021, by delivering2023. For these customers we deliver patient-ready equipment within our contracted equipment delivery times and by providingprovide technical support and educational in-servicing for equipment as-needed in clinical departments, including the emergency room, operating room, intensive care, rehabilitation, and general patient care areas. We are committed to providing the highest quality of equipment to our customers, and we do so through the use of our comprehensive QMS which is based on the quality standards recognized worldwide for medical devices: 21 CFR 820 and ISO 13485:2016. This commitment ensures that customers have access to patient-ready equipment with the confidence of knowing it has been prepared and maintained to the highest industry standard to deliverfor optimal patient safety and outcomes. Revenue attributable to such customers for theboth years ended December 31, 20212023 and 20202022 represented 34% and 38%39% of our total revenue, respectivelyrevenue.. Many of our customers have multiple contracts
and havewith Agiliti with revenue reported
inacross multiple service lines. Our contracts vary based upon service offering, including with respect to term (with most being multi-year contracts), pricing (daily, monthly, and fixed fee arrangements) and termination (termination for convenience to termination for cause only). Many of our contracts contain customer commitment guarantees and annual price increases tied to the consumer price index. Standard contract terms include payment terms, limitation of liability, force majeure provisions, and choice of law/venue.
Because we work closely with customers to provide a long-term, value-based solution versus a product-based, transactional approach, they are motivated to expand their relationships with us over time.
With approximately 75% white space within our current customers, weWe have demonstrated an ability to grow revenue up to 5-6x with existing customers as they move toward our full suite of highly complementary services.
FromAmong our top 50 customers by revenue growth from 2015 to 2023, total revenue rose from an aggregate of approximately $23.1 million for the year ended December 31, 2015, to
approximately $164.6 million for the year ended December 31,
2021, our top 502023. Within each of those customers,
that experienced the largestrevenue growth
in revenue over the same period increased in revenueranged from
an aggregate of approximately $22.2$1.4 million to
approximately $135.4$16.7 million
(with increases at each customer ranging from $1.2 million to $7.1 million andacross all three primary service lines, with an average increase of
$2.3$2.8 million
and with consistent growth across our three primary service lines), primarily driven by our efforts to expand our share of wallet within our existing customer base.per customer.
Further, the infrastructure and capabilities required to provide connected, responsive equipment lifecycle management is typically cost-prohibitive, even for large IDNs. Our nationwide network of clinical engineers, storage and repair facilities, vehicles, and analytics tools gives us scale to provide cost-effective services for individual facilities, systems, regional IDNs, governments, and device manufacturers.
We believe our business model presents an attractive value proposition to our customers and that our comprehensive medical device management solutions and ability to work in partnership with and across Original Equipment Manufacturers (“OEMs”) as a device-agnostic service provider have contributed to our growth in recent years. Our unique framework for end-to-end medical equipment management, delivered through our nationwide service and logistics infrastructure, differentiates us in the marketplace and is without comparable peers. We believe our more than
8085 years of experience, extensive employee base of trained technicians, and our reputation for service excellence has earned us a leading position in our industry. We attribute our historical success to our:
Strong value proposition. With our focus and expertise in connected, end-to-end medical equipment management and service solutions, we offer a compelling customer value proposition. We believe that many of our customers have come to rely on our ability to respond quickly to their needs with reliable, high quality products and service expertise. We believe our ability to provide this level of service distinguishes us from our competitors. It also requires us to maintain inventories and infrastructure that we do not believe our competitors currently maintain. Our comprehensive solutions focus on helping customers: | ● | lower total cost of device ownership by reducing capital and operating costs related to owning and managing medical equipment; |
| ● | enhance operational productivity and staff satisfaction by ensuring equipment is available when and where needed; and |
| ● | maintain high standards of quality and regulatory compliance related to medical equipment use, maintenance and end-of-life disposal. |
•lower total cost of device ownership by reducing capital and operating costs related to owning and managing medical equipment;
•enhance operational productivity and staff satisfaction by ensuring equipment is available when and where needed; and
•maintain high standards of quality and regulatory compliance related to medical equipment use, maintenance and end-of-life disposal.
Large, nationwide infrastructure. We have a broad and specialized nationwide staff, facility, and vehicle service network coupled with focused and customized operations at the local level. Our extensive network of service centers and Centers of Excellence and our 24-hours-a-day, 365 days-a-year service capabilities enable us to compete effectively for large, national contracts as well as drive growth regionally and locally. We employ a number of technical, clinical, and surgical specialists that engage directly with our customers to drive improved cost, efficiency, and clinical outcomes. These include over
700800 biomedical repair technicians, more than 4,000 field-based service operators, and over 200 field sales and account managers. Our specialized teams, large equipment fleet, and quality assurance programs have been built over
8085 years serving provider customers and represent a significant investment in infrastructure over time. This places us in a unique and hard-to-replicate position with the scale to serve the most complex acute care hospitals, such as teaching, research or specialty institutions, that demand access to current and preferred technologies to meet the complex needs of their patients.
Proprietary software and asset management tools. We have used our more than 8085 years of experience and our extensive database of equipment management information to develop sophisticated software technology and management tools. These tools enable us to meet unique customer demands by supporting sophisticated onsite managed services that help drive cost efficiencies and equipment productivity for caregivers. We believe that our ongoing investment in new tools and technology will help continue to distinguish our offerings to the healthcare industry. Commitment to quality. Class I and II medical devices are designed, manufactured, and distributed from our Sizewise manufacturing facilities. Each of the United States-based facilities that produce finished goods is registered with the FDAUnited States Food and Drug Administration ("FDA") and follows strict quality guidelines in accordance with 21 CFR 820. The Hays, KS, Ellis, KS,820 and Corona, CA Sizewise manufacturing facilities are ISO 1385:2016 compliant, and the two Kansas facilities are certified by Intertek; the California facility is pending certification. A dedicated quality team oversees the Quality Management System (QMS) at these locations.13485:2016.
Agiliti also services and repairs medical devices manufactured by other OEMs. Third-party service providers like Agiliti are not required to register their sites with the FDA; therefore, there are no regulations that specifically apply to our maintenance of medical devices. We’ve made a commitment, however, to do the right thing for our customers and their patients by staffing a dedicated Quality team and implementing a QMS based on the quality standards recognized
worldwide for medical devices: 21 CFR 820 and ISO 13485:2016. This commitment to quality ensures that patient safety and risk management are at the center of every product decision, and that our equipment is serviced to the highest standards in the industry. Over 90We have elected to have independent accredited registrars certify our QMS at over 110 of our local market service centers, eight government service centers, and seven Centers of Excellence follow anto ISO 13485:2016 ccertified QMS, and we have elected to hire outside independent accredited registrars to audit our quality system.2015. British Standards Institute (“BSI”) has certified over 90 of our local market service centers, eight government service centers, manufacturing sites, and five of our Centers of Excellence to ISO 13485:2016, the remaining two2016. The Surgical Equipment Repair and Imaging Centers of Excellence are certified by Deutscher Kraftfahrzeug-Überwachungs-Verein e.V. (“Dekra”) and National Quality Assurance (“NQA”). Our manufacturing facilities are certified by Intertek. We believe that ISO 13485:2016 provides the stringent guidelines specific to medical devices to ensure that our fleet of equipment, as well as the equipment we service, is maintained to the highest quality standards. Our commitment to quality extends to our exclusive use of OEM parts to repair FDA 510(k) registered medical devices that we own, whenever available. Implementing optimal maintenance intervals and parts replacement extends equipment use life, thereby reducing waste and lowering risk of obsolescence. We believe that our robust QMS policies set us apart in our industry from those who may use less stringent quality practices on the equipment they own or maintain.
Superior customer service. We believe we have a long-standing reputation among our customers for outstanding service and quality. This reputation is largely attributable to our strong customer service culture, which is continuously reinforced by management’s commitment to, and significant investment in, hiring and training resources. We strive to seamlessly integrate our employees and solutions into the operations of our customers. We believe that our aggressive focus on the overall customer experience has helped us achieve high customer satisfaction ratings, as evidenced by ourratings. Our customer satisfaction survey returned an NPS of 5540 for the year ended December 31, 2021.2023.
Low direct third-party payor reimbursement risk. Many healthcare providers rely on direct payment from patients or reimbursement from third-party payors. Our fees are primarily paid directly by our customers, rather than by third-party payors, such as Medicare, Medicaid, managed care organizations, or indemnity insurers. Accordingly, our exposure to
uncollectible patient or reimbursement receivables or Medicare or Medicaid reimbursement changes is reduced, as evidenced by our bad debt expense of approximately 0.2%, 0.3%, and 0.2% of total revenue for the years ended December 31,
2023, 2022, and 2021,
2020, and 2019, respectively.
Values driven culture centered on doing the right thing for our many stakeholders. Our team operates on a set of shared aspirations that reflect the manner in which we approach our work and serve the needs of our customers, team members, shareholders, and local communities. We believe these aspirations that underpin our culture, strategy, and service model help contribute to a safer and more sustainable healthcare system and frame the cornerstone of our success:
WE ARE BUILDING THE PREMIER CLINICAL EQUIPMENT SERVICES COMPANY. We ensure clinicians have the equipment they need, when they need it, with the confidence it is maintained to the highest industry standards. We never waver from doing what is right for our customers, our team members, and our shareholders.
WE ARE ESSENTIAL TO CUSTOMERS. We are dependable, trusted advisors—steadfast in our commitments and ready to serve. We deliver a unique and valuable offering that helps customers improve their business and prioritize patient care.
WE ARE EMPOWERED AND ENGAGED. We lead by example, inspiring one another to be at our best, to be accountable, and to develop with purpose. We value our diversity, knowing different perspectives lead to better outcomes. We share a common drive to make a difference and take pride in being part of something bigger than ourselves.
WE ARE OPERATIONALLY EXCELLENT. We demonstrate a tireless commitment to quality, reliability, and continuous improvement. We demand of ourselves the highest degree of accuracy, efficiency, and integrity in order to deliver exceptional service to our customers and their patients.
WE ARE CREATING A CATEGORY OF ONE. Together, we are building a highly differentiated service company that is the vendor of choice for customers and an employer of choice nationwide.
Highly engaged team. We believe a strong and sustainable company begins with an engaged and empowered team. We are committed to investing in our team’s development and to fostering a culture of diversity, inclusion, trust, and transparency. Approximately 41%43% of our total work force is comprised of minorities and approximately 29% of our team members are female. Since 2018, we have consistently had an annual internal promotion rate of approximately 29%, compared to the national average of 8.9%, as reported by ADP Research Institute. We offer competitive compensation and benefits programs, and we ensure our team members share in the success of our business with a companywidecompany wide annual bonus program and an Employee Stock Purchase Plan. We strive to ensure Agiliti is a place where our people are proud to work, and we achieve that by listening to feedback and taking active steps to improve. In 2021,2023, we achieved a 7760 employee engagement score rating, which places us nearing the extraordinary company benchmark according to third-party engagement indices.
rating.
Proven management team. Our diverse and industry leading management team brings decades of executive-level healthcare expertise from across the sector and has successfully supervised the development of our competitive strategy, continually enhanced and expanded our service and product offerings, reinforced our nationwide operating footprint, and furthered our reputation as an industry leader in our category. Key Elements of our Growth Strategy
Retain and expand existing customer relationships. While our overall market opportunity is large, there is also significant expansion opportunity within our existing customers. We currently have 25% wallet share within our existing contracted customers and have demonstrated the ability to grow our wallet share among existing customers by expanding the services we provide to them over time. FromLooking at our top 50 customers by revenue growth between 2015 and 2023, total revenue rose from an aggregate of approximately $23.1 million for the year ended December 31, 2015, to approximately $164.6 million for the year ended December 31, 2021, our top 502023. Within each of those customers, that experienced the largestrevenue growth in revenue over the same period increased in revenueranged from an aggregate of approximately $22.2$1.4 million to approximately $135.4$16.7 million (with increases at each customer ranging from $1.2 million to $7.1 million andacross all three primary service lines, with an average increase of $2.3$2.8 million and with consistent growth across our three primary service lines), primarily driven by our efforts to expand our share of wallet within our existing customer base.per customer.
Grow our customer base among customerscustomers that outsource. We believe there is a significant opportunity to further grow our business by winning new customer contracts within the $5.85 billion that is contracted annually for medical equipment management services in the U.S. This is less than half of the total addressable market and, dueDue to increasing pressures that providers are facing, we expect outsourcing to significantlysignificantly accelerate. As a leader in our industry, we believe we are poised to take advantage of this continued shift.
Grow our serviceable market by contracting with those that insource today. Currently, we estimate that $14 billion is spent annually in the U.S. for medical equipment services and functionality, but less than half of the total market is currently being outsourced to an equipment management service, while the rest is done in-house in facilities. We believebelieve that as we reach additional potential customers with demonstrated value both in improved patient care and reduced costs, we can grow our total addressable market by contracting with new clients that were not previously outsourcing device management services. Further, this market is also experiencing tailwinds that make the total addressable market, the total contracted market, and our own contracts with ongoing customers poised to continue to expand. TheseExamples of these tailwinds include increasing overall provider volumes, increasing use and complexity of medical devices increasingand increased outsourcing by hospitals, and additional factors that we believe will continue to drive growth.hospitals.
Invest in complementary offerings that enhance customer relationships. As the medical device field becomes increasingly complex and the number of devices used per patient on average increases over time, we are constantly evaluatingroutinely evaluate additional services and methods of approaching service delivery that increase value for our clients. As an example, this has recently taken the form of expanding our work with federal, state, and local governments to help them maintain and mobilize strategic stockpiles of ventilators and other critical medical equipment. Opportunistically pursue accretive M&A. Due to our high and sustained value creation for customers and significant white space withwithin existing customer relationships, we believe that pursuing opportunistic M&A will drive increasing returns through embedded customer relationships. From 2015-2021,2016-2023, we have successfully integrated nine11 acquisitions and will continue to opportunistically pursue additional inorganic growth.
Recent Acquisitions
Northfield Acquisition
On October 28, 2020, we entered into a stock purchase agreement to acquire 100% of the issued and outstanding capital stock of Northfield Medical (“Northfield Medical”) a nationwide provider of surgical equipment repair services for $475.0 million, subject to adjustments (the “Northfield Acquisition”). Northfield Medical provides service and repair of medical devices, specializing in the repair of endoscopes, surgical instruments and other operating room equipment. The acquisition closed on March 19, 2021.
Sizewise Acquisition
On September 14, 2021, we entered into a definitive agreement to acquire Sizewise Rentals, LLC (“Sizewise”), a privately held manufacturer and distributor of specialty patient handling equipment, in a stock purchase transaction valued at $230 million. (the “Sizewise Acquisition”). Sizewise is a leading manufacturer and provider of specialized bed frames, therapeutic surfaces and mobility equipment serving customers in the acute and post-acute care markets with products that address the needs of bariatric, geriatric, pediatric and standard patient populations. The Company completed the acquisition on October 1, 2021.
COVID-19 Update
COVID-19 has placed our customers, business, teams and communities in uncharted waters. We consider the impact of the pandemic on our business by evaluating the healthopportunistic M&A as part of our operations, changes to our revenue outlook, and the degree to which perceptions of and need for Agiliti solutions have evolved during this unprecedented time. As demand for emergent acute care increases around the country and as the global pandemic highlights the importance of resilient supply chains and service networks, the importance of our services has been magnified. We are proud to have rapidly developed and deployed a response plan to ensure the safety of our team, while continuing to meet our customers’ evolving needs for patient-ready medical equipment when and where it was needed; notably, doing so without service interruptions.
We believe our value proposition now resonates with an even broader audience of customers as providers, IDNs and governments prepare for potential future surges in demand for acute care and the required equipment necessary to care for patients.
Specifically, during the COVID-19 pandemic, we have:
| ● | fully and rapidly deployed our fleet of medical devices and accessories across the U.S. to ensure they are reaching the maximum number of patients;long-term growth strategy. |
| ● | leveraged our logistics, inventory management, and maintenance/repair infrastructure to work with medical device brokers and manufacturers to make thousands of additional critical medical devices available to healthcare facilities; |
| ● | deployed our local biomedical repair teams to augment teams at hospitals around the country to ensure their owned medical equipment remains fully operational and available for patient needs; |
| ● | redeployed teams from our over 150 local service centers to support surge medical capacity in parks, gymnasiums, and hotel rooms across the country; |
| ● | been awarded a new contract to leverage our unique scale and capabilities to manage the maintenance and field repair of the national strategic ventilator stockpile; we are likewise working with various state and municipal governments to manage and mobilize their centralized and local medical device stockpiles; and |
| ● | prioritized the care and safety of our employees who are essential to helping our customers meet patient care needs. We committed to avoid COVID-19 related layoffs or furloughs and bridge the income of our team members with variable net pay for the duration of the pandemic. As many of our team members entered high-exposure environments each day, we ensured all had the necessary PPE, guidelines, training and support from the highest levels of the company. We provided 100% coverage for COVID-19 testing and telemedicine, extended short-term medical leave and disability coverage related to COVID-19, and |
| | granted additional time-off benefits for COVID-19 related needs, so that our teams were able to safely focus on our customers and their patients as we served alongside them in front-line response efforts. |
Business Operations
As of December 31,
2021,2023, we operated more than 150 local market service centers which allow us to provide our end-to-end healthcare technology management and service solutions to customers in virtually all markets throughout the United States. Each service center is responsible for supporting the equipment management needs of its local healthcare market across all sites of care. Each service center maintains an inventory of locally demanded equipment, parts, supplies, and other items tailored to accommodate the needs of individual customers within its geographical area. Should additional or unusual equipment be required by one of our customers, a local service center can draw upon the resources of our other service centers. With access to more than
aone million owned or managed units of medical equipment (over 300,000 owned) available for customer use as of December 31,
2021,2023, we believe we can most often obtain the necessary equipment within 24 hours.
Depending on market size and demands, our service centers are staffed by multi-disciplined teams of sales professionals, service representatives, customer service technicians, clinical engineering (biomedical) equipment technicians, and surgical services technologists trained to deliver on our complete portfolio of customer solutions. Employees providing resident-based services through our on-site managed programs are supported by local site managers and/or the service centers in the markets where those customers are located.
Our local market service center network is supported by
seven strategically located Centers of Excellence. These centers focus on providing highly specialized clinical engineering service and support. The Centers of Excellence also provide overflow support, technical expertise, training programs, and specialized service functions for our local service centers. All specialized depot work required by our manufacturer customers resides within these Centers of Excellence.
Five of ourOur Centers of Excellence are certified to ISO 13485:2016 by BSI,
DEKRA, NQA, and Intertek as a quality commitment to our
customers, while the remaining two are certified by Dekra and NQA.customers.
Our corporate office is located in
Minneapolis,Eden Prairie, Minnesota. We have centralized many of the key elements of our equipment and service offerings in order to create standardization and to maximize our operating efficiencies and uniformity of service. Some of the critical aspects of our business centralized within our corporate office include contract administration, marketing, purchasing, pricing, logistics, accounting,
quality, and information technology.
We acquire, manufacture, or manage medical equipment to meet our customers’ needs in some of the following product areas: respiratory therapy, infusion therapy, newborn care, critical care, patient monitors, specialty beds and therapy
surfaces (which includes fall management equipment, bariatrics equipment, pressure area management and wound therapy equipment, stretchers, and wheelchairs), and surgical equipment. We believe we maintain one of the most technologically advanced and comprehensive equipment fleets in the industry and routinely acquiringacquire new and certified pre-owned equipment to enhance our fleet. Our specialized equipment portfolio managers evaluate new products each year to keep abreast of current market technology and to determine whether to add new products to our equipment fleet. In making equipment purchases, we consider a variety of factors, including manufacturer credibility, repair and maintenance costs, anticipated user demand, equipment mobility, and anticipated obsolescence. We generally do not enter into long-term fixed price contracts with suppliers of our equipment. As of December 31, 2021,2023, we owned or managed more than aone million units of medical equipment available for use by our customers of which overmore than 300,000 were owned.owned by Agiliti.
In 2021,2023, our ten largest manufacturers of medical equipment supplied approximately 72%65% (measured in dollars spent) of our direct medical equipment purchases. In 2021,2023, three of our largest medical equipment suppliers accounted for approximately 35%41% of our medical equipment purchases (measured in dollars spent).
Environmental, Social
Corporate Citizenship Matters
Our approach to corporate citizenship is guided by a detailed understanding of those matters most material to Agiliti, its customers, team members, shareholders and
Governance (ESG) MattersMotivatedother stakeholders across the communities we serve. Our differentiated product and service offerings provide powerful benefits to the nation’s healthcare industry and align with several United Nations Sustainable Development Goals (“UN SDGs”), including Optimizing Clinical Outcomes (UN SDG 3), Improving Economic Outcomes (UN SDG 8), and Reducing Waste (UN SDG 12). We intend to partner with our customers, suppliers, and other stakeholders to maximize those benefits as we continue to evolve our business offerings. In that spirit, we seek to demonstrate our commitments to corporate citizenship through purposeful actions and meaningful results and by our belief that every interaction hasthoughtfully managing the power to change a life, we are committed to making an impact through our work, managing ESG risks and opportunities and shapingthat shape the long-term sustainability of our business. Our Nominating and Governance Committee has formal oversight of ESG related matters, and our executive team has responsibility for driving ESG strategy and reporting.
In
2021,2023, we continued to
enhance our ESG strategy by undertaking our first materiality assessment to identify the ESG topics most important to our business and to our stakeholders. Guided by these insights, we will continue to develop strategies to manage our most important ESG metrics and reportmake progress on our
progress over time.priority focus areas, which are detailed in our corporate citizenship reporting, and include our commitments to product quality standards; investments in our teams to prioritize safety and engagement; and, monitoring the energy and emissions intensity of our operations. Our strategic focus in 2023 also included careful tracking of emerging sustainability regulations and preparation for future reporting requirements.
We maintain a formal governance structure to oversee our corporate citizenship efforts, including oversight from the Nominating and Corporate Governance Committee of the Board of Directors and a cross-functional steering committee comprised of senior leaders that supports the execution of strategy and reporting. These groups meet regularly to assess performance, guide strategy, and review disclosures for quality and accuracy. For more information
about our corporate citizenship efforts please
visit the ESG section ofsee our
Investor Relations site: https://investors.agilitihealth.com/esg/corporate-citizenship/default.aspx.investor relations website.
We believe a strong and sustainable company begins with an engaged and empowered team. We are committed to investing in our team’s training and development, and to open, two-way communication. Our culture is underpinned by our core belief, our Code of Conduct and our strong commitment to diversity, equity, and inclusion.
As of December 31,
2021,2023, we employed more than
5,0005,800 employees throughout the United
States including one location that is represented by a union.States. We believe we generally have good relations with our employees.
Diversity and Inclusion: We foster a diverse company culture where all backgrounds and perspectives are welcomed, valued, and respected equally. As of
2021,2023, ethnically diverse talent represents more than
40%43% of our workforce.
Read more in ourWe have adopted an Equal Employment Opportunity & Affirmative Action
policy.policy to further our commitment to providing equal employment opportunities to all Agiliti employees and applicants for employment.
Talent Development: We offer to our team members role-based and career development training covering a broad curriculum each year—from leadership development courses, to role-based skills development and high-touch onboarding experiences, we strive to offer the tools and resources our team members need to perform at their best and grow their careers. Roughly 30%More than 22% of our positions are filled internally year over yearyear-over-year, and more than 60%roughly 57% of our leadership roles were filled internally in 2021.2023. We enjoyed a 71%77% employee retention rate in 2021.2023. In addition, we offer dynamic online training
through our Quality Management System covering all dimensions of operations, safety, quality, and compliance across the company.
Engagement: We believe a strong and sustainable company begins with an engaged and empowered team. We are committed to investing in our team’s training and development and to fostering a culture of trust and transparency. We constantly strive to make Agiliti a place where people are proud to work, and we achieve that by listening to feedback and taking active steps to improve. In our most recent survey
(2020)(2023), we achieved a
7760 employee engagement score
rating, which places us nearing the extraordinary company benchmark according to third party engagement indices.rating.
Health & SafetySafety:Compensation & Benefits: We ensure Agiliti is a safe place to work where team members feel supported and protected. We offer comprehensive health and wellness benefits and our team members are trained annually on safe work practices and procedures. Find more information in our policypolicies on PTO during workplace infectious disease outbreaks and our COVID Flex Holiday policy.
PTO for illness. We have registrations with the United States Patent and Trademark Office (“PTO”) for the following marks: Asset360"Asset360®" and BioMed360"BioMed360®"; “Universal Hospital Services, Inc.,” ‘‘UHS®’’ and the UHS logo; “OnCare,” “Harmony,” “Quartet,” “Agiliti” and the Agiliti logo. Sizewise has registrations with the United States Patent and Trademark Office for the following marks: Carewise, Comfort Turn, Designed to Heal, Envy, Mighty Rest, Sapphire Series, Sizewise, and SW Low Boy. We have applications pending with the United States Patent and Trademark Office for the following marks: “Vityl.” United States service mark registrations are generally for a term of 10 years, renewable every 10 years if the mark is used in the regular course of business. business. Sizewise maintains 45 issued patents in the United States and other countries, is prosecuting ten pending patent applications in the United States and other countries. No decisions have been made regarding foreign patent protection, but new foreign patent applications are likely. Sizewise maintains 46 registered trademarks in the United States and in other countries. Sizewise maintains five applications for registration of trademarks in the United States and one in Canada. Sizewise also has many common law trademarks. Sizewise owns twelve issued patentscopyrights on original works of authorship and has two published patent applicationsprovides appropriate notice of copyright on its original works of authorship. There is currently no pending with the PTOlitigation pertaining to seven Sizewise’s intellectual property.
We.We have a domain name registration for agilitihealth.com, which serves as our main website. In 2011, we registered the domain name OnCareMedical.com featuring our OnCare™ sub-brand for patient handling products. In 2012, we registered UHSSurgicalServices.com. In 2016, we acquired resxray.com. In 2021, we acquired Sizewise.com. In 2023, we acquired dabir-surfaces.com.
We have developed a number of proprietary software programs to directly service or support our customers including “inCare™” which is a medical equipment inventory management system that allows us to track the location and usage of equipment we are managing at a customer’s location in our 360 Solutions. “MyAgiliti™” is our online ordering and reporting site which accesses our proprietary programs specifically designed to help customers meet medical equipment documentation and reporting needs under applicable regulations and standards, such as those promulgated by the FDA and The Joint Commission. Additionally, this tool provides detailed reporting on utilization, compliance, and analytics for management. ““VitylVityl™” is our equipment maintenance and planning system which houses our work order system and assists in our customers regulatory compliance recordkeeping. ““SchedulerScheduler™” is our web-based scheduling, tracking, reporting and physician preference system for Agiliti Surgical solutions. ““inCommandinCommand™™” encompasses the proprietary software tools that allow our employees to manage and maintain our extensive equipment fleet and serve our customers more effectively and efficiently. We primarily rely on trade secret, copyright and other similar laws for the protection of our proprietary software. Our employees who access such proprietary software sign confidentiality agreements and receive training on protecting the security of our data systems, and any independent contractors who assist with development of our proprietary software are required to sign non-disclosure and work product assignment agreementsagreements.. We market our programs primarily through our direct sales force, which consisted of
overmore than 200 sales representatives as of December 31,
2021.2023. We support our direct sales force with technical, clinical, surgical, and financial specialists, who lead new business selling efforts to deliver comprehensive solutions for our customers. Our national accounts team also supports our direct sales force through its focus on securing national and regional contracts.
Our sales force uses a structured and consistent process to target customers where we can deliver significant financial and operational value over time. Each sales team member is responsible for identifying and prioritizing customer opportunities in their territory through the use of segmentation tools and market intelligence, leading to short- and long-term sales pipelines balanced across our comprehensive solutions. The sales force then engages customers directly with insights and tailored solutions that address specific customer challenges while using tools to demonstrate financial and operational
savings. Our goal with this approach is to help customers with their most pressing challenges first and measure their return on value for each solution. We then work to connect additional solutions that add incremental and synergistic value for our customers, leading to an end-to-end approach to medical equipment management. Each activity our sales force initiates is aligned to our customer’s buying process and is designed to move the opportunity quickly through the sales process. Every step in the process is documented in a customer relationship management
CRM("CRM") system, where we continually monitor and manage sales pipelines,
balanced opportunity mix, and sales forecasts.
The members of the sales force are compensated with a combination of base pay and variable incentive pay. The percentage of each individual’s overall compensation that is comprised of base pay versus variable incentive pay is dependent on the individual’s position. Sales force members whose primary responsibility is account management receive a higher percentage of base pay, while sales force members whose primary responsibility is the generation of new business
receive a higher percentage of variable incentive pay. The actual variable incentive pay received by an individual is based on his or her achievement of certain performance metrics, including revenue, earnings, and/or new business milestones.
We also market our end-to-end solutions through our website at www.agilitihealth.com and various social media and digital marketing channels, including a variety of trade publications and organizations with subscribers and members who are key decision makers for our solutions. In addition, we participate in numerous national and regional conventions where we interact with industry groups and opinion leaders. Information presented on our website is not incorporated by reference and should not be considered a part of this Reporting Statement.
In our marketing efforts, we primarily target key decision makers such as administrators, chief executive officers, chief financial officers, chief technology officers, chief medical officers and chief nursing officers, as well as physicians, directors and managers of functional departments, such as supply chain, materials management, surgery, purchasing, pharmacy, biomedical services, and clinical engineering. We also promote comprehensive solutions to IDNs, hospitals, surgery centers, manufacturers,
and alternate site provider groups, and associations.
Seasonality and Business Interruption
Quarterly operating results are typically affected by seasonal factors. Historically, our first and fourth quarters are the strongest, reflecting increased hospital census and patient acuity during the fall and winter months. However,
the COVID-19
haspandemic impacted the seasonality of our
business.business and we would expect any future pandemics to have a similar effect on seasonality. Our business can also be impacted by natural disasters, such as hurricanes and earthquakes, which
may affect our ability to transfer equipment to and from our customers, and
by equipment recalls, which can cause equipment to be removed from market use. We
may also see
declinesvariability in our business
induring down economic cycles with high levels of
unemployment. Ourunemployment at which times our customers typically
seeexperience weaker census and higher levels of indigent
patients during these times, causing them to use fewer of our solutions.patients.
Regulation of Medical Equipment
Our customers are subject to documentation and safety reporting regulations and standards with respect to the medical equipment they use, including those established by the FDA, CMS and the National Fire Protection Association (“NFPA”). Various states and municipalities may also have similar regulations.
We monitor changes in regulations and standards to accommodate the needs of customers by providing specific product and manufacturer information upon request. Manufacturers of medical equipment are subject to regulation by agencies and organizations such as the FDA, Underwriters Laboratories, and the NFPA. We believe that all medical equipment we outsource conforms to these regulations.
The Safe Medical Devices Act of 1990 (“SMDA”), which amended the Food, Drug and Cosmetic Act (“FDCA”), requires manufacturers, user facilities, and importers of medical devices to report whenever they believe there is a probability that a medical device has caused or contributed to a death, illness, or injury. In addition, the SMDA requires the establishment and maintenance of adverse safety and effectiveness data and various other FDA reports. Manufacturers and importers are also required to report certain device malfunctions. We
also work with our customersdiligently evaluate all complaints for devices we manufacture and report to
assist them in meeting their reporting obligations under the
FDCA, including those requirements added by the SMDA.FDA as required.
Besides the FDA, a number of states regulate medical device distributors and wholesalers either through pharmacy or device distributor licensure. Currently, we hold such licenses in
2326 states. Some licensure regulations and statutes in additional states may apply to our activities. Although our failure to possess such licenses in these states for our existing operations may subject us to certain monetary fines, we do not believe the extent of such fines, in the aggregate, would be material to our liquidity, financial condition, or results of operations.
In addition, we are required to provide information to manufacturers regarding the permanent disposal or any change in ownership of certain categories of medical outsourcing equipment. While we believe our medical equipment tracking
systems are in compliance with these regulations, these regulations are subject to change and such changes could have an impact on how we conduct our business.
The Health Insurance Portability and Accountability Act of 1996 (“HIPAA”) applies to certain covered entities, including health plans, healthcare clearinghouses and healthcare providers, as well as to business associates such as us. HIPAA regulations protect individually identifiable health information, including information in an electronic format, by, among other things, setting forth specific standards under which such information may be used and disclosed, providing patients’ rights to obtain and amend their health information, requiring notification to individuals, federal and state agencies, and media outlets in the event of a breach of health information and establishing certain administrative requirements for covered entities. The
HITECHHealth Information Technology for Economic and Clinical Health ("HITECH") Act created legal obligations for business associates and extended criminal and civil sanctions to business associates for violations of HIPAA requirements.
Because of our self-insured health plans, we are also a covered entity under the HIPAA regulations. Also, we may be obligated to comply with certain HIPAA requirements as a business associate of various healthcare providers. In addition, various state legislatures have enacted and may continue to enact additional privacy legislation that is not preempted by the federal law, which may impose additional burdens on us. Moreover, other federal privacy legislation may be enacted. Accordingly, we have made and, as new standards go into effect, we expect to continue to make, administrative, operational, and information infrastructure changes in order to comply with these requirements.
The Patient Protection and Affordable Care Act (the “Affordable Care Act”)
(have and will resulthas resulted in significant reforms to the U.S. healthcare system and the structure of the healthcare provider delivery system. The Affordable Care Act calls for additional transparency around payments made by the pharmaceutical and medical device industries to doctors and teaching hospitals, which may include gifts, food, travel, and speaking or consultancy fees. All U.S. manufacturers of drugs, devices, biologics or medical supplies, including distributors who hold title to such drugs, devices, biologics, or medical supplies, for which payment is available under government-funded health insurance programs (i.e., Medicare, Medicaid and the State Children’s Health Insurance Program) must report annually to the U.S. Department of Health and Human Services any payment or gift, which represents a “transfer of value,” to a physician,
physician assistant, nurse practitioner, clinical nurse specialist, certified registered nurse anesthetist, certified nurse-midwife, or teaching hospital, including detailed information about the nature and value of remuneration provided, and the identity of the receiving
physicianindividual or
teaching hospital.entity. Additionally, states may require manufacturers to report information that is not required or is exempted under the federal reporting requirements. For example, a state may require manufacturers to report advertising expenditures, loans of medical devices, in-kind gifts to charities, and payments to other recipients, group purchasing organizations ("GPOs")
, and retailers. We identify applicable state reporting requirements as they become effective.
We are subject to the federal Anti-Kickback Statute, which prohibits the knowing and willful offer, payment, solicitation or receipt of any form of “remuneration” in return for, or to induce, the referral of business or ordering of services paid for by Medicare or other federal programs. “Remuneration” has been broadly defined to include anything of value, including gifts, discounts, credit arrangements, and in-kind goods or services. The Anti-Kickback Statute is broad and prohibits many arrangements and practices that are lawful in businesses outside the healthcare industry. Violations can result in imprisonment, civil or criminal fines, or exclusion from Medicare, Medicaid, and other governmental programs. Contracts with healthcare facilities and other marketing practices or transactions may implicate the Anti-Kickback Statute. We have attempted to structure our contracts and marketing practices to comply with the Anti-Kickback Statute along with providing training to our employees. However, we cannot ensure that we will not have to defend against alleged violations from private entities or that
OIGthe Office of Inspector General ("OIG") or other authorities will not find that our practices violate the Anti-Kickback Statute.
Although our business is not currently extensively regulated under healthcare laws, we are subject to certain regulatory requirements as discussed above and our customers are subject to direct regulation under the Federal False Claims Act, the Stark Law, the Anti-Kickback Law, rules and regulations of the CMS, and other federal and state healthcare laws and
regulations. Promulgation of new laws and regulations, or changes in or re-interpretations of existing laws and regulations, could affect our business, operating results or financial condition. Our operations may be negatively impacted if we have to comply with additional complex government regulations.
Third-Party Reimbursement
Our fees are primarily paid directly by our customers rather than through direct reimbursement from third-party payors, such as Medicare or Medicaid. We do not typically bill the patient, the insurer, or other third-party payors directly for services provided for hospital or alternate site provider inpatients or outpatients. Sometimes our customers are eligible to receive third-party reimbursement for our services. Consequently, the reimbursement policies of such third-party payors have a direct effect on the ability of healthcare providers to pay for our services and an indirect effect on our level of charges. Also, in certain circumstances, third-party payors may take regulatory or other action against service providers even though the service provider does not receive direct reimbursement from third-party payors. Hospitals and alternate site providers face cost containment pressures from public and private insurers and other managed care providers, such as health maintenance organizations, preferred provider organizations, and managed fee-for-service plans, as these organizations continue to place controls on the reimbursement and utilization of healthcare services. We believe that these payors have followed or will follow the government in limiting the services that are reimbursed and in exerting downward pressure on prices. In addition to promoting managed care plans, employers are increasingly self-funding their benefit programs and shifting costs to employees through increased deductibles, co-payments, and employee contributions. Hospitals and healthcare facilities are also experiencing an increase in uncompensated care or “charity care,” which causes increased economic pressures on these organizations. We believe that these cost reduction efforts will place additional pressures on healthcare providers’ operating margins and will encourage efficient equipment management practices such as the use of our outsourcing and
360 on-siteonsite managed solutions.
Our business entails the risk of claims related to the manufacturing, outsourcing, sale, and service of medical equipment. In addition, our instruction of hospital and alternate site provider employees with respect to the use of equipment and our professional consulting services are sources of potential claims. We have not suffered a material loss due to a claim. However, any such claim, if made, could have a material adverse effect on our business. While we do not currently provide any services that require us to work directly with patients, expansion of services in the future could involve such activities and subject us to claims from patients.
We maintain a number of insurance policies, including commercial general liability coverage (product and premises liability insurance), automobile liability insurance, worker’s compensation insurance, and professional liability insurance. We also maintain excess liability coverage. Our policies are subject to annual renewal. We believe that our current insurance coverage is adequate. Claims exceeding such coverage may be made and we may not be able to continue to obtain liability insurance at acceptable levels of cost and coverage.
Our corporate headquarters are in
Minneapolis,Eden Prairie, Minnesota, where we lease
55,19775,978 square feet of office space as of December 31,
2021.2023. We also have domestic offices in Alabama,
Alaska, Arkansas, Arizona, California, Colorado, Connecticut, Florida, Georgia, Idaho, Illinois, Indiana, Iowa, Kansas, Kentucky, Louisiana, Maine, Maryland, Massachusetts, Michigan,
Minnesota, Mississippi, Missouri, Nebraska, New Jersey, New Mexico, Nevada, New York, North Carolina, North Dakota, Ohio, Oklahoma, Oregon, Pennsylvania,
RoadRhode Island, South Carolina, South Dakota, Tennessee, Texas, Utah, Virginia, Washington, West Virginia and Wisconsin.
We lease all of our facilities. We believe that our facilities are adequate for our current needs and anticipate that suitable additional space will be readily available to accommodate any foreseeable expansion of our operations.
Our Principal Stockholder
Thomas H. Lee Partners, L.P., our principal stockholder, is an affiliate of
Thomas H. Lee Partners, L.P. (“THL”("THL"). is our principal stockholder. THL is a premier private equity firm that invests in middle market growth companies, headquartered primarily in North America, exclusively in three sectors: Financial Services, Healthcare, and Technology & Business Solutions. The firm couples its deep sector expertise with dedicated internal operating resources to transform and build great companies of
lasting value in partnership with company
management. Since 1974, THL has raised
more than $25$35 billion of equity capital, invested in
over 150more than 170 companies and completed more than
400600 add-on acquisitions
representingthat represent an aggregate enterprise value
at acquisition of over
$200$250 billion.
General Corporate Information
We commenced operations in 1939, originally incorporated in Minnesota in 1954 and reincorporated in Delaware in 2001.
In 2019, we completed a business combination transaction involving entities affiliated with THL, and entities affiliated with our former owners, by which THL became our principal shareholder (such transaction referred to herein as the "Business Combination"). Since the Business Combination,
(as defined below), we have been controlled by THL Agiliti LLC (“THL Stockholder”), an affiliate of THL. We completed our initial public offering (“IPO”) in April 2021.
Agiliti, Inc. was formed on August 1, 2018 in order to consummate a merger with Federal Street Acquisition Corp., a special purpose acquisition company affiliated with THL (“FSAC”) pursuant to the Amended and Restated Agreement and Plan of Merger, dated as of December 19, 2018 (the “A&R Merger Agreement”), by and among Agiliti, FSAC, Umpire SPAC Merger Sub, Inc., Umpire Cash Merger Sub, Inc., Agiliti Holdco, Inc. (“Agiliti Holdco”), solely in their capacities as Majority Stockholders, IPC/UHS, L.P. and IPC/UHS Co-Investment Partners, L.P., solely in its capacity as the Stockholders’ Representative (as defined in the A&R Merger Agreement), IPC/UHS and, solely for the purposes stated therein, Umpire Equity Merger Sub, Inc. Pursuant to the A&R Merger Agreement, (i) FSAC became a wholly owned subsidiary of Agiliti and the holders of Class A common stock, par value $0.0001 per share, of FSAC (the “FSAC Class A Common Stock”) received shares of common stock, par value $0.0001 per share, of Agiliti (our “common stock”); and (ii) Agiliti Holdco became a wholly owned subsidiary of FSAC and the equityholders of Agiliti Holdco received cash and/or shares of our common stock and/or fully-vested options to purchase shares of our common stock as merger consideration (the transactions contemplated by the A&R Merger Agreement are referred to herein as the “Business Combination”).
The Company’s Annual Reports on Form 10-K, Quarterly Reports on Form 10-Q, Current Reports on Form 8-K, and amendments to reports filed pursuant to Sections 13(a) and 15(d) of the Securities Exchange Act of 1934, as amended (the “Exchange Act”), are filed with the U.S. Securities and Exchange Commission (the “SEC”). Such reports and other information filed by the Company with the SEC are available free of charge at investors.agilitihealth.com/financials/
sec-filings/default.aspxsec-filings when such reports are available on the SEC’s website. The Company periodically provides other information for investors on its corporate website www.agilitihealth.com, and its investor relations website,
investors.agilitihealth.com/overview/default.aspx.investors.agilitihealth.com. This includes press releases and other information about financial performance, information on environmental, social and corporate governance and details related to the Company’s annual meeting of shareholders. The information contained on the websites referenced in this Form 10-K is not incorporated by reference into this filing. Further, the Company’s references to website URLs are intended to be inactive textual references only.
Certain factors may have a material adverse effect on our business, financial condition, and results of operations. You should carefully consider the following risks, together with all of the other information contained in this Annual Report on Form 10-K, including the sections titled “Note Regarding Forward-looking Statements” and “Management’s Discussion and Analysis of Financial Condition and Results of Operations” and our financial statements and the related notes included elsewhere in this Annual Report on Form 10-K. Any of the following risks could have an adverse effect on our business, financial condition, operating results, or prospects and could cause the trading price of our common stock to decline, which would cause you to lose all or part of your investment. Our business, financial condition, operating results, or prospects could also be harmed by risks and uncertainties not currently known to us or that we currently do not believe are material.
Some of the principal risks related to our business include the following:
| ● | Political and policy changes could materially limit our growth opportunities.• |
| ● | The COVID-19 pandemic could materially and adversely affect our business, operating results, financial condition and prospects including the potential inflationary impact and supply chain disruption. |
| ● | We may be unable to maintain existing contracts or contract terms or enter into new contracts with our customers. This risk is heightened as it relates to customers on whom we rely for a substantial portion of our revenue. |
| ● | A substantial portion of our revenues come from customers with which we do not have long-term commitments, and cancellations by or disputes with customers could decrease the amount of revenue we generate, thereby reducing our ability to operate and expand our business. |
| ● | If we fail to maintain our reputation, including by adequately protecting our intellectual property, our sales and operating results may decline. |
| ● | If our customers’ patient census or services decrease, the revenue generated by our business could decrease. |
| ● | Our competitors may engage in significant competitive practices, which could cause us to lose market share, reduce prices or increase expenditures. |
| ● | Consolidation in the healthcare industry may lead to a reduction in the prices we charge, thereby decreasing our revenue. |
| ● | We have substantial indebtedness which may require us to dedicate a substantial portion of our cash flow from operations to payments on our indebtedness, thereby reducing the availability of our cash flow to fund working capital, capital expenditures, research and development efforts and other general corporate purposes, and increase our vulnerability to general adverse economic, industry and competitive conditions. |
| ● | If we are unable to fund our significant cash needs, including capital expenditures, we may be unable to expand our business as planned or to service our debt. |
| ● | THL controls us, and its interests may conflict with yours or ours in the future. |
| ● | We may fail to realize all of the anticipated benefits of our recent acquisitions, or those benefits may take longer to realize than expected. We may also encounter significant difficulties in integrating the businesses of our recent acquisitions. |
Risks Related to Our Business and Industry
Political and policy changes could materially limit our growth opportunities.
•We may be unable to maintain existing contracts or contract terms or enter into new contracts with our customers. This risk is heightened as it relates to customers on whom we rely for a substantial portion of our revenue.
•A substantial portion of our revenues come from customers with which we do not have long-term commitments, and cancellations by or disputes with customers could decrease the amount of revenue we generate, thereby reducing our ability to operate and expand our business.
•If we fail to maintain our reputation, including by adequately protecting our intellectual property, our sales and operating results may decline.
•A global economic downturn could adversely affect our customers and suppliers or have new, additional adverse effects on them, which could have further adverse effects on our operating results and financial position.
•Future disease outbreak, including epidemics, pandemics or similar widespread public health emergencies could materially and adversely affect our business, operating results, financial condition and prospects.
•If our customers’ patient census or services decrease, the revenue generated by our business could decrease.
•Our competitors may engage in significant competitive practices, which could cause us to lose market share, reduce prices or increase expenditures.
•Consolidation in the healthcare industry may lead to a reduction in the prices we charge, thereby decreasing our revenue.
•We have substantial indebtedness which may require us to dedicate a substantial portion of our cash flow from operations to payments on our indebtedness, thereby reducing the availability of our cash flow to fund working
capital, capital expenditures, research and development efforts and other general corporate purposes, and increase our vulnerability to general adverse economic, industry and competitive conditions.
•If we are unable to fund our significant cash needs, including capital expenditures, we may be unable to expand our business as planned or to service our debt.
•THL controls us, and its interests may conflict with yours or ours in the future.
•We may fail to realize all of the anticipated benefits of our recent acquisitions, or those benefits may take longer to realize than expected. We may also encounter significant difficulties in integrating the businesses of our recent acquisitions.
Risks Related to Our Business and Industry
Political and policy changes could materially limit our growth opportunities.
Our business may be impacted by political and policy changes. Geopolitical issues, the availability and cost of credit and government stimulus programs in the United States and other countries have contributed to increased volatility and uncertain expectations for the global economy. Additionally, political changes in the United States and elsewhere in the world have created a level of uncertainty in the markets. If the markets experience any economic slowdown, recession or prolonged stagnation, there may be a profound impact on the financial condition of our suppliers and our customers, resulting in a negative impact on our business, financial condition and results of operations.
Healthcare costs have risen significantly over the past decade. There have been and continue to be proposals by legislators, regulators and third-party payors to keep these costs down. Certain proposals, if passed, would impose limitations on the prices the Company will be able to charge for the Company’s products, or the amounts of reimbursement available for its products from governmental agencies or third-party payers. These limitations could have a material adverse effect on our financial position and results of operations. Changes in the healthcare industry in the U.S. and elsewhere could adversely affect the demand for our products as well as the way in which we conduct business. The 2010 Affordable Care Act provides that most individuals must have health insurance, establishes new regulations on health plans, and creates insurance pooling mechanisms and other expanded public health care measures. The Company
anticipates that the healthcare reform legislation will further reduce Medicare spending on services provided by hospitals and other providers and further forms of sales or excise tax on the medical device sector. Various healthcare reform proposals have also emerged at the federal and state level. We cannot predict what healthcare initiatives, if any, will be implemented at the federal or state level, or the effect any future legislation or regulation will have on the Company. However, an expansion in government’s role in the U.S. healthcare industry may lower reimbursements for the Company’s products, reduce medical procedure volumes and may thereby materially adversely affect the Company’s business, financial condition and results of operations.
The COVID-19 pandemic could materially and adversely affect our business, operating results, financial condition and prospects.
We are closely monitoring the outbreak and spread of COVID-19 (and any evolutions thereof or related or associated epidemics, pandemics or disease outbreaks, “COVID-19”). COVID-19 has spread to many countries and has been declared by the World Health Organization to be a pandemic, resulting in action from federal, state and local governments that has significantly affected virtually all facets of the U.S. and global economies. The U.S. government has implemented enhanced screenings, quarantine requirements and travel restrictions in connection with the COVID-19 outbreak.
Our business may be more adversely impacted by the effects of COVID-19 in the future. We source equipment from different parts of the world that have been affected by the virus, which could have an adverse impact on our supply chain operations and ability for manufacturers to obtain materials needed to assemble the products we offer. Additionally, certain ancillary effects of the COVID-19 pandemic have arisen, including inflation in the U.S. and elsewhere as well as a tightening labor market. The current outbreak and continued spread of COVID-19 as well as the prolonged duration and severity of these ancillary effects could cause an economic slowdown and potentially lead to a global recession. There is a significant degree of uncertainty and lack of visibility as to the extent and duration of any such slowdown or recession. Given the significant economic uncertainty and volatility created by the COVID-19 pandemic, it is difficult to predict the nature and extent of impacts on demand for our products.
The extent of the impact of COVID-19 on our operational and financial performance will depend on future developments, including, but not limited to, efficacy of vaccines and the the duration and spread of the outbreak, including new variants, and related travel advisories and restrictions, all of which are highly uncertain and cannot be predicted. Government shutdown orders or a change to our business classification as an “essential business” may result in a closure of operations for an uncertain duration impacting our business results. Preventing the effects from and responding to this market disruption or any other public health threat, related or otherwise, may further increase our costs of doing business and may have a material adverse effect on our business, financial condition and results of operations.
While we have taken steps to minimize the potential for COVID-19 exposure in the workplace, the potential for a COVID-19 outbreak within our facilities occurring and significantly disrupting operations remains possible. Increased infection rates in geographic locations in which we operate have the potential to result in disruptions to our operations at a greater rate than we currently experience.
The spread of COVID-19 has caused us to modify our business practices (including employee travel, employee work locations, cancellation of physical participation in meetings (including in-person sales activities), events and conferences and social distancing measures), and we may take further actions as may be required by government authorities or that we determine are in the best interests of our employees, customers, partners, vendors and suppliers. Work-from-home and other measures introduce additional operational risks, including cybersecurity risks, which could have an adverse effect on our operations. Similarly, work-from-home and other measures may lead to increased absenteeism or cause workplace disruption. There is no certainty that such measures will be sufficient to mitigate the risks posed by the COVID-19 virus, and illness and workforce disruptions could lead to unavailability of key personnel and harm our ability to perform critical functions.
The extent to which disruptions to the global supply chain, inflationary pressures, including the accompanying higher interest rates, and a tightening labor market will impact our operational and financial performance depends on the duration and severity of such factors and on our ability and the ability of various governments to combat and/or mitigate such pressures. Some of these economic factors have increased and may continue to increase our costs, and we may not be able
to offset such increases. There may also be further impacts on our operational and financial performance if such trends continue.
Additionally, in response to the COVID-19 pandemic, the federal government and certain state and local governments have purchased significant amounts of medical equipment of the type we offer in our rental fleet. These purchases by federal, state and local governments of medical equipment that previously would have been rented may reduce the demand for our rental equipment.
The severity, magnitude and duration of the current COVID-19 pandemic and its ancillary effects are uncertain, rapidly changing and hard to predict and depends on events beyond our knowledge or control. These and other impacts of the COVID-19 pandemic could have the effect of heightening many of the other risks described in this “Risk Factors” section, such as those relating to our reputation, sales, results of operations or financial condition. We might not be able to predict or respond to all impacts on a timely basis to prevent near- or long-term adverse impacts to our results. As a result, we cannot at this time predict the impact of the COVID-19 pandemic, but it could have a material adverse effect on our business, results of operations, financial condition and cash flows.
We may be unable to maintain existing contracts or contract terms or enter into new contracts with our customers.
Our revenue maintenance and growth depend, in part, on continuing contracts with customers, including through GPOs and IDNs, with which certain of our customers are affiliated. In the past, we have been able to maintain and renew the majority of such contracts and expand the solutions we offer under such contracts. If we are unable to maintain our contracts, or if the GPOs or IDNs seek additional discounts or other more beneficial terms on behalf of their members, we may lose a portion or all of existing business with, or revenue from, customers that are members of such GPOs and IDNs. In addition, certain of our customers account for large portions of our revenue. From time to time, a single customer, depending on the current status and volumes of a number of separate contracts, may account for 10% or more of our total revenue. As a result, the actions of even a single customer can expose our business and operating results to greater volatility.
On
July 21, 2020, weDecember 14, 2022, the Company entered into a
one-yearnew agreement
(the “Agreement”) with the U.S. Department of Health and Human
Services’Services (“HHS”)
Office ofand the Assistant Secretary for Preparedness and Response (“ASPR”) for
the comprehensivepreventive maintenance
services (“PMS”), management and
management services of medical ventilator equipment in exchangestorage for
up to $193.0 million (the “HHS Agreement”). Subsequent to its initial term, the Company has continued to operate under a series of short-term extensions to the HHS Agreement. For the year ended December 31, 2021, approximately 17% of total revenue related to various contracts with HHS and ASPR.On February 28, 2022, the Company entered into a new 12-month sole source agreement (the “Agreement”) with HHS and ASPR to provide comprehensive ventilator and powered air purifying respirator (“PAPR”) systems managementsystems. The Agreement’s performance period commenced on August 28, 2023, and maintenance services in connection with ongoing supportis anticipated to have a period of performance of four years and maintenancesix months, consisting of a base period of twelve months, three one-year option periods and an additional six-month option period. The Agreement is valued at up to $491 million over its expected term. Additionally on December 14, 2022, the national stockpile. This Agreement replacesCompany received a modification to the Company’s prior agreements withcurrent HHS/ASPR agreement that ran from July 21, 2020, toexpired on February 27, 2022, and is comprised of an initial 6-month base term, running from the period of February 28, 2022, to August 27, 2022, with a 6-month option term that will expire February 27, 2023.
The term of this new Agreement will allow adequate time for HHS/ASPR to compete a longer-term agreement for comprehensive ventilator and PAPR systems management and maintenance services without having a lapse in critical COVID-19 pandemic response needs. HHS/ASPR solicited, negotiated and awarded the Agreement to the Company pursuant to2023, incorporating Federal Acquisition Regulation (“FAR”) 6.302-2 Unusual and Compelling Urgency. Due52.217-8, which allows the government to extend the unusual and compelling urgencyterm of this requirement, HHS/ASPR determined thatcurrent agreement by up to six months. For the Company is the only vendor that can provide comprehensive ventilator and PAPR management and maintenance as interim services on an expedited basis. Services include immediately providing all capabilities, such as, but not limitedyear ended December 31, 2023, approximately 10.4% of total revenue related to expertise, record management, labor, material, equipment, properly licensed and secure facilities to meet all of the current federal, state and local regulatory compliance, meeting stringent security, temperature control to maintain medical equipment, maintenance and repair services for the Division of Strategic National Stockpile (“DSNS”) cache of 167,574 ventilators, ventilator kits and supplies in 36,110 pallet positions and 164,950 PAPRs in 2,504 pallet positions. HHS/ASPR concluded that a lapse in service would cause
irreparable harm to the government and therefore that the Agreement is necessary. We expect that HHS and ASPR will continue to be our largest customer throughout the duration of the Agreement.
The term of the Agreement will allow for transition to the competitive contract when awarded. Agiliti fully intends to compete for such future contract award. Although we expect to have the opportunity to complete a request for proposal for continuing contracts with HHS following the expiration of the Agreement or any extension thereto, the federal government follows a comprehensive competitive bid process that can lengthen the time period for renewals or contract awards and we have no visibility into the the expected timing of any future requests for proposal or contract awards.ASPR. To the extent the Agreement or other
contracts with significant customers are not renewed or are terminated, or the timing of any such renewal is substantially delayed, our revenue and operating results would be significantly impacted.
A substantial portion of our revenue come from customers with which we do not have long-term commitments, and cancellations by or disputes with customers could decrease the amount of revenue we generate, thereby reducing our ability to operate and expand our business.
For the year ended December 31,
2021,2023, approximately
59%75% of our total revenue was derived from customers that purchased equipment or services from us through a GPO that contracted with us on behalf of its members. The remaining
41%25% of revenue was derived from customers that contract with us directly. Our customers are generally not obligated to outsource our equipment under long-term commitments. The short-term services we provide could be terminated by the customer without notice or payment of any termination fee. A large number of such terminations may adversely affect our ability to generate revenue growth and sufficient cash flows to support our growth plans. In addition, those customers with long-term commitments may have contracts that do not permit us to raise our prices, yet our cost to serve may increase. Any of these risks could have a material adverse impact on our ability to operate and expand our business.
If we fail to maintain our reputation, including by adequately protecting our intellectual property, our sales and operating results may decline.
We believe our continued success depends on our ability to maintain and grow the value of our brand. Brand value is based in large part on perceptions of subjective qualities. Even isolated incidents can erode the trust and confidence of our customers and damage the strength of our brand, if such incidents result in adverse publicity or litigation. Challenges or reactions to action (or inaction) or perceived action (or inaction), by us on issues such as social policies, compliance related to social, product, labor and environmental standards or other sensitive topics, and any perceived lack of transparency about such matters, could harm our reputation. The increasing use of social media platforms and online forums may increase the chance that an adverse event could negatively affect the reputation of our brands. The online dissemination of negative information about our brand, including inaccurate information, could harm our reputation, business, competitive advantage and goodwill. Damage to our reputation could result in declines in customer loyalty and sales, relationships with our suppliers, business development opportunities, divert attention and resources from management, including by requiring responses to inquiries or additional regulatory scrutiny, and otherwise materially adversely affect our results. Any failure to offer and maintain high-quality customer support, or a market perception that we do not maintain high-quality customer support, could similarly adversely affect our reputation, our ability to sell our products and services, and in turn our business, financial condition and results of operations. In addition, we are currently implementing a new information technology business systems platform. The implementation process could result in
systemwidesystem wide delays or failure. Because we depend on information technology systems to operate our business, failure or delay of any or all information technology systems could impact our ability to operate and meet customer demand, resulting in reputational harm.
Further, our ability to protect our brand depends in part on our ability to protect our confidential information, including unpatented know-how, technology and other proprietary information, maintaining, defending and enforcing our intellectual property rights. We rely on our agreements with our customers, non-disclosure and confidentiality agreements with employees and third parties, and our trademarks and copyrights to protect our intellectual property rights. However, any of these parties may breach such agreements and disclose our proprietary information, and we may not be able to obtain adequate remedies for such breaches. In addition, third parties may allege that our products and services, or the conduct of our business, infringe, misappropriate or otherwise violate such third party’s intellectual property rights. Moreover, although we try to ensure that our employees do not use the proprietary information or know-how of others in
their work for us, we may be subject to claims that we or these employees have used or disclosed intellectual property of any third parties, including such individual’s former employer. If we fail in defending any such claims, in addition to paying monetary damages, we may lose valuable intellectual property rights or personnel. Even if we are successful in defending against such claims, litigation could result in substantial costs and be a distraction to management. Furthermore, any of our trademarks may be challenged, opposed, infringed, cancelled, circumvented or declared generic, or determined to be infringing on other marks. We may not be able to protect our rights to these trademarks, which we need in order to maintain name recognition by potential collaborators or clients in our markets of interest.
A global economic downturn could adversely affect our customers and suppliers or have new, additional adverse effects on them, which could have further adverse effects on our operating results and financial position.
We believe our customers could be adversely affected by further global economic downturn. The impact of further downturn on our customers may result in, among other things, a decreased number of patients our customers serve at any
time (which we refer to as “patient census”), decreased number of non-essential patient services, increased uncompensated care and bad debt, increased difficulty obtaining financing on favorable terms and tighter capital and operating budgets. Many of our customers depend on investment income to supplement inadequate third-party payor reimbursement. Further disruption in the capital and credit markets could adversely affect the value of many investments, reducing our customers’ ability to access cash reserves to fund their operations. If economic conditions worsen, our customers may seek to further reduce their costs and may be unable to pay for our solutions, resulting in reduced orders, slower payment cycles, increased bad debt and customer bankruptcies.
Our suppliers also may be negatively impacted by further economic downturn and tighter capital and credit markets. If our key suppliers experience financial difficulty and are unable to deliver to us the equipment we require, we could be forced to seek alternative sources of medical equipment or to purchase equipment on less favorable terms, or we could be unable to fulfill our requirements. A delay in procuring equipment or an increase in the cost to purchase equipment could limit our ability to provide equipment to customers on a timely and cost-effective basis (e.g., supply chain
issues arising out of the COVID-19 pandemic)issues). Any of these occurrences, all of which are out of our control, could have a material adverse effect on our financial condition.
Future disease outbreak, including epidemics, pandemics or similar widespread public health emergencies could materially and adversely affect our business, operating results, financial condition and prospects.
In May 2023, both the U.S. and the World Health Organization declared an end to the COVID-19 pandemic as a public health emergency, and the health consequences have been mitigated by the availability of vaccines and therapeutics to treat COVID-19 infections. However, epidemics, pandemics, or similar widespread public health emergencies have in the past and may in the future result in adverse economic impacts both domestically and internationally that impact our operations and financial condition.
The COVID-19 pandemic and its variants caused disruptions to our operations and those of our suppliers, customers or vendors and our business may be similarly adversely impacted by future disease outbreak. We source equipment from different parts of the world that may be affected by an epidemic, pandemic or similar widespread public health emergency, which could have an adverse impact on our supply chain operations and ability for manufacturers to obtain materials needed to assemble the products we offer. The extent to which disruptions to the global supply chain, inflationary pressures, including accompanying higher interest rates, and a tightening labor market may impact our operational and financial performance depends on the duration and severity of such factors and on our ability and the ability of various governments to combat and/or mitigate such pressures. In the past, some of these economic factors have increased and may continue to increase our costs, and we may not be able to offset such increases in the future.
Government shutdown orders or a change to our business classification as an “essential business” due to an epidemic, pandemic or similar widespread public health emergency may result in a closure of operations for an uncertain duration impacting our business results. Preventing the effects from and responding to this market disruption or any other public health threat, related or otherwise, may further increase our costs of doing business and may have a material adverse effect on our business, financial condition and results of operations.
Additionally, in response to the COVID-19 pandemic, our customers including the federal government and certain state and local governments purchased significant amounts of medical equipment of the type we offer in our rental fleet. Future epidemics, pandemics or similar widespread public health emergencies could result in a similar reaction from our customers which could reduce the demand for our rental equipment.
The ultimate impact of pandemics, epidemics and public health emergencies on our business, results of operations, financial condition and cash flows is dependent on future developments, including the duration of any such event and the related length of its impact on the U.S. and global economies and their healthcare systems, which are uncertain and cannot be predicted. Future epidemics, pandemics or similar widespread public health emergencies could have the effect of heightening many of the other risks described in this “Risk Factors” section, such as those relating to our reputation, sales, results of operations or financial condition. We might not be able to predict or respond to all impacts on a timely basis to prevent near- or long-term adverse impacts to our results.
If our customers’ patient census or services decrease, the revenue generated by our business could decrease.
Our operating results are dependent in part on the amount and types of equipment necessary to service our customers’ needs, which are heavily influenced by patient census and the services those patients receive. At times of lower patient census, our customers have a decreased need for our services on a supplemental or peak needs basis. During severe
economic downturns, the number of hospital admissions and inpatient surgeries declines as consumers reduce their use of non-essential healthcare services. Our operating results can also vary depending on the timing and severity of the cold and flu season, local, regional or national epidemics and the impact of national catastrophes, as well as other factors affecting patient census and service demand.
Our competitors may engage in significant competitive practices, which could cause us to lose market share, reduce prices or increase expenditures.
Our competitors may engage in competitive practices that could cause us to lose market share, reduce our prices, or increase our expenditures. For example, competitors may sell significant amounts of surplus equipment or sell capital equipment at a lower gross margin to obtain the future repeat sales of disposables for a higher gross margin, thereby decreasing the demand for our equipment solutions. Our competitors also may choose to offer their products and services to customers on a combined or bundled basis with reduced prices, and if we are unable to offer comparable products or prices, we may experience reduced demand for our solutions. Additionally, the overall market for our services is very competitive and our competitors often compete by lowering prices, thus impacting our ability to maintain our gross margins. Any actions we may be required to take as a result of increased competitive pressure, including decreasing our prices, renegotiating contracts with customers on more favorable terms or increasing our sales and marketing expenses, could have a material adverse effect on our business, financial condition and results of operations.
Consolidation in the healthcare industry may lead to a reduction in the prices we charge, thereby decreasing our revenue.
Numerous initiatives and reforms initiated by legislators, regulators and third-party payers to curb rising healthcare costs, in addition to other economic factors, have resulted in a consolidation trend in the healthcare industry to create new companies with greater market power, including hospitals. As the healthcare industry consolidates, competition to provide products and services to industry participants has become, and will likely continue to become, more intense. In addition, competitive bidding also emphasizes the importance of relationships with both the payors and others in the space that impact reimbursement of our clients and customers. All of this in turn has resulted, and will likely continue to result in, greater pricing pressures and the exclusion of certain suppliers from various market segments as GPOs, IDNs, and large single accounts continue to use their market power to consolidate purchasing decisions for some of our existing and prospective customers. We expect the market demand, government regulation, and third-party reimbursement policies, among other potential factors, will continue to change the worldwide healthcare industry, resulting in further business consolidations and alliances among our customers and prospective customers, which may reduce competition among our existing and prospective customers, exert further downward pressure on the prices of our implants and may adversely impact our business, financial condition or results of operations.
We have relationships with certain key medical equipment manufacturers and suppliers, and adverse developments concerning these manufacturers or suppliers could delay our ability to procure equipment or provide certain services or increase our cost of purchasing equipment.
We purchased medical equipment from over
100500 manufacturers
and suppliers in
2021,2023, ten of which accounted for approximately
72%65% of our direct medical equipment purchases in
2021.2023. Additionally, we purchase repair parts, supplies and disposables from medical equipment manufacturers and suppliers that are necessary to our business. Adverse developments concerning key suppliers or our relationships with them could force us to seek alternative sources for our medical equipment or repair parts or to purchase such equipment or repair parts on less favorable terms. A delay in procuring equipment or repair parts or an increase in our cost to purchase equipment or repair parts could limit our ability to provide equipment and/or services to our customers on a timely and cost-effective basis. In addition, if we do not have access to certain parts, or if manufacturers
and suppliers do not provide access to the appropriate equipment manuals or training, we may not be able to provide certain clinical engineering services.
If we are unable to change the manner in which healthcare providers traditionally procure medical equipment, we may not be able to achieve significant revenue growth.
We believe the direct purchase or capital lease of medical equipment, and self-management of that equipment, by hospitals and alternate site providers significantly competes with our solution offerings. Many hospitals and alternate site providers view equipment rental primarily as a means of meeting short-term or peak supplemental needs, rather than as a long-term, effective and cost-efficient alternative to purchasing or leasing equipment. Many healthcare providers may continue to purchase or lease a substantial portion of their medical equipment and to manage and maintain it on their own. If we are
unable to influence healthcare providers to increase the proportion of medical equipment they rent rather than purchase, our ability to achieve significant revenue growth will be materially impaired.
We depend on key personnel and our inability to attract and retain key personnel could harm our business.
Our financial performance is dependent in significant part on our ability to hire, develop and retain key personnel, including our senior executives, sales professionals, sales specialists, hospital management employees and other qualified workers. We have experienced and will continue to experience intense competition for these resources. The loss of the services of one or more of our senior executives or other key personnel could significantly undermine our management expertise, key relationships with customers and suppliers, and our ability to provide efficient, quality healthcare solutions, which would have a material adverse effect on our business, financial condition and results of operations.
We may be unable to make attractive acquisitions or successfully integrate acquired businesses, and any inability to do so may disrupt our business and hinder our ability to grow.
From time to time, we may evaluate acquisition candidates or other strategic relationships within the healthcare industry that may strategically fit our business objectives, as opportunistic acquisitions are part of our growth strategy. However, there is no guarantee we will be able to identify attractive acquisition opportunities. In the event we are able to identify attractive acquisition opportunities, we may not be able to complete the acquisition or do so on commercially acceptable terms. We may not be successful in acquiring other businesses, and the businesses we do acquire in the future may not ultimately produce returns that justify our related investment.
Acquisitions may involve numerous risks, including:
| ● | difficulties assimilating personnel and integrating distinct business cultures; |
| ● | diversion of management’s time and resources from existing operations; |
| ● | potential loss of key employees or customers of acquired companies; |
| ● | exposure to unforeseen liabilities of acquired companies; and |
| ● | liabilities that may exceed indemnification caps provided in acquisition agreements. |
•difficulties assimilating personnel and integrating distinct business cultures;
•diversion of management’s time and resources from existing operations;
•potential loss of key employees or customers of acquired companies;
•exposure to unforeseen liabilities of acquired companies; and
•liabilities that may exceed indemnification caps provided in acquisition agreements.
We may fail to realize all of the anticipated benefits of our recent acquisitions or those benefits may take longer to realize than expected. We may also encounter significant difficulties in integrating the businesses of our recent acquisitions.
The success of our
acquisitions of the businesses of Northfield Medical and Sizewise (collectively “our recent
acquisitions”)acquisitions will depend, in part, on our ability to integrate the businesses of
Northfield Medical and Sizewiseour recent acquisitions in an effective and efficient manner, which is a complex, costly and time-consuming process. The integration process may disrupt business and, if we are unable to successfully integrate
theacquired businesses,
of Northfield Medical and/or Sizewise, we could fail to realize the anticipated benefits of our recent acquisitions. The failure to meet the challenges involved in the integration process and realize the anticipated benefits of our recent acquisitions could cause an interruption of, or a loss of momentum in, our operations and could have a material adverse effect on our business, financial condition and results of operations.
In addition, the integration of
Northfield Medical and Sizewiseour recent acquisitions may result in material unanticipated challenges, expenses, liabilities, competitive responses and losses of customers and other business relationships. Additional integration challenges may include:
| ● | diversion of management’s attention to integration matters; |
| ● | difficulties in achieving anticipated cost savings, synergies, business opportunities and growth prospects from our recent acquisition; |
| ● | difficulties in the integration of operations and systems; |
| ● | difficulties in conforming standards, controls, procedures and accounting and other policies, business cultures and compensation structures; |
| ● | difficulties in the assimilation of employees; |
| ● | difficulties in managing the expanded operations of a materially larger and more complex company; |
| ● | challenges in attracting and retaining key personnel; and |
| ● | the impact of potential liabilities we may be inheriting from Northfield Medical and/or Sizewise. |
•diversion of management’s attention to integration matters;
•difficulties in achieving anticipated cost savings, synergies, business opportunities and growth prospects from our recent acquisition;
•difficulties in the integration of operations and systems;
•difficulties in conforming standards, controls, procedures and accounting and other policies, business cultures and compensation structures;
•difficulties in the assimilation of employees;
•difficulties in managing the expanded operations of a materially larger and more complex company;
•challenges in attracting and retaining key personnel; and
•the impact of potential liabilities we may be inheriting from our recent acquisitions.
Many of these factors are outside of our control and could result in increased costs, decreases in the amount of anticipated revenue and diversion of management’s time and energy, each of which could adversely affect our business, financial condition and results of operations.
In addition, even if the integration of theacquired businesses of Northfield Medical and Sizewise is successful, we may not realize all of the anticipated benefits of our recent acquisitions, including the synergies, cost savings, or sales or growth opportunities. These benefits may not be achieved within the anticipated time frames, or at all. Further, additional unanticipated costs may be incurred in the integration process. All of these factors could cause reductions in earnings per
share, decrease or delay the expected accretive effect of the transaction and negatively impact the price of shares of our common stock. As a result, it cannot be assured that our recent acquisitions will result in the realization of the anticipated benefits and potential synergies.
Impairment charges for goodwill or other long-lived assets could adversely affect the Company’s financial condition and results of operations.
We monitor the recoverability of our long-lived assets, such as amortizing intangibles and equipment, and evaluate their carrying
valueamount for impairment whenever events or changes in circumstances indicate that the carrying amount of such assets may not be fully recoverable. We annually review goodwill to determine if impairment has occurred. Additionally, interim reviews are performed whenever events or changes in circumstances indicate that impairment may have occurred. If the testing performed indicates that impairment has occurred, we are required to record a non-cash impairment charge for the difference between the carrying
valueamount and fair value of the long-lived assets or the carrying
valueamount and fair value of the reporting unit, in the period the determination is made. The testing of long-lived assets and goodwill for impairment requires us to make estimates that are subject to significant assumptions about our future revenue, profitability, cash flows, fair value of assets and liabilities, weighted average cost of capital, as well as other assumptions. Changes in these estimates, or changes in actual performance compared with these estimates, may affect the fair value of long-lived assets or reporting unit, which may result in an impairment charge.
We cannot accurately predict the amount or timing of any impairment of assets. Should the value of long-lived assets or goodwill become impaired, our financial condition and results of operations may be adversely affected.
We may incur increased expenses related to our pension plan, which could impact our financial position.
We have a defined benefit pension plan covering certain current and former employees. Although benefits under the pension plan were frozen in 2002, funding obligations under the pension plan continue to be impacted by the performance of the financial markets. If the financial markets do not provide the long-term returns we have assumed, the likelihood of us being required to make additional contributions will increase. The equity and debt markets can be, and recently have been, volatile, and therefore our estimate of future contribution requirements can change dramatically in relatively short periods of time.
Our cash flow fluctuates during the year.
Our results of operations have been and can be expected to be subject to quarterly fluctuations. We may experience increased revenue in the first and fourth quarters of the year, depending upon the timing and severity of the cold and flu season and the related increased hospital census and medical equipment usage during that season. Because a significant portion of our expenses are relatively fixed over these periods, our operating income as a percentage of revenue tends to increase during the first and fourth quarter of each year. If the cold and flu season is delayed by as little as one month, or is less severe than in prior periods, our quarterly operating results for a current period can vary significantly from prior periods. Our quarterly results can also fluctuate as a result of such other factors as the timing of acquisitions, new on-site managed solution agreements or new service center openings.
A portion of our revenue is derived from home care providers and nursing homes, and these healthcare providers may pose additional credit risks.
Our nursing home and home care customers may pose additional credit risks since they are generally less financially sound than hospitals. In addition, such cost pressures have increased due to temporary and permanent closure of nursing homes and home care agencies caused byfollowing the spread of COVID-19. These customers continue to face cost pressures. We may incur losses in the future due to the credit risks, including potential bankruptcy filings, associated with any of these customers.
Our business entails the risk of claims related to the medical equipment that we outsource and service. We may not have adequate insurance to cover a claim, and it may be more expensive or difficult for us to obtain adequate insurance in the future.
We may be liable for claims related to the manufacture or use of our medical equipment or to our maintenance or repair of a customer’s medical equipment. Any such claims, if made and upheld, could make our business more expensive to operate and therefore less profitable. We may be subject to claims exceeding our insurance coverage or we may not be able to continue to obtain liability insurance at acceptable levels of cost and coverage. If we are found liable for any significant claims that are not covered by insurance, our liquidity and operating results could be materially adversely affected. In addition, litigation relating to a claim could adversely affect our existing and potential customer relationships, create adverse public relations and divert management’s time and resources from the operation of the business.
We may incur increased costs that we cannot pass through to our customers.
Our customer contracts may include limitations on our ability to increase prices over the term of the contract. On the other hand, we rely on third parties, including subcontractors, to provide some of our services and supplies and we do not always have fixed pricing contracts with these subcontractors. Therefore, we are at risk of incurring increased costs that we are unable to pass through to our customers.
Any failure of our management information systems,
including as a result of a cybersecurity event or other system breach, could harm our business and operating results.
We depend on our management information systems to actively manage our medical equipment fleet, control capital spending and provide fleet information, including equipment usage history, condition and availability of our medical equipment. These functions enhance our ability to optimize fleet utilization and redeployment. The inability of our management information systems to operate as we anticipate could damage our reputation with our customers, disrupt our business or result in, among other things, decreased revenue and increased overhead costs. Any such failure could harm our business and results of operations.
Our results of operations could be adversely affected if these systems, or our customers’ access to them, are interrupted, damaged by unforeseen events, cyber security incidents or other actions of third parties, or fail for any extended period of time. In addition, data security breaches could adversely impact our operations, results of operations or our ability to satisfy legal requirements, including those related to patient-identifiable health information.
There are inherent limitations in all internal control systems over financial reporting, and misstatements due to error or fraud may occur and not be detected.
While we have taken actions designed to address compliance with the internal control over financial reporting and disclosure controls and other requirements of the Sarbanes-Oxley Act of 2002 and the rules and regulations promulgated by the SEC implementing these requirements, there are inherent limitations in our ability to control all circumstances. We do not expect that our internal control over financial reporting and disclosure controls will prevent all error and all fraud. A control system, no matter how well conceived and operated, can provide only reasonable, not absolute, assurance that the objectives of the control system are met. In addition, the design of a control system must reflect the fact that there are resource constraints and the benefit of controls must be relative to their costs. Because of the inherent limitations in all control systems, no evaluation of controls can provide absolute assurance that all control issues and instances of fraud, if any, in our Company have been detected. These inherent limitations include the realities that judgments in decision-making can be faulty and that breakdowns can occur because of simple errors or mistakes. Further, controls can be circumvented by individual acts of some persons, by collusion of two or more persons, or by management override of the controls. The design of any system of controls also is based in part upon certain assumptions about the likelihood of future events, and there can be no assurance that any design will succeed in achieving its stated goals under all potential future conditions. Over time, a control may be inadequate because of changes in conditions, such as our growth or increased transaction volume, or the degree of compliance with the policies or procedures may deteriorate. Because of the inherent limitations in a cost-effective control system, misstatements due to error or fraud may occur and not be detected.
Social unrest may materially and adversely impact our business.
We have over 150 offices located in cities across the country, and such social unrest could materially affect the ability of certain of these offices to operate. Prolonged disruptions because of such social unrest in the markets in which we operate
could disrupt our relationships with customers, employees and referral sources located in affected areas and, in the case of our corporate office, our ability to provide administrative support services, including billing and collection services. Future civil insurrection, social unrest, protests, looting, strikes or street demonstrations may adversely affect our reputation, business and consolidated financial condition, results of operations and cash flows.
If we do not respond to technological changes, our products and services could become obsolete, and we could lose customers.
To remain competitive, we must continue to enhance and improve the functionality and features of the technology that forms part of our service offering. The healthcare industry is rapidly changing, and if competitors introduce new products and services using new technologies or if new industry standards and practices emerge, our existing products and services and our systems and our proprietary software may become obsolete. Our failure to respond to technological change or to adequately maintain, upgrade and develop our products, services and systems used to process customers’ orders and payments could harm our business, prospects, financial condition and results of operations.
If we do not successfully coordinate the management of our equipment, we could lose sales.
Our business requires that we coordinate the management of our equipment over a significant geographic range. If we do not successfully coordinate the timely and efficient management of our equipment (for example, if equipment is lost, missing or misplaced), our costs may increase, we may experience a build-up or shortage in inventory, we may not be able to deliver sufficient quantities to meet customer demand and we could lose sales, each of which could seriously harm our business.
Challenges to our tax positions, the interpretation and application of recent U.S. tax legislation or other changes in taxation of our operations could harm our business, revenue and financial results.
We operate in a number of tax jurisdictions, including at the U.S. federal, state and local levels, and we therefore are subject to review and potential audit by tax authorities in these various jurisdictions. Significant judgment is required in determining our provision for income taxes and other tax liabilities, and tax authorities may disagree with tax positions we take and challenge our tax positions. Successful unilateral or multi-jurisdictional actions by various tax authorities, including in the context of our current or future corporate operating structure and third-party and intercompany arrangements, may increase our effective tax rate, result in additional taxes or other costs or have other material consequences, which could harm our business, revenue and financial results. Our effective tax rate may also change from year to year or vary materially from our expectations based on changes or uncertainties in the mix of activities and income allocated or earned among various jurisdictions, changes in tax laws and the applicable tax rates in these jurisdictions (including future tax laws that may become material) and the valuation of deferred tax assets and liabilities.
We may from time to time be subject to litigation, which may be extremely costly to defend, could result in substantial judgment or settlement costs or subject us to other remedies.
We are currently not a party to any material legal proceedings. From time to time, however, we may be involved in various legal proceedings, including, but not limited to, actions relating to breach of contract, employment-related proceedings, anti-competition-related matters and intellectual property infringement, misappropriation or other violation. Claims may be expensive to defend, may divert management’s time away from our operations, and may impact the availability and premiums of our liability insurance coverage, regardless of whether they are meritorious or ultimately lead to a judgment against us. We cannot assure you that we will be able to successfully defend or resolve any current or future litigation matters, in which case those litigation matters could have a material and adverse effect on our business, financial condition, operating results, cash flows, and prospects.
Risks Related to HealthCareHealthcare and Other Legal Regulation Affecting Us
Uncertainty surrounding healthcare reform initiatives remains. Depending on the scope, form, and implementation of final healthcare reform legislation, our business may be adversely affected.
The healthcare industry is undergoing significant change. In March 2010, the Congress adopted and President Obama signed into law the Affordable Care Act. The Affordable Care Act increased the number of Americans with health insurance and employer mandates and subsidies offered to lower income individuals. While the increase in coverage could translate into increased utilization of our products and services, healthcare reform and political uncertainty have historically
resulted in changes in how our customers purchase our services and have adversely affected our revenue. In addition to healthcare reform, Medicare, Medicaid and managed care organizations, such as health maintenance organizations and preferred provider organizations, traditional indemnity insurers and third-party administrators are under increasing pressure to control costs and limit utilization, while improving quality and healthcare outcomes. Provider revenue per service may decline with reductions in Medicare and Medicaid reimbursement. Furthermore, the implementation of the Affordable Care Act may impose changes in healthcare delivery, reimbursement, operations or record keeping that are not compatible with our current offerings, which could force us to incur additional compliance costs. So far, starting in 2013, our business, along with that of some of our suppliers and customers that are manufacturers, came under direct regulation of the Open Payments Law, specifically the Physician Payments Sunshine Act. The Open Payments Law requires the annual reporting and publishing of all transfers of value to physicians and teaching hospitals to give greater transparency to financial relationships between manufacturers, physicians and teaching hospitals. Federal and state governments also continue to enact and consider various legislative and regulatory proposals that could materially impact certain aspects of the healthcare system. We cannot predict with certainty what additional healthcare initiatives, if any, will be implemented at the federal or state levels or what the ultimate effect of federal healthcare reform (including, but not limited to, the Affordable Care Act) or any future legislation or regulation will have on our operating results or financial condition. We cannot predict with any certainty the result of proposed regulation in the healthcare space, such as the Department of Health and Human Services initiative to accelerate a transformation of the healthcare system, with a focus on removing “unnecessary obstacles” to coordinated care (the “Sprint to Coordinated Care”). Finally, we cannot quantify the repeal of the individual mandate, effective in 2019, under the Affordable Care Act, nor can we predict with any certainty the impact of the composition of the U.S. Supreme Court on our business model, prospects, financial condition or results of operations.
We are subject to federal and state privacy and data security laws and regulations in connection with our collection and use of personal information, including recently enacted amendments to federal privacy laws which make us subject to more stringent penalties in the event we improperly use or disclose protected health information regarding our customers’ patients.
HIPAA regulations apply national standards for some types of electronic health information transactions and the data elements used in those transactions to ensure the integrity, security and confidentiality of health information and standards to protect the privacy of individually identifiable health information businesses receive, maintain or transmit. The Health Information Technology for Economic and Clinical Health Act of 2009 (“HITECH Act”) expanded the scope of the privacy and security requirements under HIPAA and increased penalties for violations to “Business Associates” such as Agiliti Health, who are required to comply with certain of the HIPAA privacy standards and are required to implement administrative, physical and technical security standards. In addition, the HITECH Act enacted federal breach notification rules requiring notification to affected individuals and the Department of Health and Human Services (and in some cases, relevant media outlets) whenever a breach of protected health information occurs. In addition, the HIPAA rules now involve increased penalties, including mandatory penalties for “willful neglect” violations, starting at $100 per violation subject to a cap of $1.5 million for violations of the same standard in a single calendar year. To meet these requirements, as well as the requirements of other federal laws and regulations governing the collection and use of personal information, we may need to expend additional capital, software development and other resources, including to modify our products and services. Furthermore, our failure to maintain confidentiality of sensitive protected health information or other personal information in accordance with the applicable regulatory requirements could damage our reputation and expose us to claims, fines and penalties. Our operations could also be negatively impacted by a violation of the HIPAA privacy or security rules or any other applicable privacy or data security law.
Many states in which we operate also have state laws that protect the privacy and security of confidential, protected health information or other personal information that have similar or even more protection than the federal provisions. State attorneys general are also authorized to enforce federal HIPAA privacy and security rules. Furthermore, state data breach notification laws continue to expand the type of protected health information and other personal information they encompass, and in many cases are more burdensome than the HIPAA/HITECH breach reporting requirements. Some state laws impose fines and penalties upon violators in addition to allowing a private right of action to sue for damages for those who believe their protected health information or other personal information has been misused.
Our relationships with healthcare facilities and marketing practices are subject to the federal Anti-Kickback Statute and similar state laws.
Although we do not receive a significant amount of direct reimbursement from the U.S. federal government in the normal course of our business, we are subject to the federal Anti-Kickback Statute, which prohibits the knowing and willful offer,
payment, solicitation or receipt of any form of “remuneration” in return for, or to induce, the referral of business or ordering of services paid for by Medicare or other federal programs. “Remuneration” has been broadly defined to include anything of value, including gifts, discounts, credit arrangements, and in-kind goods or services. Certain federal courts have held that the Anti-Kickback Law can be violated if “one purpose” of a payment is to induce referrals. The Anti-Kickback Statute is broad and prohibits many arrangements and practices that are lawful in businesses outside the healthcare industry. Violations can result in imprisonment, civil or criminal fines or exclusion from Medicare, Medicaid and other governmental programs. The
Office of Inspector General (“OIG”)OIG issued a series of safe harbors that if met will help assure healthcare providers and other parties will not be prosecuted under the Anti-Kickback Law. Contracts with healthcare facilities and other marketing practices or transactions may implicate the Anti-Kickback Statute. We have attempted to structure our contracts and marketing practices to comply with the Anti-Kickback Statute along with providing training to our employees. However, we cannot ensure that we will not have to defend against alleged violations from private entities or that
the OIG or other authorities will not find that our practices violate the Anti-Kickback Statute.
Our contracts with the federal government subject us to additional oversight.
On July 21, 2020 we entered
Since entering into
theour initial contract with HHS
Agreement for the comprehensive maintenance and management services of medical ventilator equipment in
exchange for up to $193.0 million. Since entering into this contract,2020, the U.S. government has been our largest customer. In addition to
theour current long-term agreement with HHS,
Agreement, we have other agreements with the U.S. government. For the year ended December 31,
2021,2023, we derived approximately
17%10% of our revenue from multiple contracts with agencies of the federal government. As such, we must comply with and are affected by laws and regulations relating to the award, administration and performance of U.S. government contracts. Government contract laws and regulations affect how we do business with our customers and impose certain risks and costs on our business. A violation of specific laws and regulations, by us, our employees, others working on our behalf, a supplier or a venture partner, could harm our reputation and result in the imposition of fines and penalties, the termination of our contracts, suspension or debarment from bidding on or being awarded contracts, loss of our ability to export products or services and civil or criminal investigations or proceedings. In some instances, these laws and regulations impose terms or rights that are different from those typically found in commercial transactions.
For example, the U.S. government may terminate any of our government contracts and subcontracts either at its convenience or for default based on our performance, which may result in a loss. In addition, as funds are typically appropriated on a fiscal year basis and as the costs of a termination for convenience may exceed the costs of continuing a program in a given fiscal year, occasionally programs do not have sufficient funds appropriated to cover the termination costs were the government to terminate them for convenience. Under such circumstances, the U.S. government could assert that it is not required to appropriate additional funding.
A termination arising out of our default may expose us to liability and have a material adverse effect on our ability to compete for future contracts and orders. In addition, the U.S. government could terminate a prime contract under which we are a subcontractor, notwithstanding the quality of our services as a subcontractor. In the case of termination for default, the U.S. government could make claims to reduce the contract value or recover its procurement costs and could assess other special penalties.
Additionally, the U.S. government may not exercise an option period for various reasons, or, alternatively, the U.S. government may exercise option periods, even for contracts for which it is expected that our costs may exceed the contract price or ceiling.
U.S. government agencies routinely audit and investigate government contractors. These agencies review a contractor’s performance under its contracts, its cost structure, its business systems and compliance with applicable laws, regulations and standards. The U.S. government has the ability to decrease or withhold certain payments when it deems systems subject to its review to be inadequate. Additionally, any costs found to be misclassified may be subject to repayment.
Changes in third-party payor reimbursement for healthcare items and services, as well as economic hardships faced by other parties from which our customers obtain funding, may affect our customers’ ability to pay for our services, which could cause us to reduce our prices or adversely affect our ability to collect payments.
Most of our customers are healthcare providers that pay us directly for the services we deliver, and these customers rely on third-party payor reimbursement for a substantial portion of their operating revenue. Third-party payors include government payors like Medicare and Medicaid and private payors like insurance companies and managed care organizations. Third-party payors continue to engage in widespread efforts to control healthcare costs. Their cost containment initiatives include efforts to control utilization of services and limit reimbursement amounts. Reimbursement
limitations can take many forms, including discounts, non-payment for certain care (for example, care associated with certain hospital-acquired conditions) and fixed payment rates for particular treatment modalities or plans, regardless of the provider’s actual costs in caring for a patient. Reimbursement policies have a direct effect on our customers’ ability to pay us for our services and an indirect effect on the prices we charge. Ongoing concerns about rising healthcare costs may cause more restrictive reimbursement policies to be implemented in the future. Restrictions on the amounts or manner of reimbursements or funding to healthcare providers may affect the financial strength of our customers and the amount our customers are able to pay for our solutions.
In addition, a portion of our customers derive funding from state and local government sources, some of which are facing financial hardships, including decreased funding. Any limitation or elimination of funding to our customers by these sources could also affect the financial strength of our customers and the amount they are able to pay for our services.
Our customers operate in a highly regulated environment. Regulations affecting them could cause us to incur additional expenses associated with compliance and licensing. We could be assessed fines and face possible exclusion from participation in state and federal healthcare programs if we violate laws or regulations applicable to our business.
The healthcare industry is required to comply with extensive and complex laws and regulations at the federal, state and local government levels. While the majority of these regulations do not directly apply to us, there are some that do, including the FDCA and certain state pharmaceutical licensing requirements. Although we believe we are in compliance with the FDCA, if the Food and Drug Administration (“FDA”) expands the reporting requirements under the FDCA, we may be required to comply with the expanded requirements and may incur substantial additional expenses in doing so. With respect to state requirements, we are currently licensed in
2326 states and may be required to obtain additional licenses, permits and registrations as state requirements change. Our failure to possess such licenses for our existing operations may subject us to certain additional expenses.
Our success depends on the ability to service medical equipment safely and effectively. We are required to comply with the Food and Drug Administration Reauthorization Act (“FDARA”), which requires us to evaluate quality, safety and effectiveness of medical devices with respect to servicing. Our quality management system has not been fully extended to all of our programs and services, and the lack of controls may result in issues related to compliance and patient safety. In addition, our suppliers may not be able to fulfill service or product commitments, resulting in delays or failure to repair medical devices, and our manufacturers may be reluctant to provide the service manuals, training, equipment or parts needed to repair medical devices. The use of inadequate or substandard parts during the repair of medical devices may also result in the inoperability of medical equipment and malfunction that results in harm to patients and employees.
In addition to the FDCA, FDARA and state licensing requirements, we are impacted by federal and state laws and regulations aimed at protecting the privacy of individually identifiable protected health information, among other things, and detecting and preventing fraud, abuse and waste with respect to federal and state healthcare programs. Some of these laws and regulations apply directly to us. Additionally, many of our customers require us to abide by their policies relating to patient privacy, state and federal anti-kickback acts, and state and federal false claim acts and whistleblower protections. Since the Affordable Care Act provides for further oversight over and detection of fraud and abuse activities, we expect many of our customers to continue to require us to abide by such policies.
Given that our industry is heavily regulated, we may be subject to additional regulatory requirements. If our operations are found to be in violation of any governmental regulations to which we, or our customers, are subject, we may be subject to the applicable penalty associated with the violation. While we believe that our practices materially comply with applicable state and federal requirements, the requirements might be interpreted in a manner inconsistent with our interpretation. Also, if we are found to have violated certain federal or state laws or regulations regarding Medicare, Medicaid or other governmental funding sources, we could be subject to fines and possible exclusion from participation in federal and state healthcare programs. Penalties, damages, fines, or curtailment of our operations could significantly increase our cost of doing business, leading to difficulty generating sufficient income to support our business.
In addition, although our business is not currently extensively regulated under healthcare laws, we are subject to certain regulatory requirements that continue to come under greater scrutiny and regulation. Our customers are subject to direct regulation under the Federal False Claims Act, the Stark Law, the Anti-Kickback Statute, rules and regulations of the Centers for Medicare and Medicaid Services (“CMS”) and other federal and state healthcare laws and regulations. Promulgation of new laws and regulations, or changes in or re-interpretations of existing laws or regulations as they relate to our customers and our business, could affect our business, operating results or financial condition. Our operations may be negatively impacted if we have to comply with additional complex government regulations.
We own a large fleet of medical equipment, which may be subject to equipment recalls or obsolescence.
We incur significant expenditures to maintain a large and modern equipment fleet. Our equipment may be subject to recalls that could be expensive to implement and could result in revenue loss while the associated equipment is removed from service. We may be required to incur additional costs to repair or replace the equipment at our own expense or we may choose to purchase incremental new equipment from a supplier not affected by the recall. Additionally, our relationship with our customers may be damaged if we cannot promptly replace the equipment that has been recalled. We depend on manufacturers and other third parties to properly obtain and maintain FDA clearance for their equipment and products and their failure to maintain FDA clearance could have a material adverse effect on our business.
Our success depends, in part, on our ability to respond effectively to changes in technology. Because we maintain a large fleet of equipment, we are subject to the risk of equipment obsolescence. If advancements in technology render a substantial portion of our equipment fleet obsolete, or if a competing technology becomes available that our customers prefer, we may experience a decrease in demand for our products, which could adversely affect our operating results and cause us to invest in new technology to maintain our market share and operating margins.
Risks Related to Our Indebtedness
We have substantial indebtedness.
As of December 31,
2021,2023, we had approximately
$1.2$1.1 billion in borrowings outstanding under our First Lien Term Loan Facility (as defined herein) (together with the Revolving Credit Facility (as defined herein), the “Credit Facilities”), respectively, and
$8.0$6.8 million of letters of credit outstanding under our Revolving Credit Facility.
This is a significant amount of indebtedness which could have important consequences. For example, it could:
| ● | make it more difficult for us to satisfy our debt obligations; |
| ● | increase our vulnerability to general adverse economic, industry and competitive conditions; |
| ● | require us to dedicate a substantial portion of our cash flow from operations to payments on our indebtedness, thereby reducing the availability of our cash flow to fund working capital, capital expenditures, research and development efforts and other general corporate purposes; |
| ● | limit our flexibility in planning for, or reacting to, changes in our business and the industry in which we operate; |
| ● | place us at a competitive disadvantage compared to our competitors that have less indebtedness; |
| ● | limit our ability to borrow additional funds; |
| ● | limit our ability to make investments in technology and infrastructure improvements; and |
| ● | limit our ability to make significant acquisitions. |
•make it more difficult for us to satisfy our debt obligations;
•increase our vulnerability to general adverse economic, industry and competitive conditions;
•require us to dedicate a substantial portion of our cash flow from operations to payments on our indebtedness, thereby reducing the availability of our cash flow to fund working capital, capital expenditures, research and development efforts and other general corporate purposes;
•limit our flexibility in planning for, or reacting to, changes in our business and the industry in which we operate;
•place us at a competitive disadvantage compared to our competitors that have less indebtedness;
•limit our ability to borrow additional funds;
•limit our ability to make investments in technology and infrastructure improvements; and
•limit our ability to make significant acquisitions.
Our ability to satisfy our debt obligations will depend on our future operating performance. This, to a certain extent, is subject to general economic, financial, competitive, legislative, regulatory and other factors that are beyond our control. Our business may not continue to generate sufficient cash flow from operations and future borrowings may not be available to us in an amount sufficient to enable us to repay our indebtedness or to fund our other liquidity needs. If we are unable to make our interest payments or to repay our debt at maturity, we may have to obtain alternative financing, which may not be available to us.
We are vulnerable to interest rate risk with respect to our debt.
We are subject to interest rate risk in connection with the issuance of variable and fixed-rate debt. In order to maintain a desired mix of fixed-rate and variable-rate debt, we utilize interest rate swap agreements to fix a portion of our variable-rate debt. There is uncertainty in our ability to enter into additional swap agreements upon the expiration of our current arrangements in July 2025. In the current environment of high interest rates, we may not be able to manage our interest rate risk effectively, which could adversely affect our business, earnings and financial condition.
If we are unable to fund our significant cash needs, including capital expenditures, we may be unable to expand our business as planned or to service our debt.
We require substantial cash to operate our healthcare technology solutions and service our debt. Our healthcare technology solutions require us to invest a significant amount of cash in medical equipment purchases. To the extent that such expenditures cannot be funded from our operating cash flow, borrowings under our Credit Facilities or other financing
sources, we may not be able to grow as currently planned. We currently expect that over the next 12 months, we will make net investments of approximately
$85$80 to
$95$90 million in new and pre-owned medical equipment, leasehold improvements and other capital expenditures. This estimate is subject to numerous assumptions, including revenue growth, the number of on-site managed solution signings, and any significant changes in customer contracts. In addition, a substantial portion of our cash flow from operations must be dedicated to servicing our debt and there are significant restrictions on our ability to incur additional indebtedness under the credit agreements governing our credit facilities.
Primarily because of our debt service obligations and debt refinancing charges and elevated depreciation and amortization charges we have incurred, we have had a history of net losses. If we consistently incur net losses, it could result in our inability to finance our business in the future. We had a net incomeloss of $24.0$19 million for the year ended December 31, 2021,2023. We had a net lossincome of $22.5 million, $31.4$30 million and $3.9$24 million for the yearyears ended December 31, 2020, the period from January 4 through December 31, 2019,2022 and the period from January 1 through January 3, 2019,2021, respectively. Our ability to use our United States federal income tax net operating loss carryforwards to offset our future taxable income may be limited. If we are limited in our ability to use our net operating loss carryforwards in future years in which we have taxable income, we will pay more current taxes than if we were able to utilize our net operating loss carryforwards without limitation, which could harm our results of operations and liquidity.
We may not be able to obtain funding on acceptable terms or at all as a result of the credit and capital markets. Thus, we may be unable to expand our business or to service our debt.
Depending on the global financial markets and economic conditions, the cost of raising money in the debt and equity capital markets may increase while the availability of funds from those markets may diminish. Without adequate funding, we may be unable to execute our growth strategy, complete future acquisitions, or take advantage of other business opportunities or respond to competitive pressures, any of which could have a material adverse effect on our revenue and results of operations.
Risks Related to Ownership of our Securities
THL controls us, and its interests may conflict with ours or yours in the future.
For so long as the THL Stockholder continues to own a significant portion of our stock, THL will be able to significantly influence the composition of our board of directors (our “Board”), including the approval of actions requiring shareholder approval. Accordingly, for such period of time, THL will have significant influence with respect to our management, business plans and policies, including the appointment and removal of our officers, decisions on whether to raise future capital and amending our charter and bylaws, which govern the rights attached to our common stock. In particular, for so long as the THL Stockholder continues to own a significant percentage of our stock, THL will be able to cause or prevent a change of control of us or a change in the composition of our Board and could preclude any unsolicited acquisition of us. The concentration of ownership could deprive you of an opportunity to receive a premium for your shares of common stock as part of a sale of us and ultimately might affect the market price of our common stock.
In connection with our IPO, we entered into an amended and restated director nomination agreement (the “director nomination agreement”) with the THL Stockholder whereby, so long as the THL Stockholder beneficially owns at least 5% of our common stock then outstanding, the THL Stockholder has the right to designate: (i) all of the nominees for election to our Board for so long as the THL Stockholder beneficially owns 40% or more of the total number of shares of our common stock beneficially owned by the THL Stockholder upon completion of our IPO, as adjusted for any reorganization, recapitalization, stock dividend, stock split, reverse stock split or similar changes in our capitalization (the “Original Amount”); (ii) a number of directors (rounded up to the nearest whole number) equal to 40% of the total directors for so long as the THL Stockholder beneficially owns at least 30% and less than 40% of the Original Amount; (iii) a number of directors (rounded up to the nearest whole number) equal to 30% of the total directors for so long as the THL Stockholder beneficially owns at least 20% and less than 30% of the Original Amount; (iv) a number of directors (rounded up to the nearest whole number) equal to 20% of the total directors for so long as beneficially owns at least 10% and less than 20% of the Original Amount; and (v) one director for so long as the THL Stockholder beneficially owns at least 5% and less than 10% of the Original Amount. In each case, the THL Stockholder’s nominees must comply with applicable law and stock exchange rules. In addition, the THL Stockholder shall be entitled to designate the replacement for any of its board designees whose board service terminates prior to the end of the director’s term regardless of the THL Stockholder’s beneficial ownership at such time. The THL Stockholder shall also have the right to have its designees participate on committees of our Board proportionate to its stock ownership, subject to compliance with applicable law and stock exchange rules. The director nomination agreement will also prohibit us from increasing or decreasing the size of our
Board without the prior written consent of the THL Stockholder. This agreement will terminate at such time as the THL Stockholder owns less than 5% of the Original Amount.
THL and its affiliates engage in a broad spectrum of activities, including investments in the information and business services industry generally. In the ordinary course of their business activities, THL and its affiliates may engage in activities where their interests conflict with our interests or those of our other shareholders, such as investing in or advising businesses that directly or indirectly compete with certain portions of our business or are suppliers or customers of ours. Our certificate of incorporation provides that none of THL, any of its affiliates or any director who is not employed by us (including any non-employee director who serves as one of our officers in both his director and officer capacities) or its affiliates will have any duty to refrain from engaging, directly or indirectly, in the same business activities or similar business activities or lines of business in which we operate. THL also may pursue acquisition opportunities that may be complementary to our business, and, as a result, those acquisition opportunities may not be available to us. In addition,
THL may have an interest in pursuing acquisitions, divestitures and other transactions that, in its judgment, could enhance its investment, even though such transactions might involve risks to you.
We are a “controlled company” within the meaning of the rules of the NYSE and, as a result, we qualify for, and may in the future rely on, exemptions from certain corporate governance requirements. As such, you may not have the same protections as those afforded to shareholders of companies that are subject to such governance requirements.
THL Stockholder controls a majority of the voting power of our outstanding common stock. As a result, we are “controlled company” within the meaning of the corporate governance standards of the NYSE. Under these rules, a company of which more than 50% of the voting power for the election of directors is held by an individual, group or another company is a “controlled company” and may elect not to comply with certain corporate governance requirements, including:
| ● | the requirement that a majority of our Board consist of independent directors; |
| ● | the requirement that we have a nominating and corporate governance committee that is composed entirely of independent directors with a written charter addressing the committee’s purpose and responsibilities; |
| ● | the requirement that we have a compensation, nominating and governance committee that is composed entirely of independent directors with a written charter addressing the committee’s purpose and responsibilities; and |
| ● | the requirement for an annual performance evaluation of the compensation, nominating and governance committee. |
•the requirement that a majority of our Board consist of independent directors;
•the requirement that we have a nominating and corporate governance committee that is composed entirely of independent directors with a written charter addressing the committee’s purpose and responsibilities;
•the requirement that we have a compensation, nominating and governance committee that is composed entirely of independent directors with a written charter addressing the committee’s purpose and responsibilities; and
•the requirement for an annual performance evaluation of the compensation, nominating and governance committee.
We do not currently rely on these exemptions but may choose to do so in the future. As a result, we may not have a majority of independent directors on our Board and our Compensation Committee and Nominating and Governance Committee may not consist entirely of independent directors and our Compensation Committee and Nominating and Governance Committee may not be subject to annual performance evaluations. Accordingly, you will not have the same protections afforded to shareholders of companies that are subject to all of the corporate governance requirements of the NYSE.
An active, liquid trading market for our common stock may not develop, which may limit your ability to sell your shares.
Our
Since our IPO occurred in April
2021. Therefore,2021, there has been a public market for our common
stock for a short period of time.stock. Although we have listed our common stock on the NYSE under the symbol “AGTI,” an active trading market for our common stock may not be sustained. A public trading market having the desirable characteristics of depth, liquidity and orderliness depends upon the existence of willing buyers and sellers at any given time, such existence being dependent upon the individual decisions of buyers and sellers over which neither we nor any market maker has control. The failure of an active and liquid trading market to develop and continue would likely have a material adverse effect on the value of our common stock. The market price of our common stock may decline,
below the public offering price, and you may not be able to sell your shares of our common stock at or above the price you paid for our shares, or at all. An inactive market may also impair our ability to raise capital to continue to fund operations by issuing shares and may impair our ability to acquire other companies by using our shares as consideration.
Operating as a public company requires us to incur substantial costs and requires substantial management attention.
As a public company, we incur substantial legal, accounting and other expenses that we did not incur as a private company.expenses. For example, we are subject to the reporting requirements of the Exchange Act, the applicable requirements of the Sarbanes-Oxley Act, the Dodd-Frank Wall Street Reform and Consumer Protection Act, the rules and regulations of the SEC and the listing standards of the Nasdaq Global Select Market. For example, the Exchange Act requires, among other things, we file annual, quarterly and current reports with respect to our business, financial condition and results of operations.NYSE. We are also required to maintain effective disclosure controls and procedures and internal control over financial reporting. Compliance with these rules and regulations has increased and will continue to increase our legal and financial
compliance
compliance costs, and increase demand on our systems. In addition, as a public company, we may be subject to stockholder activism, which can lead to additional substantial costs, distract management and impact the manner in which we operate our business in ways we cannot currently anticipate. As a result of disclosure of information in filings required of a public company, our business and financial condition will becomeis more visible, which maycould result in threatened or actual litigation, including by competitors.
In addition, changing laws, regulations and standards relating to corporate governance and public disclosure are creating uncertainty for public companies, increasing legal and financial compliance costs and making some activities more time consuming. These laws, regulations and standards are subject to varying interpretations, in many cases due to their lack of specificity, and, as a result, their application in practice may evolve over time as new guidance is provided by regulatory and governing bodies. This could result in continuing uncertainty regarding compliance matters and higher costs necessitated by ongoing revisions to disclosure and governance practices. We
intend to invest resources to comply with evolving laws, regulations and standards, and
thiscontinued investment may result in increased general and administrative expenses and a diversion of our management’s time and attention from sales-generating activities to compliance activities. If our efforts to comply with new laws, regulations and standards differ from the activities intended by regulatory or governing bodies due to ambiguities related to their application and practice, regulatory authorities may initiate legal proceedings against us and could have a material adversely effect on our business, financial condition and results of operations.
If we fail to maintain an effective system of disclosure controls and internal control over financial reporting, our ability to produce timely and accurate financial statements or comply with applicable regulations could be impaired.
The Sarbanes-Oxley Act requires, among other things, that
we maintain effective disclosure controlsmanagement certify financial and
proceduresother information in our quarterly and
annual reports and provide an annual management report on the effectiveness of internal control over financial reporting.
In addition, our independent registered public accounting firm is required to attest to the effectiveness of our internal controls over financial reporting annually. We are continuing to develop and refine our disclosure controls and other procedures that are designed to ensure that information required to be disclosed by us in the reports that we
will file with the SEC is recorded, processed, summarized and reported within the time periods specified in SEC rules and forms and that information required to be disclosed in reports under the Exchange Act is accumulated and communicated to our principal executive and financial officers. We are also continuing to improve our internal control over financial reporting. We have expended, and anticipate that we will continue to expend, significant resources in order to
maintain and improve the effectiveness of our disclosure controls and procedures and internal control over financial reporting.
Our current controls
As described in Item 9A. “Controls and any new controlsProcedures,” management has concluded that we develop may become inadequate because of changes in the conditions in our business, including increased complexity resulting from acquisitions or business expansion. Further, weaknesses in our disclosure controls or our internal control over financial reporting was ineffective as of December 31, 2023 due to the material weaknesses caused by an insufficient number of trained resources with expertise in the design and implementation of controls to address identified risk related to IT systems and certain process-level controls including: (i) information technology general controls ("ITGC") across all financial reporting systems related to ineffective user access, including segregation of duties, and ineffective change management controls over certain financial reporting systems, and (ii) ineffective risk assessment processes and ineffective identification and design of process-level control activities related to order-to-cash (including revenue and accounts receivable) and manual journal entries. Based on this evaluation, our Chief Executive Officer and Chief Financial Officer also concluded that our disclosure controls and procedures were not effective due to these material weaknesses in internal control over financial reporting
Our independent registered public accounting firm was required to formally attest to the effectiveness of our internal controls over financial reporting pursuant to Section 404 as of December 31, 2023. As described in Item 9A. “Controls and Procedures”, our independent registered public accounting firm has expressed an adverse report on the operating effectiveness of our internal control over financial reporting as of December 31, 2023. In the future, our independent registered public accounting firm may issue a report that is adverse in the event that it continues to not be satisfied with the level at which our controls are documented, designed or operating.
We have begun to implement a number of steps to remediate the material weaknesses as described in Item 9A. “Controls and Procedures." However, remediation of material weaknesses may be discovered in the future. Any failure to develop or maintain effective controls, ora lengthy process and any difficulties encountered in theirremediation efforts or our implementation or improvement,of new controls could harm our results of operations or cause us to fail to meet our reporting obligations and may result in a restatement of our financial statements for prior periods. Any continued failure to implement and maintain effective internal control over financial reporting could also adversely affect the results of periodic management evaluations and annual independent registered public accounting firm attestation reports regarding the effectiveness of our internal control over financial reporting that we will eventually be required to include in our periodic reports that will be filed with the SEC.reporting. Ineffective disclosure controls and procedures and internal control over financial reporting could also cause investors to lose confidence in our reported financial and other
information, which would likely adversely affect the market price of our common stock. In addition, if we are unable to continue to meet these requirements, we may not be able to remain listed on the NYSE.
We are not currently required to comply with the SEC rules that implement Section 404 of the Sarbanes-Oxley Act and are therefore not required to make a formal assessment of the effectiveness of our internal control over financial reporting for that purpose. As a public company, we are required to provide an annual management report on the effectiveness of our internal control over financial reporting commencing with our second annual report on Form 10-K.We expect our independent registered public accounting firm will be required to formally attest to the effectiveness of our internal control over financial reporting commencing with our second annual report on Form 10-K. At such time, our independent registered public accounting firm may issue a report that is adverse in the event it is not satisfied with the level at which our internal control over financial reporting is documented, designed or operating.
Any continued failure to maintain effective disclosure controls and internal control over financial reporting could have an adverse effect on our business, financial condition and results of operations and could cause a decline in the market price of our common stock.
Provisions of our corporate governance documents could make an acquisition of us more difficult and may prevent attempts by our shareholders to replace or remove our current management, even if beneficial to our shareholders.
In addition to the THL Stockholder’s beneficial ownership of
75%73% of our common stock, our certificate of incorporation and bylaws and the Delaware General Corporation Law (the “DGCL”) contain provisions that could make it more difficult for a third party to acquire us, even if doing so might be beneficial to our shareholders. Among other things:
| ● | these provisions allow us to authorize the issuance of undesignated preferred stock, the terms of which may be established and the shares of which may be issued without shareholder approval, and which may include supermajority voting, special approval, dividend, or other rights or preferences superior to the rights of shareholders; |
| ● | these provisions provide for a classified board of directors with staggered three-year terms; |
| ● | these provisions provide that, at any time when the THL Stockholder beneficially owns, in the aggregate, less than 40% in voting power of our stock entitled to vote generally in the election of directors, directors may only be removed for cause, and only by the affirmative vote of holders of at least 662/3% in voting power of all the then-outstanding shares of our stock entitled to vote thereon, voting together as a single class; |
| ● | these provisions prohibit shareholder action by written consent from and after the date on which the THL Stockholder beneficially owns, in the aggregate, less than 35% in voting power of our stock entitled to vote generally in the election of directors; |
| ● | these provisions provide that for as long as the THL Stockholder beneficially owns, in the aggregate, at least 50% in voting power of our stock entitled to vote generally in the election of directors, any amendment, alteration, rescission or repeal of our bylaws by our shareholders require the affirmative vote of a majority in voting power of the outstanding shares of our stock and at any time when the THL Stockholder beneficially owns, in the aggregate, less than 50% in voting power of all outstanding shares of our stock entitled to vote generally in the election of directors, any amendment, alteration, rescission or repeal of our bylaws by our shareholders requires the affirmative vote of the holders of at least 662/3% in voting power of all the then-outstanding shares of our stock entitled to vote thereon, voting together as a single class; and |
| ● | these provisions establish advance notice requirements for nominations for elections to our Board or for proposing matters that can be acted upon by shareholders at shareholder meetings; provided, however, at any time when the THL Stockholder beneficially owns, in the aggregate, at least 10% in voting power of our stock entitled to vote generally in the election of directors, such advance notice procedure do not apply to it. |
•these provisions allow us to authorize the issuance of undesignated preferred stock, the terms of which may be established and the shares of which may be issued without shareholder approval, and which may include supermajority voting, special approval, dividend, or other rights or preferences superior to the rights of shareholders;
•these provisions provide for a classified board of directors with staggered three-year terms;
•these provisions provide that, at any time when the THL Stockholder beneficially owns, in the aggregate, less than 40% in voting power of our stock entitled to vote generally in the election of directors, directors may only be removed for cause, and only by the affirmative vote of holders of at least 662/3% in voting power of all the then-outstanding shares of our stock entitled to vote thereon, voting together as a single class;
•these provisions prohibit shareholder action by written consent from and after the date on which the THL Stockholder beneficially owns, in the aggregate, less than 35% in voting power of our stock entitled to vote generally in the election of directors;
•these provisions provide that for as long as the THL Stockholder beneficially owns, in the aggregate, at least 50% in voting power of our stock entitled to vote generally in the election of directors, any amendment, alteration, rescission or repeal of our bylaws by our shareholders require the affirmative vote of a majority in voting power of the outstanding shares of our stock and at any time when the THL Stockholder beneficially owns, in the aggregate, less than 50% in voting power of all outstanding shares of our stock entitled to vote generally in the election of directors, any amendment, alteration, rescission or repeal of our bylaws by our shareholders requires the affirmative vote of the holders of at least 662/3% in voting power of all the then-outstanding shares of our stock entitled to vote thereon, voting together as a single class; and
•these provisions establish advance notice requirements for nominations for elections to our Board or for proposing matters that can be acted upon by shareholders at shareholder meetings; provided, however, at any time when the THL Stockholder beneficially owns, in the aggregate, at least 10% in voting power of our stock entitled to vote generally in the election of directors, such advance notice procedure do not apply to it.
Our certificate of incorporation contains a provision that provides us with protections similar to Section 203 of the DGCL, and prevents us from engaging in a business combination with a person (excluding THL and any of its direct or indirect transferees and any group as to which such persons are a party) who acquires at least 15% of our common stock for a period of three years from the date such person acquired such common stock, unless Board or shareholder approval is obtained prior to the acquisition. These provisions could discourage, delay or prevent a transaction involving a change in control of our company. These provisions could also discourage proxy contests and make it more difficult for you and other shareholders to elect directors of your choosing and cause us to take other corporate actions you desire, including actions that you may deem advantageous, or negatively affect the trading price of our common stock. In addition, because our Board is responsible for appointing the members of our management team, these provisions could in turn affect any attempt by our shareholders to replace current members of our management team.
These and other provisions in our certificate of incorporation, bylaws and Delaware law could make it more difficult for shareholders or potential acquirers to obtain control of our Board or initiate actions that are opposed by our then-current Board, including delay or impede a merger, tender offer or proxy contest involving our company. The existence of these
provisions could negatively affect the price of our common stock and limit opportunities for you to realize value in a corporate transaction.
Our certificate of incorporation designates the Court of Chancery of the State of Delaware as the exclusive forum for certain litigation that may be initiated by our shareholders, which could limit our shareholders’ ability to obtain a favorable judicial forum for disputes with us.
Pursuant to our certificate of incorporation, unless we consent in writing to the selection of an alternative forum, the Court of Chancery of the State of Delaware is the sole and exclusive forum for (1) any derivative action or proceeding brought on our behalf, (2) any action asserting a claim of breach of fiduciary duty owed by, or other wrongdoing by, any of our directors, officers or other employees or agents to us or our shareholders, or a claim of aiding and abetting any such breach of fiduciary duty, (3) any action asserting a claim against us or any director, officer, employee or agent of the Company arising pursuant to any provision of the DGCL, our certificate of incorporation or our bylaws, (4) any action to interpret, apply, enforce or determine the validity of our certificate of incorporation or bylaws, (5) any action asserting a claim against us or any director, officer, employee or agent governed by the internal affairs doctrine or (6) any action asserting an “internal corporate claim” as that term is defined in Section 115 of the DGCL; provided that for the avoidance of doubt, the forum selection provision that identifies the Court of Chancery of the State of Delaware as the exclusive forum for certain litigation, including any “derivative action”, does not apply to suits to enforce a duty or liability created by Securities Act, the Exchange Act or any other claim for which the federal courts have exclusive jurisdiction. Our certificate of incorporation also provides that, unless we consent in writing to the selection of an alternative forum, the federal district courts of the United States shall be the exclusive forum for the resolution of any complaint asserting a cause of action arising under the Securities Act. Our certificate of incorporation further provides that any person or entity purchasing or otherwise acquiring any interest in shares of our capital stock is deemed to have notice of and consented to the provisions of our certificate of incorporation described above. The forum selection clause in our certificate of incorporation may have the effect of discouraging lawsuits against us or our directors and officers and may limit our shareholders’ ability to obtain a favorable judicial forum for disputes with us. Alternatively, if a court were to find the choice of forum provision contained in our amended and restated certificate of incorporation to be inapplicable or unenforceable, we may incur additional costs associated with resolving such action in other jurisdictions, which could adversely affect our business, financial condition and results of operations.
Our operating results and stock price may be volatile, and the market price of our common stock may drop below the price you paid for our common stock.
Our quarterly operating results are likely to fluctuate in the future. In addition, securities markets worldwide have experienced, and are likely to continue to experience, significant price and volume fluctuations. This market volatility, as well as general economic, market or political conditions, could subject the market price of our shares to wide price fluctuations regardless of our operating performance. Our operating results and the trading price of our shares may fluctuate in response to various factors, including the factors mentioned throughout this section.
A significant portion of our total outstanding shares may be sold into the market in the near future. This could cause the market price of our common stock to drop significantly, even if our business is doing well.
Sales of a substantial number of shares of our common stock in the public market could occur at any time. These sales, or the perception in the market that the holders of a large number of shares intend to sell shares, could reduce the market price of our common stock.stock. We currently have 131,121,028135,652,249 outstanding shares of common stock based on the number of shares outstanding as of February 28, 2022.29, 2024. The marketmarket price of our stock could decline if the holders of shares sell them or are perceived by the market as intending to sell them.
Because we have no current plans to pay regular cash dividends on our common stock, you may not receive any return on investment unless you sell your common stock for a price greater than that which you paid for it.
We do not currently pay any regular cash dividends on our common stock. Any decision to declare and pay dividends in the future will be made at the discretion of our Board and will depend on, among other things, our results of operations, financial condition, cash requirements, contractual restrictions and other factors that our Board may deem relevant. In
addition, our ability to pay dividends is, and may be, limited by covenants of existing and any future outstanding indebtedness we or our subsidiaries incur, including under the credit agreements governing our credit facilities. Therefore, any return on investment in our common stock is solely dependent upon the appreciation of the price of our common stock on the open market, which may not occur.
If securities or industry analysts do not publish research or reports about our business, if they adversely change their recommendations regarding our shares or if our results of operations do not meet their expectations, our stock price and trading volume could decline.
The trading market for our shares is influenced by the research and reports that industry or securities analysts publish about us or our business. We do not have any control over these analysts. If one or more of these analysts cease coverage of us or fail to publish reports on us regularly, we could lose visibility in the financial markets, which in turn could cause our stock price or trading volume to decline.
Moreover,Analysts who cover our stock have issued adverse reports with respect to our stock in the past and if
one or more of theadditional analysts who cover us downgrade our stock or if our results of operations do not meet their expectations, our stock price could decline.
We may issue shares of preferred stock in the future, which could make it difficult for another company to acquire us or could otherwise adversely affect holders of our common stock, which could depress the price of our common stock.
Our certificate of incorporation authorizes us to issue one or more series of preferred stock. Our Board has the authority to determine the preferences, limitations and relative rights of the shares of preferred stock and to fix the number of shares constituting any series and the designation of such series, without any further vote or action by our shareholders. Our preferred stock could be issued with voting, liquidation, dividend and other rights superior to the rights of our common stock. The potential issuance of preferred stock may delay or prevent a change in control of us, discouraging bids for our common stock at a premium to the market price, and materially adversely affect the market price and the voting and other rights of the holders of our common stock.
ITEM
1B:1B. Unresolved Staff Comments
ITEM 2:1C. Cybersecurity
Our Board is actively involved in oversight of the Company’s risk management program, and cybersecurity represents an important component of enterprise risk management (“ERM”). The Company’s cybersecurity policies, standards, processes and practices are fully integrated into the Company’s risk management program and are based on recognized frameworks established by the National Institute of Standards and Technology, the International Organization for Standardization and other applicable industry standards and intended to comply with applicable laws governing the use and protection of data, including HIPAA. In general, the Company seeks to address cybersecurity risks by focusing on preserving the confidentiality, integrity, and availability of the information that the Company collects and by aiming to identify, prevent and mitigate cybersecurity threats and respond to cybersecurity incidents when they occur.
The Company’s cybersecurity program is focused on the following key areas:
•Governance: As discussed in more detail below, the Board’s oversight of cybersecurity risk management is supported by the Audit Committee, which regularly engages with the Company’s risk management function, the Company’s Chief Information Officer (“CIO”), Chief Information Security Officer (“CISO”) and other members of management.
•Collaborative Approach: The Company has implemented a wide-ranging approach to identifying, preventing and mitigating cybersecurity threats and incidents, while also implementing controls and procedures that provide for the prompt escalation of cybersecurity incidents so that decisions regarding the public disclosure and reporting of such incidents can be made by management in a timely manner.
•Technical Safeguards: The Company deploys technical safeguards that are designed to protect the Company’s information systems from cybersecurity threats, including firewalls, intrusion prevention and detection systems, anti-malware functionality and access controls, which are evaluated and improved through vulnerability assessments and cybersecurity threat intelligence.
•Incident Response and Recovery Planning: The Company has established and maintains an incident response and recovery plan that addresses the Company’s response to a cybersecurity incident, and such plan is tested and evaluated on a regular basis.
•Third-Party Risk Management: The Company employs a risk-based approach to identify and oversee cybersecurity risks presented by third parties, including vendors, service providers and other external users of the Company’s systems, as well as the systems of third parties that could adversely impact our business in the event of a cybersecurity incident affecting those third-party systems. The Company’s methods for managing third-party
cybersecurity risk include reliance on contractual clauses, periodic due diligence, audits by third parties, and vulnerability testing.
•Education and Awareness: The Company provides biannual training for personnel regarding information security, privacy, and compliance.
The Company engages in the periodic assessment and testing of the Company’s policies, standards, processes and practices that are designed to address cybersecurity threats and incidents. These efforts include a wide range of activities, including audits, assessments, tabletop exercises, vulnerability testing and other exercises focused on evaluating the effectiveness of our cybersecurity measures and planning. The Company regularly engages third parties to perform assessments on our cybersecurity measures, including information security maturity assessments, audits and independent reviews of our information security control environment and operating effectiveness. The results of such assessments, audits and reviews are reported to the Audit Committee and the Board, and the Company endeavors to adjust its cybersecurity policies, standards, processes and practices based on the information provided by these assessments, audits and reviews.
The Board oversees the Company’s ERM process, including the management of risks arising from cybersecurity threats in coordination with the Audit Committee and regularly discusses the approach to cybersecurity risk management with management, including the Company's CIO and CISO. The Board and the Audit Committee each receive quarterly presentations and reports on cybersecurity risks, which address a wide range of topics including recent developments, evolving standards, vulnerability assessments, third-party reviews, the threat environment, technological trends and information security considerations arising with respect to the Company’s peers and vendors. The Board and the Audit Committee also receive prompt and timely information regarding cybersecurity incidents that may meet company-established reporting thresholds, as well as ongoing updates regarding such incidents through resolution.
The Company’s CISO, in coordination with our Chief Executive Officer, Chief Financial Officer, CIO, General Counsel and Chief Compliance Officer, works collaboratively across the Company to implement the Company’s cybersecurity program, to protect the Company’s information systems from cybersecurity threats, and to promptly respond to cybersecurity incidents in accordance with the Company’s incident response and recovery plans. The Company relies on the expertise of its cybersecurity team to address cybersecurity threats and to respond to cybersecurity incidents. Through ongoing communications with the cybersecurity team and key security vendor partners, the CIO and CISO monitor the prevention, detection, mitigation and remediation of cybersecurity threats and incidents in real time.
The CIO has served in various roles in information technology for over 25 years, including serving as the Chief Information Officer and in a variety of senior technology roles at public companies. The CISO has served in various roles in information technology and information security for over 30 years, including previously serving as the Chief Information Security Officer of a large public company in the banking industry. In addition, the CISO held executive roles in information technology and cyber security development for the U.S. Department of Defense for over 20 years. The CISO holds a graduate degree in information and communication sciences and has attained the professional certification of Certified Information Systems Security Professional ("CISSP").
During the fiscal year ended December 31, 2023, we did not identify risks from cybersecurity threats, including as a result of previous cybersecurity incidents, that have materially affected or are not reasonably likely to materially affect the Company, including its business strategy, results of operations or financial condition. However, there is no guarantee that a future cybersecurity incident would not materially affect our business. For more information about the cybersecurity risks we face, see the risk factor entitled “Any failure of our management information systems, including as a result of a cybersecurity event or other system breach, could harm our business and operating results” under Item 1A., “Risk Factors” of this Form 10-K.
As of December 31, 2021,2023, we operated approximately 150 full-service service centers nationwide, seven Centers of Excellence, and four manufacturing facilities, all of which are leased. The average square footage of our non-corporate locations is approximately 17,000 square feet. Our corporatecorporate office is located at a 55,19775,978 square foot leased facility in a suburb of Minneapolis,Eden Prairie, Minnesota.
ITEM
3:3. Legal Proceedings
The Company, in the ordinary course of business, is subject to liability claims related to employees and the equipment that it rents and services. Asserted claims are subject to many uncertainties and the outcome of individual matters is not
predictable. While the ultimate resolution of these actions may have an impact on the Company’s financial results for a particular reporting period, management believes that any such resolution would not have a material adverse effect on the financial position, results of operations or cash flows of the Company and the chance of a negative outcome on outstanding litigation is considered remote.
ITEM
4:4. Mine Safety Disclosures
Not applicable.
ITEM
5:5. Market for Registrant’s Common Equity, Related Stockholder Matters and Issuer Purchases of Equity Securities
Market Information for our Common Stock
Our common stock has been listed on the New York Stock Exchange under the symbol "AGTI" since April 23, 2021.
We have not historically paid dividends
on our common stock and do not intend to pay any dividends in the future. Any future determination to pay dividends will be at the discretion of our Board of Directors and will depend on then existing conditions, including our operating results, financial condition, contractual restrictions, capital requirements, business prospects and other factors that our Board of Directors may deem relevant.
Holders of our Common Stock
As of February 28, 2022,29, 2024, there were approximately 1511 holders of record of our common stock. The actual number of holders of common stock is greater than this number of record holders and includes stockholders who are beneficial owners but whose shares are held in street name by brokers and nominees. The number of holders of record also does not include stockholdersstockholders whose shares may be held in trust by other entities.
Recent Sales of Unregistered Securities
There were no unregistered sales of equity securities during the year ended December 31, 2021, except2023.
Share Repurchase Program
The following table shows information with respect to purchases of our Common Stock made during the three months ended December 31, 2023 by us or any of our “affiliated purchasers” as previously reporteddefined in Rule 10b-18(a)(3) under the Exchange Act:
44
| | | | | | | | | | | | | | | | | | | | | | | | | | |
| Period | | Total Number of Shares Repurchased (1) | | Average Price Paid Per Share (1) | | Total Number of Shares Purchased as Part of Publicly Announced Plans (1) | | Maximum Dollar Value of Shares that May Yet Be Purchased Under the Plans at Period End (in thousands) (1) |
| October 1-31 | | — | | | $ | — | | | — | | | $ | 46,247 | |
| November 1-30 | | — | | | — | | | — | | | 46,247 | |
| December 1-31 | | — | | | — | | | — | | | 46,247 | |
| Total | | — | | | $ | — | | | — | | | $ | 46,247 | |
(1)On August 21, 2023, our Board of Directors approved a share repurchase program, pursuant to which, the Company is authorized to repurchase up to $50 million of shares of the Company’s common stock (exclusive of any fees, commissions or other expenses related to such repurchases), over a 12-month period (the “Repurchase Plan”). Share repurchases may be made from time to time, on the open market, through privately negotiated transactions, through an accelerated share repurchase, or in any other manner permitted by the applicable federal and state securities laws and regulations. There is no minimum number of shares, if any, that the Company is required to repurchase and the Repurchase Plan may be suspended or discontinued at any time without prior notice.
This performance graph shall not be deemed “soliciting material” or to be “filed” with the SEC for purposes of Section 18 of the Exchange Act, or otherwise subject to the liabilities under that Section, and shall not be deemed to be incorporated by reference into any filing of Agiliti, Inc. under the Securities Act, or the Exchange Act.
The following graph compares the cumulative total return to stockholders on our common stock relative to the cumulative total returns of the
Standard & Poor’s 500 Index, (“S&P 500”), S&P Mid-Cap Index (“S&P Mid-Cap”)
, and the
S&PStandard & Poor’s 500 Healthcare & Services Index (“S&P Healthcare Index”). An investment of $100 (with reinvestment of all dividends) is assumed to have been made in our common stock and in each index on April 23, 2021, the date our common stock began trading on the NYSE, and its relative performance is tracked through December 31,
2021.2023. The returns shown
within the graph and table below are based on historical results and are not intended to suggest future performance.
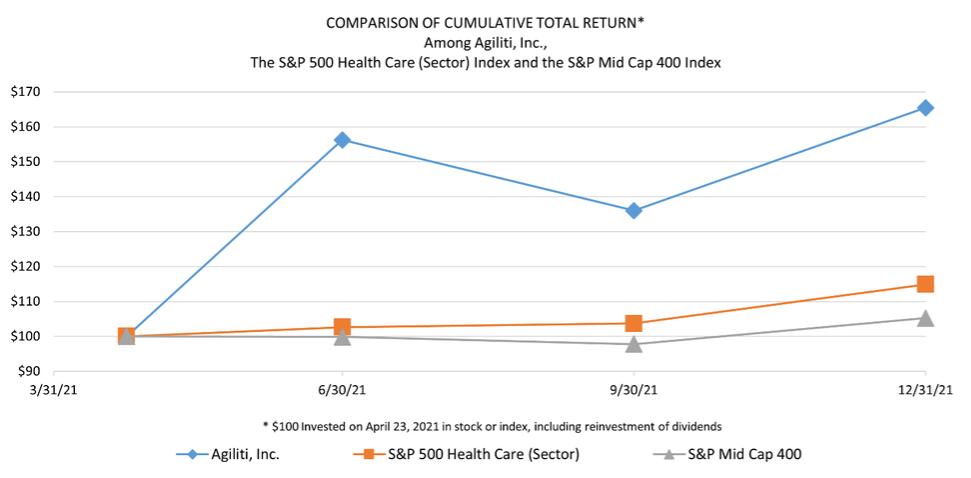
| | | | | | | | | | | | |
| | 2021 |
Index | | | Apr. 23 | | | Jun. 30 | | | Sep. 30 | | | Dec. 31 |
Agiliti, Inc. | | $ | 100 | | $ | 156 | | $ | 136 | | $ | 165 |
S&P 500 Health Care (Sector) | | | 100 | | | 103 | | | 104 | | | 115 |
S&P Mid Cap 400 | | | 100 | | | 100 | | | 98 | | | 105 |
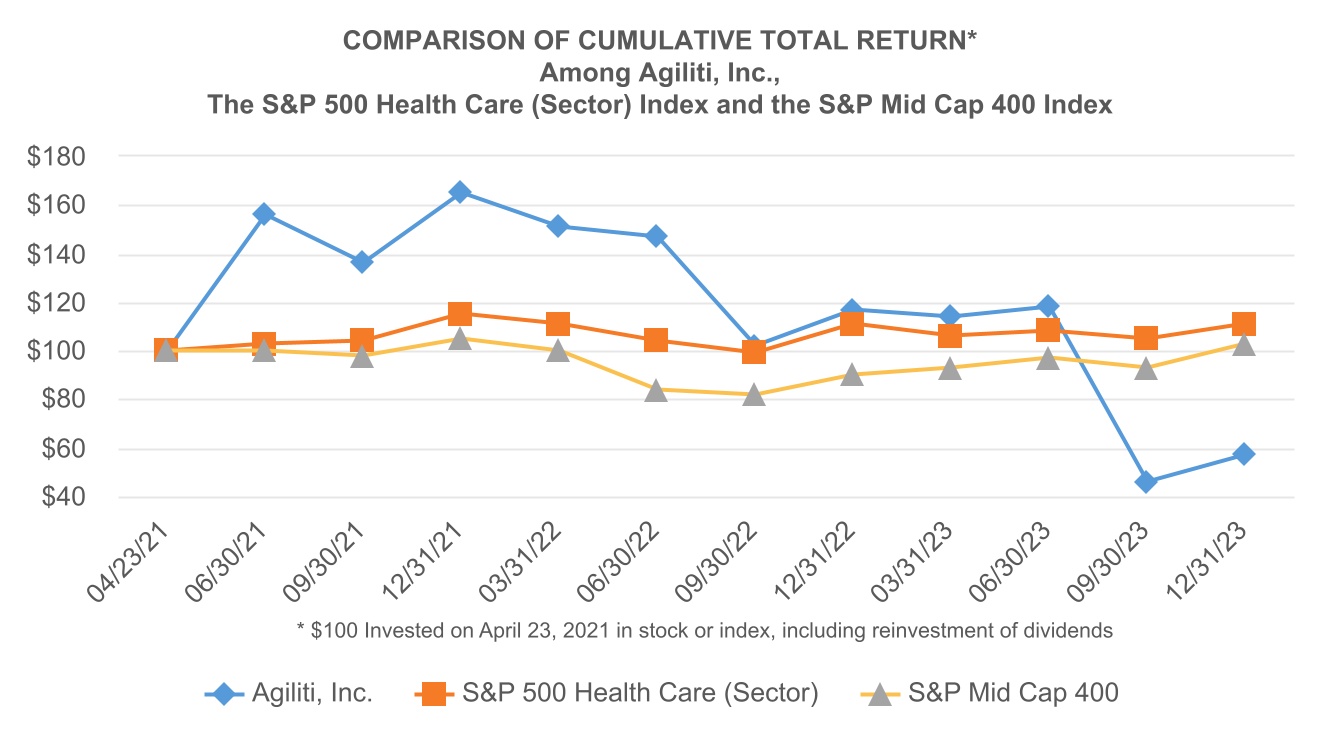
| | | | | | | | | | | | | | | | | | | | | | | | | | |
| | 2023 |
| Index | | Mar 31. | | Jun 30. | | Sep 30. | | Dec 31. |
| Agiliti, Inc. | | $ | 114 | | $ | 118 | | $ | 46 | | $ | 57 |
| S&P 500 Health Care (Sector) | | 106 | | 108 | | 105 | | 111 |
| S&P Mid Cap 400 | | 93 | | 97 | | 93 | | 103 |
ITEM
6: Selected Financial Data[Reserved]
6. [Reserved]
Not applicable.
ITEM
7:7. Management’s Discussion and Analysis of Financial Condition and Results of Operations
The following discussion and analysis summarizes the significant factors affecting the consolidated operating results, financial condition, liquidity and cash flows of our company as of and for the periods presented below. The following discussion and analysis should be read in conjunction with our consolidated financial statements and the related notes thereto included elsewhere in this Annual Report on Form 10-K. In addition to historical consolidated financial information, the following discussion contains forward-looking statements that reflect our plans, estimates, and beliefs. Our actual results could differ materially from those discussed in the forward-looking statements. You should review the
sections titled “Note Regarding Forward-Looking Statements” for a discussion of forward-looking statements as well as in Part I, Item 1A,1A., “Risk Factors” for a discussion of factors that could cause actual results to differ materially from the results described in or implied by the forward-looking statements contained in the following discussion and analysis and elsewhere in this Annual Report on Form 10-K. Unless otherwise specified, the terms “we”, “our”, “us” and the “Company” refer to Agiliti, Inc. and, where appropriate, its consolidated subsidiaries.
We believe we are one of the leading experts in the management, maintenance and mobilization of mission-critical, regulated, reusable medical devices. We offer healthcare providers a comprehensive suite of medical equipment management and service solutions that help reduce capital and operating expenses, optimize medical equipment utilization, reduce waste, enhance staff productivity, and bolster patient safety.
We commenced operations in 1939, originally incorporated in Minnesota in 1954 and reincorporated in Delaware in 2001.
In our
more than 8085 years of experience ensuring healthcare providers have high-quality, expertly maintained equipment to serve their patients, we’ve built an at-scale, strong nationwide operating footprint. This service and logistics infrastructure positions us to reach customers across the entire healthcare continuum—from individual facilities to the largest and most complex healthcare systems. Likewise, our ability to rapidly mobilize, track, repair and redeploy equipment during times of peak need or emergent events has made us a service provider of choice for city, state and federal governments to manage emergency equipment stockpiles.
Trends and Uncertainties Affecting our Business
Our expected results may not be achieved and actual results may differ materially from our expectations. This may be a result of various trends and uncertainties, including, but not limited to:
| ● | the status of the economy, including supply chain delays affecting our medical equipment manufacturers and the labor shortage; |
| ● | the status of capital markets, including prevailing interest rates; |
| ● | changes in financing terms; |
| ● | fluctuating census and patient acuity; |
| ● | promulgation of new safety laws and regulations, or changes in or re-interpretations of existing safety laws and regulations with respect to the medical equipment our customers use; |
| ● | acquisitions, both the successful integration of recent acquisitions and completion of future attractive acquisitions; |
| ● | re-negotiations of contracts critical to our revenue; |
| ● | changes in federal, state and local legislation, including healthcare and tax reformation; and |
| ● | the duration, spread and severity of the COVID-19 outbreak. |
•the status of the economy, including supply chain delays affecting our medical equipment manufacturers and the labor shortage;
•the status of capital markets, including prevailing interest rates;
•changes in financing terms;
•fluctuating census and patient acuity;
•promulgation of new safety laws and regulations, or changes in or re-interpretations of existing safety laws and regulations with respect to the medical equipment our customers use;
•acquisitions, both the successful integration of recent acquisitions and completion of future attractive acquisitions;
•re-negotiations of contracts critical to our revenue; and
•changes in federal, state and local legislation, including healthcare and tax reformation.
We regularly monitor the economic and other factors listed above. We develop strategic and tactical plans designed to improve performance and maximize our competitive position. Our ability to achieve our financial objectives is dependent upon our ability to effectively execute these plans and to appropriately respond to emerging economic and company-specific trends.
Impact of COVID-19 on our Business
Health and Safety
From the earliest signs of the outbreak, we have taken proactive action to protect the health and safety of our employees, customers, partners and suppliers. We enacted safety measures in all of our sites, including implementing social distancing protocols, requiring working from home for those employees that do not need to be physically present to perform their work, suspending travel, implementing temperature checks at the entrances to our facilities, extensively and
Global Economic Conditions
frequently disinfecting our workspacesglobal supply chain disruptions, and providing masks to those employees who must be physically present. We expect to continue to implement these measures until we determine that the COVID-19 pandemic is adequately contained for purposes of our business,increased inflation. Economic and we may take further actions as government authorities require or recommend or as we determine to becapital market conditions both in the best interestsU.S. and worldwide, have been volatile in the past and at times have adversely affected our access to capital and increased the cost of capital. The capital and credit markets may not be available to support future capital raising activity on favorable terms. If economic conditions decline, our employees, customers, partnersfuture cost of equity or debt capital and suppliers.
Operations
As a result ofaccess to the COVID-19 pandemic, governmental authorities have implemented and are continuing to implement numerous and constantly evolving measures to try to contain the virus, such as travel bans and restrictions, limits on gatherings, quarantines, shelter-in-place orders and business shutdowns. Measures providing for business shutdowns generally exclude certain essential services, and those essential services commonly include critical infrastructure and the businesses that support that critical infrastructure. While all of our facilities currently remain operational, these measures have impacted and may further impact our workforce and operations, as well as those of our customers, vendors and suppliers. In connection with the COVID-19 pandemic, we have experienced limited absenteeism from those employees who are required to be on-site to perform their jobs, and we do not currently expect that our operations willcapital markets could be adversely affectedaffected. Changes in economic conditions, supply chain constraints, logistics challenges, labor shortages, and steps taken by significant absenteeism.
Liquidity
Although there is uncertainty relatedgovernments and central banks including stimulus and spending programs, have led to higher inflation, which has led to an increase in costs and has caused changes in fiscal and monetary policy, including increased interest rates. Our operating results could be materially impacted by further changes to the impact of the recent COVID-19, including new variants, on our future results, we believe our business model, our current cash reservesmacroeconomic environment and available borrowings under our Revolving Credit Facility leave us well-positioned to manage our business through this crisis. We believe our existing balances of cash and cash equivalents and our currently anticipated operating cash flows will be sufficient to meet our cash needs arising in the ordinary course of business for the next twelve months and the foreseeable future.
We continue to monitor the rapidly evolving situation and guidance from federal, state and local public health authorities and may take additional actions based on their recommendations. In these circumstances, there may be developments outside our control requiring us to adjust our operating plan. As such, given the dynamic nature of this situation, we cannot reasonably estimate the impacts of COVID-19 on our financial condition, results of operations or cash flows in the future.
resulting economic conditions.
Principles of Consolidation
The consolidated financial statements present the consolidated financial information for Agiliti and its subsidiaries and the consolidated financial information for Agiliti Health, Inc. for the period of January 1 through January 3, 2019. Agiliti is the successor of Agiliti Health, Inc. for financial reporting purposes.subsidiaries. In addition, in accordance with guidance issued by the Financial Accounting Standards Board, we have accounted for our equity investments in entities in which we are the primary beneficiary under the full consolidation method. All intercompany transactions and balances have been eliminated through consolidation. As the primary beneficiary, we consolidate the limited liability companies referred to in Note 13, Principles
Critical Accounting Policies and Estimates
The preparation of consolidated financial statements in conformity with GAAPgenerally accepted accounting principles in the United States of America (“GAAP”) requires us to make decisions that impact the reported amounts of assets, liabilities, revenue and expenses and the related disclosures. Such decisions include the selection of the appropriate accounting principles to be applied and the assumptions on which to base accounting estimates. In reaching such decisions, we apply judgments based on our understanding and analysis of relevant circumstances, historical experience and actuarial valuations. Actual amounts could differ from those estimated at the time the consolidated financial statements are prepared. Some of our critical accounting policies require us to make difficult, subjective or complex judgments or estimates. An accounting estimate is considered to be critical if it meets both of the following criteria: (i) the estimate requires
assumptions about matters that are highly uncertain at the time the accounting estimate is made, and (ii) different estimates reasonably could have been used, or changes in the estimate that are reasonably likely to occur from period to period may have a material impact on the presentation of our financial condition, changes in financial condition or results of operations. Our most critical accounting policies and estimates include the following:
| ● | fair value measurements in business combinations; and |
| ● | valuation of long-lived assets, including goodwill and definite-lived intangible assets. |
•revenue recognition;
•fair value measurements in business combinations including the recoverability and valuation of long-lived assets, goodwill, and definite-lived intangibles; and
•interest rate swaps.
We recognize revenue when we satisfy performance obligations by transferringin accordance with Accounting Standards Codification (ASC) 606, Revenue from Contracts with Customers. Revenue is recognized upon transfer of control of promised goodsproducts or services to customers in an amount that reflects the consideration we expect to receive in exchange for those goodsproducts or services.Customer arrangements typically Many of our customers have multiple contracts and have revenue reported in multiple service lines. Our contracts may include a base level of services provided for a stated period of time, optional services provided upon request, or products. Each of these products and services are generally capable of being distinct and are accounted for as separate performance obligations to provide equipment solutions, clinical engineering and/or on-site equipment managed services on a per use and/or over time basis. Consideration paid by the customerobligations.
The price for each performance obligation is billed withinstated in the monthcustomer contract and is based upon a price that would be charged to a customer if the product or service were sold on a standalone basis (the list price). Any discount from the list price provided to a customer for a product or service is performed,allocated among the performance obligations based upon their individual standalone selling prices.
Service revenue is typically recognized over time as the services are provided. When services are provided for a stated period of time, revenue is generally recognized ratably over the period services are provided. In certain circumstance, optional services may be provided on a time and contractual pricesmaterials basis. In these circumstances, revenue is recognized in an amount that corresponds to the actual time and expense incurred. Product revenue is recognized when we transfer control of a good, which occurs at a point in time.
Revenue is recognized net of allowances for estimated rebates and group purchasing organization ("GPO") fees, which are established
within our customer arrangements thatat the time of sale. Adjustments are
representative of the stand-alone selling price.made to these allowances at each reporting period. Taxes assessed by a governmental authority that are both imposed on and concurrent with a specific revenue-producing transaction, that
we collectare collected by us from a customer, are excluded from revenue.
Our performance obligations that are satisfied at a point in time are recognized when the service is performed or equipment is delivered to the customer. For certain performance obligations satisfied over time, we use a straight-line method to recognize revenue ratably over the contract period, as this coincides with our stand-ready performance obligation under the contract.
We account for the acquisition of a business in accordance with the accounting standards codification guidance for business combinations, whereby the total consideration transferred is allocated to the assets acquired and liabilities assumed, including amounts attributable to non-controlling interests, when applicable, based on their respective estimated fair values as of the date of acquisition. Goodwill represents the excess of consideration transferred over the estimated fair value of the net assets acquired in a business combination.
Assigning estimated fair values to the assets acquired and liabilities assumed requires the use of significant estimates, judgments, inputs and assumptions regarding the fair value of the assets and liabilities. Such significant estimates, judgments, inputs and assumptions may include, but would not be limited to, selection of an appropriate valuation model,
applying an appropriate discount rate, assumptions related to projected financial information and estimates of customer attrition.
Derivative Financial Instruments
We have an interest rate swap agreement which is used as a derivative financial instrument to manage our interest rate exposure. We do not use financial instruments for trading or other speculative purposes.
ASC 815, Derivatives and Hedging, establishes accounting and reporting standards requiring that derivative instruments be recorded on the balance sheet as either an asset or liability measured at fair value. The standard requires that changes in the derivative’s fair value be recognized currently in earnings unless specific hedge accounting criteria are met. If hedge accounting criteria are met, the changes in a derivative’s fair value (for a cash flow hedge) are deferred in stockholders’ equity as a component of accumulated other comprehensive loss. These deferred gains and losses are recognized as income in the period in which hedged cash flows occur. The ineffective portions of hedge returns are recognized as earnings.
Recoverability and Valuation of Long-Lived Assets Including Goodwill and Indefinite Lived Intangible Assets
For long-lived assets and definite lived intangible assets, impairment is evaluated when a triggering event is indicated. If there is an indication of impairment, an evaluation of undiscounted cash flow versus carrying
valueamount is conducted. If necessary, an impairment is measured based on the estimated fair value of the long-lived or amortizable asset in comparison to its carrying
value.amount. This evaluation is conducted at the lowest level of identifiable cash flows. Our amortizable intangible assets consist of customer relationships,
non-compete agreements, trade names, and
non-compete agreements.patents. For property and equipment, primarily movable medical equipment, we continuously monitor individual makes and models for potential triggering events such as product recalls or technological obsolescence.
For goodwill we review for impairment annually at the reporting unit level and upon the occurrence of certain events that might indicate the asset may be impaired. We operate under one reporting unit and do not aggregate any components into our one reporting unit. A qualitative review is conducted to determine whether it is more likely than not that the fair value is less than its carrying amount. If it is determined that it is more likely than not that the carrying valueamount is greater than the fair value of the asset, a quantitative impairment test is performed. We then review goodwill for
To perform the quantitative impairment by comparingtest, we compare the fair value of a reporting unit withto its carrying amount, and recognize an impairment charge forincluding goodwill. If the fair value of a reporting unit exceeds its carrying amount, by whichgoodwill of the reporting unit is not impaired. If the carrying amount of the reporting unit, including goodwill, exceeds its fair value, a goodwill impairment loss is recognized in an amount equal to that excess.
Determining fair value requires the exercise of significant judgments, including the amount and timing of expected future cash flows, long-term growth rates, terminal value, discount rates, and relevant comparable public company earnings multiples and relevant transaction multiples. We estimate the fair value of the reporting unit using an income approach that utilizes a discounted cash flow model and a market approach that utilizes the guideline public company method. Each of the valuation methods were weighted by accounting for the relative merits of each method and considered, among other things, the reliability of the valuation methods and the inputs used in the methods. Management’s future financial projections used in the discounted cash flow model included organic net sales growth and net sales growth through new customer and product channels as well as continued operating efficiencies in future periods.
We elected to perform a quantitative goodwill impairment test as of December 31, 2023. The fair value was approximately 7% greater than its carrying amount, thus no impairment was recognized. Due to the many variables inherent in the estimation of a reporting unit’s fair value. We operate under onevalue and the relative size of our recorded goodwill, differences in assumptions could have a material effect on the estimated fair value of our reporting unit
and could result in a goodwill impairment charge in a future period.and do not aggregate any components into our one reporting unit. There are no known trends or uncertainties that we reasonably expect will have an unfavorable impact on revenue or income from operations. We have not performed a quantitative impairment test since January 4, 2019, the date of the Business Combination, in which the balance sheet was fair valued.
Adjusted EBITDA
EBITDA is defined as earnings attributable to Agiliti, Inc. before interest expense, income taxes, depreciation and amortization. Adjusted Earnings Before Interest, Taxes, Depreciation and Amortization (“Adjusted EBITDA”) is defined as EBITDA excluding non-cash share-based compensation expense, management fees and other non-recurring gains, expenses or losses, transaction costs, remeasurement of tax receivable agreement and loss on extinguishment / modification of debt. In addition to using EBITDA and Adjusted EBITDA internally as measures of operational performance, we
disclose them externally to assist analysts, investors and lenders in their comparisons of operational performance, valuation and debt capacity across companies with differing capital, tax and legal structures. We believe the investment community frequently uses EBITDA and Adjusted EBITDA in the evaluation of similarly situated companies. Adjusted EBITDA is also used by the Company as a factor to determine the total amount of incentive compensation to be awarded to executive officers and other employees. EBITDA and Adjusted EBITDA, however, are not measures of financial performance under GAAP and should not be considered as alternatives to, or more meaningful than, net income as measures of operating performance or to cash flows from operating, investing or financing activities or as measures of liquidity. Since EBITDA and Adjusted EBITDA are not measures determined in accordance with GAAP and are thus susceptible to varying interpretations and calculations, EBITDA and Adjusted EBITDA, as presented, may not be comparable to other similarly titled measures of other companies. EBITDA and Adjusted EBITDA do not represent amounts of funds that are available for management’s discretionary use. EBITDA and Adjusted EBITDA presented below may not be the same as EBITDA and Adjusted EBITDA calculations as defined in the First Lien Credit Facilities.
The following
section summarizes the consolidated results of operations for the years ended December 31, 2023 and 2022. The discussion
addresses: | ● | Our financial condition as of December 31, 2021 and 2020; |
| ● | the results of operations for the years ended December 31, 2021 and 2020; |
| ● | In accordance with Item 303 of Regulation S-K, the Company has excluded the discussion of 2019 results in “Management's Discussion and Analysis of Financial Condition and Results of Operations”, as this discussion can be found in our Registration Statement on Form S-1, filed with the SEC on file no. 333-253947, under "Management's Discussion and Analysis of Financial Condition and Results of Operations".Results of Operations for the year ended December 31, 2021 compared to the year ended December 31, 2020 |
of the consolidated results of operation for the years ended December 31, 2022 and 2021 are presented within our Annual Report on Form 10-K for the year ended December 31, 2022 under Item 7. "Management’s Discussion and Analysis of Financial Condition and Results of Operations."The following table presents our results of operations for the periods indicated:
| | | | | | | | | | | | | | | | | | |
| | Year Ended | | | | | | |
| | December 31, | | Change |
(in thousands) | | 2021 | | 2020 | | $ | | % | |
| | (Successor) | | (Successor) | | | | | | |
Consolidated Statement of Operations Data: | | | | | % of total revenue | | | | | % of total revenue | | | | | | |
Revenue | | $ | 1,038,690 | | 100.0 | % | | $ | 773,312 | | 100.0 | % | | $ | 265,378 | | 34.3 | % |
Cost of revenue | | | 614,073 | | 59.1 | | | | 486,965 | | 63.0 | | | | 127,108 | | 26.1 | |
Gross margin | | | 424,617 | | 40.9 | | | | 286,347 | | 37.0 | | | | 138,270 | | 48.3 | |
Selling, general and administrative | | | 320,387 | | 30.8 | | | | 250,289 | | 32.4 | | | | 70,098 | | 28.0 | |
Operating income | | | 104,230 | | 10.1 | | | | 36,058 | | 4.6 | | | | 68,172 | | 189.1 | |
Loss on the extinguishment of debt | | | 10,116 | | 1.0 | | | | — | | — | | | | 10,116 | | — | |
Interest expense | | | 53,514 | | 5.2 | | | | 61,530 | | 8.0 | | | | (8,016) | | (13.0) | |
Income (loss) before income taxes and noncontrolling interest | | | 40,600 | | 3.9 | | | | (25,472) | | (3.4) | | | | 76,188 | | * | |
Income tax expense (benefit) | | | 16,433 | | 1.6 | | | | (3,234) | | (0.4) | | | | 19,667 | | * | |
Consolidated net income (loss) | | $ | 24,167 | | 2.3 | | | | (22,238) | | (3.0) | | | $ | 56,521 | | * | |
* not meaningful | | | | | | | | | | | | | | | | | | |
| | | | | | | | | | | | | | | | | | | | | | | | | | | | | | | | | | | | | | |
| | Year Ended December 31, | | Change |
| (in thousands) | | 2023 | | 2022 | | $ | | % |
| Consolidated Statement of Operations | | | | % of Total Revenue | | | | % of Total Revenue | | | | |
| Revenue | | $ | 1,174,604 | | | 100.0 | % | | $ | 1,121,292 | | | 100.0 | % | | $ | 53,312 | | | 4.8 | % |
| Cost of revenue | | 770,501 | | | 65.6 | | | 690,318 | | | 61.6 | | | 80,183 | | | 11.6 | |
| Gross margin | | 404,103 | | | 34.4 | | | 430,974 | | | 38.4 | | | (26,871) | | | (6.2) | |
| Selling, general and administrative expense | | 339,312 | | | 28.9 | | | 338,988 | | | 30.2 | | | 324 | | | 0.1 | |
| Operating income | | 64,791 | | | 5.5 | | | 91,986 | | | 8.2 | | | (27,195) | | | (29.6) | |
| Loss on extinguishment / modification of debt | | 4,527 | | | 0.4 | | | 1,418 | | | 0.1 | | | 3,109 | | | 219.3 | |
| Interest expense | | 84,115 | | | 7.2 | | | 49,439 | | | 4.4 | | | 34,676 | | | 70.1 | |
| Tax indemnification expense | | — | | | — | | | 11,918 | | | 1.1 | | | (11,918) | | | N/A |
| Income (loss) before income taxes and noncontrolling interest | | (23,851) | | | (2.1) | | | 29,211 | | | 2.6 | | | (53,062) | | | N/A |
| Income tax (benefit) | | (4,732) | | | (0.4) | | | (1,232) | | | (0.1) | | | (3,500) | | | (284.1) | |
| Consolidated net income (loss) | | (19,119) | | | (1.7) | | | 30,443 | | | 2.7 | | | (49,562) | | | N/A |
| Net income attributable to noncontrolling interest | | 306 | | | — | | | 231 | | | — | | | 75 | | | 32.5 | |
| Net income (loss) attributable to Agiliti, Inc. and Subsidiaries | | $ | (19,425) | | | (1.7) | % | | $ | 30,212 | | | 2.7 | % | | $ | (49,637) | | | N/A |
The following table presents revenue by service solution for the years ended December 31,
20212023 and
2020: | | | | | | | | | | | | | | | | | | |
| | Year Ended | | | | | | |
| | December 31, | | Change |
(in thousands) | | 2021 | | 2020 | | $ | | % | |
| | (Successor) | | (Successor) | | | | | | |
Disaggregated Revenue: | | | | | % of total revenue | | | | | % of total revenue | | | | | | |
Equipment Solutions | | $ | 352,094 | | 33.9 | % | | $ | 296,267 | | 38.3 | % | | $ | 55,827 | | 18.8 | % |
Clinical Engineering | | | 384,147 | | 37.0 | | | | 256,874 | | 33.2 | | | | 127,273 | | 49.5 | |
Onsite Managed Services | | | 302,449 | | 29.1 | | | | 220,171 | | 28.5 | | | | 82,278 | | 37.4 | |
Total revenue | | $ | 1,038,690 | | 100.0 | | | $ | 773,312 | | 100.0 | | | $ | 265,378 | | 34.3 | |
2022:
| | | | | | | | | | | | | | | | | | | | | | | | | | | | | | | | | | | | | | |
| | Year Ended December 31, | | Change |
| (in thousands) | | 2023 | | 2022 | | $ | | % |
| Disaggregated Revenue: | | | | % of Total Revenue | | | | % of Total Revenue | | | | |
| Equipment Solutions | | $ | 459,797 | | | 39.1 | % | | $ | 438,682 | | | 39.1 | % | | $ | 21,115 | | | 4.8 | % |
| Clinical Engineering | | 459,013 | | | 39.1 | | | 420,685 | | | 37.5 | | | 38,328 | | | 9.1 | |
| Onsite Managed Services | | 255,794 | | | 21.8 | | | 261,925 | | | 23.4 | | | (6,131) | | | (2.3) | |
| Total revenue | | $ | 1,174,604 | | | 100.0 | % | | $ | 1,121,292 | | | 100.0 | % | | $ | 53,312 | | | 4.8 | % |
Total Revenue
Total revenue for the year ended December 31, 20212023 was $1,038.7$1,174.6 million, compared with $773.3$1,121.3 million for the year ended December 31, 2020,2022, an increase of $265.4$53.3 million or 34.3%4.8%. Equipment Solutions revenue increased 18.8%4.8% primarily driven by new business growth and a prior year acquisition, offset by lower utilization of our peak need rental equipment as compared to utilization due to the Sizewise acquisition completed on October 1, 2021 which generated 42.0 millionimpact of COVID-19 in revenue and the increased demand for surgical equipment procedures. Although difficult to determine, we estimate that the overall
favorable impact from COVID-19 within Equipment Solutions was $30 million to $40 million for the year ended December 31, 2021, and $30 million to $40 million for the year ended December 31, 2020.prior year. Clinical Engineering revenue increased 49.5%9.1% primarily due to continued strong growthnew customer growth. Onsite Managed Services revenue decreased 2.3% as a result of the Northfield acquisition completed on March 19, 2021renewal pricing and supplemental clinical engineering work related toscope of the government contract entered into in the third quarter of 2020. Onsite Managed Services revenue increased 37.4% with the majority of growth coming the government contract related to the comprehensive maintenance and management services of medical ventilator equipment.
contract.
Total cost of revenue for the year ended December 31, 20212023 was $614.1$770.5 million compared to $487.0$690.3 million for the year ended December 31, 2020,2022, an increase of $127.1$80.2 million or 26.1 %.11.6%. On a percentage of revenue basis, cost of revenue decreasedincreased from 63.0%61.6% of revenue in 20202022 to 59.1%65.6% in 2021.2023. The decreaseincrease as a percentage ofof revenue was driven primarily from revenue growth as we were able to leverage our fixed cost infrastructure resulting in our expenses growing atby a lower rate than revenue growth.mix of peak need rental placements post-COVID-19, as well as the renewal pricing and scope of the government contract.
Total gross margin for the year ended December 31, 20212023 was $424.6$404.1 million, or 40.9%34.4% of total revenue compared to $286.3431.0 million, or 37.0%38.4% of total revenue for the year ended December 31, 2020, an increase2022, a decrease of $138.3$26.9 million or 48.3%6.2%. The increasedecrease in gross margin as a percentage of revenue was primarily impacted by favorable leverage from volume growth.a lower mix of peak need rental placements as well as the renewal pricing and scope of the government contract.
Selling, General and Administrative
Selling, general, and administrative expenses for the year ended December 31,
20212023 increased by
$70.1$0.3 million, or
28.0%0.1%, to
$320.4$339.3 million as compared to the same period of
2020. The increase was primarily due to the increases in costs and amortization expense related to the Northfield acquisition, the Sizewise acquisition, the buyout fee related to the termination of an advisory services agreement (the “Advisory Services Agreement”) with Agiliti Holdco, Inc., Agiliti Health, Inc. and THL Managers VIII, LLC (the “Advisor”) of $7.0 million and an increase in payroll related costs associated with the growth of our business.2022. Selling, general and administrative expense as a percentage of total revenue was
30.8%28.9% and
32.4 %30.2% for the years ended December 31,
20212023 and
2020,2022, respectively.
The increase in total expenses was driven by severance charges related to a reduction in workforce and a charge related to the change in Chief Executive Officers totaling $5.7 million, partially offset by a reduction in acquisition costs.
Loss on extinguishment / modification of debt
Loss on Extinguishment of DebtLoss on extinguishment / modification of debt for the year ended December 31, 2021 consisted of the write-off of the unamortized deferred financing cost and debt discount of $7.42023 was $4.5 million and an additional 1% redemption price or $2.4 million relatedcompared to the repayment of our Second Lien Term Loan in April 2021 with proceeds from the IPO and the write-off of the unamortized deferred financing cost of $0.3 million related to the amendment of our Revolving Credit Facility.
Interest Expense
Interest expense decreased $8.0 million to $53.5$1.4 million for the year ended December 31, 20212022, an increase of $3.1 million. Loss on extinguishment / modification of debt for the year ended December 31, 2023 consisted of the write-off of unamortized costs and new costs incurred relating to the refinancing of the Company's First Lien Term Loan and Revolving Credit Facility. Loss on extinguishment / modification of debt for the year ended December 31, 2022 consisted of the write-off of unamortized debt discount related to the partial prepayment of our term loan.
Interest Expense
Interest expense increased $34.7 million to $84.1 million for the year ended December 31, 2023 as compared to the same period of 20202022 primarily due to higher interest rates experienced in 2023.
Tax Indemnification Expense
Tax indemnification expense decreased $11.9 million for the
repaymentyear ended December 31, 2023 as compared to the same period of
our Second Lien Term Loan with proceeds2022 due solely to a non-recurring expense from the
IPO.release of the indemnification asset in 2022 related to the Sizewise Acquisition, which occurred in 2021.
Income taxes were an expensea benefit of $16.4$4.7 million and a benefit of $3.2$1.2 million for the years ended December 31, 20212023 and 2020,2022, respectively. The increase in the income tax expense for year ended December 31, 2021benefit is primarily due to the tax-effectpretax loss in 2023 as compared to the pretax earnings in 2022 offset by the release of pre-tax income from operations plus deductions for share-based compensation, non-deductible transaction costs, nondeductible expensesthe reserve and associated interest and penalty accruals in 2022 related to executive compensation disallowed under Internal Revenue Code Section 162(m), a tax rate change and the remeasurement of the tax receivable agreement. The tax benefit for the year ended December 31, 2020 was primarily Sizewise acquisition.due to the tax-effect of pre-tax loss from operations for the period, amended state income tax filings and the remeasurement of the tax receivable agreement.
Consolidated Net Income (Loss)
Consolidated net income was $24.2 for year ended December 31, 2021.
Consolidated net loss was $22.2$19.1 million for the year ended December 31, 20202023. .Consolidated net income was $30.4 million for the year ended December 31, 2022. The increasedecrease in net income was impacted primarily by the increase in revenue.due to higher interest expense and lower gross margins.
Adjusted EBITDA was
$330.7$266.9 million and
$234.2$296.6 million for the years ended December 31,
20212023 and
2020,2022, respectively. Adjusted EBITDA for the year ended December 31,
20212023 was
higherlower than in
20202022 primarily due to
the increase in revenue.lower gross margins.
A reconciliation of net income (loss) attributable to Agiliti, Inc.
and Subsidiaries to Adjusted EBITDA is included below:
| | | | | | |
| | Year Ended |
| | December 31, |
(in thousands) | | 2021 | | 2020 |
| | (Successor) | | (Successor) |
Net income (loss) attributable to Agiliti, Inc. and Subsidiaries | | $ | 24,006 | | $ | (22,478) |
Interest expense | | | 53,514 | | | 61,530 |
Income tax expense (benefit) | | | 16,433 | | | (3,234) |
Depreciation and amortization | | | 187,963 | | | 169,241 |
EBITDA | | | 281,916 | | | 205,059 |
Non-cash share-based compensation expense | | | 13,960 | | | 10,334 |
Management and other expenses (1) | | | 7,926 | | | 671 |
Transaction costs (2) | | | 12,222 | | | 3,837 |
Tax receivable agreement remeasurement | | | 4,542 | | | 14,300 |
Loss on extinguishment of debt (3) | | | 10,116 | | | — |
Adjusted EBITDA | | $ | 330,682 | | $ | 234,201 |
| | | | | | |
Other Financial Data: | | | | | | |
Net cash provided by operating activities | | $ | 210,317 | | $ | 137,927 |
Net cash used in investing activities | | | (734,134) | | | (151,732) |
Net cash provided by financing activities | | | 391,637 | | | 220,310 |
(1) | Management and other expenses represent (a)management fees and buyout termination fee under the Advisory Services Agreement, which was terminated in connection with the initial public offering and (b) employee related non-recurring expenses |
(2) | Transaction costs represent costs associated with potential and completed mergers and acquisitions and are primarily related to the Northfield and Sizewise acquisitions for the year ended December 31, 2021. |
(3) | Loss on extinguishment of debt consists of the write-off of the unamortized deferred financing costs and debt discount and an additional 1% redemption price related to the repayment of our Second Lien Term Loan and the write-off of the unamortized deferred financing cost related to the amendment of our Revolving Credit Facility. |
52
| | | | | | | | | | | | | | |
| | Year Ended December 31, |
| (in thousands) | | 2023 | | 2022 |
| Net income (loss) attributable to Agiliti, Inc. and Subsidiaries | | $ | (19,425) | | | $ | 30,212 | |
| Interest expense | | 84,115 | | | 49,439 | |
| Income tax (benefit) (1) | | (4,732) | | | (1,232) | |
| Depreciation and amortization | | 168,841 | | | 175,764 | |
| EBITDA | | 228,799 | | | 254,183 | |
| Non-cash share-based compensation expense | | 20,186 | | | 18,775 | |
| Tax indemnification expense | | — | | | 11,918 | |
| Management and other expenses (2) | | 9,409 | | | 2,411 | |
| Transaction costs (3) | | 2,900 | | | 9,984 | |
| Tax receivable agreement remeasurement | | 1,042 | | | (2,124) | |
| Loss on extinguishment / modification of debt (4) | | 4,527 | | | 1,418 | |
| Adjusted EBITDA | | $ | 266,863 | | | $ | 296,565 | |
(1)Income tax (benefit) expense includes the $11.9 million tax benefit due to the release of the reserve and associated interest and penalties related to the Sizewise Acquisition offset in tax indemnification expense.
(2)Management and other expenses represent non-recurring expenses, including a severance charge related to the Chief Executive Officer transition and charges related to a reduction in workforce.
(3)Transaction costs represent costs associated with potential and completed mergers and acquisitions.
(4)Loss on extinguishment / modification of debt for 2023 consists of the write-off of the unamortized costs and new costs incurred in relation to the amendment of the First Lien Term Loan and Revolving Credit Facility. Loss on extinguishment / modification of debt for 2022 consists of the write-off of the unamortized debt discount related to the partial prepayment of the First Lien Term Loan.
Liquidity and Capital Resources
General
GeneralOur principal sources of liquidity are expected to be cash flows from operating activities and borrowings under our Revolving Credit Facility. Availability under our Revolving Credit Facility which provides for loans in an amountis $293.2 million as of up to $250 million.December 31, 2023. Our principal uses of liquidity will be to fund capital expenditures related to purchases of medical equipment, provide working capital, meet debt service requirements and finance our strategic plans.
We believe our existing balances of cash and cash equivalents and our currently anticipated operating cash flows will be sufficient to meet our cash needs arising in the ordinary course of business for the next twelve months and the foreseeable future. If new financing is necessary, there can be no assurance that any such financing would be available on commercially acceptable terms, or at all. To date, we have not experienced difficulty accessing the credit market; however, future volatility in the credit market may increase costs associated with issuing debt instruments or affect our ability to access those markets. In addition, it is possible that our ability to access the credit market could be limited at a time when we would like, or need to do so, which could have an adverse impact on our ability to refinance debt and/or react to changing economic and business conditions.
Net cash provided by operating activities was
$210.3$169.8 million and
$137.9$199.8 million for the years ended December 31,
20212023 and
2020,2022, respectively. Net cash provided by operating activities
during 2021 compareddecreased primarily due to
2020 was favorably impacted by our improved financial performance. Partially offsetting the increase inlower net
cash provided by operating activities was the use of cash to pay accrued compensation related to the strong 2020 operating results, payments of over $15 million on the tax receivable agreement and payments related to the deferred payroll tax provided for by part of the CARES Act. Our improved financial performance in 2021 was drivenearnings partially offset by the
34.3% increase in revenue.timing of interest payments.
Net cash used in investing activities was $734.1$83.9 million and $151.7$146.9 million for the years ended December 31, 20212023 and 2020,2022, respectively. The increasedecrease in net cash used in investing activities during 2021during 2023 was primarily due to the Northfield Acquisition completedacquisition of a surgical laser equipment solutions provider in March 2021 and the Sizewise acquisition completed in October 2021.2022.
Net cash provided byused in financing activities was $391.6$71.5 million and 220.3$121.7 million for the years ended December 31, 20212023 and 2020,2022, respectively. The increasechange in net cash provided by financing activities during 2021year-over-year was primarily due to net proceeds from issuance of common stock from the IPO.Restricted stock units and performance restricted stock units are not taxable to the employee until they have settled and underlying shares have been delivered. In connection with the IPO, settlement of vested restricted stock unit and performance restricted stock unit awards granted prior to 2021 were deferred until one year following our IPO as permittedFirst Term Loan refinancing partially offset by payments made under the 2018 Plan andtax receivable agreement in accordance with the terms of the grant agreements. As a result, shares underlying these vested restricted stock unit and performance restricted stock unit awards will be delivered on April 23, 2022 and will become taxable to the employees on that date. Upon settlement, the Company will reduce the number of shares that the employee is entitled to receive to cover the estimated income taxes and other payroll taxes. The Company will then pay the outstanding tax liability. The amount of the tax liability is dependent upon the share price at the date of settlement and, although difficult to quantify, is currently estimated to be between $15 million and $20 million. This liability will be paid in the second quarter of 2022.
2023.
First Lien Credit Facilities
On January 4, 2019, in connection with and substantially concurrent with the closing of the
business combination, Agiliti Health, Inc.Business Combination, we entered into a credit agreement (the “First Lien Credit
Facilities”Agreement”) with JPMorgan Chase Bank, N.A. as administrative agent, collateral agent, and letter of credit issuer,
Agiliti Holdco, Inc., certain subsidiaries of Agiliti Health, Inc. acting as guarantors (the “Guarantors”), and the lenders from
time to timetime-to-time party thereto.
The First Lien Credit FacilitiesAgreement originally provided for a seven-year senior secured delayed draw term loan facility in an aggregate principal amount of $660$660.0 million (the “First Lien Term Loan”) and a five-year senior secured revolving credit facility in an aggregate principal amount of $150$150.0 million (the “Revolving Loan”Credit Facility”). In February 2020, we increased
our principal First Lien Term Loan facility by $125 million and the revolving loan facility by $40 million. In October 2021 and April 2021, we further increased our principal First Lien Term Loan facility by $150 million and $200 million, respectively. All terms to the First Lien Term Loan remained the same, except these additional loans are subject to an interest rate floor of 0.75%.
The First Lien Term Loan amortizesamortized in equal quarterly installments, commencing on June 30, 2019, in an aggregate annual amount equal to 1.00% of the original principal amount of such term loan, with the balance due and payable at maturity unless prepaid prior thereto.
Borrowings
Between February 2020 and December 2022, we increased the First Lien Term Loan facility by $625.0 million and the Revolving Credit Facility by $100.0 million via five amendments, resulting in $1.285 billion of borrowings under the First Lien Term Loan and access to $250.0 million via the Revolving Credit Facilities bear interest, at Agiliti Health, Inc.’s option, atFacility as of December 31, 2022.
During the year ended December 31, 2022, we prepaid $69.1 million resulting in a rate per annum equal to an applicable margin (the “Applicable Margin”) over either (a)loss on extinguishment / modification of $1.4 million for the year ended December 31, 2022, which consisted entirely of the write-off of unamortized debt discount.
During the year ended December 31, 2021, in connection with amendments discussed above, we incurred a
base rate determined by referenceloss on extinguishment / modification of debt of $0.3 million related to the
highestwrite-off of
(1) the prime lending rate published in the Wall Street Journal, (2) the federal funds effective rate plus 1/2 of 1% and (3) the LIBOR rate for a one-month interest period, plus 1.00%, or (b) a LIBOR rate determined by reference to the LIBOR rate as set forth by the ICE Benchmark Administration for the interest period relevant to such borrowing, in each case, subject to interest rate floors.unamortized deferred financing costs.
The First Lien Credit Facilities contain a number of negative covenants that, among other things, restrict, subject to certain exceptions,
theour ability
of Agiliti Health, Inc. and the guarantors thereunder to incur additional indebtedness and guarantee indebtedness; create or incur liens; engage in mergers or consolidations; sell, transfer or otherwise dispose of assets; pay dividends and distributions or repurchase capital stock; prepay, redeem or repurchase certain indebtedness; make investments, loans and advances; enter into agreements which limit
theour ability
of Agiliti Health, Inc. and the guarantors thereunder to incur liens on assets; and enter into amendments to certain junior lien and subordinated indebtedness in a manner materially adverse to the lenders.
Solely with respect to the Revolving
Loan, commencing with the fiscal quarter ending June 30, 2019, the Company isCredit Facility, we are required to maintain a leverage ratio not to exceed 7:1 when the aggregate principal amount of outstanding Revolving Loans and drawn Letters of Credit, on the last day of the most recent fiscal quarter, exceeds 35% of the total revolving credit commitments.
Revolving Credit Facility Amendment
On April 27, 2021, the Company6, 2023, we entered into Amendment No. 4 (the “Amendment”6 (“Amendment No. 6”) to the First Lien Credit Agreement. Pursuant toAgreement, with JPMorgan Chase Bank, N.A., as administrative agent and collateral agent, and the lenders.
Amendment No. 6, among other things, provided for (i) a refinancing of the existing Revolving Loan was terminatedCredit Facility through a replacement of the existing $250.0 million Revolving Credit Facility with a $300.0 million revolving credit facility; (ii) extends the maturity of the Revolving Credit Facility to April 6, 2028; and (iii) updates the benchmark interest rate provisions to replace the London Interbank Offered Rate ("LIBOR") with a term rate based on the Secured Overnight Financing Rate (“Term SOFR”), for revolving loans extended in dollars, a term rate based on the Euro InterBank Offered Rate (“Adjusted EURIBOR”), for revolving loans extended in euros, and a newdaily rate (“Daily Simple RFR”) based on the Sterling Overnight Index Average (“SONIA”), for revolving credit facility was incurredloans extended in sterling, as the reference rates for purposes of calculating interest under the First Lien Credit Agreement in an aggregate principle amount of $250.0 million (the “New Revolving Credit Facility”); (ii)Facility.
Following Amendment No. 6, the interest rate margin for borrowings under the New Revolving Credit Facility wasare set at LIBOR Adjusted EURIBOR, Daily Simple RFR or Term SOFR plus 2.75%, with stepdownsstep downs to (A) LIBOR Adjusted EURIBOR, Daily Simple RFR or Term SOFR plus 2.50% if the first lien leverage ratio (as calculated thereunder)under the First Lien Credit Agreement) is less than or equal to 3.75:1.00 and (B) LIBOR Adjusted EURIBOR, Daily Simple RFR or Term SOFR plus 2.25% if the first lien leverage ratio is less than or equal to 3.25:1.00; (iii)1.00. Consistent with the prior agreement, the commitment fee on the average daily undrawn portion of the New Revolving Credit Facility was reduced tois 0.3750% per annum if the first lien leverage ratio is greater than 3.25:1.00 and 0.250% if the first lien leverage ratio is less than or equal to 3.25:1.00 and (iv) borrowings under
During the New Revolving Credit Facility mature the earlier of (x) six months prior to the then-existing final maturity date of the related term loans and (y) January 4, 2026.In connection with the Amendment above, the Company incurred loss on extinguishment of debt of $0.3 million related to the write-off of unamortized deferred financing cost on the revolving credit facility.
On October 1, 2021,year ended
December 31, 2023, in connection with the closing of Sizewise Rentals, LLC (“Sizewise”),our entry into Amendment No. 6, $3.7 million in lender and third-party fees were capitalized. A&R First Lien Term Loan Agreement
On May 1, 2023, we entered into Amendment No. 5 toan amended and restated credit agreement, dated as of May 1, 2023 (the “A&R First Lien Credit Agreement”), with JPMorgan Chase Bank, N.A., as administrative agent and collateral agent, and the lenders from time-to-time party thereto, which amends and restates the First Lien Credit Agreement. This amendment
The A&R First Lien Credit Agreement among other things (i) provides for a $150.0 million incrementalrefinancing of the existing term loan credit facility the proceeds of which were used, together with cash on hand, to finance the Sizewise acquisition. This incrementala $1.075 billion term loan credit facility has terms identical(the “Term Loan Credit Facility”); (ii) extends the maturity of the Term Loan Credit Facility to those applicableMay 1, 2030; and (iii) updates the benchmark interest rate provisions to replace LIBOR with a term rate based on the Initial Term Loans andSOFR, for term loans extended in dollars. Following the February 2020 Amendment (each as defined in theA&R First Lien Credit Agreement), including asAgreement, the interest rate margin for the term loan borrowings under the Term Loan Credit Facility will be set at Term SOFR plus 3.00%.
The Term Loan Credit Facility amortizes in equal quarterly installments, commencing on December 31, 2023, in an aggregate annual amount equal to
pricing0.25% of the original principal amount of such term loan, with the balance due and
interest, tenor, rights of payment and prepayment and right of security.payable at maturity unless prepaid prior thereto.
Except as described above, the Amendment has substantiallyA&R First Lien Credit Agreement does not give effect to other material changes to the same terms asof the First Lien Credit Agreement, including with respect to the representations and amendments thereto, including customary covenants andwarranties, events of default.default and affirmative and negative covenants.
During the year ended December 31, 2023, in connection with our entry into the A&R First Lien Credit Agreement, lender and third-party fees of $3.1 million and $2.8 million were capitalized and expensed, respectively. Unamortized costs written off due to loss on extinguishment / modification of debt totaled $1.7 million for the year ended December 31, 2023.Second Lien Credit Facilities
Term Loan
The Second Lien Term Loan provided for an eight-year term loan facility in an aggregate principal amount of
$240$240.0 million (the “Second Lien Term Loan”).
The proceeds of the Second Lien Term Loan were drawn on November 15, 2019 and used to return capital to shareholders.Borrowings under the Second Lien Term Loan bore interest, at Agiliti Health, Inc.’s option, at a rate per annum equal to an applicable margin over either (a) a base rate determined by reference to the highest of (1) the prime lending rate published in the Wall Street Journal, (2) the federal funds effective rate plus 1/2 of 1% and (3) the LIBOR rate for a one-month interest period, plus 1.00%, or (b) a LIBOR rate determined by reference to the LIBOR rate as set forth by the ICE Benchmark Administration for the interest period relevant to such borrowing, in each case, subject to interest rate floors. The interest rate on the Second Lien Term Loan was LIBOR rate plus 7.75% at the end of the first quarter.
We used the proceeds from the IPO to repay $240.0 million in aggregatethe full principal amount of our
the Second Lien Term Loan, $80.0 million of
ourthe First Lien Term Loan, and $10.0 million of
ourthe Revolving
Loan facility.Credit Facility. In connection with the repayment of ourthe Second Lien Term Loan in April 2021, we incurred a loss on extinguishment / modification of debt of $9.8 million which consisted of the write-off of unamortized deferred financing costs and debt discount of $7.4 million and an additional 1% redemption price or $2.4 million
Interest Rates and Fees
Borrowings under the First Lien Credit Agreement bear interest at a rate per annum, at the borrower’s option, equal to an applicable margin, plus (a) a base rate determined by reference to the highest of (i) the prime lending rate published in The Wall Street Journal, (ii) the federal funds rate in effect on such day plus 1/2 of 1.00% and (iii) the LIBOR rate for a one-month interest period on such day plus 1.00% or (b) a LIBOR rate determined by reference to the LIBOR rate as set forth by the ICE Benchmark Administration for the interest period relevant to such borrowing subject to a LIBOR floor of 0.00%.
The applicable margin for borrowings under the First Lien Credit Agreement is:
(a) (1) prior to March 31, 2019 and
(2) on or after March 31, 2019 (so long as the first lien leverage ratio is greater than 3.75 to 1.00),
(i) 2.00% for alternate base rate borrowings and
(ii) 3.00% for Eurodollar borrowings and
(b) on or after June 30, 2020 (so long as the first lien leverage ratio is less than or equal to 3.75 to 1.00), subject
to step downs to
(i) 1.75% for alternate base rate borrowings and
(ii) 2.75% for Eurodollar borrowings.
Under the First Lien Credit Agreement, the borrower is also required to pay a commitment fee on the average daily undrawn portion of the Revolving Credit Facility of:
(i) 0.50% per annum if the first lien leverage ratio is greater than 4.00:1.00,
(ii) 0.375% per annum if the first lien leverage ratio is less than or equal to 4.00:1.00 but greater than
3.50:1.00 and
(iii) 0.250% if the first lien leverage ratio is less than or equal to 3.50:1.00, and a letter of credit
participation fee equal to the applicable margin for Eurodollar revolving loans on the actual daily
amount of the letter of credit exposure
million.
In May 2020, we entered into an interest rate swap agreement for a total notional amount of $500.0 million. Until its expiration in June 2023, the agreement converted $350.0 million which hasand $150.0 million of the effect of converting a portion of our First Lien Term Loan to fixed interest rates. The effective date forrates of 0.3396% and 0.3290%, respectively, plus the Applicable Margin.
On April 17, 2023, we entered into a new two-year interest rate swap agreement was June 2020 andwith an effective date of July 1, 2023. As a result, we expect the expiration date is June 2023.effective interest rate on $500.0 million of the Term Loan Credit Facility to be 4.0685%, plus the Applicable Margin, through July 2025.
TheBoth interest rate swap agreement qualifiesagreements qualify for cash flow hedge accounting under ASC Topic 815, “Derivatives and Hedging.” Both at815. At inception and on an on-going basis, we must perform an effectiveness test. The fair value of the interest rate swap agreement atas of December 31, 20212023 was $2.1$1.9 million, of which $0.4$3.1 million is included in other current assets and $1.7offset by $1.2 million is included in obligation under tax receivable agreement, pension and other long-term assetsliabilities on ourthe consolidated balance sheet. The change in fair value was recorded as a component of accumulated other comprehensive loss on ourthe consolidated balance sheet, net of tax, since the instrument was determined to be an effective hedge atas of December 31, 2021.2023. We have not recorded any amounts due to ineffectiveness for any periods presented.
As a result of our interest rate swap agreement, we expect the effective interest rate on $350.0 million and $150.0 million of our First Lien Term Loan to be 0.3396% and 0.3290%, respectively, plus the Applicable Margin through June 2023.
Contractual Obligations
The following table is a summary,
Our significant contractual cash requirements as of December 31,
2021,2023, consist primarily of
ourprincipal and interest on loans, principal and interest on operating and finance lease liabilities, and tax receivable obligations. Our current and long-term obligations related to these items are outlined within ‘Note 5 – Fair Value Measurements,’ ‘Note 7 – Long-Term Debt,’ and ‘Note 8 – Leases’ of the Notes to Consolidated Financial Statements within this Report. As of December 31, 2023, total future
contractual obligations:
| | | | | | | | | | | | | | | |
| | Payments due by period |
| | | | | | | | | | | | | | 2027 and |
(in thousands) | | Total | | 2022 | | 2023 - 2024 | | 2025 - 2026 | | beyond |
Other financial data: | | | | | | | | | | | | | | | |
Long-term debt principal obligations | | $ | 1,183,071 | | $ | 9,398 | | $ | 18,796 | | $ | 1,154,877 | | $ | — |
Interest on notes | | | 141,528 | | | 35,695 | | | 70,580 | | | 35,253 | | | — |
Principal and interest on finance leases | | | 28,789 | | | 8,746 | | | 10,401 | | | 5,112 | | | 4,530 |
Principal and interest on operating leases | | | 89,898 | | | 24,399 | | | 38,959 | | | 24,883 | | | 1,657 |
Pension obligations (1) | | | 650 | | | 650 | | | — | | | — | | | — |
Tax receivable obligations | | | 39,880 | | | 29,187 | | | 10,693 | | | — | | | — |
Unrecognized tax positions (2) | | | 10,111 | | | — | | | — | | | — | | | — |
Total contractual obligations | | $ | 1,493,927 | | $ | 108,075 | | $ | 149,429 | | $ | 1,220,125 | | $ | 6,187 |
Other commercial commitments: | | | | | | | | | | | | | | | |
Stand by letter of credit | | $ | 8,005 | | $ | — | | $ | — | | $ | — | | $ | — |
(1) | While our net pension liability at December 31, 2021 was approximately $4.8 million, we cannot reasonably estimate required payments beyond 2022 due to changing actuarial and market conditions. |
(2) | We cannot reasonably determine the exact timing of payments related to our unrecognized tax positions. |
payments for financing obligations are $1,771.0 million, of which $136.5 million is payable within 12 months. Additionally, we expect future payments for tax obligations of $16.9 million, of which $12.8 million are payable within 12 months.
Based on the level of operating performance in
2021,2023, we believe our cash from operations and additional borrowings under our Revolving Credit Facility will meet our liquidity needs for the foreseeable future, exclusive of any borrowings that we may make to finance potential acquisitions. However, if during that period or thereafter we are not successful in generating sufficient cash flows from operations or in raising additional capital when required in sufficient amounts and on terms acceptable to us, our business could be adversely affected.
Our levels of borrowing are further restricted by the financial covenants set forth in our Revolving Credit Facility.
As of December 31,
2021,2023, we were in compliance with all covenants for all years presented.
Our expansion and acquisition strategy may require substantial capital. Sufficient funding for future acquisitions may not be available under our Revolving Credit Facility, and we may not be able to raise any necessary additional funds through bank financing or the issuance of equity or debt securities on terms acceptable to us, if at all.
Recent Accounting Pronouncements
Refer to Note'Note 2 - “Summary of Significant Accounting Policies,”' of our consolidated financial statements contained in this report for a description of recently issued accounting pronouncements that are applicable to our business.
ITEM 7A:7A. Quantitative and Qualitative Disclosures about Market Risk
For purposes of this Item
7A,7A., “we”, “us”, “our” and similar words and the Company refer to Agiliti,
Health.Inc.
We are exposed to market risk arising from adverse changes in interest rates, fuel costs and pension valuation. We do not enter into derivatives or other financial instruments for speculative purposes.
We use both fixed and variable rate debt as sources of financing.
To manage variable interest rate risk, we entered into a new two-year interest rate swap agreement on April 17, 2023 for a notional amount of $500.0 million. As a result, we expect the effective interest rate on $500.0 million of our total debt outstanding before netting with deferred financing costs and unamortized debt discount to be 4.0685%, plus the Applicable Margin, through July 2025. As of December 31,
2021,2023, we had approximately
$1,210$1,099.7 million of total debt outstanding before netting with deferred financing costs and unamortized debt discount, of which
$683.1 million$572.3 was bearing interest at variable rates. Based on variable debt levels
atas of December 31,
2021,2023, a 1.0 percentage point change in interest rates on variable rate debt would have resulted in annual interest expense fluctuating by approximately
$6.8$5.7 million.
We are exposed to market risks related to changes in the price of gasoline used to fuel our fleet of delivery and sales vehicles. A hypothetical 10% increase or decrease in the average
20212023 prices of unleaded gasoline, assuming normal gasoline usage levels for the year, would lead to an annual increase or decrease in fuel costs of approximately
$0.6$0.9 million.
Our pension plan assets, which were approximately
$26.4$22.6 million
atas of December 31,
2021,2023, are subject to volatility that can be caused by fluctuations in general economic conditions. Continued market volatility and disruption could cause declines in asset values, and if this occurs, we may need to make additional pension plan contributions and our pension expense in future years may increase. A hypothetical 10% decrease in the fair value of plan assets at December 31,
20212023 would lead to a decrease in the funded status of the plan of approximately
$2.6$2.3 million.
As of December 31,
2021,2023, we have no other material exposure to market risk.
ITEM 8:8. Consolidated Financial Statements and Supplementary Data
The Report of Independent Registered Public Accounting Firm, our Financial Statements, the accompanying Notes to the Financial Statements, and the Financial Statement Schedule that are filed as part of this Report are listed under
“ItemItem 15.
Exhibits"Exhibits and Financial Statement Schedules” and are set forth immediately
followingpreceding the signature pages of this Report.
The following tables set forth certain unaudited supplementary quarterly financial data of Agiliti Health for 2021 and 2020. In our opinion, this unaudited information has been prepared on the same basis as the audited information and includes all adjustments (consisting only of normal recurring adjustments) necessary to present fairly the information set forth therein. The operating results for any one quarter are not necessarily indicative of results for any future period.
| | | | | | | | | | | | | | | | |
| | Year Ended December 31, 2021 |
| | Quarter Ended |
(unaudited, in thousands) | | March 31 | | June 30 | | September 30 | | December 31 |
| | (Successor) | | (Successor) | | (Successor) | | (Successor) |
Selected Quarterly Financial Information | | | | | | | | | | | | | | | | |
Total revenue | | $ | 235,245 | | | $ | 250,543 | | | $ | 262,424 | | | $ | 290,478 | |
Gross margin | | $ | 101,323 | | | $ | 99,108 | | | $ | 103,434 | | | $ | 120,752 | |
Gross margin % | | | 43.1 | % | | | 39.6 | % | | | 39.4 | % | | | 41.6 | % |
Consolidated net income (loss) | | $ | 9,583 | | | $ | (5,171) | | | $ | 9,728 | | | $ | 10,027 | |
Net cash provided by operating activities | | $ | 62,909 | | | $ | 44,599 | | | $ | 30,905 | | | $ | 71,904 | |
Net cash used in investing activities | | $ | (457,525) | | | $ | (17,541) | | | $ | (6,396) | | | $ | (252,672) | |
Net cash provided by (used in) financing activities | | $ | 201,439 | | | $ | 63,284 | | | $ | (4,466) | | | $ | 131,380 | |
| | | | | | | | | | | | | | | | |
| | Year Ended December 31, 2020 |
| | Quarter Ended |
(unaudited, in thousands) | | March 31 | | June 30 | | September 30 | | December 31 |
| | (Successor) | | (Successor) | | (Successor) | | (Successor) |
Selected Quarterly Financial Information | | | | | | | | | | | | | | | | |
Total revenue | | $ | 179,240 | | | $ | 185,161 | | | $ | 194,721 | | | $ | 214,190 | |
Gross margin | | $ | 57,807 | | | $ | 67,470 | | | $ | 74,606 | | | $ | 86,464 | |
Gross margin % | | | 32.3 | % | | | 36.4 | % | | | 38.3 | % | | | 40.4 | % |
Consolidated net (loss) income | | $ | (12,548) | | | $ | 851 | | | $ | (10,113) | | | $ | (428) | |
Net cash provided by operating activities | | $ | 27,679 | | | $ | 32,767 | | | $ | 39,280 | | | $ | 38,201 | |
Net cash used in investing activities | | $ | (101,139) | | | $ | (12,624) | | | $ | (12,057) | | | $ | (25,912) | |
Net cash provided by (used in) financing activities | | $ | 134,483 | | | $ | (4,335) | | | $ | (54,586) | | | $ | 144,748 | |
ITEM 9: Changes in and Disagreements with Accountants on Accounting and Financial Disclosure
None.
ITEM 9A: Controls and Procedures
Evaluation of Disclosure Controls and Procedures
Our management is responsible for establishing and maintaining effective disclosure controls and procedures, as defined under Rule 13a-15(e) of the Securities Exchange Act of 1934 (the “Exchange Act”). As of the end of the period covered by this report, we performed an evaluation, under the supervision and with the participation of our management, including our Chief Executive Officer and Chief Financial Officer, of the effectiveness of Agiliti Health’s disclosure controls and procedures. Based upon, and as of the date of, that evaluation, our Chief Executive Officer and Chief Financial Officer concluded that Agiliti Health’s disclosure controls and procedures were effective to ensure that information required to be disclosed by us in the reports that our Company files or submits to the SEC under the Exchange Act is recorded, processed, summarized and reported within the time periods specified in the SEC’s rules and forms, and that
such information is accumulated and communicated to our management, including our Chief Executive Officer and Chief Financial Officer, as appropriate to allow timely decisions regarding required disclosure.
Management’s Annual Report on Internal Control over Financial Reporting
The Annual Report on Form 10-K does not include a report of management's assessment regarding internal control over financial reporting or an attestation report of our independent registered public accounting firm due to a transition period established by the rules of the SEC for newly public companies.
ITEM 9B: Other Information
None.
PART III
ITEM 10: Directors, Executive Officers and Corporate Governance
The information required by this Item 10 will be contained in the Definitive Proxy Statement and is incorporated herein by reference.
ITEM 11: Executive Compensation
The information required by this Item 11 will be contained in the Definitive Proxy Statement and is incorporated herein by reference.
ITEM 12: Security Ownership of Certain Beneficial Owners and Management and Related Stockholder Matters
The information required by this Item 12 will be contained in the Definitive Proxy Statement and is incorporated herein by reference.
ITEM 13: Certain Relationships and Related Transactions, and Director Independence
The information required by this Item 13 will be contained in the Definitive Proxy Statement and is incorporated herein by reference.
ITEM 14: Principal Accounting Fees and Services
Our independent registered public accounting firm is KPMG LLP, Minneapolis, MN, Auditor Firm ID: 185
The information required by this Item 14 will be contained in the Definitive Proxy Statement and is incorporated herein by reference.
PART IV
ITEM 15: Exhibits and Financial Statement Schedules
We have filed the following documents as part of this Annual Report on Form 10-K:
1. Consolidated Financial Statements
Our consolidated financial statements are listed in the "Index to Consolidated Financial Statements" immediately following the signature pages of this Annual Report on Form 10-K.
2. Consolidated Financial Statement Schedules
Supplemental financial schedules are omitted as not applicable or not required under the rules of Regulation S-X or the information is presented in the financial statements or notes thereto.
3. Exhibits
The documents listed in the Exhibit Index of this Annual Report on Form 10-K are incorporated by reference or are filed with this Annual Report on Form 10-K, in each case as indicated therein (numbered in accordance with Item 601 of Regulation S-K)
EXHIBIT INDEX
| | |
| | |
Exhibit
Number
| | Description
|
| |
| |
2.1
| | Stock Purchase Agreement, dated as of October 28, 2020, by and among Agiliti Health, Inc., Northfield Medical Holdings LLC and Northfield Medical, Inc. (incorporated by reference to Exhibit 2.1 to our Registration Statement on Form S-1/A filed on April 21, 2021).
|
| |
3.1
| | Second Amended and Restated Certificate of Incorporation of Agiliti, Inc. (incorporated by reference to Exhibit 3.1 to our Quarterly Report on Form 10-Q filed on August 12, 2021).
|
| |
3.2
| | Third Amended and Restated Bylaws of Agiliti, Inc. (incorporated by reference to Exhibit 3.2 to our Quarterly Report on Form 10-Q filed on August 12, 2021).
|
| |
4.1
| | Specimen Common Stock Certificate of Agiliti, Inc. (incorporated by reference to Exhibit 4.1 to our Registration Statement on Form S-4/A filed on October 9, 2018).
|
| |
4.2
| | Assignment and Assumption Agreement, dated as of January 4, 2019, between Continental Stock Transfer & Trust Company, Agiliti, Inc. and Federal Street Acquisition Corp. (incorporated by reference to Exhibit 4.4 to our Current Report on Form 8-K filed on January 10, 2019).
|
| |
4.3
| | Amended and Restated Registration Rights Agreement, dated as of April 27, 2021, by and among Agiliti, Inc., THL Agiliti LLC, Thomas J. Leonard and the individuals listed therein (incorporated by reference to Exhibit 4.1 to our Quarterly Report on Form 10-Q filed on August 12, 2021).
|
| |
4.4
| | Description of Agiliti, Inc.’s Securities Registered Pursuant to Section 12 of the Securities Exchange Act of 1934, filed herewith.
|
| |
10.1
| | Credit Agreement, dated as of January 4, 2019, by and among Agiliti Health, Inc., as borrower, Agiliti Holdco, Inc. and certain subsidiaries of Agiliti Health as guarantors, JPMorgan Chase Bank, N.A., as administrative agent, collateral agent and letter of credit issuer, and the lenders from time to time party thereto (incorporated by reference to Exhibit 10.1 to our Current Report on Form 8-K filed on January 10, 2019).
|
| |
10.2
| | Amended and Restated Director Nomination Agreement, dated as of April 26, 2021, by and among Agiliti, Inc. and THL Agiliti LLC (incorporated by reference to Exhibit 10.1 to our Quarterly Report on Form 10-Q filed on August 12, 2021).
|
| |
10.3
| | Tax Receivable Agreement, dated as of January 4, 2019, by and among Agiliti Holdco, Inc., IPC/UHS, L.P., solely in the capacity of the Stockholders’ Representative, and each of the successors and assigns thereto (incorporated by reference to Exhibit 10.4 to our Current Report on Form 8-K filed on January 10, 2019).
|
| |
10.4
| | Advisory Services Agreement, dated as of January 4, 2019, by and among Agiliti, Inc., Agiliti Holdco, Inc., Agiliti Health, Inc. and THL Managers VIII, LLC (incorporated by reference to Exhibit 10.6 to our Current Report on Form 8-K filed on January 10, 2019).
|
|
|
|
10.5+
| | Form of Director and Officer Indemnification Agreement, by and between Agiliti, Inc. and its directors and executive officers (incorporated by reference to Exhibit 10.7 to our Current Report on Form 8-K filed on January 10, 2019).
|
| |
10.6+
| | Agiliti Inc.’s 2018 Omnibus Incentive Plan (incorporated by reference to Exhibit 10.5 to our Current Report on Form 8-K filed on January 10, 2019).
|
| |
10.7+
| | Agiliti Holdco, Inc. (f/k/a UHS Holdco, Inc.) Amended and Restated 2007 Stock Option Plan, dated as of November 4, 2014 (incorporated by reference to Exhibit 10.2 to the Quarterly Report on Form 10-Q of Agiliti Health, Inc. (f/k/a Universal Hospital Services, Inc.) filed November 6, 2014).
|
| |
10.8+
| | Form of notice to option holders regarding amendments to outstanding options (incorporated by reference to Exhibit 10.3 to the Quarterly Report on Form 10-Q of Agiliti Health, Inc. (f/k/a Universal Hospital Services, Inc.) filed November 6, 2014).
|
| |
10.9+
| | Form of Option Agreement Evidencing a Grant of an Option Under the 2007 Stock Option Plan, dated as of May 8, 2015, between Agiliti Health, Inc. (f/k/a Universal Hospital Services, Inc.) and Thomas Leonard (incorporated by reference to Exhibit 10.3 to the Quarterly Report on Form 10-Q of Agiliti Health, Inc. (f/k/a Universal Hospital Services, Inc.) filed on May 13, 2015).
|
| |
10.10+
| | Amendment One to Option Agreement, dated March 14, 2016, between UHS Holdco and Thomas Leonard (incorporated by reference to Exhibit 10.25 to the Annual Report on Form 10-K of Agiliti Health, Inc. (f/k/a Universal Hospital Services, Inc.) filed on March 15, 2016).
|
| |
10.11+
| | Agiliti Holdco, Inc. (f/k/a UHS Holdco, Inc.) 2018 Executive Management Stock Option Plan (incorporated by reference to Exhibit 10.1 to the Quarterly Report on Form 10-Q of Agiliti Health, Inc. (f/k/a Universal Hospital Services, Inc.) filed on May 14, 2018).
|
| |
10.12+
| | Form of Agiliti Holdco, Inc. (f/k/a UHS Holdco, Inc.) Executive Management Stock Option Agreement (incorporated by reference to Exhibit 10.2 to the Quarterly Report on Form 10-Q of Agiliti Health, Inc. (f/k/a Universal Hospital Services, Inc.) filed on May 14, 2018).
|
| |
10.13+
| | Amendment No. 1 to Agiliti Holdco, Inc. (f/k/a UHS Holdco, Inc.) Executive Management Stock Option Plan dated August 9, 2018 (incorporated by reference to Exhibit 10.2 to the Quarterly Report on Form 10-Q of Agiliti Health, Inc. (f/k/a Universal Hospital Services, Inc.) filed on August 13, 2018).
|
| |
10.14+
| | Agiliti Health, Inc. (f/k/a Universal Hospital Services, Inc.) Executive Severance Pay Plan, dated November 2, 2016 (incorporated by reference to Exhibit 10.1 to the Quarterly Report on Form 10-Q of Agiliti Health, Inc. (f/k/a Universal Hospital Services, Inc.) filed on November 7, 2016).
|
| |
10.15+
| | Employment Agreement, dated as of January 20, 2020, by and between Thomas W. Boehning and Agiliti, Inc. (incorporated by reference to Exhibit 10.15 to our Registration Statement on Form S-1 filed on March 5, 2021).
|
| |
10.16+
| | Employment Agreement, dated as of March 5, 2019, by and between Thomas J. Leonard and Agiliti, Inc. (incorporated by reference to Exhibit 10.17 to our Registration Statement on Form S-1 filed on March 5, 2021).
|
| |
10.17+
| | Employment Agreement, dated as of March 5, 2019, by and between James B. Pekarek and Agiliti, Inc. (incorporated by reference to Exhibit 10.18 to our Registration Statement on Form S-1 filed on March 5, 2021).
|
| |
10.18+
| | Agiliti Executive Deferred Compensation Plan, as Amended and Restated Effective December 3, 2018 (incorporated by reference to Exhibit 10.19 to our Registration Statement on Form S-1 filed on March 5, 2021).
|
| |
10.19+
| | Agiliti, Inc. Employee Stock Purchase Plan (incorporated by reference to Exhibit 10.2 to our Registration Statement on Form S-8 filed on April 29, 2021).
|
| |
10.20+
| | Agiliti, Inc. Amended and Restated 2018 Omnibus Incentive Plan (incorporated by reference to Exhibit 10.1 to our Registration Statement on Form S-8 filed on April 29, 2021).
|
| |
10.21+
| | Form of Restricted Stock Unit Agreement Pursuant to the Agiliti, Inc. Amended and Restated 2018 Omnibus Incentive Plan (Employee Form) (incorporated by reference to Exhibit 10.22 to our Registration Statement on Form S-1 filed on March 5, 2021).
|
| |
10.22+
| | Form of Performance Restricted Stock Unit Agreement Pursuant to the Agiliti, Inc. Amended and Restated 2018 Omnibus Incentive Plan (incorporated by reference to Exhibit 10.23 to our Registration Statement on Form S-1 filed on March 5, 2021).
|
| |
10.23+
| | Form of Nonqualified Stock Option Agreement Pursuant to the Agiliti, Inc. Amended and Restated 2018 Omnibus Incentive Plan (incorporated by reference to Exhibit 10.24 to our Registration Statement on Form S-1 filed on March 5, 2021).
|
| |
10.24+
| | Form of Restricted Stock Unit Agreement Pursuant to the Agiliti, Inc. Amended and Restated 2018 Omnibus Incentive Plan (Director Form) (incorporated by reference to Exhibit 10.25 to our Registration Statement on Form S-1 filed on March 5, 2021).
|
| |
10.25
| | Amendment No. 1 to Credit Agreement, dated as of February 6, 2020, by and among Agiliti Health, Inc., as borrower, Agiliti Holdco, Inc. and certain subsidiaries of Agiliti Health as guarantors, JPMorgan Chase Bank, N.A., as administrative agent and collateral agent, and the other loan parties thereto (incorporated by reference to Exhibit 10.26 to our Registration Statement on Form S-1/A filed on April 15, 2021).
|
| |
10.26
| | Amendment No. 2 to Credit Agreement, dated as of October 16, 2020, by and among Agiliti Health, Inc., as borrower, Agiliti Holdco, Inc. and certain subsidiaries of Agiliti Health as guarantors, JPMorgan Chase Bank, N.A., as administrative agent and collateral agent, and the other loan parties thereto (incorporated by reference to Exhibit 10.27 to our Registration Statement on Form S-1/A filed on April 15, 2021).
|
| |
10.27
| | Amendment No. 3 to Credit Agreement, dated as of March 19, 2021, by and among Agiliti Health, Inc., as borrower, Agiliti Holdco, Inc. and certain subsidiaries of Agiliti Health as guarantors, JPMorgan Chase Bank, N.A., as administrative agent and collateral agent, and the other loan parties thereto (incorporated by reference to Exhibit 10.28 to our Registration Statement on Form S-1/A filed on April 15, 2021).
|
| |
10.28
| | Amendment No. 4 to Credit Agreement, dated as of April 27, 2021, by and among Agiliti Health, Inc., as borrower, Agiliti Holdco, Inc. and certain subsidiaries of Agiliti Health as guarantors, JP Morgan Chase Bank, N.A., as administrative agent and collateral agent, and the other loan parties thereto (incorporated by reference to Exhibit 10.1 to our Current Report on Form 8-K filed on May 3, 2021).
|
|
|
|
10.29
| | Amendment No. 5, dated as of October 1, 2021, by and among Agiliti Health, Inc., as borrower, Agiliti Holdco, Inc. as holdings, the subsidiaries of the Borrower from time to time party thereto, JPMorgan Chase Bank, N.A., as administrative agent, and the lenders party thereto, including Exhibit B, which is a conformed copy of the First Lien Credit Agreement through Amendment No. 5 (incorporated by reference to Exhibit 10.1 to our Current Report on Form 8-K filed on October 4, 2021).
|
| |
21.1
| | List of subsidiaries of Agiliti, Inc.
|
| |
23.1
| | Consent of KPMG LLP, independent registered public accounting firm.
|
| |
31.1
| | Certification of Principal Executive Officer pursuant to Rules 13a-14(a) and 15d-14(a) under the Securities Exchange Act of 1934, as adopted pursuant to Section 302 of the Sarbanes-Oxley Act of 2002.
|
| |
+ Indicates a management contract or compensatory plan or arrangement.
* Furnished, not filed.
ITEM 16: 10-K Summary
None.
SIGNATURES
Pursuant to the requirements of Section 13 or 15(d) of the Securities Exchange Act of 1934, the registrant has duly caused this report to be signed on its behalf by the undersigned thereunto duly authorized on March 8, 2022.
| | AGILITI, INC.
|
|
| By
| /s/ Thomas J. Leonard
|
|
|
| Thomas J. Leonard
|
|
|
| Chief Executive Officer and Director
|
Pursuant to the requirements of the Securities Exchange Act of 1934, this report has been signed by the following persons on behalf of the registrant and in the capacities indicated on March 8, 2022.
| | |
/s/ Thomas J. Leonard
| | Chief Executive Officer and Director (Principal Executive
|
Thomas J. Leonard
|
| Officer)
|
|
|
|
/s/ James B. Pekarek
|
| Executive Vice President and
|
James B. Pekarek
|
| Chief Financial Officer (Principal Financial Officer)
|
|
|
|
/s/ Scott A. Christensen
|
| Senior Vice President, Controller, and
|
Scott A. Christensen
|
| Chief Accounting Officer (Principal Accounting Officer)
|
|
|
|
/s/ John L. Workman
|
| Director
|
John L. Workman
|
|
|
|
|
|
/s/ Michael A. Bell
|
| Director
|
Michael A. Bell
|
|
|
|
|
|
/s/ Darren Friedman
|
| Director
|
Darren Friedman
|
|
|
|
|
|
/s/ Gary L. Gottlieb
|
| Director
|
Gary L. Gottlieb
|
|
|
|
|
|
/s/ Joshua M. Nelson
|
| Director
|
Joshua M. Nelson
|
|
|
|
|
|
/s/ Megan M. Preiner
|
| Director
|
Megan M. Preiner
|
|
|
|
|
|
/s/ Scott M. Sperling
|
| Director
|
Scott M. Sperling
|
|
|
|
|
|
/s/ Diane B. Patrick
|
| Director
|
Diane B. Patrick
|
|
|
Agiliti, Inc. and Subsidiaries
As of December 31,
20212023 and
20202022 and
For the years ended December 31,
2021, 2020, the period from January 4 through December 31, 20192023, 2022, and
the period from January 1 through January 3, 2019
2021
Report of Independent Registered Public Accounting Firm
To the Stockholders and Board of Directors
Opinion on the
Consolidated Financial StatementsWe have audited the accompanying consolidated balance sheets of Agiliti, Inc. and subsidiaries (the Company) as of December 31, 20212023 and 2020,2022, the related consolidated statements of operations, comprehensive income (loss), equity, and cash flows for each of the years in the three-year period ended December 31, 2021 and 2020 and for the period January 4, 2019 through December 31, 2019, and the related notes. We have also audited the accompanying consolidated statements of operations, comprehensive loss, deficit, and cash flows of Agiliti Health, Inc. and subsidiaries for the period January 1, 2019 through January 3, 2019,2023, and the related notes (collectively, the consolidated financial statements). In our opinion, the consolidated financial statements present fairly, in all material respects, the financial position of Agiliti, Inc.the Company as of December 31, 20212023 and 2020,2022, and the results of its operations and its cash flows for each of the years in the three-year period ended December 31, 2021 and 2020 and for the period January 4, 2019 through December 31, 2019,2023, in conformity with U.S. generally accepted accounting principles. It is
We also
have audited, in accordance with the standards of the Public Company Accounting Oversight Board (United States) (PCAOB), the Company’s internal control over financial reporting as of December 31, 2023, based on criteria established in Internal Control – Integrated Framework (2013) issued by the Committee of Sponsoring Organizations of the Treadway Commission, and our
report dated March 5, 2024 expressed an adverse opinion
thaton the
consolidatedeffectiveness of the Company’s internal control over financial
statements referred to above present fairly, in all material respects, the results of operations and cash flows of Agiliti Health, Inc. and subsidiaries for the period January 1, 2019 through January 3 2019, in conformity with U.S. generally accepted accounting principles.reporting.
These consolidated financial statements are the responsibility of the Company’s management. Our responsibility is to express an opinion on these consolidated financial statements based on our audits. We are a public accounting firm registered with the PCAOB and are required to be independent with respect to the Company in accordance with the U.S. federal securities laws and the applicable rules and regulations of the Securities and Exchange Commission and the PCAOB.
We conducted our audits in accordance with the standards of the PCAOB. Those standards require that we plan and perform the audit to obtain reasonable assurance about whether the consolidated financial statements are free of material misstatement, whether due to error or fraud. Our audits included performing procedures to assess the risks of material misstatement of the consolidated financial statements, whether due to error or fraud, and performing procedures that respond to those risks. Such procedures included examining, on a test basis, evidence regarding the amounts and disclosures in the consolidated financial statements. Our audits also included evaluating the accounting principles used and significant estimates made by management, as well as evaluating the overall presentation of the consolidated financial statements. We believe that our audits provide a reasonable basis for our opinion.
The critical audit matter communicated below is a matter arising from the current period audit of the consolidated financial statements that was communicated or required to be communicated to the audit committee and that: (1) relates to accounts or disclosures that are material to the consolidated financial statements and (2) involved our especially challenging, subjective, or complex judgments. The communication of a critical audit matter does not alter in any way our opinion on the consolidated financial statements, taken as a whole, and we are not, by communicating the critical audit matter below, providing a separate opinion on the critical audit matter or on the accounts or disclosures to which it relates.
Acquisition date fair value
Sufficiency of
customer relationship assetsaudit evidence
As discussed in Note 4 toItem 9A. Controls and Procedures, material weaknesses were identified as of December 31, 2023 and included in management’s report on internal control over financial reporting. The description of the consolidated financial statements, on March 19, 2021,material weaknesses state that the Company acquired certain assets of a surgical equipment repair and maintenance service provider in a business combination for consideration of approximately $472.3 million, and on October 1, 2021, the Company acquired certain assets of a manufacturer and distributor of specialty patient handling equipment in a business combination for consideration of approximately $234.8 million.had ineffective information technology general controls across all financial reporting systems. As a result, of the transactions, the Company acquired customer relationship intangible assets associated with the generation of future incomehad ineffective process level controls that are automated or that rely on information from the acquirees’ existing customers. The acquisition-date fair value of other intangible assets recorded byaffected systems across all financial reporting processes. Additionally, the Company was $183.7 millionhad ineffective process level controls related to order-to-cash (including revenue and $67.7 million, respectively, which included the customer relationship intangible assets.
accounts receivable) and manual journal entries.
We identified the evaluation of acquisition-date fair valuethe sufficiency of customer relationship intangible assetsaudit evidence as a critical audit matter. There was a high degreeEvaluating the sufficiency of audit evidence obtained required especially subjective auditor judgment in evaluating certain assumptions included in the discounted cash flow models used to estimate the acquisition-date fair value of customer relationship intangible assets. Specifically, there was limited observable market information for the forecasted revenue growth assumptions, and evaluationbecause of the discount rate assumptions used required valuation professionals with specialized skills and knowledge.
pervasiveness of the material weaknesses noted above.
The following are the primary procedures we performed to address this critical audit matter. We
applied auditor judgment to plan the nature and extent of our audit procedures to be performed over financial statement account balances. We evaluated
our scoping thresholds and control risk assessments considering the
designmaterial weaknesses noted above. We increased the number of
certain internalsample selections compared to what we would have otherwise made if the Company’s controls
related to the acquisition-date fair valuewere designed and operating effectively. For a selection of
customer relationship intangible assets. These included controls over the reviewmanual and automated journal entries, we inspected supporting documentation and evidence of
the forecasted revenue growth and discount rate assumptions.authorization. We evaluated the
Company’s forecasted revenue growth assumptionssufficiency of audit evidence obtained by
comparing them to (1) actual rates historically experienced byassessing the
acquired companies, (2) actual and forecasted growth ratesresults of procedures performed, including the appropriateness of the
acquirees’ peers,nature and
(3) industry reports. We compared the Company’s assumptions for forecasted revenue growthextent of
the acquired companies to actual post-acquisition results to assess the Company’s ability to accurately forecast. In addition, we involved valuation professionals with specialized skills and knowledge, who assisted in evaluating the Company’s discount rates by comparing them against discount rate ranges that were independently developed for each acquisition using publicly available market data for comparable entities.such evidence.
We have served as the Company’s auditor since 2013.
| | | | | | |
Agiliti, Inc. and Subsidiaries | | | | | | |
Consolidated Balance Sheets | | | | | | |
| | December 31, | | December 31, |
(in thousands, except share and per share information) | | 2021 | | 2020 |
| | (Successor) | | (Successor) |
Assets | | | | | | |
Current assets: | | | | | | |
Cash and cash equivalents | | $ | 74,325 | | $ | 206,505 |
Accounts receivable, less allowance for credit losses of $2,902 at December 31, 2021 and $1,993 at December 31, 2020 | | | 209,308 | | | 154,625 |
Inventories | | | 55,307 | | | 27,062 |
Prepaid expenses | | | 18,549 | | | 13,549 |
Other current assets | | | 395 | | | 626 |
Total current assets | | | 357,884 | | | 402,367 |
Property and equipment: | | | | | | |
Medical equipment | | | 359,284 | | | 285,723 |
Property and office equipment | | | 174,669 | | | 112,646 |
Accumulated depreciation | | | (275,583) | | | (183,953) |
Total property and equipment, net | | | 258,370 | | | 214,416 |
Other long-term assets: | | | | | | |
Goodwill | | | 1,213,121 | | | 817,113 |
Operating lease right-of-use assets | | | 80,676 | | | 51,214 |
Other intangibles, net | | | 573,159 | | | 402,095 |
Other | | | 32,537 | | | 16,151 |
Total assets | | $ | 2,515,747 | | $ | 1,903,356 |
Liabilities and Equity | | | | | | |
Current liabilities: | | | | | | |
Current portion of long-term debt | | $ | 17,534 | | $ | 16,044 |
Current portion of operating lease liability | | | 22,826 | | | 14,155 |
Current portion of obligation under tax receivable agreement | | | 29,187 | | | 15,572 |
Accounts payable | | | 53,851 | | | 37,215 |
Accrued compensation | | | 47,951 | | | 38,671 |
Accrued interest | | | 3,473 | | | 6,347 |
Deferred revenue | | | 5,808 | | | 8,800 |
Other accrued expenses | | | 27,900 | | | 22,727 |
Total current liabilities | | | 208,530 | | | 159,531 |
Long-term debt, less current portion | | | 1,174,968 | | | 1,145,055 |
Obligation under tax receivable agreement, pension and other long-term liabilities | | | 29,629 | | | 53,794 |
Operating lease liability, less current portion | | | 63,241 | | | 40,283 |
Deferred income taxes, net | | | 143,307 | | | 62,748 |
Commitments and contingencies (Note 11) | | | | | | |
Equity: | | | | | | |
Common stock, $0.0001 par value; 350,000,000 shares authorized; 130,950,061 and 98,983,296 shares issued and outstanding at December 31, 2021 and December 31, 2020 | | | 13 | | | 10 |
Additional paid-in capital | | | 938,888 | | | 513,902 |
Accumulated deficit | | | (44,486) | | | (68,492) |
Accumulated other comprehensive income (loss) | | | 1,537 | | | (3,619) |
Total Agiliti, Inc. and Subsidiaries equity | | | 895,952 | | | 441,801 |
Noncontrolling interest | | | 120 | | | 144 |
Total equity | | | 896,072 | | | 441,945 |
Total liabilities and equity | | $ | 2,515,747 | | $ | 1,903,356 |
| | | | | | |
The accompanying notes are an integral part of these consolidated financial statements. |
Report of Independent Registered Public Accounting Firm
To the Stockholders and Board of Directors
Agiliti, Inc.:
Opinion on Internal Control Over Financial Reporting
We have audited Agiliti, Inc. and subsidiaries' (the Company) internal control over financial reporting as of December 31, 2023, based on criteria established in Internal Control – Integrated Framework (2013) issued by the Committee of Sponsoring Organizations of the Treadway Commission. In our opinion, because of the effect of the material weaknesses, described below, on the achievement of the objectives of the control criteria, the Company has not maintained effective internal control over financial reporting as of December 31, 2023, based on criteria established in Internal Control – Integrated Framework (2013) issued by the Committee of Sponsoring Organizations of the Treadway Commission.
We also have audited, in accordance with the standards of the Public Company Accounting Oversight Board (United States) (PCAOB), the consolidated balance sheets of the Company as of December 31, 2023 and 2022, the related consolidated statements of operations, comprehensive income (loss), equity, and cash flows for each of the years in the three-year period ended December 31, 2023, and the related notes (collectively, the consolidated financial statements), and our report dated March 5, 2024 expressed an unqualified opinion on those consolidated financial statements.
A material weakness is a deficiency, or a combination of deficiencies, in internal control over financial reporting, such that there is a reasonable possibility that a material misstatement of the company’s annual or interim financial statements will not be prevented or detected on a timely basis. The following material weaknesses have been identified and included in management’s assessment. The Company had ineffective information technology general controls across all financial reporting systems. As a result, the Company had ineffective process level controls that are automated or that rely on information from the affected systems across all financial reporting processes. Additionally, the Company had ineffective process level controls related to order-to-cash (including revenue and accounts receivable) and manual journal entries. The material weaknesses were considered in determining the nature, timing, and extent of audit tests applied in our audit of the 2023 consolidated financial statements, and this report does not affect our report on those consolidated financial statements.
Basis for Opinion
The Company’s management is responsible for maintaining effective internal control over financial reporting and for its assessment of the effectiveness of internal control over financial reporting, included in the accompanying Management's Report on Internal Control over Financial Reporting. Our responsibility is to express an opinion on the Company’s internal control over financial reporting based on our audit. We are a public accounting firm registered with the PCAOB and are required to be independent with respect to the Company in accordance with the U.S. federal securities laws and the applicable rules and regulations of the Securities and Exchange Commission and the PCAOB.
We conducted our audit in accordance with the standards of the PCAOB. Those standards require that we plan and perform the audit to obtain reasonable assurance about whether effective internal control over financial reporting was maintained in all material respects. Our audit of internal control over financial reporting included obtaining an understanding of internal control over financial reporting, assessing the risk that a material weakness exists, and testing and evaluating the design and operating effectiveness of internal control based on the assessed risk. Our audit also included performing such other procedures as we considered necessary in the circumstances. We believe that our audit provides a reasonable basis for our opinion.
Definition and Limitations of Internal Control Over Financial Reporting
A company’s internal control over financial reporting is a process designed to provide reasonable assurance regarding the reliability of financial reporting and the preparation of financial statements for external purposes in accordance with generally accepted accounting principles. A company’s internal control over financial reporting includes those policies and procedures that (1) pertain to the maintenance of records that, in reasonable detail, accurately and fairly reflect the transactions and dispositions of the assets of the company; (2) provide reasonable assurance that transactions are recorded as necessary to permit preparation of financial statements in accordance with generally accepted accounting principles, and that receipts and expenditures of the company are being made only in accordance with authorizations of management and directors of the company; and (3) provide reasonable assurance regarding prevention or timely detection of unauthorized acquisition, use, or disposition of the company’s assets that could have a material effect on the financial statements.
| | | | | | | | | | | | | |
Agiliti, Inc. and Subsidiaries | | | | | | From | | | From |
Consolidated Statements of Operations | | | | | | January 4 | | | January 1 |
| | Year Ended | | through | | | through |
| | December 31, | | December 31, | | | January 3, |
(in thousands, except share and per share information) | | 2021 | | 2020 | | 2019 | | | 2019 |
| | (Successor) | | (Successor) | | (Successor) | | | (Predecessor) |
Revenue | | $ | 1,038,690 | | $ | 773,312 | | $ | 613,073 | | | $ | — |
Cost of revenue | | | 614,073 | | | 486,965 | | | 423,812 | | | | — |
Gross margin | | | 424,617 | | | 286,347 | | | 189,261 | | | | — |
Selling, general and administrative | | | 320,387 | | | 250,289 | | | 187,156 | | | | 17,147 |
Operating income | | | 104,230 | | | 36,058 | | | 2,105 | | | | (17,147) |
Loss on extinguishment of debt | | | 10,116 | | | — | | | — | | | | — |
Interest expense | | | 53,514 | | | 61,530 | | | 48,199 | | | | — |
Income (loss) before income taxes and noncontrolling interest | | | 40,600 | | | (25,472) | | | (46,094) | | | | (17,147) |
Income tax expense (benefit) | | | 16,433 | | | (3,234) | | | (14,857) | | | | (13,281) |
Consolidated net income (loss) | | | 24,167 | | | (22,238) | | | (31,237) | | | | (3,866) |
Net income attributable to noncontrolling interest | | | 161 | | | 240 | | | 171 | | | | — |
Net income (loss) attributable to Agiliti, Inc. and Subsidiaries | | $ | 24,006 | | $ | (22,478) | | $ | (31,408) | | | $ | (3,866) |
| | | | | | | | | | | | | |
Basic income (loss) per share | | $ | 0.20 | | $ | (0.23) | | $ | (0.32) | | | | |
Diluted income (loss) per share | | $ | 0.19 | | $ | (0.23) | | $ | (0.32) | | | | |
| | | | | | | | | | | | | |
Weighted-average common shares outstanding: | | | | | | | | | | | | | |
Basic | | | 120,877,480 | | | 98,976,226 | | | 98,942,437 | | | | |
Diluted | | | 128,497,220 | | | 98,976,226 | | | 98,942,437 | | | | |
| | | | | | | | | | | | | |
The accompanying notes are an integral part of these consolidated financial statements. |
Because of its inherent limitations, internal control over financial reporting may not prevent or detect misstatements. Also, projections of any evaluation of effectiveness to future periods are subject to the risk that controls may become inadequate because of changes in conditions, or that the degree of compliance with the policies or procedures may deteriorate.Minneapolis, Minnesota
March 5, 2024
| | | | | | | | | | | | | |
Agiliti, Inc. and Subsidiaries | | | | | | From | | | From |
Consolidated Statements of Comprehensive Income (Loss) | | | | | | January 4 | | | January 1 |
| | Year Ended | | through | | | through |
| | December 31, | | December 31, | | | January 3, |
(in thousands) | | 2021 | | 2020 | | 2019 | | | 2019 |
| | (Successor) | | (Successor) | | (Successor) | | | (Predecessor) |
Consolidated net income (loss) | | $ | 24,167 | | $ | (22,238) | | $ | (31,237) | | | $ | (3,866) |
Other comprehensive income (loss): | | | | | | | | | | | | | |
Gain (loss) on minimum pension liability, net of tax of $747, $435, $320 and $0 | | | 2,195 | | | (1,275) | | | (940) | | | | — |
Gain (loss) on cash flow hedge, net of (benefit) tax of $1015, $478, $0 and $0 | | | 2,961 | | | (1,404) | | | — | | | | — |
Total other comprehensive income (loss) | | | 5,156 | | | (2,679) | | | (940) | | | | — |
Comprehensive income (loss) | | | 29,323 | | | (24,917) | | | (32,177) | | | | (3,866) |
Comprehensive income attributable to noncontrolling interest | | | 161 | | | 240 | | | 171 | | | | — |
Comprehensive income (loss) attributable to Agiliti, Inc. and Subsidiaries | | $ | 29,162 | | $ | (25,157) | | $ | (32,348) | | | $ | (3,866) |
| | | | | | | | | | | | | |
The accompanying notes are an integral part of these consolidated financial statements. |
| | | | | | | | | | | | | | |
| Agiliti, Inc. and Subsidiaries | | | | |
| Consolidated Balance Sheets | | | | |
| (in thousands, except share and per share information) | | December 31, 2023 | | December 31, 2022 |
| Assets | | | | |
| Current assets: | | | | |
| Cash and cash equivalents | | $ | 20,037 | | | $ | 5,577 | |
| Accounts receivable, less allowance for credit losses of $6,236 as of December 31, 2023 and $4,182 as of December 31, 2022 | | 215,684 | | | 207,753 | |
| Inventories | | 74,484 | | | 70,132 | |
| Prepaid expenses | | 20,231 | | | 23,458 | |
| Other current assets | | 7,307 | | | 9,393 | |
| Total current assets | | 337,743 | | | 316,313 | |
| Property and equipment, net | | 292,684 | | | 273,958 | |
| Goodwill | | 1,239,432 | | | 1,239,106 | |
| Operating lease right-of-use assets | | 78,157 | | | 79,975 | |
| Other intangibles, net | | 430,002 | | | 512,020 | |
| Other | | 20,926 | | | 22,735 | |
| Total assets | | $ | 2,398,944 | | | $ | 2,444,107 | |
| Liabilities and Equity | | | | |
| Current liabilities: | | | | |
| Current portion of long-term debt | | $ | 18,468 | | | $ | 17,752 | |
| Current portion of operating lease liability | | 25,603 | | | 23,607 | |
| Current portion of obligation under tax receivable agreement | | 12,796 | | | 34,694 | |
| Accounts payable | | 58,518 | | | 59,163 | |
| Accrued compensation | | 28,866 | | | 25,928 | |
| Accrued interest | | 21,451 | | | 5,039 | |
| Other current liabilities | | 30,906 | | | 31,198 | |
| Total current liabilities | | 196,608 | | | 197,381 | |
| Long-term debt, less current portion | | 1,061,062 | | | 1,077,293 | |
| Obligation under tax receivable agreement, pension and other long-term liabilities | | 10,467 | | | 9,161 | |
| Operating lease liability, less current portion | | 63,765 | | | 67,332 | |
| Deferred income taxes, net | | 126,219 | | | 146,615 | |
| Commitments and contingencies (Note 11) | | | | |
| Equity: | | | | |
| Common stock, $0.0001 par value; 500,000,000 shares authorized; 135,368,025 and 133,608,495 shares issued; 135,352,336 and 133,608,495 outstanding as of December 31, 2023 and December 31, 2022, respectively | | 14 | | | 13 | |
| Treasury stock, at cost; 54,256 and — shares as of December 31, 2023 and December 31, 2022, respectively | | (419) | | | — | |
| Additional paid-in capital | | 972,156 | | | 953,046 | |
| Accumulated deficit | | (33,699) | | | (14,274) | |
| Accumulated other comprehensive income | | 2,505 | | | 7,343 | |
| Total Agiliti, Inc. and Subsidiaries equity | | 940,557 | | | 946,128 | |
| Noncontrolling interest | | 266 | | | 197 | |
| Total equity | | 940,823 | | | 946,325 | |
| Total liabilities and equity | | $ | 2,398,944 | | | $ | 2,444,107 | |
| | | | |
| The accompanying notes are an integral part of these consolidated financial statements. |
| | | | | | | | | | | | | | | | | | | | | |
Agiliti, Inc. and Subsidiaries | | | | | | | | | | | Accumulated | | Total | | | | | | |
Consolidated Statements of Equity (Deficit) | | | | Additional | | | | | Other | | Agiliti, Inc. | | | | | Total |
| | Common | | Paid-in | | Accumulated | | Comprehensive | | and | | Noncontrolling | | Equity |
(in thousands) | | Stock | | Capital | | Deficit | | Loss | | Subsidiaries | | Interests | | (Deficit) |
Balance at December 31, 2018 (Predecessor) | | $ | — | | $ | 252,439 | | $ | (313,656) | | $ | (6,633) | | $ | (67,850) | | $ | 191 | | $ | (67,659) |
Net loss | | | — | | | — | | | (3,866) | | | — | | | (3,866) | | | — | | | (3,866) |
Share-based compensation expense | | | — | | | 5,900 | | | — | | | — | | | 5,900 | | | — | | | 5,900 |
Balance at January 3, 2019 (Predecessor) | | $ | — | | $ | 258,339 | | $ | (317,522) | | $ | (6,633) | | $ | (65,816) | | $ | 191 | | $ | (65,625) |
| | | | | | | | | | | | | | | | | | | | | |
| | | | | | | | | | | | | | | | | | | | | |
Balance at January 4, 2019 (Successor) | | $ | 10 | | $ | 764,582 | | $ | (14,606) | | | — | | | 749,986 | | | 191 | | | 750,177 |
Net (loss) income | | | — | | | — | | | (31,408) | | | — | | | (31,408) | | | 171 | | | (31,237) |
Other comprehensive loss | | | — | | | — | | | — | | | (940) | | | (940) | | | — | | | (940) |
Share-based compensation expense | | | — | | | 6,011 | | | — | | | — | | | 6,011 | | | — | | | 6,011 |
Stock options exercised | | | — | | | 193 | | | — | | | — | | | 193 | | | — | | | 193 |
Shares repurchased | | | — | | | (775) | | | — | | | — | | | (775) | | | — | | | (775) |
Redemption of warrants | | | — | | | (35,872) | | | — | | | — | | | (35,872) | | | — | | | (35,872) |
Dividend and equity distribution | | | — | | | (230,502) | | | — | | | — | | | (230,502) | | | — | | | (230,502) |
Contributions from new members to limited liability company | | | — | | | — | | | — | | | — | | | — | | | 140 | | | 140 |
Cash distributions to noncontrolling interests | | | — | | | — | | | — | | | — | | | — | | | (226) | | | (226) |
Balance at December 31, 2019 (Successor) | | $ | 10 | | $ | 503,637 | | $ | (46,014) | | $ | (940) | | $ | 456,693 | | $ | 276 | | $ | 456,969 |
Net (loss) income | | | — | | | — | | | (22,478) | | | — | | | (22,478) | | | 240 | | | (22,238) |
Other comprehensive loss | | | — | | | — | | | — | | | (2,679) | | | (2,679) | | | — | | | (2,679) |
Share-based compensation expense | | | — | | | 10,334 | | | — | | | — | | | 10,334 | | | — | | | 10,334 |
Shares forfeited for taxes | | | — | | | (145) | | | — | | | — | | | (145) | | | — | | | (145) |
Dividend forfeited, net of payable | | | — | | | 76 | | | — | | | — | | | 76 | | | — | | | 76 |
Contributions from members to limited liability company | | | — | | | — | | | — | | | — | | | — | | | 25 | | | 25 |
Cash distributions to noncontrolling interests | | | — | | | — | | | — | | | — | | | — | | | (397) | | | (397) |
Balance at December 31, 2020 (Successor) | | $ | 10 | | $ | 513,902 | | $ | (68,492) | | $ | (3,619) | | $ | 441,801 | | $ | 144 | | $ | 441,945 |
Net income | | | — | | | — | | | 24,006 | | | — | | | 24,006 | | | 161 | | | 24,167 |
Other comprehensive income | | | — | | | — | | | — | | | 5,156 | | | 5,156 | | | — | | | 5,156 |
Proceeds from issuance of common stock | | | 3 | | | 414,112 | | | — | | | — | | | 414,115 | | | — | | | 414,115 |
Stock issue costs | | | — | | | (4,379) | | | — | | | — | | | (4,379) | | | — | | | (4,379) |
Share-based compensation expense | | | — | | | 13,818 | | | — | | | — | | | 13,818 | | | — | | | 13,818 |
Stock options exercised | | | — | | | 1,409 | | | — | | | — | | | 1,409 | | | — | | | 1,409 |
Dividend forfeited, net of payable | | | — | | | 26 | | | — | | | — | | | 26 | | | — | | | 26 |
Cash distributions to noncontrolling interests | | | — | | | — | | | — | | | — | | | — | | | (185) | | | (185) |
Balance at December 31, 2021 (Successor) | | $ | 13 | | $ | 938,888 | | $ | (44,486) | | $ | 1,537 | | $ | 895,952 | | $ | 120 | | $ | 896,072 |
| | | | | | | | | | | | | | | | | | | | | |
The accompanying notes are an integral part of these consolidated financial statements. |
| | | | | | | | | | | | | | | | | | | | |
| Agiliti, Inc. and Subsidiaries | | | | |
| Consolidated Statements of Operations | | | | |
| | | | | | |
| | Year Ended December 31, |
| (in thousands, except share and per share information) | | 2023 | | 2022 | | 2021 |
| Revenue | | $ | 1,174,604 | | | $ | 1,121,292 | | | $ | 1,038,690 | |
| Cost of revenue | | 770,501 | | | 690,318 | | | 614,073 | |
| Gross margin | | 404,103 | | | 430,974 | | | 424,617 | |
| Selling, general and administrative expense | | 339,312 | | | 338,988 | | | 320,387 | |
| Operating income | | 64,791 | | | 91,986 | | | 104,230 | |
| Loss on extinguishment / modification of debt | | 4,527 | | | 1,418 | | | 10,116 | |
| Interest expense | | 84,115 | | | 49,439 | | | 53,514 | |
| Tax indemnification expense | | — | | | 11,918 | | | — | |
| Income (loss) before income taxes and noncontrolling interest | | (23,851) | | | 29,211 | | | 40,600 | |
| Income tax (benefit) expense | | (4,732) | | | (1,232) | | | 16,433 | |
| Consolidated net income (loss) | | (19,119) | | | 30,443 | | | 24,167 | |
| Net income attributable to noncontrolling interest | | 306 | | | 231 | | | 161 | |
| Net income (loss) attributable to Agiliti, Inc. and Subsidiaries | | $ | (19,425) | | | $ | 30,212 | | | $ | 24,006 | |
| | | | | | |
| Basic income (loss) per share | | $ | (0.14) | | | $ | 0.23 | | | $ | 0.20 | |
| Diluted income (loss) per share | | $ | (0.14) | | | $ | 0.22 | | | $ | 0.19 | |
| | | | | | |
| Weighted-average common shares outstanding: | | | | | | |
| Basic | | 134,647,238 | | | 132,602,747 | | | 120,877,480 | |
| Diluted | | 134,647,238 | | | 138,381,295 | | | 128,497,220 | |
| | | | | | |
| The accompanying notes are an integral part of these consolidated financial statements. |
| | | | | | | | | | | | | |
Agiliti, Inc. and Subsidiaries | | | | | | From | | | From |
Consolidated Statements of Cash Flows | | | | | | January 4 | | | January 1 |
| | Year Ended | | through | | | through |
| | December 31, | | December 31, | | | January 3, |
(in thousands) | | 2021 | | 2020 | | 2019 | | | 2019 |
| | (Successor) | | (Successor) | | (Successor) | | | (Predecessor) |
Cash flows from operating activities: | | | | | | | | | | | | | |
Consolidated net income (loss) | | $ | 24,167 | | $ | (22,238) | | $ | (31,237) | | | $ | (3,866) |
Adjustments to reconcile net income (loss) to net cash provided by operating activities: | | | | | | | | | | | | | |
Depreciation | | | 103,805 | | | 99,638 | | | 96,486 | | | | — |
Amortization | | | 88,240 | | | 73,456 | | | 68,357 | | | | — |
Remeasurement of tax receivable agreement and contingent consideration | | | 4,542 | | | 12,931 | | | (8,586) | | | | — |
Loss on extinguishment of debt | | | 7,716 | | | — | | | — | | | | — |
Provision for credit losses | | | 2,023 | | | 1,959 | | | 1,031 | | | | — |
Provision for inventory obsolescence | | | 2,424 | | | 722 | | | 455 | | | | — |
Non-cash share-based compensation expense | | | 13,960 | | | 10,334 | | | 6,011 | | | | 5,900 |
Gain on sales and disposals of equipment | | | (3,735) | | | (1,191) | | | (1,715) | | | | — |
Deferred income taxes | | | 12,004 | | | (4,944) | | | (15,302) | | | | (13,281) |
Changes in operating assets and liabilities: | | | | | | | | | | | | | |
Accounts receivable | | | (8,915) | | | (39,763) | | | (827) | | | | — |
Inventories | | | 3,052 | | | (9,712) | | | (1,325) | | | | — |
Other operating assets | | | (9,044) | | | (13,597) | | | (7,397) | | | | — |
Accounts payable | | | 718 | | | 552 | | | 1,661 | | | | — |
Other operating liabilities | | | (30,640) | | | 29,780 | | | (37,614) | | | | 11,247 |
Net cash provided by operating activities | | | 210,317 | | | 137,927 | | | 69,998 | | | | — |
Cash flows from investing activities: | | | | | | | | | | | | | |
Medical equipment purchases | | | (37,377) | | | (31,668) | | | (45,768) | | | | — |
Property and office equipment purchases | | | (29,121) | | | (27,597) | | | (9,974) | | | | — |
Proceeds from disposition of property and equipment | | | 9,242 | | | 3,486 | | | 3,583 | | | | — |
Collection of note receivable from officer | | | — | | | — | | | 2,585 | | | | — |
Acquisition of Agiliti Health, Inc. by THL Shareholders | | | — | | | — | | | (702,139) | | | | — |
Acquisitions, net of cash acquired | | | (676,878) | | | (95,953) | | | (10,260) | | | | — |
Net cash used in investing activities | | | (734,134) | | | (151,732) | | | (761,973) | | | | — |
Cash flows from financing activities: | | | | | | | | | | | | | |
Proceeds under revolver | | | 35,000 | | | 199,500 | | | 207,100 | | | | — |
Payments under revolver | | | (35,000) | | | (233,000) | | | (173,600) | | | | — |
Proceeds under term loan | | | 346,927 | | | 273,344 | | | 890,775 | | | | — |
Payments under term loan | | | (329,119) | | | (7,860) | | | (4,950) | | | | — |
Payments of principal under finance lease liability | | | (9,097) | | | (8,024) | | | (7,609) | | | | — |
Payments under senior secured credit facility | | | — | | | — | | | (25,933) | | | | — |
Repayments of 2012 Notes | | | — | | | — | | | (645,000) | | | | — |
Payments of deferred financing costs | | | (229) | | | (199) | | | (21,836) | | | | — |
Payments under tax receivable agreement | | | (15,577) | | | — | | | — | | | | |
Distributions to noncontrolling interests | | | (185) | | | (397) | | | (226) | | | | — |
Proceeds from exercise of stock options | | | 1,409 | | | — | | | 193 | | | | — |
Shares repurchased | | | — | | | — | | | (775) | | | | — |
Redemption of warrants | | | — | | | — | | | (35,872) | | | | — |
Dividend and equity distribution payment | | | (928) | | | (1,138) | | | (227,065) | | | | — |
Contribution from new members to limited liability company | | | — | | | — | | | 140 | | | | |
Proceeds from issuance of common stock | | | 402,815 | | | — | | | — | | | | — |
Stock issuance costs | | | (4,379) | | | — | | | — | | | | |
Shares forfeited for taxes | | | — | | | (145) | | | — | | | | — |
Change in book overdrafts | | | — | | | (1,771) | | | 1,771 | | | | — |
Net cash provided by (used in) financing activities | | | 391,637 | | | 220,310 | | | (42,887) | | | | — |
Net change in cash and cash equivalents | | | (132,180) | | | 206,505 | | | (734,862) | | | | — |
Cash and cash equivalents at the beginning of period | | | 206,505 | | | — | | | 734,862 | | | | 7,340 |
Cash and cash equivalents at the end of period | | $ | 74,325 | | $ | 206,505 | | $ | — | | | $ | 7,340 |
| | | | | | | | | | | | | |
Supplemental cash flow information: | | | | | | | | | | | | | |
Interest paid | | $ | 52,341 | | $ | 55,161 | | $ | 59,737 | | | $ | — |
Income taxes paid | | | 3,214 | | | 1,260 | | | 1,564 | | | | — |
| | | | | | | | | | | | | |
The accompanying notes are an integral part of these consolidated financial statements. | | | | | | | | | | | | | |
| | | | | | | | | | | | | | | | | | | | |
| Agiliti, Inc. and Subsidiaries | | | | | | |
| Consolidated Statements of Comprehensive Income (Loss) | | | | |
| | Year Ended December 31, |
| (in thousands) | | 2023 | | 2022 | | 2021 |
| Consolidated net income (loss) | | $ | (19,119) | | | $ | 30,443 | | | $ | 24,167 | |
| Other comprehensive income (loss): | | | | | | |
| Gain on minimum pension liability, net of tax (expense) of $(191), $(181), and $(747) | | 567 | | | 522 | | | 2,195 | |
| Gain (loss) on cash flow hedge, net of tax benefit (expense) of $1,880, $(1,835), and $(1,015) | | (5,405) | | | 5,284 | | | 2,961 | |
| Total other comprehensive income (loss) | | (4,838) | | | 5,806 | | | 5,156 | |
| Comprehensive income (loss) | | (23,957) | | | 36,249 | | | 29,323 | |
| Comprehensive income attributable to noncontrolling interest | | 306 | | | 231 | | | 161 | |
| Comprehensive income (loss) attributable to Agiliti, Inc. and Subsidiaries | | $ | (24,263) | | | $ | 36,018 | | | $ | 29,162 | |
| | | | | | |
| The accompanying notes are an integral part of these consolidated financial statements. |
| | | | | | | | | | | | | | | | | | | | | | | | | | | | | | | | | | | | | | | | | | | | | | | | | | |
| Agiliti, Inc. and Subsidiaries | | Common
Stock | | Treasury
Stock | | Additional
Paid-in
Capital | | Accumulated
Deficit | | Accumulated
Other
Comprehensive
Income (Loss) | | Total
Agiliti, Inc.
and
Subsidiaries | | Noncontrolling
Interests | | Total
Equity
(Deficit) |
| Consolidated Statements of Equity | | | | | | | | |
| | | | | | | | |
| (in thousands) | | | | | | | | |
| Balance as of December 31, 2020 | | $ | 10 | | | $ | — | | | $ | 513,902 | | | $ | (68,492) | | | $ | (3,619) | | | $ | 441,801 | | | $ | 144 | | | $ | 441,945 | |
| Net income | | — | | | — | | | — | | | 24,006 | | | — | | | 24,006 | | | 161 | | | 24,167 | |
| Other comprehensive income | | — | | | — | | | — | | | — | | | 5,156 | | | 5,156 | | | — | | | 5,156 | |
| Proceeds from issuance of common stock | | 3 | | | — | | | 414,112 | | | — | | | . | | 414,115 | | | — | | | 414,115 | |
| Stock issue costs | | — | | | — | | | (4,379) | | | — | | | — | | | (4,379) | | | — | | | (4,379) | |
| Share-based compensation expense | | — | | | — | | | 13,818 | | | — | | | — | | | 13,818 | | | — | | | 13,818 | |
| Stock options exercised | | — | | | — | | | 1,409 | | | — | | | — | | | 1,409 | | | — | | | 1,409 | |
| Dividend forfeited, net of payable | | — | | | — | | | 26 | | | — | | | — | | | 26 | | | — | | | 26 | |
| Cash distributions to noncontrolling interests | | — | | | — | | | — | | | — | | | — | | | — | | | (185) | | | (185) | |
| Balance at December 31, 2021 | | $ | 13 | | | $ | — | | | $ | 938,888 | | | $ | (44,486) | | | $ | 1,537 | | | $ | 895,952 | | | $ | 120 | | | $ | 896,072 | |
| Net income | | — | | | — | | | — | | | 30,212 | | | — | | | 30,212 | | | 231 | | | 30,443 | |
| Other comprehensive income | | — | | | — | | | — | | | — | | | 5,806 | | | 5,806 | | | — | | | 5,806 | |
| Proceeds from issuance of common stock | | — | | | — | | | 3,809 | | | — | | | . | | 3,809 | | | — | | | 3,809 | |
| Acquisition consideration paid in equity | | — | | | — | | | 2,928 | | | — | | | — | | | 2,928 | | | — | | | 2,928 | |
| Share-based compensation expense | | — | | | — | | | 18,845 | | | — | | | — | | | 18,845 | | | — | | | 18,845 | |
| Shares forfeited for taxes | | — | | | — | | | (14,547) | | | — | | | — | | | (14,547) | | | — | | | (14,547) | |
| Stock options exercised | | — | | | — | | | 3,101 | | | — | | | — | | | 3,101 | | | — | | | 3,101 | |
| Dividend forfeited, net of payable | | — | | | — | | | 22 | | | — | | | — | | | 22 | | | — | | | 22 | |
| Cash distributions to noncontrolling interests | | — | | | — | | | — | | | — | | | — | | | — | | | (154) | | | (154) | |
| Balance as of December 31, 2022 | | $ | 13 | | | $ | — | | | $ | 953,046 | | | $ | (14,274) | | | $ | 7,343 | | | $ | 946,128 | | | $ | 197 | | | $ | 946,325 | |
| Net income (loss) | | — | | | — | | | — | | | (19,425) | | | — | | | (19,425) | | | 306 | | | (19,119) | |
| Other comprehensive (loss) | | — | | | — | | | — | | | — | | | (4,838) | | | (4,838) | | | — | | | (4,838) | |
| Purchases of treasury stock | | — | | | (3,761) | | | — | | | — | | | — | | | (3,761) | | | — | | | (3,761) | |
| Reissuance of treasury stock | | — | | | 3,342 | | | (3,342) | | | — | | | — | | | — | | | — | | | — | |
| Proceeds from issuance of common stock | | — | | | — | | | 3,140 | | | — | | | — | | | 3,140 | | | — | | | 3,140 | |
| Acquisition consideration paid in equity | | — | | | — | | | 2,753 | | | — | | | — | | | 2,753 | | | — | | | 2,753 | |
| Share-based compensation expense | | 1 | | | — | | | 19,803 | | | — | | | — | | | 19,804 | | | — | | | 19,804 | |
| Shares forfeited for taxes | | — | | | — | | | (6,301) | | | — | | | — | | | (6,301) | | | — | | | (6,301) | |
| Stock options exercised | | — | | | — | | | 3,057 | | | — | | | — | | | 3,057 | | | — | | | 3,057 | |
| Cash distributions to noncontrolling interests | | — | | | — | | | — | | | — | | | — | | | — | | | (237) | | | (237) | |
| Balance as of December 31, 2023 | | $ | 14 | | | $ | (419) | | | $ | 972,156 | | | $ | (33,699) | | | $ | 2,505 | | | $ | 940,557 | | | $ | 266 | | | $ | 940,823 | |
| | | | | | | | | | | | | | | | |
| The accompanying notes are an integral part of these consolidated financial statements. |
| | | | | | | | | | | | | | | | | | | | |
| Agiliti, Inc. and Subsidiaries | | | | | | |
| Consolidated Statements of Cash Flows | | | | |
| | | | | | |
| | Year Ended December 31, |
| (in thousands) | | 2023 | | 2022 | | 2021 |
| Cash flows from operating activities: | | | | | | |
| Consolidated net income (loss) | | $ | (19,119) | | | $ | 30,443 | | | $ | 24,167 | |
| Adjustments to reconcile net income (loss) to net cash provided by operating activities: | | | | | | |
| Depreciation | | 80,249 | | | 84,331 | | | 103,805 | |
| Amortization | | 93,683 | | | 95,452 | | | 88,240 | |
| Remeasurement of tax receivable agreement | | 1,042 | | | (2,124) | | | 4,542 | |
| Loss on extinguishment / modification of debt | | 4,527 | | | 1,418 | | | 7,716 | |
| Provision for credit losses | | 2,305 | | | 3,903 | | | 2,023 | |
| Provision for inventory obsolescence | | 1,725 | | | 1,034 | | | 2,424 | |
| Non-cash share-based compensation expense | | 20,186 | | | 18,775 | | | 13,960 | |
| Gain on sales and disposals of equipment | | (1,331) | | | (1,101) | | | (3,735) | |
| Deferred income taxes | | (17,321) | | | 1,292 | | | 12,004 | |
| Changes in operating assets and liabilities: | | | | | | |
| Accounts receivable | 0 | (9,330) | | | (3,976) | | | (8,915) | |
| Inventories | | (5,547) | | | (12,188) | | | 3,052 | |
| Other operating assets | | (1,532) | | | (10,144) | | | (9,044) | |
| Accounts payable | | 1,077 | | | 15,753 | | | 718 | |
| Accrued and other operating liabilities | | 19,202 | | | (23,092) | | | (30,640) | |
| Net cash provided by operating activities | | 169,816 | | | 199,776 | | | 210,317 | |
| Cash flows from investing activities: | | | | | | |
| Medical equipment purchases | | (52,118) | | | (55,864) | | | (37,377) | |
| Property and office equipment purchases | | (34,230) | | | (31,600) | | | (29,121) | |
| Proceeds from disposition of property and equipment | | 3,895 | | | 2,963 | | | 9,242 | |
| Acquisitions, net of cash acquired | | (1,350) | | | (62,339) | | | (676,878) | |
| Intangible asset purchases | | (89) | | | (20) | | | — | |
| Net cash used in investing activities | | (83,892) | | | (146,860) | | | (734,134) | |
| Cash flows from financing activities: | | | | | | |
| Proceeds under debt arrangements | | 1,302,937 | | | 60,000 | | | 381,927 | |
| Payments under debt arrangements | | (1,321,737) | | | (160,023) | | | (364,119) | |
| Payments of principal under finance lease liability | | (9,502) | | | (8,812) | | | (9,097) | |
| Payments of deferred financing costs | | (9,579) | | | — | | | (229) | |
| Payments under tax receivable agreement | | (24,822) | | | — | | | (15,577) | |
| Distributions to noncontrolling interests | | (237) | | | (154) | | | (185) | |
| Proceeds from exercise of stock options | | 3,057 | | | 3,101 | | | 1,409 | |
| Dividend and equity distribution payment | | (321) | | | (908) | | | (928) | |
| Proceeds from issuance of common stock | | — | | | — | | | 402,815 | |
| Purchases of treasury stock | | (3,761) | | | — | | | — | |
| Stock issuance costs | | — | | | — | | | (4,379) | |
| Shares forfeited for taxes | | (6,301) | | | (14,547) | | | — | |
| Acquisition holdback and contingent consideration | | (1,198) | | | (321) | | | — | |
| Net cash (used in) provided by financing activities | | (71,464) | | | (121,664) | | | 391,637 | |
| Net change in cash and cash equivalents | | 14,460 | | | (68,748) | | | (132,180) | |
| Cash and cash equivalents at the beginning of period | | 5,577 | | | 74,325 | | | 206,505 | |
| Cash and cash equivalents at the end of period | | $ | 20,037 | | | $ | 5,577 | | | $ | 74,325 | |
| | | | | | |
| Supplemental cash flow information: | | | | | | |
| Interest paid | | $ | 60,984 | | | $ | 42,773 | | | $ | 52,341 | |
| Income taxes paid | | 11,816 | | | 14,843 | | | 3,214 | |
| | | | | | |
| The accompanying notes are an integral part of these consolidated financial statements. |
Agiliti, Inc. and Subsidiaries
Notes to Consolidated Financial Statements
Agiliti, Inc. and its consolidated subsidiaries (Federal Street Acquisition Corp (“FSAC”), Agiliti Holdco, Inc. and Agiliti Health, Inc. and subsidiaries
(“we”, “our”, “us”, the(the “Company” or “Agiliti”
)) is a nationwide provider of healthcare technology management and service solutions to the United States healthcare industry. Agiliti, Inc. owns 100% of FSAC. FSAC owns 100% of Agiliti Holdco, Inc. Agiliti Holdco, Inc. owns 100% of Agiliti Health, Inc. Agiliti Health, Inc. owns 100% of Agiliti Surgical, Inc.
and, Agiliti Imaging, Inc.
, Agiliti Surgical Equipment Repair, Inc. and Sizewise Rentals, LLC. Agiliti Health, Inc. and subsidiaries
isare the only
companyentities with operations. All other entities have no material assets, liabilities, cash flows or operations other than their investment and ownership of Agiliti Health, Inc. and subsidiaries.
The successor period reflected the financial position and result of operations of Agiliti, Inc and its consolidated subsidiaries as of December 31, 2021 and 2020 and the period from January 4 through December 31, 2019. The predecessor period reflected the financial position and result of operations of Agiliti Health, Inc. and its consolidated subsidiaries for the period from January 1 through January 3, 2019. Disclosures in our Notes to Consolidated Financial Statements related to the stub period are only included in instances where there is material activity.
On April 22, 2021,
ourthe Company's registration statement on Form S-1 (File No. 333-253947) related to
ourthe initial public offering (“IPO”) was declared effective by the SEC, and
ourthe Company's common stock began trading on the New York Stock Exchange (“NYSE”) on April 23, 2021.
OurThe IPO closed on April 27, 2021.
Our
Agiliti's service solutions consist of Equipment Solutions, Clinical Engineering Services and Onsite Managed Services.
On-Site Managed Services:Onsite Managed Services are comprehensive programs that assume full responsibility for the management, reprocessing, and logistics of medical equipment at individual facilities and IDNs,integrated delivery networks ("IDNs"), with the added benefit of enhancing equipment utilization and freeing more clinician time for patient care. This solution monitors and adjusts equipment quantities and availability to address fluctuations in patient census and acuity. OurThe Company's more than 1,6001,300 onsite employees work 24/7 in customer facilities, augmenting clinical support by integrating proven equipment management processes, utilizing our proprietary management software and conducting daily rounds and unit-based training to ensure equipment is being used and managed properly, overall helping to optimize day-to-day operations and care outcomes. We assumeThe Company assumes full responsibility for ensuring equipment is available when and where it is needed, removing equipment when no longer in use, and decontaminating, testing and servicing equipment as needed between each patient use. Clinical Engineering Services: Clinical Engineering Services provides maintenance, repair and remediation solutions for all types of medical equipment, including general biomedical equipment, diagnostic imaging equipment and surgical equipment through supplemental and outsourced offerings. OurThe Company's supplemental offering helps customers manage their equipment repair and maintenance backlog, assist with remediation and regulatory reporting and temporarily fill open biotechnical positions. With our outsourced offering, we assumeofferings, the Company assumes full management, staffing and clinical engineering service responsibilities for individual or system-wide customer sites. The outsourced model deploys a dedicated, on-site team to coordinate the management of customer-owned equipment utilizing ourthe Company's proprietary information systems, third party vendors of services and parts, and a broad range of professional services for capital equipment planning and regulatory compliance. We leverageThe Company employs more than 700800 technical resources from our over 100150 local market service centers and 7 Centers of Excellence towho can flex staff in and out of customer facilities on an as-needed basis, ensuring customers pay only for time spent directly servicing their equipment by an appropriately qualified technician. We useThe Company uses flex staffing for ourthe supplemental clinical engineering solution and to augment support when additional technicians are needed to supplement ourthe outsourced services during peak workload. We contract ourThe Company contracts its Clinical Engineering Services with acute care and alternate
site facilities across the U.S., as well as with the federal government and any medical device manufacturers that require a broad logistical footprint to support their large-scale service needs.
Equipment Solutions:Equipment Solutions primarily provides supplemental, peak need and per-case rental of general biomedical, specialty, and surgical equipment to approximately 7,000 acute care hospitals and alternate site providers in the U.S., including some of the nation’s premier healthcare institutions and integrated delivery networks. We contractThe Company contracts for Equipment Solutions services directly with customers or through our contractual arrangements with hospital systems and alternate site providers. WeThe Company consistently achieveachieves high customer satisfaction ratings, as evidenced by our NPSAgiliti's net promoter score ("NPS") of 5540 for the year ended December 31, 2021, by delivering2023. For these customer, the Company delivers patient-ready equipment within our contracted equipment delivery times and by providingprovide technical support and educational in-servicing for equipment as-needed in clinical departments, including the emergency room, operating room, intensive care, rehabilitation
and general patient care areas. We areThe Company is committed to providing the highest quality of equipment to our customers, and we dothe Company does so through the use of oura comprehensive QMSquality management system ("QMS"), which is based on the quality standards recognized worldwide for medical devices: 21 CFRCode of Federal Regulations ("CFR") 820 and ISOInterational Organization for Standardization ("ISO") 13485:2016. This commitment ensures that customers have access to patient-ready equipment with the confidence of knowing it has been prepared and maintained to the highest industry standard to deliverfor optimal patient safety and outcomes.
Principles of Consolidation
The consolidated financial statements include the accounts of Agiliti, Inc., FSAC, Agiliti Holdco, Inc., Agiliti Health, Inc., Agiliti Surgical, Inc., Agiliti Imaging, Inc., Agiliti Surgical Equipment Repair, Inc., and Sizewise Rentals, LLC. In addition, in accordance with guidance issued by the Financial Accounting Standards Board (“FASB”),
we havethe Company has accounted for
ourits equity investments in entities in which
we areit is the primary beneficiary under the full consolidation method. All intercompany transactions and balances have been eliminated through consolidation.
As the primary beneficiary, we consolidate the limited liability companies (“LLCs”) referred to in Note 13, Limited Liability Companies, as we effectively receive the majority of the benefits from such entities, and we provide equipment lease guarantees for such entities.
2. Significant Accounting Policies
Cash and Cash Equivalents
The Company considers money market accounts and other highly liquid investments purchased with an original maturity of three months or less to be cash equivalents.
Changes Book overdrafts, if any, are included in book overdrafts are considered financingaccounts payable in the consolidated balance sheets and in operating activities in the consolidated statements of cash flows.
Accounts Receivable and Allowance for Credit Losses
Trade accounts receivable are recorded at the invoiced amount. Concentrations of credit risk with respect to trade accounts receivable are limited due to the number of customers and their geographical distribution. The Company performs initial and ongoing credit evaluations of its customers and maintains allowances for potential credit losses. The allowance for credit losses is based on historical loss experience and estimated exposure on specific trade receivables. Inventories consist of supplies and equipment held for resale and are valued at the lower of cost and net realizable value. Cost is determined by the average cost method, which approximates the first-in, first-out (“FIFO”) method.
Medical
The Company separates its property and equipment into two categories - medical equipment and property and office equipment.
Depreciation of medical equipment is provided on the straight-line method over the equipment’s estimated useful life generally fivefour to seventen years. The cost and accumulated depreciation of medical equipment retired or sold is eliminated from their respective accounts and the resulting gain or loss is recorded in cost of revenue in the period the asset is retired or sold. During fiscal year ended December 31, 2022, the Company performed a review of the estimated useful lives associated with certain medical equipment and determined that these assets had actual lives that were longer than previously estimated. As a result, effective July 1, 2022, the Company increased the expected useful lives of such medical equipment from four to seven years to five to ten years on a prospective basis. The effect of this change reduced depreciation expense by approximately $6.8 million and increased net income by approximately $4.6 million, or $0.03 per basic and diluted share for the year ended December 31, 2022.
Property and Office Equipment
Property and office equipment includes property, leasehold improvements, vehicles, computer software and hardware, and office equipment. Depreciation and amortization of property and office equipment is provided on the straight-line method over the lesser of the remaining useful life or lease term for leasehold improvements and 3three to 10ten years for office equipment. The cost and accumulated depreciation or amortization of property and equipment retired or sold is eliminated from their respective accounts and the resulting gain or loss is recorded in selling, general and administrative expense in the period the asset is retired or sold.
Goodwill
Goodwill represents the excess of the cost of acquired businesses over the fair value of identifiable tangible net assets and identifiable intangible assets purchased.
Goodwill is tested at least annually for impairment at the reporting unit level and more frequently if events or changes in circumstances indicate that the asset might be impaired. We review goodwill for impairment by comparing the fair value of a reporting unit with its carrying value and recognize an impairment charge for the amount by which the carrying amount exceeds the reporting unit’s fair value.For the periods presented, we reported 1 reporting segment which is equal to our 1 reporting unit for purposes of evaluating goodwill. NaN goodwill impairments have been recognized in 2021, 2020, or 2019.
Other Intangible Assets
Other intangible assets primarily include customer relationships, trade names and non-compete agreements. Our other intangible assets are amortized over their estimated economic lives of three to fifteen years. The straight-line method of amortization generally reflects an appropriate allocation of the cost of the intangible assets to earnings in proportion to the amount of economic benefits obtained by the Company in each reporting period. However, for certain of our customer relationships, we use the sum-of-the-years-digits amortization method to more appropriately allocate the cost to earnings in proportion to the estimated amount of economic benefit obtained.
Intangible assets with indefinite lives were tested for impairment on an annual basis and more frequently if events or changes in circumstances indicated that the asset might be impaired. We reviewed indefinite-lived intangible assets for impairment by first assessing qualitative factors to determine whether the existence of events and circumstances indicates that it is more likely than not that the indefinite-lived intangible asset is impaired. If, after assessing the totality of events and circumstances, we conclude that it is not more likely than not that the indefinite-lived intangible asset is impaired, then we take no further action.
Long-Lived Assets
The Company periodically reviews its long-lived assetsproperty and equipment for impairment and assesses whenever significant events or changes in business circumstances indicate that the carrying valueamount of the assets may not be recoverable. A recoverability
test is performed by comparing the anticipated future undiscounted cash flows to the carrying valueamount of the assets. If impairment is identified, an impairment loss is recognized for the excess of the carrying amount of an asset over the anticipated future discounted cash flows expected to result from the use of the asset and its eventual disposition. For other long-lived assets,property and equipment, primarily movable medical equipment, wethe Company continuously monitormonitors specific makes/models for events such as product recalls or obsolescence. The amount of the impairment loss to be recorded, if any, is calculated by the excess of the asset’s carrying valueamount over its fair value. Recoverability and Valuation of Goodwill
Goodwill represents the excess of the cost of acquired businesses over the fair value of identifiable tangible net assets and identifiable intangible assets purchased. Management reviews goodwill for impairment annually at the reporting unit level and upon the occurrence of certain events that might indicate the asset may be impaired. The Company operates under one reporting unit and does not aggregate any components into the one reporting unit. A qualitative review is conducted to determine whether it is more likely than not that the fair value is less than its carrying amount. If it is determined that it is more likely than not that the carrying amount is greater than the fair value of the asset, a quantitative impairment test is performed.
To perform the quantitative impairment test, management compares the fair value of a reporting unit to its carrying amount, including goodwill. If the fair value of a reporting unit exceeds its carrying amount, goodwill of the reporting unit is not impaired. If the carrying amount of the reporting unit, including goodwill, exceeds its fair value, a goodwill impairment loss is recognized in an amount equal to that excess.
Determining fair value requires the exercise of significant judgments, including the amount and timing of expected future cash flows, long-term growth rates, terminal value, discount rates, relevant comparable public company earnings multiples, and relevant transaction multiples. The Company estimates the fair value of the reporting unit using an income approach that utilizes a discounted cash flow model and a market approach that utilizes the guideline public company method. Each of the valuation methods were weighted by accounting for the relative merits of each method and considered, among other things, the reliability of the valuation methods and the inputs used in the methods. Management’s future financial projections used in the discounted cash flow model included organic net sales growth and net sales growth through new customer and product channels as well as continued operating efficiencies in future periods.
The Company elected to perform a quantitative goodwill impairment test as of December 31, 2023. The fair value was approximately 7% greater than its carrying amount, thus no impairment was recognized. Due to the many variables inherent in the estimation of a reporting unit’s fair value and the relative size of our recorded goodwill, differences in assumptions could have a material effect on the estimated fair value of our reporting unit and could result in a goodwill impairment charge in a future period.
No goodwill impairments have been recognized in 2023, 2022, or 2021.
Leases
At inception, the Company determines whether an arrangement is a lease and the appropriate lease classification. Operating leases with terms greater than twelve months are included as operating lease right-of-use (“ROU”) assets, and lease liabilities within current portion of operating lease liability and operating lease liability less current portion on the consolidated balance sheets. Finance leases with terms greater than twelve months are included as finance ROU assets within property and office equipment, and finance lease liabilities within current portion of long-term debt and long-term debt, less current portion on the consolidated balance sheets. Leases with terms of less than twelve months, referred to as short-term leases, do not create a ROU asset or lease liability on the balance sheet.
ROU assets represent the right to use an underlying asset for the lease term. Lease liabilities represent the obligation to make lease payments arising from the lease. Operating lease ROU assets and liabilities are recognized at the commencement date of the lease, based on the present value of lease payments over the lease term. As most of the Company's leases do not provide an implicit rate, the Company uses its incremental borrowing rate based on the information available at the commencement date in determining the present value of lease payments. The Company’s incremental borrowing rate for a lease is the rate of interest it would have to pay on a collateralized basis to borrow an amount equal to the lease payments under similar terms. Finance leases are recognized on the date the asset is placed into service at the cost of capital. For both operating and finance leases, the initial ROU asset equals the lease liability, plus initial direct costs and favorable lease commitments, less lease incentives received. The Company's lease agreements may include options to extend or terminate the lease, which are included in the lease term at the commencement date when it is
reasonably certain that the Company will exercise that option. In general, the Company does not consider optional periods included in the lease agreements as reasonably certain of exercise at inception.
The Company has lease agreements with lease and non-lease components, which are generally accounted for separately. Variable lease payments (for example, common area maintenance and real estate tax charges) are recorded separately from the determination of the ROU asset and lease liability.
Other Intangible Assets
Other intangible assets primarily include customer relationships, non-compete agreements, trade names, developed technology, and patents. Other intangible assets are amortized over their estimated economic lives of two to fifteen years. The straight-line method of amortization generally reflects an appropriate allocation of the cost of the intangible assets to earnings in proportion to the amount of economic benefits obtained by the Company in each reporting period. However, for certain customer relationships, the sum-of-the-years-digits amortization method more appropriately allocates the cost to earnings in proportion to the estimated amount of economic benefit obtained.
Deferred Financing Costs
and Debt Discount
FinancingUnamortized financing costs and discounts associated with issuing debt are presented in the consolidated balance sheet as a direct deduction from the carrying amount of the debt and are deferred and amortized to interest expense over the related terms using the effective interest rate method.
AcquisitionsAcquisitions
We accountThe Company accounts for business acquisitions in accordance with ASC 805, Business Combinations.Combinations. This standard requires the acquiring entity in a business combination to recognize all (and only) the assets acquired and liabilities assumed in the transaction and establishes the acquisition-date fair value as the measurement objective for all assets acquired and liabilities assumed in a business combination. Certain provisions of this standard prescribe, among other things, the determination of acquisition-date fair value of consideration paid in a business combination (including contingent consideration) and the exclusion of transaction and acquisition-related restructuring costs from acquisition accounting.
Assigning estimated fair values to the net assets acquired requires the use of significant estimates, judgments, inputs, and assumptions regarding the fair value of the assets acquired and liabilities assumed as of the acquisition date. The Company may refine the estimated fair values of assets acquired and liabilities assumed over a period not to exceed one year from the date of acquisition by taking into consideration new information about facts and circumstances that existed as of the acquisition date. Purchase price allocation revisions that occur outside of the measurement period, if applicable, are recorded within cost of revenue or selling, general and administrative expense within the consolidated statements of operations depending on the nature of the adjustment.
Revenue Recognition
Customer arrangements typically
The Company recognizes revenue in accordance with ASC 606, Revenue from Contracts with Customers. Revenue is recognized upon transfer of control of promised products or services to customers in an amount that reflects the consideration the Company expect to receive in exchange for those products or services. Many of the Company’s customers have multiple contracts and have revenue reported in multiple service lines. The Company’s contracts may include a base level of services provided for a stated period of time, optional services provided upon request, or products. Each of these products and services are generally capable of being distinct and are accounted for as separate performance obligations to provide equipment solutions, clinical engineering and/or onsite equipment managed services on a per use and/or over time basis. Consideration paid by the customerobligations.
The price for each performance obligation is billed withinstated in the monthcustomer contract and is based upon a price that would be charged to a customer if the product or service were sold on a standalone basis (the list price). Any discount from the list price provided to a customer for a product or service is performed,allocated among the performance obligations based upon their individual standalone selling prices.
Service revenue is typically recognized over time as the services are provided. When services are provided for a stated period of time, revenue is generally recognized ratably over the period services are provided. In certain circumstance, optional services may be provided on a time and contractual pricesmaterials basis. In these circumstances, revenue is recognized in an
amount that corresponds to the actual time and expense incurred. Product revenue is recognized when the Company transfers control of a good, which occurs at a point in time.
Revenue is recognized net of allowances for estimated rebates and group purchasing organization ("GPO") fees, which are established
within our customer arrangements thatat the time of sale. Adjustments are
representative of the stand-alone selling price.made to these allowances at each reporting period. Taxes assessed by a governmental authority that are both imposed on and concurrent with a specific revenue-producing transaction, that are collected by the Company from a customer, are excluded from revenue.
The Company’s performance obligations that are satisfied at a point in time are recognized when the service is performed or equipment is delivered to the customer. For performance obligations satisfied over time, the Company uses a straight line method to recognize revenue ratably over the contract period, as this coincides with the Company’s performance under the contract.From time to time the Company receives both non-monetary and cash refunds on equipment recalled by manufacturers. It is the Company’s practice to record such recall gains as a reduction in cost of revenue.
The Company incurs incremental costs related to obtaining new contracts.contracts, primarily for commissions and implementation. Management expects those costs attributable to new revenue production are recoverable and therefore the Company capitalizes them as contract costs in accordance with ASC Topic 340,Other Assets and Deferred Costs, and is amortizing them over the anticipated period of the new revenue production.Leases
At inception, we determine whether an arrangement isproduction which the Company estimates to be a lease and the appropriate lease classification. Operating leases with terms greater than twelve months are included as operating lease right-of-use (“ROU”) assets, and lease liabilities within current portionperiod of operating lease liability and operating lease liability less current portion on our consolidated balance sheets. Finance leases with terms greater than twelve months are included as finance ROU assets within property and office equipment, and finance lease liabilities within current portion of long-term debt and long-term debt, less current portion on our consolidated balance sheets. Leases with terms of less than twelve months, referred to as short-term leases, dofive years. The Company does not create a ROU asset or lease liability on the balance sheet.
ROU assets represent our right to use an underlying asset for the lease term. Lease liabilities represent our obligation to make lease payments arising from the lease. Operating lease ROU assets and liabilities are recognized at the commencement date of the lease, based on the present value of lease payments over the lease term. As most of our leases do not provide an implicit rate, we use our incremental borrowing rate based on the information available at the commencement date in determining the present value of lease payments. The company’s incremental borrowing rate for a lease is the rate of interest it would have to pay on a collateralized basis to borrow an amount equal to the lease payments under similar terms. For both operating and finance leases, the initial ROU asset equals the lease liability, plus initial direct costs, plus favorable lease commitments, less lease incentives received. Our lease agreements may include options to extend or terminate the lease, which are included in the lease term at the commencement date when it is reasonably certain that we will exercise that option. In general, we do not consider optional periods included in our lease agreements as reasonably certain of exercise at inception.any material contract liabilities.
We have lease agreements with lease and non-lease components, which are generally accounted for separately. Variable lease payments (for example, common area maintenance and real estate tax charges) are recorded separately from the determination of the ROU asset and lease liability.
Derivative Financial Instruments
The Company has an interest rate swap agreement which it uses as a derivative financial instrument to manage its interest rate exposure. The Company does not use financial instruments for trading or other speculative purposes.
ASC Topic 815, “Derivatives and Hedging,” establishes accounting and reporting standards requiring that derivative instruments be recorded on the balance sheet as either an asset or liability measured at fair value. The statementstandard requires that changes in the derivative’s fair value be recognized currently in earnings unless specific hedge accounting criteria are met. If hedge accounting criteria are met, the changes in a derivative’s fair value (for a cash flow hedge) are deferred in stockholders’ equity as a component of accumulated other comprehensive loss. These deferred gains and losses are recognized as income in the period in which hedged cash flows occur. The ineffective portions of hedge returns are recognized as earnings. The Company accounts for deferred income taxes utilizing ASC Topic 740, “Income Taxes.” ASC Topic 740 requires the asset and liability method, whereby deferred tax assets and liabilities are recognized based on the tax effects of temporary differences between the financial statement and the tax bases of assets and liabilities, as measured at current enacted tax rates. We haveThe Company has assessed the need for a valuation allowance by considering whether it is more likely than not that some portion or all of ourthe Company's deferred tax assets will not be realized. We continueThe Company continues to evaluate ourits ability to realize the tax benefits associated with deferred tax assets by analyzing the relative impact of all the available positive and negative evidence regarding ourits forecasted taxable income, the reversal of existing deferred tax liabilities, taxable income in prior carry-back years (if permitted) and the availability of tax planning strategies. In future reporting periods, wethe Company will continue to assess the likelihood that deferred tax assets will be realizable. Interest and penalties associated with uncertain income tax positions is classified as income tax expense. Fair Value of
Other Financial Instruments
The
Company considers that the carrying amount of financial instruments
includingof the Company include cash and cash equivalents, accounts receivable,
interest rate swap, deferred compensation, accounts payable,
and accrued liabilities,
approximate fair value due to their short maturities. The fair value of our outstanding First Lien Term Loancontingent compensation, contingent consideration, debt obligations, and
Second Lien Term Loan (each as defined in Note 7, Long-Term Debt), based on the quoted market price for the same or similar issues of debt, which represents a Level 2 fair value measurement, is approximately:
| | | | | | | | | | | | |
| | December 31, 2021 | | December 31, 2020 |
| | (Successor) | | (Successor) |
| | Carrying | | Fair | | Carrying | | Fair |
(in thousands) | | Value | | Value | | Value | | Value |
First Lien Term Loan (1) | | $ | 1,167,649 | | $ | 1,174,871 | | $ | 906,624 | | $ | 911,788 |
Second Lien Term Loan (2) | | | — | | | — | | | 232,361 | | | 240,000 |
(1) | The carrying value of the First Lien Term Loan is net of unamortized deferred financing costs of $10.4 million and $12.8 million and unamortized debt discount of $5.0 million and $2.8 million as of December 31, 2021 and 2020, respectively. |
(2) | The carrying value of the Second Lien Term Loan is net of unamortized deferred financing costs of $0.8 million and unamortized debt discountof $6.8 million as of December 31, 2020. |
Share-Based Compensation
Share-based compensation expense related to stock options is measured by the fair value of the stock options on the date of grant, net of the estimated forfeiture rate. We determine the fair value of options using the Black-Scholes option pricing model. The estimated fair value of options is recognized as expense on a straight-line basis over the options’ vesting periods. The fair value of the stock options contain certain assumptions, such as the risk-free interest rate, expected volatility, dividend yield and expected option life.
Share-based compensation expense related to restricted stock units and performance restricted stock units is recorded based on the market value of our common stock on the date of grant, net of the estimated forfeiture rate. The expense is recognized over the requisite service period.
Our performance restricted stock units award have a graded vesting schedule. The expense is recognized for each separately vesting tranche as though each tranche of the award is, in substance, a separate award. The amount of compensation expense recognized for performance restricted stock units is dependent upon an assessment of the likelihood of achieving the performance conditions and is subject to adjustment based on management’s assessment of the Company’s performance relative to the target number of shares performance criteria.
Comprehensive Income (Loss)
Comprehensive income (loss) is comprised of net income (loss) and other comprehensive income (loss). Other comprehensive income (loss) includes minimum pension liability adjustments and cash flow hedge. These amounts are presented in the consolidated statements of comprehensive income (loss) net of reclassification adjustments to earnings.
Use of Estimates
The preparation of financial statements in conformity with accounting principles generally accepted in the United States of America (“GAAP”) requires management to make estimates and assumptions that affect the reported amounts of assets and liabilities and disclosure of contingent assets and liabilities at the date of the financial statements and the reported amounts of revenue and expenses during the reporting period. Examples include, but are not limited to, estimates for fair value measurements in business combinations, valuation of long-lived assets, including goodwill and definite-lived intangible assets and valuation of obligation under the tax receivable agreement. Actual results could differ from those estimatesTax Receivable Agreement ("TRA").
.Recent Accounting Pronouncements
Standards Adopted
In December 2019,
Fair value is defined as the FASB issued ASU No. 2019-12 Income Taxes (Topic 740): Simplifyingexit price, or the Accounting for Income Taxes (“ASU 2019-12”). ASU 2019-12 simplifies the accounting for income taxes by removing certain exceptionsamount that would be received to the general principles in Topic 740 relatedsell an asset or paid to the approach for intraperiod tax allocation, the methodology for calculating income taxestransfer a liability in an interim period and recognition of deferred tax liabilities. This standard also simplifies the accounting for franchise taxes and enacted change in tax laws or rates and clarifies the accounting for transactions that result in a step-uporderly transaction between market participants in the basis of goodwill. The ASU is effective for annual and interim periods in fiscal years beginning after December 15, 2020. Early adoption is permitted. We adopted this standard on January 1, 2021. The adoption of this standard did not have a material impact on our consolidated financial statements.Standards Not Yet Adopted
In October 2021, the FASB issued ASU No. 2021-08 Business Combinations (Topic 805)-Accounting for Contract Assets and Contract Liabilities from Contracts with Customers (“ASU 2021-08”). ASU 2021-08 improves the accounting for acquired revenue contracts with customers in a business combination. The amendments in this ASU require that an entity (acquirer) recognize and measure contract assets and contract liabilities acquired in a business combination in accordance with Topic 606. At the acquisition date, an acquirer should account for the related revenue contracts in accordance with Topic 606principal or most advantageous market as if it had originated the contracts. To achieve this, an acquirer may assess how the acquiree applied Topic 606 to determine what to record for the acquired revenue contracts. The ASU is effective for fiscal years beginning after December 15, 2022, including interim periods within those fiscal years. Early adoption of the amendments is permitted. We will continue to evaluate ASU 2021-08, but do not expect the adoption will have a material impact on our consolidated our consolidated financial statements.
In March 2020, the FASB issued ASU No. 2020-04 Reference Rate Reform (Topic 848) Facilitation of the Effects of Reference Rate Reform on Financial Reporting (“ASU 2020-04”). ASU 2020-04 provides optional expedients and
exceptions for applying GAAP to contracts, hedging relationships, and other transactions that reference LIBOR or another reference rate expected to be discontinued because of reference rate reform. The ASU may be applied through December31, 2022. We will continue to evaluate the phase out of LIBOR but do not expect the adoption will have a material impact on our consolidated financial statements.
3. Revenue Recognition
In the following table, revenue is disaggregated by service solution:
| | | | | | | | | |
| | | | | | From |
| | | | | | January 4 |
| | Year Ended | | through |
| | December 31, | | December 31, |
(in thousands) | | 2021 | | 2020 | | 2019 |
| | (Successor) | | (Successor) | | (Successor) |
Disaggregated Revenue | | | | | | | | | |
Equipment Solutions | | $ | 352,094 | | $ | 296,267 | | $ | 253,597 |
Clinical Engineering | | | 384,147 | | | 256,874 | | | 188,752 |
Onsite Managed Services | | | 302,449 | | | 220,171 | | | 170,724 |
Total revenue | | $ | 1,038,690 | | $ | 773,312 | | $ | 613,073 |
The Company capitalizes contract costs incurred in obtaining new contracts. The contract asset included in other long-term assets in the Consolidated Balance Sheet at December 31, 2021 and December 31, 2020 was $15.9 million and $13.4 million, respectively. Capitalized costs are amortized over the expected life of the related contracts, which is estimated to be five years. Amortization is computed on a straight-line basis, which coincides with the predominant expected life of the underlying contracts. Amortization costs are reflected in cost of revenue and selling, general and administrative expenses. The amount of amortization included in cost of revenue was $0.7 million, $0.4 million and $0.1 million for the years ended December 31, 2021 and 2020, and for the period from January 4 through December 31, 2019, respectively. The amount of amortization included in selling, general and administrative expense was $3.1 million, $2.0 million and $0.5 million for the years ended December 31, 2021 and 2020, and for the period from January 4 through December 31, 2019, respectively. There was 0 impairment loss in relation to the costs capitalized during the years ended December 31, 2021 and 2020, and for the period from January 4 through December 31, 2019.
4. Acquisitions
On October 1, 2021, we completed a stock purchase agreement to purchase all of the outstanding capital stock of Sizewise Rentals, LLC (“Sizewise”), a privately held manufacturer and distributor of specialty patient handling equipment, for a total consideration of approximately $234.8 million (“Sizewise Acquisition”). The results of Sizewise’s operations have been included in the consolidated financial statements since October 1, 2021.
The following summarizes the preliminary fair values of assets acquired and liabilities assumed at the date of the Sizewise Acquisition within our consolidated balance sheet:
| | | |
(in thousands) | | | |
Cash | | $ | 9,977 |
Accounts receivable | | | 31,005 |
Inventories | | | 27,911 |
Other current assets | | | 2,968 |
Property and equipment | | | 59,042 |
Goodwill | | | 87,867 |
Operating lease right-of-use assets | | | 16,754 |
Other intangibles | | | 67,700 |
Other long-term assets | | | 10,368 |
Accounts payable | | | (3,362) |
Accrued compensation | | | (12,576) |
Other accrued expenses | | | (4,525) |
Operating lease liability | | | (16,953) |
Other long-term liabilities | | | (9,924) |
Deferred income taxes | | | (31,470) |
Total purchase price | | $ | 234,782 |
The acquired intangible assets, all of which are finite-life, are comprised of trade name, developed technology and customer relationships, have a weighted average useful life of approximately 14.4 years. The total amount of goodwill that is deductible for tax purposes is $1.4 million.
Due to the recent closing of the transaction, the purchase price allocation is preliminary and will be finalized when final assessments of the fair value of acquired assets and assumed liabilities are completed. The area of the purchase price allocation that is not yet finalized includes income tax related matters. The Company will make appropriate adjustments to the purchase price allocation prior to completion of the measurement period, as required.
This Sizewise Acquisition was funded from additional borrowing under our first lien term loandate. ASC 820, Fair Value Measurements, provides a fair value hierarchy that prioritizes the inputs to valuation techniques used to and cash. Transaction costs of $3.2 million for legal and other related costs incurred in connection with the acquisition of Sizewise were expensed as incurred for the year ended December 31, 2021.
On March 19, 2021, we completed a stock purchase agreement to purchase allis composed of the outstanding capital stock of Northfield Medical, Inc. (“Northfield”), a company specializing in the service and repair of medical equipment and instruments for a total consideration of approximately $472.3 million (“Northfield Acquisition”). The consideration consisted of $461.0 million of cash paid and $11.3 million in issuance of 752,328 shares of common stock. The results of Northfield’s operations have been included in the consolidated financial statements since March 19, 2021. During the year ended December 31, 2021, adjustments affecting the fair values of assets acquired and liabilities assumed decreased accounts receivable $0.2 million, increased goodwill $1.3 million, increased accounts payable $0.1 million, and increased deferred income taxes $1.0 million. All adjustments net to 0.
following levels:The following summarizes the fair values of assets acquired and liabilities assumed at the date of acquisition within our consolidated balance sheet:
| | | |
(in thousands) | | | |
Cash | | $ | 10,767 |
Accounts receivable | | | 16,786 |
Inventories | | | 5,810 |
Other current assets | | | 502 |
Property and equipment | | | 11,713 |
Goodwill | | | 306,678 |
Operating lease right-of-use assets | | | 4,815 |
Other intangibles | | | 183,700 |
Accounts payable | | | (7,412) |
Accrued compensation | | | (7,948) |
Other accrued expenses | | | (9,620) |
Finance lease liability | | | (2,340) |
Operating lease liability | | | (5,025) |
Other long-term liabilities | | | (837) |
Deferred income taxes | | | (35,324) |
Total purchase price | | $ | 472,265 |
The Other intangibles represent acquired finite-life customer relationships, which is amortized over 15 years using the sum of the years’ digits method. The total amount of goodwill that is deductible for tax purposes is $68.2 million.
The Northfield Acquisition was funded with additional borrowings under our first lien term loan, revolving loan and cash. Transaction costs of $4.2 million for legal and other related costs incurred in connection with the acquisition of Northfield were expensed as incurred for the year ended December 31, 2021.
The following unaudited pro forma consolidated results of operations assume the Sizewise and Northfield acquisitions had occurred on January 1, 2020. The unaudited pro forma consolidated financial information should not be relied upon as necessarily being indicative of the historical results that would have been obtained if the acquisitions had actually closed on that date, nor the results that may be obtained in the future:
| | | | | | |
| | Year Ended |
| | December 31, |
(unaudited, in thousands) | | 2021 | | 2020 |
| | (Successor) | | (Successor) |
Revenue | | $ | 1,186,472 | | $ | 1,035,181 |
Net income (loss) attributable to Agiliti, Inc. and Subsidiaries | | | 28,493 | | | (31,375) |
Included in the determination of pro forma net income (loss) for the years ended December 31, 2021 and 2020 are pro forma charges for various purchase accounting adjustments. These pro forma adjustments included depreciation and amortization of assets acquired and interest expense on additional debt to finance the acquisition. Income taxes are provided at the estimated statutory rate.
On December 11, 2020, we completed the acquisition of certain assets of a surgical laser equipment solutions provider for total consideration of approximately $8.9 million. The result of the acquired company’s operations have been included in the consolidated financial statements since that date.
On January 31, 2020, we completed the acquisition of certain assets of a surgical equipment repair and maintenance service provider for total consideration of approximately $88.3 million. The result of the acquired company’s operations have been included in the consolidated financial statements since that date.
The following summarized the fair value of assets acquired and liabilities assumed at the date of acquisition within our consolidated balance sheet:
| | | |
(in thousands) | | | |
Cash | | $ | 51 |
Accounts receivable | | | 10,447 |
Inventories | | | 4,591 |
Other current assets | | | 208 |
Property and equipment | | | 3,534 |
Goodwill | | | 35,554 |
Operating lease right-of-use assets | | | 2,422 |
Other intangibles | | | 34,714 |
Accounts payable | | | (1,333) |
Accrued compensation | | | (494) |
Other accrued expenses | | | (275) |
Operating lease liability | | | (1,142) |
Total purchase price | | $ | 88,277 |
The acquired intangible assets, all of which are of finite-life, are comprised of trade name and customer relationships and have a weighted average useful life of approximately 14.5 years. The total amount of goodwill that is deductible for tax purposes is $35.4 million.
This acquisition was funded from the revolving loan.
5. Fair Value Measurements
Financial assets and liabilities measured at fair value on a recurring basis as of December 31, 2021 and 2020 are summarized in the following tables by type of inputs applicable to the fair value measurements:
| | | | | | | | | | | | |
| | Fair Value at December 31, 2021 |
| | (Successor) |
(in thousands) | | Level 1 | | Level 2 | | Level 3 | | Total |
Assets: | | | | | | | | | | | | |
Deferred compensation assets | | $ | 2,452 | | $ | — | | $ | — | | $ | 2,452 |
Interest rate swap | | | — | | | 2,093 | | | — | | | 2,093 |
Liabilities: | | | | | | | | | | | | |
Contingent consideration | | $ | — | | $ | — | | $ | 500 | | $ | 500 |
Obligation under tax receivable agreement | | | — | | | — | | | 39,880 | | | 39,880 |
Interest rate swap | | | — | | | — | | | — | | | — |
Deferred compensation liabilities | | | 2,452 | | | — | | | — | | | 2,452 |
| | | | | | | | | | | | |
| | Fair Value at December 31, 2020 |
| | (Successor) |
(in thousands) | | Level 1 | | Level 2 | | Level 3 | | Total |
Assets: | | | | | | | | | | | | |
Deferred compensation assets | | $ | 1,104 | | $ | — | | $ | — | | $ | 1,104 |
Liabilities: | | | | | | | | | | | | |
Contingent consideration | | $ | — | | $ | — | | $ | 321 | | $ | 321 |
Obligation under tax receivable agreement | | | — | | | — | | | 50,600 | | | 50,600 |
Interest rate swap | | | — | | | 1,883 | | | — | | | 1,883 |
Deferred compensation liabilities | | | 1,104 | | | — | | | — | | | 1,104 |
A description of the inputs used in the valuation of assets and liabilities is summarized as follows:
Level 1 — Inputs represent unadjusted quoted prices for identical assets or liabilities exchanged in active markets.
Level 2 — Inputs include directly or indirectly observable inputs other than Level 1 inputs such as quoted prices for similar assets or liabilities exchanged in active or inactive markets; quoted prices for identical assets or liabilities exchanged in inactive markets; other inputs that are considered in fair value determinations of the assets or liabilities, such as interest rates and yield curves that are observable at commonly quoted intervals, volatilities, prepayment speeds, loss severities, credit risks and default rates; and inputs that are derived principally from or corroborated by observable market data by correlation or other means.
Level 3 — Inputs include unobservable inputs used in the measurement of assets and liabilities. Management is required to use its own assumptions regarding unobservable inputs because there is little, if any, market activity in the assets or liabilities or related observable inputs that can be corroborated at the measurement date. Measurements of non-exchange traded derivative contract assets and liabilities are primarily based on valuation models, discounted cash flow models or other valuation techniques that are believed to be used by market participants. Unobservable inputs require management to make certain projections and assumptions about the information that would be used by market participants in pricing assets or liabilities.
The Company considers that the carrying amount of financial instruments, including accounts receivable, accounts payable and accrued liabilities approximates fair value due to their short maturities. The deferred compensation assets are held in mutual funds. The fair value of the deferred compensation assets and liabilities is based on the quoted market prices for the mutual funds and thus represents a Level 1 fair value measurement. The fair value of the Company's outstanding First Lien Term Loan (each as defined in Note 7, Long-Term Debt), based on the quoted market price for the same or similar issues of debt, represents a Level 2 fair value measurement. The fair value of the Company’s revolving line of credit facilities and long-term debt are based on current lending rates for similar borrowings, assuming the debt is outstanding through maturity, and considering the collateral. The carrying amounts of variable interest rate long-term debt and revolving line of credit facilities approximate their fair values because the variable interest rates of these instruments are generally reset monthly. The fair value of the Company's non-variable interest rate debt is estimated by discounting future cash flows at currently available rates for borrowing arrangements with similar terms and conditions, which are considered to be Level 2 inputs under the fair value hierarchy.
The fair value of the Company’s derivative instruments designated as hedge instruments, which are considered Level 2 inputs under the fair value hierarchy, are determined using standard pricing models and market-based assumptions for all significant inputs, such as yield curves and quoted spot and forward exchange rates.
The fair value of the Company’s contingent consideration obligation is determined utilizing a series of call options with strike prices at revenue thresholds defined in the acquisition purchase agreement. The fair value of the Company’s contingent compensation obligation is determined using projected financial information. The TRA obligation is valued using a discounted cash flow analysis given that the fair value of the liability is expected to approximate the maximum obligation under the TRA. The assumptions used in preparing the discounted cash flow analyses include estimates of interest rates and the timing and amount of incremental cash flows. These fair value measurements are based on significant unobservable inputs in the market and thus represents a Level 3 measurement within the fair value hierarchy.
Share-Based Compensation
Share-based compensation expense related to stock options is measured by the fair value of the stock options on the date of grant. The Company determines the fair value of options using the Black-Scholes option pricing model incorporating certain assumptions, including the risk-free interest rate, expected volatility, dividend yield and expected option life.
Share-based compensation expense related to restricted stock units is recorded based on the market value of the Company's common stock on the date of grant.
The fair value of the Company's performance restricted stock unit awards is initially measured using a Monte-Carlo simulation model in order to incorporate a total shareholder return multiplier. Subsequent measurement is based on expected level of achievement of a 3-year cumulative adjusted EBITDA target.
The Company has an employee stock purchase plan (“ESPP”) under which shares of the Company’s common stock are available for purchase by eligible participants. The plan allows participants to purchase the Company's common stock at 85% of its fair market value at the end of the six-month offering period ending on April 30 and October 31 each year. The fair value of purchases is estimated based on actual employee contributions during the offering period.
The expense related to all awards is recognized evenly over the requisite service period within the same statement of operations line item in which cash compensation is recorded for each participant.
Treasury Stock
The Company records treasury stock at the cost to acquire common stock on the open market. Share reissuances for vested restricted stock units and exercised stock options are made on FIFO basis. Treasury stock is presented as a separate line item on the Company's balance sheet.
Comprehensive Income (Loss)
Comprehensive income (loss) is comprised of net income (loss) and other comprehensive income (loss). Other comprehensive income (loss) includes minimum pension liability adjustments and unrealized fair value adjustments to the cash flow hedge. These amounts are presented in the consolidated statements of comprehensive income (loss) net of reclassification adjustments to earnings, if any.
Earnings (Loss) Per Share
Basic earnings (loss) per share ("EPS") is computed by dividing net income (loss) by the weighted average number of common shares outstanding during the period. Diluted EPS includes the effect of all potentially dilutive common stock equivalents by application of the treasury stock method, which considers the effect on a per share basis of restricted stock units, performance restricted stock units, and stock options as if they had been converted to common stock at the beginning of the periods presented, or issuance date, if later. Potential shares that have an anti-dilutive effect are excluded from the calculation of diluted EPS and presented separately.
Use of Estimates
The preparation of financial statements in conformity with accounting principles generally accepted in the United States of America (“GAAP”) requires management to make estimates and assumptions that affect the reported amounts of assets and liabilities and disclosure of contingent assets and liabilities at the date of the financial statements and the reported amounts of revenue and expenses during the reporting period. Examples include, but are not limited to, estimates for fair value measurements in business combinations including recoverability and valuation of long-lived assets, goodwill and definite-lived intangibles, and interest rate swaps. Actual results could differ from those estimates.
Recent Accounting Pronouncements
Standards Adopted
In October 2021, the FASB issued Accounting Standards Update No. 2021-08 Business Combinations (ASC 805): Accounting for Contract Assets and Contract Liabilities from Contracts with Customers (“ASU 2021-08”). ASU 2021-08 improves the accounting for acquired revenue contracts with customers in a business combination. The amendments in this ASU require that an entity (acquirer) recognize and measure contract assets and contract liabilities acquired in a business combination in accordance with ASC 606. At the acquisition date, an acquirer should account for the related revenue contracts in accordance with ASC 606 as if it had originated the contracts. To achieve this, an acquirer may assess how the acquiree applied ASC 606 to determine what to record for the acquired revenue contracts. The ASU is effective for fiscal years beginning after December 15, 2022, including interim periods within those fiscal years. Early adoption of the amendments is permitted. The Company adopted this standard as of January 1, 2023. The adoption of this standard did not have a material impact on the consolidated financial statements.
In March 2020, the FASB issued ASU No. 2020-04 Reference Rate Reform (ASC 848): Facilitation of the Effects of Reference Rate Reform on Financial Reporting (“ASU 2020-04”). ASU 2020-04 provides optional expedients and exceptions for applying GAAP to contracts, hedging relationships, and other transactions that reference the London Interbank Offered Rate ("LIBOR") or another reference rate expected to be discontinued because of reference rate reform. In December 2022, the FASB issued ASU No. 2022-06 Reference Rate Reform (ASC 848): Deferral of the Sunset Date of ASC 848 ("ASU 2022-06"), which delayed the adoption of reference rate reform from December 31, 2022, to December 31, 2024. The Company adopted these standards on May 1, 2023. The adoption did not have a material impact on the consolidated financial statements. Refer to Note 7, Long-Term Debt for details surrounding the adoption of ASU 2020-04 and ASU 2022-06.
Standards Not Yet Adopted
In November 2023, the FASB issued ASU No. 2023-07 Segment Reporting (ASC 280): Improvements to Reportable Segment Disclosures ("ASU 2023-07"). The ASU requires that an entity disclose significant segment expenses impacting profit and loss that are regularly provided to the chief operating decision maker. The update is required to be applied retrospectively to prior periods presented, based on the significant segment expense categories identified and disclosed in the period of adoption. The amendments in this ASU are required to be adopted for fiscal years beginning after December 15, 2023, and interim periods within fiscal years beginning after December 15, 2024. Early adoption is permitted. The Company is currently evaluating the impact of this standard on the consolidated financial statements and related disclosures.
In December 2023, the FASB issued ASU No. 2023-09, Income Taxes (ASC 740): Improvements to Income Tax Disclosures ("ASU 2023-09). ASU 2023-09 is intended to enhance the transparency and decision usefulness of income tax disclosures. The amendments in ASU 2023-09 address investor requests for enhanced income tax information primarily through changes to the rate reconciliation and income taxes paid information. Early adoption is permitted. A public entity should apply the amendments in ASU 2023-09 prospectively to all annual periods beginning after December 15, 2024. The Company is currently evaluating the impact of this standard on the consolidated financial statements and related disclosures.
3. Revenue Recognition
In the following table, revenue is disaggregated by service solution:
| | | | | | | | | | | | | | | | | | | | |
| | Year Ended December 31, |
| (in thousands) | | 2023 | | 2022 | | 2021 |
| Disaggregated Revenue | | | | | | |
| Equipment Solutions | | $ | 459,797 | | | $ | 438,682 | | | $ | 352,094 | |
| Clinical Engineering | | 459,013 | | | 420,685 | | | 384,147 | |
| Onsite Managed Services | | 255,794 | | | 261,925 | | | 302,449 | |
| Total revenue | | $ | 1,174,604 | | | $ | 1,121,292 | | | $ | 1,038,690 | |
The Company capitalizes contract costs incurred in obtaining new contracts. The contract asset included in other long-term assets in the consolidated balance sheets as of December 31, 2023 and December 31, 2022 was $14.8 million and $17.3 million, respectively. Capitalized costs are amortized over the expected life of the related contracts, which is estimated to be five years.
Amortization is computed on a straight-line basis, which coincides with the predominant expected life of the underlying contracts. Amortization costs are reflected in cost of revenue and selling, general and administrative expenses. The amount of amortization included in cost of revenue was $1.4 million, $1.1 million and $0.7 million for the years ended December 31, 2023, 2022, and 2021, respectively. The amount of amortization included in selling, general and administrative expense was $4.9 million, $4.2 million and $3.1 million for the years ended December 31, 2023, 2022, and 2021, respectively.
There was no impairment loss in relation to the costs capitalized during the years ended December 31, 2023, 2022, and 2021.
4. Acquisitions
The Company completed a small acquisition of certain assets of an equipment manufacturer during the year ended December 31, 2023.
On December 15, 2022, the Company completed the acquisition of certain assets of a surgical laser equipment solutions provider for total consideration of approximately $51.2 million funded by cash on hand and a draw on the line of credit. On December 1, 2022, the Company completed the acquisition of certain assets of a surgical equipment and repair services provider for total consideration of $9.7 million funded by cash on hand and common stock issuance. During the year ended
December 31, 2023, the Company made a payment of $0.4 million to settle a revenue-based contingent consideration agreement made in connection with this acquisition.
During fiscal years ended December 31, 2022 and 2021, the Company completed the acquisition of several small surgical equipment repair companies, which included contingent compensation arrangements. As a result, the Company made earn-out payments of $2.8 million and $0.9 million during the years ended December 31, 2023 and 2022, respectively.
All fiscal year 2022 acquisitions qualify as business combinations under ASC 805 and are accounted for using the acquisition method. The results of operations of acquisitions are included in the accompanying consolidated financial statements from the acquisition date. Unaudited pro forma financial information has not been disclosed for the fiscal year 2022 acquisitions as they are not considered material to the Company's consolidated results of operations. Purchase accounting was finalized for the fiscal year 2022 acquisitions as of March 31, 2023.
The following summarizes the preliminary fair value of assets acquired and liabilities assumed within the consolidated balance sheet for the fiscal year 2022 transactions:
| | | | | |
| (in thousands) | |
| Accounts receivable | $ | 372 | |
| Prepaid expenses | 80 | |
| Inventories | 3,503 | |
| Property and equipment | 9,001 | |
| Goodwill | 26,312 | |
| Operating lease right-of-use assets | 215 | |
| Other non-current assets | 6 | |
| Other intangibles | 24,980 | |
| Accrued expenses | (455) | |
| Operating lease liability | (209) | |
| Total purchase price | $ | 63,805 | |
Prior to the finalization of purchase accounting, 2023 adjustments affecting the fair values of assets acquired and liabilities assumed decreased inventories by $0.2 million and increased accrued expenses and goodwill by $0.1 million and $0.3 million, respectively.
The Company incurred legal and other related costs in connection with the 2022 acquisitions, which were expensed as incurred in the amount of $0.4 million and $1.0 million for the years ended December 31, 2023 and 2022, respectively. Transaction costs are included within selling, general, and administrative costs within the consolidated statements of operations.
On October 1, 2021, the Company completed a stock purchase agreement to purchase all of the outstanding capital stock of Sizewise Rentals, LLC (“Sizewise”), a privately held manufacturer and distributor of specialty patient handling equipment, for a total consideration of approximately $234.8 million (“Sizewise Acquisition”). The results of Sizewise’s operations have been included in the consolidated financial statements since October 1, 2021.
The following summarizes the final fair values of assets acquired and liabilities assumed at the date of the Sizewise Acquisition within the consolidated balance sheet:
| | | | | |
| (in thousands) | |
| Cash | $ | 9,977 | |
| Accounts receivable | 31,005 | |
| Inventories | 27,911 | |
| Other current assets | 2,968 | |
| Property and equipment | 59,042 | |
| Goodwill | 87,867 | |
| Operating lease right-of-use assets | 16,754 | |
| Other intangibles | 67,700 | |
| Other long-term assets | 10,368 | |
| Accounts payable | (3,362) | |
| Accrued compensation | (12,576) | |
| Other accrued expenses | (4,525) | |
| Operating lease liability | (16,953) | |
| Other long-term liabilities | (9,924) | |
| Deferred income taxes | (31,470) | |
| Total purchase price | $ | 234,782 | |
The acquired other intangibles, all of which are finite-life, are comprised of trade name, developed technology, and customer relationships, and have a weighted average useful life of approximately 14.4 years. The total amount of goodwill that is deductible for tax purposes is $1.4 million.
The Sizewise Acquisition was funded from additional borrowing under the first lien term loan and cash. There were no transaction costs incurred in connection with the Sizewise Acquisition for the year ended December 31, 2023. Transaction costs of $0.4 million and $3.2 million for legal and other related costs incurred in connection with the acquisition of Sizewise were expensed as incurred for the years ended December 31, 2022 and 2021, respectively.
On March 19, 2021, The Company completed a stock purchase agreement to purchase all of the outstanding capital stock of Northfield Medical, Inc. (“Northfield”), a company specializing in the service and repair of medical equipment and instruments for a total consideration of approximately $472.3 million (“Northfield Acquisition”). The consideration consisted of $461.0 million of cash paid and $11.3 million in issuance of 752,328 shares of common stock. The results of Northfield’s operations have been included in the consolidated financial statements since March 19, 2021. During the year ended December 31, 2022, adjustments affecting the fair values of assets acquired and liabilities assumed decreased accounts receivable $0.2 million, increased goodwill $1.3 million, increased accounts payable $0.1 million, and increased deferred income taxes $1.0 million. All adjustments net to zero.
The following summarizes the final fair values of assets acquired and liabilities assumed at the date of the Northfield Acquisition within the consolidated balance sheet:
| | | | | |
| (in thousands) | |
| Cash | $ | 10,767 | |
| Accounts receivable | 16,786 | |
| Inventories | 5,810 | |
| Other current assets | 502 | |
| Property and equipment | 11,713 | |
| Goodwill | 306,678 | |
| Operating lease right-of-use assets | 4,815 | |
| Other intangibles | 183,700 | |
| Accounts payable | (7,412) | |
| Accrued compensation | (7,948) | |
| Other accrued expenses | (9,620) | |
| Finance lease liability | (2,340) | |
| Operating lease liability | (5,025) | |
| Other long-term liabilities | (837) | |
| Deferred income taxes | (35,324) | |
| Total purchase price | $ | 472,265 | |
The other intangibles represent acquired finite-life customer relationships, which is amortized over 15 years using the sum of the years’ digits method. The total amount of goodwill that is deductible for tax purposes is $68.2 million.
The Northfield Acquisition was funded with additional borrowings under the First Lien Term Loan, Revolving Credit Facility, and cash. There were no transaction costs incurred in connection with the Northfield Acquisition for the year ended December 31, 2023. Transaction costs for legal and other related costs incurred in connection with the acquisition of Northfield were expensed as incurred in the amount of $0.1 million and $4.2 million for the years ended December 31, 2022 and 2021, respectively.
5. Fair Value Measurements
Financial assets and liabilities measured at fair value on a recurring basis are summarized in the following tables by type of inputs applicable to the fair value measurements:
| | | | | | | | | | | | | | | | | | | | | | | | | | |
| | Fair Value at December 31, 2023 |
| (in thousands) | | Level 1 | | Level 2 | | Level 3 | | Total |
| Assets: | | | | | | | | |
| Deferred compensation assets | | $ | 3,390 | | | $ | — | | | $ | — | | | $ | 3,390 | |
| Interest rate swap | | — | | | 3,140 | | | — | | | 3,140 | |
| Liabilities: | | | | | | | | |
| Obligation under tax receivable agreement | | $ | — | | | $ | — | | | $ | 15,549 | | | $ | 15,549 | |
| Interest rate swap | | — | | | 1,212 | | | — | | | 1,212 | |
| Deferred compensation liabilities | | 3,390 | | | — | | | — | | | 3,390 | |
| | | | | | | | | | | | | | | | | | | | | | | | | | |
| | Fair Value at December 31, 2022 |
| (in thousands) | | Level 1 | | Level 2 | | Level 3 | | Total |
| Assets: | | | | | | | | |
| Deferred compensation assets | | $ | 2,681 | | | $ | — | | | $ | — | | | $ | 2,681 | |
| Interest rate swap | | — | | | 9,212 | | | — | | | 9,212 | |
| Liabilities: | | | | | | | | |
| Contingent compensation | | $ | — | | | $ | — | | | $ | 1,898 | | | $ | 1,898 | |
| Contingent consideration | | — | | | — | | | 248 | | | 248 | |
| Obligation under tax receivable agreement | | — | | | — | | | 38,714 | | | 38,714 | |
| Deferred compensation liabilities | | 2,674 | | | — | | | — | | | 2,674 | |
The deferred compensation assets are held in mutual funds. The fair value of the deferred compensation assets and liabilities is based on the quoted market prices for the mutual funds and thus represents a Level 1 fair value measurement.
On April 17, 2023, the Company entered into an interest rate swap agreement, effective July 2023, to manage interest rate exposure. In May 2020, the Company entered into an interest rate swap agreement which expired in June 2023. For additional information on the interest swap agreements, see Note 7, Long-Term Debt. The carrying amount of the interest rate swap contracts is at fair value, which is determined based on current and forward interest rates as of the balance sheet date and is classified within Level 2.
During fiscal years ended December 31, 2022 and 2021, the Company completed the acquisition of several small surgical equipment repair companies, which included contingent compensation arrangements. As a result, the Company made earn-out payments of $2.8 million and $0.9 million during the years ended December 31, 2023 and 2022, respectively.
The Company also completed the acquisition of another small surgical repair company during the year ended December 31, 2022, which included a revenue-based contingent consideration agreement. An earn-out payment of $0.4 million was made during the year ended December 31, 2023. There were no earn-out payments made during year ended December 31, 2022 in connection with this acquisition.
Finally, in January 2022, a $0.5 million earn-out payment was made to the previous owners of a surgical laser equipment solutions company, from which the Company acquired assets on December 11, 2020, based on achievement of certain revenue results.
On January 4, 2019, wethe Company entered into a tax receivable agreement (“TRA”) with ourits former owners. Historically, the fair value of the liability was estimated using a Monte Carlo simulation model, peer company cost of capital, discount rates and projected financial information. As realization of the tax benefits associated with the federal, state, and local net operating losses has become more certain, the reliance on the Monte Carlo model and projected financial information has decreased andin favor of a discounted cash flow analysis given that the fair value of the liability is expected to approximate the maximum obligation under the TRA. MostThe assumptions used in preparing the discounted cash flow analyses include estimates of interest rates and the timing and amount of incremental cash flows. Given that the information utilized in determining the obligation was not observable in the market, and thus the measurement of the liability represents a Level 3 fair value measurement. If our taxable income decreases significantly,The value of the obligation could also decrease. Wemay decrease in-line with decreases in the Company's estimated taxable income. The Company made a remeasurement adjustment to increase the liability by $4.5 million and $14.3$1.0 million during the yearsyear ended December 31, 20212023 and 2020, respectively. We made a remeasurement adjustment to reducedecrease the liability by $8.0$2.1 million during the period from January 4 throughyear ended December 31, 2019. We2022. The Company made $15.6$24.8 million in payments under the TRA during the year ended December 31, 2021,2023 and 0no payments for the year ended December 31, 2020 and for the period from January 4 through December 31, 2019, respectively.In May 2020, we entered into an interest rate swap agreement to manage our interest rate exposure, see Note 7, Long-Term Debt. The carrying value of interest rate swap contracts is at fair value, which is determined based on current interest rate and forward interest rates as of the balance sheet date and is classified within Level 2.
The assumptions used in preparing the discounted cash flow analyses included estimates of interest rates and the timing and amount of incremental cash flows.
2022.
A reconciliation of the beginning and ending balance for the Level 3 measurement are as follows:
| | | |
(in thousands) | | | |
Balance at December 31, 2019 (Successor) | | $ | 37,669 |
Addition | | | 321 |
Remeasurement adjustment (1) | | | 12,931 |
Balance at December 31, 2020 (Successor) | | $ | 50,921 |
Addition | | | 494 |
Payments | | | (15,577) |
Remeasurement adjustment (1) | | | 4,542 |
Balance at December 31, 2021 (Successor) | | $ | 40,380 |
| (1) | | | | | | | |
| (in thousands) | | |
| Balance as of December 31, 2021 | | $ | 41,130 | |
| Additions | | 3,255 | |
| Payments | | (1,428) | |
Remeasurement adjustments are recognized in change inadjustment (1) | | (2,097) | |
| Balance as of December 31, 2022 | | $ | 40,860 | |
| Additions | | 1,597 | |
| Payments | | (27,950) | |
Remeasurement adjustment (1) | | 1,042 | |
| Balance as of December 31, 2023 | | $ | 15,549 | |
(1)Remeasurement adjustments are recognized within selling, general and administrative expense in the consolidated statements of operations.
Fair Value of Other Financial Instruments
The fair value of the Company's outstanding First Lien Term Loan (as defined in Note 7, Long-Term Debt) is based on the quoted market price for the same or similar issuances of debt, which represents a Level 2 fair value measurement. The fair value is approximately:
| | | | | | | | | | | | | | | | | | | | | | | | | | |
| | December 31, 2023 | | December 31, 2022 |
| (in thousands) | | Carrying
Value | | Fair
Value | | Carrying
Value | | Fair
Value |
First Lien Term Loan (1) | | $ | 1,056,253 | | $ | 1,070,973 | | $ | 1,043,915 | | $ | 1,030,072 |
| | | | | |
| (1) | The carrying amount of the First Lien Term Loan is net of unamortized deferred financing costs of $7.3 million and administrative expense in the Consolidated Statement$8.0 million and unamortized debt discount of Operations.$8.8 million and $2.6 million as of December 31, 2023 and 2022, respectively. |
6. Selected Financial Statement Information
Inventories
The Company's inventories consist of the following:
| | | | | | | | | | | | | | |
| (in thousands) | | December 31,
2023 | | December 31,
2022 |
| Raw materials | | $ | 13,376 | | | $ | 14,575 | |
| Work-in-process | | 400 | | | 692 | |
| Finished goods | | 60,708 | | | 54,865 | |
| Total inventories | | $ | 74,484 | | | $ | 70,132 | |
Property and Equipment
Our
The Company's property and equipment
at December 31, 2021 and 2020 consists of the following:
| | | | | | |
| | December 31, | | December 31, |
(in thousands) | | 2021 | | 2020 |
| | (Successor) | | (Successor) |
Medical Equipment | | $ | 359,284 | | $ | 285,723 |
Less: Accumulated depreciation | | | (209,516) | | | (145,645) |
Medical equipment, net | | | 149,768 | | | 140,078 |
Leasehold improvements | | | 39,026 | | | 28,415 |
Office equipment and vehicles | | | 135,643 | | | 84,231 |
| | | 174,669 | | | 112,646 |
Less: Accumulated depreciation and amortization | | | (66,067) | | | (38,308) |
Property and office equipment, net | | | 108,602 | | | 74,338 |
Total property and equipment, net | | $ | 258,370 | | $ | 214,416 |
| | | | | | | | | | | | | | |
| (in thousands) | | December 31,
2023 | | December 31,
2022 |
| Medical equipment | | $ | 450,564 | | | $ | 405,149 | |
| Less: Accumulated depreciation | | (285,139) | | | (250,620) | |
| Medical equipment, net | | 165,425 | | | 154,529 | |
| Leasehold improvements | | 59,422 | | | 52,046 | |
| Property and office equipment | | 200,560 | | | 165,737 | |
| | 259,982 | | | 217,783 | |
| Less: Accumulated depreciation | | (132,723) | | | (98,354) | |
| Property and office equipment, net | | 127,259 | | | 119,429 | |
| Total property and equipment, net | | $ | 292,684 | | | $ | 273,958 | |
Depreciation expense recognized during the years ended December 31,
2023, 2022, and 2021
2020was $80.2 million, $84.3 million, and
2019 was $103.8 million,
$99.6 million and $96.5 million, respectively.
There were
0no impairment charges on property and equipment during
2021, 20202023, 2022, and
2019.2021.
Goodwill and Other Intangible Assets
Goodwill and other intangible assets as ofduring the year ended December 31, 2021 and 2020 were2023 was recognized as part ofdue to purchase price allocation of theadjustments for acquisitions completed during 2021 and 2020.2022. There were 0no impairment losses recorded on goodwill through December 31, 20212023.Our
The Company's goodwill consists of the following:
| | | | | |
| (in thousands) | |
| Balance at December 31, 2022 | $ | 1,239,106 | |
| Acquisitions | 326 | |
| Balance at December 31, 2023 | $ | 1,239,432 | |
Management elected to perform a quantitative goodwill impairment test as of December 31, 20212023. The fair value was approximately 7% greater than its carrying amount, thus no impairment was recognized. Due to the many variables inherent in the estimation of a reporting unit’s fair value and 2020the relative size of our recorded goodwill, differences in assumptions could have a material effect on the estimated fair value of our reporting unit and could result in a goodwill impairment charge in a future period.
The Company's other intangible assets consist of the following:
| | | |
(in thousands) | | | |
Balance at December 31, 2020 (Successor) | | $ | 817,113 |
Acquisitions | | | 396,008 |
Balance at December 31, 2021 (Successor) | | $ | 1,213,121 |
| | | | | | | | | | | | | | | | | | | | |
| | December 31, 2023 |
| (in thousands) | | Cost | | Accumulated
Amortization | | Net |
| Finite-life intangibles | | | | | | |
| Customer relationships | | $ | 780,806 | | | $ | (353,190) | | | $ | 427,616 | |
| Non-compete agreements | | 1,225 | | | (341) | | | 884 | |
| Trade names | | 7,806 | | | (6,603) | | | 1,203 | |
| Patents | | 310 | | | (11) | | | 299 | |
| Total intangible assets | | $ | 790,147 | | | $ | (360,145) | | | $ | 430,002 | |
Our other intangible assets as of December 31, 2021 and 2020 consist of the following:
| | | | | | | | | | | | |
| | December 31, 2021 |
| | (Successor) |
| | | | Accumulated | | | | |
(in thousands) | | Cost | | Amortization | | Impairment | | Net |
Finite-life intangibles | | | | | | | | | | | | |
Customer relationships | | $ | 756,889 | | $ | (194,312) | | $ | — | | $ | 562,577 |
Non-compete agreements | | | 14,613 | | | (13,222) | | | — | | | 1,391 |
Trade names | | | 9,179 | | | (2,230) | | | — | | | 6,949 |
Developed technology | | | 2,300 | | | (58) | | | — | | | 2,242 |
Total intangible assets | | $ | 782,981 | | $ | (209,822) | | $ | — | | $ | 573,159 |
| | | | | | | | | | | | |
| | December 31, 2020 |
| | (Successor) |
| | | | Accumulated | | | | |
(in thousands) | | Cost | | Amortization | | Impairment | | Net |
Finite-life intangibles | | | | | | | | | | | | |
Customer relationships | | $ | 513,189 | | $ | (118,172) | | $ | — | | $ | 395,017 |
Non-compete agreements | | | 14,613 | | | (9,647) | | | — | | | 4,966 |
Trade names | | | 3,779 | | | (1,667) | | | — | | | 2,112 |
Total intangible assets | | $ | 531,581 | | $ | (129,486) | | $ | — | | $ | 402,095 |
| | | | | | | | | | | | | | | | | | | | |
| | December 31, 2022 |
| (in thousands) | | Cost | | Accumulated
Amortization | | Net |
| Finite-life intangibles | | | | | | |
| Customer relationships | | $ | 780,806 | | | $ | (275,522) | | | $ | 505,284 | |
| Non-compete agreements | | 6,225 | | | (5,096) | | | 1,129 | |
| Trade names | | 7,826 | | | (3,311) | | | 4,515 | |
| Developed technology | | 2,300 | | | (1,208) | | | 1,093 | |
| Total intangible assets | | $ | 797,157 | | | $ | (285,137) | | | $ | 512,020 | |
Total amortization expense related to intangible assets was approximately
$80.3$82.3 million,
$67.0$86.1 million, and
$64.6$80.3 million for the years ended December 31,
2023, 2022, and 2021,
2020 and 2019, respectively.
There were
0no impairment charges during
2023, 2022, and 2021
or 2020 with respect to other intangible assets.
At
As of December 31,
2021,2023, future estimated amortization expense related to intangible assets
for each of the years ended December 31, 2022 to 2026 is estimated as follows:
| | | |
(in thousands) | | | |
2022 | | $ | 83,370 |
2023 | | | 75,735 |
2024 | | | 69,374 |
2025 | | | 63,012 |
2026 | | | 56,640 |
| | | | | |
| (in thousands) | |
| 2024 | $ | 71,619 | |
| 2025 | 65,056 | |
| 2026 | 58,480 | |
| 2027 | 51,915 | |
| 2028 | 45,159 | |
| Thereafter | 137,773 | |
| $ | 430,002 | |
Future amortization expense is an estimate. Actual amounts may change due to additional intangible asset acquisitions, impairment, accelerated amortization or other events.
Supplementary Cash Flow Information
Supplementary cash flow information is as follows:
| | | | | | | | | | | | | | | | | | | | |
| | Year Ended December 31, |
| (in thousands) | | 2023 | | 2022 | | 2021 |
| Non-cash activities: | | | | | | |
| Property and equipment purchases included in accounts payable (at end of period) | | $ | 1,610 | | | $ | 2,241 | | | $ | 7,633 | |
| Finance lease asset and liability additions | | 13,190 | | | 7,117 | | | 8,783 | |
| Operating lease right-of-use asset and operating lease liability additions | | 20,633 | | | 22,501 | | | 27,660 | |
| Issuance of common stock related to acquisition | | — | | | 2,000 | | | 11,300 | |
| Dividend and equity distribution (forfeited) payable | | — | | | (23) | | | (26) | |
| Software service contract additions | | — | | | — | | | 94 | |
Table of Contents | | | | | | | | | | | | | |
| | | | | | From | | | From |
| | | | | | January 4 | | | January 1 |
| | Year Ended | | through | | | through |
| | December 31, | | December 31, | | | January 3, |
(in thousands) | | 2021 | | 2020 | | 2019 | | | 2019 |
| | (Successor) | | (Successor) | | (Successor) | | | (Predecessor) |
Non-cash activities: | | | | | | | | | | | | | |
Property and equipment purchases included in accounts payable (at end of period) | | $ | 7,633 | | $ | 3,141 | | $ | 7,842 | | | $ | — |
Finance lease assets and liability additions | | | 8,783 | | | 10,286 | | | 9,968 | | | | — |
Operating lease right-of-use assets and operating lease liability additions | | | 27,660 | | | 29,577 | | | 9,674 | | | | 30,426 |
Non-cash equity contribution | | | — | | | — | | | 22,464 | | | | — |
Issuance of common stock related to acquisition | | | 11,300 | | | — | | | — | | | | — |
Dividend and equity distribution (forfeited) payable | | | (26) | | | — | | | 3,437 | | | | — |
Software service contract additions | | | 94 | | | — | | | 4,637 | | | | — |
Long-term debt
at December 31, 2021 and 2020 consists of the following:
| | | | | | |
| | December 31, | | December 31, |
(in thousands) | | 2021 | | 2020 |
| | (Successor) | | (Successor) |
First Lien Term Loan | | $ | 1,183,071 | | $ | 922,191 |
Second Lien Term Loan | | | — | | | 240,000 |
Revolving Loan | | | — | | | — |
Finance lease liability | | | 26,621 | | | 24,595 |
| | | 1,209,692 | | | 1,186,786 |
Less: unamortized deferred financing costs and debt discount | | | (17,190) | | | (25,687) |
| | | 1,192,502 | | | 1,161,099 |
Less: Current portion of long-term debt | | | (17,534) | | | (16,044) |
Total long-term debt | | $ | 1,174,968 | | $ | 1,145,055 |
| | | | | | | | | | | | | | |
| (in thousands) | | December 31,
2023 | | December 31,
2022 |
| First Lien Term Loan | | $ | 1,072,313 | | | $ | 1,054,549 | |
| Revolving Credit Facility | | — | | | 28,500 | |
| Finance lease liability | | 27,374 | | | 23,892 | |
| | 1,099,687 | | | 1,106,941 | |
| Less: Unamortized deferred financing costs and debt discount | | (20,157) | | | (11,896) | |
| | 1,079,530 | | | 1,095,045 | |
| Less: Current portion of long-term debt | | (18,468) | | | (17,752) | |
| Total long-term debt | | $ | 1,061,062 | | | $ | 1,077,293 | |
First Lien Credit Facilities
On January 4, 2019, in connection with and substantially concurrent with the closing of the business combination, Agiliti Health, Inc. entered into a credit agreement (the “First Lien Credit
Facilities”Agreement”) with JPMorgan Chase Bank, N.A. as administrative agent, collateral agent, and letter of credit issuer, Agiliti Holdco, Inc., certain subsidiaries of Agiliti Health, Inc. acting as guarantors,
(the “Guarantors”), and the lenders from
time to timetime-to-time party thereto.
The First Lien Credit FacilitiesAgreement originally provided for a seven-year senior secured delayed draw term loan facility in an aggregate principal amount of $660$660.0 million (the “First Lien Term Loan”) and a five-year senior secured revolving credit facility in an aggregate principal amount of $150$150.0 million (the “Revolving Loan”Credit Facility”). In February 2020, we increased our principal First Lien Term Loan facility by $125 million and the revolving loan facility by $40 million. In October 2020 and March 2021, we further increased our principal First Lien Term Loan facility by $150 million and $200 million, respectively. All terms to the First Lien Term Loan remained the same, except these additional loans are subject to an interest rate floor of 0.75%.
The First Lien Term Loan amortizesamortized in equal quarterly installments, commencing on June 30, 2019, in an aggregate annual amount equal to 1.00% of the original principal amount of such term loan, with the balance due and payable at maturity unless prepaid prior thereto.
Borrowings
Between February 2020 and December 2022, the Company increased the First Lien Term Loan facility by $625.0 million and the Revolving Credit Facility by $100.0 million via five amendments, resulting in $1.285 billion of borrowings under the First Lien Term Loan and access to $250.0 million via the Revolving Credit Facilities bear interest, at Agiliti Health, Inc.’s option, atFacility as of December 31, 2022.
During the year ended December 31, 2022, the Company prepaid $69.1 million resulting in a rate per annum equal to an applicable margin (the “Applicable Margin”) over either (a)loss on extinguishment / modification of $1.4 million for the year ended December 31, 2022, which consisted entirely of the write-off of unamortized debt discount.
During the year ended December 31, 2021, in connection with amendments discussed above, the Company incurred a
base rate determined by referenceloss on extinguishment / modification of debt of $0.3 million related to the
highestwrite-off of
(1) the prime lending rate published in the Wall Street Journal, (2) the federal funds effective rate plus 1/2 of 1% and (3) the LIBOR rate for a one-month interest period, plus 1.00%, or (b) a LIBOR rate determined by reference to the LIBOR rate as set forth by the ICE Benchmark Administration for the interest period relevant to such borrowing, in each case, subject to interest rate floors.unamortized deferred financing costs.
The First Lien Credit Facilities contain a number of negative covenants that, among other things, restrict, subject to certain exceptions, the ability of Agiliti Health, Inc. and the guarantors thereunder to incur additional indebtedness and guarantee indebtedness; create or incur liens; engage in mergers or consolidations; sell, transfer or otherwise dispose of assets; pay dividends and distributions or repurchase capital stock; prepay, redeem or repurchase certain indebtedness; make investments, loans and advances; enter into agreements which limit the ability of Agiliti Health, Inc. and the guarantors thereunder to incur liens on assets; and enter into amendments to certain junior lien and subordinated indebtedness in a manner materially adverse to the lenders.
Solely with respect to the Revolving
Loan, commencing with the fiscal quarter ending June 30, 2019,Credit Facility, the Company is required to maintain a leverage ratio not to exceed 7:1 when the aggregate principal amount of outstanding Revolving Loans and drawn Letters of Credit, on the last day of the most recent fiscal quarter, exceeds 35% of the total revolving credit commitments.
Revolving Credit Facility Amendment
On April 27, 2021,6, 2023, the Company entered into Amendment No. 4 (the “Amendment”6 (“Amendment No. 6”) to the First Lien Credit Agreement. Pursuant toAgreement, with JPMorgan Chase Bank, N.A., as administrative agent and collateral agent, and the lenders.
Amendment No. 6, among other things, provided for (i) a refinancing of the existing Revolving Loan was terminatedCredit Facility through a replacement of the existing $250.0 million Revolving Credit Facility with a $300.0 million revolving credit facility; (ii) extends the maturity of the Revolving Credit Facility to April 6, 2028; and (iii) updates the benchmark interest rate provisions to replace the LIBOR with a term rate based on the Secured Overnight Financing Rate (“Term SOFR”), for revolving loans extended in dollars, a term rate based on the Euro InterBank Offered Rate (“Adjusted EURIBOR”), for revolving loans extended in euros, and a newdaily rate (“Daily Simple RFR”) based on the Sterling Overnight Index Average (“SONIA”), for revolving credit facility was incurredloans extended in sterling, as the reference rates for purposes of calculating interest under the First Lien Credit Agreement in an aggregate principle amount of $250 million (the “New Revolving Credit Facility”); (ii)Facility.
Following Amendment No. 6, the interest rate margin for borrowings under the New Revolving Credit Facility wasare set at LIBOR Adjusted EURIBOR, Daily Simple RFR or Term SOFR plus 2.75%, with stepdownsstep downs to (A) LIBOR Adjusted EURIBOR, Daily Simple RFR or Term SOFR plus 2.50% if the first lien leverage ratio (as calculated thereunder)under the First Lien Credit Agreement) is less than or equal to 3.75:1.00 and (B) LIBOR Adjusted EURIBOR, Daily Simple RFR or Term SOFR plus 2.25% if the first lien leverage ratio is less than or equal to 3.25:1.00; (iii)1.00. Consistent with the prior agreement, the commitment fee on the average daily undrawn portion of the New Revolving Credit Facility was reduced tois 0.3750% per annum if the first lien leverage ratio is greater than 3.25:1.00 and 0.250% if the first lien leverage ratio is less than or equal to 3.25:1.00 and (iv) borrowings under
During the New Revolving Credit Facility mature the earlier of (x) six months prior to the then-existing final maturity date of the related term loans and (y) January 4, 2026.In connection with the Amendment above, the Company incurred loss on extinguishment of debt of $0.3 million related to the write-off of unamortized deferred financing cost on the revolving credit facility.
In October 2021,year ended
December 31, 2023, in connection with the closing of Sizewise Rentals, LLC (“Sizewise”), we enteredCompany's entry into Amendment No. 5 to6, $3.7 million in lender and third-party fees were capitalized. A&R First Lien Term Loan Agreement
On May 1, 2023, the Company entered into an amended and restated credit agreement, dated as of May 1, 2023 (the “A&R First Lien Credit Agreement”), with JPMorgan Chase Bank, N.A., as administrative agent and collateral agent, and the lenders from time-to-time party thereto, which amends and restates the First Lien Credit Agreement. This amendment
The A&R First Lien Credit Agreement among other things (i) provides for a $150 million incrementalrefinancing of the existing term loan credit facility the proceeds of which were used, together with cash on hand, to finance the Sizewise acquisition. This incrementala $1.075 billion term loan credit facility has terms identical(the “Term Loan Credit Facility”); (ii) extends the maturity of the Term Loan Credit Facility to those applicableMay 1, 2030; and (iii) updates the benchmark interest rate provisions to replace LIBOR with a term rate based on the Initial Term Loans andSOFR, for term loans extended in dollars. Following the February 2020 Amendment (each as defined in theA&R First Lien Credit Agreement), including asAgreement, the interest rate margin for the term loan borrowings under the Term Loan Credit Facility will be set at Term SOFR plus 3.00%.
The Term Loan Credit Facility amortizes in equal quarterly installments, commencing on December 31, 2023, in an aggregate annual amount equal to
pricing0.25% of the original principal amount of such term loan, with the balance due and
interest, tenor, rights of payment and prepayment and right of security.payable at maturity unless prepaid prior thereto.
Except as described above, the
Amendment has substantiallyA&R First Lien Credit Agreement does not give effect to other material changes to the
same terms
asof the First Lien Credit Agreement,
including with respect to the representations and
amendments thereto, including customary covenants andwarranties, events of
default.default and affirmative and negative covenants.
During the year ended December 31, 2023, in connection with the Company's entry into the A&R First Lien Credit Agreement, lender and third-party fees of $3.1 million and $2.8 million were capitalized and expensed, respectively. Unamortized costs written off due to loss on extinguishment / modification of debt totaled $1.7 million for the year ended December 31, 2023.
The Company was in compliance with all financial debt covenants for all periods presented.
The Second Lien Term Loan provided for an eight-year term loan facility in an aggregate principal amount of
$240$240.0 million (the “Second Lien Term Loan”).
The proceeds ofDuring the
Second Lien Term Loan were drawn on November 15, 2019 and used to return capital to shareholders.Borrowings underyear ended December 31, 2021, the Second Lien Term Loan bore interest, at Agiliti Health, Inc.’s option, at a rate per annum equal to an applicable margin over either (a) a base rate determined by reference to the highest of (1) the prime lending rate published in the Wall Street Journal, (2) the federal funds effective rate plus 1/2 of 1% and (3) the LIBOR rate for a one-month interest period, plus 1.00%, or (b) a LIBOR rate determined by reference to the LIBOR rate as set forth by the ICE
Benchmark Administration for the interest period relevant to such borrowing, in each case, subject to interest rate floors. The interest rate on the Second Lien Term Loan was LIBOR rate plus 7.75% at the end of the first quarter.
WeCompany used the proceeds from the IPO to repay $240 million in aggregatethe full principal amount of ourthe Second Lien Term Loan, $80$80.0 million of ourthe First Lien Term Loan, and $10$10.0 million of ourthe Revolving Loan facility.
Credit Facility. In connection with the repayment of ourthe Second Lien Term Loan, in April 2021, wethe Company incurred a loss on extinguishment / modification of debt of $9.8 million which consisted of the write-off of unamortized deferred financing costs and debt discount of $7.4 million and an additional 1% redemption price or $2.4 million.
In May 2020, wethe Company entered into an interest rate swap agreement for a total notional amount of $500$500.0 million. Until its expiration in June 2023, the agreement converted $350.0 million which hasand $150.0 million of the effect of converting a portion of our First Lien Term Loan to fixed interest rates. The effective date forrates of 0.3396% and 0.3290%, respectively, plus the Applicable Margin.
On April 17, 2023, the Company entered into a new two-year interest rate swap agreement
was June 2020 andwith an effective date of July 1, 2023. As a result, the
expiration date is June 2023.TheCompany expects the effective interest rate on $500.0 million of the Term Loan Credit Facility to be 4.0685%, plus the Applicable Margin, through July 2025.
Both interest rate swap
agreement qualifiesagreements qualify for cash flow hedge accounting under ASC
Topic 815, “Derivatives and Hedging.” Both at815. At inception and on an on-going basis,
wethe Company must perform an effectiveness test. The fair value of the interest rate swap agreement
atas of December 31,
20212023 was
$2.1$1.9 million, of which
$0.4$3.1 million is included in other current assets
and $1.7offset by $1.2 million
is included in
obligation under tax receivable agreement, pension and other long-term
assetsliabilities on
ourthe consolidated balance sheet. The change in fair value was recorded as a component of accumulated other comprehensive loss on
ourthe consolidated balance sheet, net of tax, since the instrument was determined to be an effective hedge
atas of December 31,
2021. We have2023. The Company has not recorded any amounts due to ineffectiveness for any periods presented.
As a result of our interest rate swap agreement, we expect the effective interest rate on $350 million and $150 million of our First Lien Term Loan to be 0.3396% and 0.3290%, respectively, plus the Applicable Margin through June 2023.
We were in compliance with all financial debt covenants for all periods presented.
Maturities of Long-Term Debt
At
As of December 31,
2021,2023, maturities of long-term debt and capital lease obligations
for each of our fiscal years ending December 31, 2021 to 2026 and thereafter, are contractually as follows:
| | | | |
(in thousands) | | | | |
2022 | | $ | 17,534 | |
2023 | | | 15,028 | |
2024 | | | 13,301 | |
2025 | | | 12,109 | |
2026 | | | 1,147,364 | |
Thereafter | | | 4,356 | |
Total | | | 1,209,692 | |
Unamortized deferred financing costs | | | (12,208) | |
Unamortized debt discount | | | (4,982) | |
| | $ | 1,192,502 | |
| | | | | |
| (in thousands) | |
| 2024 | $ | 18,468 | |
| 2025 | 16,261 | |
| 2026 | 14,696 | |
| 2027 | 13,582 | |
| 2028 | 12,788 | |
| Thereafter | 1,023,892 | |
| Total | 1,099,687 | |
| Unamortized deferred financing costs | (11,371) | |
| Unamortized debt discount | (8,786) | |
| $ | 1,079,530 | |
The Company leases facilities under operating lease agreements, which include both monthly and longer-term arrangements. OurThe Company's finance leases consist primarily of leased vehicles.
Lease assets and liabilities
are as follows:
| | | | | | | | |
| | | | December 31, | | December 31, |
(in thousands) | | | | 2021 | | 2020 |
| | | | (Successor) | | (Successor) |
Lease Assets | | Classification | | | | | | |
Operating lease assets | | Operating lease right-of-use assets | | $ | 80,676 | | $ | 51,214 |
Finance lease assets | | Property and equipment (1) | | | 26,098 | | | 23,513 |
Total leased assets | | | | $ | 106,774 | | $ | 74,727 |
Lease Liabilities | | | | | | | | |
Current: | | | | | | | | |
Operating | | Current portion of operating lease liability | | $ | 22,826 | | $ | 14,155 |
Finance | | Current portion of long-term debt | | | 8,136 | | | 6,694 |
Noncurrent: | | | | | | | | |
Operating | | Operating lease liability, less current portion | | | 63,241 | | | 40,283 |
Finance | | Long-term debt, less current portion | | | 18,485 | | | 17,901 |
Total lease liabilities | | | | $ | 112,688 | | $ | 79,033 |
consist of the following: | | | | | | | | | | | | | | | | | |
| (in thousands) | | | December 31,
2023 | | December 31,
2022 |
| Lease Assets | Classification | | | | |
| Operating lease assets | Operating lease right-of-use assets | | $ | 78,157 | | | $ | 79,975 | |
| Finance lease assets | Property and equipment (1) | | 27,554 | | | 23,231 | |
| Total leased assets | | | $ | 105,711 | | | $ | 103,206 | |
| Lease Liabilities | | | | | |
| Current: | | | | | |
| Operating | Current portion of operating lease liability | | $ | 25,603 | | | $ | 23,607 | |
| Finance | Current portion of long-term debt | | 7,718 | | | 8,354 | |
| Noncurrent: | | | | | |
| Operating | Operating lease liability, less current portion | | 63,765 | | | 67,332 | |
| Finance | Long-term debt, less current portion | | 19,656 | | | 15,538 | |
| Total lease liabilities | | | $ | 116,742 | | | $ | 114,831 | |
| | | | | |
| (1) | Finance lease assets are recorded net of accumulated depreciation of $20.4$39.4 million and $13.1$29.6 million as of December 31, 20212023 and 2020,2022, respectively. |
TheTotal lease cost forconsists of the year ended December 31, 2021, 2020 and for the period from January 4 through December 31, 2019 was as follows:
| | | | | | | | | |
| | | | | | From |
| | | | | | January 4 |
| | Year Ended | | through |
| | December 31, | | December 31, |
(in thousands) | | 2021 | | 2020 | | 2019 |
| | (Successor) | | (Successor) | | (Successor) |
Lease Cost | | | | | | |
Finance lease cost: | | | | | | | | | |
Amortization of right-of-use assets | | $ | 8,657 | | $ | 9,531 | | $ | 9,058 |
Interest on lease liabilities | | | 738 | | | 781 | | | 658 |
Operating lease cost | | | 19,547 | | | 12,706 | | | 10,547 |
Short-term lease cost | | | 791 | | | 715 | | | 41 |
Variable lease cost | | | 5,641 | | | 4,388 | | | 3,397 |
Total lease cost | | $ | 35,374 | | $ | 28,121 | | $ | 23,701 |
following: | | | | | | | | | | | | | | | | | | | | |
| | Year Ended December 31, |
| (in thousands) | | 2023 | | 2022 | | 2021 |
| Lease Cost | | | | | |
| Finance lease cost: | | | | | | |
| Amortization of right-of-use assets | | $ | 10,034 | | | $ | 8,659 | | | $ | 8,657 | |
| Interest on lease liabilities | | 998 | | | 648 | | | 738 | |
| Operating lease cost | | 30,218 | | | 29,044 | | | 19,547 | |
| Short-term lease cost | | 982 | | | 878 | | | 791 | |
| Variable lease cost | | 7,028 | | | 6,293 | | | 5,641 | |
| Total lease cost | | $ | 49,260 | | | $ | 45,522 | | | $ | 35,374 | |
The maturitymaturities of lease liabilities atas of December 31, 2021 was2023 are as follows:
| | | | | | | | | | | | | | | | | | | | |
| (in thousands) | | Operating
Leases | | Finance
Leases | | Total |
| 2024 | | $ | 28,000 | | | $ | 8,447 | | | $ | 36,447 | |
| 2025 | | 23,746 | | | 6,035 | | | 29,781 | |
| 2026 | | 18,551 | | | 4,372 | | | 22,923 | |
| 2027 | | 7,985 | | | 3,140 | | | 11,125 | |
| 2028 | | 5,074 | | | 2,260 | | | 7,334 | |
| Thereafter | | 13,094 | | | 5,515 | | | 18,609 | |
| Total lease payments | | $ | 96,450 | | | $ | 29,769 | | | $ | 126,219 | |
| Less: Interest | | 7,082 | | | 2,395 | | | 9,477 | |
| Present value of lease liabilities | | $ | 89,368 | | | $ | 27,374 | | | $ | 116,742 | |
Table of Contents | | | | | | | | | |
| | | Operating | | | Finance | | | |
(in thousands) | | | Leases | | | Leases | | | Total |
2022 | | $ | 24,399 | | $ | 8,746 | | $ | 33,145 |
2023 | | | 21,000 | | | 6,116 | | | 27,116 |
2024 | | | 17,959 | �� | | 4,285 | | | 22,244 |
2025 | | | 14,379 | | | 3,015 | | | 17,394 |
2026 | | | 10,504 | | | 2,097 | | | 12,601 |
Thereafter | | | 1,657 | | | 4,530 | | | 6,187 |
Total lease payments | | $ | 89,898 | | $ | 28,789 | | $ | 118,687 |
Less: Interest | | | 3,831 | | | 2,168 | | | 5,999 |
Present value of lease liabilities | | $ | 86,067 | | $ | 26,621 | | $ | 112,688 |
The lease term and discount
rate at December 31, 2021 wererates are as follows:
|
| | December 31,
2023 | | | | |
|
|
| December 31,
|
|
|
| 2021
|
Lease Term and Discount Rate | |
|
|
|
Weighted-average remaining lease term (years) | |
|
|
|
Operating leases | | 4.6 |
| 4.2
|
|
Finance leases | | 2.1 |
| 2.7
|
|
Weighted-average discount rate | |
|
|
|
Operating leases | | 3.2 % |
| 2.2
| %
|
Finance leases | | 2.7 % |
| 2.3
| %
|
Other information related to cash paid related to lease liabilities and lease assets obtained foris as follows:
| | | | | | | | | | | | | | | | | | | | |
| | Year Ended December 31, |
| (in thousands) | | 2023 | | 2022 | | 2021 |
| Cash paid for amounts included in the measurement of lease liabilities: | | | | | | |
| Operating cash flows for finance leases | | $ | 998 | | | $ | 648 | | | $ | 738 | |
| Operating cash flows for operating leases | | 27,549 | | | 25,878 | | | 19,569 | |
| Financing cash flows for finance leases | | 9,502 | | | 8,812 | | | 9,097 | |
| | | | | | |
| Lease asset obtained in exchange for new finance lease liabilities | | 13,190 | | | 7,117 | | | 8,783 | |
| Lease asset obtained in exchange for new operating lease liabilities | | 20,633 | | | 22,501 | | | 27,660 | |
9. Shareholder’s Equity
Treasury Stock
On August 21, 2023, the yearsCompany announced that its board of directors approved a share repurchase program, pursuant to which, the Company is authorized to repurchase up to $50.0 million of shares of the Company’s common stock (exclusive of any fees, commissions or other expenses related to such repurchases), over a period of 12 months. During the year ended December 31, 2021 and 2020, and2023, the period from January 4 through December 31, 2019 were as follows:Company repurchased 406,096 shares of its common stock for a total of $3.8 million.
Dividends
| | | | | | | | | |
| | | | | | From |
| | | | | | January 4 |
| | Year Ended | | through |
| | December 31, | | December 31, |
(in thousands) | | 2021 | | 2020 | | 2019 |
| | (Successor) | | (Successor) | | (Successor) |
Cash paid for amounts included in the measurement of lease liabilities: | | | | | | | | | |
Operating cash flows for finance leases | | $ | 738 | | $ | 781 | | $ | 658 |
Operating cash flows for operating leases | | | 19,569 | | | 12,733 | | | 10,028 |
Financing cash flows for finance leases | | | 9,097 | | | 8,024 | | | 7,609 |
| | | | | | | | | |
Lease asset obtained in exchange for new finance lease liabilities | | | 8,783 | | | 10,286 | | | 9,968 |
Lease asset obtained in exchange for new operating lease liabilities | | | 27,660 | | | 29,577 | | | 9,674 |
9. Shareholder’s Equity (Deficit)
Dividends
In November 2019, the Company declared a $2.23 dividend per share that was paid to holders of common stock and is paid upon vesting to holders of restricted stock units and performance restricted stock units. Dividends paid during the years ended December 31, 20212023 and 2020 were $0.9 million and $1.1 million, respectively.
Dividend payable was $1.2 and $2.2 million as of December 31, 2021 and 2020, respectively, of which $0.9 totaled $0.3 million and $0.9 million, was included in accounts payable and $0.3 million and $1.3 million was included in other long-term liabilities, respectively.
Common Stock
The Company has authorized and issued 130,950,061 shares of common stock with a par value of $0.0001 per share.
Accumulated Other Comprehensive
LossIncome (Loss)
The components of Accumulated Other Comprehensive Income (Loss) are as follows:
| | | | | | | |
| | December 31, | | December 31, | |
(in thousands) | | 2021 | | 2020 | |
| | (Successor) | | (Successor) | |
Unrealized loss on minimum pension liability adjustment, net of tax | | $ | (20) | | $ | (2,215) | |
Unrealized loss on cash flow hedge, net of tax | | | 1,557 | | | (1,404) | |
| | $ | 1,537 | | $ | (3,619) | |
| | | | | | | | | | | | | | |
| (in thousands) | | December 31,
2023 | | December 31,
2022 |
| Unrealized gain on minimum pension liability adjustment, net of tax | | $ | 1,069 | | | $ | 502 | |
| Unrealized gain on cash flow hedge, net of tax | | 1,436 | | | 6,841 | |
| | $ | 2,505 | | | $ | 7,343 | |
Changes in Accumulated Other Comprehensive
LossIncome (Loss) for the year ended December 31,
20212023 are as follows:
| | | | |
(in thousands) | | | | |
Minimum pension liability - balance at December 31, 2020 (Successor) | | $ | (2,215) | |
Net actuarial gain | | | 2,649 | |
Reclassification for amortization of net gain | | | 293 | |
Income tax expense related to pension | | | (747) | |
Net current year other comprehensive income | | | 2,195 | |
Minimum pension liability - balance at December 31, 2021 (Successor) | | $ | (20) | |
| | | | |
Cash flow hedge - balance at December 31, 2020 (Successor) | | $ | (1,404) | |
Changes in the effective portion of the fair value of cash flow hedge | | | 3,976 | |
Income tax expense related to cash flow hedge | | | (1,015) | |
Net current year other comprehensive income | | | 2,961 | |
Cash flow hedge - balance at December 31, 2021 (Successor) | | $ | 1,557 | |
| | | | |
Net current year other comprehensive income | | $ | 5,156 | |
Amount reclassified from accumulated other comprehensive loss is included in the selling, general and administrative expense in the Consolidated Statements of Operations.
| | | | | |
| (in thousands) | |
| Minimum pension liability - balance as of December 31, 2022 | $ | 502 | |
| Net actuarial gain | 909 | |
| Amortization of net actuarial gain | (151) | |
| Income tax (expense) related to pension | (191) | |
| Net current year other comprehensive income | 567 | |
| Minimum pension liability - balance as of December 31, 2023 | $ | 1,069 | |
| |
| Cash flow hedge - balance as of December 31, 2022 | $ | 6,841 | |
| Changes in the effective portion of the fair value of cash flow hedge | (7,285) | |
| Income tax benefit related to cash flow hedge | 1,880 | |
| Net current year other comprehensive (loss) | (5,405) | |
| Cash flow hedge - balance as of December 31, 2023 | $ | 1,436 | |
| |
| Net current year other comprehensive (loss) | $ | (4,838) | |
10. Share-Based Compensation
On January 4, 2019, the 2018 Omnibus Incentive Plan (“2018 Plan”) became effective. The 2018 Plan provides for issuance of 24.6 million nonqualified stock options, restricted stock units and performance restricted stock units to any of its executives, other key employees and certain non-employee directors. Approximately 3.0 million shares of the 2007 Stock Option Plan with an exercise price of $2.13 per share and expiration date of November 4, 2024 were rolled into the 2018 Plan on January 4, 2019.The 2018 Plan provides for issuance of 10.4 million nonqualified
In connection with the Company's IPO in 2021, the Company granted certain employees, including named executive officers, restricted stock options,units, performance restricted stock units, and performance restricted stock unitsoptions under the 2018 Plan with respect to anyapproximately 1.6 million shares of its executives, other keythe Company’s common stock.
The Company adopted an Employee Stock Purchase Plan (“ESPP”) in 2021 and a total of 2.6 million shares of the Company's common stock are reserved for issuance thereunder. Employees are permitted to purchase the Company’s common stock at 85% of market value at the end of the six-month offering period ending on April 30 and October 31 each year. 398,895 shares were issued under the ESPP during the year ended December 31, 2023. The Company recognized $0.6 million share-based compensation expense for the discount received by participating employees and certain non-employee directors. Thefor the year ended December 31, 2023.
In connection with the dividend payment in November 2019, the exercise price of stock options granted under the 2018 Plan was adjusted from $8.50 to $6.27 per share. This modification did not result in additional share-based compensation expense.
Stock Options
A summary of activity for the stock options under the 2018 Plan is detailed below:
| | | | | | | | | | | | | | | | | | | | | | | | | | |
| (in thousands, except exercise price and years) | | Number of
options | | Weighted
average
exercise price | | Aggregate
intrinsic
value | | Weighted
average
remaining
contractual
term (years) |
| Outstanding as of December 31, 2020 | | 6,690 | | | $ | 4.25 | | | $ | 81,235 | | | 6.5 |
| Granted | | 710 | | | 14.09 | | | | | |
| Exercised | | (651) | | | 2.22 | | | 11,939 | | | |
| Forfeited or expired | | — | | | — | | | | | |
| Outstanding as of December 31, 2021 | | 6,749 | | | $ | 6.08 | | | $ | 114,095 | | | 6.1 |
| Granted | | 555 | | | 18.45 | | | | | |
| Exercised | | (820) | | | 3.67 | | | 12,332 | | | |
| Forfeited or expired | | (85) | | | 14.30 | | | | | |
| Outstanding as of December 31, 2022 | | 6,399 | | | $ | 7.36 | | | $ | 58,449 | | | 5.7 |
| Granted | | 676 | | | 14.54 | | | | | |
| Exercised | | (835) | | | 3.93 | | | 6,778 | | | |
| Forfeited or expired | | (1,145) | | | 11.38 | | | | | |
| Outstanding as of December 31, 2023 | | 5,095 | | | $ | 7.97 | | | $ | 9,797 | | | 4.9 |
| Exercisable as of December 31, 2023 | | 4,547 | | | $ | 7.11 | | | $ | 9,764 | | | 4.5 |
Stock options allow for the purchase of shares of common stock of the Company at prices equal to the stock’s fair market value at the date of grant. Options granted have a ten-year contractual term and vest over one to four years. The restricted stock units vest over three to four years. The performance restricted stock units vest over three years upon achievement of established performance targets as defined in the agreement.
The shares issued to a grantee upon the exercise of such grantee’s options will be subject to certain restrictions on transferability as provided in the 2018 Plan. Grantees are subject to non-competition, non-solicitation and confidentiality requirements as set forth in their respective stock option grant agreements. Forfeited and expired options are available for future issue.
In connection with our IPO, we granted certain of our employees, including our named executive officers, restricted stock units, performance restricted stock units, and stock options under the 2018 Plan with respect to approximately 1.6 million shares of the Company’s common stock.issuance.
In connection with the IPO, we adopted an Employee Stock Purchase Plan (“ESPP”). A total of 2.0 million shares of our common stock are reserved for issuance under the ESPP. Employees are permitted to purchase the Company’s common stock at 85% of market value at the end of the six-month offering period ending on April 30 and October 31 each year. 71,768 shares were issued under the ESPP as of December 31, 2021. The Company recognized $0.4 million share-based compensation expense for the discount received by participating employees for the year ended December 31, 2021.
In connection with the dividend payment in November 2019, the exercise price of stock options granted under the 2018 Plan was adjusted from $8.50 to $6.27 per share. This modification did not result in additional share-based compensation expense.
A summary of activity for the stock options under the 2018 Plan is detailed below:
| | | | | | | | | | |
| | | | | | | | | | Weighted |
| | | | | | | | | | average |
| | | | Weighted | | Aggregate | | remaining |
| | Number of | | average | | intrinsic | | contractual |
(in thousands, except exercise price and years) | | options | | exercise price | | value | | term (years) |
Outstanding at January 4, 2019 (Successor) | | — | | $ | — | | $ | — | | — |
Granted | | 6,023 | | | 4.22 | | | | | |
Exercised | | (91) | | | 2.13 | | | 580 | | |
Forfeited or expired | | (10) | | | 6.27 | | | | | |
Outstanding at December 31, 2019 (Successor) | | 5,922 | | $ | 4.25 | | $ | 23,669 | | 7.1 |
Granted | | 1,274 | | | 8.25 | | | | | |
Exercised | | (239) | | | 6.27 | | | 473 | | |
Forfeited or expired | | (267) | | | 6.38 | | | | | |
Outstanding at December 31, 2020 (Successor) | | 6,690 | | $ | 4.86 | | $ | 81,235 | | 6.5 |
Granted | | 710 | | | 14.09 | | | | | |
Exercised | | (651) | | | 2.22 | | | 11,939 | | |
Forfeited or expired | | — | | | | | | | | |
Outstanding at December 31, 2021 (Successor) | | 6,749 | | $ | 6.08 | | $ | 114,095 | | 6.1 |
Exercisable at December 31, 2021 (Successor) | | 4,190 | | $ | 4.28 | | $ | 77,948 | | 5.0 |
Remaining authorized option available for issue | | 8,392 | | | | | | | | |
The exercise price of the stock option award is equal to the market value of Company’s common stock on the grant date as determined reasonably and in good faith by the Company’s Board of Directors and
compensation committee and based on an analysis of a variety of factors including peer group multiples, merger and acquisition multiples, and discounted cash flow analyses.Compensation Committee. The intrinsic value of a stock award is the amount by which the market value of the underlying stock exceeds the exercise price of the award.
We determine
The Company determines the fair value of options using the Black-Scholes option pricing model. The estimated fair value of options including the effect of estimated forfeitures, is recognized as expense on a straight-line basis over the options’ vesting periods.
The assumptions in the table below were used to determine the Black-Scholes fair value of stock options granted for the years ended December 31, 2021 and 2020, and the period from January 4 through December 31, 2019.
| | | | | | | | | | | |
| | | | | | | | | From |
| | | | | | | | | January 4 |
| | | | | | | | | through |
| Year Ended December 31, | | December 31, |
| 2021 | | 2020 | | 2019 |
| (Successor) | | (Successor) | | (Successor) |
Risk-free interest rate | | 0.94 | % | | | 0.51 | % | | | 2.50 | % |
Expected volatility | | 34.05 | % | | | 33.95 | % | | | 34.13 | % |
Dividend yield | | N/A | | | | N/A | | | | N/A | |
Expected option life (years) | | 5.92 | | | | 3.03 | | | | 3.57 | |
Black-Scholes Value of options | $ | 4.83 | | | $ | 1.94 | | | $ | 2.42 | |
granted:
| | | | | | | | | | | | | | | | | |
| Year Ended December 31, |
| 2023 | | 2022 | | 2021 |
| Risk-free interest rate | 3.91 % | | 1.76 % | | 0.94 % |
| Expected volatility | 39.71 % | | 33.36 % | | 34.05 % |
| Dividend yield | N/A | | N/A | | N/A |
| Expected option life (years) | 6.00 | | 6.00 | | 5.92 |
| Black-Scholes Value of options | $ | 6.64 | | $ | 6.53 | | $ | 4.83 |
Expected volatility is based on an independent valuation of the stock of companies within
ourthe Company's peer group. Given the lack of a true comparable company, the peer group consists of selected public healthcare companies representing
ourthe Company's suppliers, customers and competitors within certain product lines. The risk-free interest rate is based on the U.S. Treasury yield curve in effect at the grant date based on the expected option life. The expected option life is estimated
based on foreseeable trends.At December 31, 2021, unearned non-cash share-based compensationutilizing the simplified method due to the Company's lack of historical exercise data.
Future expense related to
2018 Planstock options that
we expectthe Company expects to recognize as expense over a weighted average period of
1.82.0 years, totals approximately
$4.6 million, net of our estimated forfeiture rate of 2.0%.$2.2 million. The expense could be accelerated upon the sale of the Company.
Restricted Stock Units and Performance Restricted Stock Units
A summary of activity for restricted stock units and performance restricted stock units is detailed below:
| | | | | | | | | | | |
| (in thousands, except grant date fair values) | Number of
units | | Weighted
average
grant date
fair value |
| Nonvested as of December 31, 2020 | 1,944 | | | $ | 8.37 | |
| Granted | 1,180 | | | 14.69 | |
| Vested | (817) | | | 8.58 | |
| Forfeited | (135) | | | 11.55 | |
| Nonvested as of December 31, 2021 | 2,172 | | | $ | 11.26 | |
| Granted | 1,620 | | | 18.40 | |
| Vested | (1,021) | | | 10.03 | |
| Forfeited | (398) | | | 15.58 | |
| Nonvested as of December 31, 2022 | 2,373 | | | $ | 15.55 | |
| Granted | 2,636 | | | 11.38 | |
| Vested | (1,289) | | | 13.64 | |
| Forfeited | (505) | | | 16.90 | |
| Nonvested as of December 31, 2023 | 3,215 | | | $ | 12.68 | |
The restricted stock units vest over one | | | | | | |
| | | | | Weighted |
| | | | | average |
| | Number of | | | grant date |
| | units | | | fair value |
Nonvested at January 4, 2019 (Successor) | | — | | $ | — | |
Granted | | 1,575 | | | 8.50 | |
Vested | | — | | | — | |
Forfeited | | (29) | | | 8.50 | |
Nonvested at December 31, 2019 (Successor) | | 1,546 | | $ | 8.50 | |
Granted | | 1,057 | | | 8.25 | |
Vested | | (512) | | | 8.50 | |
Forfeited | | (147) | | | 8.45 | |
Nonvested at December 31, 2020 (Successor) | | 1,944 | | $ | 8.37 | |
Granted | | 1,180 | | | 14.69 | |
Vested | | (817) | | | 8.58 | |
Forfeited | | (135) | | | 11.55 | |
Nonvested at December 31, 2021 (Successor) | | 2,173 | | $ | 11.26 | |
to four years. The performance restricted stock units cliff vest after 3 years and are subject to the level of achievement of a 3-year cumulative adjusted EBITDA target. Future expense related to restricted stock units and performance restricted stock units that we expectthe Company expects to recognize as expense over a weighted average period of 2.01.6 years totals approximately $14.8 million, net$20.5 million.
The fair value of ourthe market-based performance restricted stock units is estimated forfeitureat the grant date using a Monte-Carlo simulation model which included the following assumptions:
| | | | | | | | |
| | Year Ended December 31, 2023 |
| Risk-free interest rate | | 4.19 % |
| Dividend yield | | N/A |
| Expected volatility | | 51.19 % |
| Expected term (years) | | 2.57 |
The risk-free interest rate is based on the U.S. Treasury yield curve in effect at the grant date based on the expected option life. Expected volatility is based on the historical volatility of 2.0%.
the Company's stock over the expected term. The expected term is the time between the award grant date and performance period end date.
ForThe following table summarizes stock-based compensation expense for the 2018 Plan and ESPP:
| | | | | | | | | | | | | | | | | | | | |
| | December 31, |
| (in thousands) | | 2023 | | 2022 | | 2021 |
| Cost of sales | | $ | 2,962 | | | $ | 2,335 | | | $ | — | |
| Selling, general, and administrative expense | | 17,224 | | | 16,440 | | | 13,960 | |
| Total stock-based compensation expense | | $ | 20,186 | | | $ | 18,775 | | | $ | 13,960 | |
The Company's actual tax benefits realized from tax deductions related to the vesting of awards for years ended December 31, 2021 and 2020, and for the periods from January 4 through December 31, 2019 and from January 1 through January 3, 2019, we recognized non-cash share-based compensation expense of $14.0 million, $10.3 million, $5.8 million and $5.9 million, respectively, which is primarily included in selling, general and administrative expenses.Restricted stock units and performance restricted stock units are not taxable to the employee until they have settled and underlying shares have been delivered. In connection with the IPO, settlement of vested restricted stock unit and performance restricted stock unit awards granted prior to 2021 were deferred until one year following our IPO as permitted under the 2018 Plan and in accordance with the terms of the grant agreements. As a result, shares underlying these vested restricted stock unit and performance restricted stock unit awards will be delivered on April 23,2023, 2022, and will become taxable to the employees on that date. Upon settlement, we will reduce the number of shares that the employee is entitled to receive to cover the estimated income taxes2021 was
$4.9, $6.0, and other payroll taxes. We will then pay the outstanding tax liability. The amount of the tax liability is dependent upon the share price at the date of settlement and, although difficult to quantify, is currently estimated to be between $15$3.6 million, and $20 million. This liability will be paid in the second quarter of 2022.respectively.
Remaining authorized options, restricted stock units and performance restricted stock units available for future issuance under the 2018 Plan was 8.414.1 million shares atas of December 31, 2021.2023.
11. Commitments and Contingencies
The Company, in the ordinary course of business, is subject to liability claims related to employees and the equipment that it rents and services. Asserted claims are subject to many uncertainties and the outcome of individual matters is not predictable. For certain claims where the loss is probable, a provision is recorded based on the Company’s best estimate. While the ultimate resolution of these actions may have an impact on the Company’s financial results for a particular reporting period, management believes that any such resolution would not have a material adverse effect on the financial position, results of operations or cash flows of the Company and the chance of a negative outcome on outstanding litigation is considered remote.
On July 29, 2019, the Company entered into a memorandum of understanding to settle all claims in an employee related class action litigation brought in California. The Company received a release in exchange for a payment of $3.5 million. Payment of the settlement amount was made in February 2020.
12. Related Party Transactions
On January 4, 2019, the Company entered into an advisory services agreement (the “Advisory Services Agreement”) with Agiliti Holdco, Inc., Agiliti Health, Inc. and THL Managers VIII, LLC (the “Advisor”). Pursuant to the Advisory Services Agreement, the Advisor provided management, consulting, and other advisory services to the Company.
In consideration for these services, the Company paid to the Advisor (i) a non-refundable periodic retainer fee in an aggregate amount per fiscal quarter equal to the greater of (a) $375,000 or (b) 1% of the consolidated Adjusted EBITDA (as defined in the Advisory Services Agreement) for the immediately preceding fiscal quarter or such other amount as may be mutually agreed, with the first such payment to be made on April 15, 2019, (ii) fees in amounts to be mutually agreed upon in connection with any financing or refinancing, dividend, recapitalization, acquisition, disposition and spin-off or split-off transaction, (iii) in the case of an initial public offering (“IPO”), in addition to the fees under clauses (i) and (ii), an amount equal to the net present value of the higher periodic fee that would have been payable from the date of such IPO until the scheduled termination date of the Advisory Services Agreement, and (iv) fees for other management, consulting and other advisory services to be discussed in good faith among the parties. The companies also paid expenses incurred by the Advisor, its consultants and certain other parties affiliated with Advisor. Total professional services fees incurred to the Advisor were $0.6 million and $2.3 million for the years ended December 31, 2021 and 2020, respectively.The Advisory Services Agreement was terminated in the second quarter of 2021 upon the completion of the IPO. In connection with the termination of the Advisory Services Agreement, we were required to paythe Company paid a buyout fee to the Advisor a buyout fee of approximately $7.0 million, which was expensed inas incurred. Total professional services fees incurred to the second quarter ofAdvisor were $0.6 million for the year ended December 31, 2021.
13. Limited Liability Companies
We participate with others in the formation of LLCs in which the Company becomes a partner and shares the financial interest with the other investors. The Company is the primary beneficiary of these LLCs. These LLCs acquire certain medical equipment for use in their respective business activities, which generally focus on surgical procedures. The LLCs will acquire medical equipment for rental purposes under equipment financing leases. At December 31, 2021, the LLCs had approximately $0.4 million of total assets. The third-party investors in each respective LLC generally provide the lease financing company with individual proportionate lease guarantees based on their respective ownership percentages in the LLCs. In addition, the Company will provide such financing companies with its corporate guarantee based on its respective ownership interest in each LLC. In certain instances, the Company has provided such financing companies with an overall corporate guarantee in connection with equipment financing transactions. In such instances, the individual investors in each respective LLC will generally indemnify us against losses, if any, incurred in connection with the Company’s corporate guarantee. Additionally, we provide operational and administrative support to the LLCs in which it is a partner. As of December 31, 2021, we held interests in 2 active LLCs.
In accordance with guidance issued by the FASB, we account for equity investments in LLCs (in which we are the primary beneficiary) under the full consolidation method whereby transactions between the Company and the LLCs have been eliminated through consolidation.
14. Employee Benefit Plans
ASC Topic 715, “Compensation — Retirement Benefits,” requires employers to recognize the under- fundedunder-funded or over fundedover-funded status of a defined benefit post retirement plan as an asset or liability in its consolidated balance sheets and to recognize changes in the funded status in the year in which the changes occur through accumulated other comprehensive income. Additionally, ASC Topic 715 requires employers to measure the funded status of a plan as of the date of its year-end balance sheet date. Pension plan benefits are to be paid to eligible employees after retirement based primarily on years of credited service and participants’ compensation. The Company uses a December 31 measurement date. Effective December 31, 2002, the Company froze the benefits under the pension plan.
The change in benefit obligation, pension plan assets and funded status as of and for the years ended December 31,
20212023 and
20202022 are as follows:
Change in Benefit Obligation
| | | | | | |
(in thousands) | | 2021 | | 2020 |
| | (Successor) | | (Successor) |
Benefit obligations at beginning of year | | $ | 33,007 | | $ | 30,514 |
Interest cost | | | 785 | | | 955 |
Actuarial (gain) loss | | | (1,260) | | | 2,877 |
Benefit paid | | | (1,382) | | | (1,339) |
Benefit obligations at end of year | | $ | 31,150 | | $ | 33,007 |
| | | | | | | | | | | | | | |
| (in thousands) | | 2023 | | 2022 |
| Benefit obligations at beginning of year | | $ | 24,129 | | | $ | 31,150 | |
| Interest cost | | 1,181 | | | 847 | |
| Actuarial (gain) loss | | 591 | | | (6,451) | |
| Benefits paid | | (1,532) | | | (1,417) | |
| Benefit obligations at end of year | | $ | 24,369 | | | $ | 24,129 | |
Change in Plan Assets
| | | | | | |
(in thousands) | | 2021 | | 2020 |
| | (Successor) | | (Successor) |
Fair value of plan assets at beginning of year | | $ | 24,630 | | $ | 22,616 |
Actual return on plan assets | | | 2,495 | | | 2,228 |
Employer contributions | | | 650 | | | 1,125 |
Benefits paid | | | (1,382) | | | (1,339) |
Fair value of plan assets at end of year | | $ | 26,393 | | $ | 24,630 |
| | | | | | | | | | | | | | |
| (in thousands) | | 2023 | | 2022 |
| Fair value of plan assets at beginning of year | | $ | 21,016 | | | $ | 26,393 | |
| Actual return on plan assets | | 2,933 | | | (4,610) | |
| Employer contributions | | 180 | | | 650 | |
| Benefits paid | | (1,532) | | | (1,417) | |
| Fair value of plan assets at end of year | | $ | 22,597 | | | $ | 21,016 | |
Funded Status
| | | | | | |
(in thousands) | | 2021 | | 2020 |
| | (Successor) | | (Successor) |
Funded status | | $ | (4,757) | | $ | (8,377) |
Unrecognized net actuarial loss/accumulated other comprehensive loss | | | 28 | | | 2,969 |
Net amount recognized | | $ | (4,729) | | $ | (5,408) |
| | | | | | | | | | | | | | |
| (in thousands) | | 2023 | | 2022 |
| Funded status | | $ | (1,772) | | | $ | (3,113) | |
| Unrecognized net actuarial (gain) / accumulated other comprehensive (gain) | | (1,432) | | | (675) | |
| Net amount recognized | | $ | (3,204) | | | $ | (3,788) | |
A summary of
ourthe Company's pension plan projected benefit obligation, accumulated obligation and fair value of pension plan assets
at December 31, are as follows:
| | | | | | |
(in thousands) | | 2021 | | 2020 |
| | (Successor) | | (Successor) |
Projected benefit obligation | | $ | 31,150 | | $ | 33,007 |
Accumulated benefit obligation (“ABO”) | | | 31,150 | | | 33,007 |
Fair value of plan assets | | | 26,393 | | | 24,630 |
ABO less fair value of plan assets | | | 4,757 | | | 8,377 |
| | | | | | | | | | | | | | |
| (in thousands) | | 2023 | | 2022 |
| Projected benefit obligation | | $ | 24,369 | | | $ | 24,129 | |
| Accumulated benefit obligation (“ABO”) | | 24,369 | | | 24,129 | |
| Fair value of plan assets | | 22,597 | | | 21,016 | |
| ABO less fair value of plan assets | | $ | 1,772 | | | $ | 3,113 | |
Amounts recognized in the consolidated balance sheets
at December 31, are as follows:
| | | | | | | | | | | | | | |
| (in thousands) | | 2023 | | 2022 |
| Current liabilities | | $ | — | | | $ | 650 | |
| Noncurrent liabilities | | 1,772 | | | 2,463 | |
| Total amount recognized | | $ | 1,772 | | | $ | 3,113 | |
Table of Contents | | | | | | |
(in thousands) | | 2021 | | 2020 |
| | (Successor) | | (Successor) |
Current liabilities | | $ | 650 | | $ | 650 |
Noncurrent liabilities | | | 4,107 | | | 7,727 |
Total amount recognized | | $ | 4,757 | | $ | 8,377 |
Net Periodic Benefit Cost
The components of net periodic benefit cost are as follows:
| | | | | | | | | | |
| | | | | | | | From |
| | | | | | | | January 4 |
| | Year Ended | | | through |
| | December 31, | | | December 31, |
(in thousands) | | 2021 | | 2020 | | | 2019 |
| | (Successor) | | (Successor) | | | (Successor) |
Interest cost | | $ | 785 | | $ | 955 | | | $ | 1,132 |
Expected return on plan assets | | | (1,107) | | | (1,110) | | | | (1,073) |
Recognized net actuarial loss | | | 293 | | | 49 | | | | — |
Net periodic benefit cost | | $ | (29) | | $ | (106) | | | $ | 59 |
| | | | | | | | | | | | | | | | | | | | |
| (in thousands) | | Year Ended December 31, |
| 2023 | | 2022 | | 2021 |
| Interest cost | | $ | 1,181 | | | $ | 847 | | | $ | 785 | |
| Expected return on plan assets | | (1,434) | | | (1,139) | | | (1,107) | |
| Recognized net actuarial (gain) loss | | (151) | | | — | | | 293 | |
| Net periodic benefit cost | | $ | (404) | | | $ | (292) | | | $ | (29) | |
Change in Accumulated Other Comprehensive Loss
| | | | | | | | | | |
| | | | | | | | From |
| | | | | | | | January 4 |
| | Year Ended | | | through |
| | December 31, | | | December 31, |
(in thousands) | | 2021 | | 2020 | | | 2019 |
| | (Successor) | | (Successor) | | | (Successor) |
Beginning of year | | $ | (2,215) | | $ | (940) | | | $ | (9,059) |
Net actuarial gain (loss) | | | 2,649 | | | (1,759) | | | | (1,259) |
Impact of reflecting purchase accounting | | | — | | | — | | | | 9,059 |
Amortization of net gain | | | 293 | | | 49 | | | | — |
Income tax expense related to pension | | | (747) | | | 435 | | | | 319 |
End of year | | $ | (20) | | $ | (2,215) | | | $ | (940) |
Income (Loss)
| | | | | | | | | | | | | | | | | | | | |
| (in thousands) | | Year Ended December 31, |
| 2023 | | 2022 | | 2021 |
| Beginning of year | | $ | 502 | | | $ | (20) | | | $ | (2,215) | |
| Net actuarial gain | | 909 | | | 703 | | | 2,649 | |
| Amortization of net actuarial (gain) loss | | (151) | | | — | | | 293 | |
| Income tax expense related to pension | | (191) | | | (181) | | | (747) | |
| End of year | | $ | 1,069 | | | $ | 502 | | | $ | (20) | |
The Company's target pension plan asset allocation and actual pension plan allocation of assets
atas of December 31, are as follows:
| | | | | | | | | |
| | Target | | | | | | |
Asset Category | | Allocation | | 2021 | | 2020 |
| | | | | (Successor) | | (Successor) |
Equity securities | | 65 | % | | 67 | % | | 80 | % |
Debt securities and cash | | 35 | | | 33 | | | 20 | |
| | 100 | % | | 100 | % | | 100 | % |
| | | | | | | | | | | | | | | | | | | | |
| Asset Category | | Target
Allocation | | 2023 | | 2022 |
| Equity securities | | 46 | % | | 43 | % | | 69 | % |
| Debt securities and cash | | 54 | | | 57 | | | 31 | |
| | 100 | % | | 100 | % | | 100 | % |
The pension plan assets are invested with the objective of maximizing long-term returns while minimizing material losses in order to meet future benefit obligations when they come due.
The Company utilizes an investment approach with a mix of equity and debt securities used to maximize the long-term return on assets. Risk tolerance is established through consideration of pension plan liabilities, funded status and corporate financial condition. The investment portfolio consists of a diversified blend of mutual funds and fixed-income investments. Investment risk is measured and monitored on an ongoing basis through quarterly investment portfolio reviews and annual asset and liability reviews.
The following tables present
ourthe Company's plan assets, using the fair value hierarchy as disclosed in Note 5, Fair Value
Measurements, as of December 31, 2021 and 2020.
| | | | | | | | | | | | |
| | Assets at Fair Value as of December 31, 2021 |
| | (Successor) |
(in thousands) | | Level 1 | | Level 2 | | Level 3 | | Total |
Cash and cash equivalents | | $ | — | | $ | — | | $ | — | | $ | — |
Registered investment companies: | | | | | | | | | | | | |
Total international stock index fund | | | 8,525 | | | — | | | — | | | 8,525 |
Total stock market index fund | | | 9,127 | | | — | | | — | | | 9,127 |
Total return fund | | | 8,625 | | | — | | | — | | | 8,625 |
Pending trades | | | 116 | | | — | | | — | | | 116 |
Total assets at fair value | | $ | 26,393 | | $ | — | | $ | — | | $ | 26,393 |
Measurements. | | | | | | | | | | | | | | | | | | | | | | | | | | |
| | Assets at Fair Value as of December 31, 2023 |
| (in thousands) | | Level 1 | | Level 2 | | Level 3 | | Total |
| Cash and cash equivalents | | $ | 127 | | | $ | — | | | $ | — | | | $ | 127 | |
| Registered investment companies: | | | | | | | | |
| Total international stock index fund | | 5,184 | | | — | | | — | | | 5,184 | |
| Total stock market index fund | | 4,609 | | | — | | | — | | | 4,609 | |
| Total return fund | | 12,677 | | | — | | | — | | | 12,677 | |
| Total assets at fair value | | $ | 22,597 | | | $ | — | | | $ | — | | | $ | 22,597 | |
| | | | | | | | | | | | | | | | | | | | | | | | | | |
| | Assets at Fair Value as of December 31, 2022 |
| (in thousands) | | Level 1 | | Level 2 | | Level 3 | | Total |
| Cash and cash equivalents | | $ | 121 | | | $ | — | | | $ | — | | | $ | 121 | |
| Registered investment companies: | | | | | | | | |
| Total international stock index fund | | 7,163 | | | — | | | — | | | 7,163 | |
| Total stock market index fund | | 7,346 | | | — | | | — | | | 7,346 | |
| Total return fund | | 6,386 | | | — | | | — | | | 6,386 | |
| Total assets at fair value | | $ | 21,016 | | | $ | — | | | $ | — | | | $ | 21,016 | |
| | Assets at Fair Value as of December 31, 2020 |
| | (Successor) |
(in thousands) | | Level 1 | | Level 2 | | Level 3 | | Total |
Cash and cash equivalents | | $ | 660 | | $ | — | | $ | — | | $ | 660 |
Registered investment companies: | | | | | | | | | | | | |
Total international stock index fund | | | 9,533 | | | — | | | — | | | 9,533 |
Total stock market index fund | | | 6,400 | | | — | | | — | | | 6,400 |
Total return fund | | | 4,150 | | | — | | | — | | | 4,150 |
Volatility risk premium defensive fund | | | 3,887 | | | — | | | — | | | 3,887 |
Total assets at fair value | | $ | 24,630 | | $ | — | | $ | — | | $ | 24,630 |
Investments in Equityequity and Debt Securitiesdebt securities are valued at the net asset value of units held at the end of the period based upon the value of the underlying investments as determined by quoted market prices. These investments are classified as Level 1.
The Company contributed $0.2 million, $0.7 million $1.1 million and $0.5$0.7 million to the pension plan during the years ended December 31, 20212023, 2022, and 2020, and for the period from January 4 through December 31, 2019,2021, respectively. The Company expectsdoes not expect to make contribution of approximately $0.7 millioncontributions during in 2022 2024. Estimated Future Benefit Payments
The following benefit payments are expected to be paid:
| | | | | |
| (in thousands) | |
| 2024 | $ | 1,633 | |
| 2025 | 1,672 | |
| 2026 | 1,720 | |
| 2027 | 1,810 | |
| 2028 | 1,812 | |
| 2029 - 2033 | 8,822 | |
Table of Contents | | | |
(in thousands) | | | |
2022 | | $ | 1,449 |
2023 | | | 1,555 |
2024 | | | 1,599 |
2025 | | | 1,638 |
2026 | | | 1,703 |
2027 - 2032 | | | 8,895 |
The following weighted-average assumptions were used as of each of the years ended December 31, as follows:
| | | | | | | | | |
| | 2021 | | 2020 | | 2019 |
| | (Successor) | | (Successor) | | (Successor) |
Weighted-average actuarial assumptions used to determine benefit obligations: | | | | | | | | | |
Discount rate | | 2.77 | % | | 2.43 | % | | 3.17 | % |
Expected return on assets | | 5.05 | % | | 5.40 | % | | 5.50 | % |
Weighted-average actuarial assumptions used to determine net periodic benefit cost: | | | | | | | | | |
Discount rate | | 2.43 | % | | 3.17 | % | | 4.26 | % |
Expected return on assets | | 5.05 | % | | 5.40 | % | | 5.50 | % |
Rate of compensation increase | | N/A | | | N/A | | | N/A | |
| | | | | | | | | | | | | | | | | | | | |
| | 2023 | | 2022 | | 2021 |
| Weighted-average actuarial assumptions used to determine benefit obligations: | | | | | | |
| Discount rate | | 4.82 % | | 5.01 % | | 2.77 % |
| Expected return on assets | | 5.93 % | | 4.90 % | | 5.05 % |
| Weighted-average actuarial assumptions used to determine net periodic benefit cost: | | | | | | |
| Discount rate | | 5.01 % | | 2.77 % | | 2.43 % |
| Expected return on assets | | 6.13 % | | 5.05 % | | 5.05 % |
| Rate of compensation increase | | N/A | | N/A | | N/A |
These assumptions are reviewed on an annual basis. The discount rate reflects the current rate at which the pension obligation could be effectively settled at the end of the year. The Company sets its rate to reflect the yield of a portfolio of high quality, fixed-income debt instruments that would produce cash flow sufficient in timing and amount to settle projected future benefits. In determining the expected return on asset assumption, the Company evaluates the long-term
returns earned by the pension plan, the mix of investments that comprise pension plan assets and forecasts of future long-term investment returns.
The Company also sponsors a defined contribution plan, which qualifies under Section 401(k) of the Internal Revenue Code of 1986, as amended (the “Code”) and covers substantially all of the Company’s employees. Employees may contribute annually up to
60%80% of their base compensation on a pre-tax basis (subject to Internal Revenue Service limitation). The company matching contribution is 50% of the first 6% of base compensation that an employee contributes.
WeThe Company made matching contributions to the plan of approximately
$5.6$7.5 million,
$4.0$6.0 million and
$3.0$5.6 million for the years ended December 31,
2023 and 2022, and 2021,
and 2020, and for the period from January 4 through December 31, 2019, respectively.
The Company is self-insured for employee healthcare up to $250,000 per member per plan year and aggregate claims up to 125% of expected claims per plan year. Also, the Company purchases workers’ compensation and automobile liability coverage with related deductibles. The Company is liable for up to $250,000 per individual workers’ compensation claim and up to $500,000 per accident for automobile liability claims. Self-insurance and deductible costs are included in other accrued expenses in the consolidated balance sheets and are accrued based upon the aggregate of the liability for reported claims and an actuarially determined estimated liability for claims development and incurred but not reported.
15.
The
(benefit) provision for income
taxestax expense (benefit) consists of the following:
| | | | | | | | | | | | | |
| | | | | | From | | | From |
| | | | | | January 4 | | | January 1 |
| | Year Ended | | through | | | through |
| | December 31, | | December 31, | | | January 3, |
(in thousands) | | 2021 | | 2020 | | 2019 | | | 2019 |
| | (Successor) | | (Successor) | | (Successor) | | | (Predecessor) |
Federal Current | | $ | 223 | | $ | — | | $ | — | | | $ | — |
State Current | | | 4,206 | | | 1,710 | | | 445 | | | | — |
Total Current | | | 4,429 | | | 1,710 | | | 445 | | | | — |
Federal Deferred | | | 11,823 | | | (3,351) | | | (11,802) | | | | (11,130) |
State Deferred | | | 181 | | | (1,593) | | | (3,500) | | | | (2,151) |
Total Deferred | | | 12,004 | | | (4,944) | | | (15,302) | | | | (13,281) |
| | $ | 16,433 | | $ | (3,234) | | $ | (14,857) | | | $ | (13,281) |
| | | | | | | | | | | | | | | | | | | | |
| | Year Ended December 31, |
| (in thousands) | | 2023 | | 2022 | | 2021 |
| Federal current | | $ | 8,873 | | $ | (6,555) | | $ | 223 |
| State current | | 3,716 | | 3,697 | | 4,206 |
| Total current | | 12,589 | | (2,858) | | 4,429 |
| Federal deferred | | (11,918) | | 1,730 | | 11,823 |
| State deferred | | (5,403) | | (104) | | 181 |
| Total deferred | | (17,321) | | 1,626 | | 12,004 |
| | $ | (4,732) | | $ | (1,232) | | $ | 16,433 |
Reconciliations between the Company’s effective income tax rate and the U.S. statutory rate are as follow:
| | | | | | | | | | | | | |
| | | | | | | | From | | | From |
| | | | | | | | January 4 | | | January 1 |
| | Year Ended | | through | | | through |
| | December 31, | | December 31, | | | January 3, |
| | 2021 | | 2020 | | 2019 | | | 2019 |
| | (Successor) | | (Successor) | | (Successor) | | | (Predecessor) |
Statutory U.S. Federal income tax rate | | 21.0 | % | | (21.0) | % | | (21.0) | % | | | (21.0) | % |
State income taxes, net of U.S. Federal income tax | | 4.8 | | | (6.3) | | | (3.5) | | | | (2.2) | |
Permanent items | | 0.5 | | | 2.0 | | | 0.9 | | | | 1.7 | |
Deferred rate change | | 1.8 | | | 0.2 | | | (1.0) | | | | (0.6) | |
Share-based compensation | | (5.2) | | | (1.4) | | | (3.5) | | | | (58.2) | |
TRA fair value adjustment | | 2.9 | | | 14.1 | | | (4.4) | | | | — | |
Transaction costs | | 2.3 | | | — | | | — | | | | 2.7 | |
Valuation allowance | | — | | | — | | | — | | | | — | |
Executive compensation disallowed | | 11.1 | | | — | | | — | | | | — | |
Other | | 1.4 | | | (0.2) | | | 0.4 | | | | 0.1 | |
Effective income tax rate | | 40.6 | % | | (12.6) | % | | (32.1) | % | | | (77.5) | % |
follows:
| | | | | | | | | | | | | | | | | | | | |
| | Year Ended December 31, |
| | 2023 | | 2022 | | 2021 |
| Statutory U.S. Federal income tax rate | | 21.0 % | | 21.0 % | | 21.0 % |
| State income taxes, net of U.S. Federal income tax | | 3.4 | | 10.9 | | 4.8 |
| Permanent items | | (0.4) | | (0.8) | | 0.1 |
| Meals and entertainment | | (2.7) | | 0.3 | | 0.4 |
| Deferred rate change | | 8.9 | | 2.1 | | 1.8 |
| Share-based compensation | | 6.2 | | (30.0) | | | (5.2) |
| Executive compensation disallowed | | (15.8) | | 23.5 | | 11.1 |
| TRA fair value adjustment | | (1.1) | | (1.9) | | 2.9 |
| Release of Sizewise reserve | | — | | (30.4) | | — |
| Transaction costs | | — | | — | | 2.3 |
| Tax credits | | 2.7 | | (0.6) | | — |
| Valuation allowance | | (2.4) | | — | | — |
| Other | | (0.2) | | 1.6 | | 1.4 |
| Effective income tax rate | | 19.6 % | | (4.3) % | | 40.6 % |
The Company's effective tax rate for the year ended December 31, 2023 was primarily impacted by executive compensation disallowed under Internal Revenue Code Section 162(m), share-based compensation, and deferred rate changes. ThOure Company's effective tax rate for the year ended December 31, 2022 was primarily impacted by share-based compensation, executive compensation disallowed under Internal Revenue Code Section 162(m), and the release of uncertain tax positions and permanent items related to the Sizewise Acquisition as described below. The Company's effective tax rate for the year ended December 31, 2021 was primarily impacted by share-based compensation, executive compensation disallowed under Internal Revenue Code Section 162(m), a tax rate change, transaction costs and ourthe Company's tax receivable agreement. Our effective tax rate for
Pursuant to the
receipt of a Private Letter Ruling from the IRS during the fiscal year ended December 31,
20202022, the Company released a reserve assumed from the Sizewise Acquisition completed in 2021. The exposure was covered by an indemnification agreement with the seller. The release of the reserve and associated interest and penalties accrual resulted in a $11.9 million tax benefit and indemnification expense for the same amount, which is included in ‘Tax indemnification expense’ on the consolidated statements of operations. The release of the reserve is treated as a significant, unusual item under the provisions of ASC 740 and the
period from January 4 through$11.9 million tax benefit recognized resulted in a significant variation in the customary relationship between income tax expense (benefit) and pre-tax income (loss) for fiscal year ended December 31,
2019 was primarily impacted by our tax receivable agreement. Our effective tax rate for2022, as seen within the
period from January 1 through January 3, 2019 was reduced by 55.7% for excess tax benefits associated with exercises of share-based compensation.The Coronavirus Aid, Relief, and Economic Securitytable above.
On August 9, 2022, the Creating Helpful Incentives to Produce Semiconductors ("CHIPS") Act ("CARES Act") was signed into law creating a new advanced manufacturing investment credit under new Internal Revenue Code section 48D. On August 16, 2022, the Inflation Reduction Act was signed into law. The two primary tax implications for corporations are a 15% alternative minimum tax (“AMT”) that applies to corporations with at least $1.0 billion of pretax income and a 1% surtax on March 27, 2020. Among others,share buybacks, which takes effect in 2023. The Company does not deem the CARESCHIPS Act delayed payment of employer payroll taxes and adjustedor the depreciable life of qualified leasehold improvement property. WeInflation Reduction Act to have reflected thea material impact of the CARES Act within our consolidatedon its financial statements for the years ended December 31, 20212023 and 2020,2022.
On December 15, 2022, the European Union (“EU”) member states formally adopted the EU’s Pillar Two Directive, which was established by the Organization for Economic Co-operation and suchDevelopment, and which generally provides for a 15% minimum effective tax rate for multinational enterprises, in every jurisdiction in which they operate. While the Company does not anticipate that this will have a material impact was not materialon the tax provision or effective tax rate, management continues to our consolidated financial statements.
monitor evolving tax legislation in the jurisdictions in which the Company operates.
The components of the Company’s overall deferred tax assets and liabilities are as follows:
| | | | | | |
| | December 31, | | December 31, |
(in thousands) | | 2021 | | 2020 |
| | (Successor) | | (Successor) |
Deferred tax assets: | | | | | | |
Accounts receivable | | $ | 797 | | $ | 507 |
Accrued compensation and pension | | | 17,063 | | | 19,190 |
Inventories | | | 1,942 | | | 616 |
Other assets | | | 2,924 | | | 3,574 |
Unrealized loss on pension | | | 7 | | | 754 |
Operating lease liability | | | 22,120 | | | 13,826 |
Unrealized (gain) loss on cash flow hedge | | | (536) | | | 478 |
Net operating loss carryforwards | | | 30,660 | | | 44,819 |
Total deferred tax assets | | | 74,977 | | | 83,764 |
Deferred tax liabilities: | | | | | | |
Other liabilities | | | (3,545) | | | (3,056) |
Accelerated depreciation and amortization | | | (191,461) | | | (128,518) |
Prepaid assets | | | (2,683) | | | (1,931) |
Operating lease right-of-use assets | | | (20,595) | | | (13,007) |
Total deferred tax liabilities | | | (218,284) | | | (146,512) |
Net deferred tax asset (liabilities) | | $ | (143,307) | | $ | (62,748) |
At
| | | | | | | | | | | | | | |
| (in thousands) | | December 31,
2023 | | December 31,
2022 |
| Deferred tax assets: | | | | |
| Accounts receivable | | $ | 1,582 | | $ | 1,079 |
| Accrued compensation and pension | | 8,529 | | 9,901 |
| Inventories | | 2,888 | | 1,468 |
| Other assets | | 4,151 | | 3,847 |
| Operating lease liability | | 22,730 | | 23,407 |
| Section 163(j) capitalized interest | | 16,979 | | 4,975 |
| Section 174 capitalized R&D costs | | 6,591 | | 2,901 |
| Net operating loss carryforwards | | 2,138 | | 17,146 |
| Total gross deferred tax assets | | 65,588 | | 64,724 |
| Valuation allowance | | (577) | | | — | |
| Total deferred tax assets | | 65,011 | | 64,724 | |
| Deferred tax liabilities: | | | | |
| Deferred contract costs | | (3,102) | | | (3,850) | |
| Unrealized (gain) on pension | | (364) | | | (174) | |
| Unrealized (gain) on cash flow hedge | | (489) | | | (2,370) | |
| Accelerated depreciation and amortization | | (163,988) | | | (180,934) | |
| Prepaid assets | | (3,429) | | | (3,537) | |
| Operating lease right-of-use assets | | (19,858) | | | (20,474) | |
| Total deferred tax liabilities | | (191,230) | | | (211,339) | |
| Total net deferred tax liabilities | | (126,219) | | | (146,615) | |
As of December 31,
2021,2023, the Company
had available unusedhas fully utilized its federal net operating loss
carryforwards of approximately $105.1 million. There is no expiration of federal net operating losses. Net operating loss carryforwards of the Company are subject to review and possible adjustment by the taxing authorities.Under the Code, certain corporate stock transactions into which the Company has entered or may enter in the future could limit the amount of the net operating loss carryforwards that can be utilized in future periods. The Company has completed a review of historical stock transactions, as well as the stock transactions completed in the current year and concluded that there is no material limitation on the use of the net operating loss carryforwards.
In assessing the need for a valuation allowance,
we considerthe Company considers whether it is more likely than not that some portion or all of the deferred tax assets will not be realized.
We evaluate ourThe Company evaluates its ability to realize the tax benefits associated with deferred tax assets by analyzing the relative impact of all the available positive and negative evidence regarding
ourits forecasted taxable income, the reversal of existing deferred tax liabilities, taxable income in prior carry-back years (if permitted) and the availability of tax planning strategies. The Company has been generating taxable income in recent years
on a consolidated basis and is projecting
significant taxable income in future years due to continued
growth. As such, we believegrowth on a consolidated basis. However, based upon the analysis performed on the various operating entities, it was determined that it
is more likely thanwas more-likely-than not that
wethe Company will
not be able to
realize ourbenefit from a portion of the separate state net operating losses. As such, the Company has recorded a valuation allowance on these deferred tax assets
and haveas of December 31, 2023. The Company did not
recordedrecord a valuation allowance for the years ended December 31,
20212022 and
2020, the period from January 4 through December 31, 2019 and the period from January 1 through January 3, 2019.2021.
ASC
Topic 740 clarifies the accounting for uncertainty in income taxes recognized in an enterprise’s financial statements and prescribes a recognition threshold and measurement process for financial statement recognition and measurement of a tax position taken or expected to be taken in a tax return. ASC
Topic 740 also provides guidance on derecognition, classification, interest and penalties, accounting in interim periods, disclosure and transition.
The Company files income tax returns in the U.S. federal jurisdiction and numerous state jurisdictions. With few exceptions, the Company is no longer subject to U.S. federal or state and local income tax examinations by tax authorities for taxable years before 2018.
2020.
A reconciliation of the beginning and ending amount of unrecognized tax benefit for the years ended December 31, 2021, 20202023, 2022 and 20192021 is as follows:
| | | |
(in thousands) | | | |
Unrecognized tax benefits balance at January 1, 2019 (Predecessor) | | $ | 1,365 |
Gross decreases for tax positions in 2019 | | | (25) |
Unrecognized tax benefits balance at December 31, 2019 (Successor) | | | 1,340 |
Gross decreases for rate change in 2020 | | | — |
Unrecognized tax benefits balance at December 31, 2020 (Successor) | | | 1,340 |
Gross increase for tax positions in 2021 | | | 8,771 |
Unrecognized tax benefits balance at December 31, 2021 (Successor) | | $ | 10,111 |
| | | | | |
| (in thousands) | |
| Unrecognized tax benefits balance at December 31, 2020 | $ | 1,340 |
| Gross decreases for tax positions in 2021 | 8,771 | |
| Unrecognized tax benefits balance at December 31, 2021 | 10,111 |
| Gross increase for rate change in 2022 | (8,753) |
| Unrecognized tax benefits balance at December 31, 2022 | 1,358 |
| Gross decrease for tax positions in 2023 | (18) |
| Unrecognized tax benefits balance at December 31, 2023 | $ | 1,340 |
The Company has
$1.3 million of unrecognized tax benefits
of $8.8 million as of December 31,
20212023 that, if recognized, would impact the effective tax rate. The
gross increase in 2021 was the result of the Sizewise AcquisitionCompany did not accrue for
which the exposure is fully indemnified. The Company has $3.2 million in accruedany interest
andor penalties related to unrecognized tax benefits as of December 31,
2023 and 2022 as compared to an accrual of $3.2 million for the year ended December 31, 2021. The Company
expects that it is reasonably possible that approximately $1.4 million ofdoes not anticipate significant changes to our unrecognized tax benefits
will reverse within the next twelve months.
16.
On December 14, 2022, the year ended December 31, 2021, approximately 17% of total revenue relatedCompany received a modification to various contracts with the Company’s current U.S. Department of Health and Human Services’ (“HHS”Services (“HHS”) Office ofand the Assistant Secretary offor Preparedness and Response (“(“ASPR”) agreement that expired on February 27, 2023 incorporating Federal Acquisition Regulation (“FAR”) 52.217-8, which allows the government to extend the term of this current agreement by up to six months.
Additionally, on December 14, 2022, the Company entered into a new HHS / ASPR
” agreement (the "Agreement")
.17. for preventive maintenance services (“PMS”), management and storage for ventilator and powered air purifying respirator (“PAPR”) systems. The Agreement’s performance period commenced on August 28, 2023 and is anticipated to have a period of performance of four years and six months, consisting of a base period of twelve months, three one-year option periods and an additional six-month option period.
Approximately 10.4% and 10.5% of total Company revenue was attributable to various contracts with the HHS / ASPR for the years ending December 31, 2023 and 2022, respectively.
16. Earnings (Loss) Per Share
The following is a reconciliation of the basic and diluted number of shares used in computing earnings (loss) per share:
| | | | | | | | | |
| | | | | | | | From |
| | | | | | | | January 4 |
| | Year Ended | | through |
| | December 31, | | December 31, |
| | 2021 | | 2020 | | 2019 |
| | (Successor) | | (Successor) | | (Successor) |
Basic weighted average shares outstanding | | | 120,877,480 | | | 98,976,226 | | | 98,942,437 |
Net effect of dilutive stock awards based upon the treasury stock method | | | 7,619,740 | | | — | | | — |
Dilutive weighted average shares outstanding | | | 128,497,220 | | | 98,976,226 | | | 98,942,437 |
| | | | | | | | | |
Basic earnings (loss) per share | | $ | 0.20 | | $ | (0.23) | | $ | (0.32) |
Diluted earnings (loss) per share | | $ | 0.19 | | $ | (0.23) | | $ | (0.32) |
| | | | | | | | | |
Anti-dilutive share-based awards excluded from the calculation of dilutive earnings per share | | | — | | | 7,108,088 | | | 3,686,255 |
102
| | | | | | | | | | | | | | | | | | | | |
| | Year Ended December 31, |
| | 2023 | | 2022 | | 2021 |
| Basic weighted average shares outstanding | | 134,647,238 | | 132,602,747 | | 120,877,480 |
| Net effect of dilutive stock awards based upon the treasury stock method | | — | | | 5,778,548 | | | 7,619,740 | |
| Dilutive weighted average shares outstanding | | 134,647,238 | | 138,381,295 | | 128,497,220 |
| | | | | | |
| Basic earnings (loss) per share | | $ | (0.14) | | $ | 0.23 | | | $ | 0.20 | |
| Diluted earnings (loss) per share | | $ | (0.14) | | $ | 0.22 | | | $ | 0.19 | |
| | | | | | |
| Anti-dilutive share-based awards excluded from the calculation of dilutive earnings per share | | 8,557,396 | | 9,203 | | — |
For the year ended December 31, 2023, dilutive weighted-average shares outstanding is equal to basic weighted-average shares outstanding due to the Company’s net loss position as the inclusion of such stock awards within dilutive weighted-average shares outstanding would be antidilutive.
Merger Agreement
On February 28, 2022, we26, 2024, the Company, entered into an Agreement and Plan of Merger (the “Merger Agreement”) by and among the Company, Apex Intermediate Holdco, Inc., a Delaware corporation (“Parent”), and Apex Merger Sub, Inc., a Delaware corporation and a direct wholly owned subsidiary of Parent (“Merger Sub”), pursuant to which, subject to the satisfaction or waiver of certain conditions and on the terms set forth therein, Merger Sub will merge (the “Merger”) with and into the Company, with the Company continuing as the surviving corporation (the “Surviving Corporation”). Parent and Merger Sub are affiliates of THL Agiliti LLC, an affiliate of Thomas H. Lee Partners, L.P. (“THL”) and the holder of a majority of the outstanding capital stock of the Company (the “Significant Company Stockholder”). Capitalized terms used herein but not otherwise defined have the meaning set forth in the Merger Agreement.
Merger Consideration
Pursuant to the Merger Agreement, at the effective time of the Merger (the “Effective Time”), each share of common stock, $0.0001 par value per share, of the Company (the “Shares” and each a “Share”) issued and outstanding immediately prior to the Effective Time (other than (i) Shares owned directly or indirectly by the Significant Company Stockholder, Parent or Merger Sub or any of their respective Subsidiaries (each such Share referred to in clause (i), a “Significant Company Stockholder Share” and, collectively, the “Significant Company Stockholder Shares”), (ii) the Rollover Shares (defined below) and (iii) Shares owned by the Company as treasury stock (each such Share referred to in clause (iii), an “Excluded Share” and, collectively, the “Excluded Shares”) and (iv) Shares that are owned by stockholders who have perfected and not withdrawn a demand for appraisal rights in accordance with Section 262 of the DGCL (“Dissenting Stockholders”)), shall be converted into the right to receive $10.00 per Share in cash, without interest thereon (the “Merger Consideration”).
Refer to the Company’s Current Report on Form 8-K filed with the Securities and Exchange Commission on February 26, 2024 for additional information regarding the Merger.
Accounts Receivable Securitization
On February 14, 2024, Agiliti Receivables LLC, a special purpose entity (the “SPV”) that is an indirect subsidiary of the Company, entered into an accounts receivable securitization facility (the “AR Facility”) of up to $150 million with MUFG Bank, Ltd., as administrative agent pursuant to a receivables financing agreement, dated as of February 14, 2024 (the “RFA”), among the SPV, Agiliti Health, Inc., as servicer, the administrative agent and the group and agents and lenders party thereto. In connection with the AR Facility, certain subsidiaries of Agiliti, as originators (the “Originators”), sold and will continue to sell all of their accounts receivable and certain related assets (collectively, the “Receivables”) to the SPV.
The amount available for borrowings at any one time under the RFA is limited to a borrowing base amount calculated based on the outstanding balance of eligible Receivables, subject to certain reserves, concentration limits, and other limitations. Borrowings under the RFA bear interest at rates specified in the RFA in addition to a drawn fee and a fee on the undrawn committed amount of the RFA. Interest and fees payable by the SPV under the RFA are due monthly. The RFA is scheduled to terminate onFebruary 12, 2027, unless extended in accordance with its terms or earlier terminated. As of the date hereof, no amounts have been drawn on the AR facility.
The SPV pledged its ownership interest in the Receivables as collateral security for all amounts outstanding under the RFA, and Agiliti Health, Inc. will perform administrative and collection services relating to the Receivables on behalf of the SPV for a fee. Agiliti Health, Inc. guaranteed the respective performance obligations of the Originators under the RFA pursuant to a performance guaranty dated as of the Closing Date. However, neither Agiliti Health, Inc. nor any of its affiliates guarantees the SPV’s borrowings under the RFA or the collectability of the Receivables.
The RFA contains certain customary representations and warranties, affirmative and negative covenants, indemnification provisions, and events of default, including those providing for termination of the AR Facility and the acceleration of amounts owed by the SPV under the RFA upon the occurrence of certain events.
ITEM 9. Changes in and Disagreements with Accountants on Accounting and Financial Disclosure
None.
ITEM 9A. Controls and Procedures
Evaluation of Disclosure Controls and Procedures
Our management is responsible for establishing and maintaining effective disclosure controls and procedures, as defined under Rule 13a-15(e) and 15d-15(e) under the Securities Exchange Act of 1934, as amended (the “Exchange Act”). As of December 31, 2023, we performed an evaluation, under the supervision and with the participation of our management, including our Chief Executive Officer and Chief Financial Officer, of the effectiveness of the design and operation of Agiliti, Inc.’s disclosure controls and procedures and concluded that, due to the existence of material weaknesses in internal control over financial reporting described below, and based on the evaluation of these disclosure controls and procedures, the Company’s disclosure controls and procedures were not effective as of December 31, 2023.
Notwithstanding the existence of the material weaknesses described below, management performed additional analysis and other procedures to ensure that the consolidated financial statements and related financial information included in this Annual Report on Form 10-K fairly present, in all material respects, our financial position, results of operations and cash flows as of and for the periods presented, in conformity with generally accepted accounting principles in the United States of America (“GAAP”).
Management’s Report on Internal Control over Financial Reporting
Management is responsible for establishing and maintaining adequate internal control over financial reporting, as such term is defined under Rules 13a-15(f) and 15d-15(f) of the Exchange Act. Because of its inherent limitations, internal control over financial reporting may not prevent or detect all misstatements. Also, projections of any evaluation of effectiveness to future periods are subject to the risk that controls may become inadequate because of changes in conditions, or that the degree of compliance with the policies or procedures may deteriorate.
Management, including our Chief Executive Officer and Chief Financial Officer, under the oversight of our Board of Directors, evaluated the effectiveness of the Company’s internal control over financial reporting as of December 31, 2023. In making this evaluation, management used the criteria set forth by the Committee of Sponsoring Organizations of the Treadway Commission ("COSO") the Internal Control - Integrated Framework (2013). Based on its evaluation, management has concluded that the Company did not maintain effective internal control over financial reporting as of December 31, 2023, due to the material weaknesses caused by an insufficient number of trained resources with expertise in the design and implementation of controls to address identified risk related to IT systems and certain process-level controls, as follows:
•Information technology general controls ("ITGC") across all financial reporting systems related to ineffective user access, including segregation of duties, and ineffective change management controls over certain financial reporting systems. As a result, the Company had ineffective process level controls that are automated or that rely on information from the affected systems across all financial reporting processes.
•The Company was unable to maintain effective risk assessment processes and did not have effective identification and design of process-level control activities related to order-to-cash (including revenue and accounts receivable) and manual journal entries.
A material weakness is a deficiency, or a combination of deficiencies, in internal control over financial reporting, such that there is a reasonable possibility that a material misstatement of our annual or interim financial statements will not be prevented or detected on a timely basis.
Although these material weaknesses did not result in any material misstatement of our consolidated financial statements for the periods presented, there is a possibility they could lead to a material misstatement of account balances or disclosures. Accordingly, management has concluded that these control deficiencies constitute material weaknesses.
Our independent registered public accounting firm, KPMG LLP, who audited the consolidated financial statements included in this Annual Report on Form 10-K, issued an adverse opinion on the effectiveness of the Company’s internal control over financial reporting. KPMG LLP’s report appears in Part II, Item 8. of this Annual Report on Form 10-K.
2023 Remediation Activities
As previously disclosed in Item 9A. of our Annual Report for the fiscal year ended December 31, 2022, management identified material weaknesses in internal control over financial reporting due to insufficient trained resources with
expertise in implementation and operation of internal controls. These material weaknesses included ineffective identification of risks and related responses, ineffective control activities related to the design and operation of process level controls, and ineffective ITCGs across all financial reporting systems.
While we believe that we have taken meaningful steps to improve our internal controls over financial reporting related to the previously reported material weaknesses, full remediation was not realized as of December 31, 2023.
The Company performed the following remediation activities in 2023:
•We enhanced policies and procedures to improve our overall control environment and monitoring controls around timely evaluation and communication of internal control deficiencies to those parties responsible for taking corrective action, including senior management and the Board of Directors, as appropriate.
•We recruited key positions within our technology, accounting, internal audit, and other support functions with appropriate qualified experience to enhance our risk assessment processes and internal control capabilities, allow for additional segregation of duties and improved change management, and provide appropriate oversight and reviews.
•We provided training and education programs for personnel responsible for the performance of key business processes throughout the Company to facilitate their understanding of the risks being addressed by the controls they are performing as well as educate them in the documentation requirements of the internal control framework.
•We began modifying access to key system privileges to minimize risk within the organization and its IT systems.
•We began enhancing user access provisioning and monitoring controls to enforce appropriate system access and segregation of duties as well as controls supporting change management. We have also established a ruleset against which we will evaluate segregation of duties in future periods.
•We migrated most of our customers to a new cloud-based technology that is managed by our organization, which will allow for better established ITGCs.
•12-month sole source agreement (the “Agreement”) with HHS/ASPRWe made investments in our technology platforms and associated tools, such as monitoring software, in order to provide comprehensive ventilatorbetter reporting capabilities and powered air purifying respirator (“PAPR”) systems managementallow for transparency as to the changes made by users with privileged access.
•We made significant progress in enhancements to the business process control environment to address the noted design deficiencies.
•We modified resource allocations to further support the SOX compliance program.
Management’s Ongoing Remediation Plan
While we have put forth significant resources and maintenance serviceseffort in connectionour remediation activities described above, ongoing and additional activities are required to fully remediate our material weaknesses. We are continuing to implement process and control improvements to address the above material weaknesses as follows:
•We will continue to implement and enhance ITGCs and related policies. This will include providing training and support related to newly developed templates that are designed to help us both assess the appropriateness of IT access and identify potential segregation of duties conflicts so we can either modify access to address the conflict or identify sufficient compensating controls.
•We will continue to configure system access and new tools, such as monitoring software, to allow us to better report upon and evaluate software modifications, data changes, and other relevant IT changes.
•We will continue to coordinate with ongoing supportour Human Resources personnel to allow for better tracking of contingent workers (i.e., personnel who are not full-time employees of our company) to help us assess the appropriateness of, and maintenanceterminate as applicable, the system access of those workers.
•We will continue to develop and implement system and business process controls around our order-to-cash process for the various revenue streams and the manual journal entry process to address the design and implementation of controls. We have developed numerous controls that are being implemented and are dependent on system enhancements that are scheduled to occur throughout 2024.
•We will provide additional training with control owners and reviewers with specific focus on understanding the risks being addressed by the controls they are performing, as well as requirements for sufficient documentation and evidence in the execution of the national stockpile. This Agreement replacescontrols.
As anticipated, a remediation effort of this magnitude takes multiple years to complete. We are committed to ensuring that our internal controls are designed and operating effectively. Management believes the efforts taken to date and the planned remediation will improve the effectiveness of our internal control over financial reporting. While these remediation efforts
are ongoing, the controls must also be operating effectively for a sufficient period of time and be tested by management in order to consider them remediated and conclude that the controls are operating effectively to address the risks of material misstatement.
Changes in Internal Controls Over Financial Reporting
Except for the steps taken as part of the remediation activities described above, there have been no changes in our internal controls over financial reporting (as defined in Rules 13a-15(f) and 15d-15(f) under the Exchange Act) that occurred during the quarter ended December 31, 2023, that have materially affected, or are reasonably likely to materially affect, our internal control over financial reporting.
ITEM 9B. Other Information
Rule 10b5-1 Trading Plans
On December 11, 2023, Thomas J. Leonard, a member of our Board of Directors and our Chief Executive Officer, adopted a pre-arranged trading plan that is intended to satisfy the affirmative defense conditions of Rule 10b5-1(c) under the Exchange Act (“Rule 10b5-1 trading plan”). Mr. Leonard’s Rule 10b5-1 trading plan authorizes the potential sale of up to 496,041 shares of common stock issuable upon the exercise of outstanding stock options and expires no later than November 1, 2024.
On December 11, 2023, Lee M. Neumann, Executive Vice President and General Counsel, adopted a Rule 10b5-1 trading plan authorizing the potential sale of up to 14,055 shares of common stock. Ms. Neumann’s Rule 10b5-1 trading plan expires no later than November 29, 2024.
On December 12, 2023, Scott A. Christensen, Senior Vice President, Controller and Chief Accounting Officer, adopted a Rule 10b5-1 trading plan authorizing the potential sale of up to 13,934 shares of common stock issuable upon the exercise of outstanding stock options. Mr. Christensen’s Rule 10b5-1 trading plan expires no later than November 29, 2024.
Other than as disclosed above, none of our directors or officers adopted, modified or terminated Rule 10b5-1 trading plans or non-Rule 10b5-1 trading arrangements (as such terms are defined in Item 408(c) of Regulation S-K) during the three prior agreements between Agilitimonths ended December 31, 2023.
ITEM 9C. Disclosure Regarding Foreign Jurisdictions that Prevent Inspections
Not applicable.
PART III
ITEM 10. Directors, Executive Officers and HHS/ASPR that ran from July 21, 2020 to February 27, 2022,Corporate Governance
The information required by this Item 10. will be contained in the Definitive Proxy Statement and is comprisedincorporated herein by reference.
ITEM 11. Executive Compensation
The information required by this Item 11. will be contained in the Definitive Proxy Statement and is incorporated herein by reference.
ITEM 12. Security Ownership of an initial 6-month base term, running fromCertain Beneficial Owners and Management and Related Stockholder Matters
The information required by this Item 12. will be contained in the periodDefinitive Proxy Statement and is incorporated herein by reference.
ITEM 13. Certain Relationships and Related Transactions, and Director Independence
The information required by this Item 13. will be contained in the Definitive Proxy Statement and is incorporated herein by reference.
ITEM 14. Principal Accounting Fees and Services
Our independent registered public accounting firm is KPMG LLP, Minneapolis, MN, Auditor Firm ID: 185
The information required by this Item 14. will expire February 27, 2023. The termbe contained in the Definitive Proxy Statement and is incorporated herein by reference.
PART IV
ITEM 15. Exhibits and Financial Statement Schedules
We have filed the following documents as part of this new Agreement will allow adequate time for HHS/ASPRAnnual Report on Form 10-K:
1.Consolidated Financial Statements
Our consolidated financial statements are listed in the "Index to competeConsolidated Financial Statements" at the beginning of this document.
2.Consolidated Financial Statement Schedules
Supplemental financial schedules are omitted as not applicable or not required under the rules of Regulation S-X or the information is presented in the financial statements or notes thereto.
3.Exhibits
The documents listed in the Exhibit Index of this Annual Report on Form 10-K are incorporated by reference or are filed with this Annual Report on Form 10-K, in each case as indicated therein (numbered in accordance with Item 601 of Regulation S-K)
EXHIBIT INDEX
| | | | | | | | |
Exhibit
Number | | Description |
| 2.1 | | |
| | |
| 3.1 | | |
| | |
| 3.2 | | |
| | |
| 4.1 | | |
| | |
| 4.2 | | |
| | |
| 4.3 | | |
| | |
| 4.4 | | |
| | |
| 10.1 | | Credit Agreement, dated as of January 4, 2019, by and among Agiliti Health, Inc., as borrower, Agiliti Holdco, Inc. and certain subsidiaries of Agiliti Health as guarantors, JPMorgan Chase Bank, N.A., as administrative agent, collateral agent and letter of credit issuer, and the lenders from time to time party thereto (incorporated by reference to Exhibit 10.1 to our Current Report on Form 8-K filed on January 10, 2019). |
| 10.2 | | |
| | |
| | | | | | | | |
| 10.3 | | |
| | |
| 10.4 | | Advisory Services Agreement, dated as of January 4, 2019, by and among Agiliti, Inc., Agiliti Holdco, Inc., Agiliti Health, Inc. and THL Managers VIII, LLC (incorporated by reference to Exhibit 10.6 to our Current Report on Form 8-K filed on January 10, 2019). |
| | |
| 10.5+ | | |
| | |
| 10.6+ | | |
| | |
| 10.7+ | | |
| | |
| 10.8+ | | |
| | |
| 10.9+ | | |
| | |
| 10.10+ | | |
| | |
| 10.11+ | | |
| | |
| 10.12+ | | |
| | |
| 10.13+ | | |
| | |
| 10.14+ | | |
| | |
| 10.15+ | | |
| | |
| 10.16+ | | |
| | |
| 10.17+ | | |
| | |
| 10.18+ | | |
| | |
| 10.19+ | | |
| | |
| | | | | | | | |
| 10.20+ | | |
| | |
| 10.21+ | | |
| | |
| 10.22+ | | |
| | |
| 10.23+ | | |
| | |
| 10.24+ | | |
| | |
| 10.25 | | Amendment No. 1 to Credit Agreement, dated as of February 6, 2020, by and among Agiliti Health, Inc., as borrower, Agiliti Holdco, Inc. and certain subsidiaries of Agiliti Health as guarantors, JPMorgan Chase Bank, N.A., as administrative agent and collateral agent, and the other loan parties thereto (incorporated by reference to Exhibit 10.26 to our Registration Statement on Form S-1/A filed on April 15, 2021). |
| | |
| 10.26 | | Amendment No. 2 to Credit Agreement, dated as of October 16, 2020, by and among Agiliti Health, Inc., as borrower, Agiliti Holdco, Inc. and certain subsidiaries of Agiliti Health as guarantors, JPMorgan Chase Bank, N.A., as administrative agent and collateral agent, and the other loan parties thereto (incorporated by reference to Exhibit 10.27 to our Registration Statement on Form S-1/A filed on April 15, 2021). |
| | |
| 10.27 | | Amendment No. 3 to Credit Agreement, dated as of March 19, 2021, by and among Agiliti Health, Inc., as borrower, Agiliti Holdco, Inc. and certain subsidiaries of Agiliti Health as guarantors, JPMorgan Chase Bank, N.A., as administrative agent and collateral agent, and the other loan parties thereto (incorporated by reference to Exhibit 10.28 to our Registration Statement on Form S-1/A filed on April 15, 2021). |
| | |
| 10.28 | | Amendment No. 4 to Credit Agreement, dated as of April 27, 2021, by and among Agiliti Health, Inc., as borrower, Agiliti Holdco, Inc. and certain subsidiaries of Agiliti Health as guarantors, JP Morgan Chase Bank, N.A., as administrative agent and collateral agent, and the other loan parties thereto (incorporated by reference to Exhibit 10.1 to our Current Report on Form 8-K filed on May 3, 2021). |
| | |
| 10.29 | | Amendment No. 5, dated as of October 1, 2021, by and among Agiliti Health, Inc., as borrower, Agiliti Holdco, Inc. as holdings, the subsidiaries of the Borrower from time to time party thereto, JPMorgan Chase Bank, N.A., as administrative agent, and the lenders party thereto, including Exhibit B, which is a conformed copy of the First Lien Credit Agreement through Amendment No. 5 (incorporated by reference to Exhibit 10.1 to our Current Report on Form 8-K filed on October 4, 2021). |
| | |
| 10.30+ | | |
| | |
| 10.31+ | |
|
| | |
| 10.32+ | | |
| | |
| 10.33 | | Amendment No. 6, dated as of April 6, 2023, by and among Agiliti Health, Inc., as borrower, Agiliti Holdco, Inc., as holdings, the subsidiaries of the Borrower from time to time party thereto, JPMorgan Chase Bank, N.A., as administrative agent, and the lenders party thereto, including Exhibit C, which is a conformed copy of the First Lien Credit Agreement through Amendment No. 6 (incorporated by reference to Exhibit 10.1 to our Current Report on Form 8-K filed on April 10, 2023). |
| | |
| 10.34 | | Amended and Restated Credit Agreement, dated as of May 1, 2023, by and among Agiliti Health, Inc., as borrower, Agiliti Holdco, Inc., as holdings, the subsidiaries of the borrower from time to time party thereto, JPMorgan Chase Bank, N.A., as administrative agent and collateral agent, and the lenders party thereto, including any schedules and exhibits attached thereto (incorporated by reference to Exhibit 10.1 to our Current Report on Form 8-K filed on May 2, 2023). |
| | |
| | | | | | | | |
| 10.35 | | Amendment No. 1, dated as of June 7, 2023, to the Tax Receivable Agreement, dated as of January 4, 2019, by and among Agiliti Holdco, Inc., a Delaware corporation, Agiliti, Inc., a Delaware corporation, as guarantor thereunder, IPC/UHS, L.P., solely in the capacity of the Stockholders’ Representative, and each of the successors and assigns thereto. (incorporated by reference to Exhibit 10.3 to our Quarterly Report on Form 10-Q filed on August 8, 2023). |
| | |
| 10.36+ | | |
| | |
| 10.37+ | | |
| | |
| 10.38 | | |
| | |
| 21.1 | | |
| | |
| 23.1 | | |
| | |
| 31.1 | | |
| | |
| 31.2 | | |
| | |
| 32.1* | | |
| | |
| 32.2* | | |
| | |
| 97.1 | | |
| | |
| 101.INS | | Inline XBRL Instance Document - the instance document does not appear in the Interactive Data File because its XBRL tags are embedded within the Inline XBRL document. |
| | |
| 101.SCH | | Inline XBRL Taxonomy Extension Calculation Linkbase Document. |
| | |
| 101.DEF | | Inline XBRL Taxonomy Extension Definition Linkbase Document. |
| | |
| 101.LAB | | Inline XBRL Taxonomy Extension Labels Linkbase Document. |
| | |
| 101.PRE | | Inline XBRL Taxonomy Extension Presentation Linkbase Document. |
| | |
| 104 | | The cover page for the Company’s Annual Report on Form 10-K has been formatted in Inline XBRL and contained in Exhibit 101. |
+ Indicates a longer-term agreement for comprehensive ventilator and PAPR systems management and maintenance services without having a lapse in critical COVID-19 pandemic response needs.contract or compensatory plan or arrangement.
103
*Furnished, not filed.ITEM 16. 10-K Summary
None.
SIGNATURES
Pursuant to the requirements of Section 13 or 15(d) of the Securities Exchange Act of 1934, the registrant has duly caused this report to be signed on its behalf by the undersigned thereunto duly authorized on March 5, 2024.
| | | | | | | | |
| AGILITI, INC. |
| By | /s/ Thomas J. Leonard |
| | Thomas J. Leonard |
| | Chief Executive Officer and Director |
Pursuant to the requirements of the Securities Exchange Act of 1934, this report has been signed by the following persons on behalf of the registrant and in the capacities indicated on March 5, 2024.
| | | | | |
| /s/ Thomas J. Leonard | Chief Executive Officer and Director (Principal Executive Officer) |
| Thomas J. Leonard |
| |
| /s/ James B. Pekarek | Executive Vice President and Chief Financial Officer (Principal Financial Officer) |
| James B. Pekarek |
| |
| /s/ Scott A. Christensen | Senior Vice President, Controller, and Chief Accounting Officer (Principal Accounting Officer) |
| Scott A. Christensen |
| |
| /s/ John L. Workman | Director |
| John L. Workman | |
| |
| /s/ Michael A. Bell | Director |
| Michael A. Bell | |
| |
| /s/ Darren Friedman | Director |
| Darren Friedman | |
| |
| /s/ Gary L. Gottlieb | Director |
| Gary L. Gottlieb | |
| |
| /s/ Joshua M. Nelson | Director |
| Joshua M. Nelson | |
| |
| /s/ Megan M. Preiner | Director |
| Megan M. Preiner | |
| |
| /s/ Scott M. Sperling | Director |
| Scott M. Sperling | |
| |
| /s/ Diane B. Patrick | Director |
| Diane B. Patrick | |
| |
| /s/ C. Martin Harris | Director |
| C. Martin Harris | |