SECURITIES AND EXCHANGE COMMISSION
Washington, D.C. 20549
FORM 10-K
| | | | | |
☒x
| Annual Report Pursuant to Section 13 or 15(d) of the Securities Exchange Act of 1934 |
for the fiscal year ended January 1,December 31, 2023 |
o | ☐Transition Report Pursuant to Section 13 or 15(d) of the Securities Exchange Act of 1934 |
For the transition period from to |
|
|
Commission File Number: 1-13703

SIX FLAGS ENTERTAINMENT CORPORATION
(Exact name of registrant as specified in its charter)
|
| | | | | | | |
| Delaware |
|
13-3995059 |
Delaware
(State or other jurisdiction of
incorporation or organization)
| | 13-3995059
(I.R.S. Employer Identification No.) |
|
|
|
1000 Ballpark Way, Suite 400
| | 76011 |
| (Address of principal executive offices) | | | 76011
(Zip Code) |
Registrant’s telephone number, including area code:(972) (972) 595-5000 Securities registered pursuant to Section 12(b) of the Act:
| |
| |
| | | | | | | | | | |
Title of each class | | | Trading Symbol(s) | | | Name of each exchange on which registered |
Common stock, $0.025 par value per share | |
SIX | |
New York Stock Exchange |
Securities registered pursuant to Section 12(g) of the Act: None
Indicate by check mark if the registrant is a well-known seasoned issuer, as defined in Rule 405 of the Securities Act of 1993. Yes ⌧x No ◻o
Indicate by check mark if the registrant is not required to file reports pursuant to Section 13 or Section 15(d) of the Securities Exchange Act of 1934. Yes ◻o No ⌧x Indicate by check mark whether the registrant (1) has filed all reports required to be filed by Section 13 or 15(d) of the Securities Exchange Act of 1934 during the preceding 12 months (or for such shorter period that the Registrant was required to file such reports), and (2) has been subject to such filing requirements for the past 90 days. Yes ⌧x No ◻o Indicate by check mark whether the registrant has submitted electronically every Interactive Data File required to be submitted pursuant to Rule 405 of Regulation S-T (§232.405 of this chapter) during the preceding 12 months (or for such shorter period that the registrant was required to submit such files). Yes ⌧x No ◻o
Indicate by check mark whether the registrant is a large accelerated filer, an accelerated filer, a non-accelerated filer, a smaller reporting company, or emerging growth company. See definition of "large accelerated filer," "accelerated filer," "smaller reporting company" and "emerging growth company" in Rule 12b-2 of the Exchange Act.
|
|
|
|
|
|
|
|
| | | | | | | | | | | | | | | | | | | | | |
Large accelerated filer⌧ | x
| Accelerated filer ◻
|
o | Non-accelerated filer◻ |
o | Smaller reporting company ☐
| o | Emerging growth company ☐
| o |
If an emerging growth company, indicate by check mark if the registrant has elected not to use the extended transition period for complying with any new or revised financial accounting standards provided pursuant to Section 13(a) of the Exchange Act. ◻o
Indicate by check mark whether the registrant is a shell company (as defined in Rule 12b-2 of the Act). Yes ☐o No ⌧x Indicate by check mark whether the registrant has filed a report on and attestation to its management's assessment of the effectiveness of its internal control over financial reporting under Section 404(b) of the Sarbanes-Oxley Act by the registered public accounting firm that prepared or issued its audit report. ☒x If securities are registered pursuant to Section 12(b) of the Act, indicate by check mark whether the financial statements of the registrant included in the filing reflect the correction of an error to previously issued financial statements. ☐x Indicate by check mark whether any of those error corrections are restatements that required a recovery analysis of incentive-based compensation received by any of the registrant’s executive officers during the relevant recovery period pursuant to §240.10D-1(b). ☐x On the last business day of the registrant’s most recently completed second fiscal quarter, the aggregate market value of the common stock of the registrant held by non-affiliates was approximately $1,912.9 million based on the closing price $23.04 of the common stock on The New York Stock Exchange on such date. Shares of common stock beneficially held by each executive officer and director have been excluded from this computation because these persons may be deemed to be affiliates. This determination of affiliate status is not necessarily a conclusive determination for any other purposes.
On March 3, 2023,February 26, 2024, there were 83,161,73684,127,596 shares of common stock, par value $0.025, of the registrant issued and outstanding.
DOCUMENTS INCORPORATED BY REFERENCE
Portions of the information required in Part III by Items 10, 11, 12, 13 and 14 are incorporated by reference
to the registrant’s proxy statement for the 2023 annual meeting of stockholders, whichand will be filed
by the registrant within 120 days after the
close of its 2022 fiscal
year.
year ended December 31, 2023.
CAUTIONARY NOTE REGARDING FORWARD-LOOKING STATEMENTS
This Annual Report on Form 10-K (the "Annual Report") and the documents incorporated herein by reference contain forward-looking statements within the meaning of Section 27A of the Securities Act of 1933, as amended, and Section 21E of the Securities Exchange Act of 1934, as amended. Forward-looking statements include all statements that are not historical facts and can be identified by words such as "anticipates," "intends," "plans," "seeks," "believes," "estimates," "expects," "may," "should," "could" and variations of such words or similar expressions. These forward-looking statements are not guarantees of future performance and are subject to risks, uncertainties, assumptions and other factors, some of which are beyond our control, which could cause actual results to differ materially from those expressed or implied by such forward-looking statements. These factors1 include (i) global coronavirus (“COVID-19”) pandemic-related business disruptions and economic uncertainty (ii) the adequacy of our cash flows from operations, available cash and available amounts under our credit facilities to meet our liquidity needs, (ii) the risk that the proposed Mergers (as defined below) disrupts current plans and operations of the Company and the effect of the announcement or pendency of the Mergers on the business relationships, operating results and business generally of the Company, (iii) our expectations regarding the timing, costs, benefits and results of our strategic plan, (iv) impact of macro-economic conditions, including inflation on consumer spending, (iv)(v) our ability to implement our capital plans in a timely and cost effective manner, and our expectations regarding the anticipated costs, benefits and results of such capital plans, (vi) the extent to which having parks in diverse geographical locations protects our consolidated results against the effects of adverse weather and other events, (vii) our ongoing compliance with laws and regulations, and the effect of, and cost and timing of compliance with, newly enacted laws and regulations, (viii) our ability to obtain additional financing and the increased cost of capital due to rising interest rates, (x)(ix) our expectations regarding the effect of certain accounting pronouncements, (xi)(x) our expectations regarding the cost or outcome of any litigation or other disputes, (xii)(xi) our annual income tax liability and the availability and effect of net operating loss carryforwards and other tax benefits, and (xii) our expectations regarding uncertain tax positions.
Forward-looking statements are based on our current expectations and assumptions regarding our business, the economy and other future conditions. Because forward-looking statements relate to the future, they are, by their nature, subject to inherent uncertainties, risks and changes in circumstances that are difficult to predict. Additional risks and uncertainties that could cause actual results to differ materially from those described in such forward-looking statements include, among others, the following:
| • | factors impacting attendance, such as local conditions, contagious diseases, including COVID-19 and Monkey Pox, or the perceived threat of contagious diseases, events, disturbances and terrorist activities; |
| • | regulations and guidance of federal, state and local governments and health officials regarding the response to COVID-19 and Monkey Pox, including, with respect to business operations, safety protocols and public gatherings (such as voluntary and, in some cases, mandatory, quarantines, as well as shut downs and other restrictions on travel and commercial, social and other activities); |
| • | economic impact of political instability and conflicts globally, such as the war in Ukraine; |
| • | recall of food, toys and other retail products sold at our parks; |
| • | accidents or incidents involving the safety of guests and employees, or contagious disease outbreaks at our parks or other parks in our industry, and negative publicity about us or our industry; |
| • | availability of commercially reasonable insurance policies at reasonable rates; |
| • | inability to achieve desired improvements and financial performance targets; |
| • | adverse weather conditions, such as excess heat or cold, rain and storms; |
| • | general financial and credit market conditions, including our ability to access credit or raise capital; |
| • | macro-economic conditions (including supply chain issues and the impact of inflation on customer spending patterns); |
| • | our ability to successfully implement our strategy; |
| • | changes in public and consumer tastes; |
| • | construction delays in capital improvements or ride downtime; |
| • | competition with other theme parks, water parks and entertainment alternatives; |
| • | dependence on a seasonal workforce; |
| • | unionization activities and labor disputes; |
•factors impacting our ability to consummate the transactions (collectively the “Mergers”) contemplated by that certain Agreement and Plan of Merger (the "Merger Agreement"), dated November 2, 2023, by and among Six Flags Entertainment Corporation, (“Holdings”), Cedar Fair, L.P., (“Cedar Fair”), CopperSteel HoldCo, Inc. ("CopperSteel"), and CopperSteel Merger Sub, LLC ("Copper Merger Sub");
•the risk that the proposed Mergers disrupts current plans and operations of the Company and the effect of the announcement or pendency of the Mergers on the business relationships, operating results and business generally of the Company;
•the occurrence of any event, change or other circumstance that could give rise to the termination of the Merger Agreement;
•factors impacting attendance, such as local conditions, contagious diseases, or the perceived threat of contagious diseases, events, disturbances and terrorist activities;
•economic impact of political instability and conflicts globally, such as the war in Ukraine and the Middle East;
•recall of food, toys and other retail products sold at our parks;
•accidents or incidents involving the safety of guests and employees, or contagious disease outbreaks at our parks or other parks in our industry, and negative publicity about us or our industry;
•availability of commercially reasonable insurance policies at reasonable rates;
•inability to achieve desired improvements and financial performance targets;
•adverse weather conditions, such as excess heat or cold, rain and storms;
•general financial and credit market conditions, including our ability to access credit or raise capital;
•macro-economic conditions (including supply chain issues and the impact of inflation on customer spending patterns);
•our ability to successfully implement our strategy;
•changes in public and consumer tastes;
•construction delays in capital improvements or ride downtime;
•competition with other theme parks, water parks and entertainment alternatives;
•dependence on a seasonal workforce;
•unionization activities and labor disputes;
•laws and regulations affecting labor and employee benefit costs, including increases in state and federally mandated minimum wages, healthcare reform and potential wage and hour claims;
•availability of labor;
•environmental laws and regulations;
•laws and regulations affecting corporate taxation;
•pending, threatened or future legal proceedings and the significant expenses associated with litigation;
| • | laws and regulations affecting labor and employee benefit costs, including increases in state and federally mandated minimum wages, healthcare reform and potential wage and hour claims; |
| • | environmental laws and regulations; |
| • | laws and regulations affecting corporate taxation; |
| • | pending, threatened or future legal proceedings and the significant expenses associated with litigation; |
| • | cyber security risks; and |
| • | other factors or uncertainties described in "Item 1A. Risk Factors" of this Annual Report. |
•
cyber security risks; and
•other factors or uncertainties described in "Item 1A. Risk Factors" of this Annual Report.
A more complete discussion of these factors and other risks applicable to our business is contained in "Item
1A. Risk Factors" of this Annual Report. All forward-looking statements in this report, or that are made on our behalf by our directors, officers or employees related to the information contained herein, apply only as of the date of this report or as of the date they were made. While we believe that the expectations reflected in such forward-looking statements are reasonable, we make no assurance that such expectations will be realized and actual results could vary materially. Factors or events that could cause our actual results to differ may emerge from time to time, and it is not possible for us to predict all of them. We undertake no obligation, except as required by applicable law, to publicly update any forward-looking statement, whether as a result of new information, future developments or otherwise. Additionally, the continued impact of COVID-19, virus variants and the rate of vaccinations could heighten many of the risk factors described herein.
As used in this Annual Report, unless the context requires otherwise, the terms "we," "our," "Six Flags," "the Company" and "SFEC" refer collectively to Six Flags Entertainment Corporation and its consolidated subsidiaries, and "Holdings" refers only to Six Flags Entertainment Corporation, without regard to its consolidated subsidiaries.
Looney Tunes characters, names and all related indicia are trademarks of Warner Bros., a division of WarnerMedia owned by AT&T Inc. Batman, Superman and Wonder Woman and all related characters, names and indicia are copyrights and trademarks of DC Comics. Six Flags and all related indicia are registered trademarks of Six Flags Theme Parks Inc.
We own and operate regional theme parks and water parks. We are the largest regional theme park operator in the world and the largest operator of water parks in North America based on the number of parks we operate.operate. Of our 27 regional theme parks and water parks, 24 are located in the United States, two are located in Mexico and one is located in Montreal, Canada. Our U.S. parks serve each of the top 10 designated market areas, as determined by a survey of television households within designated market areas published by A.C. Nielsen Media Research in Fall 2022.2023. Our diversified portfolio of North American parks serves an aggregate population of approximately 145 million people and 250 million people within a radius of 50 miles and 100 miles, respectively, with some of the highest per capita gross domestic product in the U.S. We generate revenue primarily from selling admission to our parks and from the sale of food, beverages, merchandise and other products and services within our parks.
Our parks occupy approximately 5,850 acres of land, and we own approximately 700 additional acres of land with development potential. Our parks are located in geographically diverse markets across North America. Our parks generally offer a broad selection of state-of-the-art and traditional thrill rides, water attractions, themed areas, concerts and shows, restaurants, game venues and retail outlets, and thereby provide a complete family-oriented entertainment experience. In the aggregate, during 2022,2023, our parks contained approximately 940880 rides, including over 140150 roller coasters, making us the leading provider of "thrill rides" in the industry. Developing new parks is resource intensive, given a limited supply of real estate appropriate for theme park development, substantial initial capital investment requirements, long development lead-time, and zoning restrictions. Based on our knowledge of the development of our own and other regional theme parks, we estimate it would take a minimum of four years to plan and construct a new regional theme park comparable to one of our major Six Flags-branded parks.
We own the internationally recognized "Six Flags" brand name in the U.S. and other countries throughout the world. To capitalize on this name recognition, 23 of our parks are branded as "Six Flags" or "Hurricane Harbor" parks, and we are working with a third party that is developing a Six Flags-branded theme park in Saudi
Arabia.Arabia, Six Flags Qiddiya. We license the right to use certain Warner Bros. and DC Comics characters at our theme parks, which provide an enhanced family entertainment experience and theming.
Merger Agreement with Cedar Fair
On November 2, 2023, Holdings, Cedar Fair, CopperSteel and Copper Merger Sub entered into the Merger Agreement, providing for a merger of equals through (i) the merger of Copper Merger Sub with and into Cedar Fair (the “Cedar Fair First Merger”), with Cedar Fair continuing its existence as the surviving entity (the “Cedar Fair Surviving Entity”) following the Cedar Fair First Merger as a direct subsidiary of CopperSteel, (ii) the subsequent merger of the Cedar Fair Surviving Entity with and into CopperSteel (the “Cedar Fair Second Merger” and together with the Cedar Fair First Merger, the “Cedar Fair Mergers”), with CopperSteel continuing as the surviving corporation, and (iii) the subsequent merger of Six Flags with and into CopperSteel, with CopperSteel continuing as the surviving corporation (the “Six Flags Merger” and together with the Cedar Fair Mergers, the “Mergers”).If the Mergers are completed, subject to certain exceptions, (i) each issued and outstanding unit of limited partnership interest in Cedar Fair (each a “Cedar Fair Unit” and collectively, the “Cedar Fair Units”) will be converted into the right to receive one (1) share of common stock, par value $0.01 per share, of CopperSteel (the “CopperSteel Common Stock”), as may be adjusted pursuant to the Merger Agreement (the “Cedar Fair Exchange Ratio”), together with cash in lieu of fractional shares of CopperSteel Common Stock, without interest and (ii)each issued and outstanding share of Holdings common stock, par value $0.025 per share (the “Six Flags Common Stock”) will be converted into the right to receive 0.58 shares of CopperSteel Common Stock (as the same may be adjusted pursuant to the Merger Agreement, the “Six Flags Exchange Ratio”), together with cash in lieu of fractional shares of CopperSteel Common Stock, without interest. Following the completion of the Mergers, it is anticipated that holders of Holdings Common Stock and holders of Cedar Fair Units immediately prior to the Mergers will own approximately 48.8% and 51.2% of CopperSteel Common Stock, respectively, on a fully-diluted basis. In addition, subject to the terms of the Merger Agreement and applicable law, Six Flags will declare and set a record date for a special dividend to holder of record of Six Flags Common Stock as of the close of business one business day prior to the closing of the Mergers of (i) $1.00 plus (ii) the product (rounded to the nearest whole cent) of (a) the Six Flags Exchange Ratio and (ii) the aggregate amount of distributions per unit declared or paid by Cedar Fair with respect to a Cedar Fair Unit with a record date following November 2, 2023 and
prior to the effective time of the Six Flags Merger, subject to certain adjustments provided under the Merger Agreement, the payment of which is contingent upon the consummation of the Mergers.
Upon consummation of the Mergers, Holdings and Cedar Fair will each have been merged with and into CopperSteel, with CopperSteel as the parent entity and successor corporation to Holdings and Cedar Fair. Upon closing, CopperSteel will be headquartered in Charlotte, North Carolina, and is expected to change its name to “Six Flags Entertainment Corporation” and be listed on the New York Stock Exchange (“NYSE”) under the ticker symbol “FUN.”
The obligations of Holdings and Cedar Fair to complete the Mergers are subject to the satisfaction or waiver, in whole or in part (to the extent permitted by applicable law) of a number of conditions set forth in the Merger Agreement. Completion of the Mergers requires, among other things, the adoption of the Merger Agreement by the Holdings stockholders.In connection with the Mergers, CopperSteel filed a registration statement on Form S-4 (the “Registration Statement) with the Securities and Exchange Commission (“Commission”), which includes a proxy statement with respect to the stockholder meeting of Holdings (the “Special Meeting”) to consider and adopt the Merger Agreement and a prospectus with respect to the CopperSteel Common Stock to be issued in connection with the Mergers.The Registration Statement was declared effective by the Commission on January 31, 2024 and the proxy statement/prospectus will be mailed to stockholders of Holdings as of January 24, 2024, the record date established for voting on the Mergers at the Special Meeting to be held on March 12, 2024.Stockholders of Holdings are encouraged to read the proxy statement/prospectus, as well as the annexes thereto, and other documents to be filed with the Commission because the documents contain important information about Holdings, Cedar Fair and the Mergers.
The obligations of Holdings and Cedar Fair to complete the Mergers are also subject to the satisfaction or waiver, in whole or in part (to the extent permitted by applicable law) of a number of conditions set forth in the Merger Agreement, including the receipt of regulatory approvals. Closing of the Mergers is subject to antitrust review in the United States. Under the Hart-Scott-Rodino Antitrust Improvements Act of 1976, as amended (“HSR Act”), and the rules promulgated thereunder, the Mergers cannot be completed until the parties to the Merger Agreement have given notification and furnished information to the Federal Trade Commission (the “FTC”) and the United States Department of Justice (the “DOJ”), and until the applicable waiting period has expired or has been terminated.
On November 17, 2023 and November 20, 2023, the Premerger Notification Office of the Federal Trade Commission accepted the premerger notification and report forms under the HSR Act submitted by Holdings and Cedar Fair, respectively. On December 20, 2023, Holdings and Cedar Fair withdrew their respective premerger notification and report forms under the HSR Act, and refiled them on December 21, 2023. On January 22, 2024, Holdings and Cedar Fair each received a request for additional information and documentary materials (a “Second Request”) from the DOJ in connection with the DOJ’s review of the Mergers. The effect of a Second Request is to extend the waiting period imposed by the HSR Act, until 30 days after each of Holdings and Cedar Fair has substantially complied with the Second Request issued to it, unless that period is extended voluntarily by the parties or terminated earlier by the DOJ. Per the terms of the Merger Agreement, Cedar Fair and Holdings will use their reasonable best efforts to certify substantial compliance with the Second Request on or before May 2, 2024.
Holdings and Cedar Fair expect to complete the Mergers in the first half of 2024. However, neither Holdings nor Cedar Fair can predict the actual date on which the Mergers will be completed, nor can the parties ensure that the Mergers will be completed because completion is subject to conditions beyond the control of either party, including the receipt of Holdings’ stockholder approval and required regulatory approvals.
Revision of Previously Issued Financial Statements
During the third quarter of 2023, we identified an accounting error for our stock-based compensation expense related to the recognition of expense for dividend equivalent rights ("DERs"). The error primarily relates to the inadvertent reversal of stock-based compensation expense for vested DERs for periods beginning in the first quarter of 2020 through the fourth quarter of 2022.
We have assessed the error and concluded that it was not material to any prior periods. However, the aggregate amount of the error would have been material to our consolidated financial statements in the current period. Therefore, we have revised our previously issued financial information. Prior periods not presented herein will be revised, as applicable, in future filings. Refer to Note 18 - Revision to Previously Reported Financial Information for additional information. Impact of the COVID-19 Pandemic
The COVID-19 pandemic had material effects on our business during the
yearsyear ended January 2, 2022
and December 31, 2020, through the temporary suspension of operations at
certain of our parks. During the year ended January 2, 2022, our parks in California and Mexico had fewer operating days than planned due to COVID-19 related closures.
All of our parks were closed for at least a portion of 2020. COVID-19 and its variants continue to present material uncertainty and risk with respect to our performance and financial results, including our ability to keep all of our parks open to our guests. We will continue to consider near-term exigencies and the long-term financial health of the business as we take steps to mitigate the consequences of the COVID-19 pandemic on our business. The extent to which the COVID-19 pandemic adversely impacts our business will depend on future developments, which are highly uncertain and cannot be predicted, including any additional actions we have taken, or will take, to minimize the spread of COVID-19 and its variants or manage its impact.
Fiscal Calendar Change
Holdings’
Our Board of Directors
of determined that it is in our best interest to change the method of determining our fiscal quarters and fiscal years, such that each fiscal quarter will consist of thirteen weeks ending on a Sunday and each fiscal year will consist of 52 or 53 weeks, as applicable, and will end on the Sunday closest to December 31, effective as of the commencement of our fiscal year on January 1, 2021. This change was made to align our fiscal reporting calendar with how we operate our business and improve comparability across periods. This Annual Report covers
our 2023, 2022 and 2021 fiscal years. Our 2023 fiscal year covers the period
from January 2, 2023 through December 31, 2023 (“the year ended December 31, 2023” or “2023”). Our 2022 fiscal year covers the period from January 3, 2022 through January 1, 2023
(“the(the year ended January 1,
2023”2023 or
“2022”"2022").
The comparisonOur 2021 fiscal year covers the period
in the prior year coversfrom January 1, 2021 through January 2, 2022 (“the year ended January 2, 2022” or “2021”). The year ended January 2, 2022 contained three extra days due to the calendar change from calendar year reporting.
The year ended December 31, 2020, covers the period between January 1, 2020, through December 31, 2020 (“the year ended December 31, 2020” or “2020”).Strategic Plan
In December 2021, we made changes to our organizational structure, including to our leadership team, by reducing layers
Description of Parks and Segment Information
Our parks provide similar products and services through a similar process to the same class of customer through a consistent method. We also believe our parks share common economic characteristics. Based on these factors, we have only one reportable segment—theme parks. The following chart summarizes key business and geographical information about our parks.
| | | | | | | | | | | | | | | | | | | | |
| Name of Park and Location | | Description | | Description
|
Designated
Market Operating Area and
Rank* | | Population Within
Radius from
Park Location | | External Park Competition / Location /
Approximate Distance
|
Frontier City
Six Flags Hurricane Harbor Oklahoma City
Oklahoma City, OK | | | 109 acres—
theme park
23 acres—
water park | | | Oklahoma City (48) | | | 1.6 million—50 miles
3.0 million—100 miles |
| Andy Alligator’s Water Park /
Norman, OK / 20 miles
|
La Ronde
Montreal, Canada | | | 146 acres—theme
park | | N/A | | N/A
| 4.3 million—50 miles
6.3 million—100 miles |
| Quebec City Water Park /
Quebec City, Quebec, Canada / 130 miles
Canada’s Wonderland /
Vaughan, Ontario, Canada / 370 miles
|
Six Flags Hurricane Harbor Rockford
Rockford, IL | | | 43 acres—water park | | | Chicago (3)
Milwaukee (43)
| | | 2.7 million—50 miles
13.7 million—100 miles |
| Several water parks /
Wisconsin Dells Area / 120 miles
|
Six Flags America
Largo, MD | | | 523 acres—combination theme park and water park and approximately 300 acres of potentially developable land | | | Washington, D.C. (8)
Baltimore (23) | | | 8.5 million—50 miles
14.0 million—100 miles |
| Kings Dominion /
Doswell, VA (near Richmond) / 120 miles
Hershey Park /
Hershey, PA / 130 miles
Busch Gardens /
Williamsburg, VA / 180 miles
|
Six Flags Darien Lake
Corfu, NY | | | 988 acres— combination theme park and water park, hotel and campground | | | Buffalo (59) | | | 2.6 million—50 miles
10.9 million—100 miles |
| Marineland /
Niagara Falls, Ontario, Canada / 50 miles
Fantasy Island /
Grand Island, NY / 40 miles
|
Six Flags Discovery
Kingdom
Vallejo, CA
Six Flags Hurricane
Harbor Concord
Concord, CA
| | | 151 acres— separately gated theme park with marine and land animal exhibits, and water park on 127 acres and 24 acres, respectively | | | San Francisco / Oakland (4)
Sacramento (28) | | | 6.4 million—50 miles
12.0 million—100 miles |
| Aquarium of the Bay at Pier 39 /
San Francisco, CA / 30 miles
Academy of Science Center /
San Francisco, CA / 30 miles
California Great America /
Santa Clara, CA / 60 miles
Gilroy Gardens /
Gilroy, CA / 100 miles
Outer Bay at Monterey Bay Aquarium /
Monterey, CA / 130 miles
|
Six Flags Fiesta Texas
San Antonio, TX | | | 218 acres—combination theme park and water park | | | Houston (6)
San Antonio (25)
Austin (29) | | | 2.8 million—50 miles
5.1 million—100 miles |
| Sea World of Texas /
San Antonio, TX / 20 miles
Schlitterbahn /
New Braunfels, TX / 30 miles
Cotaland /
Austin, TX / 80 miles
|
Six Flags Great Adventure &
Safari /
Six Flags Hurricane Harbor
Jackson, NJ | | | 2,116 acres—separately gated theme park/safari and water park and approximately 367 acres of potentially developable land | | | New York City (1)
Philadelphia (9) | | | 14.5 million—50 miles
29.6 million—100 miles |
| Hershey Park /
Hershey, PA / 150 miles
Dorney Park /
Allentown, PA / 80 miles
Morey’s Piers Wildwood /
Wildwood, NJ / 100 miles
Coney Island /
Brooklyn, NY / 80 miles
American Dream Park
East Rutherford, NJ / 70 miles
|
Six Flags Great America /
Six Flags Hurricane Harbor Chicago
| | | 297 acres—combination theme park and water park and approximately 30 acres of potentially developable land | | | Chicago (3)
Milwaukee (43) | | | 9.0 million—50 miles
13.9 million—100 miles |
| Kings Island /
Cincinnati, OH / 350 miles
Cedar Point /
Sandusky, OH / 340 miles
Several water parks /
Wisconsin Dells Area / 170 miles
|
Six Flags Hurricane Harbor
Oaxtepec, Mexico | | | 67 acres—water park | | N/A | | N/A
| 22.6 million—50 miles
32.6 million—100 miles |
| El Rollo /
Tlaquiltenango, Mexico / 20 miles
Parque Acuatico Ojo de Agua /
Temixco, Mexico / 20 miles
Ixtapan Aquatic Park /
Ixtapan de la Sal, Mexico / 50 miles
|
Six Flags Hurricane Harbor Phoenix
Glendale, AZ | | | 33 acres—water park | | | Phoenix (13) | | | 4.9 million—50 miles
5.2 million—100 miles |
| Big Surf /
Tempe, AZ / 30 miles
Golfland Sunsplash /
Mesa, AZ / 40 miles
Castles & Coasters /
Phoenix, AZ / 10 miles
|
Name of Park and Location
| | Description
| | Designated
Market Area
and Rank*
| | Population Within
Radius from
Park Location
| | External Park Competition / Location /
Approximate Distance
|
Six Flags Hurricane Harbor
Splashtown
Spring, TX | | | 46 acres—water park | | | Houston (6) | | | 7.1 million—50 miles
8.1 million—100 miles |
| Big Rivers Water Park /
New Caney, TX / 20 miles
Typhoon Texas Water Park /
Katy, TX / 40 miles
Schlitterbahn Galveston /
Galveston, TX / 70 miles
|
Six Flags Magic Mountain /
Six Flags Hurricane Harbor
Valencia, CA | | | 255 acres—separately gated theme park and water park on 243 acres and 12 acres, respectively | | | Los Angeles (2) | | | 10.2 million—50 miles
18.6 million—100 miles |
| Disneyland Resort /
Anaheim, CA / 60 miles
Universal Studios Hollywood /
Universal City, CA / 20 miles
Knott’s Berry Farm / Soak City USA
Buena Park, CA / 50 miles
Sea World of California /
San Diego, CA / 150 miles
Legoland /
Carlsbad, CA / 130 miles
Raging Waters /
San Dimas, CA / 50 miles
|
Six Flags Mexico
Mexico City, Mexico | | | 110 acres—theme park | | N/A | | N/A
| 24.5 million—50 miles
33.2 million—100 miles |
| Mexico City Zoo /
Mexico City, Mexico / 10 miles
La Feria /
Mexico City, Mexico / 10 miles
|
Six Flags New England
Agawam, MA | | | 289 acres—combination theme park and water park | | | Boston (10)
Hartford / New Haven (54)
Providence (44)
Springfield (103) | | | 3.2 million—50 miles
16.8 million—100 miles |
| Lake Compounce /
Bristol, CT / 50 miles
Canobie Lake Park /
Salem, NH / 140 miles
|
Six Flags Over Georgia
Austell, GA
Six Flags White Water
Atlanta
Marietta, GA | | | 360 acres—separately gated theme park and water park on 291 acres and water park on 69 acres, respectively | | | Atlanta (7) | | | 6.2 million—50 miles
8.8 million—100 miles |
| Georgia Aquarium /
Atlanta, GA / 20 miles
Fun Spot Atlanta /
Fayetteville, Georgia / 30 miles
Carowinds /
Charlotte, NC / 250 miles
Alabama Splash Adventures /
Birmingham, AL / 160 miles
Dollywood and Splash Country /
Pigeon Forge, TN / 200 miles
Wild Adventures /
Valdosta, GA / 240 miles
|
Six Flags Over Texas /
Six Flags Hurricane Harbor
Arlington, TX | | | 264 acres—separately gated theme park and water park on 217 and 47 acres, respectively | | | Dallas/Fort Worth (5) | | | 7.4 million—50 miles
8.8 million—100 miles |
| Sea World of Texas /
San Antonio, TX / 280 miles
NRH2O Water Park /
North Richland Hills, TX / 10 miles
Epic Waters /
Grand Prairie, TX / 5 miles
Hawaiian Falls Water parks /
Multiple Locations / 15 - 35 miles
|
Six Flags St. Louis
Eureka, MO | | | 316 acres—combination theme park and water park and approximately 17 acres of potentially developable land | | | St. Louis (24) | | | 2.8 million—50 miles
4.1 million—100 miles |
| Worlds of Fun /
Kansas City, MO / 250 miles
Silver Dollar City /
Branson, MO / 250 miles
Holiday World /
Santa Claus, IN / 150 miles
|
The Great Escape and Hurricane Harbor /
Six Flags Great Escape
Lodge & Indoor Water Park
Queensbury, NY | | | 372 acres—combination theme park and water park, plus 200 room hotel and 38,000 square foot indoor water park | | | Albany (67) | | | 1.1 million—50 miles
3.0 million—100 miles |
| Huck Finn’s Playland /
Albany, New York / 60 miles
Several hotels/indoor water parks /
Poconos and New England Areas / 200 miles
|
*
| Based on a 2022survey of radio market population within designated market areas published by A.C. Nielsen Media Research.
|
________________________________
Partnership Park Arrangements
In 1998, we acquired the former Six Flags Entertainment Corporation ("Former SFEC", a corporation that has been merged out of existence and that had always been a separate corporation from Holdings), which had operated regional theme parks and water parks
under the Six Flags name for nearly forty years. In connection with this acquisition, we guaranteed certain obligations relating to Six Flags Over Texas ("SFOT") and Six Flags Over Georgia, including Six Flags White Water Atlanta ("SFOG", and together with SFOT, the "Partnership Parks"). These obligations continue until 2027, in the case of SFOG, and 2028, in the case of SFOT. Such obligations include (i) minimum annual distributions (including rent) of approximately $85.6$88.5 million in 20232024 (subject to cost of living adjustments in subsequent years) to the limited partners of the partnership entities (the "Georgia Partnership" with respect to SFOG and the "Texas Partnership" with respect to SFOT) that owns the Partnership Parks (based on our ownership of units as of January 1,December 31, 2023, our share of such distribution will be approximately $38.1$39.4 million) and (ii) minimum capital expenditures at each park during rolling five-year periods based generally on 6% of Partnership Park revenues.Given recent increases Due to the increase in consumer price index, for 2023,2024, we will pay approximately $5$3 million more in minimum distributions to the limited partners than in 2022. 2023. In addition, designated subsidiaries are required to repurchase up to all of the limited partnership units in the Georgia Partnership and the Texas Partnership (the “Partnership Park Put”) held by third-party limited partners on an annual basis.We are required to repurchase such limited partnership units through May 15, 2026 in the case of the Georgia Partnership and May 15, 2027 in the cash of the Texas Partnership Cash flow from operations at the Partnership Parks is used to satisfy these requirements before any funds are required from us. We also guaranteed the obligation of our subsidiaries to annually purchase all outstanding limited partnership units to the extent tendered by the unit holders (the "Partnership(pursuant to the Partnership Park Put")Put). After payment of the minimum distribution, we are entitled to a management fee equal to 3% of prior year gross revenues and, thereafter, any additional cash will be distributed first to management fee in arrears, then repayment of any interest and principal on intercompany loans, with any additional cash being distributed 95% to us, in the case of SFOG, and 92.5% to us, in the case of SFOT.
The agreed price for units tendered in the Partnership Park Put is based on a valuation of each of the respective Partnership Parks (the "Specified"Partnership Put Price") that is the greater of (i) a valuation for each of the respective Partnership Parks derived by multiplying such park’s weighted average four year EBITDA (as defined in the agreements that govern the partnerships) by a specified multiple (8.0 in the case of SFOG and 8.5 in the case of SFOT) and (ii) a valuation derived from the highest prices previously paid for the units of the Partnership Parks by certain entities. In light of the temporary suspension of operations of the Partnership Parks due to the COVID-19 pandemic in March 2020, which would cause the value of the limited partnership units of the Partnership Parks to decrease in 2021 and thereafter, we adjusted our annual offer to purchase these units. Accordingly, to preserve liquidity in 2020 and avoid uncertainty with future purchase prices for the units, we adjusted the 2020 offer price to set a minimum price floor for all future purchases. Pursuant to the valuation methodologies described in the preceding sentence, the SpecifiedPartnership Put Price for the Partnership Parks, if determined as of January 1,December 31, 2023, is $409.7 million in the case of SFOG, and $527.4 millionin the case of SFOT. As of January 1,December 31, 2023, we owned approximately 31.5% and 54.1% of the Georgia limited partner interests and Texas limited partner interests, respectively. The remaining redeemable units of approximately 68.5% and 45.9% of the Georgia limited partner and Texas limited partner, respectively, represent a current redemption value for the limited partnership units of approximately $521.4$521.0 million.
In January 2027 with respect to the Georgia Partnership and in January 2028 with respect to the Texas Partnership, we will have the option (each the “End-of-Term Option”) to require the redemption of all the limited partnership units we do not then own in the Partnerships. To exercise the End-of-Term Option, we must give the Georgia Partnership notice of its exercise no later than December 31, 2024 and we must give the Texas Partnership notice of its exercise no later than December 31, 2025. If the End-of-Term Option is not exercised, the parties may decide to renew and extend the arrangements relating to the Partnership Parks. Alternatively, if the End-of-Term Option is not exercised, the Partnership Park entities may be sold and the proceeds applied to redeem the outstanding interests in the Georgia Partnership and Texas Partnership, as applicable. If the End-of-Term Option is exercised, the price offered, and required to be accepted by the holders' of the limited units we do not then own would, is based on the agreed-upon value of the partnerships included in the original agreements, multiplied by the change in the Consumer Price Index ("CPI") between the beginning and end of the agreement. The agreements for Georgia Partnership and the Texas Partnership began in 1997 and 1998, respectively. The agreed-upon value for the partnerships, when the agreements were executed, was $250.0 million and $374.8 million for SFOG and SFOT, respectively. As of December 31, 2023, the agreed upon value, as adjusted for CPI, would be $483.5 million and $712.7 million for SFOG and SFOT, respectively. The agreed upon values, if determined as of December 31, 2023, multiplied by the 68.5% and 45.9% of units held by the limited partner for SFOG and SFOT, respectively, represent $330.9 million and $332.6 million that would be required to be paid to the limited partner of SFOG and SFOT, respectively, if the End-of-Term Option were to be exercised. The actual agreed upon value for the End-of-Term Option will be further adjusted by CPI until the end of the each respective agreement. The decision to exercise, or not exercise, the End-of-Term Option for either of SFOT or SFOG will ultimately be made based on numerous factors, including prevailing macro-economic and industry conditions and the cost and availability of financing to fund the purchase.
Pursuant to the 2023 and 2022 annual offer,offers, we did not purchase units from the Georgia partnership. We purchased 0.149 units from the Texas partnership for approximately $0.3 million in May 2023. We purchased 0.25358 units from the Texas partnership for approximately $0.6 million in May 2022. The $350$400 million accordion feature on the Second Amended and Restated Term Loan B (as defined in Note 8 -Long-Term IndebtednessIndebtedness, to the consolidated financial statements in Item 8 of this Annual Report) is available for borrowing for future "put" obligations if necessary.
In connection with our acquisition of the Former SFEC, we entered into thea Subordinated Indemnity Agreement with certain of the Company’s entities, Time Warner, and an affiliate of Time Warner (an indirect subsidiary of AT&T Inc. as a result of a merger in 2018), pursuant to which, among other things, we transferred to Time Warner (which has guaranteed all of our obligations under the Partnership Park arrangements) record title to the corporations that own the entities that purchase limited partnership units of the Partnership Parks, and we received an assignment from Time Warner of all cash flow received on such limited partnership units, and we otherwise control such entities. In addition, we issued preferred stock of the managing partner of the partnerships to Time Warner. In the event of a default by us under the Subordinated Indemnity Agreement or of our obligations to our partners in the Partnership Parks, these arrangements would permit Time Warner to take full control of both the entities that own limited partnership units and the managing partner. If we satisfy all such obligations, Time Warner is required to transfer to us the entire equity interests of these entities at the end of the term, which is 2027 for SFOGthe Georgia Partnership and 2028 for SFOT.the Texas Partnership. The 2022 sale of Time
Warner to Discovery did not affect the Time Warner guarantee of our obligations under the Subordinated Indemnity Agreement.
We incurred $20.6$26.0 million of capital expenditures at these parks during the 20222023 season, and intend to incur at least the minimum required expenditure in 2023.2024. Cash flows from operations at the Partnership Parks will be used to satisfy the annual distribution and capital expenditure requirements before any funds are required from us. The two partnershipsPartnership Parks generated approximately $73.0 million$16.3 million of cash in 2022 in2023, calculated as cash flows from operating activities after deduction ofless capital expenditures, and excluding the impact of short-term intercompany advances from or payments, to Holdings, as the case may be. As of January 1, 2023, and January 2, 2022, we had totalThe loans receivable outstanding of $288.3 million from the partnerships that own the Partnership Parks.are eliminated in our consolidated balance sheet. The proceeds from these loans were primarily used to fund the acquisition of Six Flags White Water Atlanta and to make capital improvements and distributions to the limited partners. We attract visitors through multichannel marketing and promotional programs for each of our parks. The programs are designed to attract guests and enhance the Six Flags brand name. They are tailored to address the different characteristics of our various markets and to maximize the impact of specific park attractions and product introductions. Marketing and promotional programs are updated or replaced each year to address new developments.
We also seek to develop long-term corporate sponsorship and co-marketing relationships with well-known regional and national brands that align with our values and strategy. This allows us to develop strategic alliances with mutually beneficial advertising programs.
During the year ended January 1,December 31, 2023, we hadsold two primary admission pass products.products: (1) our traditional season passes and (2) our newly launched Six Flags Plus product, which is a subscription-style program that was launched in June 2023. Our traditional season pass products offers unlimited visits to a specified park, or all of our parks depending on the tier purchased, whenever it is open and is valid for one operating season or such other date stated in the pass product. Our Six Flags Plus pass offers our guests the ability to visit all of our parks and the ability to pay a fixed monthly fee. Six Flags Plus automatically renews monthly after the one-year commitment period. Our legacy membership program offers unlimited visits to most of our parks and automatically renews monthly after a one-year commitment period. The program was discontinued during 2022, however, existing members can continue to renewmake monthly payments until cancellation or default.
Season pass and
membershipSix Flags Plus sales represent advance purchase commitments that reduce exposure to inclement weather and economic downturns. In general, a season pass holder or member contributes higher aggregate revenue and profitability to the Company over the course of a year compared to a single-day guest. A season pass holder or member pays a higher
tickettotal admission price and contributes to in-park guest spending over multiple visits. Additionally, guests enrolled in
ourSix Flags Plus and legacy membership
program andprograms as well as season pass holders often bring paying guests and generate "word-of-mouth" advertising for the parks.
Single-dayHowever, our single-day guests tend to spend more per visit. We will continue to strive for a balanced mix of guests to maximize revenue. Season pass,
Six Flags Plus and
legacy membership attendance constituted approximately
54%59% and
63%54% of total attendance at our parks in
20222023 and
2021,2022, respectively. We plan to offer
primarilytraditional season passes,
our Six Flags Plus product and
single daysingle-day tickets during
2023,2024, while continuing to honor our legacy membership program.
We offer products to enhance the guest experience including all-season dining passes and all-season flash passes.
Our Group Sales team organizes events and outings for various groups at our parks, including customized catering, coordination of tickets and event planning.
We use limited promotional programs as a means of targeting specific market segments and locations not generally reached through group or retail sales efforts. The promotional programs utilize coupons, sweepstakes, reward incentives and rebates to attract additional visitors. These programs are implemented through online promotions, digital and social marketing activities, search engine
marketing, radio and television advertising, direct mail, and sponsorship marketing. The special promotional offers are usually available for a limited time and provide some additional incentiveincentive(s) to purchase a ticket.
LicensesLicenses
We hold exclusive long-term licenses of the Warner Bros. and DC Comics animated characters at our theme parks throughout the U.S. (except for the Las Vegas metropolitan area), Canada, Mexico and certain other countries. In particular, our license agreements entitle us to use, subject to customary approval rights of Warner Bros. and, in limited circumstances, approval rights of certain third parties, all animated, cartoon and comic book characters that Warner Bros. and DC Comics have the right to license, including Batman, The Joker, Superman, Wonder Woman, The Flash, Green Lantern, Harley Quinn,Aquaman, Bugs Bunny, Daffy Duck, Tweety Bird and Yosemite Sam. The licenses include the right to sell merchandise using the characters and to use the characters in our advertising, as walk-around characters and in theming for rides, attractions and retail outlets. In addition to annual license fees, we are required to pay a royalty fee on any merchandise manufactured by or for us and sold that use the licensed characters. Warner Bros. has the right to terminate the license agreements under certain circumstances, including if any persons involved in the movie or television industries obtain control of us or, in the case of Warner Bros., upon a default under the Subordinated Indemnity Agreement.
We currently operate in geographically diverse markets in North America. Each park is
generally managed by a park president or general manager who is responsible for all operations and management of the individual park. Each park president or general manager directs a full-time, on-site management team. Local advertising, ticket sales, community relations and hiring and training of personnel are the responsibility of individual park management in coordination with corporate support teams.
Each park has senior personnel responsible for operations and
maintenance;maintenance, in-park food, beverage, merchandising and
games;games, marketing and
sales;sales, public safety and risk
management;management, human resources and finance. Park management compensation structures are designed to provide financial incentives for individual park managers to execute our strategy and to maximize revenue and
free cash flow.earnings.
Our parks are generally open daily from Memorial Day through Labor Day. In addition, most of our parks are open weekends prior to and following their daily seasons, often in conjunction with themed events such as Fright Fest® and Holiday in the Park®. Due to their location, certain parks have longer operating seasons. Six Flags Magic Mountain operates on most days year-round, and our parks in Mexico, Six Flags Fiesta Texas and Six Flags Over Texas operate weekends year-round outside of their traditional operating season. Typically, the parks charge a basic daily admission price that allows unlimited use of all rides and attractions, although in certain cases special rides and attractions require the payment of an additional fee. See Note 17 -Business Segments, to the consolidated financial statements in Item 8 of this Annual Report for information concerning revenues and long-lived assets by domestic and international categories.jurisdictions.
Capital Improvements and Other Initiatives
We regularly make capital investments for new rides and attractions in our parks. We purchase both new and used rides and
attractions. Onattractions and, on occasion, we
also relocate rides among
parks to provide fresh attractions. In addition, each year weparks. We also make capital investments in the food, retail, games and other in-park areas
to increase guest spending per capita. We also make annualas well as enhancements to theming and landscaping of our parks
in orderand as guest-facing technology as we seek to
provide a more complete family-oriented entertainmentcontinually enhance the overall experience
andof our guests. We also invest in
ourcertain back-office information technology infrastructure to attain operational efficiencies. We regularly perform maintenance capital enhancements, with most expenditures made during the off-season.
RepairsRepair and maintenance costs for
materialsroutine and
services associated with maintaining assets, such as painting and inspecting existing rides,recurring maintenance activities are expensed as
incurred and are not included in capital expenditures.incurred.
Our capital plan will continue to selectively add new coastersrides and attractions over time to our exceptional portfolio of thrill rides; however, ourexisting portfolio. Our near-term focus will be a balanced approach between exciting new rides and an increased focus on implementing guest-facing technology, food service equipment, amenities, and infrastructure improvements, eventsimprovements.
In January 2024, we announced the launch of the largest digital alliance in the theme park industry, partnering with Google, HCL Tech, Dell, Snowflake, Fueled, and festivals in our parks, as well as enhancingPure Imagination Studios. The digital alliance will offer cutting-edge technologies from best-in-class companies to benefit both guests and team members. The technological advancements spearheaded by this alliance aim to redefine the overallguest experience in our water parks.
across multiple touchpoints. Our initiatives focus on streamlining pre-visit planning through intelligent recommendation systems, elevating real-time engagement during the visit with personalized, AI-driven notifications and virtual assistant support, and enriching post-visit interactions via insightful analytics that tailor future recommendations and offers.
During 2023,2024, we plan to enhance our targeted marketing strategies to attract new-to-brand consumers and convert them to loyal guests, by (i) elevating our overall guest experience and focusing on our breadth of product in our theme parks and water parks; (ii) simplifying our admissions product offerings (iii) developing guest-focused in-park initiatives to drive guest spending growth; (iv)(iii) taking a balanced approach to single daysingle-day ticket and season pass sales; and (v)(iv) growing group sales and sponsorship revenue opportunities back to pre-pandemic levels or higher.
We are working with a third party that is developing
Six Flags Qiddiya, a
Six Flags-brandedtheme park in Saudi Arabia. As compensation for exclusivity, brand licensing rights, and design, development and management services, we receive fees during the design and development period as well as ongoing remuneration after the park opens to the public. The agreements do not require us to make any capital investments in the park.
We plan to focus on our core business over the next two to three years; during this time, we will be cautious about expanding into adjacent domestic markets or entering into new international agreements.Maintenance and Inspection
Rides are inspected at various levels and frequencies in accordance with manufacturer specifications. Our rides are inspected daily during the operating season by our maintenance personnel. These inspections include safety checks, as well as regular maintenance, and are made through both visual inspection and test operations of the rides. Our senior management and the individual park personnel evaluate the risk aspects of each park’s operations, potential risks to employees and staff as well as to the
public.guests. In addition, contingency response plans for potential emergency situations have been developed for each facility. During the off-season, maintenance personnel examine the rides and repair, refurbish and rebuild them
whenas necessary. This process includes x-raying and magnafluxing (a further examination for minute cracks and defects) steel portions of certain rides at high-stress points. A large portion of our full-time workforce devotes substantially all of its time to maintaining the parks and our rides and attractions. We use a computerized maintenance-management system across all of our domestic parks to assist us in executing our maintenance programs.
In addition to the performance of our internal maintenance and inspection procedures, we, or our insurance carriers, as the case may be, retain third party consultants to perform an annual inspection of each park and all attractions. The results of these inspections are reported in written evaluation and inspection reports and include suggestions on various aspects of park operations. In certain states, state inspectors conduct additional annual ride inspections before the beginning of each season. Other portions of each park are subject to inspections by local fire marshals and health and building department officials. Furthermore, we use
Ellis & Associates asthird-party, professional water safety consultants at all of our water parks to train lifeguards and audit safety procedures.
We maintain insurance of the types and in amounts we believe are commercially reasonable and are available to businesses in our industry. We maintain multi-layered general liability policies that provide for excess liability coverage of up to $100.0 million per occurrence. For incidents arising on or after December 31, 2008, our self-insured retention is $2.0 million, followed by a $0.5 million deductible per occurrence applicable to all claims in the policy year for our domestic parks and our park in Canada and a nominal amount per occurrence for our parks in Mexico. Defense costs are in addition to these retentions. Our general liability policies cover the cost of punitive damages only in certain jurisdictions. Based upon reported claims and an estimate for incurred, but not reported claims, we accrue a liability for our retention contingencies. For workers’ compensation claims arising after November 15, 2003, our deductible is $0.75 million. We also maintain fire and extended coverage, business interruption, terrorism and other forms of insurance typical to businesses in this industry. The all peril property coverage policies insure our real and personal properties (other than land) against physical damage resulting from a variety of hazards. Additionally, we maintain information security and privacy liabilitycybersecurity insurance in the amount of $10.0 million with a $0.25 million retention per event.
We generally renegotiate our insurance policies on an annual basis. The majority of our current insurance policies expire on December 31, 2023.2024. We cannot predict the level of the premiums that we may be required to pay for subsequent insurance coverage, the level of any retention applicable thereto, the level of aggregate coverage available or the availability of coverage for specific risks.
Our parks compete with other theme parks, water parks, amusement parks, as well as with other types of recreational facilities and forms of out-of-home entertainment within their marketoperating areas, including family entertainment centers, indoor adventure parks, movies, sporting events, restaurants and vacation travel. Competitors of our parks include SeaWorld Entertainment, Inc.; Cedar Fair, L.P.; NBCUniversal/Universal Parks & Resorts; Disney Parks; Herschend Family Entertainment Corporation; Hershey Entertainment & Resorts Company; Merlin Entertainment Ltd.; Palace Entertainment; Premier Parks, LLC; Boomers Parks and a number of other regional and local competitors in the geographies in which we operate. In addition, our business is subject to various factors affecting the recreation and leisure industries generally, such as general economic conditions and changes in discretionary consumer spending
habits. See "ItemItem 1A. Risk Factors"Factors of this Annual Report. Within each park’s regional marketoperating area, the principal factors affecting direct theme park competition include location, price, the uniqueness and perceived safety and quality of the rides and attractions in the park, the atmosphere and cleanliness of the park, the quality of park food and entertainment, and ease of travel to the park.park. Our theme parks have several advantages over other forms of entertainment. We believe that our parks offer a sufficient quality and variety of rides and attractions, culinary offerings, retail locations, and interactive and family experiences to make them highly competitive with other parks and forms of entertainment. They are outdoor venues spread over hundreds of acres, making them naturally conducive to social distancing. They are open many hours throughout the day, reducing the need for guests to arrive or leave at the same time. Finally, the vast majority of our guests live within a day’s drive,driving distance, so a visit to one of our parks does not require air travel or a stay at a hotel.
Our operations are highly seasonal, with approximately 70% of park attendance and revenues in a typical year occurring in the second and third calendar quarters of each year, with the most significant period falling between Memorial Day and Labor Day.
Environmental and Other Regulations
Our operations are subject to federal, state and local environmental laws and regulations including laws and regulations governing water and sewer discharges, air emissions, soil and groundwater contamination, the maintenance of underground and
abovegroundabove ground storage tanks and the disposal of waste and hazardous materials. In addition, our operations are subject to other local, state and federal governmental regulations including, without limitation, labor, health, safety, zoning and land use and minimum wage regulations applicable to theme park and water park operations, and local and state regulations applicable to restaurant operations at each park. Finally, certain of our facilities are subject to laws and regulations relating to the care of animals. We believe that we are in compliance with applicable environmental and other laws and regulations and, although no assurance can be given, we do not foresee the need for any significant expenditures in this area in the near future.
Portions of the undeveloped areas at certain of our parks are classified as wetlands. Accordingly, we may need to obtain governmental permits and other approvals prior to conducting development activities that affect these areas and future development may be prohibited in some or all of these areas. Additionally, the presence of wetlands in portions of our undeveloped land could adversely affect our ability to dispose of such land and/or the price we receive in any such disposition.
Environmental, Social and Governance
We are committed to advancing a purpose-led vision and fostering a culture that encourages our employees to enhance our business and the communities in which we operate. We endeavor to integrate environmental, social, and governance (ESG) practices that create sustainable economic value to our employees, stockholders, communities, and other stakeholders. Our dedicated environmental and community stewardship is an integral component of our delivering excellence, driving strategic innovation, and growing long-term stockholder value. We believe that our impact on the environment, how we manage our relationships with employees, suppliers, customers and the communities where we operate, and the accountability of our leadership to our stockholders are all critically important to our business. We have undertaken a number of initiatives to further these goals, including establishment of a diversity and inclusion council
and the implementation of a human rights
policy and continued collaboration with local communities to support COVID-19 testing and vaccination programs.policy.
With respect to environmental initiatives, we place a high priority on energy management, water conservation, and waste reduction. During 2023, construction efforts commenced on the installation of a new 12.37-megawatt solar carport and energy storage system at Six Flags Magic Mountain in Los Angeles. In addition to the Six Flags Magic Mountain installation, two additional parks - Six Flags Discovery Kingdom in Northern California and Six Flags Great Adventure in New Jersey - have also developed on-site solar capabilities with over 30 megawatts of fully-operational solar power systems installed. These three sites will rank as the largest volume of onsite Solar photovoltaic systems for any U.S. organization, with a combined total of 42.37 megawatts.
We are enhancing our water reclamation initiatives and continue to prioritize recyclable or biodegradable products in both our operations and our supply chain. We also continue to seek to incorporate solar power into our operations and otherwise reduce our greenhouse gas emissions.
With respect to governance issues, we are dedicated to meeting the highest standards of business conduct through our commitments to fostering quality and integrity in our own operations, and we expect our vendors to uphold the same standards of responsible business practices as set forth in our vendor code of conduct.
Our vision to be the preferred regional destination for entertainment would not be possible without our employees, who are the cornerstone of our commitment to provide the best customer experience for our guests.
We aim to create a culture that is results-oriented and supports our values of safety, integrity, accountability, guest-centricity, innovation, teamwork, inclusiveness, and fun. Core to achieving this goal is our commitment to conducting business in a manner that respects all individuals and promotes human rights, including providing fair working conditions and competitive wages, as set forth in our Human Rights Policy.We believe that the Company’s success will be realized through the engagement and empowerment of our employees. We are focused on developing a dynamic performance-driven culture centered on the guest and creating a spirit of innovation, which has always been at our core.
Employees
As of January 1, 2023, we employed approximately 1,450 full-time employees, and over the course of the 2022 operating season we employed approximately 40,000 seasonal employees. We compete with other local employers for qualified candidates on a season-by-season basis. As part of the seasonal employment program, we employ a significant number of teenagers, which subjects us to child labor laws.
Approximately 20% of our domestic full-time and approximately 7% of our domestic seasonal employees are subject to labor agreements with local chapters of national unions. Approximately 4% of our international full-time and approximately 46% of our international seasonal employees are subject to labor agreements with local chapters of national unions. These labor agreements expire in January 2024 (Six Flags Over Texas), December 2024 (Six Flags Over Georgia and Six Flags Magic Mountain), and January 2025 (Six Flags St. Louis). The labor agreements for La Ronde expire in various years ranging from December 2022 through December 2024. With respect to the La Ronde agreement that expired in December 2022, active discussions with the unions are currently underway. The labor agreements for Six Flags Great Adventure expire in various years ranging from December 2023 through December 2026. We consider our employee relations to be good.
During the year ended January 1, 2023, we reduced full-time employee headcount by 520 from our total as of January 2, 2022. The reduction in full-time employees was done to right-size our organization for intentionally lower attendance levels and to create a more streamlined and efficient organization by reducing layers of management and empowering our workers.
Diversity and Inclusion
We understand that enhancing our financial strength and improving our guest’s experience requires a diverse and inclusive workforce. We are committed to creating an inclusive environment that fully embraces the diversity of our employees and guests, regardless of ethnicity, gender, age, disability, cultural background, sexual orientation, or religious beliefs. We maintain a Diversity and Inclusion Council that provides feedback on a wide variety of diversity and inclusion related issues. In that regard, we are focused on the following:
| | |
Listen
| to employees and other stakeholders about how we can become more diverse and inclusive through our Diversity and Inclusion Council, and through regular employee surveys, which provide feedback directly to senior management, including the CEO
|
Train
| leaders on how to embrace inclusion, create awareness, understanding and recognize explicit and implicit bias including by providing instruction on how to lead open and honest conversations with employees
|
Address Unconscious Biases
| by updating our grooming, social media, and hiring policies, and changing any ride or attraction names that could be viewed as offensive
|
Build a Diverse Team
| with a leadership team that represents the diversity of our workplace and marketplace and through updating recruiting, people planning, and talent management programs to foster more objective processes for all employees
|
Partner with Communities
| by proactively working with diversity driven suppliers to develop long-term alliances.
|
As of January 1, 2023, approximately 50% of our full-time management employees, defined as those holding the title of manager or higher, were diverse by ethnicity and/or gender. Of the group, 33% are female and approximately 28% are ethnically diverse. By fostering an inclusive culture, we enable every employee to leverage unique talents and high-performance standards to drive innovation and success.
Employee Development
We seek to continuously elevate employee development and training through a variety of programs, opportunities, and resources. We continue to partner with the International Board of Credentialing and Continuing Education Standards to provide our guest-facing employees with specialized training to earn a Certificate in Autism Competency to further our commitment to better serve the special needs community, provide a more inclusive environment in our parks and continue our efforts in educating our employees on diversity and inclusion. We continue to enhance our talent development program by providing our employees with access to training, including virtual classrooms and online courses on topics including general safety, Office 365, harassment, discrimination, business ethics, anti-corruption, privacy and security, and park safety. We continue to redefine our succession planning process by establishing programs to better support the development of our talent bench for roles in management, maintenance and operations. Our senior leadership team reviews our talent development program annually with a particular focus on our top 10% of high performing, high potential talent, including a focus on diversity. We are committed to identifying and developing the talents of our future leaders.
In 2022 we launched an educational platform called Workforce Edge that provides educational opportunities to all of our employees. These educational opportunities include degrees, certification, licensing, and leadership opportunities.
Employee Engagement and Recruitment
We understand that continuous engagement with our employees is vital to driving successful, meaningful outcomes. Senior management conducts “town-hall” style meetings with employees to address topics such as business operations, strategy, market conditions, and question-and-answer sessions, to foster an environment and corporate culture of transparency and collaboration. We conduct ongoing employee satisfaction surveys that provide actionable feedback from employees to management. The survey responses are anonymous and measure employee satisfaction and solicit honest feedback. Management from both corporate and the parks meet routinely to review the survey results and develop action plans in response to the employee feedback.
We are focused on attracting, developing, and retaining best-in-class diverse teams, and continuing to build an inclusive culture that inspires leadership, encourages innovative thinking, empowers expeditious decision-making, and ties to our values. These guiding principles have been more important than ever in light of the unique challenges of operating during the ongoing pandemic. We source candidates from various sources in order to meet the current and future demands of our business. We have established relationships with high schools, trade schools, universities, professional associations and industry partners to proactively attract new talent.
Our recruiting practices and candidate selection are among our most important activities. We prioritized filling open positions with quality employees who want to advance the Six Flags’ mission. In addition, we utilize social media, virtual job fairs and organizations across the United States to find diverse, enthusiastic and qualified employees.
Competitive Benefits
Attracting, motivating, developing and retaining the best people is crucial to all aspects of our business and long-term success, and is central to our mission, vision and values. Our compensation programs are designed to align the compensation of our employees with our performance and to provide the proper incentives to attract, motivate and retain employees to achieve superior results. The structure of our compensation programs includes incentives based on both short-term and long-term performance. Specifically:
| ● | We provide employee wages that are competitive and consistent with employee positions, skill levels, experience, knowledge and geographic location. |
| ● | We engage nationally recognized outside compensation and benefits consulting firms to independently evaluate the effectiveness of our executive compensation and benefit programs. |
| ● | We align our executives’ long-term equity compensation with our stockholders’ interests by linking a significant portion of total compensation opportunity to business performance. |
| ● | All full-time employees are eligible for health insurance, paid and unpaid leaves, and life and disability/accident coverage, unless otherwise specified by a union contract. We also offer a variety of voluntary benefits that allow employees to select the options that meet their needs, including telemedicine, paid parental leave, prescription savings solutions, health savings accounts, flexible spending accounts, legal insurance, identity theft insurance, pet insurance and a wellness program. |
| ● | A unique Six Flags perquisite offers full-time employees complimentary passes, including for their dependents, which provides free admission to any of our parks, preferred parking and discounts on in-park products. Full-time employees are also provided complimentary tickets. |
Safety
The health and safety of our guests and employees is our highest priority. It is the shared responsibility of every employee to actively participate in creating a safe and secure environment and to minimize injuries. The hallmarks of the Company’s safety and security programs are:
| ● | Resources and education to ensure safe and secure operating environments at the parks, including compliance with Occupational Safety and Health Administration (OSHA) standards, as well as to improve overall workplace safety and health. This includes regular and ongoing safety training and assessments as well as annual safety audits. |
| ● | A highly trained workforce that proactively assesses risks, strives to eliminate unsafe conditions, and integrates learning from incidents to prevent future occurrences. |
| ● | Dedicated leadership, accountability, and employee empowerment. |
We expanded remote work opportunities where possible and implemented extensive health and safety measures, such as enhanced sanitization protocols and distribution of personal protective equipment, to provide a safe working environment for our employees. We continue to regularly monitor guidance from federal and local health authorities in evaluating applicable COVID-19 health and safety protocols with regard to ongoing operations. We enhanced our operations to make it safer and easier for our employees to come to work including adding training to ensure compliance with applicable health and safety protocols, contactless recruiting and hiring procedures, and offering voluntary on-site COVID testing and vaccination opportunities. We received favorable responses from our employees on our safety measures as evidenced by our employee satisfaction scores.
We continue to offer guests the ability to obtain cash cards from kiosks throughout the parks to facilitate electronic transactions as an option in lieu of using cash, and implemented mobile food ordering at all of our domestic parks.These innovations added contactless means to enhance our guests’ experience through faster, more convenient transactions while elevating our enhanced safety guidelines.
Human Rights
Our attention to health and safety of our guests and employees extends to the workers and communities in the supply chain. We believe that respect for human rights is fundamental to our mission of creating fun and thrilling memories for all and our commitment to ethical business conduct. We adopted a human rights policy that is grounded in international standards and is an important expression of our values. The policy provides the framework to hold employees accountable to advance, support and respect human rights in the course of doing business. We are focused on screening and doing business with vendors and suppliers who conduct their business with ethical standards that are consistent with our policy and the Company’s code of vendor conduct.
We believe that the Company’s success will be realized through the engagement and empowerment of our employees. We are focused on developing a dynamic performance-driven culture centered on the guest and creating a spirit of innovation, which has always been at our core.
Employees
As of December 31, 2023, we employed approximately 1,350 full-time employees, and over the course of the 2023 operating season we employed approximately 41,000 seasonal employees. We compete with other local employers for qualified candidates on a season-by-season basis. As part of the seasonal employment program, we employ a significant number of teenagers, which subjects us to child labor laws.
Approximately 24% of our domestic full-time and approximately 7% of our domestic seasonal employees are subject to labor agreements with local chapters of national unions. Approximately 3% of our international full-time and approximately 33% of our international seasonal employees are subject to labor agreements with local chapters of national unions. These labor agreements expire in January 2027 (Six Flags Over Texas), December 2024 (Six Flags Over Georgia and Six Flags Magic Mountain), and January 2025 (Six Flags St. Louis). The labor agreements for La Ronde expire in various years ranging from December 2022 through December 2027. With respect to the La Ronde agreement that expired in December 2022, active discussions with the unions are currently ongoing. The labor agreements for Six Flags Great Adventure expire in various years ranging from December 2023 through December 2026. With respect to Six Flags Great Adventure agreement that expired in December 2023, active discussions with the union are currently underway. We consider our employee relations to be good.
Diversity and Inclusion
We understand that enhancing our financial strength and improving our guest’s experience requires a diverse and inclusive workforce. We are committed to creating an inclusive environment that fully embraces the diversity of our employees and guests, regardless of ethnicity, gender, age, disability, cultural background, sexual orientation, or religious beliefs. We maintain a Diversity and Inclusion Council that provides feedback on a wide variety of diversity and inclusion related issues. In that regard, we are focused on building a team that represents the diversity of our workforce and marketplace by enhancing recruitment plans and fostering talent management programs that provide inclusive and objective processes for all employees.Additionally, we continue to support diversity driven suppliers to develop long term alliances
As of December 31, 2023, approximately 52% of our full-time management employees, defined as those holding the title of manager or higher, were diverse by ethnicity and/or gender. Of the group, 36% are female and approximately 26% are ethnically diverse. By fostering an inclusive culture, we enable every employee to leverage unique talents and high-performance standards to drive innovation and success.
Employee Development
We seek to continuously elevate employee development and training through a variety of programs, opportunities, and resources. We continue to partner with the International Board of Credentialing and Continuing Education Standards to provide our guest-facing employees with specialized training to earn a Certificate in Autism Competency to further our commitment to better serve the special needs community, provide a more inclusive environment in our parks and continue our efforts in educating our employees on diversity and inclusion. We continue to innovate and enhance our talent development program by providing our employees with access to
training, including virtual classrooms and online courses on topics including general safety, Office 365, harassment, discrimination, business ethics, anti-corruption, privacy and security, and park safety. We recognize that a highly engaged and well prepared team is paramount to operate more efficiently and effectively.We continue to redefine our succession planning process by establishing programs to better support the development of our talent bench for roles in management, maintenance and operations. Finally, utilizing training, education, and professional development as key metrics of performance is also important in maximizing skills and growth potential for our future leaders.
We have continued to foster partnerships with local and global educational institutions to create learning opportunities to all of our employees. These opportunities include degrees, certifications, licenses, and leadership upskilling.
Employee Engagement and Recruitment
We understand that continuous engagement with our employees is vital to driving successful, meaningful outcomes. Ensuring the alignment of performance management and recognition is vital in managing employee retention and is a key ingredient to create a positive and supportive workplace culture that promotes high-performance and high involvement by its teams.We conduct ongoing employee satisfaction surveys that provide actionable feedback from employees to management. The survey responses are anonymous and measure employee satisfaction and solicit honest feedback. By continuously monitoring and evaluating feedback, we are able to improve employee needs, enhance their capabilities, and develop strategies for improvement and recognition.
We are focused on attracting, developing, and retaining best-in-class diverse teams, and continuing to build an inclusive culture that inspires leadership, encourages innovative thinking, empowers expeditious decision-making, and ties to our values. We source candidates from various avenues in order to meet the current and future demands of our business. We have established relationships with high schools, trade schools, universities, professional associations and industry partners to proactively attract new talent.We have also taken on new approaches to expand strategic recruitment and outreach activities that target specific talent for high demand roles. We have developed a programmatic approach to recruitment that focuses on casting a wide radius to attract talent to our parks through the use of geofencing and social media.In 2023, we launched our first global TikTok campaign to recruit for our fall operations.This campaign allowed us to reach over 800,000 potential candidates and successfully provide talent specifically for needed positions.
Our recruiting practices and candidate selection are among our most important activities and we prioritized filling open positions with quality employees who want to advance the Six Flags’ mission.
Competitive Benefits
Attracting, motivating, developing and retaining the best people is crucial to all aspects of our business and long-term success, and is central to our mission, vision and values. Our compensation programs are designed to align the compensation of our employees with our performance and to provide the proper incentives to attract, motivate and retain employees to achieve superior results. The structure of our compensation programs includes incentives based on both short-term and long-term performance. Specifically:
•We provide employee wages that are competitive and consistent with employee positions, skill levels, experience,
knowledge and geographic location.
•We align our executives’ long-term equity compensation with our stockholders’ interests by linking a significant portion
of total compensation opportunity to business performance.
•All full-time employees are eligible for health insurance, paid and unpaid leaves, and life and disability/accident coverage,
unless otherwise specified by a union contract. We also offer a variety of voluntary benefits that allow employees to select the
options that meet their needs, including telemedicine, paid parental leave, prescription savings solutions, health savings
accounts, flexible spending accounts, legal insurance, identity theft insurance, pet insurance and a wellness program.
•A unique Six Flags incentive offers employees complimentary tickets and passes, including for their dependents, which
provides free admission to any of our parks, preferred parking and discounts on in-park products.
Safety
The health and safety of our guests and employees is our highest priority. It is the shared responsibility of every employee to actively participate in creating a safe and secure environment and to minimize injuries. The hallmarks of the Company’s safety and security programs are:
•Resources and education to ensure safe and secure operating environments at the parks, including compliance with Occupational Safety and Health Administration (OSHA) standards, as well as to improve overall workplace safety and health. This includes regular and ongoing safety training and assessments as well as annual safety audits.
•A highly trained workforce that proactively assesses risks, strives to eliminate unsafe conditions, and integrates learning from incidents to prevent future occurrences.
•Dedicated leadership, accountability, and employee empowerment.
Information about our Executive Officers and Certain Significant Employees
The following table sets forth the name of the members of the Company’s senior leadership team and executive officers, the position held by such person and the age of such person as of the date of this report. The officers of the Company are generally elected each year at a meeting of Holdings’ Board of Directors at the time of Holdings’ annual meeting of stockholders, and at other Board of Directors meetings, as appropriate.
|
Name | |
Name
| | Age
| | Title
|
|
Selim Bassoul* | | 67 | | 66
| President and Chief Executive Officer |
|
Gary Mick* | | 63 | | 62
| Chief Financial Officer |
|
Aimee Williams-Ramey*
Evan Bertrand | | 40 | | 49
| Chief Legal Officer and Corporate Secretary
|
|
Stephen R. Purtell
|
| 56
|
| Senior Vice President Corporate Communications,of Investor Relations and Treasurer
|
|
Jason Freeman | | 57 | | 56
| Vice President of Operations, Public Safety, Maintenance and Engineering |
|
Christopher Neumann | | 54 | | General Counsel and Corporate Secretary |
| Omar J. Omran | | 32 | | 31
| Chief Digital Officer |
|
Edithann Velez Ramey | | 51 | | 50
| Chief Marketing Officer |
|
Derek Sample | | 38 | | 37
| Vice President and Chief Accounting Officer |
|
*
Executive OfficersSelim Bassoul was named President and Chief Executive Officer of the Company in November 2021. Mr. Bassoul has served as a director of the Company since February 2020 and was the Non-Executive Chairman of the Board from February 2021 to November 2021. Mr. Bassoul served as Chief Executive Officer and Chairman of the Board of Directors of The Middleby Corporation (NASDAQ: MIDD), a manufacturer of food service and processing equipment, from 2001 to 2019. Mr. Bassoul currently serves as a director and non-executive chairman of the Board of Directors of Diversey Holdings, Ltd. (Nasdaq:(NASDAQ: DSEY), where he is a member of the Audit Committee and People Resources Committee. Mr. Bassoul previously served on the boards of 1847 Goedeker Corporation, Confluence Outdoor, Piper Aircraft, Inc., and Scientific Protein Laboratories LLC. He holds a B.A. in Business Administration from the American University of Beirut, and an M.B.A. in Finance and Marketing from the Kellogg School of Management at Northwestern University.
Gary Mick was named Chief Financial Officer of the Company in June 2022. Mr. Mick brings 40 years of business and strategy experience, primarily in the food industry. He previously served as President and Chief Financial Officer at Ice-O-Matic, an Ali Group Company based in Denver, Colorado from September 2018 through June 2022. Prior to that, he was Group President for Middleby Corporation (NASDAQ: MIDD), where he managed multiple foodservice divisions in the U.S. and Denmark. Prior to his role as Group President, he served in finance leadership roles of increasing responsibility and ultimately became President of Blodgett Ovens, a division of Middleby Corporation. Mr. Mick has a B.S. in Accounting from the University of Virginia and an M.B.A from the University of Vermont.
Evan Bertrand was named Chief Legal Officer and Corporate Secretary of the Company in June 2022. Prior to joining Six Flags, she served as Senior Vice President and General Counsel at Sabre Corporation, a leading technology provider to the global travel industry, where she served in various leadership positions with increasing responsibilities before assuming the General Counsel role in 2017. From 2013 to 2016, Ms. Williams-Ramey served as a regulator with the Financial Industry Regulatory Authority (FINRA), where she was the Regional Chief Counsel for the west region of the United States. Before joining FINRA, Ms. Williams-Ramey was in private practice with several high-profile law firms, where she handled a diverse range of complex legal and regulatory matters, including commercial litigation, securities litigation and enforcement actions, investigations, and corporate governance matters. From 1999 to 2000, she was a judicial clerk for the Honorable Henry A. Politz at the US Court of Appeals, Fifth Judicial Circuit. She also worked as an auditor for Deloitte before entering the legal field. Ms. Williams-Ramey has a Juris Doctor, summa cum laude, from Southern Methodist University School of Law, and a Bachelor of Accountancy, also summa cum laude, from the University of Oklahoma.
Stephen R. Purtell was named Senior Vice President, Corporate Communications, Investor Relations and Treasurer of the Company in January 2022. Mr. Purtell served as Interim Chief Financial Officer from March 2022 until the appointment of Mr. Mick in June 2022. Mr. Purtell previously served as Senior Vice President, Investor Relations, Treasury and Strategy since December 2020. From October 2016 to December 2020, Mr. Purtell was Senior Vice President, Investor Relations and Treasurer of Six Flags in April 2023. Mr. Bertrand joined Six Flags Entertainment Corporation as the Assistant Treasurer in December 2020 where he managed treasury operations and from July 2012 to October 2016, Mr. Purtell was Vice President, Business Development and Treasurer.supported investor relations. Prior to joining the Company, Mr. PurtellBertrand served in roles of increasing responsibility for Solera Holdings, a provider of automotive and property risk management software, from 2016 to 2020, ultimately serving as VP, Sales Operationsits Director of Global Treasury and Market Research for Siemens Healthcare DiagnosticsCapital Markets. Mr. Bertrand joined Solera after it acquired Dade Behring in 2007. Mr. Purtell joined Dade Behring in 2003 andhaving held various financial positions including Assistant Treasurer, VP Corporate Planningat ExxonMobil in its Controller’s and Analysis, Treasurer’s departments. In 2015, he earned his Chartered Financial Analyst certification. Mr. Bertrand holds a Master of Business Administration
and
Treasurer.a Bachelor of Music from Rice University. Prior to
joining Dade Behring,obtaining his MBA, Mr.
Purtell held financial and engineering positions at IMC Global and GATX Terminals Corporation, and was an officer inBertrand performed as a percussionist with symphony orchestras around the
U.S. Army. Mr. Purtell has a B.S. in Civil Engineering from the U.S. Military Academy at West Point and an M.B.A. from the Wharton School of the University of Pennsylvania.world.
Jason Freeman was named Vice President of Operations, Public Safety, Maintenance and Engineering of Six Flags in September 2022. Previously, Mr. Freeman was Vice President of Public Safety since January 2017. Mr. Freeman also oversees many Six Flags’ environmental initiatives. He began his career at Six Flags in 1984 as a seasonal employee and has held various management positions in Safety, Security, Operations and Administration at both the park and corporate levels of Six Flags beginning in 1988 including as Park President of Six Flags New England from 2010 until 2012. Mr. Freeman was appointed to a three-year term on the Board of Directors of the International Association of Amusement Parks & Attractions in January of 2023 and is also the Global Chairman of the IAAPA Security Committee. Mr. Freeman became a Certified Police Officer in 1988 from the Commonwealth of Massachusetts Criminal Justice Training Academy and was certified as an Emergency Medical Technician in 1985. Mr. Freeman also earned his national certification as an Americans with Disabilities Act Coordinator from the University of Missouri.
Christopher Neumann joined the Company in January 2018, and served as Vice President, Legal and Corporate Secretary until February 2024 and was appointed General Counsel in February 2024. Prior to joining Six Flags, he served in various roles for Kaplan, Inc. from 2009 to 2017, most recently as its Deputy General Counsel, where he oversaw mergers and acquisitions, commercial contracts, and intellectual property matters. Prior to joining Kaplan, Mr. Neumann was an Associate General Counsel in BlackRock's private equity group, where he handled acquisitions, joint ventures, and private fund formation. Previously, Mr. Neumann had been an associate and then partner, in Kirkland & Ellis' New York office, where he represented clients in M&A transactions, equity investments, debt financings, and public offerings. Mr. Neumann has a Juris Doctor, magna cum laude, from St. John’s University School of Law, where he was Notes and Comments Editor of the St. John Law Review, and a Bachelor degree in Business Administration from the University of Vermont.Omar J. Omran was named Chief Digital Officer of Six Flags in August 2022. Prior to Six Flags, Mr. Omran worked for Welbilt from October 2019 to August 2022. He was the Vice President of Digital Transformation at Welbilt and Managing Director of Welbilt’s KitchenConnect brand. Welbilt is the one of the largest commercial kitchen equipment manufacturers in the world. Under Mr. Omran’s leadership KitchenConnect became the biggest cloud platform in the foodservice industry globally, connecting any smart equipment in a restaurant. Prior to joining Welbilt, Mr. Omran was responsible for digital offerings at Middleby from July 2016 to August 2019. He founded Middleby Connect (known today as Open Kitchen), which became one of the largest cloud platforms in the food service industry. Mr. Omran has an entrepreneurial background and co-founded several technology companies (Live Love, TeraNotes, and Virtual Software). Mr. Omran holds a B.S. in Computer Science from the Lebanese American University and is currently pursuing an Executive MBA at MIT.
Edithann Velez Ramey was named Chief Marketing Officer of the Company in February 2022. Prior to joining the Company, Ms. Ramey held the position of Chief Marketing Officer for On the Border Restaurants, where she led marketing, culinary and catering initiatives for the brand through menu optimization, rewards programs and guest experience innovation. Ms. Velez Ramey has also held strategic management roles at TopGolf Entertainment Group, Chili’s Grill & Bar and Maggiano’s Little Italy. Ms. Ramey holds a B.A. in Communications and Political Science from the University of Michigan and a Master’s degree in Corporate Communication from Boston University.
Derek Sample was named Chief Accounting Officer of the Company in September 2022. Prior to joining the Company, Mr. Sample held the position of Corporate Controller at PHI Group, Inc, a global helicopter transportation company, from June 2021 through September 2022. From 2016 through 2021, Mr. Sample served in roles of increasing responsibility for Valaris, Inc., ultimately serving as its Director of Corporate Accounting. Previously, he served as SEC Technical Reporting Manager for Spiceworks, Inc., Manager of Financial Planning for Smart Sand, Inc., and Manager for KPMG. Mr. Sample holds Bachelor degrees in Accounting and Economics from Southwestern University and is a Certified Public Accountant. Copies of our annual reports on Form 10-K, quarterly reports on Form 10-Q, current reports on Form 8-K, and amendments to those reports, are available free of charge through our website at investors.sixflags.com. References to our website in this Annual Report are provided as a convenience and do not constitute an incorporation by reference of the information contained on, or accessible through, the website. Therefore, such information should not be considered part of this Annual Report. These reports, and any amendments to these reports, are made available on our website as soon as reasonably practicable after we electronically file such reports with, or furnish them to, the
United States Securities and Exchange Commission (the "SEC").SEC. Copies are also available, without charge, by sending a written request to Six Flags Entertainment Corporation, 1000 Ballpark Way, Suite 400, Arlington, TX 76011, Attn: Investor Relations.
Our website, investors.sixflags.com, also includes items related to corporate governance matters, including the charters of our Audit Committee, Nominating and Corporate Governance Committee and Compensation Committee, our Corporate Governance Guidelines, our Code of Business Conduct and Ethics and our Code of Ethics for Senior Management. Copies of these materials are also available, without charge, by sending a written request to Six Flags Entertainment Corporation, 1000 Ballpark Way, Suite 400, Arlington, TX 76011, Attn: Investor Relations.
Set forth below are the principal risks that we believe are most significant to our business and should be considered by our security holders. We operate in a continually changing business environment and, therefore, new risks emerge from time to time. This section contains forward-looking statements. For an explanation of the qualifications and limitations on forward-looking statements, see "CautionaryCautionary Note Regarding Forward-Looking Statements."Statements
. Risks Relating to Our Business
General economic conditions may have an adverse impact on our business, financial condition or results of operations.
Our results can be impacted by a number of macroeconomic factors, including but not limited to consumer confidence and spending levels, tax rates, unemployment, consumer credit availability, raw materials costs, pandemics (such as the ongoing COVID-19 pandemic) and natural disasters, fuel and energy costs (including oil prices), and credit market conditions. The COVID-19 pandemic has severely impacted and will likely continue to impact many of these factors. A general economic slowdown or recession resulting in a decrease in discretionary spending could adversely affect the frequency with which guests choose to visit our parks and the amount that our guests spend when they visit. Additionally, difficult economic conditions throughout the world, including global supply chain issues, could impact our ability to obtain supplies, services and credit as well as the ability of third parties to meet their obligations to us, including, for example, manufacturers’ ability to supply rides,payment of claims by our insurance carriers, funding of our lines of credit, or payment by our international agreement partner. Changes in exchange rates for foreign currencies could reduce international demand for our products, increase our labor and supply costs in non-U.S. markets or reduce the U.S. dollar value of revenue we earn in other markets. The demand for our parks, other entertainment and recreation activities generally, and discretionary travel is highly sensitive to downturns in the economy and the corresponding impact on discretionary consumer spending. Any actual or perceived deterioration or weakness in general, regional or local economic conditions, unemployment levels, the job or housing markets, consumer debt levels or consumer confidence, as well as other adverse economic or market conditions
due to COVID-19 or otherwise, may reduce our customers’ discretionary income to spend on parks, entertainment, recreation activities and travel.
Our growth strategy and strategic plan may not achieve the anticipated results.
Our future success depends on our ability to grow and evolve our business, including through capital investments to improve existing parks, rides, attractions and other entertainment offerings, technological advancements and improvements to enhance the guest experience and to increase productivity, as well as through our food and beverage and retail offerings.
Our strategies may not enhance guest experiences or increase productivity as planned, may not increase our revenues at the rate we expect or at all, and may require the expenditure of capital resources or operating costs in excess of what we originally budgeted and allocated for such purposes. In addition, our increased focus on improving our food and beverage offerings and simplifying our admissions products may not be successful. If we are unable to achieve our strategic objectives and grow and evolve our business, our financial condition and results of operations may be adversely affected.
Bad or extreme weather conditions and forecasts of bad or mixed weather conditions, which may be due to climate change, can adversely impact attendance at our parks.
Because most of the attractions at our parks are outdoors, attendance at our parks is adversely affected by bad or extreme weather conditions and forecasts of bad or mixed weather conditions that may be a result of climate change, which negatively affects our revenues. The effects of bad weather on attendance generally are not recovered later in the operating season. This can be more pronounced at our water parks.parks, which have shorter operating seasons. We believe our operating results in certain years were adversely affected by abnormally hot, cold and/or wet weather in a number of our major U.S. markets. In addition, since a number of our parks are geographically concentrated in the eastern portion of the United States, a weather pattern that affects that area could adversely affect a number of our parks and disproportionately impact our results of operations. In addition,Furthermore, our parks in California and Texas are more likely to be impacted by extreme heat, wildfires, mudslides and floods, which may be exacerbated by the effects of climate change, than
our parks in other locations. Bad weather and forecasts of bad weather on weekends, holidays or other peak periods will typically have a greater negative impact on our revenues and could disproportionately impact our results of operations.
Conditions beyond our control could damage our properties and could adversely impact attendance at our parks and result in decreased revenues.
Natural disasters, public heath crises, epidemics, pandemics, such as the outbreak of COVID-19, terrorist activities, power outages or other events outside our control could disrupt our operations, impair critical systems, damage our properties or reduce attendance at our parks or require temporary park closures. For example, many of our parks were either closed or operated under significant capacity restrictions in 2020 and early 2021 due to the COVID-19 pandemic. Damage to our properties could take a long time to repair and there is no guarantee that we would have adequate insurance to cover the costs of repair or the expense of the interruption to our business. Furthermore, natural disasters such as fires, earthquakes or hurricanes may interrupt or impede access to our affected properties or require evacuations and may cause attendance at our affected properties to decrease for an indefinite period. For example, our water park in Oaxtepec, Mexico was closed for several months during 2017 following the earthquakes in central Mexico. The occurrence of such events could have a material adverse effect on our business, financial condition and results of operations. In addition, since some of our parks are near major urban areas and appeal to teenagers and young adults, there may be disturbances at one or more parks that could negatively affect our reputation or brand. This may result in a decrease in attendance at the affected parks and could adversely impact our results of operations. While we work with local law enforcement authorities on security-related precautions to prevent certain types of disturbances, we can make no assurance that these precautions will be able to prevent or mitigate these types of events.
We cannot predict the frequency, duration or severity of these activities and the effect that they may have on our business, financial condition or results of operations.
The ongoing COVID-19 pandemic has had, and could continue to have, a significant negative impact on our financial condition and operations.
Since early 2020, the world has been, and continues to be, impacted by COVID-19 and its variants. COVID-19 and measures to prevent its spread has impacted our business especially when we were required to temporarily suspend operations at our theme parks and water parks in March 2020. As of January 1, 2023, we expect all of our parks to open in accordance with their normal operating schedules.
The impacts of COVID-19 on our business will continue for an unknown length of time. Future developments relating to COVID-19, including severity, rate of transmission, variants, treatment, testing and vaccinations, are uncertain and difficult to predict. Additionally, COVID-19 impacts that have subsided (such as temporary park closures, operating at reduced capacity and requiring advanced reservations) may again impact our business in the future and new impacts may emerge from COVID-19 developments or other pandemics.
Additionally, there are limitations on our ability to mitigate the adverse financial impact of COVID-19, including the fixed costs of operating our business and the impact COVID-19 may have on capital markets and our cost of borrowing.
The impact of any future outbreak of any COVID-19 variants or any other highly infectious or contagious disease is unpredictable and could result in restrictions from governmental authorities. Additionally, we may impose our own COVID-19 related restrictions in addition to what is required by state and local governments in the interest of safety for our guests and employees.Any of these measures could further disrupt our operations, or have a negative impact on our financial results. If future developments require subsequent disruptive measures to be implemented, such as prolonged park closures, our business, financial condition, results of operations and reputation may be materially and adversely affected.
The COVID-19 pandemic could have longer-term impacts on consumer tastes and preferences and could shift consumer entertainment and recreation behaviors toward digital entertainment experiences and other off-premises experiences and technologies. As a result, attendance, revenue and per capita spending at our theme parks and water parks could be adversely affected, which could materially adversely affect our business, results of operations, liquidity, cash flows, financial condition, and prospects.
The extent and duration of the impact of the ongoing endemic on our operations, financial performance and condition, liquidity and cash flows, will depend largely on future developments, including the duration of the pandemic and any variants that may be highly contagious and/or impact the effectiveness of vaccines, vaccination rates in the communities in which we operate, any continuing or newly imposed travel restrictions or vaccination requirements in connection with travel, and the related impact on factors affecting guest behavior, including individuals’ risk tolerance regarding health matters going forward, consumer confidence and spending, all of which are highly uncertain and cannot be predicted.
Our operations are seasonal.
Our operations are seasonal. In a typical year, approximately 70% of our annual park attendance and revenue occurs during the second and third calendar quarters of each year. As a result, when conditions or events described in the above risk factors occur during the operating season, particularly during the peak months of July and August, there is only a limited period of time during which the impact of those conditions or events can be mitigated. Accordingly, such conditions or events may have a disproportionately adverse effect on our revenues and cash flow. In addition, most of our maintenance and capital expenses are incurred in the off-season. For this reason, a sequential quarter-to-quarter comparison is not a good indication of our performance or of how we will perform in the future.
Adverse litigation judgments or settlements resulting from legal proceedings in which we may be involved in the normal course of our business could adversely affect our financial condition or results of operations.
We are subject to allegations, claims and legal actions arising in the ordinary course of our business, which may include claims by third parties, including guests who visit our parks, our employees or regulators. The outcome of these proceedings cannot be predicted. If any of these proceedings is determined adversely to us, or if we receive a judgment, a fine or a settlement involving a payment of a material sum of money, or injunctive relief is issued against us, our business, financial condition and results of operations could be materially adversely affected. Litigation can also be expensive, lengthy and disruptive to normal business operations, including to our management due to the increased time and resources required to respond to and address the litigation.
Additionally, from time to time, animal activist and other third party groups may make negative public statements about us or bring claims before government agencies or lawsuits against us. Such claims and lawsuits sometimes are based on allegations that we do not properly care for some of our featured animals. On other occasions, such claims and/or lawsuits are specifically designed to change existing law or enact new law in order to impede our ability to retain, exhibit, acquire or breed animals. While we seek to comply with all applicable federal and state laws and vigorously defend ourselves in any lawsuits, there are no assurances as to the outcome of future claims and lawsuits that could be brought against us. An unfavorable outcome in any legal proceeding could have a material adverse effect on our business, financial condition and results of operations. In addition, associated negative publicity could adversely affect our reputation, financial condition and results of operations.
Failures in, material damage to, or interruptions in our information technology systems, software or websites and difficulties in updating our systems or software or implementing new systems or software could adversely affect our business or operations.
We rely extensively on our information technology systems in the conduct of our business. We use software and other technology systems, among other things, to sell tickets and admit guests to our parks, to sell food, beverages and other products in our parks, to manage our workforce, to manage our inventory, and to monitor and manage our business on a day-to-day basis. We also use mobile devices, social networking and other online platforms to connect with our employees, business partners and customers. These technology systems and our uses thereof are vulnerable to damage or disruption from circumstances beyond our control including fire, natural disasters, power outages, system and equipment failures, viruses, malicious attacks, security breaches, theft, and inadvertent release of information. Damage or disruption to these technology systems may require a significant investment to update, remediate or replace with alternate systems, and we may suffer disruptions in our operations as a result.
We rely on third parties for the performance of a significant portion of our information technology functions. In particular, our ticket, season pass and membership sales system relies on data communications networks and technology systems and software operated by third parties. The success of our business depends in part on maintaining our relationships with these third parties and their continuing ability to perform these functions and services in a timely and satisfactory manner. If we experience a loss or disruption in the provision of any of these functions or services, or they are not performed in a satisfactory manner, we may have difficulty in finding alternate providers on terms favorable to us, in a timely manner or at all, and our business could be adversely affected.
Further, as we implement our strategy to pursue new initiatives that improve our operations and cost structure, we are also expanding and upgrading our information technologies. Potential problems and disruptions associated with the implementation of new or upgraded systems and technology or with maintenance or adequate support of existing systems could also disrupt or reduce the efficiency of our operations. Any material interruptions or failures in our systems, including those that may result from our failure to adequately develop, implement and maintain a robust disaster recovery plan and backup systems could severely affect our ability to conduct normal business operations and, as a result, could adversely affect our business operations and financial performance. Cyber-attacks could have a disruptive effect on our business.
Our business involves the storage and transmission of numerous classes of sensitive and/or confidential information and intellectual property, including guests’ personal information, private information about employees and financial and strategic information about the Company and our business.
We have experienced and continue to experience cybersecurity threats and vulnerabilities in our systems and those of our third party providers, including cyber-attacks targeting our information technology systems and networks, which could result in a loss of sensitive business or customer information, systems interruption or the disruption of our operations.
Further, implementing our strategy to pursue new initiatives that improve our operations and cost structure will result in a larger technological presence and corresponding exposure to cybersecurity risk. Failure to adequately assess and identify cybersecurity risks associated with new initiatives would increase our vulnerability to such risks.
Due to the increased remote workforce, we must increasingly rely on information technology systems that are outside our direct control. These systems are potentially vulnerable to cyber-based attacks and security breaches. In addition, cyber criminals are increasing their attacks on individual employees, utilizing interest in pandemic-related information to increase business email compromise scams designed to trick victims into transferring sensitive data or funds, or steal credentials that compromise information systems.
Even if we are fully compliant with legal standards and contractual or other requirements, we still may not be able to prevent security breaches involving sensitive data. We have, and require, certain of our third party service providers to have, programs in place to detect, contain and respond to data security incidents. However, the actions and controls we
have implemented and continue to implement, or which we seek to cause or have caused third party service providers to implement, may be insufficient to protect our systems, information or other intellectual property. In addition, the techniques used to obtain unauthorized access or interfere with systems change frequently and may be difficult to detect for long periods of time, and we may be unable to anticipate these techniques or implement adequate preventive measures. The sophistication of efforts by hackers to gain unauthorized access to information technology systems has continued to increase in recent years. Breaches, thefts, losses or fraudulent uses of customer, employee or company data could cause customers to lose confidence in the security of our websites, mobile applications, point of sale systems and other information technology systems and choose not to purchase from us. Such security breaches also could expose us to risks of data loss, business disruption, litigation and other costs or liabilities, any of which could adversely affect our business.
To date, these cybersecurity threats have not had a material impact on our business, financial condition or results of operations. However, the potential consequences of a future material cybersecurity attack on us or our third party service providers include business disruption; disruption to systems; theft, destruction, loss, corruption, misappropriation or unauthorized release of sensitive and/or confidential information or intellectual property (including personal information in violation of one or more privacy laws); reputational and brand damage; and potential liability, including litigation or other legal actions against us or the imposition by governmental authorities of penalties, fines, fees or liabilities, which, in turn, could cause us to incur significantly increased cybersecurity protection and remediation costs and the loss of customers. Failure to keep pace with developments in technology could adversely affect our operations or competitive position.
The theme park and water park industry demands the use of sophisticated technology and systems for operation of our parks, ticket, membership and season pass sales and management, and labor and inventory management. Information technology systems continue to evolve and, in order to remain competitive, we must implement new technologies and systems in a timely and efficient manner. The development and maintenance of these technologies may require significant investment by us and we may not achieve the anticipated benefits from such new developments or upgrades.
There is a risk of accidents occurring at our parks or competing parks which may reduce attendance and negatively impact our operations.
Our brand and our reputation are among our most important assets. Our ability to attract and retain customers depends, in part, upon the external perceptions of the Company, the quality and safety of our parks, services and rides, and our corporate and management integrity. While we carefully maintain the safety of our rides, there are inherent risks involved with these attractions. An accident or an injury (including water- or air-borne illnesses) at any of our parks or at parks operated by competitors, particularly an accident or injury involving the safety of guests and employees, that receives media attention, could negatively impact our brand or reputation, cause loss of consumer confidence in the Company, reduce attendance at our parks, and negatively impact our results of operations. For example, in September 2019, a coaster accident at La Feria, a competing park in Mexico, resulted in two fatalities. We believe that the publicity surrounding this accident had a significant negative impact on attendance at our park in Mexico during that period. The considerable expansion in the use of social media over recent years has compounded the impact of negative publicity. If any such incident occurs during a time of high seasonal demand, the effect could disproportionately impact our results of operations for the year.
Increases in labor costs and employee health and welfare benefits could have a negative impact on our cash flows, financial condition, and results of operations.
Labor is a primary component in the cost of operating our business. We devote significant resources to recruiting and training our employees in order to meet our guests’ high expectations for service. Wage and benefit increases to attract and retain employees in a tight labor market have driven-up labor costs. These increased costs pressure our margins and could have a negative impact on our financial results. Our ability to control labor costs is subject to numerous external factors, including market pressures with respect to prevailing wage rates, unemployment levels, and health and other insurance costs, as well as the impact of legislation or regulations governing labor relations, minimum wage, and healthcare benefits. Our results of operations are also substantially affected by costs of retirement, including
as a result of macroeconomic factors beyond our control, such as declines in investment returns on pension plan assets and changes in discount rates used to calculate pension and related liabilities.
In addition, we may experience material increase in the cost of securing our seasonal workforce in the future. Increased minimum wage requirements, seasonal wages or an inadequate workforce could have an adverse impact on our results of operations. We anticipate that the recent increases to the minimum wage rates will increase our salary, wage and benefit expenses in
20232024 and future years and further legislative changes or competitive wage rates could continue to increase these expenses in the future.
Additionally, we contribute to multiple defined benefit multiemployer pension plans on behalf of our collectively bargained employees of Six Flags Great Adventure LLC. If we were to cease contributing to or otherwise incur a withdrawal from any such plans, we could be obligated to pay withdrawal liability assessments based on the underfunded status (if any) of such plans at the time of the withdrawal. The amount of any multiemployer pension plan underfunding can fluctuate from year to year, and thus there is a possibility that the amount of withdrawal liability that we could incur in the future could be material, which could materially adversely affect our financial condition.
We depend on a seasonal workforce to meet our operational needs.
Our park operations depend in part on our ability to attract, train, motivate and retain qualified employees, many of whom are seasonal employees. We seek to manage seasonal wages and the timing of the hiring process to ensure the appropriate workforce is in place for peak and low seasons. If we are unable to hire sufficient personnel or successfully manage our seasonal workforce needs, we may not be able to meet our operational needs and our financial results could be negatively impacted.
The theme park and water park industry competes with numerous entertainment alternatives and such competition may have an adverse impact on our business, financial condition or results of operations.
Our parks compete with other theme parks, water parks and amusement parks and with other types of recreational facilities and forms of entertainment, including movies, home entertainment options, sporting events, restaurants and vacation travel. Our business is also subject to factors that affect the recreation and leisure time industries generally, such as general economic conditions, including relative fuel prices, and changes in consumer spending habits. The principal competitive factors of a park include location, price, the uniqueness and perceived quality of the rides and attractions, the atmosphere and cleanliness of the park and the quality of its food and entertainment. If we are unable to compete effectively against entertainment alternatives or on the basis of principal competitive factors of the park, our business, financial condition or results of operations may be adversely affected.
We could be adversely affected by changes in consumer tastes and preferences for entertainment and consumer products.
The success of our parks depends substantially on consumer tastes and preferences that can change in often unpredictable ways and on our ability to ensure that our parks meet the changing preferences of the broad consumer market. We conduct research and analysis before acquiring new parks or opening new rides or attractions and often invest substantial amounts before we learn the extent to which these new parks and new rides or attractions will earn consumer acceptance. If visitor volumes at our parks were to decline significantly or if new rides and entertainment offerings at our parks do not achieve sufficient consumer acceptance, revenues and margins may decline. Our results of operations may also be adversely affected if we fail to retain long-term customer loyalty or provide satisfactory customer service.
Data privacy regulation and our ability to comply could harm our business.
We are subject to laws that regulate the collection, use, retention, security, and transfer of our customer’s data. Data privacy is subject to frequently changing rules and regulations, such as California’s Consumer Privacy Act (the “CCPA”) that became effective January 1, 2020, which provides a private right of action for data breaches and requires companies that process information on California residents to make certain disclosures to consumers about their data collection, use
and sharing practices and allow consumers to opt out of certain data sharing with third parties. Compliance with the CCPA, and other current and future applicable privacy and related laws can be costly and time-consuming, and violations of privacy-related laws can result in significant damages and penalties. These laws continue to evolve in ways we cannot predict, both through regulatory and legislative action and judicial decisions, and that may harm our business.
Our privacy policies and practices concerning the collection, use and disclosure of user data are available on our website. Any failure, or perceived failure, by us to comply with our posted privacy policies or with any regulatory requirements or orders or other privacy or consumer protection-related laws and regulations, including the CCPA, could result in proceedings or actions against us by governmental entities or others (e.g., class action privacy litigation), subject us to significant penalties and negative publicity, require us to change our business practices, increase our costs and adversely affect our business. Data collection, privacy and security have become the subject of increasing public concern. If internet and mobile users were to reduce their use of our websites, mobile platforms, products, and services as a result of these concerns, our business could be harmed.
Our insurance coverage may not be adequate to cover all possible losses that we could suffer, and our insurance costs may increase.
Although we maintain various safety and loss prevention programs and carry property and casualty insurance to cover certain risks, our insurance policies do not cover all types of losses and liabilities. Additionally, there can be no assurance our insurance will be sufficient to cover the full extent of all losses or liabilities for which we are insured. The majority of our current insurance policies have annual terms and expire on December 31, 2023,2024, and we cannot guarantee we will be able to renew our current insurance policies on favorable terms, or at all. In addition, if we or other theme or water park operators sustain significant losses or make significant insurance claims, then our ability to obtain future insurance coverage at commercially reasonable rates could be materially adversely affected. If our insurance coverage is not adequate, or we become subject to damages that cannot by law be insured against, such as
punitive damages or certain intentional misconduct by our employees, this could adversely affect our financial condition or results of operations.
If we are not able to fund capital expenditures and invest in future attractions and projects in our parks, our revenues could be negatively impacted.
Because a principal competitive factor for a theme park or a water park is the uniqueness and perceived quality of its rides and attractions, we need to make continued capital investments through maintenance and the regular addition of new rides and attractions. A key element for our revenue growth is strategic capital spending on such investments. Our ability to fund capital expenditures will depend on our ability to generate sufficient cash flow from operations and to raise capital from third parties. We cannot provide assurance our operations will be able to generate sufficient cash flow to fund such costs, or that we will be able to obtain sufficient financing on adequate terms, or at all, which could cause us to delay or abandon certain projects or plans. In addition, any construction delays or ride downtime can adversely affect our attendance and our ability to realize revenue growth.
Incidents involving food contamination, product recalls, product liability claims and associated costs could adversely affect our reputation and our financial condition.
The sale of food, toys and other retail products involves legal and other risks. While we dedicate substantial resources to food safety matters to enable customers to enjoy safe, quality food products, food safety events, including instances of food-borne illness (such as salmonella or E. Coli) could occur in our parks. Instances or reports, whether true or not, of food-safety issues could negatively affect our sales and reputation and could possibly lead to product liability claims, litigation (including class actions), or other damages. We may need to recall food products if they become contaminated, and we may need to recall toys, games or other retail merchandise if there is a design or product defect. Even though we are resellers of food, toys and other retail products, we may be liable if the consumption or purchase of any of the products we sell causes illness or injury. A recall could result in losses due to the cost of the recall, the destruction of product and lost sales due to the unavailability of product for a period of time. A significant food or retail product recall could also result in adverse publicity, damage to our reputation and loss of consumer confidence in our parks, which could have a material adverse effect on our business, financial condition or results of operations.
We may be unable to purchase or contract with third parties to manufacture theme park or water park rides and attractions.
We may be unable to purchase or contract with third parties to build high quality rides and attractions and to continue to service and maintain those rides and attractions at competitive or beneficial prices, or to provide the replacement parts needed to maintain the operation of such rides. Global supply chain issues may also cause delays in the receipt of required goods or services. In addition, if our third party suppliers’ financial condition deteriorates or they go out of business, we may not be able to obtain the full benefit of manufacturer warranties or indemnities typically contained in our contracts or may need to incur greater costs for the maintenance, repair, replacement or insurance of these assets.
We may not be able to realize the benefits of our international agreements.
Various external factors, including difficult economic and political conditions throughout the world, could negatively affect the progress of our initiatives to develop new Six Flags-branded parks outside of North America. These initiatives could be delayed, and the ultimate success of such parks may be uncertain.
For example, on February 14, 2020, we terminated our agreements with our partner in China to build parks as a result of its uncured payment defaults.Some factors that will be important to the success of our international agreement initiatives are different than those affecting our existing parks. Tastes naturally vary by region, and consumers in new international markets into which we expand our brand may not embrace the parks’ offerings to the same extent as consumers in our existing markets. International agreements are also subject to additional risks, including the performance of our partners and their ability to obtain financing and government approvals; the impact of economic fluctuations in economies outside of the U.S.; difficulties and costs of staffing and managing foreign operations due to distance, language and cultural differences; changes or uncertainties in economic, legal, regulatory, social and political conditions; the enforceability of intellectual property and contract rights; and foreign currency exchange rate fluctuations, currency controls, and potentially adverse tax consequences of overseas operations. If we do not realize the benefits of such transactions, it could have an adverse effect on our financial performance.
We may not be able to renew our leases on terms acceptable to us or at all and our leases contain default provisions that, if enforced or exercised by the landlord, could significantly impact our operations at those parks.
Of our 27 theme parks and water parks, 12 are located on property that we lease and do not own. While most of our leases have at least five years remaining on their terms, and in some cases with renewal options, our lease for our theme park in Mexico expires in
2024. We intend to renewWhile we are in the final stages of renewing this lease, but we cannot guarantee that the lease will be renewed on terms that are acceptable to us or at all. In addition, certain of our leases permit the landlord to terminate the lease if there is a default under the lease, including, for example, our failure to pay rent, utilities and applicable taxes in a timely fashion or to maintain certain insurance. If we could not renew a lease or a landlord were to terminate a lease, it would
halt our operations at that park and, depending on the size of the park, could have a negative impact on our financial condition and results of operations. In addition, any disputes that may result from such a non-renewal or termination may be expensive to pursue and may divert money and management’s attention from our other operations and adversely affect our business, financial condition or results of operations.
Our intellectual property rights are valuable, and any inability or material increase in the cost to protect them could adversely affect our business.
Our intellectual property, including our trademarks and domain names and other proprietary rights, constitutes a significant part of our value. To protect our intellectual property rights, we rely upon a combination of trademark, trade secret and unfair competition laws of the United States and other countries, as well as contract provisions and third party policies and procedures governing internet/domain name registrations. However, there can be no assurance these measures will be successful in any given case, particularly in those countries where the laws do not protect our proprietary rights as fully as in the United States. We may be unable to prevent the misappropriation, infringement or violation of our intellectual property rights, breach of any contractual obligations to us, or independent development of intellectual property that is similar to ours, any of which could reduce or eliminate any competitive advantage we have developed, adversely affect our revenues or otherwise harm our business. In addition, pursuant to our license agreements, we have exclusive theme park usage rights in the U.S. (except for the Las Vegas metropolitan area), Canada and Mexico to certain Warner Bros. and DC Comics animated characters. The license fee is subject to periodic scheduled adjustments and CPI increases, and Warner Bros. has the right to terminate the agreements under certain circumstances, such as a default under the Subordinated Indemnity Agreement. The termination of these licenses, or a material increase in the cost to retain these licenses, could have a material adverse effect on our business or financial condition.
Unionization activities or labor disputes may disrupt our operations and affect our profitability.
As of January 1,December 31, 2023, approximately 20%24% of our domestic full-time and approximately 7% of our domestic seasonal employees were subject to labor agreements with local chapters of national unions. Approximately 4%3% of our international full-time and 46%33% of our international seasonal employees are subject to labor agreements with local chapters of national unions. We have collective bargaining agreements in place for certain employees at Six Flags Over Georgia, Six Flags Magic Mountain, Six Flags Great Adventure, Six Flags Over Texas, Six Flags St. Louis, and La Ronde. New unionization activity or a labor dispute involving our employees could disrupt our operations and reduce our revenues, and resolution of unionization activities or labor disputes could increase our costs. Litigation relating to employment and/or wage and hour disputes could also increase our operating expenses. Such disrupted operations, reduced revenues or increased costs could have a material adverse effect on our financial condition and results of operations.
Our operations and our ownership of property subject us to environmental, health and safety, climate change, and other regulations, which create uncertainty regarding future expenditures and liabilities.
Our operations involve wastewater and stormwater discharges and air emissions, and as a result are subject to environmental, health and safety laws, regulations and permitting requirements. These requirements are administered by the U.S. Environmental Protection Agency and the states and localities where our parks are located (and can also often be enforced through citizen suit provisions) and include the requirements of the Clean Water Act and the Clean Air Act. Our operations also involve maintaining underground and aboveground storage tanks, and managing and disposing of hazardous substances, chemicals and materials and are subject to federal, state and local laws and regulations regarding the use, generation, manufacture, storage, handling and disposal of these substances, chemicals and materials, including the Resource Conservation and Recovery Act and the Comprehensive Environmental Response, Compensation and Liability Act ("CERCLA"). A portion of our capital expenditures budget is intended to ensure continued compliance with environmental, health and safety laws, regulations and permitting requirements. In the event of contamination or injury as a result of a release of or exposure to regulated materials, we could be held liable for any resulting damages. For example, pursuant to CERCLA, past and current owners and operators of facilities and persons arranging for disposal of hazardous substances may be held strictly, jointly and severally liable for costs to remediate releases and threatened releases of hazardous substances. The costs of investigation, remediation or removal of regulated materials may be substantial, and the presence of those substances, or the failure to remediate property properly, may impair our ability to use, transfer or obtain financing regarding our property. Our activities may be affected by new legislation or changes in existing environmental, health and safety laws. For example, the state or federal government having jurisdiction over a given area may enact legislation and the U.S. Environmental Protection Agency or applicable state entity may propose new regulations or change existing regulations that could require our parks to reduce certain emissions or discharges. Such action could require our parks to install costly equipment or increase operating expenses. We may be required to incur costs to remediate potential environmental hazards, mitigate environmental risks in the future, or comply with
other environmental requirements. Concern over climate change may result in new or increased legal and regulatory requirements to reduce or mitigate the effects of climate change on the environment. Increased costs of energy or compliance with emissions standards due to increased legal or regulatory requirements may cause disruptions in or increased costs associated with park services.
We also are subject to federal and state laws, which prohibit discrimination and other laws regulating the design and operation of facilities, such as the Americans With Disabilities Act. Compliance with these laws and regulations can be costly and increase our exposure to litigation and governmental proceedings, and a failure or perceived failure to comply with these laws could result in negative publicity that could harm our reputation, which could adversely affect our business.
Risks Related to Our Indebtedness and Common Stock
A portion of our cash flow is required to be used to fund our substantial monetary obligations.
We have significant financial obligations under our debt instruments and the Partnership Park arrangements. See the Partnership Parks section in Note 15 -Commitments and Contingencies, to the consolidated financial statements in Item 8 - Financial Statements and Supplementary Data of this Annual Report for a detailed discussion of our obligations with respect to the Partnership Parks. In the event of a default by us under the Partnership Parks arrangements, Time Warner has the right to take control of the Partnership Parks. In addition, such a default could trigger an event of default under theour Credit Agreement.Facility. See "Business—Partnership Park Arrangements" for additional information. If we are unable to make payments on our debt or satisfy our other obligations, or if we fail to obtain future financing that may be necessary for working capital, capital expenditures, payment of debt, or the Partnership Park obligations, it could materially adversely affect our business, financial condition or results of operations.
We plan to strategically reinvest in our properties to improve the guest experience and our business plan includes targeted annual capital spending. However, depending on various factors including strategic initiatives, the duration of the COVID-19 pandemic, unanticipated delays in the completion of our projects, weather conditions, increased labor
costs, and availability and cost of ride components, we may spend more or less than our planned target amount. In 2022,2023, we spent $111.5$170.2 million on capital expenditures, net of property insurance recoveries.
We cannot be sure that cash generated from our parks will be as high as we expect or that our expenses will not be higher than we expect. Because a portion of our expenses are fixed in any given year, our operating cash flows are highly dependent on revenues, which are largely driven by attendance levels, in-park sales, accommodations and sponsorship and international agreement activity. A lower amount of cash generated from our parks or higher expenses than expected, when coupled with our debt obligations, could adversely affect our ability to fund our operations.
Our leverage could adversely affect our ability to raise additional capital to fund our operations, limit our ability to react to changes in the economy or our industry, and prevent us from meeting our obligations under our indebtedness.
As of
January 1,December 31, 2023, our total indebtedness was approximately
$2.381$2.365 billion. Our high degree of leverage could have important consequences, including the following: (i) a substantial portion of our cash flow from operations is dedicated to the payment of principal and interest on indebtedness, thereby reducing the funds available for operations, capital expenditures, future business opportunities and/or repurchases of Holdings common stock; (ii) our ability to obtain additional financing for working capital, capital expenditures, debt service requirements, acquisitions and general corporate purposes in the future may be limited; (iii) certain of the borrowings are at variable rates of interest, which will increase our vulnerability to increases in interest rates; (iv) we are at a competitive disadvantage to less leveraged competitors; (v) we may be unable to adjust rapidly to changing market conditions; (vi) the debt service requirements of our other indebtedness could make it more difficult for us to satisfy our financial obligations; and (vii) we may be vulnerable in a downturn in general economic conditions or in our business and we may be unable to carry out activities that are important to our growth.
Our ability to make scheduled payments of the principal of, or to pay interest on, or to refinance indebtedness depends on and is subject to our financial and operating performance, which in turn is affected by general and regional economic, financial, competitive, business and other factors beyond our control, including the availability of financing in the banking and capital markets. If unable to generate sufficient cash flow to service our debt or to fund our other liquidity needs, we will need to restructure or refinance all or a portion of our debt, which could cause us to default on our obligations and impair our liquidity. There can be no assurance that any refinancing of our indebtedness will be possible and any such refinancing could be at higher interest rates and may require us to comply with more onerous covenants that could further restrict our business operations. If we are unable to meet our debt obligations or to fund our other liquidity needs, we may be forced to reduce or delay strategic initiatives and capital expenditures, sell material assets or operations, obtain additional capital or restructure our debt, which could cause us to default on our debt obligations and impair our
liquidity. We from time to time may increase the amount of our indebtedness, modify the terms of our financing arrangements, make capital expenditures, issue dividends and take other actions that may substantially increase our leverage.
Despite our significant leverage, we may incur additional amounts of debt, which could further exacerbate the risks associated with our significant leverage.
Changes to, or the elimination of, LIBOR may adversely affect interest expense related to our indebtedness.
Borrowings under the Second Amended and Restated Term Loan B are calculated on a London Inter-Bank Offered Rate (“LIBOR”) plus an additional percentage based on credit risk. LIBOR is the subject of recent proposals for reform. In July 2017, the United Kingdom’s Financial Conduct Authority, which regulates LIBOR, announced that it will no longer persuade or compel banks to submit LIBOR rates after 2021. At the end of 2021, the ICE Benchmark Administration, the administrator for LIBOR, ceased publishing one-week and two-month U.S. dollar LIBOR and will cease publishing all remaining U.S. dollar LIBOR tenors on June 30, 2023. These reforms may cause LIBOR to cease to exist, new methods of calculating LIBOR to be established or the establishment of an alternative reference rate. The consequences cannot be entirely predicted and could have an adverse impact on the interest payments under our debt. We will begin using SOFR or an alternative rate following the discontinuation of LIBOR on June 30, 2023. Changes in market interest rates may influence our future financing costs and could reduce our earnings and cash flows.
The stock price of Holdings’ common stock may change significantly, and you may not be able to sell shares of Holdings’ common stock at or above the price you paid or at all, and you could lose all or part of your investment as a result.
The trading price of Holdings’ common stock has been, and may continue to be, volatile. In addition to the risk factors discussed in this Annual Report, the trading price of Holdings’ common stock may be adversely affected due to a number of factors, many of which are beyond our control, including: (i) our operating and financial performance; (ii) our ability to repay our debt; (iii) our ability to refinance our debt; (iv) investor perceptions of us and the industry and markets in which we operate; (v) our dividend policy; (vi) changes in earnings estimates or recommendations by analysts; and (viii) general financial, domestic, economic and other market conditions. In addition, our business and long-range planning process is designed to maximize our long-term strength, growth, and profitability. We believe that this longer-term focus is in the best interests of the Company and stockholders. At the same time, however, we recognize that, when possible, it is helpful to provide investors with guidance as to our forecast of EBITDA and other financial metrics or projections from time to time. We do not have any responsibility to provide guidance or to update any of our forward-looking statements at such times or otherwise. In addition, any longer-term guidance that we provide is based on goals that we believe, at the time guidance is given, are reasonably attainable for growth and performance over a number of years. If, or when, we announce actual results that differ from those that have been predicted by us, outside investment analysts, or others, our stock price could be adversely affected. Investors who rely on these stated goals when making investment decisions with respect to our securities do so at their own risk. We take no responsibility for any losses suffered as a result of such changes in our stock price.
We
Historically, we had periodically
returnreturned value to investors through payment of quarterly dividends and common stock repurchases. In 2020, pursuant to amendments to the Credit
Agreement,Facility, we
suspendedwere required to suspend our quarterly dividend payment and stock repurchase
program due to the impact of the COVID-19 pandemic until the earlier December 31, 2022, orprogram. Although such
time as Six Flags Theme Parks Inc. (“SFTP”) reduces the incremental revolving credit commitments by $131.0 million and begins using actual results to test covenant compliance. However, given the uncertainty associated with the ultimate impact of the COVID-19 pandemic on our business and operations,restrictions have since lapsed, we may determine that it is prudent to continue these suspensions,
for longer depending on any then-existing limitations on our working capital. We met the terms of the covenants by reducing the incremental revolving credit commitments by $131.0 million during May of 2022. Investorswhich may
have an expectation that we will resume our dividend at a certain time and at certain levels or repurchase shares available under Holdings’ repurchase program.not align with investor expectations. The stock price of Holdings’ common stock could be adversely affected if our cash dividend rate or common stock repurchase activity differs from investors’ expectations. During the year ended January 1, 2023, we repurchased 3,464,000 shares at an aggregate cost of $96.8 million.
We did not repurchase any shares during the year ended December 31, 2023.
Our existing debt agreements contain, and future debt agreements may contain, financial and other restrictions that limit our flexibility in operating our business.
Our existing debt agreements contain, and documents governing our future indebtedness may contain, financial and operating covenants that limit the discretion of management with respect to certain business matters. These covenants place restrictions on, among other things, our ability to incur additional indebtedness, pay dividends and other distributions, create liens, make investments and other restricted payments, repurchase stock, engage in transactions with affiliates, sell certain assets or engage in mergers, acquisitions and other business combination. Our existing debt agreements also require, and documents governing our future indebtedness may require, us to meet certain financial ratios and tests. Our ability to comply with these and other provisions of the existing debt agreements is dependent on our future performance, which will be subject to many factors, some of which are beyond our control including weather and economic, financial and industry conditions. The breach of any of these covenants or non-compliance with any of these financial ratios and tests could result in an event of default under the existing debt agreements, which, if not cured or waived, could result in acceleration of the related debt and the acceleration of debt under other instruments evidencing indebtedness that may contain cross-acceleration or cross-default provisions. We cannot provide assurance that our liquidity would be sufficient to repay or refinance such indebtedness if it was accelerated upon an event of default. We discuss certain key covenants and financial ratios to which we are subject under our debt agreements in greater detail
Changes in our credit ratings could adversely affect the price of Holdings’ common stock.
We receive debt ratings from the major credit rating agencies in the United States. Factors that may impact our credit ratings include the sizable attendance and revenue generated from our portfolio of geographically diversified regional theme parks and water
parks, vulnerability to cyclical discretionary consumer spending, and seasonality of our operations. As the result of the COVID-19 pandemic and impact of expanding restrictions and quarantines on the entertainment industry, the credit rating agencies lowered the ratings on several theme park companies in 2020. In June 2021, Moody’s changed our outlook from “negative” to “stable” and reaffirmed our issuer credit rating of B2 and reaffirmed our issuer-level ratings of Ba2 and B3 on our senior secured and senior unsecured issuances, respectively. Additionally, in June 2021, Standard and Poor’s changed our outlook from “negative” to “positive” in June 2022. In August 2021, Standard and Poor’s increased our issuer credit rating from B- to B+. Standard and Poor’s increased the rating on our senior secured issuances from B to BB, and in November 2022, Standard and Poor’s increased the rating on our senior unsecured from B- to B. In November 2022, our outlook changed from “positive” to “stable”.
In November 2023, Standard and Poor's placed Six Flags Entertainment on CreditWatch Positive on the proposed merger with Cedar Fair L.P. Similarly, Moody's placed our ratings under review for upgrade following the announcement of the proposed Mergers. A negative change in our ratings or the perception such a change might occur could adversely affect the market price of Holdings’ common stock.
Holdings is a holding company and is dependent on dividends and other distributionsdistributions from its subsidiaries. Holdings is a holding company and substantially all of its operations are conducted through direct and indirect subsidiaries. As a holding company, it has no significant assets other than its equity interests in its subsidiaries. Accordingly, Holdings is dependent on dividends and other distributions from its subsidiaries to meet its obligations, including the obligations under the Company’s debt agreements, and, at such time as dividend payments by Holdings are no longer suspended, to pay dividends on Holdings’ common stock. If these dividends and other distributions are not sufficient for Holdings to meets its financial obligations, or not available to Holdings due to restrictions in the instruments governing our indebtedness, it could cause Holdings to default on its debt obligations, which would impair our liquidity and adversely affect our financial condition and our business. We had
$80.1$77.6 million of cash and cash equivalents on a consolidated basis at
January 1,December 31, 2023, of which a nominal amount was held at Holdings.
Anti-takeover provisions in our organizational documents, debt agreements and Delaware law could delay or prevent change of control.
Certain provisions in Holdings’ charter, bylaws and debt agreements could have the effect of delaying, deferring or preventing a merger, takeover attempt, or other change of control transaction that a stockholder might consider in its best interest, including those attempts that might result in a premium price over the market price for shares of Holdings’ common stock. Holdings is also subject to the anti-takeover provisions of Delaware law, which could have the effect of delaying or preventing a change of control in some circumstances.
We may not be able to attract and retain key management and other key employees.
Our employees, particularly our key management, are vital to our success and difficult to replace. We may be unable to retain them or to attract other highly qualified employees, particularly if we do not offer employment terms competitive with the rest of the market. Failure to attract and retain highly qualified employees, or failure to develop and implement a viable succession plan, could result in inadequate depth of institutional knowledge or skill sets, adversely affecting our business.
Risk related to tariffs and other duties
We source merchandise for resale and other products used in our business from entities located outside of North America. Additionally, some of our ride manufacturers may be located in foreign countries or may utilize components or materials manufactured or sourced from foreign countries. Our business exposes us to risks associated with global commerce, including changes to tariffs, quotas and other restrictions on imports. While existing tariffs and duties have not had a material impact on our business, the U.S. government may impose additional tariffs on thousands of products sourced from foreign countries and has expressed a willingness to impose additional or increased tariffs on goods imported from China, including many items that we purchase for our business. While the impact has been immaterial to date, tariffs or duties could lower our gross margin on impacted products. Additionally, even if the products that we import are not affected directly by tariffs or other duties, the imposition of such additional tariffs on goods imported into the United States could cause increased pricing of other consumer goods, which could lower the discretionary income of our potential guests and decrease attendance or in-park spending.
We may be subject to claims for infringing the intellectual property rights of others, which could be costly and result in the loss of intellectual property rights.
We cannot be certain that we do not and will not infringe the intellectual property rights of others. We have been in the past, and may be in the future, subject to litigation and other claims in the ordinary course of our business based on allegations of infringement or other violations of the intellectual property rights of others. Regardless of their merits, intellectual property claims can divert the efforts of our personnel and are often time-consuming and expensive to litigate or settle. In addition, to the extent claims against us are successful, we may have to pay substantial monetary damages or discontinue, modify, or rename certain products or services that are found to be in violation of another party’s rights. We may have to seek a license (if available on acceptable terms, or at all) to continue offering products and services, which may increase our operating expenses.
Risks Related to Proposed Mergers
The proposed Mergers and the integration of Cedar Fair and Six Flags may be more difficult, costly or time-consuming than expected, and we may fail to realize the anticipated benefits of the Mergers.
The success of the proposed Mergers will depend in part on our ability to realize anticipated revenue and cost synergies and on our ability to successfully integrate the businesses. If we are not able to successfully achieve these objectives, the anticipated benefits of the Mergers may not be realized fully, or at all, or may take longer to realize than expected. In addition, our ability to achieve the goals for the proposed Mergers may be affected by future prospects, execution of business strategies, and our ability to manage the various factors discussed within this report, including within the forward-looking statements. The actual benefits of the proposed Mergers also could be less than anticipated if, for example, completion of the Mergers and/or integration of the businesses are more difficult, costly or time-consuming than we expect.
The market price of CopperSteel's common stock following the closing of the Mergers may be affected by factors different from those that historically have affected or currently affect our common stock.
Upon completion of the Mergers, CopperSteel's financial position may differ from each of Six Flags' and Cedar Fair's financial positions before the completion of the Mergers, and the results of operations of CopperSteel may be affected by factors that are different from those currently affecting the results of operations of each of Six Flags and Cedar Fair. Accordingly, the market price and performance of CopperSteel's common stock is likely to be different from the performance of our common stock prior to the closing of the Mergers.
We have incurred and expect to continue to incur substantial costs, fees, expenses, and charges related to the Mergers and integration, and may incur additional costs we do not currently anticipate.
We have incurred $15.4 million of costs, fees expenses, and charges related to the Mergers and integration and we expect to continue to incur additional costs, fees, expenses, and charges related to the Mergers and integration. We may incur additional costs that we do not currently anticipate. These costs include and may include legal, financial advisory, accounting, consulting and other advisory fees, retention, severance and employee benefit-related costs, public company filing fees and other regulatory fees, as well as closing, integration and other related costs. Some of the costs are payable regardless of whether or not the Mergers are completed.
We may be unable to retain personnel successfully while the Mergers are pending or after the Mergers are completed.
The success of the Mergers will depend in part on our ability to retain key employees while the Mergers are pending or after the Mergers are consummated. If we are unable to retain key employees, including management, who are critical to the successful completion, integration and future operation of CopperSteel, we could face disruption in our operations, loss of key information, expertise or know-how, or unanticipated recruiting costs, which may impact our ability to achieve our goals related to the transaction.
The announcement or completion of the proposed Mergers may disrupt and/or harm our current plans and operations or those of Cedar Fair, may divert management’s time and attention and may affect existing business relationships, any of which may impact financial performance, operating results and/or our ability to achieve the benefits of the Mergers.
The announcement or completion of the proposed Mergers may disrupt and/or harm our current plans and operations and/or those of Cedar Fair. Management’s time and attention also may be diverted on transaction-related issues. There also may be adverse reactions to or changes in business relationships as a result of the announcement or completion of the Mergers. Any of these factors
could affect our and/or Cedar Fair’s financial performance or operating results, and/or could impact our ability to achieve the benefits of the Mergers.
Regulatory approvals may not be received, may take longer than expected, or may impose conditions that are not presently anticipated or that affect the anticipated benefits of the Mergers.
Before the Mergers may be completed, various approvals, consents and non-objections must be obtained from regulatory authorities in the United States and Mexico. These approvals could be delayed or not obtained at all, which could disrupt operations, or could delay or adversely affect completion of the Merger. In Mexico, on January 25, 2024, the Mexican Federal Competition Commission concluded its review of the transactions and determined to allow the transactions to proceed as proposed, subject to customary statutory requirements. On January 22, 2024, Six Flags and Cedar Fair each received a request for additional information and documentary materials (a “Second Request”) from the DOJ in connection with the DOJ’s review of the Mergers. The effect of a Second Request is to extend the waiting period imposed by the HSR Act, until 30 days after each of Six Flags and Cedar Fair has substantially complied with the Second Request issued to it, unless that period is extended voluntarily by the parties or terminated earlier by the DOJ. The Second Request, and any further inquiries or actions from the DOJ, could have the effect of substantially delaying, imposing restrictions on, or impeding or precluding the completion of the proposed Mergers. In deciding whether to grant antitrust clearance, the DOJ will consider the effect of the Mergers on competition and take such action under the antitrust laws as it deems necessary or desirable in the public interest. The DOJ may take steps to prevent the Mergers, or the approvals that are granted may impose terms and conditions, including requiring the parties to seek divestitures of substantial assets, limitations, obligations or costs, or place restrictions on the conduct of CopperSteel's business or require changes to the terms of the transactions contemplated by the Merger Agreement, which could affect the anticipated benefits of the Mergers.
The Merger Agreement may be terminated in accordance with its terms, and the Mergers may not be completed, which could negatively impact our business, financial results, and/or unit price.
The Merger Agreement is subject to a number of conditions which must be satisfied or waived in order to complete the Mergers, including approval of Six Flags' stockholders. If the Mergers are not completed or are delayed for any reason, there may be adverse consequences and we may experience negative reactions from investors, the financial markets, our customers, our vendors and/or our employees.
The Merger Agreement subjects Six Flags and Cedar Fair to restrictions on their respective business activities prior to the closing of the Mergers.
The Merger Agreement subjects Six Flags and Cedar Fair to restrictions on their respective business activities prior to the closing of the Mergers. The Merger Agreement obligates each of Six Flags and Cedar Fair to generally conduct its businesses in the ordinary course until the closing and to use its reasonable best efforts to (i) preserve intact their current business organizations, (ii) preserve their assets and properties in good repair and condition and (iii) keep available the services of their current officers and other key employees and preserve their relationships with those having business dealings with Six Flags and Cedar Fair. These restrictions could prevent Six Flags and Cedar Fair from pursuing certain business opportunities that arise prior to the closing and are outside the ordinary course of business.
The Merger Agreement limits Six Flags’ ability to pursue alternative transaction proposals, which may discourage other companies from making a favorable alternative transaction proposal and, in specified circumstances, could require Six Flags to pay Cedar Fair a termination fee.
The Merger Agreement contains certain provisions that restrict Six Flags’ ability to solicit, initiate or knowingly encourage (including by way of furnishing information), or take any other action designed to facilitate, any inquiries or the making of competing alternative transaction proposals. Such competing alternative transaction proposals include proposals by third-parties involving, among other things (an “Alternative Transaction”): any transaction or series of transactions which result in the acquisition of more than 20% of the outstanding equity or voting power of Six Flags; any merger, consolidation, share exchange or similar transaction resulting in the acquisition or, or acquisition of control over, assets or business representing 20% or more of the consolidated revenues, net income or assets of Six Flags and any transaction resulting in the disposition of assets representing 20% or more of the consolidated revenues, net income or assets of Six Flags. Furthermore, under the terms of the Merger Agreement, our Board is not permitted to (i) withdraw, qualify, modify or propose to take such actions, in a manner adverse to Cedar Fair, its recommendation with respect to the Merger Agreement Proposal or (ii) recommend or approve, or propose to take such actions, an Alternative Transaction proposal, subject to certain exceptions for actions taken in good faith in connection with a superior transaction proposal or intervening event to the extent necessary to satisfy its fiduciary duties under applicable law.
Additionally, we are subject to restrictions on our ability to participate in any discussions or negotiations, or cooperate with any third parties with respect to any inquiries regarding, or the making of, any proposal that would constitute an Alternative Transaction, subject to certain exceptions under the Merger Agreement. The Merger Agreement further provides that, under specified circumstances, including after receipt of certain alternative acquisition proposals, Six Flags may be required to pay Cedar Fair a cash termination fee equal to $63.2 million.
These provisions could discourage a potential third-party acquirer or other strategic transaction partner that might have an interest in acquiring all or a significant portion of Six Flags from considering or pursuing an Alternative Transaction with Six Flags or proposing such a transaction, even if it were prepared to pay consideration with a higher per share value than the total value proposed to be paid or received in the Mergers. These provisions might also result in a potential third-party acquirer or other strategic transaction partner proposing to pay a lower price than it might otherwise have proposed to pay because of the added expense of the termination fee that may become payable in certain circumstances.
Litigation relating to the proposed Mergers may be filed against Cedar Fair, us and/or each entity's board of directors that could prevent or delay the closing and/or result in the payment of damages.
In connection with the proposed Mergers, it is possible that the Cedar Fair unitholders and/or the stockholders of Six Flags may file lawsuits against Cedar Fair, us and/or each entity's board of directors. Among other remedies, these unitholders and/or stockholders could seek damages and/or to enjoin the Mergers. Any such potential lawsuits could prevent or delay the closing and/or result in substantial costs to us. The outcome of any such actions would be uncertain and may create uncertainty relating to the Mergers and may be costly and distracting to management. Further, the defense or settlement of any lawsuit or claim that remains unresolved at the time of the Mergers may adversely affect our business, financial condition, results of operations and cash flows or those of CopperSteel.
Six Flags Stockholders as of immediately prior to the Mergers will have reduced ownership in CopperSteel.
Following the closing of the proposed Mergers, Six Flags’ existing stockholders are expected to own approximately 48.8% of the issued and outstanding shares of CopperSteel and Cedar Fair’s existing unitholders are expected to own approximately 51.2% of the issued and outstanding shares of CopperSteel, in each case on a fully diluted basis. As a result, existing Six Flags Stockholders will have less influence on the policies of CopperSteel than they currently have on the policies of Six Flags.
Due to the proposed Mergers, CopperSteel's future ability to use net operating losses to offset future taxable income may be restricted and these net operating losses could expire or otherwise be unavailable.
Due to the proposed merger with Cedar Fair, CopperSteel’s ability to use net operating losses to offset future taxable income [will be/may be] restricted and these net operating losses (“NOLs”) could expire or otherwise be unavailable. In general, under Section 382 of the Code and corresponding provisions of state law, a corporation that undergoes an “ownership change” is subject to limitations on its ability to utilize its pre-change NOLs to offset future taxable income. For these purposes, an ownership change generally occurs where the aggregate stock ownership of one or more stockholders or groups of stockholders who owns at least 5% of a corporation’s stock increases its ownership by more than 50 percentage points over its lowest ownership percentage within a specified testing period. [Prior to the Mergers, some of Six Flags’ existing NOLs were subject to limitations.] Following the Mergers, CopperSteel’s ability to use NOLs may be subject to [further] limitations and CopperSteel may not be able to fully use these NOLs to offset future taxable income. There is also a risk that, due to regulatory changes or for other unforeseen reasons, existing NOLs could expire or otherwise be unavailable to offset future income tax liabilities. In addition, the U.S. Tax Cuts and Jobs Act of 2017(the “Tax Act”) resulted in a reduction in the economic benefit of the NOLs and other deferred tax assets available to us. Under the Tax Act, US federal NOLs generated after December 31, 2017 will not be subject to expiration.
ITEM 1B.UNRESOLVED STAFF COMMENTS
We have received no written comments regarding our periodic or current reports from the staff of the SEC that were issued 180 days or more preceding the end of our
20222023 fiscal year and that remain unresolved.
ITEM 1C. CYBERSECURITY
We appreciate the importance of cybersecurity in maintaining the trust and confidence of our guests, employees, and business partners, and we are committed to upholding the highest standards of network and data security throughout our operations to protect our
various stakeholders. Our cybersecurity risk management program is integrated into our overall enterprise-level risk management system and shares common communications channels and response processes that apply to other legal, compliance and operational risk areas addressed by our enterprise-level risk management program. Our technology infrastructure and information systems are central to our sales of admissions products, such as single day tickets, season passes, and Six+ memberships, as well as in-park offerings of food, beverages and merchandise. We also use our technology platforms to interact with suppliers and make payments. Our technology infrastructure and information systems also forms the foundation for our accounting and finance systems and our disclosure and accounting control environment. Our internally developed technology systems, as well as those we license from third-parties, could each face breaches from cybersecurity threats. These threats include terrorist or hacker attacks, the introduction of malicious computer viruses, ransomware, theft of intellectual property or other security breaches. Such attacks have become increasingly sophisticated, and we expect that will continue to evolve as threat actors increase their use of artificial intelligence and machine-learning technologies.
To protect against cybersecurity threats to our business, our Board of Directors and management team take a comprehensive approach to cybersecurity risk management as part of our overall enterprise-level risk management program. Our Board and our management actively oversee the management of cybersecurity risks and have established processes for identifying, assessing and managing material risks from cybersecurity threats.
We design and assess our cybersecurity risk management program in accordance with National Institute of Standards (NIST) standards and guidelines to protect all proprietary and guest data. Key components of our cybersecurity risk management program include the following:
Mandatory Cyber Training – All Six Flags team members complete a mandatory Cybersecurity Training during the onboarding process on how to identify, assess, and manage risks from cybersecurity threats. Mandatory ongoing cybersecurity training is also conducted throughout the year for all team members.
Response Readiness and Incident Response Plan – we have developed a comprehensive Incident Response Plan which documents and describes our Cybersecurity Response Readiness and includes detailed procedures to help guide our team members in the event of a Cybersecurity Incident. This includes incident response report templates, which are readily available to document and report to management on incident response activities. The response plan details processes, responsibilities, escalations and other communication channels for reporting, evaluating and responding to cybersecurity incidents. Reporting paths range from addressing an incident within our IT team to escalating incidents to our Audit Committee and to our board of directors, as appropriate.
Internal and External Penetration Testing – we conduct regular Internal and External Penetration Testing to identify and assess network security vulnerabilities. Six Flags IT evaluates and remediates vulnerabilities based upon business impact and exploitability.
Vulnerability Scanning and Automated Cyber Risk Management and Compliance – we conduct monthly proactive vulnerability scanning to detect and address security weaknesses within IT systems. We have partnered with a third-party solution to identify and provide visibility and insight into existing risks. The solution collects data from our vulnerability scanning process to identify and analyze risks, prioritize remediation based upon business goals, and provide robust reporting and visual dashboards.
Disaster Recovery Plan – our Disaster Recovery Plan is documented to provide guidance and outline processes used to recover or continue operations of critical IT infrastructure, and systems in the event of natural or human disasters.
Third-Party Security Risk Management – we use a Vendor Risk Management Questionnaire to document third-party vendors’ security controls and governance policies. The questionnaire allows us to systematically assess risk which may be introduced by third-party vendors and ensures alignment with our security and compliance standards.
As of the date of this Annual Report on Form 10-K, the Company has not experienced any material cybersecurity incidents and we are not aware of any cybersecurity risks that are reasonably likely to materially affect the Company. However, we face ongoing risks of cybersecurity threats that, if realized, could result in the loss of sensitive business or customer information, disruption to our systems and operations, expose us to litigation and reputational risk and adversely affect our guests, employees or business partners. For additional information on the risks we face from cybersecurity threats, see Item 1A.Risk Factors – “Cyber-attacks could have a disruptive effect on our business.”
Cybersecurity Governance
Our Audit Committee has primary oversight of the Company’s information security programs, including cybersecurity. Our internal audit department, together with third parties that we engage, report to our Audit Committee and audit the Company’s information security programs. Our Chief Digital Officer, who oversees our information security training and awareness program, also updates the Audit Committee on a quarterly basis regarding information security matters. Our Audit Committee and Chief Digital Officer also provide the full Board of Directors with updates no less than annually, relating to information security and cybersecurity risks. These updates include
a review of the appropriateness of our various procedures related to the security of our network and data, as well as the evaluation of new and existing technologies and their effectiveness in meeting our business objectives.
Finally, management and other departments involved in our cybersecurity program participate in industry groups related to cybersecurity risk management and our IT Security Team employs third party services to gain independent perspectives of our cybersecurity program. For example, our IT Security Team belongs to various Cybersecurity Threat Advisory Committees to keep up to date on the latest threats and vulnerabilities. Technical details regarding risks and exposures associated to vulnerabilities are shared via subscription emails by these committees. In addition, we conduct annual Third-Party Posture Assessments to review the security processes and procedures that we have in place. The assessment is an unbiased review which provides credibility and trust in regards to Six Flags security posture. We also ensure our Payment Card Industry (PCI) compliance by working extensively with an external independent advisor to review and audit our systems, security measures and processes to protect cardholder data. We maintain cybersecurity insurance that we believe is appropriate for the size and complexity of our business which provides protection against the potential losses arising from a cybersecurity incident. However, there is no guarantee that our insurance coverage limits will sufficiently protect us against any future claims.
Set forth below is a brief description of our material real estate as of
January 1,December 31, 2023. See also "Business—Description of Parks."
| ● | •Six Flags America, Largo, Maryland—523 acres (owned) •Six Flags Discovery Kingdom, Vallejo, California—151 acres (owned) •Six Flags Fiesta Texas, San Antonio, Texas—218 acres (owned) •Six Flags Great Adventure & Safari and Hurricane Harbor, Jackson, New Jersey—2,116 acres (owned) •Six Flags Great America and Hurricane Harbor Chicago, Gurnee, Illinois—297 acres (owned) •Six Flags Hurricane Harbor, Arlington, Texas—47 acres (owned) •Six Flags Hurricane Harbor, Valencia, California—12 acres (owned) •Six Flags Hurricane Harbor, Oaxtepec, Mexico—67 acres (leasehold interest)(1) •Six Flags Magic Mountain, Valencia, California—255 acres (owned) •Six Flags Mexico, Mexico City, Mexico—110 acres (leased and occupied pursuant to a permit agreement)(2) •Six Flags New England, Agawam, Massachusetts—289 acres (owned) •Six Flags Over Georgia, Austell, Georgia—291 acres (leasehold interest)(3) •Six Flags Over Texas, Arlington, Texas—217 acres (leasehold interest)(3) •Six Flags St. Louis, Eureka, Missouri—316 acres (owned) •Six Flags White Water Atlanta, Marietta, Georgia—69 acres (owned)(4) •La Ronde, Montreal, Canada—146 acres (leasehold interest)(5) •The Great Escape and Lodge, Queensbury, New York—372 acres (owned) •Six Flags Hurricane Harbor Concord, Concord, California—24 acres (leasehold)(6) •Six Flags Darien Lake, Corfu, New York—988 acres (leasehold)(7) •Frontier City, Oklahoma City, Oklahoma—109 acres (leasehold)(7) •Six Flags Hurricane Harbor Oklahoma City, Oklahoma City, Oklahoma—23 acres (leasehold)(7) •Six Flags Hurricane Harbor Phoenix, Glendale, Arizona—33 acres (leasehold)(8) •Six Flags Hurricane Harbor Splashtown, Spring, Texas—46 acres (leasehold)(7) •Six Flags Hurricane Harbor Rockford, Rockford, IL—43 acres (leasehold)(9) |
| ● | Six Flags Discovery Kingdom, Vallejo, California—151 acres (owned) |
| ● | Six Flags Fiesta Texas, San Antonio, Texas—218 acres (owned) |
| ● | Six Flags Great Adventure & Safari and Hurricane Harbor, Jackson, New Jersey—2,116 acres (owned) |
| ● | Six Flags Great America and Hurricane Harbor Chicago, Gurnee, Illinois—297 acres (owned) |
| ● | Six Flags Hurricane Harbor, Arlington, Texas—47 acres (owned) |
| ● | Six Flags Hurricane Harbor, Valencia, California—12 acres (owned) |
| ● | Six Flags Hurricane Harbor, Oaxtepec, Mexico—67 acres (leasehold interest)(1) |
| ● | Six Flags Magic Mountain, Valencia, California—255 acres (owned) |
| ● | Six Flags Mexico, Mexico City, Mexico—110 acres (leased and occupied pursuant to a permit agreement)(2) |
| ● | Six Flags New England, Agawam, Massachusetts—289 acres (owned) |
| ● | Six Flags Over Georgia, Austell, Georgia—291 acres (leasehold interest)(3) |
| ● | Six Flags Over Texas, Arlington, Texas—217 acres (leasehold interest)(3) |
| ● | Six Flags St. Louis, Eureka, Missouri—316 acres (owned) |
| ● | Six Flags White Water Atlanta, Marietta, Georgia—69 acres (owned)(4) |
| ● | La Ronde, Montreal, Canada—146 acres (leasehold interest)(5) |
| ● | The Great Escape and Lodge, Queensbury, New York—372 acres (owned) |
| ● | Six Flags Hurricane Harbor Concord, Concord, California—24 acres (leasehold)(6) |
| ● | Six Flags Darien Lake, Corfu, New York—988 acres (leasehold)(7) |
| ● | Frontier City, Oklahoma City, Oklahoma—109 acres (leasehold)(7) |
| ● | Six Flags Hurricane Harbor Oklahoma City, Oklahoma City, Oklahoma—23 acres (leasehold)(7) |
| ● | Six Flags Hurricane Harbor Phoenix, Glendale, Arizona—33 acres (leasehold)(8) |
| ● | Six Flags Hurricane Harbor Splashtown, Spring, Texas—46 acres (leasehold)(7) |
| ● | Six Flags Hurricane Harbor Rockford, Rockford, IL—43 acres (leasehold) (9) |
| (1) | The site is leased from the Mexican Social Security Institute. The lease expires in 2036. The water park opened to the public in 2017. |
| (2) | The permit agreement is with the Federal District of Mexico City. The agreement expires in 2024 and the Company intends to seek renewal. |
| (3) | Lessor is the limited partner of the partnership that owns the park. The SFOG and SFOT leases expire in 2027 and 2028, respectively, at which time we have the option to acquire all of the interests in the respective lessor that we have not previously acquired. |
| (4) | Owned by the Georgia partnership. |
| (5) | The site is leased from the City of Montreal. The lease expires in 2065. |
| (6) | The site is leased from EPR Parks, LLC pursuant to a sublease that expires in 2035 or the earlier expiration of the ground lease. We began operating the water park in 2017. |
| (7) | These sites are leased from EPR Parks, LLC pursuant to a lease that expires in 2037. We began operating these parks in 2018. |
| (8) | This site is leased from EPR Parks, LLC pursuant to a lease that expires in 2033. We began operating the water park in 2018. |
| (9) | This site is leased from the Rockford Park District. The lease expires in 2029. We began operating the water park in 2019. |
(1)The site is leased from the Mexican Social Security Institute. The lease expires in 2036. The water park opened to the public in 2017.
(2)The permit agreement is with the Federal District of Mexico City. The agreement expires in 2034..
(3)Lessor is the limited partner of the partnership that owns the park. The SFOG and SFOT leases expire in 2027 and 2028, respectively, at which time we have the option to acquire all of the interests in the respective lessor that we have not previously acquired.
(4)Owned by the Georgia partnership.
(5)The site is leased from the City of Montreal. The lease expires in 2065.
(6)The site is leased from EPR Parks, LLC pursuant to a sublease that expires in 2035 or the earlier expiration of the ground lease. We began operating the water park in 2017.
(7)These sites are leased from EPR Parks, LLC pursuant to a lease that expires in 2037. We began operating these parks in 2018.
(8)This site is leased from EPR Parks, LLC pursuant to a lease that expires in 2033. We began operating the water park in 2018.
(9)This site is leased from the Rockford Park District. The lease expires in 2029. We began operating the water park in 2019.
In addition to the foregoing, we also lease a limited number of rides and attractions at our parks and office space. See Note 16 -Leases, to the consolidated financial statements in Item 8 of this Annual Report for a discussion of lease commitments. We consider our properties to be well maintained, in good condition and adequate for their present uses and business requirements. We have granted to our lenders under the Credit AgreementFacility and the collateral agent under the indenture governing the 2025 Notes, a mortgage on substantially all of our owned United States properties.
The Company and its subsidiaries are from time-to-time engaged in routine legal proceedings incidental to our business. Information regarding our material legal proceedings is included in Note 15 - Commitments and Contingencies, to the consolidated financial statements in Item 8 of this Annual Report, which is incorporated herein by reference. While certain legal proceedings and related indemnification obligations to which we are a party specify the amounts claimed, these claims may not represent reasonably possible losses. Given the inherent uncertainties of litigation, the ultimate outcome of these matters cannot be predicted at this time, nor can the amount of possible loss or range of loss, if any, be reasonably estimated, except in circumstances where an aggregate litigation accrual has been recorded for probable and reasonably estimable loss contingencies. A determination of the amount of accrual required, if any, for these contingencies is made after careful analysis of each matter. The required accrual may change in the future due to new information or developments in each matter or changes in approach such as a change in settlement strategy in dealing with these matters. See Risk Factors – “Adverse litigation judgments or settlements resulting from legal proceedings in which we may be involved in the normal course of our business could adversely affect our financial condition or results of operations.”
ITEM 4.MINE SAFETY DISCLOSURES
ITEM 5. MARKET FOR THE REGISTRANT’S COMMON EQUITY, RELATED STOCKHOLDER MATTERS AND ISSUER PURCHASES OF EQUITY SECURITIES
Market Information and Record Holders
Holdings’
Our common stock is listed on the New York Stock Exchange under the ticker symbol "SIX." As of
March 3, 2023,February 26, 2024, the most recent practicable date prior to the filing of this Annual Report, there were approximately
292296 stockholders of record of Holdings’ common stock. This does not reflect holders who beneficially own common stock held in nominee or street name accounts through brokers or banks.
We did not pay any dividends during the year ended
January 1,December 31, 2023. We have met the terms required under the 2020 amendments to the
Second Amended and Restated Credit
AgreementFacility which dictated the suspension of the repurchase of
Holdings’ common stock and payment of dividends.
WeOther than with respect to the Special Dividend to be paid in connection with the Mergers, the payment of which is contingent upon the consummation of the Mergers, we may continue to determine that it is prudent to continue suspending payments of dividends despite completion of the terms required under the 2020 amendments to the
Second Amended and Restated Credit
Agreement. We repurchased shares of Holdings’ common stock under previously approved repurchase plans during the year ended January 1, 2023.Facility.
Issuer Purchases of Equity Securities
On March 30, 2017,
Holdingswe announced that
itsour Board of Directors approved a
new stock repurchase plan that permits
Holdingsus to repurchase an incremental $500.0 million in shares of
Holdings’our common stock (the "March 2017 Stock Repurchase Plan"). As of
March 3, 2023, HoldingsFebruary 26, 2024, we had repurchased 8,071,000 shares at a cumulative cost of approximately $365.1 million and an average price per share of $45.24 under the March 2017 Stock Repurchase Plan, leaving approximately $134.9 million available for permitted repurchases.
The following graph shows a comparison of the five-year cumulative total stockholder return on Holdings’our common stock (assuming all dividends were reinvested), The Standard & Poor’s ("S&P") 500 Stock Index, The S&P Midcap 400 Index and The S&P Entertainment Movies & Entertainment Index. The stock price performance shown in the graph is not necessarily indicative of future price performance.

| | | | | | | | |
*$100 invested on 12/31/18 in stock or index, including reinvestment of dividends. Fiscal year ending December 31. Copyright© 2024 Standard & Poor's, a division of S&P Global. All rights reserved. |
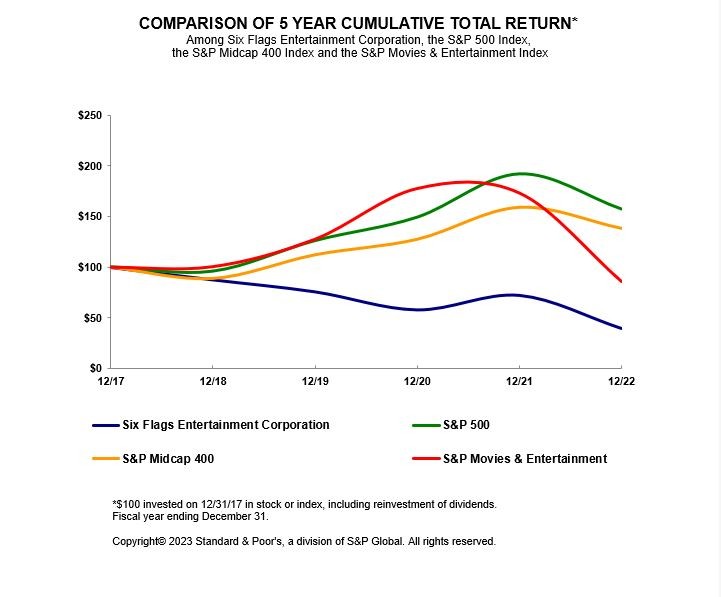
| | | | | | | | | | | | |
| | 12/31/2017 | | 12/31/2018 | | 12/31/2019 | | 12/31/2020 | | 1/2/2022 | | 1/1/2023 |
Six Flags Entertainment Corporation | | 100.00 | | 87.71 | | 75.83 | | 57.93 | | 72.33 | | 39.49 |
S&P 500 | | 100.00 | | 95.62 | | 125.72 | | 148.85 | | 191.58 | | 156.89 |
S&P Midcap 400 | | 100.00 | | 88.92 | | 112.21 | | 127.54 | | 159.12 | | 138.34 |
S&P Movies & Entertainment | | 100.00 | | 100.61 | | 127.49 | | 177.31 | | 172.95 | | 86.08 |
| | | | | | | | | | | | | | | | | | | | | | | | | | | | | | | | | | | |
| 12/31/2018 | | 12/31/2019 | | 12/31/2020 | | 1/2/2022 | | 1/1/2023 | | 12/31/2023 |
| Six Flags Entertainment Corporation | 100.00 | | | 86.46 | | | 66.04 | | | 82.47 | | | 45.03 | | | 48.57 | |
| S&P 500 | 100.00 | | | 131.49 | | | 155.68 | | | 200.37 | | | 164.08 | | | 207.21 | |
| S&P Midcap 400 | 100.00 | | | 126.20 | | | 143.44 | | | 178.95 | | | 155.58 | | | 181.15 | |
| S&P Movies & Entertainment | 100.00 | | | 126.72 | | | 176.24 | | | 171.91 | | | 85.56 | | | 112.15 | |
ITEM 7. MANAGEMENT’S DISCUSSION AND ANALYSIS OF FINANCIAL CONDITION AND RESULTS OF OPERATIONS
Significant components of the Management’s Discussion and Analysis of Financial Condition and Results of Operations section include:
| ● | Overview. The overview section provides a summary of Six Flags and the principal factors affecting our results of operations.
|
| ● | Critical Accounting Policies. The critical accounting policies section provides detail with respect to accounting policies that are considered by management to require significant judgment and use of estimates and that could have a significant impact on our financial statements. |
| ● | Recent Events. The recent events section provides a brief description of recent developments at the Company. |
| ● | Results of Operations. The results of operations section provides an analysis of our results for the years ended January 1, 2023, and January 2, 2022 and a discussion of items affecting the comparability of our financial statements for those years. Please refer to the results of operations section described in “Item 7. Management’s Discussion and Analysis of Financial Condition and Results of Operations” set forth in our Annual Report on Form 10-K for the year ended January 2, 2022, for our discussion and analysis of our results for the years ended January 2, 2022 and December 31, 2020 and a discussion of items affecting the comparability of our financial statements for those years. |
| ● | Liquidity, Capital Commitments and Resources. The liquidity, capital commitments and resources section provides a discussion of our cash flows for the year ended January 1, 2023, and our outstanding debt and commitments existing as of January 1, 2023. |
| ● | Market Risks and Security Analyses. We are principally exposed to market risk related to interest rates and foreign currency exchange rates, which are described in the market risks and security analyses section. |
| ● | Recently Issued Accounting Pronouncements. This section provides a discussion of recently issued accounting pronouncements applicable to Six Flags, including a discussion of the impact or potential impact of such standards on our financial statements when applicable. |
The following discussion and analysis contains forward-looking statements relating to future events or our future financial performance, which involve risks and uncertainties. Our actual results could differ materially from those anticipated in these forward-looking statements. Please see the discussion regarding forward-looking statements included under the caption "Cautionary"Cautionary Note Regarding Forward-Looking Statements"Statements" and "Item"Item 1A. Risk Factors"Factors" for a discussion of some of the uncertainties, risks and assumptions associated with these statements.
The following discussion and analysis presents information that we believe is relevant to an assessment and understanding of our consolidated balance sheets and results of operations. This information should be read in conjunction with the consolidated financial statements and the notes thereto in Item 8 of this Annual Report. Please refer to the results of operations section described in “Item 7. Management’s Discussion and Analysis of Financial Condition and Results of Operations” set forth in our Annual Report on Form 10-K for the year ended January 1, 2023, for our discussion and analysis of our results for the years ended January 1, 2023 and January 2, 2022 and a discussion of items affecting the comparability of our financial statements for those years.
Use of Certain Per Capita Metrics
We use certain per capita metrics that are non-GAAP measures of the performance of our business on a per guest basis and believe that these metrics provide relevant and useful information for investors because they assist in comparing our operating performance on a consistent basis, make it easier to compare our results with those of other companies and our industry and allows investors to review performance in the same manner as our management.
| ● | •Total guest spending per capita is the total revenue generated from our guests, on a per guest basis, through admission and in-park spending. Total guest spending per capita is calculated by dividing the sum of park admissions and park food, merchandise and other revenue by total attendance. •Admissions spending per capita is the total revenue generated from our guests, on a per guest basis, to enter our parks. Admissions spending per capita is calculated by dividing park admission revenue by total attendance. •In-park spending per capita is the total revenue generated from our guests, on a per guest basis, on items sold within our parks, such as food, games and merchandise. In-park spending per capita is calculated by dividing food, merchandise and other revenue by total attendance. |
| ● | Admissions revenue per capita is the total revenue generated from our guests, on a per guest basis, to enter our parks. Admissions revenue per capita is calculated by dividing park admission revenue by total attendance. |
| ● | In-park revenue per capita is the total revenue generated from our guests, on a per guest basis, on items sold within our parks, such as food, games and merchandise. In-park revenue per capita is calculated by dividing food, merchandise and other revenue by total attendance. |
Overview
We are the largest regional theme park operator in the world and the largest operator of water parks in North America based on the number of parks we operate. Of our 27 regional theme and water parks, 24 are located in the United States, two parks are located in Mexico and one is located in Montreal, Canada. Our parks are located in geographically diverse markets across North America and generally offer a broad selection of state-of-the-art and traditional thrill rides, water attractions, themed areas, concerts and shows, restaurants, game venues and retail outlets, thereby providing a complete family-oriented entertainment experience. We work continuously to improve our parks and our guests’ experiences and to meet our guests’ evolving needs and preferences.
Our revenue is derived from (i) the sale of tickets for entrance to our parks (which accounted for approximately 52%, 54% and 53% of total revenue for the yearsyear ended December 31, 2023, January 1, 2023 and January 2, 2022, and approximately 57% of total revenue during the years ended December 31, 2020)respectively),(ii) the sale of food and beverages, merchandise, games and attractions, parking and other services inside our parks (which accounted for approximately 42%43%, 44%42% and 35%44% in total revenue for the years ended December 31, 2023, January 1, 2023 and January 2, 2022, and December 31, 2020, respectively), and (iii) sponsorship, international agreements and accommodations (which accounted for approximately 4%5%, 3%4% and 8%3% for the years ended December 31, 2023, January 1, 2023 and January 2, 2022, and December 31, 2020, respectively).Revenue from ticket sales and in-park sales are primarily impacted by park attendance and spending per capita. During 2022, attendance decreased 26% due to increased pricing and the elimination of free tickets and heavily discounted product offerings. Revenue decreased by 9% as lower attendance was offset by higher realized prices on admissions products and a higher mix of single day tickets. The increase in In-park spending per capita was due to many of the Company’s in-park pricing initiatives, in-park offerings and a higher mix of single-day ticket guests, who tend to spend more than season pass holders and members on a per visit basis. Revenue from sponsorship, international agreements and accommodations can be impacted by the term, timing and extent of services and fees under these arrangements, which can result in fluctuations from year to year.
During the year ended January 1, 2023, our earnings from park operations excluding the impact of interest, taxes, depreciation, amortization and any other non-cash income or expenditures decreased from prior year, as a result of lower revenue partially offset by a reduction in expenses.
Our principal costs of operations include salaries and wages, employee benefits, advertising, third party services, repairs and maintenance, utilities, rent and insurance. A large portion of our expenses is relatively fixed as our costs for full-time employees, maintenance, utilities, rent, advertising and insurance do not vary significantly with attendance. We anticipate that
Recent Events
On November 2, 2023, Holdings, Cedar Fair, CopperSteel and Copper Merger Sub entered into the tight labor marketMerger Agreement, providing for a merger of equals through (i) the merger of Copper Merger Sub with and recent increasesinto Cedar Fair (the “Cedar Fair First Merger”), with Cedar Fair continuing its existence as the surviving entity (the “Cedar Fair Surviving Entity”) following the Cedar Fair First Merger as a direct subsidiary of CopperSteel, (ii) the subsequent merger of the Cedar Fair Surviving Entity with and into CopperSteel (the “Cedar Fair Second Merger” and together with the Cedar Fair First Merger, the “Cedar Fair Mergers”), with CopperSteel continuing as the surviving corporation, and (iii) the subsequent merger of Six Flags with and into CopperSteel, with CopperSteel continuing as the surviving corporation (the “Six Flags Merger” and together with the Cedar Fair Mergers, the “Mergers”).If the Mergers are completed, subject to certain exceptions, (i) each issued and outstanding unit of limited partnership interest in Cedar Fair (each a “Cedar Fair Unit” and collectively, the “Cedar Fair Units”) will be converted into the right to receive one (1) share of common stock, par value $0.01 per share, of CopperSteel (the “CopperSteel Common Stock”), as may be adjusted pursuant to the minimum wage ratesMerger Agreement (the “Cedar Fair Exchange Ratio”), together with cash in lieu of fractional shares of CopperSteel Common Stock, without interest and (ii)each issued and outstanding share of Holdings common stock, par value $0.025 per share (the “Six Flags Common Stock”) will increase our salary, wagebe converted into the right to receive 0.58 shares of CopperSteel Common Stock (as the same may be adjusted pursuant to the Merger Agreement, the “Six Flags Exchange Ratio”), together with cash in lieu of fractional shares of CopperSteel Common Stock, without interest. Subject to the terms of the Merger Agreement and benefit expenses inapplicable law, Six Flags will declare and set a record date for a special dividend to holder of record of Six Flags Common Stock as of the close of business one business day prior to the closing of the Mergers of (i) $1.00 plus (ii) the product (rounded to the nearest whole cent) of (a) the Six Flags Exchange Ratio and (ii) the aggregate amount of distributions per unit declared or paid by Cedar Fair with respect to a Cedar Fair Unit with a record date following November 2, 2023 and future years. Further legislative changesprior to the effective time of the Six Flags Merger, subject to certain adjustments provided under the Merger Agreement, the payment of which is contingent upon the consummation of the Mergers.
Upon consummation of the Mergers, Holdings and competitive wage rate pressure could cause these expensesCedar Fair will each have been merged with and into CopperSteel, with CopperSteel as the parent entity and successor corporation to continueHoldings and Cedar Fair. Upon closing, CopperSteel will be headquartered in Charlotte, North Carolina, and is expected to increasechange its name to “Six Flags Entertainment Corporation” and be listed on the New York Stock Exchange (“NYSE”) under the ticker symbol “FUN.”
The obligations of Holdings and Cedar Fair to complete the Mergers are subject to the satisfaction or waiver, in whole or in part (to the extent permitted by applicable law) of a number of conditions set forth in the future.Recent Events
On January 31, 2023, the BoardMerger Agreement, a copy of Directors of the Company (the “Board”), upon the recommendation of the Nominating and Corporate Governance Committee of the Board, increased the size of the Board from six to seven members. On January 31, 2023, the Board appointed Marilyn G. Spiegel to servewhich is attached as an independent director ofexhibit to the Company, effective January 31, 2023, until the Company’s 2023 annual meeting of stockholders or until her successor is elected. As Ms. Spiegel joined the Board following the completion of the fiscal year ended January 1, 2023, she has not executed this Annual Report on Form 10-K10-K. Completion of the Mergers requires, among other things, the adoption of the Merger Agreement by the Holdings stockholders.In connection with the Mergers, CopperSteel filed a registration statement on Form S-4 (the “Registration Statement) with the Securities and Exchange Commission (“Commission”), which includes a proxy statement with respect to the stockholder meeting of Holdings (the “Special Meeting”) to consider and adopt the Merger Agreement and a prospectus with respect to the CopperSteel Common Stock to be issued in connection with the Mergers.The Registration Statement was declared effective by the Commission on January 31, 2024 and the proxy statement/prospectus will be mailed to stockholders of Holdings as of January 24, 2024, the record date established for voting on the fiscal year ended January 1, 2023.Mergers at the Special Meeting to be held on March 12, 2024.
Stockholders of Holdings are encouraged to reach the proxy statement/prospectus, as well as the annexes thereto, and other documents to be filed with the Commission because the documents contain important information about Holdings, Cedar Fair and the Mergers.
Consummation of the Mergers is subject to antitrust review in the United States. Under the Hart-Scott-Rodino Antitrust Improvements Act of 1976, as amended (“HSR Act”), and the rules promulgated thereunder, the Mergers cannot be completed until the parties to the Merger Agreement have given notification and furnished information to the FTC and DOJ, and until the applicable waiting period has expired or has been terminated.
On November 17, 2023 and November 20, 2023, the Premerger Notification Office of the Federal Trade Commission accepted the premerger notification and report forms under the HSR Act submitted by Holdings and Cedar Fair, respectively. On December 20,
2023, Holdings and Cedar Fair withdrew their respective premerger notification and report forms under the HSR Act, and refiled them on December 21, 2023. On January 22, 2024, Holdings and Cedar Fair each received a request for additional information and documentary materials (a “Second Request”) from the DOJ in connection with the DOJ’s review of the Mergers. The effect of a Second Request is to extend the waiting period imposed by the HSR Act, until 30 days after each of Holdings and Cedar Fair has substantially complied with the Second Request issued to it, unless that period is extended voluntarily by the parties or terminated earlier by the DOJ. Per the terms of the Merger Agreement, Cedar Fair and Holdings will use their reasonable best efforts to certify substantial compliance with the Second Request on or before May 2, 2024.
Critical Accounting Policies
The preparation of financial statements in conformity with accounting principles generally accepted in the United States ("U.S. GAAP") requires management to make estimates and assumptions that affect the reported amounts of assets and liabilities and the disclosure of contingent liabilities as of the date of the financial statements and the reported amounts of revenues and expenses earned and incurred during the reporting period. Critical accounting estimates are fundamental to the portrayal of both our financial condition and results of operations and often require difficult, subjective and complex estimates and judgments. We evaluate our estimates and assumptions on an ongoing basis using historical experience and other factors, including the current economic environment, which we believe to be reasonable under the circumstances. We adjust such estimates and assumptions when facts and circumstances dictate. As future events and their effects cannot be determined with precision, actual results could differ significantly from these estimates. Changes in these estimates resulting from the continuing changes in the economic environment will be reflected in the financial statements in future periods. The following discussion addresses the items we have identified as our critical accounting estimates and discusses our review of applicable accounting pronouncements that have been issued by the Financial Accounting Standards Board (“FASB”). See Note 2 -Summary of Significant Accounting Policies, to the consolidated financial statements in Item 8 of this Annual Report for further discussion of these and other accounting policies. Revenue Recognition
FASB Accounting Standards Codification ("ASC") 606, Revenue from Contracts with Customers (“Topic 606") is based on the principle that revenue is recognized to depict the transfer of goods or services to customers in an amount that reflects the consideration to which the entity expects to be entitled in exchange for those goods or services.
We recognize revenue upon admission into our parks, provision of our services, or when products are delivered to our guests. Revenue is presented in the accompanying consolidated statements of operations net of sales taxes collected from our guests that are remitted or payable to government taxing authorities. For season passes,
Six Flags Plus products in the initial twelve-month term, memberships in the initial twelve-month term, and other multi-use admissions
products, we estimate a redemption rate based on historical experience and other factors and assumptions we believe to be customary and reasonable and recognize a pro-rata portion of the revenue as the guest attends our parks. For any bundled products with multiple performance obligations, revenue is allocated using the retail price of each distinct performance obligation and
products that are not soldrevenue is recognized on a
stand-alone basis are treated as residual.pro rata basis. In contrast to our
season pass and other multi-use offerings (such as our all season dining pass program, which enables season pass holders and members to eat meals and snacks any day they visit the park for one upfront payment) that expire at the end of each operating season, the
Six Flags Plus product and membership program continues on a month-to-month basis after the initial twelve-month membership term and can be canceled any time after the initial term pursuant to the terms of the membership program. Guests enrolled in
the membership program canthese offerings may visit our parks an unlimited number of times anytime the parks are open as long as the guest remains
enrolled in the membership program.enrolled. We review the estimated redemption rate on an ongoing basis and revise it as necessary throughout the year, including impact of changes to our season pass and memberships described above. Amounts owed or received for multi-use admissions in excess of redemptions are recognized in deferred revenue. For active
memberships after the initial twelve-month term,participants in these programs, we recognize revenue monthly as payments are
received.Valuationreceived after the initial twelve-month term.
Impairment of Goodwill and Indefinite-lived Intangible Assets
Goodwill and indefinite-lived intangible assets with indefinite useful livesasset are tested for impairment annually, or more frequently if events or circumstances indicate that the assets may not be recoverable. We identify our reporting unit and determine the carrying value of the reporting unit by assigning the assets and liabilities, including the existing goodwill and intangible assets, to the reporting unit. We then determine the fair value of the reporting unit and compare it to the carrying amount of the reporting unit. We have one operating segment and all of our parks are operated in a similar manner and have comparable characteristics in that they produce and distribute similar services and products using similar processes, have similar types of customers, are subject to similar regulations and exhibit similar economic characteristics. As such, we are a single reporting unit. For each year,As of December 31, 2023, the estimated fair value of theour single reporting unit exceeded its carrying amount, which is determined by comparing our market capitalization to our carrying amount (provided thatvalue. As we have onea single reporting unit, at the same level for which Holdings’ common stock is traded, we believe our market capitalization is the best indicator of our reporting unit’s fair value). value.
We
have performedperform a qualitative analysis on our indefinite-lived intangible assets
during the fourth quarter of each year.on an annual basis. The fair value of indefinite-lived intangible assets is generally determined based on a discounted cash flow analysis. An impairment loss occurs to the extent that the carrying value exceeds the fair value. For goodwill, if the fair value
Impairment of
the reporting unit exceeds its fair value.Property and Equipment
We review long-lived assets
including finite-lived intangible assets subject to amortization, for impairment upon the occurrence of events or changes in circumstances that would indicate that the carrying value of an asset or groups of assets may not be recoverable. Recoverability of assets to be held and used is measured by a comparison of the carrying amount of an asset or group of assets to the future undiscounted net cash flows expected to be generated by the asset or group of assets. If such assets are not considered to be fully recoverable, any impairment to be recognized is measured by the amount by which the carrying amount of the asset or group of assets exceeds its respective fair value. Assets to be disposed of are reported at the lower of the carrying amount or fair value less costs to sell.
During the year ended December 31, 2023, we recognized an impairment charge of $23.0 million, comprised of $16.0 million related to our Frontier City theme park in Oklahoma City, Oklahoma and $7.0 million related to our Hurricane Harbor Oklahoma City water park in Oklahoma City, Oklahoma. During the year ended January 1, 2023, we recognized an impairment charge of $16.9 million related to our water park in Houston, Texas.
Self-insurance Reserves
Self-insurance reserves are recorded for the estimated amounts of guest and employee claims and expenses incurred each period that are not covered by insurance. Reserves are established for both identified claims and incurred but not reported (“IBNR”) claims. Such amounts are accrued for when claim amounts become probable and estimable. Reserves for identified claims are based upon the Company’s historical claims experience and third-party estimates of settlement costs. Reserves for IBNR claims are based upon our claims data history, actuarially determined loss development factors and certain other qualitative considerations. We maintain self-insurance reserves for healthcare, auto, general liability, and workers’ compensation claims.
Our self-insurance reserves are periodically reviewed for changes in facts and circumstances and adjustments are made as necessary. During the second quarter of 2023, an actuarial analysis of our general liability and worker’s compensation self-insurance reserves resulted in a change in estimate that increased our ultimate loss indications on both identified claims and IBNR claims. The determination to undertake such an actuarial analysis resulted from greater than previously estimated reserve adjustments on identified claims during the quarter as well as an observed pattern of increasing litigation and settlement costs. As a result of this actuarial analysis, we revised certain key actuarial assumptions utilized in determining estimated ultimate losses, including loss development factors. The change in estimate resulted in an increase to “selling, general and administrative expense” on our consolidated statements of operation of $37.6 million during the year ended December 31, 2023.
Total accrued self-insurance reserves were $64.6 million and $34.1 million as of December 31, 2023 and January 1, 2023, respectively.
Results of Operations
The following table sets forth financial information and other data for the years ended December 31, 2023 and January 1, 2023:
| | | | | | | | | | | | | | | | | | | | | | | |
| Year Ended | | Change |
| (Amounts in thousands, except per capita data) | December 31, 2023 | | January 1, 2023 | | $ | | % |
| Total revenue | $ | 1,425,903 | | | $ | 1,358,236 | | | $ | 67,667 | | | 5 | % |
| Operating expenses | 622,952 | | | 590,660 | | | 32,292 | | | 5 | % |
| Selling, general and administrative expenses | 247,883 | | | 169,403 | | | 78,480 | | | 46 | % |
| Costs of products sold | 110,397 | | | 108,146 | | | 2,251 | | | 2 | % |
| Depreciation and amortization | 115,086 | | | 117,124 | | | (2,038) | | | 2 | % |
| Loss on impairment of park assets | 22,956 | | | 16,943 | | | 6,013 | | | 35 | % |
| Loss on disposal of assets | 16,393 | | | 3,927 | | | 12,466 | | | N/M |
| Operating income | 290,236 | | | 352,033 | | | (61,797) | | | 18 | % |
| Interest expense, net | 158,256 | | | 141,590 | | | 16,666 | | | 12 | % |
| Loss on debt extinguishment | 13,982 | | | 17,533 | | | (3,551) | | | 20 | % |
| Other expense, net | 9,208 | | | (84) | | | 9,292 | | | N/M |
| Income before income taxes | 108,790 | | | 192,994 | | | (84,204) | | | 44 | % |
| Income tax expense | 22,290 | | | 46,960 | | | (24,670) | | | 53 | % |
| Net income | 86,500 | | | 146,034 | | | (59,534) | | | 41 | % |
| Less: Net income attributable to non-controlling interests | (47,501) | | | (44,651) | | | (2,850) | | | 6 | % |
| Net income attributable to Six Flags Entertainment Corporation | $ | 38,999 | | | $ | 101,383 | | | $ | (62,384) | | | 62 | % |
| | | | | | | |
| Other Data: | | | | | | | |
| Attendance | 22,245 | | | 20,434 | | | 1,811 | | | 9 | % |
| Admissions spending per capita | $ | 33.43 | | | $ | 35.99 | | | $ | (2.56) | | | (7) | % |
| In-park spending per capita | $ | 27.60 | | | $ | 27.94 | | | $ | (0.34) | | | (1) | % |
| Total guest spending per capita | $ | 61.03 | | | $ | 63.93 | | | $ | (2.90) | | | (5) | % |
N/M Not meaningful due to the nature or amount of percentage change.
Year Ended December 31, 2023 vs. Year Ended January 1, 2023
Revenue
Revenue for the year ended December 31, 2023, totaled $1,425.9 million, an increase of $67.7 million, or 5%, compared to $1,358.2 million for the year ended January 1, 2023. The increase in revenue was primarily attributable to an increase of 9% in attendance. The increase in attendance was driven primarily by higher season pass sales as compared to the prior year. The higher season pass sales were driven by increased advertising and media spend as compared to the prior year. Sponsorship, international agreements and other revenue increased by $14.8 million.
Total guest spending per capita for the year ended December 31, 2023, decreased by $2.90, or 5%, compared to the year ended January 1, 2023, consisting of a $2.56, or 7%, decrease in admissions spending per capita and a $0.34, or 1%, decrease in in-park revenue per capita. The decrease in admissions spending per capita was driven primarily by the planned effort to optimize season pass and single-day ticket pricing, which resulted in lower average admissions pricing during 2023 compared to 2022. The decrease in in-park spending per capita was driven by reduced spending on parking, retail and flash passes, resulting from a higher mix of attendance from season passes compared to 2022 and outsourcing games operations on a revenue share basis. Due to certain benefits available to holders of multi-use admissions products, guests visiting using such products spend less per visit on certain in-park products than guests visiting on a single-day ticket. The season pass mix-driven decline in in-park spending per capita was partially offset by higher food and beverage sales during 2023 compared to 2022.
Operating expenses
Operating expenses for the year ended December 31, 2023, increased $32.3 million, or 5%, compared to the year ended January 1, 2023, primarily as a result of inflationary pressures which led to an increase in labor and other operating costs. Additionally, operating expenses increased due to higher costs associated with the increased focus on festivals and events.
Selling, general and administrative expenses
Selling, general and administrative expenses for the year ended December 31, 2023, increased $78.5 million, or 46%, compared to the year ended January 1, 2023, primarily as a result of an increase in our self-insurance reserves of $37.6 million (see Note 15 - Commitments and Contingenciesfor additional information on the change in accounting estimate that resulted in this adjustment), an increase in advertising expense of $17.8 million and transaction costs related to the proposed Mergers contemplated by the Merger Agreement of $15.4 million. Cost of products sold
Cost of products sold during the year ended December 31, 2023, increased $2.3 million, or 2%, compared to the year ended January 1, 2023, primarily due to higher sales volume resulting from the 9% increase in attendance as well as certain pricing initiatives.
Depreciation and amortization expense
Depreciation and amortization expense for the year ended December 31, 2023, decreased by $2.0 million, or 2%, compared to the year ended January 1, 2023. The decrease in depreciation and amortization is due to normal course variances in the initial carrying value and estimated useful lives of assets placed into service over time.
Loss on impairment of park assets
During the year ended December 31, 2023, we recognized an impairment charge of $16.0 million related to our leased Frontier City theme park and $7.0 million related to our lease Hurricane Harbor Oklahoma City water park. During the year ended January 1, 2023, we recognized an impairment charge of $16.9 million related to our water park in Houston, Texas.
Leadership Changes
We experienced a number of leadership changes in 2022:
| ● | In March 2022, Sandeep Reddy resigned as Chief Financial Officer |
| ● | From March 2022 to June 2022, Stephen Purtell was Interim Chief Financial Officer |
| ● | In June 2022, Gary Mick was appointed by Holdings’ board of directors as Chief Financial Officer |
| ● | In June 2022, Aimee Williams-Ramey was appointed by Holdings’ board of directors as Chief Legal Officer and Corporate Secretary |
| ● | In July 2022, Denise M. Clark resigned from Holdings’ board of directors |
| ● | Also in July 2022, Holdings’ board of directors appointed Chieh Huang to serve as a member of the board of directors. |
| ● | In January 2023, Holdings’ board of directors expanded the board to add a seventh seat, and appointed Marilyn G. Spiegel to the new position. |
Results of Operations
The following table sets forth summary financial information for the years ended January 1, 2023 and January 2, 2022:
| | | | | | | | | |
| | Year Ended | | Percentage |
(Amounts in thousands, except per capita data) | | January 1, 2023 | | January 2, 2022 | | Change |
Total revenue | | $ | 1,358,236 | | $ | 1,496,905 | | (9) | % |
Operating expenses | | | 591,560 | | | 647,250 | | (9) | % |
Selling, general and administrative expenses | | | 162,158 | | | 211,381 | | (23) | % |
Costs of products sold | | | 108,146 | | | 125,728 | | (14) | % |
Other net periodic pension benefit | | | (5,410) | | | (5,894) | | (8) | % |
Depreciation and amortization | | | 117,124 | | | 114,434 | | 2 | % |
Loss on impairment of park assets | | | 16,943 | | | — | | N/M | |
Loss on disposal of assets | | | 3,927 | | | 12,137 | | (68) | % |
Interest expense, net | | | 141,590 | | | 152,436 | | (7) | % |
Loss on debt extinguishment | | | 17,533 | | | — | | N/M | |
Other expense, net | | | 4,126 | | | 18,122 | | (77) | % |
Income before income taxes | | | 200,539 | | | 221,311 | | (9) | % |
Income tax expense | | | 46,960 | | | 49,622 | | (5) | % |
Net income | | | 153,579 | | | 171,689 | | (11) | % |
Less: Net income attributable to noncontrolling interests | | | (44,651) | | | (41,766) | | 7 | % |
Net income attributable to Six Flags Entertainment Corporation | | $ | 108,928 | | $ | 129,923 | | (16) | % |
| | | | | | | | | |
Other Data: | | | | | | | | | |
Attendance | | | 20,434 | | | 27,693 | | (26) | % |
Admissions revenue per capita | | $ | 35.99 | | $ | 28.73 | | 25 | % |
In-park revenue per capita | | $ | 27.94 | | $ | 23.67 | | 18 | % |
Total guest spending per capita | | $ | 63.93 | | $ | 52.40 | | 22 | % |
Year Ended January 1, 2023 vs. Year Ended January 2, 2022
Revenue
Revenue for the year ended January 1, 2023, totaled $1,358.2 million, a decrease of $138.7 million, or 9%, compared to $1,496.9 million for the year ended January 2, 2022. The decrease in revenue was primarily attributable to a decrease in attendance due to an increase in ticket prices, the elimination of free tickets and heavily-discounted pass products, and fewer operating days. Additionally, we did not open five parks in the fourth quarter of 2022 for Holiday in the Park that had operated Holiday in the Park in 2021. In addition, due to the adoption of a fiscal reporting calendar commencing January 1, 2021, there were three fewer days in the year ended January 1, 2023, compared to the year ended January 2, 2022, which accounted for 89 thousand guests in the year ended January 2, 2022.
Total guest spending per capita, which excludes sponsorship, international agreements and accommodations revenue, for the year ended January 1, 2023, increased by $11.53, or 22%, compared to the year ended January 2, 2022, consisting of a $7.26, or 25%, increase in admissions revenue per capita and a $4.27, or 18%, increase in in-park revenue per capita. The increase in admissions revenue per capita was primarily attributable to higher realized prices on season pass and single day tickets, and the reduction of heavily discounted season pass products and free tickets. The increase in in-park revenue per capita reflects the benefits of our revenue management initiatives and in-park initiatives to improve the guest experience.
Operating expenses
Operating expenses for the year ended January 1, 2023, decreased $55.7 million, or 9%, compared to the year ended January 2, 2022, primarily as a result of lower labor expenditures at the parks due to a reduction in operating days and more efficient labor scheduling during 2022. Additionally, we moved some back-office functions to a shared-services center, which shifted some operating costs to selling, general and administrative expenses. These decreases were partially offset by increased operating expenses at our California and Mexico parks in the first quarter of 2022, as these
parks were closed due to COVID-19 during the first quarter of 2021 and higher salaries, wages, utilities and maintenance resulting from inflationary pressures.
Selling, general and administrative expenses
Selling, general and administrative expenses for the year ended January 1, 2023, decreased $49.2 million, or 23%, compared to the year ended January 2, 2022, primarily due to reduced advertising expenses and lower personnel costs. The decline in personnel costs was primarily driven by lower bonus accruals, stock-based compensation and headcount. These reductions were partially offset by higher costs due to the movement of some back-office functions to a shared-services center, which shifted a portion of costs from operating expenses to selling, general and administrative expenses.
Cost of products sold
Cost of products sold during the year ended January 1, 2023, decreased $17.6 million, or 14%, compared to the year ended January 2, 2022, primarily as a decrease in total units sold. Cost of products sold as a percentage of in-park revenue for the year ended January 1, 2023 decreased slightly relative to the prior year period, primarily as a result of the mix of in-park revenue, an increase in retail prices, and a reduction in membership and season pass discounts. The decrease was partially offset by higher unit costs for food and retail items due to inflationary pressures and supply chain disruptions.
Depreciation and amortization expense
Depreciation and amortization expense for the year ended January 1, 2023, increased by $2.7 million, or 2%, compared to the year ended January 2, 2022. The increase in depreciation and amortization is primarily the result of decreased capital expenditures during 2020 due to the COVID-19 pandemic, which reduced depreciation expense in 2021 as compared to 2022 as our capital expenditures returned to more normalized levels.
Loss on disposal of assets
We recognized a $3.9 million loss on disposal of assets for the year ended January 1, 2023, compared to a loss on disposal of assets of $12.1 million for the year ended January 2, 2022. These losses on disposal of assets were primarily driven by the write-off of assets in conjunction with our ongoing capital plan.
Loss on impairment of park assets
We recognized an impairment charge of $16.9 million related toleased Six Flags Hurricane Harbor Splashtown.Splashtown water park. The impairment wascharges were allocated between the right-of-use assets and property and equipment, on a proportional basis.
See Note 4 - Property and Equipment for additional information.
Loss on disposal of assets
We recognized a $16.4 million loss on disposal of assets for the year ended December 31, 2023, compared to a loss on disposal of assets of $3.9 million for the year ended January 1, 2023. The $16.4 million loss on disposal of assets for the year ended December 31, 2023 was primarily attributable to the early retirement of several rides resulting from our strategy to remove rides with high maintenance costs and low ridership and/or significant downtime.
Interest expense, net decreased $9.9increased $16.7 million, or 12%, for the year ended December 31, 2023, compared to the year ended January 1, 2023. The increase is primarily attributable to the issuance of the 2031 Notes at 7.25% partially offset by the redemption of $892.6 million of the 2024 Notes at 4.875%. The remainder of the increase is due to the cost of our floating rate debt and increased borrowings on our Revolving Credit Facility. The higher borrowings under our Revolving Credit Facility are primarily attributable to additional borrowings used to fund the portion of the tender of our 2024 Notes not covered by the net proceeds of the 2031 Notes.
Loss on debt extinguishment
Loss on debt extinguishment was $14.0 million for the year ended December 31, 2023 as compared to compared to a loss of debt extinguishment of $17.5 for year ended January 1, 2023. During the year ended December 31, 2023, we recognized a loss on debt extinguishment of $14.0 million due to the write-off of unamortized deferred financing costs on the 2024 Notes, the premium paid above par on the early redemption of the 2024 Notes and the transaction costs charged to expense. During the year ended January 1, 2023, we incurred a $17.5 million loss on debt extinguishment upon the early redemption of $360.0 million of the 2025 Notes comprised of $12.6 million for the premium paid above par and $4.9 million for the write-off of the pro rata amount of unamortized deferred financing costs associated with the 2025 Notes that were redeemed early.
Net income attributable to non-controlling interests
Net income attributable to non-controlling interests increased $2.9 million, or 6%, for the year ended January 1,December 31, 2023, compared to the year ended January 2, 2022. The decrease was primarily attributable1, 2023 due to the early redemptionannual increase in the consumer price index that determines the mandatory distributions to our Partnership Parks.
Income tax expense
Income tax expense for the year ended December 31, 2023, was $22.3 million reflecting an effective tax rate of
$360.0 million aggregate principal amount20.5%. The difference between our effective tax rate and the federal statutory rate of
our senior secured 7.00% Notes due 2025 during the second quarter. The reduction resulting21% primarily results from the
early redemption waseffect of the non-controlling interest income distribution and the in change in our valuation allowance, partially offset
by borrowings under our revolving credit facilitythe effect of state and
higher interest rates on our floating rate debt, in particular, after the termination of the August 2019 Swap Agreements in March 2022, which increased our unhedged floating rate debt from $79.0 million to $479.0 million.Income tax expense
local income taxes and nondeductible executive compensation.
Income tax expense for the year ended January 1, 2023, was $47.0 million reflecting an effective tax rate of
23.4%24.3%. The difference between our effective tax rate and the federal statutory rate of 21% primarily results from state and foreign income taxes, which are partially offset by the effect of the non-controlling interest income distribution.
Calculation of EBITDA for the Years Ended January 1,December 31, 2023 and January 2, 2022
1, 2023
The presentation of Modified EBITDA Adjusted EBITDA and Adjusted EBITDA minus capex provides additional information to investors about the calculation of, and compliance with, certain financial covenants and other relevant metrics in the our Credit agreements.Facility. Modified EBITDA, Adjusted EBITDA and Adjusted EBITDA minus capex are material components of these covenants. We use Adjusted EBITDA in connection with certain components of our executive compensation program. In addition, investors, lenders, financial analysts and rating agencies have historically used EBITDA relatedEBITDA-related measures in our industry, along with other measures, to estimate the value of a company, to make informed investment decisions and to evaluate companies in theour industry. Modified
EBITDA, Adjusted EBITDA and Adjusted EBITDA
minus capex are not a recognized term under accounting principles generally accepted in the United States of America (“GAAP”), should not be considered in isolation or as a substitute for a measure of our financial performance prepared in accordance with GAAP and is not indicative of income from operations as determined under GAAP. Modified EBITDA
Adjusted EBITDA and Adjusted EBITDA
minus capex and other non-GAAP financial measures have limitations which should be considered before using these measures to evaluate our financial performance. Modified EBITDA
Adjusted EBITDA and Adjusted EBITDA,
minus capex, as presented by us, may not be comparable to similarly titled measures of other companies due to varying methods of calculation.
“Modified EBITDA,” a non-GAAP measure, is defined as our consolidated income (loss) from continuing
operations:operations, excluding the following: the cumulative effect of changes in accounting principles, discontinued operations gains or losses, income tax expense or benefit, restructure costs or recoveries, reorganization items (net), other income or expense, gain or loss on early extinguishment of debt, equity in income or loss of investees, interest expense (net), gain or loss on disposal of assets, gain or loss on the sale of investees, amortization, depreciation, stock-based compensation,
andimpairment charges, fresh start accounting valuation
adjustments. Modified EBITDA, as defined herein, may differ from similarly titled measures presented byadjustments and other
companies.significant non-recurring items, including transaction expenses incurred in the proposed Mergers. Management uses non-GAAP measures for budgeting purposes, measuring actual results, allocating resources and in determining employee incentive compensation. We believe that Modified EBITDA provides relevant and useful information for investors because it assists in comparing our operating performance on a consistent basis, makes it easier to compare our results with those of other companies in our industry as it most closely ties our performance to that of our competitors from a park-level perspective and allows investors to review performance in the same manner as our management.
"Adjusted EBITDA," a non-GAAP measure, is defined as Modified EBITDA minus
the interests of third parties in the Modified EBITDA of properties that are less than wholly owned (consisting of Six Flags Over Georgia, Six Flags White Water Atlanta and Six Flags Over Texas).net income attributable to non-controlling interests. Adjusted EBITDA is approximately equal to “Parent Consolidated Adjusted EBITDA” as defined in our secured
credit agreement,Credit Facility, except that Parent Consolidated Adjusted EBITDA excludes Adjusted EBITDA from equity investees that is not distributed to us in cash on a net basis and has limitations on the amounts of certain expenses that are excluded from the calculation.
Adjusted EBITDA as defined herein may differ from similarly titled measures presented by other companies. Our board of directors and management use Adjusted EBITDA to measure our performance and our current management incentive compensation plans are based largely on Adjusted EBITDA. We believe that Adjusted EBITDA is frequently used by
all our sell-side analysts and
most investors as their primary measure of our performance in the evaluation of companies in our industry. In addition, the instruments governing our indebtedness use Adjusted EBITDA to measure our compliance with certain covenants and, in certain circumstances, our ability to make certain borrowings.
Adjusted EBITDA, as computed by us, may not be comparable to similar metrics used by other companies in our industry.“Adjusted EBITDA minus capex,” a non-GAAP measure, is defined as Adjusted EBITDA minus capital expenditures net
The following tables set forth a reconciliation of net income to Modified EBITDA Adjusted EBITDA and Adjusted EBITDA minus capex for the years ended January 1,December 31, 2023 and January 2, 2022:1, 2023:
| | | | | | | | | | | |
| Year Ended |
| (Amounts in thousands) | December 31, 2023 | | January 1, 2023 |
| Net income | $ | 86,500 | | | $ | 146,034 | |
| Income tax expense | 22,290 | | | 46,960 | |
Other (income) expense, net(1) | 9,208 | | | (84) | |
| Loss on debt extinguishment | 13,982 | | | 17,533 | |
| Interest expense, net | 158,256 | | | 141,590 | |
| Loss on disposal of assets | 16,393 | | | 3,927 | |
| Depreciation and amortization | 115,086 | | | 117,124 | |
| Loss on impairment of park assets | 22,956 | | | 16,943 | |
| Stock-based compensation | 11,387 | | | 15,218 | |
Merger-related transaction costs(2) | 15,386 | | | — | |
Self-insurance reserve adjustment(3) | 37,558 | | | — | |
| Modified EBITDA | $ | 509,002 | | | $ | 505,245 | |
| Third party interest in EBITDA of certain operations | (47,501) | | | (44,651) | |
| Adjusted EBITDA | $ | 461,501 | | | $ | 460,594 | |
________________________________ | | | | | | |
| | Year Ended |
(Amounts in thousands, except per share data) | | January 1, 2023 | | January 2, 2022 |
Net income | | $ | 153,579 | | $ | 171,689 |
Income tax expense | | | 46,960 | | | 49,622 |
Other expense, net | | | 4,126 | | | 18,122 |
Loss on debt extinguishment | | | 17,533 | | | — |
Interest expense, net | | | 141,590 | | | 152,436 |
Loss on disposal of assets | | | 3,927 | | | 12,137 |
Depreciation and amortization | | | 117,124 | | | 114,434 |
Loss on impairment of park assets | | | 16,943 | | | — |
Stock-based compensation | | | 7,673 | | | 21,462 |
Modified EBITDA | | $ | 509,455 | | $ | 539,902 |
Third party interest in EBITDA of certain operations | | | (44,651) | | | (41,766) |
Adjusted EBITDA | | $ | 464,804 | | $ | 498,136 |
Capital expenditures, net of property insurance recovery | | | (111,509) | | | (121,742) |
Adjusted EBITDA minus CAPEX | | $ | 353,295 | | $ | 376,394 |
| | | | | | |
Weighted-average common shares outstanding - basic | | | 84,366 | | | 85,708 |
operations. This reclassification has been reflected in all periods presented. As a result of this reclassification, Adjusted EBITDA for the year endedend January 1, 2023, decreased $33.3 million, or 7%, compareddeclined by $4.2 million.
(2) Merger-related transaction costs consist primarily of financial, legal and accounting advisory fees directly attributable to the year ended January 2, 2022. Thisproposed merger with Cedar Fair L.P. as well as compensation costs for certain executive officers that was primarily driven bytriggered upon the execution of the merger agreement with Cedar Fair L.P.
(3) Amount relates to an adjustment to our self-insurance reserves resulting from a 9% decreasechange in revenue dueaccounting estimate that increased our ultimate loss indications on both identified claims and incurred but not reported claims. See Note 15 - Commitments and Contingencies for additional information regarding this change in accounting estimate. We have excluded this adjustment from our reported Adjusted EBITDA because we believe (i) the change in actuarial assumptions and related change in accounting estimate that rise to 26% fewer guests. The decreasethe adjustment is unusual and not expected to be recurring; (ii) excluding it provides more meaningful comparisons to our historical results; and (iii) excluding it provides more meaningful comparisons to other companies in revenue was partially offset by reductions in operating expenses, cost of products sold and sales, general and administrative expenses, due to a reduction in full-time headcount, more efficient labor scheduling, and a decrease in operating days. Capital expenditures, net of property insurance recovery, decreased by $9.8 million due primarily to insurance recoveries of $5.1 million and a shift in spending to guest-facing investments that are less costly than marketable capital.our industry.
Liquidity, Capital Commitments and Resources
Our principal sources of liquidity are cash generated from operations, funds from borrowings and existing cash on hand. Our principal uses of cash include the funding of working capital obligations, debt service, investments in parks (including infrastructure and capital projects), payments to our partners in the Partnership
Parks, and could include payment of dividends on Holdings’ common stock and stock repurchases, when permitted.Parks.
Based on historical and anticipated operating results, we believe cash flows from operations, available cash and amounts available under
the Second Amended and Restatedour Revolving Credit Facility will be adequate to meet our liquidity needs for at least the next twelve months, including any anticipated
requirements for working capital
requirements, capital expenditures, scheduled debt service and obligations under arrangements relating to the Partnership Parks.
We expect to be able to use federal net operating loss carryforwards to reduce our federal income tax liability for several years. For thetax years 2023 and 2024. For 2024, we have significant federal net operating loss carryforwards subject to an annual limitation that will offset approximately $32.5 million and $30.0 million of taxable income, respectively, per year.income. We expect taxable income in excess of the annual limitation in those years will be partially offset by net operating losses generated during 2020. In accordance with the CARES Act, any net operating loss carryforwards generated inafter 2020 are not subject to expiration and will carryforward indefinitely.
Based on current projections, we expect to utilize all of our federal net operating loss carryforward during tax year 2024 and become a full cash tax payer in 2025 and thereafter. The expected timing of the utilization of our federal net operating loss carryforwards may be impacted by the Mergers.
Our current and future liquidity is greatly dependent upon our operating results, which are driven largely by overall economic conditions as well as the price and perceived quality of the entertainment experience at our parks. Our liquidity could also be adversely affected by a disruption in the availability of credit as well as unfavorable weather; natural disasters; contagious diseases, such as COVID-19 or other variants; accidents or the occurrence of an event or condition at our parks. If such a material adverse event were to occur, we may be unable to borrow under the Second Amended and Restated Revolving LoanCredit Facility or may be required to repay amounts outstanding under the Second Amended and Restated Credit Facility and/or may need to seek additional financing. In addition, we expect we may be required to seek additional financing to refinance all or a significant portion of our existing debt on or prior to maturity. The degree to which we are leveraged could adversely affect our ability to obtain any additional financing. See "Cautionary"Cautionary Note Regarding Forward-Looking Statements"Statements" and "Item"Item 1A. Risk Factors"Factors" of this Annual Report.
Our net operating cash flows are largely driven by attendance and guest spending per capita levels, which vary based on the seasonality of our business. Most of our cash-based expenses are relatively fixed and do not vary significantly with either attendance or
guest spending per capita, assuming that the parks are operational.
As of January 1,December 31, 2023, we had approximately $80.1$77.6 million unrestricted cash and $229.0$299.0 million available for borrowing under the Second Amended and Restated Revolving Loan.Credit Facility. We plan to continue to strategically reinvest in our parks to improveenhance the guest experience. For more information about our planned capital expenditures, see “Capital Improvements and Other Initiatives” under Item 1. Business. | | | | | | |
| | Year Ended |
(Amounts in thousands) | | January 1, 2023 | | January 2, 2022 |
Net cash provided by operating activities | | $ | 269,361 | | $ | 334,905 |
Net cash used in investing activities | | | (111,509) | | | (121,701) |
Net cash used in financing activities | | | (414,758) | | | (35,144) |
Effect of exchange rate on cash | | | 1,443 | | | (235) |
Net (decrease) increase in cash and cash equivalents | | $ | (255,463) | | $ | 177,825 |
Business
.
| | | | | | | | | | | |
| Year Ended |
| (Amounts in thousands) | December 31, 2023 | | January 1, 2023 |
| Net cash provided by operating activities | $ | 257,473 | | | $ | 269,361 | |
| Net cash used in investing activities | (170,237) | | | (111,509) | |
| Net cash used in financing activities | (95,764) | | | (414,758) | |
| Effect of exchange rate on cash | 5,991 | | | 1,443 | |
| Net decrease in cash and cash equivalents | $ | (2,537) | | | $ | (255,463) | |
During the year ended
January 1,December 31, 2023, net cash provided by operating activities decreased
$65.5$11.9 million to
$269.4$257.5 million, compared to
$344.9$269.4 million
during the period ended January 2, 2022. The decrease was primarily attributable to a decrease in revenue of 9%. This was partially offset by decreases in operating expenses and selling, general and administrative expenses. The largest drivers of the reduction were changes to deferred revenue and accounts receivable which decreased due to the discontinuation of our membership program in favor of more single day tickets and season passes which are typically paid at the time of sale.Net cash used in investing activities during the year ended January 1, 2023. The decrease was primarily caused by lower earnings in 2023 decreased $10.2as compared to 2022, which was partially offset an increase in inventories during 2022 and a decline in accrued compensation during 2022.
Net cash used in investing activities during the year ended December 31, 2023, increased $58.7 million to $170.2 million from $111.5 million, from $121.7 million, consisting primarily as a result of lower capital expenditures, netthe execution of insurance proceeds. The decrease is attributable primarilyseveral ride contracts for rides expected to insurance proceeds of $5.1 millionopen during 2024 and reductions in marketable capital for the 2022 season.2025 that required deposits or milestone payments during 2023.
Net cash used in financing activities during the year ended
December 31, 2023, was $95.8 million as compared to $414.8 million during the year ended January 1,
2023. During 2023,
was $414.8 million. Thisnet cash used in financing activities is primarily attributable to the repayment of $892.0 million of the 2024 Notes and Partnership Park distributions of $47.5 million, partially offset by $784.0 million in net proceeds from the issuance of the 2031 Notes and net incremental borrowings under the Revolving Credit Facility of $80.0 million . During 2022, net cash used in financing activities was primarily attributable to
repayments of borrowings of $460.0 million consisting of the early repayment of $360.0 million of the 2025 Notes,
and $100.0 million on the Revolving Loan, stock repurchases of $96.8 million and partnership distributions of $44.7
million. This wasmillion, partially offset by
proceeds from borrowing $200.0$100 million
on theof net incremental borrowings under our Revolving
Loan. Net cash used in financing activities during the year ended January 2, 2022, was $35.1 million, mostly attributable to $41.8 million in distributions to noncontrolling interests in the Partnership Parks.Credit Facility.
Dividends and Stock Repurchases
See Note 12 -Preferred Stock, Common Stock and Other Stockholders’ Equity, to the consolidated financial statements in ItemItem 8 of this Annual Report for information on payment of dividends on Holdings’our common stock and stock repurchases. Other than with respect to the Special Dividend to be paid in connection with the Mergers, the payment of which is contingent upon the consummation of the Mergers, we may continue to determine that it is prudent to continue suspending payments of dividends despite completion of the terms required under the 2020 amendments to the Credit Facility. IndebtednessIndebtedness
As of January 1,December 31, 2023, our indebtedness consisted of a credit facilityoutstanding borrowings under our Revolving Credit Facility and senior notes. See following discussion and Note 8, Long-Term Indebtedness, to the consolidated financial statements in Item 8
Credit Facility
As part of our
indebtedness.Credit Facility
SFTP is the borrower under the Second Amended and Restated Credit Facility, as amended from time to time, pursuant to the Second Amended and Restated Credit Agreement, dated as of April 17, 2019, as amended, restated,normal capital planning, we periodically refinance or modified from time to time (“Credit Agreement”).
amend our existing credit facility. As of January 1,December 31, 2023, the Second Amended and Restated Credit Facilityour credit facility consisted of a $350.0$500.0 million revolving credit loan facility which had $100.0 million outstanding as of January 1, 2023 and expires on April 17, 2024,(the “Revolving Credit Facility”) and a $479.0 million Tranche B Term Loan facility which will mature on April 17, 2026. Our ability(the “Term Loan B”) pursuant to borrow under the revolvingamended and restated credit loan facility requires compliance with certain conditions, including a maximum senior secured net leverage maintenance covenant,that we entered into in 2019 (the Revolving Credit Facility and the absence of any material adverse change inTerm Loan B together comprise our business or financial condition. If we were to become unable to borrow under the revolving credit loan facility, and we failed to meet our projected results from operations significantly, we might be unable to pay in full our off-season obligations. A default under the revolving credit loan facility could permit the lenders under the Credit Agreement to accelerate the obligations thereunder.
“Credit Facility”).
As of January 1,December 31, 2023 we had approximately, after adjusting for $21.0 million of outstanding letters of credit leaving approximately $229.0and $180.0 million available forborrowings outstanding, the remaining borrowing capacity under the revolving credit loan facility.our Revolving Credit Facility is $299.0 million. See “Covenant Compliance” discussion below for information regarding our maximum net leverage maintenance covenant, which could impact amounts available for borrowing. We can draw As of December 31, 2023, the entire remaining amountborrowing capacity would be available for borrowing under the revolving credit loan facilityto us without being in breach ofbreaching our maximum net leverage maintenance or other relevant covenant.
Long-term Notes
Notes payable are listed in the order that the agreements were entered. The 2025 Notes are secured by Six Flags Theme Parks, Inc. ("SFTP"), a wholly-owned subsidiary of Holdings. The 2024 Notes, 2024 Notes Add-ons, 2027 Notes and 2031 Notes are unsecured.
The 2024 Notes, the 2024 Notes Add-on,
Notes, 2025 Notes,
andthe 2027 Notes
and the 2031 Notes are guaranteed by Holdings, Six Flags Operations Inc. ("SFO") and certain of the domestic subsidiaries of SFTP (collectively, the "Loan Parties"). The 2024 Notes, the 2024 Notes Add-on, 2025 Notes, the 2027 Notes and the 2031 Notes contain restrictive covenants that, subject to certain exceptions, limit or restrict, among other things, out ability and the ability of the Loan Parties to incur additional indebtedness, create liens, engage in mergers, consolidations and other fundamental changes, make investments, engage in transactions with affiliates, pay dividends and repurchase capital stock. The 2024 Notes, the 2024 Notes Add-on, 2025 Notes, the 2027 Notes and the 2031 Notes contain certain events of default, including payment defaults, breaches of covenants and representations, cross defaults to other material indebtedness, judgment, and changes of control and bankruptcy events of default.
2024 Notes and 2024 Notes Add-ons
On June 16, 2016, Holdings issued $300.0 million of 4.875% senior unsecured notes due July 31, 2024 (the "2024 Notes"). We capitalized $4.7 million of debt issuance costs directly associated with the issuance of the 2024 Notes.
On April 13, 2017, Holdings issued an additional $700.0 million of 4.875% Senior Notes due July 31, 2024 (the "2024 Notes Add-on").
We capitalized $3.9 million of debt issuance costs directly associated with the issuance of the 2024 Notes Add-on. Interest payments of
$23.1$24.4 million for the 2024 Notes and the 2024 Notes Add-on are due semi-annually on January 31 and July 31 of each year.
During March of 2020, we prepaid $50.5 million of the outstanding 2024 Notes principal, reducing the outstanding amount to $949.5 million. We recognized a loss on debt extinguishment of $1.0 million.
On May 3, 2023, $892.6 million of the aggregate principal amount of the 2024 Notes were redeemed pursuant to the Tender Offer discussed below in conjunction with the issuance of the 2031 Notes.
The $56.9 million of the 2024 Notes and 2024 Notes Add-on remaining subsequent to the Tender Offer mature on July 31, 2024. Interest payments of $2.8 million are due semi-annually on January 31, 2024 and July 31, 2024.
2027 Notes
On April 13, 2017, Holdings issued $500.0 million of 5.50% Senior Notes due April 15, 2027 (the "2027 Notes").
We capitalized $2.6 million of debt issuance costs directly associated with the issuance of the 2027 Notes. Interest payments of $13.8 million
for the 2027 Notes are due semi-annually on April 15 and October 15 of each year.
2025 Notes
On April 22, 2020, SFTP completed the private sale of $725.0 million in aggregate principal amount of 7.00% senior secured notes due 2025 (the “2025 Notes”). The net proceeds from this offering were used to repay the outstanding balance of the Revolving Credit Facility and $315.0 million of the Term Loan B and for general corporate and working capital purposes, including expenses relating to
the offering. Interest payments of $25.4 million are due semi-annually on
January 1December 31 and July 1 of each
year.year, with the exception of January 1, 2021, which included the interest from April 22, 2020 through July 1, 2020 and totaled $35.1 million.
On July 1, 2022,
Holdings prepaidthe Company redeemed $360.0 million of the 2025 Notes at a premium of
103.5%1,260,000,000.0%. The transaction reduced the outstanding
amountsamount of the 2025 Notes to $365.0 million. We incurred a $17.5 million loss on debt extinguishment containing
$12.6$12,600,000.0 million for the premium paid above par and $5.0 million related to the write-off of deferred financing costs related to the transaction.
As
2031 Notes & Tender Offer
On April 26, 2023, we launched a private offering of January 1, 2023, $949.5up to $800 million $365.0 million,aggregate principal amount of senior notes. Concurrently, we commenced a cash tender offer (the "Tender Offer") for any and $500.0 million, wasall outstanding under2024 Notes. The consideration offered for each $1,000 principal amount of the 2024 Notes was $1,000.50 (the "Purchase Price"), plus accrued and unpaid interest.
On May 3, 2023, we completed the private sale of $800 million aggregate principal amount of 7.250% Senior Notes due 2031 (the "2031 Notes") at on offering price of 99.248% of the principal amount thereof. Net of the original issue discount and debt issuance costs, we received net proceeds of $784.0 million.
Also, on May 3, 2023, we announced that $892.6 million, or 94.0% of the aggregate outstanding principal amount of the 2024 Notes Add-on,were validly tendered pursuant to the 2025Tender Offer. Net cash proceeds from the 2031 Notes, together with other available cash, including borrowings under our Revolving Credit Facility, were used to pay the Purchase Price, plus accrued and unpaid interest. We incurred a $14.0 million loss on debt extinguishment comprised of $1.0 million for premium paid above par and $13.0 million of costs charged to expense on debt modification which were recognized during the year ended December 31, 2023.
Interest payments on the 2031 Notes of $29.0 million are due semi-annually on May 15 and November 15, with the exception of November 15, 2023, which included interest from May 3, 2023 through November 15, 2023 and totaled $30.9 million.
Debt Commitment Letter
In connection with the Merger Agreement, Six Flags, Cedar Fair and CopperSteel have entered into a Debt Commitment Letter, with the Arrangers, pursuant to which the Arrangers have committed to provide Debt Financing in connection with the Mergers. The Debt Commitment Letter amends, restates and supersedes that certain commitment letter, dated November 2, 2023, which provided revolving credit commitments in an aggregate amount of $800 million. The proceeds from the Debt Financing may be used to, among other things, pay for transaction costs in connection with the Mergers. The obligation of the Arrangers to provide the Debt Financing under the Debt Commitment Letter is subject to a number of conditions, including the receipt of executed loan documentation, accuracy of certain representations and warranties and the
2027 Notes, respectively.consummation of the transactions contemplated by the Merger Agreement.
Covenant Compliance
As of January 1, 2023, we were in compliance with all applicable covenants in the Credit Agreement governing the Second Amended and Restated
The Credit Facility and
expectsenior notes contain a number of customary negative covenants. Subject to
becertain exceptions, these covenants restrict our ability to, among other things, incur additional indebtedness, incur liens, make investments, sell assets, pay dividends, make capital expenditures, repurchase stock or engage in
compliance for the next twelve months.
transactions with affiliates. The Credit AgreementFacility also requires that as of the end of each fiscal quarter our senior secured leverage ratio, which is the ratio of our Senior Secured Debt to our Borrower Consolidated Adjusted EBITDA (as each term is defined in the Credit Facility) for the preceding four fiscal quarters, not exceed 4.25 to 1.0 (as each such term is defined infor the Credit Agreement). The maximum senior secured leverage ratio will step down to 4.0 to 1.0 beginning with the first fiscal quarter end ofperiods ending on or about September 30, 2023 and then down to 3.75 to 1.0 fromthrough the third fiscal quarter of 2023.
In 2020, we entered into amendments to the Credit Agreement which, among other things, allowed us to use our Borrower Consolidated Adjusted EBITDA from 2019 rather than actual Borrower Consolidated Adjusted EBITDAperiod ending on or about June 30, 2024, and 3.75:1.00 for the corresponding quarters in 2021 when testing of our senior secured leverage ratio throughout 2022. In connection with these amendments, we agreed to various restrictions, including the suspension of dividend paymentsfiscal quarter period ending on Holdings common stockor about September 30, 2024, and stock repurchases, a prohibition from prepaying debt, and a requirement that we maintain minimum liquidity (defined as unrestricted cash and cash equivalents and available commitments under the Second Amended and Restated Revolving Loan) of at least $150.0 million for a specified period. The restriction on prepaying debt and the minimum liquidity requirement end on the earliereach four fiscal quarter period thereafter.
As of December 31, 2022 or such time that2023, we demonstrateare in compliance with all relevant covenants. Additionally, as of December 31, 2023, the entire remaining borrowing capacity would be available to us without breaching our senior securedmaximum net leverage ratio using actual results. On May 18, 2022, we reduced and terminated the Series B replacement Revolving Commitments by $131.0 million, which reduced the Second Amended and Restated Revolving Loan capacity to $350.0 million from $481.0 million.maintenance or other relevant covenant.
Partnership Park Obligations
We guarantee certain obligations relating to the Partnership Parks. These obligations include (i) minimum annual distributions (including rent) of approximately $85.6$88.5 million in 20232024 (subject to cost of living adjustments in subsequent years) to the limited partners in the Partnerships Parks (based on our ownership of units as of January 1,December 31, 2023, our share of the distribution will be approximately $38.1
$39.4 million), (ii) minimum capital expenditures at each of the Partnership Parks during rolling five-year periods, based generally on 6% of the Partnership Park’s revenues, (iii) an annual offer to purchase all outstanding limited partnership units at the
SpecifiedPartnership Put Price to the extent tendered by the unit holders, which annual offer must remain open from March 31 through late April of each year, and any limited partnership interest tendered during such time period must be fully paid for no later than May 15th of that year, (iv) making annual ground lease payments, and (v) either (a) purchasing all of the outstanding limited partnership interests in the Partnership Parks through the exercise of a call option upon the earlier of the occurrence of certain specified events and the end of the term of the partnerships that hold the Partnership Parks in 2027 (in the case of Georgia) and 2028 (in the case of Texas), or (b) causing each of the partnerships that hold the Partnership Parks to have no indebtedness and to meet certain other financial tests as of the end of the term of such partnership.
See Note 15, Commitments and Contingencies, to the consolidated financial statements in Item 8 of this Annual Report for additional information. After payment of the minimum distribution, we are entitled to a management fee equal to 3% of prior year gross revenues and, thereafter, any additional cash will be distributed first to management fee in arrears and then towards the repayment of any interest and principal on intercompany loans. Any additional cash, to the extent available, is distributed 95% to us, in the case of SFOG, and 92.5% to us, in the case of SFOT.
In January 2027 with respect to the Georgia Partnership and in January 2028 with respect to the Texas Partnership, we will have the option (each the “End-of-Term Option”) to require the redemption of all the limited partnership units we do not then own in the Partnerships. To exercise the End-of-Term Option, we must give the Georgia Partnership notice of its exercise no later than December 31, 2024 and we must give the Texas Partnership notice of its exercise no later than December 31, 2025. If the End-of-Term Option is not exercised, the parties may decide to renew and extend the arrangements relating to the Partnership Parks. Alternatively, if the End-of-Term Option is not exercised, the Partnership Park entities may be sold and the proceeds applied to redeem the outstanding interests in the Georgia Partnership and Texas Partnership, as applicable. If the End-of-Term Option is exercised, the price offered, and required to be accepted by the holders' of the limited units we do not then own would, is based on the agreed-upon value of the partnerships included in the original agreements, multiplied by the change in the Consumer Price Index ("CPI") between the beginning and end of the agreement. The agreements for Georgia Partnership and the Texas Partnership began in 1997 and 1998, respectively. The agreed-upon value for the partnerships, when the agreements were executed, was $250.0 million and $374.8 million for SFOG and SFOT, respectively. As of December 31, 2023, the agreed upon value, as adjusted for CPI, would be $483.5 million and $712.7 million for SFOG and SFOT, respectively. The agreed upon values, if determined as of December 31, 2023, multiplied by the 68.5% and 45.9% of units held by the limited partner for SFOG and SFOT, respectively, represent $330.9 million and $332.6 million that would be required to be paid to the limited partner of SFOG and SFOT, respectively, if the End-of-Term Option were to be exercised. The actual agreed upon value for the End-of-Term Option will be further adjusted by CPI until the end of the each respective agreement. The decision to exercise, or not exercise, the End-of-Term Option for either of SFOT or SFOG will ultimately be made based on numerous factors, including prevailing macro-economic and industry conditions and the cost and availability of financing to fund the purchase.
Off-Balance Sheet Arrangements
We had no off-balance sheet arrangements as of
January 1,December 31, 2023.
Set forth below is certain information regarding our debt and purchase obligations as of January 1,December 31, 2023:
| | | | | | | | | | | | | | | | | | | | | | | | | | | | | |
| For the year ended |
| (Amounts in thousands) | 2024 | | 2025 - 2026 | | 2027 - 2028 | | 2029 and beyond | | Total |
Interest on long-term debt(1) | $ | 166,213 | | | $ | 277,075 | | | $ | 154,154 | | | $ | 137,750 | | | $ | 735,192 | |
Purchase obligations(2) | 161,327 | | | 54,250 | | | 8,000 | | | 96,000 | | | 319,577 | |
| Total | $ | 327,540 | | | $ | 331,325 | | | $ | 162,154 | | | $ | 233,750 | | | $ | 1,054,769 | |
| | | | | | | | | | | | | | | |
| | For the year ended |
(Amounts in thousands) | | 2023 | | 2024 - 2025 | | 2026 - 2027 | | 2028 and beyond | | Total |
Interest on long-term debt (1) | | $ | 138,556 | | $ | 214,151 | | $ | 49,991 | | $ | — | | $ | 402,698 |
Purchase obligations (2) | | | 112,843 | | | 8,000 | | | 8,000 | | | 100,000 | | | 228,843 |
Total | | $ | 251,399 | | $ | 222,151 | | $ | 57,991 | | $ | 100,000 | | $ | 631,541 |
(1)See Note 8 - Long-term Indebtedness to the consolidated financial statements in Item 8 of this Annual Report for further discussion on long-term debt. Amounts shown reflect variable interest rates in effect at December 31, 2023. These figures do not include any assumed interest on our current or potential future revolving credit facility nor do these figures contemplate potential future debt instruments issued in any future refinancing of any of our existing debt instruments on or before their contractual maturities. (2)Represents obligations as of December 31, 2023 with respect to insurance, inventory, media and advertising commitments, license fees, computer systems and hardware, and new rides and attractions. Of the amount shown for 2024 and 2025, approximately $61.2 million and $46.3 million, respectively, represent contractual
(1) | See Note 8 to the consolidated financial statements in Item 8 of this Annual Report for further discussion on long-term debt. Amounts shown reflect variable interest rates in effect at January 1, 2023. |
(2) | Represents obligations as of January 1, 2023 with respect to insurance, inventory, media and advertising commitments, license fees, computer systems and hardware, and new rides and attractions. Of the amount shown for 2023, approximately $38.1 million represents marketable capital items. The amount for the Warner Bros. license fee is an estimate based on the current amount payable under the license agreement, which is subject to periodic adjustments, and is therefore subject to change. Amounts for new rides and attractions are computed as of January 1, 2023 and include estimates of costs needed to complete such improvements that, in certain cases, are not contractually committed at that date. Amounts do not include obligations to employees that cannot be quantified as of January 1, 2023, which are discussed below. Amounts do not include purchase obligations existing at the individual park-level for supplies and other miscellaneous items, none of which are individually material. |
commitments for capital expenditures. The amounts included for certain license fees is based on the pricing in effect as of December 31, 2023, which is subject to periodic adjustments, and is therefore subject to change. Amounts for new rides and attractions are computed as of December 31, 2023. Amounts do not include normal-course purchase orders for recurring goods and services.Other Obligations
During the years ended December 31, 2023, January 1, 2023 and January 2, 2022, we did not make any contributions to our defined benefit pension plan. During the year ended December 31, 2020, we made contributions to our defined benefit pension plan of $1.5 million. Our pension plan was "frozen" effective March 31, 2006, pursuant to which most participants (excluding certain union employees whose benefits have subsequently been frozen) no longer continued to earn future pension benefits. Effective February 16, 2009, the remaining participants in the pension plan no longer earned future benefits. See Note 13 -Pension Benefits, to the consolidated financial statements in Item 8 of this Annual Report for more information on our defined benefit pension benefit plan. We do not anticipate making any further contributions to our pension plan based on our current funded status. We plan to contribute to our 401(k) Plan in 2023,2024, and our estimated expense for employee health insurance for 20232024 is approximately $14$14 million. We maintain insurance of the type and in amounts that we believe is commercially reasonable and that is available to businesses in our industry. See "Insurance" under "Item"Item 1. Business"Business" of this Annual Report. Our insurance premiums and retention levels have remained relatively constant during the three-year period ended January 1, 2023. We cannot predict the level of the premiums that we may be required to pay for subsequent insurance coverage, the level of any retention applicable thereto, the level of aggregate coverage available or the availability of coverage for specific risks. We may from time to time seek to retire our outstanding debt through cash purchases and/or exchanges for equity securities, in open market purchases, privately negotiated transactions or otherwise. Such repurchases or exchanges, if any, will depend on the prevailing market conditions, our liquidity requirements, contractual restrictions and other factors. The amounts involved may be material. We expect we may be required to seek additional financing to refinance all or a significant portion of our existing debt on or prior to maturity.
The vast majority of our capital expenditures in 2023 and beyond are expected to be made on a discretionary basis.
Recently Issued Accounting Pronouncements
In March 2020, FASB issued ASU 2020-04, Reference Rate Reform (Topic 848): Facilitation of the Effects of Reference Rate Reform on Financial Reporting (“Update 2020-04”), which provides optional expedients and exceptions for applying U.S. GAAP principles to contracts, hedging relationships and other transactions affected by reference rate reform if certain criteria are met. The amendments in Update 2020-04 apply only to contracts, hedging relationships and other transactions that reference LIBOR or another reference rate expected to be discontinued because of reference rate reform. The expedients and exceptions provided by the amendments do not apply to contract modifications made and hedging relationships entered into or evaluated after December 31, 2022, except for hedging relationships existing as of December 31, 2022, that an entity has elected optional expedients for and that are retained through the end of the hedging relationship. The provisions in Update 2020-04 are effective upon issuance and can be applied prospectively through December 31, 2022. Our adoption of ASU 2020-04 did not have a material impact on our consolidated financial statements and related disclosures.
ITEM 7A.QUANTITATIVE AND QUALITATIVE DISCLOSURES ABOUT MARKET RISK
We are exposed to market risks relating to fluctuations in interest rates and currency exchange rates. The objective of our financial risk management is to minimize the negative impact of interest rate and foreign currency exchange rate fluctuations on our
operations,operating results and cash
flows and equity.flows. We do not acquire market risk sensitive instruments for trading purposes or speculative purposes.
In June 2019, we entered into three separate interest rate swap agreements with a notional amount of $300.0 million (the “June 2019 Swap Agreements”). In August 2019, we entered into two separate interest rate swap agreements with a notional amount of $400.0 million (the “August 2019 Swap Agreements”). These swaps were entered into to mitigate the risk of an increase in the
LIBOR interestborrowing rate on the
Second Amended and Restated Term Loan B by exchanging the floating
LIBOR rate for a negotiated fixed rate. The term of the June 2019 Swap Agreements
beginsbegan in June 2019 and
expiresexpired in June 2023. The term of the August 2019 Swap Agreements
beginsbegan in August 2019 and expires in August 2024. Upon execution, we designated and documented both swap agreements as cash flow hedges. The swap agreements serve as economic hedges and provide protection against rising interest rates.
In March 2020, we executed a strategy commonly known as a “blend and extend” on $100.0 million of the June 2019 Swap Agreements (the “Modified June 2019 Swap Agreement”) that extended the length of one of the June 2019 Swap Agreements through April 2026. We extended the existing pay-fixed swap rate over a longer period than its original term at a lower interest rate, while maintaining the same
overallnotional value of the swap. The remaining $200.0 million of the June 2019 Swap Agreements (the “Unmodified June 2019 Swap Agreements”) did not change. Upon execution, we designated and documented the Modified June 2019 Swap Agreement as a cash flow hedge. The Modified June 2019 Swap Agreement serves as an economic hedge and provides protection against rising interest rates.
On April 22, 2020, we repaid $315.0 million of the
Second Amended and Restated Term Loan B. In conjunction, the June 2019 Swap Agreements and the Modified June 2019 Swap Agreement were de-designated,
sinceas the hedged items were no longer probable to occur due to the repayment of the debt. As a result, $14.9 million was reclassified from accumulated other comprehensive loss to interest expense in the consolidated statement of operations. Consistent with company policy, we hold and issue derivative instruments for risk management purposes only and do not utilize derivative instruments for trading or speculative purposes. Accordingly, in April 2020 we entered into $300.0 million of notional amount counter-agreements (the “April 2020 Counter-agreements”) designed to economically offset the impact of the de-designated swap agreements.
On March 24, 2022, we terminated the August 2019 Swap Agreements for net cash proceeds of $7.4 million. The swap agreements were used as economic hedges against rising interest rates and had been designated as cash flow hedges prior to termination. We recorded the settlement in accumulated other comprehensive income in the amount of $7.7 million which will be amortized through September 2024 until the maturity of the
Second Amended and Restated Term Loan B.
The following is an analysis of the sensitivity of the market value, operations and cash flows of our market risk financial instruments to hypothetical changes in interest rates as if these changes occurred as of January 1, 2023. The range of potential change in the market chosen for this analysis reflects our view of changes that are reasonably possible over a one-year period. Market values are the present values of projected future cash flows based on the interest rate assumptions. These forward-looking disclosures are selective in nature and only address the potential impacts from financial instruments. They do not include other potential effects which could impact our business as a result of these changes in interest and foreign currency exchange rates.
As of January 1,December 31, 2023, we had total long-term debt excluding the impactprincipal amount of debt issuance costs and discountsindebtedness, inclusive of $2,393.4$180.0 million drawn on our Revolving Credit Facility of $2,380.9 million, of which $1,814.4$1,721.9 million representswas comprised of fixed-rate debt. The remaining $579.0$659.0 million balance representswas comprised of floating-rate debt.debt for which the interest rate is floating. For fixed-rate debt, interest rate changes affect the fair market value but do not impact book value, operations or cash flows. Conversely, for floating-rate debt, interest rate changes generally do not affect the fair market value but do impact future operations and cash flows, assuming other factors remain constant.
Assuming other variables remain constant (such as foreign exchange rates and debt levels), the pre-tax operating and cash flow impact resulting from a one percentage point increase in interest rates would be approximately $5.8$6.6 million. See Note 8 - Long-Term Indebtedness to the consolidated financial statements included elsewhere in this Annual Report for information on interest rates under our debt agreements.
ITEM 8.FINANCIAL STATEMENTS AND SUPPLEMENTARY DATA
SIX FLAGS ENTERTAINMENT CORPORATION
Index to Consolidated Financial Statements
Management’s Report on Internal Control Over Financial Reporting
Our management is responsible for establishing and maintaining adequate internal control over financial reporting, as such term is defined in Exchange Act Rule 13a-15(f). Under the supervision and with the participation of our management, including our Chief Executive Officer and Chief Financial Officer, we conducted an evaluation of the effectiveness of our internal control over financial reporting based on the framework in Internal Control—Integrated Framework (2013) issued by the Committee of Sponsoring Organizations of the Treadway Commission. Based on our evaluation under the framework in Internal Control—Integrated Framework (2013), our management concluded that our internal control over financial reporting was effective as of January 1, 2023. The effectiveness of our internal control over financial reporting as of January 1,December 31, 2023 has been audited by KPMG LLP, the independent registered public accounting firm that audited our financial statements included herein, as stated in their report which is included herein.
| | | | | |
| | /s/ SELIM BASSOUL |
| | Selim Bassoul
|
| President and Chief Executive Officer |
|
|
| | /s/ GARY MICK |
| | Gary Mick
|
| Chief Financial Officer |
March 7, 2023
Report of Independent Registered Public Accounting Firm
To the Stockholders and Board of Directors
Six Flags Entertainment Corporation:
Opinions on the Consolidated Financial Statements and Internal Control Over Financial Reporting
We have audited the accompanying consolidated balance sheets of Six Flags Entertainment Corporation and subsidiaries (the Company) as of
January 1,December 31, 2023 and January
2, 2022,1, 2023, the related consolidated statements of operations, comprehensive income,
(loss), equity (deficit),stockholders’ deficit, and cash flows for each of the fiscal years ended
December 31, 2023, January 1, 2023,
and January 2, 2022,
and December 31, 2020, respectively, and the related notes (collectively, the consolidated financial statements). We also have audited the Company’s internal control over financial reporting as of
January 1,December 31, 2023, based on criteria established in
Internal Control – Integrated Framework (2013) issued by the Committee of Sponsoring Organizations of the Treadway Commission.
In our opinion, the consolidated financial statements referred to above present fairly, in all material respects, the financial position of the Company as of January 1,December 31, 2023 and January 2, 2022,1, 2023, and the results of its operations and its cash flows for each of the fiscal years ended December 31, 2023, January 1, 2023, and January 2, 2022, and December 31, 2020, respectively, in conformity with U.S. generally accepted accounting principles. Also in our opinion, the Company maintained, in all material respects, effective internal control over financial reporting as of January 1,December 31, 2023 based on criteria established in Internal Control – Integrated Framework (2013) issued by the Committee of Sponsoring Organizations of the Treadway Commission.
Basis for Opinions
The Company’s management is responsible for these consolidated financial statements, for maintaining effective internal control over financial reporting, and for its assessment of the effectiveness of internal control over financial reporting, included in the accompanying
Management’sManagement's Report on Internal Control Over Financial Reporting. Our responsibility is to express an opinion on the Company’s consolidated financial statements and an opinion on the Company’s internal control over financial reporting based on our audits. We are a public accounting firm registered with the Public Company Accounting Oversight Board (United States) (PCAOB) and are required to be independent with respect to the Company in accordance with the U.S. federal securities laws and the applicable rules and regulations of the Securities and Exchange Commission and the PCAOB.
We conducted our audits in accordance with the standards of the PCAOB. Those standards require that we plan and perform the audits to obtain reasonable assurance about whether the consolidated financial statements are free of material misstatement, whether due to error or fraud, and whether effective internal control over financial reporting was maintained in all material respects.
Our audits of the consolidated financial statements included performing procedures to assess the risks of material misstatement of the consolidated financial statements, whether due to error or fraud, and performing procedures that respond to those risks. Such procedures included examining, on a test basis, evidence regarding the amounts and disclosures in the consolidated financial statements. Our audits also included evaluating the accounting principles used and significant estimates made by management, as well as evaluating the overall presentation of the consolidated financial statements. Our audit of internal control over financial reporting included obtaining an understanding of internal control over financial reporting, assessing the risk that a material weakness exists, and testing and evaluating the design and operating effectiveness of internal control based on the assessed risk. Our audits also included performing such other procedures as we considered necessary in the circumstances. We believe that our audits provide a reasonable basis for our opinions.
Definition and Limitations of Internal Control Over Financial Reporting
A company’s internal control over financial reporting is a process designed to provide reasonable assurance regarding the reliability of financial reporting and the preparation of financial statements for external purposes in accordance with
generally accepted accounting principles. A company’s internal control over financial reporting includes those policies and procedures that (1) pertain to the maintenance of records that, in reasonable detail, accurately and fairly reflect the transactions and dispositions of the assets of the company; (2) provide reasonable assurance that transactions are recorded as necessary to permit preparation of financial statements in accordance with generally accepted accounting principles, and that receipts and expenditures of the company are being made only in accordance with authorizations of management and directors of the company; and (3) provide reasonable assurance regarding prevention or timely detection of unauthorized acquisition, use, or disposition of the company’s assets that could have a material effect on the financial statements.
Because of its inherent limitations, internal control over financial reporting may not prevent or detect misstatements. Also, projections of any evaluation of effectiveness to future periods are subject to the risk that controls may become inadequate because of changes in conditions, or that the degree of compliance with the policies or procedures may deteriorate.
Critical Audit Matter
The critical audit matter communicated below is a matter arising from the current period audit of the consolidated financial statements that was communicated or required to be communicated to the audit committee and that: (1) relates to accounts or disclosures that are material to the consolidated financial statements and (2) involved our especially challenging, subjective, or complex judgments. The communication of a critical audit matter does not alter in any way our opinion on the consolidated financial statements, taken as a whole, and we are not, by communicating the critical audit matter below, providing a separate opinion on the critical audit matter or on the accounts or disclosures to which it relates.
Estimated redemption rate used to determine multi-use offering programs deferred revenue
As discussed in Notes
2(l)2(m) and 3 to the consolidated financial statements, guests enrolled in the Company’s multi-use offering programs, including season pass and membership programs, can visit parks an unlimited number of times during the specified period. For such programs, the Company estimates a redemption rate based on historical experience and other factors and assumptions the Company believes to be customary and reasonable and recognizes a pro-rata portion of the revenue as the guests visit the parks. The Company reviews the estimated redemption rate on an ongoing basis and revises it as necessary throughout the year. As of
January 1,December 31, 2023,
$129$128 million of deferred revenue was recorded related to the consideration received for multi-use offering programs and other offerings in excess of redemptions.
We identified the evaluation of the estimated redemption rate used to determine the multi-use offering programs deferred revenue as a critical audit matter. Subjective auditor judgment was required to evaluate the Company’s assumptions about how future guest attendance patterns may differ from historical attendance patterns due to changes in the parks’ operations.
The following are the primary procedures we performed to address this critical audit matter. We evaluated the design and tested the operating effectiveness of certain internal controls over the Company’s multi-use offering programs deferred revenue process, including controls related to the development of the estimated redemption rate. We assessed outstanding multi-use offering sales utilized by the Company to derive the deferred revenue balance by comparing it to relevant underlying sales documentation. We tested the mathematical accuracy and consistent application of the deferred revenue calculations supporting the recorded deferred revenue account balance. We compared actual guest visits in the current year to the estimated redemption rates. We developed an independent expectation of the deferred revenue balances related to outstanding multi-use offerings programs and compared such expectation to the recorded amount.
We have served as the Company’s auditor since 1993.
Dallas, Texas
March 7, 2023
SIX FLAGS ENTERTAINMENT CORPORATION
Consolidated Balance Sheets
| | | | | | |
| | As of |
| | January 1, 2023 | | January 2, 2022 |
(Amounts in thousands, except share data) | | | | | |
ASSETS | | | | | | |
Current assets: | | | | | | |
Cash and cash equivalents | | $ | 80,122 | | $ | 335,585 |
Accounts receivable, net | | | 49,405 | | | 97,722 |
Inventories | | | 44,811 | | | 27,273 |
Prepaid expenses and other current assets | | | 66,452 | | | 55,455 |
Total current assets | | | 240,790 | | | 516,035 |
Property and equipment, net: | | | | | | |
Property and equipment, at cost | | | 2,592,485 | | | 2,501,829 |
Accumulated depreciation | | | (1,350,739) | | | (1,250,902) |
Total property and equipment, net | | | 1,241,746 | | | 1,250,927 |
Other assets: | | | | | | |
Right-of-use operating leases, net | | | 158,838 | | | 186,754 |
Debt issuance costs | | | 2,764 | | | 4,899 |
Deposits and other assets | | | 17,905 | | | 6,170 |
Goodwill | | | 659,618 | | | 659,618 |
Intangible assets, net of accumulated amortization | | | 344,164 | | | 344,187 |
Total other assets | | | 1,183,289 | | | 1,201,628 |
Total assets | | $ | 2,665,825 | | $ | 2,968,590 |
| | | | | | |
LIABILITIES AND STOCKHOLDERS' DEFICIT | | | | | | |
Current liabilities: | | | | | | |
Accounts payable | | $ | 38,887 | | $ | 38,251 |
Accrued compensation, payroll taxes and benefits | | | 15,224 | | | 51,473 |
Accrued insurance reserves | | | 34,053 | | | 32,182 |
Accrued interest payable | | | 38,484 | | | 50,554 |
Other accrued liabilities | | | 67,346 | | | 74,290 |
Deferred revenue | | | 128,627 | | | 177,831 |
Short-term borrowings | | | 100,000 | | | — |
Short-term lease liabilities | | | 11,688 | | | 11,158 |
Total current liabilities | | | 434,309 | | | 435,739 |
Noncurrent liabilities: | | | | | | |
Long-term debt | | | 2,280,531 | | | 2,629,524 |
Long-term lease liabilities | | | 164,804 | | | 178,200 |
Other long-term liabilities | | | 30,714 | | | 36,969 |
Deferred income taxes | | | 184,637 | | | 148,291 |
Total noncurrent liabilities | | | 2,660,686 | | | 2,992,984 |
Total liabilities | | | 3,094,995 | | | 3,428,723 |
| | | | | | |
Redeemable noncontrolling interests | | | 521,395 | | | 522,067 |
| | | | | | |
Stockholders' deficit: | | | | | | |
Preferred stock, $1.00 par value | | | — | | | — |
Common stock, $0.025 par value, 280,000,000 shares authorized; 83,178,294 and 86,162,879 shares issued and outstanding at January 1, 2023 and January 2, 2022, respectively | | | 2,079 | | | 2,154 |
Capital in excess of par value | | | 1,104,051 | | | 1,120,084 |
Accumulated deficit | | | (1,985,500) | | | (2,023,251) |
Accumulated other comprehensive loss | | | (71,195) | | | (81,187) |
Total stockholders' deficit | | | (950,565) | | | (982,200) |
Total liabilities and stockholders' deficit | | $ | 2,665,825 | | $ | 2,968,590 |
| | | | | | | | | | | |
| As of |
| December 31, 2023 | | January 1, 2023 |
| (Amounts in thousands, except share data) | | | |
| ASSETS | | | |
| Current assets: | | | |
| Cash and cash equivalents | $ | 77,585 | | | $ | 80,122 | |
| Accounts receivable, net | 62,660 | | | 49,405 | |
| Inventories | 31,624 | | | 44,811 | |
| Prepaid expenses and other current assets | 80,897 | | | 66,452 | |
| Total current assets | 252,766 | | | 240,790 | |
| Property and equipment, at cost | 2,733,094 | | | 2,592,485 | |
| Accumulated depreciation | (1,447,861) | | | (1,350,739) | |
| Total property and equipment, net | 1,285,233 | | | 1,241,746 | |
| Goodwill | 659,618 | | | 659,618 | |
| Intangible assets, net of accumulated amortization | 344,141 | | | 344,164 | |
| Right-of-use operating leases, net | 134,857 | | | 158,838 | |
| Other assets, net | 34,859 | | | 20,669 | |
| Total assets | $ | 2,711,474 | | | $ | 2,665,825 | |
| LIABILITIES AND STOCKHOLDERS' DEFICIT | | | |
| Current liabilities: | | | |
| Accounts payable | $ | 27,235 | | | $ | 38,887 | |
| Accrued compensation, payroll taxes and benefits | 18,957 | | | 15,224 | |
| Self-insurance reserves | 64,605 | | | 34,053 | |
| Accrued interest payable | 28,704 | | | 38,484 | |
| Other accrued liabilities | 73,087 | | | 67,346 | |
| Deferred revenue | 127,556 | | | 128,627 | |
| Current portion of long-term debt | 56,867 | | | — | |
| Short-term borrowings | 180,000 | | | 100,000 | |
| Short-term lease liabilities | 10,514 | | | 11,688 | |
| Total current liabilities | 587,525 | | | 434,309 | |
| Noncurrent liabilities: | | | |
| Long-term debt, net | 2,128,612 | | | 2,280,531 | |
| Long-term lease liabilities | 155,335 | | | 164,804 | |
| Other long-term liabilities | 27,263 | | | 30,714 | |
| Deferred income taxes | 189,700 | | | 184,637 | |
| Total liabilities | 3,088,435 | | | 3,094,995 | |
| Redeemable non-controlling interests | 520,998 | | | 521,395 | |
| Stockholders' deficit: | | | |
| Preferred stock, $1.00 par value | — | | | — | |
| Common stock, $0.025 par value, 280,000,000 shares authorized; 84,124,014 and 83,178,294 shares issued and outstanding at December 31, 2023 and January 1, 2023, respectively | 2,112 | | | 2,079 | |
| Capital in excess of par value | 1,131,208 | | | 1,119,222 | |
| Accumulated deficit | (1,961,603) | | | (2,000,671) | |
| Accumulated other comprehensive loss | (69,676) | | | (71,195) | |
| Total stockholders' deficit | (897,959) | | | (950,565) | |
| Total liabilities and stockholders' deficit | $ | 2,711,474 | | | $ | 2,665,825 | |
See accompanying notes to consolidated financial statements.
SIX FLAGS ENTERTAINMENT CORPORATION
Consolidated Statements of Operations
| | | | | | | | | | |
| | | Year Ended |
(Amounts in thousands, except per share data) | | | January 1, 2023 | | January 2, 2022 | | December 31, 2020 |
Park admissions | | | $ | 735,415 | | $ | 795,649 | | $ | 202,646 |
Park food, merchandise and other | | | | 570,965 | | | 655,451 | | | 126,306 |
Sponsorship, international agreements and accommodations | | | | 51,856 | | | 45,805 | | | 27,623 |
Total revenues | | | | 1,358,236 | | | 1,496,905 | | | 356,575 |
Operating expenses (excluding depreciation and amortization shown separately below) | | | | 591,560 | | | 647,250 | | | 389,726 |
Selling, general and administrative expenses (including stock-based compensation of $7,673, $21,462 and $19,530 in 2022, 2021 and 2020, respectively, and excluding depreciation and amortization shown separately below) | | | | 162,158 | | | 211,381 | | | 147,295 |
Costs of products sold | | | | 108,146 | | | 125,728 | | | 34,119 |
Other net periodic pension benefit | | | | (5,410) | | | (5,894) | | | (5,190) |
Depreciation and amortization | | | | 117,124 | | | 114,434 | | | 120,173 |
Loss on impairment of park assets | | | | 16,943 | | | — | | | — |
Loss on disposal of assets | | | | 3,927 | | | 12,137 | | | 7,689 |
Interest expense | | | | 143,217 | | | 152,901 | | | 155,411 |
Interest income | | | | (1,627) | | | (465) | | | (688) |
Loss on debt extinguishment | | | | 17,533 | | | — | | | 6,106 |
Other expense, net | | | | 4,126 | | | 18,122 | | | 24,993 |
Income (loss) before income taxes | | | | 200,539 | | | 221,311 | | | (523,059) |
Income tax expense (benefit) | | | | 46,960 | | | 49,622 | | | (140,967) |
Net income (loss) | | | | 153,579 | | | 171,689 | | | (382,092) |
Less: Net income attributable to noncontrolling interests | | | | (44,651) | | | (41,766) | | | (41,288) |
Net income (loss) attributable to Six Flags Entertainment Corporation | | | $ | 108,928 | | $ | 129,923 | | $ | (423,380) |
| | | | | | | | | | |
Weighted-average common shares outstanding: | | | | | | | | | | |
Basic: | | | | 84,366 | | | 85,708 | | | 84,800 |
Diluted: | | | | 84,695 | | | 86,651 | | | 84,800 |
| | | | | | | | | | |
Net earnings (loss) per average common share outstanding: | | | | | | | | | | |
Basic: | | | $ | 1.29 | | $ | 1.52 | | $ | (4.99) |
Diluted: | | | $ | 1.29 | | $ | 1.50 | | $ | (4.99) |
| | | | | | | | | | |
Cash dividends declared per common share | | | $ | — | | $ | — | | $ | 0.25 |
| | | | | | | | | | | | | | | | | |
| (Amounts in thousands, except per share data) | Year Ended |
| December 31, 2023 | | January 1, 2023 | | January 2, 2022 |
| Park admissions | $ | 743,657 | | | $ | 735,415 | | | $ | 795,649 | |
| Park food, merchandise and other | 614,036 | | | 570,965 | | | 655,451 | |
| Sponsorship, international agreements and accommodations | 68,210 | | | 51,856 | | | 45,805 | |
| Total revenues | 1,425,903 | | | 1,358,236 | | | 1,496,905 | |
| Operating expenses (excluding depreciation and amortization shown separately below) | 622,952 | | | 590,660 | | | 646,369 | |
| Selling, general and administrative expenses (including stock-based compensation of $11,387, $15,218 and $23,556 in 2023, 2022 and 2021, respectively, and excluding depreciation and amortization shown separately below) | 247,883 | | | 169,403 | | | 213,181 | |
| Costs of products sold | 110,397 | | | 108,146 | | | 125,728 | |
| Depreciation and amortization | 115,086 | | | 117,124 | | | 114,434 | |
| Loss on impairment of park assets | 22,956 | | | 16,943 | | | — | |
| Loss on disposal of assets | 16,393 | | | 3,927 | | | 12,137 | |
| Operating income | 290,236 | | | 352,033 | | | 385,056 | |
| Interest expense, net | 158,256 | | | 141,590 | | | 152,436 | |
| Loss on debt extinguishment | 13,982 | | | 17,533 | | | — | |
| Other (income) expense, net | 9,208 | | | (84) | | | 13,403 | |
| Income before income taxes | 108,790 | | | 192,994 | | | 219,217 | |
| Income tax expense | 22,290 | | | 46,960 | | | 49,622 | |
| Net income | 86,500 | | | 146,034 | | | 169,595 | |
| Less: Net income attributable to non-controlling interests | (47,501) | | | (44,651) | | | (41,766) | |
| Net income attributable to Six Flags Entertainment Corporation | $ | 38,999 | | | $ | 101,383 | | | $ | 127,829 | |
| | | | | |
| Weighted-average common shares outstanding: | | | | | |
| Basic: | 83,410 | | 84,366 | | 85,708 |
| Diluted: | 83,935 | | 84,695 | | 86,651 |
| | | | | |
| Net earnings per average common share outstanding: | | | | | |
| Basic: | $ | 0.47 | | | $ | 1.20 | | | $ | 1.49 | |
| Diluted: | $ | 0.46 | | | $ | 1.20 | | | $ | 1.48 | |
| | | | | |
| | | | | |
See accompanying notes to consolidated financial statements.
SIX FLAGS ENTERTAINMENT CORPORATION
Consolidated Statements of Comprehensive Income
(Loss)
| | | | | | | | | |
| | Year Ended |
(Amounts in thousands) | | January 1, 2023 | | January 2, 2022 | | December 31, 2020 |
Net income (loss) | | $ | 153,579 | | $ | 171,689 | | $ | (382,092) |
Other comprehensive income (loss), net of tax: | | | | | | | | | |
Foreign currency translation adjustment (1) | | | (1,271) | | | (3,691) | | | (4,053) |
Defined benefit retirement plan (2) | | | 3,535 | | | 10,146 | | | (6,259) |
Change in cash flow hedging (3) | | | 7,728 | | | 8,862 | | | (11,482) |
Other comprehensive income (loss), net of tax | | | 9,992 | | | 15,317 | | | (21,794) |
Comprehensive income (loss) | | | 163,571 | | | 187,006 | | | (403,886) |
Less: Comprehensive income attributable to noncontrolling interests | | | (44,651) | | | (41,766) | | | (41,288) |
Comprehensive income (loss) attributable to Six Flags Entertainment Corporation | | $ | 118,920 | | $ | 145,240 | | $ | (445,174) |
(1) | Foreign currency translation adjustment is presented net of tax benefit of $0.1 million for the year ended January 1, 2023, and net of tax expense of $0.9 million and $1.2 million for the years ended January 2, 2022, and December 31, 2020, respectively. |
(2) | Defined benefit retirement plan is presented net of tax expense of $1.2 million and $3.4 million for the years ended January 1, 2023, and January 2, 2022, respectively, and net of tax benefit of $2.1 million for the year ended December 31, 2020. |
(3) | Change in cash flow hedging is presented net of tax expense of $2.6 and $3.0 million for the years ended January 1, 2023, and January 2, 2022, respectively, and net of tax benefit of $3.8 million for the years ended December 31, 2020. |
| | | | | | | | | | | | | | | | | |
| (Amounts in thousands) | Year Ended |
| December 31, 2023 | | January 1, 2023 | | January 2, 2022 |
| Net income | $ | 86,500 | | | $ | 146,034 | | | $ | 169,595 | |
| Other comprehensive income, net of tax: | | | | | |
Foreign currency translation adjustment (1) | 2,365 | | | (1,271) | | | (3,691) | |
Defined benefit retirement plan (2) | 1,541 | | | 3,535 | | | 10,146 | |
Change in cash flow hedging (3) | (2,387) | | | 7,728 | | | 8,862 | |
| Other comprehensive income, net of tax | 1,519 | | | 9,992 | | | 15,317 | |
| Comprehensive income | 88,019 | | | 156,026 | | | 184,912 | |
| Less: Comprehensive income attributable to non-controlling interests | (47,501) | | | (44,651) | | | (41,766) | |
| Comprehensive income attributable to Six Flags Entertainment Corporation | $ | 40,518 | | | $ | 111,375 | | | $ | 143,146 | |
(1)Foreign currency translation adjustment is presented net of tax expense of $0.8 million and $0.9 million for the years ended December 31, 2023, and January 2, 2022, respectively, and net of tax benefit of $0.1 million for the year ended January 1, 2023.
(2)Defined benefit retirement plan is presented net of tax expense of $0.5 million, $1.2 million and $3.4 million for the years ended December 31, 2023, January 1, 2023 and January 2, 2022 respectively.
(3)Change in cash flow hedging is presented net of tax benefit of $0.8 million for the year ended December 31, 2023, and net of tax expense of $2.6 million and $3.0 million for the years ended January 1, 2023 and January 2, 2022, respectively.
See accompanying notes to consolidated financial statements.
SIX FLAGS ENTERTAINMENT CORPORATION
Consolidated Statements of
Equity (Deficit)
| | | | | | | | | | | | | | | | | |
| | | | | | | | Accumulated | | |
| | | | Capital in | | | | other | | Total |
| | Common stock | | excess of | | Accumulated | | comprehensive | | stockholders' |
(Amounts in thousands, except share data) | | Shares issued | | Amount | | par value | | deficit | | loss | | deficit |
Balances at December 31, 2019 | | 84,633,845 | | $ | 2,116 | | $ | 1,066,223 | | $ | (1,709,747) | | $ | (74,710) | | $ | (716,118) |
Issuance of common stock | | 371,182 | | | 8 | | | 2,237 | | | — | | | — | | | 2,245 |
Stock-based compensation | | — | | | — | | | 19,530 | | | — | | | — | | | 19,530 |
Dividends declared to common stockholders | | — | | | — | | | — | | | (21,165) | | | — | | | (21,165) |
Payment of tax withholdings on equity-based compensation through shares withheld | | (2,291) | | | — | | | (54) | | | — | | | — | | | (54) |
Employee stock purchase plan | | 73,165 | | | 2 | | | 1,281 | | | — | | | — | | | 1,283 |
Fresh start valuation adjustment for SFOT units purchased | | — | | | — | | | — | | | 924 | | | — | | | 924 |
Change in redemption value of partnership units | | — | | | — | | | (18) | | | — | | | — | | | (18) |
Net loss attributable to Six Flags Entertainment Corporation | | — | | | — | | | — | | | (423,380) | | | — | | | (423,380) |
Other comprehensive loss, net of tax | | — | | | — | | | — | | | — | | | (21,794) | | | (21,794) |
Balances at December 31, 2020 | | 85,075,901 | | $ | 2,126 | | $ | 1,089,199 | | $ | (2,153,368) | | $ | (96,504) | | $ | (1,158,547) |
Issuance of common stock | | 1,175,610 | | | 30 | | | 13,425 | | | — | | | — | | | 13,455 |
Stock-based compensation | | — | | | — | | | 21,462 | | | — | | | — | | | 21,462 |
Payment of tax withholdings on equity-based compensation through shares withheld | | (127,066) | | | (3) | | | (5,292) | | | — | | | — | | | (5,295) |
Employee stock purchase plan | | 38,434 | | | 1 | | | 1,290 | | | — | | | — | | | 1,291 |
Fresh start valuation adjustment for SFOT units purchased | | — | | | — | | | — | | | 194 | | | — | | | 194 |
Net income attributable to Six Flags Entertainment Corporation | | — | | | — | | | — | | | 129,923 | | | — | | | 129,923 |
Other comprehensive income, net of tax | | — | | | — | | | — | | | — | | | 15,317 | | | 15,317 |
Balances at January 2, 2022 | | 86,162,879 | | $ | 2,154 | | $ | 1,120,084 | | $ | (2,023,251) | | $ | (81,187) | | $ | (982,200) |
Issuance of common stock | | 435,921 | | | 11 | | | 1,028 | | | — | | | — | | | 1,039 |
Stock-based compensation | | — | | | — | | | 7,673 | | | — | | | — | | | 7,673 |
Repurchase of common stock | | (3,464,385) | | | (87) | | | (25,394) | | | (71,293) | | | — | | | (96,774) |
Payment of tax withholdings on equity-based compensation through shares withheld | | (9,903) | | | — | | | (267) | | | — | | | — | | | (267) |
Employee stock purchase plan | | 53,782 | | | 1 | | | 927 | | | — | | | — | | | 928 |
Fresh start valuation adjustment for SFOT units purchased | | — | | | — | | | — | | | 116 | | | — | | | 116 |
Net income attributable to Six Flags Entertainment Corporation | | — | | | — | | | — | | | 108,928 | | | — | | | 108,928 |
Other comprehensive income, net of tax | | — | | | — | | | — | | | — | | | 9,992 | | | 9,992 |
Balances at January 1, 2023 | | 83,178,294 | | $ | 2,079 | | $ | 1,104,051 | | $ | (1,985,500) | | $ | (71,195) | | $ | (950,565) |
Stockholders' Deficit
| | | | | | | | | | | | | | | | | | | | | | | | | | | | | | | | | | | |
| (Amounts in thousands, except share data) | Common stock | | Capital in
excess of
par value | | Accumulated
deficit | | Accumulated
other
comprehensive
loss | | Total
stockholders'
deficit |
| Shares issued | | Amount | | | | |
| Balances at December 31, 2020 | 85,075,901 | | $ | 2,126 | | | $ | 1,094,731 | | | $ | (2,158,900) | | | $ | (96,504) | | | $ | (1,158,547) | |
| Issuance of common stock | 1,175,610 | | 30 | | | 13,425 | | | — | | | — | | | 13,455 | |
| Stock-based compensation | — | | — | | | 23,556 | | | — | | | — | | | 23,556 | |
| Payment of tax withholdings on equity-based compensation through shares withheld | (127,066) | | (3) | | | (5,292) | | | — | | | — | | | (5,295) | |
| Employee stock purchase plan | 38,434 | | 1 | | | 1,290 | | | — | | | — | | | 1,291 | |
| Fresh start valuation adjustment for SFOT units purchased | — | | — | | | — | | | 194 | | | — | | | 194 | |
| Net income attributable to Six Flags Entertainment Corporation | — | | — | | | — | | | 127,829 | | | — | | | 127,829 | |
| Other comprehensive loss, net of tax | — | | — | | | — | | | — | | | 15,317 | | | 15,317 | |
| Balances at January 2, 2022 | 86,162,879 | | $ | 2,154 | | | $ | 1,127,710 | | | $ | (2,030,877) | | | $ | (81,187) | | | $ | (982,200) | |
| Issuance of common stock | 435,921 | | 11 | | | 1,028 | | | — | | | — | | | 1,039 | |
| Stock-based compensation | — | | — | | | 15,218 | | | — | | | — | | | 15,218 | |
| Repurchase of common stock | (3,464,385) | | (87) | | | (25,394) | | | (71,293) | | | — | | | (96,774) | |
| Payment of tax withholdings on equity-based compensation through shares withheld | (9,903) | | — | | | (267) | | | — | | | — | | | (267) | |
| Employee stock purchase plan | 53,782 | | 1 | | | 927 | | | — | | | — | | | 928 | |
| Fresh start valuation adjustment for SFOT units purchased | — | | — | | | — | | | 116 | | | — | | | 116 | |
| Net income attributable to Six Flags Entertainment Corporation | — | | — | | | — | | | 101,383 | | | — | | | 101,383 | |
| Other comprehensive income, net of tax | — | | — | | | — | | | — | | | 9,992 | | | 9,992 | |
| Balances at January 1, 2023 | 83,178,294 | | $ | 2,079 | | | $ | 1,119,222 | | | $ | (2,000,671) | | | $ | (71,195) | | | $ | (950,565) | |
| Issuance of common stock | 1,261,192 | | 41 | | | (32) | | | — | | | — | | | 9 | |
| Stock-based compensation | — | | — | | | 11,387 | | | — | | | — | | | 11,387 | |
| Payment of tax withholdings on equity-based compensation through shares withheld | (356,363) | | (9) | | | (310) | | | — | | | — | | | (319) | |
| Employee stock purchase plan | 40,891 | | 1 | | | 941 | | | — | | | — | | | 942 | |
| Fresh start valuation adjustment for SFOT units purchased | — | | — | | | — | | | 69 | | | — | | | 69 | |
| Net income attributable to Six Flags Entertainment Corporation | — | | — | | | — | | | 38,999 | | | — | | | 38,999 | |
| Other comprehensive income, net of tax | — | | — | | | — | | | — | | | 1,519 | | | 1,519 | |
| Balances at December 31, 2023 | 84,124,014 | | $ | 2,112 | | | $ | 1,131,208 | | | $ | (1,961,603) | | | $ | (69,676) | | | $ | (897,959) | |
See accompanying notes to consolidated financial statements.
SIX FLAGS ENTERTAINMENT CORPORATION
Consolidated Statements of Cash Flows
| | | | | | | | | |
| | Year Ended |
(Amounts in thousands) | | January 1, 2023 | | January 2, 2022 | | December 31, 2020 |
Cash flows from operating activities: | | | | | | | | | |
Net income (loss) | | $ | 153,579 | | $ | 171,689 | | $ | (382,092) |
Adjustments to reconcile net income (loss) to net cash provided by operating activities: | | | | | | | | | |
Depreciation and amortization | | | 117,124 | | | 114,434 | | | 120,173 |
Stock-based compensation | | | 7,673 | | | 21,462 | | | 19,530 |
Interest accretion on notes payable | | | 1,111 | | | 1,108 | | | 1,157 |
Loss on debt extinguishment | | | 17,533 | | | — | | | 6,106 |
Amortization of debt issuance costs | | | 7,097 | | | 7,911 | | | 6,535 |
Other, including loss on disposal of assets | | | 839 | | | 10,567 | | | (4,029) |
Deferred income taxes expense (benefit) | | | 30,638 | | | 39,618 | | | (134,198) |
Loss on impairment of park assets | | | 16,943 | | | — | | | — |
Change in accounts receivable | | | 48,648 | | | (61,245) | | | 71,654 |
Change inventories, prepaid expenses and other current assets | | | (28,856) | | | 29,265 | | | (19,452) |
Change in deposits and other assets | | | (11,720) | | | 924 | | | 5,604 |
Change in ROU operating leases | | | 11,410 | | | 9,905 | | | 4,477 |
Change in accounts payable, deferred revenue, accrued liabilities and other long-term liabilities | | | (79,585) | | | 12,078 | | | 79,075 |
Change in operating lease liabilities | | | (11,003) | | | (13,181) | | | 524 |
Change in accrued interest payable | | | (12,070) | | | (9,630) | | | 34,056 |
Net cash provided by (used in) operating activities | | | 269,361 | | | 334,905 | | | (190,880) |
| | | | | | | | | |
Cash flows from investing activities: | | | | | | | | | |
Additions to property and equipment | | | (116,589) | | | (121,742) | | | (100,878) |
Property insurance recoveries | | | 5,080 | | | — | | | 2,514 |
Purchase of identifiable intangible assets | | | — | | | (12) | | | — |
Proceeds from sale of assets | | | — | | | 53 | | | 7,470 |
Net cash used in investing activities | | | (111,509) | | | (121,701) | | | (90,894) |
| | | | | | | | | |
Cash flows from financing activities: | | | | | | | | | |
Repayment of borrowings | | | (460,000) | | | (2,000) | | | (526,510) |
Proceeds from borrowings | | | 200,000 | | | 2,000 | | | 884,000 |
Payment of debt issuance costs | | | — | | | — | | | (24,987) |
Stock repurchases | | | (96,774) | | | — | | | — |
Payment of cash dividends | | | (200) | | | (813) | | | (22,499) |
Proceeds from issuance of common stock | | | 1,039 | | | 14,486 | | | 3,528 |
Payment of tax withholdings on equity-based compensation through shares withheld | | | — | | | (5,295) | | | (54) |
Redemption premium payments on debt extinguishment | | | (12,600) | | | — | | | — |
Reduction in finance lease liability | | | (1,016) | | | (641) | | | (493) |
Purchase of redeemable noncontrolling interest | | | (556) | | | (1,115) | | | (4,976) |
Distributions to noncontrolling interests | | | (44,651) | | | (41,766) | | | (41,288) |
Net cash (used in) provided by financing activities | | | (414,758) | | | (35,144) | | | 266,721 |
| | | | | | | | | |
Effect of exchange rate on cash | | | 1,443 | | | (235) | | | (1,366) |
| | | | | | | | | |
Net (decrease) increase in cash and cash equivalents | | | (255,463) | | | 177,825 | | | (16,419) |
Cash and cash equivalents at beginning of period | | | 335,585 | | | 157,760 | | | 174,179 |
Cash and cash equivalents at end of period | | $ | 80,122 | | $ | 335,585 | | $ | 157,760 |
| | | | | | | | | |
Supplemental cash flow information | | | | | | | | | |
Cash paid for interest | | $ | 146,693 | | $ | 147,628 | | $ | 99,239 |
Cash paid for income taxes | | $ | 10,637 | | $ | 11,278 | | $ | 5,917 |
| | | | | | | | | | | | | | | | | |
| (Amounts in thousands) | Year Ended |
| December 31, 2023 | | January 1, 2023 | | January 2, 2022 |
| Cash flows from operating activities: | | | | | |
| Net income | $ | 86,500 | | | $ | 146,034 | | | $ | 169,595 | |
| Adjustments to reconcile net income to net cash provided by operating activities: | | | | | |
| Depreciation and amortization | 115,086 | | | 117,124 | | | 114,434 | |
| Stock-based compensation | 11,387 | | | 15,218 | | | 23,556 | |
| Interest accretion on notes payable | 924 | | | 1,111 | | | 1,108 | |
| Loss on debt extinguishment | 13,982 | | | 17,533 | | | — | |
| Amortization of debt issuance costs | 5,356 | | | 7,097 | | | 7,911 | |
| Loss on disposal of assets | 16,393 | | | 3,927 | | | 12,137 | |
| Deferred income taxes expense | 1,320 | | | 30,638 | | | 39,618 | |
| Loss on impairment of park assets | 22,956 | | | 16,943 | | | — | |
| Other | (4,195) | | | (3,088) | | | (1,570) | |
| Changes in operating assets and liabilities: | | | | | |
| (Increase) decrease in accounts receivable | (13,831) | | | 48,648 | | | (61,245) | |
| (Increase) decrease inventories, prepaid expenses and other current assets | (2,785) | | | (28,856) | | | 29,265 | |
| (Increase) decrease in deposits and other assets | 6,700 | | | (11,720) | | | 924 | |
| Decrease in ROU operating leases | 11,773 | | | 11,410 | | | 9,905 | |
| (Decrease) increase in accounts payable, deferred revenue, accrued liabilities and other long-term liabilities | 6,297 | | | (79,585) | | | 12,078 | |
| Decrease in operating lease liabilities | (10,610) | | | (11,003) | | | (13,181) | |
| Decrease in accrued interest payable | (9,780) | | | (12,070) | | | (9,630) | |
| Net cash provided by operating activities | 257,473 | | | 269,361 | | | 334,905 | |
| | | | | |
| Cash flows from investing activities: | | | | | |
| Additions to property and equipment | (171,814) | | | (116,589) | | | (121,742) | |
| Property insurance recoveries | 1,089 | | | 5,080 | | | — | |
| Purchase of identifiable intangible assets | — | | | — | | | (12) | |
| Proceeds from sale of assets | 488 | | | — | | | 53 | |
| Net cash used in investing activities | (170,237) | | | (111,509) | | | (121,701) | |
| | | | | |
| Cash flows from financing activities: | | | | | |
| Repayment of borrowings | (1,163,623) | | | (460,000) | | | (2,000) | |
| Proceeds from borrowings | 1,144,984 | | | 200,000 | | | 2,000 | |
| Payment of debt issuance costs | (19,678) | | | — | | | — | |
| Stock repurchases | — | | | (96,774) | | | — | |
| Payment of cash dividends | — | | | (200) | | | (813) | |
| Proceeds from issuance of common stock | — | | | 1,039 | | | 14,486 | |
| Payment of tax withholdings on equity-based compensation through shares withheld | (8,587) | | | — | | | (5,295) | |
| Redemption premium payments on debt extinguishment | — | | | (12,600) | | | — | |
| Reduction in finance lease liability | (999) | | | (1,016) | | | (641) | |
| Purchase of redeemable non-controlling interest | (328) | | | (556) | | | (1,115) | |
| Distributions to non-controlling interests | (47,533) | | | (44,651) | | | (41,766) | |
| Net cash used in financing activities | (95,764) | | | (414,758) | | | (35,144) | |
| | | | | |
| Effect of exchange rate on cash | 5,991 | | | 1,443 | | | (235) | |
| | | | | |
| Net (decrease) increase in cash and cash equivalents | (2,537) | | | (255,463) | | | 177,825 | |
| Cash and cash equivalents at beginning of period | 80,122 | | | 335,585 | | | 157,760 | |
| Cash and cash equivalents at end of period | $ | 77,585 | | | $ | 80,122 | | | $ | 335,585 | |
| | | | | |
| Supplemental cash flow information | | | | | |
| Cash paid for interest | $ | 164,571 | | | $ | 146,693 | | | $ | 147,628 | |
| Cash paid for income taxes | $ | 21,238 | | | $ | 10,637 | | | $ | 11,278 | |
See accompanying notes to consolidated financial statements.
1.
| Description of Business
|
1. Description of Business
We own and operate regional theme parks and water parks. We are the largest regional theme park operator in the world and the largest operator of water parks in North America.America based on the number of parks we operate. Of the 27 parks we currently own or operate, 24 parks are located in the United States, two parks are located in Mexico and one park is located in Montreal, Canada. On April 1, 1998, we acquired the former Six Flags Entertainment Corporation ("Former SFEC", a corporation that has been merged out of existence and that has always been a separate corporation from Holdings), which had operated regional theme parks and water parks under the Six Flags name for nearly 40 years and established an internationally recognized brand name. We own the "Six Flags" brand name in the United States and foreign countries throughout the world. To capitalize on this name recognition, 23 of our current parks are branded as "Six Flags" parks.
Merger Agreement with Cedar Fair
InflationOn November 2, 2023, Holdings, Cedar Fair, CopperSteel and Supply ChainOur operations canCopper Merger Sub entered into the Merger Agreement, providing for a merger of equals through (i) the merger of Copper Merger Sub with and into Cedar Fair (the “Cedar Fair First Merger”), with Cedar Fair continuing its existence as the surviving entity (the “Cedar Fair Surviving Entity”) following the Cedar Fair First Merger as a direct subsidiary of CopperSteel, (ii) the subsequent merger of the Cedar Fair Surviving Entity with and into CopperSteel (the “Cedar Fair Second Merger” and together with the Cedar Fair First Merger, the “Cedar Fair Mergers”), with CopperSteel continuing as the surviving corporation, and (iii) the subsequent merger of Six Flags with and into CopperSteel, with CopperSteel continuing as the surviving corporation (the “Six Flags Merger” and together with the Cedar Fair Mergers, the “Mergers”).If the Mergers are completed, subject to certain exceptions, (i) each issued and outstanding unit of limited partnership interest in Cedar Fair (each a “Cedar Fair Unit” and collectively, the “Cedar Fair Units”) will be impactedconverted into the right to receive one (1) share of common stock, par value $0.01 per share, of CopperSteel (the “CopperSteel Common Stock”), as may be adjusted pursuant to the Merger Agreement (the “Cedar Fair Exchange Ratio”), together with cash in lieu of fractional shares of CopperSteel Common Stock, without interest and (ii)each issued and outstanding share of Holdings common stock, par value $0.025 per share (the “Six Flags Common Stock”) will be converted into the right to receive 0.58 shares of CopperSteel Common Stock (as the same may be adjusted pursuant to the Merger Agreement, the “Six Flags Exchange Ratio”), together with cash in lieu of fractional shares of CopperSteel Common Stock, without interest. Subject to the terms of the Merger Agreement and applicable law, Six Flags will declare and set a record date for a special dividend to holder of record of Six Flags Common Stock as of the close of business one business day prior to the closing of the Mergers of (i) $1.00 plus (ii) the product (rounded to the nearest whole cent) of (a) the Six Flags Exchange Ratio and (ii) the aggregate amount of distributions per unit declared or paid by increasesCedar Fair with respect to a Cedar Fair Unit with a record date following November 2, 2023 and prior to the effective time of the Six Flags Merger, subject to certain adjustments provided under the Merger Agreement, the payment of which is contingent upon the consummation of the Mergers.
Upon consummation of the Mergers, Holdings and Cedar Fair will each have been merged with and into CopperSteel, with CopperSteel as the parent entity and successor corporation to Holdings and Cedar Fair. Upon closing, CopperSteel will be headquartered in prices, whether causedCharlotte, North Carolina, and is expected to change its name to “Six Flags Entertainment Corporation” and be listed on the New York Stock Exchange (“NYSE”) under the ticker symbol “FUN.”
The obligations of Holdings and Cedar Fair to complete the Mergers are subject to the satisfaction or waiver, in whole or in part (to the extent permitted by inflation or other economic drivers. Our business relies onapplicable law) of a large number of seasonal workers. Our labor costs continueconditions set forth in the Merger Agreement, a copy of which is attached as an exhibit to increase duethe Annual Report on Form 10-K. Completion of the Mergers requires, among other things, the adoption of the Merger Agreement by the Holdings stockholders.In connection with the Mergers, CopperSteel filed a registration statement on Form S-4 (the “Registration Statement) with the Securities and Exchange Commission (“Commission”), which includes a proxy statement with respect to shortagesthe stockholder meeting of qualified workersHoldings (the “Special Meeting”) to consider and competition from other employers. We continually seekadopt the Merger Agreement and a prospectus with respect to optimize and deploy our existing employees to both maximize revenue generating opportunities and provide the best guest experience. Hiring and retaining our workers continuesCopperSteel Common Stock to be a priorityissued in connection with the Mergers.The Registration Statement was declared effective by the Commission on January 31, 2024 and the proxy statement/prospectus will be mailed to avoid further labor shortages.Duestockholders of Holdings as of January 24, 2024, the record date established for voting on the Mergers at the Special Meeting to be held on March 12, 2024.
Stockholders of Holdings are encouraged to reach the proxy statement/prospectus, as well as the annexes thereto, and other documents to be filed with the Commission because the documents contain important information about Holdings, Cedar Fair and the Mergers.
Consummation of the Mergers is subject to antitrust review in the United States. Under the Hart-Scott-Rodino Antitrust Improvements Act of 1976, as amended (“HSR Act”), and the rules promulgated thereunder, the Mergers cannot be completed until the
parties to the COVID-19 pandemicMerger Agreement have given notification and Russia’s invasion of Ukraine, we have experienced widespread supply chain impacts. Supply chain disruptionfurnished information to the FTC and the DOJ, and until the applicable waiting period has continued for manyexpired or has been terminated.
On November 17, 2023 and November 20, 2023, the Premerger Notification Office of the
productsFederal Trade Commission accepted the premerger notification and
inputsreport forms under the HSR Act submitted by Holdings and Cedar Fair, respectively. On December 20, 2023, Holdings and Cedar Fair withdrew their respective premerger notification and report forms under the HSR Act, and refiled them on December 21, 2023. On January 22, 2024, Holdings and Cedar Fair each received a request for additional information and documentary materials (a “Second Request”) from the DOJ in connection with the DOJ’s review of the Mergers. The effect of a Second Request is to extend the waiting period imposed by the HSR Act, until 30 days after each of Holdings and Cedar Fair has substantially complied with the Second Request issued to it, unless that
weperiod is extended voluntarily by the parties or terminated earlier by the DOJ. Per the terms of the Merger Agreement, Cedar Fair and Holdings will use
in our parks, including food, merchandise and replacement parts. We have continuedtheir reasonable best efforts to
mitigate these impacts tocertify substantial compliance with the
extent possible by passing these costsSecond Request on
to our customers when possible.or before May 2, 2024.
2. Summary of Significant Accounting Policies
a. Basis of Presentation
2.
| Summary of Significant Accounting Policies
|
The consolidated financial statements include our accounts and the accounts of our wholly owned subsidiaries. We also consolidate the partnerships that own Six Flags Over Texas ("SFOT") and Six Flags Over Georgia (including Six Flags White Water Atlanta) ("SFOG," and together with SFOT, the "Partnership Parks") as subsidiaries in our consolidated financial statements as we have determined that we have the power to direct the activities of those entities that most significantly impact the entities’ economic performance and we have the obligation to absorb losses and receive benefits from the entities that can be potentially significant to these entities. The equity interests owned by non-affiliated parties in the Partnership Parks are reflected in the accompanying consolidated balance sheets as redeemable noncontrollingnon-controlling interests. The portion of earnings or loss attributable to non-affiliated parties in the Partnership Parks is reflected as net income attributable to noncontrollingnon-controlling interests in the accompanying consolidated statements of operations. See Note 6- Non-controlling interests for further discussion.
This Annual Report covers the period
January 2, 2023 through December 31, 2023 (“the year ended December 31, 2023” or “2023”). The comparison period in the prior year covers January 3, 2022 through January 1, 2023 (“the year ended January 1, 2023” or “2022”). The
comparisonyear ended January 2, 2022 covers the period
in the prior year coversbetween January 1, 2021 through January 2, 2022 (“the year ended January 2, 2022” or “2021”). The year ended January 2, 2022 contained three extra days due to the calendar change from calendar year reporting.
The year ended December 31, 2020, covers the period between January 1, 2020, through December 31, 2020 (“the year ended December 31, 2020” or “2020”).Intercompany transactions and balances have been eliminated in consolidation.
Certain previously reported amounts have been reclassified to conform to the current year presentation. During 2023, we reclassified the net pension-related expense (benefit) to other (income) expense, net, in our consolidated statements of operations. We have separated "(Gain) loss on disposal of assets" from "Other" on the consolidated statements of cash flows.
b. Revision of Previously Issued Financial Statements
TableDuring the third quarter of Contents
2023, we identified an accounting error for our stock-based compensation expense related to the recognition of expense for dividend equivalent rights ("DERs"). The error primarily relates to the inadvertent reversal of stock-based compensation expense for vested DERs for periods beginning in the first quarter of 2020 through the fourth quarter of 2022.We have assessed the error and concluded that it was not material to any prior periods. However, the aggregate amount of the error would have been material to our consolidated financial statements in the current period. Therefore, we have revised our previously issued financial statements. Prior periods not presented herein will be revised, as applicable, in future filings. Refer to Note 18 - Revision to Previously Reported Financial Information for additional information. c. Use of Estimates
The preparation of financial statements in conformity with accounting principles generally accepted in the United States requires management to make estimates and assumptions that affect the reported amounts of assets, liabilities, revenues and expenses and the disclosure of contingent assets and liabilities in our consolidated financial statements and accompanying notes. Actual results could differ from those estimates. We evaluate our estimates and assumptions on an ongoing basis using historical experience and other factors, including the current economic environment, which we believe to be reasonable under the circumstances. We adjust such estimates and assumptions when facts and circumstances dictate. As future events and their effects cannot be determined with
precision, actual results could differ significantly from these estimates. Changes in these estimates resulting from
continuing changes in
the economic environmentfacts and circumstances will be reflected in the financial statements in future periods.
d. Fair Value Measurement c.
| Fair Value Measurement
|
Financial Accounting Standards Board ("FASB") Accounting Standards Codification ("ASC") Topic 820, Fair Value Measurement, defines fair value as the exchange prices that would be received for an asset or paid to transfer a liability (an exit price) in the principal or most advantageous market for the asset or liability in an orderly transaction between market participants on the measurement date. The guidance also specifies a hierarchy of valuation techniques based on whether the inputs to those valuation techniques are observable or unobservable. Observable inputs reflect market data obtained from independent sources, while unobservable inputs reflect our market assumptions. In accordance with FASB ASC Topic 820, Fair Value Measurement, these two types of inputs have created the following fair value hierarchy:
| ● | Level 1:•Level 1: quoted prices in active markets for identical assets; •Level 2: inputs to the valuation methodology include quoted prices for similar assets and liabilities in active markets, and inputs that are observable for the asset or liability, either directly or indirectly, for substantially the full term of the instrument; and •Level 3: inputs to the valuation methodology are unobservable for the asset or liability. quoted prices in active markets for identical assets;
|
| ● | Level 2: inputs to the valuation methodology include quoted prices for similar assets and liabilities in active markets, and inputs that are observable for the asset or liability, either directly or indirectly, for substantially the full term of the instrument; and |
| ● | Level 3: inputs to the valuation methodology are unobservable for the asset or liability. |
The fair value of a financial instrument is the amount at which the instrument could be exchanged in a current transaction between willing parties. We use a market approach for our recurring fair value measurements, and we endeavor to use the best information available. Accordingly, valuation techniques that maximize the use of observable impacts are favored. We present the estimated fair values and classifications of our financial instruments in accordance with ASC Topic 820, Fair Value Measurement.
The following methods and assumptions were used to estimate the fair value of each class of financial instruments:
| ● | The carrying values of cash and cash equivalents, accounts receivable, notes receivable, accounts payable and accrued liabilities approximate fair value because of the short maturity of these instruments. |
| ● | The measurement of the fair value of long-term debt is based on market prices that generally are observable for similar liabilities at commonly quoted intervals and is considered a Level 2 fair value measurement. Refer to Note 8 for additional information. |
| ● | The measurement of the fair value of derivative assets and liabilities is based on market prices that generally are observable for similar assets and liabilities at commonly quoted intervals and is considered a Level 2 fair value measurement. Derivative assets and liabilities that have maturity dates equal to or less than twelve months from the balance sheet date are included in prepaid expenses and other current assets and other accrued liabilities, respectively. Derivative assets and liabilities that have maturity dates greater than twelve months from the balance sheet date are included in deposits and other assets and other long-term liabilities, respectively. See Note 7 for additional information on our derivative instruments. |
•The measurement of the fair value of long-term debt is based on market prices that generally are observable for similar liabilities at commonly quoted intervals and is considered a Level 2 fair value measurement. Refer to Note 8 - Long-term indebtedness for additional information. Cash equivalents consists of transaction settlements in process from credit card companies and short-term highly liquid investments with a remaining maturity as of the date of purchase of three months or less. For purposes of the consolidated statements of cash flows, we consider all highly liquid debt instruments with remaining maturities as of their date of purchase of three months or less to be cash equivalents. Cash equivalents were not significant as of
January 1,December 31, 2023 and January
2, 2022.1, 2023.
f. Inventories
Inventories are stated at lower of weighted average cost or net realizable value and primarily consist of products purchased for resale, including merchandise, food and miscellaneous supplies. Products are removed from inventory at weighted average cost. We have recorded a $0.4$0.7 million and a $0.3$0.4 million allowance for slow moving inventory as of December 31, 2023 and January 1, 2023, respectively.
g. Prepaid Expenses and
January 2, 2022, respectively.f.
| Prepaid Expenses and Other Current Assets
|
Other Current Assets
Prepaid expenses and other current assets include
$25.8$30.3 million and
$23.8$25.8 million of spare parts inventory for existing rides and attractions as of
January 1,December 31, 2023 and January
2, 2022.1, 2023. These items are expensed as the repair or maintenance of rides and attractions
occur.occur and the parts are consumed.
h. Advertising Costs
Production costs of commercials and programming are charged to operations in the year first aired. The costs of other advertising, promotion, and marketing programs are charged to operations when incurred with the exception of direct-response advertising which is charged to the period it will benefit. As of
December 31, 2023 and January 1, 2023,
and January 2, 2022, we had
$0.3 milliona nominal amount and
$2.7$0.3 million in prepaid advertising, respectively. The amounts capitalized are included in prepaid expenses.
Advertising and promotions expense was
$55.1 million, $37.3 million
$55.5 million and
$19.6$55.5 million for the years ended
December 31, 2023, January 1, 2023
and January 2, 2022,
and December 31, 2020, respectively. These amounts are presented within “Selling, general and administrative expenses”.
i. Debt Issuance Costs h.
| Debt Issuance Costs
|
We capitalize costs that are directly related to the issuance of debt. Debt issuance costs directly related to the Second Amended and Restated Revolving LoanCredit Facility are presented within other assets, as debt issuance costs innet on our consolidated balance sheets. Debt issuance costs directly related to the Second Amended and Restated Term Loam B and our senior unsecured notes are presented within noncurrent liabilities as a reduction of long-term debt in our consolidated balance sheets. The amortization of suchour debt issuance costs is recognized as interest expense using the effective interest method over the term of the respective debt issue.instrument. Amortization related to debt issuance costs was $5.4 million, $7.1 million $7.9 million and $6.5$7.9 million for the years ended December 31, 2023, January 1, 2023 and January 2, 2022, and December 31, 2020, respectively. See Note 8- Long-term Indebtedness for further discussion.
j. Property and equipment additionsEquipment
We regularly make capital investments for new rides and attractions in our parks. The costs incurred to purchase the rides, including installation and other costs necessary to bring the ride online are recorded at costcapitalized and the carrying value is depreciated using the straight-line method over the estimated useful lives of the assets. Maintenance and repair costs that do notCosts incurred to improve service potentialthe performance or extend economicthe useful life of our existing assets are charged directly to expensealso capitalized. Repair and maintenance costs for routine and recurring maintenance activities are expensed as incurred, while betterments and renewals are generally capitalized as property and equipment.incurred. When an itemasset is retired or otherwise disposed of, the cost and applicable accumulated depreciation are removed and the resulting gain or loss is recognized. See Note 4 - Property and Equipment for further detail of the components of our property and equipment. The estimated useful lives of theour major assets classes are as follows:
|
|
|
| | |
Rides and attractions | | 5 - 25 years |
Land improvements |
| 10 - 15 years |
Buildings and improvements |
| Approximately 30 years |
Furniture and equipment |
| 5 - 10 years |
j.
| Goodwill and Indefinite-Lived Intangible Assets
|
k. Goodwill and Indefinite-Lived Intangible Assets
Goodwill and indefinite-lived intangible assets with indefinite useful livesasset are tested for impairment annually, in the fourth quarter, or more frequently if events or circumstances indicate that the assets mightmay not be impaired.recoverable. We identify our reporting unit and determine the carrying value of the reporting unit by assigning the assets and liabilities, including the existing goodwill and intangible assets, to the reporting unit. We then determine the fair value of the reporting unit and compare it to the carrying amount of the reporting unit. AllWe have one operating segment and all of our parks are operated in a similar manner and have comparable characteristics in that theycharacteristics. Furthermore, our parks produce and distribute similar services and products using similar processes, have similar types of customers, are subject to similar regulations and exhibit similar economic characteristics. As such, Holdings iswe are a single reporting unit. For each year,As of December 31, 2023, the estimated fair value of Holdingsour single reporting unit exceeded its carrying amount, which is determined by comparing our market capitalization to our carrying amount. We usevalue. As we have a single reporting unit, we believe our market capitalization asis the best indicator of our reporting unit’s fair value as it best approximates the value of Holdings. value.
We perform a qualitative analysis on
our indefinite-lived intangible assets
to determine if it is more likely than not that the fair value of the intangible asset was less than its carrying amount as a basis for determining whether it was necessary to perform a quantitative impairment test.on an annual basis. The fair value of indefinite-lived intangible assets is generally determined based on a discounted cash flow analysis. An impairment loss occurs to the extent that the carrying value exceeds the fair value. For goodwill, if the fair value
l. Impairment of
the reporting unit were to be less than the carrying amount, an impairment loss would be recognized to the extent that the carrying amount of the reporting unit exceeds its fair value.k.
| Impairment of Long-Lived Assets
|
Property and Equipment
We review
long-lived assets, including finite-lived intangible assets subject to amortization,property and equipment for impairment upon the occurrence of events or changes in circumstances that would indicate that the carrying value of the asset or group of assets may not be recoverable.
Asset groups are tested at the level of the lowest identifiable group of assets that generate cash inflows that are largely independent of the cash inflows from other assets of groups of assets. We have determined that our lowest identifiable group of assets that generate cash inflows is at the individual theme park or water park level.
We test
or long-lived asset groupsour parks for impairment when changes in circumstances indicate that their carrying value may not be recoverable. Events that trigger a test for recoverability include material adverse changes in projected revenues or expenses, present cash flow losses combined with a history of cash flow losses,
and a forecast that demonstrates significant continuing losses or significant negative industry or economic concerns at either the local or macroeconomic level. If this evaluation indicates a triggering event has occurred, a test for recoverability is performed.
When a triggering event occurs, a
A test for recoverability is performed
by comparing projected undiscounted future cash flows to the carrying value of the theme park or water park. If the undiscounted forecasted cash flows are less than the carrying value of the
assets,park, the theme park’s or water park’s fair value is measured relying primarily on a discounted cash flow method. An impairment charge is recognized for the amount by which the carrying value of the theme park or water park exceeds its fair value. When an impairment loss is recognized for one of our parks, the adjusted carrying amounts are depreciated over their remaining useful life.
In measuring the fair value of one of our theme parks or water parks, we generally estimate the fair value of the asset group using the discounted cash flow income approach. This approach requires that we make cash flow projections based on assumptions and estimates derived from operating results, forecasts, expected growth rates and cost of capital. We also make certain assumptions about future economic conditions and other data.
During the year ended December 31, 2023, we determined that the carrying value of our leased theme park in Oklahoma City, Oklahoma, Frontier City ("Frontier City") and our leased water park in Oklahoma City, Oklahoma, Hurricane Harbor Oklahoma City ("HHOKC") were not recoverable following multiple years of negative cash flows, as well as projected future cash flows that indicated the respective assets were not recoverable. Based on the analysis performed, we determined that the carrying value of Frontier City and HHOKC exceeded their fair value, resulting in a pre-tax, non-cash loss on impairment of $16.0 million and $7.0 million, respectively. The loss on impairment at Frontier City was allocated proportionally, in the amount of $8.8 million and $7.1 million, to Right-of-use operating leases, net and Property and equipment, net, respectively. The loss on impairment at HHOKC was allocated proportionally, in the amount of $4.3 million and $2.7 million, to Right-of-use operating leases, net and Property and equipment, net, respectively.During the year ended January 1, 2023, we determined that our leased watertheme park outside ofin Houston, Texas, Six Flags Hurricane Harbor Splashtown (“Splashtown”("Splashtown") was not recoverable following threemultiple years of losses,negative cash flows, as well as projected future negative cash flows. Weflows that indicated the respective assets were not recoverable. Based on the analysis, we determined that the carrying value of Frontier City exceeded its fair value, resulting in a pre-tax, non-cash loss on impairment of $16.9 million. The loss on impairment was allocated proportionally, in the amount of $15.1 million and $1.8 million, to Right-of-use operating leases, net and Property and equipment, net, respectively.
For each park, we estimated the fair value of
Splashtownthe parks primarily using an income approach,
usingutilizing projected discounted cash flows. The valuation was based on unobservable inputs that require significant judgements for which information is limited, including assumptions regarding future attendance, per-capita guest spending, operating costs and capital requirements. The discount rate utilized in the model was our internal weighted-average-cost-of-capital, which we believe is reasonable and consistent with a rate that would be utilized by another market participant.
Based on this analysis, we determined that the carrying value of Splashtown exceeded its fair value, resulting in a pre-tax, non-cash loss on impairment of $16.9 million.The loss on impairment was allocated proportionally, in the amounts of $15.1 million and $1.8 million, to “Right-of-use operating leases, net” and “Property and equipment”, respectively on our consolidated balance sheet.
We account for revenue from contracts with customers based on the principle that revenue is recognized to depict the transfer of goods or services to customers in an amount that reflects the consideration to which the entity expects to be entitled in exchange for those goods or services.
m. Revenue Recognition
We recognize revenue upon admission into our parks, provision of our services, or when products are delivered to our guests. Revenues areRevenue is presented in the accompanying consolidated statements of operations net of sales taxes collected from our guests that are remitted or payable to government taxing authorities. For season passes, Six Flags Plus products in the initial twelve-month term, legacy memberships in the initial twelve-month term, and other multi-use admissions products, we estimate a redemption rate based on historical experience and other factors and assumptions we believe to be customary and reasonable and recognize a pro-rata portion of the revenue as the guests visitguest attends our parks. Amounts owed or received for multi-use admissions in excessFor any bundled products with multiple performance obligations, revenue is allocated using the retail price of redemptions areeach distinct performance obligation and revenue is recognized in deferred revenue.on a pro rata basis. In contrast to our season pass and other multi-use offerings (such as our all season dining pass program, which enables season passholderspass holders and members to eat meals and snacks any day they visit the park for one upfront payment) that expire at the end of each operating season, the Six Flags Plus product and membership program continues on a month-to-month basis after the initial twelve-month membership term and can be canceled any time after the initial term pursuant to the terms of the membership program. Guests enrolled in the membership program canthese offerings may visit our parks an unlimited number of times wheneveranytime the parks are open as long as the guest remains enrolled in the membership program.enrolled. We review the estimated redemption rate on an ongoing basis and revise it as necessary throughout the year, including impact of changes to our season pass and memberships
described above.
For any bundled products with multiple performance obligations, revenue is allocated using the retail priceAmounts owed or received for multi-use admissions in excess of
each distinct performance obligation and products thatredemptions are
not sold on a stand-alone basis are treated as residual.
In connection with the temporary closure of our parks due to COVID-19 in March 2020, we added one additional month of membership privileges for every month a member paid but could not visit their home park. The membership payments received while parks were temporarily closed due to the pandemic were includedrecognized in deferred revenue and will be recognized as revenue whenrevenue. For active participants in these additional months are utilized at the end of the respective membership periods. For memberships that remain active following the initial twelve-month term,programs, we recognize revenue monthly as payments are received.
received after the initial twelve-month term.
As of
January 1,December 31, 2023, deferred revenue was primarily comprised of (i) unredeemed season
passes, Six Flags Plus and all-season dining pass and all-season
diningflash pass revenue and (ii) membership payments received while parks were
closedclosing during COVID-19.
Certain contracts with customers, primarily membershipsseason passes and season passes,memberships, may include bundled products with multiple performance obligations. For such arrangements, we allocate revenue to each performance obligation based on its relative standalone selling price. We generally determine standalone selling prices based on the observable retail prices charged to customers and use residual for any products not sold on a stand-alone basis.allocated between performance obligations proportionally. We generally expense (i) sales commissions when incurred, and (ii) certain costs to obtain a contract where the amortization period would have been one year or less. These costs are recognized in "Selling, general and administrative expenses." We do not disclose the value of unsatisfied performance obligations for (i) contracts with an original expected length of one year or less or (ii) contracts for which we recognize revenue at the amount for which we have the right to invoice for services performed. For certain of our contracts that have an original expected length of one year or less, we use the practical expedient applicable to such contracts and do not consider the time value of money.
We have entered into international agreements to assist a third party in the planning, design, development and operation of a Six Flags-branded park outside of North America.in Saudi Arabia, Six Flags Qiddiya. These agreements consist of a brand licensing agreement, project services agreement, and management services agreement. We treat these agreements as one contract because they were negotiated with a single commercial objective. We have identified three distinct promises within the agreement with the third party partner as brand licensing, project services and management services. Each of these promises is its own performance obligation and distinct, as the third party could benefit from each service on its own with other readily available resources, and each service is separately identifiable from other services in the context of the contract. We recognize revenue under our international agreements over the relevant service period of each performance obligation based on its relative stand-alone selling price, as determined by our best estimate of selling price. We review the service period of each performance obligation on an ongoing basis and revise it as necessary throughout the year.necessary. Revisions to the relevant service periods of the performance obligations may result in revisions to revenue in future periods and are recognized in the period in which the change is identified.
m.
| Accounts Receivable, Net
|
n. Accounts Receivable, Net
Accounts receivable are reported at net realizable value and consist primarily of amounts due from guests for the sale of group outings and multi-use admission products, including
theseason passes purchased with our flexible payment options and Six Flags Plus products and our legacy membership program. We are not exposed to a significant concentration of credit risk, however, based on the age of the receivables, our historical experience and other factors and assumptions we believe to be customary and reasonable, we
do record an allowance for doubtful accounts. As of
January 1,December 31, 2023 and January
2, 2022,1, 2023, we have recorded an allowance for doubtful accounts of
$4.1$4.2 million and
$13.8$4.1 million, respectively. The allowance for doubtful accounts is primarily comprised of estimated defaults under our
membership plans and season passes
purchased with
flexible payment
plans.n.
| Derivative Instruments and Hedging Activities
|
options, and Six Flags Plus products.
o. Derivative Instruments and Hedging Activities
We recognize all derivatives as either assets or liabilities in the consolidated balance sheet and measure those instruments at fair value. If certain conditions are met, a derivative may be specifically designated as a hedge for accounting purposes. The accounting for changes in the fair value of a derivative (e.g., gains and losses) depends on the intended use of the derivative and the resulting designation.
We formally document all relationships between hedging instruments and hedged items, as well as our risk-management objective and our strategy for undertaking various hedge transactions. This process includes linking all derivatives that are designated as cash flow hedges to forecasted transactions. We also assess, both at the hedge’s inception and on an ongoing basis, whether the derivatives that are used in hedging transactions are highly effective in offsetting changes in cash flows of hedged items.
Change in the fair value of a derivative that is effective and that is designated and qualifies as a cash-flow hedge are recorded in other comprehensive
(loss) income until operations are affected by the variability in cash flows of the designated hedged item, at which point they are reclassified to interest expense. Change in fair value of a derivative that is not designated as a hedge are recorded in other expense, net in the consolidated statements of operations on a current basis.
See Note 7 - Derivative Financial Instruments for a further discussion.
p. Commitments and Contingencies o.
| Commitments and Contingencies
|
We are involved in various lawsuits and claims that arise in the normal course of business. Amounts associated with lawsuits or claims are reserved for matters in which it is believed that losses are probable and can be reasonably estimated. In addition to matters in which it is believed that losses are probable, disclosure is also provided for matters in which the likelihood of an unfavorable outcome is at least reasonably possible but for which a reasonable estimate of loss or range of loss is not possible. Legal fees are expensed as incurred. See
Note 15 - Commitments and Contingencies for further discussion. q. Income TaxesIncome taxes are accounted for under the asset and liability method. Deferred tax assets and liabilities are recognized for the future tax consequences attributable to differences between the financial statement carrying amounts of existing assets and liabilities and their respective tax bases, including net operating loss and other tax carryforwards. Deferred tax assets and liabilities are measured using enacted tax rates expected to apply to taxable income in the years in which those differences are expected to be recovered or settled. The effect on deferred tax assets and liabilities of a change in tax rates is recognized in operations in the period that includes the enactment date. We have a valuation allowanceallowance of $96.0$93.6 million and $107.4and $96.0 million as of January 1,December 31, 2023 and January 2, 2022,1, 2023, respectively, due to uncertainties related to our ability to utilize some of our deferred tax assets, primarily consisting of certain state net operating loss, foreign tax credits and other tax carryforwards, before they expire. The valuation allowance was based on our estimates of taxable income by jurisdiction in which we operate and the period over which our deferred tax assets were recoverable. We expect to generate taxable income that will allow for the utilization of all of our federal net operating loss carryforwards.
Our liability for income taxes is finalized as auditable tax years pass their respective statutes of limitations in the various jurisdictions in which we are subject to tax. However, these jurisdictions may audit prior years for which the statute of limitations is closed for the purpose of making an adjustment to our taxable income in a year for which the statute of limitations has not closed. Accordingly, taxing authorities of these jurisdictions may audit prior years
of the group and its predecessors for the purpose of adjusting net operating loss carryforwards to years for which the statute of limitations has not closed.
We classify interest and penalties attributable to income taxes as part of income tax expense.
As ofDuring the years ended December 31, 2023 and January 1, 2023,
and January 2, 2022, we had no accruedthe expense recognized for interest and penalties
liability.was not material.
Because we do not permanently reinvest foreign earnings, United States deferred income taxes have been provided on unremitted foreign earnings to the extent that such foreign earnings are expected to be taxable upon repatriation.
For global intangible low taxed income ("GILTI") under the Tax Cuts and Jobs Act, we have elected to account for GILTI as a component of tax expense in the period in which we are subject to the rules (the "period cost method").
r. Earnings Per Common Share
Basic earnings
(loss) per common share is computed by dividing net income
(loss) attributable to
Holdings’ common stockholders by the weighted average number of common shares outstanding for the period. Diluted earnings per common share is computed by dividing net income attributable to
Holdings’ common stockholders by the weighted average number of common shares outstanding during the period including the effect of all dilutive common stock equivalents using the treasury stock method. In periods for which there is a net loss, diluted loss per common share is equal to basic loss per common share, since the effect of including any common stock equivalents would be antidilutive.
s. Stock-Based Compensation r.
| Stock-Based Compensation
|
Pursuant to the Six Flags Entertainment Corporation Long-Term Incentive Plan (the "Long-Term Incentive Plan"), Holdingswe may grant stock options, stock appreciation rights, restricted stock, restricted stock units, unrestricted stock, deferred stock units, performance and cash-settled awards and dividend equivalents to select employees, officers, directors and consultants of Holdings and its affiliates.consultants. We recognize the fair value of each grant as compensation expense on a straight-line basis over the vesting period using the graded vesting terms of the respective grant. The fair value of stock option grants is estimated on the date of grant using the Black-Scholes option pricing valuation model. The fair value of stock, restricted stock units and restricted stock awards is the quoted market price of Holdings’ stockour common shares on the date of grant. See Note 10- Stock Benefit Plans for further discussion of stock-based compensation and related disclosures.
s.
| Comprehensive Income (Loss)
|
t. Comprehensive Income
Comprehensive income
(loss) consists of net income,
(loss), changes in the foreign currency translation adjustment, changes in the fair value of derivatives that are designated as hedges and changes in the net actuarial gains
(losses) and amortization of prior service costs on our defined benefit retirement plan.
t.
| Redeemable Noncontrolling Interest
|
u. Redeemable Non-controlling Interest
We record the carrying amount of our redeemable
noncontrollingnon-controlling interests at their fair value at the date of issuance. We recognize the changes in their redemption value immediately as they occur and adjust the carrying value of these redeemable
noncontrollingnon-controlling interests to equal the redemption value at the end of each reporting period, if greater than the redeemable
noncontrollingnon-controlling interest carrying value.
This method would view the end of the reporting period as if it were also the redemption date for the redeemable
noncontrollingnon-controlling interests. We conduct an annual review to determine if the fair value of the redeemable units is less than the redemption amount. If the fair value of the redeemable units is less than the redemption amount, there would be a charge to
earnings per share allocable to common stockholders.earnings. The redemption amount at the end of each reporting period did not exceed the fair value of the redeemable units.
v. Leases
We enter into various
noncancelablenon-cancelable operating and finance leases, primarily for operating rights to amusement parks, land, office space, warehouses, office equipment and machinery. We determine if an arrangement is or contains a lease at contract inception and recognize a right-of-use ("ROU") asset and lease liability at the lease commencement date.
For both our operating and finance leases, the lease liability is initially and subsequently measured at the present value of the unpaid lease payments at the lease commencement date. Key estimates and judgments include how we determine (i) the discount rate used to discount the unpaid lease payments to present value, (ii) the lease term and (iii) the lease payments. We discount our unpaid lease payments using the interest rate implicit in the lease or, if that rate cannot be readily determined,
itsour incremental borrowing rate ("IBR"). Generally, we cannot determine the interest rate implicit in the lease and therefore we use the IBR as a discount rate for our leases. The IBR reflects the rate of interest we would pay on a collateralized basis to borrow an amount equal to the lease payments under similar terms. The lease term for all of our leases includes the noncancelable period of the lease plus any additional periods covered by an option to extend the lease that are reasonably certain to be executed by us. Lease payments included in the measurement of the lease liability comprise fixed payments owed over the lease term, variable lease payments that depend on an index or rate, and the exercise price of an option to purchase the underlying asset if it is reasonably certain that we will exercise the option.
The ROU asset is initially measured at cost, which comprises the initial amount of lease liability adjusted for lease payments made at or before the lease commencement date, plus any initial direct costs incurred, less any lease incentives received. For our operating leases, the ROU asset is subsequently measured throughout the lease term at the carrying amount of the lease liability, plus initial direct costs, and adjusted for any prepaid or accrued lease payments, less the unamortized balance of lease incentives received. Lease expense for lease payments is recognized on a straight-line basis over the term of the operating lease.
Variable lease payments associated with our leases are recognized upon the occurrence of the event, activity, or circumstance in the lease agreement on which those payments are assessed. Variable lease payments for operating leases are presented as operating expense in our consolidated statements of operations in the same line item as expense arising from fixed lease payments. Property taxes and insurance paid on behalf of our lessors is included within variable lease payments.
Operating lease ROU assets net of accumulated amortization are presented as "Right-of-useright-of-use operating leases, net"net on the consolidated balance sheets. The current portion of operating lease liabilities is presented as "Short-term operatingshort-term lease liabilities"liabilities and the long-term portion is presented separately as "Long-term operatinglong-term lease liabilities"liabilities on the consolidated balance sheets.
Finance lease ROU assets are presented within “Propertyproperty and equipment, at cost”cost and the related lease amortization within “Accumulated depreciation”accumulated depreciation on our consolidated balance sheets. The current portion of the finance lease liabilities is presented as “Short-termshort-term lease liabilities”liabilities and the long-term portion is presented separately as “Long-termlong-term lease liabilities”liabilities on our consolidated balance sheets. We have elected not to recognize ROU assets and lease liabilities for short-term leases that have a lease term of 12 months or less. We recognize the lease payments associated with short-term leases as an expense on a straight-line basis over the lease term. Variable lease payments associated with short-term leases are recognized and presented in the same manner as for all other leases.
The ROU assets for operating leases may be periodically reduced by impairment losses. We use the long-lived assets impairment guidance to determine whether an ROU asset is impaired and if so, the amount of the impairment loss to recognize. We monitor for events or changes in circumstances that require a reassessment of one of our leases. When a reassessment results in the remeasurement of a lease liability, an adjustment is made to the carrying amount of the corresponding ROU asset unless doing so would reduce the carrying amount of the ROU asset to an amount less than zero. In that case, the amount of the adjustment that would result in a negative ROU asset balance is recorded in our consolidated statements of operations.
We incurred an impairment charge of $13.2 million and $15.1 million related to our right-of-use operating leases, net during the year ended December 31, 2023 and January 1, 2023.2023, respectively. See Note 4 - Property and Equipment for more information. w. Recent Accounting Pronouncements Not Yet Adopted v.
| Recently Accounting Pronouncements Not Yet Adopted
|
In March 2020, FASBNovember 2023, the Financial Accounting Standards Board ("FASB") issued Accounting Standards Update ("ASU") 2023-07,
Segment Reporting, to improve reportable segment disclosure requirements, primarily through enhanced disclosures about significant segment expenses. This ASU 2020-04, Reference Rate Reform (Topic 848): Facilitation of the Effects of Reference Rate Reform on Financial Reporting (“Update 2020-04”), which provides optional expedients and exceptionsis effective for applying U.S. GAAP principles to contracts, hedging relationships, and other transactions affected by reference rate reform if certain criteria are met. The amendments in Update 2020-04 apply only to contracts, hedging relationships, and other transactions that reference LIBOR or another reference rate expected to be discontinued because of reference rate reform. The expedients and exceptions provided by the amendments do not apply to contract modifications made and hedging relationships entered into or evaluatedfiscal years beginning after December 31, 2022, except for hedging relationships existing as15, 2023, and interim periods within fiscal years beginning after December 15, 2024. Early adoption is permitted. We are currently evaluating the impact of December 31, 2022, that an entity has elected optional expedients for and that are retained through the end of the hedging relationship. The provisions in Update 2020-04 are effective upon issuance and can be applied prospectively through December 31, 2022. Interest on the Second Amended and Restated Credit Facility accrues at an annual rate of LIBOR. We do not expect Update 2020-04 to have a material effectthis standard on our consolidated financial statements.statements and related disclosures.
In December 2023, the FASB issued ASU 2023-09, Income Taxes, requiring more granular disclosure of the components of income taxes. This ASU is effective for fiscal years beginning after December 15, 2024 on a prospective basis. Early adoption is permitted. We are currently evaluating the impact of this standard on our consolidated financial statements and related disclosures.
3. Revenue
Revenues are recognized when control of the promised goods or services is transferred to our customers in an amount that reflects the consideration we expect to be entitled to in exchange for those goods or services. Sales and other taxes we collect concurrent with revenue-producing activities are excluded from revenue. Incidental items that are immaterial in the context of the contract are recognized as expense.
The following tables present our revenues disaggregated by contract duration for the years ended December 31, 2023, January 1, 2023 and January 2, 2022, and December 31, 2020, respectively. Long-term and short-term contracts consist of our contracts with customers with terms greater than one year and less than or equal to one year, respectively.
| | | | | | | | | | | | | | | | | | | | | | | |
| Year Ended December 31, 2023 |
| (Amounts in thousands) | Park admissions | | Park food, merchandise and other | | Sponsorship, international agreements and accommodations | | Total |
| Long-term contracts | $ | 67,008 | | | $ | 7,249 | | | $ | 9,071 | | | $ | 83,328 | |
Short-term contracts and other (a) | 676,649 | | | 606,787 | | | 59,139 | | | 1,342,575 | |
| Total revenues | $ | 743,657 | | | $ | 614,036 | | | $ | 68,210 | | | $ | 1,425,903 | |
| | | | | | | | | | | | | | | | | | | | | | | |
| Year Ended January 1, 2023 |
| (Amounts in thousands) | Park Admissions | | Park food, merchandise and other | | Sponsorship, international agreements and accommodations | | Total |
| Long-term contracts | $ | 65,207 | | | $ | 10,266 | | | $ | 24,342 | | | $ | 99,815 | |
Short-term contracts and other (a) | 670,208 | | | 560,699 | | | 27,514 | | | 1,258,421 | |
| Total revenues | $ | 735,415 | | | $ | 570,965 | | | $ | 51,856 | | | $ | 1,358,236 | |
| | | | | | | | | | | | | | | | | | | | | | | |
| Year Ended January 2, 2022 |
| (Amounts in thousands) | Park Admissions | | Park food, merchandise and other | | Sponsorship, international agreements and accommodations | | Total |
| Long-term contracts | $ | 237,932 | | | $ | 28,347 | | | $ | 33,371 | | | $ | 299,650 | |
Short-term contracts and other (a) | 557,717 | | | 627,104 | | | 12,434 | | | 1,197,255 | |
| Total revenues | $ | 795,649 | | | $ | 655,451 | | | $ | 45,805 | | | $ | 1,496,905 | |
| | | | | | | | | | | | |
| | Year Ended January 1, 2023 |
| | | | | | | | Sponsorship, | | | |
| | | | | Park Food, | | International | | | |
| | | | | Merchandise | | Agreements and | | | |
(Amounts in thousands) | | Park Admissions | | and Other | | Accommodations | | Consolidated |
Long-term contracts | | $ | 65,207 | | $ | 10,266 | | $ | 24,342 | | $ | 99,815 |
Short-term contracts and other (a) | | | 670,208 | | | 560,699 | | | 27,514 | | | 1,258,421 |
Total revenues | | $ | 735,415 | | $ | 570,965 | | $ | 51,856 | | $ | 1,358,236 |
| | | | | | | | | | | | |
| | Year Ended January 2, 2022 |
| | | | | | | | Sponsorship, | | | |
| | | | | Park Food, | | International | | | |
| | | | | Merchandise | | Agreements and | | | |
(Amounts in thousands) | | Park Admissions | | and Other | | Accommodations | | Consolidated |
Long-term contracts | | $ | 237,932 | | $ | 28,347 | | $ | 33,371 | | $ | 299,650 |
Short-term contracts and other (a) | | | 557,717 | | | 627,104 | | | 12,434 | | | 1,197,255 |
Total revenues | | $ | 795,649 | | $ | 655,451 | | $ | 45,805 | | $ | 1,496,905 |
| | | | | | | | | | | | |
| | Year Ended December 31, 2020 |
| | | | | | | | Sponsorship, | | | |
| | | | | Park Food, | | International | | | |
| | | | | Merchandise | | Agreements and | | | |
(Amounts in thousands) | | Park Admissions | | and Other | | Accommodations | | Consolidated |
Long-term contracts | | $ | 28,627 | | $ | 2,431 | | $ | 20,762 | | $ | 51,820 |
Short-term contracts and other (a) | | | 174,019 | | | 123,875 | | | 6,861 | | | 304,755 |
Total revenues | | $ | 202,646 | | $ | 126,306 | | $ | 27,623 | | $ | 356,575 |
(a)Other revenues primarily include sales of single-day tickets and short-term transactional sales for which we have the right to invoice.
(a) | Other revenues primarily include sales of single-day tickets and short-term transactional sales for which we have the right to invoice. |
Long-term Contracts
Our long-term contracts consist of season passes purchased by customers in the year preceding the operating season to which they relate, sponsorship contracts and international agreements with third parties. We earn season pass revenue when our customers purchase a season pass for a fixed fee, which entitles the customer to visit our parks, including certain water parks, throughout the duration of the parks’ operating season. We earn sponsorship revenue from separately-priced contracts with third parties pursuant to which we sell and advertise the third party’s products within the parks in exchange for consideration. Advertisements may include, but are not limited to, banners, signs, radio ads, association with certain events, sponsorship of rides within our parks and retail promotions. We earnWith respect to our international agreements, we earn revenue pursuant to arrangements in which we assist in the development and management of Six Flags-branded parks outside of North America. Within our international agreements, we have identified three distinct performance obligations as brand licensing, project services and management services. We do not consider revenue recognized for the performance obligations related to our international agreements to be significant, neither individually nor in the aggregate, to any period presented. See Note 12 - Summary of Significant Accounting Policies for additional information on our accounting for performance obligations under these contracts. The transaction price for our long-term contracts is explicitly stated within the contracts. Our sponsorship contracts and international agreements may include estimated variable consideration such as penalties for delay in performance of contract terms, and certain volume-based discounts and rebates. We do not believe there will be significant changes to our estimates of variable consideration. Our brand licensing and management services performance agreements include royalty payments and management fees, respectively, based on gross sales from Six Flags-branded parks once opened. We have elected to apply the sales-based royalty exemption to the brand licensing performance obligation, and accordingly, do not estimate revenue attributable to the gross sales-based royalty. We have also elected to apply the
direct allocation exemption to the management services performance obligation, and accordingly, do not estimate revenue attributable to the gross sales-based management fee.
We recognize season pass revenue in "Park admissions"park admissions and “Parkpark food, merchandise and other”other over the estimated redemption rate,period, as we believe this appropriately depicts the transfer of service to our customers. We estimate the redemption rate based on historical experience and other factors and assumptions that we believe to be customary and reasonable. We review the estimated redemption rate regularly, on an ongoing basis, and revise itmake revisions as necessary throughout the year.necessary. Amounts received for multi-use admissions products in excess of redemptions are recognized in "Deferred revenue." We recognize sponsorship and international agreements revenue over the term of the agreements using the passage of time as a measure of completeour satisfaction of the performance obligations in "Sponsorship,sponsorship, international agreements and accommodations."accommodations. Amounts received for unsatisfied sponsorship and international agreements performance obligations are recognized in "Deferred revenue."At January 1, 2021, $77.6 million of unearned
deferred revenue associated with outstanding long-term contracts was reported in “Deferred revenue,” and $86.2 million was recognized as revenue for long-term contracts during the year ended January 2, 2022. As of January 2, 2022, the total unearned amount of revenue for remaining long-term contract performance obligations was $58.7 million. our consolidated balance sheets. At January 3, 2022, $58.7 million of unearned revenue associated with outstanding long-term contracts was reported in "Deferred“Deferred revenue,"” and $86.3 million was recognized as revenue for long-term contracts during the year ended January 1, 2023. As of January 1, 2023, the total unearned amount of revenue for remaining long-term contract performance obligations was $33.5 million. At January 2 2023, $33.5 million of unearned revenue associated with outstanding long-term contracts was reported in "Deferred revenue," and $48.9 million was recognized as revenue for long-term contracts during the year ended December 31, 2023. As of January 1,December 31, 2023, the total unearned amount of revenue for remaining long-term contract performance obligations was $89.2 million.
As of December 31, 2023, we expect to recognize estimated revenue for partially or wholly unsatisfied performance obligations on long-term contracts of approximately
$43.9$105.9 million in
2023, $6.92024, $9.2 million in
2024, $0.92025, $7.1 million in
20252026 and
$0.9$6.4 million in
20262027 and
$0.3$6.4 million in
20272028 and thereafter.
Short-term Contracts and Other
Our short-term contracts consist primarily of season passes, Six Flags Plus and memberships with customers, certain sponsorship contracts and international agreements with third parties. We earn revenue from a customer’s purchase of our season pass, Six Flags Plus and membership products, which entitles the customer to visit our parks, including certain water parks, throughout the duration of
the parks’ operating season for a fixed fee. Some membership and season pass products include other benefits and discounts for our guests during their visits. We earn sponsorship and international agreements revenue from contracts with third parties, pursuant to which we sell and advertise the third party’s products within our parks on a short-term basis that generally coincides with our annual operating season, and pursuant to certain activities in connection with our international agreements. The transaction price for our short-term contracts is explicitly stated within the contracts.
We generally recognize revenue from short-term contracts over the passage of time, with the exception of season pass and membership revenues. We estimate the redemption rate based on historical experience and other factors and assumptions we believe to be customary and reasonable. We review the estimated redemption rate regularly and on an ongoing basis and revise it as
necessary throughout the year.necessary. Amounts received for multi-use admissions
products in excess of redemptions are recognized in "Deferred revenue."
Other revenues consist primarily of revenues from single-day tickets for entrance to our parks, in-park services (such as the sale of food and beverages, merchandise, games and attractions, standalone parking sales and other services inside our parks), accommodations revenue, and other miscellaneous products and services. Due to the short-term transactional nature of such purchases, we apply the practical expedient to recognize revenue for single-day ticket sales, in-park services, accommodations, and other miscellaneous services and goods for which we have the right to invoice.
Arrangements with Multiple Performance Obligations
Certain contracts with customers, primarily season passes and memberships, may include bundled products with multiple performance obligations. For such arrangements, we allocate revenue to each performance obligation based on its relative standalone selling price. We generally determine standalone selling prices based on the observable retail prices charged to customers and use residual for any products not sold on a stand-alone basis.allocated between performance obligations proportionally. We generally expense
(i) sales commissions when incurred, and (ii) certain costs to obtain a contract where the amortization period would have been one year or less. These costs are recognized in "Selling, general and administrative expenses." We do not disclose the value of unsatisfied performance obligations for (i) contracts with an original expected length of one year or less or (ii) contracts for which we recognize revenue at the amount for which we have the right to invoice for services performed. For certain of our contracts that have an original expected length of one year or less, we use the practical expedient applicable to such contracts and do not consider the time value of money.
Practical Expedients and Exemptions
We generally expense (i) sales commissions when incurred, and (ii) certain costs to obtain a contract where the amortization period would have been one year or less. These costs are recorded within Selling,selling, general and administrative expenses.expenses
in our consolidated statements of operations. We do not disclose the value of unsatisfied performance obligations for (i) contracts with an original expected length of one year or less and (ii) contracts for which we recognize revenue at the amount for which we have the right to invoice for services performed.
For certain of our contracts that have an original expected length of one year or less, we use the practical expedient applicable to such contracts and do not consider the time value of money.
4. Property and Equipment
As of
December 31, 2023, and January 1, 2023,
and January 2, 2022, property and equipment was classified as follows:
| | | | | | | | | | | |
| Year Ended |
| (Amounts in thousands) | December 31, 2023 | | January 1, 2023 |
| Land | $ | 219,453 | | | $ | 219,453 | |
| Land improvements | 325,795 | | | 315,140 | |
| Buildings and improvements | 361,262 | | | 342,258 | |
| Rides and attractions | 1,423,907 | | | 1,305,781 | |
| Equipment and other | 402,677 | | | 409,853 | |
| Property and equipment, at cost | 2,733,094 | | | 2,592,485 | |
| Accumulated depreciation | (1,447,861) | | | (1,350,739) | |
| Property and equipment, net | $ | 1,285,233 | | | $ | 1,241,746 | |
Table of Contents | | | | | | |
| | Year Ended |
(Amounts in thousands) | | January 1, 2023 | | January 2, 2022 |
Land | | $ | 219,453 | | $ | 219,453 |
Land improvements | | | 315,140 | | | 300,756 |
Buildings and improvements | | | 342,258 | | | 328,251 |
Rides and attractions | | | 1,305,781 | | | 1,238,671 |
Equipment and other | | | 409,853 | | | 414,698 |
Property and equipment, at cost | | | 2,592,485 | | | 2,501,829 |
Accumulated depreciation | | | (1,350,739) | | | (1,250,902) |
Property and equipment, net | | $ | 1,241,746 | | $ | 1,250,927 |
As of December 31, 2023, it was determined that the carrying value of our assets at Frontier City and HHOKC were not recoverable. As a result, an impairment charge of $23.0 million was recorded during the year ended December 31, 2023 with approximately $9.8 million attributable to Property and equipment, net and the remainder to Right-of-use operating assets, net.
As of January 1, 2023, it was determined that the carrying value of our assets at Six Flags Hurricane Harbor Splashtown, maywere not be recoverable. AnAs a result, an impairment losscharge of $16.9 million was recognizedrecorded during each of the year ended January 1, 2023 with approximately $1.8 million attributable to “Propertyproperty and equipment”equipment, net and the remainder to “Right of useright-of-use operating assets, net”net. Depreciation expense related to fixed assets totaled $114.2 million, $116.4 million $114.4 million and $119.2$114.4 million for the years ended December 31, 2023, January 1, 2023 and January 2, 2022, respectively.
5. Goodwill and
December 31, 2020, respectively.
5.
| Goodwill and Intangible Assets
|
Intangible Assets
For the year ended
January 1,December 31, 2023 we performed a qualitative analysis of our goodwill and indefinite-lived intangible assets and noted no indicators of impairment. As of each of
January 1,December 31, 2023 and January
2, 2022,1, 2023, the carrying amount of goodwill was $659.6 million.
As of December 31, 2023 and January 1, 2023, and January 2, 2022, intangible assets, net of accumulated amortization consisted of the following:
| | | | | | | | | | | | | | | | | | | | | | | |
| As of December 31, 2023 |
| (Amounts in thousands, except years) | Weighted-Average
Remaining
Amortization Period
(Years) | | Gross
Carrying
Value | | Accumulated
Amortization | | Net
Carrying
Value |
| Indefinite-lived intangible assets: | | | | | | | |
| Trade names, trademarks and other | | | $ | 344,075 | | | $ | — | | | $ | 344,075 | |
| Finite-lived intangible assets: | | | | | | | |
| Third party licensing rights | 2.4 | | 373 | | | (307) | | | 66 | |
| Total intangible assets, net | | | $ | 344,448 | | | $ | (307) | | | $ | 344,141 | |
| | | | | | | | | | | | | | | | | | | | | | | |
| As of January 1, 2023 |
| (Amounts in thousands, except years) | Weighted-Average
Remaining
Amortization Period
(Years) | | Gross
Carrying
Value | | Accumulated
Amortization | | Net
Carrying
Value |
| Indefinite-lived intangible assets: | | | | | | | |
| Trade names, trademarks and other | | | $ | 344,075 | | | $ | — | | | $ | 344,075 | |
| Finite-lived intangible assets: | | | | | | | |
| Third party licensing rights | 3.4 | | 373 | | | (284) | | | 89 | |
| Total intangible assets, net | | | $ | 344,448 | | | $ | (284) | | | $ | 344,164 | |
Table of Contents | | | | | | | | | | | |
| | As of January 1, 2023 |
| | Weighted-Average | | | | | | | | | |
| | Remaining | | Gross | | | | | Net |
| | Amortization Period | | Carrying | | Accumulated | | Carrying |
(Amounts in thousands, except years) | | (Years) | | Value | | Amortization | | Value |
Indefinite-lived intangible assets: | | | | | | | | | | | |
Trade names, trademarks and other | | | | $ | 344,075 | | $ | — | | $ | 344,075 |
| | | | | | | | | | | |
Finite-lived intangible assets: | | | | | | | | | | | |
Third party licensing rights | | 3.4 | | | 373 | | | (284) | | | 89 |
| | | | | | | | | | | |
Total intangible assets, net | | | | $ | 344,448 | | $ | (284) | | $ | 344,164 |
| | | | | | | | | | | |
| | As of January 2, 2022 |
| | Weighted-Average | | | | | | | | | |
| | Remaining | | Gross | | | | | Net |
| | Amortization Period | | Carrying | | Accumulated | | Carrying |
(Amounts in thousands, except years) | | (Years) | | Value | | Amortization | | Value |
Indefinite-lived intangible assets: | | | | | | | | | | | |
Trade names, trademarks and other | | | | $ | 344,075 | | $ | — | | $ | 344,075 |
| | | | | | | | | | | |
Finite-lived intangible assets: | | | | | | | | | | | |
Third party licensing rights | | 5.0 | | | 373 | | | (261) | | | 112 |
| | | | | | | | | | | |
Total intangible assets, net | | | | $ | 344,448 | | $ | (261) | | $ | 344,187 |
Amortization expense related to finite-lived intangible assets was a nominal amount during the years ended
December 31, 2023, January 1, 2023 and January 2, 2022.
We recognized $1.0 million of amortization expense related to finite-lived intangible assets during the year ended December 31, 2020. We expect that amortization expense on our existing intangible assets subject to amortization for the succeeding five years and thereafter will approximate the following:
| | | |
(Amounts in thousands) | | | |
For the year ending: | | | |
2023 | | $ | 23 |
2024 | | | 23 |
2025 | | | 23 |
2026 | | | 12 |
2027 | | | 1 |
2028 and thereafter | | | 7 |
| | $ | 89 |
6.
| Noncontrolling Interests, Partnerships and Joint Ventures
|
| | | | | |
| (Amounts in thousands) | |
| For the year ending: | |
| 2024 | $ | 23 | |
| 2025 | 23 | |
| 2026 | 12 | |
| 2027 | 1 | |
| 2028 | 1 | |
| 2029 and thereafter | 6 | |
| $ | 66 | |
6. Non-controlling Interests, Partnerships and Joint Ventures
Redeemable
NoncontrollingNon-controlling Interests
Redeemable noncontrollingnon-controlling interests represent the non-affiliated parties’ share of the assets of the Partnership Parks that are less than wholly-owned: SFOT, SFOG and Six Flags White Water Atlanta, which is owned by the partnership that owns SFOG.
The following table presents a rollforward of redeemable noncontrollingnon-controlling interests in the Partnership Parks:
| | | | | | | | | | | | | | | | | |
| (Amounts in thousands) | SFOT | | SFOG | | Total |
| Balance at January 2, 2022 | $ | 241,866 | | | $ | 280,201 | | | $ | 522,067 | |
| Fresh start accounting fair market value adjustment for purchased units | (116) | | | — | | | (116) | |
| Purchases of redeemable units | (556) | | | — | | | (556) | |
| Net income attributable to non-controlling interests | 22,283 | | | 22,368 | | | 44,651 | |
| Distributions to non-controlling interests | (22,283) | | | (22,368) | | | (44,651) | |
| Balance at January 1, 2023 | $ | 241,194 | | | $ | 280,201 | | | $ | 521,395 | |
| Fresh start accounting fair market value adjustment for purchased units | (69) | | | — | | | (69) | |
| Purchases of redeemable units | (328) | | | — | | | (328) | |
| Net income attributable to non-controlling interests | 23,689 | | | 23,812 | | | 47,501 | |
| Distributions to non-controlling interests | (23,689) | | | (23,812) | | | (47,501) | |
| Balance at December 31, 2023 | $ | 240,797 | | | $ | 280,201 | | | $ | 520,998 | |
| | | | | | | | | |
(Amounts in thousands) | | SFOT | | SFOG | | Total |
Balance at December 31, 2020 | | $ | 242,595 | | $ | 280,781 | | $ | 523,376 |
Fresh start accounting fair market value adjustment for purchased units | | | (126) | | | (68) | | | (194) |
Purchases of redeemable units | | | (603) | | | (512) | | | (1,115) |
Change in redemption value of partnership units | | | — | | | — | | | — |
Net income attributable to noncontrolling interests | | | 20,866 | | | 20,900 | | | 41,766 |
Distributions to noncontrolling interests | | | (20,866) | | | (20,900) | | | (41,766) |
Balance at January 2, 2022 | | | 241,866 | | | 280,201 | | | 522,067 |
Fresh start accounting fair market value adjustment for purchased units | | | (116) | | | — | | | (116) |
Purchases of redeemable units | | | (556) | | | — | | | (556) |
Net income attributable to noncontrolling interests | | | 22,283 | | | 22,368 | | | 44,651 |
Distributions to noncontrolling interests | | | (22,283) | | | (22,368) | | | (44,651) |
Balance at January 1, 2023 | | $ | 241,194 | | $ | 280,201 | | $ | 521,395 |
See Note 15 - Commitments and Contingencies for a description of the partnership arrangements applicable to the Partnership Parks, the accounts of which are included in the accompanying consolidated financial statements. As of January 1,December 31, 2023, the redemption value of the noncontrollingnon-controlling partnership units in SFOT and SFOG equaled theapproximated their carrying values.
7. Derivative Financial Instruments
We hold interest rate swap agreements that mitigate the risk of an increase in the
LIBORborrowing rate
in effect on the
Second Amended and Restated Term Loan B. We enter into derivative contracts for risk management purposes only and do not utilize derivative instruments for trading or speculative purposes.
In June 2019, we entered into the June 2019 Swap Agreements with an aggregate notional amount of $300.0 million to mitigate the risk of an increase in the
LIBOR interestborrowing rate on the
Second Amended and Restated Term Loan B. The term of the June 2019 Swap Agreements began in June 2019 and
expiresexpired in June 2023. Upon execution, we designated and documented the June 2019 Swap Agreements as cash flow hedges. The June 2019 Swap Agreements
serveoriginally served as economic hedges and
provideprovided protection against rising interest rates.
In August 2019, we entered into the August 2019 Swap Agreements with an aggregate notional amount of $400.0 million to mitigate the risk of an increase in the LIBOR interestborrowing rate in effect on the Second Amended and Restated Term Loan B. The term of the August 2019 Swap Agreements began in August 2019 and expires in August 2024. Upon execution, we designated and documented the August 2019 Swap Agreements as cash
flow hedges. The August 2019 Swap Agreements
serveoriginally served as economic hedges and
provideprovided protection against rising interest rates.
In March 2020, we executed a strategy commonly known as a “blend and extend” on $100.0 million of the June 2019 Swap Agreements that extended the length of one of the June 2019 Swap Agreements through April 2026. We extended the existing pay-fixed swap rate over a longer period than its original term at a lower interest rate, while maintaining the same overall
notional value of the swap. The remaining $200.0 million of the June 2019 Swap Agreements did not change.
On April 22, 2020, we repaid $315.0 million of the
Second Amended and Restated Term Loan B. In conjunction, the June 2019 Swap Agreements and the Modified June 2019 Swap Agreement were de-designated, since the hedged interest
waspayments were no longer probable of occurring due to the repayment of the debt. As a result, $14.9 million was reclassified from accumulated other comprehensive loss to interest expense in the consolidated statement of operations. Consistent with company policy, we hold and issue derivative instruments for risk management purposes only and do not utilize derivative instruments for trading or speculative purposes. Accordingly, in April 2020 we entered into $300.0 million of notional amount counter-agreements (the “April 2020 Counter-agreements”) designed to economically offset the impact of the de-designated swap agreements with expiration dates in June 2023 and April 2026.
On March 24, 2022, we terminated the August 2019 Swap Agreements for net cash proceeds of $7.4 million. The swap agreements were used as economic hedges against rising interest rates and had been designated as cash flow hedges prior to termination. We recorded the settlement in accumulated other comprehensive income in the amount of
$7.7 $7.7 million which will be amortized through September 2024 untilaligned with the maturity of the Second Amended and Restated Term Loan B.
By utilizing a derivative instrument to hedge our exposure to
LIBORborrowing rate changes, we are exposed to credit risk and market risk. Credit risk is the failure of the counterparty to perform under the terms of the derivative contract. To mitigate this risk, hedging instruments are placed with counterparties that we believe pose minimal credit risk. Market risk is the adverse effect on the value of a financial instrument that results from a change in interest rates, commodity prices or currency exchange rates. We manage the market risk associated with derivative instruments by establishing and monitoring parameters that limit the types and degree of market risk that we may undertake.
We hold and issue derivative instruments for risk management purposes only and do not utilize derivatives for trading or speculative purposes.We record derivative instruments at fair value on our consolidated balance sheets. When in qualifying relationships, the gains and losses on cash flow designated derivatives are deferred in accumulated other comprehensive loss (“AOCL”) and are reclassified to interest expense when the forecasted transaction takes place. The fair valuegains and losses of derivatives that are not designated as hedging instruments are recorded directly to “interest expense”.interest expense, net in our consolidated statements of operations. Derivative assets and derivative liabilities that have maturity dates equal to or less than twelve months from the balance sheet date are included in prepaid expenses and other current assets and other accrued liabilities respectively., respectively in our consolidated balance sheet. Derivative assets and derivative liabilities that have maturity dates greater than twelve months from the balance sheet date are included in deposits and other assets, netand other long-term liabilities respectively.Derivative assets and derivative liabilities that have maturity dates equal to or less than twelve months from the
, respectively in our consolidated balance sheet date are included in “Prepaid expenses and other current assets” and “Other accrued liabilities,” respectively. Derivative assets and derivative liabilities that have maturity dates greater than twelve months from the balance sheet date are included in “Deposits and other assets” and “Other long-term liabilities,” respectively.sheets.
Derivative assets recorded at fair value in our consolidated balance sheets as of
January 1,December 31, 2023 and January
2, 2022,1, 2023, respectively, consisted of the following:
| | | | | | | | | | | |
| Derivative Assets |
| (Amounts in thousands) | December 31, 2023 | | January 1, 2023 |
| Derivatives Not Designated as Hedging Instruments | | | |
| Interest rate swap agreements - other current assets | 3,156 | | | 6,135 | |
| Interest rate swap agreements - other non-current assets | 2,262 | | | 4,446 | |
| $ | 5,418 | | | $ | 10,581 | |
Table of Contents | | | | | |
| Derivative Assets |
(Amounts in thousands) | January 1, 2023 | | January 2, 2022 |
Derivatives Not Designated as Hedging Instruments | | | | | |
Interest rate swap agreements - other current assets | | 6,135 | | | — |
Interest rate swap agreements - other non-current assets | | 4,446 | | | — |
| $ | 10,581 | | $ | — |
Derivative liabilities recorded at fair value in our consolidated balance sheets as of
January 1,December 31, 2023 and January
2, 2022,1, 2023, respectively, consisted of the following:
| | | | | | | | | | | |
| Derivative Liabilities |
| (Amounts in thousands) | December 31, 2023 | | January 1, 2023 |
| Derivatives Not Designated as Hedging Instruments | | | |
| Interest rate swap agreements - other accrued liabilities | 4,047 | | | 8,476 | |
| Interest rate swap agreements - other long-term liabilities | 3,302 | | | 6,224 | |
| $ | 7,349 | | | $ | 14,700 | |
| | | | | | |
| | Derivative Liabilities |
(Amounts in thousands) | | January 1, 2023 | | January 2, 2022 |
Derivatives Designated as Cash Flow Hedges | | | | | | |
Interest rate swap agreements — other accrued liabilities | | $ | — | | $ | (3,986) |
Interest rate swap agreements — other long-term liabilities | | | — | | | (1,046) |
Derivatives Not Designated as Hedging Instruments | | | | | | |
Interest rate swap agreements - other accrued liabilities | | | (8,476) | | | (4,012) |
Interest rate swap agreements - other long-term liabilities | | | (6,224) | | | (4,581) |
| | $ | (14,700) | | $ | (13,625) |
Losses before taxes on derivatives not designated as a cash flow hedge of $0.4$0.3 million were presented in “Interest expense”interest expense, net in the consolidated statement of operations for the year ended January 1,December 31, 2023.
Gains and losses before taxes on derivatives designated as hedging instruments were presentedrecognized in “Interest expense” in the consolidated statement of operationsAOCL and reclassified from AOCL into interest expense, net for the years ended December 31, 2023, January 1, 2023 and January 2, 2022 and December 31, 2020 were as follows:
| | | | | | | | | | | | | | | | | | | | | | | | | | | | | | | | | | | |
| Gain (Loss)
Recognized in AOCL | | Gain (Loss) Reclassified from
AOCL into Operations |
| (Amounts in thousands) | December 31, 2023 | | January 1, 2023 | | January 2, 2022 | | December 31, 2023 | | January 1, 2023 | | January 2, 2022 |
| Interest rate swap agreements | $ | — | | | $ | 11,540 | | | $ | 6,299 | | | $ | 3,177 | | | $ | 1,218 | | | $ | (5,535) | |
| Total | $ | — | | | $ | 11,540 | | | $ | 6,299 | | | $ | 3,177 | | | $ | 1,218 | | | $ | (5,535) | |
| | | | | | | | | | | | | | | | | | |
| | Gain (Loss) | | Loss (Gain) Reclassified from |
| | Recognized in AOCL | | AOCL into Operations |
(Amounts in thousands) | | January 1, 2023 | | January 2, 2022 | | December 31, 2020 | | January 1, 2023 | | January 2, 2022 | | December 31, 2020 |
Interest Rate Swap Agreements | | $ | 11,540 | | $ | 6,299 | | $ | (33,902) | | $ | 1,218 | | $ | (5,535) | | $ | (3,685) |
Total | | $ | 11,540 | | $ | 6,299 | | $ | (33,902) | | $ | 1,218 | | $ | (5,535) | | $ | (3,685) |
As of January 1,December 31, 2023, we expect to reclassify net gains of $3.2 million, currently recorded in AOCL, into “Interestinterest expense, net”net within the next twelve months.
8. Long-Term Indebtedness
As part of our
ongoing operations,normal capital markets transactions, we periodically refinance
or amend our existing credit facility. As of
January 1,December 31, 2023, our credit facility consisted of a
$350.0$500.0 million revolving credit loan facility (the
“Second Amended and Restated Revolving Loan”“Revolving Credit Facility”) and a $479.0 million Tranche B Term Loan facility (the
“Second Amended and Restated Term“Term Loan B”) pursuant to the amended and restated credit facility that we entered into in 2019
and amended on May 3, 2023 (the
“Second AmendedRevolving Credit Facility and
Restated Creditthe Term Loan B together comprise our “Credit Facility”). Our prior credit facility (as previously amended as described below, the “2015 Credit Facility”) consisted of a $250.0 million revolving credit loan facility (the “2015 Revolving Loan”) and a $700.0 million Tranche B Term Loan (the “2015 Term Loan B”) and was amended and restated in conjunction with the
Second Amended and Restated Credit Facility.
On April 8, 2020, we increased the
Second Amended and Restated Revolving
LoanCredit Facility by $131.0 million,
(the "Series B replacement credit facility") from $350.0 million to $481.0 million.
On April 15, 2020, we amended the
Second Amended and Restated Credit Facility,
(the "Credit Facility Amendment") substantially concurrently with the closing of the $725.0 million 2025 Notes discussed below to, among other things, (i) permit the issuance of the 2025 Notes, including specifically, permitting the 2025 Notes to mature inside the
Second Amended and Restated Term Loan B, (ii) suspend the testing of the senior secured leverage ratio financial maintenance covenant in the
Second Amended and Restated Credit Facility through the end of 2020, (iii) re-establish the financial maintenance covenant thereafter (provided that for the first, second, and third quarters in 2021 that such covenant is tested, we will be permitted to use the quarterly Borrower Consolidated Adjusted EBITDA (as defined in the
Second Amended and Restated Credit Facility) from the second, third and fourth quarters of 2019 in lieu of the actual Borrower Consolidated Adjusted EBITDA for the corresponding quarters of 2020) and (iv) add a minimum liquidity covenant that will apply from the date of the Credit
AgreementFacility Amendment through December 31,
2021.2022. The Credit
AgreementFacility Amendment became effective on April 22, 2020, after giving effect to the repayment of a portion of the
Second Amended and Restated Term Loan B with a portion of the proceeds from the 2025 Notes.
On April 22, 2020, SFTPour wholly owned subsidiary, Six Flags Theme Parks ("SFTP") completed the private sale of $725.0 million in aggregate principal amount of 7.00% senior secured notes due 2025 (discussed below). The net proceeds from this offering were used to repay the outstanding balance of the Second Amended and Restated Revolving LoanCredit Facility and $315.0 million of the Second Amended and Restated Term Loan B and for general corporate and
working capital purposes, including expenses relating to the offering. We recognized a loss on debt extinguishment of $5.1 million related to the transaction.
On August 26, 2020, we amended the Second Amended and Restated Credit Facility which, among other things, (i) extended the previously effectuated suspension of the senior secured leverage ratio financial maintenance covenant in the Second Amended and Restated Credit Facility through the end of 2021, (ii) re-established the senior secured leverage ratio financial maintenance covenant thereafter (provided that for each quarter in 2022 (other than the fourth quarter) that the financial maintenance covenant is tested, SFTP will be permitted to use its quarterly Borrower Consolidated
Adjusted EBITDA (as defined in the Credit Agreement governing the Second Amended and Restated Credit Facility) from the second, third, and fourth quarters of 2019 in lieu of the actual Borrower Consolidated Adjusted EBITDA for the corresponding quarters of 2021), (iii) reduced the commitment fee on the revolving credit facility, and (iv) extended the minimum liquidity covenant that will applyapplied through December 31, 2022. The extension of the modifications to the financial covenant and other provisions in the Second Amended and Restated Credit Facility pursuant to this amendment will be in effect from the date of the amendment until the earlier of the delivery of the compliance certificate for the fourth quarter of 2022 and the date on which SFTP, in its sole discretion, elects to calculate its compliance with the financial maintenance covenant by using its actual Borrower Consolidated Adjusted EBITDA instead of the 2019 figures as outlined above. In addition, the incremental $131.0 million revolving credit commitments to the Second Amended and Restated Revolving LoanCredit Facility were extended by one year to December 31, 2022.
On May 18, 2022, we reduced and terminated the Series B replacement Revolving Commitments by $131.0 million, which reduced the
Second Amended and Restated Revolving
LoanCredit Facility capacity to $350.0 million from $481.0 million.
On May 3, 2023, concurrently with closing of the $800.0 million in aggregate principal amount of 7.25% senior unsecured notes due 2031 ("2031 Notes"), the Company amended its existing senior secured credit facility to, among other things, (i) establish a $500.0 million replacement revolving credit facility maturing in May 2028, subject to springing maturity conditions, which was previously scheduled to expire in April 2024 (ii) maintain the same interest rate margins on borrowings under the replacement revolving credit facility as were previously in effect, while reducing the fee on unused revolving commitments to 0.5% stepping down to 0.375% upon achieving a senior secured leverage ratio of less than 1.25:1.00, (iii) replace LIBOR as the interest rate benchmark for borrowings under the senior secured credit facility with Secured Overnight Financing Rate ("SOFR"), plus a percentage equal to 0.10% per annum (the "Term SOFR Adjustment"), (iv) modify the maximum senior secured leverage ratio that the Company must maintain to 4.50:1.00 for the four fiscal-quarter periods ending on or about December 31, 2022, March 31, 2023, and June 30, 2023, 4.25:1:00 for the four fiscal-quarter period ending on or about September 30, 2023, and each four fiscal-quarter period ending on or about June 30, 2024, and 3.75:1.00 for the four fiscal-quarter period ending on or about September 30, 2024, and each four fiscal-quarter period thereafter, and (v) make certain other changes to the covenants and other terms of the senior secured credit facility. We incurred a $0.1 million loss on debt extinguishment related to the write-off of deferred financing costs related to the transaction.
As of January 1,December 31, 2023 we had $100.0, after adjusting for $21.0 million of outstanding under the Second Amended and Restated Revolving Loan (excluding amounts reserved for letters of credit inand $180.0 million borrowings outstanding, the amount of $21.0 million). As of January 2, 2022, noremaining borrowing capacity under our Revolving Credit Facility is $299.0 million. See “Covenant Compliance” discussion below for information regarding our maximum net leverage maintenance covenant, which could impact amounts were outstanding under the Second Amended and Restated Revolving Loan (excluding amounts reservedavailable for letters of credit in the amount of $20.2 million). borrowing. Interest on the Second Amended and Restated Revolving LoanCredit Facility accrues at an annual rate of LIBORSOFR plus an applicable margin with an unused commitment fee based on our senior secured leverage ratio. As of January 1,December 31, 2023, the Second Amended and Restated Revolving LoanCredit Facility unused commitment fee was 0.625%0.500%. The Second Amended and Restated Revolving LoanCredit Facility will mature on April 17, 2024.in May 2028.
As of
December 31, 2023 and January 1, 2023,
and January 2, 2022, $479.0 million was outstanding under the
Second Amended and Restated Term Loan B. Interest on the
Second Amended and Restated Term Loan B accrues at
an annual rate of LIBORSOFR plus an applicable margin, based on our consolidated leverage ratio. As of
January 1,December 31, 2023 and January
2, 2022,1, 2023, the applicable interest rate on the
Second Amended and Restated Term Loan B was
6.14%7.17% and
3.00%6.14%, respectively. The
Second Amended and Restated Term Loan B will mature on April 17, 2026.
The
Second Amended and Restated Credit Facility is guaranteed by
Holdings, Six Flags Operations Inc. ("SFO") and certain of the
domestic subsidiaries of SFTP (collectively, the "Loan Parties").Loan Parties. The
Second Amended and Restated Credit Facility is secured by a first priority security interest in substantially all of the assets of the Loan Parties. The
Second Amended and Restated Credit Facility agreement contains certain representations, warranties, affirmative covenants and financial covenants (specifically, a maximum senior secured net leverage maintenance covenant). In addition, the
Second Amended and Restated Credit Facility agreement contains restrictive covenants that, subject to certain exceptions, limit or restrict, among other things, the incurrence of indebtedness and liens, fundamental changes, restricted payments, capital expenditures, investments, prepayments of certain indebtedness, transactions with affiliates, changes in fiscal periods, modifications of certain documents, activities of the Company and SFO and hedging agreements, subject, in each case, to certain carve-outs.
Long-term Notes
Notes payable are listed in the order that the agreements were entered. The 2025 Notes are secured by Six Flags Theme Parks, Inc. ("SFTP"), a wholly-owned subsidiary of Holdings. The 2024 Notes, 2024 Notes Add-ons, 2027 Notes and 2031 Notes are unsecured.
The 2024 Notes, the 2024 Notes Add-on, 2025 Notes,
andthe 2027 Notes
and the 2031 Notes are guaranteed by the Loan Parties. The 2024 Notes, the 2024 Notes Add-on, 2025 Notes, the 2027 Notes and the 2031 Notes contain restrictive covenants that, subject to certain exceptions, limit or restrict, among other things, the ability of the Loan Parties to incur additional indebtedness, create liens, engage in mergers, consolidations and other fundamental changes, make investments, engage in transactions with affiliates, pay dividends and repurchase capital stock. The 2024 Notes, the 2024 Notes Add-on, 2025 Notes, the 2027 Notes and the 2031 Notes contain certain events of default, including payment defaults, breaches of covenants and representations, cross defaults to other material indebtedness, judgment, and changes of control and bankruptcy events of default.
2024 Notes and 2024 Notes Add-ons
On June 16, 2016, Holdings issued $300.0 million of 4.875% senior unsecured notes due July 31, 2024 (the "2024 Notes"). We capitalized $4.7 million of debt issuance costs directly associated with the issuance of the 2024 Notes.
We used approximately $150.0 million of the proceeds from the issuance of the 2024 Notes to reduce our borrowings under the 2015 Term Loan B. We used the remaining net proceeds of the sale of the 2024 Notes for general corporate and working capital purposes, which primarily included repurchases of Holdings common stock.On April 13, 2017, Holdings issued an additional $700.0 million of 4.875% Senior Notes due July 31, 2024 (the "2024 Notes Add-on"). We capitalized $3.9 million of debt issuance costs directly associated with the issuance of the 2024 Notes Add-on. Interest payments of $24.4 million for the 2024 Notes and the 2024 Notes Add-on are due semi-annually on January 31 and July 31 of each year.
During March of 2020, we prepaid $50.5 million of the outstanding 2024 Notes principal, reducing the outstanding amount to $949.5 million. We recognized a loss on debt extinguishment of $1.0 million.On May 3, 2023, $892.6 million of the aggregate principal amount of the 2024 Notes were redeemed pursuant to the Tender Offer discussed below in conjunction with the issuance of the 2031 Notes.
TableThe $56.9 million of Contents
the 2024 Notes and 2024 Notes Add-on remaining subsequent to the Tender Offer mature on July 31, 2024. Interest payments of $2.8 million are due semi-annually on January 31, 2024 and July 31, 2024.On April 13, 2017, Holdings issued $500.0 million of 5.50% Senior Notes due April 15, 2027 (the "2027 Notes"). We capitalized $2.6 million of debt issuance costs directly associated with the issuance of the 2027 Notes. Interest payments of $13.8 million are due semi-annually on April 15 and October 15 of each year.
During March of 2020, we prepaid $50.5 million of the outstanding 2024
2025 Notes
principal, reducing the outstanding amount to $949.5 million. We recognized a loss on debt extinguishment of $1.0 million. Interest payments of $23.1 million for the 2024 Notes and the 2024 Notes Add-on are due semi-annually on January 31 and July 31 of each year. On April 22, 2020, SFTP completed the private sale of $725.0 million in aggregate principal amount of 7.00% senior secured notes due 2025 (the “2025 Notes”). The net proceeds from this offering were used to repay the outstanding balance of the
Second Amended and Restated Revolving
LoanCredit Facility and $315.0 million of the
Second Amended and Restated Term Loan B and for general corporate and working capital purposes, including expenses relating to the offering. Interest payments of $25.4 million are due semi-annually on
January 1December 31 and July 1 of each year, with the exception of January 1, 2021, which included the interest from April 22, 2020 through July 1, 2020 and totaled $35.1 million.
On July 1, 2022, the Company redeemed $360.0 million of the 2025 Notes at a premium of 103.5%. The transaction reduced the outstanding amount of the 2025 Notes to $365.0 million. We incurred a $17.5 million loss on debt extinguishment containing $12.6 million for the premium paid above par and $5.0 million related to the write-off of deferred financing costs related to the transaction.
2031 Notes & Tender Offer
On April 26, 2023, we launched a private offering of up to $800.0 million aggregate principal amount of senior notes. Concurrently, we commenced a cash tender offer (the "Tender Offer") for any and all outstanding 2024 Notes. The 2024 Notes,consideration offered for each $1,000 principal amount of the 2024 Notes Add-on, 2025was $1,000.50 (the "Purchase Price"), plus accrued and unpaid interest.
On May 3, 2023, we completed the private sale of $800.0 million aggregate principal amount of 7.250% Senior Notes due 2031 (the "2031 Notes") at on offering price of 99.248% of the principal amount thereof. Net of the original issue discount and debt issuance costs, we received net proceeds of $784.0 million.
Also, on May 3, 2023, we announced that $892.6 million, or 94.0% of the 2027 Notes are guaranteed by the Loan Parties. The 2024 Notes,aggregate outstanding principal amount of the 2024 Notes Add-on, 2025were validly tendered pursuant to the Tender Offer. Net cash proceeds from the 2031 Notes, together with other available cash, including borrowings under our Revolving Credit Facility, were used to pay the Purchase Price, plus accrued and unpaid interest. We incurred a $14.0 million loss on debt extinguishment comprised of $1.0 million for premium paid above par and $13.0 million of costs charged to expense on debt modification which were recognized during the 2027year ended December 31, 2023.
Interest payments on the 2031 Notes contain restrictive covenants that, subjectof $29.0 million are due semi-annually on May 15 and November 15, with the exception of November 15, 2023, which included interest from May 3, 2023 through November 15, 2023 and totaled $30.9 million.
Merger Commitment Letter
In connection with the Merger Agreement, Six Flags, Cedar Fair and CopperSteel have entered into a Debt Commitment Letter, with the Arrangers, pursuant to
certain exceptions, limit or restrict,which the Arrangers have committed to provide Debt Financing in connection with the Mergers. The Debt Commitment Letter amends, restates and supersedes the commitment letter, dated November 2, 2023, which provided revolving credit commitments in an aggregate amount of $800 million. The proceeds from the Debt Financing may be used to, among other things,
pay for transaction costs in connection with the
abilityMergers. The obligation of the
Loan PartiesArrangers to
incur additional indebtedness, create liens, engage in mergers, consolidationsprovide the Debt Financing under the Debt Commitment Letter is subject to a number of conditions, including the receipt of executed loan documentation, accuracy of certain representations and
other fundamental changes, make investments, engage in transactions with affiliates, pay dividends and repurchase capital stock. The 2024 Notes, the 2024 Notes Add-on, 2025 Noteswarranties and the
2027 Notes contain certain eventsconsummation of
default, including payment defaults, breaches of covenants and representations, cross defaults to other material indebtedness, judgment, and changes of control and bankruptcy events of default.the transactions contemplated by the Merger Agreement.
The Credit
AgreementFacility and senior notes contains a number of customary negative covenants. Subject to certain exceptions, these covenants restrict our ability to, among other things, incur additional indebtedness, incur liens, make investments, sell assets, pay dividends, make capital expenditures, repurchase stock or engage in transactions with affiliates.
The Credit
AgreementFacility also requires that as of the end of each fiscal quarter our senior secured leverage ratio, which is the ratio of our Senior Secured Debt to our Borrower Consolidated Adjusted EBITDA
(as each term is defined in the Credit Facility) for the preceding four fiscal quarters, not exceed 4.25 to 1.0
(as each such term is defined infor the
Credit Agreement). The maximum senior secured leverage ratio will step down to 4.0 to 1.0 beginning with the first fiscal quarter
end ofperiods ending on or about September 30, 2023
and then down to 3.75 to 1.0 fromthrough the
third fiscal quarter
of 2023.
In 2020, we entered into amendments to the Credit Agreement which, among other things, allowed us to use our Borrower Consolidated Adjusted EBITDA from 2019 rather than actual Borrower Consolidated Adjusted EBITDAperiod ending on or about June 30, 2024, and 3.75:1.00 for the corresponding quarters in 2021 when testing of our senior secured leverage ratio throughout 2022. In connection with these amendments, we agreed to various restrictions, including the suspension of dividend paymentsfiscal quarter period ending on Holdings common stockor about September 30, 2024, and stock repurchases, a prohibition from prepaying debt, and a requirement that we maintain minimum liquidity (defined as unrestricted cash and cash equivalents and available commitments under the Second Amended and Restated Revolving Loan) of at least $150 million for a specified period. The restriction on prepaying debt and the minimum liquidity requirement end on the earliereach four fiscal quarter period thereafter.
As of December 31, 2022 or such time that2023, we demonstratesare in compliance with all relevant covenants. Additionally, as of December 31, 2023, the entire remaining borrowing capacity would be available to us without breaching our senior securedmaximum net leverage ratio using actual results.maintenance or other relevant covenant.
On May 18, 2022, we reduced and terminated the Series B replacement Revolving Commitments by $131.0 million, which reduced the Second Amended and Restated Revolving Loan capacity to $350.0 million from $481.0 million and began testing our senior secured leverage ratio using actual results. The termination of the additional capacity and testing
with actual results eliminated the minimum liquidity requirement and ended various restrictions on dividend payments of Holdings’ common stock and stock repurchases and our prohibition from repaying debt.
Total Indebtedness Summary
As of
January 1,December 31, 2023 and January
2, 2022,1, 2023, total long-term debt consisted of the following:
| | | | | | |
| | As of |
(Amounts in thousands) | | January 1, 2023 | | January 2, 2022 |
Second Amended and Restated Term Loan B | | $ | 479,000 | | $ | 479,000 |
Second Amended and Restated Revolving Loan | | | 100,000 | | | — |
2024 Notes | | | 949,490 | | | 949,490 |
2025 Notes | | | 365,000 | | | 725,000 |
2027 Notes | | | 500,000 | | | 500,000 |
Net discount | | | (2,138) | | | (3,249) |
Deferred financing costs | | | (10,821) | | | (20,717) |
Total debt | | $ | 2,380,531 | | $ | 2,629,524 |
Less short-term borrowings | | | 100,000 | | | — |
Total long-term debt | | $ | 2,280,531 | | $ | 2,629,524 |
| | | | | | | | | | | |
| As of |
| (Amounts in thousands) | December 31, 2023 | | January 1, 2023 |
| Term Loan B | $ | 479,000 | | | $ | 479,000 | |
| Revolving Credit Facility | 180,000 | | | 100,000 | |
| 4.875% Senior Notes due 2024 ("2024 Notes") | 56,867 | | | 949,490 | |
| 7.00% Senior Secured Notes due 2025 ("2025 Notes") | 365,000 | | | 365,000 | |
| 5.50% Senior Notes due 2027 ("2027 Notes") | 500,000 | | | 500,000 | |
| 7.25% Senior Notes due 2031 ("2031 Notes") | 800,000 | | | — | |
| Net discount | (6,167) | | | (2,138) | |
| Deferred financing costs | (9,221) | | | (10,821) | |
| Total debt | $ | 2,365,479 | | | $ | 2,380,531 | |
| Less short-term borrowings | 180,000 | | | 100,000 | |
| Less current portion of long-term debt | 56,867 | | | — | |
| Total long-term debt | $ | 2,128,612 | | | $ | 2,280,531 | |
As of
January 1,December 31, 2023, annual maturities of long-term debt, assuming no acceleration of maturities, were as follows:
| | | |
(Amounts in thousands) | | | |
For the year ending: | | | |
2023 | | $ | — |
2024 | | | 1,049,490 |
2025 | | | 365,000 |
2026 | | | 479,000 |
2027 | | | 500,000 |
2028 and thereafter | | | — |
| | $ | 2,393,490 |
| | | | | |
| (Amounts in thousands) | |
| For the year ending: | |
| 2024 | $ | 56,867 | |
| 2025 | 365,000 | |
| 2026 | 479,000 | |
| 2027 | 500,000 | |
| 2028 | 180,000 | |
| 2029 and thereafter | 800,000 | |
| $ | 2,380,867 | |
Fair-Value of Long-Term Indebtedness
As of
December 31, 2023, and January 1, 2023,
and January 2, 2022, the fair value of our long-term debt was
$2,284.3$2,374.7 million and
$2,703.5$2,284.3 million, respectively. The measurement of the fair value of long-term debt is based on market prices that are generally observable for similar liabilities at commonly quoted intervals and is considered a Level 2 fair value measurement.
9.
| Selling, General and Administrative Expenses
|
9. Selling, General and Administrative Expenses
Selling, general and administrative expenses
were comprised
of the following for the years ended
December 31, 2023, January 1, 2023
and January 2,
2022 and December 31, 2020:
| | | | | | | | | |
| | Year Ended |
(Amounts in thousands) | | January 1, 2023 | | January 2, 2022 | | December 31, 2020 |
Park | | $ | 106,077 | | $ | 117,830 | | $ | 80,027 |
Corporate | | | 56,081 | | | 93,551 | | | 67,268 |
Total selling, general and administrative expenses | | $ | 162,158 | | $ | 211,381 | | $ | 147,295 |
2022: | | | | | | | | | | | | | | | | | |
| Year Ended |
| (Amounts in thousands) | December 31, 2023 | | January 1, 2023 | | January 2, 2022 |
| Park | $ | 160,187 | | | $ | 106,077 | | | $ | 117,830 | |
| Corporate | 87,696 | | | 63,326 | | | 95,351 | |
| Total selling, general and administrative expenses | $ | 247,883 | | | $ | 169,403 | | | $ | 213,181 | |
Pursuant to the Long-Term Incentive Plan, Holdingswe may grant stock options, stock appreciation rights, restricted stock, restricted stock units, unrestricted stock, deferred stock units, performance and cash-settled awards and dividend equivalents to select employees,
officers, directors and consultants of Holdings and its affiliates. The Company has reserved 19.3 million shares of common stock for issuance under Long-Term Incentive Plan, of which approximately
5.64.5 million are available for future issuance as of
January 1,December 31, 2023.
During the years ended December 31, 2023, January 1, 2023 and January 2, 2022, and December 31, 2020, we recognized stock-based compensation expense related to the Long-Term Incentive Plan of $7.7$11.4 million, $21.1$15.2 million and $19.1$23.6 million, respectively, which is included in selling, general and administrative expense.expense
in our consolidated statements of operations. As of January 1,December 31, 2023, options to purchase approximately 1,684,0001,186,000 shares of common stock, of Holdings, approximately 957,0001,031,000 shares of restricted stock or restricted stock units and approximately 595,000469,000 shares of performance stock unitswere outstanding under the Long-Term Incentive Plan and approximately 5,634,000 shares were available for future grant.Plan.
Stock options granted under the Long-Term Incentive Plan are designated as either incentive stock options or non-qualified stock options. Stock options are generally granted with an exercise price equal to the fair market value of the common stock of Holdings on the date of grant. While certain stock options are subject to acceleration in connection with a change in control, stock options are generally cumulatively exercisable in four equal annual installments commencing one year after the date of grant with a ten-year term. Generally, the unvested portion of stock option awards is forfeited upon termination of employment. Stock option compensation is recognized over the vesting period using the graded vesting terms of the respective grant. The estimated fair value of our stock options granted was calculated using the Black-Scholes option pricing valuation
model.model as of the grant date of the awards. This model takes into account several factors and assumptions. The risk-free interest rate is based on the yield on United States Treasury zero-coupon issues with a remaining term equal to the expected term assumption at the time of grant. We have sufficient historical data to develop an expected term assumption and we calculated the expected term using a mid-point scenario with a one-year grant date filter to exclude grants for which vesting could not have yet occurred. Expected volatility is based
three-fourthsthree-fourths on the term-matching historical volatility of our stock and
one-fourthone-fourth on the weighted-average implied volatility based on forward-looking pricing data on exchange-traded options for our stock. The expected dividend yield is based on our current quarterly dividend,
if any, and a three-month average stock price. The fair value of stock options on the date of grant is expensed on a straight-line basis over the requisite service period of the graded vesting term as if the award was, in substance, multiple awards.
No stock options were granted during the years ended
January 1,December 31, 2023 and January
2, 2022.The following weighted-average assumptions were utilized in the Black-Scholes model to value the stock options granted during the year ended December 31, 2020:
|
|
|
|
|
|
| | December 31, 2020
|
|
| | CEO
| | Employees
|
|
Risk-free interest rate
| | —
| %
| 1.60
| %
|
Expected life (in years)
| | —
| | 3.67
|
|
Expected volatility
| | —
| %
| 28.38
| %
|
Expected dividend yield
| | —
| %
| 7.18
| %
|
1, 2023.The following table summarizes stock option activity for the year ended January 1,December 31, 2023:
| | | | | | | | | | | | | | | | | | | | | | | |
| (Amounts in thousands, expect per share and term data) | Shares | | Weighted Avg.
Exercise Price
Per Share
($) | | Weighted Avg.
Remaining
Contractual
Term | | Aggregate
Intrinsic Value
($) |
| Balance at January 1, 2023 | 1,684 | | $ | 55.52 | | | | | |
| Granted | — | | $ | — | | | | | |
| Exercised | — | | $ | — | | | | | |
| Canceled | (467) | | $ | 53.45 | | | | | |
| Forfeited | (31) | | $ | 59.32 | | | | | |
| Expired | — | | $ | — | | | | | |
| Balance at December 31, 2023 | 1,186 | | $ | 56.23 | | | 3.77 | | $ | — | |
| Vested and expected to vest at December 31, 2023 | 1,186 | | $ | 56.23 | | | 3.77 | | $ | — | |
| Options exercisable at December 31, 2023 | 1,186 | | $ | 56.23 | | | 3.77 | | $ | — | |
Table of Contents | | | | | | | | | | |
| | | | Weighted Avg. | | Weighted Avg. | | | |
| | | | Exercise Price | | Remaining | | Aggregate |
| | | | Per Share | | Contractual | | Intrinsic Value |
(Amounts in thousands, expect per share and term data) | | Shares | | ($) | | Term | | ($) |
Balance at January 2, 2022 | | 3,421 | | $ | 54.25 | | | | | |
Granted | | — | | $ | — | | | | | |
Exercised | | (30) | | $ | 35.06 | | | | | |
Canceled | | (1,542) | | $ | 52.59 | | | | | |
Forfeited | | (165) | | $ | 60.20 | | | | | |
Expired | | — | | $ | — | | | | | |
Balance at January 1, 2023 | | 1,684 | | $ | 55.52 | | 4.80 | | $ | — |
Vested and expected to vest at January 1, 2023 | | 1,684 | | $ | 55.52 | | 4.80 | | $ | — |
Options exercisable at January 1, 2023 | | 1,551 | | $ | 55.25 | | 4.27 | | $ | — |
The following table presents the weighted average grant date fair value per share of the options granted, the total intrinsic value of options exercised, the total fair value of options that have vested, and the total cash received from the exercise of stock options during the years ended December 31, 2023, January 1, 2023 and January 2, 2022 and2022:
| | | | | | | | | | | | | | | | | | | | |
| | Year Ended |
| (Amounts in thousands, expect per share data) | | December 31, 2023 | | January 1, 2023 | | January 2, 2022 |
| Weighted average grant date fair value per share of options granted | | $ | — | | | $ | — | | | $ | — | |
| Total intrinsic value of options exercised | | $ | — | | | $ | 181 | | | $ | 5,470 | |
| Total fair value of vested options | | $ | — | | | $ | 223 | | | $ | 5,491 | |
| Total cash received from the exercise of stock options | | $ | — | | | $ | 1,039 | | | $ | 13,209 | |
As of December 31,
2020:
| | | | | | | | | |
| | Year Ended |
(Amounts in thousands, expect per share data) | | January 1, 2023 | | January 2, 2022 | | December 31, 2020 |
Weighted average grant date fair value per share of options granted | | $ | — | | $ | — | | $ | 4.85 |
Total intrinsic value of options exercised | | $ | 181 | | $ | 5,470 | | $ | 1,275 |
Total fair value of vested options | | $ | 223 | | $ | 5,491 | | $ | 7,369 |
Total cash received from the exercise of stock options | | $ | 1,039 | | $ | 13,209 | | $ | 2,235 |
As of January 1, 2023, there was $0.1 milliona nominal amount of unrecognized compensation expense related to option awards. The weighted-average period overawards which that cost is expected to be recognized is 0.64 years.
within the first quarter of 2024.
Stock, Restricted Stock and Restricted Stock Units
Stock, restricted stock and restricted stock units granted under the Long-Term Incentive Plan may be subject to transfer and other restrictions as determined by the compensation committee of
Holdings’our Board of Directors. Generally, the unvested portion of restricted stock and restricted stock unit awards is forfeited upon termination of employment. The fair value of stock, restricted stock and restricted stock unit awards on the date of grant is expensed on a straight-line basis over the requisite service period of the graded vesting term as if the award was, in substance, multiple awards.
The following table summarizes stock, restricted stock and restricted stock unit activity for the year ended
January 1,December 31, 2023:
| | | | | |
| | | | | Weighted |
| | | | | Average Grant |
| | | | | Date Fair Value |
| | | | | Per Share |
(Amounts in thousands, except per share amounts) | | Shares | | | ($) |
Non-vested balance at January 2, 2022 | | 1,340 | | $ | 34.91 |
Granted | | 416 | | $ | 36.10 |
Vested | | (364) | | $ | 30.82 |
Forfeited | | (435) | | $ | 33.66 |
Canceled | | — | | $ | — |
Non-vested balance at January 1, 2023 | | 957 | | $ | 37.55 |
| | | | | | | | | | | |
| (Amounts in thousands, except per share amounts) | Shares | | Weighted
Average Grant
Date Fair Value
Per Share
($) |
| Non-vested balance at January 1, 2023 | 957 | | $ | 37.55 | |
| Granted | 650 | | $ | 24.04 | |
| Vested | (348) | | $ | 30.99 | |
| Forfeited | (228) | | $ | 32.78 | |
| | | |
| Non-vested balance at December 31, 2023 | 1,031 | | $ | 32.30 | |
The following table presents the weighted average grant date fair value per share of stock awards granted, the total grant date fair value of stock awards granted, and the total fair value of stock awards that have vested during the years ended December 31, 2023, January 1, 2023 and January 2, 2022, and December 31, 2020:
| | | | | | | | | |
| | Year Ended |
(Amounts in thousands, expect per share data) | | January 1, 2023 | | January 2, 2022 | | December 31, 2020 |
Weighted average grant date fair value per share of stock awards granted | | $ | 36.10 | | $ | 44.07 | | $ | 18.86 |
Total grant date fair value of stock awards granted | | $ | 15,009 | | $ | 44,855 | | $ | 29,597 |
Total fair value of vested stock awards | | $ | 11,210 | | $ | 14,681 | | $ | 2,011 |
2022:
| | | | | | | | | | | | | | | | | | | | |
| | Year Ended |
| (Amounts in thousands, except per share data) | | December 31, 2023 | | January 1, 2023 | | January 2, 2022 |
| Weighted average grant date fair value per share of stock awards granted | | $ | 24.04 | | | $ | 36.10 | | | $ | 44.07 | |
| Total grant date fair value of stock awards granted | | $ | 15,616 | | | $ | 15,009 | | | $ | 44,855 | |
| Total fair value of vested stock awards | | $ | 10,775 | | | $ | 11,210 | | | $ | 14,681 | |
There was
$17.1$10.1 million of total unrecognized stock-based compensation expense related to stock, restricted stock and restricted stock units as of
January 1,December 31, 2023, that is expected to be recognized over a weighted-average period of
1.220.91 years.
Deferred Share Units
Non-employee
Prior to 2023, non-employee directors
canhad the option to elect to receive the value of their annual cash retainer as a deferred share unit award ("DSU") under the Long-Term Incentive Plan whereby the non-employee director is granted DSUs in an amount equal to such director’s annual cash retainer divided by the closing price of
Holdings’our common stock on the date of the annual stockholders meeting. Each DSU represents
Holdings’our obligation to issue one share of common stock. The shares are delivered approximately thirty days following the cessation of the non-employee director’s service as a director of Holdings.
DSUs generally vest consistent with the manner in which non-employee directors’ cash retainers are paid. The fair value of the DSUs on the date of grant is expensed on a straight line basis over the requisite service period.
We did not grant any DSUs during the year ended December 31, 2023. During the years ended January 1, 2023
and January 2, 2022,
and December 31, 2020, approximately 8,000
7,000 and 7,000 DSUs were granted, respectively. The DSUs had a weighted-average grant date fair value of $29.70
$43.36 and
$31.43$43.36 per DSU, respectively. The total grant date fair value of DSUs granted was $0.2 million
and $0.3 million for the years ended January 1, 2023 and
December 31, 2020 and $0.3 million for the year ended January 2,
2022.2022, respectively.
As of
January 1,December 31, 2023, there was no unrecognized compensation expense related to the outstanding DSUs.
Dividend Equivalent Rights
On February 8, 2012,
Holdings’our Board of Directors granted dividend equivalent rights (“DERs”) to holders of unvested stock options. If and when
Holdingswe paid quarterly cash dividends on
itsour common stock, the DERs accrue dividends from the stock option grant date through the date of vesting of the stock option, and are distributed, in either cash or stock, upon the vesting of the stock option award. Generally, holders of stock options for fewer than 1,000 shares of stock will receive their accumulated accrued dividends in cash and holders of stock options for 1,000 shares of stock or greater will receive their accumulated accrued dividends in shares of common stock.
Holdings’
Our Board of Directors has not granted stock options since the year ended December 31, 2019; however,
many options
are stillremain outstanding from prior grants. We recorded
a reversal of stock-based compensation for DER grants of
$7.4a nominal amount, $0.1 million and
$0.3$1.8 million for the years ended
December 31, 2023, January 1, 2023 and January 2, 2022,
respectively, and stock-based compensation for DER grants of $0.3 million for the year ended December 31, 2020.respectively. All DERs issued upon stock options vesting during these periods accrued based on dividends that
Holdings’we declared prior to the suspension of dividend payments in connection with the increase in the
Second Amended and Restated Revolving
LoanCredit Facility in April 2020.
During the third quarter of 2023, we identified an accounting error for our stock-based compensation expense related to the recognition of expense for dividend equivalent rights ("DERs"). The error primarily relates to the inadvertent reversal of stock-based compensation expense for vested DERs for periods beginning in the first quarter of 2020 through the fourth quarter of 2022. As a result, the stock-based compensation for DER grants above have been revised from the figures previously reported. See Note 18 - Revision to Previously Reported Financial Information for additional information. During the year ended January 2, 2022, performance stock units were granted to key employees that will vest upon the achievement of specified EBITDA and revenue performance goals by 2023. The aggregate payout at target achievement under these awards if the performance goals are achieved in 2023 would be 64,00041,000 shares, but could be
more or less depending on the level of achievement and timing thereof. There has been no stock-based compensation expense recorded for the performance stock units because, as of January 1,December 31, 2023, it iswe did not deemed probable that we will achieve the specified performance targets by 2023. Based on the grant date fair value of these performance stock units as determined by the closing price of Holdings’ common stock on the date of grant, the total unrecognized compensation cost related to these performance stock units at target achievement in 2023 is $3.2 million, which will be expensed over the service period if achievement of the performance conditions becomes probable. We will continue to evaluate the probability of achieving the performance conditions going forward, and we will record the appropriate expense as necessary. No expense has been recognized as of January 1, 2023.
During the year ended January 2, 2022, performance stock units were granted to the chief executive officer that will vest upon the achievement of specified EBITDA performance goals during fiscal years 2022 through 2024, employee and guest satisfaction, and ESG achievement metrics. The aggregate payout at target achievement under these awards if the performance goals are achieved by 2024 would be 50,000333,000 shares, but could be more or less depending on the level of achievement and timing thereof. There has not been any stock-based compensation expense recorded for the performance stock units because, as of December 31, 2023, it is not deemed probable that we will achieve the specified performance targets by 2024. Based on the grant date fair value of these performance stock units as determined by the closing price of our common stock on the date of grant, the total unrecognized compensation expense related to these performance stock units at target achievement in 2024 is $14.5 million, which will be expensed over the service period if achievement of the performance conditions becomes probable. We will continue to evaluate the probability of achieving the performance conditions and we will record the appropriate expense, as necessary. No expense has been recognized as of December 31, 2023.
During the year ended January 1, 2023, performance stock units were granted to key employees that will vest upon the achievement of specified EBITDA performance goals during fiscal years 2022 through 2024. The aggregate payout at target achievement under these awards if the performance goals are achieved in 2024 would be 378,000 shares, but could be more or less depending on the level of achievement and timing thereof. There has been no stock-based compensation expense recorded for the performance stock units because, as of January 1,December 31, 2023, it is not deemed probable that we will achieve the specified performance targets by 2024. Based on the grant date fair value of these performance stock units as determined by the closing price of Holdings’ common stock on the date of grant, the total unrecognized compensation cost related to these performance stock units at target achievement in 2024 is $2.2$14.7 million, which will be expensed over the service period if achievement of the performance conditions
becomes probable. We will continue to evaluate the probability of achieving the performance conditions
going forward, and we will record the appropriate expense, as necessary.
No expense has been recognized as of January 1, 2023.During the year ended January 1, 2023, performance stock units were granted to key employees that will vest upon the achievement of specified EBITDA performance goals by 2024. The aggregate payout at target achievement under these awards if the performance goals are achieved in 2024 would be 482,000 shares, but could be more or less depending on the level of achievement and timing thereof. There has been no stock-based compensation expense recorded for the performance stock units because, as of January 1, 2023, it is not deemed probable that we will achieve the specified performance targets by 2024. Based on the grant date fair value of these performance stock units as determined by the closing price of Holdings’ common stock on the date of grant, the total unrecognized compensation cost related to these performance stock units at target achievement in 2024 is $18.7 million, which will be expensed over the service period if achievement of the performance conditions becomes probable. We will continue to evaluate the probability of achieving the performance conditions going forward, and we will record the appropriate expense as necessary. No expense has been recognized as of January 1, 2023.
Employee Stock Purchase Plan
The Six Flags Entertainment Corporation
Our Employee Stock Purchase Plan (the "ESPP") allows eligible employees to purchase
Holdings’ common stock at 90% of the lower of the market value of the common stock at the beginning or end of each successive six-month offering period. Amounts accumulated through participants’ payroll deductions ("purchase rights") are used to purchase shares of common stock at the end of each purchase period. No more than 2,000,000 shares of common stock
of Holdings may be issued pursuant to the ESPP.
Holdings’Shares of common stock may be issued from authorized and unissued shares, treasury shares or shares purchased on the open market. As of
January 1,December 31, 2023, we had
1,487,0001,446,000 shares available for purchase pursuant to the ESPP.
Stock-based compensation related to purchase rights is recognized based on the intrinsic value ofdifference between the outstanding share price and the purchase price paid by the eligible employees to purchase common stock during each respective six-month ESPP offering period. As of January 1,December 31, 2023, and January 2, 2022,1, 2023, no purchase rights were outstanding under the ESPP.
Stock-Based Compensation ExpenseStock-based compensation consisted of the following amounts for the years ended December 31, 2023, January 1, 2023 and January 2, 2022 and December 31, 2020. We present separately the reversal of previously recorded stock-based compensation related to the Employee Stock Purchase Plan.
| | | | | | | | |
| Year Ended |
(Amounts in thousands) | January 1, 2023 | | January 2, 2022 | | December 31, 2020 |
Long-term incentive plan | | | | | | | | |
Options and restricted stock | $ | 7,549 | | $ | 21,102 | | $ | 19,078 |
Employee stock purchase plan | | 124 | | | 360 | | | 452 |
Total stock-based compensation | $ | 7,673 | | $ | 21,462 | | $ | 19,530 |
2022.
| | | | | | | | | | | | | | | | | |
| Year Ended |
| (Amounts in thousands) | December 31, 2023 | | January 1, 2023 | | January 2, 2022 |
| Options and restricted stock | $ | 11,254 | | | $ | 15,094 | | | $ | 23,196 | |
| Employee stock purchase plan | 133 | | | 124 | | | 360 | |
| Total stock-based compensation | $ | 11,387 | | | $ | 15,218 | | | $ | 23,556 | |
11. Income Taxes
The following table summarizes the domestic and foreign components of our income
(loss) before income taxes for the years ended
December 31, 2023, January 1, 2023
and January 2,
2022 and December 31, 2020:2022:
| | | | | | | | | | | | | | | | | |
| Year Ended |
| (Amounts in thousands) | December 31, 2023 | | January 1, 2023 | | January 2, 2022 |
| Domestic | $ | 69,882 | | | $ | 161,205 | | | $ | 217,189 | |
| Foreign | 38,908 | | | 31,789 | | | 2,028 | |
| Income before income taxes | $ | 108,790 | | | $ | 192,994 | | | $ | 219,217 | |
Table of Contents | | | | | | | | | |
| | Year Ended |
(Amounts in thousands) | | January 1, 2023 | | January 2, 2022 | | December 31, 2020 |
Domestic | | $ | 168,751 | | $ | 219,283 | | $ | (487,594) |
Foreign | | | 31,789 | | | 2,028 | | | (35,464) |
Income (loss) before income taxes | | $ | 200,539 | | $ | 221,311 | | $ | (523,059) |
The following table summarizes the components of income tax expense (benefit) for the years ended
December 31, 2023, January 1, 2023
and January 2,
2022 and December 31, 2020:
| | | | | | | | | |
(Amounts in thousands) | | Current | | Deferred | | Total |
2022: | | | | | | | | | |
U.S. federal | | $ | (362) | | $ | 20,691 | | $ | 20,329 |
Foreign | | | 12,943 | | | 3,745 | | | 16,688 |
State and local | | | 3,741 | | | 6,202 | | | 9,943 |
Income tax expense | | $ | 16,322 | | $ | 30,638 | | $ | 46,960 |
2021: | | | | | | | | | |
U.S. federal | | $ | 1,631 | | $ | 33,765 | | $ | 35,396 |
Foreign | | | 1,367 | | | (322) | | | 1,045 |
State and local | | | 7,006 | | | 6,175 | | | 13,181 |
Income tax expense | | $ | 10,004 | | $ | 39,618 | | $ | 49,622 |
2020: | | | | | | | | | |
U.S. federal | | $ | (3,530) | | $ | (99,976) | | $ | (103,506) |
Foreign | | | — | | | (7,642) | | | (7,642) |
State and local | | | (3,239) | | | (26,580) | | | (29,819) |
Income tax benefit | | $ | (6,769) | | $ | (134,198) | | $ | (140,967) |
2022: | | | | | | | | | | | | | | | | | |
| (Amounts in thousands) | Current | | Deferred | | Total |
| 2023: | | | | | |
| U.S. federal | $ | 1,021 | | | $ | 5,471 | | | $ | 6,492 | |
| Foreign | 13,499 | | | (5,589) | | | 7,910 | |
| State and local | 6,450 | | | 1,438 | | | 7,888 | |
| Income tax expense | $ | 20,970 | | | $ | 1,320 | | | $ | 22,290 | |
| 2022: | | | | | |
| U.S. federal | $ | (362) | | | $ | 20,691 | | | $ | 20,329 | |
| Foreign | 12,943 | | | 3,745 | | | 16,688 | |
| State and local | 3,741 | | | 6,202 | | | 9,943 | |
| Income tax expense | $ | 16,322 | | | $ | 30,638 | | | $ | 46,960 | |
| 2021: | | | | | |
| U.S. federal | $ | 1,631 | | | $ | 33,765 | | | $ | 35,396 | |
| Foreign | 1,367 | | | (322) | | | 1,045 | |
| State and local | 7,006 | | | 6,175 | | | 13,181 | |
| Income tax expense | $ | 10,004 | | | $ | 39,618 | | | $ | 49,622 | |
Effective Tax Rate
Recorded income tax expense (benefit) differed from amounts computed by applying the U.S. federal income tax rate of 21% for the years ended December 31, 2023, January 1, 2023 and January 2, 2022 and December 31, 2020 to income (loss) before income taxes as a result of the following:
| | | | | | | | | |
| | Year Ended |
(Amounts in thousands) | | January 1, 2023 | | January 2, 2022 | | December 31, 2020 |
Computed "expected" federal income tax (benefit) expense | | $ | 42,113 | | $ | 46,475 | | $ | (109,842) |
Effect of noncontrolling interest income distribution | | | (9,377) | | | (8,771) | | | (8,671) |
Change in valuation allowance | | | (11,408) | | | 1,845 | | | (2,482) |
Effect of state and local income taxes, net of federal tax benefit | | | 17,514 | | | 10,414 | | | (14,356) |
Deductible compensation in excess of book | | | 1,463 | | | (4,341) | | | 773 |
Nondeductible compensation | | | 264 | | | 5,652 | | | 951 |
Effect of foreign income taxes | | | 8,913 | | | (1,082) | | | (4,072) |
Effect of foreign tax credits | | | (977) | | | (94) | | | (528) |
Other, net | | | (1,546) | | | (476) | | | (2,740) |
Income tax expense (benefit) | | $ | 46,960 | | $ | 49,622 | | $ | (140,967) |
| | | | | | | | | | | | | | | | | |
| Year Ended |
| (Amounts in thousands) | December 31, 2023 | | January 1, 2023 | | January 2, 2022 |
| Computed "expected" federal income tax (benefit) expense | $ | 22,846 | | | $ | 42,113 | | | $ | 46,475 | |
| Effect of non-controlling interest income distribution | (9,975) | | | (9,377) | | | (8,771) | |
| Change in valuation allowance | (2,340) | | | (11,408) | | | 1,845 | |
| Effect of state and local income taxes, net of federal tax benefit | 8,704 | | | 17,514 | | | 10,414 | |
| Deductible compensation in excess of book | (2,357) | | | 1,463 | | | (4,341) | |
| Nondeductible compensation | 5,562 | | | 264 | | | 5,652 | |
| Merger-related transaction costs | 2,075 | | | — | | | — | |
| Effect of foreign income taxes | (2,500) | | | 8,913 | | | (1,082) | |
| Effect of foreign tax credits | (877) | | | (977) | | | (94) | |
| Other, net | 1,152 | | | (1,545) | | | (476) | |
| Income tax expense (benefit) | $ | 22,290 | | | $ | 46,960 | | | $ | 49,622 | |
Deferred Taxes
In connection with emergence from Chapter
11 in 2010, the Company recognized cancellation of debt income ("CODI") upon discharge of its outstanding indebtedness. Under federal tax laws, after emergence from Chapter 11, the Company’s NOLs were reduced by approximately $804.8$804.8 million of CODI.
Sections
382 and 383 of the Internal Revenue Code (“IRC”) impose an annual limitation on the utilization of NOLs and other favorable Tax Attribute carryforwards. As a result of the emergence from Chapter 11, the limitation amount is the product of the value of the Company, computed under special rules that apply to a bankruptcy reorganization, and a published rate that applied for the month the Company emerged from Chapter 11. The Company’s limitation amount is approximately $32.5$32.5 million for each
year to which NOLs and other Tax Attribute carryforwards that existed at emergence are carried forward. The Company has approximately $62.5$30.0 million of NOL carry forwards subject to Section 382 limitation.
Substantially all of our future taxable temporary differences (deferred tax liabilities) relate to the different financial accounting and tax depreciation methods and periods for property and equipment (20 to 25 years for financial reporting purposes and as few as 1 year for tax reporting purposes when
100% bonus depreciation is elected) and intangibles. Our net operating loss carryforwards, foreign tax credits, alternative minimum tax credits, accrued insurance expenses and deferred compensation amounts represent future income tax benefits (deferred tax assets). The following table summarizes the components of deferred
income tax assets and deferred tax liabilities as of
January 1,December 31, 2023, and January
2, 2022:
1, 2023: | | | | | | | | | | | |
| Year Ended |
| (Amounts in thousands) | December 31, 2023 | | January 1, 2023 |
| Deferred tax assets | $ | 241,409 | | | $ | 235,845 | |
| Less: Valuation allowance | 93,643 | | | 95,983 | |
| Net deferred tax assets | 147,766 | | | 139,862 | |
| Deferred tax liabilities | 325,277 | | | 324,499 | |
| Net deferred tax liability | $ | 177,511 | | | $ | 184,637 | |
| | | | | | | | | | | |
| Year Ended |
| (Amounts in thousands) | December 31, 2023 | | January 1, 2023 |
| Deferred tax assets: | | | |
| Federal net operating loss carryforwards | $ | 19,375 | | | $ | 45,463 | |
| State net operating loss carryforwards | 64,953 | | | 72,814 | |
| Deferred compensation | 3,764 | | | 6,201 | |
| Foreign tax credits | 16,225 | | | 17,786 | |
| Interest limitation carryforward | 54,990 | | | 32,868 | |
| Accrued insurance, pension liability and other | 82,102 | | | 60,713 | |
| Total deferred tax assets | $ | 241,409 | | | $ | 235,845 | |
| | | |
| Deferred tax liabilities: | | | |
| Property and equipment | $ | 230,059 | | | $ | 236,589 | |
| Intangible assets and other | 95,218 | | | 87,910 | |
| Total deferred tax liabilities | $ | 325,277 | | | $ | 324,499 | |
| | | | | | |
| | Year Ended |
(Amounts in thousands) | | January 1, 2023 | | January 2, 2022 |
Deferred tax assets | | $ | 222,593 | | $ | 251,446 |
Less: Valuation allowance | | | 95,983 | | | 107,391 |
Net deferred tax assets | | | 126,610 | | | 144,055 |
Deferred tax liabilities | | | 311,247 | | | 292,346 |
Net deferred tax liability | | $ | 184,637 | | $ | 148,291 |
| | | | | | |
| | | | | | |
| | Year Ended |
(Amounts in thousands) | | January 1, 2023 | | January 2, 2022 |
Deferred tax assets: | | | | | | |
Federal net operating loss carryforwards | | $ | 45,463 | | $ | 70,060 |
State net operating loss carryforwards | | | 72,814 | | | 88,494 |
Deferred compensation | | | 6,201 | | | 8,597 |
Foreign tax credits | | | 17,786 | | | 19,005 |
Interest limitation carryforward | | | 32,867 | | | 4,884 |
Accrued insurance, pension liability and other | | | 47,462 | | | 60,406 |
Total deferred tax assets | | $ | 222,593 | | $ | 251,446 |
| | | | | | |
Deferred tax liabilities: | | | | | | |
Property and equipment | | $ | 223,337 | | $ | 213,676 |
Intangible assets and other | | | 87,910 | | | 78,670 |
Total deferred tax liabilities | | $ | 311,247 | | $ | 292,346 |
Other assets, net
As on our consolidated balance sheet. We did not have any deferred tax assets as of January 1, 2023.
As of December 31, 2023, we had
approximately $0.3 billion$160.9 million and
$5.7$6.5 billion of gross net operating loss carryforwards available for U.S. federal income tax and state income tax purposes, respectively, that expire through 2030 and 2038, respectively. Foreign tax credits of
$17.8$16.2 million expire between
20232025 and 2027. We have a valuation allowance of
$96.0$93.6 million and
$107.4$96.0 million as of
January 1,December 31, 2023, and January
2, 2022,1, 2023, respectively, due to uncertainties related to our ability to utilize some of our deferred tax assets before they expire. We analyze our ability to use our foreign tax credits based on our most probable outcome for future foreign sourced income. Based on that analysis, we have determined it is
not more likely than not that some of our foreign tax credits will not be fully utilized and have established a valuation allowance of approximately
$15.9$16.2 million at
January 1,December 31, 2023. The
remaindermajority of
ourthe remaining valuation allowance at
January 1,December 31, 2023 and January
2, 20221, 2023 was based on our inability to use state deferred tax assets related to NOLs that were generated in states where we no longer do business or where we have consistently not generated taxable income. The change in valuation allowance is all attributable to income from operations.
Unrecognized Tax Benefits
Our tax positions are evaluated for recognition using a more-likely-than-not threshold, and those tax positions requiring recognition are measured as the largest amount of tax benefit that is greater than 50% likely of being realized upon effective settlement with a taxing authority that has full knowledge of all relevant information.
As of December 31, 2023, we had $26.1 million of unrecognized tax benefitbenefits, of which $4.4 million was included in Other long-term liabilities on our consolidated balance sheet and $21.7 million, which is associated with tax positions taken in tax years with NOL carryforwards, was presented as a reduction of eachdeferred tax assets.
As of January 1, 2023, we had $25.6 million of unrecognized tax benefits, of which $2.6 million was included in Other long-term liabilities on our consolidated balance sheet and January 2, 2022$23.0 million, which is associated with tax positions taken in tax years with NOL carryforwards, was $25.6 million. presented as a reduction of deferred tax assets.
We classify interest and penalties attributable to income taxes as part of income tax expense. Due toDuring the Company’s NOL position, we haveyears ended December 31, 2023 and January 1, 2023, the expense recognized for interest and penalties was not accrued any penaltiesmaterial.
12. Preferred Stock, Common Stock and
interest.
12.
| Preferred Stock, Common Stock and Other Stockholders’ Equity
|
Other Stockholders’ Equity
As of
January 1,December 31, 2023, the number of authorized shares of common stock was 280,000,000, of which
83,178,29484,124,014 shares were outstanding,
5,634,0004,521,000 shares were reserved for future issuance through our Long-Term Incentive Plan, and
1,487,0001,446,000 shares were reserved for future issuance through the ESPP. Pursuant to the ESPP,
Holdings’ common stockshares may be issued from authorized and unissued shares, treasury shares or shares purchased on the open market.
On March 30, 2017, Holdings announced that itsour Board of Directors approved a new stock repurchase plan that permits Holdings tothe repurchase of an incremental $500.0 million in shares of Holdings’ common stock (the "March 2017 Stock Repurchase Plan"). As of January 1,December 31, 2023, Holdingswe had repurchased 8,071,000 shares at a cumulative cost of approximately $365.1 million and an average price per share of $45.24 under the March 2017 Stock Repurchase Plan, leaving approximately $134.9 million available for permitted repurchases.
During the year ended January 1, 2023, we repurchased 3,464,000 shares for an aggregate price of $96.8 million. We did not repurchase any shares during the years ended December 31, 2023 and January 2, 2022, and December 31, 2020.
Holdings has2022.
We have not paid a quarterly cash dividend since the first quarter of 2020.
As of
January 1,December 31, 2023, the number of authorized shares of preferred stock was 5,000,000,
none of which have been
issued or reserved for future issuance. The authorization of preferred shares empowers
Holdings’our Board of Directors, without further stockholder approval, to issue preferred shares with dividend, liquidation, conversion, voting or other rights which could adversely affect the voting power or other rights of the holders of
Holdings’our common stock. If issued, the preferred stock could also dilute the holders of
Holdings’our common stock and could be used to discourage, delay or prevent a change of control.
Accumulated Other Comprehensive Loss
The balances for each component of accumulated other comprehensive loss are as follows:
| | | | | | | | | | | | | | | | | | | | | | | | | | | | | |
| (Amounts in thousands) | Cumulative
Translation
Adjustment | | Cash Flow
Hedges | | Defined Benefit
Plans | | Income
Taxes | | Accumulated
Other
Comprehensive
Loss |
| Balance as of December 31, 2020 | $ | (27,412) | | | $ | (16,819) | | | $ | (57,642) | | | $ | 5,369 | | | $ | (96,504) | |
| Net current period change | (4,558) | | | 6,299 | | | 12,147 | | | (3,766) | | | 10,122 | |
| Amounts reclassified from AOCL | — | | | 5,535 | | | 1,402 | | | (1,742) | | | 5,195 | |
| Balance as of January 2, 2022 | $ | (31,970) | | | $ | (4,985) | | | $ | (44,093) | | | $ | (139) | | | $ | (81,187) | |
| Net current period change | (1,175) | | | 11,540 | | | 3,817 | | | (3,947) | | | 10,235 | |
| Amounts reclassified from AOCL | — | | | (1,218) | | | 891 | | | 84 | | | (243) | |
| Balance as of January 1, 2023 | $ | (33,145) | | | $ | 5,337 | | | $ | (39,385) | | | $ | (4,002) | | | $ | (71,195) | |
| Net current period change | 3,136 | | | — | | | 1,111 | | | (1,047) | | | 3,200 | |
| Amounts reclassified from AOCL | — | | | (3,177) | | | 940 | | | 556 | | | (1,681) | |
| Balances at December 31, 2023 | $ | (30,009) | | | $ | 2,160 | | | $ | (37,334) | | | $ | (4,493) | | | $ | (69,676) | |
Table of Contents | | | | | | | | | | | | | | | |
| | | | | | | | | | | | | | Accumulated |
| | Cumulative | | | | | | | | | | | Other |
| | Translation | | Cash Flow | | Defined Benefit | | Income | | Comprehensive |
(Amounts in thousands) | | Adjustment | | Hedges | | Plans | | Taxes | | Loss |
Balance as of December 31, 2019 | | $ | (22,184) | | $ | (1,530) | | $ | (49,282) | | $ | (1,714) | | $ | (74,710) |
Net current period change | | | (5,228) | | | (33,902) | | | (9,345) | | | 11,968 | | | (36,507) |
Amounts reclassified from AOCL | | | — | | | 3,685 | | | 985 | | | (1,165) | | | 3,505 |
Effects of Adoption of ASU 2018-02 | | | — | | | 14,928 | | | — | | | (3,720) | | | 11,208 |
Balance as of December 31, 2020 | | $ | (27,412) | | $ | (16,819) | | $ | (57,642) | | $ | 5,369 | | $ | (96,504) |
Net current period change | | | (4,558) | | | 6,299 | | | 12,147 | | | (3,766) | | | 10,122 |
Amounts reclassified from AOCL | | | — | | | 5,535 | | | 1,402 | | | (1,742) | | | 5,195 |
Balance as of January 2, 2022 | | $ | (31,970) | | $ | (4,985) | | $ | (44,093) | | $ | (139) | | $ | (81,187) |
Net current period change | | | (1,175) | | | 11,540 | | | 3,817 | | | (3,947) | | | 10,235 |
Amounts reclassified from AOCL | | | — | | | (1,218) | | | 891 | | | 84 | | | (243) |
Balances at January 1, 2023 | | $ | (33,145) | | $ | 5,337 | | $ | (39,385) | | $ | (4,002) | | $ | (71,195) |
The Company had the following reclassifications out of accumulated other comprehensive loss during the years ended
December 31, 2023, January 1, 2023
and January 2,
2022 and December 31, 2020:
| | | | | | | | | | |
| | | Amount of Reclassification from AOCL |
| | | Year Ended |
Component of AOCL | | Location of Reclassification into Income | January 1, 2023 | | January 2, 2022 | | December 31, 2020 |
Amortization of loss on interest rate hedge | | Interest expense | $ | (1,218) | | $ | 5,535 | | $ | 3,685 |
| | Income tax benefit | | 306 | | | (1,390) | | | (917) |
| | Net of tax | $ | (912) | | $ | 4,145 | | $ | 2,768 |
| | | | | | | | | | |
Amortization of deferred actuarial loss and prior service cost | | Operating expenses | $ | 891 | | $ | 1,402 | | $ | 985 |
| | Income tax expense | | (222) | | | (352) | | | (248) |
| | Net of tax | $ | 669 | | $ | 1,050 | | $ | 737 |
| | | | | | | | | | |
Total reclassifications | | | $ | (243) | | $ | 5,195 | | $ | 3,505 |
2022: | | | | | | | | | | | | | | | | | | | | | | | | | | |
| Component of AOCL | | Location of Reclassification into Income | | Amount of Reclassification from AOCL |
| | Year Ended |
| | December 31, 2023 | | January 1, 2023 | | January 2, 2022 |
| Amortization of loss on interest rate hedge | | Interest expense | | $ | (3,177) | | | $ | (1,218) | | | $ | 5,535 | |
| | Income tax benefit | | 790 | | | 306 | | | (1,390) | |
| | Net of tax | | $ | (2,387) | | | $ | (912) | | | $ | 4,145 | |
| | | | | | | | |
| Amortization of deferred actuarial loss and prior service cost | | Other (income) expense | | $ | 940 | | | $ | 891 | | | $ | 1,402 | |
| | Income tax expense | | (234) | | | (222) | | | (352) | |
| | Net of tax | | $ | 706 | | | $ | 669 | | | $ | 1,050 | |
| | | | | | | | |
| Total reclassifications | | | | $ | (1,681) | | | $ | (243) | | | $ | 5,195 | |
As part of the acquisition of Former SFEC, we assumed the obligations related to the SFTP Defined Benefit Plan (the "SFTP Benefit Plan"). The SFTP Benefit Plan covered substantially all of SFTP’s employees. During 1999, the SFTP Benefit Plan was amended to cover substantially all of our domestic full-time employees. During 2004, the SFTP Benefit Plan was further amended to cover certain seasonal workers, retroactive to January 1, 2003. The SFTP Benefit Plan permits normal retirement at age 65, with early retirement at ages 55 through 64 upon attainment of 10 years of credited service. The early retirement benefit is reduced for benefits commencing before age 62. Plan benefits are calculated according to a benefit formula based on age, average compensation over the highest consecutive five-year5-year period during the employee’s last ten10 years of employment and years of service.
We froze the SFTP Benefit Plan effective March 31, 2006, and as of February 16, 2009, participants in the plan no longer earned future benefits. The SFTP Benefit Plan assets are invested primarily in
equity and fixed income
securities, as well as alternative investments, such as hedge funds.securities. The SFTP Benefit Plan does not have significant liabilities other than benefit obligations. Under our funding policy, contributions to the SFTP Benefit Plan are determined using the projected unit credit cost method. This funding policy meets the requirements under the Employee Retirement Income Security Act of 1974 (“ERISA”).
We froze the SFTP Benefit Plan effective March 31, 2006, and as
Obligations and Funded Status
The following table sets forth the change in our benefit plan obligation and fair value of plan assets as of
December 31, 2023, January 1, 2023
and January 2,
2022 and December 31, 2020:2022:
| | | | | | | | | | | | | | | | | |
| Year Ended |
| (Amounts in thousands) | December 31, 2023 | | January 1, 2023 | | January 2, 2022 |
| Change in benefit obligation: | | | | | |
| Beginning balance | $ | 163,261 | | | $ | 218,150 | | | $ | 237,126 | |
| Interest cost | 7,817 | | | 5,518 | | | 5,119 | |
| Actuarial (gain) loss | 3,070 | | | (49,740) | | | (14,628) | |
| Benefits paid | (10,544) | | | (10,667) | | | (9,467) | |
| Benefit obligation at end of period | $ | 163,604 | | | $ | 163,261 | | | $ | 218,150 | |
| | | | | |
| Change in fair value of plan assets: | | | | | |
| Beginning balance | $ | 172,444 | | | $ | 217,997 | | | $ | 218,773 | |
| Actual return on assets | 13,329 | | | (33,721) | | | 9,871 | |
| Employer contributions | — | | | — | | | — | |
| Benefits paid | (10,544) | | | (10,667) | | | (9,467) | |
| Administrative fees | (2,142) | | | (1,165) | | | (1,180) | |
| Fair value of plan assets at end of period | $ | 173,087 | | | $ | 172,444 | | | $ | 217,997 | |
| | | | | | | | | |
| | Year Ended |
(Amounts in thousands) | | January 1, 2023 | | January 2, 2022 | | December 31, 2020 |
Change in benefit obligation: | | | | | | | | | |
Beginning balance | | $ | 218,150 | | $ | 237,126 | | $ | 221,458 |
Interest cost | | | 5,518 | | | 5,119 | | | 6,431 |
Actuarial (gain) loss | | | (49,740) | | | (14,628) | | | 18,243 |
Benefits paid | | | (10,667) | | | (9,467) | | | (9,006) |
Benefit obligation at end of period | | $ | 163,261 | | $ | 218,150 | | $ | 237,126 |
| | | | | | | | | |
Change in fair value of plan assets: | | | | | | | | | |
Beginning balance | | $ | 217,997 | | $ | 218,773 | | $ | 205,463 |
Actual return on assets | | | (33,721) | | | 9,871 | | | 21,987 |
Employer contributions | | | — | | | — | | | 1,500 |
Benefits paid | | | (1,165) | | | (9,467) | | | (9,006) |
Administrative fees | | | (10,667) | | | (1,180) | | | (1,171) |
Fair value of plan assets at end of period | | $ | 172,444 | | $ | 217,997 | | $ | 218,773 |
Employer contributions and benefits paid in the above table include only those amounts contributed directly to, or paid directly from, plan assets. As of January 1,December 31, 2023 and January 2, 2022, the SFTP Benefit Plan’s projected benefit obligation exceeded1, 2023, the fair value of the SFTP Benefit Plan assets exceeded its projected benefit obligation by $9.5 million and $9.2 million, respectively, resulting in the SFTP Benefit Plan being overfunded by $9.2 million and underfunded by $0.2 million, respectively.a net plan asset position in each period. The overfunded / underfunded amountnet plan asset is recognizedpresented in deposits and other assets, or other long-term liabilitiesnet in our consolidated balance sheets, respectively. Other net periodic pension benefit is separately disclosed within the consolidated statement of operations.
We use December 31 as our measurement date. sheets.
The weighted average assumptions used to determine benefit obligations are as follows:
| | | | | |
| | Year Ended | |
| | January 1, 2023 | | January 2, 2022 | |
Discount rate | | 4.95 | % | 2.60 | % |
Rate of compensation increase | | N/A | | N/A | |
| | | | | | | | | | | |
| Year Ended |
| December 31, 2023 | | January 1, 2023 |
| Discount rate | 4.75 | % | | 4.95 | % |
| Rate of compensation increase | N/A | | N/A |
Net periodic benefit cost and other comprehensive income (loss)
The following table sets forth the components of net periodic benefit cost and other comprehensive income (loss):
| | | | | | | | |
| Year Ended |
(Amounts in thousands) | January 1, 2023 | | January 2, 2022 | | December 31, 2020 |
Net periodic benefit cost: | | | | | | | | |
Service cost | $ | 1,200 | | $ | 1,100 | | $ | 1,200 |
Interest cost | | 5,518 | | | 5,119 | | | 6,431 |
Expected return on plan assets | | (12,237) | | | (12,272) | | | (13,119) |
Amortization of net actuarial loss | | 891 | | | 1,402 | | | 985 |
Total net periodic benefit | $ | (4,628) | | $ | (4,651) | | $ | (4,503) |
| | | | | | | | |
Other comprehensive income: | | | | | | | | |
Current year actuarial gain | $ | 3,817 | | $ | 12,147 | | $ | (9,345) |
Recognized net actuarial loss | | 891 | | | 1,402 | | | 985 |
Total other comprehensive gain | $ | 4,708 | | $ | 13,549 | | $ | (8,360) |
| | | | | | | | | | | | | | | | | |
| Year Ended |
| (Amounts in thousands) | December 31, 2023 | | January 1, 2023 | | January 2, 2022 |
| Net periodic benefit cost: | | | | | |
| Service cost | $ | — | | | $ | — | | | $ | — | |
| Interest cost | 7,817 | | | 5,518 | | | 5,119 | |
| Expected return on plan assets | (9,606) | | | (12,237) | | | (12,272) | |
| Amortization of net actuarial loss | 940 | | | 891 | | | 1,402 | |
| Administrative fees | $ | 2,600 | | | $ | 1,200 | | | $ | 1,100 | |
| Total net periodic expense (benefit) | $ | 1,751 | | | $ | (4,628) | | | $ | (4,651) | |
| | | | | |
| Other comprehensive income: | | | | | |
| Current year actuarial gain | $ | 1,110 | | | $ | 3,817 | | | $ | 12,147 | |
| Recognized net actuarial loss | 940 | | | 891 | | | 1,402 | |
| Total other comprehensive gain | $ | 2,050 | | | $ | 4,708 | | | $ | 13,549 | |
As of
December 31, 2023 and January 1, 2023,
and January 2, 2022, we have
recordedrecognized actuarial losses of $37.3 million (net of tax of $9.8 million) and $39.4 million (net of tax of $9.2
million) and $48.6 million (net of tax of $8.1 million), respectively, in accumulated other comprehensive loss in our consolidated balance sheets.
We anticipate that $0.9 million will be amortized from accumulated other comprehensive loss into net periodic benefit cost in
2023.2024.
The weighted average assumptions used to determine
our net
costsperiodic benefit cost are as follows:
| | | | | | | |
| | Year Ended | |
| | January 1, 2023 | | January 2, 2022 | | December 31, 2020 | |
Discount rate | | 2.60 | % | 2.20 | % | 3.00 | % |
Rate of compensation increase | | N/A | | N/A | | N/A | |
Expected return on plan assets | | 5.75 | % | 5.75 | % | 6.50 | % |
Corridor | | 10.00 | % | 10.00 | % | 10.00 | % |
Average future life expectancy (in years) | | 24.17 | | 24.77 | | 25.70 | |
| | | | | | | | | | | | | | | | | |
| Year Ended |
| December 31, 2023 | | January 1, 2023 | | January 2, 2022 |
| Discount rate | 4.95 | % | | 2.60 | % | | 2.20 | % |
| Rate of compensation increase | N/A | | N/A | | N/A |
| Expected return on plan assets | 5.75 | % | | 5.75 | % | | 5.75 | % |
| Corridor | 10.00 | % | | 10.00 | % | | 10.00 | % |
| Average future life expectancy (in years) | 23.62 | | 24.17 | | 24.77 |
The discount rate assumption was developed based on high-quality corporate bond yields as of the measurement date. High quality corporate bond yield indices on over 500 AA high grade bonds are considered when selecting the discount rate.
The return on plan assets assumption was developed based on consideration of historical market returns, current market conditions, and the SFTP Benefit Plan’s past experience. Estimates of future market returns by asset category are reflective of actual long-term historical returns. Overall, it was projected that the SFTP Benefit Plan could achieve a 5.75% net return over time based on a consistent application of the existing asset allocation strategy and a continuation of the SFTP Benefit Plan’s policy of monitoring manager performance.
Description of Investment Committee and Strategy
The Investment Committee is responsible for managing the investment of SFTP Benefit Plan assets and ensuring that the SFTP Benefit Plan’s investment program is in compliance with all provisions of ERISA, other relevant legislation, related SFTP Benefit Plan documents and the Statement of Investment Policy. The Investment Committee has retained several mutual funds, commingled funds and/or investment managers to manage SFTP Benefit Plan assets and implement the investment process. The investment managers, in implementing their investment processes, have the authority and responsibility to select appropriate investments in the asset classes specified by the terms of the applicable prospectus or other investment manager agreements with the SFTP Benefit Plan.
The primary financial objective of the SFTP Benefit Plan is to secure participant retirement benefits. To achieve this, the key objective in the SFTP Benefit Plan’s financial management is to promote stability and, to the extent appropriate, growth in funded status. Other related and supporting financial objectives are also considered in conjunction with a comprehensive review of current and projected SFTP Benefit Plan financial requirements.
The assets of the fund are invested to achieve the greatest reward for the SFTP Benefit Plan consistent with a prudent level of risk. The asset return objective is to achieve, as a minimum over time, the passively managed return earned by market index funds, weighted in the proportions outlined by the asset class exposures in the SFTP Benefit Plan’s long-term target asset allocation.
The SFTP Benefit Plan’s portfolio may be allocated across several hedge fund styles and strategies.
Plan Assets
The target allocations for
Our plan assets are 92%allocate as follows: 95% to fixed income securities, 3%securities; 5% to international equity securitiessecurities; and 5%a nominal amount to alternative investments. Equity securities primarily include investments in large-cap companies located in the United States and abroad. Fixed income securities include bonds and debentures issued by domestic and foreign private and governmental issuers. Alternative investments are comprised of hedge fund of funds. The following table presents the categories of our plan assets and the related levels of inputs in the fair value hierarchy used to determine the fair value, as defined in Note 2(c)2 - Summary of Significant Accounting Policies: | | | | | | | | | | | | | | | | | | | | | | | |
| Fair Value Measurements as of December 31, 2023 |
| (Amounts in thousands) | Total | | Quoted Prices in
Active Markets for
Identical Assets
(Level 1) | | Significant
Observable
Inputs
(Level 2) | | Significant
Observable
Inputs
(Level 3) |
| ASSET CATEGORY: | | | | | | | |
| Equity Securities: | | | | | | | |
International Equity (a) | $ | 8,890 | | | $ | 8,890 | | | $ | — | | | $ | — | |
| Fixed Income: | | | | | | | |
Long Duration Fixed Income (b) | 164,093 | | | 164,093 | | | — | | | — | |
| Alternatives: | | | | | | | |
Other Investments (c) | 104 | | | — | | | — | | | — | |
| Fair Value of Plan Assets | $ | 173,087 | | | $ | 172,983 | | | $ | — | | | $ | — | |
| | | | | | | | | | | | | | | | | | | | | | | |
| Fair Value Measurements as of January 1, 2023 |
| (Amounts in thousands) | Total | | Quoted Prices in
Active Markets for
Identical Assets
(Level 1) | | Significant
Observable
Inputs
(Level 2) | | Significant
Observable
Inputs
(Level 3) |
| ASSET CATEGORY: | | | | | | | |
| Equity Securities: | | | | | | | |
International Equity (a) | $ | 8,415 | | | $ | 8,415 | | | $ | — | | | $ | — | |
| Fixed Income: | | | | | | | |
Long Duration Fixed Income (b) | 159,158 | | | 159,158 | | | — | | | — | |
| Alternatives: | | | | | | | |
Other Investments (c) | 4,871 | | | — | | | — | | | — | |
| Fair Value of Plan Assets | $ | 172,444 | | | $ | 167,573 | | | $ | — | | | $ | — | |
(a) | | | | | | | | | | | | |
| | Fair Value Measurements as of January 1, 2023 |
| | | | | Quoted Prices in | | Significant | | Significant |
| | | | | Active Markets for | | Observable | | Unobservable |
| | | | | Identical Assets | | Inputs | | Inputs |
(Amounts in thousands) | | Total | | (Level 1) | | (Level 2) | | (Level 3) |
ASSET CATEGORY: | | | | | | | | | | | | |
Equity Securities: | | | | | | | | | | | | |
International Equity (a) | | $ | 8,415 | | $ | 8,415 | | $ | — | | $ | — |
Fixed Income: | | | | | | | | | | | | |
Long Duration Fixed Income (b) | | | 159,158 | | | 159,158 | | | — | | | — |
Alternatives: | | | | | | | | | | | | |
Other Investments (c) | | | 4,871 | | | — | | | — | | | — |
Fair Value of Plan Assets | | $ | 172,444 | | $ | 167,573 | | $ | — | | $ | — |
This category consists of mutual funds invested primarily in equity securities (common stocks, securities that are convertible into common stocks, preferred stocks, warrants and rights to subscribe to common stocks) of non-U.S. issuers purchased in foreign markets. The mutual funds are actively traded on U.S. or foreign registered exchanges, or the over-the-counter markets.
| | | | | | | | | | | | |
| | Fair Value Measurements as of January 2, 2022 |
| | | | | Quoted Prices in | | Significant | | Significant |
| | | | | Active Markets for | | Observable | | Unobservable |
| | | | | Identical Assets | | Inputs | | Inputs |
(Amounts in thousands) | | Total | | (Level 1) | | (Level 2) | | (Level 3) |
ASSET CATEGORY: | | | | | | | | | | | | |
Equity Securities: | | | | | | | | | | | | |
International Equity (a) | | $ | 16,747 | | $ | 16,747 | | $ | — | | $ | — |
Fixed Income: | | | | | | | | | | | | |
Long Duration Fixed Income (b) | | | 164,200 | | | 164,200 | | | — | | | — |
Alternatives: | | | | | | | | | | | | |
Other Investments (c) | | | 37,050 | | | — | | | — | | | — |
Fair Value of Plan Assets | | $ | 217,997 | | $ | 180,947 | | $ | — | | $ | — |
(b)The assets are comprised of U.S. Treasury Separate Trading of Registered Interest and Principal of Securities ("U.S. Treasury STRIPS") and mutual funds which are actively traded on the registered exchanges. The mutual funds are invested primarily in high quality government and corporate fixed income securities, as well as synthetic instruments or derivatives having economic characteristics similar to fixed income securities.
(a) | This category consists of mutual funds invested primarily in equity securities (common stocks, securities that are convertible into common stocks, preferred stocks, warrants and rights to subscribe to common stocks) of non-U.S. issuers purchased in foreign markets. The mutual funds are actively traded on U.S. or foreign registered exchanges, or the over-the-counter markets.(c) |
(b) | The assets are comprised of U.S. Treasury Separate Trading of Registered Interest and Principal of Securities ("U.S. Treasury STRIPS") and mutual funds which are actively traded on the registered exchanges. The mutual funds are invested primarily in high quality government and corporate fixed income securities, as well as synthetic instruments or derivatives having economic characteristics similar to fixed income securities. |
(c) | Common/collective trust investments that are measured at fair value using the net asset value per share practical expedient have not been classified in the fair value hierarchy. The fair value amounts presented in this table are intended to permit reconciliation of the fair value hierarchy to the total fair value of plan assets. The Company has participant redemptions restricted to the last business day of the quarter, with either a 65 or 90 day of the quarter, with either a 65 days or 90 days period redemption notice. |
We do not plan to make any contributions to plan trusts in
2023.2024. The following table summarizes expected future benefit payments:
| | | |
(Amounts in thousands) | | | |
Expected benefit payments: | | | |
2023 | | $ | 10,685 |
2024 | | | 11,019 |
2025 | | | 11,274 |
2026 | | | 11,430 |
2027 | | | 11,615 |
2028 through 2032 | | | 58,265 |
Total expected benefit payments | | $ | 114,288 |
14.
| Earnings (Loss) Per Share of Common Stock
|
| | | | | |
| (Amounts in thousands) | |
| Expected benefit payments: | |
| 2024 | $ | 11,053 | |
| 2025 | 11,273 | |
| 2026 | 11,421 | |
| 2027 | 11,603 | |
| 2028 | 11,656 | |
| 2029 through 2033 | 57,609 | |
| Total expected benefit payments | $ | 114,615 | |
14. Earnings Per Share of Common Stock
For the years ended
December 31, 2023, January 1, 2023 and January 2, 2022, the computation of diluted earnings per common share included the effect of
0.5 million, 0.3 million and 0.9 million dilutive stock options and restricted stock units, respectively. For the years ended
December 31, 2023, January 1, 2023
and January 2, 2022,
and December 31, 2020, the computation of diluted earnings
(loss) per share of common stock excluded the effect of
1.4 million, 2.5 million
3.4 million and
6.33.4 million antidilutive stock options and restricted stock units, respectively. Earnings
(loss) per common share for the years ended
December 31, 2023, January 1, 2023
and January 2, 2022
and December 31, 2020 was calculated as follows:
| | | | | | | | | |
| | For The Year Ended |
(Amounts in thousands, except per share amounts) | | January 1, 2023 | | January 2, 2022 | | December 31, 2020 |
Net income (loss) attributable to Six Flags Entertainment Corporation common stockholders | | $ | 108,928 | | $ | 129,923 | | $ | (423,380) |
| | | | | | | | | |
Weighted-average common shares outstanding—basic | | | 84,366 | | | 85,708 | | | 84,800 |
Effect of dilutive stock options and restricted stock units | | | 329 | | | 943 | | | — |
Weighted-average common shares outstanding—diluted | | | 84,695 | | | 86,651 | | | 84,800 |
| | | | | | | | | |
Earnings (loss) per share—basic | | $ | 1.29 | | $ | 1.52 | | $ | (4.99) |
Earnings (loss) per share—diluted | | $ | 1.29 | | $ | 1.50 | | $ | (4.99) |
| | | | | | | | | | | | | | | | | |
| For The Year Ended |
| (Amounts in thousands, except per share amounts) | December 31, 2023 | | January 1, 2023 | | January 2, 2022 |
| Net income attributable to Six Flags Entertainment Corporation common stockholders | $ | 38,999 | | | $ | 101,383 | | | $ | 127,829 | |
| | | | | |
| Weighted-average common shares outstanding—basic | 83,410 | | 84,366 | | 85,708 |
| Effect of dilutive stock options and restricted stock units | 525 | | 329 | | 943 |
| Weighted-average common shares outstanding—diluted | 83,935 | | 84,695 | | 86,651 |
| | | | | |
| Earnings per share—basic | $ | 0.47 | | | $ | 1.20 | | | $ | 1.49 | |
| Earnings per share—diluted | $ | 0.46 | | | $ | 1.20 | | | $ | 1.48 | |
15.
| Commitments and Contingencies
|
Partnership Parks
On April 1, 1998, we acquired all of the capital stock of Former SFEC for $976.0 million, paid in cash. In addition to our obligations under outstanding indebtedness and other securities issued or assumed in the Former SFEC acquisition, we also guaranteed certain contractual obligations relating to the Partnership Parks. Specifically, we guaranteed the obligations of the general partners of those partnerships to (i) make minimum annual distributions (including rent) of approximately $85.6$88.5 million in 20232024 (subject to cost of living adjustments) to the limited partners inof the partnership entities (the Georgia Partnership with respect to the SFOG and the Texas Partnership with respect to the SFOT) that owns the Partnership Parks (based on our ownership of units as of January 1,December 31, 2023, our share of the distribution will be approximately $38.1$39.4 million) and (ii) make minimum capital expenditures at each of the Partnership Parks during rolling five-year periods, based generally on 6% of the Partnership Parks’ revenues. Cash flow from operations at the Partnership Parks is used to satisfy these requirements, before any funds are required from us. We also guaranteed the obligation of our subsidiaries to annually purchase all outstanding limited partnership units to the extent tendered by the unit holders (the "Partnership Park Put"). The agreed price for units tendered in the Partnership Park Put is based on a valuation of each of the respective Partnership Parks (the "Specified"Partnership Put Price") that is the greater of (a) a valuation for each of the respective Partnership Parks derived by multiplying such park’s weighted average four year EBITDA (as defined in the agreements that govern the partnerships) by a specified multiple (8.0 in the case of SFOG and 8.5 in the case of SFOT) and (b) a valuation derived from the highest prices previously paid for the units of the Partnership Parks by certain entities. In light of the temporary suspension of operations of the Partnership Parks due to
the COVID-19 pandemic in March 2020, which would cause the value of the limited partnership units of the Partnership Parks to decrease in 2021 and thereafter, we adjusted our annual offer to purchase these units. Accordingly, to preserve liquidity in 2020 and avoid uncertainty with future purchase prices for the units, we adjusted the 2020 offer price to set a minimum price floor for all future purchases. Pursuant to the valuation methodologies described in the preceding sentence, the SpecifiedPartnership Put Price for the Partnership Parks, if determined as of January 1,December 31, 2023 is $409.7 million in the case of SFOG and $527.4 million in the case of SFOT. As of January 1,December 31, 2023, we owned approximately 31.5% and 54.1% of the Georgia limited partner interests and Texas limited partner interests, respectively. Our obligations
In January 2027 with respect to SFOGthe Georgia Partnership and SFOT will continue until 2027 andin January 2028 respectively.In 2027 and 2028,with respect to the Texas Partnership, we will have the option (each the “End-of-Term Option”) to purchaserequire the redemption of all remainingthe limited partnership units we do not then own in the Partnerships. To exercise the End-of-Term Option, we must give the Georgia Partnership notice of its exercise no later than December 31, 2024 and we must give the Texas Partnership notice of its exercise no later than December 31, 2025. If the End-of-Term Option is not exercised, the parties may decide to renew and extend the arrangements relating to the Partnership Parks. Alternatively, if the End-of-Term Option is not exercised, the Partnership Park entities may be sold and the proceeds applied to redeem the outstanding interests in the Georgia Partnership and Texas Partnership, as applicable. If the End-of-Term Option is exercised, the price offered, and required to be accepted by the holders' of the limited partnerunits we do not then own would, is based on the agreed-upon value of the partnerships included in the original agreements, multiplied by the change in the Consumer Price Index ("CPI") between the beginning and end of the agreement. The agreements for Georgia Partnership and the Texas Partnership began in 1997 and 1998, respectively. The agreed-upon value for the partnerships, when the agreements were executed, was $250.0 million and $374.8 million for SFOG and SFOT, respectively. As of
December 31, 2023, the agreed upon value, as adjusted for CPI, would be $483.5 million and $712.7 million for SFOG and SFOT, respectively. The agreed upon values, if determined as of December 31, 2023, multiplied by the 68.5% and 45.9% of units held by the limited partner for SFOG and SFOT, respectively, at a pricerepresent $330.9 million and $332.6 million that would be required to be paid to the limited partner of SFOG and SFOT, respectively, if the End-of-Term Option were to be exercised. The actual agreed upon value for the End-of-Term Option will be further adjusted by CPI until the end of the each respective agreement. The decision to exercise, or not exercise, the End-of-Term Option for either of SFOT or SFOG will ultimately be made based on numerous factors, including prevailing macro-economic and industry conditions and the Specified Price, increased by a cost and availability of living adjustment. financing to fund the purchase. Pursuant to the 2023 and 2022 annual offer,offers, we did not purchase units from the Georgia Partnership. We purchased 0.149 units from the Texas partnership for approximately $0.3 million in May 2023. We purchased 0.25358 units from the Texas partnership for approximately $0.6 million in May 2022. We did not purchase any units from the Georgia partnership during 2022. Pursuant to the 2021 annual offer, we purchased 0.125 units from the Georgia partnership for approximately $0.5 million and 0.2748 units from the Texas partnership for approximately $0.6 million in May 2021. As we purchase additional units, we are entitled to a proportionate increase in our share of the minimum annual distributions. The maximum unit purchase obligations for 2023 at both parks aggregates to approximately $521.4 million, representing approximately 68.5% of the outstanding units of SFOG and 45.9% of the outstanding units of SFOT. The $350.0$400.0 million accordion feature on the Second Amended and Restated Term Loan B under the Second Amended and Restated Credit Facility(as defined in Note 8 - Long-Term Indebtedness) is available for borrowing for future "put" obligations, if necessary. In connection with our acquisition of the Former SFEC, we entered into the Subordinated Indemnity Agreement with certain of the Company’s entities, Time Warner and an affiliate of Time Warner, (an indirect subsidiary of AT&T Inc. as a result of a merger in 2018), pursuant to which, among other things, we transferred to Time Warner (which has guaranteed all of our obligations under the Partnership Park arrangements) record title to the corporations which own the entities that have purchased and will purchase limited partnership units of the Partnership Parks, and we received an assignment from Time Warner of all cash flow received on such limited partnership units, and we otherwise control such entities. In addition, we issued preferred stock of the managing partner of the partnerships to Time Warner. In the event of a default by us under the Subordinated Indemnity Agreement or of our obligations to our partners in the Partnership Parks, these arrangements would permit Time Warner to take full control of both the entities that own limited partnership units and the managing partner. If we satisfy all such obligations, Time Warner is required to transfer to us the entire equity interests of these entities. The 2022 sale of Time Warner to Discovery did not affect the Time Warner guarantee of our obligations under the Subordinated Indemnity Agreement.
We incurred $20.6incurred $26.0 million of capital expenditures at these parks during the 20222023 season and intend to incur approximately $20.4 million of capital expenditures at these parks for the 20232024 season an amount in excess of the minimum required expenditure. Cash flows from operations at the Partnership Parks will be used to satisfy the annual distribution and capital expenditure requirements, before any funds are required from us. The Partnership Parks generated approximately $73.0$16.3 million of cash in 20222023 from operating activities after deduction of capital expenditures and excluding the impact of short-term intercompanyintercompany advances from or payments to Holdings. As of January 1, 2023 and January 2, 2022, we had total loans receivable outstanding of $288.3 million, from the partnerships that own the Partnership Parks, primarily to fund the acquisition of Six Flags White Water Atlanta, and to make capital improvements and distributions to the limited partners.
We are party to a license agreement pursuant to which we have the exclusive right on a long-term basis to theme park use in the United States and Canada (excluding the Las Vegas, Nevada metropolitan area) of all animated, cartoon and comic book characters that Warner Bros. and DC Comics have the right to license for such use. The term of the agreement expires in 2053. The license fee is payable on a per-theme park basis, and is subject to CPI increases and scheduled adjustments, including periodic market resets.
In November 1999, we entered into license agreements pursuant to which we have the exclusive right on a long-term basis to parkstheme park use in Europe, Central and South America of all animated, cartoon and comic book characters that Warner Bros. and DC
Comics have the right to license for such use. Under such agreements, the license fee is based on specified percentages of the gross revenues of the applicable parks.
We maintain insurance of the types and in amounts that we believe are commercially reasonable and that are available to businesses in our industry. We maintain multi-layered general liability policies that provide for excess liability coverage of up to $100.0 million per occurrence. For incidents arising on or after December 31, 2008, our self-insured retention is $2.0 million, followed by a $0.5 million deductible per occurrence applicable to all claims in the policy year for our domestic parks and our park in Canada and a nominal amount per occurrence for our parks in Mexico. Defense costs are in addition to these retentions. Our general liability policies cover the cost of punitive damages only in certain jurisdictions. Based upon reported claims and an estimate for incurred, but not reported claims, we accrue a liability for our retention contingencies. For workers’ compensation claims arising after November 15, 2003, our deductible is $0.75 million. We also maintain fire and extended coverage, business interruption, terrorism and other forms of insurance typical to businesses in this industry. The all peril property coverage policies insure our real and personal properties (other than land) against physical damage resulting from a variety of hazards. Additionally, we maintain information security and privacy liability insurance in the amount of $10.0 million with a $0.25 million retention per event. We generally renegotiate our insurance policies on an annual basis. The majority of our current insurance policies expire on December 31, 2023.2024. We cannot predict the level of the premiums that we may be required to pay for subsequent insurance coverage, the level of any retention applicable thereto, the level of aggregate coverage available or the availability of coverage for specific risks.
Self-Insurance ReservesSelf-insurance reserves are recorded for the estimated amounts of guest and employee claims and expenses incurred each period that are not covered by insurance. Reserves are established for both identified claims and incurred but not reported (“IBNR”) claims. Such amounts are accrued for when claim amounts become probable and estimable. Reserves for identified claims are based upon the Company’s historical claims experience and third-party estimates of settlement costs. Reserves for IBNR claims are based upon our claims data history, actuarially determined loss development factors and certain other qualitative considerations. We maintain self-insurance reserves for healthcare, auto, general liability, and workers’ compensation claims.
Total accrued self-insurance reserves were $64.6 million and $34.1 million as of December 31, 2023 and January 1, 2023.
While certain legal proceedings and related indemnification obligations to which we are a party specify the amounts claimed, these claims may not represent reasonably possible losses. Except as noted below, given the inherent uncertainties of litigation, the ultimate outcome of these matters cannot be predicted at this time, nor can the amount of possible loss or range of loss, if any, be reasonably estimated, except in circumstances where an aggregate litigation accrual has been recorded for probable and reasonably estimable loss contingencies. A determination of the amount of accrual required, if any, for these contingencies is made after careful analysis of each matter. The required accrual may change in the future due to new information or developments in each matter or changes in approach such as a change in settlement strategy in dealing with these matters.
Privacy Class Action Lawsuits
Legal Proceedings Related to Proposed Mergers
On January 7, 2016,February 16, 2024, a putative class actionpurported stockholder of the Company filed a complaint was filedcaptioned Garfield vs. Baldanza, et al., No. 42-350320-24, against Holdingsthe Company, its Board of Directors (the "Board"), Cedar Fair, and CopperSteel (collectively, the "Defendants") in the CircuitDistrict Court of LakeTarrant County, Illinois. On April 22, 2016, Great America, LLC was added as a defendant.Texas. The complaint assertscompliant alleges, among other things, that we violated the Illinois Biometric Information Privacy Act ("BIPA")Company made materially false and misleading statements in connection with its proposed combination with Cedar Fair, and that the admissionBoard breached their fiduciary duties to stockholders in approving the merger and in disseminating the challenged disclosures. The complaint, among other things, seeks a
declaration that the Company and members through the finger scan program that commenced in the 2014 operating season at Six Flags Great America in Gurnee, Illinois, and seeks statutory damages, attorneys’Board breached their fiduciary duties, requests attorneys' fees and an injunction. An aggrieved party under BIPA may recover (i) $1,000 if a company is foundcosts, and asks the court to have negligently violated BIPAcompel the Defendants to make certain supplemental disclosures or (ii) $5,000 if found to have intentionallyenjoin or recklessly violated BIPA, plus reasonable attorneys’ fees in each case. unwind the proposed transaction absent such disclosures.
The
complaint does not allege that any information was misused or disseminated. On April 7, 2017, the trial court certified two questions for consideration by the Illinois Appellate Court of the Second District. On June 7, 2017, the Illinois Appellate Court granted our motion to appeal. Accordingly, two questions regarding the interpretation of BIPA were certified for consideration by the Illinois Appellate Court. On December 21, 2017, the Illinois Appellate Court found in our favor, holding that the plaintiff had to allege more than a technical violation of BIPACompany has received additional letters and
had to be injured in some way in order to have a right of action. On March 1, 2018, the plaintiff filed a petition for leave to appeal to the Illinois Supreme Court. On May 30, 2018, the Illinois Supreme Court granted the plaintiff’s leave to appeal and oral arguments were heard on November 20, 2018. On January 25, 2019, the Illinois Supreme Court found in favor of the plaintiff, holding that the plaintiff does not need to allege an actual injury beyond the violation of his rights under BIPA in order to proceed with a complaint. On May 7, 2021, the parties entered into a settlement agreement to resolve the lawsuit, and on October 29, 2021, the circuit court granted final settlement approval. We have reserved the full amount of our obligations under the settlement agreement.During 2017, four putative class actiondraft complaints were filed against Holdings or one of its subsidiaries. Complaints were filed on August 11, 2017, in the Circuit Court of Lake County, Illinois; on September 1, 2017, in the United States District Court for the Northern District of Georgia; on September 11, 2017, in the Superior Court of Los Angeles County, California; and on November 30, 2017, in the Superior Court of Ocean County, New Jersey. The complaints allege that we, in violation of federal law, printed more than the last five digits of a credit or debit card number on customers’ receipts and/or the expiration dates of those cards. A willful violation may subject a company to liability for actual damages or statutory damages between $100 and $1,000 per person, punitive damages in an amount determined by a court and reasonable attorneys’ fees, all of which are sought by the plaintiffs. The complaints do not allege that any information was misused. On October 20, 2020, the parties entered into a settlement agreement to resolve the lawsuits, for an immaterial amount, and final approval was granted by the circuit court on June 18, 2021. All four lawsuits were dismissed in the second and third quarters of 2021.
demanding additional supplemental disclosures.
Putative Securities Class Action Lawsuit
In February 2020, two putative securities class action complaints were filed against Holdings and certain of its former executive officers (collectively, the “defendants”) in the U.S. District Court for the Northern District of Texas. On March 2, 2020, the two cases were consolidated in an action captioned Electrical Workers Pension Fund Local 103 I.B.E.W. v. Six Flags Entertainment Corp., et al., Case No. 4:20-cv-00201-P (N.D. Tex.) (the “Electrical Workers litigation”), and an amended complaint was filed on March 20, 2020. On May 8, 2020, Oklahoma Firefighters Pension and Retirement System and Electrical Workers Pension Fund Local 103 I.B.E.W. were appointed as lead plaintiffs, Bernstein Litowitz Berger & Grossman LLP was appointed as lead counsel, and McKool Smith PC was appointed as
liaison counsel. On July 2, 2020, lead plaintiffs filed a consolidated complaint. The consolidated complaint alleges, among other things, that the defendants made materially false or misleading statements or omissions regarding the Company’s business, operations and growth prospects, specifically with respect to the development of its Six Flags branded parks in China and the financial health of its former partner, Riverside Investment Group Co. Ltd., in violation of the federal securities laws. The consolidated complaint seeks an unspecified amount of compensatory damages and other relief on behalf of a putative class of purchasers of Holdings’ publicly traded common stock during the period between April 24, 2018 and February 19, 2020. On August 3, 2020, defendants filed a motion to dismiss the consolidated complaint. On March 3, 2021, the district court granted defendants’ motion, dismissing the complaint in its entirety and with prejudice.
On August 25, 2021, plaintiffsCo-Lead Plaintiff Oklahoma Firefighters filed a notice of appeal to the U.S. Court of Appeals for the Fifth Circuit (“the Fifth Circuit”) from the district court’s decisions granting defendants’ motion to dismiss, denying plaintiffs’ motion to amend or set aside judgment, and denying plaintiffs’ motion for leave to file a supplemental brief. Plaintiffs’ appeal is captioned Oklahoma Firefighters Pension & Ret. Sys. v. Six Flags Ent. Corp., et al., No. 21-10865 (5th Cir.). The appeal was fully briefed as of December 15, 2021, and oral argument was held on March 7, 2022. On January 18, 2023, the Fifth Circuit reversed the dismissal and remanded the case to the district court for further proceedings. On February 9, 2023, the Fifth Circuit mandate issued to the district court.
On March 7, 2023, the district court entered a scheduling order governing pre-trial proceedings. On April 18, 2023, Oklahoma Firefighters filed a motion for leave to file an amended complaint that would add a new named plaintiff, remove former Co-Lead Plaintiff Electrical Workers Pension Fund Local
We 103 I.B.E.W., and modify the case caption. On May 2, 2023, defendants filed an opposition to that motion and a motion for judgment on the pleadings. On June 2, 2023, the district court granted defendants’ motion for judgment on the pleadings, dismissing the case with prejudice, and denied Oklahoma Firefighters’ motions. On June 30, 2023, plaintiffs filed a notice of appeal to the Fifth Circuit from the district court’s decisions. The appeal was fully briefed as of December 4, 2023. Oral argument is scheduled for March 4, 2024.We believe this lawsuit is without merit; however, there can be no assurance regarding the ultimate outcome. Regardless of the merit of plaintiffs’ claims, litigation may be expensive, time-consuming, disruptive to the Company’s operations and distracting to management. The outcome of this litigation is inherently uncertain, and we cannot reasonably estimate any loss or range of loss that may arise from this matter.
Stockholder Derivative Lawsuits
On March 20, 2020, a putative stockholder derivative lawsuit was filed on behalf of nominal defendant Holdings in the U.S. District Court for the Northern District of Texas against certain of its then-current and former executive officers and directors (the “individual defendants”) in an action captioned Schwartz v. Reid-Anderson, et al., Case No. 4:20-cv-00262-P (N.D. Tex.). In April 2020, two additional stockholder derivative lawsuits, making substantially identical allegations as the Schwartz complaint, were filed by Trustees of the St. Clair County Employees’ Retirement System and Mr. Mehmet Ali Albayrak in the U.S. District Court for the Northern District of Texas in actions captioned Martin, et al. v. Reid-Anderson, et al., Case No. 4:20-cv-00311-P (N.D. Tex.) and Albayrak v. Reid-Anderson, et al., Case No. 4:20-cv-00312-P (N.D. Tex.), respectively. On April 8, 2020, plaintiffs in all three of these putative derivative actions moved to consolidate the actions and appoint lead counsel. On May 8, 2020, the district court granted the plaintiffs’ motion to consolidate. The consolidated action is captioned In re Six Flags Entertainment Corp. Derivative Litigation, Case No. 4:20-cv-00262-P (N.D. Tex.). On August 10, 2020, plaintiffs filed a consolidated derivative complaint. The consolidated derivative complaint alleges breach of fiduciary duty, insider selling, waste of corporate assets, unjust enrichment, and contribution for violations of federal securities laws. The consolidated derivative complaint references, and makes many of the same allegations as are set forth in, the Electrical Workers litigation, alleging, among other things, that the individual defendants breached their fiduciary duties, committed waste, are liable for contribution for, or were unjustly enriched by making, failing to correct, or failing to implement adequate internal controls relating to alleged materially false or misleading statements or omissions regarding the Company’s business, operations and growth prospects, specifically with respect to the prospects of the development of Six Flags branded parks in China and the financial health of its former partner, Riverside Investment Group Co. Ltd. The consolidated derivative complaint also alleges that a former officer and director sold shares of the Company while allegedly in possession of material non-public information concerning the same. On
September 9, 2020, Holdings and the individual defendants filed a motion to dismiss the consolidated complaint. On April 28, 2021, the district court granted defendants’ motion, dismissing the consolidated complaint in its entirety and with prejudice and denying leave to amend. Plaintiffs’ time to appeal the judgment dismissing this action in its entirety and with prejudice and denying leave to amend lapsed in May 2021.
On May 5, 2020, a putative stockholder derivative lawsuit was filed on behalf of nominal defendant Holdings, by Richard Francisco in Texas state court against certain of its then-current and former executive officers and directors (the “individual defendants”) in an action captioned Francisco v. Reid-Anderson, et al., Case No. DC-20-06425 (160th Dist. Ct., Dallas Cty., Tex.) (the “Francisco action”). The petition in the Francisco action alleges breach of fiduciary duty,
unjust enrichment, abuse of control, gross mismanagement, and waste of corporate assets. The petition in the Francisco action references, and makes many of the same allegations, as are set forth in the Electrical Workers litigation, alleging, among other things, that the individual defendants breached their fiduciary duties, were unjustly enriched by, abused their control, committed gross mismanagement, and committed waste by making, failing to correct, or failing to implement adequate internal controls relating to alleged materially false or misleading statements or omissions regarding the Company’s business, operations and growth prospects, specifically with respect to the prospects of the development of Six Flags branded parks in China and the financial health of its former partner, Riverside Investment Group Co. Ltd. The petition also alleges that a former officer and director engaged in insider trading. On May 28, 2020, the parties in the Francisco action filed a joint motion to stay proceedings through the resolution of the forthcoming motion to dismiss the Electrical Workers litigation. On June 3, 2020, the district court granted the joint motion to stay proceedings. On June 12, 2020, an additional stockholder derivative lawsuit, making substantially identical allegations as the Francisco petition, was filed on behalf of nominal defendant Holdings in Texas state court by putative stockholder Cliff Bragdon in an action captioned Bragdon v. Reid-Anderson, et al., Case No. DC-20-08180 (298th Dist. Ct., Dallas Cty., Tex.) (the “Bragdon action”). On July 10, 2020, the district court granted an agreed motion filed by the parties in the Francisco and Bragdon actions to consolidate cases, to accept service and an unopposed motion to appoint co-lead and liaison counsel, and to stay both the Francisco and Bragdon actions through final resolution of the motion to dismiss the Electrical Workers litigation. The consolidated state derivative action was captioned In re Six Flags Entertainment Corp. Derivative Litigation, Case No. DC-20-06425 (160th Dist. Ct., Dallas Cty., Tex.). On September 8, 2020, the parties to the consolidated state derivative action filed an agreed motion to transfer the case from Dallas County to Tarrant County, which motion was so ordered on September 27, 2020. The consolidated action is now captioned In re Six Flags Ent. Corp. Derivative Litigation, No. 096-320958-20 (96th Dist. Ct., Tarrant Cty., Tex.). On February 9, 2023, the stay was lifted in the consolidated action when the Fifth Circuit issued the mandate in the Electrical Workers litigation. On April 27, 2023 and May 30, 2023, the parties informed the court that they were conferring, that they would provide a further update within 30 days, and that, in the meantime, the defendants had no obligation to respond to the Francisco or Bragdon complaints or the consolidated action. On June 29, 2023, plaintiffs filed a notice of non-suit without prejudice.
On February 16, 2023, a putative stockholder derivative lawsuit was filed on behalf of nominal defendant Holdings by John Hancock in Texas state court against certain of its former executive officers and directors (the “individual defendants”) in an action captioned Hancock v. Roedel, et al., Case No. 348-340304-23 (348th Dist. Ct., Tarrant Cty., Tex.). Plaintiff refers to and makes many of the same allegations as are set forth in the Electrical Workers litigation, claiming that, among other things, the individual defendants caused Six Flags to make false and misleading statements and omissions about the status of construction of Six Flags branded parks in China and the financial health of its former partner, Riverside Investment Group Co. Ltd. Plaintiff asserts breach of fiduciary duty and unjust enrichment claims. Plaintiff seeks an unspecified amount of monetary damages and equitable relief including, but not limited to, disgorgement.
On May 5, 2023, the individual defendants and the Company agreed to accept service of the petition, and plaintiff agreed that the individual defendants and the Company had no obligation to respond to the petition and that defendant's answer dates are tolled until plaintiff files an amended petition. Plaintiff stated Plaintiff would file an amended petition by June 30, 2023. On August 25, 2023, Plaintiff filed an amended petition. On September 7, 2023, the individual defendants and the Company filed a motion to stay pending resolution of a duplicative federal derivative action, captioned Dela Cruz v. Reid-Anderson, et al, Case No. 3:23-CV-0396-D (N.D. Tex), and described below. On September 15, 2023, the court granted the motion to stay and ordered the action stayed until 30 days after a ruling by the federal court on the motions to dismiss pending in Dela Cruz v. Reid-Anderson.
On February 22, 2023, a putative stockholder derivative lawsuit was filed on behalf of nominal defendant Holdings by Antonio Dela Cruz in in the U.S. District Court for the Northern District of Texas against certain of its current and former executive officers and directors (the “individual defendants”) in an action captioned Cruz v. Reid-Anderson, et al., Case No. 3:23-CV-0396-D (N.D. Tex.). Plaintiff refers to and makes many of the same allegations as are set forth in the Electrical Workers litigation, claiming that, among other things, the individual defendants caused Six Flags to make false and misleading statements and omissions about the status of construction of Six Flags branded parks in China and the financial health of its former partner, Riverside Investment Group Co. Ltd. Plaintiff asserts contribution, breach of fiduciary duty, and unjust enrichment claims. Plaintiff seeks an unspecified amount of monetary damages and equitable relief including, but not limited to, disgorgement.
On September 12, 2023, Six Flags and the individual defendants filed motions to dismiss the amended complaint. On January 12, 2024, the district court granted defendants' motions, dismissing the complaint in its entirety and with prejudice. On February 7, 2024, Plaintiffs filed a Notice of Appeal of the district court's decision.
Wage and Hour Class Action Lawsuits
Holdings and/or certain of its consolidated subsidiaries are named defendants in various lawsuits generally alleging violations of federal and/or state laws regulating wage and hour pay. Plaintiffs in these lawsuits seek monetary damages, including unpaid wages, statutory penalties, and/or attorneys’ fees and costs. Regardless of the merits of particular suits, litigation may be expensive, time-consuming, disruptive to the Company’s operations and distract management from the operation of our business. In recognition of these impacts on the business, the Company may enter into settlement agreements or other arrangements to settle litigation and resolve such disputes. No assurance can be given that such agreements can be obtained on acceptable terms or at all, or that litigation will not occur. These agreements may also significantly increase the Company’s operating expenses. The outcomes of these lawsuits are inherently uncertain, and we cannot reasonably estimate any loss or range of loss that may arise from these matters in excess of the amounts that we have recognized for these lawsuits, which amounts are not material to our consolidated financial statements.
COVID-19 Park Closure Lawsuits
Since COVID-19 began affecting the operations of our parks in mid-March 2020, three similar purported class action complaints were filed against Holdings or one of its subsidiaries in the U.S. District Court for the Central District of California on April 10, 2020, April 13, 2020, and April 21, 2020. These complaints allege that we, in violation of California law, charged members and season passholders while the parks were closed and did not provide refunds for the amounts charged. The complaints seek compensatory damages, punitive damages, restitution, and unspecified injunctive relief. On April 22, 2021, the parties entered into a settlement agreement to resolve the lawsuits, and on January 5, 2022, the court granted final settlement approval. We have reserved the full amount of our obligations under the settlement agreement.
Personal Injury Lawsuit
On November 18, 2021, the Texas Judicial Panel on Multidistrict Litigation consolidated numerous lawsuits filed against Six Flags Splashtown, LLC d/b/a Six Flags Hurricane Harbor Splashtown asserting claims arising from an alleged chemical vapor release on July 17, 2021 at Six Flags Splashtown. Certain plaintiffs have also named unaffiliated third parties as additional defendants. The consolidated multidistrict litigation is captioned In re Six Flags Splashtown Litigation (Master File No. 2021-77214), and is pending in the 295th Judicial District Court in Harris County, Texas. Plaintiffs are seeking compensatory and punitive damages. The court will conduct the firstOn April 14, 2023, Six Flags Splashtown settled with 421 plaintiffs, including all bellwether plaintiffs set for trial on April 17, 2023. Discovery is ongoing, as2023, for an immaterial amount. On September 22, 2023, the Park settled with 55 additional plaintiffs, including the bellwether plaintiffs set for trial on January 15, 2024, for an immaterial amount. These settlements resolved claims brought by these plaintiffs only and do not resolve all claims arising from the alleged chemical vapor release. There are 19 remaining plaintiffs represented by different firms. All pro se plaintiffs have been dismissed. The parties prepare for trial. Additionally, ahead of trial, there are multiple motions pending, including motions for summary judgment on multiple causes of action. We have defended this litigation vigorouslyworking to document these settlements and the Court has appointed special masters to determine the amounts each settling plaintiff will continue to do so.receive. Regardless of the merit of particular claims, litigation may be expensive, time-consuming, disruptive to the Company’sCompany's operations and distracting to management. In recognition of these considerations, the Company may enter into further settlement agreements or other arrangements to settle litigation and resolve such disputes.disputes and particularly the 19 remaining plaintiffs. No assurance can be given that such agreements can be obtained on acceptable terms or that litigation will not occur. These agreements may also significantly increase the Company’sCompany's operating expenses. The outcome of this litigation is inherently uncertain, and we cannot reasonably estimate any loss or range of loss that may arise from thesethe remaining matters in excess of the amount of that we have recorded for this litigation, which amount is not material to our consolidated financial statements.
Litigation Relating to Routine Proceedings
We are also engaged from time to time in other routine legal and tax proceedings incidental to our business. We do not believe that any of these routine proceedings will have a material impact on the business or our financial condition.
Securities and Exchange Commission Investigation
The Securities and Exchange Commission is conducting an investigation into the Company’s disclosures and reporting made in 2018 through February 2020related to its business, operations and growth prospects of its Six Flags branded parks in China and the financial health of its former business partner, Riverside Investment Group Co. Ltd. The Company received a document subpoena in February 2020 and subsequently certain current and former executives received subpoenas in connection with this matter and they continue to provide responsive information. The Company is fully cooperating and is committed to continuing to cooperate fully with the SEC in this matter. We cannot predict the length, scope or results of the investigation, or the impact, of the investigation on our results of operations, business or financial condition.
Tax and other contingencies
As of December 31, 2023, and January 1, 2023, and January 2, 2022, we had a nominal amount of accrued liabilities for tax and other indemnification contingencies related to certain parks sold in previous years that could be recognized as recovery losses from discontinued operations in the future if such liabilities are not requested to be paid.
We have operating leases for amusement parks, land, vehicles, machinery and certain equipment. Our leases have remaining lease terms of less than one year to 4342 years, some of which include an option to extend the underlying leases for up to 20 years, and some of which include an option to terminate the underlying lease within one year. For our noncancelable operating leases with such
options to extend, because we may determine it is not reasonably certain we will exercise the option, the options are not considered in determining the lease term, and associated potential option payments are excluded from lease payments. Our leases generally do not include restrictive financial or other covenants. Payments due under the lease contracts include fixed payments and, for certain of our leases, variable payments.
The components of lease cost for the
yearyears ended
December 31, 2023, January 1, 2023 and January 2, 2022 are as follows:
| | | | | | |
| | Year Ended |
(Amounts in thousands) | | January 1, 2023 | | January 2, 2022 |
Finance Lease Expense | | | | | | |
Amortization of ROU assets | | $ | 980 | | $ | 900 |
Interest on lease liabilities | | | 90 | | | 106 |
Operating lease cost | | | 23,896 | | | 24,152 |
Short-term lease cost | | | 6,038 | | | 3,904 |
Variable lease cost | | | 5,363 | | | 6,744 |
Total lease cost | | $ | 36,367 | | $ | 35,806 |
| | | | | | | | | | | | | | | | | |
| Year Ended |
| (Amounts in thousands) | December 31, 2023 | | January 1, 2023 | | January 2, 2022 |
| Finance Lease Expense | | | | | |
| Amortization of ROU assets | $ | 968 | | | $ | 980 | | | $ | 900 | |
| Interest on lease liabilities | 52 | | | 90 | | | 106 | |
| Operating lease cost | 23,423 | | | 23,896 | | | 24,152 | |
| Short-term lease cost | 9,163 | | | 6,038 | | | 3,904 | |
| Variable lease cost | 2,716 | | | 5,363 | | | 6,744 | |
| Total lease cost | $ | 36,322 | | | $ | 36,367 | | | $ | 35,806 | |
Lease costs for the years ended
December 31, 2023, January 1, 2023
and January 2, 2022
and December 31, 2020 included minimum rental payments under operating leases recognized on a straight-line basis over the term of the lease.
Other information related to leases for the years ended
December 31, 2023, January 1, 2023 and January 2, 2022 is as follows:
| | | | | | | | |
| | Year Ended | |
(Amounts in thousands, except for lease term and discount rate) | | January 1, 2023 | | | January 2, 2022 | |
Cash paid for amounts included in the measurement of lease liabilities | | | | | | | | |
Operating cash flows for operating leases | | $ | 22,578 | | | $ | 26,936 | |
Financing cash flows for finance leases | | | 926 | | | | 641 | |
Operating cash flows from finance leases | | | 90 | | | | 106 | |
Operating Leases | | | | | | | | |
ROU assets obtained in exchange for lease liabilities | | | 268 | | | | 384 | |
Finance Leases | | | | | | | | |
ROU assets obtained in exchange for lease liabilities | | | — | | | | 1,702 | |
| | | | | | | | | | | | | | | | | |
| Year Ended |
| (Amounts in thousands, except for lease term and discount rate) | December 31, 2023 | | January 1, 2023 | | January 2, 2022 |
| Cash paid for amounts included in the measurement of lease liabilities | | | | | |
| Operating cash flows for operating leases | $ | 22,104 | | | $ | 22,578 | | | $ | 26,936 | |
| Financing cash flows for finance leases | 999 | | | 926 | | | 641 | |
| Operating cash flows from finance leases | 52 | | | 90 | | | 106 | |
| Operating Leases | | | | | |
| ROU assets obtained in exchange for lease liabilities | 83 | | | 268 | | | 384 | |
| Finance Leases | | | | | |
| ROU assets obtained in exchange for lease liabilities | — | | | — | | | 1,702 | |
Additional information related to our operating leases for the year ended January 1,December 31, 2023 is as follows:
| | | | | |
Weighted average remaining lease term (in years) | 17.72
|
| 18.0
|
|
Weighted average discount rate | 6.87
| %
| 6.88
| %
|
Additional information related to our finance leases for the year ended January 1,December 31, 2023 is as follows:
| | | | | |
Weighted average remaining lease term (in years) | 1.04
|
| 2.0
|
|
Weighted average discount rate | 3.83
| %
| 3.84
| %
|
The following tables set forth supplemental balance sheet information related to operating and finance leases as of January 1,December 31, 2023 and January 2, 2022:
| | | | | | |
| | Year Ended |
(Amounts in thousands) | | January 1, 2023 | | January 2, 2022 |
Operating Leases | | | | | | |
Right of use assets, net | | $ | 158,838 | | $ | 186,754 |
| | | | | | |
Short-term lease liabilities | | | 10,689 | | | 10,181 |
Long-term lease liabilities | | | 163,892 | | | 176,180 |
Total operating lease obligation | | $ | 174,581 | | $ | 186,361 |
| | | | | | |
Finance Leases | | | | | | |
Property and equipment, at cost | | $ | 3,920 | | $ | 4,131 |
Accumulated depreciation | | | (2,074) | | | (1,148) |
Total property and equipment, net | | $ | 1,846 | | $ | 2,983 |
| | | | | | |
Short-term lease liabilities | | $ | 999 | | $ | 977 |
Long-term lease liabilities | | | 912 | | | 2,020 |
Total finance lease obligation | | $ | 1,911 | | $ | 2,997 |
Maturities1, 2023:
| | | | | | | | | | | |
| Year Ended |
| (Amounts in thousands) | December 31, 2023 | | January 1, 2023 |
| Operating Leases | | | |
| Right of use assets, net | $ | 134,857 | | | $ | 158,838 | |
| | | |
| Short-term lease liabilities | 9,733 | | | 10,689 | |
| Long-term lease liabilities | 155,204 | | | 163,892 | |
| Total operating lease obligation | $ | 164,937 | | | $ | 174,581 | |
| | | |
| Finance Leases | | | |
| Property and equipment, at cost | $ | 3,846 | | | $ | 3,920 | |
| Accumulated depreciation | (2,996) | | | (2,074) | |
| Total property and equipment, net | $ | 850 | | | $ | 1,846 | |
| | | |
| Short-term lease liabilities | $ | 781 | | | $ | 999 | |
| Long-term lease liabilities | 131 | | | 912 | |
| Total finance lease obligation | $ | 912 | | | $ | 1,911 | |
During the year ended December 31, 2023, we recognized an impairment loss on the right-of-use asset of
noncancelable operating$13.2 million at our Frontier City theme park and
finance lease liabilities as of January 1, 2023, are summarized in the table below.
| | | | | | |
(Amounts in thousands) | | As of January 1, 2023 |
| | Finance Leases | | Operating Leases |
2024 | | $ | 1,052 | | $ | 22,086 |
2025 | | | 797 | | | 20,332 |
2026 | | | 132 | | | 18,233 |
2027 | | | — | | | 17,791 |
2028 | | | — | | | 17,751 |
Thereafter | | | — | | | 224,009 |
Total | | $ | 1,981 | | $ | 320,202 |
Less: present value discount | | | (70) | | | (145,621) |
Lease liability | | $ | 1,911 | | $ | 174,581 |
Hurricane Harbor Oklahoma City water park. During the year ended January 1, 2023, we recognized an impairment loss on the right-of-use asset of $15.1 million at our Hurricane Harbor Splashtown water park in Houston, water park.
Texas. 97
Maturities of non-cancelable operating and finance lease liabilities as of December 31, 2023, are summarized in the table below. | | | | | | | | | | | |
| (Amounts in thousands) | As of December 31, 2023 |
| Finance Leases | | Operating Leases |
| 2024 | $ | 797 | | | $ | 20,275 | |
| 2025 | 132 | | | 18,231 | |
| 2026 | — | | | 17,802 | |
| 2027 | — | | | 17,751 | |
| 2028 | — | | | 17,740 | |
| Thereafter | — | | | 206,269 | |
| Total | $ | 929 | | | $ | 298,068 | |
| Less: present value discount | (17) | | | (133,131) | |
| Lease liability | $ | 912 | | | $ | 164,937 | |
Our chief operating decision maker “CODM” regularly receives consolidated information which is used to make strategy decisions. Each individual park location, has a Park President or General Manager responsible for the operational results and executing the strategy set forth by the CODM. Substantially all of our parks provide similar products and services through a similar process to the same class of customer through a consistent method. We also believe that the parks share common economic characteristics. Based on these factors, we have only one reportable segment - parks.
All of our owned or managed parks are located in the United States with the exception of two parks in Mexico and one park in Montreal, Canada. We also have revenue and expenses related to the development of Six Flags-branded parks outside of North America. The following information reflects our long-lived assets (which consists of property and equipment, goodwill, intangible assets
and right-of-use assets), revenues and income (loss) before income taxes by domestic and foreign jurisdictions as of or for the years ended December 31, 2023, January 1, 2023 and January 2, 2022:
| | | | | | | | | | | | | | | | | |
| Domestic | | Foreign | | Total |
| As of or for the year ended December 31, 2023 | | | | | |
| Long-lived assets | $ | 2,297,440 | | | $ | 126,409 | | | $ | 2,423,849 | |
| Revenues | 1,266,214 | | | 159,689 | | | 1,425,903 | |
| Income before income taxes | 69,882 | | | 38,908 | | | 108,790 | |
| As of or for the year ended January 1, 2023 | | | | | |
| Long-lived assets | $ | 2,290,318 | | | $ | 114,048 | | | $ | 2,404,366 | |
| Revenues | 1,235,356 | | | 122,879 | | | 1,358,236 | |
| Income before income taxes | 161,205 | | | 31,789 | | | 192,994 | |
| As of or for the year ended January 2, 2022 | | | | | |
| Long-lived assets | $ | 2,324,420 | | | $ | 117,066 | | | $ | 2,441,486 | |
| Revenues | 1,407,671 | | | 89,234 | | | 1,496,905 | |
| Income before income taxes | 217,189 | | | 2,028 | | | 219,217 | |
18. Revision to Previously Reported Financial Information
During the third quarter of 2023, we identified an accounting error for our stock-based compensation expense related to the recognition of expense for dividend equivalent rights ("DERs"). The error primarily relates to the inadvertent reversal of stock-based compensation expense for vested DERs for periods beginning in the first quarter of 2020 through the fourth quarter of 2022. We have assessed the error and concluded that it was not material to any prior periods. However, the aggregate amount of the error would have been material to our consolidated financial statements in the current period. Therefore, we have revised our previously issued financial information. Prior periods not presented herein will be revised, as applicable, in future filings.
The following table presents the impact of correcting the error previously discussed on the affected line items of our consolidated balance sheet as of January 2, 2022 and December 31, 2020: | | | | | | | | | |
| | Domestic | | Foreign | | Total |
As of or for the year ended January 1, 2023 | | | | | | | | | |
Long-lived assets | | $ | 2,290,318 | | $ | 114,048 | | $ | 2,404,366 |
Revenues | | | 1,235,356 | | | 122,879 | | | 1,358,236 |
Income before income taxes | | | 168,751 | | | 31,789 | | | 200,539 |
As of or for the year ended January 2, 2022 | | | | | | | | | |
Long-lived assets | | $ | 2,324,420 | | $ | 117,066 | | $ | 2,441,486 |
Revenues | | | 1,407,671 | | | 89,234 | | | 1,496,905 |
Income before income taxes | | | 219,283 | | | 2,028 | | | 221,311 |
As of or for the year ended December 31, 2020 | | | | | | | | | |
Long-lived assets | | $ | 2,317,009 | | $ | 134,805 | | $ | 2,451,814 |
Revenues | | | 334,713 | | | 21,862 | | | 356,575 |
Loss before income taxes | | | (487,594) | | | (35,465) | | | (523,059) |
.
| | | | | | | | | | | | | | | | | | | | |
| | As of January 2, 2022 |
| (Amounts in thousands) | | As Reported | | Adjustments | | As Revised |
| Capital in excess of par value | | $ | 1,120,084 | | | $ | 7,626 | | | $ | 1,127,710 | |
| Accumulated deficit | | (2,023,251) | | | (7,626) | | | (2,030,877) | |
| Total stockholders' deficit | | (982,200) | | | — | | | (982,200) | |
| Total liabilities and stockholders' deficit | | $ | 2,968,590 | | | $ | — | | | $ | 2,968,590 | |
The following table presents the impact of correcting the error previously discussed on the affected line items of our consolidated balance sheet as of January 1, 2023.
| | | | | | | | | | | | | | | | | | | | |
| | As of January 1, 2023 |
| (Amounts in thousands) | | As Reported | | Adjustments | | As Revised |
| Capital in excess of par value | | $ | 1,104,051 | | | $ | 15,171 | | | $ | 1,119,222 | |
| Accumulated deficit | | (1,985,500) | | | (15,171) | | | (2,000,671) | |
| Total stockholders' deficit | | (950,565) | | | — | | | (950,565) | |
| Total liabilities and stockholders' deficit | | $ | 2,665,825 | | | $ | — | | | $ | 2,665,825 | |
The following table presents the impact of correcting the error previously discussed on the affected line items of our consolidated statement of operations for the year ended January 2, 2022.
| | | | | | | | | | | | | | | | | | | | |
| | Year Ended January 2, 2022 |
| (Amounts in thousands) | | As Reported | | Adjustments | | As Revised |
Selling, general and administrative expenses (1) | | $ | 211,087 | | | $ | 2,094 | | | $ | 213,181 | |
| Income before income taxes | | 221,311 | | | (2,094) | | | 219,217 | |
| Net income | | 171,689 | | | (2,094) | | | 169,595 | |
| Net income attributable to Six Flags Entertainment Corporation | | 129,923 | | | (2,094) | | | 127,829 | |
| Earnings per average common share outstanding: | | | | | | |
| Basic | | $ | 1.52 | | | $ | (0.03) | | | $ | 1.49 | |
| Diluted | | $ | 1.50 | | | $ | (0.02) | | | $ | 1.48 | |
(1) Including stock-based compensation of $21,462 and $23,556 in the "As Reported" and "As Revised" figures, respectively. "As Reported" figure adjusted to reflect the reclassification of pension-related expense to other (income) expense, net in our condensed consolidated statements of operations as discussed in Note 1 - General - Basis of Presentation. The following table presents the impact of correcting the error previously discussed on the affected line items of our consolidated statement of operations for the year ended January 1, 2023.
| | | | | | | | | | | | | | | | | | | | |
| | Year Ended January 1, 2023 |
| (Amounts in thousands) | | As Reported | | Adjustments | | As Revised |
Selling, general and administrative expenses (1) | | $ | 161,858 | | | $ | 7,545 | | | $ | 169,403 | |
| Income before income taxes | | 200,539 | | | (7,545) | | | 192,994 | |
| Net income | | 153,579 | | | (7,545) | | | 146,034 | |
| Net income attributable to Six Flags Entertainment Corporation | | 108,928 | | | (7,545) | | | 101,383 | |
| Earnings per average common share outstanding: | | | | | | |
| Basic | | $ | 1.29 | | | $ | (0.09) | | | $ | 1.20 | |
| Diluted | | $ | 1.29 | | | $ | (0.09) | | | $ | 1.20 | |
(2) Including stock-based compensation of $7,673 and $15,218 in the "As Reported" and "As Revised" figures, respectively. "As Reported" figure adjusted to reflect the reclassification of pension-related expense to other (income) expense, net in our condensed consolidated statements of operations as discussed in Note 1 - General - Basis of PresentationITEM 9.
| CHANGES IN AND DISAGREEMENTS WITH ACCOUNTANTS ON ACCOUNTING AND FINANCIAL DISCLOSURE
|
. The consolidated statements of stockholders' deficit and the consolidated statements of comprehensive income for the years ended January 2, 2022 and January 1, 2023, have also been revised to reflect the impacts to net income. The consolidated statement of cash flows for the years ended January 2, 2022 and January 1, 2023 have been adjusted to reflect the impact to net income and stock-based compensation. The adjustments did not affect any subtotals within the statement of cash flows for any previous period.
The impacts of the revisions have been reflected throughout the financial statements, including the applicable footnotes, as appropriate.
ITEM 9. CHANGES IN AND DISAGREEMENTS WITH ACCOUNTANTS ON ACCOUNTING AND FINANCIAL DISCLOSURE
We have had no disagreements with our independent registered public accounting firm on any matter of accounting principles or practices or financial statement disclosure.
ITEM 9A.
| CONTROLS AND PROCEDURES
|
ITEM 9A. CONTROLS AND PROCEDURES
Conclusion Regarding the Effectiveness of Disclosure Controls and Procedures
Under the supervision and with the participation of our management, including our Chief Executive Officer and Chief Financial Officer, we conducted an evaluation, as of January 1,December 31, 2023, of the effectiveness of our disclosure controls and procedures, as such term is defined under Rule 13a-15(e) or 15(d)-15(e) promulgated under the Securities Exchange Act of 1934, as amended (the "Exchange
"Exchange Act"). Based on this evaluation, our Chief Executive Officer and our Chief Financial Officer concluded that, as of the end of such period, our disclosure controls and procedures are effective to ensure that information required to be disclosed by us in the reports that we file or submit under the Exchange Act is (i) recorded, processed, summarized and reported within the time periods specified in the SEC’s rules and forms and (ii) accumulated and communicated to our management, including our principal executive and principal financial officers, or persons performing similar functions, as appropriate, to allow timely decisions regarding required disclosure.
Management’s Report on Internal Control Over Financial Reporting
Management’s Report on Internal Control Over Financial Reporting included in Item 8 of this Annual Report is incorporated by reference herein.
Attestation Report of Registered Public Accounting Firm
KPMG LLP’s Attestation Report included in Item 8 of this Annual Report is incorporated by reference herein. Changes in Internal Control Over Financial Reporting During the Quarter Ended
January 1,December 31, 2023
There were no changes in our internal control over financial reporting, as such term is defined under Rule 13a-15(f) or 15(d)-15(f) promulgated under the Securities Exchange Act of 1934, as amended, that occurred during our fiscal quarter ended
January 1,December 31, 2023 other than certain internal controls related to the implementation of a new accounting and financial reporting system that have materially affected, or are reasonably likely to materially affect, our internal control over financial reporting.
ITEM 9B.OTHER INFORMATION
Not applicable
During the quarter ended December 31, 2023, none of our directors or officers (as defined in Section 16 of the Securities Act of 1933, adopted or terminated a "Rule 10b5-1 trading arrangement" or a "non-Rule 10b5-1 trading arrangement" (each as defined in Item 408(a) and (c) of Regulation S-K).
ITEM 9C.DISCLOSURE REGARDING FOREIGN JURISDICTIONS THAT PREVENT INSPECTIONS
ITEM 10.DIRECTORS, EXECUTIVE OFFICERS AND CORPORATE GOVERNANCE
The information required by this item regarding our executive officers is provided in "Item"Item 1. Business — Executive Officers and Certain Significant Employees"Employees" of this Annual Report. The information required by this item concerning our directors, our codes of ethics and other corporate governance information is incorporated by reference to the information set forth in the sections entitled "Proposal 1: Election of Directors" and "Corporate Governance" in our Proxy Statement for our 2023 annual meeting of stockholders towill be filed withby the SEC not later thanCompany within 120 days after the fiscal year ended January 1, 2023 (the "2023 Proxy Statement").December 31, 2023.
ITEM 11.EXECUTIVE COMPENSATION
The information required by this item is incorporated by reference
toand will be filed by the
information set forth inCompany within 120 days after the
sections entitled "2022 Non-Employee Director Compensation," "Executive Compensation," "Corporate Governance," “Compensation Committee Interlocks and Insider Participation,” and "Compensation Committee Report" in the 2023 Proxy Statement.ITEM 12.
| SECURITY OWNERSHIP OF CERTAIN BENEFICIAL OWNERS AND MANAGEMENT AND RELATED STOCKHOLDER MATTERS
|
fiscal year ended December 31, 2023.
ITEM 12. SECURITY OWNERSHIP OF CERTAIN BENEFICIAL OWNERS AND MANAGEMENT AND RELATED STOCKHOLDER MATTERS
The information required by this item concerning security ownership of certain beneficial owners and management is incorporated by reference
toand will be filed by the
information set forth inCompany within 120 days after the
section entitled "Security Ownership of Certain Beneficial Owners and Management" in the 2023 Proxy Statement.fiscal year ended December 31, 2023.
Equity Compensation Plan Information
The following table contains information as of January 1,December 31, 2023 regarding shares of common stock that may be issued under equity compensation plans approved by our stockholders (Employee Stock Purchase Plan and Long-Term Incentive Plan).
| | | | | | | | | | | | | | | | | | | | | | | |
| Plan Category | | (a)
Number of securities
to be
issued upon exercise
of outstanding options,
warrants and rights | | (b)
Weighted-average
exercise price of
outstanding
options, warrants
and rights | | (c)
Number of securities
remaining available
for future issuance
under equity
compensation plans | |
| Equity compensation plans approved by security holders | | 1,184,000 | (1) | $ | 56.23 | | (2) | 5,967,000 | (3) |
| Equity compensation plans not approved by security holders | | N/A | | N/A | | N/A | |
| Total | | 1,184,000 | | $ | 56.23 | | | 5,967,000 | |
| | | | | | | | |
| | (a) | | (b) | | (c) | |
| | Number of securities | | Weighted-average | | Number of securities | |
| | to be | | exercise price of | | remaining available | |
| | issued upon exercise | | outstanding | | for future issuance | |
| | of outstanding options, | | options, warrants | | under equity | |
Plan Category | | warrants and rights | | and rights | | compensation plans | |
Equity compensation plans approved by security holders | | 1,684,000 | (1) | $ | 55.52 | (2) | 7,121,000 | (3) |
Equity compensation plans not approved by security holders | | N/A | | | N/A | | N/A | |
Total | | 1,684,000 | | $ | 55.52 | | 7,121,000 | |
(1)Excludes restricted stock units outstanding under the Company’s Long-Term Incentive Plan and rights outstanding under the Company’s Employee Stock Purchase Plan. We are unable to ascertain with specificity the number of securities to be issued upon exercise of outstanding rights under the Company’s Employee Stock Purchase Plan.
(2)The determination of the weighted-average exercise price excludes outstanding rights under the Company’s Employee Stock Purchase Plan and restricted stock units under the Company’s Long-Term Incentive Plan.
(1) | Excludes restricted stock units outstanding under the Company’s Long-Term Incentive Plan and rights outstanding under the Company’s Employee Stock Purchase Plan. We are unable to ascertain with specificity the number of securities to be issued upon exercise of outstanding rights under the Company’s Employee Stock Purchase Plan. |
(2) | The determination of the weighted-average exercise price excludes outstanding rights under the Company’s Employee Stock Purchase Plan and restricted stock units under the Company’s Long-Term Incentive Plan. |
(3) | Consists of 1,487,000 shares reserved for issuance under the Company’s Employee Stock Purchase Plan and 5,634,000(3)Consists of 1,446,000 shares reserved for issuance under the Company’s Employee Stock Purchase Plan and 4,521,000 shares reserved for issuance under the Long-Term Incentive Plan. The Employee Stock Purchase Plan allows eligible employees to purchase shares at 90% of the lower of the fair market value on the first or last trading day of each six-month offering period. Shares available for issuance under the Long-Term Incentive Plan can be granted pursuant to stock options, stock appreciation rights, restricted stock or units, performance units, performance shares and any other stock-based award selected by the committee. |
Table of Contents
ITEM 13. CERTAIN RELATIONSHIPS AND RELATED TRANSACTIONS AND DIRECTOR INDEPENDENCEITEM 13.
| CERTAIN RELATIONSHIPS AND RELATED TRANSACTIONS AND DIRECTOR INDEPENDENCE
|
The information required by this item is incorporated by reference toand will be filed by the information set forth inCompany within 120 days after the sections entitled "Transactions with Related Persons" and "Corporate Governance —Independence" in the 2023 Proxy Statement.
ITEM 14.
| PRINCIPAL ACCOUNTING FEES AND SERVICES
|
fiscal year ended December 31, 2023.
ITEM 14. PRINCIPAL ACCOUNTING FEES AND SERVICES
The information required by this item is incorporated by reference
toand will be filed by the
information set forth inCompany within 120 days after the
section entitled "Audit, Audit-Related, and Tax Fees" in the 2023 Proxy Statement.
fiscal year ended December 31, 2023.
ITEM 15.EXHIBITS AND FINANCIAL STATEMENT SCHEDULES
(a)(1) and (2) Financial Statements and Financial Statement Schedules
The following consolidated financial statements of Six Flags Entertainment Corporation and its subsidiaries, the notes thereto, the related report thereon of the independent registered public accounting firm, and financial statement schedules are filed under Item 8 of this Annual Report:
Certain schedules for which provision is made in the applicable accounting regulations of the SEC have been omitted because they either are not required under the related instructions, are inapplicable, or the required information is shown in the financial statements or notes thereto.
(a)(3) Exhibits
|
Exhibit
Number | | Exhibit Description |
| 2.1 | + | | |
Exhibit
Number
3.1 | |
|
3.13.2
| |
| Restated Certificate of Incorporation of Six Flags Entertainment Corporation, as amended—incorporated by reference to Exhibit 3.1 to Registrant’s Current Report on Form 8-K (File No. 001-13703) filed on May 6, 2021. |
3.23.3
| |
| Amended and Restated Bylaws of Six Flags Entertainment Corporation—incorporated by reference to Exhibit 3.1 to Registrant’s Current Report on Form 8-K (File No. 001-13703) filed on February 7, 2018. |
3.33.4
| |
| Certificate of Elimination of Series B Junior Preferred Stock of Six Flags Entertainment Corporation, as filed with the Secretary of State of the State of Delaware on April 1, 2021—incorporated by reference to Exhibit 3.1 to Registrant’s Registration Statement on Form 8-A/A (File No. 001-13703) filed on April 1, 2021 |
4.1 | |
| Registration Rights Agreement, dated as of April 30, 2010, between Six Flags Entertainment Corporation and certain holders of Common Stock—incorporated by reference to Exhibit 4.1 to Registrant’s Current Report on Form 8-K (File No. 001-13703) filed on May 3, 2010. |
4.2 | |
| Indenture, dated as of June 16, 2016, among Six Flags Entertainment Corporation, the guarantors party thereto and U.S. Bank National Association, as trustee—incorporated by reference to Exhibit 4.1 to Registrant’s Current Report on Form 8-K (File No. 001-13703) filed on June 17, 2016. |
4.3 | |
| Form of 4.875% Senior Notes due 2024—incorporated by reference to Exhibit A to Exhibit 4.1 to Registrant’s Current Report on Form 8-K (File No. 001-13703) filed on June 17, 2016. |
4.4 | |
| Indenture, dated as of April 13, 2017, by and among Six Flags Entertainment Corporation, each of the guarantors party thereto and U.S. Bank National Association as trustee—incorporated by reference to Exhibit A to Exhibit 4.3 to Registrant’s Current Report on Form 8-K (File No. 001-13703) filed on April 13, 2017. |
4.5 | |
| Form of 5.500% Senior Notes due 2027—incorporated by reference to Exhibit A to Exhibit 4.3 to Registrant’s Current Report on Form 8-K (File No. 001-13703) filed on April 13, 2017. |
102
| | | | | | | | |
| 4.6 | |
| Rights Agreement, dated March 31, 2020, by and between Six Flags Entertainment Corporation and Computershare Trust Company, N.A.—incorporated by reference to Exhibit 4.1 to Registrant's Current Report on Form 8-K (File No. 001-13703) filed on March 31, 2020
|
4.7
|
| Indenture, dated as of April 22, 2020, by and among Six Flags Theme Parks Inc., the Guarantors party thereto and U.S. Bank National Association as trustee and as collateral agent—incorporated by reference to Exhibit 4.1 to Registrant’s Current Report on Form 8-K (File No. 001-13703) filed on April 23, 2020. |
4.84.7
| |
| Form of 7.000% Senior Secured Notes due 2025—incorporated by reference to Exhibit A to Exhibit 4.1 to Registrant’s Current Report on Form 8-K (File No. 001-13703) filed on April 23, 2020. |
4.94.8
| * | |
4.9 | | |
| 4.10 | | |
10.1P | | Overall Agreement, dated February 15, 1997 by and among Six Flags Fund, Ltd. (L.P.), the Salkin Family Trust, SFG, Inc., SFG-I, LLC, SFG-II, LLC, Six Flags Over Georgia, Ltd., SFOGII, Inc., SFOG Acquisition A, Inc., SFOG Acquisition B, LLC, Six Flags Over Georgia, Inc., Six Flags Theme Parks, Inc. and Six Flags Entertainment Corporation (incorporated by reference to Registrant's Annual Report on Form 10-K filed on March 23, 1998. |
10.2P | |
Subordinated Indemnity Agreement, dated February 9, 1998 among Registrant, the subsidiaries of Registrant named therein, Time Warner, Inc., the subsidiaries of Time Warner Inc. named therein, Six Flags Entertainment Corporation and the subsidiaries of Six Flags Entertainment Corporation named therein—incorporatedtherein--incorporated by reference from Exhibit 2(b) to Registrant’sRegistrant's Registration Statement on Form S-3 (No. 333-45859) declared effective on March 26, 1998. |
10.210.3
| |
| Amendment No. 1 Subordinated Indemnity Agreement, dated November 5, 1999, among Registrant, the subsidiaries of Registrant named therein, Time Warner Inc., the subsidiaries of Time Warner Inc. named therein, Six Flags Entertainment Corporation, and the subsidiaries of Six Flags Entertainment Corporation named therein—incorporated by reference from Exhibit 10 (bb) to Registrant’s Form 10-K for the year ended December 31, 2003. |
10.310.4
| |
| Amendment No. 2 Subordinated Indemnity Agreement, dated June 12, 2004, among Registrant, the subsidiaries of Registrant named therein, Time Warner Inc., the subsidiaries of Time Warner Inc. named therein, Six Flags Entertainment Corporation, and the subsidiaries of Six Flags Entertainment Corporation named therein—incorporated by reference from Exhibit 10 (cc) to Registrant’s Form 10-K for the year ended December 31, 2003. |
10.410.5
| |
| Amendment No. 3 to Subordinated Indemnity Agreement, dated as of April 13, 2004, among Six Flags Operations Inc., Six Flags Theme Parks Inc., SFOG II, Inc., SFT Holdings, Inc., Time Warner Inc., Time Warner Entertainment Company, L.P., TW-SPV Co., Six Flags, Inc. and GP Holdings Inc.—incorporated by reference to Exhibit 10.4 to Registrant’s Form 10-Q (File No. 001-13703) for the quarter ended June 30, 2009. |
10.510.6
| |
| Amendment No. 4 to Subordinated Indemnity Agreement, dated as of December 8, 2006, among Six Flags Operations Inc., Six Flags Theme Parks Inc., SFOG II, Inc., SFT Holdings, Inc., Time Warner Inc., Time Warner Entertainment Company, L.P., TW-SPV Co., Six Flags, Inc. and GP Holdings Inc.—incorporated by reference to Exhibit 10.5 to Registrant’s Form 10-Q (File No. 001-13703) for the quarter ended June 30, 2009. |
10.610.7
| |
| Amendment No. 5 to Subordinated Indemnity Agreement, dated as of April 2, 2007, among Six Flags Operations Inc., Six Flags Theme Parks Inc., SFOG II, Inc., SFT Holdings, Inc., Time Warner Inc., Warner Bros. Entertainment Inc., TW-SPV Co., Six Flags, Inc. and GP Holdings Inc.—incorporated by reference to Exhibit 10.6 to Registrant’s Form 10-Q (File No. 001-13703) for the quarter ended June 30, 2009. |
10.710.8
| |
| Amendment No. 6 to Subordinated Indemnity Agreement, dated as of May 15, 2009, among Six Flags Operations Inc., Six Flags Theme Parks Inc., SFOG II, Inc., SFT Holdings, Inc., Historic TW Inc., Time Warner Entertainment Company, L.P., TW-SPV Co., Six Flags, Inc. and GP Holdings Inc.—incorporated by reference to Exhibit 10.7 to Registrant’s Form 10-Q (File No. 001-13703) for the quarter ended June 30, 2009. |
10.810.9
| |
| Amendment No. 7 to Subordinated Indemnity Agreement, dated as of April 30, 2010, among Six Flags Operations Inc., Six Flags Theme Parks Inc., SFOG II, Inc., SFT Holdings, Inc., Historic TW Inc., Warner Bros. Entertainment Inc., TW-SPV Co., Six Flags Entertainment Corporation, the other subsidiaries of Six Flags Entertainment Corporation and GP Holdings Inc.—incorporated by reference from Exhibit 10.7 to Registrant’s Form 10-Q (File No. 001-13703) for the quarter ended March 31, 2010. |
10.910.10
| † | |
10.1010.11
| † | |
103
| | | | | | | | |
10.1110.12 | † | |
10.1210.13
| † | |
10.1310.14
| † | |
10.14
| †
| Transition and Retirement Agreement, dated as of November 15, 2019, by and between Lance Balk and Six Flags Entertainment Corporation—incorporated by reference to Exhibit 10.1 to Registrant’s Current Report on Form 8-K (File No. 001-13703) filed on November 15, 2019.
|
10.15 | † | |
10.16 | † | |
10.17 | † | |
10.18 | † | |
10.19 | † | |
10.20 | † | |
10.21 | |
| Third Amendment and Limited Waiver to Amended and Restated Credit Agreement, dated as of June 21, 2017, among Six Flags Entertainment Corporation, Six Flags Operations Inc., Six Flags Theme Parks Inc., the Subsidiary Guarantors (as defined therein) from time to time party thereto, the Lenders (as defined therein) from time to time party thereto and Wells Fargo Bank, National Association, as administrative agent-incorporated by reference to Exhibit 10.1 to Registrant’s Current Report on Form 8-K (File No. 001-13703) filed on June 21, 2017. |
10.22 | |
| $1,150,000,000 Second Amended and Restated Credit Agreement, dated as of April 17, 2019, among the Company, SFO and SFTP and several lenders, Wells Fargo Bank, National Association, as administrative agent, an issuing lender and a swingline lender, Wells Fargo Securities, LLC and Merrill Lynch, Pierce, Fenner & Smith Incorporated, as joint lead arrangers, Barclays Bank PLC, JPMorgan Chase Bank, N.A., Compass Bank, HSBC Bank USA, National Association and PNC Bank, National Association, as co-documentation agents, Bank of America, N.A. and Goldman Sachs Bank USA, as co-syndication agents, and Wells Fargo Securities, LLC, Barclays Bank PLC, Goldman Sachs Bank USA, JPMorgan Securities LLC, Merrill Lynch, Pierce, Fenner & Smith Incorporated and HSBC Bank USA, National Association, as joint bookrunners—incorporated by reference to Exhibit 10.1 to Registrant’s Current Report on Form 8-K (File No. 001-13703) filed on April 17, 2019. |
10.23 | |
| Second Amended and Restated Guarantee and Collateral Agreement, dated as of April 17, 2019, among the Company, SFO and SFTP, the other grantors party thereto, and Wells Fargo Bank, National Association, as administrative agent—incorporated by reference to Exhibit 10.2 to Registrant’s Current Report on Form 8-K (File No. 001-13703) filed on April 17, 2019. |
10.24 | |
| First Incremental Amendment to Second Amended and Restated Credit Agreement, dated as of April 8, 2020, among Six Flags Entertainment Corporation, Six Flags Operations Inc., Six Flags Theme Parks Inc., the other subsidiary guarantors party thereto, Wells Fargo Bank, National Association, as administrative agent, and the revolving credit lenders party thereto─incorporated by reference to Exhibit 10.1 to Registrant’s Current Report on Form 8-K (File No. 001-13703) filed on April 8, 2020. |
10.25 | |
| Replacement Revolving Facility Amendment to Second Amended and Restated Credit Agreement, dated as of April 8, 2020, among Six Flags Entertainment Corporation, Six Flags Operations Inc., Six Flags Theme Parks Inc., the other subsidiary guarantors party thereto, Wells Fargo Bank, National Association, as administrative agent, and the revolving credit lenders party thereto─incorporated by reference to Exhibit 10.2 to Registrant’s Current Report on Form 8-K (File No. 001-13703) filed on April 8, 2020. |
| | | | | | | | |
10.26 | |
| Second Amendment to Second Amended and Restated Credit Agreement, dated as of April 22, 2020, among Six Flags Entertainment Corporation, Six Flags Operations Inc., Six Flags Theme Parks Inc., the other subsidiary guarantors party thereto, Wells Fargo Bank, National Association, as administrative agent, and the revolving credit lenders party thereto─incorporated by reference to Exhibit 10.1 to Registrant’s Current Report on Form 8-K (File No. 001-13703) filed on April 23, 2020. |
10.27 | |
| Third Amendment to Second Amended and Restated Credit Agreement, dated as of August 26, 2020, among Six Flags Entertainment Corporation, Six Flags Operations Inc., Six Flags Theme Parks Inc., the other subsidiary guarantors party thereto, Wells Fargo Bank, National Association, as administrative agent and the other lenders party thereto─incorporated by reference to Exhibit 10.1 to Registrant’s Current Report on Form 8-K (File No. 001-13703) filed on August 26, 2020. |
10.28 | |
| Consent to Second Amended and Restated Credit Agreement, dated as of December 28, 2020, among Six Flags Entertainment Corporation, Six Flags Operations Inc., Six Flags Theme Parks Inc., the other subsidiary guarantors party thereto, Wells Fargo Bank, National Association, as administrative agent and the other lenders party thereto─incorporated by reference to Exhibit 10.1 to Registrant’s Current Report on Form 8-K (File No. 001-13703) filed on December 28, 2020. |
10.29 | |
| Cooperation Agreement, dated as of January 30, 2020, by and among Six Flags Entertainment Corporation and H Partners Management, LLC and certain of its affiliates—incorporated by reference to Exhibit 10.1 to Registrant’s Current Report on Form 8-K (File No. 001-13703) filed on January 31, 2020. |
10.30 | † | |
10.31
| †
| Employment Agreement, dated November 14, 2021, by and between Six Flags Entertainment Corporation and Selim A. Bassoul—incorporated by reference to Exhibit 10.2 to Registrant’s Current Report on Form 8-K (File No. 001-13703) filed on November 15, 2021. |
10.3210.31
| † | |
10.3410.32
| † | |
10.3510.33
| |
| Amendment No. 1, dated November 10, 2022, to the Cooperation Agreement, dated as of January 30, 2020, by and among Six Flags Entertainment Corporation and H Partners Management, LLC and certain of its affiliates – incorporated by reference to Exhibit 10.1 to Registrant’s Current Report on Form 8-K (File No. 001-13703) filed on November 10, 2022 |
10.34 | | Replacement Revolving Facility and Incremental Amendment to Second Amended and Restated Credit Agreement, dated as of May 3, 2023, among Six Flags Entertainment Corporation, Six Flags Operations Inc., Six Flags Theme Parks Inc., each of the subsidiary guarantors party thereto, Wells Fargo Bank, National Association, as administrative agent, and the replacement revolving lenders and incremental revolving lenders--incorporated by reference Exhibit 10.1 to Registrant's Current Report on Form 8-K (File No. 001-13703) filed on May 4, 2023. |
| 10.35 | | Fourth Amendment to Second Amended and Restated Credit Agreement, dated as of May 3, 2023, among Six Flags Entertainment Corporation, Six Flags Operations Inc., Six Flags Theme Parks Inc., each of the subsidiary guarantors party thereto, Wells Fargo Bank, National Association, as administrative agent, and the lenders party thereto--incorporated by reference Exhibit 10.2 to Registrant's Current Report on Form 8-K (File No. 001-13703) filed on May 4, 2023. |
| 10.36 | | |
| 10.37 | | |
| 10.38 | | |
| 21.1 | * | |
23.1 | * | |
31.1 | * | |
31.2 | * | |
32.1 | * | |
32.2 | * | |
| | | | | | | | |
| 97.1 | * | |
101 | * | The following financial statements and footnotes from the Company’s Annual Report on Form 10-K for the year ended January 1,December 31, 2023 formatted in Inline XBRL: (i) the Audited Consolidated Balance Sheets, (ii) the Audited Consolidated Statements of Operations, (iii) the Audited Consolidated Statements of Comprehensive Income, (iv) the Consolidated Statements of Stockholders’ Deficit, (v) the Audited Statements of Cash Flow, and (vi) related Notes to the Consolidated Financial Statements. |
104 | * | The cover page from the Company’s Annual Report on Form 10-K for the year ended January 1,December 31, 2023, formatted in Inline XBRL. |
P Filed paper only
†Management contract or compensatory plan
†
| Management contract or compensatory plan
|
(b)ExhibitsSee Item 15(a)(3) above.
Neither Six Flags Entertainment Corporation, nor any of its consolidated subsidiaries, has outstanding any instrument with respect to its long-term debt, other than those filed as an exhibit to this Annual Report, under which the total amount of securities authorized exceeds 10% of the total assets of Six Flags Entertainment Corporation and its subsidiaries on a consolidated basis. Six Flags Entertainment Corporation hereby agrees to furnish to the SEC, upon request, a copy of each instrument that defines the rights of holders of such long-term debt that is not filed or incorporated by reference as an exhibit to this Annual Report.
Six Flags Entertainment Corporation will furnish any exhibit upon the payment of a reasonable fee, which fee will be limited to Six Flags Entertainment Corporation’s reasonable expenses in furnishing such exhibit.
Pursuant to the requirements of Section 13 or 15(d) of the Securities Exchange Act of 1934, the Registrant has duly caused this Form 10-K to be signed on its behalf by the undersigned, thereunto duly authorized.
Date: March 7, 2023
| | | | | | | | |
Date: February 29, 2024 | | |
| | |
| SIX FLAGS ENTERTAINMENT CORPORATION |
|
|
| By: | By:
| /s/ SELIM BASSOUL |
|
|
Selim Bassoul
President and Chief Executive Officer |
Pursuant to the requirements of the Securities Exchange Act of 1934, this report has been signed by the following persons on behalf of the Registrant and in the following capacities on the dates indicated.
|
Signature | |
| | | | |
| | | Director, President and Chief Executive Officer
(Principal Executive Officer) | |
| | | | |
| | | | |
| | | Chief Financial Officer
(Principal Financial Officer) | |
| | | | |
| | | | |
| | | Vice President and Chief Accounting Officer
(Principal Accounting Officer) | |
| | | | |
| | | | |
| |
| | | | |
| | | | |
| |
| | | | |
| | | | |
| |
| | | | |
| | | | |
| |
| | | | |
