ELLINGTON RESIDENTIAL MORTGAGE REIT
| Item No. | Form 10-K Report Page | |||||||
| PART I | ||||||||
| 1. | Business | |||||||
| 1A. | Risk Factors | |||||||
| 1B. | Unresolved Staff Comments | |||||||
| 1C. | Cybersecurity | |||||||
| 2. | Properties | |||||||
| 3. | Legal Proceedings | |||||||
| 4. | Mine Safety Disclosures | |||||||
| PART II | ||||||||
| 5. | Market for Registrant's Common Equity, Related Shareholder Matters, and Issuer Purchases of Equity Securities | |||||||
| 6. | [Reserved] | |||||||
| 7. | Management's Discussion and Analysis of Financial Condition and Results of Operations | |||||||
| 7A. | Quantitative and Qualitative Disclosures About Market Risk | |||||||
| 8. | Financial Statements and Supplementary Data | |||||||
| 9. | Changes in and Disagreements with Accountants on Accounting and Financial Disclosure | |||||||
| 9A. | Controls and Procedures | |||||||
| 9B. | Other Information | |||||||
| 9C. | Disclosure Regarding Foreign Jurisdictions that Prevent Inspections | |||||||
| PART III | ||||||||
| 10. | Directors, Executive Officers, and Corporate Governance | |||||||
| 11. | Executive Compensation | |||||||
| 12. | Security Ownership of Certain Beneficial Owners and Management and Related Shareholder Matters | |||||||
| 13. | Certain Relationships and Related Transactions, and Director Independence | |||||||
| 14. | Principal Accountant Fees and Services | |||||||
| PART IV | ||||||||
| 15. | Exhibits and Financial Statement Schedules | |||||||
| 16. | Form 10-K Summary | |||||||
| Item No. | Form 10-K Report Page | |
| PART I | ||
| 1. | ||
| 1A. | ||
| 1B. | ||
| 2. | ||
| 3. | ||
| 4. | ||
| Part II | ||
| 5. | ||
| 6. | ||
| 7. | ||
| 7A. | ||
| 8. | ||
| 9. | ||
| 9A. | ||
| 9B. | Other Information | |
| Part III | ||
| 10. | ||
| 11. | ||
| 12. | ||
| 13. | ||
| 14. | ||
| Part IV | ||
| 15. | ||
| 16. | Form 10-K Summary | |
PART I
Item 1. Business
Except where the context suggests otherwise "EARN,"references in this Annual Report on Form 10-K to "we," "us," and "our" refer to Ellington Residential Mortgage REIT and its consolidated subsidiaries, including Ellington Residential Mortgage LP, our operating partnership subsidiary, which we refer to as our "Operating Partnership." We hold all of our assets and conduct all of our operations through our Operating Partnership. "Manager" refers to Ellington Residential Mortgage Management LLC, our external manager, and "Ellington" refers to Ellington Management Group, L.L.C. and its affiliated investment advisory firms, including our Manager. In certain instances, references to our Manager and services to be provided to us by our Manager may also include services provided by Ellington and its other affiliates from time to time. In certain instances, references to our Manager and services to be provided to us by our Manager may also include services provided by Ellington and its other affiliates from time to time. References to "Blackstone" mean The Blackstone Group LP.Inc. The "Blackstone Funds" means the group of funds that are managed by an affiliate of Blackstone and that, helped form, and have a substantial investment in,together with Ellington, constituted our company. original group of investors.
Special Note Regarding Forward-Looking Statements
When used in this Annual Report on Form 10-K, in future filings with the Securities and Exchange Commission, or the "SEC," or in press releases or other written or oral communications, statements which are not historical in nature, including those containing words such as "believe," "expect," "anticipate," "estimate," "project," "plan," "continue," "intend," "should," "would," "could," "goal," "objective," "will," "may," "seek," or similar expressions or their negative forms or references to strategy, plans or intentions, are intended to identify "forward-looking statements" within the meaning of Section 27A of the Securities Act of 1933, as amended, or the "Securities Act," and Section 21E of the Securities Exchange Act of 1934, as amended, or the "Exchange Act," and, as such, may involve known and unknown risks, uncertainties and assumptions.
Forward-looking statements are based on our beliefs, assumptions, and expectations of our future operations, business strategies, performance, financial condition, liquidity and prospects, taking into account all information currently available to us. These beliefs, assumptions, and expectations are subject to risks and uncertainties and can change as a result of many possible events or factors, not all of which are known to us. If a change occurs, our business, financial condition, liquidity, results of operations and strategies may vary materially from those expressed or implied in our forward-looking statements. The following factors are examples of those that could cause actual results to vary from our forward-looking statements: changes in interest rates and the market value of our securities;securities or our investments; our use of and dependence on leverage; future changes with respect to the Federal National Mortgage Association, or "Fannie Mae," and Federal Home Loan Mortgage Corporation, or "Freddie Mac," and related events, including the lack of certainty as to the future roles of these entities and the U.S. Government in the mortgage market and changes to legislation and regulations affecting these entities; market volatility; changes in the prepayment rates on the mortgage loans underlying the securities we own and intend to acquire; changes in rates of default and/or recovery rates on our non-Agency assets; our ability to borrow to finance our assets;assets and the available terms for such borrowings; changes in government regulations affecting our business; our ability to maintain our exclusion from registration under the Investment Company Act of 1940, as amended, or the "Investment Company Act"; our ability to maintain our qualification as a real estate investment trust, or "REIT"; and risks associated with investing in real estate assets, including changes in business conditions and the general economy.economysuch as changes to fiscal or monetary policy, heightened inflation, slower growth or recession, and currency fluctuations. These and other risks, uncertainties and factors, including the risk factors described under Item 1A of this Annual Report on Form 10-K, could cause our actual results to differ materially from those projected or implied in any forward-looking statements we make. All forward-looking statements speak only as of the date on which they are made. New risks and uncertainties arise over time, and it is not possible to predict those events or how they may affect us. Except as required by law, we are not obligated to, and do not intend to, update or revise any forward-looking statements, whether as a result of new information, future events, or otherwise.
Our Company
Ellington Residential Mortgage REIT is a Maryland real estate investment trust formed in August 2012 that specializes in acquiring, investing in, and managing residential mortgage- and real estate-related assets. Our primary objective is to generate attractive current yields and risk-adjusted total returns for our shareholders by making investments that we believe compensate us appropriately for the risks associated with them. We seek to attain this objective by constructing and actively managing a portfolio consisting primarily of residential mortgage-backed securities, or "RMBS," for which the principal and interest payments are guaranteed by a U.S. government agency or a U.S. government-sponsored entity, or "Agency RMBS," and, to a lesser extent, RMBS backed by prime jumbo, Alternative A-paper, or "Alt-A," mortgage loans that are not deemed "qualified mortgage," or "QM," loans under the rules of the Consumer Financial Protection Bureau, or "non-QM loans," mortgages on single-family-rental properties, manufactured housing, and subprime residential mortgage loans, or "non-Agency RMBS." We also may opportunistically acquire other types of residential mortgage- and real estate-related asset classes, such as commercial mortgage-backed securities, or "CMBS"; residential mortgage loans,loans; mortgage servicing rights, or "MSRs,""MSRs"; and credit risk transfer securities, or “CRTs.”"CRTs." We also acquire and manage corporate collateralized loan obligations, or "CLOs." We believe that being
4
able to combine Agency RMBS with CLOs, non-Agency RMBS and other residential mortgage- and real estate-related asset classesopportunistic investments, enables us to balance a range of mortgage-related and credit risks.
We were formed through an initial strategic venture among affiliates of Ellington, an investment management firm and registered investment adviser with a 23-year29-year history of investing in a broad spectrum of residential and commercial mortgage-backed securities, or "MBS," and related derivatives, and the Blackstone Funds. As of December 31, 2017, the Blackstone Funds owned approximately 20% of our outstanding common shares. We have elected to be taxed as a real estate investment trust, or "REIT," for U.S. federal income tax purposes. We intend to maintain our exclusion from registration under the Investment Company Act.
Our Manager and Ellington
We are externally managed and advised by our Manager, an affiliate of Ellington, pursuant to a management agreement. Our Manager was formed solely to serve as our manager and does not have any other clients. In addition, our Manager does not have any employees of its own and instead relies on the employees of Ellington to perform its obligations to us.
The members of our management team are Michael Vranos, founder and Chief Executive Officer of Ellington, who serves as our Co-Chief Investment Officer and as a member of our Board of Trustees; Laurence Penn, Vice Chairman and Chief Operating Officer of Ellington, who serves as our President and Chief Executive Officer and as a member of our Board of Trustees; Mark Tecotzky, Vice Chairman—Co-Head of Credit Strategies of Ellington, who serves as our Co-Chief Investment Officer; Christopher Smernoff, who serves as our Chief Financial Officer; JR Herlihy, a Managing Director of Ellington, who serves as our Co-Chief Investment Officer; Lisa Mumford, who serves as our Chief FinancialOperating Officer; Daniel Margolis, General Counsel of Ellington, who serves as our General Counsel; JR Herlihy, a Director of Ellington, who serves as our Treasurer; Chris Smernoff,Vincent Ambrico, who serves as our Controller; and Jason Frank,Alaael-Deen Shilleh, Associate General Counsel of Ellington, who serves as our Associate General Counsel and Secretary. Mr. Smernoff is expected to become our Chief Financial Officer upon Ms. Mumford's retirement from her position with our company on or about March 30, 2018, at which time Mr. Herlihy is expected to become our Chief Operating Officer. Each of these individuals is an officer of our Manager.
Our Manager is responsible for administering our business activities and day-to-day operations and, pursuant to a services agreement between our Manager and Ellington, relies on the resources of Ellington to support our operations. Ellington has well-established portfolio management resources for each of our targeted asset classes and an established infrastructure supporting those resources. Through our relationship with our Manager, we benefit from Ellington's highly analytical investment processes, broad-based deal flow, extensive relationships in the financial community, financial and capital structuring skills, investment surveillance capabilities, and operational expertise. Ellington's analytic approach to the RMBS investment process involves collection of substantial amounts of data regarding historical performance of RMBS collateral and RMBS market transactions. Ellington’s approach to the CLO investment process is similar, with the analysis of CLO investments driven by models underpinned by substantial amounts of historical data on corporate loan and CLO performance including default, loss, recovery, and prepayment rates, as well as historical price action. Ellington analyzes this data to identify possible relationships and trends and develops financial models used to support our investment and risk management process. In addition, throughout Ellington's 23-year29-year history of investing in RMBS and related derivatives and 11-year history of investing in corporate CLOs, it has developed strong relationships with a wide range of dealers and other market participants that provide Ellington access to a broad range of trading opportunities and market information. As a result, Ellington provides us with access to a wide variety of asset acquisition and disposition opportunities and information that assist us in making asset management decisions across our targeted asset classes, which we believe provides us with a significant competitive advantage. We also benefit from Ellington's finance, accounting, operational, legal, compliance, and administrative functions.
As of December 31, 2017,2023, Ellington employedhad over 160170 employees and had assets under management of approximately $6.6$10.3 billion, of which (i) approximately $5.1$7.2 billion consisted of our company, as well as Ellington Financial LLC,Inc., a specialty finance company listed on the New York Stock Exchange, or "NYSE," under the ticker "EFC,"Delaware corporation that elected to be taxed as a REIT (NYSE: EFC), and various hedge funds and other alternative investment vehicles that employ financial leverage, and (ii) approximately $1.5$3.1 billion consisted of accounts that do not employ financial leverage. The $10.3 billion and $7.2 billion in assets under management include approximately $0.8 billion in Ellington-managed CLOs. For these purposes, the Ellington-managed CLO figure represents the aggregate outstanding balance of CLO notes and market value of CLO equity, excluding any notes and equity held by other Ellington-managed funds and accounts.
Our Strategy
We intend to capitalize on current market opportunities by utilizing an opportunistic strategy that we believe will enable us to generate attractive current yields and risk-adjusted total returns for our shareholders. In particular, our strategy consists of:
•utilizing an investment model that focuses on security selection and allocates capital to assets that balance a range of mortgage-related risks;
•constructing and actively managing a hybrid investment portfolio consisting primarily of Agency RMBS and, to a lesser extent, non-Agency RMBS, designed to:
◦take advantage of opportunities in the Agency RMBS market by acquiring Agency RMBS on a leveraged basis; and
5
◦take advantage of opportunities in the non-Agency residential mortgage market by purchasing investment grade and non-investment grade non-Agency RMBS, including senior and subordinated securities;
•acquiring and managing a portfolio of corporate CLOs, with an emphasis on CLO mezzanine debt and equity tranches;
•opportunistically acquiring and managing other mortgage- and real estate-related assets, such as MSRs, CRTs, CMBS, and residential mortgage loans, that we would hold for appreciation and/or current income; and
•opportunistically mitigating our interest rate, and prepayment, risk and, to a lesser extent, credit risk,risks, by using a variety of hedging instruments.
Our strategy is adaptable to changing market environments, subject to compliance with the income and other tests that will allowenable us to maintain our qualification as a REIT for U.S. federal income tax purposes and to maintain our exclusion from registration as an investment company under the Investment Company Act. As a result, although we intend to focus on the acquisition and management primarily of Agency RMBS, and to a lesser extent, non-Agency RMBS, residential mortgage loans, MSRs, CRTs, and CRTs,CMBS, our acquisition and management decisions will depend on prevailing market conditions and our targeted asset classes may vary over time in response to market conditions. To the extent that we acquire MSRs or engage in other strategies including certain relative value trading strategies, it may be necessary to holdconduct such assetsactivities through a taxable REIT subsidiary, or "TRS." The income from any such assets heldactivities conducted through a domestic TRS willwould be subject to U.S. federal and state corporate income tax.tax, as applicable. Our Manager is authorized to follow very broad investment guidelines and, as a result, we cannot predict our portfolio composition. We may change our strategy and policies without a vote of our shareholders. Moreover, although our independent trustees may periodically review our investment guidelines and our portfolio, they generally do not review our proposed asset acquisitions or asset management decisions.
Ellington's continued emphasis on and development of proprietary RMBS,MBS, interest rate, prepayment, and credit models, as well as other proprietary research and analytics, underscores the importance it places on a disciplined and analytical approach to fixed income investing, especially in RMBS.MBS. Our Manager uses Ellington's proprietary models to identify attractive assets, value these assets, monitor and forecast the performance of these assets, and (subject to qualifying and maintaining our qualification as a REIT) opportunistically hedge our interest rate risk and yield spread risk, hedge our prepayment risk, and hedge our credit risk. We leverage these skills and resources for purposes of attaining our objectives.
We believe that our Manager is uniquely qualified to implement our strategy. Our strategy is consistent with Ellington's investment approach, which is based on its distinctive strengths in sourcing, analyzing, trading, and hedging for complex MBS and other mortgage- and non-mortgage-related products. Furthermore, we believe that Ellington's extensive experience in buying, selling, analyzing, and structuring fixed income securities, coupled with its broad access to market information and trading flows, provides us with a steady flow of opportunities to acquire assets with favorable trade executions.
6
Our Targeted Assets
| Asset Class | Principal Assets | ||||||||||||
| Agency RMBS | . | Agency RMBS collateralized by fixed rate mortgage loans, adjustable rate mortgage loans, or "ARMs," or hybrid mortgage loans, reverse mortgages, or derivatives thereof, including: | |||||||||||
| . | whole and partial pool mortgage pass-through certificates; | ||||||||||||
| . | Agency collateralized mortgage obligations, or "CMOs," including interest only securities, or "IOs," principal only securities, or "POs," inverse interest only securities, or "IIOs," and inverse floaters; and | ||||||||||||
| . | To-Be-Announced mortgage pass-through certificates, or "TBAs." | ||||||||||||
| Non-Agency RMBS | . | RMBS backed by prime jumbo, Alt-A, non-QM loans, manufactured housing, and subprime mortgages; | |||||||||||
| . | RMBS backed by fixed rate mortgages, ARMs, Option-ARMs, and residential mortgage loans that have interest rates that are fixed for a specified period of time (typically three, five, seven, or ten years) and, thereafter, adjust to an increment over a specified interest rate index, or "hybrid ARMs"; | ||||||||||||
| . | RMBS backed by first lien and second lien mortgages; | ||||||||||||
| . | RMBS backed by mortgages on single-family-rental properties; | ||||||||||||
| . | Investment grade and non-investment grade securities; | ||||||||||||
| . | Senior and subordinated securities; and | ||||||||||||
| . | Non-Agency CMOs, including IOs, POs, IIOs, and inverse floaters. | ||||||||||||
| . | Collateralized loan obligation debt and equity tranches, or "CLOs." | ||||||||||||
| Other | . | Residential mortgage loans; | |||||||||||
| . | MSRs; | ||||||||||||
| . | CRTs; | ||||||||||||
| . | CMBS; and | ||||||||||||
| . | Other mortgage- and real estate-related assets, including asset-backed securities and certain hedging transactions. | ||||||||||||
Agency RMBS
Residential Mortgage Pass-Through Certificates—Residential mortgage pass-through certificates represent interests in "pools" of mortgage loans secured by residential real property where payments of both interest and principal, plus prepayments, on the underlying residential mortgage loans are made monthly to holders of the certificates, in effect "passing through" monthly payments made by the individual borrowers on the mortgage loans that underlie the securities, net of fees paid to the issuer/guarantor and servicers of the securities.
Collateralized Mortgage Obligations—CMOs are structured instruments representing interests in specified mortgage loan collateral. CMO securitizations consist of multiple classes, or "tranches," of securities, with each tranche having specified characteristics based on the rules described in the securitization documents governing the division of the monthly principal and interest distributions, including prepayments, from the underlying mortgage collateral among the various tranches. IOs are CMOs that only receive interest payments while POs receive only principal payments.
TBAs—In addition to investing in specific pools of Agency RMBS, subject to our satisfying the requirements for qualification as a REIT, we utilize forward-settling purchases and sales of Agency RMBS where the underlying pools of mortgage loans are TBAs. Pursuant to these TBA transactions, we agree to purchase or sell, for future delivery, Agency RMBS with certain principal and interest terms and certain types of underlying collateral, but the particular Agency RMBS to be delivered is not identified until shortly before the TBA settlement date. TBAs are generally liquid and have quoted market prices and represent the most actively traded class of RMBS. We use TBAs primarily for hedging purposes. TBA trading is based on the assumption that mortgage pools that are eligible to be delivered at TBA settlement are fungible and thus the specific mortgage pools to be delivered do not need to be explicitly identified at the time a trade is initiated.
We primarily engage in TBA transactions for purposes of managing interest rate risk associated with our liabilities under repurchase agreements, orwhich we sometimes refer to herein as "repos." WeFor tax purposes, we generally treat such TBA purchases and sales as hedging transactions that hedge indebtedness incurred to acquire or carry real estate assets, or "qualifying liability hedges,hedges." for REIT purposes. Alternatively, we may, from time to time,We also opportunistically engage in TBA transactions because we find them attractive in their own right, from a relative value perspective or otherwise. Our ability to engageFor accounting purposes, in TBA transactions may be limited by our intention to remain qualified as a REIT. In accordance with generally accepted accounting principles in the United States of America, or "U.S. GAAP," we treat TBAsclassify TBA transactions as derivative transactions.derivatives.
7
Non-Agency RMBS
We acquire non-Agency RMBS backed by prime jumbo, Alt-A, non-QM, manufactured housing, and subprime residential, and single-family-rental mortgage loans. Our non-Agency RMBS holdings can include investment grade and non-investment grade classes, including non-rated classes.
Non-Agency RMBS are debt obligations issued by private originators of, or investors in, residential mortgage loans. Non-Agency RMBS generally are issued as CMOs and are backed by pools of whole mortgage loans or by mortgage pass-through certificates. Non-Agency RMBS generally are in the form of senior/subordinated structures, or in the form of excess spread/over-collateralization structures. In senior/subordinated structures, the subordinated tranches generally absorb all losses on the underlying mortgage loans before any losses are borne by the senior tranches. In excess spread/over-collateralization structures, losses are first absorbed by any existing over-collateralization, then are borne by subordinated tranches and excess spread, which represents the difference between the interest payments received on the mortgage loans backing the RMBS and the interest due on the RMBS debt tranches, and finally are borne by senior tranches and any remaining excess spread.
CLOs
A CLO is a form of structured finance security that is generally backed by a pool of corporate loans or similar corporate credit-related assets that serve as collateral. Most CLOs are issued in multiple tranches, offering investors various maturity and credit risk characteristics, often categorized as senior, mezzanine and subordinated/equity according to their relative seniority and degree of risk. If the relevant collateral defaults or otherwise underperforms, payments to the more senior tranches of such securitizations take precedence over those of more junior tranches, such as mezzanine debt and equity tranches, which are the focus of our CLO investment strategy.
Other Assets
We also may from time to time opportunistically acquire other mortgage- and real estate-related assets that may include, among others, residential mortgage loans, MSRs, CRTs, and CRTs.CMBS.
Investment Process
Our investment process benefits from the resources and professionals of our Manager and Ellington. The process is managed by an investment and risk management committee, which includes, among others, the following three officers of our Manager: Messrs.Mr. Vranos, Mr. Penn, and Mr. Tecotzky. These officers of our Manager also serve as our Co-Chief Investment Officer, President and Chief Executive Officer, and Co-Chief Investment Officer, respectively. The investment and risk management committee operates under investment guidelines and meets periodically to develop a set of preferences for the composition of our portfolio. The primary focus of the investment and risk management committee is to review and approve our investment policies and our portfolio composition and related compliance with our investment policies and guidelines. Under the management agreement between us and our Manager, our Manager has the authority to enter into transactions consistent with our investment guidelines, subject to the oversight of our Board of Trustees.
Ellington has a focused investment team for each of our targeted asset classes. Each team evaluates acquisition opportunities consistent with our investment guidelines. Our asset acquisition process includes sourcing and screening of asset acquisition opportunities, credit analysis, due diligence, structuring, financing, and hedging, each as appropriate, to seek attractive current yields and total returns commensurate with our risk tolerance. We also screen and monitor potential asset acquisitions to determine their impact on maintaining our exclusion from registration as an investment company under the Investment Company Act and our qualification as a REIT.
Valuation of Assets
Our Manager's valuation committee directs our valuation process, which is also subject to the oversight of our Manager's Valuation Committee as well as the oversight of the independent members of our Board of Trustees.trustees. See Note 2 of the notes to consolidated financial statements included in Item 8 of this reportAnnual Report on Form 10-K for a complete discussion of our valuation process.
Risk Management
Risk management is a cornerstone of Ellington's portfolio management process. Ellington's risk management infrastructure system includes "ELLiN," a proprietary portfolio management system that Ellington uses for its accounts, which provides real-time and batch reporting toused by all departments at Ellington, including trading, research, risk management, finance, operations, accounting, and compliance. We benefit from Ellington's comprehensive risk management infrastructure and ongoing assessment of both portfolio and operational risks. In addition, we utilize derivatives and other hedging instruments to opportunistically manage our interest rate and yield spread risk.
8
Interest Rate Hedging
We opportunistically manage our interest rate risk by using various hedging strategies to mitigate such risks, subject to maintaining our qualification as a REIT and maintaining our exclusion from registration as an investment company under the Investment Company Act. The interest rate hedging instruments that we use and may use in the future include, without limitation:
•interest rate swaps (including floating-to-fixed, fixed-to-floating, or more complex swaps such as floating-to-inverse floating, callable or non-callable);
•TBAs;
•U.S. Treasury securities;
•futures and forward contracts; and
•other derivatives on interest rates, including swaptions and other options on any of the foregoing.
Because fluctuations in short-term interest rates may expose us to fluctuations in the spread between the interest we earn on our investments and the interest we pay on our borrowings, we may seek to manage such exposure by entering into short positions in interest rate swaps. An interest rate swap is an agreement to exchange interest rate cash flows, calculated on a notional principal amount, at specified payment dates during the life of the agreement. Typically, one party pays a fixed interest rate and receives a floating interest rate and the other party pays a floating interest rate and receives a fixed interest rate. Each party's payment obligation is computed using a different interest rate. In an interest rate swap, the notional principal is generally not exchanged.
We also utilize TBAs.TBAs for interest rate hedging purposes. Pursuant to a TBA transaction, we agree to purchase or sell, for future delivery, Agency RMBS with certain principal and interest terms and certain types of underlying collateral, but the particular Agency RMBS to be delivered is not identified until shortly before the TBA settlement date. We primarily engage in TBA transactions for purposes of managing interest rate risk associated with our liabilities under repurchase agreements. Alternatively, we may, from time to time, opportunistically engage in TBA transactions because we find them attractive on their own, from a relative value perspective or otherwise. Our ability to engage in TBA transactions may be limited by our intention to remain qualified as a REIT.
Credit Risk Hedging
Although we do not operate our corporate CLO or non-Agency RMBS investment strategystrategies on a credit-hedged basis in general, we may from time to time opportunistically enter into short credit positions using credit default swapsderivative instruments to protect against adverse credit events and/or spread widening risk with respect to our corporate CLOs, non-Agency RMBS, or other assets, subject to maintaining our qualification as a REIT and maintaining our exclusion from registration as an investment company under the Investment Company Act. We mayThe derivative instruments that we use credit default swaps to hedge non-Agency RMBS credit risk by buying protection on various MBS indices. We may also enter into other derivative contracts for credit hedging purposes includingmay include contracts referencing the unsecured corporate credit, or the equity of, certain corporations, including indices on corporate debt and equity.
Our Financing Strategies and Use of Leverage
We finance our assets with what we believe to be a prudent amount of leverage, which will vary from time to time based upon the particular characteristics of our portfolio, availability of financing and market conditions. As of December 31, 2017,2023, all of our debt financings consisted of repos. In a repo, we sell an asset to a counterparty at a discounted value, or the loan amount,"Loan Amount," and simultaneously agree to repurchase the same asset from such counterparty at a future date at a price equal to the loan amountLoan Amount plus an interest factor. Despite being legally structured as sales and subsequent repurchases, repurchase agreementsrepos are accounted for as collateralized borrowings. During the term of a repurchase agreement,repo, we generally receive the income and other payments distributed with respect to the underlying assets, and pay interest to the counterparty. While the proceeds of our repurchase agreementsrepos are often used to purchase the asset subject to the transaction, our financing arrangements do not restrict our ability to use proceeds from these arrangements to support our other liquidity needs. Our repurchase agreementrepo arrangements are typically documented under the standard form master repurchase agreement of the Securities Industry and Financial Markets Association, with the ability for both parties to request margin (i.e., to demand that the other party post additional collateral or repay a portion of the funds advanced) should the value of the underlying assets and posted collateral change. As the value of our collateral fluctuates, we and our repurchase agreementrepo counterparties are required to post additional margin collateral to each other from time to time as part of the normal course of our business. Our repurchase agreementrepo financing counterparties generally have the right, to varying degrees, to determine the value of the underlying collateral for margining purposes, subject to the terms and conditions of our agreement with the counterparty, including in
certain cases our right to dispute the counterparty's valuation determination. As of December 31, 2017,2023, we had approximately $1.6$0.7 billion outstanding under repos with fifteen19 counterparties, and given that we had approximately $192.7$136.2 million of shareholders' equity as of December 31, 2017,2023, our debt-to-equity ratio was 8.35.4 to 1. Our debt-to-equity ratio does not account for liabilities other than debt financings.
We may utilize other types of borrowings in the future, including term facilities or other more complex financing structures. We also may raise capital by issuing unsecured debt, preferred or common shares, or depositary shares.
9
Our use of leverage, especially in order to increase the amount of assets supported by our capital base, may have the effect of increasing losses when these assets underperform. Our investment policies require no minimum or maximum leverage, and our Manager's investment and risk management committee has the discretion, without the need for further approval by our Board of Trustees, to change both our overall leverage and the leverage used for individual asset classes. Because our strategy is flexible, dynamic, and opportunistic, our overall leverage will vary over time. As a result, we do not have a targeted debt-to-equity ratio.
Management Agreement
Upon our inception in September 2012, we entered into a management agreement with our Manager pursuant to which our Manager provides for the day-to-day management of our operations. The management agreement, as amended, requires our Manager to manage our business affairs in conformity with policies and investment guidelines that are approved and monitored by our Board of Trustees. Our Manager is subject to the direction and oversight of our Board of Trustees. Our Manager is responsible for, among other things:
•the selection, purchase, and sale of our portfolio investments;
•our financing and risk management activities;
•providing us with advisory services; and
•providing us with a management team, inclusive of a dedicated or partially dedicated Chief Financial Officer and appropriate support personnel as necessary.
Our Manager is responsible for our day-to-day operations and performs (or causes to be performed) such services and activities relating to the management, operation, and administration of our assets and liabilities, and business as may be
appropriate.
Under the management agreement, we pay our Manager a management fee quarterly in arrears, and we reimburse certain expenses of our Manager.
Management Fees
Under the management agreement, we pay our Manager a management fee quarterly in arrears in an amount equal to 1.50% per annum of our shareholders' equity, with shareholders' equity being calculated, as of the end of any fiscal quarter, as (a) the sum of (1) the net proceeds from any issuances of common shares or other equity securities of our company or our Operating Partnership (without double counting) since inception, plus (2) our and our Operating Partnership's (without double counting) retained earnings (expressed as a positive number) or accumulated deficit (expressed as a negative number), as the case may be, calculated in accordance with U.S. GAAP at the end of the most recently completed fiscal quarter (without taking into account any non-cash equity compensation expense incurred in current or prior periods), less (b) any amount that we or our Operating Partnership has paid to repurchase our common shares, limited partnership interests in our Operating Partnership, or other equity securities since inception. Shareholders' equity excludes (1) non-cash equity compensation expenses that have impacted shareholders' equity as reported in our financial statements prepared in accordance with U.S. GAAP, and (2) one-time events pursuant to changes in U.S. GAAP, and certain non-cash items not otherwise described above in each case, after discussions between our Manager and our independent trustees and approval by a majority of the independent trustees. Our shareholders' equity, for purposes of calculating the management fee, could be greater or less than the amount of shareholders' equity shown on our financial statements.
Reimbursement of Expenses
We do not maintain an office or employ personnel. We rely on the facilities and resources of our Manager to conduct our operations. We pay all of our direct operating expenses, except those specifically required to be borne by our Manager under the management agreement. Our Manager is responsible for all costs incident to the performance of its duties under the management agreement, including compensation of Ellington's employees and other related expenses, other than our allocable portion of the costs incurred by our Manager for certain dedicated or partially dedicated employees, including a Chief Financial Officer, one or more controllers, an in-house legal counsel, an investor relations professional, certain internal audit staff in connection with Sarbanes-Oxley compliance initiatives and certain other personnel performing duties for us, based on the portion of their working time and efforts spent on our matters and subject to approval of the reimbursed amounts by the Compensation Committee of our Board of Trustees. In addition, other than as expressly described in the management agreement, we are not required to pay any portion of rent, telephone, utilities, office furniture, equipment, machinery, and other office, internal and overhead expenses of our Manager and its affiliates. Expense reimbursements to our Manager are made within 60 days following delivery of the expense statement by our Manager.
Term and Termination
The current term of the management agreement will expire in September 20182024 and will be automatically renewed for a one-year term on such date and on each anniversary of such date thereafter unless terminated as described below.
Either we or our Manager may elect not to renew the management agreement upon expiration of its initial term or any renewal term by providing written notice of non-renewal at least 180 days, but not more than 270 days, before expiration. In the event we elect
10
not to renew the term, we will be required to pay our Manager a termination fee equal to 5% of our Shareholders' Equity, as defined in the management agreement, as of the end of the month preceding the date of the notice of termination or non-renewal of the management agreement. No termination fee will be due to the Manager if the Manager decides not to renew the management agreement.
We have the right to terminate the management agreement for cause, as defined in the management agreement, at any time during the term upon 30 days' prior written notice, without payment of any termination fee.
Our Board of Trustees reviews our Manager's performance annually and, as a result of such review, upon the affirmative vote of at least two-thirds of the members of our Board of Trustees or of the holders of a majority of our outstanding common shares, we may terminate the management agreement based either upon unsatisfactory performance by our Manager that is materially detrimental to us or upon a determination by our independent trustees that the management fees payable to our Manager are not fair, subject to the right of our Manager to prevent such a fee-based termination by agreeing to a reduction of the management fees payable to our Manager. Upon any termination of the management agreement based on unsatisfactory performance or unfair management fees, we are required to pay our Manager the termination fee described above.
Our Manager may terminate the management agreement, without payment of the termination fee, in the event we become regulated as an investment company under the Investment Company Act. Our Manager may also terminate the management agreement upon 60 days written notice if we default in the performance of any material term of the management agreement and the default continues for a period of 30 days after written notice to us, whereupon we would be required to pay our Manager the termination fee described above.
Our Manager may generally only assign the management agreement with the written approval of a majority of our independent trustees. However, our Manager may assign to one or more of its affiliates the performance of any of its responsibilities under the management agreement without the approval of our independent trustees so long as our Manager remains liable for any such affiliate's performance and such assignment does not require our approval under the Investment Advisers Act of 1940, as amended, or the "Advisers Act."
Conflicts of Interest; Equitable Allocation of Opportunities
Ellington manages various other clients that have strategies that are similar to, or overlap with, our strategy, including Ellington Financial LLC, a specialty finance company listed on the NYSE.Inc. As of December 31, 2017,2023, Ellington managed various funds, accounts, and other vehicles, comprising approximately $9.0 billion of assets under management (excluding our assets but including $3.1 billion of accounts that havedo not employ financial leverage), with strategies that are similar to, or that overlap with, our strategy, that had approximately $5.7 billion of total assets under management, excluding our assets but including $1.5 billion of accounts that do not employ financial leverage.strategy. Ellington makes available to our Manager all opportunities to acquire assets that it determines, in its reasonable and good faith judgment, based on our objectives, policies and strategies, and other relevant factors, are appropriate for us in accordance with Ellington's written investment allocation policy, subject to the exception that we might not participate in each such opportunity, but will on an overall basis equitably participate with Ellington's other accounts in all such opportunities. Ellington's investment and risk management committee and its compliance committee (headed by its Chief
Compliance Officer) are responsible for monitoring the administration of, and facilitating compliance with, Ellington's investment allocation procedures and policies.
Because Agency pass-through certificates, Agency and non-Agency CMOs, and certain other asset classes in which we invest are typically available only in specified quantities and are also targeted assets for certain other Ellington accounts, Ellington often is not able to buy as much of any given asset as required to satisfy the needs of all of its accounts. In these cases, Ellington's investment allocation procedures and policies typically allocate such assets to multiple accounts in proportion to their needs and available capital. Ellington may at times allocate opportunities on a preferential basis to accounts that are in a "start-up" or "ramp-up" phase. The policies permit departure from such proportional allocation under certain other circumstances, including, for example, when such allocation would result in an inefficiently small amount of the security or assets being purchased for an account. In that case, the policies allow for a protocol of allocating assets so that, on an overall basis, each account is treated equitably. In addition, as part of these policies, we may be excluded from specified allocations of assets for tax, regulatory, risk management, or similar reasons.
Other policies of Ellington that our Manager applies to the management of our company include controls for:
•Cross Transactions—defined as transactions between us or one of our subsidiaries, on the one hand, and an account (other than us or one of our subsidiaries) managed by Ellington or our Manager, on the other hand. It is Ellington's policy to engage in a cross transaction only when the transaction is in the best interests of, and is consistent with the objectives and policies of, both accounts involved in the transaction. Pursuant to the terms of the management agreement, Ellington or our Manager may enter into cross transactions where it acts both on our behalf and on behalf of the other party to the transaction; provided, however, that our Manager will not enter into any cross transactions on our behalf unless the cross transaction involves a "level one" asset for U.S. GAAP accounting purposes which is being
11
crossed at market prices, or the cross transaction has received approval of a majority of our independent trustees. Although we believe such restrictions on our Manager's ability to engage in cross transactions on our behalf mitigate many risks, cross transactions, even at market prices, may potentially create a conflict of interest between our Manager's and our officers' duties to and interests in us and their duties to and interests in the other party. Subject to our Board of Trustees authorizing such action and upon written notice to our Manager, we may at any time revoke our consent to our Manager's executing cross transactions. Additionally, unless approved in advance by a majority of our independent trustees or pursuant to and in accordance with a policy that has been approved by a majority of our independent trustees, all cross transactions must be effected at the then-prevailing market prices. Pursuant to our Manager's current policies and procedures, assets for which there are no readily observable market prices may be purchased or sold in cross transactions (i) at prices based upon third-party bids received through auction, (ii) at the average of the highest bid and lowest offer quoted by third-party dealers, or (iii) according to another pricing methodology approved by our Manager's Chief Compliance Officer.
•Principal Transactions—defined as transactions between Ellington or our Manager (or any related party of Ellington or our Manager, which includes employees of Ellington and our Manager and their families), on the one hand, and us or one of our subsidiaries, on the other hand. Certain cross transactions may also be considered principal transactions whenever our Manager or Ellington (or any related party of Ellington or our Manager, which includes employees of Ellington and our Manager and their families) have a substantial ownership interest in one of the transacting parties. Our Manager is only authorized to execute principal transactions with the prior approval of a majority of our independent trustees and in accordance with applicable law. Such prior approval includes approval of the pricing methodology to be used, including with respect to assets for which there are no readily observable market prices.
•Investment in Other Ellington Accounts—pursuant to ourthe management agreement, if we invest in any other investment fund or other investment for which Ellington or one of its affiliates receives management, origination, or structuring fees, then, unless agreed otherwise by a majority of the Company'sour independent trustees, the management feefees payable by us to our Manager will be reduced by (or our Manager will otherwise rebate to us) an amount equal to the applicable portion (as described in the management agreement) of any such management, origination, or structuring fees.
We have not made any such investments to date.•Split Price Executions—pursuant to ourthe management agreement, our Manager is authorized to combine purchase or sale orders on our behalf together with orders for other accounts managed by Ellington, our Manager or their affiliates and allocate the securities or other assets so purchased or sold, on an average price basis or other fair and consistent basis, among such accounts.
To date, we have not entered into any cross transactions with other Ellington-managed accounts or principal transactions with Ellington, or invested in other Ellington accountsaccounts.
Our Manager is authorized to follow very broad investment guidelines. Our independent trustees will periodically review our investment guidelines and our portfolio. However, our independent trustees generally will not review our proposed asset acquisitions, dispositions, or other management decisions. In addition, in conducting periodic reviews, our independent trustees
will rely primarily on information provided to them by our Manager. Furthermore, our Manager may arrange for us to use complex strategies or to enter into complex transactions that may be difficult or impossible to unwind by the time they are reviewed by our independent trustees. Our Manager has great latitude within our broad investment guidelines to determine the types of assets it may decide are proper for purchase by us. The management agreement with our Manager does not restrict the ability of its officers and employees from engaging in other business ventures of any nature, whether or not such ventures are competitive with our business. We may acquire assets from entities affiliated with our Manager, even where the assets were originated by such entities. Affiliates of our Manager may also provide services to entities in which we have invested.
Our executive officers and the officers and employees of our Manager are also officers and employees of Ellington, and we compete with other Ellington accounts for access to these individuals. We have not adopted a policy that expressly prohibits our trustees, officers, security holders, or affiliates from having a direct or indirect pecuniary interest in any asset to be acquired or disposed of by us or any of our subsidiaries or in any transaction to which we or any of our subsidiaries is a party or has an interest, nor do we have a policy that expressly prohibits any such persons from engaging for their own account in business activities of the types conducted by us. However, our code of business conduct and ethics contains a conflicts of interest policy that prohibits our trustees, officers, and employees, as well as employees of our Manager who provide services to us, from engaging in any transaction that involves an actual or apparent conflict of interest with us, absent approval by the Board of Trustees or except as expressly set forth above or as provided in the management agreement between us and our Manager. In addition, nothing in the management agreement binds or restricts our Manager or any of its affiliates, officers, or employees from buying, selling, or trading any securities or commodities for their own accounts or for the accounts of others for whom our Manager or any of its affiliates, officers, or employees may be acting.
12
Competition
In acquiring our assets, we compete with other mortgage REITs, specialty finance companies, savings and loan associations, banks, mortgage bankers, insurance companies, mutual funds, institutional investors, investment banking firms, financial institutions, governmental bodies, and other entities. Many of our competitors are significantly larger than us, have greater access to capital and other resources, and may have other advantages over us. Some competitors may have a lower cost of funds and access to funding sources that may not be available to us, such as funding from the government. Additionally, many of our competitors are not subject to REIT tax compliance or required to maintain an exclusion from the Investment Company Act. Our competitors may include other investment vehicles managed by Ellington or its affiliates, including Ellington Financial LLC.Inc. In addition to existing companies, other companies may be organized for similar purposes in the future, including companies focused on purchasing mortgage assets. A proliferation of such companies may increase the competition for equity capital and thereby adversely affect the market price of our common shares. An increase in the competition for sources of funding could adversely affect the availability and cost of financing, and thereby adversely affect the market price of our common shares. In addition, some of our competitors may have higher risk tolerances or different risk assessments, which could allow them to consider a wider variety of assets, or pay higher prices, than we can.
In the face of this competition, we believe that our access to our Manager's and Ellington's professionals and their industry expertise may provide us with a competitive advantage, including helping us to identify appropriate assets for acquisition and the appropriate prices to pay for such assets, and thereby to compete more effectively for attractive asset acquisition opportunities. However, we may not be able to achieve our business goals or expectations as a result of the competitive risks that we face.
Operating and Regulatory Structure
Tax Requirements
We have elected to be taxed as a REIT under the Internal Revenue Code of 1986, as amended, or "the Code,Code." and have complied, and intend to continue to comply, with the provisions of the Code with respect thereto. Accordingly,Provided that we domaintain our qualification as a REIT, we generally will not expect to be subject to U.S. federal income tax on our REIT taxable income that is currently distributed to our shareholders. REITs are subject to a number of organizational and operational requirements, including a requirement that they currently distribute at least 90% of their annual REIT taxable income, determined excluding any net capital gains and without regard to the deduction for dividends paid. We cannot assure you that we will be able to comply with such requirements. Failure to qualify as a REIT in any taxable year would cause us to be subject to U.S. federal income tax (and any applicable state and local taxes) on our taxable income at regular corporate rates. Even if we qualify for taxation as a REIT, we may be subject to certain federal, state, local, and non-U.S. taxes on our income. For example, if we form a domestic TRS, the income generated by that subsidiary willwould be subject to U.S. federal, state, and local income tax. Any taxes paid by a TRS will reduce the cash available for distribution to our shareholders.
Investment Company Act Exclusion
Both we and our Operating Partnership are organized as holding companies and conduct our businesses primarily through wholly-owned subsidiaries of our Operating Partnership in a manner such that neither we nor our subsidiaries are subject to
registration under the Investment Company Act. Under Section 3(a)(1) of the Investment Company Act, a company is deemed to be an "investment company" if:
•it is, or holds itself out as being, engaged primarily, or proposes to engage primarily, in the business of investing, reinvesting, or trading in securities (Section 3(a)(1)(A)); or
•it is engaged or proposes to engage in the business of investing, reinvesting, owning, holding, or trading in securities and does own or proposes to acquire "investment securities" having a value exceeding 40% of the value of its total assets (excluding U.S. government securities and cash) on an unconsolidated basis, or "the 40% Test" (Section 3(a)(1)(C)). "Investment securities" excludes U.S. government securities and securities of majority-owned subsidiaries that are not themselves investment companies and are not relying on the exception from the definition of investment company for private funds under Section 3(c)(1) or Section 3(c)(7) of the Investment Company Act.
We believe that we and our Operating Partnership will not be considered investment companies under Section 3(a)(1)(A) of the Investment Company Act because we and our Operating Partnership do not engage primarily or hold ourselves out as being engaged primarily in the business of investing, reinvesting, or trading in securities. Rather, through wholly-owned or majority-owned subsidiaries, we and our Operating Partnership are primarily engaged in the non-investment company businesses of these subsidiaries. In addition, we conduct our operations so that both we and our Operating Partnership satisfy the 40% Test.
Our Operating Partnership's direct and indirect subsidiaries, through which we operate our business, rely upon certain exclusions from the definition of investment company under the Investment Company Act including, in the case of our
13
Operating Partnership's wholly-owned subsidiary, EARN Mortgage LLC, Section 3(c)(5)(C) of the Investment Company Act. Section 3(c)(5)(C), as interpreted by the staff of the SEC, requires an entity to invest at least 55% of its assets in "mortgages and other liens on and interests in real estate," which we refer to as "qualifying real estate interests," and at least 80% of its assets in qualifying real estate interests plus "real estate-related assets." In satisfying the 55% requirement, the entity may treat agency securities issued with respect to an underlying pool of mortgage loans in which it holds all of the certificates issued by the pool as qualifying real estate interests. The CMOs we acquire will not be treated as qualifying real estate interests for purposes of the 55% requirement.
We also have formed, and may in the future form, certain other wholly-owned or majority-owned subsidiaries that will invest in CMOs and, subject to our investment guidelines, other real estate-related assets. These subsidiaries will rely upon the exclusion from the definition of investment company under the Investment Company Act pursuant to Section 3(c)(1) or 3(c)(7) of the Investment Company Act. Investments in subsidiaries that rely on the exclusions from the definition of investment company under 3(c)(1) or 3(c)(7) of the Investment Company Act are considered investment securities for the purposes of the 40% Test. Therefore, our Operating Partnership's investments in its 3(c)(7) subsidiaries and its other investment securities cannot exceed 40% of the value of our Operating Partnership's total assets (excluding U.S. government securities and cash) on an unconsolidated basis.
We monitor our compliance with the 40% Test and the holdings of our subsidiaries to ensure that each of our subsidiaries is in compliance with an applicable exemption or exclusion from registration as an investment company under the Investment Company Act.
On August 31, 2011, the SEC published a concept release entitled "Companies Engaged in the Business of Acquiring Mortgages and Mortgage Related Instruments" (Investment Company Act Rel. No. 29778). This release notes that the SEC is reviewing the 3(c)(5)(C) exclusion relied upon by companies similar to us that invest in mortgage loans and mortgage-backed securities. There can be no assurance that the laws and regulations governing the Investment Company Act status of companies similar to ours, or the guidance from the Division of Investment Management of the SEC regarding the treatment of assets as qualifying real estate assets or real estate-related assets, will not change in a manner that adversely affects our operations as a result of this review. To the extent that the SEC staff provides more specific guidance regarding any of the matters bearing upon our exclusion from the need to register under the Investment Company Act, we may be required to adjust our strategy accordingly. Any additional guidance from the SEC staff could provide additional flexibility to us, or it could further inhibit our ability to pursue the strategies that we have chosen. Furthermore, although we monitor the assets of EARN Mortgage LLC regularly, there can be no assurance that EARN Mortgage LLC will be able to maintain this exclusion from registration. In that case, our investment in EARN Mortgage LLC would be classified as an investment security, and we might not be able to maintain our overall exclusion from registering as an investment company under the Investment Company Act.
The loss of our exclusion from registration pursuant to the Investment Company Act could require us to restructure our operations, sell certain of our assets, or abstain from the purchase of certain assets, which could have an adverse effect on our financial condition and results of operations. See "—Risk"Risk Factors—Risks Related to Our Organization and Structure—Maintenance of our exclusion from registration as an investment company under the Investment Company Act imposes significant limitations on our operations."
If we were required to register as an investment company under the Investment Company Act, we would be subject to the restrictions imposed by the Investment Company Act, which would require us to make material changes to our strategy.
Investment Advisers Act of 1940
Both Ellington and our Manager are registered as investment advisers under the Advisers Act and are subject to the regulatory oversight of the Division of Investment Management of the SEC.
We currently do not have any employees. All of our executive officers, and our partially dedicated personnel, which include our Chief Financial Officer, Treasurer, controllers,Chief Operating Officer, controller, accounting staff, in-house legal counsel, investor relations professional, and internal audit staff, are employees of Ellington or one or more of its affiliates. See "—Management Agreement" above.
Additional Information
A copy of this Annual Report on Form 10-K, as well as our Quarterly Reports on Form 10-Q, Current Reports on Form 8-K and any amendments to such reports filed or furnished pursuant to Section 13(a) or 15(d) of the Exchange Act are available, free of charge, on our internet website at www.earnreit.com. All of these reports are made available on our internet website as soon as reasonably practicable after they are electronically filed with or furnished to the SEC. Our Corporate Governance Guidelines and Code of Business Conduct and Ethics and the charters of the Audit, Compensation and Nominating and Corporate Governance Committees of our Board of Trustees are also available at www.earnreit.com and are available in print to
14
any shareholder upon request in writing to Ellington Residential Mortgage REIT, c/o Investor Relations, 53 Forest Avenue, Old Greenwich, CT 06870. The information on our website is not, and shall not be deemed to be, a part of this report or incorporated into any other filing we make with the SEC.
Item 1A. Risk Factors
Summary of Risk Factors
Risks Related To Our Business
•The federal conservatorship of Fannie Mae and Freddie Mac and related efforts, along with any changes in laws and regulations affecting the relationship between Fannie Mae, Freddie Mac, and Ginnie Mae and the U.S. Government, could materially adversely affect our business, financial condition and results of operations, and our ability to pay dividends to our shareholders.
•Certain actions by the Federal Reserve could materially adversely affect our business, financial condition and results of operations, and our ability to pay dividends to our shareholders.
•Prepayment rates can change, adversely affecting the performance of our assets.
•Interest rate mismatches between our assets and our borrowings may reduce our income during periods of changing interest rates, and increases in interest rates could adversely affect the value of our assets.
•Interest rate caps on ARMs and hybrid ARMs, including those that back our RMBS, may reduce our net interest margin during periods of rising or high interest rates.
•Mortgage loan modification programs and future legislative action may adversely affect the value of, and the returns on, our targeted assets.
•Difficult conditions in the mortgage and residential real estate markets as well as general market concerns may adversely affect the value of the assets in which we invest.
•Our assets include subordinated and lower-rated securities that generally have greater risks of loss than senior and higher-rated securities.
•Less stringent underwriting guidelines and the resultant potential for delinquencies or defaults on certain mortgage loans could lead to losses on many of the non-Agency RMBS we hold, as well as other mortgage-related investments that we currently hold and/or may hold in the future.
•The principal and interest payments on our non-Agency RMBS and CRTs are not guaranteed by any entity, including any government entity or GSE, and therefore are subject to increased risks, including credit risk.
•Non-government guaranteed residential mortgage loans, including subprime, non-performing, and sub-performing residential mortgage loans, are subject to increased risks.
•To the extent that due diligence is conducted on potential assets, such due diligence may not reveal all of the risks associated with such assets and may not reveal other weaknesses in such assets, which could lead to losses.
•We rely on mortgage servicers to service effectively, including loss mitigation efforts, and we also may engage in our own loss mitigation efforts with respect to whole mortgage loans and loan pools that we may purchase and such loss mitigation efforts may be unsuccessful or not cost effective.
•We may be affected by deficiencies in foreclosure practices of third parties, as well as related delays in the foreclosure process.
•Sellers of the mortgage loans that underlie the non-Agency RMBS in which we invest may be unable to repurchase defective mortgage loans, which could have a material adverse effect on the value of the loans held by the trust that issued the RMBS and could cause shortfalls in the payments due on the RMBS.
•If we acquire and subsequently resell any whole mortgage loans, we may be required to repurchase such loans or indemnify purchasers if we breach representations and warranties.
•We could be subject to liability for potential violations of various federal, state and local laws and regulations, including predatory lending laws, which could materially adversely affect our business, financial condition and results of operations, and our ability to pay dividends to our shareholders.
•Our real estate-related assets are subject to the risks associated with real property.
•We may be exposed to environmental liabilities with respect to properties in which we have an interest.
•We rely on analytical models and other data to analyze potential asset acquisition and disposition opportunities and to manage our portfolio. Such models and other data may be incorrect, misleading or incomplete, which could cause us to purchase assets that do not meet our expectations or to make asset management decisions that are not in line with our strategy.
•Valuations of some of our assets are inherently uncertain, may be based on estimates, may fluctuate over short periods of time, and may differ from the values that would have been used if a ready market for these assets existed.
•The lack of liquidity in our assets may materially adversely affect our business, financial condition and results of operations, and our ability to pay dividends to our shareholders.
•We are highly dependent on Ellington's information systems and those of third-party service providers, including mortgage servicers, and system failures could significantly disrupt our business, which could materially adversely affect our business, financial condition and results of operations, and our ability to pay dividends to our shareholders.
•Our access to financing sources may not be available on favorable terms, may be limited or completely shut off, and our lenders and derivative counterparties may require us to post additional collateral. These circumstances may materially adversely affect our business, financial condition and results of operations, and our ability to pay dividends to our shareholders.
•Increases in interest rates could adversely affect the value of our assets and cause our interest expense to increase, and increase the risk of default on our assets, which could result in reduced earnings or losses and negatively affect our profitability as well as the cash available for distribution to shareholders.
•We use leverage in executing our business strategy, which may adversely affect the return on our assets and may reduce cash available for distribution to our shareholders, as well as increase losses when economic conditions are unfavorable.
•Hedging against interest rate changes and other risks could materially adversely affect our business, financial condition and results of operations and our ability to pay dividends to our shareholders.
•Hedging instruments and other derivatives, including some credit default swaps, may not, in many cases, be traded on exchanges, or may not be guaranteed or regulated by any U.S. or foreign governmental authority and involve risks and costs that could result in material losses.
•Our use of derivatives may expose us to counterparty risk.
16
•We may change our investment strategy, investment guidelines, hedging strategy, and asset allocation, operational, and management policies without notice or shareholder consent, which could materially adversely affect our business, financial condition and results of operations, and our ability to pay dividends to our shareholders. In addition, our declaration of trust provides that our Board of Trustees may authorize us to revoke or otherwise terminate our REIT election without the approval of our shareholders.
•An increase in interest rates may cause a decrease in the issuance volumes of certain of our targeted assets, which could adversely affect our ability to acquire targeted assets that satisfy our investment objectives and to generate income and pay dividends.
•Lack of diversification in the number of assets we acquire would increase our dependence on relatively few individual assets.
•Investments in second-lien mortgage loans could subject us to increased risk of losses.
Risks Related to our CLO Investments
•Our investments in corporate CLOs involve certain risks.
•The underlying assets held by the CLOs in which we invest generally have lower credit ratings and are subject to significant credit risk.The underlying assets held by the CLOs in which we invest generally have lower credit ratings and are subject to significant credit risk.
•The underlying assets held by the CLOs in which we invest generally have lower credit ratings and are subject to significant credit risk.
•Our corporate CLO investments may include “middle market” and/or “covenant-lite” loans.
•The CLOs in which we invest are subject to risks associated with loan participations.
•Our investments in the primary corporate CLO market involve certain additional risks.
•We and our investments are subject to prepayment and reinvestment risk.
•Our portfolio of corporate CLO investments may lack diversification, which may subject us to a risk of significant loss if one or more of these corporate CLOs experience a high level of defaults on collateral.
•Failure by a CLO to satisfy certain tests, including as a result of loan defaults and/or negative loan ratings migration, may place pressure on the performance of our investments in such CLO.
•Our CLO debt investments are subject to credit rating changes.
•We are dependent on the collateral managers of the corporate CLOs in which we invest, and those corporate CLOs are generally not registered under the Investment Company Act.
•Our CLO investments often have limited liquidity.
•We and our corporate CLO investments are subject to risks associated with non-U.S. investing, including in some cases foreign currency risk.
•Our manager has significant latitude in determining the types of assets we acquire, and there is no specific prohibition in our investment strategy, investment guidelines and/or the REIT qualification requirements against investing in corporate CLOs or other corporate investments.
Risks Related to our Relationship with our Manager and Ellington
•We are dependent on our Manager and certain key personnel of Ellington that are provided to us through our Manager and may not find a suitable replacement if our Manager terminates the management agreement or such key personnel are no longer available to us.
•There are conflicts of interest in our relationships with our Manager and Ellington, which could result in decisions that are not in the best interests of our shareholders.
Risks Related to Our Common Shares
•Our shareholders may not receive dividends or dividends may not grow over time.
•An increase in interest rates may have an adverse effect on the market price of our common shares and our ability to pay dividends to our shareholders.
•Investing in our common shares involves a high degree of risk.
Risks Related to Our Organization and Structure
•Maintenance of our exclusion from registration as an investment company under the Investment Company Act imposes significant limitations on our operations. If we were required to register as an investment company under the Investment Company Act, we would be subject to the restrictions imposed by the Investment Company Act, which would require us to make material changes to our strategy.
•The ownership limits in our declaration of trust may discourage a takeover or business combination that may have benefited our shareholders.
•Our shareholders' ability to control our operations is severely limited.
•Certain provisions of Maryland law could inhibit a change in our control.
•Our authorized but unissued common and preferred shares may prevent a change in our control.
•Our rights and the rights of our shareholders to take action against our trustees and officers or against our Manager or Ellington are limited, which could limit your recourse in the event actions are taken that are not in your best interests.
U.S. Federal Income Tax Risks
•Your investment has various U.S. federal, state, and local income tax risks.
•Our failure to qualify as a REIT would subject us to U.S. federal, state and local income taxes, which could adversely affect the value of our common shares and could substantially reduce the cash available for distribution to our shareholders.
•Complying with REIT requirements may cause us to forego or liquidate otherwise attractive investments.
•Complying with REIT requirements may limit our ability to hedge effectively.
•CLOs in which we invest could become subject to U.S. federal income tax or withholding requirements.
The above list is not exhaustive, and we face additional challenges and risks. Please carefully consider all of the information in this Report, including the matters set forth below in this Item 1A.
17
If any of the following risks occurs, our business, financial condition or results of operations could be materially and adversely affected. The risks and uncertainties described below are not the only ones we face. Additional risks and uncertainties not presently known to us, or not presently deemed material by us, may also impair our operations and performance. In connection with the forward-looking statements that appear in our periodic reports on Form 10-Q and Form 10-K, our Current Reports on Form 8-K, our press releases and our other written and oral communications, you should also carefully review the cautionary statements referred to in such reports and other communications referred to under "Special Note Regarding Forward-Looking Statements."
Risks Related To Our Business
The federal conservatorship of Fannie Mae and Freddie Mac and related efforts, along with any changes in laws and regulations affecting the relationship between Fannie Mae, Freddie Mac, and Ginnie Mae and the U.S. Government, maycould materially adversely affect our business, financial condition and results of operations, and our ability to pay dividends to our shareholders.
The payments we receive on our Agency RMBS depend upon a steady stream of payments on the underlying mortgages and such payments are guaranteed by Fannie Mae, Freddie Mac, or the Government National Mortgage Association, within the U.S. Department of Housing and Urban Development, or "Ginnie Mae." Fannie Mae and Freddie Mac are government-sponsored enterprises, or "GSEs," but their guarantees are not backed by the full faith and credit of the United States. Ginnie Mae, which guarantees MBS backed by federally insured or guaranteed loans primarily consisting of loans insured by the Federal Housing Administration, or "FHA," or guaranteed by the Department of Veterans Affairs, or "VA," is part of athe U.S. Government agencyDepartment of Housing and Urban Development and its guarantees are backed by the full faith and credit of the United States. Finally, cash flows from any MSR investments we may make depend on the performance of the underlying loans.
In September 2008, in response to the deteriorating financial condition of Fannie Mae and Freddie Mac, the U.S. Government placed Fannie Mae and Freddie Mac into the conservatorship of the Federal Housing Finance Agency, or "FHFA," their federal regulator, pursuant to its powers under The Federal Housing Finance Regulatory Reform Act of 2008, a part of the Housing and Economic Recovery Act of 2008. Under this conservatorship, Fannie Mae and Freddie Mac are required to reduce the amount of mortgage loans they own or for which they provide guarantees on Agency RMBS. In addition to the FHFA becoming the conservator of Fannie Mae and Freddie Mac, the U.S. Treasury entered into Preferred Stock Purchase Agreements ("PSPAs") with the FHFA and have taken various actions intended to provide Fannie Mae and Freddie Mac with additional liquidity in an effort to ensure their financial stability.
Shortly after Fannie Mae and Freddie Mac were placed in federal conservatorship, the Secretary of the U.S. Treasury noted that the guarantee structure of Fannie Mae and Freddie Mac required examination and that changes in the structures of
the entities were necessary to reduce risk to the financial system. The future roles of Fannie Mae and Freddie Mac could be significantly reduced, and the nature of their guarantees could be considerably limited relative to historical measurements or even eliminated. The substantial financial assistance provided by the U.S. Government to Fannie Mae and Freddie Mac, especially in the course of their being placed into conservatorship and thereafter, together with the substantial financial assistance provided by the U.S. Government to the mortgage-related operations of other GSEs and government agencies, such as the FHA, VA, and Ginnie Mae, has stirred debate among many federal policymakers over the continued role of the U.S. Government in providing such financial support for the mortgage-related GSEs in particular, and for the mortgage and housing markets in general. To date, no
No definitive proposals or legislation hashave been released or enacted with respect to a possibleending the conservatorship, unwinding the GSEs, or materially reducing the roles of the GSEs or a material reduction in their roles in the U.S. mortgage market, and it is not possible at this time to predict the scope and nature of the actions that the U.S. Government will ultimately take with respect to these GSEs.
Fannie Mae, Freddie Mac, and Ginnie Mae could each be dissolved, and the U.S. Government could determine to stop providing liquidity support of any kind to the mortgage market. If Fannie Mae, Freddie Mac, or Ginnie Mae were eliminated, or their structures were to change radically, or if the U.S. Government significantly reduced its support for any or all of them, the value of our currently held Agency RMBS could drop significantly, and we may be unable or significantly limited in our ability to acquire Agency RMBS, which would drastically reduce the amount and type of Agency RMBS available for purchase which, in turn, could materially adversely affect our ability to maintain our exclusion from registration as an investment company under the Investment Company Act. Act and our ability to maintain our qualification as a REIT.
Moreover, any changes to the nature of the guarantees provided by, or laws affecting, Fannie Mae, Freddie Mac, and Ginnie Mae could materially adversely affect the credit quality of the guarantees, could increase the risk of loss on purchases of Agency RMBS issued by these GSEs (or MSRs with underlying loans guaranteed by these GSEs), and could have broad adverse market implications for the Agency RMBS they currently guarantee. Any action that affects the credit quality of the guarantees provided by Fannie Mae, Freddie Mac, and Ginnie Mae could materially adversely affect the value of our Agency
18
RMBS. In addition, any market uncertainty that arises from such proposed changes could have a similar impact on us and our Agency RMBS.
In addition, we rely on our Agency RMBS as collateral for our financings under the reverse repos that we enter into. Any decline in their value, or perceived market uncertainty about their value, would make it more difficult for us to obtain financing on our Agency RMBS on acceptable terms or at all, or to maintain compliance with the terms of any financing transactions
Certain actions by the U.S. Federal Reserve could materially adversely affect our business, financial condition and results of operations, and our ability to pay dividends to our shareholders.
In September 2012,response to the global financial crisis of 2008-2009 and again in response to the economic effects of the COVID-19 pandemic in 2020, the Federal Reserve announced a third roundand completed several rounds of quantitative easing, or "QE3," which was an open-ended programare programs designed to expand the Federal Reserve's holdings of long-term securities by purchasing at the time, an additional $40 billion ofU.S. Treasury securities and/or Agency RMBS, per month until key economic indicators show sufficient signs of improvement.
In November 2021, the Federal Reserve began to withdraw some of this quantitative easing support by commencing the tapering of its asset purchases of U.S. Treasury securities and Agency RMBS. In 2022, the Federal Reserve increased the pace of its balance sheet runoff, and also began a series of interest rate increases may occurhikes in response to historically high inflation. As of January 31, 2024, the near future.target range for the federal funds rate was 5.25%—5.50%. This quantitative tightening has caused, and could continue to cause, elevated market volatility, widening yield spreads, and an inversion of the U.S. Treasury yield curve. These and other actions by the Federal Reserve have adversely affected, and could continue to adversely affect, the economy as a whole, which in turn could materially adversely affect our business, financial condition and results of operations, and our ability to pay dividends to our shareholders. See also "—Increases in interest rates could adversely affect the value of our assets and cause our interest expense to increase, and increase the risk of default on our assets, which could result in reduced earnings or losses and negatively affect our profitability as well as the cash available for distribution to shareholders." Shouldshareholders" for the U.S. economy begin to deteriorate, the Federal Reserve could decide to reinstate its asset purchase program or institute other measures designed to reduce interest rates. These measures could lead to a flattening in the yield curve, increased prepayment rates (resulting from lower long-termimpact of higher interest rates including mortgage rates), and a narrowing ofon our net interest margin.business.
Prepayment rates can change, adversely affecting the performance of our assets.
The frequency at which prepayments (including both voluntary prepayments by borrowers and liquidations due to defaults and foreclosures) occur on mortgage loans underlying our RMBS or MSRs, is affected by a variety of factors, including the prevailing level of interest rates as well as economic, demographic, tax, social, legal, and other factors. Generally, borrowers tend to prepay their mortgages when prevailing mortgage rates fall below the interest rates on their mortgage loans. When borrowers prepay their mortgage loans at rates that are faster or slower than expected, it results in prepayments that are faster or slower than expected on the related RMBS.RMBS or MSRs. These faster or slower than expected payments may adversely affect our profitability.
We may purchase securities or loans that have a higher interest rate than the then-prevailing market interest rate. In exchange for this higher interest rate, we may pay a premium to par value to acquire the security or loan. In accordance with U.S. GAAP, we amortize this premium as an expense over the expected term of the security or loan based on our prepayment assumptions. If a security or loan is prepaid in whole or in part at a faster than expected rate, however, we must expense all or a part of the remaining unamortized portion of the premium that was paid at the time of the purchase, which will adversely affect our profitability.
We also may purchase securities or loans that have a lower interest rate than the then-prevailing market interest rate. In exchange for this lower interest rate, we may pay a discount to par value to acquire the security or loan. We accrete this discount as income over the expected term of the security or loan based on our prepayment assumptions. If a security or loan is prepaid at a slower than expected rate, however, we must accrete the remaining portion of the discount at a slower than expected rate. This will extend the expected life of our investment portfolio and result in a lower than expected yield on securities and loans purchased at a discount to par.
Prepayment rates generally increase when interest rates fall and decrease when interest rates rise. Since many RMBS, especially fixed rate RMBS, will be discount securities when interest rates are high, and will be premium securities when interest rates are low, these RMBS may be adversely affected by changes in prepayments in any interest rate environment. Prepayment rates are also affected by factors not directly tied to interest rates or home values, and these factors are difficult to predict. Prepayments can also occur when borrowers sell their properties, or when borrowers default on their mortgages and the
19
mortgages are prepaid from the proceeds of a foreclosure sale of the underlying property and/or from the proceeds of a mortgage insurance policy or other guarantee. Fannie Mae and Freddie Mac will generally, among other conditions, purchase mortgages that are 120 days or more delinquent from the Agency RMBS pools that they have issued when the cost of guaranteed payments to security holders, including advances of interest at the security coupon rate, exceeds the cost of holding the non-performing loans in their portfolios. Consequently, prepayment rates also may be affected by conditions in the housing and financial markets, which may result in increased delinquencies on mortgage loans. Prepayment rates can also be affected by actions of the GSEs and their cost of capital, general economic conditions, and the relative interest rates on fixed and adjustable rate loans. Additionally, changes in the GSEs' decisions as to when to repurchase delinquent loans can materially impact prepayment rates on Agency RMBS.
The adverse effects of prepayments may impact us in various ways. First, particular investments may experience outright losses, as in the case of IOs and IIOs in an environment of faster actual or anticipated prepayments. Second, particular investments may underperform relative to any hedges that our Manager may have constructed for these assets, resulting in a loss to us. In particular, prepayments (at par) may limit the potential upside of many RMBS to their principal or par amounts,
whereas their corresponding hedges often have the potential for unlimited loss. Furthermore, to the extent that faster prepayment rates are due to lower interest rates, the principal payments received from prepayments will tend to be reinvested in lower-yielding assets, which may reduce our income in the long run. Therefore, if actual
Prepayments also significantly affect the value of MSRs because an MSR entitles the holder to receive a monthly servicing fee equal to a percentage of the unpaid principal balance of the mortgage loans, as well as other cashflows, for so long as the underlying loans are outstanding. To the extent the underlying mortgage loan principal balances are prepaid or expected to be prepaid at a faster rate, the expected future cash flows from servicing would be lower and the value of the related MSR would decline. Actual prepayment rates differdiffering from anticipated prepayment rates could materially adversely affect our business, financial condition and results of operations, and our ability to pay dividends to our shareholders.
Interest rate mismatches between our assets and our borrowings may reduce our income during periods of changing interest rates, and increases in interest rates could adversely affect the value of our assets.
Some of our assets are fixed rate securities or have a fixed rate component (such as RMBS backed by hybrid ARMs). This means that the interest we earn on these assets will not vary over time based upon changes in a short-term interest rate index. Although the interest we earn on our RMBS backed by ARMs and many of our CLO investments generally will adjust for changing interest rates, such interest rate adjustments may not occur as quickly as the interest rate adjustments to any related borrowings, and such interest rate adjustments will generally be subject to interest rate caps, which potentially could cause such assets to acquire many of the characteristics of fixed rate securities during periods of rising or high interest rates. We generally fund our targeted assets with borrowings whose interest rates reset frequently, and as a result we generally have an interest rate mismatch between our assets and liabilities, which could cause our net interest margin (the spread between the average yield on our assets and our average borrowing costs) to compress, or even become negative. While our interest rate hedges are intended to mitigate a portion of this mismatch, the use of interest rate hedges also introduces the risk of other interest rate mismatches and exposures, as will the use of other financing techniques. Additionally, to the extent cash flows from RMBS we hold are reinvested in new RMBS, the spread between the yields of the new RMBS and available borrowing rates may also compress or become negative. If our net interest margin compresses or becomes negative, our business, cash flow, financial condition, results of operations, and ability to pay dividends to our shareholders could be materially adversely affected. In fact, in 2022 and parts of 2023, which saw periods of rising interest rates, we experienced compressed and in some cases negative net interest margin on many of our assets.
Fixed income assets, including many RMBS, typically decline in value if interest rates increase. If long-term rates were to increase significantly, not only would the market value of these assets be expected to decline, but these assets could lengthen in duration because borrowers would be less likely to prepay their mortgages.
Interest rates are highly sensitive to many factors, including governmental monetary and tax policies, domestic and international economic and political considerations, and other factors beyond our control. Between March 2020 and March 2022, the U.S. Federal Reserve, or the "Federal Reserve," maintained the target range for the federal funds rate at 0.00%—0.25%. Beginning in March 2022, however, the Federal Reserve began a series of interest rate hikes in response to historically high inflation, and as of January 31, 2024, the target range for the federal funds rate was 5.25%—5.50%. Moreover, concerns over the United States' debt ceiling and budget-deficit have increased the possibility of downgrades by rating agencies to the U.S. government's credit rating, which could cause interest rates and borrowing costs to rise further. The future path of interest rates is highly uncertain.
While we opportunistically hedge our exposure to changes in interest rates, such hedging may be limited by the tax rules governing REITs, and we can provide no assurance that our hedges will be successful, or that we will be able to enter into or
20
maintain such hedges. As a result, interest rate fluctuations can cause significant losses, reductions in income, and can limit the cash available to pay dividends to our shareholders.
Interest rate caps on the ARMs and hybrid ARMs, including those that back our RMBS, may reduce our net interest margin during periods of rising or high interest rates.
ARMs and hybrid ARMs are typically subject to periodic and lifetime interest rate caps. Periodic interest rate caps limit the amount an interest rate can increase during any given period. Lifetime interest rate caps limit the amount an interest rate can increase through the maturity of the loan. Our borrowings typically are not subject to similar restrictions. Accordingly, in a period of rapidly increasing interest rates, our financing costs could increase without limitation while caps could limit the interest we earn on our RMBS backed by ARMs and hybrid ARMs. This problem is magnified for ARMs and hybrid ARMs that are not fully indexed because such periodicwe hold (or that back RMBS that we hold) expose us to interest rate caps prevent the coupon on the security from fully reaching the specified rate in one reset. Further, some ARMs and hybrid ARMs may be subject to periodic payment caps that result in a portion of the interest being deferred and added to the principal outstanding. As a result, we may receive less cash income on RMBS backed by ARMs and hybrid ARMs than necessary to pay interest on our related borrowings. mismatch risks. See "—Interest rate caps on RMBS backed by ARMsmismatches between our assets and hybrid ARMs couldour borrowings may reduce our net interest margin ifincome during periods of changing interest rates, were to increase beyond the level of the caps, whichand increases in interest rates could materially adversely affect the value of our business, financial condition and results of operations and our ability to pay dividends to our shareholders.assets."
Mortgage loan modification programs and future legislative action may adversely affect the value of, and the returns on, our targeted assets.
The U.S. Government, through the U.S. Treasury, FHA, and the Federal Deposit Insurance Corporation, or "FDIC," commenced implementation ofhas at various points in time, including in response to the COVID-19 pandemic, and may again in the future, implement programs designed to provide homeowners with assistance in avoiding mortgage loan foreclosures, including the Home Affordable Refinance Program, or "HARP," which allows borrowers who are current on their mortgage payments to refinance and reduce their monthly mortgage payments at loan-to-value ratios up to 125% without new mortgage insurance.foreclosures. The programs may involve, among other things, the modification of mortgage loans to reduce the principal amount of the loans or the rate of interest payable on the loans, or to extend the payment terms of the loans.
Loan modification and refinance programs may adversely affect the performance of Agency and non-Agency RMBS. In the case of non-Agency RMBS and MSRs, a significant number of loan modifications with respect to a given security, including those related to principal forgiveness and coupon reduction, could negatively impact the realized yields and cash flows on such security. Similarly, principal forgiveness and/or coupon reduction could negatively impact the performance of any residential mortgage loans, RMBS, or MSRs. In addition, it is also likely that loan modifications would result in increased prepayments on some RMBS. See above "—Prepayment rates can change, adversely affecting the performance of our assets," for information relating to the impact of prepayments on our business.
The U.S. Congress and various state and local legislatures are considering, and in the future may consider,pass mortgage-related legislation that would affect our business, including legislation that would permit limited assignee liability for certain violations in the mortgage loan origination process, and legislation that would allow judicial modification of loan principal in the event of personal bankruptcy.bankruptcy, or legislation relating to the handling of escrow accounts. We cannot predict whether or in what form Congress or the various state and local legislatures may enact legislation affecting our business or whether any such legislation will require us to change our practices or make changes in our portfolio in the future. These changes, if required, could materially adversely affect our business, results of operations and financial condition, and our ability to pay dividends to our shareholders, particularly if we make such changes in response to new or amended laws, regulations or ordinances in any state where we acquire a significant portion of our mortgage loans, or if such changes result in us being held responsible for any violations in the mortgage loan origination process.
The existing loan modification programs, together with future legislative or regulatory actions, including possible amendments to the bankruptcy laws, which result in the modification of outstanding residential mortgage loans and/or changes in the requirements necessary to qualify for refinancing mortgage loans with Fannie Mae, Freddie Mac, or Ginnie Mae, may adversely affect the value of, and the returns on, our assets, which could materially adversely affect our business, financial condition and results of operations, and our ability to pay dividends to our shareholders.
Difficult conditions in the mortgage and residential real estate markets as well as general market concerns may adversely affect the value of the assets in which we invest and such conditions may persist for the foreseeable future.invest.
Our business is materially affected by conditions in the residential mortgage market, the residential real estate market, the financial markets, and the economy, including inflation, interest rates, energy costs, unemployment, geopolitical issues, concerns over the creditworthiness of governments worldwide and the stability of the global banking system. In particular, the residential
mortgage market in the U.S. has experienced a variety of difficulties and challenging economic conditions in the past, including defaults, credit losses, and liquidity concerns. Certain commercial banks, investment banks, insurance companies, loan origination companies and mortgage-related investment vehicles incurred extensive losses from exposure to the residential mortgage market as a result of these difficulties and conditions. These factors, along with the abrupt failure of more than one regional bank in the U.S., have impacted, and may in the future impact, investor perception of the risks associated with RMBS, other real estate-related securities and various other asset classes in which we may invest. As a result, values for RMBS, other real estate-related securities and various other asset classes in which we may invest have experienced, and may in the future experience, significant volatility. Any deterioration of the mortgage market and investor perception of the risks associated with RMBS, residential mortgage loans, other real estate-related securities, and various other assets that we
21
acquire could materially adversely affect our business, financial condition and results of operations, and our ability to pay dividends to our shareholders.
Our non-Agency RMBS assets include subordinated and lower-rated securities that generally have greater risks of loss than senior and higher-rated securities.
Certain non-Agency RMBSmortgage-related securities that we acquire, including certain non-Agency MBS, CRTs, and CMBS, are deemed by rating agencies to have substantial vulnerability to default in payment of interest and/or principal. Other securities that we acquire have the lowest quality ratings or are unrated. Many securities that we acquire are subordinated in cash flow priority to other more "senior" securities of the same securitization. The exposure to defaults on the underlying mortgages is severely magnified in subordinated securities. Certain subordinated securities ("first loss securities") absorb all losses from default before any other class of securities is at risk. Such securities therefore are considered to be highly speculative investments. Also,In the case of CRTs and subordinated RMBS and CMBS, the risk of defaults on the underlying mortgages and/or declining real estate values in particular, is amplified, in subordinated RMBS, as are the risks associated with possible changes in the market's perception of theany entity issuing or guaranteeing them,such securities, or by changes in government regulations and tax policies. In the case of CLOs, the risk of economic recession and declining creditworthiness of corporate borrowers is amplified. Accordingly, the subordinated and lower-rated (or unrated) securities in which we invest may experience significant price and performance volatility relative to more senior or higher-rated securities, and they are subject to greater risk of loss than more senior or higher-rated securities which, if realized, could materially adversely affect our business, financial condition and results of operations, and our ability to pay dividends to our shareholders.
Less stringent underwriting guidelines and the resultant potential for delinquencies or defaults on certain mortgage loans could lead to losses on many of the non-Agency RMBS we hold.hold, as well as other mortgage-related investments that we currently hold and/or may hold in the future.
The principal and interest payments on our non-Agency RMBS and CRTs are not guaranteed by any entity, including any government entity or GSE, and therefore are subject to increased risks, including credit risk.
Our portfolio may includeincludes securities, such as non-Agency RMBS, which are backed by residential mortgage loans that do not conform to the Fannie Mae or Freddie Mac underwriting guidelines, including subprime, manufactured housing, Alt-A, and prime jumbo mortgage loans. Consequently, the principal and interest on non-Agency RMBS, unlike those on Agency RMBS, are not guaranteed by GSEs such as Fannie Mae and Freddie Mac or, in the case of Ginnie Mae, the U.S. Government.
In the event of defaults under mortgage loans backing any of our non-Agency RMBS or CRTs, we will bear a risk of loss of principal to the extent of any deficiency between the value of the collateral and the principal and accrued interest of the mortgage loan. The recently enacted law informally known as the Tax Cuts and Jobs Act, or “TCJA,” reduced the mortgage interest deduction and the state and local income and property tax deduction. These changes could adversely impact housing prices in markets to which we have exposure.
22
Additionally, in the event of the bankruptcy of a mortgage loan borrower, the mortgage loan to such borrower will be deemed to be secured only to the extent of the value of the underlying collateral at the time of bankruptcy (as determined by the bankruptcy court), and the lien securing the mortgage loan will be subject to the avoidance powers of the bankruptcy trustee or debtor-in-possession to the extent the lien is unenforceable under state law. Foreclosure of a mortgage loan can be an expensive and lengthy process which could have a substantial negative effect on our anticipated return on the foreclosed mortgage loan. In many jurisdictions, legislation has been enacted that has the effect of making the foreclosure process more difficult, lengthier, and more expensive, and additional such legislation may be enacted in the future. If borrowers default on the mortgage loans backing our non-Agency RMBS or CRTs and we are unable to recover any resulting loss through the foreclosure process, it could materially adversely affect our business, financial condition and results of operations, and our ability to pay dividends to our shareholders, could be materially adversely affected.shareholders.
Non-government guaranteed residential mortgage loans, including subprime, non-performing, and sub-performing residential mortgage loans, are subject to increased risks.
We may acquire and manage residential mortgage loans. ResidentialNon-government guaranteed residential mortgage loans, including subprime, non-performing, and sub-performing mortgage loans, are subject to increased risk of loss. Unlike Agency RMBS, residential mortgage loans generally are not guaranteed by the U.S. Government or any GSE, though in some cases they may benefit from private mortgage insurance. Additionally, by directly acquiring residential mortgage loans, we do not receive the structural credit enhancements that benefit senior tranches of RMBS. A residential mortgage loan is directly exposed to losses resulting from default. Therefore, the value of the underlying property, the creditworthiness and financial position of the borrower, and the priority and enforceability of the lien will significantly impact the value of such mortgage loan. In the event of a foreclosure, we may assume direct ownership of the underlying real estate. The liquidation proceeds upon sale of such real estate may not be sufficient to recover our cost basis in the loan, and any costs or delays involved in the foreclosure or liquidation process may increase losses.
Residential mortgage loans are also subject to property damage caused by hazards, such as earthquakes or environmental hazards, not covered by standard property insurance policies or "special hazard risk," and to reduction in a borrower's mortgage debt by a bankruptcy court, or "bankruptcy risk." In addition, claims may be assessed against us on account of our position as a mortgage holder or property owner, including assignee liability, environmental hazards, and other liabilities. We could also be responsible for property taxes. In some cases, these liabilities may be "recourse liabilities" or may otherwise lead to losses in excess of the purchase price of the related mortgage or property.
To the extent that due diligence is conducted on potential assets, such due diligence may not reveal all of the risks associated with such assets and may not reveal other weaknesses in such assets, which could lead to losses.
Before making an investment, our Manager may decide to conduct (either directly or using third parties) certain due diligence.diligence on such potential investment. There can be no assurance that our Manager will conduct any specific level of due diligence, or that, among other things, our Manager's due diligence processes will uncover all relevant facts or that any purchase will be successful, which could result in losses on these assets, which in turn, could materially adversely affect our business, financial condition and results of operations, and our ability to pay dividends to our shareholders.
We rely on mortgage servicers for ourto service effectively, including loss mitigation efforts, and we also may engage in our own loss mitigation efforts with respect to whole mortgage loans and loan pools that we may purchase. Suchpurchase and such loss mitigation efforts may be unsuccessful or not cost effective.
We depend on a variety of services provided by third-party service providers related to our non-Agency RMBS and whole mortgage loans and loan pools we may acquire. We rely on the mortgage servicers who service the mortgage loans backing our non-Agency RMBS to, among other things, collect principal and interest payments on the underlying mortgages and perform loss mitigation services. Our mortgage servicers and other service providers to our non-Agency RMBS, such as trustees, bond
insurance providers and custodians, may not perform in a manner that promotes our interests. In addition, legislation that has been enacted or that may be enacted in order to reduce or prevent foreclosures through, among other things, loan modifications, may reduce the value of MSRs or mortgage loans backing our non-Agency RMBS, CRTs or whole mortgage loans that we may acquire. Mortgage servicers may be incentivized by the U.S. Government to pursue such loan modifications, as well as forbearance plans and other actions intended to prevent foreclosure, even if such loan modifications and other actions are not in the best interests of the beneficial owners of the mortgage loans. In addition to legislation that creates financial incentives for mortgage loan servicers to modify loans and take other actions that are intended to prevent foreclosures, legislation has also been adopted that creates a safe harbor from liability to creditors for servicers that undertake loan modifications and other actions that are intended to prevent foreclosures. Finally, legislationLegislation has been adopted that delays the initiation or completion of
23
foreclosure proceedings on specified types of residential mortgage loans or otherwise limitlimits the ability of mortgage servicers to take actions that may be essential to preserve the value of the mortgage loans underlying the mortgage servicing rights. Any such limitations are likely to cause delayed or reduced collections from mortgagors and generally increase servicing costs. As a result of these legislative actions, the mortgage loan servicers on which we rely may not perform in our best interests or up to our expectations. If our third-party service providers including mortgage servicers do not perform as expected, our business, financial condition and results of operations and our ability to pay dividends to our shareholders may be materially adversely affected.
In addition, to the extent that we own the MSR related to a mortgage loan, we could be ultimately liable for any servicing infractions by a subservicer, and in certain cases, infractions related to the origination of the mortgage loans. To the extent that we or a master servicer cannot recover any such losses from the originator or subservicer, we would suffer losses, which could materially adversely affect our business, financial condition and results of operations, and our ability to pay dividends to our shareholders. Any increases in servicing costs, including as a result of an increase in the difficulty of or the costs related to loss mitigation efforts, would lower our yield on the relevant assets and could materially adversely affect our business, financial condition and results of operations, and our ability to pay dividends to our shareholders.
Further, if we purchase pools of whole mortgage loans, we may engage in our own loss mitigation efforts over and above the efforts of the mortgage servicers, including more hands-on mortgage servicer oversight and management, borrower refinancing solicitations, as well as other efforts. Our loss mitigation efforts may be unsuccessful in limiting delinquencies, defaults and losses, or may not be cost effective, which may materially adversely affect our business, financial condition and results of operations and our ability to pay dividends to our shareholders. Furthermore, our ability to accomplish such loss mitigation may be limited by the tax rules governing REITs.
We may be affected by deficiencies in foreclosure practices of third parties, as well as related delays in the foreclosure process.
Sellers of the mortgage loans that underlie the non-Agency RMBS in which we invest may be unable to repurchase defective mortgage loans, which could have a material adverse effect on the value of the loans held by the trust that issued the RMBS and could cause shortfalls in the payments due on the RMBS.
Sellers of mortgage loans to the trusts that issued the non-Agency RMBS in which we invest made various representations and warranties related to the mortgage loans sold by them to the trusts that issued the RMBS. If a seller fails to cure a material breach of its representations and warranties with respect to any mortgage loan in a timely manner, then the trustee or the servicer of the loans may have the right to require that the seller repurchase the defective mortgage loan (or in some cases substitute a performing mortgage loan). It is possible, however, that for financial or other reasons, the seller either may not be capable of repurchasing defective mortgage loans, or may dispute the validity of or otherwise resist its obligation to repurchase defective mortgage loans. The inability or unwillingness of a seller to repurchase defective mortgage loans from a non-Agency RMBS trust in which we invest would likely cause higher rates of delinquencies, defaults and losses for the mortgage loans backing such non-Agency RMBS, and ultimately greater losses for our investment in such non-Agency RMBS.
If we acquire and subsequently resell any whole mortgage loans, we may be required to repurchase such loans or indemnify purchasers if we breach representations and warranties.
24
If we acquire and subsequently resell any whole mortgage loans, we would generally be required to make customary representations and warranties about such loans to the loan purchaser. Our residential mortgage loan sale agreements and terms
of any securitizations into which we sell loans will generally require us to repurchase or substitute loans in the event we breach a representation or warranty given to the loan purchaser. In addition, we may be required to repurchase loans as a result of borrower fraud or in the event of early payment default on a mortgage loan. The remedies available to a purchaser of mortgage loans are generally broader than those available to us against an originating broker or correspondent. Repurchased loans are typically worth only a fraction of the original price. Significant repurchase activity could materially adversely affect our business, financial condition and results of operations, and our ability to pay dividends to our shareholders.
We could be subject to liability for potential violations of various federal, state and local laws and regulations, including predatory lending laws, which could materially adversely affect our business, financial condition and results of operations, and our ability to pay dividends to our shareholders.
Residential mortgage loan originators and servicers are required to comply with various federal, state and local laws and regulations, including anti-predatory lending laws and laws and regulations imposing certain restrictions on requirements on high cost loans. Failure of residential mortgage loan originators or servicers to comply with these laws, to the extent any of their residential mortgage loans become part of our mortgage-related assets, could subject us, as an assignee or purchaser of the related residential mortgage loans, to monetary penalties and could result in the borrowers rescinding the affected residential mortgage loans. Lawsuits have been brought in various states making claims against assignees or purchasers of high cost loans for violations of state law. Named defendants in these cases have included numerous participants within the secondary mortgage market. If the loans are found to have been originated in violation of predatory or abusive lending laws, we could incur losses, which could materially adversely affect our business, financial condition and results of operations, and our ability to pay dividends to our shareholders.
Our real estate-related assets are subject to the risks associated with real property.
We own assets secured by real estate and may own real estate directly in the future, either through direct acquisitions or upon a default of mortgage loans. Real estate assets are subject to various risks, including:
•acts of God, including pandemics, such as the COVID-19 pandemic, earthquakes, floods, wildfires, hurricanes, mudslides, volcanic eruptions and other natural disasters, which may result in uninsured losses;
•adverse changes in national and local economic and market conditions;conditions, including those related to high unemployment, elevated inflation and high energy costs;
•changes in governmental laws and regulations, fiscal policies and zoning ordinances and the related costs of compliance with laws and regulations, fiscal policies and zoning ordinances;
•costs of remediation and liabilities associated with environmental conditions such as indoor mold;
•potential liabilities for other legal actions related to property ownership including tort claims; and
•the potential for uninsured or under-insured property losses.
The occurrence of any of the foregoing or similar events maycould reduce our return from an affected property or asset and, consequently, could materially adversely affect our business, financial condition and results of operations, and our ability to pay dividends to our shareholders.
We may be exposed to environmental liabilities with respect to properties in which we have an interest.
In the course of our business, we may take title to real estate, and, if we do take title, we could be subject to environmental liabilities with respect to these properties. In such a circumstance, we may be held liable to a governmental entity or to third parties for property damage, personal injury, investigation, and clean-up costs incurred by these parties in connection with environmental contamination, or may be required to investigate or clean up hazardous or toxic substances, or chemical releases at a property. The costs associated with investigation or remediation activities could be substantial. In addition, the presence of hazardous substances may adversely affect an owner's ability to sell real estate or borrow using real estate as collateral. To the extent that an owner of an underlying property becomes liable for removal costs, the ability of the owner to make debt payments may be reduced, which in turn may materially adversely affect the value of the relevant mortgage-related assets held by us.
25
We rely on analytical models and other data to analyze potential asset acquisition and disposition opportunities and to manage our portfolio. Such models and other data may be incorrect, misleading or incomplete, which could cause us to purchase assets that do not meet our expectations or to make asset management decisions that are not in line with our strategy.
Some of the risks of relying on analytical models and third-party data include the following:
•collateral cash flows and/or liability structures may be incorrectly modeled in all or only certain scenarios, or may be modeled based on simplifying assumptions that lead to errors;
•information about assets or the underlying collateral may be incorrect, incomplete, or misleading;
•asset, collateral, MBS, or RMBSCLO historical performance (such as historical prepayments, defaults, cash flows, etc.) may be incorrectly reported, or subject to interpretation (e.g., different RMBSMBS issuers may report delinquency statistics based on different definitions of what constitutes a delinquent loan); and
•asset, collateral, MBS, or RMBSCLO information may be outdated, in which case the models may contain incorrect assumptions as to what has occurred since the date information was last updated.
Some models, such as prepayment models or default models, may be predictive in nature. The use of predictive models has inherent risks. For example, such models may incorrectly forecast future behavior, leading to potential losses. In addition, the predictive models used by our Manager may differ substantially from those models used by other market participants, with the result that valuations based on these predictive models may be substantially higher or lower for certain assets than actual market prices. Furthermore, because predictive models are usually constructed based on historical data supplied by third parties, the success of relying on such models may depend heavily on the accuracy and reliability of the supplied historical data, and, in the case of predicting performance in scenarios with little or no historical precedent (such as extreme broad-based declines in home prices, or deep economic recessions or depressions)depressions, or pandemics), such models must employ greater degrees of extrapolation and are therefore more speculative and of more limited reliability.
All valuation models rely on correct market data inputs. If incorrect market data is entered into even a well-founded valuation model, the resulting valuations will be incorrect. However, even if market data is input correctly, "model prices" will often differ substantially from market prices, especially for securities with complex characteristics or whose values are particularly sensitive to various factors. If our market data inputs are incorrect or our model prices differ substantially from market prices, our business, financial condition and results of operations, and our ability to pay dividends to our shareholders could be materially adversely affected.
Valuations of some of our assets are inherently uncertain, may be based on estimates, may fluctuate over short periods of time, and may differ from the values that would have been used if a ready market for these assets existed.
The values of some of the assets in our portfolio are not readily determinable. We value these assets monthly at fair value, as determined in good faith by our Manager, subject to the oversight of our Manager's valuation committee. Because such valuations are inherently uncertain, may fluctuate over short periods of time, especially during periods of elevated market volatility, and may be based on estimates, our Manager's determinations of fair value may differ from the values that would have been used if a ready market for these assets existed or from the prices at which trades occur. Furthermore, we may not obtain third party valuations for all of our assets. Changes in the fair value of our assets directly impact our net income through recording unrealized appreciation or depreciation of our investments and derivative instruments, and so our Manager's determination of fair value has a material impact on our net income.
While in many cases our Manager's determination of the fair value of our assets is based on valuations provided by third-party dealers and pricing services, our Manager can and does value assets based upon its judgment and such valuations may differ from those provided by third-party dealers and pricing services. Valuations of certain assets are often difficult to obtain or are unreliable.unreliable, and certain of our credit, IO and/or CLO investments may trade infrequently and are illiquid. In general, dealers and pricing services heavily disclaim their valuations. Additionally, dealers and pricing services may claim to furnish valuations only as an accommodation and without special compensation, and so they may disclaim any and all liability for any direct,
26
incidental, or consequential damages arising out of any inaccuracy or incompleteness in valuations, including any act of negligence or breach of any warranty. Depending on the complexity and illiquidity of an asset, valuations of the same
asset can vary substantially from one dealer or pricing service to another. Higher valuations of our assets have the effect of increasing the amount of management fees we pay to our Manager. Therefore, conflicts of interest exist because our Manager is involved in the determination of the fair value of our assets.
Market-based inputs are generally the preferred source of values for purposes of measuring the fair value of our assets under U.S. GAAP. However, the markets for our investments have experienced, and could in the future experience, extreme volatility, reduced transaction volume and liquidity, and disruption as a result of certain events, such as the COVID-19 pandemic, which has made, and could in the future make, it more difficult for our Manager, and for third-party dealers and pricing services that we use, to rely on market-based inputs in connection with the valuation of our assets under U.S. GAAP. Furthermore, in determining the fair value of our assets, our Manager uses proprietary models that require the use of a significant amount of judgment and the application of various assumptions including, but not limited to, assumptions concerning future prepayment rates, interest rates, default rates and loss severities. These assumptions might be especially difficult to project accurately during periods of economic disruption. The fair value of certain of our investments may fluctuate over short periods of time, and our Manager’s determinations of fair value may differ materially from the values that would have been used if a ready market for these investments existed.
Our business, financial condition and results of operations, and our ability to pay dividends to our shareholders could be materially adversely affected if our Manager's fair value determinations of these assets were materially different from the values that would exist if a ready market existed for these assets.
The lack of liquidity in our assets may materially adversely affect our business, financial condition and results of operations, and our ability to pay dividends to our shareholders.
Certain of the assets and other instruments we acquire are not publicly traded, including privately placed RMBS. As such, these assets may be subject to legal and other restrictions on resale, transfer, pledge or other disposition, or will otherwise be less liquid than publicly-traded securities. Other assets that we acquire, while publicly traded, have limited liquidity on account of their complexity, turbulent market conditions, or other factors. In addition, mortgage-related assets from time to time have experienced extended periods of illiquidity, including during times of financial stress (such as during the 2008 financial crisis)COVID-19 pandemic), which is often the time that liquidity is most needed. Illiquid assets typically experience greater price volatility, because a ready market does not exist, and they can be more difficult to value or sell if the need arises. In addition, if we are required to liquidate all or a portion of our portfolio quickly, we may realize significantly less than the value at which we have previously recorded our assets. We may also face other restrictions on our ability to liquidate any assets for which we or our Manager has or could be attributed with material non-public information. Furthermore, assets that are illiquid are more difficult to finance, and to the extent that we finance assets that are or become illiquid, we may lose that financing or have it reduced. If we are unable to sell our assets at favorable prices or at all, it could materially adversely affect our business, financial condition and results of operations, and our ability to pay dividends to our shareholders.
We are highly dependent on Ellington's information systems and those of third-party service providers, including mortgage servicers, and system failures could significantly disrupt our business, which may, in turn,could materially adversely affect our business, financial condition and results of operations, and our ability to pay dividends to our shareholders.
Our business is highly dependent on Ellington's communications and information systems.systems and those of third-party service providers, including mortgage loan servicers. Any failure or interruption of ourEllington's or certain third-party service providers' systems or cyber-attacks or security breaches of ourtheir networks or systems could cause delays or other problems in our securities trading activities, could allow unauthorized access for purposes of misappropriating assets, stealing proprietary and confidential information, corrupting data or causing operational disruption, or could prevent us from receiving distributions to which we are entitled, any of which could materially adversely affect our business, financial condition and results of operations, and our ability to pay dividends to our shareholders. In addition, we also face the risk of operational failure, termination or capacity constraints of any of the third parties with which we do business or that facilitate our business activities, including clearing agents or other financial intermediaries we use to facilitate our securities transactions, if their respective systems experience failure, interruption, cyber-attacks, or security breaches.
Computer malware, ransomware, viruses, and computer hacking and phishing attacks have become more prevalent in the financial services industry and may occur on ourEllington's or certain third party service providers' systems in the future. We rely heavily on ourEllington's financial, accounting and other data processing systems. Although we have not detected a breach to date, financialFinancial services institutions have reported breaches of their systems, some of which have been significant.significant, and Ellington has experienced a data breach, which was not material to its or our operations. Even with all reasonable security efforts, not every breach can be prevented or even detected. It is possible that weEllington or certain third-party service providers have experienced an undetected breach, and it is likely that other financial institutions have experienced more breaches than have been detected and reported. There is no assurance that we, Ellington, or certain of the third parties that facilitate our and Ellington's business activities, have not or will not experience a breach. It is difficult to determine what, if any, negative impact may directly result from any specific interruption or cyber-attacks or security breaches of ourEllington's networks or systems (or the networks or systems of certain third parties that facilitate
27
our and Ellington's business activities) or any failure to maintain performance, reliability and security of ourEllington's or certain third-party service providers' technical infrastructure, but such computer malware, ransomware, viruses, and computer hacking and phishing attacks could materially adversely affect our business, financial condition and results of operations, and our ability to pay dividends to our shareholders. Additionally, operational failures or cyber incidents relating to our third-party service providers (or their service providers), including mortgage servicers, may negatively affectimpact in the future, our operations.business. For example, a prominent mortgage loan servicer experienced a cyber-attack which caused it to delay payments to its counterparties; it is possible that, to the extent a similar future event occurs at one of our counterparties, funds from such counterparty could also be delayed, or not recovered at all. The number and complexity of these threats continue to increase over time and many companies in the mortgage space have recently been targeted by hackers, likely due to the personally identifiable information that these companies hold. While we collaborate with mortgage servicers and other third-party service providers to develop secure transmission capabilities and protect against operational failures and cyber-attacks, we and those third parties may not have all appropriate controls in place to protect from such failures or attacks. If a material operational failure or material breach of the information technology systems of our third-party service providers occurs, we could be required to expend significant amounts of money, be delayed in receiving funds (or not receive them at all) or have to expend significant time and resources to respond to these threats or breaches, each of which could materially adversely impact our business, financial condition and results of operations, and our ability to pay dividends to our shareholders.
Our access to financing sources which may not be available on favorable terms, or at all, may be limited or completely shut off, and thisour lenders and derivative counterparties may require us to post additional collateral. These circumstances may materially adversely affect our business, financial condition and results of operations, and our ability to pay dividends to our shareholders.
Our lenders are primarily large global financial institutions, with exposures both to global financial markets and to more localized conditions. In addition to borrowing from large banks, we borrow from smaller non-bank financial institutions as well.institutions. Whether because of a subsequent global or local financial crisis or other circumstances, such as if one or more of our lenders experiences severe financial difficulties, they or other lenders could become unwilling or unable to provide us with financing, could increase the haircut required for such financing, or could increase the costs of that financing, or could become insolvent, as was the case with Lehman Brothers in 2008. financing.
Moreover, we are currently party to short-term borrowings (in the form of repurchase agreements) and there can be no assurance that we will be able to replace
these borrowings, or "roll" them, as they mature on a continuous basis and it may be more difficult for us to obtain debt financing on favorable terms, or at all. If we are not able to renew our existing repurchase agreements or other types of borrowings we may enter into from time to time or arrange for new financing on terms acceptable to us, or if we default on our financial covenants, are otherwise unable to access funds under our financing arrangements, or if we are required to post more collateral or face larger haircuts, we may have to dispose of assets at significantly depressed prices and at inopportune times, which could cause significant losses, and may also force us to curtail our asset acquisition activities. Similarly, if we were to move a financing from one counterparty to another that was subject to a larger haircut we would have to repay more cash to the original counterparty than we would be able to borrow from the new counterparty. To the extent that we might be compelled to liquidate qualifying real estate assets to repay debts, our compliance with the REIT asset tests, income tests, and distribution requirements could be negatively affected, which could jeopardize our qualification as a REIT. Losing our REIT qualification would cause us to be subject to U.S. federal income tax (and any applicable state and local taxes) on all of our income and decrease profitability and cash available to pay dividends to our shareholders. Any such forced liquidations could also materially adversely affect our ability to maintain our exclusion from registration as an investment company under the Investment Company Act.
In addition, if there is a contraction in the overall availability of financing for our assets, including if the regulatory capital requirements imposed on our lenders change theyor our shareholders’ equity decreases to levels that make us a less attractive financing counterparty, our lenders may be required to limit, orsignificantly increase the cost of the financing that they provide to us.us, increase the amounts of collateral they require as a condition to providing us with financing, or even cease providing us with financing. Our lenders also have revised, and may continue to revise, their eligibility requirements for the types of assets that they are willing to finance or the terms of such financing arrangements, including increased haircuts and requiring additional cash collateral, based on, among other factors, the regulatory environment and their management of actual and perceived risk, particularly with respect to assignee liability.
28
Moreover, the amount of financing that we receive under our financing agreements will be directly related to our lenders’ valuation of the financed assets subject to such agreements. Typically, the master repurchase agreements that govern our borrowings under repurchase agreements grant the lender the right to reevaluate the fair market value of the financed assets subject to such repurchase agreements at any time. If a lender determines that the net decrease in the value of the portfolio of financed assets is greater in magnitude than any applicable threshold, it will generally initiate a margin call. In general,such cases, a lender's valuations of the financed assets may be different than the values that we ascribe to these assets and may be influenced by recent asset sales at distressed levels by forced sellers. A valid margin call requires us to transfer cash or additional qualifying collateral to a lender or to repay a portion of the outstanding borrowings. If we were to dispute the validity of a margin call from a lender under one of our repo agreements and refuse to deliver margin collateral as a result, a lender could still send us a notice of default. In this could potentiallysituation, such lender will have possession of the financed assets, and might still decide to exercise its contractual remedies, despite the margin dispute. In the event of our default, our lenders or derivative counterparties can accelerate our indebtedness, terminate our derivative contracts (potentially on unfavorable terms requiring additional payments, including additional fees and costs), increase our borrowing rates, liquidate our collateral, and terminate our ability to borrow. In certain cases, a default on one repo agreement or derivative agreement (whether caused by a failure to satisfy margin calls or another event of default) can trigger "cross defaults" on other such agreements. In addition, if the market value of our derivative contracts with a derivative counterparty declines in value, we generally will be subject to a margin call by the derivative counterparty.
Significant margin calls and/or increased repo haircuts could have a material adverse effect on our results of operations, financial condition, business, liquidity, and ability to make distributions to our shareholders, and could cause the value of our common shares to decline. During March and April of 2020, we observed that many of our financing costsagreement counterparties assigned lower valuations to certain of our assets, resulting in us having to pay cash to satisfy margin calls, which were higher than historical levels. In addition, during March and reduceApril of 2020 we also experienced an increase in haircuts on repurchase agreements that we rolled. A sufficiently deep and/or rapid increase in margin calls or haircuts would have an adverse impact on our liquidity or require us to sell assets at an inopportune time or price. liquidity.
Consequently, depending on market conditions at the relevant time, we may have to rely on additional equity issuances to meet our capital and financing needs, which may be dilutive to our shareholders, or we may have to rely on less efficient forms of debt financing that consume a larger portion of our cash flow from operations, thereby reducing funds available for our operations, future business opportunities, cash distributions to our shareholders, and other purposes. We cannot assure you that we will have access to such equity or debt capital on favorable terms (including, without limitation, cost and term) at the desired times, or at all, which may cause us to curtail our asset acquisition activities and/or dispose of assets, which could materially adversely affect our business, financial condition and results of operations, and our ability to pay dividends to our shareholders.shareholders, or in the worst case, cause our insolvency.
Increases in interest rates could adversely affect the value of our assets and cause our interest expense to increase, and increase the risk of default on our assets, which could result in reduced earnings or losses and negatively affect our profitability as well as the cash available for distribution to shareholders.
Our operating results will depend in large part on the difference between the income from our assets, net of credit losses, and financing costs. We anticipate that, in many cases, the income from our assets will respond more slowly to interest rate fluctuations than the cost of our borrowings. Consequently, changes in interest rates, particularly short-term interest rates, to the extent not offset by our interest rate hedges, may significantly influence our financial results.
We use leverage in executing our business strategy, which may adversely affect the return on our assets and may reduce cash available for distribution to our shareholders, as well as increase losses when economic conditions are unfavorable.
We use leverage to finance our investment activities and to enhance our financial returns. Currently, all of our leverage is in the form of short-term repurchase agreement financingsrepos for our RMBS and CLO assets. Other forms of leverage we may use in the future include credit facilities, including term loans and revolving credit facilities.
Through the use of leverage, we may acquire positions with market exposure significantly greater than the amount of capital committed to the transaction. For example, by entering into repurchase agreementsrepos with advance rates of 95%, or haircut levels (aof 5%, we could theoretically leverage capital allocated to Agency RMBS by an asset-to-equity ratio of as much as 20 to 1. A haircut is the percentage discount that a repo lender applies to the market value of an asset serving as collateral for a repo borrowing, for the purpose of determining whether such reverse repo borrowing is adequately collateralized), of 5%,collateralized.
Although we could theoreticallymay from time to time enter into certain contracts that may limit our leverage, capital allocated to Agency RMBS by a debt-to-equity ratio ofsuch as much as 20 to 1. There is no specificcertain financing arrangements with lenders, our governing documents do not specifically limit on the amount of leverage that we may use. Leverage can enhance our potential returns but can also exacerbate losses. Even if an asset increases in value, if the asset fails to earn a return that equals or exceeds our cost of borrowing, the leverage will diminish our returns.
29
Leverage also increases the risk of our being forced to precipitously liquidate our assets. See "—Our access to financing sources may not be available on favorable terms, may be limited or completely shut off, and our lenders and derivative counterparties may require us to post additional collateral, whichcollateral. These circumstances may force us to liquidate assets, and if we fail to post sufficient collateral our debts may be accelerated and/or our derivative contracts terminated on unfavorable terms" below.
Our rights under repurchaserepo agreements are subject to the effects of the bankruptcy laws in the event of the bankruptcy or insolvency of us or our lenders.
In the event of our insolvency or bankruptcy, certain repurchase agreements may qualify for special treatment under the U.S. Bankruptcy Code, the effect of which, among other things, would be to allow the lender to avoid the automatic stay provisions of the U.S. Bankruptcy Code and to foreclose on and/or liquidate the collateral pledged under such agreements without delay. In the event of the insolvency or bankruptcy of a lender during the term of a repurchaserepo agreement, the lender may be permitted, under applicable insolvency laws, to repudiate the contract, and our claim against the lender for damages may be treated simply as an unsecured creditor.claim. In addition, if the lender is a broker or dealer subject to the Securities Investor Protection Act of 1970, or an insured depository institution subject to the Federal Deposit Insurance Act, our ability to exercise our rights to recover our securities under a repurchaserepo agreement or to be compensated for any damages resulting from the lenders' insolvency may be further limited by those statutes. These claims would be subject to significant delay and costs to us and, if and when received, may be substantially less than the damages we actually incur.
Hedging against interest rate changes and other risks maycould materially adversely affect our business, financial condition and results of operations and our ability to pay dividends to our shareholders.
Subject to maintaining our qualification as a REIT and exclusion from registration as an investment company under the Investment Company Act, we may pursue various hedging strategies to seek to reduce our exposure to adverse changes in interest rates and, to a lesser extent, credit risk. Our hedging activity is expected to vary in scope based on the level and volatility of interest rates, the types of liabilities and assets held and other changing market conditions. Hedging may fail to protect or could adversely affect us because, among other things:
•interest rate hedging can be expensive, particularly during periods of rising and volatile interest rates;
•available interest rate hedges may not correspond directly with the interest rate risk for which protection is sought;
•the duration of the hedge may not match the duration of the related assets or liabilities being hedged;
•to the extent that the creditworthiness of a hedging counterparty deteriorates, it may be difficult or impossible to terminate or assign any hedging transactions with such counterparty to another counterparty;
•to the extent hedging transactions do not satisfy certain provisions of the Code and are not made through a TRS, the amount of income that a REIT may earn from hedging transactions to offset interest rate losses is limited by U.S. federal tax provisions governing REITs;
•the value of derivatives used for hedging may be adjusted from time to time in accordance with accounting rules to reflect changes in fair value. Downward adjustments, or "mark-to-market losses," would reduce our earnings and our shareholders' equity;
•we may fail to correctly assess the degree of correlation between the performance of the instruments used in the hedging strategy and the performance of the assets in the portfolio being hedged;
•our Manager may fail to recalculate, re-adjust, and execute hedges in an efficient and timely manner; and
•the hedging transactions may actually result in poorer overall performance for us than if we had not engaged in the hedging transactions.
Although we do not intend to operate our non-Agency RMBS investment strategy on a credit-hedged basis in general, we may from time to time opportunistically enter into short positions using credit default swaps to protect against adverse credit events with respect to our non-Agency RMBS, provided that our ability to do so may be limited in order to maintain our qualification as a REIT and maintain our exclusion from registration as an investment company under the Investment Company Act.
30
Hedging instruments and other derivatives, including some credit default swaps, may not, in many cases, be traded on exchanges, or may not be guaranteed or regulated by any U.S. or foreign governmental authority and involve risks and costs that could result in material losses.
Hedging instruments and other derivatives, including certain types of credit default swaps, involve risk because they may not, in many cases, be traded on exchanges and may not be guaranteed or regulated by any U.S. or foreign governmental authorities. Consequently, for these instruments there may be less stringent requirements with respect to record keeping and compliance with applicable statutory and commodity and other regulatory requirements and, depending on the identity of the counterparty, applicable international requirements. Our Manager is not restricted from dealing with any particular counterparty or from concentrating any or all of its transactions with one counterparty. Furthermore, our Manager has only a limited internal credit function to evaluate the creditworthiness of its counterparties, mainly relying on its experience with such counterparties and their general reputation as participants in these markets. TheUnder the terms of many of our hedging transaction contracts, the business failure of a hedging counterparty with whom we enter into a hedging transaction will most likely result in a default under the agreement governing the hedging arrangement. Default by a party with whom we enter into a hedging transaction may result in losses and may force us to re-initiate similar hedges with other counterparties at the then-prevailing market levels. Generally, we will seek to reserve the right to terminate our hedging transactions upon a counterparty's insolvency, but absent an actual insolvency, we may not be able to terminate a hedging transaction without the consent of the hedging counterparty, and we may not be able to assign or otherwise dispose of a hedging transaction to another counterparty without the consent of both the original hedging counterparty and the potential assignee. If we terminate a hedging transaction, we may not be able to enter into a replacement contract in order to cover our risk. There can be no assurance that a liquid secondary market will exist for hedging instruments purchased or sold, and therefore we may be required to maintain any hedging position until exercise or expiration, which could materially adversely affect our business, financial condition and results of operations, and our ability to pay dividends to our shareholders.
In addition, some portion of our hedges are cleared through a central counterparty clearinghouse, or "CCP," which we access through a futures commission merchant, or "FCM." If an FCM that holds our cleared derivatives account were to become insolvent, the CCP will make an effort to move our futures and swap positions to an alternate FCM, though it is possible that no alternate FCM could be found to accept our positions, which could result in a total cancellation of our positions in the account; in such a case, if we wished to reinstate such hedging positions, we would have to re-initiate such positions with an alternate FCM. In the event of the insolvency of an FCM that holds our cleared over-the-counter derivatives, the rules of the CCP require that its direct members submit bids to take over the portfolio of the FCM, and would further require the CCP to move our existing positions and related margin to an alternate FCM. If this were to occur, we believe that our risk of loss would be limited to the excess equity in the account at the insolvent FCM due to the "legally segregated, operationally commingled" treatment of client assets under the rules governing FCMs in respect of cleared over-the-counter derivatives. In addition, in the case of both futures and cleared over-the-counter derivatives, there could be knock-on effects of our FCM's insolvency, such as the failure of co-customers of the FCM or other FCMs of the same CCP. In such cases, there could be a shortfall in the funds available to the CCP due to such additional insolvencies and/or exhaustion of the CCP's guaranty fund that could lead to total loss of our positions in the FCM account. Finally, we face a risk of loss (including total cancellation) of positions in the account in the event of fraud by our FCM or other FCMs of the CCP, where ordinary course remedies would not apply.
The U.S. Commodity Futures Trading Commission, or "CFTC," and certain commodity exchanges have established limits referred to as speculative position limits or position limits on the maximum net long or net short position which any person or group of persons may hold or control in particular futures and options. Limits on trading in options contracts also have been established by the various options exchanges. It is possible that trading decisions may have to be modified and that positions held may have to be liquidated in order to avoid exceeding such limits. Such modification or liquidation, if required, could materially adversely affect our business, financial condition and results of operations and our ability to pay dividends to our shareholders.
Our use of derivatives may expose us to counterparty risk.
We have entered into interest rate swaps and other derivatives that have not been cleared by a CCP. If a derivative counterparty cannot perform under the terms of the derivative contract, we would not receive payments due under that agreement, we may lose any unrealized gain associated with the derivative, and the hedged liability would cease to be hedged by such instrument. If a derivative counterparty becomes insolvent or files for bankruptcy, we may also be at risk for any collateral we have pledged to such counterparty to secure our obligations under derivative contracts, and we may incur significant costs in attempting to recover such collateral.
We engage in short selling transactions, which may subject us to additional risks.
Many of our hedging transactions, and occasionally our investment transactions, are short sales. Short selling may involve selling securities that are not owned and typically borrowing the same securities for delivery to the purchaser, with an
31
obligation to repurchase the borrowed securities at a later date. Short selling allows the investor to profit from declines in market prices to the extent such declines exceed the transaction costs and the costs of borrowing the securities. A short sale may create the risk of an unlimited loss, in that the price of the underlying security might theoretically increase without limit, thus increasing the cost of repurchasing the securities. There can be no assurance that securities sold short will be available for repurchase or borrowing. Repurchasing securities to close out a short position can itself cause the price of the securities to rise further, thereby exacerbating the loss.
We may change our investment strategy, investment guidelines, hedging strategy, and asset allocation, operational, and management policies without notice or shareholder consent, which maycould materially adversely affect our business, financial condition and results of operations, and our ability to pay dividends to our shareholders. In addition, our declaration of trust provides that our Board of Trustees may authorize us to revoke or otherwise terminate our REIT election without the approval of our shareholders.
We may change our investment strategy, investment guidelines, hedging strategy, and asset allocation, operational, and management policies at any time without notice to or consent from our shareholders. As a result, the types or mix of assets, liabilities, or hedging transactions in our portfolio may be different from, and possibly riskier than, the types or mix of assets,
liabilities, and hedging transactions that we have historically held, or that are otherwise described in this report. A change in our strategy may increase our exposure to real estate values, interest rates, and other factors. Changes in our investment strategy may also affect our ability to qualify as a REIT, or cause us to determine that it is not in the best interests of our company and our shareholders for us to continue to qualify as a REIT. Our Board of Trustees determines our investment guidelines and our operational policies, and may amend or revise our policies, including those with respect to our acquisitions, growth, operations, indebtedness, capitalization, and dividends or approve transactions that deviate from these policies without a vote of, or notice to, our shareholders. For example, we recently began investing in corporate CLOs with the approval of our Board of Trustees and without any notice or consent from our shareholders.
We operate in a highly competitive market.
Our profitability depends, in large part, on our ability to acquire targeted assets at favorable prices. We compete with a number of entities when acquiring our targeted assets, including other mortgage REITs, financial companies, public and private funds, commercial and investment banks and residential and commercial finance companies. We may also compete with (i) the Federal Reserve and the U.S. Treasury to the extent they purchase assets in our targeted asset classes and (ii) companies that partner with and/or receive financing from the U.S. Government.Government or consumer bank deposits. Many of our competitors are substantially larger and have considerably more favorable access to capital and other resources than we do. Furthermore, new companies with significant amounts of capital have been formed or have raised additional capital, and may continue to be formed and raise additional capital in the future, and these companies may have objectives that overlap with ours, which may create competition for assets we wish to acquire. Some competitors may have a lower cost of funds and access to funding sources that are not available to us, such as funding from the U.S. Government. In addition, some of our competitors may have higher risk tolerances or different risk assessments, which could allow them to consider a wider variety of assets to acquire or pay higher prices than we can. We also may have different operating constraints from those of our competitors including, among others, (i) tax-driven constraints such as those arising from our qualification as a REIT, (ii) restraints imposed on us by our attempt to comply with certain exclusions from the definition of an "investment company" or other exemptions under the Investment Company Act and (iii) restraints and additional costs arising from our status as a public company. Furthermore, competition for assets in our targeted asset classes may lead to the price of such assets increasing, which may further limit our ability to generate desired returns. We cannot assure you that theThe competitive pressures we face will not have a material adverse effect oncould materially adversely affect our business, financial condition and results of operations, and our ability to pay dividends to our shareholders.
An increase in interest rates may cause a decrease in the issuance volumes of certain of our targeted assets, which could adversely affect our ability to acquire targeted assets that satisfy our investment objectives and to generate income and pay dividends.
Rising interest rates generally reduce the demand for mortgage loans due to the higher cost of borrowing. A reduction in the volume of mortgage loans originated may affect the volume of targeted assets available to us, which could adversely affect our ability to acquire assets that satisfy our investment objectives. If rising interest rates cause us to be unable to acquire a
32
sufficient volume of our targeted assets with a yield that is above our borrowing cost, our ability to satisfy our investment objectives and to generate income and pay dividends to our shareholders may be materially and adversely affected.
Lack of diversification in the number of assets we acquire would increase our dependence on relatively few individual assets.
Our management objectives and policies do not place a limit on the amount of capital used to support, or the exposure to (by any other measure), any individual asset or any group of assets with similar characteristics or risks. As a result, our portfolio may be concentrated in a small number of assets or may be otherwise undiversified, increasing the risk of loss and the magnitude of potential losses to us and our shareholders if one or more of these assets perform poorly.
For example, the properties underlying our portfolio of mortgage-related assets may at times be concentrated in certain property typessectors that are subject to higher risk of foreclosure, or secured by propertiesmay be concentrated in a limited number of geographic locations.locations, and our investments may be concentrated in certain of our targeted asset classes such that they are substantial relative to our total equity. To the extent that our portfolio is concentrated in any one region or type of security, downturns or other significant events or developments relating generally to such region or type of security, such as natural disasters, may result in defaults on a number of our assets within a short time period, which may materially adversely affect our business, financial condition and results of operations, and our ability to pay dividends to our shareholders.
Our ability to pay dividends will depend on our operating results, our financial condition and other factors, and we may not be able to pay dividends at a fixed rate or at all under certain circumstances.
We intend to pay dividends to our shareholders in amounts such that we distribute all or substantially all of each year's taxable income (subject to certain adjustments). This distribution policy will enable us to avoid being subject to U.S. federal income tax on our REIT taxable income that we distribute to our shareholders. However, our ability to pay dividends will depend on our earnings, our financial condition and such other factors as our Board of Trustees may deem relevant from time to time. We will declare and pay dividends only to the extent approved by our Board of Trustees.
We depend uponmay invest in second-lien mortgage loans or RMBS backed by such loans. If a borrower defaults on a second lien mortgage loan or on its senior debt (i.e., a first-lien loan, in the availabilitycase of adequate funding and capital for our operations. To maintain our status as a REIT, we are required to distribute to our shareholders at least 90%residential mortgage loan), or in the event of our REIT taxable income annually, determined excluding any net capital gains and without regard to the deduction for dividends paid.a borrower bankruptcy, such loan will be satisfied only after all senior debt is paid in full. As a result, if we are not able to retain muchdirectly or anyindirectly invest in second-lien mortgage loans and the underlying borrower defaults, we may lose all or a significant part of our earnings for new investments. We cannot assure you that any, or sufficient, funding or capital will be available to us in the future on terms that are acceptable to us. In the event that we cannot obtain sufficient funding and capital on acceptable terms, there may be a negative impact on the value of our common shares and our ability to pay dividends to our shareholders, and you may lose part or all of your investment.
We may invest in securities in the developing CRT sector that are subject to mortgage credit risk.
We may invest in credit risk transfer securities, or “CRTs.”"CRTs." CRTs are designed to transfer a portion of the mortgage credit risk onof a pool of insured or guaranteed mortgage loans from the insurer or guarantor of such loans to CRT investors. In a CRT transaction, interest and/or principal of the CRT is written off following certain credit events, such as delinquencies, defaults, and/or realized losses, on the underlying mortgage pool. To date, the vast majority of CRTs consist of risk sharing transactions issued by the GSEs, namely Fannie Mae's Connecticut Avenue Securities program, or “CAS,”"CAS," and Freddie Mac's Structured Agency Credit Risk program, or “STACR.”"STACR." These securities have historically been structured as unsecured debtand subject to the credit risk of the related GSE, but where the principal payments and principal write-offs are determined by the prepayments, delinquencies, and/or realized losses on a reference pool ofunderlying mortgage loans guaranteed by such GSE. However, it is anticipated that inpool. In the future, Fannie Mae and Freddie Mac willmay issue CRTs with a variety of other structures.
Risks Related to our RelationshipCLO Investments
Our investments in corporate CLOs involve certain risks.
Investments in corporate CLO securities involve certain risks. Corporate CLOs are generally backed by a pool of corporate loans or similar corporate credit-related assets that serve as collateral. We and other investors in CLO securities ultimately bear the credit risk of the underlying collateral. Most CLOs are issued in multiple tranches, offering investors various maturity and credit risk characteristics, often categorized as senior, mezzanine and subordinated/equity according to their relative seniority and degree of risk. If the relevant collateral defaults or otherwise underperforms, payments to the more senior tranches of such securitizations take precedence over those of more junior tranches, such as mezzanine debt and equity tranches, which are the focus of our investment strategy. CLOs present risks similar to those of other types of credit investments, including credit, interest rate and prepayment risks.
The corporate loans that underlie our CLO investments may become nonperforming or impaired for a variety of reasons. Nonperforming or impaired loans may require substantial workout negotiations or restructurings that may result in significant delays in repayment, a significant reduction in the interest rate, and/or a significant write-down of the principal of the loan. A wide range of factors could adversely affect the ability of an underlying corporate borrower to make interest or other payments on its loan. The corporate issuers of the loans or securities underlying our CLO investments may be subject to an increased risk
33
of default depending on certain micro- or macro-economic conditions, such as economic recessions, heightened interest rates and/or inflation, and other conditions. Such defaults and losses, especially those in excess of the market’s or our expectations, would have a negative impact on the fair value of our CLO investments, and reduce the cash flows that we receive from our CLO investments, which could materially adversely affect our business, financial condition and results of operations, and our ability to pay dividends to our shareholders.
In addition, if a CLO in which we invest experiences an event of default as a result of failure to make a payment when due, erosion of the underlying collateral, or for other reasons, the CLO would be subject to the possibility of liquidation. In such cases, the risks are heightened that the collateral underlying the CLO may not be able to be readily liquidated, or that when liquidated, the resulting proceeds would be insufficient to redeem the CLO mezzanine debt and equity tranches that are the focus of our investment strategy. CLO equity tranches often suffer a loss of all of their value in these circumstances, which could materially adversely affect our business, financial condition and results of operations, and our ability to pay dividends to our shareholders. Furthermore, following an event of default by a CLO, the holders of CLO mezzanine debt and equity tranches typically have limited rights regarding decisions made with respect to the underlying collateral, with the result that such decisions might favor the more senior tranches of the CLO.
The underlying assets held by the CLOs in which we invest generally have lower credit ratings and are subject to significant credit risk.
The assets underlying our ManagerCLO investments are generally rated for creditworthiness by one or more nationally recognized statistical ratings organizations (“NRSROs”), including Moody’s, Standard and EllingtonPoor’s, and Fitch. These assets generally consist of lower-rated first lien corporate loans, although certain CLO structures may also allow for limited exposure to other asset classes including unsecured loans, second lien loans, or corporate bonds.
Corporate issuers of lower-rated debt securities may be highly leveraged and may not have available to them more traditional methods of financing. During economic downturns or sustained periods of rising interest rates, issuers of lower-rated debt securities may be likely to experience financial stress, especially if such issuers are highly leveraged. In such periods, the market for lower-rated debt securities could be severely disrupted, adversely affecting the value of such securities, which could materially adversely affect our business, financial condition and results of operations, and our ability to pay dividends to our shareholders. The risk of loss for lower-rated debt securities is also magnified to the extent that such securities are unsecured or subordinated to more senior creditors. Lower-rated debt securities generally have limited liquidity and limited secondary market support.
Second lien loans are secured by liens on the collateral securing the loan that are subordinated to the liens of at least one other class of obligations of the related obligor. Thus, the ability of the second lien debtholders to exercise remedies after a second lien loan becomes a defaulted obligation is subordinated to, and limited by, the rights of the senior creditors holding such other classes of obligations. In many circumstances, the second lien debtholders may be prevented from foreclosing on the collateral securing a second lien loan until the related first lien loan is paid in full. Moreover, any amounts that might be realized as a result of collection efforts or in connection with a bankruptcy or insolvency proceeding involving a second lien loan must generally be turned over to the first lien secured lender until the first lien secured lender has realized the full value of its own claims. In addition, certain second lien loans contain provisions requiring the related lien to be released in certain circumstances. These lien and payment obligation subordination provisions may materially and adversely affect the ability of the second lien debtholders to realize value from second lien loans.
In the event of a bankruptcy or insolvency of an issuer of a loan or of an underlying asset held by a CLO in which we invest, a court or other governmental entity may determine that the related claims held by such CLO are not valid, or are subject to significant modification. In addition, any payments previously received by such CLO could be subject to avoidance as a “preference” if made within a certain period of time (which may be as long as one year under U.S. Federal bankruptcy law or even longer under state laws) before insolvency.
The underlying assets in a CLO in which we are invested may be subject to various laws for the protection of debtors in other jurisdictions, including the jurisdiction of incorporation of the issuer or borrower of such underlying assets and, if different, the jurisdiction from which it conducts business and in which it holds assets, any of which may adversely affect such issuer’s or borrower’s ability to make, or a creditor’s ability to enforce, payment in full, on a timely basis or at all. These insolvency considerations will differ depending on the jurisdiction in which an issuer or borrower or the related underlying assets are located and may differ depending on the legal status of the issuer or borrower.
Our CLO investments are exposed to changes in interest rates.
Even though we expect that most of our CLO mezzanine debt investments will have floating rate coupons, these and other of our CLO investments are still exposed to interest rate risk. There can be significant mismatches between the timing and
34
frequency of coupon resets on the floating rate CLO debt tranches and the underlying floating rate corporate loans, and furthermore some of the underlying corporate loans may bear fixed coupon rates. When interest rates are low but increasing, variations between interest rate floors on the CLO debt tranches and the underlying corporate loans can reduce the amount of excess interest available for payment to the CLO debt and equity tranches. This reduction in excess interest could adversely impact our CLO equity cashflows and valuations, which could materially adversely affect our business, financial condition and results of operations, and our ability to pay dividends to our shareholders.
Our corporate CLO investments may include “middle market” and/or “covenant-lite” loans.
The underlying collateral of the corporate CLO securities in which we invest may include loans to smaller companies, or “middle market” loans, which may carry more inherent risks than loans to larger, publicly traded entities. Compared to larger companies, these middle-market companies tend to have more limited access to capital, weaker financial positions, narrower product lines, and tend to be more vulnerable to competitors’ actions and market conditions, as well as to general economic downturns. As a result, the securities issued by CLOs that hold significant investments in middle-market loans are generally considered riskier than securities issued by CLOs that primarily invest in broadly syndicated loans.
In addition, “covenant-lite” loans may comprise a significant portion of the underlying collateral of the CLOs in which we invest. Generally, covenant-lite loans provide the obligor with more freedom to take actions that could negatively impact their lenders because the obligor’s covenants are incurrence-based and not maintenance-based, which means that they are only tested and can only be breached following an affirmative action of the borrower, rather than by a deterioration in the borrower’s financial condition. At times, covenant-lite loans have represented a significant majority of the market. To the extent that the corporate CLO securities in which we invest hold covenant-lite loans, we may have a greater risk of loss on such investments as compared to investments in CLOs holding loans with more robust covenants.
The CLOs in which we invest are subject to risks associated with loan participations.
The CLOs in which we invest may acquire interests in corporate loans indirectly, by way of participations. In a participation, the underlying debt obligation remains with the institution that has sold us the participation, which typically results in a contractual relationship only with such selling institution, and not with the corporate obligor directly. As a result, the holder of a participation assumes the credit risk of both the obligor and the selling institution, and may only have limited rights to influence any decisions made by the selling institution in connection with the underlying debt obligation.
Our investments in the primary corporate CLO market involve certain additional risks.
Between the pricing date and the closing date of a corporate CLO, the collateral manager generally purchases additional assets for the CLO. During this period, the price and availability of these assets may be adversely affected by a number of market factors, including price volatility and availability of investments suitable for the CLO, which could hamper the ability of the collateral manager to acquire a portfolio of assets that will satisfy specified concentration limitations and allow the CLO to reach the target initial principal amount of collateral prior to the effective date. An inability or delay in reaching the target initial principal amount of collateral may adversely affect the timing and amount of payments received by the holders of CLO mezzanine debt securities and equity securities and could result in early redemptions which could cause significant principal losses on the CLO mezzanine debt and equity securities, which could materially adversely affect our business, financial condition and results of operations, and our ability to pay dividends to our shareholders.
We cannot assure youand our investments are subject to prepayment and reinvestment risk.
As part of the ordinary management of its portfolio, a CLO will typically generate cash flow from asset repayments and sales that is reinvested into substitute assets, subject to compliance with its investment tests and certain other conditions. If the CLO collateral manager causes the CLO to purchase substitute assets at a lower yield than those initially acquired, the excess interest-related cash flow available for distribution to the CLO equity tranches would decline. In addition, prepayment rates of the assets underlying a CLO are driven by a number of factors, including changing interest rates and other factors that are beyond our control. Furthermore, in most CLO transactions, CLO debt investors are subject to the risk that the holders of a majority of the equity tranche can direct a call or refinancing of a CLO, causing such CLO’s outstanding CLO debt securities to be repaid at par earlier than expected. This and other factors can cause considerable uncertainty in the average lives of the CLO tranches in which we invest.
Our portfolio of corporate CLO investments may lack diversification, which may subject us to a risk of significant loss if one or more of these corporate CLOs experience a high level of defaults on collateral.
Because we do not have fixed guidelines for diversification, we do not have any limitations on the ability to invest in any one CLO, and our investments may be concentrated in relatively few CLOs, CLOs that have similar risk profiles (including by being concentrated in a limited number of industries), CLOs where there is an overlap of underlying corporate issuers or CLOs
35
that are managed by the same collateral manager. The overlap of underlying corporate issuers is often more prevalent across CLOs of the same year of origination, as well as across CLOs managed by the same asset manager or collateral manager.
To the extent that our Manager's pastCLO investments are less diversified, we are susceptible to a greater risk of loss if one or more of the CLOs in which we are invested performs poorly, or in the event a CLO collateral manager were to fail, experience the loss of key employees or sell its business. To the extent we invest in CLOs that have a high level of overlap of underlying corporate obligors, there is a greater likelihood of experiencing multiple defaults in our CLO portfolio, which could materially adversely affect our business, financial condition and results of operations, and our ability to pay dividends to our shareholders.
Failure by a CLO to satisfy certain tests, including as a result of loan defaults and/or negative loan ratings migration, may place pressure on the performance of our investments in such CLO.
The failure by a CLO in which we invest to satisfy certain tests, including with respect to adequate collateralization and/or interest coverage, would generally lead to a reduction in the payments made to holders of its mezzanine debt and equity tranches. In a typical corporate CLO, nonperforming assets, or performing assets rated “CCC+” or lower (or their equivalent) in excess of applicable limits, typically do not receive full par credit for purposes of calculation of the CLO’s overcollateralization tests. As a result, if an asset were to default, or an asset’s credit rating were to decrease to a lower credit rating level, also known as "negative rating migration," it could cause a CLO to move out of compliance with some or all of its overcollateralization tests. CLOs are also generally subject to interest coverage tests, under each of which the interest income generated by the underlying assets is compared to the interest owed to a given CLO tranche and all tranches more senior to it. To the extent that any overcollateralization tests or interest coverage tests are breached, cash flows could be diverted away from the CLO mezzanine debt and equity tranches in favor of the more senior CLO debt tranches until and unless such breaches are cured, which could materially adversely affect our business, financial condition and results of operations, and our ability to pay dividends to our shareholders.
Our CLO debt investments are subject to credit rating changes.
Our investments in CLO debt tranches are subject to credit rating upgrades or downgrades by the NRSROs. Ratings downgrades on our CLO debt investments may result in our investments being viewed as riskier than they were previously thought to be. This perception of increased riskiness resulting from a downgrade can result in adverse impacts to the market value and liquidity of our CLO debt investments, as well as reduce the availability or increase the cost of repo financing for our CLO debt investments.
CLO investments involve complex documentation.
CLOs are often governed by a complex series of legal documents and contracts. As a result, the risk of dispute over the interpretation or enforceability of the documentation may be higher relative to other types of investments. Further, the complex structure of a particular security may not be fully understood at the time of investment and may produce disputes with the issuer or unexpected investment results, which could materially adversely affect our business, financial condition and results of operations, and our ability to pay dividends to our shareholders.
We are dependent on the collateral managers of the corporate CLOs in which we invest, and those corporate CLOs are generally not registered under the Investment Company Act.
We invest in CLO securities issued by CLOs that are managed by collateral managers unaffiliated with us, and we are dependent on the skill and expertise of such managers. While the actions of the CLO collateral managers may significantly affect the return on our investments, we typically do not have any direct contractual relationship with these collateral managers.
While we also rely on these collateral managers to act in the best interests of the CLOs in which we invest, there can be no assurance that such collateral managers will do so. Moreover, such collateral managers are subject to fiduciary duties owed to other classes of notes besides those in which we invest, and they may have other incentives to manage the CLO portfolios in a manner that disadvantages the particular classes of notes in which we are invested. Furthermore, since the CLO issuer often provides an indemnity to its collateral manager, the CLO tranches we hold may ultimately bear the burden of any legal claims brought against the collateral manager, including any legal claims brought by us.
In addition, the CLOs in which we invest are generally not registered as investment companies under the Investment Company Act. As investors in these CLOs, we are not afforded the protections that shareholders in an investment company registered under the Investment Company Act would have.
We may only have limited information regarding the underlying assets held by the CLOs in which we invest, and collateral managers may not identify or report issues relating to the underlying assets on a timely basis (or at all) to enable us to take appropriate measures to manage our risks. Further, none of the information contained in certain monthly reports nor any
36
other financial information furnished to us as an investor in a corporate CLO is audited and or reviewed, nor is an opinion expressed, by an independent public accountant.
Collateral managers are subject to removal or replacement by other holders of CLO securities without our consent and may also voluntarily resign as collateral manager or assign their role as collateral manager to another entity. The removal, replacement, resignation, or assignment of any particular CLO manager’s role could adversely affect the returns on the CLO securities in which we invest, which could materially adversely affect our business, financial condition and results of operations, and our ability to pay dividends to our shareholders.
Our CLO investments often have limited liquidity.
We expect to focus our CLO investment activity in mezzanine debt and equity tranches, which have less liquidity than many other securities, including as a result of lower trading volumes, transfer restrictions, and their bespoke nature. This illiquidity results in price volatility and can make it more difficult to value or sell these securities if the need arises, which could require us to realize a greater loss if we are ever required to liquidate such assets, which could materially adversely affect our business, financial condition and results of operations, and our ability to pay dividends to our shareholders.
The CLOs in which we invest incur significant operating expenses.
The CLOs in which we invest incur significant operating expenses, including but not limited to collateral management fees, administrative expenses, and other operating expenses. As the most subordinated tranche, the CLO equity tranche typically bears the primary burden of these expenses, although such expenses can also be borne by mezzanine debt tranches to the extent that the CLO equity tranche suffers a total principal loss.
We and our corporate CLO investments are subject to risks associated with non-U.S. investing, including in some cases foreign currency risk.
While we invest primarily in CLOs that hold underlying U.S. assets, we may also invest in corporate CLOs that hold non-U.S. assets, and we expect that many of the CLO issuers in which we invest will be sufficientdomiciled outside the United States. Investing directly or indirectly in non-U.S. issuers may expose us to successfully manageadditional risks, including political and social instability, expropriation, imposition of foreign taxes, less developed bankruptcy laws, difficulty in enforcing contractual obligations, lack of uniform accounting and auditing standards, currency fluctuations and greater price volatility. Further, we, and the CLOs in which we invest, may have difficulty enforcing creditor’s rights in foreign jurisdictions.
A portion of our business as a REIT.CLO investments (and the income and gains received by us in respect of such investments) may be denominated in currencies other than the U.S. dollar. Accordingly, changes in foreign currency exchange rates may materially adversely affect the value of these investments.
Our Manager has operated usinvestments in corporate CLOs may result in our recognizing taxable income prior to receiving cash distributions related to such income.
The tax implications of the corporate CLOs in which we invest are complex and, in some circumstances, unclear. In particular, we may recognize taxable income on certain of our CLO investments without the concurrent receipt of cash.
CLOs in which we invest could become subject to U.S. federal income tax or withholding requirements.
The CLO issuers in which we invest will generally operate pursuant to investment guidelines intended to ensure that the CLO is not treated for U.S. federal income tax purposes as engaged in a REIT since 2013. U.S. trade or business. If a CLO issuer fails to comply with the investment guidelines, or if the Internal Revenue Service otherwise successfully asserts that the CLO should be treated as engaged in a U.S. trade or business, such CLO could be subject to U.S. federal income tax, which could reduce the amount available to distribute to mezzanine debt and equity holders in such CLO, including us.
The REITU.S. Foreign Account Tax Compliance Act provisions of the Code are complex,impose a withholding tax of 30% on certain U.S. source periodic payments, including interest and any failuredividends, to certain non-U.S. entities, including certain non-U.S. financial institutions and investment funds, unless such non-U.S. entity complies with certain reporting requirements regarding its U.S. account holders and its U.S. owners. Most CLOs in which we invest will be treated as non-U.S. financial entities for this purpose, and therefore will be required to comply with those provisionsthese reporting requirements to avoid the 30% withholding. If a CLO in which we invest fails to properly comply with these reporting requirements, certain payments received by such CLO may be subject to the 30% withholding tax, which could reduce the amount available to distribute to equity and mezzanine debt holders in such CLO, including us.
37
Our manager has significant latitude in determining the types of assets we acquire, and there is no specific prohibition in our investment strategy, investment guidelines and/or the REIT qualification requirements against investing in corporate CLOs or other corporate investments.
To maintain our qualification as a timely manner could prevent us fromREIT and avoid being treated as an investment company under the Investment Company Act, we are subject to various requirements and tests that impose limits on our investment strategy. However, neither the broad investment guidelines in our management agreement, the REIT qualification requirements, nor the Investment Company Act impose any specific limits on, or prohibitions against, investing our capital in corporate CLOs or other corporate investments. Under the terms of our management agreement, our Manager has significant latitude within our broad investment guidelines in determining the types of assets it may acquire. Our Board of Trustees generally does not review individual acquisitions, dispositions, or many other management decisions. That said, our investments in CLOs generally will not be qualifying assets for purposes of the REIT 75% asset test and generally will not produce qualifying income for purposes of the REIT 75% gross income test. As a result, maintaining our qualification as a REIT will require that we limit the size of our CLO investment portfolio, and our Manager may, in the course of investing in CLO investments, utilize certain capital structures and subsidiary structures that give it more flexibility under the relevant REIT tests and Investment Company Act tests. If our Manager were to allocate a materially greater amount of our investment capital to CLOs, it may be necessary or forceadvisable for us, with the approval of our Board of Trustees, to pay unexpected taxesrevoke or otherwise terminate our REIT election.
Risks Related to our Relationship with our Manager and penalties. In such event, our net income would be reduced and we could incur a loss.Ellington
We are dependent on our Manager and certain key personnel of Ellington that are provided to us through our Manager and may not find a suitable replacement if our Manager terminates the management agreement or such key personnel are no longer available to us.
We do not have any employees of our own. Our officers are employees of Ellington or one or more of its affiliates. We have no separate facilities and are completely reliant on our Manager, which has significant discretion as to the implementation of our operating policies and execution of our business strategies and risk management practices. We also depend on our Manager's access to the professionals and principals of Ellington as well as information and deal flow generated by Ellington. The employees of Ellington identify, evaluate, negotiate, structure, close, and monitor our portfolio. The departure of any of the senior officers of our Manager, or of a significant number of investment professionals or principals of Ellington or the inability of such personnel to perform their duties due to acts of God, pandemics such as the COVID-19 pandemic, war or other geopolitical conflict, terrorism, elevated inflation, high energy costs, social unrest, or civil disturbances, could have a material adverse effect on our ability to achieve our objectives. We can offer no assurance that our Manager will remain our manager or that we will continue to have access to our Manager's senior management. We are subject to the risk that our Manager will terminate the management agreement or that we may deem it necessary to terminate the management agreement or prevent certain individuals from performing services for us and that no suitable replacement will be found to manage us.
The management fees payable to our Manager are payable regardless of the performance of our portfolio, which may reduce our Manager's incentive to devote the time and effort to seeking profitable opportunities for our portfolio.
We pay our Manager management fees, which may be substantial, based on our shareholders' equity (as defined in the management agreement) regardless of the performance of our portfolio. The management fee takes into account the net issuance proceeds of both common and preferred share offerings. Our Manager's entitlement to non-performance-based compensation might reduce its incentive to devote the time and effort of its professionals to seeking profitable opportunities for
our portfolio, which could result in a lower performance of our portfolio and could materially adversely affect our business, financial condition and results of operations, and our ability to pay dividends to our shareholders.
Our Board of Trustees has approved very broad investment guidelines for our Manager and will not approve each decision made by our Manager to acquire, dispose of, or otherwise manage an asset.
Our Manager is authorized to follow very broad guidelines in pursuing our strategy. While our Board of Trustees periodically reviews our guidelines and our portfolio and asset-management decisions, including our decision to begin making CLO investments, it generally does not review all of our proposed acquisitions, dispositions, and other management decisions. In addition, in conducting periodic reviews, our Board of Trustees relies primarily on information provided to them by our Manager. Furthermore, our Manager may arrange for us to use complex strategies or to enter into complex transactions that may be difficult or impossible to unwind by the time they are reviewed by our Board of Trustees. Our Manager has great latitude within the broad guidelines in determining the types of assets it may decide are proper for us to acquire and other decisions with respect to the management of those assets subject to our maintaining our qualification as a REIT. Poor decisions could have a material adverse effect onmaterially adversely affect our business, financial condition and results of operations, and our ability to pay dividends to our shareholders.
We compete with Ellington's other accounts for access to Ellington.Ellington and for opportunities to acquire assets.
38
Ellington has sponsored and/or currently manages accounts with a focus that overlaps with our investment focus, and expects to continue to do so in the future. Ellington is not restricted in any way from sponsoring or accepting capital from new accounts, even for investing in asset classes or strategies that are similar to, or overlapping with, our asset classes or strategies. Therefore, we compete for access to the benefits that our relationship with our Manager and Ellington provides us. For the same reasons, the personnel of Ellington and our Manager may be unable to dedicate a substantial portion of their time to managing our assets.
Since many of our targeted assets are typically available only in specified quantities and are also targeted assets for other Ellington accounts, Ellington often is not able to buy as much of any asset or group of assets as would be required to satisfy the needs of all of Ellington's accounts. In these cases, Ellington's investment allocation procedures and policies typically allocate such assets to multiple accounts in proportion to their needs and available capital. As part of these policies, accounts that are in a "start-up" or "ramp-up" phase may get allocations above their proportion of available capital, which could work to our disadvantage, particularly because there are no limitations surrounding Ellington's ability to create new accounts. In addition, the policies permit departure from proportional allocations under certain circumstances, for example when such allocation would result in an inefficiently small amount of the security or assets being purchased for an account, which may also result in our not participating in certain allocations.
There are conflicts of interest in our relationships with our Manager and Ellington, which could result in decisions that are not in the best interests of our shareholders.
We are subject to conflicts of interest arising out of our relationship with Ellington and our Manager. Currently, all of our executive officers, and two of our trustees, are employees of Ellington or one or more of its affiliates. As a result, our Manager and our officers may have conflicts between their duties to us and their duties to, and interests in, Ellington or our Manager. For example, Mr. Penn, our President and Chief Executive Officer and one of our trustees, also serves as the President and Chief Executive Officer of, and as a member of the Board of Directors of, Ellington Financial LLC,Inc., and Vice Chairman and Chief Operating Officer of Ellington, Ms. Mumford, our Chief Financial Officer, also serves as the Chief Financial Officer of Ellington Financial LLC, Mr. Tecotzky, our Co-Chief Investment Officer, also serves as the Co-Chief Investment Officer of Ellington Financial LLC, and a Managing Director of Ellington, andEllington. Mr. Vranos, our Co-Chief Investment Officer and one of our trustees, also serves as the Co-Chief Investment Officer of Ellington Financial Inc., and Chairman of Ellington. Mr. Tecotzky, our Co-Chief Investment Officer, also serves as the Co-Chief Investment Officer of Ellington Financial Inc., and as Vice Chairman - Co-Head of Credit Strategies of Ellington. Mr. Smernoff, our Chief Financial Officer, also serves as the Chief Accounting Officer of Ellington Financial Inc. Mr. Herlihy, our Chief Operating Officer, also serves as the Chief Financial Officer of Ellington Financial Inc., and as a member of the Board of Directors of, Ellington Financial LLC, and ChairmanManaging Director of Ellington.
We may acquire or sell assets in which Ellington or its affiliates have or may have an interest. Similarly, Ellington or its affiliates may acquire or sell assets in which we have or may have an interest. Although such acquisitions or dispositions may present conflicts of interest, we nonetheless may pursue and consummate such transactions. Additionally, we may engage in transactions directly with Ellington or its affiliates, including the purchase and sale of all or a portion of a portfolio asset.
Acquisitions made for entities with similar objectives may be different from those made on our behalf. Ellington may have economic interests in, or other relationships with, others in whose obligations or securities we may acquire. In particular, such persons may make and/or hold an investment in securities that we acquire that may be pari passu, senior, or junior in ranking to our interest in the securities or in which partners, security holders, officers, directors, agents, or employees of such persons serve on boards of directors or otherwise have ongoing relationships. Each of such ownership and other relationships may result in securities laws restrictions on transactions in such securities and otherwise create conflicts of interest. In such instances, Ellington may, in its sole discretion, make recommendations and decisions regarding such securities for other entities that may be the same as or different from those made with respect to such securities and may take actions (or omit to take actions) in the context of these other economic interests or relationships the consequences of which may be adverse to our interests.
In deciding whether to issue additional debt or equity securities, we will rely in part on recommendations made by our Manager. While such decisions are subject to the approval of our Board of Trustees, two of our trustees are also Ellington employees. Because our Manager earns management fees that are based on the total amount of our equity capital, our Manager may have an incentive to recommend that we issue additional equity securities. In addition, through its non-voting special membership interests in an affiliate of Ellington, the Blackstone Funds are entitled to receive distributions from such affiliate equal to a portion of the management fees that are paid to our Manager, and therefore our trustee affiliated with Blackstone may have a similar incentive for us to issue additional equity securities. See below for further discussion of the adverse impact future debt or equity offerings could have on our common shares. Future offerings of debt securities, which would rank senior to our common shares upon liquidation, and future offerings of equity securities which would dilute the common shares share
39
holdings of our existing shareholders and may be senior to our common shares for the purposes of dividend and liquidating distributions, may adversely affect the market price of our common shares.
The officers of our Manager and its affiliates devote as much time to us as our Manager deems appropriate; however, these officers may have conflicts in allocating their time and services among us and Ellington and its affiliates' accounts. During turbulent conditions in the mortgage industry, distress in the credit markets or other times when we will need focused support and assistance from our Manager and Ellington employees, other entities that Ellington advises or manages will likewise require greater focus and attention, placing our Manager and Ellington's resources in high demand. In such situations, we may not receive the necessary support and assistance we require or would otherwise receive if we were internally managed or if Ellington or its affiliates did not act as a manager for other entities.
We, directly or through Ellington, may obtain confidential information about the companies or securities in which we have invested or may invest. If we do possess confidential information about such companies or securities, there may be restrictions on our ability to dispose of, increase the amount of, or otherwise take action with respect to the securities of such companies. Our Manager's and Ellington's management of other accounts could create a conflict of interest to the extent our Manager or Ellington is aware of material non-public information concerning potential investment decisions. We have implemented compliance procedures and practices designed to ensure that investment decisions are not made while in possession of material non-public information. We cannot assure you, however, that these procedures and practices will be effective. In addition, this conflict and these procedures and practices may limit the freedom of our Manager to make potentially profitable investments, which could have an adverse effect on our operations. These limitations imposed by access
to confidential information could therefore materially adversely affect our business, financial condition and results of operations, and our ability to pay dividends to our shareholders.
The management agreement with our Manager was not negotiated on an arm's-length basis and may not be as favorable to us as if it had been negotiated with an unaffiliated third party and may be costly and difficult to terminate.
Our management agreement with our Manager was negotiated between related parties, and its terms, including fees payable, may not be as favorable to us as if it had been negotiated with an unaffiliated third party. Various potential and actual conflicts of interest may arise from the activities of Ellington and its affiliates by virtue of the fact that our Manager is controlled by Ellington.
Termination of our management agreement without cause, including termination for poor performance or non-renewal, is subject to several conditions which may make such a termination difficult and costly. The management agreement has a current term that expires on September 24, 2018,2024, and will be automatically renewed for successive one-year terms thereafter unless notice of non-renewal is delivered by either party to the other party at least 180 days prior to the expiration of the then current term. The management agreement provides that it may be terminated by us based on performance upon the affirmative vote of at least two-thirds of our independent trustees,Board of Trustees, or by a vote of the holders of at least a majority of our outstanding common shares, based either upon unsatisfactory performance by our Manager that is materially detrimental to us or upon a determination by the Board of Trusteesour independent trustees that the management feefees payable to our Manager isare not fair, subject to our Manager's right to prevent such a fee-based termination by accepting a mutually acceptable reduction of management fees. In the event we terminate the management agreement as discussed above or elect not to renew the management agreement, we will be required to pay our Manager a termination fee equal to 5% of our shareholders' equity as of the month-end preceding the date of the notice of termination or non-renewal. These provisions will increase the effective cost to us of terminating the management agreement, thereby adversely affecting our ability to terminate our Manager without cause.
Pursuant to the management agreement, our Manager will not assume any responsibility other than to render the services called for thereunder and will not be responsible for any action of our Board of Trustees in following or declining to follow its advice or recommendations. Under the terms of the management agreement, our Manager, Ellington, and their affiliates and each of their officers, directors, trustees, members, shareholders, partners, managers, investment and risk management committee members, employees, agents, successors and assigns, will not be liable to us for acts or omissions performed in accordance with and pursuant to the management agreement, except because of acts constituting bad faith, willful misconduct, gross negligence, fraud or reckless disregard of their duties under the management agreement. In addition, we will indemnify our Manager, Ellington, and their affiliates and each of their officers, directors, trustees, members, shareholders, partners, managers, investment and risk management committee members, employees, agents, successors and assigns, with respect to all expenses, losses, damages, liabilities, demands, charges and claims arising from acts of our Manager not constituting bad faith, willful misconduct, gross negligence, fraud or material breach or reckless disregard of duties, performed in good faith in accordance with and pursuant to the management agreement.
40
Our Manager's failure to identify and acquire assets that meet our asset criteria or perform its responsibilities under the management agreement could materially adversely affect our business, financial condition and results of operations, our ability to pay dividends to our shareholders, and our ability to maintain our qualification as a REIT and our ability to pay dividends to our shareholders.REIT.
Our ability to achieve our objectives depends on our Manager's ability to identify and acquire assets that meet our asset criteria. Accomplishing our objectives is largely a function of our Manager's structuring of our investment process, our access to financing on acceptable terms, and general market conditions. Our shareholders do not have input into our investment decisions. All of these factors increase the uncertainty, and thus the risk, of investing in our common shares. The senior management team of our Manager has substantial responsibilities under the management agreement. In order to implement certain strategies, our Manager may need to hire, train, supervise, and manage new employees successfully. Any failure to manage our future growth effectively could have a material adversematerially adversely effect on our business, financial condition and results of operations, our ability to pay dividends to our shareholders and our ability to maintain our qualification as a REIT and our ability to pay dividends to our shareholders.REIT.
If our Manager ceases to be our Manager pursuant to the management agreement or one or more of our Manager's key personnel ceases to provide services to us, our lenders and our derivative counterparties may cease doing business with us.
If our Manager ceases to be our Manager, including upon the non-renewal of our management agreement, or if one or more of our Manager's key personnel cease to provide services for us, it could constitute an event of default or early termination event under many of our repo financing and derivative hedging agreements, upon which ourthe relevant counterparties would have the right to terminate their agreements with us. If our Manager ceases to be our Manager for any reason, including upon the non-renewal of our management agreement and we are unable to obtain or renew financing or enter into or maintain derivative transactions, it could materially adversely affect our business, financial condition and results of operations, and our ability to pay dividends to our shareholders may be materially adversely affected.
shareholders.
We do not own the Ellington brand or trademark, but may use the brand and trademark as well as our logo pursuant to the terms of a license granted by Ellington.
Ellington has licensed the "Ellington" brand, trademark, and logo to us for so long as our Manager or another affiliate of Ellington continues to act as our manager. We do not own the brand, trademark, or logo that we will use in our business and may be unable to protect this intellectual property against infringement from third parties. Ellington retains the right to continue using the "Ellington" brand and trademark. We will further be unable to preclude Ellington from licensing or transferring the ownership of the "Ellington" brand and trademark to third parties, some of whom may compete against us. Consequently, we will be unable to prevent any damage to goodwill that may occur as a result of the activities of Ellington or others. Furthermore, in the event our Manager or another affiliate of Ellington ceases to act as our manager, or in the event Ellington terminates the license, we will be required to change our name and trademark. Any of these events could disrupt our recognition in the marketplace, damage any goodwill we may have generated, and otherwise harm our business. Finally, the license is a domestic license in the United States only and does not give us any right to use the "Ellington" brand, trademark, and logo overseas even though we expect to use the brand, trademark, and logo overseas. Our use of the "Ellington" brand, trademark and logo overseas will therefore be unlicensed and could expose us to a claim of infringement.
Risks Related to Our Common Shares
Our shareholders may not receive dividends or dividends may not grow over time.
Our ability to pay dividends may be adversely affected by a numberimpaired if any of factors, including the risk factorsrisks described herein. All dividends will be declared at the discretionin this Annual Report on Form 10-K, or any of our Boardother periodic or current reports filed with the SEC, were to occur. In addition, payment of Trustees and will depend ondividends depends upon our earnings, liquidity, financial condition, the REIT distribution requirements, our financial condition,covenants, and other factors asthat our Board of Trustees may deem relevant from time to time. We cannot assure you that our business will generate sufficient cash flow from operations or that future borrowings or other capital will be available to us in an amount sufficient to enable us to make distributions on our common shares, to pay our indebtedness, or to fund other liquidity needs. Our Board of Trustees will
41
continue to assess the dividend rate on our common shares on an ongoing basis, as market conditions and our financial position continue to evolve. Our Board of Trustees is under no obligation or requirement to declare a dividend.any dividend distribution. We cannot assure you that we will achieve results that will allow us to pay a specified level of dividends or to increase dividends from one yearperiod to the next. Among the factors that could materially adversely affect our business, financial condition and results of operations, and our ability to pay dividends to our shareholders are:
An increase in interest rates may have an adverse effect on the market price of our common shares and our ability to pay dividends to our shareholders.
One of the factors that investors may consider in deciding whether to buy or sell our common shares is our dividend rate (or expected future dividend rate) as a percentage of our common share price, relative to market interest rates. If market interest rates continue to increase or do not decline from their current levels, prospective investors may demand a higher dividend rate on our common shares or seek alternative investments paying higher dividends or interest. We cannot assure you that we will achieve results that will allow us to increase our dividend rate in response to market interest rate increases. As a result, interest rate fluctuations and capital market conditions can affect the market price of our common shares independent of the effects such conditions may have on our portfolio. For instance, if interest rates rise without an increase in our dividend rate, the market price of our common shares could decrease because potential investors may require a higher dividend yield on our common shares as market rates on interest-bearing instruments such as bonds rise. In addition, to the extent we have variable rate debt, such as our repurchase agreementrepo financing, rising interest rates would result in increased interest expense on this variable rate debt, thereby adversely affecting our cash flow and our ability to service our indebtedness and pay dividends to our shareholders.
Investing in our common shares involves a high degree of risk.
The assets we purchase in accordance with our objectives may result in a higher amount of risk than other alternative asset acquisition options. The assets we acquire may be highly speculative and aggressive and may be subject to a variety of risks, including credit risk, prepayment risk, interest rate risk, and market risk. As a result, an investment in our common shares may not be suitable for investors with lower risk tolerance.
Risks Related to Our Organization and Structure
Maintenance of our exclusion from registration as an investment company under the Investment Company Act imposes significant limitations on our operations. If we were required to register as an investment company under the Investment Company Act, we would be subject to the restrictions imposed by the Investment Company Act, which would require us to make material changes to our strategy.
We have conducted and intend to continue to conduct our operations so that neither we nor any of our subsidiaries are required to register as an investment company under the Investment Company Act. Both we and our Operating Partnership are organized as holding companies and conduct our business primarily through wholly-owned subsidiaries of our Operating Partnership. Investments in subsidiaries that rely on the exclusions from the definition of investment company under 3(c)(1) or 3(c)(7) of the Investment Company Act are considered investment securities for the purposes of the 40% Test. Therefore, our Operating Partnership's investments in its 3(c)(7) subsidiaries and its other investment securities cannot exceed 40% of the value of our Operating Partnership's total assets (excluding U.S. government securities and cash) on an unconsolidated basis. This requirement limits the types of businesses in which we may engage and the assets we may hold. Certain of our Operating Partnership's subsidiaries rely on the exclusion provided by Section 3(c)(5)(C) of the Investment Company Act. Section 3(c)(5)(C) of the Investment Company Act is designed for entities "primarily engaged in the business of purchasing or otherwise
acquiring mortgages and other liens on and interests in real estate." This exclusion generally requires that at least 55% of the entity's assets on an unconsolidated basis consist of qualifying real estate assets and at least 80% of the entity's assets on an unconsolidated basis consist of qualifying real estate assets or real estate-related assets. These requirements limit the assets those subsidiaries can own and the timing of sales and purchases of those assets.
To classify the assets held by our subsidiaries as qualifying real estate assets or real estate-related assets, we rely on no-action letters and other guidance published by the SEC staff regarding those kinds of assets, as well as upon our analyses (in consultation with outside counsel) of guidance published with respect to other types of assets. There can be no assurance that the laws and regulations governing the Investment Company Act status of companies similar to ours, or the guidance from the SEC staff regarding the treatment of assets as qualifying real estate assets or real estate-related assets, will not change in a manner that adversely affects our operations. In fact, in August 2011, the SEC published a concept release in which it asked for comments on this exclusion from registration. To the extent that the SEC staff provides more specific guidance regarding any of the matters bearing upon our exclusion from the definition of an investment company under the Investment Company Act, we may be required to adjust our strategy accordingly. Any additional guidance from the SEC staff could further inhibit our ability to pursue the strategies that we have chosen. Furthermore, although we monitor the assets of our subsidiaries regularly, there can be no assurance that our subsidiaries will be able to maintain their exclusion from registration. Any of the foregoing could require us to adjust our strategy, which could limit our ability to make certain investments or require us to sell assets in a
42
manner, at a price or at a time that we otherwise would not have chosen. This could negatively affect the value of our common shares, the sustainability of our business model, and our ability to pay dividends to our shareholders. If we were required to register as an investment company under the Investment Company Act, we would be subject to the restrictions imposed by the Investment Company Act, which would require us to make material changes to our strategy that could have a materially adverse effect on our business, financial condition, and results of operations.
The ownership limits in our declaration of trust may discourage a takeover or business combination that may have benefited our shareholders.
To assist us in qualifying as a REIT, among other purposes, our declaration of trust restricts the beneficial or constructive ownership of our shares by any person to no more than 9.8% in value or thein number of shares, whichever is more restrictive, of the outstanding shares of any class or series of our shares. This and other restrictions on ownership and transfer of our shares contained in our declaration of trust may discourage a change of control of us and may deter individuals or entities from making tender offers for our common shares on terms that might be financially attractive to you or which may cause a change in our management. In addition to deterring potential transactions that may be favorable to our shareholders, these provisions may also decrease your ability to sell our common shares.
Our shareholders' ability to control our operations is severely limited.
Our Board of Trustees has approval rights with respect to our major strategies, including our strategies regarding investments, financing, growth, debt capitalization, REIT qualification and distributions. Our Board of Trustees may amend or revise these and other strategies without a vote of our shareholders.
Certain provisions of Maryland law could inhibit a change in our control.
Certain provisions of the Maryland General Corporation Law, or the MGCL,"MGCL," applicable to a Maryland real estate investment trust may have the effect of inhibiting a third party from making a proposal to acquire us or of impeding a change in our control under circumstances that otherwise could provide the holders of our common shares with the opportunity to realize a premium over the then prevailing market price of such shares. We are subject to the "business combination" provisions of the MGCL that, subject to limitations, prohibit certain business combinations between us and an "interested shareholder" (defined generally as any person who beneficially owns 10% or more of our then outstanding voting shares or an affiliate or associate of ours who, at any time within the two-year period prior to the date in question, was the beneficial owner of 10% or more of our then outstanding voting shares) or an affiliate thereof for five years after the most recent date on which the shareholder becomes an interested shareholder and, thereafter, imposes minimum price or supermajority shareholder voting requirements on these combinations. These provisions of the MGCL do not apply, however, to business combinations that are approved or exempted by the board of trustees of a real estate investment trust prior to the time that the interested shareholder becomes an interested shareholder. Pursuant to the statute, our Board of Trustees has by resolution exempted business combinations between us and any other person, provided that the business combination is first approved by our Board of Trustees, including a majority of our trustees who are not affiliates or associates of such person. This resolution, however, may be altered or repealed in whole or in part at any time. If this resolution is repealed, or our Board of Trustees does not otherwise approve a business combination, this statute may discourage others from trying to acquire control of us and increase the difficulty of consummating any offer.
The "control share" provisions of the MGCL provide that holders of "control shares" of a Maryland real estate investment trust (defined as shares which, when aggregated with all other shares controlled by the shareholder, entitle the shareholder to exercise one of three increasing ranges of voting power in the election of trustees) acquired in a "control share acquisition" (defined as the acquisition of "control shares," subject to certain exceptions) have no voting rights with respect to
the control shares except to the extent approved by the Maryland real estate investment trust's shareholders by the affirmative vote of at least two-thirds of all the votes entitled to be cast on the matter, excluding votes entitled to be cast by the acquirer of control shares, its officers and its trustees who are also employees of the Maryland real estate investment trust. Our bylaws contain a provision exempting from the control share acquisition statute any and all acquisitions by any person of our shares. There can be no assurance that this provision will not be amended or eliminated at any time in the future.
The "unsolicited takeover" provisions of the MGCL permit our Board of Trustees, without shareholder approval and regardless of what is currently provided in our declaration of trust or bylaws, to implement certain provisions. These provisions may have the effect of inhibiting a third party from making an acquisition proposal for us or of delaying, deferring or preventing a change in our control under circumstances that otherwise could provide the holders of our common shares with the opportunity to realize a premium over the then current market price.
Our authorized but unissued common and preferred shares may prevent a change in our control.
Our declaration of trust authorizes us to issue additional authorized but unissued common shares and preferred shares. In addition, our Board of Trustees may, without shareholder approval, approve amendments to our declaration of trust to increase
43
the aggregate number of our authorized shares or the number of shares of any class or series that we have authority to issue and may classify or reclassify any unissued common shares or preferred shares and may set the preferences, rights and other terms of the classified or reclassified shares. As a result, among other things, our Board of Trustees may establish a class or series of common shares or preferred shares that could delay or prevent a transaction or a change in our control that might involve a premium price for our common shares or otherwise be in the best interests of our shareholders.
Our rights and the rights of our shareholders to take action against our trustees and officers or against our Manager or Ellington are limited, which could limit your recourse in the event actions are taken that are not in your best interests.
Our declaration of trust limits the liability of our present and former trustees and officers to us and our shareholders for money damages to the maximum extent permitted under Maryland law. Under current Maryland law, our present and former trustees and officers will not have any liability to us or our shareholders for money damages other than liability resulting from:
•actual receipt of an improper benefit or profit in money, property or services; or
•active and deliberate dishonesty by the trustee or officer that was established by a final judgment and is material to the cause of action.
Our declaration of trust authorizes us to indemnify our present and former trustees and officers for actions taken by them in those and other capacities to the maximum extent permitted by Maryland law. Our bylaws require us to indemnify each present and former trustee or officer, to the maximum extent permitted by Maryland law, in the defense of any proceeding to which he or she is made, or threatened to be made, a party by reason of his or her service to us as a trustee or officer or in certain other capacities. In addition, we may be obligated to pay or reimburse the expenses incurred by our present and former trustees and officers without requiring a preliminary determination of their ultimate entitlement to indemnification.
As a result, we and our shareholders may have more limited rights against our present and former trustees and officers than might otherwise exist absent the current provisions in our declaration of trust and bylaws or that might exist with other companies, which could limit your recourse in the event of actions not in your best interest.
Our declaration of trust contains provisions that make removal of our trustees difficult, which could make it difficult for our shareholders to effect changes to our management.
Our declaration of trust provides that, subject to the rights of holders of any series of preferred shares, a trustee may be removed only for "cause" (as defined in our declaration of trust), and then only by the affirmative vote of at least two-thirds of the votes entitled to be cast generally in the election of trustees. Vacancies generally may be filled only by a majority of the remaining trustees in office, even if less than a quorum, for the full term of the class of trustees in which the vacancy occurred. These requirements make it more difficult to change our management by removing and replacing trustees and may prevent a change in our control that is in the best interests of our shareholders.
Our declaration of trust generally does not permit ownership in excess of 9.8% of any class or series of our shares of beneficial interest, and attempts to acquire our shares in excess of the share ownership limits will be ineffective unless an exemption is granted by our Board of Trustees.
Our declaration of trust generally prohibits beneficial or constructive ownership by any person of more than 9.8% in value or by number of shares, whichever is more restrictive, of any class or series of our outstanding shares and contains certain other limitations on the ownership and transfer of our shares. Our Board of Trustees, in its sole discretion, may grant an exemption to
certain of these prohibitions, subject to certain conditions and receipt by our board of certain representations and undertakings. Our Board of Trustees may from time to time increase this ownership limit for one or more persons and may increase or decrease such limit for all other persons. Any decrease in the ownership limit generally applicable to all shareholders will not be effective for any person whose percentage ownership of our shares is in excess of such decreased ownership limit until such time as such person's percentage ownership of our shares equals or falls below such decreased ownership limit, but any further acquisition of our shares in excess of such decreased ownership limit will be in violation of the decreased ownership limit. Our Board of Trustees may not increase the ownership limit (whether for one person or all shareholders) if such increase would allow five or fewer individuals to beneficially own more than 49.9% in value of our outstanding shares.
Our declaration of trust's constructive ownership rules are complex and may cause the outstanding shares owned by a group of related individuals or entities to be deemed to be constructively owned by one individual or entity. As a result, the acquisition of less than 9.8% of the outstanding shares of any class or series by an individual or entity could cause that individual or entity to own constructively in excess of 9.8% of the outstanding shares of such class or series and thus violate the ownership limit or other restrictions on ownership and transfer of our shares. Any attempt to own or transfer our common shares or preferred shares (if and when issued) in excess of such ownership limit without the consent of our board of trustees or in a manner that would cause us to be "closely held" under Section 856(h) of the Code (without regard to whether the shares are held during the last half of a taxable year) or otherwise fail to qualify as a REIT will result in the shares being automatically
44
transferred to a trustee for a charitable trust or, if the transfer to the charitable trust is not automatically effective to prevent a violation of the share ownership limits or the restrictions on ownership and transfer of our shares, any such transfer of our shares will be void ab initio. Further, any transfer of our shares that would result in our shares being beneficially owned by fewer than 100 persons will be void ab initio.
U.S. Federal Income Tax Risks
Your investment has various U.S. federal, state, and local income tax risks.
We strongly urge you to consult your own tax advisor concerning the effects of U.S. federal, state, and local income tax law on an investment in our common shares and on your individual tax situation.
Our failure to qualifymaintain our qualification as a REIT would subject us to U.S. federal, state and local income taxes, which could adversely affect the value of our common shares and wouldcould substantially reduce the cash available for distribution to our shareholders.
We believe that commencing with our short taxable year ended December 31, 2013, we have been organized in conformity with, and have operated in a manner that has enabled us to meet, the requirements for qualification as a REIT under the Code. While we intend to continue to operate in a manner that will enable us to remain qualified as a REIT,Code; however, we cannot assure you that we will remain qualified as a REIT.
The U.S. federal income tax laws governing REITs are complex, and interpretations of the U.S. federal income tax laws governing qualification as a REIT are limited. Qualifying as a REIT requires us to meet various tests regarding the nature of our assets, our income and our earnings and profits, or "E&P" (calculated pursuant to Code Sections 316 and 857(d) and the regulations thereunder), the ownership of our outstanding stock,shares, and the amount of our distributions on an ongoing basis. Our ability to satisfy the REIT asset tests depends upon the characterization and fair market values of our assets, some of which are not susceptible to a precise determination.precisely determinable, and for which we may not obtain independent appraisals. Our compliance with the REIT incomeasset and assetincome tests and the accuracy of our tax reporting to shareholders also depend upon our ability to successfully manage the calculation and composition of our gross and net taxable income, our E&P and our assets on an ongoing basis. Even a technical or inadvertent mistake could jeopardize our REIT status. Although we intend tobelieve we have operated in the past and currently operate so as to maintain our qualificationsqualification as a REIT, given the complex nature of the rules governing REITs, the ongoing importance of factual determinations, including the potential tax treatment of the investments we make, and the possibility of future changes in our circumstances, no assurance can be given that our actual results of operations for any particular taxable year will satisfy such requirements.
If we fail to qualifymaintain our qualification as a REIT in any calendar year, and do not qualify for certain statutory relief provisions, we would be required to pay U.S. federal income tax (and any applicable state and local taxes), including, for taxable years prior to 2018, any applicable alternative minimum tax, on our taxable income at regular corporate rates, (for federal income tax purposes a maximum rate of 35% applies through 2017 and a 21% rate applies for 2018), and dividends paid to our shareholders would not be deductible by us in computing our taxable income (although such dividends received by certain non-corporate U.S. taxpayers generally would be subject to a preferential rate of taxation). Further, if we fail to qualifymaintain our qualification as a REIT, we might need to borrow money or sell assets in order to pay any resulting tax. Our payment of income tax would decrease the amount of our income available for distribution to our shareholders. Furthermore, if we fail to maintain our qualification as a REIT, we no longer would be required under U.S. federal tax laws to distribute substantially all of our REIT taxable income to our shareholders. Unless our failure to qualifymaintain our qualification as a REIT was subject to relief under the U.S. federal tax laws, we could not re-elect to qualify as a REIT until the fifth calendar year following the year in which we failed to qualify.
Complying with REIT requirements may cause us to forego or liquidate otherwise attractive investments.
To qualifymaintain our qualification as a REIT, we must continually satisfy various tests regarding the sources of our income, the nature and diversification of our assets, the amounts we distribute to our shareholders and the ownership of our shares of beneficial interest. In order to meet these tests, we may be required to forego investments we might otherwise make. We may be required to pay dividends to shareholders at disadvantageous times or when we do not have funds readily available for distribution, and may be unable to pursue investments that would be otherwise advantageous to us in order to satisfy the source of income or asset diversification requirements for qualifying as a REIT. Thus, compliance with the REIT requirements may hinder our investment performance.
In particular, we must ensure that at the end of each calendar quarter, we satisfy the REIT 75% asset test, which requires that at least 75% of the value of our total assets consistsconsist of cash, cash items, government securities and qualified REIT real estate assets, including RMBS. The remainder of our investment in securities (other than government securities and qualified REIT real estate assets) generally cannot include more than 10% of the outstanding voting securities of any one issuer or more than 10% of the total value of the outstanding securities of any one issuer. In addition, in general, no more than 5% of the value of our total assets (other than government securities, TRS securities and qualified REIT real estate assets) can consist of the securities of any one issuer, and no more than 20% of the value of our total assets can be represented by securities of one or
45
more TRSs. Generally, if we fail to comply with these requirements at the end of any calendar quarter, we must correct the failure within 30 days after the end of the calendar quarter or qualify for certain statutory relief provisions to avoid losing our REIT qualification and becoming subject to U.S. federal income tax (at a 35% rate through 2017 and a 21% rate in 2018) and any applicable state and local taxes on all of our taxable income.
In addition, we must also ensure that each taxable year we satisfy the REIT 75% and 95% gross income tests, which require that, in general, 75% of our gross income come from certain real estate-related sources and 95% of our gross income consist of gross income that qualifies for the REIT 75% gross income test or certain other passive income sources. As a result of the requirement that we satisfy both the REIT 75% asset test and the REIT 75% and 95% gross income tests, we may be required to liquidate from our portfolio otherwise attractive investments or contribute such investments to a TRS, in which event they willwould be subject to regular corporate U.S. federal, state and local taxes assuming that the TRS is organized in the United States. These actions could have the effect of reducing our income and amounts available for distribution to our shareholders. Generally, if we fail to comply with the income requirements at the end of any calendar year, we will lose our REIT qualification and may be subject to U.S. federal income tax and any applicable state and local taxes on all of our taxable income.
Failure to make required distributions would subject us to tax, which would reduce the cash available for distribution to our shareholders.
To qualifymaintain our qualification as a REIT, we must distribute to our shareholders each calendar year at least 90% of our REIT taxable income (including certain items of non-cash income), determined excluding any net capital gains and without regard to the deduction for dividends paid. Distributions of our taxable income must generally occur in the taxable year to which they relate, or in the following taxable year if declared before we timely file our tax return for the year and if paid with or before the first regular dividend payment after such declaration. To the extent that we satisfy the REIT 90% distribution requirement, but distribute less than 100% of our taxable income, we will be subject to U.S. federal corporate income tax (at a 35% rate through 2017(and any applicable state and a 21% rate in 2018)local taxes) on our undistributed income. In addition, we will incur a 4% nondeductible excise tax on the amount, if any, by which our distributions in any calendar year are less than the sum of:
•85% of our REIT ordinary income for that year;
•95% of our REIT capital gain net income for that year; and
•any undistributed taxable income from prior years.
We intend to distribute our taxable income to our shareholders in a manner intended tothat would satisfy the REIT 90% distribution requirement and to avoid the corporate income tax. These distributions will limit our ability to retain earnings and thereby replenish or increase capital from operations. However, there is no requirement that TRSs distribute their after-tax net income to their parent REIT.
Our taxable income may substantially exceed our net income as determined based on GAAP, because, for example, realized capital losses will be deducted in determining our GAAP net income, but may not be deductible in computing our taxable income. We have made an election under Section 475(f) of the Code to mark our securities to market, which may cause us to recognize taxable gains for a taxable year with respect to such securities without the receipt of any cash corresponding to such gains. Additionally, E&P in any foreign TRS are taxable to us, regardless of whether such earnings are distributed. However, overall losses in our TRSs will not reduce our taxable income, and will generally not provide any benefit to us, except for being carried forward against future TRS taxable income in the case of a domestic TRS. Also, our ability, or the ability of our subsidiaries, to deduct interest may be limited under Section 163(j) of the Code. In addition, we may invest in assets that generate taxable income in excess of economic income or in advance of the corresponding cash flow from the assets. As a result of the foregoing, we may generate less cash flow than taxable income in a particular year. To the extent that we generate such non-cash taxable income in a taxable year or have limitations on our deductions, we may incur corporate income tax and the 4% nondeductible excise tax on that income if we do not distribute such income to shareholders in that year. In that event, we may be required to use cash reserves, incur debt, sell assets, make taxable distributions of our shares or debt securities or liquidate non-cash assets at rates, at terms or at times that we regard as unfavorable, in order to satisfy the distribution requirement and to avoid corporate income tax and the 4% nondeductible excise tax in that year.
Conversely, from time to time, we may generate taxable income less than our income for financial reporting purposes due to GAAP and tax accounting differences or, as mentioned above, the timing between the recognition of taxable income and the actual receipt of cash. In such circumstances we may make distributions according to our business plan that are within our wherewithal from an economic or cash management perspective, but that are labeled as return of capital for tax reporting purposes, as they are in excess of taxable income in that period. Utilizing net operating loss or net capital loss carryforwards may allow us to reduce our required distributions to shareholders or our income tax liability, which would allow us to retain future taxable income as capital. However, if we choose to nonetheless make distributions according to our business plan or if
46
we do not generate sufficient taxable income of the appropriate tax character, such net operating loss or net capital loss carryforwards may not be fully utilized. To the extent that our net operating loss or net capital loss carryforwards expire unutilized, we may not fully realize the benefit of these tax attributes which could lead to higher annual distribution requirements or tax liabilities.
Determination of our REIT taxable income and of our E&P involves the application of highly technical and complex Code provisions for which only limited judicial and administrative authorities exist. If the IRS disagrees with our determination, it could affect our satisfaction of the distribution requirement. Under certain circumstances, we may be able to correct a failure to meet the distribution requirement for a year by paying "deficiency dividends" to our shareholders in a later year. We may include such deficiency dividends in our deduction for dividends paid for the earlier year. Although we may be able to avoid income tax on amounts distributed as deficiency dividends, we will be required to pay interest and a penalty to the IRS based upon the amount of any deduction we take for deficiency dividends.
Even if we qualifymaintain our qualification as a REIT, we may face other tax liabilities that reduce our cash flows.
Even if we qualify for taxation as a REIT, we may be subject to certain U.S. federal, state and local taxes on our income and assets, including taxes on any undistributed income, tax on income from some activities conducted as a result of a foreclosure, and state or local income, property and transfer taxes. In addition, any domestic TRSs we form will be subject to regular corporate U.S. federal, state and local taxes. Any of these taxes would decrease cash available for distributions to shareholders.
The failure of RMBS subject to a repurchase agreement to qualify as real estate assets would adversely affect our ability to qualifymaintain our qualification as a REIT.
We have entered into repurchase agreements under which we nominally sell certain of our RMBS to a counterparty and simultaneously enter into an agreement to repurchase the sold assets. We believe that, for U.S. federal income tax purposes, these transactions will be treated as secured debt and we will be treated as the tax owner of the RMBS that are the subject of any such repurchase agreement, notwithstanding that such agreements may transfer record ownership of such assets to the counterparty during the term of the agreement. It is possible, however, that the IRS could successfully assert that we do not own the RMBS during the term of the repurchase agreement, in which case we could fail to qualifymaintain our qualification as a REIT.
We purchase and sell Agency RMBS through TBAs and to holdrecognize income or disposegains from the disposition of those TBAs, through dollar roll transactions or otherwise, couldand may continue to do so in the future. While there is no direct authority with respect to the qualification of TBAs as real estate assets or U.S. Government securities for purposes of the REIT 75% asset test or the qualification of income or gains from dispositions of TBAs as gains from the sale of real property or other qualifying income for purposes of the REIT 75% gross income test, we treat the GAAP value of our TBAs under which we contract to purchase to-be-announced Agency RMBS ("long TBAs") as qualifying assets for purposes of the REIT 75% asset test, and we treat income and gains from our long TBAs as qualifying income for purposes of the REIT 75% gross income test, based on an opinion of Hunton Andrews Kurth LLP substantially to the effect that (i) for purposes of the REIT asset tests, our ownership of a long TBA should be limited.
Complying with REIT requirements may limit our ability to hedge effectively.
The REIT provisions of the Code substantially limit our ability to hedge. Under these provisions, any income that we generate from transactions intended to hedge our interest rate risk will be excluded from gross income for purposes of the REIT 75% and 95% gross income tests if the instrument hedges interest rate risk on liabilities incurred to carry or acquire real estate, and such instrument is properly identified under applicable Treasury Regulations. The requirements in the Treasury Regulations related to identifying hedging transactions are highly technical and complex for which only limited judicial and administrative authorities exist, and the IRS could disagree with and successfully challenge our treatment and identifications of such hedging transactions. Income from hedging transactions that do not meet these requirements will generally constitute non-qualifying income for purposes of both the REIT 75% and 95% gross income tests and could cause us to fail to maintain our qualification as a REIT. Our aggregate gross income from non-qualifying hedges, fees, and certainsuch transactions, along with other non-qualifying sourcesgross income that does not qualify for the
47
REIT 95% gross income test, cannot exceed 5% of our annual gross income. As a result, we might have to limit our use of advantageous hedging techniques, orand we may choose to implement thosecertain hedges through a domestic or foreign TRS. Any hedging income earned by a domestic TRS would be subject to U.S. federal, state and local income tax at regular corporate rates. This could increase the cost of our hedging activities or expose us to greater risks associated with interest rate changes or other changes than we would otherwise want to bear. In addition, losses in our TRSs will generally not provide any tax benefit, except for being carried forward against future TRS taxable income in the case of a domestic TRS. Even if the income from certain of our hedging transactions is excluded from gross income for purposes of the REIT 75% and 95% gross income tests, such income and any loss will be taken into account in determining our REIT taxable income and our distribution requirement and the GAAP value of our hedging assets will not be treated as qualified real estate assets for the REIT asset test. If the IRS disagrees with our calculation of the amount or amortization of gain or loss with respect to our hedging transactions, including the impact of our election under Section 475(f) of the Code and the treatment of hedging expense and losses under Section 163(j) of the Code and Treasury Regulation Section 1.446-4, our distribution requirement could increase, which could require that we correct any shortfall in distributions by paying deficiency dividends to our shareholders in a later year.
Our ownership of and relationship with anyour TRSs that we form will be limited, and a failure to comply with the limits would jeopardize our REIT status and may result in the application of a 100% excise tax.
A REIT may own up to 100% of the stock of one or more TRSs. A TRS may earn income that would not be qualifying income if earned directly by the parent REIT. Both the subsidiary and the REIT must jointly elect to treat the subsidiary as a TRS. A corporation (other than a REIT) of which a TRS directly or indirectly owns more than 35% of the voting power or value
of the stock will automatically be treated as a TRS. Overall, no more than 20% of the value of a REIT's total assets may consist of stock or securities of one or more TRSs. While we believe that we have managed our affairs so as to satisfy the requirement that no more than 20% of the value of our total assets consists of stock or securities of our TRSs, as well as the requirement that taxable income from our TRSs plus other non-qualifying gross income not exceed 25% of our total gross income, there can be no assurance that we will be able to do so in all market circumstances. The TRS rules limit the deductibility of interest paid or accrued by a TRS to its parent REIT to assure that the TRS is subject to an appropriate level of corporate taxation. The rules also impose a 100% excise tax on certain transactions between a TRS and its parent REIT that are not conducted on an arm's-length basis. Any domestic TRS that we may form will pay U.S. federal, state and local income tax on its taxable income at regular corporate tax rates, and its after-tax net income will be available for distribution to us but is not required to be distributed to us. In certain circumstances, the ability to deduct interest expense by any TRS that we may form could be limited.
We intend to structure our foreign TRSs so that their income and operations will not be subject to U.S. federal, state and local income tax. For example, the Code and the Treasury Regulations promulgated thereunder specifically provide that a non-U.S. corporation is not a U.S. trade or business and therefore is not subject to U.S. federal income tax if it restricts its activities in the United States to trading in stock and securities (or any activity closely related thereto) for its own account irrespective of whether such trading (or such other activity) is conducted by such a non-U.S. corporation or its employees through a resident broker, commission agent, custodian or other agent. However, there is no assurance that our foreign TRSs will successfully operate so that they are not subject to federal, state and local income tax. If the IRS successfully challenged that tax treatment, it would reduce the amount that those foreign TRSs would have available to pay to their creditors and to distribute to us. E&P in our foreign TRSs are taxable to us, and are not qualifying income for the purposes of the REIT 75% gross income tests, regardless of whether such earnings are distributed to us. In addition, losses in our foreign TRSs generally will not provide any tax benefit prior to liquidation.
We intend to monitor the value of our respective investments in our foreign and any domestic TRSs for the purpose of ensuring compliance with TRS ownership limitations. In addition, we will review all of our transactions with our TRSs to ensure that they are entered into on arm's-length terms to avoid incurring the 100% excise tax described below. There can be no assurance, however, that we will be able to comply with the 20% limitation or avoid application of the 100% excise tax discussed below.
Our investments in corporate CLOs may result in our recognizing taxable income prior to receiving cash distributions related to such income.
The tax implications of the corporate CLOs in which we invest are complex and, in some circumstances, unclear. In particular, we may recognize taxable income on certain of our CLO investments without the concurrent receipt of cash, or in excess of the actual or anticipated yield generated by such investments.
CLOs in which we invest could become subject to U.S. federal income tax or withholding requirements.
The CLO issuers in which we invest will generally operate pursuant to investment guidelines intended to ensure that the CLO is not treated for U.S. federal income tax purposes as engaged in a U.S. trade or business. If a CLO issuer fails to comply
48
with the investment guidelines, or if the Internal Revenue Service otherwise successfully asserts that the CLO should be treated as engaged in a U.S. trade or business, such CLO could be subject to U.S. federal income tax, which could reduce the amount available to distribute to mezzanine debt and equity holders in such CLO, including us.
The U.S. Foreign Account Tax Compliance Act provisions of the Code impose a withholding tax of 30% on certain U.S. source periodic payments, including interest and dividends, to certain non-U.S. entities, including certain non-U.S. financial institutions and investment funds, unless such non-U.S. entity complies with certain reporting requirements regarding its U.S. account holders and its U.S. owners. Most CLOs in which we invest will be treated as non-U.S. financial entities for this purpose, and therefore will be required to comply with these reporting requirements to avoid the 30% withholding. If a CLO in which we invest fails to properly comply with these reporting requirements, certain payments received by such CLO may be subject to the 30% withholding tax, which could reduce the amount available to distribute to equity and mezzanine debt holders in such CLO, including us.
Our ownership limitation may restrict change of control or business combination opportunities in which our shareholders might receive a premium for their common shares.
In order for us to qualifymaintain our qualification as a REIT, no more than 50% in value of our outstanding shares may be owned, directly or indirectly, by five or fewer individuals during the last half of any calendar year. "Individuals" for this purpose include natural persons, private foundations, some employee benefit plans and trusts, and some charitable trusts. In order to help us qualifymaintain our qualification as a REIT, among other purposes, our declaration of trust generally prohibits any person from beneficially or constructively owning more than 9.8% in value or in number of shares, whichever is more restrictive, of the outstanding shares of any class or series of our shares.
The ownership limitation and other restrictions could have the effect of discouraging a takeover or other transaction in which holders of our common shares might receive a premium for their common shares over the then-prevailing market price or which holders might believe to be otherwise in their best interests.
Dividends payable by REITs do not qualify for the reduced tax rates available for "qualified dividend income."
We may be subject to adverse legislative or regulatory tax changes that could reduce the market price of our common shares.
At any time, the U.S. federal income tax laws or regulations governing REITs or the administrative interpretations of those laws or regulations may be amended. We cannot predict when or if any new U.S. federal income tax law, regulation or administrative interpretation, or any amendment to any existing U.S. federal income tax law, regulation or administrative interpretation, will be adopted, promulgated or become effective and any such law, regulation or interpretation may take effect retroactively. The TCJAChanges to the tax laws, with or without retroactive application, could significantly and negatively affect our shareholders or us. Several recent proposals have been made that would make substantial changes to the U.S. federal income tax laws applicable to businesses and their owners, including REITs and their shareholders. Technical corrections or other amendments to the TCJA or administrative guidance interpreting the TCJA may be forthcoming at any time.laws. We cannot predict the long-term effect of the TCJAany future changes on REITs or assure our shareholders that any such changes will not adversely affect the taxation of a shareholder. We and our shareholders could be adversely affected by any such change in, or any new, U.S. federal income tax law, regulation or administrative interpretation.
Certain financing activities may subject us to U.S. federal income tax and could have negative tax consequences for our shareholders.
49
We currently do not intend to enter into any transactions that could result in our, or a portion of our assets, being treated as a taxable mortgage pool for U.S. federal income tax purposes. If we enter into such a transaction in the future we will be taxable at the highest corporate income tax rate on a portion of the income arising from a taxable mortgage pool, referred to as "excess inclusion income," that is allocable to the percentage of our shares held in record name by disqualified organizations (generally tax-exempt entities that are exempt from the tax on unrelated business taxable income, such as state pension plans and charitable remainder trusts and government entities). In that case, under our declaration of trust, we could reduce distributions to such shareholders by the amount of tax paid by us that is attributable to such shareholder's ownership.
If we were to realize excess inclusion income, IRS guidance indicates that the excess inclusion income would be allocated among our shareholders in proportion to our dividends paid. Excess inclusion income cannot be offset by losses of our shareholders. If the shareholder is a tax-exempt entity and not a disqualified organization, then this income would be fully taxable as unrelated business taxable income under Section 512 of the Code. If the shareholder is a foreign person, it would be subject to U.S. federal income tax at the maximum tax rate and withholding will be required on this income without reduction or exemption pursuant to any otherwise applicable income tax treaty.
Our recognition of "phantom" income may reduce a shareholder's after-tax return on an investment in our common shares.
We may recognize taxable income in excess of our economic income, known as phantom income, in the first years that we hold certain investments, and experience an offsetting excess of economic income over our taxable income in later years. In addition, in years when we have a capital loss carryforward that offsets current year capital gains, our earnings and profits may be higher than our taxable income. As a result, shareholders at times may be required to pay U.S. federal income tax on distributions taxable as dividends that economically represent a return of capital rather than a dividend. These distributions wouldcould be offset in later years by distributions that would be treated as returns of capital for U.S. federal income tax purposes. Taking into account the time value of money, this acceleration or increase of U.S. federal income tax liabilities may reduce a shareholder's after-tax return on his or her investment to an amount less than the after-tax return on an investment with an identical before-tax rate of return that did not generate phantom income.
Liquidation of our assets may jeopardize our REIT qualification.qualification or may be subject to a 100% tax.
To maintain our qualification as a REIT, we must comply with requirements regarding our assets and our sources of income. If we are compelled to liquidate our assets to repay obligations to our lenders or for other reasons, we may be unable to comply with these requirements, thereby jeopardizing our qualification as a REIT, or we may be subject to a 100% tax on any resultant gain if we sell assets that are treated as inventory or property held primarily for sale to customers in the ordinary course of business.
The tax on prohibited transactions will limit our ability to engage in transactions, including certain methods of securitizing RMBS, that would be treated as sales of dealer property for U.S. federal income tax purposes.
A REIT's net income from prohibited transactions is subject to a 100% tax with no offset for losses. In general, prohibited transactions are sales or other dispositions of property, other than foreclosure property, but including mortgage loans, held primarily for sale to customers in the ordinary course of business. We might be subject to this tax if we dispose of or securitize RMBS in a manner that was treated as dealer activity for U.S. federal income tax purposes. Therefore, in order to avoid the prohibited transactions tax, we may choose not to engage in certain sales or securitization structures, even though the transactions might otherwise be beneficial to us. Alternatively, in order to avoid the prohibited transactions tax, we may choose to implement certain transactions through a TRS, including by contributing or selling the assets to a TRS.
Although we expect to avoid the prohibited transactions tax by conducting the sale of property that may be characterized as dealer property through a TRS, such TRS will be subject to federal, state and local corporate income tax and may incur a significant tax liability as a result of those sales conducted through the TRS. No assurance can be given that any property that we sell will not be treated as property held for sale to customers, or that we can satisfy certain safe-harbor provisions of the Code that would prevent such treatment. Moreover, no assurance can be given that the IRS will respect the transaction by which property that may be characterized as dealer property is contributed to the TRS. If any property sold is treated as property held for sale to customers or if the contribution of property is not respected, then we may be treated as having engaged in a prohibited transaction, and our net income therefrom would be subject to a 100% tax.
We have made a mark-to-market election under Section 475(f) of the Code. If the IRS challenges our application of that election, it may jeopardize our REIT qualification.
We have made an election under Section 475(f) of the Code to mark our securities to market effective as of January 1, 2021. There are limited authorities under Section 475(f) of the Code as to what constitutes a trader for U.S. federal income tax purposes, and how such an election would be applied in the context of a REIT. Under other sections of the Code, the status of a
50
trader in securities depends on all of the facts and circumstances, including the nature of the income derived from the taxpayer's activities, the frequency, extent and regularity of the taxpayer's securities transactions, and the taxpayer's investment intent. There can be no assurance that we will continue to qualify as a trader in securities eligible to make a mark-to-market election. We have not received, nor are we seeking, an opinion from counsel or a ruling from the IRS regarding our qualification as a trader. If the qualification for, or our application of, such election were successfully challenged by the IRS, in whole or in part, it could, depending on the circumstances, result in retroactive (or prospective) changes in the amount or timing of gross income we recognize, and potentially jeopardize our REIT qualification. Furthermore, the law is unclear as to the treatment of mark-to-market gains and losses under the various REIT tax rules, including, among others, the prohibited transaction and qualified liability hedging rules. While there is limited analogous authority, we treat any mark-to-market gains as qualifying income for purposes of the REIT 75% gross income test to the extent that the gain is recognized with respect to a qualifying real estate asset, based on an opinion of Hunton Andrews Kurth LLP substantially to the effect that any such gains recognized with respect to assets that would produce qualifying income for purposes of the REIT 75% and/or 95% gross income test, as applicable, if they were actually sold should be treated as qualifying income to the same extent for purposes of the REIT 75% and/or 95% gross income test, as applicable, and any such gains should not be subject to the prohibited transaction tax. If the IRS were to successfully treat our mark-to-market gains as subject to the prohibited transaction tax or to successfully challenge the treatment or timing of recognition of our mark-to-market gains or losses with respect to our qualified liability hedges, we could owe material federal income or penalty tax or, in some circumstances, even fail to maintain our qualification as a REIT. Finally, mark-to-market gains and losses could cause volatility in the amount of our taxable income. For instance, the mark-to-market election could generate losses in one taxable year that we are unable to use to offset taxable income, followed by mark-to-market gains in a subsequent taxable year that force us to make additional distributions to our shareholders. Hence, the mark-to-market gains and losses could cause us to distribute more dividends to our shareholders in a particular period than would otherwise be desirable from a business perspective.
Our qualification as a REIT and exemption from U.S. federal income tax with respect to certain assets may be dependent on the accuracy of legal opinions or advice rendered or given or statements by the issuers of assets that we acquire, and the inaccuracy of any such opinions, advice or statements may adversely affect our REIT qualification and result in significant corporate-level tax.
When purchasing securities, we may rely on opinions or advice of counsel for the issuer of such securities, or statements made in related offering documents, for purposes of determining whether such securities represent debt or equity securities for U.S. federal income tax purposes, the value of such securities, and also to what extent those securities constitute qualified real estate assets for purposes of the REIT asset tests and produce income which qualifies under the REIT 75% gross income test. The inaccuracy of any such opinions, advice or statements may adversely affect our REIT qualification and result in significant corporate-level tax. Additionally, counsel is generally under no obligation to update any such opinions after they are issued. Hence, subsequent changes to the purchased securities or in the applicable law may cause such opinions to become inaccurate or outdated despite being accurate when issued and may also adversely affect our REIT qualification and result in significant corporate-level tax.
We, Ellington, or its affiliates may be subject to adverse legislative or regulatory changes.
At any time, U.S. federal, state, local, or foreign laws or regulations that impact our business, or the administrative interpretations of those laws or regulations, may be enacted or amended.
We cannot predict when or if any new law, regulation, or administrative interpretation, or any amendment to or repeal of any existing law, regulation, or administrative interpretation, will be adopted or promulgated or will become effective. Additionally, the adoption or implementation of any new law, regulation, or administrative interpretation, or any revisions in or repeals of these laws, regulations, or administrative interpretations, could cause us to change our portfolio, could constrain our strategy, or increase our costs. We could be adversely affected by any change in or any promulgation of new law, regulation, or administrative interpretation.
Failure to procure adequate funding and capital would adversely affect our results and may, in turn, negatively affect the value of our common shares and our ability to pay dividends to our shareholders.
We depend upon the availability of adequate funding and capital for our operations. To maintain our status as a REIT, we are required to distribute to our shareholders at least 90% of our REIT taxable income annually, determined excluding any net capital gains and without regard to the deduction for dividends paid. As a result, we are not able to retain much or any of our earnings for new investments. We cannot assure you that any, or sufficient, funding or capital will be available to us in the future on terms that are acceptable to us. In the event that we cannot obtain sufficient funding and capital on acceptable terms,
51
there may be a negative impact on the value of our common shares and our ability to pay dividends to our shareholders, and you may lose part or all of your investment.
We, Ellington, or its affiliates may be subject to regulatory inquiries and proceedings, or other legal proceedings.
At any time, industry-wide or company-specific regulatory inquiries or proceedings can be initiated and we cannot predict when or if any such regulatory inquiries or proceedings will be initiated that involve us or Ellington or its affiliates, including our Manager. We believe that the heightened scrutiny of the financial services industry increases the risk of inquiries and requests from regulatory or enforcement agencies. For example, as discussed under the caption Item 3. Legal Proceedings, over the years, Ellington and its affiliates have received, and we expect in the future that we and they may receive, inquiries and requests for documents and information from various federal, state, and foreign regulators.
We can give no assurances that, whether the result of regulatory inquiries or otherwise, neither we nor Ellington nor its affiliates will become subject to investigations, enforcement actions, fines, penalties or the assertion of private litigation claims. If any such events were to occur, we, or our Manager's ability to perform its obligations to us under the management agreement between us and our Manager, or Ellington's ability to perform its obligations to our Manager under the services agreement between Ellington and our Manager, could be materially adversely impacted, which could materially adversely effect on our business, financial condition and results of operations, and our ability to pay dividends to our shareholders.
The market for our common shares may be limited, and the price and trading volume of our common shares may be volatile.
While our common shares are listed on the NYSE, such listing does not provide any assurance as to whether or not the market price reflects our actual financial performance, the liquidity of our stock, a holder's ability to sell our stock and/or at what price such holder could sell our stock. Market prices for our common shares may be volatile and subject to wide fluctuations, including as a result of the trading volume. We cannot assure you that the market price of our common shares will not fluctuate or decline significantly in the future. Some of the factors that could negatively affect the price of our common shares, or result in fluctuations in the price or trading volume of our common shares include:
•actual or anticipated variations in our dividends or quarterly operating results;
•changes in our earnings estimates, failure to meet earnings or operating results expectations of public market analysts and investors, or publication of research reports about us or the real estate specialty finance industry;
•increases in market interest rates that lead purchasers of our common shares to demand a higher yield;
•repurchases and issuances by us of our common shares;
•passage of legislation, changes in applicable law, court rulings, enforcement actions or other regulatory developments that adversely affect us or our industry;
•changes in government policies or changes in timing of implementation of government policies, including with respect to Fannie Mae, Freddie Mac, and Ginnie Mae;
•changes in market valuations of similar companies;
•adverse market reaction to any increased indebtedness we incur in the future;
•additions or departures of key management personnel;
•actions by shareholders;
•speculation in the press or investment community;
•adverse changes in global, national, regional and local economic and market conditions, including those relating to pandemics, such as the COVID-19 pandemic, high unemployment, elevated inflation, volatile interest rates, concerns regarding a recession, geopolitical conflicts, social unrest, or civil disturbances;
•our inclusion in, or exclusion from, various stock indices;
•our operating performance and the performance of other similar companies; and
•changes in accounting principles.
Stock markets in general have experienced volatility that has often been unrelated to the operating performance of a particular company. These broad market fluctuations may adversely affect the market price of our common shares.
Future offerings of debt securities, which would rank senior to our common shares upon our bankruptcy liquidation, and future offerings of equity securities which could dilute the common share holdings of our existing shareholders and may be senior to our common shares for the purposes of dividend and liquidating distributions, may adversely affect the market price of our common shares.
52
In the future, we may attempt to increase our capital resources by making offerings of debt securities or additional offerings of equity securities. Upon bankruptcy or liquidation, holders of our debt securities and preferred shares, if any, and lenders with respect to other borrowings will receive a distribution of our available assets prior to the holders of our common shares. Our preferred shares, if issued, could have a preference on liquidating distributions or a preference on dividend payments or both that could limit our ability to pay a dividend or other distribution to the holders of our common shares. Because our decision to issue securities in any future offering will depend on market conditions and other factors beyond our control, we cannot predict or estimate the amount, timing or nature of our future offerings. Thus, holders of our common shares bear the risk of our future offerings reducing the market price of our common shares and diluting their share holdings in us.
Future sales of our common shares or other securities convertible into our common shares could cause the market value of our common shares to decline and could result in dilution of your shares.
Sales of substantial amounts of our common shares or other securities convertible into our common shares could cause the market price of our common shares to decrease significantly. We cannot predict the effect, if any, of future sales of our common shares or other securities convertible into our common shares, or the availability of such securities for future sales, on the market price of our common shares. Sales of substantial amounts of our common shares or other securities convertible into our common shares, or the perception that such sales could occur, may adversely affect prevailing market values for our common shares.
Climate change has the potential to impact the properties underlying our investments.
Currently, it is not possible to predict how legislation or new regulations that may be adopted to address greenhouse gas emissions will impact the properties underlying our investments. However, any such future laws and regulations imposing reporting obligations, limitations on greenhouse gas emissions, or additional taxation of energy use could require the owners of properties to make significant expenditures to attain and maintain compliance. Any new legislative or regulatory initiatives related to climate change could adversely affect our business.
The physical impact of climate change could also have a material adverse effect on the properties underlying our investments. Physical effects of climate change such as increases in temperature, sea levels, the severity of weather events and the frequency of natural disasters, such as hurricanes, tropical storms, tornadoes, wildfires, floods and earthquakes, among other effects, could damage the properties underlying our investments. The costs of remediating or repairing such damage, or of investments made in advance of such weather events to minimize potential damage, could be considerable. Additionally, such actual or threatened climate change related damage could increase the cost of, or make unavailable, insurance on favorable terms on the properties underlying our investments. Such repair, remediation or insurance expenses could reduce the net operating income of the properties underlying our investments which may in turn adversely affect us.
We are subject to risks related to corporate social responsibility.
Our business faces public scrutiny related to environmental, social and governance (“ESG”) activities. We risk damage to our reputation if we or affiliates of our Manager are viewed as failing to act responsibly in a number of areas, such as diversity and inclusion, environmental stewardship, support for local communities, corporate governance and transparency and considering ESG factors in our investment processes. Investors are increasingly taking into account ESG factors, including climate risks, in determining whether to invest in companies. However, regional and investor specific sentiment often differ in what constitutes a material positive or negative ESG corporate practice. Our corporate social responsibility practices will not uniformly fit investors’ definitions, particularly across geographies and investor types, of best practices for ESG considerations. Adverse incidents with respect to ESG activities could impact the cost of our operations and relationships with investors, all of which could adversely affect our business and results of operations.
Additionally, there is a growing regulatory interest across jurisdictions in improving transparency regarding the definition, measurement and disclosure of ESG factors in order to allow investors to validate and better understand sustainability claims, and we are subject to changing rules and regulations promulgated by a number of governmental and self-regulatory organizations, including the SEC, the NYSE and the Financial Accounting Standards Board. These rules and regulations continue to evolve in scope and complexity and many new requirements have been created in response to laws enacted by Congress, making compliance more difficult and uncertain. Further, new and emerging regulatory initiatives in the U.S. related to climate change and ESG could adversely affect our business. On March 6, 2024, the SEC issued a final rule regarding the enhancement and standardization of mandatory climate-related disclosures for investors. The final rule mandates extensive disclosure of climate-related data, risks, and opportunities, including financial impacts, physical and transition risks, related governance and strategy and greenhouse gas emissions, for certain public companies. Compliance with the final rule may result in increased legal, accounting and financial compliance costs, make some activities more difficult, time-consuming and costly, and place strain on our Manager’s personnel, systems and resources. In addition, in 2021 the SEC established an enforcement task force to look into ESG practices and disclosures by public companies and investment managers and has started to bring enforcement actions based on ESG disclosures not matching actual investment processes.
53
Growing interest on the part of investors and regulators in ESG factors and increased demand for, and scrutiny of, ESG-related disclosures, have also increased the risk that companies could be perceived as, or accused of, making inaccurate or misleading statements regarding their ESG efforts or initiatives, or greenwashing. Such perception or accusation could damage our reputation, result in litigation or regulatory actions and adversely impact our ability to raise capital. Relatedly, certain investors have also begun to use ESG data, third-party benchmarks and ESG ratings to allow them to monitor the ESG impact of their investments.
These changing rules, regulations and stakeholder expectations have resulted in, and are likely to continue to result in, increased general and administrative expenses and increased management time and attention spent complying with or meeting such regulations and expectations. If we fail or are perceived to fail to comply with applicable rules, regulations and stakeholder expectations, it could negatively impact our reputation and our business results. Further, our business could become subject to additional regulations, penalties and/or risks of regulatory scrutiny and enforcement in the future. We cannot guarantee that our current ESG practices will meet future regulatory requirements, reporting frameworks or best practices, increasing the risk of related enforcement. Compliance with new requirements may lead to increased management burdens and costs. Generally, we expect investor demands and the prevailing legal environment to require us to devote additional resources to ESG matters in our review of prospective investments and management of existing investments, which could increase our expenses.
We are largely dependent on external sources of capital in order to grow.
In order to maintain our qualification as a REIT, we generally will have to distribute to our shareholders 90% of our REIT taxable income. As with other mortgage REITs, the vast majority of our income is expected to constitute REIT taxable income, and therefore we expect to have to distribute, and not retain, the vast majority of our income. As a result, any material growth in our equity capital base must largely be funded by external sources of capital. Our access to external capital will depend upon a number of factors, including the market price of our common shares, the market’s perception of our financial condition and potential future earnings, and general market conditions.
Periods of heightened inflation could adversely impact our financial results.
Due to various economic and monetary policy factors, including low unemployment, high corporate demand, supply-chain issues, geopolitical conflicts, and quantitative easing, inflation has been elevated in recent periods. High inflation may undermine the performance of our investments by reducing the value of such investments and/or the income received from such investments. In addition, actions that the Federal Reserve has taken, and could continue to take, to combat inflation could have an adverse impact on our financial results. See "—Risks Related To Our Business—Certain actions by the Federal Reserve could materially adversely affect our business, financial condition and results of operations, and our ability to pay dividends to our shareholders."
Item 1B. Unresolved Staff Comments
None.
Item 1C. Cybersecurity
As discussed further in "Item 1. Business—Our Manager and Ellington," we are externally managed and advised by our Manager, an affiliate of Ellington. Our Manager does not have any employees and instead relies on the employees of Ellington to fulfill its obligations to us pursuant to a services agreement. We rely on Ellington's information systems in conducting our day-to-day operations. As such, we also rely on Ellington's processes for assessing, identifying, and managing material risks from cybersecurity threats.
Ellington's cybersecurity processes and practices are integrated into Ellington's risk management and oversight program. In general, Ellington seeks to address cybersecurity risks through a cross-functional approach that is focused on preserving the confidentiality, security and availability of the information that Ellington collects and stores by identifying, preventing and mitigating cybersecurity threats and responding to cybersecurity incidents when they occur.
Ellington's Risk Management and Strategy
Ellington's cybersecurity program is focused on the following key areas:
•Governance: As discussed in more detail below under "Governance," our Board of Trustees' oversight of cybersecurity risk management is supported by the Audit Committee of our Board of Trustees (the “Audit Committee”), which regularly interacts with our management team and other professionals who are responsible for assessing and managing material risks from cybersecurity threats at Ellington.
•Collaborative Approach: Ellington has implemented a cross-functional approach to identifying and evaluating, preventing, mitigating and remediating cybersecurity threats and incidents, while also implementing controls and
54
procedures that provide for the prompt escalation of certain cybersecurity incidents. Such escalation allows Ellington to make timely decisions regarding its response to such incidents and whether disclosure to senior management, our Audit Committee and/or the public is appropriate.
•Technical Safeguards: Ellington deploys technical safeguards that are designed to protect information systems from cybersecurity threats. These systems cover many facets of cyber security including identity protection, anti-virus and anti-malware defense, data loss prevention, endpoint protection (including managed detection and response services), patch and vulnerability management and others. Ellington regularly evaluates new technologies as the cyber security landscape evolves.
•Incident Response and Recovery Planning: Ellington has established and maintains incident response and recovery plans that we believe properly address the response to a cybersecurity incident or other business disruption. To the extent feasible, such plans are tested and evaluated on a regular basis.
•Third-Party Risk Management: Ellington follows a risk-based approach to identifying and overseeing cybersecurity risks presented by third-parties, including vendors, service providers and other external users of Ellington’s systems, as well as the systems of third-parties that could adversely impact Ellington’s business in the event of a cybersecurity incident affecting their systems. Third-party service providers are regularly evaluated by Ellington to assess their cyber security posture and general information technology practices to determine if they are suitable partners; where applicable, relevant certifications are obtained such as SOC 2 or ISO 27001.
•Education and Awareness: Ellington: (i) provides regular, mandatory cyber security training to all personnel to equip them with tools to identify and address cybersecurity threats; (ii) communicates evolving information security policies, standards, processes and practices to employees via email; (iii) delivers additional training to all users who have access to personally identifiable information on Ellington’s processes for handling such information; and (iv) conducts regular, monthly phishing tests to assess user alertness, and retains a separate external cybersecurity vendor to conduct similar tests on an annual basis.
Ellington's technology team assesses the firm’s cybersecurity and infrastructure postures regularly with two separate working groups—one group, meeting weekly, focused on IT implementation and one group, meeting bi-weekly, focused on engineering integration. Both groups include senior members of the technology team. These meetings cover a broad range of topics including implementation planning for the deployment of new hardware and software, patch and vulnerability management, considerations for disaster recovery and business continuity, user access controls, data security and more. In such continued monitoring of its cybersecurity posture, Ellington conducts continuous depreciation of obsolete or unsuitable technology, including legacy hardware and software, has a robust patch and vulnerability management process, and has personnel dedicated to the continued monitoring of new developments in threat actors’ activities in order to take preventative actions.
Ellington also regularly engages third parties to perform assessments of Ellington’s cybersecurity posture, including penetration testing, user access control reviews and independent reviews of Ellington’s information security control environment, and operating effectiveness. The results of such assessments, tests and reviews are reported to the Audit Committee and our Board of Trustees, and Ellington adjusts its cybersecurity policies, standards, processes and practices as necessary based on the information provided by these assessments, tests and reviews, including the implementation of new software and technologies.
To date, no risks from cybersecurity threats to Ellington have materially affected or are reasonably likely to materially affect the Company. While Ellington did experience two business email compromise incidents in recent years, neither had a material impact on our business strategy, results of operations or financial condition.
Governance
Our Board of Trustees, through the Audit Committee, oversees our cybersecurity risk management process. Our Audit Committee receives regular presentations and reports on cybersecurity risks at Ellington, each of which addresses a wide range of topics including recent developments, evolving standards, vulnerability assessments, third-party and independent reviews, the threat environment, technological trends and information security considerations arising with respect to our peers and third parties.
Ellington employs internal or external resources whose responsibilities include oversight of their respective firm’s cybersecurity posture.
55
Ellington's cybersecurity team is lead by Ellington's outsourced Chief Technology Officer (the "CTO"), who is primarily responsible for assessing and managing material risks from cybersecurity threats to Ellington. The CTO has extensive experience in application development, database architecture, systems design, and third-party software integration. During his tenure at Ellington, the CTO has lead large technical efforts such as the development of Ellington’s proprietary whole loan management system and the overhaul of Ellington’s engineering infrastructure and development services. The CTO works closely with Ellington’s head of Data Platform and Infrastructure (the "DPI Head") to manage Ellington’s infrastructure and cybersecurity posture. During his tenure at Ellington, the DPI Head has lead several critical efforts such as the revitalization of Ellington’s hardware, networking and disaster recovery facilities, major improvements to Ellington’s cybersecurity infrastructure, and the development and maintenance of Ellington’s Data Engineering infrastructure. Ellington’s Senior Systems Administrator (the "SSA") works closely with both the CTO and the DPI Head to implement Ellington’s cybersecurity program and infrastructure. The SSA is responsible for all systems and telecommunication design and implementation, with a focus on cybersecurity. The SSA ensures that Ellington's systems are secure and resilient against cyber threats. Prior to joining Ellington in 1997, the SSA was a Senior PC Technical Support at Bear Stearns for seven years. The CTO, after consultation with others, including the DPI Head and the SSA, regularly provides an assessment of Ellington’s cybersecurity posture and reviews Ellington’s information technology roadmap with the Audit Committee. The CTO's reports cover a range of topics including, at various times, a discussion of the primary cybersecurity risks facing Ellington, an overview of Ellington’s cybersecurity program, common attack vectors and types, the primary functions of Ellington’s cybersecurity program, how Ellington’s cybersecurity programs are applied to critical cybersecurity areas, any recent cybersecurity incidents, Ellington’s ongoing focus areas in its cybersecurity program, Ellington’s employee education program, management of patches and system vulnerabilities, various threat detection methods, malicious activity monitoring, any new cybersecurity focus areas for Ellington, a review of Ellington’s key technologies, Ellington’s incident response procedures and Ellington’s backup systems and redundancy and disaster recovery processes.
Item 2. Properties
We do not own any properties. Our principal offices are located in leased space at 53 Forest Avenue, Old Greenwich, CT 06870. The offices of our Manager and Ellington are at the same location. As part of our management agreement, our Manager is responsible for providing offices necessary for all operations, and accordingly, all lease responsibilities belong to our Manager.
Item 3. Legal Proceedings
Neither we nor Ellington nor its affiliates (including our Manager) are currently subject to any legal proceedings that we or our Manager consider material. Nevertheless, we and Ellington and its affiliates operate in highly regulated markets that currently are under regulatory scrutiny, and over the years, Ellington and its affiliates have received, and we expect in the future that we and they may receive, inquiries and requests for documents and information from various federal, state and foreign regulators. For example, in January 2017, an affiliate of Ellington received a subpoena from the SEC requesting documents, communications, and other information relating primarily to a loan originator and the loans originated by such originator, such affiliate's analyses of such loans, the purchases and securitizations of such loans by such affiliate and by certain third parties, and the servicing of such loans. Ellington's affiliate has responded to the subpoena and intends to continue to cooperate with any further requests. Ellington has advised us that, at the present time, it is not aware that any material legal proceeding against us or Ellington or its
Item 4. Mine Safety Disclosures
Not applicable.
PART II
Item 5. Market for Registrant's Common Equity, Related Shareholders Matters, and Issuer Purchases of Equity Securities
Market Information
Our common shares have been listed on the New York Stock Exchange ("NYSE") under the symbol "EARN" since May 1, 2013. The following table sets forth, for the periods indicated, the high and low sales prices for our common shares:
| Common Stock Sales Price | ||||||||
| High | Low | |||||||
| 2017: | ||||||||
| First Quarter | $ | 14.83 | $ | 12.82 | ||||
| Second Quarter | 15.74 | 13.96 | ||||||
| Third Quarter | 14.96 | 13.44 | ||||||
| Fourth Quarter | 14.65 | 12.01 | ||||||
| 2016: | ||||||||
| First Quarter | $ | 12.90 | $ | 9.57 | ||||
| Second Quarter | 13.30 | 11.72 | ||||||
| Third Quarter | 14.43 | 12.84 | ||||||
| Fourth Quarter | 13.92 | 12.21 | ||||||
Holders of Our Common Shares
Based upon a review of a securities position listing as of the close of business on March 9, 2018,8, 2024, we had an aggregate of 109107 holders of record and holders of our common shares who are nominees for an undetermined number of beneficial owners.
| Plan Category | Number of securities to be issued upon exercise of outstanding options, warrants and rights (a) | Weighted-average exercise price of our outstanding options, warrants and rights (b) | Number of securities remaining available for future issuance under equity compensation plans (excluding securities reflected in column (a)) (c) | |||||
| Equity compensation plans approved by security holders | 15,945 | (1) | N/A | 340,461 | (2) | |||
Unregistered Sales of Equity Securities
Pursuant to our 20132023 Equity Incentive Plan, on December 12, 2017,14, 2023, we granted 4,41314,473 restricted common shares to certain of our partially dedicated employees. The restricted common shares are subject to forfeiture restrictions that will lapse with respect to 2,6307,237 of the common shares on December 12, 201814, 2024 and 1,7837,236 of the common shares on December 12, 2019.14, 2025. Such grants were exempt from the registration requirements of the Securities Act based on the exemption provided in Section 4(a)(2) of the Securities Act.
Issuer Purchases of Equity Securities
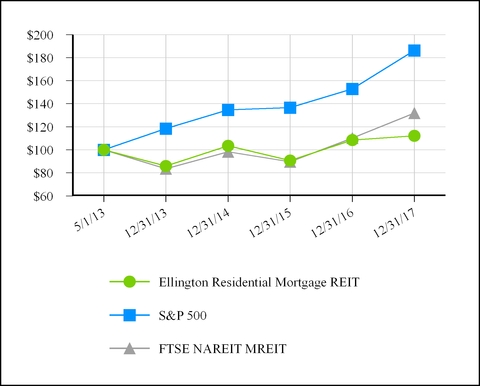
| December 31, | |||||||||||||||||||||||
| May 1, 2013 | 2013 | 2014 | 2015 | 2016 | 2017 | ||||||||||||||||||
| Ellington Residential Mortgage REIT | $ | 100.00 | $ | 85.95 | $ | 103.55 | $ | 90.63 | $ | 108.46 | $ | 112.14 | |||||||||||
| S&P 500 | 100.00 | 118.52 | 134.73 | 136.58 | 152.91 | 186.28 | |||||||||||||||||
| FTSE NAREIT MREIT | 100.00 | 83.44 | 98.34 | 89.69 | 110.17 | 131.93 | |||||||||||||||||
Item 6. Selected Financial Data[Reserved]
| Year Ended December 31, | ||||||||||||||||||||
| (In thousands except for per share amounts) | 2017 | 2016 | 2015 | 2014 | 2013 | |||||||||||||||
| Net Interest Income | ||||||||||||||||||||
| Net interest income | $ | 30,143 | $ | 24,224 | $ | 34,515 | $ | 42,313 | $ | 24,810 | ||||||||||
| Expenses | ||||||||||||||||||||
| Management fees | 2,678 | 2,129 | 2,304 | 2,285 | 2,066 | |||||||||||||||
| Professional fees | 737 | 668 | 574 | 986 | 624 | |||||||||||||||
| Compensation expense | 775 | 599 | 621 | 678 | 401 | |||||||||||||||
Insurance expense(1) | 304 | 361 | 408 | 476 | 330 | |||||||||||||||
Other operating expenses(1) | 1,208 | 1,252 | 1,238 | 1,327 | 905 | |||||||||||||||
| Total Expenses | 5,702 | 5,009 | 5,145 | 5,752 | 4,326 | |||||||||||||||
| Other Income (Loss) | ||||||||||||||||||||
| Net realized and change in net unrealized gains (losses) on securities | (7,175 | ) | (1,676 | ) | (9,327 | ) | 51,007 | (63,602 | ) | |||||||||||
| Net realized and change in net unrealized gains (losses) on financial derivatives | (6,478 | ) | (5,633 | ) | (20,013 | ) | (71,400 | ) | 41,204 | |||||||||||
| Total Other Income (Loss) | (13,653 | ) | (7,309 | ) | (29,340 | ) | (20,393 | ) | (22,398 | ) | ||||||||||
| Net Income (Loss) | $ | 10,788 | $ | 11,906 | $ | 30 | $ | 16,168 | $ | (1,914 | ) | |||||||||
| Net Income (Loss) Per Common Share | $ | 0.93 | $ | 1.31 | $ | — | $ | 1.77 | $ | (0.29 | ) | |||||||||
| Cash Dividends Declared Per Common Share | $ | 1.57 | $ | 1.65 | $ | 2.00 | $ | 2.20 | $ | 1.14 | ||||||||||
| As of December 31, | ||||||||||||||||||||
| (In thousands except for share amounts) | 2017 | 2016 | 2015 | 2014 | 2013 | |||||||||||||||
| Assets | ||||||||||||||||||||
| Cash and cash equivalents | $ | 56,117 | $ | 33,504 | $ | 40,166 | $ | 45,237 | $ | 50,112 | ||||||||||
| Mortgage-backed securities, at fair value | 1,685,998 | 1,226,994 | 1,242,266 | 1,393,303 | 1,326,036 | |||||||||||||||
| Due from brokers | 26,754 | 49,518 | 33,297 | 18,531 | 18,347 | |||||||||||||||
| Financial derivatives–assets, at fair value | 8,792 | 6,008 | 2,183 | 3,072 | 34,963 | |||||||||||||||
| Reverse repurchase agreements | 81,461 | 75,012 | 78,632 | 13,987 | — | |||||||||||||||
| Receivable for securities sold | 21,606 | 33,199 | 155,526 | 41,834 | 76,692 | |||||||||||||||
| Other assets | 6,359 | 4,899 | 4,614 | 5,110 | 4,940 | |||||||||||||||
| Total Assets | $ | 1,887,087 | $ | 1,429,134 | $ | 1,556,684 | $ | 1,521,074 | $ | 1,511,090 | ||||||||||
| Liabilities and Shareholders' Equity | ||||||||||||||||||||
| Liabilities | ||||||||||||||||||||
| Repurchase agreements | $ | 1,597,206 | $ | 1,197,973 | $ | 1,222,719 | $ | 1,323,080 | $ | 1,310,347 | ||||||||||
| Payable for securities purchased | 3,830 | 5,516 | 98,949 | 4,227 | 2,776 | |||||||||||||||
| Due to brokers | 489 | 1,055 | 439 | 583 | 22,788 | |||||||||||||||
| Financial derivatives–liabilities, at fair value | 1,863 | 1,975 | 4,725 | 8,700 | 1,069 | |||||||||||||||
| U.S. Treasury securities sold short, at fair value | 81,289 | 74,194 | 78,447 | 13,959 | — | |||||||||||||||
| Dividend payable | 4,936 | 3,652 | 4,111 | 5,032 | 4,570 | |||||||||||||||
| Other liabilities | 4,771 | 3,092 | 2,439 | 2,128 | 2,360 | |||||||||||||||
| Total Liabilities | 1,694,384 | 1,287,457 | 1,411,829 | 1,357,709 | 1,343,910 | |||||||||||||||
| Shareholders' Equity | ||||||||||||||||||||
| Preferred shares, par value $0.01 per share, 100,000,000 shares authorized; (0 shares issued and outstanding, respectively) | — | — | — | — | — | |||||||||||||||
| Common shares, par value $0.01 per share, 500,000,000 shares authorized; (13,340,217, 9,130,897, 9,135,103, 9,149,274, and 9,139,842 shares issued and outstanding, respectively) | 134 | 92 | 92 | 91 | 91 | |||||||||||||||
| Additional paid-in-capital | 240,062 | 180,996 | 181,027 | 181,282 | 181,147 | |||||||||||||||
| Accumulated deficit | (47,493 | ) | (39,411 | ) | (36,264 | ) | (18,008 | ) | (14,058 | ) | ||||||||||
| Total Shareholders' Equity | 192,703 | 141,677 | 144,855 | 163,365 | 167,180 | |||||||||||||||
| Total Liabilities and Shareholders' Equity | $ | 1,887,087 | $ | 1,429,134 | $ | 1,556,684 | $ | 1,521,074 | $ | 1,511,090 | ||||||||||
Item 7. Management's Discussion and Analysis of Financial Condition and Results of Operations
Executive Summary
We are a Maryland real estate investment trust, or "REIT," formed in August 2012 that specializes in acquiring, investing in, and managing residential mortgage- and real estate-related and other assets. Our primary objective is to generate attractive current yields and risk-adjusted total returns for our shareholders by making investments that we believe compensate us appropriately for the risks associated with them. We seek to attain this objective by constructing and actively managing a portfolio consisting primarily of residential mortgage-backed securities, or "RMBS," for which the principal and interest payments are guaranteed by a U.S. government agency or a U.S. government-sponsored entity, or "Agency RMBS," and to a lesser extent, RMBS that do not carry such guarantees, or "non-Agency RMBS," such as RMBS backed by prime jumbo, Alternative A-paper, mortgage loans that are not deemed "qualified mortgage," or "QM," loans under the rules of the Consumer Financial Protection Bureau, or "non-QM loans," mortgages on single-family-rental properties, manufactured housing, and subprime residential mortgage loans. We also acquire and manage corporate collateralized loan obligations, or "CLOs." We also may opportunistically acquire and manage other types of residential mortgage-relatedmortgage- and real estate-related asset classes, such as commercial mortgage-backed securities, or "CMBS," residential mortgage loans, mortgage servicing rights or "MSRs," and credit risk transfer securities, or "CRTs."securities. We believe that being able to combine Agency RMBS with non-Agency RMBS and other residential mortgage- and real estate-related asset classes, along with opportunistic investments in CLOs, enables us to balance a range of mortgage-related risks.
We were initially formed through an initiala strategic venture among affiliates of Ellington Management Group, L.L.C., an
investment management firm and registered investment adviser with a 23-year29-year history of investing in a broad spectrum of MBSresidential and commercial mortgage-backed securities, or "MBS," and related derivatives, with an emphasis on the RMBS market, and the Blackstone Tactical Opportunity Funds, or the "Blackstone Funds." As of December 31, 2017, the Blackstone Funds owned approximately 20% of our outstanding common shares. We are externally managed and advised by Ellington Residential Mortgage Management LLC, or our "Manager,"Manager, an affiliate of Ellington. From our inception until August 2021, the Blackstone Funds had held special non-voting membership interests in the holding company that owns our Manager. In August 2021, an Ellington Management Group, L.L.C.affiliate purchased these
57
special non-voting membership interests from the second quarter of 2017, we completed a follow-on common share offering whereby we sold 3,230,000 shares for net proceeds of $45.0 million, after offering costs and underwriters' discounts.
We use leverage in our Agency RMBS strategystrategies and while we have not done so meaningfully to date we may use leverage in our non-Agency RMBS strategy as well, although we expect such leverage to be lower. We have financed our purchases of Agency RMBSassets exclusively through repurchase agreements, which we account for as collateralized borrowings. As of December 31, 2017,2023, we had outstanding borrowings under repurchase agreements in the amount of $1.6 billion$729.5 million with fifteen counterparties.19 counterparties; 93% of such borrowings were collateralized by Agency RMBS.
We have elected to be taxed as a REIT for U.S. federal income tax purposes. Accordingly, we generally will not be subject to U.S. federal income taxes on our taxable income that we distribute currently to our shareholders as long as we maintain our qualification as a REIT. We intend to conduct our operations so that neither we nor any of our subsidiaries is required to register as an investment company under the Investment Company Act of 1940, as amended, or the "Investment Company Act."
As of December 31, 2017,2023, our book value per share was $14.45,$7.32 as compared to $15.52$8.40 as of December 31, 2016.2022, respectively.
Trends and Recent Market Developments
•After increasing the target range for the federal funds rate three timesby a cumulative 4.25% in 2017, and ended2022, the year with a target rangeU.S. Federal Reserve, or the "Federal Reserve," slowed the pace of 1.25%–1.50%. The market is currently expecting several additionalits interest rate hikes in 2018.2023. In 2023, at its January/February meeting, the Federal Reserve raised the target range by 25 basis points to 4.50%–4.75%, which was its smallest increase since March 2022.
Next, the Federal Reserve increased the target range by an additional 25 basis points in May 2023, paused in June, increased by an additional 25 basis points in July to a range of 5.25%–5.50%, and then maintained that range at each of its meetings from September through December, noting in December that "inflation has eased over the past year but remains elevated." In a dovish shift, the Summary of Economic Projections released by the Federal Reserve in December implied three interest rate cuts in 2024. However, minutes from the December 2023 meeting released in early January 2024 revealed that during the meeting Federal Reserve participants "reaffirmed that it would be appropriate for policy to remain at a restrictive stance for some time until inflation was clearly moving down," seemingly lowering the likelihood of a cut during the first quarter of 2017,2024.
Throughout 2023, the Federal Reserve continued to reinvest only principal payments that exceeded monthly caps of $60 billion on U.S. Treasury securities and $35 billion on Agency RMBS.
•Interest rates were highly volatile during much of 2023, and many parts of the yield curve flattened. Overcontinued to be inverted. After falling in January, interest rates increased in February and early March, particularly short-term interest rates, as the courseyield on the 2-year U.S. Treasury surpassed 5% for the first time since June 2007. Then, in mid-March 2023, concerns about the stress in the banking system spurred a flight to safety, which drove interest rates down significantly. Overall, the yield on the 2-year U.S. Treasury decreased by 40 basis points to 4.03% in the first quarter, while the yield on the 10-year U.S. Treasury decreased by 41 basis points to 3.47%. Interest rate volatility spiked in mid-March 2023, with the MOVE Index surpassing its COVID-related highs and reaching its highest level since 2008.
After trading in a relatively tight range in April and early May of 2023, interest rates rose steadily in the latter half of the year,second quarter, and the inversion of the yield curve deepened. Overall, the yield on the 2-year U.S. Treasury increased by 87 basis points to 4.90%, quarter over quarter, while the yield on the 10-year U.S. Treasury increased by
58
37 basis points to 3.84%. Meanwhile, interest rate volatility, as measured by the MOVE Index, declined during the quarter, particularly in June 2023 following the resolution of the federal government's debt ceiling dispute.
In the third quarter of 2023, interest rates increased, particularly long-term interest rates, which caused the inversion of the yield curve to subside somewhat. The yield on the 2-year U.S. Treasury increased by 15 basis points quarter over quarter to 5.04%, while the yield on the 10-year U.S. Treasury increased by 73 basis points quarter over quarter to 4.57%. Toward the end of the quarter, the 2-year U.S. Treasury yield increased 70reached its highest level since July 2006, and the 10-year U.S. Treasury yield reached its highest level since October 2007. Meanwhile, interest rate volatility, as measured by the MOVE Index, remained elevated throughout the quarter.
In the fourth quarter, interest rates reversed course and began to decline, as the market anticipated the conclusion of the Federal Reserve's interest rate hiking cycle. For the quarter, the yield on the 2-year U.S. Treasury decreased by 79 basis points and finished the year at 1.88%to 4.25%, while the 10-year U.S. Treasury yield decreased 4by 69 basis points to 2.41%3.88%. AtThe MOVE Index increased modestly from the previous quarter.
For the full year end, the spread between2023, the 2-year U.S. Treasury yield and 10-year U.S. Treasury yield was just 52decreased by 18 basis points, compared to 126while the 10-year yield increased by 1 basis point.
•Secured Overnight Financing Rates, or "SOFR" rates, rose sharply from the start of the year through July 31, 2023, with one-month term SOFR increasing by 96 basis points at the end of 2016.
•Mortgage rates decreasedmoved in sympathy with long-term interest rates during the first nine months of 2017 before reversing course in the fourth quarter.2023. The Freddie Mac survey 30-year mortgage rate fell 49 basis points between year-end 2016 and September 30, 2017,declined from 6.41% at the start of the year to 5.95% in mid-January, and then steadily rose 16 basis points to 6.74% in early March, before declining to 6.24% by the end 2017of the first quarter. From there, mortgage rates rose steadily for much of 2023, with the Freddie Mac 30-year mortgage rate peaking at 3.99%. Overall Agency RMBS prepayment rates were relatively stable during7.79% on October 26th, its highest level since October 2000.The survey rate then reversed course and fell sharply over the final two months of 2023, declining to 6.42% on December 28th, approximately where it started the year. The
After reaching a 25-year low at the end of 2022, the Mortgage Bankers Association's Refinance Index which measures refinancing application volumes, finished 2017 almost exactly where it beganincreased by 53% in the yearfirst quarter of 2023, before declining through the end of November, driven by higher mortgage rates. The index temporarily rose in mid-December 2023 with lower mortgage rates, and substantially belowdeclined again toward the multi-year high reached in mid-2016.
•Despite higher mortgage rates for much of 2023, the S&P CoreLogic Case-Schiller US National Home Price NSA Index increased by 5.5% during the year. The National Association of Realtors Housing Affordability Index declined by 7% during 2023, as higher mortgage rates and record home prices continued to $13.15 trillionstress housing affordability.
•U.S. real GDP increased at an annualized rate of 2.2% in 2017, which is $473 billion higher than the previous peakfirst quarter, 2.1% in the second quarter, 4.9% in the third quarter, and an estimated annualized rate of $12.68 trillion reached3.2% in the fourth quarter. Meanwhile, the unemployment rate remained low throughout 2023, starting the year at 3.5% and registering 3.7% as of year end.
•Inflation, while still elevated, declined during each of the first six months of 2023. The year-over-year percentage change in the Consumer Price Index for All Urban Consumers ("CPI-U"), not seasonally adjusted, declined from 6.4% in January 2023 to 3.0% in June 2023. Year-over-year inflation then increased again in the third quarter of 2008. The University of Michigan's Index of Consumer Sentiment increased 5.3%2023, registering 3.7% in 2017, indicating consumers hold a favorable assessment of the economy and their current financial condition.
•After a historically difficult year in 2022, MBS performance was mixed in 2023. Following strong absolute and relative performance in January 2023, MBS performance reversed course in mid-February and especially in March, as concerns in the year near all-time highs after receiving a boost from the passage of the TCJA in December, and in particular from anticipation of the lowering of corporate income tax rates starting in 2018.
59
generated a positive return of 7.31% and an excess return of 1.26%. For the full year 2023, the BB MBS Index generated a positive return of 5.05% and an excess return of 0.68%.
•Similarly, after negative performance in 2022, the Bloomberg Barclays U.S. Corporate Bond Index ("BB IG Index") generated positive results on both an absolute and relative basis in 2023, driven by strong results in the fourth quarter of 2023. For the full year 2023, the BB IG Index generated a return of 8.52% on an absolute basis and an excess return of 4.55%. Meanwhile, the Bloomberg Barclays U.S. Corporate High Yield Bond Index ("BB HY Index") generated positive returns in each quarter of 2023 on both an absolute and relative basis. For the full year 2023, the BB HY Index generated a positive return of 13.45% and an excess return of 8.86%.
•U.S. equities were also volatile during 2023, but performed well overall for the year, with the Dow Jones Industrial Average increasing by 13.7%, the S&P 500 rising by 24.2%, and the NASDAQ up 43.4%. Meanwhile, London's FTSE 100 index increased by 3.8% for the year, and the MSCI World global equity index increased by 21.8%. The VIX volatility index spiked in mid-March 2023 in response to the stress in the banking system and again in late September and October, before falling through year end.
Portfolio Overview and Outlook
As of December 31, 2017,2023, our mortgage-backed securities portfolio consisted of $1.556 billion$706.0 million of fixed-rate Agency "specified pools," $29.6$7.1 million of Agency RMBS backed by adjustable rate mortgages, or "Agency ARMs," $70.6ARMs", $14.9 million of Agency reverse mortgage pools, $12.2$7.4 million of Agency interest onlyinterest-only securities, or "Agency IOs," and $18.0IOs", $9.4 million of non-Agency RMBS.RMBS, and $11.3 million of non-Agency interest-only securities, or "non-Agency IOs". Specified pools are fixed-rate Agency pools consisting of mortgages with special characteristics, such as mortgages with low loan balances, mortgages backed by investor properties, mortgages originated through the government-sponsored "Making Homes Affordable" refinancing programs, and mortgages with various other characteristics.
In addition, during the second half of the year, we started rotating a portion of our portfolio reflects the investment capital to corporate CLOs. As of December 31, 2023 our holdings of corporate CLO investments totaled $17.4 million. CLOs are a form of asset-backed security collateralized by syndicated corporate loans. We could continue to increase our capital allocation to CLO mezzanine debt and CLO equity investments, based on a leveraged basis, of the proceeds received through our follow-on equity offering and ATM program during 2017. market opportunities or other factors.
Our debt-to-equity ratio, adjusted for unsettled purchases and sales, decreased to 5.3:1 as of December 31, 20172023, as compared to 7.6:1 as of December 31, 2022. The decline was primarily due to a decrease in borrowings on our smaller Agency RMBS portfolio and 2016 was 8.3:1 and 8.5:1, respectively.significantly higher shareholders' equity, partially offset by a small increase in borrowings on our CLO portfolio. Our debt-to-equity ratio may fluctuate period over period based on portfolio management decisions, market conditions, capital markets activities, and the timing of security purchase and sale transactions. As of December 31, 2023, 93% of our borrowings were secured by Agency RMBS.
As of December 31, 2023, we had cash and cash equivalents of $38.5 million, in addition to other unencumbered assets of $22.9 million. This compares to cash and cash equivalents of $34.8 million and other unencumbered assets of $2.9 million as of December 31, 2022.
The first quarter of 2023 began on a constructive note with interest rates and volatility declining and Agency RMBS yield spreads tightening in January. However, markets reversed course in mid-February on renewed anxiety over inflation and what the Federal Reserve’s response would be. Then in March, turmoil in the banking system put further pressure on Agency yield spreads. Overall, Agency RMBS underperformed U.S. Treasury securities and interest rate swaps (which are the primary instruments we use to hedge our interest rate risk) in the first quarter with the most pronounced underperformance coming on sub-5% coupon RMBS, where our Agency RMBS was concentrated, due to concerns over future selling from distressed regional banks.
FDIC-directed sales of RMBS from failed regional banks commenced at the start of the second quarter of 2023, which pressured yield spreads but also drove strong RMBS demand into May, even as interest rate volatility remained elevated. Then in June, yield spreads tightened following the resolution of the debt ceiling dispute, and Agency RMBS outperformed hedging instruments for the quarter. In addition, separate from the third quarter of 2023, Agency RMBS faced the significant headwinds of elevated market volatility and rising long-term interest rates, resulting in wider yield spreads and Agency RMBS underperformance relative to hedging instruments.
60
In the fourth quarter of 2023, interest rates and volatility increased in October, which drove yield spreads wider in most fixed income sectors, including Agency RMBS. Markets then reversed course, however, with interest rates and volatility declining, and yield spreads tightening, through year end. Overall for the fourth quarter, Agency RMBS outperformed hedging instruments, with lower and intermediate coupon RMBS exhibiting the most pronounced outperformance.
Overall, we had positive net income in the Agency RMBS strategy for the year, driven by net gains on our interest rate hedges, which exceeded net losses on our Agency RMBS and negative net interest income.
Average pay-ups on our specified pool portfolio decreased to 1.01% as of December 31, 2023, as compared to 1.26% as of December 31, 2022. During the year, we continued to hedge interest rate risk primarily through the use of interest rate swaps, and to a lesser extent, short positions in TBAs, U.S. Treasury securities, and futures. We ended the year with a net long TBA position on a notional basis, but a net short TBA position as measured by 10-year equivalents. 10-year equivalents for a group of positions represent the amount of 10-year U.S. Treasury securities that would be expected to experience a similar change in market value under a standard parallel move in interest rates.
In the fourth quarter, our newly established corporate CLO portfolio that we hold for hedging purposes, we increasedcontributed positively to our long TBA positions that we hold for investment purposesresults, driven by net interest income and net gains. Similar to $113.1 million in notional amount at December 31, 2017, as compared to $49.1 million at
Our net mortgage assets-to-equity ratio—which we define as the net aggregate market value of our Agency poolsmortgage-backed securities (including the underlying market values of our long and short TBA positions) divided by shareholders' equity attributable to our mortgage-related strategies—slightly declined during the year. The decrease was driven by lower leverage employed in our mortgage-related strategies at December 31, 2023, despite having a net long TBA position as of December 31, 2023 as compared to a net short TBA position as of December 31, 2022. From time to time, in response to market opportunities and other factors, we increase or decrease our net mortgage assets-to-equity ratio by varying the sizes of our net short TBA positions, divided by total shareholders' equity—as an important measureposition and/or our long RMBS portfolio in relation to the portion of our effective overall leverage. As of December 31, 2017 and 2016,shareholders' equity employed in our mortgage-related strategies. The following table summarizes our net Agency poolmortgage assets-to-equity ratio was 5.5:1 and 5.3:1, respectively. We believe that using TBA short positions to reduce our net Agency pool assets-to-equity ratio has several advantages, including: (i) reducing our risk and book value volatility, (ii) enabling us to take advantage of dislocations in specified pool pay-ups without increasing our overall net exposure to Agency yield spreads, and (iii) during times of increased volatility, allowing us to avoid the high rebalancing costs associated with interest rate swap hedges.
| Notional Amount of Long TBAs | Notional Amount of Short TBAs | Fair Value of Mortgage-backed Securities | Net Long (Short) TBA Underlying Market Value(1) | Net Mortgage Assets-to-Equity Ratio | ||||||||||||||||||||||||||||
| ($ In thousands) | ||||||||||||||||||||||||||||||||
| December 31, 2023 | $ | 107,422 | $ | (78,285) | $ | 756,131 | $ | 36,679 | 6.5:1 | |||||||||||||||||||||||
| September 30, 2023 | 68,064 | (116,747) | 822,718 | (36,149) | 7.2:1 | |||||||||||||||||||||||||||
| June 30, 2023 | 117,009 | (243,532) | 920,714 | (102,485) | 7.0:1 | |||||||||||||||||||||||||||
| March 31, 2023 | 66,488 | (221,497) | 925,531 | (131,188) | 6.9:1 | |||||||||||||||||||||||||||
| December 31, 2022 | 81,759 | (258,253) | 893,301 | (149,982) | 6.6:1 | |||||||||||||||||||||||||||
(1)Market value represents the capital we had raised earlier in the year into Agency RMBS, and having reduced our TBA short position coming into the third quarter. However, although Agency RMBS spreads generally held firm during the fourth quarter, many shorter-duration RMBS (including higher-coupon pools and 15-year pools) underperformed longer-duration RMBS, which led to net unrealized losses on our portfolio for the fourth quarter.
We expect to continue to target specified pools that, taking into account their particular composition and based on our prepayment projections, should: (1) generate attractive yields relative to other Agency RMBS and U.S. Treasury securities, (2) have less prepayment sensitivity to government policy shocks, and/or (3) create opportunities for trading gains once the market recognizes their value, which for newer pools may come only after several months, when actual prepayment experience can be observed. We believe that our research team, proprietary prepayment models, and extensive databases remain essential tools in our implementation of this strategy.
The following table summarizes prepayment rates for our portfolio of fixed-rate specified pools (excluding those backed by reverse mortgages) for the three monththree-month periods ended December 31, 2017,2023, September 30, 2017,2023, June 30, 2017,2023, March 31, 2017,2023, and December 31, 2016.2022.
| Three-Month Period Ended | |||||||||||||||||||||||||||||||||||
| December 31, 2023 | September 30, 2023 | June 30, 2023 | March 31, 2023 | December 31, 2022 | |||||||||||||||||||||||||||||||
Three-Month Constant Prepayment Rates(1) | 6.8 | 7.3 | 7.4 | 4.3 | 6.1 | ||||||||||||||||||||||||||||||
(1)Excludes recent purchases of fixed rate Agency specified pools with no prepayment history.
61
| Three Month Period Ended | |||||||||||||||
| December 31, 2017 | September 30, 2017 | June 30, 2017 | March 31, 2017 | December 31, 2016 | |||||||||||
Three Month Constant Prepayment Rates(1) | 9.6 | % | 9.6 | % | 8.2 | % | 12.7 | % | 15.6 | % | |||||
The following table provides details about the composition of our portfolio of fixed-rate specified pools (excluding those backed by reverse mortgages) as of December 31, 20172023 and 2016.2022.
| December 31, 2017 | December 31, 2016 | ||||||||||||||||||||||||||||||||||||||||||||||||||||||||||||||||||||||||||||||||||||||||||||||
| Coupon | Current Principal | Fair Value | Weighted Average Loan Age (Months) | Current Principal | Fair Value | Weighted Average Loan Age (Months) | |||||||||||||||||||||||||||||||||||||||||||||||||||||||||||||||||||||||||||||||||||||||||
| (In thousands) | (In thousands) | ||||||||||||||||||||||||||||||||||||||||||||||||||||||||||||||||||||||||||||||||||||||||||||||
| December 31, 2023 | December 31, 2023 | December 31, 2022 | |||||||||||||||||||||||||||||||||||||||||||||||||||||||||||||||||||||||||||||||||||||||||||||
| Coupon (%) | Coupon (%) | Current Principal | Fair Value | Weighted Average Loan Age (Months) | Current Principal | Fair Value | Weighted Average Loan Age (Months) | ||||||||||||||||||||||||||||||||||||||||||||||||||||||||||||||||||||||||||||||||||||||||
| (In thousands) | |||||||||||||||||||||||||||||||||||||||||||||||||||||||||||||||||||||||||||||||||||||||||||||||
| Fixed-rate Agency RMBS: | |||||||||||||||||||||||||||||||||||||||||||||||||||||||||||||||||||||||||||||||||||||||||||||||
| Fixed-rate Agency RMBS: | |||||||||||||||||||||||||||||||||||||||||||||||||||||||||||||||||||||||||||||||||||||||||||||||
| Fixed-rate Agency RMBS: | |||||||||||||||||||||||||||||||||||||||||||||||||||||||||||||||||||||||||||||||||||||||||||||||
| 15-year fixed-rate mortgages: | |||||||||||||||||||||||||||||||||||||||||||||||||||||||||||||||||||||||||||||||||||||||||||||||
| 2.50 | $ | 612 | $ | 613 | 52 | $ | — | $ | — | — | |||||||||||||||||||||||||||||||||||||||||||||||||||||||||||||||||||||||||||||||||||||
| 3.00 | 50,391 | 51,453 | 21 | 35,199 | 36,201 | 20 | |||||||||||||||||||||||||||||||||||||||||||||||||||||||||||||||||||||||||||||||||||||||||
| 3.50 | 110,748 | 115,001 | 24 | 97,018 | 101,868 | 21 | |||||||||||||||||||||||||||||||||||||||||||||||||||||||||||||||||||||||||||||||||||||||||
| 4.00 | 9,247 | 9,707 | 36 | 9,612 | 10,294 | 30 | |||||||||||||||||||||||||||||||||||||||||||||||||||||||||||||||||||||||||||||||||||||||||
| 15-year fixed-rate mortgages: | |||||||||||||||||||||||||||||||||||||||||||||||||||||||||||||||||||||||||||||||||||||||||||||||
| 15-year fixed-rate mortgages: | |||||||||||||||||||||||||||||||||||||||||||||||||||||||||||||||||||||||||||||||||||||||||||||||
| 1.50-1.99 | |||||||||||||||||||||||||||||||||||||||||||||||||||||||||||||||||||||||||||||||||||||||||||||||
| 1.50-1.99 | |||||||||||||||||||||||||||||||||||||||||||||||||||||||||||||||||||||||||||||||||||||||||||||||
| 1.50-1.99 | |||||||||||||||||||||||||||||||||||||||||||||||||||||||||||||||||||||||||||||||||||||||||||||||
| 2.50–2.99 | |||||||||||||||||||||||||||||||||||||||||||||||||||||||||||||||||||||||||||||||||||||||||||||||
| 3.00–3.49 | |||||||||||||||||||||||||||||||||||||||||||||||||||||||||||||||||||||||||||||||||||||||||||||||
| 3.50–3.99 | |||||||||||||||||||||||||||||||||||||||||||||||||||||||||||||||||||||||||||||||||||||||||||||||
| 4.00–4.49 | |||||||||||||||||||||||||||||||||||||||||||||||||||||||||||||||||||||||||||||||||||||||||||||||
| 4.50–4.99 | |||||||||||||||||||||||||||||||||||||||||||||||||||||||||||||||||||||||||||||||||||||||||||||||
| Total 15-year fixed-rate mortgages | 170,998 | 176,774 | 24 | 141,829 | 148,363 | 22 | |||||||||||||||||||||||||||||||||||||||||||||||||||||||||||||||||||||||||||||||||||||||||
| 20-year fixed-rate mortgages | 4.00 | 8,712 | 9,230 | 36 | 10,488 | 11,185 | 18 | ||||||||||||||||||||||||||||||||||||||||||||||||||||||||||||||||||||||||||||||||||||||||
| 20-year fixed-rate mortgages: | |||||||||||||||||||||||||||||||||||||||||||||||||||||||||||||||||||||||||||||||||||||||||||||||
| 2.00–2.49 | |||||||||||||||||||||||||||||||||||||||||||||||||||||||||||||||||||||||||||||||||||||||||||||||
| 2.00–2.49 | |||||||||||||||||||||||||||||||||||||||||||||||||||||||||||||||||||||||||||||||||||||||||||||||
| 2.00–2.49 | |||||||||||||||||||||||||||||||||||||||||||||||||||||||||||||||||||||||||||||||||||||||||||||||
| 2.50–2.99 | |||||||||||||||||||||||||||||||||||||||||||||||||||||||||||||||||||||||||||||||||||||||||||||||
| 3.00–3.49 | 3.00–3.49 | 1,147 | 1,045 | 46 | 1,362 | 1,236 | 34 | ||||||||||||||||||||||||||||||||||||||||||||||||||||||||||||||||||||||||||||||||||||||||
| 4.00–4.49 | |||||||||||||||||||||||||||||||||||||||||||||||||||||||||||||||||||||||||||||||||||||||||||||||
| 4.50–4.99 | |||||||||||||||||||||||||||||||||||||||||||||||||||||||||||||||||||||||||||||||||||||||||||||||
| 5.00–5.49 | |||||||||||||||||||||||||||||||||||||||||||||||||||||||||||||||||||||||||||||||||||||||||||||||
| 6.50–6.99 | |||||||||||||||||||||||||||||||||||||||||||||||||||||||||||||||||||||||||||||||||||||||||||||||
| Total 20-year fixed-rate mortgages | |||||||||||||||||||||||||||||||||||||||||||||||||||||||||||||||||||||||||||||||||||||||||||||||
| 30-year fixed-rate mortgages: | |||||||||||||||||||||||||||||||||||||||||||||||||||||||||||||||||||||||||||||||||||||||||||||||
| 2.50 | — | — | — | 1,607 | 1,562 | 2 | |||||||||||||||||||||||||||||||||||||||||||||||||||||||||||||||||||||||||||||||||||||||||
| 3.00 | 15,580 | 15,612 | 29 | 16,000 | 15,970 | 29 | |||||||||||||||||||||||||||||||||||||||||||||||||||||||||||||||||||||||||||||||||||||||||
| 3.03 | 456 | 457 | 66 | — | — | — | |||||||||||||||||||||||||||||||||||||||||||||||||||||||||||||||||||||||||||||||||||||||||
| 3.25 | 1,100 | 1,115 | 12 | — | — | — | |||||||||||||||||||||||||||||||||||||||||||||||||||||||||||||||||||||||||||||||||||||||||
| 3.28 | 373 | 373 | 66 | — | — | — | |||||||||||||||||||||||||||||||||||||||||||||||||||||||||||||||||||||||||||||||||||||||||
| 3.50 | 433,348 | 447,904 | 22 | 255,122 | 263,743 | 18 | |||||||||||||||||||||||||||||||||||||||||||||||||||||||||||||||||||||||||||||||||||||||||
| 3.75 | 3,319 | 3,455 | 5 | — | — | — | |||||||||||||||||||||||||||||||||||||||||||||||||||||||||||||||||||||||||||||||||||||||||
| 4.00 | 522,981 | 551,217 | 18 | 391,677 | 415,251 | 17 | |||||||||||||||||||||||||||||||||||||||||||||||||||||||||||||||||||||||||||||||||||||||||
| 4.25 | 5,672 | 5,992 | 5 | — | — | — | |||||||||||||||||||||||||||||||||||||||||||||||||||||||||||||||||||||||||||||||||||||||||
| 4.50 | 281,412 | 300,833 | 20 | 173,689 | 188,083 | 22 | |||||||||||||||||||||||||||||||||||||||||||||||||||||||||||||||||||||||||||||||||||||||||
| 5.00 | 37,379 | 40,451 | 48 | 48,324 | 52,981 | 35 | |||||||||||||||||||||||||||||||||||||||||||||||||||||||||||||||||||||||||||||||||||||||||
| 5.50 | 1,228 | 1,347 | 131 | 1,670 | 1,854 | 119 | |||||||||||||||||||||||||||||||||||||||||||||||||||||||||||||||||||||||||||||||||||||||||
| 6.00 | 736 | 833 | 135 | 887 | 1,013 | 123 | |||||||||||||||||||||||||||||||||||||||||||||||||||||||||||||||||||||||||||||||||||||||||
| 2.00–2.49 | |||||||||||||||||||||||||||||||||||||||||||||||||||||||||||||||||||||||||||||||||||||||||||||||
| 2.00–2.49 | |||||||||||||||||||||||||||||||||||||||||||||||||||||||||||||||||||||||||||||||||||||||||||||||
| 2.00–2.49 | |||||||||||||||||||||||||||||||||||||||||||||||||||||||||||||||||||||||||||||||||||||||||||||||
| 2.50–2.99 | |||||||||||||||||||||||||||||||||||||||||||||||||||||||||||||||||||||||||||||||||||||||||||||||
| 3.00–3.49 | |||||||||||||||||||||||||||||||||||||||||||||||||||||||||||||||||||||||||||||||||||||||||||||||
| 3.50–3.99 | |||||||||||||||||||||||||||||||||||||||||||||||||||||||||||||||||||||||||||||||||||||||||||||||
| 4.00–4.49 | |||||||||||||||||||||||||||||||||||||||||||||||||||||||||||||||||||||||||||||||||||||||||||||||
| 4.50–4.99 | |||||||||||||||||||||||||||||||||||||||||||||||||||||||||||||||||||||||||||||||||||||||||||||||
| 5.00–5.49 | |||||||||||||||||||||||||||||||||||||||||||||||||||||||||||||||||||||||||||||||||||||||||||||||
| 5.50–5.99 | |||||||||||||||||||||||||||||||||||||||||||||||||||||||||||||||||||||||||||||||||||||||||||||||
| 6.00–6.49 | |||||||||||||||||||||||||||||||||||||||||||||||||||||||||||||||||||||||||||||||||||||||||||||||
| 6.50–6.99 | |||||||||||||||||||||||||||||||||||||||||||||||||||||||||||||||||||||||||||||||||||||||||||||||
| Total 30-year fixed-rate mortgages | 1,303,584 | 1,369,589 | 21 | 888,976 | 940,457 | 20 | |||||||||||||||||||||||||||||||||||||||||||||||||||||||||||||||||||||||||||||||||||||||||
| Total fixed-rate Agency RMBS | $ | 1,483,294 | $ | 1,555,593 | 21 | $ | 1,041,293 | $ | 1,100,005 | 20 | |||||||||||||||||||||||||||||||||||||||||||||||||||||||||||||||||||||||||||||||||||||
For the year ended December 31, 2017,2023, we had total net realized and unrealized lossesgains on our Agency securities of $(9.0)$0.2 million, or $(0.77)$0.01 per share, on our aggregateshare. Our Agency RMBS portfolio. Although Agency RMBS prices remained firm during the year, many shorter-duration RMBS (including higher-coupon pools and 15-year pools) underperformed longer-duration RMBS, leading to net unrealized losses on our overall portfolio turnover was approximately 87% for the year. We had total net realized and unrealized gains for the year of $2.5 million, or $0.21 per share, on our non-Agency RMBS portfolio as underlying fundamentals remained strong.
For the year ended December 31, 2023, we continued to hedge interest rate risk primarily through the use of interest rate swaps, and short positions in TBAs, and to a lesser extent, short positions in TBAs, U.S. Treasury securities. For the year, wesecurities, and futures. We had total net realized and unrealized lossesgains of $(7.1)$10.8 million, or $(0.62)$0.73 per share, on our interest rate hedging portfolio. Inportfolio, as sharply rising interest rates in the
62
second and third quarters of the year drove a significant gain on our hedging portfolio, the relative proportion (based on 10-year equivalents1) of TBA short positions decreased year over year relative to interest rate swaps.hedges during those periods. These gains were partially offset by net losses in the first and fourth quarters, driven by declining interest rates. These gains exclude net realized and unrealized gains of $0.6 million, or $0.04 per share, on our long TBAs held for investment.
The relative makeup of our interest rate hedging portfolio can change materially from period to period. We may also selectively hedge our corporate CLO and/or non-Agency RMBS investments; as of December 31, 2023, we had a small credit hedge position in place.
After giving effect to quarterly dividends in the aggregate amount of $1.57 per share, and including the approximately $0.44 per share dilutive effect of our common share offeringsdeclared during the year ended December 31, 2023 of $0.96 per share, our book value per share decreased to $14.45$7.32 as of December 31, 2017,2023, from $15.52$8.40 as of December 31, 2016,2022, and as a result we had ana negative economic return of 3.2%(1.4)% for the year. Excluding the dilutive effect of our common share offerings, we had an economicyear ended December 31, 2023. Economic return of 6.1% for the year. Economic returna period is computed by adding back dividends declared during the period to ending book value per share, and comparing that amount to book value per share as of the beginning of the year.
We believe that our adaptive and active style of portfolio management is well suited to the current MBS market environment, which, continuesespecially given the current effects and future uncertainties related to be shaped by heightened prepayment risk,quantitative tightening, shifting central bank and government policies, regulatory changes, and developing technologies.disruptive technological developments, exhibits high levels of interest rate risk, prepayment risk (including extension risk), financing and liquidity risk.
Financing
While large banks still dominate the repo market, non-bank firms, not subject to the same regulations as banks, are becoming more active in providing repo financing. Most of our outstanding repo financing is still provided by banks and bank affiliates; however, in limited amounts, we have also entered into repo agreements with non-bank dealers. In general, we continue to see strong appetite and competitive terms from both types of lenders.
Our debt-to-equity ratio was to 8.3:5.4:1 as of December 31, 20172023, as compared to 8.5:7.5:1 as of December 31, 2016.2022. Adjusted for unsettled security purchases and sales, our debt-to-equitydebt-to equity ratio was 8.2:5.3:1 as of December 31, 2017 and 8.3:2023, as compared to 7.6:1 as of December 31, 2016.2022. The decline was primarily due to a decrease in borrowings on our smaller Agency RMBS portfolio (reflecting in part the ongoing rotation of investment capital from RMBS to corporate CLOs) and significantly higher shareholders' equity. Our leveragedebt-to-equity ratio may fluctuate period over period based on portfolio management decisions, market conditions, capital markets activities, and the timing of security purchase and sale transactions.
Critical Accounting PoliciesEstimates
Our consolidated financial statements have been prepared in conformity with generally accepted accounting principles in the United States of America, or "U.S. GAAP.GAAP," and Regulation S-X. Entities in which we have a controlling financial interest, through ownership of the majority of the entities' voting equity interests, or through other contractual rightrights that give us control, are consolidated by us. All inter-company balances and transactions have been eliminated.
Valuation: We have elected the fair value option for the vast majority of our assets and liabilities for which such election is permitted, as provided for under ASC 825, Financial Instruments ("ASC 825"). Electing the fair value option allows us to record changes in fair value in our Consolidated Statement of Operations, which, in our view, more appropriately reflects the results of our operations for a particular reporting period as all securities activities will be recorded in a similar manner. As
63
such, the mortgage-backed securities are recorded at fair value on our Consolidated Balance Sheet and the period change in fair value is recorded in current period earnings on our Consolidated Statement of Operations as a component of Change in net unrealized gains (losses) on securities. Purchase and sales transactions are generally recorded on trade date. Realized and unrealized gains and losses are calculated based on identified cost.
For financial instruments that are traded in an "active market," the best measure of fair value is the quoted market price. However, many of our financial instruments are not traded in an active market. Therefore, management generally uses third-party valuations when available. If third-party valuations are not available, management uses other valuation techniques, such as the discounted cash flow methodology.
Summary descriptions, for the various categories of financial instruments, of the valuation methodologies management uses in determining fair value of our financial instruments are detailed
in Note 2 of the notes to our consolidated financial statements. Management utilizes such methodologies to assign a good faith fair value (the estimated price that, in an orderly transaction at the valuation date, would be received to sell an asset, or paid to transfer a liability, as the case may be) to each such financial instrument.
See the notes to our consolidated financial statements for more information on valuation techniques used by management in the valuation of our assets and liabilities.
The determination of estimated fair value option allows usof those of our financial instruments that are not traded in an active market requires the use of both macroeconomic and microeconomic assumptions and/or inputs, which are generally based on current market and economic conditions. Changes in market and/or economic conditions could have a significant adverse effect on the estimated fair value of our financial instruments. Changes to recordassumptions, including assumed market yields, may significantly impact the estimated fair value of our investments. Our valuations are sensitive to changes in fair value in our Consolidated Statement of Operations, which, in our view, more appropriately reflectsinterest rates; see the results of our operations for a particular reporting period as all securities activities will be recorded in a similar manner. As such, the mortgage-backed securities are recorded at fair value on our Consolidated Balance Sheet and the period change in fair value is recorded in current period earnings on our Consolidated Statement of Operations as a component of Change in net unrealized gains (losses) on securities.
Interest Income: Coupon interest income on investment securities is accrued based on the outstanding principal balance and the current coupon rate on each security. We generally amortize purchase premiums and accrete purchase discounts on our fixed incomefixed-income investments using the effective interest method. For certain of our securities, for purposes of estimating future expected cash flows, management uses assumptions including, but not limited to, assumptions for future prepayment rates, default rates, and loss severities (each of which may in turn incorporate various macroeconomic assumptions, such as future housing prices, GDP growth rates, and unemployment rates). These assumptions require the use of a significant amount of judgment. Any resulting changes in effective yield are recognized prospectively based on the current amortized cost of the investment as adjusted for credit impairment, if any.
The effective yield on our debt securities that are deemed to be of high credit quality (including Agency RMBS, exclusive of interest only securities) can be significantly impacted by our estimate of future prepayments. Future prepayment rates are difficult to predict. We estimate prepayment rates over the remaining life of our securities using models that generally incorporate the forward yield curve, current mortgage rates, mortgage rates on the outstanding loans, age and size of the outstanding loans, and other factors. We compare estimated prepayments to actual prepayments on a quarterly basis, and effective yields are recalculated retroactive to the time of purchase. When differences arise between our previously calculated effective yields and our current calculated effective yields, a catch-up adjustment, or "Catch-up Amortization Adjustment," is made to interest income to reflect the cumulative impact of the changes in effective yields. For the years ended December 31, 2023 and 2022, we recognized a Catch-up Amortization Adjustment of $(0.1) million and $3.1 million, respectively. The Catch-up Amortization Adjustment is reflected as an increase (decrease) to interest income on the Consolidated Statement of Operations.
Our accretion of discounts and amortization of premiums on securities for U.S. federal and other tax purposes is likely to differ from the accounting treatment under U.S. GAAP of these items as described above.
See the Note 2 of the notes to our consolidated financial statements for more information on the assumptions and methods that we use to amortize purchase premiums and accrete purchase discounts.
Income Taxes: We made an election to be taxed as a REIT for U.S. federal income tax purposes. As a REIT, wepurposes and are generally are not subject to corporate-level federal and state income tax on net income we distribute to our shareholders. To qualify as a REIT, we must meet a number of organizational and operational requirements, including a requirement to distribute at least 90% of our taxable income to our shareholders. Even if we qualify as a REIT, we may be subject to certain federal, state, local and foreign taxes on our income and property and to federal income and excise taxes on our undistributed taxable income. Ifshareholders within the Company fails to qualify as a REIT, and does not qualify for certain statutory relief provisions, it will be subject to U.S. federal, state, and local income taxes and may be precluded from qualifying as a REIT for the four taxable years following the year in which the Company fails to qualify as a REIT.
64
liability that has not been recorded in the accompanying consolidated financial statements. Also, management's conclusions regarding the authoritative guidance may be subject to review and adjustment at a later date based on changing tax laws, regulations, and interpretations thereof. There were no amounts accrued for penalties or interest asAs of or duringDecember 31, 2023, the periods presented in theREIT had a net operating loss carry-forward of approximately $39 million. See Note 2 to our consolidated financial statements included in this Annual Reportfor additional details on Form 10-K.income taxes.
Recent Accounting Pronouncements
Refer to the notes to our consolidated financial statements for a description of relevant recent accounting pronouncements.
Financial Condition
Investment portfolio
The following tables summarize our mortgage-backed securities portfolio of as of December 31, 20172023 and 2016:2022:
| December 31, 2023 | December 31, 2022 | ||||||||||||||||||||||||||||||||||||||||||||||||||||||||||
| ($ In thousands) | Current Principal | Fair Value | Average Price(1) | Cost | Average Cost(1) | Current Principal | Fair Value | Average Price(1) | Cost | Average Cost(1) | |||||||||||||||||||||||||||||||||||||||||||||||||
| Agency Portfolio: | |||||||||||||||||||||||||||||||||||||||||||||||||||||||||||
Agency RMBS(2) | |||||||||||||||||||||||||||||||||||||||||||||||||||||||||||
| 15-year fixed-rate mortgages | $ | 28,647 | $ | 27,847 | 97.21 | $ | 28,765 | 100.41 | $ | 47,453 | $ | 45,324 | 95.51 | $ | 48,899 | 103.05 | |||||||||||||||||||||||||||||||||||||||||||
| 20-year fixed-rate mortgages | 8,524 | 7,863 | 92.25 | 9,033 | 105.97 | 10,812 | 9,691 | 89.63 | 11,508 | 106.44 | |||||||||||||||||||||||||||||||||||||||||||||||||
| 30-year fixed-rate mortgages | 697,510 | 670,294 | 96.10 | 682,379 | 97.83 | 841,823 | 781,754 | 92.86 | 849,168 | 100.87 | |||||||||||||||||||||||||||||||||||||||||||||||||
| ARMs | 7,127 | 7,119 | 99.89 | 8,060 | 113.09 | 8,696 | 8,663 | 99.62 | 9,595 | 110.34 | |||||||||||||||||||||||||||||||||||||||||||||||||
| Reverse mortgages | 14,406 | 14,874 | 103.25 | 16,589 | 115.15 | 17,506 | 17,852 | 101.98 | 19,659 | 112.30 | |||||||||||||||||||||||||||||||||||||||||||||||||
| Total Agency RMBS | 756,214 | 727,997 | 96.27 | 744,826 | 98.49 | 926,290 | 863,284 | 93.20 | 938,829 | 101.35 | |||||||||||||||||||||||||||||||||||||||||||||||||
| Agency IOs | n/a | 7,415 | n/a | 6,607 | n/a | n/a | 9,313 | n/a | 9,212 | n/a | |||||||||||||||||||||||||||||||||||||||||||||||||
| Total Agency | 735,412 | 751,433 | 872,597 | 948,041 | |||||||||||||||||||||||||||||||||||||||||||||||||||||||
| Credit Portfolio: | |||||||||||||||||||||||||||||||||||||||||||||||||||||||||||
| CLO Notes | 16,876 | 14,491 | 85.87 | 14,441 | 85.57 | — | — | — | — | — | |||||||||||||||||||||||||||||||||||||||||||||||||
| CLO Equity | n/a | 2,926 | n/a | 2,947 | n/a | — | — | — | — | — | |||||||||||||||||||||||||||||||||||||||||||||||||
Non-Agency RMBS(2) | 9,953 | 9,409 | 94.53 | 8,189 | 82.28 | 16,895 | 12,566 | 74.38 | 12,414 | 73.48 | |||||||||||||||||||||||||||||||||||||||||||||||||
| Non-Agency IOs | n/a | 11,310 | n/a | 8,700 | n/a | n/a | 8,138 | n/a | 6,289 | n/a | |||||||||||||||||||||||||||||||||||||||||||||||||
| Preferred equity securities | — | — | — | — | — | n/a | 208 | n/a | 202 | n/a | |||||||||||||||||||||||||||||||||||||||||||||||||
| Total Credit | 38,136 | 34,277 | 20,912 | 18,905 | |||||||||||||||||||||||||||||||||||||||||||||||||||||||
| U.S. Treasury securities sold short | — | — | — | — | — | (500) | (498) | 99.60 | (499) | 99.80 | |||||||||||||||||||||||||||||||||||||||||||||||||
| Reverse repurchase agreements | — | — | — | — | — | 499 | 499 | 100.00 | 499 | 100.00 | |||||||||||||||||||||||||||||||||||||||||||||||||
| Total | $ | 773,548 | $ | 785,710 | $ | 893,510 | $ | 966,946 | |||||||||||||||||||||||||||||||||||||||||||||||||||
| December 31, 2017 | December 31, 2016 | ||||||||||||||||||||||||||||||||||||||
| (In thousands) | Current Principal | Fair Value | Average Price(1) | Cost | Average Cost(1) | Current Principal | Fair Value | Average Price(1) | Cost | Average Cost(1) | |||||||||||||||||||||||||||||
Agency RMBS(2) | |||||||||||||||||||||||||||||||||||||||
| 15-year fixed-rate mortgages | $ | 170,998 | $ | 176,774 | $ | 103.38 | $ | 178,551 | $ | 104.42 | $ | 141,829 | $ | 148,363 | $ | 104.61 | $ | 148,873 | $ | 104.97 | |||||||||||||||||||
| 20-year fixed-rate mortgages | 8,712 | 9,230 | 105.95 | 9,394 | 107.83 | 10,488 | 11,185 | 106.65 | 11,275 | 107.50 | |||||||||||||||||||||||||||||
| 30-year fixed-rate mortgages | 1,303,584 | 1,369,589 | 105.06 | 1,380,265 | 105.88 | 888,976 | 940,457 | 105.79 | 948,157 | 106.66 | |||||||||||||||||||||||||||||
| ARMs | 28,087 | 29,558 | 105.24 | 29,949 | 106.63 | 31,656 | 33,138 | 104.68 | 33,226 | 104.96 | |||||||||||||||||||||||||||||
| Reverse mortgages | 64,608 | 70,617 | 109.30 | 70,901 | 109.74 | 57,411 | 62,058 | 108.09 | 63,114 | 109.93 | |||||||||||||||||||||||||||||
| Total Agency RMBS | 1,575,989 | 1,655,768 | 105.06 | 1,669,060 | 105.91 | 1,130,360 | 1,195,201 | 105.74 | 1,204,645 | 106.57 | |||||||||||||||||||||||||||||
| Non-Agency RMBS | 21,995 | 18,025 | 81.95 | 15,278 | 69.46 | 27,794 | 19,446 | 69.96 | 18,268 | 65.73 | |||||||||||||||||||||||||||||
Total RMBS(2) | 1,597,984 | 1,673,793 | 104.74 | 1,684,338 | 105.40 | 1,158,154 | 1,214,647 | 104.88 | 1,222,913 | 105.59 | |||||||||||||||||||||||||||||
| Agency IOs | n/a | 12,205 | n/a | 13,197 | n/a | n/a | 12,347 | n/a | 11,841 | n/a | |||||||||||||||||||||||||||||
| Total mortgage-backed securities | 1,685,998 | 1,697,535 | 1,226,994 | 1,234,754 | |||||||||||||||||||||||||||||||||||
| U.S. Treasury securities sold short | (82,492) | (81,289 | ) | 98.54 | (81,836 | ) | 99.20 | (78,589) | (74,194 | ) | 94.41 | (75,465 | ) | 96.02 | |||||||||||||||||||||||||
| Reverse repurchase agreements | 81,461 | 81,461 | 100.00 | 81,461 | 100.00 | 75,012 | 75,012 | 100.00 | 75,012 | 100.00 | |||||||||||||||||||||||||||||
| Total | $ | 1,686,170 | $ | 1,697,160 | $ | 1,227,812 | $ | 1,234,301 | |||||||||||||||||||||||||||||||
(2)Excludes IOs.
As of December 31, 2023, 89% of our invested capital was allocated to mortgage-related securities and 11% was allocated to corporate CLOs. The vast majority of our capital is allocated to ourmortgage-related securities are Agency RMBS, strategy, which includesinclude investments in Agency pools and Agency CMOs. Within this strategy, we generally target Agency RMBS pools that, taking into account their particular composition and based on our prepayment projections: (1) should generate attractive yields relative to other Agency RMBS and U.S. Treasury securities, (2) should have less prepayment sensitivity to government policy shocks and/collateralized mortgage obligations, or (3) should create opportunities for trading gains once the market recognizes their value, which for newer pools may come only after several months when actual prepayment experience can be observed. As of both December 31, 2017 and 2016, investments in non-Agency RMBS constituted a relatively small portion of our total investments."CMOs."
Our most prevalent method of financing RMBS is through short-term repurchase agreements,repos, which generally have maturities of 180364 days or less. The weighted average lives of the RMBS that we own are generally much longer. Consequently, the weighted average term of our repurchase agreement financings will almost always be substantially shorter than the expected average maturity of our RMBS. This mismatch in maturities, together with the uncertainty of RMBS prepayments, and other potential changes in timing and/or amount of cash flows on our RMBS assets, creates the risk that changes in interest rates will cause our financing costs with respect to our RMBS to increase relative to the income on our RMBS over the term of our investments.
65
Financial Derivatives
The following table summarizes our portfolio of financial derivative holdings as of December 31, 20172023 and 2016:2022:
| (In thousands) | December 31, 2017 | December 31, 2016 | (In thousands) | December 31, 2023 | December 31, 2022 | |||||||||||||||||||||||
| Financial derivatives–assets, at fair value: | ||||||||||||||||||||||||||||
| TBA securities purchase contracts | $ | 26 | $ | 96 | ||||||||||||||||||||||||
| TBA securities purchase contracts | ||||||||||||||||||||||||||||
| TBA securities purchase contracts | ||||||||||||||||||||||||||||
| TBA securities sale contracts | 376 | 949 | ||||||||||||||||||||||||||
| Fixed payer interest rate swaps | 7,475 | 4,198 | ||||||||||||||||||||||||||
| Fixed receiver interest rate swaps | 563 | 693 | ||||||||||||||||||||||||||
| Swaptions | 181 | — | ||||||||||||||||||||||||||
| Futures | ||||||||||||||||||||||||||||
| Futures | ||||||||||||||||||||||||||||
| Futures | 171 | 72 | ||||||||||||||||||||||||||
| Total financial derivatives–assets, at fair value | 8,792 | 6,008 | ||||||||||||||||||||||||||
| Financial derivatives–liabilities, at fair value: | ||||||||||||||||||||||||||||
| TBA securities purchase contracts | (266 | ) | — | |||||||||||||||||||||||||
| TBA securities purchase contracts | ||||||||||||||||||||||||||||
| TBA securities purchase contracts | ||||||||||||||||||||||||||||
| TBA securities sale contracts | (469 | ) | (554 | ) | ||||||||||||||||||||||||
| Fixed payer interest rate swaps | (1,128 | ) | (1,421 | ) | ||||||||||||||||||||||||
| Fixed receiver interest rate swaps | ||||||||||||||||||||||||||||
| Futures | ||||||||||||||||||||||||||||
| Futures | ||||||||||||||||||||||||||||
| Futures | ||||||||||||||||||||||||||||
| Credit Default Swaps | ||||||||||||||||||||||||||||
| Total financial derivatives–liabilities, at fair value | (1,863 | ) | (1,975 | ) | ||||||||||||||||||||||||
| Total | $ | 6,929 | $ | 4,033 | ||||||||||||||||||||||||
Pursuant to our hedging program, we engage in a variety of interest rate hedging activities that are designed to reduce the interest rate risk with respect to the liabilities incurred to acquire or hold RMBS. These interest rate hedges generally seek to reduce the interest rate sensitivity of our liabilities or, in other words, reduce the volatility of our financing cost over time attributable to interest rate changes. Our interest rate hedging transactions may include:
•Interest rate swaps (a contract exchanging a variable rate for a fixed rate, or vice versa);
•Interest rate swaptions (options to enter into interest rate swaps at a future date);
•TBA forward contracts on Agency pass-through certificates;
•Short sales of U.S. Treasury securities;
•Eurodollar and U.S. Treasury futures; and
•Other derivatives.
We generally enter into these transactions to offset the potential adverse effects of rising interest rates on short-term repurchase agreements. Our repurchase agreements generally have maturities of up to 180364 days and carry interest rates that are determined by reference to LIBOR or correlateda benchmark ratesrate such as SOFR for those same periods. As each then-existing fixed-rate repo borrowing matures, it will generally be replaced with a new fixed-rate repo borrowing based on market interest rates established at that future date.
In the case of interest rate swaps, most of our agreementscontracts are structured such that we receive payments based on a variable interest rate and make payments based on a fixed interest rate. The variable interest rate on which payments are received is generally calculated based on various reset mechanisms for LIBOR.a benchmark rate such as SOFR. To the extent that the benchmark rates used to calculate the payments we receive on our future repo borrowing costsinterest rate swaps continue to be highly correlated with LIBOR, our repo borrowing costs, our interest rate swap agreementscontracts should help to reduce the variability of our overall repo borrowing costs, thus reducing risk to the extent we hold fixed-rate assets that are financed with repo borrowings.
In the case of TBAs, mostmany of our positions are short TBA positions with a negative duration, meaning that asshould interest rates rise, the value of the short position increases, so these positions serve as a hedge against increases in interest rates. In the event that interest rates rise, thewould be expected to increase. This expected increase in value of the short TBA position serveswould then serve to offset corollary expected increases in our current and/or future borrowing costs under our repurchase agreements.agreements, and so in this manner our short TBA positions serve as a hedge against potential increases in interest rates. While we primarily use TBAs to hedge interest rate risk from time to timeand certain other risks, we also hold net long positions in certain TBA securities as a means of acquiring exposure to Agency RMBS. Our ability
66
Credit Risk Hedging
We also selectively enter into credit-hedging positions in order to engage in TBA transactions may be limited byprotect against adverse credit events with respect to our intentionCLO and/or non-Agency RMBS investments, subject to remain qualifiedmaintaining our qualification as a REIT.
place.
The composition and relative mix of our hedging instruments may vary from period to period given the amount of our liabilities outstanding or anticipated to be entered into, the overall market environment and our view as to which instruments best enable us to execute our hedging goals.
Leverage
The following table summarizes our outstanding liabilities under repurchase agreements as of December 31, 20172023 and 2016.2022. We had no other borrowings outstanding.
| December 31, 2023 | December 31, 2023 | December 31, 2022 | ||||||||||||||||||||||||||||||||||||||||||||||||||||||||||||||||||||||||||||||||||||||||||
| Weighted Average | Weighted Average | Weighted Average | ||||||||||||||||||||||||||||||||||||||||||||||||||||||||||||||||||||||||||||||||||||||||||
| Remaining Days to Maturity | Remaining Days to Maturity | Borrowings Outstanding | Interest Rate | Remaining Days to Maturity | Borrowings Outstanding | Interest Rate | Remaining Days to Maturity | |||||||||||||||||||||||||||||||||||||||||||||||||||||||||||||||||||||||||||||||||||||
| (In thousands) | ||||||||||||||||||||||||||||||||||||||||||||||||||||||||||||||||||||||||||||||||||||||||||||
| 30 days or less | ||||||||||||||||||||||||||||||||||||||||||||||||||||||||||||||||||||||||||||||||||||||||||||
| 30 days or less | ||||||||||||||||||||||||||||||||||||||||||||||||||||||||||||||||||||||||||||||||||||||||||||
| 30 days or less | $ | 713,678 | 5.56 | % | 17 | $ | 563,926 | 4.01 | % | 14 | ||||||||||||||||||||||||||||||||||||||||||||||||||||||||||||||||||||||||||||||||||
| 31-60 days | 31-60 days | 6,131 | 6.69 | 46 | 210,569 | 2.73 | 44 | |||||||||||||||||||||||||||||||||||||||||||||||||||||||||||||||||||||||||||||||||||||
| 61-90 days | 61-90 days | 9,734 | 6.47 | 67 | 67,960 | 4.16 | 72 | |||||||||||||||||||||||||||||||||||||||||||||||||||||||||||||||||||||||||||||||||||||
| December 31, 2017 | December 31, 2016 | |||||||||||||||||||||||||||||||||||||||||||||||||||||||||||||||||||||||||||||||||||||||||||
| Weighted Average | Weighted Average | |||||||||||||||||||||||||||||||||||||||||||||||||||||||||||||||||||||||||||||||||||||||||||
| Remaining Days to Maturity | Borrowings Outstanding | Interest Rate | Remaining Days to Maturity | Borrowings Outstanding | Interest Rate | Remaining Days to Maturity | ||||||||||||||||||||||||||||||||||||||||||||||||||||||||||||||||||||||||||||||||||||||
| Total | ||||||||||||||||||||||||||||||||||||||||||||||||||||||||||||||||||||||||||||||||||||||||||||
| (In thousands) | ||||||||||||||||||||||||||||||||||||||||||||||||||||||||||||||||||||||||||||||||||||||||||||
| 30 days or less | $ | 410,628 | 1.41 | % | 15 | $ | 545,817 | 0.80 | % | 19 | ||||||||||||||||||||||||||||||||||||||||||||||||||||||||||||||||||||||||||||||||||
| 31-60 days | 906,602 | 1.46 | 46 | 304,398 | 0.91 | 45 | ||||||||||||||||||||||||||||||||||||||||||||||||||||||||||||||||||||||||||||||||||||||
| 61-90 days | 273,665 | 1.60 | 74 | 299,081 | 0.98 | 74 | ||||||||||||||||||||||||||||||||||||||||||||||||||||||||||||||||||||||||||||||||||||||
| 91-120 days | 6,311 | 1.61 | 120 | 1,050 | 0.88 | 109 | ||||||||||||||||||||||||||||||||||||||||||||||||||||||||||||||||||||||||||||||||||||||
| 121-150 days | — | — | — | 12,428 | 0.97 | 135 | ||||||||||||||||||||||||||||||||||||||||||||||||||||||||||||||||||||||||||||||||||||||
| 151-180 days | — | — | — | 35,199 | 1.05 | 164 | ||||||||||||||||||||||||||||||||||||||||||||||||||||||||||||||||||||||||||||||||||||||
| Total | $ | 1,597,206 | 1.47 | % | 43 | $ | 1,197,973 | 0.88 | % | 45 | ||||||||||||||||||||||||||||||||||||||||||||||||||||||||||||||||||||||||||||||||||
| Total | $ | 729,543 | 5.58 | % | 17 | $ | 842,455 | 3.70 | % | 26 | ||||||||||||||||||||||||||||||||||||||||||||||||||||||||||||||||||||||||||||||||||