0001562528bsprt:CollateralizedLoanObligationsIssuedin2018FL4Memberbsprt:U.S.BankNationalAssociationMemberus-gaap:SecuredDebtMember2020-12-31
UNITED STATES
SECURITIES AND EXCHANGE COMMISSION
Washington, D.C. 20549
FORM 10-K
| | | | | |
| (Mark One) |
☒x | ANNUAL REPORT PURSUANT TO SECTION 13 OR 15(d) OF THE SECURITIES EXCHANGE ACT OF 1934 |
For the fiscal year ended December 31, 20212023
OR
| | | | | |
| ☐ | TRANSITION REPORT PURSUANT TO SECTION 13 OR 15(d) OF THE SECURITIES EXCHANGE ACT OF 1934 |
For the transition period from _________ to __________
Commission file number: 000-55188001-40923
FRANKLIN BSP REALTY TRUST, INC.
(Exact name of registrant as specified in its charter)
| | | | | | | | |
| Maryland | | 46-1406086 |
| (State or other jurisdiction of incorporation or organization) | | (I.R.S. Employer Identification No.) |
| 1345 Avenue of the Americas, Suite 32A, New York, NY | | 10105 |
| (Address of principal executive offices) | | (Zip Code) |
| (212) 588-6770 |
| (Registrant's telephone number, including area code) |
| | | | | | | | |
| Securities registered pursuant to section 12(b) of the Act |
| Title of each class | Trading Symbol(s) | Name of each exchange on which registered |
| Common Stock, par value $0.01 per share | FBRT | New York Stock Exchange |
| 7.50% Series E Cumulative Redeemable Preferred Stock, par value $0.01 per share | FBRT PRE | New York Stock Exchange |
Securities registered pursuant to section 12(g) of the Act: |
Series F Convertible Preferred Stock, par value $0.01 per share |
(Title of Class) |
Indicate by check mark if the registrant is a well-known seasoned issuer, as defined in Rule 405 of the Securities Act. Yes x No o
Indicate by check mark if the registrant is not required to file reports pursuant to Section 13 or Section 15(d) of the Act. Yes o No x
Indicate by check mark whether the registrant (1) has filed all reports required to be filed by Section 13 or 15(d) of the Securities Exchange Act of 1934 during the preceding 12 months (or for such shorter period that the registrant was required to file such reports), and (2) has been subject to such filing requirements for the past 90 days. x Yes ¨ No
Indicate by check mark whether the registrant submitted electronically every Interactive Data File required to be submitted pursuant to Rule 405 of Regulation S-T (§ 232.405 of this chapter) during the preceding 12 months (or for such shorter period that the registrant was required to submit such files). x Yes ¨ No
Indicate by check mark whether the registrant is a large accelerated filer, an accelerated filer, a non-accelerated filer, a smaller reporting company or emerging growth company. See the definitions of "large accelerated filer," "accelerated filer," "smaller reporting company", and "emerging growth company" in Rule 12b-2 of the Exchange Act.
| | | | | | | | | | | | | | |
| Large accelerated filer | ☐x | | Accelerated filer | ☐ |
| Non-accelerated filer | ☒☐ | | Smaller reporting company | ☐ |
| | | Emerging growth company | ☐ |
If an emerging growth company, indicatedindicate by check mark if the registrant has elected not to use the extended transition period for complying with any new or revised financial accounting standards provided pursuant to Section 13(a) of the Exchange Act. ¨
Indicate by check mark whether the registrant has filed a report on and attestation to its management's assessment of the effectiveness of its internal control over financial reporting under Section 404(b) of the Sarbanes-Oxley Act (15 U.S.C. 7262(b)) by the registered public accounting firm that prepared or issued its audit report. x
If securities are registered pursuant to Section 12(b) of the Act, indicate by check mark whether the financial statements of the registrant included in the filing reflect the correction of an error to previously issued financial statements. ☐
Indicate by check mark whether any of those error corrections are restatements that required a recovery analysis of incentive-based compensation received by any of the registrant’s executive officers during the relevant recovery period pursuant to §240.10D-1(b). ☐
Indicate by check mark whether the registrant is a shell company (as defined in Rule 12b-2 of the Exchange Act). ☐ Yes x No
AsThe aggregate market value of the voting and non-voting common equity (not including shares of common stock underlying outstanding shares of convertible preferred stock) held by non-affiliates as of June 30, 2021 there2023 was no established public market for the registrant's shares of common stock. The registrant’s common stock commenced trading on the facilities of the New York Stock Exchange on October 19, 2021. As of December 31, 2021, the market capitalization of the registrant's common stock(not including preferred stock that will automatically convert to common stock in 2022) was $656,850,964.$1,114.5 million. See Part II, Item 5, “Market for Registrant’s Common Equity, Related Stockholder Matters and Issuer Purchases of Equity Securities.”
The number of outstanding shares of the registrant's common stock on February 17, 20227, 2024 was 43,957,36382,122,502 shares.
DOCUMENTS INCORPORATED BY REFERENCE
None.Portions of the definitive proxy statement to be filed by Franklin BSP Realty Trust, Inc. with the Securities and Exchange Commission pursuant to Regulation 14A relating to the registrant’s Annual Meeting of Stockholders to be held on May 29, 2024 will be incorporated by reference in this Form 10-K in response to Items 10, 11, 12, 13 and 14 of Part III. The definitive proxy statement will be filed with the SEC not later than 120 days after the registrant’s fiscal year ended December 31, 2023.
FRANKLIN BSP REALTY TRUST, INC.
FORM 10-K
Year Ended December 31, 20212023
Forward-Looking Statements
Certain statements included in this Annual Report on Form 10-K are forward-looking statements. Those statements include statements regarding the intent, belief or current expectations of Franklin BSP Realty Trust, Inc. ("we," "our," "us," or the "Company") and members of our management team, as well as the assumptions on which such statements are based, and generally are identified by the use of words such as "may," "will," "seeks," "anticipates," "believes," "estimates," "expects," "plans," "intends," "should" or similar expressions. Actual results may differ materially from those contemplated by such forward-looking statements. Further, forward-looking statements speak only as of the date they are made, and we undertake no obligation to update or revise forward-looking statements to reflect changed assumptions, the occurrence of unanticipated events or changes to future operating results over time, unless required by law.Currently, one of the most significant factors that could cause actual outcomes to differ materially from our forward-looking statements is the continuing adverse effect of the current pandemic of the novel coronavirus, or COVID-19, on the financial condition, operating results and cash flows of the Company, its borrowers, the real estate market, the global economy and the financial markets. The extent to which the COVID-19 pandemic continues to impact us and our borrowers will depend on future developments, which are highly uncertain and cannot be predicted with confidence, including the scope, severity and duration of the pandemic, including resurgences of the virus and its variants, including the Delta and Omicron variants, the speed, effectiveness and adoption of vaccine (including boosters) and treatment developments and the direct and indirect economic effects of the pandemic and containment measures, among others.
Our forward-looking statements are subject to various risks and uncertainties. Accordingly, there are or will be important factors that could cause actual outcomes or results to differ materially from those indicated in these statements, and thus our investors should not place undue reliance on these statements. We believe these factors include but are not limited to those described under the section entitled “Risk Factors” in this Annual Report, as such factors may be updated from time to time in our periodic filings with the Securities and Exchange Commission (the “SEC”), which are accessible on the SEC’s website at http://www.sec.gov. These factors include:
•changes in our business and investment strategy;
•our ability to make investments in a timely manner or on acceptable terms;
•the impact of the COVID-19 pandemic;
•currentchanges in credit market conditions and our ability to obtain long-term financing for our investments in a timely manner and on terms that are consistent with what we project when we invest;
•the effect of general market, real estate market, economic and political conditions;conditions, including changing interest rate environments (and sustained high interest rates) and inflation;
•our ability to make scheduled payments on our debt obligations;
•our ability to generate sufficient cash flows to make distributions to our stockholders;
•our ability to generate sufficient debt and equity capital to fund additional investments;
•our ability to refinance our existing financing arrangements;
•our ability to successfully and in a timely matter reinvest the dividend, interest,recover unpaid principal and sales proceeds from the assets acquired in the merger with Capstead Mortgage Corporation in a manner consistent with our investment strategies;
•adverse changes in the value of the assets acquired in the merger with Capstead Mortgage Corporation prior to the time such assets are monetized and reinvested in in a manner consistent with our investment strategies;on defaulted loans;
•the degree and nature of our competition;
•the availability of qualified personnel;
•we may be deemedour ability to be an investment company under recover or mitigate estimated losses on non-performing assets;
•the Investment Company Actimpact of 1940, as amended (the "Investment Company Act"), and thus subject to regulation under the Investment Company Act; andnational health crises;
•our ability to maintain our qualification as a real estate investment trust ("REIT").
All forward-looking statements should be read in light of the risks identified in Part I, Item 1A of this Annual Report on Form 10-K.
Risk Factor Summary
We are providing the following summary of the risk factors contained in this Annual Report on Form 10-K to enhance the readability and accessibility of our risk factor disclosures. We encourage our stockholders to carefully review the full risk factors contained in this Annual Report on Form 10-K in their entirety.
Risks Related to an Investment in Franklin BSP Realty Trust, Inc.
•The COVID-19 pandemic continues to adversely impact our business and the business of many of our borrowers.
•Because we have a large number of stockholders subject to lock-up restrictions which expire in April 2022, there may be significant pent-up demand to sell shares of our common stock once applicable lock-up restrictions expire.
•Our business could suffer in the event our Advisor or any other party that provides us with services essential to our operations experiences system failures or cyber-incidents or a deficiency in cybersecurity.
Risks Related to Conflicts of Interest
•The Advisor faces conflicts of interest relating to purchasing commercial real estate-related investments, and such conflicts may not be resolved in our favor.
•The Advisor and its employees face competing demands relating to their time, and this may cause our operating results to suffer.
Risks Related to Our Corporate Structure
•The limit on the number of shares a person may own may discourage a takeover.
•Certain provisions of Maryland law could inhibit a change in control of our Company.
Risks Related to Our Financing Strategy
•The Company uses leverageWe have a significant amount of indebtedness and may need to incur more in connection withthe future.
•We may not be able to earn returns on loans we make in excess of the interest we pay on our investments, which increasesborrowings.
•We rely on the riskavailability of loss associated withcollateralized debt and loan obligation securitization markets to provide long-term financing for our loans and investments.
•Lenders mayoften require us to enter into restrictive covenants relating to our operations, which could limit our ability to make distributions.
•In a periodDuring periods of rising interest rates, our interest expense could increase while theincreases may outpace any increases in interest we earn on our fixed-rate assets, would not change, which would adversely affectand the value of our profitability.assets may decrease.
•We may not be able to access financing sources on attractive terms, if at all, which could dilute our existing stockholders and adversely affect our ability to fund and grow our business.business, or result in dilution to our existing stockholders.
•We useOur short-term borrowings to finance our investments whichoften require us to provide additional collateral inwhen the event the lender determines there is a decrease in the fair market value of our collateral decreases, and these calls for collateral could significantly impact our liquidity position.
Risks Related to ourOur Investments
•Our commercial real estate debt investments are subject to the risks typically associated with ownership of commercial real estate.
•Our success depends on the availability of attractive investment opportunities and the Advisor’s ability to identify, structure, consummate, leverage, manage and realize returns on our investments.
•There can be no assurances that the U.S. or global financial systems will remain stable.
•We may have difficulty in redeploying the proceeds from repayments of our existing loans and other investments.opportunities.
•Delays in liquidating defaulted commercial real estate debt investments could reduce our investment returns.
•Operating and disposing of properties acquired through foreclosure subject us to additional risks that could harm our results of operations.
•Subordinate commercial real estate debt that we originate or acquire exposescould expose us to greater losses.
•We may be subject to risks associated with construction lending, such as declining real estate values, cost overruns and delays in completion.
•Investments in non-conformingJurisdictions with one action or non-investment grade rated loanssecurity first rules or securities involve greater risk of loss.anti-deficiency legislation may limit the ability to foreclose on the property or to realize the obligation secured by the property by obtaining a deficiency judgment.
•Insurance may not cover all potential losses on the properties underlying our investments.investments, which may harm the value of our assets.
•We invest in CMBS and CRE CLO Bonds, which may include subordinate securities, which entails certain risks.
•TheWe may not control the special servicing of the mortgage loans underlying the CMBS and CRE CLO Bonds in which we invest and, in such cases, the special servicer may invest are subject to the risks of the mortgage securities market as a whole and risks of the securitization process.take actions that could adversely affect our interests.
•We invest in collateralized debt obligations ("CDOs") and such investments involve significant risks.
•Adjustable-rate commercial real estate loans may entail greater risks of default to us than fixed-rate commercial real estate loans.
•Changes in interest rates could negatively affect the value of our investments, which could result in reduced income or losses and negatively affect the cash available for distribution.
•Hedging against interest rate exposure may adversely affect our income, limit our gains or result in losses, which could adversely affect cash available for distribution to our stockholders.
•Most of our investments are illiquid and we may not be able to vary our portfolio in response to changes in economic and other conditions, which may result in losses to us.
•WhileSome of our investments will be carried at estimated fair value as determined by us and, as a result, there may be uncertainty as to the value of these investments.
•Competition with third parties for originating and acquiring investments may reduce our profitability.
•Our due diligence may not reveal all material issues relating to our origination or acquisition of a particular investment.
•We may be unable to restructure loans in a manner that we attemptbelieve maximizes value, particularly if we are one of multiple creditors in large capital structures.
•We may be subject to risks associated with future advance obligations, such as declining real estate values and operating performance.
•We may not be successful in our attempts to align the maturities of our liabilities with the maturities on our assets, we may not be successful in that regard which could harm our operating results and financial condition.
•Provision for credit losses is difficult to estimate.
•Any credit ratings assigned to our investments will be subject to ongoing evaluations and revisions and we cannot assure you that those ratings will not be downgraded.
•Changes to, or the elimination of, LIBOR may adversely affect our interest income, interest expense, or both.
Risks Related to the Conduit Segment of the Business
•We use warehouse facilities that may limit our ability to acquire assets, and we may incur losses if the collateral is liquidated.
•We directly or indirectly utilize non‑recourse securitizations, and such structures expose us to risks that could result in losses to us.
•The securitization market is subject to a regulatory environment that may affect certain aspects of these activities.
Risks Related to our merger with Capstead Mortgage Corporation
•We may not be ableenter into hedging transactions that could expose us to realizecontingent liabilities in the anticipated benefits of the merger on the anticipated timeframe or at all.future.
•Changes inHedging against interest rates, whether increases or decreases,rate exposure may adversely affect yields on the securities acquiredour income, limit our gains or result in the merger.losses, which could adversely affect cash available for distributions to our stockholders.
Risks Related to Conflicts of Interest
•The Advisor faces conflicts of interest relating to purchasing commercial real estate-related investments, and such conflicts may not be resolved in our favor, which could adversely affect our investment opportunities.
•An increaseThe Advisor and its employees face competing demands relating to their time, and this may cause our operating results to suffer.
•The fee structure set forth in prepaymentsthe Advisory Agreement may adversely affectnot create proper incentives for the fair value of the Capstead portfolio.Advisor.
•PeriodsOur Advisor manages our portfolio pursuant to broad investment guidelines and is not required to seek the approval of illiquidityour board of directors for each investment, financing, asset allocation or hedging decision made by it, which may result in the mortgage markets may reduce amounts availableour making riskier loans and other investments and which could materially and adversely affect us.
•Our Advisor maintains a contractual as opposed to a fiduciary relationship with us. Our Advisor’s liability is limited under secured borrowing arrangements dueour Advisor Agreement, and we have agreed to declines in the perceived valueindemnify our Advisor against certain liabilities.
•Termination of related collateralour Advisory Agreement would be difficult and may reducecostly.
Risks Related to Our Corporate Structure
•The limit on the number of counterparties willingshares a person may own may discourage a takeover that could otherwise result in a premium price to lend to us and/or the amounts individual counterparties are willing to lend.our stockholders.
•We incurred direct and indirect costs asCertain provisions of Maryland law could inhibit a resultchange in control of the merger with Capstead.
•We have a significant amount of indebtedness and may need to incur more in the future.our Company.
Risks Related to Taxation
•Our failure to qualify as a REIT could have significant adverse consequences to us and the value of our common stock.
•The failure of a mezzanine loan to qualify as a real estate asset could adversely affect our ability to qualify as a REIT.
•Even if we qualify as a REIT, we may be subject to tax liabilities that reduce our cash flow for distribution to our stockholders.
•The failure of assets subject to repurchase agreements to qualify as real estate assets could adversely affect our ability to qualify as a REIT.
•The “taxable mortgage pool” rules may increase the taxes that we or our stockholders incur, and may limit the manner in which we effect future securitizations.
•The prohibited transactions tax may limit our ability to engage in transactions, including certain methods of securitizing mortgage loans that would be treated as sales for U.S. federal income tax purposes.
•Complying with REIT requirements may limit our ability to hedge effectively and may cause us to incur tax liabilities.
•Liquidation of assets may jeopardize our REIT qualification.
•Modification of the terms of our debt investments and mortgage loans underlying our CMBS in conjunction with reductions in the value of the real property securing such loans could cause us to fail to qualify as a REIT.
Risks Related to an Investment in Franklin BSP Realty Trust, Inc.
•Public health crises have, and may in the future, adversely impact our business and the business of many of our borrowers.
•We may be unable to maintain or increase cash distributions over time, or may decide to reduce the amount of distributions for business reasons.
•Our business could suffer in the event our Advisor or any other party that provides us with services essential to our operations experiences system failures or cyber-incidents or a deficiency in cybersecurity.
•We are subject to risks from natural disasters such as earthquakes and severe weather, including as the result of global climate changes, which may result in damage to the properties securing our loans.
PART I
Item 1. Business
Franklin BSP Realty Trust, Inc. (the “Company”), formerly known as Benefit Street Partners Realty Trust, Inc., is a real estate finance company that primarily originates, acquires and manages a diversified portfolio of commercial real estate debt investments secured by properties located within and outside the United States. The Company isWe are a Maryland corporation and hashave made tax elections to be treated as a real estate investment trust (a "REIT") for U.S. federal income tax purposes since 2013. We believe that we have qualified as a REIT and we intend to continue to meet the requirements for qualification and taxation as a REIT. Substantially all of our business is conducted through Benefit Street Partners Realty Operating Partnership, L.P. (the “OP”), a Delaware limited partnership. We are the sole general partner and directly or indirectly hold all of the units of limited partner interests in the OP. In addition, the Company, through oneOne or more of our wholly-owned subsidiaries which are each treated as a taxable REIT subsidiary (asubsidiaries (each a “TRS”), is indirectlyand are subject to U.S. federal, state and local income taxes.
The Company has no employees. Benefit Street Partners L.L.C. serves as our advisor ("Advisor") pursuant to an advisory agreement, as amended on August 18, 2021 (the "Advisory Agreement"). The Advisor, an investment adviser registered with the SEC, is a credit-focused alternative asset management firm.
Establishedfirm that was established in 2008, our2008. Our Advisor's credit platform manages funds for institutions and high-net-worth investors across various credit funds and complementary strategies including high yield, levered loans, private/opportunistic debt, liquid credit, structured credit and commercial real estate debt. These strategies complement each other as they all leverage the sourcing, analytical, compliance, and operational capabilities that encompass the platform. The Advisor manages the Company's affairs on a day-to-day basis. The Advisor receives compensation fees and reimbursements for services related to the investment and management of the Company's assets and the operations of the Company. The advisor is a wholly-owned subsidiary of Franklin Resources, Inc., which together with its various subsidiaries operates as "Franklin Templeton”.
The Company primarily invests in commercial real estate debt investments, which may include first mortgage loans, subordinated mortgage loans, mezzanine loans and participations in such loans. The Company also originates conduit loans which the Company intends to sell through its TRS into commercial mortgage-backed securities ("CMBS") securitization transactions.
The Company also invests in Historically this business has focused primarily on CMBS, commercial real estate securities. Real estate securities may include CMBS, senior unsecured debt of publicly traded REITs, debt or equity securities of other publicly traded real estate companies andcollateralized loan obligation bonds ("CRE CLO bonds"), collateralized debt obligations ("CDOs"). The Company also owns real estate acquired by and other securities. As a result of the Company through foreclosure and deed in lieuOctober 2021 acquisition of foreclosure, and purchased for investment, typically subject to triple net leases.
On October 19, 2021, the Company completed a merger with Capstead Mortgage Corporation (“Capstead”("Capstead") pursuant to which Capstead merged into a wholly-owned subsidiary of, the Company and the Company’s common stock commenced trading on the New York Stock Exchange ("NYSE"acquired a portfolio of residential mortgage backed securities (“RMBS”) under the ticker “FBRT”. The Capstead assets acquired in the merger consist primarilyform of cash and residential adjustable-rate mortgage pass-through securities ("ARM Agency Securities" or "ARMs") issued and guaranteed by government-sponsored enterprises or by an agency of the federal government. TheAs of December 31, 2023, the Company intendshas fully disposed of all of its ARM Agency Securities and is continuing to reinvest the cash and proceeds from dividends, interest, repayments and salesthe sale of these securities in its other businesses. The Company also owns real estate that was either acquired by the assets acquiredCompany through foreclosure or deed in the merger into its ownlieu of foreclosure, or that was purchased for investment, strategies.typically subject to triple net leases.
Investment Objectives
We plan to implement policies and strategiesOur objective is to provide our common shareholders attractive, risk-adjusted returns through a stable divideddividend and capital growth.
Investment Strategies and Policies
We have four investment strategies. OneOur first and primary strategy is to originate, acquire and manage a diversified portfolio of commercial real estate debt, including first mortgage loans, subordinate loans, mezzanine loans and participations in such loans. We expect that our portfolio of debt investments will be secured by real estate located within and outside the United States and diversified by property type and geographic location. TheOur second strategy is to invest in commercial real estate securities, such as CMBS, CRE CLO Bonds, senior unsecured debt of publicly-traded REITs and CDO notes. TheOur third strategy is to originate conduit loans and sell them through our TRS business into CMBS securitization transactions. TheOur fourth strategy representsis to maximize cash flows from real estate acquired by the Company through foreclosure and deed in lieu of foreclosure, and purchases of real estate that generally are, or will be, subject to a triple net lease.
As noted above, we also acquired a significant portfolio of residential adjustable-rate mortgage pass-through securities issued and guaranteed by government-sponsored enterprises or by an agency of the federal government in our merger with Capstead.We intend to reinvest the cash and proceeds from dividends, interest, repayments and sales of these assets into our four investment strategies.
Commercial Real Estate Debt
We originate, fund, acquire and structure commercial real estate debt, including first mortgage loans, mezzanine loans, bridge loans, and other loans related to commercial real estate. We may also acquire some equity participations in the underlying collateral of commercial real estate debt. We structure, underwrite, and originate most of our investments. We use conservative underwriting criteria to focus on risk adjusted returns based on several factors, which may include the leverage point, debt service coverage and sensitivity, lease sustainability studies, market and economic conditions, quality of the underlying collateral and location, reputation and track record of the borrower, and a clear exit or refinancing plan for the borrower. Our underwriting process involves comprehensive financial, structural, operational, and legal due diligence to assess any risks in connection with making such investments so that we can optimize pricing and structuring. By originating loans directly, we are able to structure and underwrite loans that satisfy our standards, establish a direct relationship with the borrower, and utilize our own documentation. Described below are some of the types of loans we may originate or acquire. In addition, although we generally prefer the benefits of new origination, market conditions can create situations where holders of commercial real estate debt may be in distress and are therefore willing to sell at prices that compensate the buyer for the lack of control typically associated with directly structured investments.
First Mortgage Loans
We primarily focus on first mortgage loans. First mortgage loans generally finance the acquisition, refinancing or rehabilitation of commercial real estate. First mortgage loans may be either short (one-to-five years) or long (up to ten years) term, may be fixed or floating rate, and are predominantly current-pay loans. We may originate or acquire current-pay first mortgage loans backed by properties that fit our investment strategy. We may selectively syndicate portions of these loans, including senior or junior participations that will effectively provide permanent financing or optimize returns which may include retained origination fees.
First mortgage loans typically provide for a higher recovery rate and lower defaults than other debt positions due to the lender's favorable control position, which at times can include control of the entire capital structure. Because of these attributes, this type of investment typically receives favorable treatment from third-party rating agencies and financing sources, which should increase the liquidity of these investments. However, these loans typically generate lower returns than subordinate debt, such as subordinate loans and mezzanine loans, commonly referred to as B-notes.
B-notes
B-notes consist of subordinate mortgage loans, including structurally subordinated first mortgage loans and junior participations in first mortgage loans or participations in these types of assets. Like first mortgage loans, these loans generally finance the acquisition, refinancing, rehabilitation or construction of commercial real estate. Subordinated mortgage loans or B-notes may be either short (one-to-five years) or long (up to ten years) term, may be fixed or floating rate, and are predominantly current-pay loans. We may originate or acquire current-pay subordinated mortgage loans or B-notes backed by high quality properties that fit our investment strategy. We may create subordinated mortgage loans by tranching our directly originated first mortgage loans generally through syndications of senior first mortgages or buy such assets directly from third party originators. Due to the limited opportunities in this part of the capital structure, we believe there are certain situations that allow us to directly originate or to buy subordinated mortgage investments from third parties on favorable terms.
Bridge Loans
We may offer bridge financing products to borrowers who are typically seeking short-term capital to be used in an acquisition, development or refinancing of a given property. From the borrower’s perspective, shorter term bridge financing is advantageous because it allows time to improve the property value through repositioning without encumbering it with restrictive long-term debt. The terms of these loans generally do not exceed three years.
Mezzanine Loans
Mezzanine loans are secured by one or more direct or indirect ownership interests in an entity that directly or indirectly owns commercial real estate and generally finance the acquisition, refinancing, rehabilitation or construction of commercial real estate. Mezzanine loans may be either short (one-to-five years) or long (up to ten years) term and may be fixed or floating rate. We may originate or acquire mezzanine loans backed by properties that fit our investment strategy. We may own such mezzanine loans directly or we may hold a participation in a mezzanine loan or a sub-participation in a mezzanine loan. These loans are predominantly current-pay loans (although there may be a portion of the interest that accrues) and may provide for participation in the value or cash flow appreciation of the underlying property as described below. With the credit market disruption and resulting dearth of capital available in this part of the capital structure, we believe that the opportunities to both directly originate and to buy mezzanine loans from third parties on favorable terms will continue to be attractive.
Equity Participations or “Kickers”
We may pursue equity participation opportunities in connection with our commercial real estate debt originations if we believe that the risk-reward characteristics of the loan merit additional upside participation related to the potential appreciation in value of the underlying assets securing the loan. Equity participations can be paid in the form of additional interest, exit fees, percentage of sharing in refinance or resale proceeds or warrants in the borrower. Equity participation can also take the form of a conversion feature, sometimes referred to as a "kicker," which permits the lender to convert a loan or preferred equity investment into common equity in the borrower at a negotiated premium to the current net asset value of the borrower. We expect to generate additional revenues from these equity participations as a result of excess cash flows being distributed or as appreciated properties are sold or refinanced.
Commercial Real Estate Securities
In addition to our focus on origination of and investments in commercial real estate debt, we may also acquire commercial real estate securities, such as CMBS, RMBS, unsecured REIT debt,CRE CLO Bonds, CDO notes, and equity investments in entities that own commercial real estate.
CMBS & CRE CLO Bonds
CMBS and CRE CLO Bonds are securities that are collateralized by, or evidence ownership interests in, a single commercial mortgage loan or a partial or entire pool of mortgage loans secured by commercial properties. CMBS and CRE CLO Bonds are generally pass-through certificates that represent beneficial ownership interests in common law trusts whose assets consist of defined portfolios of one or more commercial mortgage loans. They are typically issued in multiple tranches whereby the more senior classes are entitled to priority distributions of specified principal and interest payments from the trust’s underlying assets. The senior classes are often securities which, if rated, would have ratings ranging from low investment grade “BBB-” to higher investment grades “A,” “AA” or “AAA.” The junior, subordinated classes typically would include one or more non-investment grade classes which, if rated, would have ratings below investment grade “BBB.” Losses and other shortfalls from expected amounts to be received on the mortgage pool are borne first by the most subordinate classes, which receive payments only after the more senior classes have received all principal and/or interest to which they are entitled. We may invest in senior or subordinated, investment grade or non-investment grade CMBS and CRE CLO Bonds, as well as unrated CMBS.CMBS and CRE CLO Bonds.
Unsecured Publicly-Traded REIT Debt Securities
We may also choose to acquire senior unsecured debt of publicly-traded equity REITs that acquire and hold real estate. Publicly-traded REITs may own large, diversified pools of commercial real estate properties or they may focus on a specific type of property, such as shopping centers, office buildings, multifamily properties and industrial warehouses. Publicly-traded REITs typically employ moderate leverage. Corporate bonds issued by these types of REITs are usually rated investment grade and benefit from strong covenant protection.
CDO Notes
CDOs are multiple class debt notes, secured by pools of assets, such as CMBS and mezzanine loans, and unsecured REIT debt.loans. Like typical securitization structures, in a CDO, the assets are pledged to a trustee for the benefit of the holders of the bonds. CDOs often have reinvestment periods that typically last for five years, during which time, proceeds from the sale of a collateral asset may be invested in substitute collateral. Upon termination of the reinvestment period, the static pool functions very similarly to a CMBS securitization where repayment of principal allows for redemption of bonds sequentially.
Commercial Real Estate Equity Investments
We may acquire: (i) equity interests (including preferred equity) in an entity (including, without limitation, a partnership or a limited liability company) that is an owner of commercial real property (or in an entity operating or controlling commercial real property, directly or through affiliates), which may be structured to receive a priority return or is senior to the owner's equity (in the case of preferred equity); (ii) certain strategic joint venture opportunities where the risk-return and potential upside through sharing in asset or platform appreciation is compelling; and (iii) private issuances of equity securities (including preferred equity securities) of public companies. Our commercial real estate equity investments may or may not have a scheduled maturity and are expected to be of longer duration (five-to-ten year terms) than our typical portfolio investment. Such investments are expected to be fixed rate (if they have a stated investment rate) and may have accrual structures and provide other distributions or equity participations in overall returns above negotiated levels.
Conduit Loans
The Company originates conduit loans which the Company intends to sell through its TRS into CMBS securitization transactions at a profit. The Conduit loans are typically fixed-rate commercial real estate loans and are long (up to ten years) term, and are predominantly current-pay loans.
Ownership of Properties and Other Possible Investments
Although we expect that most of our investments will be of the types described above, we may make other investments. For example, we own and expect in the future to own real estate acquired by the Company through foreclosure and deed in lieu of foreclosure, or from purchases of real estate that generally are, or will be, subject to a triple net lease.We may also invest in whatever other types of interests in real estate-related assets that we believe are in our best interest which may include the commercial real property underlying our debt investments as a result of a loan workout, foreclosure or similar circumstances.
Investment Process
Our Advisor has the authority to make all the decisions regarding our investments consistent with the investment guidelines and borrowing policies approved by our board of directors and subject to the direction and oversight of our board of directors. With respect to investments in commercial real estate debt, our board of directors has adopted investment guidelines that our Advisor must follow when acquiring such assets on our behalf without the approval of our board of directors.. We will not however, purchase assets in which our Advisor, any of our directors or any of their affiliates has an interest without a determination by a majority of our directors (including a majority of the independent directors) not otherwise interested in the transaction that such transaction is fair and reasonable to us and at a price to us no greater than the cost of the asset to the affiliated seller, unless there is substantial justification for the excess amount and such excess is reasonable. Our investment guidelines and borrowing policies may be altered by a majority of our directors without approval of our stockholders. Our Advisor may not alter our investment guidelines or borrowing policies without the approval of a majority of our directors, including a majority of our independent directors.
Borrowing Strategies and Policies
Our financing strategy primarily includes the use of secured repurchase agreement facilities for loans, securities and securitizations. We have also raised capital through private placements of our equity securities. In addition to our current mix of financing sources, we may also access additional forms of financings, including credit facilities, and public or private secured and unsecured debt issuances by us or our subsidiaries.
We expect to use additional debt financing as a source of capital. We intend to employ reasonable levels of borrowing in order to provide more cash available for investment and to generate improved returns. We believe that careful use of leverage will help us to achieve our diversification goals and potentially enhance the returns on our investments. Our board of directors reviewsoversees our aggregate borrowings at least quarterly.borrowing levels.
Income Taxes
We elected to be taxed as a REIT under Sections 856 through 860 of the Internal Revenue Code of 1986, as amended (the "Internal Revenue Code") commencing with the taxable year ended December 31, 2013. In general, as a REIT, if we meet certain organizational and operational requirements and distribute at least 90% of our "REIT taxable income" (determined before the deduction of dividends paid and excluding net capital gains) to our stockholders in a year, we will not be subject to U.S. federal income tax to the extent of the income that we distribute. We believe that we currently qualify and we intend to continue to qualify as a REIT under the Internal Revenue Code. If we fail to qualify as a REIT in any taxable year and statutory relief provisions were not to apply, we will be subject to U.S. federal income tax on our income at regular corporate tax rates for the year in which we do not qualify and the succeeding four years. Even if we qualify for taxation as a REIT, we may be subject to certain U.S. federal, state and local taxes on our income and property and U.S. federal income and excise taxes on our undistributed income.
We pay income taxes on our Conduit segment, which is conducted by our wholly-owned TRS entities. The income taxes on the Conduit segment are paid at the U.S. federal and applicable state levels.
Competition
Our net income depends, in large part, on our ability to originate investments that provide returns in excess of our borrowing cost. In originating these investments, we compete with other mortgage REITs, specialty finance companies, savings and loan associations, banks, mortgage bankers, insurance companies, mutual funds, institutional investors, investment banking firms, private funds, other lenders, governmental bodies, and other entities, many of which have greater financial resources and lower costs of capital available to them than we have. In addition, there are numerous mortgage REITs with asset acquisition objectives similar to ours, and others may be organized in the future, which may increase competition for the investments suitable for us. Competitive variables include market presence and visibility, size of loans offered and underwriting standards. To the extent that a competitor is willing to risk larger amounts of capital in a particular transaction or to employ more liberal underwriting standards when evaluating potential loans than we are, our investment volume and profit margins for our investment portfolio could be impacted. Our competitors may also be willing to accept lower returns on their investments and may succeed in buying or underwriting the assets that we have targeted. Although we believe that we are well positioned to compete effectively in each facet of our business, there is enormous competition in our market sector and there can be no assurance that we will compete effectively or that we will not encounter increased competition in the future that could limit our ability to conduct our business effectively.
Human Capital Resources
As of December 31, 2021,2023, we had no employees. Our executive officers serve as officers of our Advisor and are employed by an affiliate of our Advisor. The employees of the Advisor and other affiliates of the Advisor perform a full range of real estate services for us, including origination, acquisitions, accounting, legal, asset management, wholesale brokerage, and investor relations services. We are dependent on these affiliates for services that are essential to us, including asset acquisition decisions, and other general administrative responsibilities. In the event that any of these companies were unable to provide these services to us, we would be required to provide such services ourselves or obtain such services from other sources.
Government Regulation
Our operations are subject, in certain instances, to supervision and regulation by U.S. and other governmental authorities, and may be subject to various laws and judicial and administrative decisions imposing various requirements and restrictions, which, among other things: (i) regulate credit-granting activities; (ii) establish maximum interest rates, finance charges and other charges; (iii) require disclosures to customers; (iv) govern secured transactions; and (v) set collection, foreclosure, repossession and claims-handling procedures and other trade practices. We intend to conduct our business so that neither we nor any of our subsidiaries are required to register as an investment company under the Investment Company Act.
In our judgment, existing statutes and regulations have not had a material adverse effect on our business. In recent years, legislators in the United States and in other countries have said that greater regulation of financial services firms is needed, particularly in areas such as risk management, leverage, and disclosure. While we expect that additional new regulations in these areas will be adopted and existing ones may change in the future, it is not possible at this time to forecast the exact nature of any future legislation, regulations, judicial decisions, orders or interpretations, nor their impact upon our future business, financial condition, or results of operations or prospects.
Available Information
We electronically file annual reports on Form 10-K, quarterly reports on Form 10-Q, current reports on Form 8-K, and all amendments to those reports, and proxy statements, with the SEC. We also filed with the SEC a registration statement in connection with our dividend reinvestment plan ("DRIP") securities offerings. The SEC maintains an internet address at www.sec.gov that contains reports, proxy statements and information statements, and other information, which may be obtained free of charge. In addition, copies of our filings with the SEC may be obtained from the website maintained for us at www.fbrtreit.com. Access to these filings is free of charge. We are not incorporating our website or any information from the website into this Form 10-K.
Item 1A. Risk Factors
Risks Related to an Investment in Franklin BSP Realty Trust, Inc.
The COVID-19 pandemic continues to adversely impact our business and the business of many of our borrowers.
The COVID-19 pandemic has had, and another pandemic or public health crisis in the future could have, repercussions across domestic and global economies and financial markets. The COVID-19 pandemic resulted in many governmental authorities, including state and local governments in regions in which our borrowers own properties, reacting by instituting government restrictions, border closings, quarantines, “shelter-in-place” orders and “social distancing” guidelines which forced many of our borrowers to suspend or significantly restrict their business activities. The recent resurgences driven by variants, such as Delta and Omicron, have resulted in some of these restrictions, which had been lifted, being reimposed. The economic consequences of the pandemic and government and individual responses to it resulted challenging operating conditions for many businesses, particularly in the retail (including restaurants) and hospitality sectors.
The COVID-19 pandemic has adversely affected our business in a number of respects, including:
•at the onset of the pandemic in March and April of 2020, the financial markets for the assets we then held in our real estate securities portfolio were significantly disrupted, resulting in significant decreases in market values for these assets and significant market volatility. This resulted in margin calls from our lenders, which we satisfied, but similar disruptions in the future could result in additional margin calls, including with respect to the assets we acquired in the Capstead merger, which, if not satisfied, could result in the liquidation of some of our assets at significant losses.
•declines in the value of commercial real estate generally, and significant declines in certain assets classes, including office, hospitality and retail, which negatively impacted the value of our commercial mortgage loan portfolio, and could continue to negatively impact the value in the future, potentially materially.
•adverse impacts on the financial stability of many of our borrowers, which has and will continue to increase the prospects of borrower delinquencies,defaults, or requests for loan modifications.
•periodic increases in the cost and decreases in the availability of debt capital, including as a result of dislocations in the commercial mortgage-backed securities market, and as a result of lenders permitting significantly lower advance rates on our repurchase agreements.
•increases in the risk that we may not meet certain interest coverage tests, over-collateralization coverage tests or other tests related to our securitized debt that could result in a change in the priority of distributions, which could result in the reduction or elimination of distributions to the subordinate debt and equity tranches we own until the tests have been met or certain senior classes of securities have been paid in full. Accordingly, we may experience a reduction in our cash flow from those interests which may adversely affect our liquidity and therefore our ability to fund our operations or address maturing liabilities on a timely basis.
•periodic declines in business activity which if continued will result in a decline in demand for mortgage financing, which could adversely affect our ability to make new investments or to redeploy the proceeds from repayments of our existing investments.
The extent to which the COVID-19 pandemic impacts our or our borrowers’ operations will depend on future developments which are highly uncertain and cannot be predicted with confidence, including the scope, severity and duration of the pandemic, including any resurgences due to variants, such as the Delta and Omicron variants, the effectiveness of vaccines against variants such as the Delta and Omicron variants, the speed of vaccine (including booster) distribution, treatment developments and the direct and indirect economic effects of the pandemic and containment measures. The inability of our borrowers to meet their loan obligations and/or borrowers filing for bankruptcy protection would reduce our cash flows, which would impact our ability to pay dividends to our stockholders. The rapid development and fluidity of this situation precludes any prediction as to the full adverse impact of the COVID-19 pandemic. Moreover, many risk factors set forth in this Annual Report on Form 10-K should be interpreted as heightened risks as a result of the impact of the COVID-19 pandemic.
We may be unable to maintain or increase cash distributions over time, or may decide to reduce the amount of distributions for business reasons.
There are many factors that can affect the amount and timing of cash distributions to stockholders. The amount of cash available for distributions is affected by many factors, such as the cash provided by the Company's investments and obligations to repay indebtedness as well as many other variables. There is no assurance that the Company will be able to pay or maintain the current level of distributions or that distributions will increase over time. In certain prior periods, distributions have been in excess of cash flows from operations. Distributions in excess of earnings will decrease the book value per share of common stock. The Company cannot give any assurance that returns from the investments will be sufficient to maintain or increase cash available for distributions to stockholders. Actual results may differ significantly from the assumptions used by the board of directors in establishing the distribution rate to stockholders. The Company may not have sufficient cash from operations to make a distribution required to qualify for or maintain our REIT status, which may materially adversely affect the value of our securities.
Because we have a large number of stockholders subject to lock-up restrictions which expire six months after the effective time of the merger, there may be significant pent-up demand to sell shares of our common stock once applicable lock-up restrictions expire. Significant sales of shares of our common stock, or the perception that significant sales of such shares could occur, may adversely impact the price of shares of our common stock.
Pursuant to certain lock-up agreements and the restructuring of our equity prior to the effective time of the merger with Capstead, approximately 94% of the shares of our common stock (including shares of common stock underlying preferred shares that will automatically convert to common stock) which were outstanding prior to the effective time of the merger are prohibited from being publicly traded for six months following the merger (i.e., until April 19, 2022). Prior to its listing in connection with the closing of the merger on October 19, 2021, our common stock had never been listed on any national securities exchange and the ability of stockholders to liquidate their investments was limited. As a result, there may be significant pent-up demand to sell shares of our common stock once the lock-up restrictions referenced above expire. A large volume of sales of shares of our common stock could decrease the prevailing market price of shares of our common stock and could impair our ability to raise additional capital through the sale of equity securities in the future. Even if actual sales volumes are not elevated, the mere perception of the possibility of these sales could depress the market price of shares of our common stock and have a negative effect on our ability to raise capital in the future.
Our business could suffer in the event our Advisor or any other party that provides us with services essential to our operations experiences system failures or cyber-incidents or a deficiency in cybersecurity.
Despite system redundancy, the implementation of security measures and the existence of a disaster recovery plan for the internal information technology systems of our Advisor and other parties that provide us with services essential to our operations, these systems are vulnerable to damage from any number of sources, including computer viruses, unauthorized access, energy blackouts, natural disasters, terrorism, war and telecommunication failures. Any system failure or accident that causes interruptions in our operations could result in a material disruption to our business.
A cyber-incident is considered to be any adverse event that threatens the confidentiality, integrity or availability of information resources. More specifically, a cyber-incident is an intentional attack or an unintentional event that can result in third parties gaining unauthorized access to systems to disrupt operations, corrupt data or steal confidential information. As reliance on technology in our industry has increased, so have the risks posed to the systems of our Advisor and other parties that provide us with services essential to our operations, both internal and outsourced. In addition, the risk of a cyber-incident, including by computer hackers, foreign governments and cyber terrorists, has generally increased as the number, intensity and sophistication of attempted attacks and intrusions from around the world have increased. Even the most well protected information, networks, systems and facilities remain potentially vulnerable because the techniques used in such attempted attacks and intrusions evolve and generally are not recognized until launched against a target, and in some cases are designed not to be detected and, in fact, may not be detected.
The remediation costs and lost revenues experienced by a victim of a cyber-incident may be significant and significant resources may be required to repair system damage, protect against the threat of future security breaches or to alleviate problems, including reputational harm, loss of revenues and litigation, caused by any breaches.
Although the Advisor and other parties that provide us with services essential to our operations intend to continue to implement industry-standard security measures, there can be no assurance that those measures will be sufficient, and any material adverse effect experienced by the Advisor and other parties that provide us with services essential to our operations could, in turn, have an adverse impact on us.
If we are unable to implement and maintain effective internal controls over financial reporting in the future, investors may lose confidence in the accuracy and completeness of our financial reports and the market price of our common stock may be negatively affected.
As a newly-listed public company, beginning with the 2022 fiscal year, our independent registered public accounting firm will be required to formally attest to the effectiveness of our internal controls over financial reporting on an annual basis. The process of designing, implementing and testing the internal controls over financial reporting required to comply with this obligation is time consuming, costly and complicated. If we identify material weaknesses in our internal controls over financial reporting, if we are unable to comply with the requirements of Section 404 of the Sarbanes-Oxley Act in a timely manner or to assert that our internal controls over financial reporting are effective or if the independent registered public accounting firm is unable to express an opinion as to the effectiveness of our internal controls over financial reporting, investors may lose confidence in the accuracy and completeness of our financial reports and the market price of our common stock could be negatively affected. We could also become subject to investigations by the SEC or other regulatory authorities, which could require additional financial and management resources.
Risks Related to Conflicts of Interest
The Advisor faces conflicts of interest relating to purchasing commercial real estate-related investments, and such conflicts may not be resolved in our favor, which could adversely affect our investment opportunities.
We rely on the Advisor and the executive officers and other key real estate professionals at our Advisor to identify suitable investment opportunities for us. Although there are restrictions in the Advisory Agreement we have entered into with the Advisor with respect to the Advisor’s ability to manage another REIT that competes with us, or to provide any services related to fixed-rate conduit lending to another person, the Advisor and its employees are not otherwise restricted from engaging in investment and investment management activities unrelated to us and do engage in these activities. Some investment opportunities that are suitable for us may also be suitable for other investment vehicles managed by the Advisor or its affiliates. Thus, the executive officers and real estate professionals of the Advisor could direct attractive investment opportunities to other entities or investors. In addition, we have any may in the future engage in transactions with our Advisor or affiliates of our Advisor and these transactions may not be on terms as favorable as transactions with third parties. Such events could result in us investing in assets that provide less attractive returns, which may reduce our ability to make distributions.
The Advisor and its employees face competing demands relating to their time, and this may cause our operating results to suffer.
The Advisor and its employees are engaged in investment and investment management activities unrelated to us. Because these persons have competing demands on their time and resources, they may have conflicts of interest in allocating their time between our business and these other activities. If this occurs, the returns on our investments may suffer.
Risks Related to Our Corporate Structure
The limit on the number of shares a person may own may discourage a takeover that could otherwise result in a premium price to our stockholders.
The Company's charter, with certain exceptions, authorizes the board of directors to take such actions as are necessary and desirable to preserve our qualification as a REIT. Unless exempted by the board of directors, no person or entity may own more than 7.9% in value of the aggregate of our outstanding shares of stock or more than 7.9% (in value or in number of shares, whichever is more restrictive) of any class or series of shares of our stock determined after applying certain rules of attribution. This restriction may have the effect of delaying, deferring or preventing a change in control of us, including an extraordinary transaction (such as a merger, tender offer or sale of all or substantially all our assets) that might provide a premium price for holders of our common stock.
Certain provisions of Maryland law could inhibit a change in control of our Company.
Certain provisions of the Maryland General Corporation Law (“MGCL”) may have the effect of inhibiting a third party from making a proposal to acquire us or of impeding a change in control under circumstances that otherwise could provide the holders of shares of our common stock with the opportunity to realize a premium over the then-prevailing market price of such shares, including:
•“business combination” provisions that, subject to limitations, prohibit certain business combinations between us and an “interested stockholder” (defined generally as any person who beneficially owns 10% or more of our then outstanding voting power of our shares or an affiliate or associate of ours who, at any time within the two-year period prior to the date in question, was the beneficial owner of 10% or more of our then outstanding voting shares) or an affiliate thereof for five years after the most recent date on which the stockholder becomes an interested stockholder, and thereafter imposes special appraisal rights and special stockholder voting requirements on these combinations; and
•“control share” provisions that provide that “control shares” of our company (defined as shares which, when aggregated with other shares controlled by the stockholder, entitle the stockholder to exercise one of three increasing ranges of voting power in electing directors) acquired in a “control share acquisition” (defined as the direct or indirect acquisition of ownership or control of “control shares”) have no voting rights except to the extent approved by our stockholders by the affirmative vote of at least two-thirds of all the votes entitled to be cast on the matter, excluding all interested shares.
Pursuant to the MGCL, our board of directors has exempted any business combination involving our Advisor or any affiliate of our Advisor. Consequently, the five-year prohibition and the super-majority vote requirements will not apply to business combinations between us and our Advisor or any affiliate of our Advisor.
In addition, the Company's bylaws contain a provision exempting from the control share provisions any and all acquisitions of our stock by any person. There can be no assurance that this provision will not be amended or eliminated at any time in the future.
In addition, the “unsolicited takeover” provisions of Title 3, Subtitle 8 of the MGCL permit the Board, without shareholder approval and regardless of what is currently provided in the charter or bylaws, to implement certain takeover defenses, including adopting a classified board or increasing the vote required to remove a director. Such takeover defenses may have the effect of inhibiting a third-party from making an acquisition proposal for us or of delaying, deferring or preventing a change in control of us under the circumstances that otherwise could provide our common stockholders with the opportunity to realize a premium over the then-current market price.
The value of our common stock may be reduced if we are required to register as an investment company under the Investment Company Act.
We are not registered, and do not intend to register ourselves, our operating partnership or any of our subsidiaries, as an investment company under the Investment Company Act. If we become obligated to register ourselves, our operating partnership or any of our subsidiaries as an investment company, the registered entity would have to comply with a variety of substantive requirements under the Investment Company Act imposing, among other things, limitations on capital structure and restrictions on specified investments.
Although we monitor the portfolio of the Company, the operating partnership and its subsidiaries periodically and prior to each acquisition and disposition, any of these entities may not be able to maintain an exclusion from the definition of investment company. If the Company, the operating partnership or any subsidiary is required to register as an investment company but fails to do so, the unregistered entity would be prohibited from engaging in our business, and criminal and civil actions could be brought against such entity. In addition, the contracts of such entity would be unenforceable unless a court required enforcement, and a court could appoint a receiver to take control of the entity and liquidate its business.
RisksRisk Related to Our Financing Strategy
The Company uses leverageWe have a significant amount of indebtedness and may need to incur more in the future.
We have substantial indebtedness. In connection with executing our business strategies, we expect to evaluate the possibility of originating, funding, and acquiring additional commercial real estate debt and making other strategic investments, and we may elect to finance these endeavors by incurring additional indebtedness. The amount of such indebtedness could have material adverse consequences, including:
•hindering our ability to adjust to changing market, industry or economic conditions;
•limiting our ability to access the capital markets to raise additional equity or refinance maturing debt on favorable terms or to fund acquisitions;
•limiting the amount of cash flow available for future operations, acquisitions, dividends, stock repurchases or other uses;
•making us more vulnerable to economic or industry downturns, including interest rate increases or sustained high interest rate environments; and
•placing us at a competitive disadvantage compared to less leveraged competitors.
Moreover, we may be required to raise substantial additional capital to execute our business strategy. Our ability to arrange additional financing will depend on, among other factors, our financial position and performance, as well as prevailing market conditions and other factors beyond our control. If we are unable to obtain additional financing, our credit ratings could be further adversely affected, which increases the risk of loss associated withcould further raise our investments.borrowing costs and further limit our future access to capital and our ability to satisfy our obligations under our indebtedness.
We financemay not be able to earn returns on loans we make in excess of the originationinterest we pay on our borrowings.
We try to generate financial returns by making and acquisition of a portioninvesting in loans and debt securities that generate returns in excess of our investments with repurchase agreements, collateralized loan obligations ("CLO") and other borrowings. Although the usecost of leverage may enhance returns and increase the number of investments that we can make, it may also substantially increase the risk of loss.capital. Our ability to execute this strategy depends on various conditions in the financing markets that are beyond our control, including liquidity, fluctuations in prevailing interest rates and credit spreads. Interest rate and credit spread fluctuations resulting in our interest and related expense exceeding interest and related income would result in operating losses
for us. Changes in the level of interest rates and credit spreads also may affect our ability to make new loans or investments and may decrease the value of our existing loans and investments. Increases in interest rates and credit spreads may also negatively affect demand for loans and could result in higher borrower default rates. We may be unable to obtain additional financing on favorable terms or, with respect to our debt and other investments, on terms that parallelmatch the maturities of the debt originated or other investments acquired, if we are able to obtain additional financing at all.
We rely on the availability of collateralized debt and loan obligation securitization markets to provide long-term financing for our loans and investments.
We rely on short-term borrowings, such as repurchase agreements and our secured revolving credit facilities, to initially fund our investments. The term of these short-term borrowing facilities is generally shorter than the term of our investments and therefore we typically intend to refinance these short-term borrowings with long-term match-funded financing through issuances of CDO’s and CLO’s. There have been times in the past when the CDO and CLO securitization markets have effectively been closed or are only available at a cost of capital that is not practicable. If our current financing strategy is notbecame no longer viable, we willwould have to find alternative forms of long-term financing for our assets, as secured revolving credit facilities and repurchase facilities may not accommodate long-term financing.assets. This could subject us to more restrictive recourse borrowings and subject us to capital costs that significantly reduce or eliminate the risk that debt servicespread between our cost of capital and the returns on less efficient forms of financing would require a larger portion of our cash flows, thereby reducing cash available for distribution, for our operations and for future business opportunities.investments. If alternative financing is not available, we may have to liquidate assets at unfavorable prices to pay off such financingour short-term borrowings or pay significant fees to extend ourthese financing arrangements. The return on our investments and cash available for distribution may be reduced to the extent that changes in market conditions cause the cost of our financing to increase relative to the income that we can derive from the assets we originate or acquire.
Lenders mayoften require us to enter into restrictive covenants relating to our operations, which could limit our ability to make distributions.
When providing financing, a lender may impose restrictions on us that affect our distribution and operating policies, and our ability to incur additional borrowings. Financing agreements that we may enter into mayoften contain covenants that limit our ability to further incur borrowings, restrict distributions or that prohibitrestrict our operations, such as prohibiting us from discontinuing insurance coverage or replacing our Advisor. CertainThese limitations would decrease our operating flexibility and may impact our ability to achieve our operating objectives, including making distributions.
In a periodDuring periods of rising interest rates, our interest expense could increase while theincreases may outpace any increases in interest we earn on our fixed-rate assets, would not change, which would adversely affectand the value of our profitability.assets may decrease.
Our operating results depend in large part on differences between the income from our assets, reduced by any credit losses and financing costs. Income from our assets may respond more slowly to interest rate fluctuations than the cost of our borrowings. In a period of rising interest rates, our interest expense on floating-rate debt would increase, while any additional interest income we earn on our floating-rate investments may not compensate for such increase in interest expense. Consequently, changes in interest rates, particularly short-term interest rates, may significantly influence our net income. Increases in these rates will tend to decrease our net income and the market value of our assets. Similarly, in a period of declining interest rates, our interest income on floating-rate investments would generally decrease, and interest rate floors on our floating-rate investments may not align with the interest rate floors on our floating-rate debt to compensate for such a decrease in interest income. Interest rate fluctuations resulting in our interest expense exceeding the income from our assets would result in operating losses for us and may limit our ability to make distributions to our stockholders. In addition, if we need to repay existing borrowings during periods of rising interest rates, we could be required to liquidate one or more of our investments at times that may not permit realization of the maximum return on those investments, which would adversely affect our profitability.
We may not be able to access financing sources on attractive terms, if at all, which could dilute our existing stockholders and adversely affect our ability to fund and grow our business.business, or result in dilution to our existing stockholders.
Our ability to fund our loans and investments may be impacted by our ability to secure bank credit facilities (including term loans and revolving facilities), warehouse facilities and structured financing arrangements, public and private debt issuances (including through securitizations) and derivative instruments, in addition to transaction or asset specific funding arrangements and additional repurchase agreements on acceptable terms. We may also rely on short-term financing that would be especially exposed to changes in availability. Our access to sources of financing will depend upon a number of factors, over which we have little or no control, including:
•general economic or market conditions;
•the market’s view of the quality of our assets;
•the market’s perception of our growth potential;
•our current and potential
•future earnings and cash distributions; and
•the market price of the shares of our common stock and preferred stock.
We may need to periodically access the capital markets to, among other things, raise cash to fund new loans and investments. Unfavorable economic conditions such as those caused by the COVID-19 pandemic, or capital market conditions may increase our funding costs, limit our access to the capital markets or could result in a decision by our potential lenders not to extend credit. An inability to successfully access the capital markets could limit our ability to grow our business and fully execute our business strategy and could decrease our earnings and liquidity. Additional equity issuances in the capital markets on unfavorable terms could also be dilutive to our
existing stockholders. In addition, any dislocation or weakness in the capital and credit markets could adversely affect our lenders and could cause one or more of our lenders to be unwilling or unable to provide us with financing or to increase the costs of that financing. In addition, as regulatory capital requirements imposed on our lenders are increased, they may be required to limit, or increase the cost of, financing they provide to us. In general, this could potentially increase our financing costs and reduce our liquidity or require us to sell assets at an inopportune time or price. We cannot make assurances that we will be able to obtain any additional financing on favorable terms or at all.
We useOur short-term borrowings such as credit facilities and repurchase agreements to finance our investments, whichoften require us to provide additional collateral inwhen the event the lender determines there is a decrease in the fair market value of our collateral decreases, and these calls for collateral could significantly impact our liquidity position.
We use short-term borrowing through repurchase agreements, credit facilities and other arrangements that put our assets and financial condition at risk. We may need to use such short-term borrowings for extended periods of time to the extent we are unable to access long-term financing. Repurchase agreements economically resemble short-term, variable-rate financing and usually require the maintenance of specific loan-to-collateral value ratios. If the market value of the assets subject to a repurchase agreement decline, we may be required to provide additional collateral or make cash payments to maintain the loan-to-collateral value ratio. If we are unable to provide such collateral or cash repayments, the lender may accelerate the loan orand we wouldmay be required to liquidate the collateral. In a weakening economic environment, or in an environment of widening credit spreads, we would generally expect the value of the commercial real estate debt or securities that serve as collateral for our short-term borrowings to decline, and in such a scenario, it is likely that the terms of our short-term borrowings would require us to provide additional collateral or to make partial repayment, which amounts could be substantial. These risks related to the use of repurchase agreements were significantly increased as a result of the assets acquired in, and the increase in our indebtedness resulting from, the Capstead merger and will continue to be heightened until we have completed the process of transitioning those acquired assets into our legacy investment strategies and returning to our traditional leverage levels.
Further, such borrowings may require us to maintain a certain amount of cash reserves or to set aside unleveraged assets sufficient to maintain a specified liquidity position that would allow us to satisfy our collateral obligations. In addition, such short-term borrowing facilities may limit the length of time that any given asset may be used as eligible collateral, and these short-term borrowing arrangements may also be restricted to financing certain types of assets, such as first mortgage loans, which could impact our asset allocation. As a result, we may not be able to leverage our assets as fully as we would like, which could reduce our return on assets. In the event that we are unable to meet these collateral obligations, our financial condition could deteriorate rapidly.
Risks Related to Our Investments
Our commercial real estate debt investments are subject to the risks typically associated with ownership of commercial real estate.
Our commercial real estate debt and commercial real estate securities generally are directly or indirectly secured by a lien on real property. The occurrence of a default on a commercial real estate debt investment could result in our acquiring ownership of the property. We do not know whether the values of the properties ultimately securing our commercial real estate debt and loans underlying our securities will remain at the levels existing on the dates of origination of these loans and the dates of origination of the loans ultimately securing our securities, as applicable. In addition, our borrowers could fraudulently inflate the values of the underlying properties. If the values of the properties drop our risk will increase because ofor are discovered to have been fraudulently inflated, the lower value of the security and reduction in borrower equity associated with such loans.loans will increase our risk. In this manner, reduced real estate values could impact the values of our debt and security investments. Therefore, our commercial real estate debt and securities investments, aremaking them subject to the risks typically associated with real estate.estate ownership.
Our operating results may be adversely affected by a number of risks generally incident to holding real estate debt, including, without limitation:
•natural disasters, such as hurricanes, earthquakes and floods, which we expect to increase in strength and frequency due to climate change;
•acts of war or terrorism, or criminal violence, including the consequences of terrorist attacks;
•adverse changes in national and local economic and real estate conditions;
•adverse changes in economic and market conditions related to pandemics and health crises, such as COVID-19;
•an oversupply of (or a reduction in demand for) space in the areas where particular properties securing our loans are located and the attractiveness of particular properties to prospective tenants;
•changes in interest rates and availability of permanent mortgage funds that my render the sale of property difficult or unattractive;
•changes in governmental laws and regulations, fiscal policies and zoning ordinances and the related costs of compliance therewith and the potential for liability under applicable laws;
•costs of remediation and liabilities associated with environmental conditions affecting properties;
•reduced demand for office space, including as a result of changes in work habits, including remote or hybrid work schedules which allow work from remote locations other than the employer’s office premises;
•the potential for uninsured or underinsured property losses; and
•periods of high interest rates and tight money supply.
The value of each property securing our loans is affected significantly by its ability to generate cash flow and net income, which in turn depends on the amount of rental or other income that can be generated net of expenses required to be incurred with respect to the property. Many expenses associated with properties (such as operating expenses and capital expenses) cannot be reduced when there is a reduction in income from the properties.
These factors may have a material adverse effect on the ability of our borrowers to pay their loans and the ability of the borrowers on the underlying loans securing our securities to pay their loans, as well as on the value and the return that we can realize from assets we acquire and originate.
Our success depends on the availability of attractive investment opportunities and the Advisor’sopportunities.
Our loans typically have a term of about three to five years.As a result, a significant amount of our invested capital is repaid at loan maturity each year.Our operating results are dependent upon our ability to identify, structure, consummate, leverage, manage and realize attractive returns on, our investments.
Our operating results are dependent upon the availability of, as well as the Advisor’s ability to identify, structure, consummate, leverage, manage and realize returns on, ournew loans and other investments. In general, the availability of attractive investment opportunities and, consequently, our operating results, will be affected by the level and volatility of interest rates, conditions in the financial markets, general economic conditions, the demand for investment opportunities in our target assets and the supply of capital for such investment opportunities. We cannot assure you that the Advisorwe will be successful in identifying and consummating attractive investments or that such investments, once made, will perform as anticipated.
There can be no assurances that the U.S. or global financial systems will remain stable, and the occurrence of another significant credit market disruption may negatively impact our ability to execute our investment strategy, which would materially and adversely affect us.
The U.S. and global financial markets experienced significant disruptions in the past, during which times global credit markets collapsed, borrowers defaulted on their loans at historically high levels, banks and other lending institutions suffered heavy losses and the value of real estate declined. During such periods, a number of borrowers became unable to pay principal and interest on outstanding loans as the value of their real estate declined. After the 2008 Global Financial Crisis, liquidity eventually returned to the market and property values recovered to levels that exceeded those observed prior to the Global Financial Crisis. However, declining real estate values due to the COVID-19 pandemic, or other factors, could in the future reduce the level of new mortgage and other real estate-related loan originations. Instability in the U.S. and global financial markets in the future could be caused by any number of factors beyond our control, including, without limitation, terrorist attacks or other acts of war and adverse changes in national or international economic, market and political conditions or another health pandemic. Any future sustained period of increased payment delinquencies, foreclosures or losses could adversely affect both our net interest income from loans in our portfolio as well as our ability to originate and acquire loans, which would materially and adversely affect us.
Difficulty in redeploying the proceeds from repayments of our existing loans and other investments could materially and adversely affect us.
As our loans and other investments are repaid, we attempt to redeploy the proceeds we receive into new loans and investments and repay borrowings under our repurchase facilities and other financing arrangements. It is possible that we will fail to identify reinvestment options that would provide a yield and/or a risk profile that is comparable to the asset that was repaid. If we fail to redeploy the proceeds we receive from repayment of a loan or other investment in equivalent or better alternatives, we could be materially and adversely affected. If we cannot redeploy the proceeds we receive from repayments into funding loans in property types or geographic markets that the Advisor has identified as priorities for us, such repayments may cause the composition of our loan portfolio to skew towards less favored property types or geographies and prevent us from achieving our portfolio construction objectives.
Delays in liquidating defaulted commercial real estate debt investments could reduce our investment returns.
If we originate or acquire commercial real estate debt investments and there are defaults under those debt investments, we may not be able to repossess and sell the properties securing the commercial real estate debt investment quickly. Foreclosure of a loan can be an expensive and lengthy process that could have a negative effect on our return on the foreclosed loan. Borrowers often resist foreclosure actions by asserting numerous claims, counterclaims and defenses, including but not limited to lender liability claims, in an effort to prolong the foreclosure action. In some states, foreclosure actions can take several years or more to resolve. At any time during the foreclosure proceedings, the borrower may file for bankruptcy, which would have the effect of staying the foreclosure action and further delaying the foreclosure process. The resulting time delay could reduce the value of ourthe assets inunder the defaulted loans. Furthermore, an action to foreclose on a property securing a loan is regulated by state statutes and regulations and is subject to the delays and expenses associated with lawsuits if the borrower raises defenses or counterclaims. In the event of default by a borrower, these restrictions, among other things, may impede our ability to foreclose on or sell the property securing the loan or to obtain proceeds sufficient to repay all amounts due to us on the loan. In addition, we
Operating and disposing of properties acquired through foreclosure subject us to additional risks that could harm our results of operations.
The size of our real estate owned portfolio acquired through foreclosure has increased in recent years. We have in the past and we may in the future be forced to operate any foreclosed properties for a substantial period of time, which couldcan be a distraction for our management team and may require us to pay significant costs associated with such property.
operations, financial condition and liquidity. We may also be subject to environmental liabilities arising from such properties acquired in the foreclosure process. In addition, at such time that we elect to sell such property, the liquidation proceeds upon sale of the underlying real estate may not be sufficient to recover our cost basis, resulting in a loss to us. Furthermore, any costs or delays involved in the maintenance or liquidation of the underlying property will further reduce the net proceeds and, thus, increase the loss. Subordinate commercial real estate debt that we originate or acquire could expose us to greater losses.
We acquire and originate subordinate commercial real estate debt, including subordinate mortgage and mezzanine loans and participations in such loans. These types of investments could constitute a significant portion of our portfolio and may involve a higher degree of risk than the type of assets that will constitute the majority of our commercial real estate debt investments, namely first mortgage loans secured by real property. In the event a borrower declares bankruptcy, we may not have full recoursebe able to fully realize on the assets of the borrower, or the assets of the borrower may not be sufficient to fully satisfy both the first mortgage loan and our subordinate debt investment. If a borrower defaults on our subordinate debt or on debt senior to ours, or in the event of a borrower bankruptcy, our subordinate debt will be satisfied only after the senior debt is paid in full. Where debt senior to our debt investment exists, the presence of intercreditor arrangements may limit our ability to amend our debt agreements, assign our debt, accept prepayments, exercise our remedies (through “standstill periods”) and control decisions made in bankruptcy proceedings relating to our borrowers. As a result, we may not recover some or all of our investment. In addition, real properties with subordinate debt may have higher loan-to-value ratios than conventional debt, resulting in less equity in the real property and increasing the risk of loss of principal and interest.
We may be subject to risks associated with construction lending, such as declining real estate values, cost overruns and delays in completion.
Our commercial real estate debt portfolio may include loans made to developers to construct prospective projects. The primary risks to us of construction loans are the potential for cost overruns, the developer’s failing to meet a project delivery schedule and the inability of a developer to sell or refinance the project at completion in accordance with its business plan and repay our commercial real estate loan due to declining real estate values. These risks could cause us to have to fund more money than we originally anticipated in order to complete the project. We may also suffer losses on our commercial real estate debt if the developer is unable to sell the project or refinance our commercial real estate debt investment.
Jurisdictions with one action or security first rules or anti-deficiency legislation may limit the ability to foreclose on the property or to realize the obligation secured by the property by obtaining a deficiency judgment.
In the event of any default under our commercial real estate debt investments and in the loans underlying our commercial real estate securities, we bear the risk of loss of principal and nonpayment of interest and fees to the extent of any deficiency between the value of the collateral and the principal amount of the loan. Certain states in which the collateral securing our commercial real estate debt and securities is located may have laws that prohibit more than one judicial action to enforce a mortgage obligation, requiring the lender to exhaust the real property security for such obligation first or limiting the ability of the lender to recover a deficiency judgment from the obligor following the lender’s realization upon the collateral, in particular if a non-judicial foreclosure is pursued. These statutes may limit the right to foreclose on the property or to realize the obligation secured by the property.
Investments in non-conforming or non-investment grade rated loans or securities involve greater risk of loss.
Some of our investments may not conform to conventional loan standards applied by traditional lenders and either will not be rated or will be rated as non-investment grade by the rating agencies. The non-investment grade ratings for these assets typically result from the overall leverage of the loans, the lack of a strong operating history for the properties underlying the loans, the borrowers’ credit history, the properties’ underlying cash flow or other factors. As a result, these investments may have a higher risk of default and loss than investment grade rated assets. Any loss we incur may be significant and may reduce distributions and adversely affect the value of our common stock.
Insurance may not cover all potential losses on the properties underlying our investments, which may harm the value of our assets.
We generally require that each of the borrowers under our commercial real estate debt investments obtain comprehensive insurance covering the mortgaged property, including liability, fire and extended coverage. However, there are certain types of losses, generally of a catastrophic nature, such as earthquakes, floods and hurricanes that may be uninsurable or not economically insurable. Climate change may exacerbate the frequency and severity of these types of events. We may not require borrowers to obtain certain types of insurance if it is deemed commercially unreasonable. Inflation, changes in building codes and ordinances, environmental considerations and other factors also might make it infeasible to useresult in insurance proceeds being inadequate to replace a property if it is damaged or destroyed. Under such circumstances, the insurance proceeds, if any, might not be adequate to restore the economic value of the property, which might impair our security and decrease the value of the property.
We invest in CMBS and CRE CLO Bonds, which may include subordinate securities, which entails certain risks.
We invest in a variety of CMBS and CRE CLO Bonds, which may include subordinate securities that are subject to the first risk of loss if any losses are realized on the underlying mortgage loans. CMBS and CRE CLO Bonds entitle the holders thereof to receive payments that depend primarily on the cash flow from a specified pool of commercial or multifamily mortgage loans. Consequently, CMBS willand CRE CLO Bonds may be adversely affected by payment defaults, delinquencies and losses on the underlying commercial real estate loans. Furthermore, if the rental and leasing markets deteriorate, it could reduce cash flow from the loan pools underlying our CMBS and CRE CLO Bonds investments. The CMBS and CRE CLO Bonds market is dependent upon liquidity for refinancing and willcould be negatively impacted by a slowdown in the new issue CMBS and CRE CLO Bonds market. In addition, the value of CMBS and CRE CLO Bonds may change due to shifts in the market’s perception of issuers and regulatory or tax changes adversely affecting the mortgage securities market as a whole.
Additionally, CMBS isand CRE CLO Bonds are subject to particular risks, including lack of standardized terms and payment of all or substantially all of the principal only at maturity rather than regular amortization of principal. Additional risks may be presented by the type and use of a particular commercial property. For example, special risks are presented by hospitals, nursing homes, hospitality properties and certain other property types. Commercial property values and net operating income are subject to volatility, which may result in net operating income becoming insufficient to cover debt service on the related commercial real estate loan, particularly if the current economic environment deteriorates. The repayment of loans secured by income-producing properties is typically dependent upon the successful operation of the related real estate project rather than upon the liquidation value of the underlying real estate. Furthermore, the net operating income from and value of any commercial property are subject to various risks. The exercise of remedies and successful realization of liquidation proceeds relating to CMBS and CRE CLO Bonds may be highly dependent upon the performance of the servicer or special servicer. Expenses of enforcing the underlying commercial real estate loans (including litigation expenses) and expenses of protecting the properties securing the commercial real estate loans may be substantial. Consequently, in the event of a default or loss on one or more commercial real estate loans contained in a securitization, we may not recover a portion or all of our investment.
The CMBS in which we may invest are subject to the risks of the mortgage securities market as a whole and risks of the securitization process.
The value of CMBS may change due to shifts in the market’s perception of issuers and regulatory or tax changes adversely affecting the mortgage securities market as a whole. Due to our investment in subordinate CMBS, we are also subject to several risks created through the securitization process. Our subordinate CMBS are paid interest only to the extent that there are funds available to make payments. To the extent the collateral pool includes delinquent loans, there is a risk that the interest payment on subordinate CMBS will not be fully paid. Subordinate CMBS are also subject to greater credit risk than those CMBS that are senior and generally more highly rated.
We may not control the special servicing of the mortgage loans underlying the CMBS and CRE CLO Bonds in which we invest and, in such cases, the special servicer may take actions that could adversely affect our interests.
Overall control over the special servicing of the underlying mortgage loans of the CMBS and CRE CLO Bonds may be held by a directing certificate holder, which is appointed by the holders of the most subordinate class of such CMBS.CMBS and CRE CLO Bonds. We ordinarily do not have the right to appoint the directing certificate holder. In connection with the servicing of the specially serviced mortgage loans, the related special servicer may, at the direction of the directing certificate holder, take actions that could adversely affect our interests.
We invest in collateralized debt obligations ("CDOs") and such investments involve significant risks.
We invest in CDOs, which are multiple class securities secured by pools of assets, such as CMBS, subordinate mortgage and mezzanine loans and REIT debt. Like typical securities structures, in a CDO, the assets are pledged to a trustee for the benefit of the holders of the bonds. Like CMBS, CDO notes are affected by payments, defaults, delinquencies and losses on the underlying commercial real estate loans. CDOs often have reinvestment periods that typically last for five years during which proceeds from the sale of a collateral asset may be invested in substitute collateral. Upon termination of the reinvestment period, the static pool functions very similarly to a CMBS where repayment of principal allows for redemption of bonds sequentially. When we invest in the equity securities of a CDO, we will be entitled to all of the income generated by the CDO after the CDO pays all of the interest due on the senior securities and its expenses. However, there will be little or no income or principal available to the holders of CDO equity securities if defaults or losses on the underlying collateral exceed a certain amount. In that event, the value of our investment in any equity class of a CDO could decrease substantially. In addition, the equity securities of CDOs are generally illiquid and often must be held by a REIT and because they represent a leveraged investment in the CDO’s assets, the value of the equity securities will generally have greater fluctuations than the values of the underlying collateral.
Adjustable-rate commercial real estate loans may entail greater risks of default to us than fixed-rate commercial real estate loans.
Adjustable-rate commercial real estate loans we originate or acquire or that collateralize our commercial real estate securities may have higher delinquency rates than fixed-rate loans. Borrowers with adjustable-rate mortgage loans may be exposed to increased monthly payments if the related interest rate adjusts upward from the initial fixed-rate or a low introductory rate, as applicable, in effect during the initial period of the loan to the rate computed in accordance with the applicable index and margin. This increase in borrowers’ monthly payments, together with any increase in prevailing market interest rates, after the initial fixed-rate period, may result in significantly increased monthly payments for borrowers with adjustable-rate loans, which may make it more difficult for the borrowers to repay the loan or could increase the risk of default of their obligations under the loan.
Changes in interest rates could negatively affect the value of our investments, which could result in reduced income or losses and negatively affect the cash available for distribution.
We may invest in fixed-rate CMBS and other fixed-rate investments. Under a normal yield curve, an investment in these instruments will decline in value if long-term interest rates increase. We will also invest in floating-rate investments, for which decreases in interest rates will have a negative effect on interest income. Declines in fair value may ultimately reduce income or result in losses to us, which may negatively affect cash available for distribution.
Hedging against interest rate exposure may adversely affect our income, limit our gains or result in losses, which could adversely affect cash available for distribution to our stockholders.
We may enter into interest rate swap agreements or pursue other interest rate hedging strategies. Our hedging activity will vary in scope based on interest rate levels, the type of investments held, and other changing market conditions. Interest rate hedging may fail to protect or could adversely affect us because, among other things:
•interest rate hedging can be expensive, particularly during periods of rising and volatile interest rates;
•available interest rate hedging may not correspond directly with the interest rate risk for which protection is sought;
•the duration of the hedge may not match the duration of the related liability or asset;
•our hedging opportunities may be limited by the treatment of income from hedging transactions under the rules determining REIT qualification;
•the credit quality of the party owing money on the hedge may be downgraded to such an extent that it impairs our ability to sell or assign our side of the hedging transaction;
•the party owing money in the hedging transaction may default on its obligation to pay; and
•we may purchase a hedge that turns out not to be necessary.
Any hedging activity we engage in may adversely affect our income, which could adversely affect cash available for distribution. Therefore, while we may enter into such transactions to seek to reduce interest rate risks, unanticipated changes in interest rates may result in poorer overall investment performance than if we had not engaged in any such hedging transactions. In addition, the degree of correlation between price movements of the instruments used in a hedging strategy and price movements in the portfolio positions being hedged or liabilities being hedged may vary materially. Moreover, for a variety of reasons, we may not be able to establish a perfect correlation between hedging instruments and the investment being hedged. Any such imperfect correlation may prevent us from achieving the intended hedge and expose us to risk of loss.
Most of our investments are illiquid and we may not be able to vary our portfolio in response to changes in economic and other conditions, which may result in losses to us.
Most of our investments are illiquid. As a result, our ability to sell commercial real estate debt, securities or properties in response to changes in economic and other conditions, could be limited, even at distressed prices. The Internal Revenue Code also places limits on our ability to sell properties held for fewer than fourtwo years. These considerations could make it difficult for us to dispose of any of our assets even if a disposition were in the best interests of our stockholders. As a result, our ability to vary our portfolio in response to further changes in economic and other conditions may be relatively limited, which may result in losses to us.
Some of our investments will be carried at estimated fair value as determined by us and, as a result, there may be uncertainty as to the value of these investments.
Some of our investments will be in the form of securities that are recorded at fair value but have limited liquidity or are not publicly-traded. The fair value of these securities and potentially other investments that have limited liquidity or are not publicly-traded may not be readily determinable. We estimate the fair value of these investments on a quarterly basis. Because such valuations are inherently uncertain, may fluctuate over short periods of time and may be based on numerous estimates and assumptions, our determinations of fair value may differ materially from the values that would have been used if a readily available market for these securities existed. The value of our common stock could be adversely affected if our determinations regarding the fair value of these investments are materially higher than the values that we ultimately realize upon their disposal.
Competition with third parties for originating and acquiring investments may reduce our profitability.
We have significant competition with respect to our origination and acquisition of assets with many other companies, including other REITs, insurance companies, commercial banks, private investment funds, hedge funds, specialty finance companies and other investors, many of which have greater resources than us. Weus, and may not be able to compete successfully for investments. In addition, the number of entities and the amount of funds competing for suitable investments may increase. If weMany of our competitors are not subject to the operating constraints associated with REIT rule compliance or maintenance of an exclusion from registration under the Investment Company Act. In addition, some of our competitors may have higher risk tolerances or different risk assessments, which could allow them to consider a wider variety of loans and investments, offer more attractive pricing or other terms and establish more relationships than us. Furthermore, competition for originations of and investments in our target assets may lead to the yields of such assets decreasing, which may further limit our ability to generate satisfactory returns.
This competition may cause us to pay higher prices for investments or originate loans onwith more generous terms than our competitors, our returns will be lower and the value of our assets may not increase or may decrease significantly below the amount we paid for such assets.would otherwise agree to. If such events occur,this occurs, our investors may experience a lower return on their investment.
Our due diligence may not reveal all material issues relating to our origination or acquisition of a particular investment.
Before making an investment, we assess the strength and skills of the management of the borrower or the operator of the property and other factors that we believe are material to the performance of the investment. In making the assessment and otherwise conducting customary due diligence, we rely on the resources available to us and, in some cases, an investigation by third parties. This process is particularly important and subjective with respect to newly organized or private entities because there may be
little or no information publicly available about the entity. EvenHowever, even if we conduct extensive due diligence on a particular investment, there can be no assurance that this diligence will uncover all material issues relating to such investment, that the information provided by the borrower is truthful or accurate, or that factors outside of our control will not later arise. If our due diligence fails to identify material issues, specific to investment, we have in the past and may be forcedin the future have to write-down or write-off assets, restructure our operationsinvestment or incur impairment or other charges that could result in our reporting losses. Charges of this nature could contribute to negative market perceptions about us or our shares of common stock.stock (refer to “Part I, Item 3. Legal Proceedings” for a summary of the Company’s legal proceedings).
We may be unable to restructure loans in a manner that we believe maximizes value, particularly if we are one of multiple creditors in large capital structures.
In the current environment, in order to maximize value we may be more likely to extend and work out a loan, rather than pursue foreclosure. However, in situations where there are multiple creditors in large capital structures, it can be particularly difficult to assess the most likely course of action that a lender group or the borrower may take and it may also be difficult to achieve consensus among the lender group as to major decisions. Consequently, there could be a wide range of potential principal recovery outcomes, the timing of which can be unpredictable, based on the strategy pursued by a lender group and/or by a borrower. These multiple creditor situations tend to be associated with larger loans. If we are one of a group of lenders, we may be a lender on a subordinated basis, and may not independently control the decision making. Consequently, we may be unable to restructure a loan in a manner that we believe would maximize value.
We may be subject to risks associated with future advance obligations, such as declining real estate values and operating performance.
Our commercial real estate debt portfolio may include loans that require us to advance future funds. Future funding obligations subject us to significant risks that the property may have declined in value, projects to be completed with the additional funds may have cost overruns and the borrower may be unable to generate enough cash flow, or sell or refinance the property, in order to repay our commercial real estate loan due. We could determine that we need to fund more money than we originally anticipated in order to maximize the value of our investment even though there is no assurance additional fundingthat such determination would, in fact, be the best course of action.
While we attemptWe may not be successful in our attempts to align the maturities of our liabilities with the maturities on our assets, we may not be successful in that regard which could harm our operating results and financial condition.
Our general financing strategy will include the use of “match-funded” structures. This means that we will seek to align the maturities of our liabilities with the maturities on our assets in order to manage the risks of being forced to refinance our liabilities prior to the maturities of our assets. We may fail to appropriately employ match-funded structures on favorable terms, or at all.all, including as a result of the unavailability of CDO and CLO financing options. We may also determine not to pursue a match-funded structure with respect to a portion of our financings for a variety of reasons. If we fail to appropriately employ match-funded structures, our exposure to interest rate volatility and exposure to matching liabilities prior to the maturity of the corresponding asset may increase substantially which could harm our operating results, liquidity and financial condition.
Provision for credit losses is difficult to estimate.
OurOur provision for credit losses is evaluated on a quarterly basis. Our determination of provision for credit losses requires us to make certain estimates and judgments.judgments, which may be difficult to determine. Our estimates and judgments are based on a number of factors, including projected cash flows from the collateral securing our commercial real estate debt, debt structure, including the availability of reserves and recourse guarantees, likelihood of repayment in full at the maturity of a loan, loan-to-value ("LTV"), potential for refinancing and expected market discount rates for varying property types.types, loan-to-value ("LTV"), and reasonable and supportable forecasts that affect the collectability of the reported amount. Our estimates and judgments may not be correct and, therefore, our results of operations and financial condition could be severely impacted.
Since the start of 2020 we have been subject to the FASB’s Accounting Standards Update (“ASU”) 2016-13, Financial Instruments-Credit"Financial Instruments - Credit Losses, (Topic 326): Measurement of Credit Losses on Financial Instruments. The new standard, knownInstruments (Topic 326)," which replaced the "incurred loss" model for recognizing credit losses with an "expected loss" model referred to as the Current Expected Credit Loss (“CECL”model ("CECL") became effective for us on January 1, 2020. Under the CECL model, significantly changed how entities measurewe are required to provide allowances for credit losses for moston certain financial assets carried at amortized cost, such as loans held-for-investment and certain other instruments that are not measured at fair value through net income. CECL amended the existing credit loss model to reflect a reporting entity's current estimateheld-to-maturity debt securities, including related future funding commitments and accrued interest receivable. The measurement of all expected credit losses not onlyis based on information about past events, including historical experience, and current conditions, but also by includingand forward looking information through the use of projected macroeconomic scenarios over the reasonable and supportable forecasts incorporating forward-looking information.forecasts. This measurement takes place at the time the financial asset is first added to the balance sheet and updated quarterly thereafter. This differs significantly from the prior “incurred loss” model."incurred loss" model previously required under GAAP, which delayed recognition until it was probable a loss had been incurred. Accordingly, the adoption of the CECL model has materially affected how we determine our credit loss provision and required us to significantly increase our allowance and recognize provisions for credit losses earlier in the lending cycle. Moreover, the CECL model created more volatility in the
level of our credit loss provisions. If we are required to materially increase our future level of credit loss allowances for any reason, such increase could adversely affect our business, results of operations, liquidity and financial conditions.
Any credit ratings assigned to our investments will be subject to ongoing evaluations and revisions and we cannot assure you that those ratings will not be downgraded.
Some of our investments may be rated by rating agencies. Any credit ratings on our investments are subject to ongoing evaluation by credit rating agencies, and we cannot assure you that any such ratings will not be downgraded or withdrawn by a rating agency in the future if, in its judgment, circumstances warrant. If rating agencies assign a lower-than-expected rating or reduce or withdraw, or indicate that they may reduce or withdraw, their ratings of FBRT’s investments in the future, the value and liquidity of ourthose investments could significantly decline, which would adversely affect the value of our investment portfolio and could result in losses upon disposition or the failure of borrowers to satisfy their debt service obligations to us.
Changes to, or the elimination of, LIBOR may adversely affect our interest income, interest expense, or both.
In July 2017, the Financial Conduct Authority of the U.K. (the “FCA”) announced its intention to cease sustaining LIBOR after 2021. The FCA has statutory powers to require panel banks to contribute to LIBOR where necessary. The FCA has decided not to ask, or to require, that panel banks continue to submit contributions to LIBOR beyond the end of 2021. The FCA has indicated that it expects that the current panel banks will voluntarily sustain LIBOR until the end of 2021. It is possible that the ICE Benchmark Administration Limited (formerly NYSE Euronext Rate Administration Limited) (the “IBA”), the current administrator of LIBOR, and the panel banks could continue to produce LIBOR on the current basis after 2021, if they are willing and able to do so, but we do not currently anticipate that LIBOR will survive in its current form, or at all. Other jurisdictions have also indicated that they will implement reforms or phase-outs, which are currently scheduled to take effect at the end of calendar year 2021. The U.S. Federal Reserve, in conjunction with the Alternative Reference Rates Committee, a steering committee comprised of large U.S. financial institutions, has identified the Secured Overnight Financing Rate (“SOFR”), a new index calculated by short-term repurchase agreements, backed by Treasury securities, as its preferred alternative for LIBOR. At this time, it is not possible to predict how markets will respond to SOFR or other alternative reference rates as the transition away from LIBOR is anticipated in coming years.
As of December 31, 2021, the carrying value of our loan portfolio included $3.7 billion and $0.4 billion of floating rate loans for which the interest rate was tied to LIBOR or SOFR, respectively. Additionally, we had $3.3 billion of floating rate debt tied to LIBOR. Our financing arrangements generally provide for the adoption of a new index based upon comparable information if the current index is no longer available. There is currently no definitive information regarding the future utilization of LIBOR or of any particular replacement rate. In addition, any benchmark may perform differently during any phase-out period than in the past. As such, the potential effect of any such event on our cost of capital and net interest income cannot yet be determined, and any changes to benchmark interest rates could increase our financing costs, which could impact our results of operations, cash flows and the market value of investments. In addition, the elimination of LIBOR and/or changes to another index could result in mismatches with the interest rate of investments that we are financing, and the overall financial markets may be disrupted as a result of the phase-out or replacement of LIBOR; however, we cannot reasonably estimate the impact of the transition at this time. The transition from LIBOR to SOFR or other alternative reference rates may also introduce operational risks in our accounting, financial reporting, loan servicing, liability management and other aspects of its business.portfolio.
Risks Related to the Conduit Segment of the Business
We use warehouse facilities that may limit our ability to acquire assets, and we may incur losses if the collateral is liquidated.
We utilize warehouse facilities pursuant to which we accumulate mortgage loans in anticipation of a securitization financing, which assets are pledged as collateral for such facilities until the securitization transaction is consummated. In order to borrow funds to acquire assets under any additional warehouse facilities, we expect that our lenders thereunder would have the right to review the potential assets for which we are seeking financing. We may be unable to obtain the consent of a lender to acquire assets that we believe would be beneficial to us and we may be unable to obtain alternate financing for such assets. In addition, no assurance can be given that a securitization transaction would be consummated with respect to the assets being warehoused. If the securitization is not consummated, the lender could liquidate the warehoused collateral and we would then have to pay any amount by which the original purchase price of the collateral assets exceeds its sale price, subject to negotiated caps, if any, on our exposure. In addition, regardless of whether the securitization is consummated, if any of the warehoused collateral is sold before the consummation, we would have to bear any resulting loss on the sale. No assurance can be given that we will be able to obtain additional warehouse facilities on favorable terms, or at all.
We directly or indirectly utilize non‑recourse securitizations, and such structures expose us to risks that could result in losses to us.
We utilize non‑recourse securitizations of our investments in mortgage loans to the extent consistent with the maintenance of our REIT qualification and exemption from the Investment Company Act in order to generate cash for funding new investments and/or to leverage existing assets. In most instances, this involves us transferring our loans to a special purpose securitization entity in exchange for cash. In some sale transactions, we also retain a subordinated interest in the loans sold. The securitization of our portfolio investments might magnify our exposure to losses on those portfolio investments because the subordinated interest we retain in the loans sold would be subordinate to the senior interest in the loans sold, and we would, therefore, absorb all of the losses sustained with respect to a loan sold before the owners of the senior interest experience any losses. Moreover, we cannot be assured that we will be able to access the securitization market in the future, or be able to do so at favorable rates. The inability to consummate securitizations of our portfolio investments to finance our investments on a long‑term basis could require us to seek other forms of potentially less attractive financing or to liquidate assets at an inopportune time or price, which could adversely affect our performance and our ability to continue to grow our business.
The securitization market is subject to a regulatory environment that may affect certain aspects of these activities.
As a result of the dislocation of the credit markets in prior years, the securitization industry has become subject to additional regulation. In particular, pursuant to the Dodd-Frank Wall Street Reform and Consumer Protection Act, various federal agencies have promulgated a rule that generally requires issuers in securitizations to retain 5% of the risk associated with the securities. While the rule as adopted generally allows the purchase of the CMBS B-Piece by a party not affiliated with the issuer to satisfy the risk retention requirement, current CMBS B-Pieces are generally not large enough to fully satisfy the 5% requirement. Accordingly, buyers of B-Pieces such as us may be required to purchase larger B-Pieces, potentially reducing returns on such investments. Furthermore, any such B-Pieces purchased by a party (such as us) unaffiliated with the issuer generally cannot be transferred for a period of five years following the closing date of the securitization or hedged against credit risk. These restrictions would reduce our liquidity and could potentially reduce our returns on such investments.
We enter into hedging transactions that could expose us to contingent liabilities in the future.
Subject to maintaining our qualification as a REIT, part of our investment strategy involves entering into hedging transactions that require us to fund cash payments in certain circumstances (such as the early termination of the hedging instrument caused by an event of default or other early termination event, or the decision by a counterparty to request margin securities it is contractually owed under the terms of the hedging instrument). The amount due would be equal to the unrealized loss of the open swap positions with the respective counterparty and could also include other fees and charges. These economic
losses will be reflected in our results of operations, and our ability to fund these obligations will depend on the liquidity of our assets and access to capital at the time, and the need to fund these obligations could adversely impact our financial condition.
Risks RelatedHedging against interest rate exposure may adversely affect our income, limit our gains or result in losses, which could adversely affect cash available for distribution to the Capstead Mergerour stockholders.
We enter into interest rate swap agreements and pursue other interest rate hedging strategies. Our hedging activity will vary in scope based on interest rate levels, the type of investments held, and other changing market conditions. Interest rate hedging may not be ablefail to realize the anticipated benefits of the merger on the anticipated timeframeprotect or at all.
The merger involved the combination of two companies that operated as independent public companies. We may encounter the following difficulties in integrating the acquired assets into our operations:could adversely affect us because, among other things:
•interest rate hedging can be expensive, particularly during periods of rising and volatile interest rates;
•available interest rate hedging may not correspond directly with the interest rate risk for which protection is sought;
•the duration of the hedge may not match the duration of the related liability or asset;
•our hedging opportunities may be limited by the treatment of income from hedging transactions under the rules determining REIT qualification;
•the credit quality of the party owing money on the hedge may be downgraded to such an extent that it impairs our ability to sell or assign our side of the hedging transactions;
•the party owing money in the hedging transaction may default on its obligation to pay; and
•we may purchase a hedge that turns out not to be necessary.
Any hedging activity we engage in may adversely affect our income, which could adversely affect cash available for distribution. Therefore, while we may enter into such transactions to seek to reduce interest rate risks, unanticipated changes in interest rates may result in poorer overall investment performance than if we had not engaged in any such hedging transactions. In addition, the degree of correlation between price movements of the instruments used in a hedging strategy and price movements in the portfolio positions being hedged or liabilities being hedged may vary materially. Moreover, for a variety of reasons, we may not be able to convert Capstead’s securities portfolio into cash atestablish a perfect correlation between hedging instruments and the prices we expected when we entered intoinvestment being hedged. Any such imperfect correlation may prevent us from achieving the merger agreement, or in the timeframe we expected;intended hedge and expose us to risk of loss.
•weRisks Related to Conflicts of Interest
The Advisor faces conflicts of interest relating to purchasing commercial real estate-related investments, and such conflicts may not be able to successfully redeploy the capital generated from Capstead’s assets into investments made pursuant to the Company’s traditional investment strategies at return thresholds consistent with our historical returns, or within the expected timetable;
•we may encounter unknown liabilities and unforeseen increased expenses, delays or conditions associated with the merger; and
•we may experience performance shortfalls as a result of the diversion of management’s attention caused by the merger.
These challenges could result in the distraction of the Company’s management, the disruption of the Company’s ongoing business or inconsistenciesresolved in our operations, services, standards, controls, policies and procedures, any offavor, which could adversely affect our investment opportunities.
We rely on the Company’sAdvisor and the executive officers and other key real estate professionals at our Advisor to identify suitable investment opportunities for us. Although there are restrictions in the Advisory Agreement we have entered into with the Advisor with respect to the Advisor’s ability to delivermanage another REIT that competes with us, or to provide any services related to fixed-rate conduit lending to another person, the Advisor and its employees are not otherwise restricted from engaging in investment returnsand investment management activities unrelated to stockholders,us and do engage in these activities. Some investment opportunities that are suitable for us may also be suitable for other investment vehicles managed by the Advisor or its affiliates. Thus, the executive officers and real estate professionals of the Advisor could direct attractive investment opportunities to maintain relationshipsother entities or investors. In addition, we may in the future engage in transactions with our key stakeholders,Advisor or affiliates of our Advisor, including co-investment transactions, and these transactions may not be on terms as favorable as transactions with third parties. Such events could result in us investing in assets that provide less attractive returns, which may reduce our ability to achievemake distributions.
The Advisor and its employees face competing demands relating to their time, and this may cause our operating results to suffer.
The Advisor and its employees are engaged in investment and investment management activities unrelated to us. We cannot provide any assurances regarding the anticipated benefitsamount of time our Advisor and its employees will dedicate to the merger,management of our business. Each of our officers is also an employee of our Advisor, who has now or couldmay be expected to have significant responsibilities for other investment vehicles currently managed by the Advisor and its affiliates. Consequently, we may not receive the level of support and assistance that we otherwise materiallymight receive if we were internally managed. Because these persons have competing demands on their time and adversely affectresources, they may have conflicts of interest in allocating their time between our business and financial results.these other activities. If this occurs, the returns on our investments may suffer.
Changes in interest rates, whether increases or decreases, may adversely affect yields on the securities acquiredThe fee structure set forth in the merger.Advisory Agreement may not create proper incentives for the Advisor.
The securities we acquired inWe pay the Capstead acquisition primarily consistAdvisor a base management fee regardless of residential adjustable-rate mortgage (“ARM”) pass-through securities issuedour performance and guaranteed by government-sponsored enterprises or by an agency of the federal government. Only a portion of coupon interest rates on the ARM loans underlying these securities reset each month and the terms of these ARM loans generally limit the amount of any increases during any single interest rate adjustment period and over the life of a loan. During periods of relatively low short term interest rates, declines in the indices used to determine coupon interest rate resets for ARM loans may adversely affect yields on the Capstead ARM securities as the underlying ARM loans reset at lower rates.
An increase in prepayments may adversely affect the fair value of the Capstead portfolio.
Prepayment expectations are an essential part of pricing mortgage investments in the marketplace and the speed of prepayments can vary widely from month to month and across individual investments; however, until we have liquidated the Capstead portfolio, prolonged periods of high mortgage prepayments could significantly reduce the expected life of the Capstead portfolio. Therefore, actual yields we realize can be lower due to faster amortization of investment premiums, which can adversely affect earnings. High levels of mortgage prepayments can also lead to larger than anticipated demandsincentive fee that is based on our liquidity fromperformance. Since the base management fee is based on total stockholder equity, the Advisor may be incentivized to focus on strategies that increase our lending counterparties. Additionally, periods of high prepayments can adversely affect pricingequity even when doing so will not optimize the returns for most of Capstead’s mortgage investmentsour stockholders. The incentive fee may create an incentive for our Advisor to invest in assets with higher yield potential, which are generally riskier or more speculative, or sell an asset prematurely for a gain, in an effort to increase our short-term net income and as a result, book value per common share can be adversely affected duethereby increase the incentive fees to declines in the fair value of the remaining Capstead portfolio.which it is entitled.
PeriodsOur Advisor manages our portfolio pursuant to broad investment guidelines and is not required to seek the approval of illiquidityour board of directors for each investment, financing, asset allocation or hedging decision made by it, which may result in the mortgage markets may reduce amounts available under secured borrowing arrangements due to declines in the perceived value of related collateralour making riskier loans and may reduce the number of counterparties willing to lend to us and/or the amounts individual counterparties are willing to lend, both ofother investments and which could materially and adversely impact our liquidity, financial condition and earnings.affect us.
Capstead financed its portfolio by pledging individual securities as collateral under uncommitted secured borrowing arrangements. If the perceived market value of the pledged collateral of the Capstead portfolio as determined by the lenders under these arrangements declines, we may be subjectOur Advisor is authorized to margin calls wherein the lender requires us to pledge additional collateral to reestablish the agreed-upon margin percentage. Because market illiquidity tends to put downward pressure on asset prices, we may be presentedfollow broad investment guidelines that provide it with substantial margin calls duringdiscretion regarding investment, financing, asset allocation and hedging decisions. Our board of directors will periodically review our investment guidelines and our portfolio but will not, and will not be required to, review and approve in advance all of our proposed loans and other investments or our Advisor’s financing, asset allocation or hedging decisions. In addition, in conducting periodic reviews, our directors may rely primarily on information provided, or recommendations made, to them by our Advisor or its affiliates. Subject to maintaining our REIT qualification and our exclusion or exemption from regulation under the Investment Company Act, our Advisor has significant latitude within the broad investment guidelines in determining the types of loans and other investments it makes for us, and how such periods. If weloans and other investments are unablefinanced or unwilling to pledge additional collateral, lenders can liquidate the collateral or seek other remedies, potentially under adverse market conditions, resulting in losses. At such times we may determine that it is prudent to sell assets to improve our ability to pledge sufficient collateral to support our remaining secured borrowings,hedged, which could result in losses. In addition, lower pricing levels for remaining investments will lead to declines in book value per common share.investment returns that are substantially below expectations or losses, which could materially and adversely affect us.
Our abilityAdvisor maintains a contractual as opposed to achievea fiduciary relationship with us. Our Advisor’s liability is limited under our Advisor Agreement, and we have agreed to indemnify our Advisor against certain liabilities.
Pursuant to our Advisory Agreement, our Advisor assumes no responsibility to us other than to render the services called for thereunder in good faith and will not be responsible for any action of our board of directors in following or declining to follow its advice or recommendations, including as set forth in our investment objectives depends onguidelines. Our Advisor maintains a contractual as opposed to a fiduciary relationship with us. Under the terms of our Advisory Agreement, our Advisor and its affiliates and the officers, directors, equity holders, members, partners, stockholders, other equity holders and employees of our Advisor, will not be liable to us, any subsidiary of ours, our board of directors, our stockholders or any of our subsidiaries’ stockholders, members or partners for acts or omissions performed in accordance with and pursuant to our Advisory Agreement, except by reason of fraud, misappropriation or embezzlement of funds of the Company or acts or omissions constituting bad faith, willful misfeasance, intentional misconduct, gross negligence or reckless disregard of their duties under our Advisory Agreement. We have agreed to indemnify our Advisor, its affiliates and the officers, directors, equity holders, members, partners, stockholders, other equity holders and employees of our Advisor and its affiliates from any and all liability, claims, damages or losses arising in the performance of their duties, and related expenses, including reasonable attorneys’ fees in respect of or arising from any acts or omissions of such party performed in good faith under our Advisory Agreement and not constituting bad faith, fraud, willful misfeasance, intentional misconduct, gross negligence or reckless disregard of duties of such party under our Advisory Agreement. As a result, we could experience poor performance or losses for which our Advisor would not be liable.
Termination of our Advisory Agreement would be difficult and costly.
The circumstances under which we can terminate our contract with the Advisor for cause are limited and do not include performance. Termination of our Advisory Agreement without cause would be difficult and costly. The Advisory Agreement may be terminated each year without cause upon the affirmative vote of at least two-thirds of our independent directors, based upon a determination that (i) our Advisor’s performance is unsatisfactory and materially detrimental to us or (ii) the base management fee and annual incentive fee payable to our Advisory are not fair (provided that in this instance, our Advisor will be afforded the opportunity to renegotiate the management fee and incentive fees prior to termination). We are required to provide our Advisor with 180 days prior notice of any such termination. Additionally, upon such a termination, or if we materially breach the Advisory Agreement and our Advisor terminates our Advisory Agreement, the Advisory Agreement provides that we will pay our Advisor a termination fee equal to three times the sum of the average annual base management fee and the average annual incentive fee paid or payable to the Advisor during the 24-month period immediately preceding the most recently completed calendar quarter prior to the termination. These provisions increase the cost to us of terminating the Advisory Agreement and adversely affect our ability to re-establishterminate our Advisor without cause.
Risks Related to Our Corporate Structure
The limit on the number of shares a person may own may discourage a takeover that could otherwise result in a premium price to our stockholders.
The Company's charter, with certain exceptions, authorizes the board of directors to take such actions as are necessary and desirable to preserve our qualification as a REIT. Unless exempted by the board of directors, no person or roll maturing secured borrowings on a continuous basis and noneentity may own more than 7.9% in value of the aggregate of our counterparties are obligated to enter into new borrowing transactions atoutstanding shares of stock or more than 7.9% (in value or in number of shares, whichever is more restrictive) of any class or series of shares of our stock determined after applying certain rules of attribution. This restriction may have the conclusioneffect of existing transactions. During periods of market illiquiditydelaying, deferring or due to perceived credit deterioration of the collateral pledged orpreventing a change in control of us, a lender may require that less favorable asset pricing procedures be employed, margin requirements be increased and/or may choose to limit or completely curtail lending to us. If a counterparty chooses not to roll a maturing borrowing, we must pay off the borrowing, generally with cash available from another secured borrowing arrangement entered into with another counterparty. If we determine that we do not have sufficient borrowing capacity with our remaining counterparties, we could be forced to sell assets under potentially adverse market conditions, which could result in losses. An industry-wide reduction in the availability of secured borrowings could adversely affect pricing levels for mortgage investments leading to declines in our liquidity and book value per common share. Under these conditions, we may determine that it is prudent to sell assets to improve our ability to pledge sufficient collateral to support our remaining borrowings, which could result in losses. In addition, lower pricing levels for remaining investments will lead to declines in book value per common share.
We incurred direct and indirect costsincluding an extraordinary transaction (such as a resultmerger, tender offer or sale of the merger with Capsteadall or substantially all our assets) that might provide a premium price for holders of our common stock.
We incurred substantial expensesCertain provisions of Maryland law could inhibit a change in connection with and as a resultcontrol of completing the merger with Capstead and expect to incur additional expenses in connection with integrating the acquired business. Factors beyond our control could affect the total amount or timing of these expenses, many of which, by their nature, are difficult to estimate accurately.
We have a significant amount of indebtedness and may need to incur more in the future.
We have substantial indebtedness following completion of the Merger. In addition, in connection with executing our business strategies following the Merger, we expect to evaluate the possibility of originating, funding, and acquiring additional commercial real estate debt and making other strategic investments, and we may elect to finance these endeavors by incurring additional indebtedness. The amount of such indebtedness could have material adverse consequences, including:
•hindering our ability to adjust to changing market, industry or economic conditions;
•limiting our ability to access the capital markets to raise additional equity or refinance maturing debt on favorable terms or to fund acquisitions or emerging businesses;
•limiting the amount of cash flow available for future operations, acquisitions, dividends, stock repurchases or other uses;
•making us more vulnerable to economic or industry downturns, including interest rate increases; and
•placing us at a competitive disadvantage compared to less leveraged competitors.
Moreover, we may be required to raise substantial additional capital to execute our business strategy. Our ability to arrange additional financing will depend on, among other factors, our financial position and performance, as well as prevailing market conditions and other factors beyond our control. If we are unable to obtain additional financing, our credit ratings could be further adversely affected, which could further raise our borrowing costs and further limit our future access to capital and our ability to satisfy our obligations under our indebtedness.Company.
Certain provisions of the Maryland General Corporation Law (“MGCL”) may have the effect of inhibiting a third party from making a proposal to acquire us or of impeding a change in control under circumstances that otherwise could provide the holders of shares of our common stock with the opportunity to realize a premium over the then-prevailing market price of such shares, including:
•“business combination” provisions that, subject to limitations, prohibit certain business combinations between us and an “interested stockholder” (defined generally as any person who beneficially owns 10% or more of our then outstanding voting power of our shares or an affiliate or associate of ours who, at any time within the two-year period prior to the date in question, was the beneficial owner of 10% or more of our then outstanding voting shares) or an affiliate thereof for five years after the most recent date on which the stockholder becomes an interested stockholder, and thereafter imposes special appraisal rights and special stockholder voting requirements on these combinations; and
•“control share” provisions that provide that “control shares” of our company (defined as shares which, when aggregated with other shares controlled by the stockholder, entitle the stockholder to exercise one of three increasing ranges of voting power in electing directors) acquired in a “control share acquisition” (defined as the direct or indirect acquisition of ownership or control of “control shares”) have no voting rights except to the extent approved by our stockholders by the affirmative vote of at least two-thirds of all the votes entitled to be cast on the matter, excluding all interested shares.
Pursuant to the MGCL, our board of directors has exempted any business combination involving our Advisor or any affiliate of our Advisor. Consequently, the five-year prohibition and the super-majority vote requirements will not apply to business combinations between us and our Advisor or any affiliate of our Advisor.
In addition, the Company's bylaws contain a provision exempting from the control share provisions any and all acquisitions of our stock by any person. There can be no assurance that this provision will not be amended or eliminated at any time in the future.
In addition, the “unsolicited takeover” provisions of Title 3, Subtitle 8 of the MGCL permit the Board, without shareholder approval and regardless of what is currently provided in the charter or bylaws, to implement certain takeover defenses, including adopting a classified board or increasing the vote required to remove a director. Such takeover defenses may have the effect of inhibiting a third-party from making an acquisition proposal for us or of delaying, deferring or preventing a change in control of us under the circumstances that otherwise could provide our common stockholders with the opportunity to realize a premium over the then-current market price.
Risks Related to Taxation
Our failure to qualify as a REIT could have significant adverse consequences to us and the value of our common stock.
We believe that we have qualified as a REIT for U.S. federal income tax purposes commencing with our taxable year ended December 31, 2013. We intend to continue to meet the requirements for qualification and taxation as a REIT, but we cannot assure stockholders that we qualify as a REIT. Qualification as a REIT involves the application of highly technical and complex Internal Revenue Code provisions for which only a limited number of judicial and administrative interpretations exist. Moreover, new tax legislation, administrative guidance or court decisions, in each instance potentially with retroactive effect, could make it more difficult or impossible for us to qualify as a REIT. Even an inadvertent or technical mistake could jeopardize our REIT status.
Our qualification as a REIT depends on our satisfaction of certain asset, income, organizational, distribution, stockholder ownership and other requirements on a continuing basis:
•Our compliance depends upon the characterization of our assets and income for REIT purposes, as well as the relative values of our assets, some of which are not susceptible to a precise determination and for which we typically do not obtain independent appraisals. Moreover, we invest in certain assets with respect to which the rules applicable to REITs may be particularly difficult to interpret or to apply, including the rules applicable to financing arrangements that are structured as sale and repurchase agreements; mezzanine loans; and investments in real estate mortgage loans that are acquired at a discount, subject to work-outs or modifications, or reasonably expected to be in default at the time of acquisition. If the IRSInternal Revenue Service ("IRS") challenged our treatment of investments for purposes of the REIT asset and income tests, and if such a challenge were sustained, we could fail to qualify as a REIT.
•The fact that we own direct or indirect interests in an entity that will elect to be taxed as a REIT under the U.S. federal income tax laws (a “Subsidiary REIT”), further complicates the application of the REIT requirements for us. The Subsidiary REIT is subject to the various REIT qualification requirements that are applicable to us and certain other requirements. If the Subsidiary REIT were to fail to qualify as a REIT, then (i) it would become subject to regular U.S. federal corporate income tax, (ii) our interest in such Subsidiary REIT would cease to be a qualifying asset for purposes of the REIT asset tests, and (iii) it is possible that we would fail certain of the REIT asset tests, in which event we also would fail to qualify as a REIT unless we could avail ourselves of relief provisions.
If we were to fail to qualify as a REIT in any taxable year and are unable to avail ourselves of certain savings provisions set forth in the Internal Revenue Code, we would be subject to U.S federal and applicable state and local income tax on our taxable income at regular corporate rates (including anyrates. In addition, we would possibly also be subject to certain taxes that are applicable alternative minimumto non-REIT corporations, including the nondeductible 1% excise tax (which alternative minimum tax has been repealed for tax years after 2017)).on certain stock repurchases. Losing our REIT status would reduce our net income available for investment or distribution to stockholders because of the additional tax liability. In addition, distributions to stockholders would no longer qualify for the dividends-paid deduction, and we would no longer be required to make distributions. If this occurs, we might be required to borrow or liquidate some investments in order to pay the applicable tax. We would not be able to elect to be taxed as a REIT for four years following the year we first failed to qualify unless the IRS were to grant us relief under certain statutory provisions.
The failure of a mezzanine loan to qualify as a real estate asset could adversely affect our ability to qualify as a REIT.
The Internal Revenue Service ("IRS")IRS has issued Revenue Procedure 2003-65, which provides a safe harbor pursuant to which a mezzanine loan, if it meets certain requirements, will be treated by the IRS as a real estate asset for purposes of the REIT asset tests, and interest derived from such loan will be treated as qualifying mortgage interest for purposes of the REIT 75% gross income test. Although the Revenue Procedure provides a safe harbor on which taxpayers may rely, it does not prescribe rules of substantive tax law. We may originate or acquire mezzanine loans that do not satisfy all of the requirements for reliance on the safe harbor set forth in the Revenue Procedure, in which case, there can be no assurance that the IRS will not challenge the tax treatment of such loans. If such a challenge were sustained, we could fail to qualify as a REIT.
Even if we qualify as a REIT, we may be subject to tax liabilities that reduce our cash flow for distribution to our stockholders.
Even if we qualify as a REIT, we may be subject to some U.S. federal, state and local taxes on our income or property. For example:
•In order to qualify as a REIT, we must distribute annually at least 90% of our "REIT taxable income" (determined before the deduction of dividends paid and excluding net capital gains) to our stockholders. To the extent that we satisfy the distribution requirement but distribute less than 100% of our REIT taxable income, we will be subject to U.S. federal corporate income tax on our undistributed income. These requirements could cause us to distribute amounts that otherwise would be spent on investments in real estate assets, and it is possible that we might be required to borrow funds or sell assets to fund these distributions.
•We will be subject to a 4% nondeductible excise tax on the amount, if any, by which distributions we pay in any calendar year are less than the sum of (i) 85% of our ordinary income, (ii) 95% of our capital gain net income and (iii) 100% of our undistributed income from prior years.
•If we have net income from the sale of foreclosure property that we hold primarily for sale to customers in the ordinary course of business or other non-qualifying income from foreclosure property, we must pay a tax on that income at the highest corporate income tax rate.
•If we sell an asset, other than a foreclosure property, that we hold primarily for sale to customers in the ordinary course of business, our gain would be subject to the 100% “prohibited transaction” tax. We might be subject to this tax if we were to dispose of or securitize loans in a manner that is treated as a sale of loans for U.S. federal income tax purposes that is subject to the prohibited transaction tax.
•Any TRStaxable REIT subsidiary (“TRS”) of ours will be subject to U.S. federal corporate income tax on its taxable income, and non-arm’s length transactions between us and any TRS could be subject to a 100% tax.
•We could, in certain circumstances, be required to pay an excise or penalty tax (which could be significant in amount) in order to utilize one or more relief provisions under the Internal Revenue Code to maintain our qualification as a REIT.
Any of these taxes would decrease cash available for distribution to our stockholders.
The failure of assets subject to repurchase agreements to qualify as real estate assets could adversely affect our ability to qualify as a REIT.
We are party to certain financing arrangements, and may in the future enter into additional financing arrangements, that are structured as sale and repurchase agreements pursuant to which we would nominally sell certain of our assets to a counterparty and simultaneously enter into an agreement to repurchase these assets at a later date in exchange for a purchase price. Economically, these agreements are financings which are secured by the assets sold pursuant thereto. We believe that we would be treated for REIT asset and income test purposes as the owner of the assets that are the subject of any such sale and repurchase agreement notwithstanding that such agreement may transfer record ownership of the assets to the counterparty during the term of the agreement. It is possible, however, that the IRS could assert that we did not own the assets during the term of the sale and repurchase agreement, in which case we could fail to qualify as a REIT.
The “taxable mortgage pool” rules may increase the taxes that we or our stockholders incur, and may limit the manner in which we effect future securitizations.
Securitizations in the form of bonds or notes secured principally by mortgage loans generally result in the creation of taxable mortgage pools (“TMPs”) for U.S. federal income tax purposes. The debt securities issued by TMPs are sometimes referred to as “collateralized mortgage obligations” (“CMOs”). We have issued CMOs through TMPs. Unless a TMP is wholly-owned by a REIT, it is subject to taxation as a corporation. However, so long as a REIT owns 100% of the equity interests in a TMP, the TMP will not be taxed as a corporation. Instead, certain categories of the REIT’s stockholders, such as foreign stockholders eligible for treaty or sovereign benefits, stockholders with net operating losses, and generally tax-exempt stockholders that are subject to unrelated business income tax, may be subject to taxation, or to increased taxes, on any portion, known as “excess inclusions”,inclusions,” of their dividend income from the REIT that is attributable to the TMP, but only to the extent that the REIT actually distributes “excess inclusions” to them. We intend not to distribute “excess inclusions”,inclusions,” but to pay the tax on “excess inclusions” ourselves. Notwithstanding our intention to try to avoid distributions to our stockholders of “excess inclusions”, it is possible that some portion of our dividends to our stockholders may be so characterized.
In order to better control, and to attempt to avoid, the distribution of “excess inclusions” to our stockholders, as of January 1, 2022, our TMPs are wholly-owned by a Subsidiary REIT. Our Subsidiary REIT is required to satisfy, on a stand-alone basis, the REIT asset, income, organizational, distribution, stockholder ownership and other requirements described above, and if it were to fail to qualify as a REIT, then (i) our Subsidiary REIT would face adverse tax consequences similar to those described above with respect to our qualification as a REIT and (ii) such failure could have an adverse effect on our ability to comply with the REIT income and asset tests and thus could impair our ability to qualify as a REIT unless we could avail ourselves of certain relief provisions. Because our TMPs must at all times be owned by a REIT, we are restricted from selling equity interests in them, or selling any notes or bonds issued by them that might be considered to be equity for tax purposes, to other investors if doing so would subject them to taxation. These restrictions limit the liquidity of our investment in our TMPs and may prevent us from incurring greater leverage on that investment in order to maximize our returns from it.
The prohibited transactions tax may limit our ability to engage in transactions, including certain methods of securitizing mortgage loans that would be treated as sales for U.S. federal income tax purposes.
A REIT’s net income from prohibited transactions is subject to a 100% tax. In general, prohibited transactions are sales or other dispositions of assets, other than foreclosure property, held primarily for sale to customers in the ordinary course of business. We might be subject to the prohibited transaction tax if we were to dispose of, modify or securitize loans in a manner that is treated as a sale of the loans for U.S. federal income tax purposes. Therefore, in order to avoid the prohibited transactions tax, we may choose not to engage in certain sales or modifications of loans at the REIT level and may limit the structures we utilize for our securitization transactions, even though the sales, modifications or structures might otherwise be beneficial to us. Additionally, we may be subject to the prohibited transaction tax upon a disposition of real property. Although a safe-harbor exception to prohibited transaction treatment is available, there can be no assurance that we can comply with the safe harbor or that we will avoid owning property that may be characterized as held primarily for sale to customers in the ordinary course of business.
It may be possible to reduce the impact of the prohibited transaction tax by conducting certain activities through a TRS. However, to the extent that we engage in such activities through a TRS, the income associated with such activities may be subject to U.S. federal corporate income tax.
Complying with REIT requirements may limit our ability to hedge effectively and may cause us to incur tax liabilities.
The REIT provisions of the Internal Revenue Code may limit our ability to effectively hedge our assets and operations. Under thesethe REIT provisions, any income that we generate from hedging transactions will be excluded from gross income for purposes of the REIT 75% and 95% gross income tests if the instrument hedges: (i) interest rate risk on liabilities incurred to carry or acquire real estate assets; or (ii) risk of currency fluctuations with respect to any item of income or gain that would be qualifying income under the REIT 75% or 95% gross income tests, and such instrument is properly identified under applicable U.S. Department of Treasury regulations ("Treasury Regulations"). Income from hedging transactions that do not meet these requirements will generally constitute non-qualifying income for purposes of both the REIT 75% and 95% gross income tests. As a result, we may have to limit our use of hedging techniques that might otherwise be advantageous, which could result in greater risks associated with interest rate or other changes than we would otherwise incur.
Liquidation of assets may jeopardize our REIT qualification.
To qualify as a REIT, we must comply with requirements regarding our assets and our sources of income. If we are compelled to liquidate our investments to repay obligations to our lenders, we may be unable to comply with these requirements, ultimately jeopardizing our qualification as a REIT, or we may be subject to a 100% prohibited transaction tax on any resultant gain if we sell assets that are treated as dealer property or inventory.
Modification of the terms of our debt investments and mortgage loans underlying our CMBS in conjunction with reductions in the value of the real property securing such loans could cause us to fail to qualify as a REIT.
Our debt and securities investments may be materially affected by a weakchanges in the real estate market and economy in general. As a result, many of the terms of our debt and the mortgage loans underlying our securities may be modified to avoid taking title to a property. Under the Internal Revenue Code, if the terms of a loan are modified in a manner constituting a "significant modification," such modification triggers a deemed exchange of the original loan for the modified loan. In general, under applicable Treasury Regulations if a loan is secured by real property and other property and the highest principal amount
of the loan outstanding during a taxable year exceeds the fair market value of the real property securing the loan determined as of the date we agreed to acquire the loan or the date we significantly modified the loan, a portion of the interest income from such loan will not be qualifying income for purposes of the REIT 75% gross income test, but will be qualifying income for purposes of the REIT 95% gross income test. Although the law is not entirely clear, a portion of the loan will likely be a non-qualifying asset for purposes of the REIT 75% asset test. The non-qualifying portion of such a loan would be subject to, among other requirements, the requirement that a REIT not hold securities possessing more than 10% of the total value of the outstanding securities of any one issuer ("10% Value Test").
IRS Revenue Procedure 2014-51 provides a safe harbor pursuant to which we will not be required to redetermine the fair market value of real property securing a loan for purposes of the gross income and asset tests discussed above in connection with a loan modification that is: (i) occasioned by a borrower default; or (ii) made at a time when we reasonably believe that the modification to the loan will substantially reduce a significant risk of default on the original loan. No assurance can be provided that all of our loan modifications have or will qualify for the safe harbor in Revenue Procedure 2014-51. To the extent we significantly modify loans in a manner that does not qualify for that safe harbor, we will be required to redetermine the value of the real property securing the loan at the time it was significantly modified. In determining the value of the real property securing such a loan, we generally will not obtain third-party appraisals, but rather will rely on internal valuations. No assurance can be provided that the IRS will not successfully challenge our internal valuations. If the terms of our debt investments and the mortgage loans underlying our CMBS are "significantly modified" in a manner that does not qualify for the safe harbor in Revenue Procedure 2014-51 and the fair market value of the real property securing such loans has decreased significantly, we could fail the REIT 75% gross income test, the 75% asset test and/or the 10% Value Test. Unless we qualified for relief under certain Internal Revenue Code cure provisions, such failures could cause us to fail to continue to qualify as a REIT.
Risks Related to an Investment in Franklin BSP Realty Trust, Inc.
Public health crises have, and may in the future, adversely impact our business and the business of many of our borrowers.
Public health crises could have repercussions across domestic and global economies and financial markets. For example, the COVID-19 pandemic resulted in many governmental authorities imposing significant restrictions on businesses and individuals that triggered economic consequences, including high unemployment, later, then high inflation, that resulted in challenging operating conditions for many businesses, particularly in the retail (including restaurants), office and hospitality sectors. These actions directly and indirectly adversely effected the financing markets as well and resulted in margin calls from our lenders, which we satisfied.
The extent to which pandemics and similar health crises impact our or our borrowers’ operations will depend on future developments which are highly uncertain and cannot be predicted with confidence, including the scope, severity and duration of the events, treatment developments and government responses to the events. The inability of our borrowers to meet their loan obligations and/or borrowers filing for bankruptcy protection as a result of these events would reduce our cash flows, which would impact our ability to pay dividends to our stockholders.
We may be unable to maintain or increase cash distributions over time, or may decide to reduce the amount of distributions for business reasons.
There are many factors that can affect the amount and timing of cash distributions to stockholders. The amount of cash available for distributions is affected by many factors, such as the cash provided by the Company's investments and obligations to repay indebtedness as well as many other variables. There is no assurance that the Company will be able to pay or maintain the current level of distributions or that distributions will increase over time. In certain prior periods, quarterly distributions have been in excess of our quarterly earnings. Distributions in excess of earnings will decrease the book value per share of common stock. The Company cannot give any assurance that returns from the investments will be sufficient to maintain or increase cash available for distributions to stockholders. Actual results may differ significantly from the assumptions used by the board of directors in establishing the distribution rate to stockholders. The Company may not have sufficient cash from operations to make a distribution required to qualify for or maintain our REIT status, which may materially adversely affect the value of our securities.
Our business could suffer in the event our Advisor or any other party that provides us with services essential to our operations experiences system failures or cyber-incidents or a deficiency in cybersecurity.
Despite system redundancy, the implementation of security measures and the existence of a disaster recovery plan for the internal information technology systems of our Advisor and other parties that provide us with services essential to our operations, these systems are vulnerable to damage from any number of sources, including computer viruses, unauthorized access, energy blackouts, natural disasters, terrorism, war and telecommunication failures. Any system failure or accident that causes interruptions in our operations could result in a material disruption to our business.
As reliance on technology in our industry has increased, so have the risks posed to the systems of our Advisor and other parties that provide us with services essential to our operations, both internal and outsourced. In addition, the risk of a cyber-
incident, including by computer hackers, foreign governments and cyber terrorists, has generally increased as the number, intensity and sophistication of attempted attacks and intrusions from around the world have increased. Even the most well protected information, networks, systems and facilities remain potentially vulnerable because the techniques used in such attempted attacks and intrusions evolve and generally are not recognized until launched against a target, and in some cases are designed not to be detected and, in fact, may not be detected.
The remediation costs and lost revenues experienced by a victim of a cyber-incident may be significant and significant resources may be required to repair system damage, protect against the threat of future security breaches or to alleviate problems, including reputational harm, loss of revenues and litigation, caused by any breaches.
Although the Advisor and other parties that provide us with services essential to our operations intend to continue to implement industry-standard security measures, there can be no assurance that those measures will be sufficient, and any material adverse effect experienced by the Advisor and other parties that provide us with services essential to our operations could, in turn, have an adverse impact on us.
Further information relating to cybersecurity risk management is discussed in Item 1C. "Cybersecurity" in this report.
We are subject to risks from natural disasters such as earthquakes and severe weather, including as the result of global climate changes, which may result in damage to the properties securing our loans.
Natural disasters and severe weather such as earthquakes, tornadoes, hurricanes or floods may result in significant damage to the properties securing our loans or in which we invest. In addition, our investments may be exposed to new or increased risks and liabilities associated with global climate change, such as increased frequency or intensity of adverse weather and natural disasters, which could negatively impact our and our borrowers’ businesses and the value of the properties securing our loans or in which we invest. The extent of our or our borrowers' casualty losses and loss in operating income in connection with such events is a function of the severity of the event and the total amount of exposure in the affected area. While the geographic distribution of our portfolio somewhat limits our physical climate risk, some physical risk is inherent in the properties of our borrowers, particularly in certain borrowers’ locations and in the unknown potential for extreme weather or other events that could occur related to climate change. We may be materially and adversely affected by our exposure to losses arising from natural disasters or severe weather, including those associated with global climate change.
In addition, global climate change concerns could result in additional legislation and regulatory requirements, including those associated with the transition to a low-carbon economy, which could increase expenses or otherwise adversely impact our business, results of operations and financial condition, or the business, results of operations and financial condition of our borrowers.
Item 1B. Unresolved Staff Comments.
None.
Item 1C. Cybersecurity.
Management and Board Oversight
Our Board oversees risk management for the Company including through its approval of the investment policy and other policies of the Company and its oversight of the Advisor.For certain risks, the Board has delegated oversight responsibilities to committees of the Board.For example, the Compensation Committee oversees and reports to the Board on the assessment and mitigation of risks associated with the Company’s and the Advisor’s compensation policies and practices, and the Nominating and Corporate Governance Committee assists our Board with assessing risks associated with conflicts of interest and with ESG matters.Cybersecurity risk management is integrated into this broader risk management framework.The Board has delegated to the Audit Committee oversight of management’s programs and policies to identify, assess, manage, mitigate and monitor significant business risks of the Company, including privacy, information technology and cybersecurity risks.
Information Technology and Cybersecurity Risks
We have no employees and rely on the Advisor, a wholly-owned subsidiary of Franklin Templeton, to manage our day-to-day operations pursuant to the Advisory Agreement.Therefore, we rely heavily on Franklin Templeton’s information systems and their program for defending against and responding to cybersecurity threats and incidents.Franklin Templeton maintains a robust cybersecurity defense program, including a dedicated cybersecurity team led by its Chief Security Officer (“CISO”).The CISO, who reports directly to the Franklin Templeton Executive Vice President, Chief Risk and Transformation Officer, has 28 years of experience in the information technology and cybersecurity field and has been at Franklin Templeton for 12 years. The CISO provides regular briefings for our senior management team on cybersecurity matters, including threats, events, and program enhancements.
In the event of an incident which jeopardizes the confidentiality, integrity, or availability of the information technology systems the Advisor uses to provide services to us pursuant to the Advisory Agreement, Franklin Templeton’s cybersecurity team utilizes a regularly updated cybersecurity incident response plan that was developed based on, and is periodically benchmarked to, applicable third-party cybersecurity standards and frameworks. Pursuant to that plan and its escalation protocols, designated personnel are responsible for assessing the severity of the incident and associated threat, containing the threat, remediating the threat, including recovery of data and access to systems, analyzing the reporting obligations associated with the incident, and performing post-incident analysis and program improvements.While the particular personnel assigned to an incident response team will depend on the particular facts and circumstances, the response team is led by the CISO or his delegee.In addition, the Audit Committee approved a Company policy that supplements the Franklin Templeton incident response plan with respect to cybersecurity incidents that have or are expected to impact the Company, including by impacting the Advisor’s ability to provide services to the Company pursuant to the Advisory Agreement.Pursuant to this policy the Advisor and Franklin Templeton are required to notify and brief Company senior management and the Audit Committee with respect to certain matters related to applicable cybersecurity incidents.The policy also designates responsibility to specified members of our senior management for Company disclosure determinations related to the incident.
The Audit Committee oversees, on behalf of the Board, the Company’s privacy, information technology and security and cybersecurity risk exposures, including (i) the potential impact of those exposures on the Company’s business, financial results, operations and reputation, (ii) the programs and steps implemented by management to monitor and mitigate any exposures, (iii) the Company’s information governance and information security policies and programs, and (iv) major legislative and regulatory developments that could materially impact the Company’s privacy, data security and cybersecurity risk exposure.Some members of the Audit Committee have completed certifications in cybersecurity, including one from the National Association of Corporate Directors (NACD) in Cyber-Risk Oversight.On a quarterly basis, the CISO or its delegee report to the Board or Audit Committee on information technology and cybersecurity matters, including a detailed threat assessment relating to information technology risks.
Processes for Assessing, Identifying and Managing Material Risks from Cybersecurity Threats
The Franklin Templeton cybersecurity program focuses on (1) preventing and preparing for cybersecurity incidents, (2) detecting and analyzing cybersecurity incidents, and (3) containing, eradicating, recovering from and reporting cybersecurity events.The Company has a policy that supplements the Franklin Templeton cybersecurity incident response plan and addresses reporting and disclosure considerations related to a cybersecurity incident.
Prevention and Preparation
Franklin Templeton undertakes regular internal and external security audits and vulnerability assessments to reduce the risk of a cybersecurity incident and they implement business continuity, contingency and recovery plans to mitigate the impact of an incident. As part of these efforts, Franklin Templeton periodically engages consultants (e.g., Cobalt, Crowdstrike and EY) to conduct external reviews of its vulnerabilities, including penetration testing and compromise assessments. Franklin Templeton employs best practice identity and access management including broad adoption of multifactor authentication, geo-location blocking, behavior analytics and controls aligned to a zero trust model.
Franklin Templeton and the Advisor recognize that threat actors frequently target employees to gain unauthorized access to information systems.Therefore, a key element of their prevention efforts is employee training on their data privacy and cyber security procedures. For example, all new hires receive mandatory privacy and information security training. In addition, current employees of the Advisor must complete mandatory annual cybersecurity and data trainings, which are supplemented by regular phishing and other cyber-related testing and trainings that we conduct throughout the year.
We recognize that third parties that provide information systems used by the Advisor to provide services to the Company can be subject to cybersecurity incidents that could impact the Company.To mitigate third party risk, Franklin Templeton maintains a vendor code of conduct, which is designed to require third party vendors to comply with our requirements for maintenance of passwords, as well as other confidentiality, security, and privacy procedures. Third-party IT vendors are also subject to additional diligence such as questionnaires and inquiries.
As discussed above, to support its preparedness Franklin Templeton has an incident response plan that it regularly updates.In addition, Franklin Templeton performs regularly scheduled tabletop exercises and periodic drills at least once a year to test its incident response procedures, identify improvement opportunities and exercise team preparedness.Franklin Templeton also maintains cybersecurity insurance providing coverage for certain costs related to security failures and specified cybersecurity-related incidents that interrupt our network or networks of our vendors, in all cases up to specified limits and subject to certain exclusions.
Detection and Analysis
Cybersecurity incidents may be detected through a variety of means, which may include, but are not limited to, automated event-detection notifications or similar technologies which are monitored by the Franklin Templeton cyber defense team, notifications from employees, borrowers or service providers, and notifications from third party information technology system providers.Franklin Templeton also has a comprehensive threat intelligence program that performs proactive analyses leveraging internal, government and third party provided intelligence to identify and mitigate risks to the firm.Once a potential cybersecurity incident is identified, including a third party cybersecurity event, the incident response team designated pursuant to the Franklin Templeton incident response plan follows the procedures set forth in the plan to investigate the potential incident, including determining the nature of the event (e.g. ransomware or personal data breach) and assessing the severity of the event and sensitivity of any compromised data.
Containment, Eradication, Recovery, and Reporting
In the event of a cybersecurity incident, the Franklin Templeton incident response team is initially focused on containing the cybersecurity incident as quickly as possible consistent with the procedures in the incident response plan.Containment procedures may include off-lining systems, including by disconnecting network cable, utilizing network-management tools to isolate the host, altering the DNS entry of impact hosts, and coordinating with service providers.
Once a cybersecurity incident is contained the focus shifts to remediation. Eradication and recovery activities depend on the nature of the cybersecurity incident and may include rebuilding systems and/or hosts, replacing compromised files with clean versions, validation of files or data that may have been affected, and increased network monitoring or logging to identify recurring attacks.
Franklin Templeton has relationships with a number of third party service providers to assist with cybersecurity containment andremediation efforts, including a forensic investigation firm, a ransomware recovery vendor, a communications firm, and various law firms.
Following the conclusion of an incident, the Franklin Templeton incident response team will generally reassess the effectiveness of the cybersecurity program and incident response plan, make adjustments as appropriate and report to our senior management and Audit Committee on these matters.
Cybersecurity Risks
As of December 31, 2023, we are not aware of any material cybersecurity incidents that impacted the Company in the last three years. We and our Advisor routinely face risks of potential incidents, whether through cyber-attacks or cyber intrusions over the Internet, ransomware and other forms of malware, computer viruses, attachment to emails, phishing attempts, extortion or other scams; however, we have been able to prevent or sufficiently mitigate harm from such risks. Although the Advisor and Franklin Templeton, on our behalf, make efforts to maintain the security and integrity of the information technology systems the Advisor uses on our behalf, these systems and the proprietary, confidential and personal information that resides on or is transmitted through them are subject to the risk of a security incident or disruption, and there can be no assurances regarding our security efforts and measures or those of our third party providers. See “Item 1A–Risk Factors–Our business could suffer in the event our Advisor or any other party that provides us with services essential to our operations experiences system failures or cyber-incidents or a deficiency in cybersecurity.”
Item 2. Properties.
Our headquarters are located in a leased space at 1345 Avenue of the Americas, Suite 32A, New York, New York 10105.
As discussedThe Company, through foreclosure, deed in more detail in Note 11lieu of foreclosure, or purchase, possesses certain real estate owned (REO) as long-lived assets held for investment or as long-lived assets held for sale. See "Note 2. Summary of Significant Accounting Policies" to our consolidated financial statements included in this Annual Report on Form 10-K wefor additional disclosures on the classification of these assets and an affiliate entered into"Note 5. Real Estate Owned" for a joint venture agreement and formed a joint venture entity to acquire a $139.5 million triple net lease industrial property in Jeffersonville, GA. We have a 79% interest insummary of the joint ventureCompany's real estate owned, held for investment assets as of December 31, 2023and consolidate it on our consolidated balance sheet..
Item 3. Legal Proceedings.
For a description of the Company’s legal proceedings, seePlease refer to “Litigation and Regulatory Matters” in “Note 10.10 - Commitments and Contingencies” to ourthe consolidated financial statements included in this report. The Company believes that these proceedings, individually or in the aggregate, will not have a material impact on the Company’s financial condition, operating results or cash flows.
Loan Fraud Lawsuit
The Company originated a loan in April 2022 secured by a portfolio of 24 properties net leased to Walgreens (the “Collateral Properties”). As described in more detail in Part I, Item 3, "Legal Proceedings" in the Company’s Annual Report on Form 10-K.10-K for the year ended December 31, 2022, due to the sponsor’s fraud and default under the loan the Company foreclosed on all of the Collateral Properties in 2022 and 2023. The Company is marketing the Collateral Properties for sale and is actively pursuing its civil remedies. Note that the collectability, if any, of legal judgments we have achieved to date and that we may achieve in the future is not currently determinable.
Item 4. Mine Safety Disclosures.
Not applicable.
PART II
Item 5. Market for Registrant's Common Equity, Related Stockholder Matters and Issuer Purchases of Equity Securities.
Market Information
Our common stock is listed on the New York Stock Exchange ("NYSE"), under the symbol "FBRT." On February 17, 2022,7, 2024, the last sales price for our common stock on the NYSE was $13.44$12.26 per share.
Holders
As of February 17, 2022,7, 2024, we had 16,4123,104 registered holders of our common stock. The 16,4123,104 holders of record include Cede & Co., which holds shares as nominee for The Depository Trust Company, which itself holds shares on behalf of the beneficial owners of our common stock. Such information was obtained through our registrar and transfer agent.
Dividends
The Company has elected to be taxed as a REIT under Sections 856 through 860 of the Internal Revenue Code commencing with the taxable year ended December 31, 2013. As a REIT, if the Company meets certain organizational and operational requirements and distributes at least 90% of its' "REIT taxable income" (determined before the deduction of dividends paid and excluding net capital gains) to the stockholders in a year, the Company will not be subject to U.S. federal income tax to the extent of the income that we distribute. Even if the Company qualifies for taxation as a REIT, the Company may be subject to certain state and local taxes on its' income and property and U.S. federal income and excise taxes on any undistributed income. Dividends are declared and paid at the discretion of our board of directors and depend on cash available for distribution, financial condition, our ability to maintain our qualification as a REIT, and such other factors that the board of directors may deem relevant. See Item 1A. "Risk Factors," and Item 7. "Management’s Discussion and Analysis of Financial Condition and Results of Operations," of this Annual Report on Form 10-K, for information regarding the sources of funds used for dividends and for a discussion of factors, if any, which may adversely affect our ability to pay dividends.
Stockholder ReturnStock Performance Graph
Our common stock began trading on the NYSE under the symbol “FBRT” as of October 19, 2021. The following graph is a comparison of the cumulative total stockholder return on shares of our common stock, the Standard & Poor's [1500]1500 (the "S&P 1500"), and the Bloomberg REITFTSE NAREIT Mortgage REITS Index (the "BBREMTG"FTSE Mortgage REIT Index"), a published industry index, from October 19, 2021 to December 31, 2021.2023. In prior years, the Company compared its stockholder return to the Bloomberg REIT Mortgage Index (the "Bloomberg Mortgage Index"), a published industry index, but has decided to discontinue the use of the Bloomberg Mortgage Index as a comparison tool as Bloomberg has announced that the Bloomberg Mortgage Index should no longer be used for financial benchmarking purposes. The FTSE Mortgage REIT Index is comprised of companies that are similar to us in size with large market capitalizations and is historically comparable to the Bloomberg Mortgage Index. The graph assumes that $100 was invested on October 19, 2021 in our common stock, the S&P 1500 and the BBREMTGFTSE Mortgage REIT Index and that all dividends were reinvested without the payment of any commissions. The graph also includes a comparison against the Bloomberg Mortgage Index for reference. There can be no assurance that the performance of our shares will continue in line with the same or similar trends depicted in the graph below.
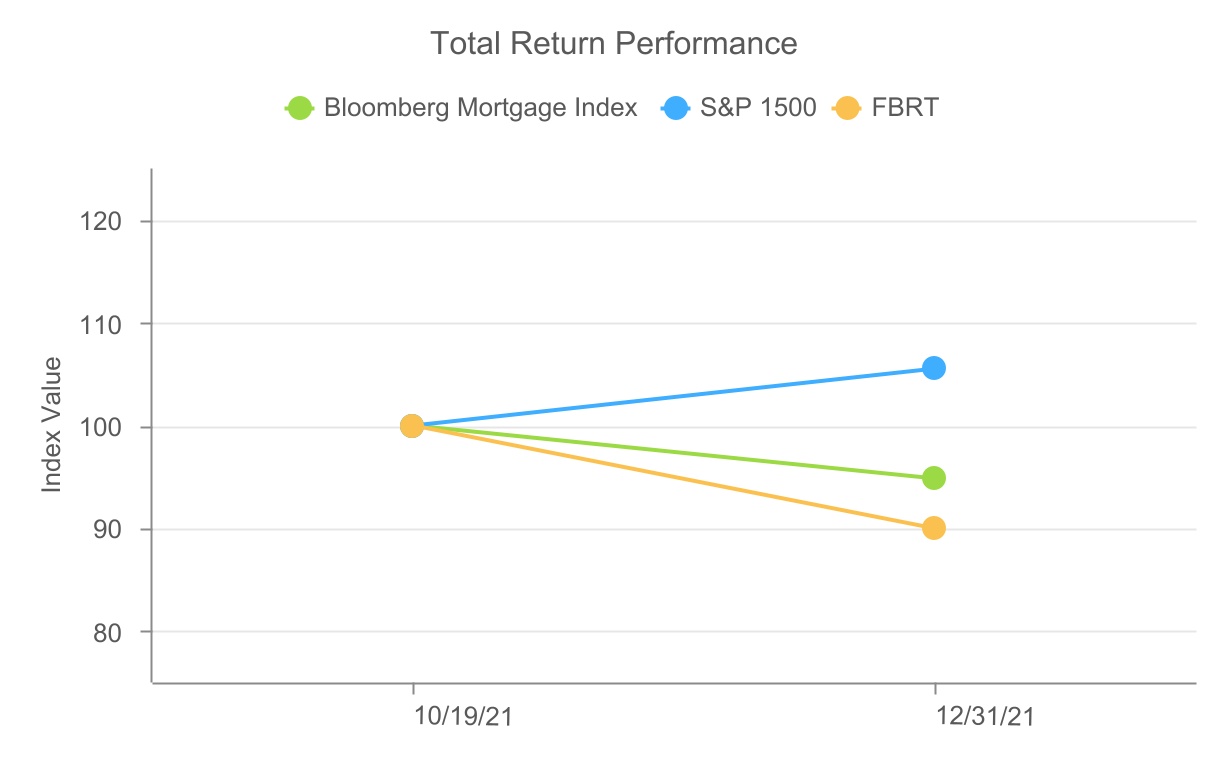
| | | | | | | | |
| Period Ending |
| Index | 10/19/2021 | 12/31/2021 |
| FBRT | $ | 100.00 | | $ | 89.91 | |
| Bloomberg Mortgage Index | $ | 100.00 | | $ | 94.80 | |
| S&P 1500 | $ | 100.00 | | $ | 105.52 | |

| | | | | | | | | | | | | | | | | | | | | | | | | | |
| | Period Ending |
| Index | | 10/19/2021 | | 12/31/2021 | | 12/31/2022 | | 12/31/2023 |
| FBRT | | $ | 100.00 | | | $ | 89.91 | | | $ | 85.93 | | | $ | 100.10 | |
| FTSE Mortgage REIT Index | | $ | 100.00 | | | $ | 94.70 | | | $ | 69.74 | | | $ | 80.34 | |
| S&P 1500 | | $ | 100.00 | | | $ | 105.52 | | | $ | 85.11 | | | $ | 108.79 | |
| Bloomberg Mortgage Index | | $ | 100.00 | | | $ | 94.80 | | | $ | 71.69 | | | $ | 82.07 | |
Purchases of Equity Securities by the Issuer and Affiliated Purchasers
The Company and its affiliates did not purchase any shares of the Company’s common stock during the three months ended December 31, 2021.
The Company’s board of directors has authorized a $65 million share repurchase program that will become operative following the conclusion of the $35 million open market share purchase program the Advisor agreed to implement in connection with the Capstead acquisition. The Company’s share repurchase program authorizespermits share repurchases at prices below the most recently reported book value per share as determined in accordance with GAAP. Purchases made under the Company’s program may be made through open market, block, and privately negotiated transactions, including Rule 10b5-1 plans, as permitted by securities laws and other legal requirements. The timing, manner, price and amount of any purchases by the Company and the Advisor will beare determined by the respective teams responsible at the Company and the Advisor, as applicable, in theirits reasonable business judgment and consistent with the exercise of theirits legal duties and will beare subject to economic and market conditions, stock price, applicable legal requirements and other factors. The CompanyCompany's share repurchase program does not obligate the Company to acquire any particular amount of common stock. The Company’s and the Advisor’s share purchase programs will remain openrepurchase program has been extended until at least November 2022December 31, 2024, or until the capital committed to the applicable repurchase program has been exhausted, whichever is sooner. Repurchases under the Company’s share repurchase program may be suspended from time to time at the Company’s discretion without prior notice.
The following table sets forth purchases of the Company's common stock under the share repurchase program for the three months ended December 31, 2023 (in thousands, except share and per share amounts):
| | | | | | | | | | | | | | | | | | | | | | | |
| Total number of shares purchased | | Average price paid per share (1) | | Total number of shares purchased as part of publicly announced plans or programs (2) | | Approximate dollar value of shares that may yet be purchased under the plans or programs (2) |
| | | | | | | |
| | | | | | | |
| | | | | | | |
| | | | | | | |
| | | | | | | |
| | | | | | | |
| | | | | | | |
| | | | | | | |
| | | | | | | |
| October 1, 2023 - October 31, 2023 | 251,397 | | | $ | 12.46 | | | 251,397 | | | 36,128 | |
| November 1, 2023 - November 30, 2023 | 16,571 | | | 12.69 | | | 16,571 | | | 35,917 | |
| December 1, 2023 - December 31, 2023 | — | | | — | | | — | | | 35,917 | |
| Total | 267,968 | | | $ | 12.47 | | | 267,968 | | | $ | 35,917 | |
_______________________(1) The average price paid per share represents the average purchase price per share, inclusive of any broker’s fees or commissions.
(2) All of the purchases listed in the table above were made in the open market under the Company's share purchase program announced on July 26, 2021, including under a Rule 10b5-1 plan adopted by the Company.
Subsequent to December 31, 2023, the Company repurchased 56,323 shares of common stock at a weighted average cost of$12.52 per share. As of February 7, 2024, $35.2 million remains available under the Company’s share repurchase program.
The information required by Item 5 with respect to securities authorized for issuance under equity compensation plans is incorporated herein by reference to Part III, Item 12 of this Form 10-K.
Item 6. Selected Financial Data.
Intentionally Omitted.[Reserved]
Item 7. Management's Discussion and Analysis of Financial Condition and Results of Operations
The following discussion and analysis should be read in conjunction with the accompanying financial statements of Franklin BSP Realty Trust, Inc. the notes thereto and other financial information included elsewhere in this Annual Report on Form 10-K.
As used herein, the terms "the Company," "we," "our" and "us" refer to Franklin BSP Realty Trust, Inc., a Maryland corporation and, as required by context, to Benefit Street Partners Realty Operating Partnership, L.P., a Delaware limited partnership, which we refer to as the "OP," and to its subsidiaries. We are externally managed by Benefit Street Partners L.L.C. (our "Advisor").
This discussion contains forward-looking statements reflecting the Company’s current expectations, estimates and assumptions concerning events and financial trends that may affect our future operating results or financial position. Actual results and timing of events may differ materially from those contained in these forward-looking statements due to a number of factors, including those discussed in the sections of this Annual Report on Form 10-K entitled “Risk Factors” and “Forward-Looking Statements.”
Overview
The Company is a Maryland corporation and has made tax elections to be treated as a REITreal estate investment trust ("REIT") for U.S. federal income tax purposes since 2013. The Company, through one or more subsidiaries which are each treated as a TRS,taxable REIT subsidiary ("TRS"), is indirectly subject to U.S. federal, state and local income taxes. We commenced business in May 2013. We primarily originate, acquire and manage a diversified portfolio of commercial real estate debt investments secured by properties located within and outside of the United States. Commercial real estate debt investments may include first mortgage loans, subordinated mortgage loans, mezzanine loans and participations in such loans. Substantially all of our business is conducted through the OP, a Delaware limited partnership. We are the sole general partner and directly or indirectly hold all of the units of limited partner interests in the OP.
The Company has no employees. We are managed by our Advisor pursuant to an Advisory Agreement as amended on August 18, 2021 (the "Advisory Agreement"). Our Advisor manages our affairs on a day-to-day basis. The Advisor receives compensation and fees for services related to the investment and management of our assets and our operations.
The Advisor, an SEC-registered investment adviser, is a credit-focused alternative asset management firm. The Advisor manages funds for institutions and high-net-worth investors across various credit funds and complementary strategies including high yield, levered loans, private / opportunistic debt, liquid credit, structured credit and commercial real estate debt. These strategies complement each other as they all leverage the sourcing, analytical, compliance, and operational capabilities that encompass the Advisor’s robust platform. On February 1, 2019,The Advisor is a wholly-owned subsidiary of Franklin Resources, Inc. and Templeton International, Inc. (collectively, “Franklin Templeton”) acquired the Advisor,, which event did not impact the terms of the Advisory Agreement or result in any changes to the executive officers of the Company.together with its various subsidiaries operates as "Franklin Templeton".
The Company invests in commercial real estate debt investments, which may include first mortgage loans, subordinated mortgage loans, mezzanine loans and participations in such loans. The Company also originates conduit loans which the Company intends to sell through its TRS into CMBScommercial mortgage-backed securities ("CMBS") securitization transactions at a profit. The Company also owns real estate which it acquires through foreclosure and deed in lieu of foreclosure, and which it purchases for investment, typically subject to triple net leases.
The Company also invests intransactions. Historically this business has focused primarily on CMBS, commercial real estate collateralized loan obligation bonds ("CRE CLO bonds"), collateralized debt obligations ("CDOs") and other securities. Real estate securities may include CMBS, senior unsecured debt of publicly traded REITs, debt or equity securities of other publicly traded real estate companies, RMBS and CDOs. The Company also owns real estate acquired by the Company through foreclosure and deed in lieu of foreclosure, and purchased for investment, typically subject to triple net leases.
ImpactAs a result of the Capstead Acquisition
As further described in Note 18 - Merger with Capstead, on October 19, 2021 the Company completed a merger withacquisition of Capstead Mortgage Corporation (“Capstead”("Capstead") pursuant to which Capstead merged into a wholly-owned subsidiary of, the Company and the Company’s common stock commenced trading on the NYSE under the ticker “FBRT”. The Capstead assets acquired a portfolio of residential mortgage backed securities (“RMBS”) in the merger consist primarilyform of cash and residential adjustable-rate mortgage pass-through securities ("ARM Agency Securities" or "ARMs") issued and guaranteed by government-sponsored enterprises or by an agency of the federal government ("government. As of December 31, 2023, the Company has fully disposed of all of its ARM Agency Securities"). The Company intendsSecurities and is continuing to reinvest the cash and proceeds from dividends, interest, repayments and salesthe sale of these securities in its other businesses. The Company also owns real estate that was either acquired by the assets acquiredCompany through foreclosure or deed in the merger into its ownlieu of foreclosure, or that was purchased for investment, strategies.primarily subject to triple net leases.
The Capstead acquisition resulted in the following material impacts on our financial results for the year and quarter ended December 31, 2021:
•Impairment of acquired assets: Pursuant to Accounting Standards Codification Topic 805, “Business Combinations,” the Company accounted for the transaction as an asset acquisition since substantially all of the fair value of the gross assets acquired was concentrated in a group of similar identifiable assets, a portfolio of agency mortgage-backed securities. The Company measured the cost of the net identifiable assets acquired on the basis of the fair value of the consideration given, inclusive of transaction costs, which was determined to be more reliably measurable. As the cost of the acquisition exceeded the fair value of the net identifiable assets acquired, the Company allocated the difference on the basis of relative fair values to certain assets which were not carried at fair value. The amount of excess consideration, including the Company's transaction costs, was capitalized on the balance sheet as a long-lived asset at the time of acquisition. In the fourth quarter of 2021, the Company concluded the long-lived asset had no potential value to the generation of future cash flows and fully impaired the asset, recognizing an expense totaling $88.3 million in the consolidated statements of operations .
•Trading losses: Since the Company does not intend to hold the ARM Agency Securities acquired in the Capstead merger for long-term investment, the assets are treated as “classified as trading” for accounting purposes. As a result, these assets are recorded at fair value on the balance sheet with trading gains and losses on the paydowns and sales of these securities recorded in the Company's consolidated statements of operations. For the quarter ended December 31, 2021, the Company recognized a trading loss of $34.8 million related to these assets.
As long as the Company holds a significant amount of the ARM Agency Securities acquired in the Capstead merger, the Company’s future results of operations will continue to be impacted by trading gains and losses related to this portfolio, and such impacts could be adverse and material. As of December 31, 2021, the value of the Company’s ARM Agency Securities portfolio was $4.6 billion. As of February 18, 2022, the value of the Company's ARM Agency Securities portfolio was $2.4 billion. The reduction in the value of the ARM Agency Securities portfolio from January 1, 2022 to February 18, 2022 is due in part to (i) $265 million of principal payments and (ii) $1.8 billion of sales. From January 1, 2022 to February 18, 2022, the Company experienced losses of $38 million related to the ARM Agency Securities portfolio as a result of net trading losses totaling $59.5 million related to principal paydowns, changes in market price and losses on sales of securities, net of portfolio-related derivative gains of $21.5 million.
Book Value Per Share
The following table calculates ourthe Company's book value per share as of December 31, 2021 ($ in2023 and 2022 (in thousands, except share and per share data)amounts):
| | December 31, 2021 | | December 31, 2020 |
| | December 31, 2023 | | | | December 31, 2023 | | December 31, 2022 |
| Stockholders' equity applicable to common stock | Stockholders' equity applicable to common stock | | $ | 736,464 | | | $ | 798,444 | |
| Shares | |
| Shares: | |
| Common stock | Common stock | | 43,951,382 | | | 44,494,496 | |
| Restricted stock | | 14,546 | | | 15,555 | |
| Total outstanding | | 43,965,928 | | | 44,510,051 | |
| Common stock | |
| Common stock | |
| Restricted stock and restricted stock units | |
| Total outstanding shares | |
| Book value per share | Book value per share | | $ | 16.75 | | | $ | 17.94 | |
The following table calculates ourthe Company's fully-converted book value per share as of December 31, 2021 ($ in2023 and 2022 (in thousands, except share and per share data)amounts):
| | | | | | | | | | | | | | |
| | December 31, 2021 | | December 31, 2020 |
| Stockholders' equity applicable to convertible common stock | | $ | 1,543,550 | | | $ | 1,007,698 | |
| Shares | | | | |
| Common stock | | 43,951,382 | | | 44,494,496 | |
| Restricted stock | | 14,546 | | | 15,555 | |
| Series A convertible preferred stock | | — | | | 12,122,088 | |
| Series C convertible preferred stock | | 418,880 | | | 418,880 | |
| Series D convertible preferred stock | | 5,370,640 | | | — | |
| Series F convertible preferred stock | | 39,733,299 | | | — | |
| Total outstanding | | 89,488,747 | | | 57,051,019 | |
| Fully-converted book value per share | | $ | 17.25 | | | $ | 17.66 | |
| | | | | | | | | | | | | | |
| | December 31, 2023 | | December 31, 2022 |
| Stockholders' equity applicable to convertible common stock | | $ | 1,390,120 | | | $ | 1,398,986 | |
| Shares: | | | | |
| Common stock | | 81,942,656 | | | 82,479,743 | |
| Restricted stock and restricted stock units | | 809,257 | | | 513,041 | |
| Series H convertible preferred stock | | 5,370,498 | | | 5,370,640 | |
| Series I convertible preferred stock | | — | | | 299,200 | |
| Total outstanding shares | | 88,122,411 | | | 88,662,624 | |
Fully-converted book value per share (1) (2) | | $ | 15.77 | | | $ | 15.78 | |
________________________(1) Fully-converted book value per share reflects full conversion of our outstanding series of convertible preferred stock and vesting of our outstanding equity compensation awards.
Table(2) Excluding the amounts for accumulated depreciation and amortization of Contentsreal property of $9.4 million and $5.2 million as of December 31, 2023 and 2022, respectively, would result in a fully-converted book value per share of $15.88 and $15.84 as of December 31, 2023 and 2022, respectively.Critical Accounting Estimates
Our financial statements are prepared in conformity with accounting principles generally accepted in the United States of America ("GAAP"), which requires us to make estimates and assumptions that affect the reported amounts of assets and liabilities at the date of the financial statements and the reported amounts of revenues and expenses during the reporting periods. Critical accounting estimates are those that require the application of management’s most difficult, subjective or complex judgments on matters that are inherently uncertain and that may change in subsequent periods. In preparing the financial statements, management has made estimates and assumptions that affect the reported amounts of assets and liabilities at the date of the financial statements and the reported amounts of revenues and expenses during the reporting periods. In preparing the financial statements, management has utilized available information, including our past history, industry standards and the current economic environment, among other factors, in forming its estimates and judgments, giving due consideration to materiality. Actual results may differ from these estimates. In addition, other companies may utilize different estimates, which may impact the comparability of our results of operations to those of companies in similar businesses.
Set forth below is a summary of the critical accounting estimates and critical accounting policies that management believes are important to the preparation of our financial statements.statements and require complex management judgment. The Company’s significant accounting policies, including recently issued accounting pronouncements, are more fully described in Note 2 – Summary of Critical Accounting Policies to the accompanying consolidated financial statements included in this Annual Report on Form 10-K.
Credit Losses - Estimating Credit Losses
General allowance for credit losses
The general allowance for credit losses for the Company’s financial instruments carried at amortized cost and off-balance sheet credit exposures, such as loans held for investment and unfunded loan commitments represents a lifetime estimate of expected credit losses. Factors considered by the Company when determining the general allowance for credit losses reserve include loan-specific characteristics such as loan-to-value (“LTV”) ratio, vintage year, loan term, property type, occupancy and geographic location, financial performance of the borrower, expected payments of principal and interest, as well as internal or external information relating to past events, current conditions and forward looking information through the use of projected macroeconomic scenarios over the reasonable and supportable forecasts.
The general allowance for credit losses is measured on a collective (pool) basis when similar risk characteristics exist for multiple financial instruments. If similar risk characteristics do not exist, the Company measures the general allowance for credit losses on an individual instrument basis. The determination of whether a particular financial instrument should be included in a pool can change over time. If a financial asset’s risk characteristics change, the Company evaluates whether it is appropriate to continue to keep the financial instrument in its existing pool or evaluate it individually.
In measuring the general allowance for credit losses for financial instruments including oursuch as loans held for investment and unfunded loan commitments that share similar risk characteristics, the Company primarily applies a probability of default (“PD”)/loss given default (“LGD”) model for instruments that are collectively assessed, whereby the allowanceprovision for credit losses is calculated as the product of PD, LGD and exposure at default (“EAD”). The Company’s model to determine the general allowance for credit losses principally utilizes historical loss rates derived from a commercial mortgage backed securities database with historical losses from 19982002 to 20202021 provided by a reputable third party, forecasting the loss parameters based on a projected macroeconomic scenario using a scenario-basedprobability-based statistical approach over a reasonable and supportable forecast period of twelve months, followed by an immediate reversion to average historical losses. For financial instruments assessed on an individual basis, including when it is probable that the Company will be unable to collect the full payment of principal and interest on the instrument, the Company applies a discounted cash flow (“DCF”) methodology.
Specific Allowance for credit losses
For financial instruments where the borrower is experiencing financial difficulty based on the Company’s assessment at the reporting date and the repayment is expected to be provided substantially through the operation or sale of the collateral, the Company may elect to use as a practical expedient the fair value of the collateral at the reporting date when determining the specific allowance for credit losses.
For loans held for investment which the Company identifies reasonable doubt as to whether the collection of contractual components can be satisfied, a loan specific allowance for credit losses analysis is performed. Determining whether a specific allowance for credit losses for a loan is required entails significant judgment from management and is based on several factors including (i) the underlying collateral performance, (ii) discussions with the borrower, (iii) borrower events of default, and (iv) other facts that impact the borrower’s ability to pay the contractual amounts due under the terms of the loan. If a loan is determined to have a specific allowance for credit losses, the specific allowance for credit losses is recorded as a component of our Current Expected Credit Loss ("CECL") reserve by applying the practical expedient for collateral dependent loans. The CECL reserve is assessed on an individual basis for such loans by comparing the estimated fair value of the underlying collateral, less costs to sell, to the book value of the respective loan. The estimated fair value of underlying collateral requires judgments, which include assumptions regarding capitalization rates, discount rates, leasing, creditworthiness of major tenants, occupancy rates, availability and cost of financing, exit plans, loan sponsorship, actions of other lenders, and other factors deemed relevant by the Company. Actual losses, if any, could ultimately differ materially from these estimates. The Company only expects to write-off specific provisions if and when such amounts are deemed non-recoverable. Non-recoverability is generally determined at the time a loan is settled, or in the case of foreclosure, when the underlying asset is sold. Non-recoverability may also be concluded if, in the Company's determination, it is deemed certain that all amounts due will not be collected. If a loan is determined to be impaired based on the above considerations, management records a write-off through a charge to the allowance for credit losses and the respective loan balance.
Risk Rating
In developing the allowanceprovision for credit losses for its loans held for investment, the Company performs a comprehensive analysis of its loan portfolio and assigns risk ratings to loans that incorporate management's current judgments about their credit quality based on all known and relevant internal and external factors that may affect collectability, using similar factors as those in developing the allowanceprovision for credit losses. This methodology results in loans being segmented by risk classification into risk rating categories that are associated with estimated probabilities of default and principal loss. Risk rating categories range from "1" to "5" with "1" representing the lowest risk of loss and "5" representing the highest risk of loss with the ratings updated quarterly.
Loans are placed on nonaccrual status and considered non-performing when full payment of principal and interest is unpaid for 90 days or more or where reasonable doubt exists as to timely collection, unless the loan is both well secured and in the process of collection. Interest received on nonaccrual status loans are accounted for under the cost-recovery method, until qualifying for return to accrual. The cost recovery method will no longer apply if collection of all principal and interest is reasonably assured. A loan may be placed back on accrual status if we determine it is probable that we will collect all payments which are contractually due.
The Company designates loans as non-performing when (i) full payment of principal and coupon interest components become 90-days past due ("non-accrual status"); or (ii) the Company has reasonable doubt as to whether the collection of contractual components can be satisfied ("cost recovery status"). When a loan is designated as non-performing and placed on non-accrual status, interest is only recognized as income when payment has been received. Loans designated as non-performing and placed on non-accrual status are removed from their non-performing designation when collection of principal and coupon interest components have been satisfied. When a loan is designated as non-performing and placed on cost recovery status, the cost-recovery method is applied to which receipt of principal or coupon interest is recorded as a reduction to the amortized cost until collection of all contractual components are reasonably assured.
Real Estate Owned - Estimating Fair Value and Holding Period
Real estate owned assets, held for investment are carried at their estimated fair value at acquisition and presented net of accumulated depreciation and impairment charges. The Company allocates the purchase price of acquired real estate assets based on the fair value of the acquired land, building, furniture, fixtures and equipment.
Real estate owned assets, held for investment are depreciated using the straight-line method over estimated useful lives of up to 40 years for buildings and improvements and up to 15 years for furniture, fixtures and equipment. Renovations and/or replacements that improve or extend the life of the real estate owned assets are capitalized and depreciated over their estimated useful lives. Real estate owned revenue is recognized when the Company satisfies a performance obligation by transferring a promised good or service to a customer. The Company is considered to have satisfied all performance obligation at a point in time.
Real estate owned assets that are probable to be sold within one year are reported as held for sale. Real estate owned assets classified as held for sale are measured at the lower of its carrying amountvalue or estimated fair value less cost to sell. Real estate owned assets are not depreciated or amortized while classified as held for sale. Interest and other expenses attributable to the liabilities of a disposal group classified as held for sale continue to be accrued. Upon the disposition of a real estate owned asset, the Company calculates realized gains and losses as net proceeds received less the carrying value of the real estate owned asset. Net proceeds received are net of direct selling costs associated with the disposition of the real estate owned asset.
Real Estate Securities - Estimating Fair Value
On the acquisition date, all of our commercial real estate securities will be classified as available for sale ("AFS") and will be carried at fair value, with any unrealized gains or losses reported as a component of accumulated other comprehensive income or loss. However, we may elect to transfer these assets to trading securities, and as a result, any unrealized gains or losses on such real estate securities will be recorded as unrealized gains or losses on investments in ourthe consolidated statements of operations. Related discounts, premiums, and acquisition expenses on investments are amortized over the life of the investment using the effective interest method. Amortization is reflected as an adjustment to interestInterest income in the consolidated statements of operations.
Credit Impairment Analysis of Real Estate Securities
Commercial realReal estate securities for which the fair value option has not been elected will be periodically evaluated for credit impairment. AFS real estate securities which have experienced a decline in the fair value below their amortized cost basis (i.e., impairment) are evaluated each reporting period to determine whether the decline in fair value is due to credit-related factors. Any impairment that is not credit-related is recognized in other comprehensive income, while credit-related impairment is recognized as an allowance onin the consolidated balance sheets with a corresponding adjustment onin the consolidated statements of operations. If the Company intends to sell an impaired real estate security or more likely than not will be required to sell such a security before recovering its amortized cost basis, the entire impairment amount is recognized in the consolidated statements of operations with a corresponding adjustment to the security’s amortized cost basis.
The Company analyzes the AFS security portfolio on a periodic basis for credit losses at the individual security level using the same criteria described above for those amortized cost financial assets subject to an allowance for credit losses including but not limited to; performance of the underlying assets in the security, borrower financial resources and investment in collateral, collateral type, credit ratings, project economics and geographic location as well as national and regional economic factors.
The non-credit loss component of the unrealized loss within the Company’s AFS portfolio is recognized as an adjustment to the individual security’s asset balance with an offsetting entry to Accumulated other comprehensive incomeincome/(loss) in the consolidated balance sheets.
Commercial realReal estate securities for which the fair value option has been elected are not evaluated for other-than-temporary impairment as changes in fair value are recorded in ourthe consolidated statement of operations.
Real Estate Securities - Classified As Trading - Estimating Fair Value
In the merger with Capstead, we acquired a portfolio of ARM Agency Securities classified as trading and recorded at fair value on the balance sheet with trading gains and losses on the paydowns and sales of these securities recorded in the Company's consolidated statements of operations. Fair values fluctuate with current and projected changes in interest rates, prepayment expectations and other factors such as market liquidity conditions and the perceived credit quality of agency securities. Judgment is required to interpret market data and develop estimated fair values, particularly in circumstances of deteriorating credit quality and market liquidity.
Results of Operations
Comparison of the Year Ended December 31, 20212023 to the Year Ended December 31, 20202022
The Company conducts its business through the following segments:
•The real estate debt business focuses on originating, acquiring and asset managing commercial real estate debt investments, including first mortgages, subordinate mortgages, mezzanine loans and participations in such loans.
•The real estate securities business focuses on investing in and asset managing real estate securities. Historically this business has focused primarily on CMBS, unsecured REIT debt,CRE CLO bonds, CDO notes, and other securities. As a result of the October 2021 acquisition of Capstead, the Company acquired and continues to hold a significant portfolio of Residential Mortgage Backed Securities (“RMBS”) in the form of the ARM Agency Securities. The Company intends to reinvestportfolio was completely divested by the cash and proceeds from dividends, interest, repayments and salesthird quarter of these assets into its other segments and does not intend to continue to invest in ARM Agency Securities or RMBS in general. As of December 31, 2021, all of the real estate securities in this segment were ARM Agency Securities acquired in the Capstead acquisition.2023.
•The commercial real estate conduit business operated through the Company's TRS, which is focused on generating superior risk-adjusted returns by originating and subsequently selling fixed-rate commercial real estate loans into the CMBS securitization market at a profit. The TRS may also hold certain mezzanine loans that don't qualify as good REIT assets due to any potential loss from foreclosure.
•The real estate owned business represents real estate acquired by the Company through foreclosure, deed in lieu of foreclosure, or purchase.
In addition, as described above in “Impact of the Capstead Acquisition”, the Company's results of operations were materially impacted by the asset impairment related to the Capstead merger and trading losses and decreases in the values of the assets acquired in the transaction from acquisition date to December 31, 2021.
Net Interest Income
Net interest income is generated on our interest-earning assets less related interest-bearing liabilities and is recorded as part of our real estate debt, real estate securities and TRS segments.
The following table presents the average balance of interest-earning assets less related interest-bearing liabilities, associated interest income and expense and corresponding yield earned and incurred for the years ended December 31, 20212023 and 20202022 (dollars in thousands): | | Year Ended December 31, |
| 2021 | | 2020 |
| Average Carrying Value (1) | | Interest Income / Expense (2) | | WA Yield / Financing Cost (3) | | Average Carrying Value (1) | | Interest Income / Expense (2) | | WA Yield / Financing Cost (3) |
| | Year Ended December 31, | | | | Year Ended December 31, |
| | 2023 | | | | 2023 | | 2022 |
| | Average Carrying Value (1) | | | | Average Carrying Value (1) | | Interest Income/Expense (2)(3) | | Avg Yield/Financing Cost (4) | | Average Carrying Value (1) | | Interest Income/Expense (2) | | Avg Yield/Financing Cost (4) |
| Interest-earning assets: | Interest-earning assets: | | | | | | | | | | | | |
| Real estate debt | | $ | 3,156,492 | | $ | 189,090 | | | 6.0 | % | | $ | 2,606,081 | | $ | 165,907 | | | 6.4 | % |
Real estate debt (5) | |
Real estate debt (5) | |
Real estate debt (5) | | | $ | 5,038,267 | | $ | 530,116 | | | 10.5 | % | | $ | 4,917,287 | | $ | 320,546 | | | 6.5 | % |
| Real estate conduit | Real estate conduit | | 75,633 | | 3,060 | | | 4.0 | % | | 83,618 | | 3,111 | | | 3.7 | % | Real estate conduit | | 16,408 | | 2,244 | | | 13.7 | | 13.7 | % | | 97,556 | | 6,956 | | | 7.1 | | 7.1 | % |
| Real estate securities | Real estate securities | | 899,033 | | 24,740 | | | 2.8 | % | | 351,859 | | 10,854 | | | 3.1 | % | Real estate securities | | 260,425 | | 17,323 | | | 6.7 | | 6.7 | % | | 1,203,242 | | 30,203 | | | 2.5 | | 2.5 | % |
| | Total | Total | | $ | 4,131,158 | | | $ | 216,890 | | | 5.3 | % | | $ | 3,041,558 | | | $ | 179,872 | | | 5.9 | % |
| Interest-bearing Liabilities: | | | | | | | | | | | | |
| Repurchase agreements - commercial mortgage loans | | $ | 477,138 | | $ | 17,299 | | | 3.6 | % | | $ | 249,289 | | $ | 10,908 | | | 4.4 | % |
| Other financing and loan participation- commercial mortgage loans | | 36,045 | | 1,874 | | | 5.2 | % | | 16,704 | | 916 | | | 5.5 | % |
| Repurchase agreements - real estate securities | | 871,466 | | 3,639 | | | 0.4 | % | | 313,227 | | 13,637 | | | 4.4 | % |
| Total | |
| Total | | | $ | 5,315,100 | | $ | 549,683 | | | 10.3 | % | | $ | 6,218,085 | | $ | 357,705 | | | 5.8 | % |
| Interest-bearing liabilities: | |
| Repurchase Agreements - commercial mortgage loans | |
| Repurchase Agreements - commercial mortgage loans | |
| Repurchase Agreements - commercial mortgage loans | | | $ | 573,530 | | $ | 54,564 | | 9.5 | % | | $ | 771,223 | | $ | 40,162 | | | 5.2 | % |
| Other financing and loan participation - commercial mortgage loans | | Other financing and loan participation - commercial mortgage loans | | 59,519 | | 5,478 | | 9.2 | % | | 47,216 | | 1,487 | | | 3.1 | % |
| Repurchase Agreements - real estate securities | | Repurchase Agreements - real estate securities | | 244,469 | | 14,118 | | 5.8 | % | | 1,097,874 | | 8,850 | | | 0.8 | % |
| Collateralized loan obligations | Collateralized loan obligations | | 1,821,993 | | 35,920 | | | 2.0 | % | | 1,706,207 | | 41,095 | | | 2.4 | % | Collateralized loan obligations | | 3,165,612 | | 223,686 | | 7.1 | % | | 2,909,513 | | 103,744 | | | 3.6 | | 3.6 | % |
| | Unsecured debt | Unsecured debt | | 35,268 | | | 2,103 | | | 6.0 | % | | — | | | — | | | — | % | Unsecured debt | | 85,613 | | 7,731 | | 9.0 | % | | 101,659 | | 6,283 | | | 6.2 | | 6.2 | % |
| Total | Total | | $ | 3,241,910 | | $ | 60,835 | | | 1.9 | % | | $ | 2,285,427 | | $ | 66,556 | | | 2.9 | % | Total | | $ | 4,128,743 | | $ | 305,577 | | | 7.4 | | 7.4 | % | | $ | 4,927,485 | | $ | 160,526 | | | 3.3 | | 3.3 | % |
| Net interest income/spread | Net interest income/spread | | | | $ | 156,055 | | | 3.4 | % | | | | $ | 113,316 | | | 3.0 | % | Net interest income/spread | | | | $ | 244,106 | | | 2.9 | | 2.9 | % | | | | $ | 197,179 | | | 2.5 | | 2.5 | % |
Average leverage % (4) | | 78.5 | % | | | | | | 75.1 | % | | | | |
Weighted average levered yield (5) | | 17.5 | % | | 15.0 | % |
Average leverage % (6) | |
Weighted average levered yield (7) | |
Weighted average levered yield (7) | |
Weighted average levered yield (7) | | | | | | | 20.6 | % | | | | | | 15.3 | % |
(1)Based on amortized cost for real estate debt and real estate securities and principal amount for interest-bearing liabilities. Amounts are calculated based on daily averages for the years ended December 31, 20212023 and 2020,2022, respectively.
(2)Includes the effect of amortization of premium or accretion of discount and deferred fees. The RMBS securities acquired in the Capstead merger are classified as trading and use the simple interest method to calculate interest income therefore no premium amortization is recognized on these securities.
(3)Excludes other income on the real estate owned business segment.
(4) Calculated as interest income or expense divided by average carrying value.
(5) The collateral sale of a Brooklyn hotel loan in April 2023, which allowed the company to recover its full investment, resulted in $15.5 million and $4.9 million in coupon and default interest income, respectively, recognized in the Company's real estate debt segment during the year ended December 31, 2023.
(6) Calculated by dividing total average interest-bearing liabilities by total average interest-earning assets.
(5) (7)Calculated by dividing net interest income/spread by the average interest-earning assets less average interest-bearing liabilities.
Interest incomeIncome
Interest income for the years ended December 31, 20212023 and 20202022 totaled $216.9$552.5 million and $179.9$357.7 million, respectively.respectively, an increase of $194.8 million due primarily to an approximate 330 basis point increase in daily average SOFR and SOFR equivalent rates and the impact of $20.4 million from the collateral sale of the Brooklyn hotel loan in April 2023. As of December 31, 2021,2023, our portfolio consisted of 165(i) 144 commercial mortgage loans, oneheld for investment and (ii) seven real estate securities, available for sale, measured at fair value. As of December 31, 2022, our portfolio consisted of (i) 161 commercial mortgage loan,loans, held for investment, (ii) two commercial mortgage loans, held for sale, measured at fair value, RMBS(iii) seven real estate securities, acquiredavailable for sale, measured at fair value and (iv) ARMs.
Interest Expense
Interest expense for the years ended December 31, 2023 and 2022 totaled $305.6 million and $160.5 million, respectively, an increase of $145.1 million due primarily to an increase of $256.1 million in the merger with Capstead and no investments in CMBS. The main driver in the increase in interest income was due to the higher average carrying value of interest-earning assetsour collateralized loan obligations coupled with an approximate 330 basis point increase in average SOFR and SOFR equivalent rates partially offset by a decrease of $1.1 billion in the average carrying values of our repurchase agreements - commercial mortgage loans and real estate securities.
Revenue from Real Estate Owned
For the years ended December 31, 2023 and 2022, revenue from real estate owned was $17.0 million and $9.7 million, respectively, an increase of $7.3 million due primarily to rental income obtained from additional retail properties acquired as real estate owned.
Provision/(Benefit) for Credit losses
Provision for credit losses was $33.7 million during the year ended December 31, 2021.2023 compared to a provision of $36.1 million during the year ended December 31, 2022. The following paragraphs set forth explanations for changes in the general and specific reserves for the years ended December 31, 2023 and 2022.
Interest expenseFor the years ended December 31, 2023 and 2022, the increases in general CECL allowance of $21.4 million and $10.8 million, respectively, were primarily related to a more pessimistic view of the macroeconomic scenario utilized for the CECL model. For the year ended December 31, 2023, this was partially offset by a decrease in the size of our loan portfolio compared to the preceding period.
Interest expenseFor the year ended December 31, 2023, the increase in specific CECL allowance of $12.3 million was primarily related to one office loan located in Portland, OR. For the year ended December 31, 2022, a specific CECL provision of $25.3 million was recorded for the loan collateralized by the Walgreens Portfolio.
Realized Gain/(Loss) on Extinguishment of Debt
Realized gain on extinguishment of debt for the year ended December 31, 2021 decreased2023 of $2.2 million was primarily related to $60.8the redemption of $17.5 million comparedpar value unsecured debt at a price equal to interest expense75% of par value coupled with the repurchases of $2.3 million of bonds of BSPRT 2021-FL7 and $8.25 million of bonds of BSPRT 2019-FL5 partially offset by the redemption of BSPRT 2019-FL5. Realized loss on extinguishment of debt for the year ended December 31, 20202022 of $66.6 million. The decrease in interest expense$5.2 million was dueprimarily related to a decrease in the one-month LIBOR, the benchmark index for our financing lines.redemption of BSPRT 2018-FL4.
Realized Gain/Loss(Loss) on Sale of Available for Sale Trading Securities
Realized gain on sale of available for sale trading securities for the year ended December 31, 2023 of $0.1 million was primarily related to the sale of 12 CRE CLO bonds. There were no sales of available for sale trading securities during the year ended December 31, 2022.
Realized Gain/(Loss) on Sale of Commercial Mortgage Loans, Held for Sale, Measured at Fair Value
Realized gain on commercial mortgage loans, held for sale, measured at fair value at the TRS for the year ended December 31, 20212023 of $3.9 million was $24.2 million comparedrelated to $15.9 million for the year ended December 31, 2020. The $8.3 million increase in realized gain was due to higher sales volumes in our conduit business segment with total proceeds of $478.3 million from the sale of fixed-rate$118.1 million in principal amount of commercial real estate loans into the CMBS securitization market duringresulting in proceeds of $122.1 million. Realized gain on commercial mortgage loans, held for sale,
measured at fair value for the year ended December 31, 20212022 of $2.4 million was related to the sale of $368.9 million in principal amount of commercial real estate loans into the CMBS securitization market resulting in proceeds of $370.2 million.
Gain/(Loss) on Other Real Estate Investments
Loss on other real estate investments for the year ended December 31, 2023 was $7.1 million compared to transactions with total proceeds of $328.1$0.7 million for the year ended December 31, 2020.
Realized Gain/Loss on Real Estate Securities Available for Sale
2022. For the year ended December 31, 2021 sales2023, the loss was primarily the result of the sale of two real estate owned, held for sale properties located in New Rochelle, NY and St. Louis, MO, respectively, resulting in a total loss of $3.3 million, in addition to a $4.0 million impairment loss on our real estate securities, availableowned, held for sale asset related to the Walgreens Portfolio.
Unrealized Gain/(Loss) on Commercial Mortgage Loans, Held for Sale, Measured at Fair Value
The Company did not hold any commercial mortgage loans, held for sale, measured at fair value resulted in a net realized lossas of $1.4 million included within the consolidated statements of operations. The loss is attributable to nine CMBS securities sold duringDecember 31, 2023. Unrealized gain for the year ended December 31, 2021. For2023 was $44.0 thousand related to the reversal of prior year unrealized gain/loss on a sale of a commercial real estate loan into the CMBS securitization market made in the first quarter of 2023. Comparatively, unrealized gain for the year ended December 31, 2020 sales2022 was $0.5 million related to changes in fair market values on loans held in the Company's TRS coupled with the reversal of ourunrealized gain/loss on a sale of commercial real estate securities, availableloans into the CMBS securitization market.
Trading Gain/(Loss)
Trading loss for sale, measured at fair value resulted in a net realized lossthe years ended December 31, 2023 and 2022 of $10.1$0.6 million included within the consolidated statements of operations. The lossand $119.2 million, respectively, was attributable to 20 CMBS securities$17.6 million and $480.2 million of principal paydowns, respectively, $218.2 million and $3.8 billion of sales of ARM Agency Securities, respectively, and changes in market values on these securities. We sold duringall remaining assets from our ARMs portfolio in the third quarter of 2023.
Net Result from Derivative Transactions
Net result from derivative transactions for the year ended December 31, 2020 in response2023 of a $0.9 million gain was composed of a realized gain of $1.0 million due primarily to the dislocations intermination and settlement of interest rate swap positions partially offset by an unrealized loss of $0.1 million. This is compared to a net gain on our derivative portfolio of $44.2 million composed of a realized gain of $60.0 million due primarily to the capital markets duetermination and settlement of interest rate swap positions specifically designed to COVID-19.
Unrealized Gain/Loss on Real Estate Securities Availablehedge the ARMs portfolio partially offset by an unrealized loss of $15.8 million for Sale
For the year ended December 31, 2021 our real estate securities, available2022.
(Provision)/Benefit for sale, measured at fair value had an unrealized gain of $8.3 million included within the consolidated statements of comprehensive income. The increase in fair value of real estate securities can be attributed to the reversal of the unrealized losses on the nine CMBS sales duringIncome Tax
Benefit for income tax for the year ended December 31, 2021.2023 was $2.8 million compared to a benefit of $0.4 million for the year ended December 31, 2022. The difference is due to change in taxable income/loss in our TRS segment.
Net (Income)/Loss Attributable to Non-controlling Interest
Net loss attributable to non-controlling interest in our consolidated joint ventures for the year ended December 31, 2023 amounted to $0.7 million compared to a net loss attributable to non-controlling interest of $0.2 million for the year ended December 31, 2022.
Preferred Share Dividends
Preferred share dividends were $27.0 million for the year ended December 31, 2023 compared to $41.7 million for the year ended December 31, 2022, a decrease of $14.7 million due primarily to fewer preferred shares outstanding following the automatic conversion into Common Stock of the Company's Series F Convertible Preferred Stock in April 2022, Series C Convertible Preferred Stock in October 2022 and Series I Convertible Preferred Stock in January 2023 (see Note 9 - Redeemable Convertible Preferred Stock and Equity Transactions).
Trading Gain/Loss
For the year ended December 31, 2021 we had a realized trading loss of $34.8 million included within the consolidated statements of operations. The loss is attributable to $20.9 million of losses due to change in market values of the ARM Agency Securities and $14.0 million of losses due to mortgage prepayments, net of $0.1 million in realized gains on sales of securities.
Expenses from operationsOperations
Expenses from operations for the years ended December 31, 20212023 and 2020 were made up2022 consisted of the following (dollars in thousands): | | | | | | | | | | | | | | |
| | Year Ended December 31, |
| | 2021 | | 2020 |
| Asset management and subordinated performance fee | | $ | 28,110 | | | $ | 15,178 | |
| Acquisition expenses | | 1,203 | | | 696 | |
| Administrative services expenses | | 7,658 | | | 13,120 | |
| Impairment of acquired assets | | 88,282 | | | — | |
| Professional fees | | 11,650 | | | 10,964 | |
| Real estate owned operating expenses | | — | | | 3,653 | |
| Depreciation and amortization | | 2,107 | | | 2,233 | |
| Other expenses | | 3,946 | | | 3,312 | |
| Total expenses from operations | | $ | 142,956 | | | $ | 49,156 | |
| | | | | | | | | | | | | | |
| | Year Ended December 31, |
| | 2023 | | 2022 |
| Asset management and subordinated performance fee | | $ | 33,847 | | | $ | 26,157 | |
| Acquisition expenses | | 1,241 | | | 1,360 | |
| Administrative services expenses | | 14,440 | | | 12,928 | |
| | | | |
| Professional fees | | 15,270 | | | 22,566 | |
| Share-based compensation | | 4,761 | | | 2,519 | |
| | | | |
| Depreciation and amortization | | 7,128 | | | 5,408 | |
| Other expenses | | 11,135 | | | 6,572 | |
| Total expenses from operations | | $ | 87,822 | | | $ | 77,510 | |
The increase in our expenses from operationsoperating expense was primarily related to impairment of acquired assets and higher asset management and subordinated performance fees. The(i) an increase in impairment of acquired assets and asset management and subordinated performance fees were all due to the merger with Capsteadincentive fees incurred during the year ended December 31, 2021. Refer2023 and (ii) an increase in other expenses due to “Impact of the Capstead Acquisition” above forexpenses incurred in order to operate various REO investments in our portfolio partially offset by (iii) a discussion of the impairment of acquired assets. The decrease in administrative services expenses wasprofessional fees primarily driven by a greater amount of originations during the year and therefore higher acquisition fees paid to our Advisor, which reduced the administrative services expenses for the year ended December 31, 2021, comparedrelated to the year ended December 31, 2020. The decrease of $3.7 millionreduction in real estate owned operating expenses was duelegal costs associated with our recovery efforts related to the sale of an owned office property during the year ended December 31, 2020a hotel asset and the fact our remaining owned property, an industrial property, is leased on a triple-net basis.Walgreens Portfolio.
Comparison of the Three Months Ended December 31, 20212023 to the Three Months Ended September 30, 20212023
Net Interest Income
Net interest income is generated on our interest-earning assets less related interest-bearing liabilities and is recorded as part of our real estate debt, real estate securities and TRS segments.
The following table presents the average balance of interest-earning assets less related interest-bearing liabilities, associated interest income and expense and corresponding yield earned and incurred for the three months ended December 31, 20212023 and September 30, 20212023 (dollars in thousands): | | Three Months Ended |
| December 31, 2021 | | September 30, 2021 |
| Average Carrying Value (1) | | Interest Income / Expense (2) | | WA Yield / Financing Cost (3)(4) | | Average Carrying Value (1) | | Interest Income / Expense (2) | | WA Yield / Financing Cost (3)(4) |
| | Three Months Ended | | | | Three Months Ended |
| | December 31, 2023 | | | | December 31, 2023 | | September 30, 2023 |
| | Average Carrying Value (1) | | | | Average Carrying Value (1) | | Interest Income/Expense (2)(3) | | Avg Yield/Financing Cost (4)(5) | | Average Carrying Value (1) | | Interest Income/Expense (2)(3) | | Avg Yield/Financing Cost (4)(5) |
| Interest-earning assets: | Interest-earning assets: | | | | | | | | | | | | |
| Real estate debt | |
| Real estate debt | |
| Real estate debt | Real estate debt | | $ | 3,631,346 | | $ | 53,145 | | | 5.9 | % | | $ | 3,118,201 | | $ | 47,166 | | | 6.1 | % | | $ | 4,778,141 | | $ | 125,816 | | | 10.5 | | 10.5 | % | | $ | 4,770,339 | | $ | 131,093 | | | 11.0 | | 11.0 | % |
| Real estate conduit | Real estate conduit | | 36,447 | | 497 | | | 5.5 | % | | 61,157 | | 581 | | | 3.8 | % | Real estate conduit | | 10,826 | | 1,065 | | | 39.4 | | 39.4 | % | | 9,859 | | 109 | | | 4.4 | | 4.4 | % |
| Real estate securities | Real estate securities | | 3,482,245 | | 24,279 | | | 2.8 | % | | — | | — | | | N/A | Real estate securities | | 232,430 | | 4,835 | | 8.3 | % | | 277,664 | | 4,908 | | | 7.1 | | 7.1 | % |
| | Total | Total | | $ | 7,150,038 | | | $ | 77,921 | | | 4.4 | % | | $ | 3,179,358 | | | $ | 47,747 | | | 6.0 | % |
| Interest-bearing Liabilities: | | | | | | | | | | | | |
| Repurchase agreements - commercial mortgage loans | | $ | 959,729 | | $ | 9,069 | | | 3.8 | % | | $ | 331,871 | | $ | 3,095 | | | 3.7 | % |
| Other financing and loan participation- commercial mortgage loans | | 37,770 | | 386 | | | 4.1 | % | | 49,145 | | 350 | | | 2.8 | % |
| Repurchase agreements - real estate securities | | 3,233,599 | | 1,361 | | | 0.2 | % | | 46,527 | | 148 | | | 1.3 | % |
| Total | |
| Total | | | $ | 5,021,397 | | $ | 131,716 | | | 10.5 | % | | $ | 5,057,862 | | $ | 136,110 | | | 10.8 | % |
| Interest-bearing liabilities: | |
| Repurchase Agreements - commercial mortgage loans | |
| Repurchase Agreements - commercial mortgage loans | |
| Repurchase Agreements - commercial mortgage loans | | | $ | 245,775 | | $ | 8,093 | | 13.2 | % | | $ | 711,560 | | $ | 16,868 | | | 9.5 | % |
| Other financing and loan participation - commercial mortgage loans | | Other financing and loan participation - commercial mortgage loans | | 26,051 | | 657 | | 10.1 | % | | 61,125 | | 1,444 | | | 9.4 | % |
| Repurchase Agreements - real estate securities | | Repurchase Agreements - real estate securities | | 248,456 | | 3,979 | | 6.4 | % | | 223,199 | | 3,151 | | | 5.6 | % |
| Collateralized loan obligations | Collateralized loan obligations | | 1,714,736 | | 11,922 | | | 2.8 | % | | 1,906,402 | | 8,395 | | | 1.8 | % | Collateralized loan obligations | | 3,508,595 | | 66,579 | | 7.6 | % | | 2,974,039 | | 54,608 | | | 7.3 | | 7.3 | % |
| | Unsecured debt | Unsecured debt | | 101,064 | | 2,103 | | | 8.3 | % | | — | | — | | | — | % | Unsecured debt | | 81,283 | | 1,924 | | 9.5 | % | | 81,258 | | 1,902 | | | 9.4 | | 9.4 | % |
| Total | Total | | $ | 6,046,898 | | $ | 24,841 | | 1.6 | % | | $ | 2,333,945 | | $ | 11,988 | | 2.1 | % | Total | | $ | 4,110,160 | | $ | 81,232 | | | 7.9 | | 7.9 | % | | $ | 4,051,181 | | $ | 77,973 | | | 7.7 | | 7.7 | % |
| Net interest income/spread | Net interest income/spread | | | | $ | 53,080 | | | 2.8 | % | | | | $ | 35,759 | | | 3.9 | % | Net interest income/spread | | | | $ | 50,484 | | | 2.6 | | 2.6 | % | | | | $ | 58,137 | | | 3.1 | | 3.1 | % |
Average leverage % (5) | | 84.6 | % | | | | | | 73.4 | % | | | | |
Weighted average levered yield (6) | | 19.2 | % | | 16.9 | % |
Average leverage % (6) | |
Weighted average levered yield (7) | |
Weighted average levered yield (7) | |
Weighted average levered yield (7) | | | | | | | 22.2 | % | | | | | | 23.1 | % |
________________________________________________ (1)Based on amortized cost for real estate debt and real estate securities and principal amount for interest-bearing liabilities. Amounts are calculated based on daily averages for the three months ended December 31, 20212023 and September 30, 2021,2023, respectively.
(2)Includes the effect of amortization of premium or accretion of discount and deferred fees. The RMBS securities acquired in the Capstead merger are classified as trading and use the simple interest method to calculate interest income therefore no premium amortization is recognized on these securities.
(3)Excludes other income on the real estate owned business segment.
(4) Calculated as interest income or expense divided by average carrying value.
(4)(5) Annualized.
(5)(6) Calculated by dividing total average interest-bearing liabilities by total average interest-earning assets.
(6) (7)Calculated by dividing net interest income/spread by the average interest-earning assets less average interest-bearing liabilities.
Interest incomeIncome
Interest income for the three months ended December 31, 20212023 and September 30, 20212023 totaled $77.9$132.0 million and $47.7$137.0 million, respectively.respectively, a decrease of $5.0 million due primarily to payoffs of two loans occurring in the third quarter of 2023 resulting in approximately $6.3 million of income. As of December 31, 2021,2023, our portfolio consisted of 165(i) 144 commercial mortgage loans, held for investment and (ii) seven real estate securities, available for sale, measured at fair value. As of September 30, 2023, our portfolio consisted of (i) 145 commercial mortgage loans, held for investment, (ii) one commercial mortgage loan, held for sale, measured at fair value RMBSand (iii) six real estate securities, acquired in the merger with Capstead and no investments in CMBS. The main driver in the increase in interest income was due to the higher average carrying value of interest-earning assets during the three months ended December 31, 2021, directly related to the merger with Capstead.available for sale, measured at fair value.
Interest expenseExpense
Interest expense for the three months ended December 31, 2021 increased to $24.8 million compared to interest expense for the three months ended2023 and September 30, 2021 of $12.0 million. The increase in interest expense was due to the increase of $627.92023 totaled $81.2 million in repurchase agreements on commercial mortgage loans and $78.0 million, respectively, an increase of $3,187.1$3.2 million due primarily to an increase of $534.6 million in the average carrying value of our collateralized loan obligations partially offset by a decrease of $465.8 million in the average carrying value of our repurchase agreements on real estate securities during the three months ended December 31, 2021, compared to the three months ended September 30, 2021.- commercial mortgage loans.
Revenue from Real Estate Owned
For the three months ended December 31, 2023 and September 30, 2023, revenue from real estate owned was $4.0 million and $3.3 million, respectively, an increase of $0.7 million due primarily to rental income obtained from the acquisition of an additional property as real estate owned.
(Provision)/Benefit for Credit losses
Provision for credit losses was $5.4 million during the three months ended December 31, 2023 compared to a provision of $2.4 million during three months ended September 30, 2023. The following paragraphs set forth explanations for changes in the general and specific reserves for the three months ended December 31, 2023 and September 30, 2023.
For the three months ended December 31, 2023 and September 30, 2023, the increases in general allowance of $5.4 million and $2.8 million, respectively, were primarily related to a more pessimistic view of the macroeconomic scenario utilized for the CECL model. For the three months ended December 31, 2023, this was coupled with increases in the size of our loan portfolio compared to the preceding period.
For the three months ended December 31, 2023, the Company did not recognize specific CECL benefit or provisions. Comparatively, for the three months ended September 30, 2023, the Company recognized $0.4 million of specific CECL benefit on one office loan located in Portland, OR.
Realized Gain/Loss(Loss) on Extinguishment of Debt
The Company did not realized a gain or loss on extinguishment of debt for the three months ended December 31, 2023. Realized loss on extinguishment of debt for the three months ended September 30, 2023 of $2.8 million was related to redemption of BSPRT 2019-FL5.
Realized Gain/(Loss) on Sale of Available for Sale Trading Securities
Realized loss on sale of available for sale trading securities for the three months ended December 31, 2023 of $30.0 thousand was primarily related to the sale of two CRE CLO bonds. Realized loss on sale of available for sale trading securities for the three months ended September 30, 2023 of $0.5 million was primarily related to the sale of six CRE CLO bonds.
Realized Gain/(Loss) on Sale of Commercial Mortgage Loans, Held for Sale, Measured at Fair Value
Realized gain on commercial mortgage loans, held for sale, measured at fair value at the TRS for the three months ended December 31, 20212023 of $0.8 million was $2.0 million compared to $9.1 million for the three months ended September 30, 2021. The $7.1 million decrease in realized gain was duerelated to the fact that there had been one sale of fixed-rate$26.3 million in principal amount of commercial real estate loans into the CMBS securitization market during the three months ended December 31, 2021 compared to two sales duringresulting in proceeds of $27.0 million. Realized gain on commercial mortgage loans, held for sale, measured at fair value for the three months ended September 30, 2021. Proceeds from2023 of $0.9 million was related to the sale were $67.1of $34.3 million in principal amount of commercial real estate loans into the CMBS securitization market resulting in proceeds of $35.3 million.
Gain/(Loss) on Other Real Estate Investments
Gain on other real estate investments for the three months ended December 31, 20212023 was $0.1 million. This is compared to $154.0a loss of $4.1 million for the three months ended September 30, 2021.2023 primarily due to an impairment on the Walgreens Portfolio, real estate owned, held for sale asset.
Unrealized Gain/(Loss) on Commercial Mortgage Loans, Held for Sale, Measured at Fair Value
The Company did not have any commercial mortgage loans, held for sale, measured at fair value held in an unrealized gain or loss position as of December 31, 2023 and September 30, 2023.
Trading Gain/Loss(Loss)
ForThe Company did not experience any trading losses during the three months ended December 31, 2021 we had2023. Trading loss for the three months ended September 30, 2023 of $2.6 million was attributable to $2.6 million of principal paydowns, $122.8 million of sales of ARM Agency Securities, and changes in market values on these securities.
Net Result from Derivative Transactions
Net result from derivative transactions for the three months ended December 31, 2023 of a $0.3 million gain was composed primarily of realized gains related to the termination and settlement of interest rate swap positions. This is compared to a net loss on our derivative portfolio of $0.1 million composed of a realized tradinggain of $0.1 million due primarily to the termination and settlement of interest rate swap positions offset by an unrealized loss of $34.8$0.2 million included withinfor the consolidated statementsthree months ended September 30, 2023 .
(Provision)/Benefit for Income Tax
Benefit for income tax for the three months ended December 31, 2023 was $0.3 million compared to a benefit of operations.$1.8 million for the three months ended September 30, 2023. The lossdifference is attributable to $20.9 million of losses due to change in market valuestaxable income/loss in our TRS segment.
Net Income/(Loss) Attributable to Non-controlling Interest
Net income attributable to non-controlling interest in our consolidated joint ventures for the three months ended December 31, 2023 amounted to $16 thousand. Comparatively, for the three months ended September 30, 2023, net loss attributable to non-controlling interest amounted to $0.8 million.
Preferred Share Dividends
Preferred share dividends were $6.7 million for each of the ARM Agency Securitiesthree months ended December 31, 2023 and $14.0 million of losses due to mortgage prepayments, net of $0.1 million in realized gains on sales of securities.September 30, 2023. (see Note 9 - Redeemable Convertible Preferred Stock and Equity Transactions).
Expenses from operations
Expenses from operations for the three months ended December 31, 20212023 and September 30, 2021 were made up2023 consisted of the following (dollars in thousands): | | Three Months Ended |
| December 31, 2021 | | September 31, 2021 |
| | Three Months Ended | | | | Three Months Ended |
| | December 31, 2023 | | | | December 31, 2023 | | September 30, 2023 |
| Asset management and subordinated performance fee | Asset management and subordinated performance fee | | $ | 8,428 | | | $ | 8,265 | |
| Acquisition expenses | Acquisition expenses | | 191 | | | 690 | |
| Administrative services expenses | Administrative services expenses | | (1,874) | | | 2,980 | |
| Impairment of acquired assets | | 88,282 | | | — | |
| | Professional fees | Professional fees | | 4,388 | | | 2,488 | |
| Professional fees | |
| Professional fees | |
| Share-based compensation | |
| | Depreciation and amortization | |
| Depreciation and amortization | |
| Depreciation and amortization | Depreciation and amortization | | 1,295 | | | — | |
| Other expenses | Other expenses | | 1,831 | | | 709 | |
| Total expenses from operations | Total expenses from operations | | $ | 102,541 | | | $ | 15,132 | |
The increaseOverall, operating expenses were consistent with prior quarter, with a decrease of approximately $0.8 million due to a decrease in ourother expenses from operationsREO that was primarily related to impairment of acquired assets and higher assetoffset by Asset management and subordinated performance fees. The increase in impairment of acquired assets and asset management and subordinated performance fees were allfee increases due to the merger with Capstead during the three months ended December 31, 2021. Refer to “Impact of the Capstead Acquisition” above for a discussion of the impairment of acquired assets. The decrease in administrative services expenses was primarily driven by the year-end adjustment to such expenses during the three months ended December 31, 2021, compared to the three months ended September 30, 2021. The increase in depreciation and amortization expense was due to $1.3 million of expenses incurred on one real estate owned assets during the three months ended December 31, 2021, compared to no such expenses incurred during the three months ended September 30, 2021.incentive fees.
Comparison of the Year Ended December 31, 20202022 to the Year Ended December 31, 20192021
See Part II, Item 7. “Management’s Discussion and Analysis of Financial Condition and Results of Operations” in our Annual Report on Form 10-K for the year ended December 31, 2020,2022, filed with the Securities and Exchange Commission on March 11, 2021,16, 2023, for a discussion of the comparison of the year ended December 31, 20202022 to the year ended December 31, 2019.2021.
Portfolio
As of December 31, 20212023 and 2020,2022, our portfolio consisted of 165144 and 130161 commercial mortgage loans, respectively, excluding commercial mortgage loans accountedheld for under the fair value option.investment, respectively. The commercial mortgage loans held for investment, as of December 31, 2021 and December 31, 2020 had a total carrying value, net of allowance for credit losses, as of $4,211.1December 31, 2023 and 2022 had a total carrying value of $4,989.8 million and $2,693.8$5,228.9 million, respectively. As of December 31, 2021 and 20202023 the Company's totalCompany did not hold any commercial mortgage loans, held for sale. As of December 31, 2022, the contractual principal balance outstanding of commercial mortgage loans, held for sale, measured at fair value was $15.6 million, comprised of one loan with total fair valuetwo loans, neither of $34.7which were in default or greater than ninety days past due. As of December 31, 2023 and 2022, we had $242.6 million and $221.0 million, respectively, of real estate securities, available for sale, measured at fair value. As of December 31, 2023 and 2022, our real estate owned, held for investment portfolio was composed of three loansand 11 properties, respectively, with total fair valuecarrying values of $67.6$115.8 million and $127.8 million, respectively. As of December 31, 2021,2023 and 2022, we had no real estate securities, available for sale, compared to real estate securities, available for sale, at fair value comprised of nine CMBS investments with total fair value of $171.1 million,23 and two properties classified as of December 31, 2020. As of December 31, 2021 and December 31, 2020, our other real estate investments, measured at fair value, were comprised one investment with a total fair value of $2.1 million and $2.5 million, respectively. As of December 31, 2021 and December 31, 2020, our real estate owned, portfolio comprised one industrial property and one office property,held for sale, respectively, with combined carrying values of $90.0$103.7 million and $26.5$36.5 million, respectively.
As of December 31, 2021, we had two loans with unpaid contractual principal balance for a total carrying value of $114.0 million, one with interest past due for greater than 90 days and2023, the other which is current. WeCompany did not takehold any asset specific reserves for these loans.real estate securities, trading, measured at fair value. As of December 31, 2020,2022, the Company had real estate securities, trading, measured at fair value of $235.7 million. During the year ended December 31, 2023, the Company fully disposed of the remaining ARM Agency Securities portfolio acquired from the Capstead merger that resulted in (i) $17.6 million of principal paydowns, (ii) $218.2 million of sales and (iii) $0.6 million of net trading losses related to principal paydowns, changes in market values and sales of these securities.
As of December 31, 2023, we had one loantwo loans, designated as non-performing status with unpaid contractual principal balance and carrying valuea total amortized cost of $57.1 million that had interest past due$78.2 million. As of December 31, 2023, no specific allowance for greater than 90 days.credit losses were recorded on the two non-performing loans, all of which were senior mortgage notes secured by multifamily properties.
As of December 31, 20212023 and 2020,2022, our commercial mortgage loans, held for investment, excluding commercial mortgage loans accounted for under the fair value option,on non-performing status, had a weighted average coupon of 4.3%9.2% and 5.5%,8.3% and a weighted average remaining life of 2.10.9 years and 1.71.4 years, respectively. As of December 31, 2020, our CMBS investments had a weighted average coupon of 2.2%, and a weighted average remaining life of 12.8 years.
The following charts summarize our commercial mortgage loans, held for investment, by coupon rate type, collateral type and geographical region and state as of December 31, 20212023 and 2020:2022:
An investments region classification is defined according to the below map based on the location of investments secured property.
The following charts show the par value by contractual maturity year for the investments in our portfolio as of December 31, 20212023 and 2020:2022:
The following table shows selected data from our commercial mortgage loans, held for investment in our portfolio as of December 31, 20212023 (dollars in thousands):
| | | | | | | | | | | | | | | | | |
| Loan Type | Property Type | Par Value | Interest Rate (1) | Effective Yield (5) | Loan to Value (2) |
| Senior Debt 1 | Hospitality | $4,858 | 1 month LIBOR + 4.00% | 5.00% | 77.0% |
| Senior Debt 2 | Hospitality | 57,075 | 1 month LIBOR + 5.19% | 6.19% | 51.8% |
| Senior Debt 3 | Multifamily | 26,568 | 1 month LIBOR + 4.50% | 5.50% | 22.4% |
| Senior Debt 4 | Hospitality | 22,150 | 1 month LIBOR + 6.00% | 6.50% | 48.1% |
| Senior Debt 5 | Office | 6,901 | 1 month LIBOR + 5.15% | 6.60% | 56.4% |
| Senior Debt 6 | Multifamily | 36,822 | 1 month LIBOR + 3.00% | 3.80% | 63.7% |
| Senior Debt 7 | Multifamily | 37,025 | 1 month LIBOR + 3.00% | 4.50% | 83.6% |
| Senior Debt 8 | Hospitality | 22,355 | 1 month LIBOR + 3.50% | 4.80% | 68.8% |
| Senior Debt 9 | Office | 20,685 | 1 month LIBOR + 3.75% | 5.80% | 70.0% |
| Senior Debt 10 | Office | 15,722 | 1 month LIBOR + 3.40% | 5.30% | 67.5% |
| Senior Debt 11 | Retail | 29,500 | 6.50% | 6.50% | 68.5% |
| Senior Debt 12 | Multifamily | 27,488 | 1 month LIBOR + 3.35% | 5.25% | 73.0% |
| Senior Debt 13 | Hospitality | 8,285 | 1 month LIBOR + 4.85% | 6.75% | 62.5% |
| Senior Debt 14 | Office | 7,125 | 1 month LIBOR + 3.90% | 5.95% | 67.6% |
| Senior Debt 15 | Hospitality | 13,972 | 1 month LIBOR + 4.47% | 6.72% | 44.8% |
| Senior Debt 16 | Retail | 11,924 | 1 month LIBOR + 3.95% | 6.45% | 61.2% |
| Senior Debt 17 | Office | 42,631 | 1 month LIBOR + 3.50% | 5.75% | 71.0% |
| Senior Debt 18 | Retail | 8,203 | 1 month LIBOR + 8.00% | 8.10% | 51.6% |
| Senior Debt 19 | Hospitality | 10,580 | 1 month LIBOR + 4.50% | 6.75% | 68.7% |
| Senior Debt 20 | Hospitality | 19,900 | 1 month LIBOR + 4.15% | 6.50% | 61.8% |
| Senior Debt 21 | Office | 39,650 | 1 month LIBOR + 4.01% | 6.26% | 68.2% |
| Senior Debt 22 | Hospitality | 20,930 | 1 month LIBOR + 3.75% | 6.10% | 62.6% |
| Senior Debt 23 | Hospitality | 13,000 | 1 month LIBOR + 2.94% | 5.44% | 56.4% |
| Senior Debt 24 | Hospitality | 4,987 | 1 month LIBOR + 4.25% | 6.50% | 47.7% |
| Senior Debt 25 | Hospitality | 12,750 | 1 month LIBOR + 4.45% | 6.85% | 62.9% |
| Senior Debt 26 | Hospitality | 10,845 | 1 month LIBOR + 4.50% | 6.85% | 64.0% |
| Senior Debt 27 | Retail | 9,400 | 1 month LIBOR + 4.20% | 6.30% | 77.1% |
| Senior Debt 28 | Hospitality | 34,053 | 1 month LIBOR + 3.99% | 5.74% | 31.0% |
| Senior Debt 29 | Industrial | 56,933 | 1 month LIBOR + 3.75% | 5.50% | 59.7% |
| Senior Debt 30 | Office | 21,825 | 1 month LIBOR + 3.50% | 5.40% | 70.9% |
| Senior Debt 31 | Hospitality | 7,100 | 1 month LIBOR + 4.00% | 5.75% | 70.3% |
| Senior Debt 32 | Multifamily | 15,342 | 1 month LIBOR + 2.75% | 4.25% | 71.7% |
| Senior Debt 33 | Multifamily | 27,650 | 1 month LIBOR + 3.15% | 4.95% | 71.6% |
| Senior Debt 34 | Multifamily | 27,094 | 1 month LIBOR + 2.70% | 2.80% | 76.0% |
| Senior Debt 35 | Multifamily | 9,016 | 1 month LIBOR + 3.95% | 5.00% | 75.3% |
| Senior Debt 36 | Multifamily | 25,000 | 1 month LIBOR + 3.30% | 4.75% | 75.5% |
| Senior Debt 37 | Office | 25,802 | 1 month LIBOR + 4.35% | 6.05% | 64.9% |
| Senior Debt 38 | Multifamily | 15,150 | 1 month LIBOR + 3.10% | 4.50% | 63.7% |
| Senior Debt 39 | Office | 58,714 | 1 month LIBOR + 3.70% | 5.00% | 65.7% |
| Senior Debt 40 | Multifamily | 11,739 | 1 month LIBOR + 3.15% | 4.75% | 72.4% |
| Senior Debt 41 | Office | 28,083 | 1 month LIBOR + 2.70% | 2.80% | 71.4% |
| Senior Debt 42 | Manufactured Housing | 1,359 | 5.50% | 5.50% | 62.8% |
| Senior Debt 43 | Multifamily | 7,060 | 1 month LIBOR + 4.75% | 5.75% | 62.6% |
| Senior Debt 44 | Industrial | 17,038 | 1 month LIBOR + 6.25% | 7.00% | 61.0% |
| Senior Debt 45 | Multifamily | 4,300 | 1 month LIBOR + 5.50% | 6.50% | 87.4% |
| Senior Debt 46 | Manufactured Housing | 7,680 | 1 month LIBOR + 4.50% | 5.00% | 66.7% |
| | | | | | | | | | | | | | | | | |
| Loan Type | Property Type | Par Value | Interest Rate (1) | Effective Yield (5) | Loan to Value (2) |
| Senior Debt 47 | Mixed Use | 30,465 | 1 month LIBOR + 5.15% | 6.15% | 67.0% |
| Senior Debt 48 | Hospitality | 27,000 | 1 month LIBOR + 6.50% | 6.85% | 62.7% |
| Senior Debt 49 | Multifamily | 50,000 | 1 month LIBOR + 6.69% | 7.44% | 80.0% |
| Senior Debt 50 | Self Storage | 29,895 | 1 month LIBOR + 5.00% | 5.25% | 58.8% |
| Senior Debt 51 | Multifamily | 14,183 | 1 month LIBOR + 4.75% | 5.25% | 70.0% |
| Senior Debt 52 | Manufactured Housing | 3,400 | 1 month LIBOR + 5.00% | 5.25% | 58.6% |
| Senior Debt 53 | Multifamily | 27,550 | 1 month LIBOR + 5.75% | 6.00% | 69.8% |
| Senior Debt 54 | Manufactured Housing | 5,020 | 1 month LIBOR + 5.25% | 5.35% | 65.9% |
| Senior Debt 55 | Office | 18,603 | 1 month LIBOR + 4.50% | 5.25% | 47.9% |
| Senior Debt 56 | Office | 67,651 | 5.15% | 5.15% | 52.5% |
| Senior Debt 57 | Office | 30,900 | 1 month LIBOR + 5.20% | 5.45% | 66.0% |
| Senior Debt 58 | Self Storage | 11,600 | 1 month LIBOR + 4.76% | 5.01% | 66.6% |
| Senior Debt 59 | Manufactured Housing | 5,000 | 1 month LIBOR + 5.90% | 6.50% | 58.8% |
| Senior Debt 60 | Office | 12,750 | 1 month LIBOR + 5.00% | 5.25% | 67.8% |
| Senior Debt 61 | Multifamily | 43,320 | 1 month LIBOR + 4.35% | 4.60% | 73.2% |
| Senior Debt 62 | Multifamily | 37,674 | 1 month LIBOR + 4.45% | 4.70% | 66.5% |
| Senior Debt 63 | Multifamily | 8,763 | 1 month LIBOR + 5.50% | 5.75% | 73.7% |
| Senior Debt 64 | Retail | 11,963 | 1 month LIBOR + 4.87% | 5.12% | 75.0% |
| Senior Debt 65 | Multifamily | 5,730 | 1 month LIBOR + 5.00% | 5.25% | 73.5% |
| Senior Debt 66 | Multifamily | 18,800 | 1 month LIBOR + 4.00% | 4.10% | 79.7% |
| Senior Debt 67 | Industrial | 14,985 | 1 month LIBOR + 4.50% | 4.75% | 66.3% |
| Senior Debt 68 | Office | 11,981 | 1 month LIBOR + 5.50% | 5.75% | 68.8% |
| Senior Debt 69 | Multifamily | 11,820 | 1 month LIBOR + 4.55% | 4.75% | 73.0% |
| Senior Debt 70 | Multifamily | 21,000 | 1 month LIBOR + 4.60% | 4.75% | 66.7% |
| Senior Debt 71 | Office | 26,000 | 1 month LIBOR + 5.00% | 5.25% | 63.9% |
| Senior Debt 72 | Multifamily | 54,500 | 1 month LIBOR + 3.80% | 4.05% | 77.0% |
| Senior Debt 73 | Multifamily | 11,672 | 1 month LIBOR + 3.50% | 3.65% | 60.1% |
| Senior Debt 74 | Multifamily | 21,000 | 1 month LIBOR + 4.95% | 5.05% | 84.2% |
| Senior Debt 75 | Office | 43,751 | 1 month LIBOR + 3.94% | 4.14% | 53.9% |
Senior Debt 76 (3) | Multifamily | — | 1 month LIBOR + 7.25% | 7.50% | —% |
| Senior Debt 77 | Multifamily | 5,400 | 1 month LIBOR + 5.25% | 5.50% | 83.1% |
| Senior Debt 78 | Hospitality | 23,000 | 1 month LIBOR + 5.79% | 5.99% | 57.2% |
| Senior Debt 79 | Multifamily | 32,856 | 1 month LIBOR + 6.75% | 7.00% | 78.2% |
| Senior Debt 80 | Multifamily | 12,325 | 1 month LIBOR + 4.50% | 4.65% | 83.3% |
| Senior Debt 81 | Multifamily | 6,300 | 1 month LIBOR + 5.35% | 5.60% | 84.0% |
| Senior Debt 82 | Multifamily | 31,023 | 1 month LIBOR + 3.00% | 3.10% | 74.3% |
| Senior Debt 83 | Multifamily | 11,936 | 1 month LIBOR + 4.25% | 4.55% | 76.4% |
| Senior Debt 84 | Multifamily | 5,575 | 1 month LIBOR + 4.50% | 4.75% | 83.6% |
| Senior Debt 85 | Multifamily | 53,178 | 1 month LIBOR + 3.00% | 3.25% | 71.6% |
| Senior Debt 86 | Multifamily | 14,045 | 1 month LIBOR + 3.39% | 3.54% | 70.6% |
| Senior Debt 87 | Multifamily | 8,301 | 1 month LIBOR + 3.80% | 3.95% | 69.9% |
| Senior Debt 88 | Multifamily | 13,582 | 1 month LIBOR + 4.50% | 4.75% | 76.7% |
| Senior Debt 89 | Multifamily | 18,277 | 1 month LIBOR + 5.25% | 5.50% | 67.0% |
| Senior Debt 90 | Multifamily | 17,985 | 1 month LIBOR + 3.60% | 3.75% | 70.8% |
| Senior Debt 91 | Multifamily | 41,823 | 1 month LIBOR + 2.95% | 3.10% | 71.6% |
| Senior Debt 92 | Hospitality | 25,785 | 1 month LIBOR + 5.60% | 5.85% | 61.0% |
| Senior Debt 93 | Mixed Use | 32,500 | 1 month LIBOR + 3.70% | 4.20% | 69.7% |
| Senior Debt 94 | Multifamily | 12,688 | 1 month LIBOR + 3.75% | 3.90% | 63.2% |
| | | | | | | | | | | | | | | | | | | | | | | | | | | | | | | | |
| Loan Type | Risk Rating (1) | Property Type | State | Par Value | Amortized
Cost | Origination Date (2) | Fully Extended Maturity (3) | Interest Rate (4) (5) | Effective Yield (6) | Loan to Value (7) |
| Senior Debt 1 | 3 | Hospitality | Wisconsin | $4,586 | $4,586 | 11/30/2017 | 3/9/2024 | Adj. 1M SOFR Term + 4.00% | 9.47% | 77.0% |
| Senior Debt 2 | 3 | Multifamily | Ohio | 35,212 | 35,212 | 4/23/2018 | 9/9/2025 | 1M SOFR Term + 4.50% | 9.85% | 83.6% |
| Senior Debt 3 | 2 | Hospitality | Louisiana | 21,796 | 21,796 | 6/28/2018 | 3/9/2025 | 1M SOFR Term + 4.25% | 9.60% | 68.8% |
| Senior Debt 4 | 2 | Office | New Jersey | 13,937 | 13,937 | 8/28/2018 | 9/9/2024 | 1M SOFR Term + 5.50% | 10.85% | 70.0% |
| Senior Debt 5 | 2 | Office | Maryland | 41,185 | 41,185 | 4/30/2019 | 5/9/2025 | 1M SOFR Term + 3.56% | 8.91% | 71.0% |
| Senior Debt 6 | 4 | Hospitality | Texas | 18,398 | 18,398 | 7/18/2019 | 1/9/2024 | 1M SOFR Term + 3.84% | 9.19% | 62.6% |
| Senior Debt 7 | 2 | Hospitality | Michigan | 12,900 | 12,900 | 9/17/2019 | 10/9/2025 | 1M SOFR Term + 4.41% | 9.76% | 56.4% |
| Senior Debt 8 | 2 | Hospitality | New York | 4,805 | 4,805 | 7/9/2019 | 7/9/2025 | 1M SOFR Term + 5.25% | 10.60% | 47.7% |
| Senior Debt 9 | 2 | Office | Arizona | 14,852 | 14,852 | 11/22/2019 | 12/9/2024 | 1M SOFR Term + 4.00% | 9.35% | 70.9% |
| Senior Debt 10 | 4 | Office | Georgia | 24,444 | 24,442 | 12/17/2019 | 1/9/2025 | Adj. 1M SOFR Term + 4.35% | 9.82% | 64.9% |
| Senior Debt 11 | 2 | Manufactured Housing | Arkansas | 1,301 | 1,301 | 4/22/2020 | 5/9/2025 | 5.50% | 5.50% | 62.8% |
| Senior Debt 12 | 3 | Self Storage | New York | 27,440 | 27,440 | 9/3/2020 | 1/9/2026 | Adj. 1M SOFR Term + 5.00% | 10.47% | 58.8% |
| Senior Debt 13 | 3 | Office | Texas | 17,103 | 17,103 | 10/6/2020 | 10/9/2025 | Adj. 1M SOFR Term + 4.50% | 9.97% | 47.9% |
| Senior Debt 14 | 2 | Office | Massachusetts | 63,274 | 63,146 | 10/8/2020 | 10/9/2025 | 5.15% | 5.15% | 52.5% |
| Senior Debt 15 | 3 | Office | Michigan | 30,186 | 30,186 | 10/14/2020 | 7/9/2025 | 1M SOFR Term + 2.81% | 8.16% | 66.0% |
| Senior Debt 16 | 2 | Office | Texas | 9,175 | 9,175 | 11/6/2020 | 11/9/2025 | Adj. 1M SOFR Term + 5.00% | 10.47% | 67.8% |
| Senior Debt 17 | 2 | Multifamily | Texas | 12,550 | 12,547 | 1/22/2021 | 2/9/2026 | Adj. 1M SOFR Term + 4.55% | 10.02% | 73.0% |
| Senior Debt 18 | 2 | Multifamily | Florida | 21,000 | 21,000 | 12/31/2020 | 1/9/2025 | Adj. 1M SOFR Term + 4.60% | 10.07% | 66.7% |
| Senior Debt 19 | 2 | Office | California | 10,855 | 10,855 | 12/31/2020 | 1/9/2024 | 1M SOFR Term + 5.56% | 10.91% | 63.9% |
| Senior Debt 20 | 4 | Office | Colorado | 44,913 | 44,892 | 3/1/2021 | 3/9/2026 | Adj. 1M SOFR Term + 3.97% | 9.43% | 53.9% |
| Senior Debt 21 | 3 | Multifamily | Arizona | 34,476 | 34,457 | 2/2/2021 | 2/9/2026 | 1M SOFR Term + 8.00% | 13.35% | N/A |
| Senior Debt 22 | 2 | Hospitality | North Carolina | 23,000 | 22,992 | 2/24/2021 | 3/9/2024 | Adj. 1M SOFR Term + 5.79% | 11.26% | 57.2% |
| Senior Debt 23 | 2 | Multifamily | Texas | 34,750 | 34,750 | 3/5/2021 | 3/9/2024 | 1M SOFR Term + 4.10% | 9.45% | 78.2% |
| Senior Debt 24 | 3 | Multifamily | Texas | 55,000 | 55,000 | 3/16/2021 | 5/9/2026 | 1M SOFR Term + 4.00% | 9.35% | 71.6% |
| Senior Debt 25 | 2 | Multifamily | Texas | 14,700 | 14,696 | 3/15/2021 | 4/9/2026 | Adj. 1M SOFR Term + 3.39% | 8.86% | 70.6% |
| Senior Debt 26 | 2 | Multifamily | Pennsylvania | 8,898 | 8,893 | 3/23/2021 | 4/9/2026 | Adj. 1M SOFR Term + 3.80% | 9.27% | 69.9% |
| Senior Debt 27 | 2 | Multifamily | Texas | 19,804 | 19,798 | 3/25/2021 | 4/9/2026 | Adj. 1M SOFR Term + 3.60% | 9.07% | 70.8% |
| Senior Debt 28 | 2 | Multifamily | Texas | 43,246 | 43,237 | 4/1/2021 | 4/9/2026 | Adj. 1M SOFR Term + 2.95% | 8.42% | 71.6% |
| Senior Debt 29 | 2 | Hospitality | Louisiana | 25,700 | 25,700 | 4/15/2021 | 5/9/2026 | Adj. 1M SOFR Term + 5.60% | 11.07% | 61.0% |
| Senior Debt 30 | 2 | Mixed Use | Washington | 32,500 | 32,500 | 6/30/2021 | 1/9/2026 | Adj. 1M SOFR Term + 3.70% | 9.17% | 69.7% |
| Senior Debt 31 | 2 | Multifamily | Texas | 75,927 | 75,901 | 3/31/2021 | 4/9/2026 | Adj. 1M SOFR Term + 2.95% | 8.42% | 72.6% |
| Senior Debt 32 | 3 | Multifamily | Texas | 20,450 | 20,426 | 4/22/2021 | 5/9/2026 | Adj. 1M SOFR Term + 3.60% | 9.07% | 67.7% |
| Senior Debt 33 | 2 | Multifamily | Texas | 30,320 | 30,310 | 3/31/2021 | 4/9/2026 | Adj. 1M SOFR Term + 2.95% | 8.42% | 70.4% |
| Senior Debt 34 | 2 | Multifamily | Texas | 35,466 | 35,459 | 4/1/2021 | 4/9/2026 | Adj. 1M SOFR Term + 2.95% | 8.42% | 71.7% |
| | | | | | | | | | | | | | | | | |
| Loan Type | Property Type | Par Value | Interest Rate (1) | Effective Yield (5) | Loan to Value (2) |
| Senior Debt 95 | Multifamily | 70,620 | 1 month LIBOR + 2.95% | 3.10% | 72.6% |
| Senior Debt 96 | Multifamily | 20,321 | 1 month LIBOR + 3.35% | 3.50% | 67.7% |
| Senior Debt 97 | Multifamily | 28,318 | 1 month LIBOR + 2.95% | 3.10% | 70.4% |
| Senior Debt 98 | Multifamily | 34,998 | 1 month LIBOR + 2.95% | 3.10% | 71.7% |
| Senior Debt 99 | Multifamily | 32,557 | 1 month LIBOR + 2.95% | 3.10% | 72.2% |
| Senior Debt 100 | Hospitality | 25,771 | 1 month LIBOR + 9.00% | 9.25% | 74.2% |
| Senior Debt 101 | Self Storage | 15,000 | 1 month LIBOR + 4.26% | 4.51% | 74.6% |
| Senior Debt 102 | Multifamily | 24,248 | 1 month LIBOR + 3.25% | 3.35% | 70.8% |
| Senior Debt 103 | Office | 6,800 | 1 month LIBOR + 5.25% | 5.50% | 67.3% |
| Senior Debt 104 | Multifamily | 12,792 | 1 month LIBOR + 6.50% | 7.00% | —% |
| Senior Debt 105 | Multifamily | 10,391 | 1 month LIBOR + 3.15% | 3.25% | 75.6% |
| Senior Debt 106 | Hospitality | 17,449 | 1 month LIBOR + 5.35% | 5.75% | 56.8% |
| Senior Debt 107 | Hospitality | 28,000 | 1 month LIBOR + 6.25% | 6.50% | 59.2% |
| Senior Debt 108 | Multifamily | 31,900 | 1 month LIBOR + 3.15% | 3.25% | 73.0% |
| Senior Debt 109 | Multifamily | 37,260 | 1 month LIBOR + 3.40% | 3.55% | 75.6% |
Senior Debt 110 (4) | Multifamily | — | 1 month LIBOR + 8.00% | 8.25% | —% |
| Senior Debt 111 | Multifamily | 29,500 | 1 month LIBOR + 2.88% | 2.98% | 68.0% |
| Senior Debt 112 | Multifamily | 10,050 | 1 month LIBOR + 4.50% | 4.65% | 77.3% |
| Senior Debt 113 | Multifamily | 13,259 | 1 month LIBOR + 3.75% | 3.85% | 76.9% |
| Senior Debt 114 | Multifamily | 29,250 | 1 month LIBOR + 3.00% | 3.10% | 73.5% |
| Senior Debt 115 | Multifamily | 34,077 | 1 month LIBOR + 3.15% | 3.25% | 71.0% |
| Senior Debt 116 | Multifamily | 42,850 | 1 month LIBOR + 3.40% | 3.50% | 79.9% |
| Senior Debt 117 | Multifamily | 35,020 | 1 month LIBOR + 3.64% | 3.74% | 66.0% |
| Senior Debt 118 | Multifamily | 8,500 | 1 month LIBOR + 3.75% | 4.00% | 79.4% |
| Senior Debt 119 | Multifamily | 14,200 | 1 month LIBOR + 3.15% | 3.25% | 79.8% |
| Senior Debt 120 | Multifamily | 13,350 | 1 month LIBOR + 3.75% | 3.85% | 64.2% |
| Senior Debt 121 | Multifamily | 66,650 | 1 month LIBOR + 3.25% | 3.35% | 77.1% |
| Senior Debt 122 | Multifamily | 18,750 | 1 month LIBOR + 2.95% | 3.05% | 72.1% |
| Senior Debt 123 | Multifamily | 9,099 | 1 month LIBOR + 3.75% | 3.95% | 70.0% |
| Senior Debt 124 | Multifamily | 26,160 | 1 month LIBOR + 3.20% | 3.30% | 77.3% |
| Senior Debt 125 | Hospitality | 17,370 | 1 month LIBOR + 5.25% | 5.35% | 61.0% |
| Senior Debt 126 | Hospitality | 16,500 | 1 month LIBOR + 7.10% | 7.20% | 73.0% |
| Senior Debt 127 | Multifamily | 13,168 | 1 month LIBOR + 3.40% | 3.50% | 78.2% |
| Senior Debt 128 | Multifamily | 88,500 | 1 month LIBOR + 2.75% | 2.85% | 50.3% |
| Senior Debt 129 | Multifamily | 56,150 | 1 month LIBOR + 3.10% | 3.20% | 78.9% |
| Senior Debt 130 | Multifamily | 36,750 | 1 month LIBOR + 2.90% | 3.00% | 72.2% |
| Senior Debt 131 | Multifamily | 52,192 | 1 month LIBOR + 3.10% | 3.20% | 67.2% |
| Senior Debt 132 | Multifamily | 37,100 | 1 month LIBOR + 2.90% | 3.00% | 72.0% |
| Senior Debt 133 | Multifamily | 60,267 | 1 month LIBOR + 2.85% | 2.95% | 70.6% |
| Senior Debt 134 | Multifamily | 30,600 | 1 month LIBOR + 2.65% | 2.75% | 59.1% |
| Senior Debt 135 | Multifamily | 30,650 | 1 month LIBOR + 3.25% | 3.35% | 80.0% |
| Senior Debt 136 | Multifamily | 62,850 | 1 month LIBOR + 3.35% | 3.45% | 78.0% |
| Senior Debt 137 | Multifamily | 42,474 | 1 month LIBOR + 3.00% | 3.10% | 74.8% |
| Senior Debt 138 | Multifamily | 46,080 | 1 month LIBOR + 2.75% | 2.85% | 68.1% |
| Senior Debt 139 | Multifamily | 28,880 | 1 month LIBOR + 2.90% | 3.00% | 74.2% |
| Senior Debt 140 | Manufactured Housing | 6,700 | 1 month LIBOR + 4.50% | 4.60% | 77.9% |
| Senior Debt 141 | Multifamily | 58,680 | 1 month LIBOR + 3.45% | 3.55% | 74.8% |
| Senior Debt 142 | Multifamily | 26,600 | 1 month LIBOR + 2.90% | 3.00% | 72.1% |
| | | | | | | | | | | | | | | | | | | | | | | | | | | | | | | | |
| Loan Type | Risk Rating (1) | Property Type | State | Par Value | Amortized
Cost | Origination Date (2) | Fully Extended Maturity (3) | Interest Rate (4) (5) | Effective Yield (6) | Loan to Value (7) |
| Senior Debt 35 | 2 | Multifamily | Texas | 33,588 | 33,582 | 4/1/2021 | 4/9/2026 | Adj. 1M SOFR Term + 2.95% | 8.42% | 72.2% |
| Senior Debt 36 | 2 | Multifamily | Florida | 152,112 | 151,644 | 5/26/2021 | 6/9/2026 | 1M SOFR Term + 4.55% | 9.90% | 47.8% |
| Senior Debt 37 | 2 | Hospitality | Florida | 36,750 | 36,713 | 5/20/2021 | 6/9/2026 | Adj. 1M SOFR Term + 6.25% | 11.72% | 59.2% |
| Senior Debt 38 | 2 | Multifamily | North Carolina | 35,116 | 34,990 | 7/22/2021 | 3/9/2027 | Adj. 1M SOFR Term + 8.00% | 13.47% | N/A |
| Senior Debt 39 | 2 | Multifamily | Texas | 16,453 | 16,453 | 10/6/2021 | 10/9/2026 | Adj. 1M SOFR Term + 3.75% | 9.22% | 76.9% |
| Senior Debt 40 | 2 | Multifamily | Pennsylvania | 47,984 | 47,901 | 9/10/2021 | 10/9/2026 | Adj. 1M SOFR Term + 3.15% | 8.62% | 71.0% |
| Senior Debt 41 | 2 | Multifamily | South Carolina | 41,650 | 41,650 | 9/2/2021 | 9/9/2025 | Adj. 1M SOFR Term + 3.40% | 8.87% | 79.9% |
| Senior Debt 42 | 3 | Multifamily | Texas | 34,760 | 34,713 | 9/20/2021 | 10/9/2024 | Adj. 1M SOFR Term + 3.64% | 9.11% | 66.0% |
| Senior Debt 43 | 2 | Multifamily | Oregon | 8,500 | 8,489 | 9/8/2021 | 9/9/2026 | Adj. 1M SOFR Term + 3.75% | 9.22% | 79.4% |
| Senior Debt 44 | 2 | Multifamily | Texas | 14,890 | 14,890 | 9/9/2021 | 9/9/2026 | Adj. 1M SOFR Term + 3.15% | 8.62% | 79.8% |
| Senior Debt 45 | 2 | Multifamily | South Carolina | 69,500 | 69,312 | 9/20/2021 | 10/9/2026 | Adj. 1M SOFR Term + 3.25% | 8.72% | 77.1% |
| Senior Debt 46 | 2 | Multifamily | Georgia | 11,325 | 11,306 | 9/22/2021 | 10/9/2026 | Adj. 1M SOFR Term + 3.75% | 9.22% | 70.0% |
| Senior Debt 47 | 2 | Multifamily | Texas | 27,199 | 27,160 | 9/30/2021 | 10/9/2026 | Adj. 1M SOFR Term + 3.20% | 8.67% | 77.3% |
| Senior Debt 48 | 2 | Hospitality | Texas | 17,122 | 17,122 | 9/30/2021 | 10/9/2026 | Adj. 1M SOFR Term + 5.25% | 10.72% | 61.0% |
| Senior Debt 49 | 2 | Multifamily | Texas | 56,150 | 56,071 | 9/30/2021 | 10/9/2026 | Adj. 1M SOFR Term + 3.10% | 8.57% | 78.9% |
| Senior Debt 50 | 2 | Multifamily | Texas | 38,242 | 38,116 | 10/14/2021 | 11/9/2026 | Adj. 1M SOFR Term + 2.90% | 8.37% | 72.2% |
| Senior Debt 51 | 3 | Multifamily | Texas | 55,394 | 55,394 | 11/23/2021 | 1/9/2027 | Adj. 1M SOFR Term + 3.10% | 8.57% | 67.2% |
| Senior Debt 52 | 3 | Multifamily | Arizona | 38,153 | 38,101 | 11/16/2021 | 12/9/2026 | Adj. 1M SOFR Term + 2.90% | 8.37% | 72.0% |
| Senior Debt 53 | 2 | Multifamily | Texas | 68,165 | 68,165 | 10/29/2021 | 11/9/2026 | Adj. 1M SOFR Term + 2.85% | 8.32% | 70.6% |
| Senior Debt 54 | 2 | Multifamily | Texas | 32,567 | 32,510 | 11/23/2021 | 12/9/2026 | Adj. 1M SOFR Term + 3.25% | 8.72% | 80.0% |
| Senior Debt 55 | 2 | Multifamily | South Carolina | 61,600 | 61,600 | 11/10/2021 | 11/9/2026 | Adj. 1M SOFR Term + 3.35% | 8.82% | 78.0% |
| Senior Debt 56 | 2 | Multifamily | Texas | 44,987 | 44,987 | 11/16/2021 | 12/9/2026 | Adj. 1M SOFR Term + 3.00% | 8.47% | 74.8% |
| Senior Debt 57 | 2 | Multifamily | Texas | 47,147 | 47,019 | 11/9/2021 | 11/9/2026 | Adj. 1M SOFR Term + 2.75% | 8.22% | 68.1% |
| Senior Debt 58 | 2 | Multifamily | New Jersey | 86,000 | 85,959 | 2/25/2022 | 3/9/2026 | 1M SOFR Term + 3.24% | 8.59% | 60.0% |
| Senior Debt 59 | 3 | Manufactured Housing | Georgia | 6,700 | 6,688 | 12/13/2021 | 12/9/2026 | Adj. 1M SOFR Term + 4.50% | 9.97% | 77.9% |
| Senior Debt 60 | 2 | Multifamily | Texas | 58,680 | 58,677 | 12/10/2021 | 1/9/2027 | Adj. 1M SOFR Term + 3.45% | 8.92% | 74.8% |
| Senior Debt 61 | 2 | Multifamily | Georgia | 26,068 | 26,068 | 11/30/2021 | 3/9/2024 | Adj. 1M SOFR Term + 2.90% | 8.37% | 72.1% |
| Senior Debt 62 | 2 | Multifamily | Kentucky | 14,933 | 14,905 | 11/19/2021 | 12/9/2026 | Adj. 1M SOFR Term + 3.20% | 8.67% | 62.4% |
| Senior Debt 63 | 2 | Multifamily | Texas | 38,283 | 38,219 | 11/22/2021 | 12/9/2026 | Adj. 1M SOFR Term + 3.00% | 8.47% | 73.3% |
| Senior Debt 64 | 4 | Multifamily | Texas | 42,235 | 42,234 | 11/18/2021 | 1/9/2027 | Adj. 1M SOFR Term + 2.90% | 8.37% | 71.7% |
| Senior Debt 65 | 3 | Multifamily | Texas | 69,415 | 69,415 | 11/30/2021 | 12/9/2026 | Adj. 1M SOFR Term + 2.88% | 8.35% | 74.8% |
| Senior Debt 66 | 2 | Multifamily | Texas | 66,742 | 66,742 | 11/30/2021 | 12/9/2026 | Adj. 1M SOFR Term + 2.88% | 8.35% | 75.5% |
| Senior Debt 67 | 2 | Multifamily | Texas | 17,145 | 17,144 | 12/30/2021 | 1/9/2027 | 1M SOFR Term + 3.50% | 8.85% | 71.7% |
| Senior Debt 68 | 3 | Multifamily | Michigan | 59,232 | 59,175 | 12/9/2021 | 12/9/2026 | Adj. 1M SOFR Term + 2.75% | 8.22% | 73.9% |
| Senior Debt 69 | 3 | Multifamily | Pennsylvania | 22,240 | 22,239 | 12/16/2021 | 1/9/2027 | 1M SOFR Term + 2.96% | 8.31% | 79.4% |
| Senior Debt 70 | 3 | Multifamily | Texas | 25,241 | 25,195 | 12/16/2021 | 1/9/2027 | 1M SOFR Term + 2.96% | 8.31% | 72.9% |
| | | | | | | | | | | | | | | | | |
| Loan Type | Property Type | Par Value | Interest Rate (1) | Effective Yield (5) | Loan to Value (2) |
| Senior Debt 143 | Multifamily | 12,478 | 1 month LIBOR + 3.20% | 3.30% | 62.4% |
| Senior Debt 144 | Multifamily | 35,996 | 1 month LIBOR + 3.00% | 3.10% | 73.3% |
| Senior Debt 145 | Multifamily | 32,250 | 1 month LIBOR + 3.20% | 3.30% | 74.5% |
| Senior Debt 146 | Multifamily | 38,631 | 1 month LIBOR + 2.90% | 3.00% | 71.7% |
| Senior Debt 147 | Multifamily | 64,281 | 1 month LIBOR + 2.88% | 2.98% | 74.8% |
| Senior Debt 148 | Multifamily | 62,003 | 1 month LIBOR + 2.88% | 2.98% | 75.5% |
| Senior Debt 149 | Multifamily | 16,570 | 1 month SOFR + 3.50% | 3.55% | 71.7% |
| Senior Debt 150 | Multifamily | 56,930 | 1 month LIBOR + 2.75% | 2.85% | 73.9% |
| Senior Debt 151 | Multifamily | 65,000 | 1 month SOFR + 5.14% | 5.19% | 74.7% |
| Senior Debt 152 | Multifamily | 22,240 | 1 month SOFR + 2.96% | 3.01% | 79.4% |
| Senior Debt 153 | Multifamily | 25,573 | 1 month SOFR + 2.96% | 3.01% | 72.9% |
| Senior Debt 154 | Multifamily | 31,678 | 1 month SOFR + 3.20% | 3.25% | 74.2% |
| Senior Debt 155 | Multifamily | 78,050 | 1 month SOFR + 3.45% | 3.50% | 78.8% |
| Senior Debt 156 | Multifamily | 77,870 | 1 month LIBOR + 3.21% | 3.31% | 76.1% |
| Senior Debt 157 | Multifamily | 24,000 | 1 month SOFR + 3.11% | 3.16% | 72.7% |
| Senior Debt 158 | Retail | 31,000 | 1 month SOFR + 3.29% | 3.34% | 42.5% |
| Senior Debt 159 | Multifamily | 47,444 | 1 month SOFR + 2.86% | 2.91% | 68.2% |
| Senior Debt 160 | Multifamily | 36,824 | 1 month SOFR + 2.86% | 2.91% | 69.7% |
| Senior Debt 161 | Hospitality | 17,169 | 5.99% | 5.99% | 52.9% |
| Mezzanine Loan 1 | Multifamily | 6,500 | 1 month LIBOR + 10.25% | 11.00% | 90.4% |
| Mezzanine Loan 2 | Multifamily | 3,000 | 1 month LIBOR + 9.20% | 10.00% | 62.2% |
| Mezzanine Loan 3 | Multifamily | 10,000 | 1 month SOFR + 15.29% | 15.34% | 86.2% |
| Mezzanine Loan 4 | Retail | 3,000 | 1 month SOFR + 12.00% | 12.05% | 46.6% |
| | $4,242,962 | | 4.33% | |
| | | | | | | | | | | | | | | | | | | | | | | | | | | | | | | | |
| Loan Type | Risk Rating (1) | Property Type | State | Par Value | Amortized
Cost | Origination Date (2) | Fully Extended Maturity (3) | Interest Rate (4) (5) | Effective Yield (6) | Loan to Value (7) |
| Senior Debt 71 | 2 | Multifamily | Texas | 32,428 | 32,425 | 12/16/2021 | 1/9/2027 | 1M SOFR Term + 3.20% | 8.55% | 74.2% |
| Senior Debt 72 | 2 | Multifamily | Florida | 78,416 | 78,167 | 12/21/2021 | 1/9/2027 | 1M SOFR Term + 3.45% | 8.80% | 78.8% |
| Senior Debt 73 | 2 | Multifamily | North Carolina | 81,247 | 81,164 | 12/15/2021 | 1/9/2027 | 1M SOFR Term + 3.21% | 8.56% | 76.1% |
| Senior Debt 74 | 2 | Multifamily | North Carolina | 24,000 | 23,999 | 12/17/2021 | 1/9/2027 | 1M SOFR Term + 3.10% | 8.45% | 72.7% |
| Senior Debt 75 | 2 | Retail | New York | 31,000 | 30,946 | 12/23/2021 | 1/9/2027 | 1M SOFR Term + 3.29% | 8.64% | 42.5% |
| Senior Debt 76 | 3 | Multifamily | Texas | 38,511 | 38,511 | 5/12/2022 | 8/9/2027 | 1M SOFR Term + 3.55% | 8.90% | 66.2% |
| Senior Debt 77 | 2 | Multifamily | Georgia | 23,855 | 23,848 | 1/28/2022 | 2/9/2027 | 1M SOFR Term + 2.95% | 8.30% | 65.6% |
| Senior Debt 78 | 2 | Multifamily | North Carolina | 11,100 | 11,097 | 1/14/2022 | 2/9/2027 | 1M SOFR Term + 3.30% | 8.65% | 75.7% |
| Senior Debt 79 | 3 | Multifamily | Texas | 47,444 | 47,442 | 12/21/2021 | 1/9/2027 | 1M SOFR Term + 2.86% | 8.21% | 68.2% |
| Senior Debt 80 | 2 | Multifamily | Texas | 36,824 | 36,821 | 12/22/2021 | 1/9/2027 | 1M SOFR Term + 2.86% | 8.21% | 69.7% |
| Senior Debt 81 | 2 | Hospitality | North Carolina | 10,504 | 10,481 | 1/19/2022 | 2/9/2027 | 1M SOFR Term + 5.30% | 10.65% | 68.2% |
| Senior Debt 82 | 2 | Multifamily | Florida | 82,000 | 81,989 | 2/10/2022 | 2/9/2027 | 1M SOFR Term + 3.20% | 8.55% | 74.5% |
| Senior Debt 83 | 2 | Industrial | Arizona | 55,000 | 54,973 | 3/15/2022 | 3/9/2027 | 1M SOFR Term + 3.50% | 8.85% | 70.1% |
| Senior Debt 84 | 2 | Multifamily | Texas | 39,864 | 39,843 | 3/14/2022 | 3/9/2027 | 1M SOFR Term + 3.10% | 8.45% | 74.1% |
| Senior Debt 85 | 2 | Multifamily | Arizona | 35,220 | 35,202 | 3/2/2022 | 3/9/2027 | 1M SOFR Term + 2.95% | 8.30% | 63.1% |
| Senior Debt 86 | 2 | Mixed Use | New York | 19,000 | 18,991 | 3/7/2022 | 3/9/2026 | 1M SOFR Term + 3.42% | 8.78% | 65.1% |
| Senior Debt 87 | 2 | Multifamily | North Carolina | 85,500 | 85,480 | 2/24/2022 | 3/9/2027 | 1M SOFR Term + 3.15% | 8.50% | 69.6% |
| Senior Debt 88 | 2 | Multifamily | North Carolina | 31,900 | 31,888 | 3/29/2022 | 4/9/2027 | 1M SOFR Term + 3.30% | 8.65% | 76.9% |
| Senior Debt 89 | 2 | Hospitality | Colorado | 30,021 | 29,741 | 5/20/2022 | 6/9/2027 | 1M SOFR Term + 7.05% | 12.40% | N/A |
| Senior Debt 90 | 2 | Multifamily | Texas | 13,558 | 12,691 | 7/20/2022 | 4/9/2027 | 1M SOFR Term + 6.75% | 12.10% | N/A |
| Senior Debt 91 | 2 | Hospitality | Georgia | 43,457 | 43,457 | 3/30/2022 | 4/9/2027 | 1M SOFR Term + 4.90% | 10.25% | 61.1% |
| Senior Debt 92 | 2 | Hospitality | New York | 15,634 | 15,568 | 11/8/2022 | 11/9/2027 | 1M SOFR Term + 5.34% | 10.69% | 57.7% |
| Senior Debt 93 | 3 | Multifamily | Nevada | 35,949 | 35,949 | 6/3/2022 | 6/9/2027 | 1M SOFR Term + 6.05% | 11.40% | 62.4% |
| Senior Debt 94 | 3 | Multifamily | Virginia | 56,616 | 56,479 | 4/29/2022 | 5/9/2027 | 1M SOFR Term + 3.95% | 9.30% | 73.2% |
| Senior Debt 95 | 3 | Multifamily | Texas | 29,905 | 29,816 | 10/21/2022 | 11/9/2027 | 1M SOFR Term + 4.00% | 9.35% | 70.9% |
| Senior Debt 96 | 2 | Multifamily | North Carolina | 56,859 | 56,806 | 8/23/2022 | 9/9/2027 | 1M SOFR Term + 6.70% | 12.05% | 46.5% |
| Senior Debt 97 | 2 | Multifamily | Texas | 12,536 | 12,523 | 5/2/2022 | 5/9/2027 | 1M SOFR Term + 3.55% | 8.90% | 67.7% |
| Senior Debt 98 | 2 | Industrial | Florida | 18,724 | 18,673 | 9/13/2022 | 9/9/2027 | 1M SOFR Term + 4.90% | 10.25% | 64.6% |
| Senior Debt 99 | 2 | Multifamily | Tennessee | 19,899 | 19,875 | 5/18/2022 | 6/9/2027 | 1M SOFR Term + 3.50% | 8.85% | 64.5% |
| Senior Debt 100 | 3 | Multifamily | Texas | 28,979 | 28,936 | 5/26/2022 | 6/9/2027 | 1M SOFR Term + 3.65% | 9.00% | 71.0% |
| Senior Debt 101 | 3 | Multifamily | Texas | 17,330 | 17,303 | 5/26/2022 | 6/9/2027 | 1M SOFR Term + 3.65% | 9.00% | 73.9% |
| Senior Debt 102 | 2 | Multifamily | Georgia | 70,750 | 70,673 | 5/18/2022 | 6/9/2027 | 1M SOFR Term + 3.80% | 9.15% | 77.9% |
| Senior Debt 103 | 4 | Multifamily | North Carolina | 83,914 | 83,810 | 6/1/2022 | 6/9/2027 | 1M SOFR Term + 3.95% | 9.30% | 71.8% |
| Senior Debt 104 | 3 | Multifamily | North Carolina | 45,469 | 45,414 | 6/1/2022 | 6/9/2027 | 1M SOFR Term + 3.95% | 9.30% | 75.9% |
| Senior Debt 105 | 4 | Multifamily | North Carolina | 58,003 | 57,930 | 6/1/2022 | 6/9/2027 | 1M SOFR Term + 3.95% | 9.30% | 73.7% |
| Senior Debt 106 | 3 | Multifamily | North Carolina | 20,716 | 20,688 | 6/1/2022 | 6/9/2027 | 1M SOFR Term + 3.95% | 9.30% | 75.1% |
| | | | | | | | | | | | | | | | | | | | | | | | | | | | | | | | |
| Loan Type | Risk Rating (1) | Property Type | State | Par Value | Amortized
Cost | Origination Date (2) | Fully Extended Maturity (3) | Interest Rate (4) (5) | Effective Yield (6) | Loan to Value (7) |
| Senior Debt 107 | 2 | Multifamily | Various | 146,810 | 146,608 | 6/1/2022 | 6/9/2027 | 1M SOFR Term + 3.95% | 9.30% | 67.8% |
| Senior Debt 108 | 2 | Multifamily | Kentucky | 56,000 | 55,938 | 6/1/2022 | 6/9/2027 | 1M SOFR Term + 3.80% | 9.15% | 73.8% |
| Senior Debt 109 | 2 | Multifamily | North Carolina | 11,675 | 11,661 | 11/3/2022 | 11/9/2027 | 1M SOFR Term + 4.45% | 9.80% | 74.8% |
| Senior Debt 110 | 2 | Multifamily | Georgia | 70,750 | 70,569 | 6/14/2022 | 6/9/2027 | 1M SOFR Term + 3.45% | 8.80% | 71.6% |
| Senior Debt 111 | 2 | Hospitality | District of Columbia | 39,525 | 39,346 | 8/2/2022 | 8/9/2027 | 1M SOFR Term + 6.94% | 12.29% | 71.2% |
Senior Debt 112 (8) | 2 | Multifamily | Pennsylvania | — | — | 2/17/2023 | 9/9/2026 | 1M SOFR Term + 6.31% | 11.66% | N/A |
| Senior Debt 113 | 2 | Hospitality | Alabama | 16,270 | 16,249 | 9/20/2022 | 10/9/2027 | 1M SOFR Term + 5.75% | 11.10% | 62.1% |
| Senior Debt 114 | 2 | Manufactured Housing | Florida | 11,617 | 11,587 | 9/13/2022 | 9/9/2027 | 1M SOFR Term + 4.75% | 10.10% | 53.8% |
Senior Debt 115 (8) | 2 | Hospitality | Texas | — | — | 1/31/2023 | 11/9/2027 | 1M SOFR Term + 7.50% | 12.85% | 6.2% |
| Senior Debt 116 | 2 | Multifamily | North Carolina | 48,764 | 48,684 | 12/29/2022 | 1/9/2028 | 1M SOFR Term + 4.20% | 9.55% | 70.1% |
| Senior Debt 117 | 2 | Multifamily | South Carolina | 51,000 | 50,875 | 12/2/2022 | 12/9/2027 | 1M SOFR Term + 3.75% | 9.10% | 64.6% |
| Senior Debt 118 | 2 | Multifamily | South Carolina | 14,635 | 14,594 | 12/16/2022 | 1/9/2027 | 1M SOFR Term + 4.25% | 9.60% | 68.1% |
| Senior Debt 119 | 2 | Hospitality | North Carolina | 28,300 | 28,297 | 12/15/2022 | 1/9/2025 | 1M SOFR Term + 5.25% | 10.60% | 54.9% |
| Senior Debt 120 | 2 | Multifamily | Arizona | 55,500 | 55,353 | 4/10/2023 | 4/9/2026 | 1M SOFR Term + 3.85% | 9.20% | 44.7% |
| Senior Debt 121 | 2 | Hospitality | Florida | 10,500 | 10,465 | 4/4/2023 | 4/9/2028 | 1M SOFR Term + 5.50% | 10.85% | 39.6% |
| Senior Debt 122 | 2 | Hospitality | Various | 120,000 | 119,559 | 2/9/2023 | 2/9/2028 | 1M SOFR Term + 4.90% | 10.25% | 53.6% |
| Senior Debt 123 | 2 | Multifamily | Florida | 64,500 | 64,388 | 4/19/2023 | 5/9/2025 | 1M SOFR Term + 5.00% | 10.35% | 62.3% |
| Senior Debt 124 | 2 | Hospitality | New York | 39,549 | 39,661 | 4/17/2023 | 12/27/2024 | 1M SOFR Term + 3.75% | 9.10% | 39.1% |
| Senior Debt 125 | 2 | Multifamily | District of Columbia | 21,700 | 21,616 | 6/30/2023 | 7/9/2027 | 1M SOFR Term + 3.95% | 9.30% | 29.4% |
| Senior Debt 126 | 2 | Manufactured Housing | Florida | 21,449 | 21,296 | 7/28/2023 | 8/9/2028 | 1M SOFR Term + 4.25% | 9.60% | 43.2% |
| Senior Debt 127 | 2 | Multifamily | New York | 19,793 | 19,881 | 6/28/2023 | 7/9/2028 | 4.75% | 4.75% | 85.7% |
| Senior Debt 128 | 2 | Multifamily | Texas | 78,996 | 78,664 | 8/1/2023 | 8/9/2028 | 1M SOFR Term + 3.20% | 8.55% | 58.7% |
| Senior Debt 129 | 2 | Hospitality | Florida | 23,000 | 22,861 | 8/10/2023 | 8/9/2028 | 1M SOFR Term + 5.45% | 10.80% | 72.8% |
| Senior Debt 130 | 2 | Hospitality | Georgia | 12,420 | 12,322 | 8/17/2023 | 9/9/2028 | 1M SOFR Term + 4.85% | 10.20% | 53.5% |
| Senior Debt 131 | 2 | Multifamily | Texas | 38,750 | 38,572 | 10/18/2023 | 11/9/2026 | 1M SOFR Term + 4.50% | 9.85% | 62.4% |
| Senior Debt 132 | 2 | Hospitality | Florida | 31,300 | 31,078 | 10/17/2023 | 11/9/2028 | 1M SOFR Term + 4.25% | 9.60% | 48.9% |
| Senior Debt 133 | 2 | Multifamily | Texas | 42,750 | 42,555 | 10/17/2023 | 11/9/2026 | 1M SOFR Term + 3.85% | 9.20% | 61.4% |
| Senior Debt 134 | 2 | Multifamily | Texas | 17,119 | 16,966 | 10/12/2023 | 10/9/2028 | 1M SOFR Term + 3.20% | 8.55% | 55.1% |
| Senior Debt 135 | 2 | Multifamily | Texas | 21,000 | 20,887 | 12/6/2023 | 12/9/2026 | 1M SOFR Term + 3.75% | 9.10% | 63.6% |
| Senior Debt 136 | 2 | Hospitality | Tennessee | 41,071 | 40,855 | 11/14/2023 | 12/9/2028 | 1M SOFR Term + 3.65% | 9.00% | 50.0% |
| Senior Debt 137 | 2 | Hospitality | Nevada | 25,750 | 25,595 | 12/15/2023 | 1/9/2028 | 1M SOFR Term + 3.95% | 9.30% | 42.4% |
| Senior Debt 138 | 3 | Hospitality | Illinois | 16,566 | 16,563 | 12/4/2017 | 10/6/2025 | 5.99% | 5.99% | 52.9% |
| Mezzanine Loan 1 | 2 | Retail | New York | 3,000 | 2,994 | 12/23/2021 | 1/9/2027 | 1M SOFR Term + 12.00% | 17.35% | 46.6% |
| Mezzanine Loan 2 | 2 | Mixed Use | New York | 1,000 | 1,000 | 3/7/2022 | 3/9/2026 | 1M SOFR Term + 11.00% | 16.35% | 68.5% |
| Mezzanine Loan 3 | 2 | Hospitality | New York | 1,350 | 1,346 | 11/8/2022 | 11/9/2027 | 1M SOFR Term + 9.25% | 14.60% | 64.6% |
Mezzanine Loan 4 (8) | 2 | Hospitality | Texas | — | — | 1/31/2023 | 11/9/2027 | 1M SOFR Term + 10.00% | 15.35% | 6.2% |
| Mezzanine Loan 5 | 3 | Multifamily | Ohio | 2,378 | 2,378 | 3/9/2023 | 9/9/2025 | 1M SOFR Term + 4.50% | 9.85% | 58.2% |
| | | | | | | | | | | | | | | | | | | | | | | | | | | | | | | | |
| Loan Type | Risk Rating (1) | Property Type | State | Par Value | Amortized
Cost | Origination Date (2) | Fully Extended Maturity (3) | Interest Rate (4) (5) | Effective Yield (6) | Loan to Value (7) |
| Mezzanine Loan 6 | 2 | Multifamily | District of Columbia | 11,700 | 11,655 | 6/30/2023 | 7/9/2027 | 1M SOFR Term + 3.95% | 9.30% | 45.2% |
| | | | $5,045,036 | $5,036,942 | | | | 9.18% | 65.4% |
_______________________(1) For a discussion of risk ratings, see Note 3 - Commercial Mortgage Loans in our Consolidated Financial Statements included in this Form 10-K.
(2) Date loan was originated or acquired by us. The origination or acquisition date is not updated for subsequent loan modifications.
(3) Fully extended maturity assumes all extension options are exercised by the borrower; provided, however, that our loans may be repaid prior to such date.
(4) Our floating rate loan agreements generally contain the contractual obligation for the borrower to maintain an interest rate cap to protect against rising interest rates. In a simple interest rate cap, the borrower pays a premium for a notional principal amount based on a capped interest rate (the “cap rate”). When the floating rate exceeds the cap rate, the borrower receives a payment from the cap counterparty equal to the difference between the floating rate and the cap rate on the same notional principal amount for a specified period of time. When interest rates rise, the value of an interest rate cap will increase, thereby reducing the borrower's exposure to rising interest rates.
(2)(5) LoanOn March 5, 2021, the Financial Conduct Authority of the U.K. (the “FCA”) announced that LIBOR tenors would cease to value percentage isbe published or no longer be representative. The Alternative Reference Rates Committee (the “ARRC”) interpreted this announcement to constitute a benchmark transition event. The benchmark index of LIBOR interest rate will convert from metrics at origination.
(3) The total commitmentLIBOR to compounded SOFR, plus a benchmark adjustment of this loan is $31.5 million, however none was funded as11.448 basis points. As of December 31, 2021.2023, all of our commercial mortgage loans, held for investment which had been indexed at LIBOR were converted to SOFR utilizing the 11.448 basis points adjustment and the applicable spreads remain unchanged. The loans which have the SOFR adjustment are indicated with "Adj. 1M SOFR Term."
(4)(6) The total commitment of this loan is $38.0 million, however none was funded as of December 31, 2021.
(5)Effective yield is calculated as the spread of the loan plus the highergreater of anythe applicable index or index floor.
(7) Loan-to-value percentage ("LTV") represents the ratio of the loan amount to the appraised value of the property at the time of origination. However, for predevelopment construction loans at origination, LTV is not applicable and is therefore nil.
(8) Commitment on the loan was unfunded as of December 31, 2023.
The following table shows selected data from our
commercial mortgage loans,real estate owned, held for
sale, measured at fair valueinvestment assets in our portfolio as of December 31,
20212023 (dollars in thousands):
| | | | | | | | | | | | | | | | | |
| Loan Type | Property Type | Par Value | Interest Rate | Effective Yield | Loan to Value (1) |
| TRS Senior Debt 1 | Office | $34,250 | 3.60% | 3.60% | 63.2% |
| | $34,250 | | 3.60% | |
________________________(1) Loan to value percentage is from metrics at origination.
We had no real estate securities, available for sale, measured at fair value as of December 31, 2021.
The following table shows selected data from our other real estate investments, measured at fair value as of December 31, 2021 (dollars in thousands): | | | | | | | | | | | |
| Type | Property Type | Par Value | Preferred Return |
| Preferred Equity 1 | Retail | $2,074 | 12.5% |
| | $2,074 | |
| | | | | | | | | | | | | | | | | | | | | | | | | | | | | | | | | | | | | | |
| Type | | Acquisition Date | | Primary Location(s) | | Property Type | | Real Estate Owned, Net | | Intangible Lease Asset, Net | | Total |
| Real Estate Owned 1 | | September 2021 | | Jeffersonville, GA | | Industrial | | $ | 85,444 | | | $ | 42,713 | | | $ | 128,157 | |
| Real Estate Owned 2 | | August 2023 | | Portland, OR | | Office | | 18,531 | | | — | | | 18,531 | |
| Real Estate Owned 3 | | October 2023 | | Lubbock, TX | | Multifamily | | 11,855 | | | 80 | | | 11,935 | |
| | | | | | | | $ | 115,830 | | | $ | 42,793 | | | $ | 158,623 | |
The following table shows selected data from our real estate owned, held for sale assets in our portfolio as of December 31, 20212023 (dollars in thousands): | | | | | | | | |
Type | Property Type | Carrying Value |
Real Estate Owned 1 | Industrial | $90,048 |
| | $90,048 |
| | | | | | | | | | | | | | | | | | | | | | | | | | | | | | | | |
| Type | | Acquisition Date | | Primary Location(s) | | Property Type | | Assets, Net | | Liabilities, Net |
| Real Estate Owned, held for sale 1 | | Various | | Various | | Retail | | $ | 103,657 | | | $ | 12,297 | |
The following
is a summary of the Company's RMBS, all of which were ARM Agency Securities, classified by collateral type and interest rate characteristicstable shows selected data from our real estate securities, CRE CLO bonds, measured at fair value as of December 31,
20212023 (dollars in thousands):
| | | | | | | | | | | |
| Type | Carrying
Amount | | Average Yield (1) |
| Agency Securities: | | | |
| Fannie Mae/Freddie Mac ARMs | $ | 4,246,803 | | | 0.02% |
| Ginnie Mae ARMs | 320,068 | | | 0.03% |
| $ | 4,566,871 | | | 0.02% |
________________________ | | | | | | | | | | | | | | | | | | | | | | | | | | | | | | | | |
| Type | | Interest Rate | | Maturity | | Par Value | | Fair Value | | Effective Yield |
| CRE CLO bond 1 | | 1 month SOFR + 2.78% | | 8/19/2035 | | $ | 30,000 | | | $ | 30,040 | | | 8.14% |
| CRE CLO bond 2 | | 1 month SOFR + 3.23% | | 8/19/2035 | | 25,000 | | | 24,637 | | | 8.59% |
| CRE CLO bond 3 | | 1 month SOFR + 2.90% | | 10/19/2039 | | 28,340 | | | 28,310 | | | 8.30% |
| CRE CLO bond 4 | | 1 month SOFR + 3.20% | | 5/25/2038 | | 50,000 | | | 49,875 | | | 8.55% |
| CRE CLO bond 5 | | 1 month SOFR + 2.37% | | 4/16/2028 | | 45,000 | | | 44,911 | | | 7.72% |
| CRE CLO bond 6 | | 1 month SOFR + 2.27% | | 9/19/2038 | | 53,000 | | | 52,827 | | | 7.63% |
| CRE CLO bond 7 | | 1 month SOFR + 3.10% | | 9/19/2038 | | 12,000 | | | 11,969 | | | 8.46% |
| | | | | | $ | 243,340 | | | $ | 242,569 | | | 8.12% |
During 2021, the Company sold trading securities using the specific identification method for proceeds totaling $1.9 billion recognizing $0.1 million in net realized gains. Subsequent to year end, until February 18, 2022, the Company sold trading securities using the same method for proceeds totaling $1.8 billion recognizing $12 million in net realized losses. The Company did not own any trading securities during 2020. As of February 18, 2022, the current market value of the Company's RMBS portfolio was $2.4 billion.
Liquidity and Capital Resources
Overview
Our expected material cash requirements forover the next twelve months ended December 31, 2022 and thereafter are comprisedcomposed of (i) contractually obligated expenditures,payments, including payments of principal and interest and contractually-obligated fundings on our loans; (ii) other essential expenditures, including operating and administrative expenses and dividends paid in accordance with REIT distribution requirements; and (iii) opportunistic expenditures,investments, including new loans.
Our contractually obligated expenditurespayments primarily consist of payment obligations under the debt financing arrangements which are set forth below, and included in the table below under “ContractualContractual Obligations and Commitments”Commitments.
We may from time to time purchase or retire outstanding debt securities and whichrepurchase or redeem our equity securities. Such purchases, if any, will depend on prevailing market conditions, liquidity requirements and other factors.
We closely monitor our liquidity position and believe that we have sufficient current liquidity and access to additional liquidity to meet our financial obligations for the next 12 months and beyond.
Debt-to-Equity Ratio and Total Leverage Ratio
The following table presents our debt-to-equity and total leverage ratios:
| | | | | | | | | | | | | | |
| | December 31, 2023 | | December 31, 2022 |
Net debt-to-equity ratio(1) | | 2.3x | | 2.5x |
Total leverage ratio(2) | | 2.5x | | 2.6x |
________________________
(1) Represents (i) total outstanding borrowings under secured financing arrangements, including collateralized loan obligations, repurchase agreements - commercial mortgage loans, repurchase agreements - real estate securities, asset-specific financing arrangements, and unsecured debt, less cash and cash equivalents, to (ii) total equity and total redeemable convertible preferred stock, at period end. Recourse net debt-to-equity ratio was 0.2x and 0.7x as of December 31, 2023 and December 31, 2022, respectively.
(2)Represents (i) total outstanding borrowings under secured financing arrangements, including collateralized loan obligations, repurchase agreements - commercial mortgage loans, repurchase agreements - real estate securities, asset-specific financing arrangements, and unsecured debt, to (ii) total equity and total redeemable convertible preferred stock, at period end. Recourse leverage ratio was 0.4x and 0.8x as of December 31, 2023 and December 31, 2022, respectively.
Sources of Liquidity
Our primary sources of liquidity include unrestricted cash, capacity in our collateralized loan obligations available for reinvestment, and funds available and in progress on financing lines.
Our current sources of near-term liquidity as of December 31, 2023 and December 31, 2022 are each describedset forth in more detailthe following table (dollars in millions):
| | | | | | | | | | | | | | |
| | December 31, 2023 | | December 31, 2022 |
| Unrestricted cash | | $ | 338 | | | $ | 179 | |
CLO reinvestment available(1) | | 55 | | | 16 | |
Financings available & in progress(2) | | 1,131 | | | 822 | |
| Total | | $ | 1,524 | | | $ | 1,017 | |
________________________
(1) See discussion below under “Repurchase Agreements, Commercial Mortgage Loans”, “Otherfor further information on the Company's collateralized loan obligations.
(2) Represents cash available to invest at a market advance rate utilizing available capacity on financing and loan participation - Commercial Mortgage Loans”, “Mortgage Note Payable”, “Unsecured Debt”, “Repurchase Agreements - Real Estate Securities”, and “Repurchase Agreements - Real Estate Securities Classified As Trading.”lines.
We expect to use operating cash flow, new or refinancedadditional debt (including collateral loan and debt obligation securitizations) and equity financing as a source of capital. Since we intend to continue to qualify as a REIT for federal income tax purposes, we will be required to annually distribute to our stockholders at least 90% of our REIT taxable income and we intend to distribute 100% of REIT taxable income. This will reduce the amount of operating cash flow available to fund our operations and growth initiatives after the payment of these distributions.
TheOur board of directors currently intends to operate at a leverage level of between one to three times book value of equity. However, our board of directors may change this target without shareholder approval. We anticipate that our debt and equity financing sources and our anticipated cash generated from operations will be adequate to fund our anticipated uses of capital.
We have usedan effective shelf registration statement for offerings of equity securities that is not limited on the amount of securities we may issue. We also have authorized an at-the-market sales program ("ATM") pursuant to which we may sell up to $200 million of shares of our common stock from time to time. We have not sold any shares of common stock under the ATM to date. We also may access liquidity through our dividend reinvestment and stock purchase plan ("DRIP"), which includes a direct stock purchase option.
In addition to our current mix of financing sources, we may in the future use variousalso access additional forms of incurring indebtedness,financings, including through repurchase agreements, credit facilities, securitizations, public and private, secured and unsecured debt issuances by usthe Company or our subsidiaries. We have generally relied on repurchase agreements to provide short-term debt financing for our commercial mortgage loans and utilized collateral loan and debt obligation securitizations for long-term match-funded financing.
With respect to equity,its subsidiaries, or through capital recycling initiatives whereby we may in the future issue common stock and/or preferred stock, including through an at-the-market offering program. We may also sell certain assets in our portfolio and reinvest the proceeds in assets with more attractive risk-adjusted returns. For example, we intend to reinvest the cash and proceeds from dividends, interest, repayments and sales of the assets acquired in the Capstead merger into our primary investment strategies.
As discussed in detail in Note 9 – Stock Transactions to the accompanying consolidated financial statements included in this Annual Report on Form 10-K, in October 2021 we closed our merger with Capstead. We intend to transition the equity invested in the assets we acquired from Capstead into our traditional investment strategies, including the origination of commercial real estate mortgages. Specifically, we intend to reinvest any dividend, interest and principal paid on such assets, and proceeds from the sale of such assets, into our current investment strategies. Until we fully transition this equity into our business, we expect that proceeds received from the sale of Capstead assets will be a significant source of capital.
We believe that our anticipated available operating cash flows, proceeds from sales of assets and debt and equity financing sources will be adequate to fund our short and long-term anticipated uses of capital.
Collateralized Loan Obligations
During 2021,the year ended December 31, 2023, the Company raised $1.3 billion of capital$896.6 million through the issuance of BSPRT 2021-FL62023-FL10 Issuer, Ltd. and BSPRT 2021-FL7 Issuer, Ltd.LLC. Additionally, as of December 31, 2021,2023, the Company had $46$54.5 million of reinvestment capital available across all outstanding collateralized loan obligations. The following table shows the par value outstanding for each CLO and the respective reinvestment end dates (dollars in millions):
| | | | | | | | | | | | | | |
| CLO Name | | Debt Amount | | Reinvestment End Date |
2019-FL5 Issuer(1) | | $ | — | | | Ended |
| 2021-FL6 Issuer | | $ | 558.0 | | | Ended |
| 2021-FL7 Issuer | | $ | 720.0 | | | 01/08/24 |
| 2022-FL8 Issuer | | $ | 960.0 | | | 03/08/24 |
| 2022-FL9 Issuer | | $ | 670.6 | | | 07/08/24 |
| 2023-FL10 Issuer | | $ | 689.3 | | | 04/08/25 |
________________________
(1) On July 17, 2023, the Company called all of the outstanding notes issued by BSPRT 2019-FL5 Issuer, Ltd, a wholly owned indirect subsidiary of the Company.
Repurchase Agreements Commercial Mortgage Loans
As of December 31, 2021, the Company has repurchase facilities with JPMorgan Chase Bank, National Association (the "JPM and Revolving Credit Facilities ("Repo Facility"), Barclays Bank PLC (the "Barclays Revolver Facility" and the "Barclays Repo Facility"), Wells Fargo Bank, National Association (the "WF Repo Facility"), andRevolving Credit Suisse AG (the "CS Repo Facility" and together with JPM Repo Facility, USB Repo Facility, WF Repo Facility, Barclays Revolver Facility, and Barclays Repo Facility, the "Repo Facilities").
The Repo and Revolving Credit Facilities are financing sources through which the Company may pledge one or more mortgage loans to the financing entity in exchange for funds typically at an advance rate ofthat typically range between 65%60% to 80%75% of the principal amount of the mortgage loan being pledged.
The Company expectsWe expect to use the advances from these Repo and Revolving Credit Facilities to finance the acquisition or origination of eligible loans, including first mortgage loans, subordinated mortgage loans, mezzanine loans and participation interests therein.
The Repo and Revolving Credit Facilities generally provide that in the event of a decrease in the value of our collateral, the lenders can demand additional collateral. Should the value of our collateral decrease as a result of deteriorating credit quality, resulting margin calls may cause an adverse change in our liquidity position.
The details offollowing tables summarize our Repo and Revolving Credit Facilities at December 31, 2021 and December 31, 2020 are as follows (dollars in thousands): | | | | | | | | | | | | | | | | | | | | | | | | | | | | | |
| As of December 31, 2021 | | | | | | | | | |
| Repurchase Facility | Committed Financing | | Amount Outstanding | | Interest Expense(1) | | Ending Weighted Average Interest Rate | | Term Maturity |
| JPM Repo Facility | $ | 400,000 | | | $ | 136,470 | | | $ | 5,178 | | | 2.13 | % | | 10/6/2022 |
| | | | | | | | | |
CS Repo Facility (2) | 300,000 | | | 137,364 | | | 3,446 | | | 2.43 | % | | 9/30/2022 |
WF Repo Facility (3) | 450,000 | | | 186,734 | | | 2,090 | | | 1.64 | % | | 11/21/2023 |
Barclays Revolver Facility (4) | 250,000 | | | 166,700 | | | 1,976 | | | 6.12 | % | | 9/20/2023 |
Barclays Repo Facility (5) | 500,000 | | | 392,332 | | | 4,057 | | | 1.76 | % | | 3/14/2025 |
| Total | $ | 1,900,000 | | | $ | 1,019,600 | | | $ | 16,747 | | | | | |
__________________________
(1) Forour master repurchase agreements ("MRAs") for the yearyears ended December 31, 2021. Includes amortization of deferred financing costs.
(2) On August 12,2023, 2022, and 2021, the Company exercised the extension option upon the satisfaction of certain conditions, and extended the term maturity to September 30, 2022. Additionally, on November 3, 2021 the committed financing amount was amended from $200 million to $300 million with the option to increase to $400 million at the Company's discretion.
(3) On October 15, 2021 the committed financing amount was increased from $175 million to $275 million. There are three more one-year extension options available at the Company's discretion.
(4) On September 8, 2021, the Company amended the maturity date to September 20, 2023. On December 1, 2021 the committed financing amount was increased from $100 million to $250 million. The Company may increase the total commitment amount by an amount between $100 million and $150 million for three month intervals, on an unlimited basis prior to maturity.
(5) On December 3, 2021 the Company amended the maturity date to March 14, 2025 and the committed financing amount was increased from $300 million to $500 million. There are two one-year extension options available at the Company's discretion.
| | | | | | | | | | | | | | | | | | | | | | | | | | | | | | | | |
| As of December 31, 2020 | | | | | | | | | | |
| Repurchase Facility | | Committed Financing | | Amount Outstanding | | Interest Expense(1) | | Ending Weighted Average Interest Rate | | Term Maturity |
JPM Repo Facility (2) | | $ | 300,000 | | | $ | 113,884 | | | $ | 5,020 | | | 2.54 | % | | 10/6/2022 |
USB Repo Facility (3) | | 100,000 | | | 5,775 | | | 599 | | | 2.40 | | | 6/15/2021 |
CS Repo Facility (4) | | 200,000 | | | 106,971 | | | 3,539 | | | 2.84 | % | | 8/19/2021 |
WF Repo Facility (5) | | 175,000 | | | 27,150 | | | 1,041 | | | 2.50 | % | | 11/21/2021 |
Barclays Revolver Facility (6) | | 100,000 | | | — | | | 387 | | | N/A | | 9/20/2021 |
Barclays Facility (7) | | 300,000 | | | 22,560 | | | 1,046 | | | 2.51 | % | | 3/15/2022 |
| Total | | $ | 1,175,000 | | | $ | 276,340 | | | $ | 11,632 | | | | | |
_______________________
(1) For the year ended December 31, 2020. Includes amortization of deferred financing costs.
(2) On October 6, 2020 the maturity date was amended to October 6, 2022.
(3) On June 9, 2020, the Company exercised the extension option upon the satisfaction of certain conditions, and extended the term maturity to June 15, 2021.
(4) On August 28, 2020, the Company exercised the extension option upon the satisfaction of certain conditions, and extended the term maturity to August 19, 2021. Additionally, in 2020 the committed financing amount was downsized from $300 million to $200 million.
(5) On November 17, 2020, the Company exercised the extension option upon the satisfaction of certain conditions, and extended the term maturity to November 21, 2021. There are two more one-year extension options available at the Company's discretion.
(6) There is one one-year extension option available at the Company's discretion.
(7) Includes two one-year extensions at the Company's option.
Other financing and loan participation - Commercial Mortgage Loans
On March 23, 2020, the Company transferred $15.2 million of its interest in a term loan to Sterling National Bank ("SNB") via a participation agreement. During 2020, the Company's outstanding loan increased resultant of future fundings, leading to an increase in amount outstanding via the participation agreement. The Company incurred $0.9 million of interest expense on SNB for the year ended December 31, 2021. As of December 31, 2021 and December 31, 2020 the outstanding participation balance was $37.9 million and $31.4 million, respectively. The loan matures on February 9, 2023.
Mortgage Note Payable
On October 15, 2019, the Company obtained a commercial mortgage loan for $29.2 million related to the real estate owned portfolio. The Company incurred $0.9 million of interest expense for the twelve months ended December 31, 2021. As of December 31, 2021 the loan has been assumed by the purchaser of the underlying asset and is no longer held by the Company (see Note 5 - Real Estate Owned).
On September 17, 2021, the Company, in connection with the consolidating joint venture (as discussed in Note 5 - Real Estate Owned), originated a $112.7 million mortgage note payable, of which $88.7 million is eliminated in consolidation (see Note 5 - Real Estate Owned). As of December 31, 2021 the Company incurred $0.2 million of interest expense, of which $0.2 million is eliminated in consolidation, for the twelve months ended December 31, 2021. The remaining mortgage note payable of $24 million is included in the consolidated balance sheets under the caption Mortgage note payable. As of December 31, 2021, the loan accrued interest at an annual rate of 3.1% and matures on October 9, 2024.
Unsecured Debt
In the merger with Capstead we acquired 30-year junior subordinated notes issued in 2005 and 2006 and maturing in 2035 and 2036, with a total face amount of $100.0 million. Note balances net of deferred issuance costs, and related weighted average interest rates as of the indicated dates (calculated including issuance cost amortization and adjusted for the effects of related derivatives held as cash flow hedges) were as follows (dollars in thousands):
| | | | | | | | | | | | | | | | | | | | | | | | | | |
| | December 31, 2021 | | December 31, 2020 |
| | Borrowings
Outstanding | | Average
Rate | | Borrowings
Outstanding | | Average
Rate |
| Junior subordinated notes maturing in: | | | | | | | | |
| October 2035 ($35,000 face amount) | | $ | 34,470 | | | 7.86 | % | | $ | — | | | — | % |
| December 2035 ($40,000 face amount) | | 39,474 | | | 7.63 | % | | — | | | — | % |
| September 2036 ($25,000 face amount) | | 24,650 | | | 7.67 | % | | — | | | — | % |
| | $ | 98,594 | | | 7.72 | % | | $ | — | | | — | % |
The notes are currently redeemable, in whole or in part, without penalty, at the Company’s option. Interest paid on unsecured debt, including related derivative cash flows, totaled $0.6 million for the twelve months ended December 31, 2021.
Pursuant to a lending and security agreement with Security Benefit Life Insurance Company ("SBL"), which was entered into in February 2020 and amended in March and August 2020, the Company may borrow up to $100.0 million at a rate of one-month LIBOR + 4.5%. The facility has a maturity of February 10, 2023 and is secured by a pledge of equity interests in certain of the Company’s subsidiaries. The Company incurred $2.0 million of interest expense on the lending agreement with SBL for the twelve months ended December 31, 2021. As of December 31, 2021 the outstanding balance was $50.0 million.
Repurchase Agreements - Real Estate Securities
The Company has entered into various Master Repurchase Agreements (the "MRAs") that allow the Company to sell real estate securities while providing a fixed repurchase price for the same real estate securities in the future. The repurchase contracts on each security under an MRA generally mature in 30-90 days and terms are adjusted for current market rates as necessary.
Below is a summary of the Company's MRAs as of December 31, 2021 and 2020 (dollars in thousands): | | | | | | | | | | | | | | | | | | | | | | | | | | | | | |
| | | | | | | Weighted Average |
| Counterparty | Amount Outstanding | | Accrued Interest | | Collateral Pledged (1) | | Interest Rate | | Days to Maturity |
| As of December 31, 2021 | | | | | | | | | |
| JP Morgan Securities LLC | $ | 19,025 | | | $ | 261 | | | $ | 24,087 | | | 1.14 | % | | 10 |
| Wells Fargo Securities, LLC | — | | | — | | | — | | | N/A | | N/A |
| Goldman Sachs International | — | | | 37 | | | — | | | N/A | | N/A |
| Barclays Capital Inc. | 15,286 | | | 526 | | | 19,131 | | | 1.21 | % | | 14 |
| Credit Suisse AG | — | | | — | | | — | | | N/A | | N/A |
| Citigroup Global Markets, Inc. | — | | | 81 | | | — | | | N/A | | N/A |
| Total/Weighted Average | $ | 34,311 | | | $ | 905 | | | $ | 43,218 | | | 1.17 | % | | 12 |
| | | | | | | | | |
| As of December 31, 2020 | | | | | | | | | |
| JP Morgan Securities LLC | $ | 33,791 | | | $ | 1,668 | | | $ | 43,612 | | | 1.75 | % | | 31 |
| Wells Fargo Securities, LLC | — | | | 1,057 | | | — | | | N/A | | N/A |
| Goldman Sachs International | 22,440 | | | 455 | | | 30,794 | | | 1.68 | % | | 16 |
| Barclays Capital Inc. | 76,809 | | | 2,102 | | | 97,244 | | | 1.71 | % | | 33 |
| Credit Suisse AG | — | | | 905 | | | — | | | N/A | | N/A |
| Citigroup Global Markets, Inc. | 53,788 | | | 2,532 | | | 71,723 | | | — | | | 29 |
| Total/Weighted Average | $ | 186,828 | | | $ | 8,719 | | | $ | 243,373 | | | 1.71 | % | | 33 |
________________________(1) Includes $43.2 million and $72.2 million of CLO notes, held by the Company, which is eliminated within the Real estate securities, at fair value line of the consolidated balance sheets as of as of December 31, 2021 and December 31, 2020, respectively.respectively:
Repurchase Agreements - Real Estate Securities Classified As Trading
As a result of the Capstead merger which closed on October 19, 2021, the Company acquired a significant portfolio of residential adjustable-rate mortgage pass-through securities issued and guaranteed by government-sponsored enterprises or by an agency of the federal government which the Company accounts for as real estate securities classified as trading. The Company pledges its real estate securities classified as trading as collateral for repurchase agreements with commercial banks and other financial institutions. Repurchase arrangements entered into by the Company involve the sale and a simultaneous agreement to repurchase the transferred assets at a future date and are accounted for as financings. The Company maintains the beneficial interest in the specific securities pledged during the term of each repurchase arrangement and receives the related principal and interest payments.
The terms and conditions of repurchase agreements are negotiated on a transaction-by-transaction basis when each such agreement is initiated or renewed. The amount borrowed is generally equal to the fair value of the securities pledged, as determined by the lending counterparty, less an agreed-upon discount, referred to as a “haircut.” Interest rates are generally fixed based on prevailing rates corresponding to the terms of the borrowings. Interest may be paid monthly or at the termination of an agreement at which time the Company may enter into a new agreement at prevailing haircuts and rates with the same lending counterparty or repay that counterparty and negotiate financing with a different lending counterparty. None of the Company’s lending counterparties are obligated to renew or otherwise enter into new agreements at the conclusion of existing agreements. In response to declines in fair value of pledged securities due to changes in market conditions or the publishing of monthly security pay-down factors, lending counterparties typically require the Company to post additional securities as collateral, pay down borrowings or fund cash margin accounts with the counterparties in order to re-establish the agreed-upon collateral requirements. These actions are referred to as margin calls. Conversely, in response to increases in fair value of pledged securities, the Company routinely margin calls its lending counterparties in order to have previously pledged collateral returned.
Repurchase agreements (and related pledged collateral, including accrued interest receivable), classified by collateral type and remaining maturities, and related weighted average borrowing rates as of the indicated dates were as follows (dollars in thousands):
| | | | | | | | | | | | | | | | | | | | | | | | | | |
| Collateral Type | | Collateral
Carrying
Amount | | Accrued
Interest
Receivable | | Borrowings
Outstanding | | Average
Borrowing
Rates |
| December 31, 2021 | | | | | | | | |
| Repurchase arrangements secured by Agency securities with maturities of 30 days or less | | $ | 4,327,020 | | | $ | 8,908 | | | $ | 4,144,473 | | | 0.13 | % |
| | $ | 4,327,020 | | | $ | 8,908 | | | $ | 4,144,473 | | | 0.13 | % |
| | | | | | | | |
| December 31, 2020 | | | | | | | | |
| Repurchase arrangements secured by Agency securities with maturities of 30 days or less | | $ | — | | | $ | — | | | $ | — | | | — | % |
| | $ | — | | | $ | — | | | $ | — | | | — | % |
As of December 31, 2021, the Company’s repurchase agreements collateralized by RMBS totaled $4.14 billion with 13 counterparties at average rates of 0.13%, before the effects of currently-paying interest rate swap agreements. Average repurchase agreements outstanding were $3.97 billion in 2021. Average repurchase agreements outstanding differed from respective year-end balances during the indicated periods primarily due to changes in portfolio levels and differences in the timing of portfolio acquisitions relative to portfolio runoff and asset sales. Interest paid on repurchase agreements, including related Derivative cash flows, totaled $1.24 million during the twelve months ended December 31, 2021.
The Company finances its residential mortgage investments primarily by borrowing under repurchase arrangements, the terms and conditions of which are negotiated on a transaction-by-transaction basis, when each such agreement is initiated or renewed.
Future agreements are dependent upon the willingness of lenders to participate in the financing of mortgage investments, lender collateral requirements and the lenders’ determination of the fair value of the investments pledged as collateral, which fluctuates with changes in interest rates and liquidity conditions within the commercial banking and mortgage finance industries. None of our repurchase agreement counterparties are obligated to renew or otherwise enter into new agreements at the conclusion of existing borrowings. Repurchase agreements averaged $3.97 billion during 2021 and ended the year at $4.14 billion, all maturing within 90 days. Average repurchase agreements can differ from period-end balances for a number of reasons including portfolio growth or contraction, as well as differences in the timing of portfolio acquisitions relative to portfolio runoff.
To help mitigate exposure to rising short-term interest rates, we economically hedge the portfolio of repurchase agreements using derivatives supplemented with longer-maturity repurchase agreements when available at attractive rates and terms. At year-end, we held $3.6 billion notional amount of portfolio financing-related interest rate swap agreements with contract expirations occurring at various dates through the Second quarter 2024 and a weighted average expiration of 18 months. At December 31, 2021, we expect to have no net cash obligations related to repurchase agreement-related interest rate swap agreements after considering the variable-rate payments owed to us under the agreements’ terms based on market interest rate expectations as of year-end.
Repurchase Agreements
The following tables summarize our Repurchase Agreements, Commercial Mortgage Loans, Trading Securities and our MRAs for the years ended December 31, 2021, December 31, 2020 and December 31, 2019 respectively:
| | As of December 31, 2021 |
| Amount Outstanding | | Average Outstanding Balance |
| Q1 | | Q2 | | Q3 | | Q4 | | Q1 | | Q2 | | Q3 | | Q4 |
| | As of December 31, 2023 | | | | As of December 31, 2023 |
| | Amount Outstanding | | | | Amount Outstanding | | Average Outstanding Balance |
| | Q1 | | | | Q1 | | Q2 | | Q3 | | Q4 | | Q1 | | Q2 | | Q3 | | Q4 |
| Repurchase Agreements, Commercial Mortgage Loans | Repurchase Agreements, Commercial Mortgage Loans | | $ | 152,925 | | | $ | 287,462 | | | $ | 550,156 | | | $ | 1,019,600 | | | $ | 340,485 | | | $ | 282,891 | | | $ | 331,871 | | | $ | 959,729 | |
| Repurchase Agreements, Real Estate Securities | Repurchase Agreements, Real Estate Securities | | $ | 88,272 | | | $ | 46,510 | | | $ | 46,531 | | | $ | 34,311 | | | $ | 123,322 | | | $ | 57,301 | | | $ | 46,527 | | | $ | 37,735 | |
| Repurchase Agreements, Real Estate Securities Classified As Trading | | $ | — | | | $ | — | | | $ | — | | | $ | 4,144,473 | | | $ | — | | | $ | — | | | $ | — | | | $ | 4,266,556 | |
| Repurchase Agreements, Real Estate Securities held as trading | |
| Total | |
| | As of December 31, 2020 |
| Amount Outstanding | | Average Outstanding Balance |
| Q1 | | Q2 | | Q3 | | Q4 | | Q1 | | Q2 | | Q3 | | Q4 |
| | As of December 31, 2022 | |
| | As of December 31, 2022 | |
| | As of December 31, 2022 | |
| | Amount Outstanding | | | | Amount Outstanding | | Average Outstanding Balance |
| | Q1 | | | | Q1 | | Q2 | | Q3 | | Q4 | | Q1 | | Q2 | | Q3 | | Q4 |
| Repurchase Agreements, Commercial Mortgage Loans | Repurchase Agreements, Commercial Mortgage Loans | | $ | 234,524 | | | $ | 226,224 | | | $ | 183,033 | | | $ | 276,340 | | | $ | 282,282 | | | $ | 238,280 | | | $ | 197,632 | | | $ | 279,187 | |
| Repurchase Agreements, Real Estate Securities | Repurchase Agreements, Real Estate Securities | | $ | 496,880 | | | $ | 335,256 | | | $ | 177,541 | | | $ | 186,828 | | | $ | 412,809 | | | $ | 351,202 | | | $ | 316,229 | | | $ | 183,632 | |
| Repurchase Agreements, Real Estate Securities held as trading | |
| Total | |
| | As of December 31, 2019 |
| Amount Outstanding | | Average Outstanding Balance |
| Q1 | | Q2 | | Q3 | | Q4 | | Q1 | | Q2 | | Q3 | | Q4 |
| | As of December 31, 2021 | |
| | As of December 31, 2021 | |
| | As of December 31, 2021 | |
| | Amount Outstanding | | | | Amount Outstanding | | Average Outstanding Balance |
| | Q1 | | | | Q1 | | Q2 | | Q3 | | Q4 | | Q1 | | Q2 | | Q3 | | Q4 |
| | Repurchase Agreements, Commercial Mortgage Loans | Repurchase Agreements, Commercial Mortgage Loans | | $ | 370,889 | | | $ | 132,870 | | | $ | 111,937 | | | $ | 252,543 | | | $ | 357,850 | | | $ | 337,970 | | | $ | 132,126 | | | $ | 214,812 | |
| | | Repurchase Agreements, Commercial Mortgage Loans | |
| | Repurchase Agreements, Commercial Mortgage Loans | |
| | Repurchase Agreements, Real Estate Securities | Repurchase Agreements, Real Estate Securities | | $ | 22,078 | | | $ | 85,022 | | | $ | 244,308 | | | $ | 394,359 | | | $ | 52,711 | | | $ | 84,179 | | | $ | 181,198 | | | $ | 324,545 | |
| | Repurchase Agreements, Real Estate Securities | |
| | Repurchase Agreements, Real Estate Securities | |
| Repurchase Agreements, Real Estate Securities held as trading | |
| Total | |
|
The use of our repurchase facilitieswarehouse lines is dependent upon a number of factors including but not limited to: origination volume, loan repayments and prepayments, our use of other financing sources such as collateralized loan obligations, our liquidity needs and types of loan assets and underlying collateral that we hold.
During the twelve months ended December 31, 2023, the maximum monthly average outstanding balance was $1.2 billion, of which $0.9 billion was related to repurchase agreements on our commercial mortgage loans and $0.3 billion for repurchase agreements on our real estate securities.
During the twelve months ended December 31, 2022, the maximum monthly average outstanding balance was $5.3 billion, of which $1.1 billion was related to repurchase agreements on our commercial mortgage loans and $4.2 billion for repurchase agreements on our real estate securities.
During the twelve months ended December 31, 2021, the maximum monthly average outstanding balance was $5.84$5.8 billion, of which $0.680.7 billion was related to repurchase agreements on our commercial mortgage loans and $0.04$5.1 billion for repurchase agreements on our real estate securitiessecurities.
Distributions
In order to maintain our election to qualify as a REIT, we must currently distribute, at a minimum, an amount equal to 90% of our taxable income, without regard to the deduction for distributions paid and $5.12 billion for repurchase agreements on our real estate securities held for trading.
During the twelve months ended December 31, 2020 the maximum monthly average outstanding balance was $721.0 million,excluding net capital gains. The Company must distribute 100% of which $268.2 million was relatedits taxable income (including net capital gains) to repurchase agreements on our commercial mortgage loans and $452.8 million for repurchase agreements on our real estate securities.
During the twelve months ended December 31, 2019, the maximum monthly average outstanding balance was $612.0 million, at the end of November 30, 2019, of which $266.6 million was related to repurchase agreements on our commercial mortgage loans and $345.4 million for repurchase agreements on our real estate securities.avoid paying corporate U.S. federal income taxes.
Cash FlowsDistributions on our common stock are payable when declared by our board of directors.
Cash FlowsDividends payable on each share of Series H convertible preferred stock ("Series H Preferred Stock") is generally equal to the quarterly dividend that would have been paid had such share of preferred stock been converted to a share of common stock, except to the extent common stock dividends have been reduced below certain specified levels. To the extent dividends on shares of preferred stock are not authorized and declared by our board of directors and paid by the Company monthly, the dividend amounts will accrue.
Holders of shares of the Company's 7.50% Series E Cumulative Redeemable Preferred Stock ("Series E Preferred Stock") are entitled to receive, when, as and if authorized by our board of directors and declared by the Company, out of funds legally available for the Year Endedpayment of dividends, cumulative cash dividends at the rate of 7.50% of the $25.00 per share liquidation preference per annum (equivalent to $1.875 per annum per share).
In December 2023, the Company's board of directors declared the following: (i) a fourth quarter 2023 dividend of $0.355 per share on the Company's common stock (equivalent to $1.42 per annum), (ii) a fourth quarter 2023 dividend of $106.22 per share on the Company’s Series H Preferred Stock, and (iii) a fourth quarter 2023 dividend of $0.46875 per share on the Company’s Series E Preferred Stock, all of which were paid in January 2024 to holders of record as of December 31, 20212023.
Net cash providedUnder the Company's dividend reinvestment and direct stock purchase plan ("DRIP"), the Company may elect to supply shares for reinvestment via newly issued shares of common stock under the DRIP or via shares of common stock acquired by operating activities forthe DRIP administrator on the open market. During the years ended December 31, 2023, 2022 and 2021, the Company issued 61,866 shares, 72,764 shares and zero shares, respectively, of common stock under the dividend reinvestment component of DRIP.
During the year ended December 31, 2021 was $146.5 million. 2023 and 2022, the Company paid an aggregate of $118.0 million and $87.8 million, respectively, of common stock distributions.
Cash inflowsFlows
The following table sets forth changes in cash, cash equivalents and restricted cash for the years ended December 31, 2023 and 2022:
| | | | | | | | | | | |
| For the Year Ended December 31, |
| 2023 | | 2022 |
| Cash Flows From Operating Activities | $ | 197,387 | | | $ | 152,515 | |
| Cash Flows From Investing Activities | 380,807 | | | 3,097,265 | |
| Cash Flows From Financing Activities | (424,994) | | | (3,227,492) | |
| Net Increase (Decrease) in Cash, Cash Equivalents, and Restricted Cash | $ | 153,200 | | | $ | 22,288 | |
Cash Flows from Operating Activities
Our cash flows from operating activities were primarily driven by net income of $25.7$144.5 million, net proceeds of $33.4$19.5 million related to originations and sales of commercial mortgage loans, measured at fair value and $33.7 million related to provision for credit losses which is a non-cash adjustmenttransaction.
During the year ended December 31, 2022, cash flows from operating activities were primarily driven by net income of $34.8$14.2 million, net proceeds of $18.1 million related to originations and sales of commercial mortgage loans, measured at fair value and $119.2 million related to trading losses on real estate securities.
NetCash Flows from Investing Activities
Our cash provided byflows from investing activities for the year ended December 31, 2021 was $1,068.7 million. Cashconsisted of cash inflows were primarily driven by proceeds from principal repayments of $1,225.6$1,065.5 million received on commercial mortgage loans, held for investment, proceeds received from the sale/repaymentsale of real estate securities of $2,059.4$418.8 million, $541.3proceeds from the sale of other real estate investments of $39.8 million and $17.7 million received from principal collateral on mortgage investments and cash acquired of $174.1 million related to the merger with Capstead.investments. Inflows were partially offset by the origination and acquisition of $2,881.9$936.3 million of commercial mortgage loans.loans, held for investment and the purchase of real estate securities for $223.8 million.
Net cash used in financing activities forDuring the year ended December 31, 2021 was $1,139.2 million. Cash outflows were primarily driven by net payment on CMBS repurchase agreements of $2,429.3 million, $68.0 million in2022, cash distributions to stockholders and $11.4 million of stock repurchases. Outflows were offset by $6.5 million of proceeds received from borrowing on other financing and loan participation for commercial mortgage loans, $23.9 million from borrowing on mortgage note payable and net proceeds of $743.3 million and $540.3 million received from repurchase agreements on commercial mortgage loans and CLOs, respectively.
Cash Flows for the Year Ended December 31, 2020
Net cash provided by operating activities for the year ended December 31, 2020 was $115.3 million. Cash inflows were primarily driven by net income of $54.7 million and net proceeds of $44.7 million related to originations of and proceeds from sales of commercial mortgage loans, measured at fair value.
Net cash provided by investing activities for the year ended December 31, 2020 was $240.7 million. Cash inflows were primarily driven by proceeds from principal repayments of $1,228.2$1,258.4 million received on commercial mortgage loans, held for investment, proceeds received from the sale/repaymentsale of real estate securities of $346.2$3,731.7 million, $77.2$545.4 million of proceeds received from theprincipal collateral on mortgage investments and proceeds from sale of commercial mortgage loans, held for sale, and $22.5 million of proceeds received from sale of real estate owned assets.$9.3 million. Inflows were partially offset by the origination and acquisition of $1,281.2$2,227.7 million of commercial mortgage loans, held for investment and the purchase of real estate securities of $148.6for $220.6 million.
Cash Flows from Financing Activities
Our cash used inoutflows from financing activities were primarily driven by net repayments on repurchase agreements for real estate securities, commercial mortgage loans and other financings of $266.0 million, $381.2 million and $39.8 million, respectively, $144.3 million in cash distributions to stockholders, repayments on unsecured debt of $13.4 million, deferred financing cost payments of $12.9 million and $12.5 million of common stock repurchases. Outflows were partially offset by net proceeds of $448.1 million received from repurchase agreements on CLOs.
During the year ended December 31, 2020 was $373.0 million. Cash2022, cash outflows were primarily driven by repaymentsnet payments on CLOs of $182.7 million, net payment on CMBS repurchase agreements for real estate securities and commercial mortgage loans of $207.5$3,738.8 million $49.8and $$338.7 million, respectively, $139.4 million in cash distributions to stockholders and $10.3$16.6 million of common stock repurchases. Outflows were partially offset by $31.4$38.5 million of proceeds received from borrowingborrowings on other financing and loan participation for commercial mortgage loans $11.7 million from borrowing on mortgage note payable and net proceeds of $23.8$968.2 million received from repurchase agreements on commercial mortgage loans.CLOs.
Election as a REIT
We elected to be taxed as a REIT under Sections 856 through 860 of the Internal Revenue Code commencing with the taxable year ended December 31, 2013. As a REIT, if we meet certain organizational and operational requirements and distribute at least 90% of our "REIT taxable income" (determined before the deduction of dividends paid and excluding net capital gains) to our stockholders in a year, we will not be subject to U.S. federal income tax to the extent of the income that we distribute. Even if we qualify for taxation as a REIT, we may be subject to certain state and local taxes on our income and property, and U.S. federal income and excise taxes on our undistributed income.
Contractual Obligations and Commitments
Our contractual obligations, excluding interest obligations (as amounts are not fixed or determinable), as of December 31, 20212023 are summarized as follows (dollars in thousands): | | Less than 1 year | | 1 to 3 years | | 3 to 5 years | | More than 5 years | | Total |
| | Less than 1 year | | | | Less than 1 year | | 1 to 3 years | | 3 to 5 years | | More than 5 years | | Total |
Unfunded loan commitments (1) | Unfunded loan commitments (1) | | $ | — | | | $ | 149,724 | | | $ | 308,381 | | | $ | — | | | $ | 458,105 | |
| | Repurchase agreements - commercial mortgage loans | |
| Repurchase agreements - commercial mortgage loans | |
| Repurchase agreements - commercial mortgage loans | Repurchase agreements - commercial mortgage loans | | 627,268 | | | — | | | 392,332 | | | — | | | 1,019,600 | |
| Repurchase agreements - real estate securities | Repurchase agreements - real estate securities | | 4,178,784 | | | — | | | — | | | — | | | 4,178,784 | |
CLOs (2) | CLOs (2) | | — | | | — | | | — | | | 2,179,514 | | | 2,179,514 | |
| Mortgage Note Payable | Mortgage Note Payable | | — | | | — | | | — | | | 23,998 | | | 23,998 | |
| Unsecured debt | Unsecured debt | | — | | | — | | | — | | | 150,000 | | | 150,000 | |
| Other financing and loan participation - commercial mortgage loans | Other financing and loan participation - commercial mortgage loans | | — | | | 37,903 | | | — | | | — | | | 37,903 | |
| Total | Total | | $ | 4,806,052 | | | $ | 187,627 | | | $ | 700,713 | | | $ | 2,353,512 | | | $ | 8,047,904 | |
(1) The allocation of our unfunded loan commitments is based on the earlier of the commitment expiration date or the loan maturity date.
(2) Excludes $320.6$495.0 million of CLO notes, held by the Company, which are eliminated within the collateralizedin Collateralized loan obligation line ofobligations in the consolidated balance sheets as of December 31, 2021.2023.
In addition to its cash requirements, the Company pays a quarterly dividend and has an existing share repurchase authorization. As of December 31, 2021,2023, the Company’s quarterly cash dividend was $0.355$0.355 per share of common stock (which was paid on an as-converted basis on the Company’s shares of Series C convertible preferred stock ("Series CH Preferred Stock"), Series D convertible preferred stock ("Series D Preferred Stock") and Series F convertible preferred stock ("Series F Preferred Stock"))Stock), and $0.46875$0.46875 per share on the Company’s shares of 7.50% Series E Cumulative Redeemable Preferred Stock ("Series E Preferred Stock").Stock. The payment of future dividends is subject to declaration by the Board of Directors. The Company’s Board of Directors also has authorized a $65.0$65.0 million share repurchase program, that will be operative following the conclusion of the $35.0which $35.9 million open market share purchase program the Advisor agreed to implement in connection with the Company’s merger with Capstead. remained available as of December 31, 2023. The authorization does not obligate the Company to acquire any specific number of shares.
Related Party Arrangements
Benefit Street Partners L.L.C.
Amended Advisory Agreement
Refer to “Note 11 - Related Party Transactions and Arrangements” for a summary of the Company’s Advisory Agreement with the Advisor and amounts paid to the Advisor pursuant to the Advisory Agreement for the years ended December 31, 20212023 and December 31, 2020.2022.
The Nominating and Corporate Governance Committee (the “Committee”) of the Company's board of directors, which consists solely of the Company’s independent directors, negotiated, approved and recommended that the board of directors approve, the amended Advisory Agreement. The Committee engaged independent legal counsel to assist the Committee in negotiating the amended Advisory Agreement.
Pursuant to the amended Advisory Agreement, the Advisor provides the daily management for the Company and the Operating Partnership, including an investment program consistent with the investment objectives and policies of the Company as determined and adopted from time to time by the board of directors. The initial term of the amended Advisory Agreement was three-years and was automatically renewed for an additional one-year period on January 19, 20222024 and will continue to automatically renew for additional one-year periods unless either party elects not to renew.
The Company may terminate the amended Advisory Agreement for a Cause Event (as defined in the amended Advisory Agreement) without payment of a termination fee. Following the expiration of a term, and upon 180 days’ prior written notice, the Company may, without cause, elect not to renew the amended Advisory Agreement upon the determination by two-thirds of the Company’s independent directors that (i) there has been unsatisfactory performance by the Advisor or (ii) that the asset management fee and annual subordinated performance fee payable to the Advisor are not fair, subject to certain conditions. In such case, the Company shall be obligated to pay a termination fee.
During the term of the amended Advisory Agreement, the Advisor shall not, directly or indirectly, manage or advise another REIT that is engaged in the business of the Company in any geographical region in which the Company has a significant investment, or provide any services related to fixed-rate conduit lending to any other person, subject to certain conditions.
Advisory Agreement Fees and Reimbursements
Pursuant to the Advisory Agreement, the Company is or was required to make the following payments and reimbursements to the Advisor:
•The Company reimburses the Advisor’s costs of providing services pursuant to the Advisory Agreement, except the salaries and benefits paid by the Advisor to the Company's executive officers.
•The Company pays the Advisor, or its affiliates, a monthly asset management fee equal to one-twelfth of 1.5% of stockholders' equity as calculated pursuant to the Advisory Agreement.
•The Company will pay the Advisor an annual subordinated performance fee calculated on the basis of total return to stockholders, payable monthly in arrears, such that for any year in which total return on stockholders’ capital (as defined in the Advisory Agreement) exceeds 6.0% per annum, the Advisor will be entitled to 15.0% of the excess total return; provided that in no event will the annual subordinated performance fee payable to the Advisor exceed 10.0% of the aggregate total return for such year.
•The Company reimburses the Advisor for insourced expenses incurred by the Advisor on the Company's behalf related to selecting, evaluating, originating and acquiring investments in an amount up to 0.5% of the principal amount funded by the Company to originate or acquire commercial mortgage loans and up to 0.5% of the anticipated net equity funded by the Company to acquire real estate securities investments.
Investment in Common and Preferred Stock
Refer to Note 9 - StockOther Transactions for a description of the Company’s private placements. Officers of the Company and other employees of the Advisor and its affiliates (“Manager Investors”), as well as members of the Company's board of directors, have acquired common stock and Series A Convertible Preferred Stock (“Series A Preferred Stock”) in these private placements on substantially the same terms applying to purchases by third party accredited investors unaffiliated with the Company or the Advisor. On October 19, 2021, each share of Series A Preferred Stock converted into 299.2 shares of common stock, pursuant to the terms of the Articles Supplementary for the Series A Preferred Stock, and no shares of Series A Preferred Stock were outstanding as of December 31, 2021.
The Manager Investors have agreed with the Advisor not to sell or otherwise transfer the securities purchased in the private placement without the consent of the Advisor, prior to 180 days after the listing of the Company’s common stock on the NYSE.
The board of directors and the Nominating and Corporate Governance Committee of the board of directors each reviewed and unanimously approved the Company’s issuance of shares to the Manager Investors and the terms of the offering.
Lending Agreement with Stockholder
Pursuant to a lending and security agreement with Security Benefit Life Insurance Company ("SBL"), which was entered into in February 2020 and amended in March and August 2020, the Company may borrow up to $100.0 million at a rate of one-month LIBOR + 4.5%. The facility has a maturity of February 10, 2023 and is secured by a pledge of equity interests in certain of the Company’s subsidiaries. The Company incurred $2.0 million and $0.2 million of interest expense on the lending agreement with SBL for the years ended December 31, 2021 and 2020, respectively. As of December 31, 2021 there was a $50.0 million outstanding balance under the lending agreement.
SBL also holds 17,950 of the Company’s outstanding shares of Series D Preferred Stock. SBL acquired these shares in March 2021: 14,950 shares were acquired in exchange for an equivalent number of shares of Series A Preferred Stock and 3,000 shares of Series D Preferred Stock were purchased at the liquidation preference of $15.0 million (net of accrued and unpaid dividends on the exchanged Series A Preferred Stock) in the same transaction.
Acquisitions
In Augustthe third quarter of 2021, the Company and an investment fund managed byaffiliate of the AdvisorCompany entered into a joint venture agreement and formed a joint venture entity,the Jeffersonville Member, LLC (the "Jeffersonville JV")JV to acquire a $139.5 million triple net lease property in Jeffersonville, GA. The Company has a 79% interest in the Jeffersonville JV, while the affiliated fund has a 21% interest. The Company invested a total of $109.8 million, made up of $88.7 million in debt and $21.1 million in equity, representing 79% of the ownership interest in the Jeffersonville JV. The affiliated fund made up the remaining $29.8 million composed of a $24.0 million mortgage note payable and $5.7$5.8 million in equity.non-controlling interest. The Company has majority control of Jeffersonville JV with 79% ownership and, therefore, consolidates the accounts of Jeffersonville JV onin its consolidated balance sheet.financial statements. The Company's $88.7 million mortgage note payable to Jeffersonville JV is eliminated in consolidation (see Note 7 - Debt).
Pursuant to the Company's 2021 Incentive Plan, in the first quarter of 2023, the Company issued awards of restricted stock units to its officers and certain other personnel of the Advisor who provide services to the Company under the Advisory Agreement.
As of December 31, 2023, our commercial mortgage loans, held for investment, includes an aggregate of $124.1 million carrying value of loans to affiliates of our Advisor. The Company recognized $10.0 million and $5.0 million in interest income from these loans for the year ended December 31, 2023 and 2022 respectively, in the consolidated statements of operations.
As disclosed in Note 3 - Commercial Mortgage Loans in April 2022, the Company fully funded a $113.2 million first mortgage consisting of the Walgreens Portfolio with various locations throughout the United States. The Company entered into a joint venture agreement and formed a joint venture entity, BSPRT Walgreens Portfolio, LLC to acquire 75.618% ownership interest in the Walgreens Portfolio, while the affiliated fund has 24.242% interest (see Note 5 - Real Estate Owned).
The table below shows the costs incurred due to arrangements with our Advisor and its affiliates during the years ended December 31, 2021, 20202023, 2022 and 20192021 and the associated amounts payable as of December 31, 20212023 and 20202022 (dollars in thousands). See Note 11 - Related Party Transactions and Arrangements for further detail. | | Year Ended December 31, | | Payable as of December 31, |
| 2021 | | 2020 | | 2019 | | 2021 | | 2020 |
| | Year Ended December 31, | | | | Year Ended December 31, | | Payable as of December 31, |
| | 2023 | | | | 2023 | | 2022 | | 2021 | | 2023 | | 2022 |
Acquisition expenses (1) | Acquisition expenses (1) | | $ | 1,203 | | | $ | 696 | | | $ | 900 | | | $ | — | | | $ | — | |
| Administrative services expenses | Administrative services expenses | | 7,658 | | | 13,120 | | | 16,363 | | | — | | | 2,940 | |
| Asset management and subordinated performance fee | Asset management and subordinated performance fee | | 28,110 | | | 15,178 | | | 16,226 | | | 15,595 | | | 4,773 | |
Other related party expenses (2)(3) | Other related party expenses (2)(3) | | 355 | | | 703 | | | 1,610 | | | 1,943 | | | 1,812 | |
| Total related party fees and reimbursements | Total related party fees and reimbursements | | $ | 37,326 | | | $ | 29,697 | | | $ | 35,099 | | | $ | 17,538 | | | $ | 9,525 | |
(1) Total acquisition fees and expenses paid during the years ended December 31, 2023, 2022 and 2021 2020 and 2019 were $15$5.8 million, $7.1$11.7 million and $8.4$15.0 millionrespectively, of which $13.8$4.6 million, $6.4$10.3 million and $7.5$13.8 million were capitalized within the commercialin Commercial mortgage loans, held for investment line of and Real estate securities, available for sale, measured at fair value in the consolidated balance sheets for the years ended December 31, 2021, 20202023, 2022 and 2019.2021.
(2) These are related to reimbursable costs incurred for the increase in loan origination activities and are included in Other expenses in the Company's consolidated statements of operations.
(3) TheAs of December 31, 2023 and December 31, 2022, the related party payable includes $1.9$0.7 million and $1.8$2.9 million, respectively, of payments made by the Advisor to third party vendors on behalf of the Company.
The amounts payablepayables as of December 31, 20212023 and 20202022 in the table above are included in Due to affiliates on in the Company's consolidated balance sheets.
Off Balance Sheet Arrangements
We currently have no off balance sheet arrangements as of December 31, 20212023 and through the date of the filing of this Form 10-K.
Non-GAAP Financial Measures
Distributable Earnings and Run-Rate Distributable Earnings
Beginning in the third quarter of 2021 to more appropriately reflect the principal purpose of the measure, "modified funds from operations ("MFFO")" or "funds from operations ("FFO")" was relabeled "Distributable Earnings", a non-GAAP financial measure. Distributable Earnings is a non-GAAP measure, which we definethe Company defines as GAAP net income (loss), adjusted for (i) non-cash CLO amortization acceleration and amortization over ourthe expected useful life of ourthe Company's CLOs, (ii) unrealized gains and losses on loans, derivatives and ARMs, including CECL reserves and impairments, (iii) non-cash equity compensation expense, (iv) depreciation and amortization, (v) non-cash incentivesubordinated performance fee accruals,accruals/(reversal), (vi) certain other non-cash items,loan workout charges, (vii) realized gains and (vii)losses on debt extinguishment and CLO calls, (viii) actual realized cash loss on a specific real estate owned ("REO") investment, (ix) impairments of acquisition assets related to the Capstead merger.merger and (x) certain other non-cash items. Further, Run-Rate Distributable Earnings, a non-GAAP measure, presents Distributable Earnings before (i) trading and derivative gain/loss on ARMs and (ii) realized cash gain/loss adjustments on REO.
We believeThe Company believes that Distributable Earnings providesand Run-Rate Distributable Earnings provide meaningful information to consider in addition to ourthe disclosed GAAP results. We believeThe Company believes Distributable Earnings is a useful financial metric for existing and potential future holders of ourits common stock as historically, overtime,over time, Distributable Earnings has been an indicator of our dividends per share. As a REIT, wethe Company generally must distribute annually at least 90% of our netits taxable income, subject to certain adjustments, and therefore we believe ourbelieves dividends are one of the principal reasons stockholders may invest in ourits common stock. Further, Distributable Earnings helps us toinvestors evaluate our performance excluding the effects of certain transactions and GAAP adjustments that wethe Company does not believe are not necessarily indicative of our current loan portfolio performance and the Company's operations and is one of the performance metrics we considerthe Company's board of directors considers when declaring our dividends.dividends are declared. The Company believes Run-Rate Distributable Earnings is a useful financial metric because it presents the Distributable Earnings of its core businesses, net of the impacts of realized cash gain/loss adjustments on REO as well as the realized trading and derivative gain/loss on the residential adjustable-rate mortgage securities acquired from Capstead Mortgage Corporation, which the Company has liquidated from its portfolio.
Distributable Earnings doesand Run-Rate Distributable Earnings do not represent net income (loss) and should not be considered as an alternative to GAAP net income (loss). OurThe methodology for calculating Distributable Earnings and Run-Rate Distributable Earnings may differ from the methodologies employed by other companies and thus may not be comparable to the Distributable Earnings reported by other companies.
The following table provides a reconciliation of GAAP net income to Distributable Earnings for the years ended December 31, 2021, December 31, 20202023, 2022, and December 31, 20192021 (dollars in thousands):
| | | | | | | | | | | | | | | | | | | | |
| | Year Ended December 31, |
| | 2021 | | 2020 | | 2019 |
| GAAP Net Income: | | $ | 25,702 | | | $ | 54,746 | | | $ | 83,924 | |
| Adjustments: | | | | | | |
CLO amortization acceleration (1) | | 250 | | | 264 | | | (2,881) | |
Unrealized (gain)/loss on financial instruments (2) | | (1,049) | | | 1,102 | | | (2,081) | |
| Unrealized gain/(loss) reversal - ARMs | | 13,867 | | | — | | | 1,989 | |
| Impairment of acquired assets | | 88,282 | | | — | | | — | |
| Incentive fees | | 9,846 | | | — | | | — | |
| Depreciation and amortization | | 2,107 | | | 2,234 | | | 507 | |
| Increase/(decrease) in provision for credit losses | | (5,192) | | | 13,296 | | | — | |
| Impairment losses on real estate owned assets | | — | | | 398 | | | — | |
| Distributable earnings | | $ | 133,813 | | | $ | 72,040 | | | $ | 81,458 | |
| Average Equity | | $ | 1,146,009 | | | $ | 974,184 | | | $ | 946,801 | |
| 7.5% Cumulative Redeemable Preferred Stock, Series E Dividend | | $ | 4,842 | | | $ | — | | | $ | — | |
| GAAP Common ROE | | 1.8 | % | | 5.6 | % | | 8.9 | % |
| Distributable Earnings ROE | | 11.3 | % | | 7.4 | % | | 8.6 | % |
| GAAP Net Income Per Share, Fully Converted | | $ | 0.33 | | | $ | 0.96 | | | $ | 1.59 | |
| Distributable Earnings Per Share, Fully Converted | | $ | 2.02 | | | $ | 1.27 | | | $ | 1.54 | |
| | | | | | | | | | | | | | | | | | | | |
| | Year Ended December 31, |
| | 2023 | | 2022 | | 2021 |
| GAAP Net Income | | $ | 144,509 | | $ | 14,215 | | $ | 25,702 |
| Adjustments: | | | | | | |
| Depreciation and amortization | | 7,128 | | 5,408 | | 2,107 |
| Impairment of Acquired Assets | | — | | — | | 88,282 |
CLO amortization acceleration (1) | | (5,521) | | (438) | | 250 |
Unrealized (gain)/loss on financial instruments (2) | | 7,185 | | 17,010 | | (7,853) |
| Unrealized (gain)/loss - ARMs | | 415 | | 43,557 | | 20,670 |
Subordinated performance fee (3) | | 6,171 | | (8,380) | | 9,846 |
| Non-Cash Compensation Expense | | 4,762 | | 3,485 | | — |
| (Reversal of)/Provision for credit losses | | 33,738 | | 36,115 | | (5,192) |
Loan workout charges/(loan workout recoveries) (4) | | (5,105) | | 5,104 | | — |
| Realized (gain)/loss on debt extinguishment / CLO call | | (2,201) | | — | | — |
| Realized trading and derivatives (gain)/loss on ARMs | | 677 | | 21,726 | | 13,600 |
Run Rate Distributable Earnings (5) | | $ | 191,758 | | $ | 137,802 | | $ | 147,412 |
| Realized trading and derivatives gain/(loss) on ARMs | | (677) | | (21,726) | | (13,600) |
Realized cash gain/(loss) adjustment on REO (6) | | (1,571) | | — | | — |
| Distributable Earnings | | $ | 189,510 | | $ | 116,076 | | $ | 133,812 |
| 7.5% Cumulative Redeemable Preferred Stock, Series E Dividend | | $ | (19,367) | | $ | (19,367) | | (4,842) |
| Non-controlling interests in joint ventures net (income)/loss | | (602) | | 216 | | — |
| Depreciation and amortization attributed to non-controlling interests of joint ventures | | (31) | | (1,415) | | — |
| Distributable Earnings to Common | | 169,510 | | 95,510 | | 128,970 |
| Average Common Stock and Common Stock Equivalents | | 1,403,558 | | 1,456,871 | | 1,146,009 |
| GAAP Net Income/(Loss) ROE | | 8.9 | % | | (0.3) | % | | 1.8 | % |
| Run-Rate Distributable Earnings ROE | | 12.2 | % | | 8.0 | % | | 12.4 | % |
| Distributable Earnings ROE | | 12.1 | % | | 6.6 | % | | 11.3 | % |
| GAAP Net Income/(Loss) Per Share, Diluted | | $ | 1.42 | | $ | (0.38) | | $ | (0.18) |
GAAP Net Income/(Loss) Per Share, Fully Converted (7) | | $ | 1.42 | | $ | (0.06) | | $ | 0.33 |
Run-Rate Distributable Earnings Per Share, Fully Converted (7) | | $ | 1.94 | | $ | 1.31 | | $ | 2.23 |
Distributable Earnings Per Share, Fully Converted (7) | | $ | 1.92 | | $ | 1.07 | | $ | 2.02 |
________________________
(1) Adjusted for non-cash CLO amortization acceleration to effectively amortize issuance costs of our CLOs over the expected lifetime of the CLOs. We assume our CLOs will be outstanding for four years and amortized the financing costs over four years in our distributable earnings as compared to effective yield methodology in our GAAP earnings.
(2) Adjusted forRepresents unrealized gains and losses on (i) commercial mortgage loans, held for sale, measured at fair value, (ii) other real estate investments, measured at fair value and (iii) derivatives.
(3) Represents accrued and unpaid subordinated performance fee. In addition, reversal of subordinated performance fee represents cash payments of the subordinated performance fee made during the period.
(4) Represents loan workout charges the Company incurred, which the Company deemed likely to be recovered. Reversal of loan workout charges represent recoveries received. During the second quarter of 2023, the Company recovered $5.1 million of loan workout charges, in aggregate, related to the loan workout charges incurred in 2022.
(5) Distributable Earnings before realized trading and derivative gain/loss on residential adjustable-rate mortgage securities (“Run-Rate Distributable Earnings”) (a non-GAAP financial measure).
(6) Represents the actual realized cash loss on a specific REO investment.
(7) Fully Converted assumes conversion of our series of convertible preferred stock and full vesting of our outstanding equity compensation awards.
Item 7A. Quantitative and Qualitative Disclosures about Market Risk.
Credit Risk
Our investments are subject to a high degree of credit risk. Credit risk is the exposure to loss from loan defaults. Default rates are subject to a wide variety of factors, including, but not limited to, borrower financial condition, property performance, property management, supply/demand factors, construction trends, consumer behavior, regional economics, interest rates, the strength of the U.S. economy, and other factors beyond our control. All loans are subject to a certain probability of default. We manage credit risk through the underwriting process, acquiring our investments at the appropriate discount to face value, if any, and establishing loss assumptions. We also carefully monitor the performance of the loans, as well as external factors that may affect their value.
Capital Market Risk
We are exposed to risks related to the debt capital markets, and our related ability to finance our business through borrowings under repurchase obligations or other debt instruments. As a REIT, we are required to distribute a significant portion of our taxable income annually, which constrains our ability to accumulate operating cash flow and therefore requires us to utilize debt or equity capital to finance our business. We seek to mitigate these risks by monitoring the debt capital markets to inform our decisions on the amount, timing and terms of capital we raise.
The COVID-19 pandemic has resultedMarket uncertainty and volatility may cause fluctuation in extreme volatility in a varietymarket value of global markets, including the real estate-related debt markets.certain asset classes within our portfolio. We have and may continue to receive margin calls from our lenders as a result of the decline in the market value of the assets pledged by us to our lenders under our repurchase agreements and warehouse credit facilities, and if we fail to resolve such margin calls when due by payment of cash or delivery of additional collateral, the lenders may exercise remedies including demanding payment by us of our aggregate outstanding financing obligations and/or taking ownership of the loans or other assets securing the applicable obligations and liquidating them at inopportune prices.
Market Risk
As a result of the closing of the Capstead merger on October 19, 2021 we hold a significant amount of ARM securities. Changes in the level of interest rates and spreads can significantly impact the value of these assets. We may utilize a variety of financial instruments in order to limit the adverse effects of interest rates on our results.
Interest Rate Risk
Our market risk arises primarily from interest rate risk relating to interest rate fluctuations. Many factors including governmental monetary and tax policies, domestic and international economic and political considerations and other factors that are beyond our control contribute to interest rate risk. To meet our short and long-term liquidity requirements, we may borrow funds at fixed and variable rates. Our interest rate risk management objectives are to limit the impact of interest rate changes in earnings and cash flows and to lower our overall borrowing costs. To achieve these objectives, from time to time, we may enter into interest rate hedge contracts such as swaps, collars and treasury lock agreements in order to mitigate our interest rate risk with respect to various debt instruments. While hedging activities may insulate us against adverse changes in interest rates, they may also limit our ability to participate in benefits of lower interest rates with respect to our portfolio of investments with fixed interest rates. We do not have any foreign denominated investments, and thus, we are not exposed to foreign currency fluctuations.
As of December 31, 20212023 and 2020,2022, our portfolio included 161141 and 133157 variable rate investments, respectively, based on LIBOR and SOFR (or "indexing rates") for various terms. Borrowings under our repurchase agreementsfinancing arrangements are also based on indexing rates.LIBOR and SOFR. The following table quantifies the potential changes in interest income net of interest expense should interest rates increase by 50 or 100 basis points or decrease by 25 or 50 basis points, assuming that our current balance sheet was to remain constant and no actions were taken to alter our existing interest rate sensitivity. The changes in the portfolio for each basis points increase/decrease is a change from the base scenario.
For | | | | | | | | | | | | | | |
| | Estimated Percentage Change in Interest Income Net of Interest Expense |
| Change in Indexing Rates | | December 31, 2023 | | December 31, 2022 |
| (-) 25 Basis Points | | (1.49) | % | | (1.78) | % |
| Base Interest Rate | | — | % | | — | % |
| (+) 50 Basis Points | | 3.01 | % | | 3.49 | % |
| (+) 100 Basis Points | | 6.03 | % | | 6.98 | % |
Real Estate Risk
The market values of commercial mortgage assets are subject to volatility and may be affected adversely by a number of factors, including, but not limited to, national, regional and local economic conditions (which may be adversely affected by industry slowdowns and other factors); local real estate conditions; changes or continued weakness in specific industry segments; and demographic factors. In addition, decreases in property values reduce the indexing rate sensitivity range, a reductionvalue of the indexing rates results in an increase in our portfolio return. This is driven bycollateral and the indexing rates floor in place for majoritypotential proceeds available to a borrower to repay the underlying loans, which could also cause us to suffer losses.
Item 8. Financial Statements and Supplementary Data.
The information required by this Item 8 is hereby incorporated by reference to our Consolidated Financial Statements beginning on page F-1 of this Annual Report on Form 10-K.
Item 9. Changes in and Disagreements With Accountants on Accounting and Financial Disclosure.
None.
Item 9A. Controls and Procedures.
Disclosure Controls and Procedures
We maintain disclosure controls and procedures that are designed to provide reasonable assurance that information required to be disclosed in reports we file and submit under the Securities Exchange Act of 1934, as amended (the “Exchange Act”) is recorded, processed, summarized and reported within the time periods specified in the SEC’s rules and forms and that such information is accumulated and communicated to our management, including our Chief Executive Officer and Chief Financial Officer, as appropriate to allow timely decisions regarding required disclosure. In designing and evaluating the disclosure controls and procedures, management recognized that any controls and procedures, no matter how well designed and operated, can provide only reasonable assurance of achieving the desired control objectives and management necessarily was required to apply its judgment in evaluating the cost-benefit relationship of possible controls and procedures in reaching that level of reasonable assurance.
In accordance with Rules 13a-15(b) and 15d-15(b) of the Securities Exchange Act, of 1934, as amended (the "Exchange Act"), management, with the participation of our Chief Executive Officer and Chief Financial Officer, has evaluated the effectiveness of our disclosure controls and procedures (as defined in Rules 13a-15(e) and 15d-15(e) of the Exchange Act) as of the end of the period covered by this Annual Report on Form 10-K. Based on such evaluation, our Chief Executive Officer and Chief Financial Officer have concluded, as of the end of such period,December 31, 2023, that our disclosure controls and procedures are effective in recording, processing, summarizing and reporting, on a timely basis, information required to be disclosed by us in our reports that we file or submit underprovide the Exchange Act.reasonable assurance described above.
Internal Control Over Financial Reporting
Management's Annual Reporting on Internal ControlsControl over Financial Reporting
Our management is responsible for establishing and maintaining adequate internal control over financial reporting, as such term is defined in RuleRules 13a-15(f) orand 15d-15(f) promulgated under the Exchange Act.
In connection with Our internal control over financial reporting is designed to provide reasonable assurance regarding the reliability of financial reporting and the preparation of our Annual Report on Form 10-K, ourfinancial statements for external purposes in accordance with generally accepted accounting principles. Because of its inherent limitations, internal control over financial reporting may not prevent or detect misstatements. Also, projections of any evaluation of effectiveness to future periods are subject to the risk that controls may become inadequate because of changes in conditions, or that the degree of compliance with the policies or procedures may deteriorate.
Our management assessed the effectiveness of our internal control over financial reporting as of December 31, 2021.2023. In making that assessment, management used the criteria set forth by the Committee of Sponsoring Organizations of the Treadway Commission in Internal Control-Integrated Framework (2013).
Based on its assessment, our management concluded that, as of December 31, 2021,2023, our internal control over financial reporting was effective.
The rules of the SEC do not require, and this Annual Report does not include an attestation report of ourOur independent registered public accounting firm, regardingPricewaterhouseCoopers LLP (“PwC”), audited the effectiveness of our internal control over financial reporting.reporting as of December 31, 2023. Their report dated February 26, 2024, which is included herein, expressed an unqualified opinion on the effectiveness of our internal control over financial reporting
Changes in Internal Control Over Financial Reporting
During the quarter ended December 31, 2021,2023, there were no changes in our internal control over financial reporting that have materially affected, or are reasonably likely to materially affect, our internal control over financial reporting.
Item 9B. Other Information.
None.During the quarter ended December 31, 2023, no director or officer of the Company adopted or terminated a “Rule 10b5-1 trading arrangement” or “non-Rule 10b5-1 trading arrangement,” as each term is defined in Item 408(a) of Regulation S-K.
Item 9C. Disclosure Regarding Foreign Jurisdictions that Prevent Inspections.
None.Not applicable.
PART III
Item 10. Directors, Executive Officers and Corporate Governance.
Directors
The table set forth below lists the name and age of each of our current directors and the position and office that each director currently holds with the Company:
| | | | | | | | | | | | | | |
Name | | Age | | Position(s) |
Richard J. Byrne | | 60 | | Chairman of the Board of Directors, Chief Executive Officer and President |
Jamie Handwerker | | 60 | | Director, Compensation Committee Chair |
Peter J. McDonough | | 63 | | Director, Nominating and Corporate Governance Committee Chair |
Buford H. Ortale | | 60 | | Director, Audit Committee Chair |
Elizabeth K. Tuppeny | | 61 | | Lead Independent Director |
Pat Augustine | | 59 | | Director |
Gary Keiser | | 78 | | Director |
Michelle P. Goolsby | | 63 | | Director |
Business Experience of Directors
The name, principal occupation for the last five years, selected biographical information and the period of service of our directors are set forth below.
Richard J. Byrne
Richard J. Byrne has served as Chairman of the Board of Directors, Chief Executive Officer and President of the Company since September 2016. Mr. Byrne has served as the President of the Advisor since 2013. He has also served as Chairman of the Board of Directors, Chief Executive Officer and President of the Business Development Corporation of America since November 2016, Broadtree Residential, Inc. since February 2020 and Franklin BSP Capital Corp since December 2020. Prior to joining the Advisor, Mr. Byrne was Chief Executive Officer of Deutsche Bank Securities, Inc. He was also the Co-Head of Global Capital Markets at Deutsche Bank. Before joining Deutsche Bank, Mr. Byrne was Global Co-Head of the Leveraged Finance Group and Global Head of Credit Research at Merrill Lynch & Co. He was also a perennially top-ranked credit analyst. Mr. Byrne earned an M.B.A. from the Kellogg School of Management at Northwestern University and a B.A. from Binghamton University. Mr. Byrne is a member of the Boards of Directors of Wynn Resorts, Limited (NASDAQ: WYNN) and New York Road Runners. We believe that Mr. Byrne’s current and prior experience as a director and Chief Executive Officer of the Company, and his significant investment banking experience in real estate make him well qualified to serve as a member of our Board.
Pat Augustine
Pat Augustine has served as an independent director of the Company since October 2021. He previously served as a member of the Board of Directors of Capstead Mortgage Corporation (NYSE: CMO) from 2020 until its merger with the Company in 2021. Mr. Augustine spent most of his career in structured finance beginning in 1985 at Salomon Brothers during the developmental phase of the mortgage-backed securities market. From 1996 until 2007, Mr. Augustine built the securities business at NationsBank, now Bank of America, where he ran sales, trading and research for structured products. Between 2009 and 2011, Mr. Augustine served as Head of Structured Product and Credit Portfolio Management at Swiss RE Insurance Asset Management where he was primarily responsible for oversight of residential and commercial mortgage-related products. Most recently, he served as founder of Meridian Enterprises where he built, owned and operated Planet Fitness franchises before selling to a private equity firm in 2019. Mr. Augustine holds a BA in Economics from Duquesne University and an MBA from Emory University. Mr. Augustine has a depth of specialty-finance related experience.
Michelle P. Goolsby
Michelle P. Goolsby has served as an independent director of the Company since October 2021. She previously served as a member of the Board of Directors of Capstead Mortgage Corporation (NYSE: CMO) from 2012 until its merger with the Company in 2021. Ms. Goolsby was a partner and investment committee member for Greenmont Capital Partners II, a private equity firm, from 2008 to 2019. From 1998 to 2008, Ms. Goolsby served as an executive vice president of Dean Foods Company (NYSE: DF) where she was responsible for corporate development, legal, corporate governance, ethics and compliance, government relations and corporate affairs. Prior to 1998, Ms. Goolsby provided legal representation for public and privately-held entities, including real estate investment trusts, in connection with securities offerings, financings, mergers, acquisitions and divestitures. Ms. Goolsby previously served as a director of WhiteWave Foods Company (NYSE: WWAV), a consumer-packaged food and beverage company, and served as a member of the Advisory Board of the successor company, Danone North America. Ms. Goolsby serves on the board of Simply Good Foods Company (NASDAQ: SMPL) and has served as a member of the Audit Committee, the Nominating and Governance Committee and as Chair of the Corporate Responsibility and Sustainability Committee. She also serves on the board of SACHEM, Inc., a privately-held chemical science technology company. Ms. Goolsby brings a diverse background of executive leadership experience, and has worked extensively with management teams and boards on matters involving risk management, strategy, compensation and corporate governance. In addition, she has significant experience in corporate financing and other capital markets transactions, including transactions on behalf of public and privately-held real estate entities.
Jamie Handwerker
Jamie Handwerker has served as an independent director of the Company since September 2016. Ms. Handwerker is a partner of KSH Capital, providing real estate entrepreneurs with capital and expertise to seed or grow their platform. Prior to joining KSH, Ms. Handwerker was a Senior Vice President and Principal of Cramer Rosenthal McGlynn (CRM) LLC, a New York-based asset management firm, which serves as investment adviser to institutions, as well as individual and family trusts. Ms. Handwerker was the portfolio manager for the CRM Windridge Partners hedge funds since she founded the Funds in June 2000. The funds were long/short US equity hedge funds, focused on real estate and consumer companies, generating absolute returns. Prior to joining CRM in April 2002, Ms. Handwerker managed Windridge Partners, L.P, as a Managing Director and Portfolio Manager with ING Furman Selz Asset Management LLC, a New York based holding company operating as a wholly-owned subsidiary of the Dutch financial conglomerate, ING Group. Ms. Handwerker previously was a Managing Director and Senior Equity Research Analyst (Sell-Side) from 1994 to 2000 at the international corporate and investment bank ING Barings and its predecessor, Furman Selz, LLC where she exclusively focused on real estate companies, including the REIT industry. She received a B.A. in Economics from the University of Pennsylvania. Ms. Handwerker serves on the Board of Trustees of Lexington Realty Trust (NYSE: LXP). She also is a member of the University of Pennsylvania School of Arts & Sciences Board of Overseers and is the Founder and Chairperson of Penn Arts & Sciences Professional Women’s Alliance, as well as being involved in other charitable endeavors. We believe Ms. Handwerker’s extensive experience in real estate venture capital, asset management and portfolio management described above make her well qualified to serve as a member of our Board.
Gary Keiser
Gary Keiser has served as an independent director of the Company since October 2021. He previously served as a member of the Board of Directors of Capstead Mortgage Corporation (NYSE: CMO) from 2004 until its merger with the Company in 2021. Gary Keiser served as an audit partner at Ernst & Young LLP from 1980 until his retirement in 2000. Mr. Keiser began his career with Ernst & Young LLP in 1967. He also serves on several governmental, non-profit and private company boards. Mr. Keiser worked in the public accounting profession for his entire career, focusing a significant amount of his time on real estate and real estate finance clients, and has a wealth of accounting, mortgage banking and real estate experience.
Peter J. McDonough
Peter J. McDonough has served as an independent director of the Company since April 2016. Mr. McDonough brings innovative thinking to transform business performance from diverse experiences leading global organizations in industries such as Biotechnology, Personal Care Products, Consumer Appliances, Power Tools and Beverage Alcohol. In 2022, Peter retired from his position as Chief Executive Officer of Trait Biosciences, a Los Alamos, NM biotechnology research organization developing Intellectual Property associated with the formulation of CBD Health & Wellness Products. Before joining Trait, Peter served as President, Chief Marketing and Innovation Officer for Diageo North America ($5+ Billion Revenue) from 2009 to 2015. While in this role he was responsible for over-seeing North America’s largest portfolio of premium spirits and beer brands. In his diverse career, Peter has served as a senior leader in seven different industries, gaining cultural insights while residing in the Pacific Rim, Central Europe and numerous American cities. After teaching at The University of Canterbury’s Graduate School of Business in Christchurch, New Zealand, Peter was appointed to serve as Procter & Gamble’s Vice President of European Marketing overseeing the brand marketing function for Duracell Batteries and Braun Appliances ($1.3 Billion Annual Revenues). Prior to his overseas roles Peter served as Gillette's Head of North American Marketing where he launched industry leading brands such as Mach3 Turbo and Venus Razors ($1.3 Billion Annual Revenues). Earlier in his career, he served as Director of North American Marketing at Black & Decker where he was involved in launching the DeWalt Power Tool Company. Mr. McDonough is an alumnus of Cornell University and holds a Master of Business Administration from the Wharton School of Business at the University of Pennsylvania. He currently serves on corporate boards including The Splash Beverage Group (NYSE: SBEV) and Copalli Spirits. He previously served on the Board of Directors for not-for-profit organizations such as The AdCouncil of America, Effies Worldwide Inc and The Children’s Trust Fund of Massachusetts. We believe Mr. McDonough’s extensive experience as an executive officer and/or director of the companies described above and his significant business accomplishments make him well qualified to serve as a member of our Board.
Buford H. Ortale
Buford H. Ortale has served as an independent director of the Company since September 2016. Mr. Ortale is a private equity investor based in Nashville, Tennessee. He is a partner in NTR, a private equity firm focused on the energy space as well as a partner in Armour Capital Management, LP, the external manager of a residential mortgage REIT with over $8 billion in assets. Mr. Ortale began his career with Merrill Lynch’s Merchant Banking Group in New York in 1987. He was subsequently a founder and managing director of NationsBanc’s (Bank of America) High Yield Bond Group. In 1996 he formed Sewanee Ventures, a private equity investment vehicle that he still manages today. Mr. Ortale’s activities have included investments in startup venture backed companies, LBO’s, real estate development, and real estate acquisition. He currently serves on the board of directors Waitr Holdings, Inc. (NASDAQ: WTRH), an on-demand food ordering and delivery company, and Broadtree Residential, Inc., a private multifamily REIT. He is currently a board advisor to Western Express (a privately owned $700 million trucking company) and a board member of Intrensic (a police bodycam and digital evidence management company) and Remote Care Partners (a private healthcare company in the remote health monitoring space). He received his B.A. from Sewanee: The University of the South and a Masters of Business Administration from Vanderbilt University. We believe Mr. Ortale’s extensive experience as a private equity investor and banker described above make him well qualified to serve as a member of our Board of Directors.
Elizabeth K. Tuppeny
Elizabeth K. Tuppeny has served as an independent director of the Company and its predecessor since January 2013. Ms. Tuppeny has been the chief executive officer and founder of Domus, Inc. (“Domus”), a full-service marketing communications agency, since 1993. Her company works at the C-Suite level with clients such as Chevron; Citibank; ConAgra; Diageo; DuPont; Epson; Mattel; Merck; Merrill Lynch; Procter & Gamble; Ralph Lauren and Westinghouse. Real Estate clients include Ritz Carlton Residences; S&H Associates; and PMC Real Estate. Ms. Tuppeny has 30 years of experience in the branding and advertising industries, with a focus on Fortune 50 companies. Ms. Tuppeny also served for three years on the board of the Philadelphia Industrial Development Council, a public-private economic development organization, wherein she evaluated and approved 500+ industrial and commercial real estate transactions worth over a billion dollars. Ms. Tuppeny currently serves as the Lead Director of New York City REIT, Inc. (NYSE: NYC), a public real estate investment trust with a portfolio of high-quality commercial real estate located within the five boroughs of New York City, particularly in Manhattan, and Ms. Tuppeny is also an independent director and Chair of the Nominating and Governance Committee of Healthcare Trust, Inc. (Nasdaq: HTIA), a publicly registered real estate investment trust focused on acquiring a diversified portfolio of healthcare real estate, with an emphasis on seniors housing and medical office buildings, located in the United States. Ms. Tuppeny previously served as an independent Director on the board of directors of American Realty Capital Trust IV. Ms. Tuppeny has served on the boards of directors and advisory committees for the Arthur Ashe Foundation, Avenue of the Arts, Drexel Medical School, Philadelphia Hospitality Cabinet, Pennsylvania Commission for Women, Penn Relays and the Police Athletic League. Ms. Tuppeny was the recipient of the national Stevie Award as the nation’s top woman entrepreneur in 2004 and was named as a “Top Woman in Philadelphia Business” in 1996, one of the “Top 50 Women in Pennsylvania” in 2004 and as the “Businessperson of the Year” in 2003 by the Greater Philadelphia Chamber of Commerce. Ms. Tuppeny has taught at New York University, University of Pennsylvania and Temple University, and received her undergraduate degree from the University of Pennsylvania, Annenberg School of Communications. We believe that Ms. Tuppeny’s prior and current experience as an independent director of the companies described above, as chief executive officer and founder of Domus, and in evaluating healthcare-related real estate business development applications, make her well qualified to serve on our Board.
Executive Officers
The following table presents certain information concerning each of our executive officers serving in such capacity:
| | | | | | | | | | | | | | |
Name | | Age | | Position(s) |
Richard J. Byrne | | 61 | | Chairman of the Board of Directors, Chief Executive Officer and President |
Jerome S. Baglien | | 45 | | Chief Financial Officer, Chief Operating Officer and Treasurer |
Richard J. Byrne
Please see above for biographical information about Mr. Byrne.
Jerome S. Baglien
Jerome S. Baglien has served as Chief Financial Officer and Treasurer of the Company since September 2016, and as Chief Operating Officer of the Company since December 2021. Mr. Baglien is a Managing Director and Chief Financial Officer of Real Estate of the Advisor. Prior to joining the Advisor in 2016, Mr. Baglien was director of fund finance for GTIS Partners LP (“GTIS”), where he oversaw all finance and operations for GTIS funds. Previously, he was an accounting manager at iStar Inc. with oversight of loans and special investments. Mr. Baglien received a Masters of Business Administration from Kellstadt Graduate School of Business at DePaul University and a Bachelor of Science in Accounting from the University of Oregon.
Audit Committee
The Company’s Board of Directors has a standing Audit Committee established in accordance with Section 3(a)(58)(A) of the Exchange Act. The Audit Committee consists of Mr. Ortale, Ms. Handwerker, Mr. Keiser, Mr. McDonough and Ms. Tuppeny, each of whom is “independent” within the meaning of the applicable (i) provisions set forth in the Audit Committee charter, (ii) requirements set forth in the Securities Exchange Act of 1934, as amended (the “Exchange Act”), and (iii) the rules and regulations of the SEC. Mr. Ortale is the chair of our Audit Committee. The Board has determined that Mr. Ortale, Ms. Handwerker and Mr. Keiser are each qualified as an “Audit Committee financial expert” as defined in Item 407(d)(5) of Regulation S-K and the rules and regulations of the SEC.
Code of Ethics
The Board of Directors maintains a Code of Ethics that is applicable to our directors, officers, our Advisor and employees of the Advisor performing substantial services for the Company. It covers topics including, but not limited to, conflicts of interest, confidentiality of information, full and fair disclosure, reporting of violations and compliance with laws and regulations.
The Code of Ethics is available on the Company’s website at www.fbrtreit.com by clicking on “Governance – Governance Documents – Code of Ethics.” We intend to disclose on this website any amendment to, or waiver of, any provision of this Code of Ethics applicable to our directors and executive officers that would otherwise be required to be disclosed under the rules of the SEC. You may also obtain a copy of the Code of Ethics by writing to our secretary at: Franklin BSP Realty Trust, Inc., 1345 Avenue of the Americas, Suite 32A, New York, New York 10105, Attention: Micah Goodman, Secretary. A waiver of the Code of Ethics for our Chief Executive Officer may be made only by the Board of Directors or the appropriate committee of the Board and will be promptly disclosed to the extent required by law. A waiver of the Code of Ethics for all other person may be made only by our Chief Executive Officer and shall be discussed with the Board or a committee of the Board as appropriate.
The other information required by this item is hereby incorporated by reference to the material appearing in the Proxy Statement for the 2024 Annual Meeting of Stockholders, to be filed pursuant to Regulation 14A under the Exchange Act.
Item 11. Executive Compensation.
2021 Executive Officer Compensation
We currently have no employees. Our Advisor, through its employees, performs our day-to-day management functions. Our current non-employee executive officers, Richard J. Byrne and Jerome S. Baglien, are each employees of our Advisor andThe information required by this item is hereby incorporated by reference to the material appearing in 2021 did not receive any compensation directly from the CompanyProxy Statement for the performance2024 Annual Meeting of their duties as executive officers of the Company. As a result of our not paying any compensation directlyStockholders, to our executive officers in 2021, we have not included in this Annual Report on Form 10-K a “Compensation Discussion and Analysis” section or a report of the Compensation Committee.
Director Compensation
The following table sets forth information regarding compensation of our independent directors during the fiscal year ended December 31, 2021. Mr. Byrne received no additional compensation for serving as a director.
| | | | | | | | | | | | | | | | | | | | |
| Name | | Fees Paid in Cash* | | Stock Awards | | Total |
| Elizabeth K. Tuppeny | | $ | 190,000 | | | $ | 50,000 | | | $ | 240,000 | |
| Buford H. Ortale | | $ | 190,000 | | | $ | 50,000 | | | $ | 240,000 | |
| Peter J. McDonough | | $ | 190,000 | | | $ | 50,000 | | | $ | 240,000 | |
| Jamie Handwerker | | $ | 190,000 | | | $ | 50,000 | | | $ | 240,000 | |
| Pat Augustine** | | $ | 22,120 | | | $ | — | | | $ | 22,120 | |
| Michelle P. Goolsby** | | $ | 22,120 | | | $ | — | | | $ | 22,120 | |
| Gary Keiser** | | $ | 22,120 | | | $ | — | | | $ | 22,120 | |
________________________* Includes a special, one-time supplemental director fee of $50,000be filed pursuant to Ms. Tuppeny, Mr. Ortale, Mr. McDonough and Ms. Handwerker in recognition of the significant incremental work required of the Board and its committees during the Company’s merger with Capstead and the listing of the Company’s common stock on the NYSE.
** Messrs, Augustine, Keiser and Ms. Goolsby joined the Board in October 2021, and received an annual cash retainer prorated for the amount of time they served on the Board during 2021.
We currently pay to each of our independent directors the fees described in the table below. All directors also receive reimbursement of reasonable out of pocket expenses incurred in connection with attendance at meetings of our Board of Directors. If a director also is our employee or an employee of our Advisor or any of its affiliates, or is otherwise not independent, we do not pay compensation for services rendered as a director.
| | | | | | | | | | | | | | |
Name | | Fees Earned or Paid in Cash ($) | | Restricted Shares |
Independent Directors | | A yearly retainer of $110,000 for each independent director; $20,000 for the Lead Independent Director and the chairs of the Audit Committee, Nominating and Corporate Governance Committee and Compensation Committee; and $5,000 for each member of a committee who is not serving as a chair. | | On the date of the annual meeting of stockholders, each independent director receives an annual grant of $50,000 in restricted shares of Common Stock based on the lower of the most recent GAAP book value or net asset value per share. The restricted shares vest on the anniversary of the grant date.
Now that the Company's common stock is listed on the NYSE, commencing in 2022, the annual grant will be valued on the basis of the closing price of our common stock on the date of grant.
|
Equity Compensation Plan Information
The following table provides information about our common stock that may be issued under our equity compensation plans as of December 31, 2021:
| | | | | | | | | | | | | | | | | | | | |
Plan Category | | Number of Securities to be Issued Upon Exercise of Outstanding Options, Warrants and Rights | | Weighted-Average Exercise of Price of Outstanding Options, Warrants, and Rights | | Number of Securities Remaining Available for Future Issuance Under Equity Compensation Plans |
Equity compensation plans approved by security holders | | — | | | — | | | — | |
Equity compensation plans not approved by security holders (1)
| | — | | | — | | | 9,443,936 | |
Total | | — | | | — | | | 9,443,936 | |
________________________(1) The number of securities remaining available for future issuance consists of an aggregate of 3,943,936 shares issuable under our employee and director incentive restricted share plan (“RSP”) and 5,500,000 shares issuableRegulation 14A under the Franklin BSP Realty Trust, Inc. 2021 Equity Incentive Plan. Each of our equity compensation plans were adopted and approved by our Board of Directors prior to the listing of our common stock on the NYSE. The RSP will expire on February 7, 2023.
Compensation Committee Interlocks and Insider Participation
The Board of Directors has a standing Compensation Committee, which is currently comprised of Ms. Handwerker, Mr. Augustine, Mr. McDonough, Mr. Ortale and Ms. Tuppeny, with Ms. Handwerker serving as the committee’s chairperson. All Compensation Committee members meet the independence criteria set forth in the listing standards of the NYSE. No current or former employee of the Company serves on the Compensation Committee. The Committee members have no interlocking relationships as defined by the SEC.Exchange Act.
Item 12. Security Ownership of Certain Beneficial Owners and Management and Related Stockholder Matters.
The following table sets forth information regarding the beneficial ownership of our Common Stock and our Series F Preferred Stock, including shares which may be acquired by such persons within 60 days, by:
•each of our executive officers and directors; and
•all of our executive officers and directorsExcept as a group.
The percentage ownership set forth below, the information required by this item is based on 43,957,363 shares of Common Stock and 39,733,299 shares of Series F Preferred Stock outstanding as of February 17, 2022. Each share of Series F Preferred Stock votes on an as-converted basis withhereby incorporated by reference to the Common Stock, voting as a single class. Each share of Series F Preferred Stock will automatically convert into one share of Common Stock on April 19, 2022.
| | | | | | | | | | | | | | |
Beneficial Owner (1) | Number of Shares of Common Stock Beneficially Owned | Percent of Class | Number of Shares of Series F Preferred Stock Beneficially Owned | Percent of Class |
| Pat Augustine | 7,653 (2) | * | — | — |
| Jerome S. Baglien | 283 | * | 2,506 | * |
| Richard J. Byrne | 13,330 | * | 117,770 | |
| Michelle P. Goolsby | 26,305 (2) | * | — | — |
| Jamie Handwerker | 4,399 (3) | * | 14,430 | * |
| Gary Keiser | 33,187 (2) | * | — | — |
| Peter J. McDonough | 4,399 (3) | * | 14,429 | * |
| Buford H. Ortale | 4,398 (3) | * | 14,416 | * |
| Elizabeth K. Tuppeny | 4,650 (3) | * | 16,684 | * |
| All directors and executive officers as a group (9 persons) | 98,604 (4) | * | 180,235 | * |
________________________* Less than 1%.
(1) The business address of each individual or entity listedmaterial appearing in the table 1345 AvenueProxy Statement for the 2024 Annual Meeting of Stockholders, to be filed pursuant to Regulation 14A under the Americas, Suite 32A, New York, New York 10105.Exchange Act.
(2) Includes 2,403 unvested restricted shares scheduled to vest on June 3, 2022.
(3) Includes 2,796 unvested restricted shares scheduled to vest on June 3, 2022.
(4) Includes 18,393 unvested restricted shares scheduled to vest on June 3, 2022.Equity Compensation Plan Information
The following table sets forthprovides information regardingabout the beneficial ownership of our Common Stock and our Series C Preferred Stock, Series D Preferred Stock and Series F Preferred Stock (such preferredCompany's common stock collectively, the “Voting Preferred Stock”), which votes as a single class with Common Stock on an as-converted basis, in each case including shares whichthat may be acquired by such persons within 60 days, by each person known by us to be the beneficial ownerissued under our equity compensation plans as of more than 5% of the outstanding shares of Common Stock or any class of the Voting Preferred Stock.December 31, 2023:
| | | | | | | | | | | | | | | | | | | | | | | | | | |
| Beneficial Owner | Number of Shares of Common Stock Beneficially Owned | Percent of Class | Number of Shares of Series C Preferred Stock Beneficially Owned | Percent of Class | Number of Shares of Series D Preferred Stock Beneficially Owned | Percent of Class | Number of Shares of Series F Preferred Stock Beneficially Owned | Percent of Class |
BlackRock, Inc. (1) | 7,002,427 | | 15.9 | % | — | | — | | — | | — | | — | | — | |
The Vanguard Group (2) | 3,588,587 | | 8.2 | % | | | | | | |
Security Benefit Life Insurance Company (3) | — | | — | | — | | — | | 17,950 | | 100.0 | % | — | | — | |
Penn Mutual Life Insurance Company (4) | — | | * | 1,000 | | 71.5 | % | — | | — | | — | | — | |
Vesta Global Stability Fund LP (5) | — | | — | | 400 | | 28.5 | % | — | | — | | — | | — | |
Howard University Endowment Fund (6) | — | | * | — | | — | | — | | — | | 2,179,465 | | 5.5 | % |
| | | | | | | | | | | | | | | | | | | | |
| Plan Category | | Number of Securities to be Issued Upon Exercise of Outstanding Options, Warrants and Rights (1) | | Weighted-Average Exercise Price of Outstanding Options, Warrants, and Rights | | Number of Securities Remaining Available for Future Issuance Under Equity Compensation Plans (2) |
| Equity compensation plans approved by security holders | | — | | | — | | | — | |
| Equity compensation plans not approved by security holders | | 809,257 | | | — | | | 4,526,704 | |
| Total | | 809,257 | | | — | | | 4,526,704 | |
________________________
* Less than 1%.
(1) This information is based on a Schedule 13G/A filed withRepresents unvested and outstanding restricted stock units issued under the SEC on January 27, 2022, by BlackRock,Franklin BSP Realty Trust, Inc. (“Blackrock”). Blackrock reported2021 Equity Incentive Plan. One share of the Company’s common stock will be issued for each restricted stock unit that it has sole voting power with respect to 6,965,313 shares, shared voting power with respect to 0 shares, sole dispositive power with respect to 7,002,427 shares and shared dispositive power with respect to 0 shares. The address of BlackRock, Inc. is 55 East 52nd Street, New York, NY 10055.vests.
(2)This information is based on a Schedule 13G filed with the SEC on February 9, 2022 by The Vanguard Group (“Vanguard”). Vanguard reported that it has sole voting power with respect to 0 shares, shared voting power with respect to 28,577 shares, sole dispositive power with respect to 3,527,307 shares and shared dispositive power with respect to 61,280 shares. The address of Vanguard is 100 Vanguard Blvd. Malvern, PA 19355.
(3) The business address of Security Benefit Life Insurance Company is One SW Security Benefit Place, Topeka, KS 66636.
(4) The business address of Penn Mutual Life Insurance Company is 600 Dresher Road, Suite 100, Horsham, PA 19044.
(5) The business addressnumber of Vesta Global Stability Fund LP is 330 5th Ave SW, Suite 640, Calgary, AB T2P 0L4, Canada.
(6) The business addresssecurities remaining available for future issuance consists of Howard University Endowment Fund is 2244 10th St NW Suite 302, Washington DC 20001-4012.shares issuable under the Franklin BSP Realty Trust, Inc. 2021 Equity Incentive Plan, which was adopted and approved by our Board of Directors prior to the listing of our common stock on the NYSE.
Item 13. Certain Relationships and Related Transactions, and Director Independence.
Certain Relationships and Related Transactions
Executive Officers
Richard J. Byrne our Chief Executive Officer and President,The information required by this item is hereby incorporated by reference to the presidentmaterial appearing in the Proxy Statement for the 2024 Annual Meeting of our Advisor. Jerome S. Baglien, our Chief Financial Officer, Chief Operating Officer and Treasurer, is the chief financial officer and chief operating officer of the Advisor’s commercial real estate group. Our Advisor is an affiliate of Franklin Templeton.
Advisor
The Advisor manages our dayStockholders, to day operationsbe filed pursuant to Regulation 14A under the Amended and Restated Advisory Agreement, dated January 19, 2018, as amended August 18, 2021 (the “Advisory Agreement”). Our Advisor is responsible for identifying, originating, acquiring and asset managing investments on our behalf. Under the Advisory Agreement, the Advisor is entitled to an asset management fee equal to one and one-half percent (1.5%) of Equity (as defined in the Advisory Agreement) and an annual subordinated performance fee equal to fifteen percent (15%) of the Total Return (as defined in the Advisory Agreement) over a six percent (6%) per annum hurdle, subject to certain limitations. The Company or the Operating Partnership continues to pay directly or reimburse the Advisor for all the expenses paid or actually incurred by the Advisor in connection with the services it provides to the Company and the Operating Partnership pursuant to the Advisory Agreement, subject to certain limitations.
For the year ended December 31, 2021, pursuant to the terms of the Amended Advisory Agreement, the Company paid total asset management fees of $28.1 million, acquisition expenses of approximately $1.2 million, reimbursements for administrative expenses and personnel costs of approximately $7.7 million, and other related party expenses, primarily related to reimbursable costs incurred for the increase in loan origination activities, of approximately $0.4 million.
Indemnification Agreements
We have entered into an indemnification agreement with each of our directors and officers providing for indemnification of such directors and officers consistent with the provisions of our Charter. No amounts have been paid by us pursuant to these indemnification agreements.
Certain Conflict Resolution Procedures
Every transaction that we enter into with our Advisor or its affiliates will be subject to an inherent conflict of interest. Our Board of Directors may encounter conflicts of interest in enforcing our rights against any affiliate in the event of a default by or disagreement with an affiliate or in invoking powers, rights or options pursuant to any agreement between us and our Advisor or any of its affiliates.
In order to reduce or eliminate certain potential conflicts of interest, our Nominating and Corporate Governance Committee charter contains a number of requirements, including that:
• the committee shall review and evaluate the terms and conditions of, and determine the advisability of, any related party transaction;
• unless the Board appoints a special committee of independent directors to negotiate any related party transaction, the committee shall negotiate the terms and conditions of any related party transaction, and if the committee deems appropriate, but subject to the limitations of applicable law, shall recommend to the Board the execution and delivery of documents in connection with any related party transaction on behalf of the Company;
• the committee shall determine whether any related party transaction is fair to, and in the best interest of the Company;
• the committee shall recommend to the Board what action, if any should be taken by the Board with respect to any related party transaction pursuant to the Company’s Charter;
• the committee shall review, evaluate and approve of any potential conflicts brought to its attention and shall report the results of its consideration of any such conflict to the Board; and
• the committee shall review, on a quarterly basis, the services provided by the Advisor, the reasonableness of the Advisor’s or its affiliates’ fees and expenses, the reasonableness of the Company’s expenses and the allocation of expenses among the Company and its affiliates and among accounting categories, and report its findings to the Board.
These responsibilities have also been codified in the Related Party Transactions Policy adopted by our Nominating and Corporate Governance Committee. Pursuant to the Related Party Transactions Policy, all related party transactions (as defined by Item 404(a) of Regulation S-K) must be approved by either the Nominating and Corporate Governance Committee or a majority of the disinterested members of the Board. As a general rule, any director who has a direct or indirect material interest in such related party transaction should not participate in the Nominating and Corporate Governance Committee or Board action regarding whether to approve the transaction. Any payment of fees and reimbursements to the Advisor pursuant to and in accordance with the Advisory Agreement are deemed to have been approved in accordance with the Related Party Transactions Policy.
Our independent directors have determined that all our transactions and relationships with our Advisor and their respective affiliates during the year ended December 31, 2021 were fair and were approved in accordance with the applicable Company policies.
Director Independence
Under our Corporate Governance Guidelines and NYSE rules, a majority of our directors must be “independent.” A director is not independent unless the Board affirmatively determines that he or she does not have a “material relationship” with us and the director must meet the bright-line test for independence set forth by the NYSE rules. A relationship with the Advisor or an affiliate thereof (other than service as an independent director or trustee for another company managed by the Advisor) is treated as a relationship with the Company. Our Corporate Governance Guidelines also require all members of the Audit Committee, the Compensation Committee and the Nominating and Corporate Governance Committee to be “independent” directors. Based upon its review, the Board has affirmatively determined that each of Messrs. Augustine, Keiser, McDonough and Ortale, and each of Mses. Goolsby, Handwerker and Tuppeny is independent under all applicable criteria for independence set forth in the listing standards of the NYSE, including with respect to committee service. In making its independence determinations, the Board considered and reviewed all information known to it, including information identified through directors’ questionnaires. There are no familial relationships between any of our directors and executive officers.Exchange Act.
Item 14. Principal Accounting Fees and Services.
The Audit Committee ofinformation required by this item is hereby incorporated by reference to the Board of Directors has selected and appointed Ernst and Young LLP (“EY”) as our independent registered public accounting firm to audit our consolidated financial statementsmaterial appearing in the Proxy Statement for the year ending December 31, 2022. EY has been our independent registered accounting firm since 2017.
The following table shows2024 Annual Meeting of Stockholders, to be filed pursuant to Regulation 14A under the fees billed by EY for the years ended December 31, 2021 and December 31, 2020 for each of the following categories of services:Exchange Act.
| | | | | | | | | | | |
| 2021 | | 2020 |
Audit Fees (1) | $ | 2,435,000 | | | $ | 1,357,600 | |
Audit-Related Fees (2) | 911,901 | | | 20,000 | |
Tax Fees (3) | 713,762 | | | 408,328 | |
| | | |
| Total | $ | 4,060,663 | | | $ | 1,785,928 | |
________________________(1) Audit fees relate to audits of the Company’s annual consolidated financial statements and reviews of the Company’s quarterly consolidated financial statements, comfort letters, and consents related to SEC registration statements.
(2) Audit-Related fees relate to assurance and related services that are traditionally performed by the independent registered public accounting firm and includes due diligence and debt compliance reporting.
(3) Tax fees primarily relate to preparation of tax returns, assistance with federal and state income tax filing calendar, compliance services, tax planning and modeling services, assistance with tax audits, tax advice related to mergers, and routine on-call tax services concerning issues, as requested by the Company, when such projects are not covered by a separate agreement and do not involve any significant tax planning or projects.
Pre-Approval Policies and Procedures
In accordance with our Audit Committee’s Audit and Non-Audit Services Pre-Approval Policy, all audit and non-audit services performed for us by our independent registered public accounting firm were pre-approved by the Audit Committee of our board of directors, which concluded that the provision of such services by EY was compatible with the maintenance of that firm’s independence in the conduct of its auditing functions.
The Audit and Non-Audit Services Pre-Approval Policy provides for categorical pre-approval of specified audit and permissible non-audit services. Services to be provided by the independent registered public accounting firm that are not within the category of pre-approved services must be approved by the Audit Committee prior to engagement, regardless of the service being requested or the dollar amount involved.
The Audit Committee must provide separate pre-approval of engagements for the performance of audit and non-audit services if (i) the type of service to be provided by the independent auditor has not received pre-approval as specifically set forth in the Audit and Non-Audit Services Pre-Approval Policy or (ii) the performance of such service would cause the aggregate annual fee, as applicable, to exceed the maximum fee level established for such type of service by the Audit Committee; provided that the Audit Committee determines that the provision of such services will not impair the auditors’ independence.
The Audit Committee may delegate pre-approval authority to one or more of its members. The member or members to whom such authority is delegated shall report any pre-approval decisions to the Audit Committee at its next scheduled meeting. The Audit Committee does not delegate to management its responsibilities to pre-approve services to be performed by the independent registered public accounting firm.
PART IV
Item 15. Exhibits and Financial Statement Schedules.
(a) Financial Statement Schedules
See the Index to Consolidated Financial Statements on page F-1 of this report.
(b) Exhibits
See the Index to Exhibit below.
INDEX TO EXHIBITS
The following exhibits are included in this Annual Report on Form 10-K for the year ended December 31, 2023 (and are numbered in accordance with Item 601 of Regulation S-K).
| | | | | | | | |
| Exhibit No. | | Description |
| 3.1 | | |
| 3.2 | | |
| 3.3 | | |
| 3.4 | | |
| 3.5 | | |
| 3.6 | | |
| 3.7 | | |
| 4.1 | | |
| 4.2 | | |
| 4.3 | | |
| 10.1 | | |
| 10.2† | | |
| 10.3† | | |
| 10.4 | | |
| 10.5 | | |
| 10.6 | | Indenture, dated as of March 25, 2021, by and among BSPRT 2021-FL6 Issuer, Ltd., BSPRT 2021-FL6 Co-Issuer, LLC, Benefit Street Partners Realty Operating Partnership, L.P., as advancing agent, and U.S. Bank National Association, as trustee, note administrator and custodian (incorporated by reference to Exhibit 10.1 to the Registrant’s Current Report on Form 8-K filed with the SEC on March 30, 2021). |
| 10.7 | | Indenture, dated as of December 21, 2021, by and among BSPRT 2021-FL7 Issuer, Ltd., BSPRT 2021-FL7 Co-Issuer, LLC, Benefit Street Partners Realty Operating Partnership, L.P., as advancing agent, and U.S. Bank National Association, as trustee, note administrator and custodian (incorporated by reference to Exhibit 10.1 to the Registrant’s Current Report on Form 8-K filed with the SEC on December 21, 2021. |
| | | | | | | | |
| 10.8 | | Indenture, dated as of February 15, 2022, by and among BSPRT 2022-FL8 Issuer, Ltd., BSPRT 2022-FL8 Co-Issuer, LLC, Benefit Street Partners Realty Operating Partnership, L.P., as advancing agent, and U.S. Bank National Association, as trustee, note administrator and custodian (incorporated by reference to Exhibit 10.1 to the Registrant’s Current Report on Form 8-K filed with the SEC on February 18, 2022). |
| 10.9 | | Indenture, dated as of June 29, 2022, by and among BSPRT 2022-FL9 Issuer, LLC, Benefit Street Partners Realty Operating Partnership, L.P., as advancing agent, U.S. Bank Trust Company, National Association, as trustee and note administrator, and U.S. Bank National Association as custodian (incorporated by reference to Exhibit 10.1 to the Registrant’s Current Report on Form 8-K filed with the SEC on July 1, 2022). |
| 10.10† | | |
| 10.11 | | Indenture, dated as of September 28, 2023, by and among BSPRT 2023-FL10 Issuer, LLC, Benefit Street Partners Realty Operating Partnership, L.P., as advancing agent, U.S. Bank Trust Company, National Association, as trustee and note administrator, and U.S. Bank National Association as custodian (incorporated by reference to Exhibit 10.1 of the Registrant’s Current Report on Form 8-K filed with the SEC on October 3, 2023) |
| 21* | | |
| 23.1* | | |
| 23.2* | | |
| 31.1* | | |
| 31.2* | | |
| 32* | | |
| 97.1†* | | |
| 101* | | |
| 104 | | |
____________________________________________* Filed herewith.
† Indicates management contract or compensatory plan or arrangement.
Item 16. Form 10-K Summary.Summary
None.
INDEX TO EXHIBITS
The following exhibits are included in this Annual Report on Form 10-K for the year ended December 31, 2021 (and are numbered in accordance with Item 601 of Regulation S-K).
| | | | | | | | |
Exhibit No. | | Description |
2.1 | | |
2.2 | | |
3.1 | | |
3.2 | | |
3.3 | | |
3.4 | | |
3.5 | | |
3.6 | | |
3.7 | | |
4.1 | | |
4.2 | | |
4.3* | | |
10.1† | | |
10.2† | | |
10.3 | | |
10.4 | | |
10.5 | | |
| | | | | | | | |
10.6 | | |
10.7 | | |
10.8 | | |
10.9 | | |
10.10 | | |
10.11 | | |
10.12 | | |
10.13 | | |
10.14 | | |
10.15 | | |
10.16 | | |
10.17 | | Credit Agreement, dated as of September 19, 2017, by and among the Company, BSPRT BB Loan, LLC, BSPRT Finance Sub-Lender II, L.L.C., Barclays Bank PLC, as sole lead arranger and bookrunner, Barclays Bank PLC, as administrative agent, and the lenders from time to time partiers thereto (incorporated by reference to Exhibit 10.1 to the Registrant’s Current Report on Form 8-K filed with the SEC on September 25, 2017).. |
10.18 | | |
10.19 | | Indenture, dated as of November 29, 2017, by and among BSPRT 2017-FL2 Issuer, Ltd., as issuer, BSPRT 2017-FL2 Co-Issuer, LLC, as co-issuer, Benefit Street Partners Realty Operating Partnership, L.P., as advancing agent, and U.S. Bank National Association, as trustee, note administrator and custodian (incorporated by reference to Exhibit 10.1 to the Registrant’s Current Report on Form 8-K filed with the SEC on December 5, 2017). |
10.20 | | |
10.21 | | .Indenture, dated as of October 12, 2018, by and among BSPRT 2018-FL4 Issuer, Ltd., BSPRT 2018-FL4 Co-Issuer, LLC, Benefit Street Partners Realty Operating Partnership, L.P., as advancing agent, and U.S. Bank National Association, as trustee, note administrator and custodian (incorporated by reference to Exhibit 10.1 to the Registrant’s Quarterly Report on Form 10-Q for the quarter ended September 30, 2018 filed with the SEC on November 9, 2018). |
10.22 | | |
10.23 | | |
10.24 | | |
10.25 | | |
| | | | | | | | |
10.26 | | Indenture, dated as of May 30, 2019, by and among BSPRT 2010-FL5 Issuer, Ltd., BSPRT 2019-FL5 Co-Issuer, LLC, Benefit Street Partners Realty Operating Partnership, L.P., as advancing agent, and U.S. Bank National Association, as trustee, note administrator and custodian (incorporated by reference to Exhibit 10.1 to the Registrant’s Current Report on Form 8-K filed with the SEC on June 5, 2019). |
10.27 | | Loan and Security Agreement, dated February 11, 2020 and as amended by Agreement of Amendment dated March 26, 2020, among BSPRT OP SUB I, LLC, Benefit Street Partners Realty Trust, Inc., Benefit Street Partners Realty Trust LP, LLC, Benefit Street Partners Realty Operating Partnership, L.P., and Security Benefit Life Insurance Company and the other lenders from time to time parties thereto, and Cortland Capital Market Services LLC, as administrative agent (incorporated by reference to Exhibit 10.1 to the Registrant’s Quarterly Report on Form 10-Q for the quarter ended March 31, 2020 filed with the SEC on May 15, 2020). |
10.28 | | Loan and Security Agreement, dated as of February 11, 2020, as amended by that certain Agreement of Amendment No. 1, dated March 26, 2020 and that certain Consent and Amendment No. 2 to Loan and Security Agreement, dated as of July 14, 2020, among BSPRT OP Sub I, LLC, Benefit Street Partners Realty Trust, Inc., Benefit Street Partners Realty Trust LP, LLC, and Benefit Street Partners Realty Operating Partnership, L.P. and Security Benefit Life Insurance Company and the other lenders from time to time parties thereto, and Cortland Capital Market Services LLC, as administrative agent (incorporated by reference to Exhibit 10.29 to the Registrant’s Annual Report on Form 10-K for the year ended December 31, 2020 filed with the SEC on March 11, 2021). |
10.29 | | |
10.30 | | Indenture, dated as of March 25, 2021, by and among BSPRT 2021-FL6 Issuer, Ltd., BSPRT 2021-FL6 Co-Issuer, LLC, Benefit Street Partners Realty Operating Partnership, L.P., as advancing agent, and U.S. Bank National Association, as trustee, note administrator and custodian (incorporated by reference to Exhibit 10.1 to the Registrant’s Current Report on Form 8-K filed with the SEC on March 30, 2021). |
10.31 | | |
10.32 | | |
10.33† | | |
10.34* | | |
10.35* | | |
10.36 | | Indenture, dated as of December 21, 2021, by and among BSPRT 2021-FL7 Issuer, Ltd., BSPRT 2021-FL7 Co-Issuer, LLC, Benefit Street Partners Realty Operating Partnership, L.P., as advancing agent, and U.S. Bank National Association, as trustee, note administrator and custodian (incorporated by reference to Exhibit 10.1 to the Registrant’s Current Report on Form 8-K filed with the SEC on December 21, 2021. |
10.37* | | |
10.38* | | Amendment No. 10 To Pricing Side Letter, dated as of November 3, 2021, among Column Financial, Inc., Credit Suisse AG, Alpine Securitization LTD, BSPRT FINANCE SUB-LENDER I, LLC, BSPRT CS LOAN, LLC, and Franklin BSP Realty Trust, Inc. |
10.39* | | |
10.40* | | |
10.41* | | |
10.42* | | |
10.43* | | |
10.44* | | |
10.45*† | | |
21* | | |
23.1* | | |
31.1* | | |
____________________________________________* Filed herewith.
† Indicates management contract or compensatory plan or arrangement.
SIGNATURES
Pursuant to the requirements of Section 13 or 15(d) of the Securities Exchange Act of 1934, the registrant has duly caused this report to be signed on its behalf by the undersigned, thereunto duly authorized.
| | | | | | | | |
| | Franklin BSP Realty Trust, Inc. |
Date: February 25, 202226, 2024 | By | /s/ Richard J. Byrne |
| | Richard J. Byrne |
| | Chief Executive Officer and President |
Pursuant to the requirements of the Securities Exchange Act of 1934, this report has been signed below by the following persons on behalf of the registrant and in the capacities and on the dates indicated. | | | | | | | | | | | | | | |
| Name | | Capacity | | Date |
| | | | |
| /s/ Richard J. Byrne | | Chairman and Chief Executive Officer and President | | February 25, 202226, 2024 |
| Richard J. Byrne | | (Principal Executive Officer) | | |
| | | | |
| /s/ Jerome S. Baglien | | Chief Financial Officer, Chief Operating Officer and Treasurer (Principal Financial and Accounting Officer) | | February 25, 202226, 2024 |
| Jerome S. Baglien | | | |
| | | | |
| /s/ Elizabeth K. Tuppeny | | Lead Independent Director | | February 25, 202226, 2024 |
| Elizabeth K. Tuppeny | | | | |
| | | | |
| /s/ Pat Augustine | | Director | | February 25, 202226, 2024 |
| Pat Augustine | | | | |
| | | | |
/s/ Michelle GoolsbyJoe Dumars | | Director | | February 25, 202226, 2024 |
Michelle GoolsbyJoe Dumars | | | | |
| | | | |
| /s/ Jamie Handwerker | | Director | | February 25, 202226, 2024 |
| Jamie Handwerker | | | | |
| | | | |
/s/ Gary Keiser | | Director | | February 25, 2022 |
Gary Keiser | | | | |
| | | | |
| /s/ Peter McDonough | | Director | | February 25, 202226, 2024 |
| Peter McDonough | | | | |
| | | | |
| /s/ Buford Ortale | | Director | | February 25, 202226, 2024 |
| Buford Ortale | | | | |
FRANKLIN BSP REALTY TRUST, INC.
INDEX TO CONSOLIDATED FINANCIAL STATEMENTS
| | | | | |
| Page |
| |
Report of Independent Registered Public Accounting Firm, Ernst & Young LLP (PCAOB ID 42) | F-3 |
| |
| |
| |
| |
| |
| |
| Financial Statement Schedule: | |
| |
Report of Independent Registered Public Accounting Firm
To the Stockholders and the Board of Directors and Stockholders of Franklin BSP Realty Trust, Inc.:
OpinionOpinions on the Financial Statements and Internal Control over Financial Reporting
We have audited the accompanying consolidated balance sheetssheet of Franklin BSP Realty Trust, Inc. (formerly Benefit Street Partners Realty Trust, Inc.)and its subsidiaries (the “Company”) as of December 31, 20212023 and 2020, the related consolidated statements of operations, of comprehensive income, stockholders'of changes in stockholders’ equity and of cash flows for each of the three years in the periodyear then ended, December 31, 2021, andincluding the related notes and financial statement schedule IVlisted in the accompanying index as of December 31, 2023 (collectively referred to as the “consolidated financial statements”). We also have audited the Company's internal control over financial reporting as of December 31, 2023, based on criteria established in Internal Control - Integrated Framework (2013) issued by the Committee of Sponsoring Organizations of the Treadway Commission (COSO).
In our opinion, the consolidated financial statements referred to above present fairly, in all material respects, the financial position of the Company atas of December 31, 2021 and 2020,2023, and the results of its operations and its cash flows for each of the three years in the periodyear then ended December 31, 2021, in conformity with U.S.accounting principles generally accepted accounting principles.
Adoptionin the United States of new accounting standard
As discussedAmerica. Also in Note 2 to the consolidated financial statements,our opinion, the Company changed its methodmaintained, in all material respects, effective internal control over financial reporting as of accounting for credit lossesDecember 31, 2023, based on criteria established in 2020. As explained below, auditingInternal Control - Integrated Framework (2013) issued by the Company’s allowance for credit losses – commercial mortgage loans held for investment was a critical audit matter.COSO.
Basis for OpinionOpinions
TheseThe Company's management is responsible for these consolidated financial statements, are the responsibilityfor maintaining effective internal control over financial reporting, and for its assessment of the Company's management.effectiveness of internal control over financial reporting, included in Management's Annual Reporting on Internal Control over Financial Reporting appearing under Item 9A. Our responsibility is to express an opinionopinions on the Company’s consolidated financial statements and on the Company's internal control over financial statementsreporting based on our audits.audit. We are a public accounting firm registered with the Public Company Accounting Oversight Board (United States) (PCAOB) and are required to be independent with respect to the Company in accordance with the U.S. federal securities laws and the applicable rules and regulations of the Securities and Exchange Commission and the PCAOB.
We conducted our audit in accordance with the standards of the PCAOB. Those standards require that we plan and perform the audit to obtain reasonable assurance about whether the consolidated financial statements are free of material misstatement, whether due to error or fraud, and whether effective internal control over financial reporting was maintained in all material respects.
Our audit of the consolidated financial statements included performing procedures to assess the risks of material misstatement of the consolidated financial statements, whether due to error or fraud, and performing procedures that respond to those risks. Such procedures included examining, on a test basis, evidence regarding the amounts and disclosures in the consolidated financial statements. Our audit also included evaluating the accounting principles used and significant estimates made by management, as well as evaluating the overall presentation of the consolidated financial statements. Our audit of internal control over financial reporting included obtaining an understanding of internal control over financial reporting, assessing the risk that a material weakness exists, and testing and evaluating the design and operating effectiveness of internal control based on the assessed risk. Our audit also included performing such other procedures as we considered necessary in the circumstances. We believe that our audit provides a reasonable basis for our opinions.
Definition and Limitations of Internal Control over Financial Reporting
A company’s internal control over financial reporting is a process designed to provide reasonable assurance regarding the reliability of financial reporting and the preparation of financial statements for external purposes in accordance with generally accepted accounting principles. A company’s internal control over financial reporting includes those policies and procedures that (i) pertain to the maintenance of records that, in reasonable detail, accurately and fairly reflect the transactions and dispositions of the assets of the company; (ii) provide reasonable assurance that transactions are recorded as necessary to permit preparation of financial statements in accordance with generally accepted accounting principles, and that receipts and expenditures of the company are being made only in accordance with authorizations of management and directors of the company; and (iii) provide reasonable assurance regarding prevention or timely detection of unauthorized acquisition, use, or disposition of the company’s assets that could have a material effect on the financial statements.
Because of its inherent limitations, internal control over financial reporting may not prevent or detect misstatements. Also, projections of any evaluation of effectiveness to future periods are subject to the risk that controls may become inadequate because of changes in conditions, or that the degree of compliance with the policies or procedures may deteriorate.
Critical Audit Matters
The critical audit matter communicated below is a matter arising from the current period audit of the consolidated financial statements that was communicated or required to be communicated to the audit committee and that (i) relates to accounts or disclosures that are material to the consolidated financial statements and (ii) involved our especially challenging, subjective, or complex judgments. The communication of critical audit matters does not alter in any way our opinion on the consolidated financial statements, taken as a whole, and we are not, by communicating the critical audit matter below, providing a separate opinion on the critical audit matter or on the accounts or disclosures to which it relates.
Allowance for Credit Losses - Commercial Mortgage Loans, Held for Investment
As described in Notes 2 and 3 to the consolidated financial statements, the allowance for credit losses on the Company’s commercial mortgage loans, held for investment was $47.2 million as of December 31, 2023, inclusive of the general and specific allowances for credit losses of $47.2 million and $0, respectively. The general allowance for credit losses for the Company’s loans carried at amortized cost, such as loans held for investment, represents a lifetime estimate of expected credit losses. The Company’s model to determine the general allowance for credit losses principally utilizes historical loss rates derived from a commercial mortgage-backed securities database with historical losses provided by a third party, forecasting the loss parameters based on a projected macroeconomic scenario using a probability-based statistical approach over a reasonable and supportable forecast period of twelve months, followed by an immediate reversion to average historical losses. For loans held for investment which management identifies reasonable doubt as to whether the collection of contractual components can be satisfied, a specific allowance for credit losses analysis is performed and management may elect to use the fair value of the collateral at the reporting date as a practical expedient. The specific allowance for credit losses is assessed on an individual basis for such loans by comparing the estimated fair value of the underlying collateral, less costs to sell to the book value of the respective loan. The estimated fair value of underlying collateral requires judgments, which may include assumptions regarding capitalization rates and discount rates or other factors deemed relevant by management.
The principal considerations for our determination that performing procedures relating to the allowance for credit losses for commercial mortgage loans, held for investment is a critical audit matter are (i) the significant judgment by management when developing the allowance for credit losses; (ii) a high degree of auditor judgement, subjectivity, and effort in performing procedures and evaluating (a) management’s projected macroeconomic scenario used when developing the general allowance for credit losses and (b) management’s assumptions related to capitalization rates and discount rates used when developing the fair value estimate of the underlying collateral used in the specific allowance for credit losses; and (iii) the audit effort involved the use of professionals with specialized skill and knowledge.
Addressing the matter involved performing procedures and evaluating audit evidence in connection with forming our overall opinion on the consolidated financial statements. These procedures included testing the effectiveness of controls relating to the allowance for credit losses for commercial mortgage loans, held for investment, including controls over management’s projected macroeconomic scenario used in the general allowance for credit losses and assumptions used in developing the fair value estimate of the underlying collateral used in the specific allowance for credit losses. These procedures also included, among others, (i) testing management’s process for developing the allowance for credit losses for commercial mortgage loans, held for investment; (ii) testing the completeness and accuracy of data used in developing the allowance for credit losses; and (iii) the involvement of professionals with specialized skill and knowledge to assist in evaluating (a) the appropriateness of the model used by management for the general allowance for credit losses and the methodology used by management for the specific allowance for credit losses, (b) the reasonableness of the projected macroeconomic scenario when estimating the general allowance for credit losses, and (c) the reasonableness of management’s assumptions related to capitalization rates and discount rates used when estimating the fair value of the underlying collateral used when developing the specific allowance for credit losses.
/s/ PricewaterhouseCoopers LLP
Atlanta, Georgia
February 26, 2024
We have served as the Company’s auditor since 2023.
Report of Independent Registered Public Accounting Firm
To the Stockholders and the Board of Directors of Franklin BSP Realty Trust, Inc.
Opinion on the Financial Statements
We have audited the accompanying consolidated balance sheet of Franklin BSP Realty Trust, Inc. (the Company) as of December 31, 2022, the related consolidated statements of operations, comprehensive income, stockholders’ equity and cash flows for each of the two years in the period ended December 31, 2022, and the related notes (collectively referred to as the “consolidated financial statements”). In our opinion, the consolidated financial statements present fairly, in all material respects, the financial position of the Company at December 31, 2022, and the results of its operations and its cash flows for each of the two years in the period ended December 31, 2022, in conformity with U.S. generally accepted accounting principles.
Basis for Opinion
These financial statements are the responsibility of the Company's management. Our responsibility is to express an opinion on the Company’s financial statements based on our audits. We are a public accounting firm registered with the PCAOB and are required to be independent with respect to the Company in accordance with the U.S. federal securities laws and the applicable rules and regulations of the Securities and Exchange Commission and the PCAOB.
We conducted our audits in accordance with the standards of the PCAOB. Those standards require that we plan and perform the audit to obtain reasonable assurance about whether the financial statements are free of material misstatement, whether due to error or fraud. The Company is not required to have, nor were we engaged to perform, an audit of its internal control over financial reporting. As part of our audits we are required to obtain an understanding of internal control over financial reporting but not for the purpose of expressing an opinion on the effectiveness of the Company's internal control over financial reporting. Accordingly, we express no such opinion.
Our audits included performing procedures to assess the risks of material misstatement of the financial statements, whether due to error or fraud, and performing procedures that respond to those risks. Such procedures included examining, on a test basis, evidence regarding the amounts and disclosures in the financial statements. Our audits also included evaluating the accounting principles used and significant estimates made by management, as well as evaluating the overall presentation of the financial statements. We believe that our audits provide a reasonable basis for our opinion.
Critical Audit Matters
The critical audit matters communicated below are matters arising from the current period audit of the financial statements that were communicated or required to be communicated to the audit committee and that: (1) relate to accounts or disclosures that are material to the financial statements and (2) involved our especially challenging, subjective or complex judgments. The communication of critical audit matters does not alter in any way our opinion on the consolidated financial statements, taken as a whole, and we are not, by communicating the critical audit matters below, providing separate opinions on the critical audit matters or on the accounts or disclosures to which they relate.
Allowance for credit losses – Commercial mortgage loans held-for-investment
| | | | | |
Description of the Matter | Allowance for credit losses– Commercial mortgage loans held-for-investment totaled $15.8 million as of December 31, 2021. As disclosed in Note 2 to the consolidated financial statements, the allowance for credit losses for the Commercial mortgage loans held-for-investment carried at amortized cost, represents a lifetime estimate of expected credit losses. The allowance for credit losses is established for current expected credit losses on the Company’s loan portfolio by utilizing expected loss models. When determining expected losses, the Company uses an economic scenario over a reasonable and supportable forecast period and then fully reverts to historical loss experience to estimate losses over the remaining asset lives. The modeled results are then evaluated to determine if adjustments are needed for certain qualitative factors.
Auditing the Allowance for credit losses– Commercial mortgage loans held-for-investment was complex due to the use of intricate expected loss models and the highly judgmental nature of the economic scenario and qualitative factors.
|
| |
How We Addressed the Matter in Our Audit | With the support of specialists, we assessed the economic scenario by, among other procedures, evaluating management’s methodology and agreeing a sample of key economic variables used to external sources. We also performed and considered the results of various sensitivity analyses and analytical procedures, including comparison of a sample of the key economic variables to alternative external sources, historical statistics and peer real estate investment trust information. With respect to expected loss models, with the support of specialists, we evaluated model calculation design and re-performed the calculation for the models. We also tested the appropriateness of a sample of key inputs and assumptions used in these models by agreeing significant inputs and underlying data to internal and external sources, as well as recalculating when required. We evaluated the overall allowance amount, including model estimates, qualitative factors, and whether the recorded allowance for credit losses appropriately reflects expected credit losses on the loan portfolio. We reviewed historical loss statistics, peer real estate investment trust information, subsequent events and transactions and considered whether they corroborate or contradict the Company’s measurement of the allowance for credit losses. |
| |
| |
| | | | | |
Accounting for the Company’s acquisition of Capstead Mortgage Corporation and subsequent impairment of certain acquired assets |
| |
Description of the Matter | On October 19, 2021, the Company completed its merger with Capstead Mortgage Corporation (”CMO”). As disclosed in Note 18 to the consolidated financial statements, the transaction was accounted for as an asset acquisition based on the Company’s qualitative evaluation that substantially all of the fair value of the gross assets acquired was concentrated in a group of similar identifiable assets. Accordingly, the acquired net assets were fair valued and the Company determined that the consideration paid exceeded the fair value of the net assets acquired resulting in a premium. The premium paid by the Company was allocated to the basis of qualifying assets acquired by the Company. The qualifying assets were subsequently tested for recoverability and determined to be impaired at December 31, 2021 resulting in the recognition of impairment expense by the Company.
Auditing the Company's accounting for its asset acquisition was complex due to the qualitative factors considered by the Company in determining that
substantially all of the fair value of the gross assets acquired was concentrated in a group of similar identifiable assets and the determination that no material intangible assets were acquired. Further, the determination of the appropriate grouping of acquired long-lived assets for the subsequent impairment review required a significant amount of judgment. Auditing the fair value of the net assets acquired, the allocation of the premium to qualifying assets, and the determination of the grouping of long-lived assets for the subsequent impairment review related to certain acquired long-lived assets was complex.
|
| |
How We Addressed the Matter in Our Audit | To test the Company’s accounting for its acquisition of CMO, we performed audit procedures that included, among others, inspecting minutes of board of directors’ meetings, executed transaction agreements, and transfer agent documentation to test the authorization and execution of the transaction and the consideration paid. We evaluated management’s determination that substantially all of the fair value of the gross assets acquired was concentrated in a group of similar identifiable assets and the determination that no material intangible assets were acquired. Additionally, we evaluated the Company’s measurement of the acquired assets, at fair value, at the acquisition date, the allocation of the related purchase premium to qualifying assets and the determination of the grouping of the acquired assets for purposes of the subsequent impairment review of certain acquired long-lived assets. |
/s/ Ernst & Young LLP
We have served as the Company’s auditor since 2017.from 2017-2022.
New York, New York
February 25, 2022March 16, 2023
FRANKLIN BSP REALTY TRUST, INC.
CONSOLIDATED BALANCE SHEETS
(In thousands, except share and per share data)
| | December 31, 2021 | | December 31, 2020 |
| | December 31, 2023 | | | | December 31, 2023 | | December 31, 2022 |
| ASSETS | ASSETS | | | | |
| Cash and cash equivalents | Cash and cash equivalents | | $ | 154,929 | | | $ | 82,071 | |
| Cash and cash equivalents | |
| Cash and cash equivalents | |
| Restricted cash | Restricted cash | | 13,270 | | | 10,070 | |
| Commercial mortgage loans, held for investment, net of allowance of $15,827 and $20,886 as of December 31, 2021 and December 31, 2020, respectively | | 4,211,061 | | | 2,693,848 | |
| Commercial mortgage loans, held for investment, net of allowance for credit losses of $47,175 and $40,848 as of December 31, 2023 and 2022, respectively | |
| Commercial mortgage loans, held for sale, measured at fair value | Commercial mortgage loans, held for sale, measured at fair value | | 34,718 | | | 67,649 | |
| Real estate securities, trading, measured at fair value | | 4,566,871 | | | — | |
| Real estate securities, available for sale, measured at fair value, amortized cost of $— and $179,392 as of December 31, 2021 and December 31, 2020, respectively | | — | | | 171,136 | |
| Real estate securities, trading, measured at fair value (includes pledged assets of $227,610 as of December 31, 2022) | |
| Real estate securities, available for sale, measured at fair value, amortized cost of $243,272 and $220,635 as of December 31, 2023 and 2022, respectively (includes pledged assets of $167,948 and $198,429 as of December 31, 2023 and 2022, respectively) | |
| Derivative instruments, measured at fair value | Derivative instruments, measured at fair value | | 436 | | | 25 | |
| Other real estate investments, measured at fair value | | 2,074 | | | 2,522 | |
| Receivable for loan repayment (1) | |
Receivable for loan repayment (1) | |
Receivable for loan repayment (1) | Receivable for loan repayment (1) | | 252,351 | | | 98,551 | |
| Accrued interest receivable | Accrued interest receivable | | 30,109 | | | 15,295 | |
| Prepaid expenses and other assets | Prepaid expenses and other assets | | 13,595 | | | 8,538 | |
| Intangible lease asset, net of amortization | Intangible lease asset, net of amortization | | 48,472 | | | 13,546 | |
| Real estate owned, net of depreciation | |
| Real estate owned, held for sale | |
| | Real estate owned, net of depreciation | | 90,048 | | | 26,510 | |
| | Cash collateral receivable from derivative counterparties | | 56,767 | | | — | |
| Total assets | |
| | Total assets | |
| | Total assets | Total assets | | $ | 9,474,701 | | | $ | 3,189,761 | |
| LIABILITIES AND STOCKHOLDERS' EQUITY | LIABILITIES AND STOCKHOLDERS' EQUITY | | | | |
| Collateralized loan obligations | Collateralized loan obligations | | $ | 2,162,190 | | | $ | 1,625,498 | |
| Repurchase agreements - commercial mortgage loans | | 1,019,600 | | | 276,340 | |
| Collateralized loan obligations | |
| Collateralized loan obligations | |
| Repurchase agreements and revolving credit facilities - commercial mortgage loans | |
| Repurchase agreements - real estate securities | Repurchase agreements - real estate securities | | 4,178,784 | | | 186,828 | |
| Mortgage note payable | Mortgage note payable | | 23,998 | | | 29,167 | |
| Other financing and loan participation - commercial mortgage loans | | 37,903 | | | 31,379 | |
| Other financings | |
| Unsecured debt | Unsecured debt | | 148,594 | | | — | |
| Derivative instruments, measured at fair value | Derivative instruments, measured at fair value | | 32,295 | | | 403 | |
| Interest payable | Interest payable | | 2,692 | | | 2,110 | |
| Distributions payable | Distributions payable | | 30,346 | | | 15,688 | |
| Accounts payable and accrued expenses | Accounts payable and accrued expenses | | 12,705 | | | 5,125 | |
| Due to affiliates | Due to affiliates | | 17,538 | | | 9,525 | |
| | Intangible lease liability, held for sale | |
| Intangible lease liability, net of amortization | |
| Total liabilities | Total liabilities | | $ | 7,666,645 | | | $ | 2,182,063 | |
| Redeemable convertible preferred stock Series A, $0.01 par value, 60,000 authorized and none issued or outstanding as of December 31, 2021 and 40,515 issued and outstanding as of December 31, 2020 | | $ | — | | | $ | 202,292 | |
| Redeemable convertible preferred stock Series C, $0.01 par value, 20,000 authorized and 1,400 issued and outstanding as of December 31, 2021 and December 31, 2020 | | 6,971 | | | 6,962 | |
| Redeemable convertible preferred stock Series D, $0.01 par value, 20,000 authorized and 17,950 issued and outstanding as of December 31, 2021 and none issued or outstanding as of December 31, 2020 | | 89,684 | | | — | |
| Commitments and Contingencies | | Commitments and Contingencies | | |
| Redeemable convertible preferred stock: | |
| Redeemable convertible preferred stock Series H, $0.01 par value, 20,000 authorized and 17,950 issued and outstanding as of December 31, 2023 and 2022, respectively | |
| Redeemable convertible preferred stock Series H, $0.01 par value, 20,000 authorized and 17,950 issued and outstanding as of December 31, 2023 and 2022, respectively | |
| Redeemable convertible preferred stock Series H, $0.01 par value, 20,000 authorized and 17,950 issued and outstanding as of December 31, 2023 and 2022, respectively | |
| Redeemable convertible preferred stock Series I, $0.01 par value, none issued and outstanding as of December 31, 2023, 1,000 authorized and 1,000 issued and outstanding as of December 31, 2022 | |
| Total redeemable convertible preferred stock | |
| Equity: | Equity: | |
| Preferred stock, $0.01 par value, 10,000,000 authorized, none issued and outstanding as of December 31, 2021 and December 31, 2020, respectively | | — | | | — |
| Preferred stock, $0.01 par value; 100,000,000 shares authorized, 7.5% Cumulative Redeemable Preferred Stock, Series E, 10,329,039 shares issued and outstanding as of December 31, 2021 and none issued or outstanding as of December 31, 2020 | | 258,742 | | | — | |
| Series F Preferred stock, $0.01 par value, 40,000,000 authorized and 39,733,299 issued and outstanding as of December 31, 2021 and none issued or outstanding as of December 31, 2020 | | 710,431 | | | — | |
| Common stock, $0.01 par value, 900,000,000 shares authorized, 43,965,928 and 44,510,051 issued and outstanding as of December 31, 2021 and December 31, 2020, respectively | | 441 | | | 446 | |
| Preferred stock, $0.01 par value; 100,000,000 shares authorized, 7.5% Cumulative Redeemable Preferred Stock, Series E, 10,329,039 shares issued and outstanding as of December 31, 2023 and 2022 | |
| Preferred stock, $0.01 par value; 100,000,000 shares authorized, 7.5% Cumulative Redeemable Preferred Stock, Series E, 10,329,039 shares issued and outstanding as of December 31, 2023 and 2022 | |
| Preferred stock, $0.01 par value; 100,000,000 shares authorized, 7.5% Cumulative Redeemable Preferred Stock, Series E, 10,329,039 shares issued and outstanding as of December 31, 2023 and 2022 | |
| Common stock, $0.01 par value, 900,000,000 shares authorized, 82,751,913 and 82,992,784 issued and outstanding as of December 31, 2023 and 2022, respectively | |
| Additional paid-in capital | Additional paid-in capital | | 903,264 | | | 912,725 | |
| Accumulated other comprehensive income (loss) | Accumulated other comprehensive income (loss) | | (62) | | | (8,256) | |
| Accumulated deficit | Accumulated deficit | | (167,179) | | | (106,471) | |
| Total stockholders' equity | Total stockholders' equity | | $ | 1,705,637 | | | $ | 798,444 | |
| Non-controlling interest | Non-controlling interest | | $ | 5,764 | | | $ | — | |
| Total equity | Total equity | | $ | 1,711,401 | | | $ | 798,444 | |
| Total liabilities, redeemable convertible preferred stock and equity | Total liabilities, redeemable convertible preferred stock and equity | | $ | 9,474,701 | | | $ | 3,189,761 | |
___________________________________________
(1) Includes $187.0$55.1 million and $98.6$42.5 million of cash held by the servicer related to CLO loan payoffsthe CLOs as of December 31, 20212023 and December 31, 2020, as well as $65.3 million of RMBS2022, respectively. The Company no longer holds a residential mortgage backed securities principal paydownspaydown receivable as of December 31, 2021.2023. The Company held a residential mortgage backed securities principal paydown receivable of $0.1 million as of December 31, 2022.
The accompanying notes are an integral part of these consolidated financial statements.
FRANKLIN BSP REALTY TRUST, INC.
CONSOLIDATED STATEMENTS OF OPERATIONS
(In thousands, except share and per share data)
| | | | | | | | | | | | | | | | | |
| Year Ended December 31, |
| 2021 | | 2020 | | 2019 |
| Interest Income: | | | | | |
| Interest income | $ | 216,890 | | | $ | 179,872 | | | $ | 195,299 | |
| Less: Interest expense | 60,835 | | | 66,556 | | | 90,418 | |
| Net interest income | 156,055 | | | 113,316 | | | 104,881 | |
| Revenue from real estate owned | 4,759 | | | 4,299 | | | 3,169 | |
| Total Income | $ | 160,814 | | | $ | 117,615 | | | $ | 108,050 | |
| Expenses: | | | | | |
| Asset management and subordinated performance fee | 28,110 | | | 15,178 | | | 16,226 | |
| Acquisition expenses | 1,203 | | | 696 | | | 900 | |
| Administrative services expenses | 7,658 | | | 13,120 | | | 16,363 | |
| Impairment of acquired assets | 88,282 | | | — | | | — | |
| Professional fees | 11,650 | | | 10,964 | | | 11,631 | |
| Real estate owned operating expenses | — | | | 3,653 | | | 2,802 | |
| Depreciation and amortization | 2,107 | | | 2,233 | | | 507 | |
| Other expenses | 3,946 | | | 3,312 | | | 3,771 | |
| Total expenses | $ | 142,956 | | | $ | 49,156 | | | $ | 52,200 | |
| Other (income)/loss: | | | | | |
| Provision/(benefit) for credit losses | (5,192) | | | 13,296 | | | 3,007 | |
| Impairment losses on real estate owned assets | — | | | 398 | | | — | |
| Realized (gain)/loss on extinguishment of debt | — | | | (3,678) | | | — | |
| Realized (gain)/loss on sale of real estate securities | 1,376 | | | 10,137 | | | 0 |
| Realized (gain)/loss on sale of commercial mortgage loans, held for sale | (26) | | | (184) | | | 25 | |
| Realized (gain)/loss on sale of real estate owned assets, held for sale | (9,809) | | | (1,851) | | | — | |
| Realized (gain)/loss on sale of commercial mortgage loans, held for sale, measured at fair value | (24,208) | | | (15,931) | | | (37,832) | |
| Unrealized (gain)/loss on commercial mortgage loans, held for sale, measured at fair value | (469) | | | 75 | | | (312) | |
| Unrealized (gain)/loss on other real estate investments, measured at fair value | 19 | | | 32 | | | (47) | |
| Trading (gain)/loss | 34,752 | | | — | | | — | |
| Unrealized (gain)/loss on derivatives | (7,402) | | | 995 | | | (1,722) | |
| Realized (gain)/loss on derivatives | (484) | | | 12,486 | | | 4,324 | |
| Total other (income)/loss | $ | (11,443) | | | $ | 15,775 | | | $ | (32,557) | |
| Income before taxes | 29,301 | | | 52,684 | | | 88,407 | |
| Provision/(benefit) for income tax | 3,599 | | | (2,062) | | | $ | 4,483 | |
| Net income | $ | 25,702 | | | $ | 54,746 | | | $ | 83,924 | |
| | | | | |
| | | | | |
| Net income/(loss) applicable to common stock | $ | (7,885) | | | $ | 39,826 | | | $ | 66,914 | |
| | | | | |
| Basic net income per share | $ | (0.18) | | | $ | 0.90 | | | $ | 1.60 | |
| Diluted net income per share | $ | (0.18) | | | $ | 0.90 | | | $ | 1.60 | |
| Basic weighted average shares outstanding | 43,419,209 | | | 44,384,813 | | | 41,859,142 | |
| Diluted weighted average shares outstanding | 43,434,731 | | | 44,398,879 | | | 41,871,646 | |
| | | | | | | | | | | | | | | | | |
| Year Ended December 31, |
| 2023 | | 2022 | | 2021 |
| Income | | | | | |
| Interest income | $ | 552,506 | | | $ | 357,705 | | | $ | 216,890 | |
| Less: Interest expense | 305,577 | | | 160,526 | | | 56,193 | |
| Net interest income | 246,929 | | | 197,179 | | | 160,697 | |
| Revenue from real estate owned | 17,021 | | | 9,655 | | | 4,759 | |
| Total income | $ | 263,950 | | | $ | 206,834 | | | $ | 165,456 | |
| Expenses | | | | | |
| Asset management and subordinated performance fee | $ | 33,847 | | | $ | 26,157 | | | $ | 28,110 | |
| Acquisition expenses | 1,241 | | | 1,360 | | | 1,203 | |
| Administrative services expenses | 14,440 | | | 12,928 | | | 7,658 | |
| Impairment of acquired assets | — | | | — | | | 88,282 | |
| Professional fees | 15,270 | | | 22,566 | | | 11,650 | |
| Share-based compensation | 4,761 | | | 2,519 | | | — | |
| | | | | |
| Depreciation and amortization | 7,128 | | | 5,408 | | | 2,107 | |
| Other expenses | 11,135 | | | 6,572 | | | 3,946 | |
| Total expenses | $ | 87,822 | | | $ | 77,510 | | | $ | 142,956 | |
| Other income/(loss) | | | | | |
| (Provision)/benefit for credit losses | $ | (33,738) | | | $ | (36,115) | | | $ | 5,192 | |
| | | | | |
| Realized gain/(loss) on extinguishment of debt | 2,201 | | | (5,167) | | | (4,642) | |
| Realized gain/(loss) on sale of available for sale trading securities | 80 | | | — | | | — | |
| Realized gain/(loss) on sale of commercial mortgage loans, held for sale | — | | | (354) | | | 26 | |
| | | | | |
| Realized gain/(loss) on sale of commercial mortgage loans, held for sale, measured at fair value | 3,873 | | | 2,358 | | | 24,208 | |
| Gain/(loss) on other real estate investments | (7,089) | | | (692) | | | 9,790 | |
| Unrealized gain/(loss) on commercial mortgage loans, held for sale, measured at fair value | 44 | | | (511) | | | 469 | |
| | | | | |
| Trading gain/(loss) | (605) | | | (119,220) | | | (36,128) | |
| Unrealized gain/(loss) on derivatives | (140) | | | (15,840) | | | 7,402 | |
| Realized gain/(loss) on derivatives | 998 | | | 60,033 | | | 484 | |
| Total other income/(loss) | $ | (34,376) | | | $ | (115,508) | | | $ | 6,801 | |
| Income/(loss) before taxes | 141,752 | | | 13,816 | | | 29,301 | |
| (Provision)/benefit for income tax | 2,757 | | | 399 | | | (3,599) | |
| Net income/(loss) | $ | 144,509 | | | $ | 14,215 | | | $ | 25,702 | |
| Net (income)/loss attributable to non-controlling interest | 706 | | | 216 | | | — | |
| Net income/(loss) attributable to Franklin BSP Realty Trust, Inc. | $ | 145,215 | | | $ | 14,431 | | | $ | 25,702 | |
| Less: Preferred stock dividends | 26,993 | | | 41,741 | | | 33,587 | |
| | | | | |
| Net income/(loss) attributable to common stock | $ | 118,222 | | | $ | (27,310) | | | $ | (7,885) | |
| | | | | |
| Basic earnings per share | $ | 1.42 | | | $ | (0.38) | | | $ | (0.18) | |
| Diluted earnings per share | $ | 1.42 | | | $ | (0.38) | | | $ | (0.18) | |
| Basic weighted average shares outstanding | 82,307,970 | | | 71,628,365 | | | 43,419,209 | |
| Diluted weighted average shares outstanding | 82,307,970 | | | 71,628,365 | | | 43,434,731 | |
The accompanying notes are an integral part of these consolidated financial statements.
FRANKLIN BSP REALTY TRUST, INC.
CONSOLIDATED STATEMENTS OF COMPREHENSIVE INCOME
(Dollars In thousands)
| | | | | | | | | | | | | | | | | |
| Year Ended December 31, |
| 2021 | | 2020 | | 2019 |
| Net income | $ | 25,702 | | | $ | 54,746 | | | $ | 83,924 | |
| | | | | |
| Unrealized gain/(loss) on available for sale securities | 8,256 | | | (7,278) | | | (978) | |
| Amounts related to cash flow hedges: | | | | | |
| Change in net unrealized gain or loss | (852) | | | — | | | — | |
| Reclassification adjustment for amounts included in net income/(loss) | 790 | | | — | | | — | |
| $ | 8,194 | | | $ | (7,278) | | | $ | (978) | |
| Comprehensive income attributable to Franklin BSP Realty Trust, Inc. | $ | 33,896 | | | $ | 47,468 | | | $ | 82,946 | |
| | | | | | | | | | | | | | | | | |
| Year Ended December 31, |
| 2023 | | 2022 | | 2021 |
| Net income/(loss) | $ | 144,509 | | | $ | 14,215 | | | $ | 25,702 | |
| | | | | |
| Amounts related to available for sale real estate securities: | | | | | |
| Change in net unrealized gain/(loss) | $ | (330) | | | $ | 390 | | | $ | 8,256 | |
| Reclassification adjustment for amounts included in net income/(loss) | (763) | | | — | | | — | |
| $ | (1,093) | | | $ | 390 | | | $ | 8,256 | |
| Amounts related to cash flow hedges: | | | | | |
| Change in net unrealized gain/(loss) | $ | — | | | $ | (220) | | | $ | (852) | |
| Reclassification adjustment for amounts included in net income/(loss) | — | | | 282 | | | 790 | |
| $ | — | | | $ | 62 | | | $ | (62) | |
| Comprehensive (income)/loss attributable to non-controlling interest | 706 | | | 216 | | | — | |
| Comprehensive income/(loss) attributable to Franklin BSP Realty Trust, Inc. | $ | 144,122 | | | $ | 14,883 | | | $ | 33,896 | |
The accompanying notes are an integral part of these consolidated financial statements.
FRANKLIN BSP REALTY TRUST, INC.
CONSOLIDATED STATEMENTS OF CHANGES IN STOCKHOLDERS' EQUITY
(In thousands, except share data)
| | Common Stock | |
| Number of Shares | | Par Value | | Additional Paid-In Capital | | Accumulated Other Comprehensive Loss | | Accumulated Deficit | | Preferred E | | Preferred F | | Total Stockholders' Equity | | Non-Controlling Interest | | Total Equity |
| Balance, December 31, 2018 | 39,303,710 | | | $ | 395 | | | $ | 827,558 | | | $ | (459) | | | $ | (94,266) | | | $ | — | | | $ | — | | | $ | 733,228 | | | $ | — | | | $ | 733,228 | |
| Issuance of common stock | 4,601,904 | | | 46 | | | 76,846 | | | — | | | — | | | — | | | — | | | 76,892 | | | — | | | 76,892 | |
| Common stock repurchases | (741,853) | | | (7) | | | (13,806) | | | — | | | — | | | — | | | — | | | (13,813) | | | — | | | (13,813) | |
| Common stock issued through distribution reinvestment plan | 746,654 | | | 7 | | | 13,903 | | | — | | | — | | | — | | | — | | | 13,910 | | | — | | | 13,910 | |
| Share-based compensation | 6,400 | | | — | | | 156 | | | — | | | — | | | — | | | — | | | 156 | | | — | | | 156 | |
| Offering costs | — | | | — | | | (1,347) | | | — | | | — | | | — | | | — | | | (1,347) | | | — | | | (1,347) | |
| Net income | — | | | — | | | — | | | — | | | 83,924 | | | — | | | — | | | 83,924 | | | — | | | 83,924 | |
| Distributions declared | — | | | — | | | — | | | — | | | (75,626) | | | — | | | — | | | (75,626) | | | — | | | (75,626) | |
| Other comprehensive income | — | | | — | | | — | | | (519) | | | — | | | — | | | — | | | (519) | | | — | | | (519) | |
| Balance, December 31, 2019 | 43,916,815 | | | $ | 441 | | | $ | 903,310 | | | $ | (978) | | | $ | (85,968) | | | $ | — | | | $ | — | | | $ | 816,805 | | | $ | — | | | $ | 816,805 | |
| Issuance of common stock | 650,034 | | | 6 | | | 10,880 | | | — | | | — | | | — | | | — | | | 10,886 | | | — | | | 10,886 | |
| Common stock repurchases | (579,467) | | | (6) | | | (10,253) | | | — | | | — | | | — | | | — | | | (10,259) | | | — | | | (10,259) | |
| Common stock issued through distribution reinvestment plan | 511,899 | | | 5 | | | 8,809 | | | — | | | — | | | — | | | — | | | 8,814 | | | — | | | 8,814 | |
| Share-based compensation | 10,770 | | | — | | | 193 | | | — | | | — | | | — | | | — | | | 193 | | | — | | | 193 | |
| Offering costs | — | | | — | | | (214) | | | — | | | — | | | — | | | — | | | (214) | | | — | | | (214) | |
| Net income | — | | | — | | | — | | | — | | | 54,746 | | | — | | | — | | | 54,746 | | | — | | | 54,746 | |
| Distributions declared | — | | | — | | | — | | | — | | | (67,488) | | | — | | | — | | | (67,488) | | | — | | | (67,488) | |
| Cumulative-effect adjustment upon adoption of ASU 2016-13 (Note 2) | — | | | — | | | — | | | — | | | (7,761) | | | — | | | — | | | (7,761) | | | — | | | (7,761) | |
| Other comprehensive income | — | | | — | | | — | | | (7,278) | | | — | | | — | | | — | | | (7,278) | | | — | | | (7,278) | |
| Common Stock | | | Common Stock | | Additional Paid-In Capital | | Accumulated Other Comprehensive Income/(Loss) | | Accumulated Deficit | | Preferred E | | Preferred F | | Total Stockholders' Equity | | Non-Controlling Interest | | Total Equity |
| Number of Shares | |
| Balance, December 31, 2020 | |
| Balance, December 31, 2020 | |
| Balance, December 31, 2020 | Balance, December 31, 2020 | 44,510,051 | | | $ | 446 | | | $ | 912,725 | | | $ | (8,256) | | | $ | (106,471) | | | $ | — | | | $ | — | | | $ | 798,444 | | | $ | — | | | $ | 798,444 | |
| Issuance of preferred stock | Issuance of preferred stock | — | | | — | | | — | | | — | | | — | | | 258,742 | | | 710,431 | | | 969,173 | | | — | | | 969,173 | |
| Issuance of common stock | Issuance of common stock | 31,887,442 | | | 319 | | | 579,207 | | | — | | | — | | | — | | | — | | | 579,526 | | | — | | | 579,526 | |
| Common stock repurchases | Common stock repurchases | (648,837) | | | (6) | | | (11,411) | | | — | | | — | | | — | | | — | | | (11,417) | | | — | | | (11,417) | |
| Common stock issued through distribution reinvestment plan | Common stock issued through distribution reinvestment plan | 289,755 | | | 3 | | | 5,107 | | | — | | | — | | | — | | | — | | | 5,110 | | | — | | | 5,110 | |
| Share-based compensation | Share-based compensation | 11,184 | | | — | | | 211 | | | — | | | — | | | — | | | — | | | 211 | | | — | | | 211 | |
| Common stock exchanged for Series F Preferred Stock | |
| Series A Preferred stock converted into common stock | |
| Offering costs | Offering costs | — | | | — | | | (68) | | | — | | | — | | | — | | | — | | | (68) | | | — | | | (68) | |
| Exchanged for series F preferred stock | (39,733,299) | | | (397) | | | (710,034) | | | — | | | — | | | — | | | — | | | (710,431) | | | — | | | (710,431) | |
| Preferred A conversion to common stock | 7,649,632 | | | 76 | | | 127,527 | | | — | | | — | | | — | | | — | | | 127,603 | | | 127,603 | |
| Net income | — | | | — | | | — | | | — | | | 25,702 | | | — | | | — | | | 25,702 | | | — | | | 25,702 | |
| Net income/(loss) attributable to Franklin BSP Realty Trust, Inc. | |
| Distributions declared | Distributions declared | — | | | — | | | — | | | — | | | (86,410) | | | — | | | — | | | (86,410) | | | — | | | (86,410) | |
| Other comprehensive income | — | | | — | | | — | | | 8,194 | | | — | | | — | | | — | | | 8,194 | | | — | | | 8,194 | |
| Non-controlling interest | — | | | — | | | — | | | — | | | — | | | — | | | — | | | — | | | 5,764 | | | 5,764 | |
| Other comprehensive income/(loss) | |
| Contributions/(distributions) in non-controlling interest, net | |
| Balance, December 31, 2021 | Balance, December 31, 2021 | 43,965,928 | | | $ | 441 | | | $ | 903,264 | | | $ | (62) | | | $ | (167,179) | | | $ | 258,742 | | | $ | 710,431 | | | $ | 1,705,637 | | | $ | 5,764 | | | $ | 1,711,401 | |
| | Common stock repurchases | |
| Common stock repurchases | |
| Common stock repurchases | |
| Common stock issued through distribution reinvestment plan | |
| Share-based compensation | |
| Offering costs | |
| Series F Preferred stock converted into common stock | |
| Series C Preferred stock converted into common stock | |
| Net income/(loss) attributable to Franklin BSP Realty Trust, Inc. | |
| Net (income)/loss attributable to non-controlling interest | |
| Distributions declared | |
| Other comprehensive income/(loss) | |
| Contributions/(distributions) in non-controlling interest, net | |
| Balance, December 31, 2022 | |
| | Common stock repurchases | |
| Common stock repurchases | |
| Common stock repurchases | |
| Common stock issued through distribution reinvestment plan | |
| Share-based compensation | |
| Shares canceled for tax withholding on vested equity rewards | |
| Series I Preferred stock converted into common stock | |
| Offering costs | |
| Net income/(loss) attributable to Franklin BSP Realty Trust, Inc. | |
| Net income/(loss) attributable to non-controlling interest | |
| Distributions declared | |
| Other comprehensive income/(loss) | |
| Contributions/(distributions) in non-controlling interest, net | |
| Balance, December 31, 2023 | |
The accompanying notes are an integral part of these consolidated financial statements.
FRANKLIN BSP REALTY TRUST, INC.
CONSOLIDATED STATEMENTS OF CASH FLOWS
(In thousands)
| | For the Years Ended December 31, |
| 2021 | | 2020 | | 2019 |
| For the Years Ended December 31, | | | For the Years Ended December 31, |
| 2023 | | | 2023 | | 2022 | | 2021 |
| Cash flows from operating activities: | Cash flows from operating activities: | | | | | |
| Net income | $ | 25,702 | | | $ | 54,746 | | | $ | 83,924 | |
| Net income/(loss) | |
| Net income/(loss) | |
| Net income/(loss) | |
| Adjustments to reconcile net income to net cash provided by operating activities: | Adjustments to reconcile net income to net cash provided by operating activities: | |
| Premium amortization and (discount accretion), net | |
| Premium amortization and (discount accretion), net | |
| Premium amortization and (discount accretion), net | Premium amortization and (discount accretion), net | (7,035) | | | (5,999) | | | (6,144) | |
| Accretion of deferred commitment fees | Accretion of deferred commitment fees | (10,139) | | | (6,410) | | | (2,754) | |
| Amortization of deferred financing costs | Amortization of deferred financing costs | 9,203 | | | 9,585 | | | 9,584 | |
| Share-based compensation | Share-based compensation | 211 | | | 193 | | | 156 | |
| Realized (gain)/loss from sale of real estate securities | 1,376 | | | 10,137 | | | — | |
| Realized (gain)/loss from sale of real estate owned, held for sale | (9,809) | | | (1,851) | | | — | |
| Realized (gain)/loss from sale of available for sale trading securities | |
| (Gain)/loss on other real estate investments | |
| | Realized (gain)/loss from extinguishment of debt | |
| Realized (gain)/loss from extinguishment of debt | |
| Realized (gain)/loss from extinguishment of debt | Realized (gain)/loss from extinguishment of debt | — | | | (3,678) | | | — | |
| Realized (gain)/loss on swap terminations | Realized (gain)/loss on swap terminations | (616) | | | — | | | — | |
| Unrealized (gain)/loss on commercial mortgage loans held for sale | (469) | | | 75 | | | (359) | |
| Realized (gain)/loss on sale of commercial mortgage loans, held for sale | |
| Trading (gain)/loss | |
| Unrealized (gain)/loss on commercial mortgage loans held for sale, measured at fair value | |
| Unrealized (gain)/losses on derivative instruments | Unrealized (gain)/losses on derivative instruments | (7,402) | | | 995 | | | (1,722) | |
| Unrealized loss on other real estate securities | 19 | | | 32 | | | — | |
| Realized and unrealized gain/loss on real estate securities, trading | 34,752 | | | — | | | — | |
| | Depreciation and amortization | Depreciation and amortization | 2,107 | | | 2,233 | | | — | |
| Recognition of deferred rent revenue | — | | | (150) | | | — | |
| Increase/(decrease) for credit losses | (5,192) | | | 13,296 | | | 3,007 | |
| Impairment losses on real estate owned assets | — | | | 398 | | | — | |
| Origination of commercial mortgage loans, held for sale | (420,673) | | | (267,553) | | | (1,020,702) | |
| Proceeds from sale of commercial mortgage loans, held for sale | 454,073 | | | 312,206 | | | 975,243 | |
| Depreciation and amortization | |
| Depreciation and amortization | |
| | Provision/(benefit) for credit losses | |
| Provision/(benefit) for credit losses | |
| Provision/(benefit) for credit losses | |
| | Origination of commercial mortgage loans, held for sale, measured at fair value | |
| Origination of commercial mortgage loans, held for sale, measured at fair value | |
| Origination of commercial mortgage loans, held for sale, measured at fair value | |
| Proceeds from sale of commercial mortgage loans, held for sale, measured at fair value | |
| Severance and deferred compensation | Severance and deferred compensation | (22,168) | | | — | | | — | |
| Changes in assets and liabilities: | Changes in assets and liabilities: | |
| Accrued interest receivable | |
| Accrued interest receivable | |
| Accrued interest receivable | Accrued interest receivable | (4,675) | | | 7,423 | | | (765) | |
| Prepaid expenses and other assets | Prepaid expenses and other assets | 94,864 | | | (7,079) | | | (4,020) | |
| Accounts payable and accrued expenses | Accounts payable and accrued expenses | 3,640 | | | (5,837) | | | 6,428 | |
| Due to affiliates | Due to affiliates | 8,013 | | | 4,736 | | | 1,560 | |
| Interest payable | Interest payable | 715 | | | (2,164) | | | 1,933 | |
| Net cash (used in)/provided by operating activities | Net cash (used in)/provided by operating activities | $ | 146,497 | | | $ | 115,334 | | | $ | 45,369 | |
| Cash flows from investing activities: | Cash flows from investing activities: | | | | | |
| Cash acquired through merger | Cash acquired through merger | $ | 174,083 | | | $ | — | | | $ | — | |
| Cash acquired through merger | |
| Cash acquired through merger | |
| Origination and purchase of commercial mortgage loans, held for investment | Origination and purchase of commercial mortgage loans, held for investment | (2,881,852) | | | (1,281,158) | | | (1,321,644) | |
| Principal repayments received on commercial mortgage loans, held for investment | Principal repayments received on commercial mortgage loans, held for investment | 1,225,645 | | | 1,228,225 | | | 756,141 | |
| Purchase/repayment of other real estate investments | 426 | | | — | | | (2,511) | |
| Principal repayments received on commercial mortgage loans, held for sale, measured at fair value | |
| Proceeds from sale of other real estate investments | |
| Purchase of real estate owned and capital expenditures | Purchase of real estate owned and capital expenditures | (134,052) | | | (2,824) | | | (42,018) | |
| Proceeds from sale of real estate owned, held for sale | 29,912 | | | 22,472 | | | — | |
| Proceeds from sale of commercial mortgage loans, held for sale | Proceeds from sale of commercial mortgage loans, held for sale | 52,615 | | | 77,164 | | | — | |
| Purchase of real estate securities | Purchase of real estate securities | — | | | (148,580) | | | (369,911) | |
| Principal repayments received on real estate securities | 0 | | — | | | — | |
| Proceeds from sale/repayment of real estate securities | 2,059,418 | | | 346,201 | | | 9,369 | |
| Proceeds from sale of real estate securities | |
| Principal collateral on mortgage investments | Principal collateral on mortgage investments | 541,313 | | | — | | | — | |
| Purchase of derivative instruments | 1,239 | | | (813) | | | 1,333 | |
| Proceeds from sale/(purchase) of derivative instruments | |
| Net cash (used in)/provided by investing activities | Net cash (used in)/provided by investing activities | $ | 1,068,747 | | | $ | 240,687 | | | $ | (969,241) | |
| Cash flows from financing activities: | | | | | |
| Cash consideration paid in merger | $ | (20,485) | | | $ | — | | | $ | — | |
|
FRANKLIN BSP REALTY TRUST, INC.
CONSOLIDATED STATEMENTS OF CASH FLOWS
(In thousands)
| | | | | | | | | | | | | | | | | |
| Proceeds from issuance of common stock | — | | | 10,672 | | | 75,545 | |
| Proceeds from issuances of convertible preferred stock | 15,000 | | | 47 | | | 63,197 | |
| Common stock repurchases | (11,417) | | | (10,259) | | | (13,813) | |
| | | | | |
| Borrowings under collateralized loan obligation | 1,410,173 | | | — | | | 639,899 | |
| Repayments of collateralized loan obligation | (869,887) | | | (182,680) | | | (343,191) | |
| Borrowings on repurchase agreements - commercial mortgage loans | 1,874,694 | | | 682,970 | | | 1,035,524 | |
| Repayments of repurchase agreements - commercial mortgage loans | (1,131,434) | | | (659,173) | | | (932,420) | |
| Borrowings on repurchase agreements - real estate securities | 13,553,886 | | | 2,675,218 | | | 1,570,331 | |
| Repayments of repurchase agreements - real estate securities | (15,983,193) | | | (2,882,749) | | | (1,220,511) | |
| Proceeds from other financing and loan participation - commercial mortgage loans | 6,524 | | | 31,379 | | | — | |
| Repayments on other financing and loan participation - commercial mortgage loans | — | | | — | | | (10,000) | |
| Borrowings on unsecured debt | 210,000 | | | — | | | — | |
| Repayments on unsecured debt | (160,000) | | | — | | | — | |
| Borrowing on mortgage note payable | 23,940 | | | 11,712 | | | 29,167 | |
| Payments of deferred financing costs | (9,285) | | | (349) | | | (4,540) | |
| Cash collateral received on interest rate swaps | 11,138 | | | — | | | — | |
| Proceeds from interest rate swap settlements | 9,115 | | | — | | | — | |
| Distributions paid | (67,955) | | | (49,790) | | | (60,613) | |
| Net cash (used in)/provided by financing activities: | $ | (1,139,186) | | | $ | (373,002) | | | $ | 828,575 | |
| Net change in cash, cash equivalents and restricted cash | $ | 76,058 | | | $ | (16,981) | | | $ | (95,297) | |
| Cash, cash equivalents and restricted cash, beginning of period | 92,141 | | | 109,122 | | | 204,419 | |
| Cash, cash equivalents and restricted cash, end of period | $ | 168,199 | | | $ | 92,141 | | | $ | 109,122 | |
| | | | | |
| Supplemental disclosures of cash flow information: | | | | | |
| Taxes paid | $ | 140 | | | $ | 4,400 | | | $ | — | |
| Interest paid | 51,050 | | | 59,819 | | | 78,901 | |
| Supplemental disclosures of non-cash flow information: | | | | | |
| Common stock issued through distribution reinvestment plan | $ | 5,110 | | | $ | 8,814 | | | $ | 13,903 | |
| Commercial mortgage loans transferred from held for investment to held for sale | 52,615 | | | 76,979 | | | — | |
| Distribution payable | 30,346 | | | 15,688 | | | 6,912 | |
| Commercial mortgage loans transferred from held for sale to held for investment | — | | | — | | | 10,072 | |
| Real estate owned received in foreclosure | — | | | 35,411 | | | 8,110 | |
| Issuances of common stock due to merger | 579,526 | | | — | | | — | |
| Issuances of Series E preferred stock due to merger | 258,742 | | | — | | | — | |
| Unsecured debt assumed due to merger | 98,574 | | | — | | | — | |
| Exchanged for Series F preferred stock | 710,431 | | | — | | | — | |
| Conversion of Preferred A stock to common stock | (127,603) | | | — | | | — | |
| | | | | |
| Reconciliation of cash, cash equivalents and restricted cash at end of period: | | | | | |
| Cash and cash equivalents | $ | 154,929 | | | $ | 82,071 | | | $ | 87,246 | |
| Restricted cash | 13,270 | | | 10,070 | | | 21,876 | |
| Cash, cash equivalents and restricted cash, end of period | $ | 168,199 | | | $ | 92,141 | | | $ | 109,122 | |
| | | | | | | | | | | | | | | | | |
| For the Years Ended December 31, |
| 2023 | | 2022 | | 2021 |
| Cash flows from financing activities: | | | | | |
| Cash consideration paid in merger | $ | — | | | $ | — | | | $ | (20,485) | |
| | | | | |
| Proceeds from issuances of redeemable convertible preferred stock | — | | | — | | | 15,000 | |
| Payments for common stock repurchases | (12,505) | | | (16,579) | | | (11,417) | |
| Shares cancelled for tax withholding on vested equity awards | (812) | | | — | | | — | |
| Payments of offering costs | (269) | | | — | | | — | |
| Borrowings on collateralized loan obligations | 689,294 | | | 1,630,639 | | | 1,410,173 | |
| Repayments of collateralized loan obligations | (241,223) | | | (662,410) | | | (869,887) | |
| Borrowings on repurchase agreements and revolving credit facilities - commercial mortgage loans | 600,164 | | | 1,918,631 | | | 1,874,694 | |
| Repayments of repurchase agreements and revolving credit facilities - commercial mortgage loans | (981,317) | | | (2,257,372) | | | (1,131,434) | |
| Borrowings on repurchase agreements - real estate securities | 870,014 | | | 18,457,406 | | | 13,553,886 | |
| Repayments of repurchase agreements - real estate securities | (1,135,967) | | | (22,196,183) | | | (15,983,193) | |
| Borrowings on other financings | 59,707 | | | 38,537 | | | 6,524 | |
| Repayments on other financings | (99,474) | | | (139) | | | — | |
| Borrowings on unsecured debt | — | | | — | | | 210,000 | |
| Repayments of unsecured debt | (13,367) | | | (50,000) | | | (160,000) | |
| Borrowing on mortgage note payable | — | | | — | | | 23,940 | |
| Payments of deferred financing costs | (12,905) | | | (15,232) | | | (9,285) | |
| Cash collateral received on interest rate swaps | — | | | 56,767 | | | 11,138 | |
| Proceeds from interest rate swap settlements | — | | | 8,478 | | | 9,115 | |
| Distributions to non-controlling interest | (1,987) | | | (745) | | | — | |
| Contributions from non-controlling interest | — | | | 125 | | | — | |
| Distributions paid to common and preferred stockholders | (144,347) | | | (139,415) | | | (67,955) | |
| Net cash (used in)/provided by financing activities: | $ | (424,994) | | | $ | (3,227,492) | | | $ | (1,139,186) | |
| Net change in cash, cash equivalents and restricted cash | $ | 153,200 | | | $ | 22,288 | | | $ | 76,058 | |
| Cash, cash equivalents and restricted cash, beginning of period | 190,487 | | | 168,199 | | | 92,141 | |
| Cash, cash equivalents and restricted cash, end of period | $ | 343,687 | | | $ | 190,487 | | | $ | 168,199 | |
| | | | | |
| Reconciliation of cash, cash equivalents and restricted cash: | | | | | |
| Cash and cash equivalents, beginning of period | $ | 179,314 | | | $ | 154,929 | | | $ | 82,071 | |
| Restricted cash, beginning of period | 11,173 | | | 13,270 | | | 10,070 | |
| Cash, cash equivalents and restricted cash, beginning of period | $ | 190,487 | | | $ | 168,199 | | | $ | 92,141 | |
| | | | | |
| Cash and cash equivalents, end of period | $ | 337,595 | | | $ | 179,314 | | | $ | 154,929 | |
| Restricted cash, end of period | 6,092 | | | 11,173 | | | 13,270 | |
| Cash, cash equivalents and restricted cash, end of period | $ | 343,687 | | | $ | 190,487 | | | $ | 168,199 | |
| | | | | |
| Supplemental disclosures of cash flow information: | | | | | |
| Cash payments for income taxes | $ | 325 | | | $ | 1,199 | | | $ | 140 | |
| Cash payments for interest | 295,130 | | | 144,195 | | | 51,050 | |
| | | | | |
| Supplemental disclosures of non-cash flow information: | | | | | |
| Common stock issued through distribution reinvestment plan | $ | 769 | | | $ | 1,963 | | | $ | 5,110 | |
FRANKLIN BSP REALTY TRUST, INC.
CONSOLIDATED STATEMENTS OF CASH FLOWS
(In thousands)
| | | | | | | | | | | | | | | | | |
| For the Years Ended December 31, |
| 2023 | | 2022 | | 2021 |
| Distribution payable | 36,133 | | | 36,317 | | | 30,346 | |
| Commercial mortgage loans transferred from held for sale to held for investment | — | | | 9,296 | | | 52,615 | |
| Loans transferred to real estate owned | 77,305 | | | 115,978 | | | — | |
| Reclassification of assets held for investment to held for sale | 114,512 | | | — | | | — | |
| Reclassification of liabilities held for investment to held for sale | 13,664 | | | — | | | — | |
| Conversion of preferred stock to common stock | 5,000 | | | 712,428 | | | (127,603) | |
| | | | | |
| | | | | |
| | | | | |
| Issuances of common stock due to merger | — | | | — | | | 579,526 | |
| Issuances of Series E preferred stock due to merger | — | | | — | | | 258,742 | |
| Unsecured debt assumed due to merger | — | | | — | | | 98,574 | |
| Exchange of preferred stock | — | | | 94,748 | | | 710,431 | |
The accompanying notes are an integral part of these consolidated financial statements.
FRANKLIN BSP REALTY TRUST, INC.
NOTES TO CONSOLIDATED FINANCIAL STATEMENTS
December 31, 20212023
Note 1 - Organization and Business Operations
Franklin BSP Realty Trust, Inc., formerly known as Benefit Street Partners Realty Trust, Inc., (the "Company") is a real estate finance company that primarily originates, acquires and manages a diversified portfolio of commercial real estate debt investments secured by properties located within and outside the United States. The Company is a Maryland corporation and has made tax elections to be treated as a real estate investment trust (a "REIT") for U.S. federal income tax purposes since 2013.
The Company believes that it has qualified as a REIT and intends to continue to meet the requirements for qualification and taxation as a REIT. Substantially all of the Company's business is conducted through Benefit Street Partners Realty Operating Partnership, L.P. (the “OP”), a Delaware limited partnership. The Company is the sole general partner and directly or indirectly holds all of the units of limited partner interests in the OP. In addition, the Company, through one or more subsidiaries which are treated as a taxable REIT subsidiary (a “TRS”), is indirectly subject to U.S. federal, state and local income taxes.
The Company has no employees. Benefit Street Partners L.L.C. serves as the Company's advisor (the "Advisor") pursuant to an advisory agreement, as amended on August 18, 2021 (the "Advisory Agreement"). The Advisor, an investment adviser registered with the SEC, is a credit-focused alternative asset management firm.
Established in 2008, the Advisor's credit platform manages funds for institutions and high-net-worth investors across various credit funds and complementary strategies including high yield, levered loans, private/opportunistic debt, liquid credit, structured credit and commercial real estate debt. These strategies complement each other as they all leverage the sourcing, analytical, compliance, and operational capabilities that encompass the platform. The Advisor manages the Company's affairs on a day-to-day basis. The Advisor receives compensation fees and reimbursements for services related to the investment and management of the Company's assets and the operations of the Company. The advisor is a wholly-owned subsidiary of Franklin Resources, Inc., which together with its various subsidiaries operates as "Franklin Templeton”.
The Company invests in commercial real estate debt investments, which may include first mortgage loans, subordinated mortgage loans, mezzanine loans and participations in such loans. The Company also originates conduit loans which the Company intends to sell through its TRS into commercial mortgage-backed securities ("CMBS") securitization transactions. Historically this business has focused primarily on CMBS, unsecured REIT debt,commercial real estate collateralized loan obligation bonds ("CRE CLO bonds"), collateralized debt obligations ("CDOs") and other securities. As a result of the October 2021 acquisition of Capstead Mortgage Corporation ("Capstead"), the Company acquired and continues to hold a significant portfolio of Residential Mortgage Backed Securitiesresidential mortgage backed securities (“RMBS”) in the form of the ARM Agency Securities. The Company also owns real estate acquired by the Company through foreclosure and deed in lieu of foreclosure, and purchased for investment, typically subject to triple net leases.
On October 19, 2021, the Company completed a merger with Capstead Mortgage Corporation (“Capstead”) pursuant to which Capstead merged into a wholly-owned subsidiary of the Company, and the Company’s common stock commenced trading on the NYSE under the ticker “FBRT”. The Capstead assets acquired in the merger consist primarily of cash and residential adjustable-rate mortgage pass-through securities ("ARM Agency Securities" or "ARMs") issued and guaranteed by government-sponsored enterprises or by an agency of the federal government. TheAs of December 31, 2023, the Company intendshas fully disposed of all of its ARM Agency Securities and is continuing to reinvest the cash and proceeds from dividends, interest, repayments and salesthe sale of these securities in its other businesses. The Company also owns real estate that was either acquired by the assets acquiredCompany through foreclosure or deed in the merger into its ownlieu of foreclosure, or that was purchased for investment, strategies. Referprimarily subject to Note 18 - Merger with Capstead for additional information.triple net leases.
Note 2 - Summary of Significant Accounting Policies
Basis of Accounting
The Company's consolidated financial statements and related footnotes have been prepared on the accrual basis of accounting in conformity with accounting principles generally accepted in the United States of America ("GAAP") and pursuant to the requirements for reporting on Form 10-K and Regulation S-X, as appropriate.
Use of Estimates
GAAP requires management to make estimates and assumptions that affect the reported amount of assets and liabilities as of the date of the financial statements and the reported amounts of income and expenses during the reported periods. Changes in the economic environment, financial markets and any other parameters used in determining these estimates could cause actual results to differ materially.
FRANKLIN BSP REALTY TRUST, INC.
NOTES TO CONSOLIDATED FINANCIAL STATEMENTS
December 31, 2021
In response to the global coronavirus (COVID-19) pandemic, numerous countries, including the U.S., have declared national emergencies with respect to COVID-19 and certain jurisdictions, including those where our corporate headquarters and/or properties that secure our investments, or properties that the Company owns, are located, have at times imposed “stay-at-home” guidelines or orders or other restrictions to help prevent its spread. The effects of COVID-19 may negatively and materially impact significant estimates and assumptions used by the Company including, but not limited to estimates of expected credit losses, valuation of our equity method investments and the fair value estimates of the Company’s assets and liabilities. Actual results could materially differ from those estimates.
Principles of Consolidation
The accompanying consolidated financial statements include the accounts of the Company, the OP and its subsidiaries. All intercompany accounts and transactions have been eliminated in consolidation. In determining whether the Company has a controlling financial interest in a joint venture and the requirement to consolidate the accounts of that entity, management considers factors such as ownership interest, authority to make decisions and contractual and substantive participating rights of the other partners or members, as well as whether the entity is a variable interest entity ("VIE") for which the Company is the primary beneficiary.
FRANKLIN BSP REALTY TRUST, INC.
NOTES TO CONSOLIDATED FINANCIAL STATEMENTS
December 31, 2023
The Company has determined the OP is a VIE of which the Company is the primary beneficiary. Substantially all of the Company's assets and liabilities are held by the OP.
The Company consolidates all entities that it controls through either majority ownership or voting rights. In addition, the Company consolidates all VIEs of which the Company is considered the primary beneficiary. VIEs are entities in which equity investors (i) do not have the characteristics of a controlling financial interest and/or (ii) do not have sufficient equity at risk for the entity to finance its activities without additional subordinated financial support from other parties. The entity that consolidates a VIE is its primary beneficiary and is generally the entity with (i) the power to direct the activities that most significantly affect the VIE’s economic performance and (ii) the right to receive benefits from the VIE or the obligation to absorb losses of the VIE that could be significant to the VIE. Non-controlling interest represents the equity of consolidated joint ventures that are not owned by the Company.
The accompanying consolidated financial statements include the accounts of collateralized loan obligations ("CLOs") issued and securitized by wholly owned subsidiaries of the Company. The Company has determined the CLOs are VIEs of which the Company's subsidiary is the primary beneficiary. The assets and liabilities of the CLOs are consolidated in the accompanying consolidated balance sheets in accordance with Financial Accounting Standards Board (“FASB”) Accounting Standards Codification (“ASC”) 810, Consolidation.
Reclassifications
Certain prior year balances have been reclassified in order to conform to the current period presentation.
For the twelve months ended December 31, 2022 and 2021, $5.2 million and $4.6 million, respectively, related to the remaining unamortized deferred financing costs on the redemption of BSPRT 2018-FL4 and BSPRT 2018-FL3, respectively, were reclassified from Interest Expense to Realized gain/(loss) on extinguishment of debt in the consolidated statements of operations and the consolidated statement of cash flows.
For the twelve months ended December 31, 2022, $33 thousand of Realized loss on sale of other real estate investments, measured at fair value and $0.7 million of Unrealized loss on other real estate investments, measured at fair value were combined to be presented as a net result in Gain/(loss) on other real estate investments in the consolidated statements of operations. For the twelve months ended December 31, 2021, $9.8 million of Realized gain on sale of real estate owned assets, held for sale and $19 thousand of Unrealized loss on other real estate investments, measured at fair value were combined to be presented as a net result in Gain/(loss) on other real estate investments in the consolidated statements of operations.
Acquisition Expenses
TheFor commercial mortgage loans, held for investment the Company capitalizes certain direct costs relating to loan origination activities. The cost is amortized over the life of the loan and recognized in interestInterest income in the Company's consolidated statements of operations. Acquisition expenses paid on future funding amounts are expensed within the acquisitionAcquisition expenses line in the Company's consolidated statements of operations.
Cash and Cash Equivalents
Cash consists of amounts deposited with high quality financial institutions. These deposits are guaranteed by the Federal Deposit Insurance Company up to an insurance limit. Cash equivalents include short-term, liquid investments in money market funds with original maturities of 90 days or less when purchased. Cash and cash equivalent balances may, at a limited number of banks and financial institutions, exceed insurable amounts. The Company believes it mitigates risk by investing in or through major financial institutions and primarily in funds that are currently U.S. federal government insured up to applicable account limits.
Restricted Cash
Restricted cash primarily consists of cash pledged as margin on repurchase agreements and derivative transactions. The duration of this restricted cash generally matches the duration of the related repurchase agreements or derivative transaction.
FRANKLIN BSP REALTY TRUST, INC.
NOTES TO CONSOLIDATED FINANCIAL STATEMENTS
December 31, 2023
Commercial Mortgage Loans
Held for Investment - Commercial mortgage loans that are held for investment purposes and are anticipated to be held until maturity, are carried at cost, net of unamortized acquisition expenses, discounts or premiums and unfunded commitments. Commercial mortgage loans, held for investment purposes, are carried at amortized cost less a specific allowance for credit losses. Interest income is recorded on the accrual basis and related discounts, premiums and acquisition expenses on investments are amortized over the life of the investment using the effective interest method. Amortization or accretion is reflected as an adjustment to interest income in the Company’s consolidated statements of operations. Guaranteed loan commitment fees payable by the borrower upon maturity are accreted over the life of the investment using the effective interest method. The accretion of guaranteed loan commitment fees is recognized in interestInterest income in the Company's consolidated statements of operations.
FRANKLIN BSP REALTY TRUST, INC.
NOTES TO CONSOLIDATED FINANCIAL STATEMENTS
December 31, 2021
Held for Sale - Commercial mortgage loans that are intended to be sold in the foreseeable future are reported as held-forheld for sale and are transferred at fair value and recorded at the lower of cost or fair value with changes recorded through the statements of operations. Unamortized loan origination costs for commercial mortgage loans held for sale that are carried at the lower of cost or fair value are capitalized as part of the carrying value of the loans and recognized upon the sale of such loans. Amortization of origination costs ceases upon transfer of commercial mortgage loans to held for sale.
Held for Sale, Accounted for Under theMeasured at Fair Value Option - The fair value option provides an option to irrevocably elect fair value as an alternative measurement for selected financial assets, financial liabilities, and written loan commitments. The Company has elected to measure commercial mortgage loans held for sale in the Company's TRS under the fair value option. These commercial mortgage loans are included in the Commercial mortgage loans, held for sale, measured at fair value in the consolidated balance sheets. Interest income received on commercial mortgage loans held for sale, measured at fair value is recorded on the accrual basis of accounting and is included in interestInterest income in the consolidated statements of operations. Costs to originate these investments are expensed when incurred.
Real estate owned
The Company classifies its real estate owned as long-lived assets held for investment or as long-lived assets held for sale. Held for investment assets are stated at cost, as adjusted for any impairment loss, less accumulated depreciation.
Real estate owned, is classified as held for sale in the period in which the six criteria under ASC Topic 360, "Property, Plant, and Equipment" are met: (1) we commit to a plan and have the authority to sell the asset; (2) the asset is available for sale in its current condition; (3) we have initiated an active marketing plan to locate a buyer for the asset; (4) the sale of the asset is both probable and expected to qualify for full sales recognition within a period of 12 months; (5) the asset is being actively marketed for sale at a price that is reflective of its current fair value; and (6) we do not anticipate changes to our plan to sell the asset. Held for sale assets are carried at the lower of depreciated cost or estimated fair value, less estimated costs to sell.
investment - Amounts capitalized to real estate owned, held for investment consist of the cost of acquisition or construction, any tenant improvements or major improvements, betterments that extend the useful life of the related asset, and transaction costs associated with the acquisition of an individual asset that does not qualify as a business combination. All repairs and maintenance are expensed as incurred. Additionally, the Company capitalizes interest while the development, or redevelopment, of a real estate owned asset is in progress. No development or redevelopments of real estate owned assets are in progress as of December 31, 2021.2023.
The Company’s real estate owned, held for investment assets are depreciated or amortized using the straight-line method over the following useful lives:
| | | | | |
| Building | 40 years |
| Furniture, fixtures, and equipment | 15 years |
| Site Improvements | 5 - 25 years |
| Intangible Lease Assets | Lease Term |
The Company continually monitors events and changes in circumstances that could indicate that the carrying amounts of the real estate and related intangible assets of either operating properties or properties under construction in which the Company has an ownership interest, either directly or through investments in joint ventures, may not be recoverable. When indicators of potential impairment are present, management assesses whether the respective carrying values will be recovered from the undiscounted future operating cash flows expected from the use of the asset and its eventual disposition for assets held for use, or from the estimated fair values, less costs to sell, for assets held for sale. In the event that the expected undiscounted future cash flows for assets held for use or the estimated fair value, less costs to sell, for assets held for sale do not exceed the respective asset carrying value, management adjusts such assets to the respective estimated fair values and recognizes an impairment loss. Estimated fair values are calculated based on the following information, depending upon availability, in order of preference: (i) recently quoted market prices, (ii) market prices for comparable properties, or (iii) the present value of undiscounted cash flows, including estimated sales value (which is based on key assumptions such as estimated market rents, lease-up periods, estimated lease terms, and capitalization and discount rates) less estimated selling costs.
FRANKLIN BSP REALTY TRUST, INC.
NOTES TO CONSOLIDATED FINANCIAL STATEMENTS
December 31, 2023
Real estate owned, assets that are probable to be sold within one year are reported as held for sale. sale - Real estate owned assetsis classified as held for sale in the period in which the six criteria under ASC Topic 360, "Property, Plant, and Equipment" are measuredmet: (i) we commit to a plan and have the authority to sell the asset; (ii) the asset is available for sale in its current condition; (iii) we have initiated an active marketing plan to locate a buyer for the asset; (iv) the sale of the asset is both probable and expected to qualify for full sales recognition within a period of 12 months; (v) the asset is being actively marketed for sale at a price that is reflective of its current fair value; and (vi) we do not anticipate changes to our plan to sell the asset. Held for sale assets are carried at the lower of its carrying amountdepreciated cost or estimated fair value, less costestimated costs to sell.
Real estate owned assets are not depreciated or amortized while they are classified as held for sale. Interest and other expenses attributable to the liabilities of a disposal group classified as held for sale continue to be accrued. Upon the disposition of a real estate owned asset, the Company calculates realized gains and losses as net proceeds received less the carrying value of the real estate owned asset. Net proceeds received are net of direct selling costs associated with the disposition of the real estate owned asset.
FRANKLIN BSP REALTY TRUST, INC.
NOTES TO CONSOLIDATED FINANCIAL STATEMENTS
December 31, 2021
Fair Value of Assets and Liabilities of Acquired Properties
Upon the acquisition of real properties, the Company records the fair value of properties (plus any related acquisition costs) allocated based on relative fair value as tangible assets, consisting of land and building, and identified intangible assets and liabilities, consisting of the value of above-market and below-market leases and the value of in-place leases, based on their estimated fair values. Substantially all of the Company’s property acquisitions qualify as asset acquisitions under Accounting Standards Codification ("ASC")ASC 805, Business Combinations.
The estimated fair values of the tangible assets of an acquired property are determined by valuing the property as if it were vacant, and the “as-if-vacant” value is then allocated to land and building based on management’s determination of the estimated fair value of these assets. Management relies on a sales comparison approach using closed land sales and listings in determining the land value, and determines the as-if-vacant estimated fair value of a property using methods similar to those used by independent appraisers. Factors considered by management in performing these analyses include an estimate of carrying costs during the expected lease-up periods considering current market conditions and costs to execute similar leases. In estimating carrying costs, management includes real estate taxes, insurance, and other operating expenses and estimates of lost rental revenue during the expected lease-up periods based on current market demand. Management also estimates the cost to execute similar leases including leasing commissions, legal, and other related costs.
The estimated fair values of above-market and below-market in-place leases are recorded based on the present value (using an interest rate which reflects the risks associated with the leases acquired) of the difference between (i) the contractual amounts to be paid pursuant to the in-place leases and (ii) management’s estimate of market rates for the corresponding in-place leases, measured over a period equal to the remaining terms of the leases, taking into consideration the probability of renewals for any below-market leases. The capitalized above-market and below-market lease values are recorded as intangible lease assets or liabilities and amortized as an adjustment to rental revenues over the remaining terms of the respective leases.
The estimated fair values of in-place leases include an estimate of the direct costs associated with obtaining the acquired or "in place" tenant and estimates of opportunity costs associated with lost rentals that are avoided by acquiring an in-place lease. The amount capitalized as direct costs associated with obtaining a tenant include commissions, tenant improvements, and other direct costs and are estimated based on management’s consideration of current market costs to execute a similar lease. These direct lease origination costs are included in deferred lease costs in the accompanying consolidated balance sheets and are amortized to expense over the remaining terms of the respective leases. The value of opportunity costs is calculated using the contractual amounts to be paid pursuant to the in-place leases over a market absorption period for a similar lease. These lease intangibles are included in intangible lease assets in the accompanying consolidated balance sheets and are amortized to expense over the remaining terms of the respective leases.
Credit Losses
In June 2016, the FASB issued Accounting Standards Update ("ASU") No. 2016-13, Financial Instruments-Credit Losses, which amends the credit impairment model for financial instruments. The Company adopted ASU 2016-13 on January 1, 2020.
The allowance for credit losses required under ASU 2016-13 is deducted from the respective loans’loan's amortized cost basis on the Company’s consolidated balance sheets. The allowance for credit losses attributed to unfunded loan commitments is included in Accounts payable and accrued expenses on the consolidated balance sheets. As reflected in the consolidated statements
The following discussion highlights changes to the Company’s accounting policies as a result of this adoption.FRANKLIN BSP REALTY TRUST, INC.
AllowanceNOTES TO CONSOLIDATED FINANCIAL STATEMENTS
December 31, 2023
General allowance for credit losses
The general allowance for credit losses for the Company’s financial instruments carried at amortized cost and off-balance sheet credit exposures, such as loans held for investment and unfunded loan commitments represents a lifetime estimate of expected credit losses. Factors considered by the Company when determining the allowancegeneral provision for credit losses reserve include loan-specific characteristics such as loan-to-value (“LTV”) ratio, vintage year, loan term, property type, occupancy and geographic location, financial performance of the borrower, expected payments of principal and interest, as well as internal or external information relating to past events, current conditions and forward looking information through the use of projected macroeconomic scenarios over the reasonable and supportable forecasts.
The general allowance for credit losses is measured on a collective (pool) basis when similar risk characteristics exist for multiple financial instruments. If similar risk characteristics do not exist, the Company measures the general allowance for credit losses on an individual instrument basis. The determination of whether a particular financial instrument should be included in a pool can change over time. If a financial asset’s risk characteristics change, the Company evaluates whether it is appropriate to continue to keep the financial instrument in its existing pool or evaluate it individually.
FRANKLIN BSP REALTY TRUST, INC.
NOTES TO CONSOLIDATED FINANCIAL STATEMENTS
December 31, 2021
In measuring the general allowance for credit losses for financial instruments including oursuch as loans held for investment and unfunded loan commitments that share similar risk characteristics, the Company primarily applies a probability of default (“PD”)/loss given default (“LGD”) model for instruments that are collectively assessed, whereby the allowanceprovision for credit losses is calculated as the product of PD, LGD and exposure at default (“EAD”). The Company’s model to determine the general allowance for credit losses principally utilizes historical loss rates derived from a commercial mortgage backed securities database with historical losses from 19982002 to 20202021 provided by a reputable third party, forecasting the loss parameters based on a projected macroeconomic scenario using a scenario-basedprobability-based statistical approach over a reasonable and supportable forecast period of twelve months, followed by an immediate reversion to average historical losses. The modeled results are then evaluated to determine if adjustments are needed
Specific allowance for certain qualitative factors. For financial instruments assessed on an individual basis, including when it is probable that the Company will be unable to collect the full payment of principal and interest on the instrument, the Company applies a discounted cash flow (“DCF”) methodology.credit losses
For financial instruments where the borrower is experiencing financial difficulty based on the Company’s assessment at the reporting date and the repayment is expected to be provided substantially through the operation or sale of the collateral, the Company may elect to use as a practical expedient the fair value of the collateral at the reporting date when determining the allowanceprovision for credit losses.
For loans held for investment which the Company identifies reasonable doubt as to whether the collection of contractual components can be satisfied, a loan specific allowance for credit losses analysis is performed. Determining whether a specific allowance for credit losses for a loan is required entails significant judgment from management and is based on several factors including (i) the underlying collateral performance, (ii) discussions with the borrower, (iii) borrower events of default, and (iv) other facts that impact the borrower’s ability to pay the contractual amounts due under the terms of the loan. If a loan is determined to have a specific allowance for credit losses, the specific allowance for credit losses is recorded as a component of our Current Expected Credit Loss ("CECL") reserve by applying the practical expedient for collateral dependent loans. The CECL reserve is assessed on an individual basis for such loans by comparing the estimated fair value of the underlying collateral, less costs to sell, to the book value of the respective loan. The estimated fair value of the underlying collateral requires judgments, which include assumptions regarding capitalization rates, discount rates, leasing, creditworthiness of major tenants, occupancy rates, availability and cost of financing, exit plans, loan sponsorship, actions of other lenders, and other factors deemed relevant by the Company. Actual losses, if any, could ultimately differ materially from these estimates. The Company only expects to write-off specific provisions if and when such amounts are deemed non-recoverable. Non-recoverability is generally determined at the time a loan is settled, or in the case of foreclosure, when the underlying asset is sold. Non-recoverability may also be concluded if, in the Company's determination, it is deemed certain that all amounts due will not be collected. If a loan is determined to be impaired based on the above considerations, management records a write-off through a charge to the allowance for credit losses and the respective loan balance.
Risk Rating
In developing the allowanceprovision for credit losses for its loans held for investment, the Company performs a comprehensive analysis of its loan portfolio and assigns risk ratings to loans that incorporate management's current judgments about their credit quality based on all known and relevant internal and external factors that may affect collectability, using similar factors as those in developing the allowanceprovision for credit losses. This methodology results in loans being segmented by risk classification into risk rating categories that are associated with estimated probabilities of default and principal loss. Risk rating categories range from "1" to "5" with "1" representing the lowest risk of loss and "5" representing the highest risk of loss with the ratings updated quarterly. At the time of origination or purchase, loans held for investment are ranked as a “2” and will move accordingly going forward based on the ratings which are defined as follows:
FRANKLIN BSP REALTY TRUST, INC.
NOTES TO CONSOLIDATED FINANCIAL STATEMENTS
December 31, 2023
1.Very Low Risk- Investment exceeding fundamental performance expectations and/or capital gain expected. Trends and risk factors since time of investment are favorable.
2.Low Risk- Performing consistent with expectations and a full return of principal and interest expected. Trends and risk factors are neutral to favorable.
3.Average Risk- Performing investments requiring closer monitoring. Trends and risk factors show some deterioration.
4.High Risk/Delinquent/Defaulted/Potential for Loss- Underperforming investment with the potential of some interest loss but still expecting a positive return on investment. Trends and risk factors are negative.
5.Impaired/Defaulted/Loss Likely- Underperforming investment with expected loss of interest and some principal.
The Company also considers qualitative and environmental factors, including, but not limited to, economic and business conditions, nature and volume of the loan portfolio, lending terms, volume and severity of past due loans, concentration of credit and changes in the level of such concentrations in its determination of the allowanceprovision for credit losses.
Changes in the allowanceprovision for credit losses for the Company’s financial instruments are recorded in Provision/(benefit)(Provision)/benefit for credit losses on in the consolidated statements of operations with a corresponding offset to the financial instrument’s amortized cost recorded onin the consolidated balance sheets, or as a component of Accounts payable and accrued expenses for unfunded loan commitments.
The Company has elected to not measure an allowancea provision for credit losses for accrued interest receivable as it isbalances are written off in a timely following three months time, reversed against interest incomemanner when a loan,loans, real estate securitysecurities or preferred equity investment isinvestments are designated as non-performing and placed on nonaccrual status. non-accrual or cost recovery status within 90 days of becoming past due.
Non-performing status
The Company did not record reversals of accrued interest receivable during the year ended December 31, 2020. Loans are charged off against the Provision/(benefit) for credit lossesdesignates loans as non-performing when all or a portion of the principal amount is determined to be uncollectible.
Past due and nonaccrual status
Loans are placed on nonaccrual status and considered non-performing when(i) full payment of principal and coupon interest components become 90-days past due ("non-accrual status"); or (ii) the Company has reasonable doubt as to whether the collection of contractual components can be satisfied ("cost recovery status"). When a loan is designated as non-performing and placed on non-accrual status, interest is unpaid for 90 days or more or where reasonable doubt existsonly recognized as to timelyincome when payment has been received. Loans designated as non-performing and placed on non-accrual status are removed from their non-performing designation when collection unless theof principal and coupon interest components have been satisfied. When a loan is both well secureddesignated as non-performing and in the process of collection. Interest receivedplaced on nonaccrualcost recovery status, loans are accounted for under the cost-recovery method until qualifying for returnis applied to accrual. Upon restructuring the nonaccrual loan, the Company may return a loan to accrual status when repaymentwhich receipt of principal andor coupon interest is reasonably assured.
FRANKLIN BSP REALTY TRUST, INC.
NOTES TO CONSOLIDATED FINANCIAL STATEMENTS
December 31, 2021
Troubled Debt Restructuring (“TDR”)
The Company classifies an individual financial instrumentrecorded as a TDR when it has a reasonable expectation that the financial instrument’s contractual terms will be modified in a manner that grants concessionreduction to the borrower who is experiencing financial difficulty. Concessions could include term extensions, payment deferrals, interest rate reductions, principal forgiveness, forbearance, or other actions designed to maximize the Company’samortized cost until collection on the financial instrument. The Company determines the allowance for credit losses for financial instruments thatof all contractual components are TDRs individually.reasonably assured.
Real Estate Securities
Available For Sale
On the acquisition date, all of theThe Company’s commercial real estate securities wereare classified as available for sale ("AFS") and carried at fair value, and subsequently any unrealized gains or losses are recognized as a component of accumulated other comprehensive income or loss. The Company may elect thevalue. Changes in fair value optionof available for itssale real estate securities and as a result, any unrealized gains or losses on such real estate securities will be recordedare recognized in the Company’s consolidated statements of operations. No such election has been made to date.comprehensive income. Related discounts, premiums and acquisition expenses on investments are amortized or accreted over the life of the investment using the effective interest method. Amortization and accretion isare reflected as an adjustment to interest income in the Company’s consolidated statements of operations. The Company uses the specific identification method in determining the cost relief for real estate securities sold. Realized gains and losses from the sale of real estateavailable for sale securities are included in the Company’s consolidated statements of operations.
AFS real estate securities which have experienced a decline in the fair value below their amortized cost basis (i.e., impairment) are evaluated each reporting period to determine whether the decline in fair value is due to credit-related factors. Any impairment that is not credit-related is recognized in accumulated other comprehensive income, while credit-related impairment is recognized as an allowance onin the consolidated balance sheets with a corresponding adjustment onin the consolidated statements of operations. If the Company intends to sell an impaired real estate security or more likely than not will be required to sell such a security before recovering its amortized cost basis, the entire impairment amount is recognized in the consolidated statements of operations with a corresponding adjustment to the security’s amortized cost basis.
The Company analyzes the AFS real estate securities portfolio on a periodic basis for credit losses at the individual security level using the same criteria described above for those amortized cost financial assets subject to an allowanceprovision for credit losses including but not limited to; performance of the underlying assets in the security, borrower financial resources and investment in collateral, collateral type, credit ratings, project economics and geographic location as well as national and regional economic factors.
FRANKLIN BSP REALTY TRUST, INC.
NOTES TO CONSOLIDATED FINANCIAL STATEMENTS
December 31, 2023
The non-credit loss component of the unrealized loss within the Company’s AFS portfolio is recognized as an adjustment to the individual security’s asset balance with an offsetting entry to accumulatedAccumulated other comprehensive incomeincome/(loss) in the consolidated balance sheets.
Trading
In the merger with Capstead, the Company acquired a portfolio of ARM Agency Securities classified as trading and recorded at fair value on the balance sheet with trading gains and losses on the paydowns and sales of these securities recorded in the Company's consolidated statements of operations. Fair values fluctuate with current and projected changes in interest rates, prepayment expectations and other factors such as market liquidity conditions and the perceived credit quality of agency securities. Judgment is required to interpret market data and develop estimated fair values, particularly in circumstances of deteriorating credit quality and market liquidity.
Repurchase Agreements
Commercial mortgage loans and real estate securities sold under repurchase agreements have been treated as collateralized financing transactions because the Company maintains effective control over the transferred securities. Commercial mortgage loans and real estate securities financed through a repurchase agreementagreements remain onin the Company’s consolidated balance sheets as an asset and cash received from the purchaser is recorded as a liability. Interest paid in accordance with repurchase agreements is recorded in interestInterest expense on in the Company's consolidated statements of operations.
FRANKLIN BSP REALTY TRUST, INC.
NOTES TO CONSOLIDATED FINANCIAL STATEMENTS
December 31, 2021
Deferred Financing Costs
The deferred financing costs related to the Company's various Master Repurchase Agreements as well as certain prepaid subscription costs are included in Prepaid expenses and other assets on in the consolidated balance sheets. Deferred financing cost on the Company's collateralized loan obligations ("CLO")CLO are netted against the Company's CLO payable in the Collateralized loan obligations on in the consolidated balance sheets. Deferred financing costs are amortized over the terms of the respective financing agreement using the effective interest method and included in interestInterest expense on in the Company's consolidated statements of operations. Unamortized deferred financing costs are generally expensedrealized in Realized gain/(loss) on extinguishment of debt in the consolidated statements of operations when the associated debt is refinanced or repaid before maturity.
Share Repurchase Program
Until the merger with Capstead, the Company had a Share Repurchase Program (the "SRP") that enabled stockholders to sell their shares to the Company, subject to certain conditions. Refer to Note 9 - Stock Transactions for a description of the SRP. Under the SRP, when a stockholder requested a redemption and the redemption was approved by the board of directors, the Company reclassified such obligation from equity to a liability based on the settlement value of the obligation. Shares repurchased under the SRP have the status of authorized but unissued shares.
Offering and Related Costs
Since 2018, the Company has from time to time offered, and may in the future offer, shares of the Company’s common stock or one or more series of its preferred stock, including its Series A convertible preferred stock (“Series A Preferred Stock”),former Series C convertible preferred stock (the “Series C Preferred Stock,”) and, former Series D convertible preferred stock ("Series(the “Series D Preferred Stock"Stock”), Series H convertible preferred stock (the “Series H Preferred Stock”) and former Series I convertible preferred stock (the “Series I Preferred Stock”) in private placements exempt from the registration requirements of the Securities Act of 1933, as amended. In connection with these offerings, the Company incursincurred various offering costs. These offering costs include but are not limited to legal, accounting, printing, mailing and filing fees, and diligence expenses of broker-dealers. Offering costs for the common stock are recorded in the Company’s stockholders’ equity, while the offering costs for the Series C Preferred Stock and Series D Preferred Stock are included within Series A Preferred Stock, Series C Preferred Stock and Series D Preferred Stock, respectively, on the Company’s consolidated balance sheets.
Distribution Reinvestment Plan
Pursuant to the terms of the Company's distribution reinvestment plan ("DRIP") in effect until December 17, 2021, stockholders had the option to elect to reinvest distributions by purchasing shares of common stock in lieu of receiving cash. No dealer manager fees or selling commissions were paid with respect to shares purchased pursuant to the DRIP. The purchase price for shares purchased through the DRIP was the lesser of (i) the Company’s most recent estimated per share NAV, and (ii) the Company’s GAAP book value per share. The Company had the right to amend any aspect of the DRIP or terminate the DRIP with ten days’ notice to participants. Shares issued under the DRIP were recorded to equity in the consolidated balance sheetssheets. Offering costs for the Series H Preferred Stock and Series I Preferred Stock were expensed in the period distributions are declared.consolidated statement of operations.
On December 17,Equity Incentive Plan
The Company maintains the Franklin BSP Realty Trust, Inc. 2021 Equity Incentive Plan (the “2021 Incentive Plan”), pursuant to which the Company amendedhas granted and restatedmay in the DRIP (the “Amended DRIP”) in recognitionfuture, from time to time, grant equity awards to the Company’s directors, officers and employees (if it ever has employees), employees of the listingAdvisor and its affiliates, or certain of the Company’s consultants, advisors or other service providers to the Company or an affiliate of the Company. The 2021 Incentive Plan, which is administered by the Compensation Committee of the board of directors, provides for the grant of awards of share options, share appreciation rights, restricted shares, restricted share units, deferred share units, unrestricted shares, dividend equivalent rights, performance shares and other performance-based awards, other equity-based awards, long-term incentive plan units and cash bonus awards.
Since 2022, the Company has been issuing under the 2021 Incentive Plan annual awards of restricted stock units ("RSUs") to its officers and certain other personnel of the Advisor who provide services to the Company. These awards are service-based and vest in equal annual installments beginning on the anniversary of the date of grant over a period of three years, subject to continuing service. One share of the Company’s common stock is issued for each unit that vests. These awards also grant non-forfeitable dividend equivalent rights equal to the cash dividend paid in the ordinary course on a common share to the New York Stock Exchange (“NYSE”Company's common shareholders. Upon termination for any reason, all unvested RSUs will be forfeited by the grantee, who will be given no further rights to such RSUs. The fair value of the RSUs is expensed over the vesting period, which are included in Share-based compensation in the consolidated statements of operations.
Restricted Share Plan
The Company also had an Amended and Restated Employee and Director Incentive Restricted Share Plan (the "RSP")., which provided the Company with the ability to grant awards of restricted shares to the Company’s directors, officers and employees (if the Company ever has employees), employees of the Advisor and its affiliates, employees of entities that provide services to the Company, directors of the Advisor or of entities that provide services to the Company, the Advisor and its affiliates. The RSP expired on February 7, 2023.
FRANKLIN BSP REALTY TRUST, INC.
NOTES TO CONSOLIDATED FINANCIAL STATEMENTS
December 31, 2023
Distribution Reinvestment Plan
The Company maintains a dividend reinvestment plan ("DRIP") pursuant to which stockholders may reinvest dividends into shares of common stock. Shares of common stock purchased through the Amended DRIP for dividend reinvestments will beare supplied either directly by the Company as newly issued shares or via purchases by the Amended DRIP administrator of shares of common stock on the open market, at the Company’s option. If the shares are purchased in the open market, the purchase price will beis the average price per share of shares purchased; if the shares are purchased directly from the Company, the purchase price willis generally be the average of the daily high and low sales prices for a share of common stock reported by the NYSE on the dividend payment date authorized by the Company’s board of directors. The Company may suspend, modify or terminate the Amended DRIP at any time in its sole discretion.
Share-Based Compensation
The Company has share-based incentive plans for certain of the Company's directors, officers and employees of the Advisor and its affiliates. Share-based awards are measured at the grant date fair value and are recognized as compensation expense on a on a straight line basis over the related vesting period of the award. See Note 12 - Share-Based Compensation.
FRANKLIN BSP REALTY TRUST, INC.
NOTES TO CONSOLIDATED FINANCIAL STATEMENTS
December 31, 2021
Income Taxes
The Company has conducted its operations to qualify as a REIT for U.S. federal income tax purposes beginning with its taxable year ended December 31, 2013. As a REIT, if the Company meets certain organizational and operational requirements and distributes at least 90% of its "REIT taxable income" (determined before the deduction of dividends paid and excluding net capital gains) to its stockholders in a year, it will not be subject to U.S. federal income tax to the extent of the income that it distributes. However, even if the Company qualifies for taxation as a REIT, it may be subject to certain state and local taxes on income in addition to U.S. federal income and excise taxes on its undistributed income. The Company, through its TRSs, is indirectly subject to U.S. federal, state and local income taxes. The Company’s TRSs are not consolidated for U.S. federal income tax purposes, but isare instead taxed as a C corporations. For financial reporting purposes, the TRSs are consolidated and a provision for current and deferred taxes is established for the portion of earnings recognized by the Company with respect to its interest in its TRSs.TRS. Total income tax provision/(benefit)(provision)/benefit for the years ended December 31, 2023, 2022, and 2021 December 31, 2020 and December 31, 2019 were $3.6$2.8 million, $(2.1)$0.4 million, and $4.5$(3.6) million, respectively.
The Company uses a more-likely-than-not threshold for recognition and derecognition of tax positions taken or to be taken in a tax return. The Company has assessed its tax positions for all open tax years beginning with December 31, 2017 and concluded that there were no uncertainties to be recognized. The Company’s accounting policy with respect to interest and penalties related to tax uncertainties is to classify these amounts as provision for income taxes.
The Company utilizes the TRSs to reduce the impact of the prohibited transaction tax and to avoid penalty for the holding of assets not qualifying as real estate assets for purposes of the REIT asset tests. Any income associated with a TRS is fully taxable because the TRS is subject to federal and state income taxes as a domestic C corporation based upon its net income.
Derivatives and Hedging Activities
In the normal course of business, the Company is exposed to the effect of interest rate changes and may undertake a strategy to limit these risks through the use of derivatives. The Company uses derivatives primarily to economically hedge against interest rates, CMBS spreads and macro market risk in order to minimize volatility. The Company may use a variety of derivative instruments that are considered conventional, including but not limited to: Treasury note futures and credit derivatives on various indices including CMBX and CDX.
The Company recognizes all derivatives on the consolidated balance sheets at fair value. With the exception of the Company’s unsecured debt-related interest rate swap agreements, theThe Company does not designate its derivatives as hedges to qualify for hedge accounting for financial reporting purposes and therefore any net payments under, or fluctuations in the fair value of these derivatives have been recognized currently in unrealizedUnrealized (gain)/loss on derivative instruments in the accompanying consolidated statements of operations. For the derivatives that are designated as an accounting hedge, the Company must document at inception that the hedge relationship is highly effective and must continue to monitor ongoing effectiveness on at least a quarterly basis. As long as the hedge relationship remains highly effective, changes in fair value are recorded in accumulated other comprehensive income. The Company records derivative asset and liability positions on a gross basis with any collateral posted with or received from counterparties recorded separately within Restricted cash and cash collateral receivable from derivative counterparties on in the Company’s consolidated balance sheets. The Company's interest rate swaps hedging repurchase agreements acquired in the merger with Capstead are recorded net of variation margin and accrued interest per the legal definition of these cleared swaps as settling on a daily basis. Certain derivatives that the Company has entered into are subject to master netting agreements with its counterparties, allowing for netting of the same transaction, in the same currency, on the same date.
Per Share Data
The Company’sSeries A Preferred Stock, Series CH Preferred Stock and Series DI Preferred Stock are each considered a participating security and the Company calculates basic earnings per share using the two-class method. The Company’s dilutive earnings per share calculation is computed using the more dilutive result of the treasury stock method, assuming the participating security is a potential common share, or the two-class method, assuming the participating security is not converted. The Company calculates basic earnings per share by dividing net income applicable to common stock for the period by the weighted-average number of shares of common stock outstanding for that period. Diluted earnings per share reflects the potential dilution that could occur from shares outstanding if potential shares of common stock with a dilutive effect have been issued in connection with the restricted stock plan or upon conversion of the outstanding shares of the Company’s Series A Preferred Stock, Series CH Preferred Stock and Series DI Preferred Stock, except when doing so would be anti-dilutive.
FRANKLIN BSP REALTY TRUST, INC.
NOTES TO CONSOLIDATED FINANCIAL STATEMENTS
December 31, 20212023
Reportable Segments
The Company has determined that it has 4four reportable segments based on how the chief operating decision maker reviews and manages the business. The 4four reporting segments are as follows:
•The real estate debt business which is focusedfocuses on originating, acquiring and asset managing commercial real estate debt investments, including first mortgage loans,mortgages, subordinate mortgages, mezzanine loans and participations in such loans.
•The real estate securities business focuses on investing in and asset managing real estate securities. Historically this business has focused primarily on CMBS, unsecured REIT debt,CRE CLO bonds, CDO notes, and other securities. As a result of the October 2021 acquisition of Capstead, the Company acquired and continues to hold a significant portfolio of Residential Mortgage Backed Securities (“RMBS”) in the form of the ARM Agency Securities. The Company intends to reinvestportfolio was completely divested by the cash and proceeds from dividends, interest, repayments and salesthird quarter of these assets into its other segments and does not intend to continue to invest in ARM Agency Securities or RMBS in general. As of December 31, 2021, all of the real estate securities in this segment were ARM Agency Securities acquired in the Capstead acquisition.2023.
•The commercial real estate conduit business inoperated through the Company's TRS, which is focused on generating risk-adjusted returns by originating and subsequently selling fixed-rate commercial real estate loans into the CMBS securitization market.market at a profit. The TRS may also hold certain mezzanine loans that don't qualify as good REIT assets due to any potential loss from foreclosure.
•The real estate owned business represents real estate acquired by the Company through foreclosure, deed in lieu of foreclosure, or purchase.
See Note 16 - Segment Reporting for further information regarding the Company's segments.
Redeemable Convertible Preferred Stock
The Company’s outstanding classes of redeemable convertible preferred stock are classified outside of permanent equity in the consolidated balance sheets.
Series AH Preferred Stock
The Series A Preferred Stock ranked senior to the Common Stock and the Company’s Series F Convertible Preferred Stock (“Series F Preferred Stock”), and on parity with all other outstanding classes of preferred stock of the Company (including the Series C and Series D Preferred Stock) with respect to priority in dividends and in the distribution of assets in the event of the liquidation, dissolution or winding-up of the Company. The liquidation preference of each share of Series A Preferred Stock was the greater of (i) $5,000 plus accrued and unpaid dividends, and (ii) the amount that would be received upon a conversion of the Series A Preferred Stock into Common Stock.
Dividends on the Series A Preferred Stock, which were typically declared and paid quarterly, accrued at a rate equal to the greater of (i) an annual amount equal to 4.0% of the liquidation preference per share (subject to a 1.0% increase in the event of the ratings for the Series A Preferred Stock decreases below a certain threshold) and (ii) the dividends that would have been paid had such share of Series A Preferred Stock been converted into a share of Common Stock on the first day of such quarter, subject to proration in the event the share of Series A Preferred Stock is not outstanding for the full quarter. Dividends are paid in arrears.
On October 19, 2021, each share of Series A Preferred Stock converted into 299.2 shares of common stock, pursuant to the terms of the Articles Supplementary for the Series A Preferred Stock, and no shares of Series A Preferred Stock were outstanding as of December 31, 2021.
Series C Preferred Stock
The Series CH Preferred Stock ranks senior to the Common Stock and Series F Preferred Stock and on parity with the Series D Preferred Stock and the Company’s 7.50% Series E Cumulative Redeemable Preferred Stock (“("Series E Preferred Stock”Stock") with respect to priority in dividends and in the distribution of assets in the event of the liquidation, dissolution or winding-up of the Company. The liquidation preference of each share of Series CH Preferred Stock is the greater of (i) $5,000 plus accrued and unpaid dividends, and (ii) the amount that would be received upon a conversion of the Series CH Preferred Stock into the Common Stock.
Dividends on the Series CH Preferred Stock, which are typically declared and paid quarterly, accrue at a rate equal to the greater of (i) an annual amount equal to 4.0% of the liquidation preference per share and (ii) the dividends that would have been paid had such share of Series CH Preferred Stock been converted into a share of common stock on the first day of such quarter, subject to proration in the event the share of Series CH preferred stock is not outstanding for the full quarter. Dividends are paid in arrears. Dividends will accumulate and be cumulative from the most recent date to which dividends had been paid.
FRANKLIN BSP REALTY TRUST, INC.
NOTES TO CONSOLIDATED FINANCIAL STATEMENTS
December 31, 2021
Each outstanding share ofOn January 10, 2024, the Series CH Preferred Stock was amended such that the mandatory conversion date was extended by one year, to January 21, 2025. Unless earlier converted, the Series H Preferred Stock will automatically convert into common stock at a rate of 299.2 shares of common stock subjectper share of Series H Preferred Stock (subject to anti-dilution adjustments as described in the Articles Supplementary for the Series CH Preferred Stock) on January 21, 2025. The holder of the Series H Preferred Stock on October 19, 2022 or, uponhas the electionright to convert up to 4,487 shares of the CompanySeries H Preferred Stock one time in each calendar month through December 2024, upon 10 business days’ advance notice to the holders, on or after April 19, 2022.
In the event of the sale of all or substantially all of the business or assets of the Company (by sale, merger, consolidation or otherwise) or the acquisition by any person of more than 50% of the total economic interests or voting power of all securities of the Company (a “ Change of Control”), in each case prior to the automatic conversion dates set forth above, each holder of Series C Preferred Stock will have the right, prior to consummation of such transaction, to convert its Series C Preferred Stock into common stock at the Conversion Rate. In addition, in the event of a change of control (as defined in the Articles Supplementary of the Series C Preferred Stock) of the Advisor or a Change of Control that is not a "Liquidity Event" and that is related to the removal of the Advisor, both the Company and the holder shall have the right, prior to consummation of the transaction, to require the redemption of the Series C Preferred Stock for the liquidation preference. A "Liquidity Event" is defined as (i) the listing of the Common Stock on a national securities exchange or quotation on an electronic inter-dealer quotation system; (ii) a merger or business combination involving the Company pursuant to which outstanding shares of Common Stock are exchanged for securities of another company which are listed on a national securities exchange or quoted on an electronic inter-dealer quotation system; or (iii) any other transaction or series of transaction that results in all shares of Common Stock being transferred or exchanged for cash or securities which are listed on a national securities exchange or quoted on an electronic inter-dealer quotation system.Company.
Holders of the Series CH Preferred Stock (voting as a single class with holders of common stock) are entitled to vote on each matter submitted to a vote of the stockholders of the Company upon which the holders of common stock are entitled to vote. The number of votes applicable to a share of outstanding Series CH Preferred Stock will be equal to the number of shares of common stock a share of Series CH Preferred Stock could have been converted into as of the record date set for purposes of such stockholder vote (rounded down to the nearest whole number of shares of common stock). In addition, the affirmative vote of the holders of two-thirds of the outstanding shares of Series CH Preferred Stock, voting as a single class with other shares of parity preferred stock, is required to approve the issuance of any equity securities senior to the Series CH Preferred Stock and to take certain actions materially adverse to the holders of the Series CH Preferred Stock.
The Series D Preferred Stock is on parity with the Series C Preferred Stock and Series E Preferred Stock with respect to preference on liquidation and dividend rights. The terms of the Series D Preferred Stock are substantially the same as the terms of the Series C Preferred Stock, except that the holders of the Series D Preferred Stock have the option to accelerate the mandatory conversion date, which is October 19, 2022, to a date no earlier than April 19, 2022.
Convertible Preferred Stock
Series F Preferred Stock
On October 12, 2021, as contemplated by the Merger Agreement with Capstead, the Company completed its previously-announced stock dividend on the outstanding shares of Common Stock, which stock dividend was paid at a rate of 9 shares of the Company’s newly issued Series F Convertible Preferred Stock (“Series F Preferred Stock”) for each share of Common Stock issued and outstanding.
The Series F Preferred Stock ranks junior to all other outstanding classes of the Company’s preferred stock with respect to priority in dividends and in the distribution of assets in the event of the liquidation, dissolution or winding-up of the Company. The liquidation preference of each share of Series F Preferred Stock is $2.00.
Dividends on the Series F Preferred Stock are equal to, and will be paid at the same time as, dividends that are authorized and declared on the Company’s common stock. The Series F Preferred Stock ranks senior to the Company’s Common Stock with respect to the distribution of assets upon any liquidation, dissolution or winding up of the Company (other than a liquidation, dissolution or winding up of the Company that results in the automatic conversion of such Series F Preferred Stock into Common Stock).
FRANKLIN BSP REALTY TRUST, INC.
NOTES TO CONSOLIDATED FINANCIAL STATEMENTS
December 31, 20212023
Each share (or fractional share)Series I Preferred Stock
On January 19, 2023, all of the 1,000 outstanding shares of the Series FI Preferred Stock shall automatically convertconverted by their terms into 1 share299.2 shares of Common Stock (or equivalent fractional share, as applicable) upon the earlier of (i) April 19, 2022, (ii) three business days prior to a liquidation, dissolution or winding up of the Company in the event that the Company’s board of directors determines (which determination will be conclusive) that the liquidating distributioncommon stock per share in respect of such converted share of Series FI Preferred Stock (or fractional share) would be in an amount in excess of the liquidation preference of $2.00 per share or (iii) immediately prior to the effective time of a qualifying change of control, provided that the consideration per share payable in connection with such change in control in respect of such converted share of Stock.
Perpetual Preferred Stock—Series FE Preferred Stock (or fractional share) is an amount in excess of the liquidation preference of $2.00.
The Series FE Preferred Stock has no stated maturity and is not redeemable.subject to any sinking fund or mandatory redemption. The Series E Preferred Stock ranks, with respect to rights to the payment of dividends and the distribution of assets upon its liquidation, dissolution or winding up, senior to the common stock and on a parity with the Series H Preferred Stock. The liquidation preference is $25.00 per share, plus an amount equal to any accumulated and unpaid dividends.
Holders of Series F Preferred Stock (voting as a single class with holders of Common Stock and other series of Company equity securities entitled to vote with the common stockholders) are entitled to vote on each matter submitted to a voteshares of the stockholders of the Company upon which the holders of CommonSeries E Preferred Stock are entitled to vote. The numberreceive, when, as and if authorized by our board of votes applicable to a sharedirectors and declared by the Company, out of outstanding Series F Preferred Stock will be equal tofunds legally available for the numberpayment of sharesdividends, cumulative cash dividends at the rate of Common Stock a share of Series F Preferred Stock could have been converted into as7.50% of the record date set for purposes of such stockholder vote (rounded down$25.00 per share liquidation preference per annum (equivalent to the nearest whole number of shares of Common Stock)$1.875 per annum per share). In addition,Dividends on the affirmative vote of the holders of two-thirds of the outstanding shares of Series F Preferred Stock is required to take certain actions materially adverse to the holders of the Series F Preferred Stock.
The complete terms of the Series A Preferred Stock, Series C Preferred Stock, Series D Preferred Stock, Series E Preferred Stock are cumulative and payable quarterly in arrears.
Dividends on the Series FE Preferred Stock will accumulate whether or not the Company has earnings, whether or not there are funds legally available for the payment of those dividends and whether or not those dividends are declared.
The Company may, at its option, upon not less than 30 nor more than 60 days’ written notice, redeem the Series E Preferred Stock, in whole or in part, at any time or from time to time, for cash at a redemption price of $25.00 per share, plus any accumulated and unpaid dividends thereon to, but not including, the date fixed for redemption. Upon a change of control of the Company, in the event the Company does not redeem the Series E Preferred Stock, a holder of Series E Preferred Stock will have the right to convert to Common Stock upon the terms set forth in the applicable Articles Supplementary applicableSupplementary.
The Series E Preferred Stock is listed on the New York Stock Exchange under the symbol “FBRT PRE”.
Recently Issued Accounting Pronouncements
In March 2022, the FASB issued ASU 2022-02 "Financial Instruments-Credit Losses (Topic 326): Troubled Debt Restructurings and Vintage Disclosures," or ASU 2022-02. ASU 2022-02 eliminates the accounting guidance for troubled debt restructurings ("TDR") and requires disclosure of current-period gross write-offs by year of loan origination. Additionally, ASU 2022-02 updates the accounting for credit losses under ASC 326 and adds enhanced disclosures with respect to each class, which have been filed as exhibitsloan refinancing and restructuring in the form of principal forgiveness, interest rate concessions, other-than-insignificant payment delays, or term extensions when the borrower is experiencing financial difficulties. On January 1, 2023, the Company adopted ASU 2022-02 on a prospective basis and the adoption had no significant or material impact to the Company’s periodic reports filed pursuant to the Securities Exchange Act of 1934, as amended.Company's consolidated financial statements.
The below table summarizes the timing of the conversion of the Company’s outstanding classes of convertible preferred stock into common stock:
| | | | | | | | |
Series/Shares Outstanding at 12/31/21 | Conversion Date | Conversion Amount Per One Share of Preferred* |
Redeemable Convertible Series C Preferred Stock / 1,400 shares outstanding | October 19, 2022, subject to the Company’s right to accelerate the conversion to April 19, 2022 | 299.2 shares of Common Stock |
Redeemable Convertible Series D Preferred Stock / 17,950 shares outstanding | October 19, 2022, subject to the holder’s right to accelerate the conversion to April 19, 2022 | 299.2 shares of Common Stock |
Series F Preferred Stock/ 39,733,299 shares outstanding | April 19, 2022 | 1 share of Common Stock |
*Subject to anti-dilution adjustments as set forth in Articles Supplementary.
Accounting Pronouncements Not Yet Adopted
OnIn March 12, 2020, the FASB issued ASU No. 2020-04, Reference Rate Reform (Topic 848): Facilitation of the Effects of Reference Rate Reform on Financial Reporting, which provides temporary optional expedients and exceptions to the US GAAP guidance on contract modifications and hedge accounting to ease the financial reporting burdens of the expected market transition from LIBORthe London interbank offered rate (“LIBOR”) and other interbank offered rates to alternative reference rates. The guidance is effective upon issuance and generally can be appliedelected over time through December 31, 2022. The Company has not adopted any2024, as extended under ASU No. 2022-06, Reference Rate Reform (Topic 848): Deferral of the optional expedients or exceptions throughSunset Date of Topic 848. During the third quarter of 2023, the Company adopted ASU 2020-04. The adoption of ASU 2020-04 did not have a material impact on the Company's consolidated financial statements as of December 31, 2021, but will continue2023.
In November 2023, the FASB issued ASU 2023-07 “Segment Reporting (Topic 280): Improvements to evaluateReportable Segment Disclosures,” or ASU 2023-07. ASU 2023-07 enhances the possibledisclosures required for reportable segments on an annual and interim basis. ASU 2023-07 is effective on a retrospective basis for annual periods beginning after December 15, 2023, for interim periods within fiscal years beginning after December 15, 2024, and early adoption is permitted. We do not expect the adoption of any such expedientsASU 2023-07 to have a material impact on our consolidated financial statements.
In December 2023, the FASB issued Accounting Standards Update, or exceptions duringASU, 2023-09 “Income Taxes (Topic 740): Improvements to Income Tax Disclosures,” or ASU 2023-09. ASU 2023-09 requires additional disaggregated disclosures on the entity’s effective period as circumstances evolve.tax rate reconciliation and additional details on income taxes paid. ASU 2023-09 is effective on a prospective basis, with the option for retrospective application, for annual periods beginning after December 15, 2024 and early adoption is permitted. We do not expect the adoption of ASU 2023-09 to have a material impact on our consolidated financial statements.
FRANKLIN BSP REALTY TRUST, INC.
NOTES TO CONSOLIDATED FINANCIAL STATEMENTS
December 31, 20212023
Note 3 - Commercial Mortgage Loans
The following table is a summary of the Company's commercial mortgage loans, held for investment, carrying values by class (dollars in thousands): | | December 31, 2021 | | December 31, 2020 |
| December 31, 2023 | | | December 31, 2023 | | December 31, 2022 |
| Senior loans | Senior loans | $ | 4,204,464 | | | $ | 2,698,823 | |
| Mezzanine loans | Mezzanine loans | 22,424 | | | 15,911 | |
| Total gross carrying value of loans | Total gross carrying value of loans | 4,226,888 | | | 2,714,734 | |
Less: Allowance for credit losses (1) | 15,827 | | | 20,886 | |
| General allowance for credit losses | |
Specific allowance for credit losses (1) | |
| Less: Allowance for credit losses | |
| Total commercial mortgage loans, held for investment, net | Total commercial mortgage loans, held for investment, net | $ | 4,211,061 | | | $ | 2,693,848 | |
(1)As of December 31, 20212022, the Company recorded a specific reserve with respect to a retail loan designated as non-performing.
For the years ended December 31, 2023 and 2020, there have been no specific reserves2022, the activity in the Company's commercial mortgage loans, held for loansinvestment carrying values, was as follows (dollars in non-performing status.thousands):
| | | | | | | | | | | |
| For the Years Ended |
| December 31, 2023 | | December 31, 2022 |
| Amortized cost, beginning of period | $ | 5,269,776 | | | $ | 4,226,888 | |
| Acquisitions and originations | 941,513 | | | 2,247,613 | |
| Principal repayments | (1,076,532) | | | (1,109,769) | |
| Net fees capitalized into carrying value of loans | (5,242) | | | (13,775) | |
| Discount accretion/premium amortization | 13,016 | | | 12,614 | |
| Loans transferred from/(to) commercial real estate loans, held for sale | — | | | (9,296) | |
| Transfer to real estate owned | (103,863) | | | (80,460) | |
| Cost recovery | (1,726) | | | (4,039) | |
| Amortized cost, end of period | 5,036,942 | | | 5,269,776 | |
| Allowance for credit losses, beginning of period | (40,848) | | | (15,827) | |
| General (provision)/benefit for credit losses | (20,551) | | | (10,797) | |
| Specific (provision)/benefit for credit losses | (12,334) | | | (25,281) | |
| Write offs from specific allowance for credit losses | 26,558 | | | 11,057 | |
| Allowance for credit losses, end of period | (47,175) | | | (40,848) | |
| Total commercial mortgage loans, held for investment, net | $ | 4,989,767 | | | $ | 5,228,928 | |
As of December 31, 20212023 and December 31, 2020,2022, the Company's total commercial mortgage loan, portfolio, excluding commercial mortgage loans accountedheld for under the fair value option,investment portfolio, was comprised of 165144 and 130161 loans, respectively.
Allowance for Credit LossesThe following table presents the activity in the Company's allowance for credit losses, excluding the unfunded loan commitments, as of December 31, 2021 and 2020 (dollars in thousands):
| | | | | | | | | | | | | | | | | | | | | | | | | | | | | | | | | | | | | | | | | | | | | | | | | | | | | | | | |
| | Year Ended December 31, 2021 |
| | MultiFamily | | Retail | | Office | | Industrial | | Mixed Use | | Hospitality | | Self Storage | | Manufactured Housing | | Total |
| Beginning Balance | | $ | 3,095 | | | $ | 404 | | | $ | 1,575 | | | $ | 3,795 | | | $ | 132 | | | $ | 11,646 | | | $ | 117 | | | $ | 122 | | | $ | 20,886 | |
| | | | | | | | | | | | | | | | | | |
| Current Period: | | | | | | | | | | | | | | | | | | |
| Provision/(benefit) for credit losses | | 6,875 | | | (116) | | | (799) | | | (3,709) | | | 37 | | | (7,049) | | | 35 | | | (44) | | | (4,770) | |
| Write offs | | (289) | | | — | | | — | | | — | | | — | | | — | | | — | | | — | | | (289) | |
| | | | | | | | | | | | | | | | | | |
| Ending Balance | | $ | 9,681 | | | $ | 288 | | | $ | 776 | | | $ | 86 | | | $ | 169 | | | $ | 4,597 | | | $ | 152 | | | $ | 78 | | | $ | 15,827 | |
| | | | | | | | | | | | | | | | | | | | | | | | | | | | | | | | | | | | | | | | | | | | | | | | | | | | | | | | |
| | Year Ended December 31, 2020 |
| | MultiFamily | | Retail | | Office | | Industrial | | Mixed Use | | Hospitality | | Self Storage | | Manufactured Housing | | Total |
| Beginning Balance | | $ | 322 | | | $ | 202 | | | $ | 249 | | | $ | 23 | | | $ | 4 | | | $ | 103 | | | $ | — | | | $ | 18 | | | $ | 921 | |
| Cumulative-effect adjustment upon adoption of ASU 2016-13 | | 3,220 | | | 386 | | | 1,966 | | | 434 | | | 9 | | | 739 | | | 399 | | | 58 | | | 7,211 | |
| Current Period: | | | | | | | | | | | | | | | | | | |
| Provision/(benefit) for credit losses | | (447) | | | (184) | | | (640) | | | 3,338 | | | 119 | | | 11,231 | | | (282) | | | 46 | | | 13,181 | |
| Write offs | | — | | | — | | | — | | | — | | | — | | | (427) | | | — | | | — | | | (427) | |
| | | | | | | | | | | | | | | | | | |
| Ending Balance | | $ | 3,095 | | | $ | 404 | | | $ | 1,575 | | | $ | 3,795 | | | $ | 132 | | | $ | 11,646 | | | $ | 117 | | | $ | 122 | | | $ | 20,886 | |
The Company recorded a decrease in its allowance for credit losses during the year ended December 31, 2021 of $4.8 million. The primary driver for the improvement in the reserve balance is the positive economic outlook since the end of the prior year.
FRANKLIN BSP REALTY TRUST, INC.
NOTES TO CONSOLIDATED FINANCIAL STATEMENTS
December 31, 20212023
Loan Portfolio by Collateral Type and Geographic Region
The following tables represent the composition by loan collateral type and region of the Company's commercial mortgage loans, held for investment portfolio (dollars in thousands):
| | | | | | | | | | | | | | | | | | | | | | | | | | |
| | December 31, 2023 | | December 31, 2022 |
| Loan Collateral Type | | Par Value | | Percentage | | Par Value | | Percentage |
| Multifamily | | $ | 3,876,108 | | | 76.8 | % | | $ | 4,030,975 | | | 76.1 | % |
| Hospitality | | 670,274 | | | 13.3 | % | | 510,566 | | | 9.7 | % |
| Office | | 269,924 | | | 5.4 | % | | 405,705 | | | 7.7 | % |
| Industrial | | 73,724 | | | 1.5 | % | | 93,035 | | | 1.8 | % |
| Retail | | 34,000 | | | 0.7 | % | | 120,017 | | | 2.3 | % |
| Other | | 121,006 | | | 2.3 | % | | 128,676 | | | 2.4 | % |
| | | | | | | | |
| | | | | | | | |
| | | | | | | | |
| Total | | $ | 5,045,036 | | | 100.0 | % | | $ | 5,288,974 | | | 100.0 | % |
| | | | | | | | | | | | | | | | | | | | | | | | | | |
| | December 31, 2023 | | December 31, 2022 |
| Loan Region | | Par Value | | Percentage | | Par Value | | Percentage |
| Southeast | | $ | 1,989,175 | | | 39.4 | % | | $ | 2,229,756 | | | 42.2 | % |
| Southwest | | 1,920,491 | | | 38.1 | % | | 1,763,492 | | | 33.3 | % |
| Mideast | | 455,739 | | | 9.0 | % | | 706,192 | | | 13.4 | % |
| Great Lakes | | 161,059 | | | 3.2 | % | | 162,162 | | | 3.1 | % |
| Far West | | 113,554 | | | 2.3 | % | | 234,891 | | | 4.4 | % |
| Other | | 405,018 | | | 8.0 | % | | 192,481 | | | 3.6 | % |
| | | | | | | | |
| | | | | | | | |
| | | | | | | | |
| Total | | $ | 5,045,036 | | | 100.0 | % | | $ | 5,288,974 | | | 100.0 | % |
Allowance for Credit Losses
The following table presents the activitychanges in the Company's allowance for credit losses for the unfundedyears ended December 31, 2023 and 2022 (dollars in thousands):
| | | | | | | | | | | | | | | | | | | | | | | | | | | | | | | | |
| | | | General Allowance for Credit Losses | | |
| | Specific Allowance for Credit Losses | | Funded | | Unfunded | | Total | | Total Allowance for Credit Losses |
| December 31, 2021 | | $ | — | | | $ | 15,827 | | | $ | 243 | | | $ | 16,070 | | | $ | 16,070 | |
| Changes: | | | | | | | | | | |
| Provision/(Benefit) | | 25,281 | | 10,797 | | 37 | | 10,834 | | 36,115 |
| Write offs | | (11,057) | | | — | | | — | | | — | | | (11,057) | |
| December 31, 2022 | | $ | 14,224 | | | $ | 26,624 | | | $ | 280 | | | $ | 26,904 | | | $ | 41,128 | |
| Changes: | | | | | | | | | | |
| Provision/(Benefit) | | 12,334 | | 20,551 | | 853 | | 21,404 | | 33,738 |
| Write offs | | (26,558) | | | — | | | — | | | — | | | (26,558) | |
| December 31, 2023 | | $ | — | | | $ | 47,175 | | | $ | 1,133 | | | $ | 48,308 | | | $ | 48,308 | |
| | | | | | | | | | |
Specific Allowance for Credit Losses
As of December 31, 2022, the Company identified a commercial mortgage loan, commitments, which is presentedheld for investment secured by a portfolio of retail properties (the “Walgreens Portfolio”), that was assigned a risk rating of “5” due to certain conditions that negatively impacted the underlying collateral property’s cash flows. The loan was evaluated in accounts payableaccordance with ASC 310 - Receivables and accrued expenseswas determined to be a TDR. The Company elected the practical expedient collateral-dependent asset to measure the fair value of the underlying collateral, as of December 31, 2022, and recorded a specific provision for credit losses of $14.2 million based on the difference between the Company’s estimation of the fair value of the underlying collateral property, less costs to sell, and the loan’s amortized cost basis. As of December 31, 2022, the loan had a fully funded outstanding principal balance of $63.6 million, and carrying value of $46.1 million. During the first quarter of 2023, the Company recorded an additional $0.8 million specific allowance for credit losses on the loan and wrote off the remaining $15.1 million specific allowance for credit losses for the Walgreens Portfolio, net of $0.7 million recoveries recorded. All properties collateralized by the senior mortgage notes were assumed by the Company through foreclosures and deeds-in-lieu of foreclosure and correspondingly were transferred to Real estate owned, net of depreciation in the consolidated balance sheets as of sheets.December 31, 2021 and 2020 (dollars in thousands): | | | | | | | | | | | | | | | | | | | | | | | | | | | | | | | | | | | | | | | | | | | | | | | | | | | | | | | | |
| | Year Ended December 31, 2021 |
| | MultiFamily | | Retail | | Office | | Industrial | | Mixed Use | | Hospitality | | Self Storage | | Manufactured Housing | | Total |
| Beginning Balance | | $ | 85 | | | $ | — | | | $ | 47 | | | $ | 418 | | | $ | 14 | | | $ | 101 | | | $ | — | | | $ | — | | | $ | 665 | |
| | | | | | | | | | | | | | | | | | |
| Current Period: | | | | | | | | | | | | | | | | | | |
| Provision/(benefit) for credit losses | | 52 | | | 1 | | | (34) | | | (415) | | | (4) | | | (22) | | | — | | | — | | | (422) | |
| | | | | | | | | | | | | | | | | | |
| | | | | | | | | | | | | | | | | | |
| Ending Balance | | $ | 137 | | | $ | 1 | | | $ | 13 | | | $ | 3 | | | $ | 10 | | | $ | 79 | | | $ | — | | | $ | — | | | $ | 243 | |
| | | | | | | | | | | | | | | | | | | | | | | | | | | | | | | | | | | | | | | | | | | | | | | | | | | | | | | | |
| | Year Ended December 31, 2020 |
| | MultiFamily | | Retail | | Office | | Industrial | | Mixed Use | | Hospitality | | Self Storage | | Manufactured Housing | | Total |
| Beginning Balance | | $ | — | | | $ | — | | | $ | — | | | $ | — | | | $ | — | | | $ | — | | | $ | — | | | $ | — | | | $ | — | |
| Cumulative-effect adjustment upon adoption of ASU 2016-13 | | 239 | | | 40 | | | 150 | | | 30 | | | 1 | | | 57 | | | 28 | | | 5 | | | 550 | |
| Current Period: | | | | | | | | | | | | | | | | | | |
| Provision/(benefit) for credit losses | | (154) | | | (40) | | | (103) | | | 388 | | | 13 | | | 44 | | | (28) | | | (5) | | | 115 | |
| | | | | | | | | | | | | | | | | | |
| | | | | | | | | | | | | | | | | | |
| Ending Balance | | $ | 85 | | | $ | — | | | $ | 47 | | | $ | 418 | | | $ | 14 | | | $ | 101 | | | $ | — | | | $ | — | | | $ | 665 | |
The following table represents the composition by loan type of the Company's commercial mortgage loans portfolio, excluding commercial mortgage loans, held for investment (dollars in thousands): | | | | | | | | | | | | | | | | | | | | | | | | | | |
| | December 31, 2021 | | December 31, 2020 |
| Loan Type | | Par Value | | Percentage | | Par Value | | Percentage |
| Multifamily | | $ | 2,953,938 | | | 69.6 | % | | $ | 1,202,694 | | | 44.2 | % |
| Office | | 485,575 | | | 11.4 | % | | 517,464 | | | 19.0 | % |
| Hospitality | | 460,884 | | | 10.9 | % | | 403,908 | | | 14.8 | % |
| Retail | | 104,990 | | | 2.5 | % | | 78,550 | | | 2.9 | % |
| Industrial | | 88,956 | | | 2.1 | % | | 243,404 | | | 8.9 | % |
| Mixed Use | | 62,965 | | | 1.5 | % | | 102,756 | | | 3.8 | % |
| Self Storage | | 56,495 | | | 1.3 | % | | 86,424 | | | 3.2 | % |
| Manufactured Housing | | 29,159 | | | 0.7 | % | | 71,263 | | | 2.6 | % |
| Land | | — | | | — | % | | 16,400 | | | 0.6 | % |
| Total | | $ | 4,242,962 | | | 100.0 | % | | $ | 2,722,863 | | | 100.0 | % |
FRANKLIN BSP REALTY TRUST, INC.
NOTES TO CONSOLIDATED FINANCIAL STATEMENTS
December 31, 20212023
| | | | | | | | | | | | | | | | | | | | | | | | | | |
| | December 31, 2021 | | December 31, 2020 |
| Loan Region | | Par Value | | Percentage | | Par Value | | Percentage |
| Southwest | | $ | 1,764,905 | | | 41.6 | % | | $ | 515,392 | | | 18.9 | % |
| Southeast | | 1,106,439 | | | 26.2 | % | | 796,908 | | | 29.3 | % |
| Mideast | | 646,125 | | | 15.2 | % | | 473,514 | | | 17.4 | % |
| Far West | | 301,040 | | | 7.1�� | % | | 415,173 | | | 15.2 | % |
| Great Lakes | | 183,930 | | | 4.3 | % | | 199,203 | | | 7.3 | % |
| Various | | 68,896 | | | 1.6 | % | | 136,855 | | | 5.0 | % |
| New England | | 67,651 | | | 1.6 | % | | 69,675 | | | 2.6 | % |
| Plains | | 60,225 | | | 1.4 | % | | 116,143 | | | 4.3 | % |
| Rocky Mountain | | 43,751 | | | 1.0 | % | | — | | | — | % |
| Total | | $ | 4,242,962 | | | 100.0 | % | | $ | 2,722,863 | | | 100.0 | % |
As of December 31, 2021 andIn February 2020, the Company's total commercialCompany originated a first mortgage loans, heldloan secured by an office property in Portland, OR. In February 2023, the fully committed $37.3 million senior loan was restructured as a result of financial difficulty to a $25.0 million committed senior loan. In connection with the restructuring, the Company committed a $10.1 million mezzanine note. In accordance with the adoption of ASU 2022-02, the restructuring was classified as a continuation of an existing loan on the senior loan and new loan for sale, measured atthe mezzanine note. During the second quarter of 2023, the Company assigned the senior and mezzanine notes a risk rating of "5" and placed the loan on cost recovery status. The Company elected to apply a practical expedient for collateral dependent assets in which the allowance for credit losses is calculated as the difference between the estimated fair value was comprised of 1 and 3 loans, respectively. As of December 31, 2021 and 2020, the contractual principal outstanding of commercial mortgage loans, held for sale, measured at fair value was $34.3 million and $67.6 million, respectively. As of December 31, 2021 and 2020, none of the Company's commercial mortgage loans, held for sale, measured at fair value were in default or greater than 90 days past due.
The following table represents the composition by loan type of the Company's commercial mortgage loans, held for sale, measured at fair value (dollars in thousands): | | | | | | | | | | | | | | | | | | | | | | | | | | |
| | December 31, 2021 | | December 31, 2020 |
| Loan Type | | Par Value | | Percentage | | Par Value | | Percentage |
| Office | | $ | 34,250 | | | 100.0 | % | | $ | — | | | — | % |
| Industrial | | — | | | — | % | | 67,550 | | | 99.9 | % |
| Multifamily | | — | | | — | % | | 100 | | | 0.1 | % |
| | | | | | | | |
| | | | | | | | |
| Total | | $ | 34,250 | | | 100.0 | % | | $ | 67,650 | | | 100.0 | % |
| | | | | | | | | | | | | | | | | | | | | | | | | | |
| | December 31, 2021 | | December 31, 2020 |
| Loan Region | | Par Value | | Percentage | | Par Value | | Percentage |
| Southeast | | $ | 34,250 | | | 100.0 | % | | $ | — | | | — | % |
| Far West | | — | | | — | % | | 58,500 | | | 86.5 | % |
| Great Lakes | | — | | | — | % | | 9,150 | | | 13.5 | % |
| | | | | | | | |
| | | | | | | | |
| | | | | | | | |
| | | | | | | | |
| Total | | $ | 34,250 | | | 100.0 | % | | $ | 67,650 | | | 100.0 | % |
Loan Credit Qualityunderlying collateral, less estimated cost to sell, and Vintage
The following tables present the amortized cost basis of ourthe loan. As a result, the Company recorded a specific allowance for credit losses of $11.9 million on this loan in the second quarter of 2023 and subsequently wrote off this specific allowance for credit losses in the same quarter. During the third quarter of 2023, the Company foreclosed upon the mortgage notes through deed-in-lieu of foreclosure. The carrying value of the loan at the time of repossession was $20.3 million, net of cost recoveries totaling $1.1 million. In connection therewith, the underlying collateral assets were reclassified to Real estate owned, net of depreciation in the consolidated balance sheets as a result of deed-in-lieu. The transfer was evaluated to be an asset acquisition in accordance with ASC 805. See Note 5 - Real Estate Owned.
General Allowance for Credit Losses
The Company recorded an increase in its general allowance for credit losses during the year ended December 31, 2023 of $21.4 million. The primary driver for the higher reserve balance is due to a more pessimistic and conservative macro-economic outlook since the end of the prior year slightly offset by a decrease in the overall portfolio of commercial mortgage loans, held for investment as of December 31, 2021 and 2020, by loan type,2023. The Company recorded an increase in its general allowance for credit losses during the year of origination and the Company’s internal risk rating at the corresponding balance sheet date.
FRANKLIN BSP REALTY TRUST, INC.
NOTES TO CONSOLIDATED FINANCIAL STATEMENTS
ended December 31, 2021
| | | | | | | | | | | | | | | | | | | | | | | | | | | | | | | | | | | | | | | | | | | | | | |
| | 2021 | | 2020 | | 2019 | | 2018 | | 2017 | | | | Prior | | Total |
| Multifamily: | | | | | | | | | | | | | | | | |
| Risk Rating: | | | | | | | | | | | | | | | | |
| 1-2 internal grade | | $ | 2,438,376 | | | $ | 270,953 | | | $ | 103,989 | | | $ | 90,877 | | | $ | — | | | | | $ | — | | | $ | 2,904,195 | |
| 3-4 internal grade | | — | | | — | | | — | | | 37,025 | | | — | | | | | — | | | 37,025 | |
| Total Multifamily Loans | | $ | 2,438,376 | | | $ | 270,953 | | | $ | 103,989 | | | $ | 127,902 | | | $ | — | | | | | $ | — | | | $ | 2,941,220 | |
| | | | | | | | | | | | | | | | |
| Retail: | | | | | | | | | | | | | | | | |
| Risk Rating: | | | | | | | | | | | | | | | | |
| 1-2 internal grade | | $ | 33,830 | | | $ | 11,928 | | | $ | 29,515 | | | $ | 29,452 | | | $ | — | | | | | $ | — | | | $ | 104,725 | |
| 3-4 internal grade | | — | | | — | | | — | | | — | | | — | | | | | — | | | — | |
| Total Retail Loans | | $ | 33,830 | | | $ | 11,928 | | | $ | 29,515 | | | $ | 29,452 | | | $ | — | | | | | $ | — | | | $ | 104,725 | |
| | | | | | | | | | | | | | | | |
| Office: | | | | | | | | | | | | | | | | |
| Risk Rating: | | | | | | | | | | | | | | | | |
| 1-2 internal grade | | $ | 50,291 | | | $ | 253,759 | | | $ | 136,800 | | | $ | 43,308 | | | $ | — | | | | | $ | — | | | $ | 484,158 | |
| 3-4 internal grade | | — | | | — | | | — | | | — | | | — | | | | | — | | | — | |
| Total Office Loans | | $ | 50,291 | | | $ | 253,759 | | | $ | 136,800 | | | $ | 43,308 | | | $ | — | | | | | $ | — | | | $ | 484,158 | |
| | | | | | | | | | | | | | | | |
| Industrial: | | | | | | | | | | | | | | | | |
| Risk Rating: | | | | | | | | | | | | | | | | |
| 1-2 internal grade | | $ | — | | | $ | 31,906 | | | $ | — | | | $ | — | | | $ | — | | | | | $ | — | | | $ | 31,906 | |
| 3-4 internal grade | | — | | | — | | | 56,933 | | | — | | | — | | | | | — | | | 56,933 | |
| Total Industrial Loans | | $ | — | | | $ | 31,906 | | | $ | 56,933 | | | $ | — | | | $ | — | | | | | $ | — | | | $ | 88,839 | |
| | | | | | | | | | | | | | | | |
| Mixed Use: | | | | | | | | | | | | | | | | |
| Risk Rating: | | | | | | | | | | | | | | | | |
| 1-2 internal grade | | $ | 32,395 | | | $ | 30,325 | | | $ | — | | | $ | — | | | $ | — | | | | | $ | — | | | $ | 62,720 | |
| 3-4 internal grade | | — | | | — | | | — | | | — | | | — | | | | | — | | | — | |
| Total Mixed Use Loans | | $ | 32,395 | | | $ | 30,325 | | | $ | — | | | $ | — | | | $ | — | | | | | $ | — | | | $ | 62,720 | |
| | | | | | | | | | | | | | | | |
| Hospitality: | | | | | | | | | | | | | | | | |
| Risk Rating: | | | | | | | | | | | | | | | | |
| 1-2 internal grade | | $ | 153,032 | | | $ | 26,920 | | | $ | 34,054 | | | $ | — | | | $ | — | | | | | $ | — | | | $ | 214,006 | |
| 3-4 internal grade | | — | | | — | | | 113,961 | | | 52,790 | | | 79,102 | | | | | — | | | 245,853 | |
| Total Hospitality Loans | | $ | 153,032 | | | $ | 26,920 | | | $ | 148,015 | | | $ | 52,790 | | | $ | 79,102 | | | | | $ | — | | | $ | 459,859 | |
| | | | | | | | | | | | | | | | |
| Self Storage: | | | | | | | | | | | | | | | | |
| Risk Rating: | | | | | | | | | | | | | | | | |
| 1-2 internal grade | | $ | 14,948 | | | $ | 41,382 | | | $ | — | | | $ | — | | | $ | — | | | | | $ | — | | | $ | 56,330 | |
| 3-4 internal grade | | — | | | — | | | — | | | — | | | — | | | | | — | | | — | |
| Total Self Storage Loans | | $ | 14,948 | | | $ | 41,382 | | | $ | — | | | $ | — | | | $ | — | | | | | $ | — | | | $ | 56,330 | |
| | | | | | | | | | | | | | | | |
| Manufactured Housing: | | | | | | | | | | | | | | | | |
| Risk Rating: | | | | | | | | | | | | | | | | |
| 1-2 internal grade | | $ | 6,665 | | | $ | 22,372 | | | $ | — | | | $ | — | | | $ | — | | | | | $ | — | | | $ | 29,037 | |
| 3-4 internal grade | | — | | | — | | | — | | | — | | | — | | | | | — | | | — | |
| Total Manufactured Housing Loans | | $ | 6,665 | | | $ | 22,372 | | | $ | — | | | $ | — | | | $ | — | | | | | $ | — | | | $ | 29,037 | |
| | | | | | | | | | | | | | | | |
| Total | | $ | 2,729,537 | | | $ | 689,545 | | | $ | 475,252 | | | $ | 253,452 | | | $ | 79,102 | | | | | $ | — | | | $ | 4,226,888 | |
FRANKLIN BSP REALTY TRUST, INC.
NOTES TO CONSOLIDATED FINANCIAL STATEMENTS
$10.8 million. The primary driver for the higher reserve balance is the change in economic outlook since the end of the prior year coupled with the increase in overall portfolio of commercial mortgage loans, held for investment as of December 31, 2021
| | | | | | | | | | | | | | | | | | | | | | | | | | | | | | | | | | | | | | | | | | | | | | | | | | |
| December 31, 2020 | | | | | | | | | | | | | | | | |
| | 2020 | | 2019 | | 2018 | | 2017 | | 2016 | | 2015 | | Prior | | Total |
| Multifamily: | | | | | | | | | | | | | | | | |
| Risk Rating: | | | | | | | | | | | | | | | | |
| 1-2 internal grade | | $ | 583,550 | | | $ | 349,588 | | | $ | 188,975 | | | $ | — | | | $ | — | | | $ | — | | | $ | 3,488 | | | $ | 1,125,601 | |
| 3-4 internal grade | | — | | | — | | | 35,887 | | | 37,812 | | | — | | | — | | | — | | | 73,699 | |
| Total Multifamily Loans | | $ | 583,550 | | | $ | 349,588 | | | $ | 224,862 | | | $ | 37,812 | | | $ | — | | | $ | — | | | $ | 3,488 | | | $ | 1,199,300 | |
| | | | | | | | | | | | | | | | |
| Retail: | | | | | | | | | | | | | | | | |
| Risk Rating: | | | | | | | | | | | | | | | | |
| 1-2 internal grade | | $ | 13,277 | | | $ | 22,760 | | | $ | 16,400 | | | $ | — | | | $ | — | | | $ | — | | | $ | — | | | $ | 52,437 | |
| 3-4 internal grade | | — | | | 12,872 | | | 29,425 | | | — | | | — | | | — | | | — | | | 42,297 | |
| Total Retail Loans | | $ | 13,277 | | | $ | 35,632 | | | $ | 45,825 | | | $ | — | | | $ | — | | | $ | — | | | $ | — | | | $ | 94,734 | |
| | | | | | | | | | | | | | | | |
| Office: | | | | | | | | | | | | | | | | |
| Risk Rating: | | | | | | | | | | | | | | | | |
| 1-2 internal grade | | $ | 244,301 | | | $ | 160,709 | | | $ | 61,169 | | | $ | 40,846 | | | $ | — | | | $ | — | | | $ | — | | | $ | 507,025 | |
| 3-4 internal grade | | — | | | — | | | — | | | 8,392 | | | — | | | — | | | — | | | 8,392 | |
| Total Office Loans | | $ | 244,301 | | | $ | 160,709 | | | $ | 61,169 | | | $ | 49,238 | | | $ | — | | | $ | — | | | $ | — | | | $ | 515,417 | |
| | | | | | | | | | | | | | | | |
| Industrial: | | | | | | | | | | | | | | | | |
| Risk Rating: | | | | | | | | | | | | | | | | |
| 1-2 internal grade | | $ | 119,193 | | | $ | 89,590 | | | $ | — | | | $ | — | | | $ | — | | | $ | 33,655 | | | $ | — | | | $ | 242,438 | |
| 3-4 internal grade | | — | | | — | | | — | | | — | | | — | | | — | | | — | | | — | |
| Total Industrial Loans | | $ | 119,193 | | | $ | 89,590 | | | $ | — | | | $ | — | | | $ | — | | | $ | 33,655 | | | $ | — | | | $ | 242,438 | |
| | | | | | | | | | | | | | | | |
| Mixed Use: | | | | | | | | | | | | | | | | |
| Risk Rating: | | | | | | | | | | | | | | | | |
| 1-2 internal grade | | $ | 30,246 | | | $ | — | | | $ | 59,451 | | | $ | 12,839 | | | $ | — | | | $ | — | | | $ | — | | | $ | 102,536 | |
| 3-4 internal grade | | — | | | — | | | — | | | — | | | — | | | — | | | — | | | — | |
| Total Mixed Use Loans | | $ | 30,246 | | | $ | — | | | $ | 59,451 | | | $ | 12,839 | | | $ | — | | | $ | — | | | $ | — | | | $ | 102,536 | |
| | | | | | | | | | | | | | | | |
| Hospitality: | | | | | | | | | | | | | | | | |
| Risk Rating: | | | | | | | | | | | | | | | | |
| 1-2 internal grade | | $ | 26,878 | | | $ | 10,547 | | | $ | — | | | $ | — | | | $ | — | | | $ | — | | | $ | — | | | $ | 37,425 | |
| 3-4 internal grade | | — | | | 160,079 | | | 115,026 | | | 90,612 | | | — | | | — | | | — | | | 365,717 | |
| Total Hospitality Loans | | $ | 26,878 | | | $ | 170,626 | | | $ | 115,026 | | | $ | 90,612 | | | $ | — | | | $ | — | | | $ | — | | | $ | 403,142 | |
| | | | | | | | | | | | | | | | |
| Self Storage: | | | | | | | | | | | | | | | | |
| Risk Rating: | | | | | | | | | | | | | | | | |
| 1-2 internal grade | | $ | 41,305 | | | $ | — | | | $ | 44,908 | | | $ | — | | | $ | — | | | $ | — | | | $ | — | | | $ | 86,213 | |
| 3-4 internal grade | | — | | | — | | | — | | | — | | | — | | | — | | | — | | | — | |
| Total Self Storage Loans | | $ | 41,305 | | | $ | — | | | $ | 44,908 | | | $ | — | | | $ | — | | | $ | — | | | $ | — | | | $ | 86,213 | |
| | | | | | | | | | | | | | | | |
| Manufactured Housing: | | | | | | | | | | | | | | | | |
| Risk Rating: | | | | | | | | | | | | | | | | |
| 1-2 internal grade | | $ | 25,905 | | | $ | 45,049 | | | $ | — | | | $ | — | | | $ | — | | | $ | — | | | $ | — | | | $ | 70,954 | |
| 3-4 internal grade | | — | | | — | | | — | | | — | | | — | | | — | | | — | | | — | |
FRANKLIN BSP REALTY TRUST, INC.
NOTES TO CONSOLIDATED FINANCIAL STATEMENTS
December 31, 2021
| | | | | | | | | | | | | | | | | | | | | | | | | | | | | | | | | | | | | | | | | | | | | | | | | | |
| Total Manufactured Housing Loans | | $ | 25,905 | | | $ | 45,049 | | | $ | — | | | $ | — | | | $ | — | | | $ | — | | | $ | — | | | $ | 70,954 | |
| | | | | | | | | | | | | | | | |
| Total | | $ | 1,084,655 | | | $ | 851,194 | | | $ | 551,241 | | | $ | 190,501 | | | $ | — | | | $ | 33,655 | | | $ | 3,488 | | | $ | 2,714,734 | |
Past Due Status
The following table presents an aginga summary of the loans amortized cost basis atas of December 31, 20212023 (dollars in thousands): | | | | | | | | | | | | | | | | | | | | | | | | | | | | | | | | | | | | | | | | | | | | | | | | | | | | | | | | |
| | Multifamily | | Retail | | Office | | Industrial | | Mixed Use | | Hospitality | | Self Storage | | Manufactured Housing | | Total |
| Status: | | | | | | | | | | | | | | | | | | |
| Current | | $ | 2,941,220 | | | $ | 104,725 | | | $ | 484,158 | | | $ | 31,906 | | | $ | 62,720 | | | $ | 402,784 | | | $ | 56,330 | | | $ | 29,037 | | | $ | 4,112,880 | |
1-29 days past due (1) | | — | | | — | | | — | | | 56,933 | | | — | | | — | | | — | | | — | | | 56,933 | |
| 30-59 days past due | | — | | | — | | | — | | | — | | | — | | | — | | | — | | | — | | | — | |
| 60-89 days past due | | — | | | — | | | — | | | — | | | — | | | — | | | — | | | — | | | — | |
| 90-119 days past due | | — | | | — | | | — | | | — | | | — | | | — | | | — | | | — | | | — | |
120+ days past due (2) | | — | | | — | | | — | | | — | | | — | | | 57,075 | | | — | | | — | | | 57,075 | |
| Total | | $ | 2,941,220 | | | $ | 104,725 | | | $ | 484,158 | | | $ | 88,839 | | | $ | 62,720 | | | $ | 459,859 | | | $ | 56,330 | | | $ | 29,037 | | | $ | 4,226,888 | |
| | | | | | | | | | | | | | | | | | | | | | | | | | |
| | Current | | Less than 90 days past due | | 90 or more days past due (1) | | Total |
| As of December 31, 2023 | | $ | 4,837,414 | | | $ | 136,139 | | | $ | 63,389 | | | $ | 5,036,942 | |
________________________(1) For the year endedThis is comprised of (i) $27.4 million of outstanding principal amount of a mortgage loan collateralized by self storage properties which was paid down subsequent to December 31, 2021,2023 and (ii) $35.9 million outstanding principal amount of a mortgage loan collateralized by multifamily properties which was designated as non-performing and, subsequent to December 31, 2023, all past due accrued interest income recognized on this loan was $3.1 million.collected.
Non-performing Status
The following table presents the amortized cost basis of our non-performing loans as of December 31, 2023 and 2022 (dollars in thousands):
| | | | | | | | | | | | | | |
| | December 31, 2023 | | December 31, 2022 |
| Non-performing loan amortized cost at beginning of year, January 1 | | $ | 117,379 | | | $ | 57,075 | |
| Addition of non-performing loan amortized cost | | 118,647 | | | 60,304 | |
| Less: Removal of non-performing loan amortized cost | | 157,841 | | | — | |
Non-performing loan amortized cost end of period (1) | | $ | 78,185 | | | $ | 117,379 | |
________________________(2)(1) For the year ended December 31, 2021, there was no interest income recognized on this loan.
As of December 31, 2021,2023 and 2022, the Company had 1 loan on non-accrual status with a total cost basis of $57.1 million for which there was no related allowancetwo and two loans, respectively, designated as non-performing. No specific allowances for credit losses. Aslosses were determined for the 2 loans on non-performing status as of December 31, 2020,2023.
As ofDecember 31, 2023, the Company had 2two designated non-performing loans on non-accrual status with a total cost basis of $94.9 million for which there was no related allowance for credit losses.were both collateralized by multifamily properties.
Loan Credit Characteristics, Quality and Vintage
As part of the Company's process for monitoring the credit quality of its commercial mortgage loans, excluding those held for sale, measured at fair value, it performs a quarterly loan portfolio assessment and assigns risk ratings to each of its loans. The loans are scored on a scale of 1 to 5 as follows:described in Note 2 - Summary of Significant Accounting Policies.
| | | | | | | | |
Investment Rating | | Summary Description |
1 | | Very Low Risk - Investment exceeding fundamental performance expectations and/or capital gain expected. Trends and risk factors since time of investment are favorable.
|
2 | | Low Risk - Performing consistent with expectations and a full return of principal and interest expected. Trends and risk factors are neutral to favorable.
|
3 | | Average Risk - Performing investments requiring closer monitoring. Trends and risk factors show some deterioration.
|
4 | | High Risk/Delinquent/Potential For Loss - Underperforming investment with the potential of some interest loss but still expecting a positive return on investment. Trends and risk factors are negative.
|
5 | | Impaired/Defaulted/Loss Likely - Underperforming investment with expected loss of interest and some principal.
|
All commercial mortgage loans, excluding loans classified as commercial mortgage loans, held for sale, measured at fair value within the consolidated balance sheets, are assigned an initial risk rating of 2. As of December 31, 2021 and 2020, the weighted average risk ratings of loans were 2.1 and 2.2, respectively.
FRANKLIN BSP REALTY TRUST, INC.
NOTES TO CONSOLIDATED FINANCIAL STATEMENTS
December 31, 20212023
Commercial mortgage loans, held for investment in the consolidated balance sheets, are assigned an initial risk rating of 2. As of December 31, 2023 and 2022, the weighted average risk rating of loans was 2.3 and 2.2, respectively.
The following table representstables present the allocationpar value and amortized cost of our commercial mortgage loans, held for investment as of December 31, 2023 and 2022, by the Company’s internal risk rating and year of origination (dollars in thousands):
| | | | | | | | | | | | | | | | | | | | | | | | | | | | | | | | | | | | | | | | | | | | | | | | | | | | | | | | | | | | | | |
| December 31, 2023 |
| | | | | | Amortized Cost by Year of Origination | | |
| Risk Rating | | Number of Loans | | Total Par Value | | 2023 | | 2022 | | 2021 | | 2020 | | 2019 | | Prior | | Total Amortized Cost | | % of Portfolio |
| 1 | | — | | $ | — | | | $ | — | | | $ | — | | | $ | — | | | $ | — | | | $ | — | | | $ | — | | | $ | — | | | — | % |
| 2 | | 111 | | 3,897,680 | | 694,228 | | | 1,256,509 | | | 1,724,734 | | | 105,477 | | | 73,743 | | | 35,734 | | | 3,890,424 | | 77.2 | % |
| 3 | | 27 | | 875,449 | | 2,379 | | | 273,097 | | | 468,244 | | | 74,729 | | | — | | | 56,362 | | | 874,811 | | 17.4 | % |
| 4 | | 6 | | 271,907 | | — | | | 141,740 | | | 87,126 | | | — | | | 42,840 | | | — | | | 271,707 | | 5.4 | % |
| 5 | | — | | — | | | — | | | — | | | — | | | — | | | — | | | — | | | — | | | — | % |
| Total | | 144 | | $ | 5,045,036 | | | $ | 696,607 | | | $ | 1,671,346 | | | $ | 2,280,104 | | | $ | 180,206 | | | $ | 116,583 | | | $ | 92,096 | | | $ | 5,036,942 | | | 100.0 | % |
| | | | | | | | | | Allowance for credit losses | | (47,175) | | | |
| | | | | | | | | | | | Total carrying value, net | | $ | 4,989,767 | | | |
| | | | | | | | | | | | | | | | | | | | | | | | | | | | | | | | | | | | | | | | | | | | | | | | | | | | | | | | | | | | | | |
| December 31, 2022 |
| | | | | | Amortized Cost by Year of Origination | | |
| Risk Rating | | Number of Loans | | Total Par Value | | 2022 | | 2021 | | 2020 | | 2019 | | 2018 | | Prior | | Total Amortized Cost | | % of Portfolio |
| 1 | | — | | $ | — | | | $ | — | | | $ | — | | | $ | — | | | $ | — | | | $ | — | | | $ | — | | | $ | — | | | — | % |
| 2 | | 141 | | 4,783,568 | | 1,778,691 | | | 2,483,120 | | | 315,269 | | | 115,673 | | | 75,467 | | | — | | | 4,768,220 | | 90.6 | % |
| 3 | | 15 | | 281,071 | | — | | | 167,707 | | | 36,655 | | | 54,631 | | | — | | | 21,792 | | | 280,785 | | 5.3 | % |
| 4 | | 4 | | 160,695 | | 32,305 | | | — | | | 36,356 | | | — | | | 34,731 | | | 57,075 | | | 160,467 | | 3.0 | % |
| 5 | | 1 | | 63,640 | | 60,304 | | | — | | | — | | | — | | | — | | | — | | | 60,304 | | 1.1 | % |
| Total | | 161 | | $ | 5,288,974 | | | $ | 1,871,300 | | | $ | 2,650,827 | | | $ | 388,280 | | | $ | 170,304 | | | $ | 110,198 | | | $ | 78,867 | | | $ | 5,269,776 | | | 100.0 | % |
| | | | | | | | | | Allowance for credit losses | | (40,848) | | | |
| | | | | | | | | | | | Total carrying value, net | | $ | 5,228,928 | | | |
Commercial Mortgage Loans, Held for Sale, Measured at Fair Value
As of December 31, 2023 the Company did not hold any commercial mortgage loans, held for sale. As of December 31, 2022, the contractual principal balance outstanding of commercial mortgage loans, held for sale, measured at fair value was $15.6 million which was comprised of two loans. As of December 31, 2022, none of the Company's commercial mortgage loans, held for
investment, (dollarssale, measured at fair value were in
thousands): | | | | | | | | | | | | | | | | | | | | | | | | | | | | | | | | |
| December 31, 2021 | | December 31, 2020 |
| Risk Rating | | Number of Loans | | Par Value | | Risk Rating | | Number of Loans | | Par Value |
| 1 | | — | | | $ | — | | | 1 | | — | | | $ | — | |
| 2 | | 148 | | | 3,903,047 | | | 2 | | 104 | | | 2,232,045 | |
| 3 | | 16 | | | 282,840 | | | 3 | | 22 | | | 384,040 | |
| 4 | | 1 | | | 57,075 | | | 4 | | 4 | | | 106,778 | |
| 5 | | — | | | — | | | 5 | | — | | | — | |
| | 165 | | | $ | 4,242,962 | | | | | 130 | | | $ | 2,722,863 | |
ForThe following tables represent the years ended December 31, 2021composition by loan collateral type and December 31, 2020, the activity inregion of the Company's commercial mortgage loans, held for investment portfolio, net of allowance, was as followssale, measured at fair value (dollars in thousands): | | | | | | | | | | | |
| Year Ended December 31, |
| 2021 | | 2020 |
| Balance at Beginning of Year | $ | 2,693,848 | | | $ | 2,762,042 | |
| Cumulative-effect adjustment upon adoption of ASU 2016-13 | — | | | (7,211) | |
| Acquisitions and originations | 2,897,002 | | | 1,287,720 | |
| Principal repayments | (1,286,598) | | | (1,223,490) | |
| Discount accretion/premium amortization | 7,038 | | | 6,146 | |
| Loans transferred from/(to) commercial real estate loans, held for sale | (52,615) | | | (76,979) | |
| Net fees capitalized into carrying value of loans | (15,150) | | | (6,562) | |
| (Provision)/benefit for credit losses | 4,770 | | | (13,181) | |
| Charge-off from allowance | 289 | | | 427 | |
| Transfer to real estate owned | (37,523) | | | (35,064) | |
| | | |
| Balance at End of Year | $ | 4,211,061 | | | $ | 2,693,848 | |
During the year ended December 31, 2021, the Company wrote off a commercial mortgage loan, held for investment, with a carrying value of $37.8 million in exchange for the possession of a REO investment at a fair value of $37.5 million, comprised of $33.0 million of real property (land, building and improvements) and $4.5 million of personal property (furniture, fixture, and equipment) at the time of transfer. The transfer occurred when the Company took possession of the property by completing a foreclosure transaction in January 2021, resulting in a $0.3 million impairment loss at the time of transfer. Since the foreclosure was entered into due to the borrower experiencing financial difficulty and the recorded investment in the receivable was more than the fair value for the collateral collected, the transaction qualifies as a TDR. The Company accounted for the REO acquired during the year ended December 31, 2021 as an asset acquisition. The Company subsequently sold this REO asset during the year ended December 31, 2021 for a $0.8 million gain, presented net of direct selling costs associated with the disposition of the asset, included within Realized gain/loss on sale of real estate owned assets, held for sale in the Company's consolidated statements of operations. | | | | | | | | | | | | | | | | | | | | | | | | | | |
| | December 31, 2023 | | December 31, 2022 |
| Loan Collateral Type | | Par Value | | Percentage | | Par Value | | Percentage |
| | | | | | | | |
| Retail | | — | | | — | % | | $ | 12,000 | | | 76.8 | % |
| Office | | — | | | — | % | | 3,625 | | | 23.2 | % |
| | | | | | | | |
| | | | | | | | |
| | | | | | | | |
| | | | | | | | |
| Total | | $ | — | | | — | % | | $ | 15,625 | | | 100.0 | % |
| | | | | | | | | | | | | | | | | | | | | | | | | | |
| | December 31, 2023 | | December 31, 2022 |
| Loan Region | | Par Value | | Percentage | | Par Value | | Percentage |
| Southeast | | $ | — | | | — | % | | $ | 15,625 | | | 100.0 | % |
| | | | | | | | |
| | | | | | | | |
| | | | | | | | |
| | | | | | | | |
| | | | | | | | |
| | | | | | | | |
| | | | | | | | |
FRANKLIN BSP REALTY TRUST, INC.
NOTES TO CONSOLIDATED FINANCIAL STATEMENTS
December 31, 20212023
Note 4 - Real Estate Securities
Real Estate Securities Classified As Trading
As of December 31, 20212023, the Company did not hold any real estate securities available for sale, measured at fair value. The following is a summary of the Company's real estate securities, available for sale, measures at fair valueclassified as of December 31, 2020 (dollars in thousands):
| | | | | | | | | | | | | | | | | | | | | | | | | | |
| December 31, 2020 |
| Type | | Interest Rate | | Maturity | | Par Value | | Fair Value |
| CMBS 1 | | 3.0% | | 5/15/2022 | | $13,250 | | $12,657 |
| CMBS 2 | | 2.2% | | 6/26/2025 | | 10,800 | | 10,335 |
| CMBS 3 | | 2.5% | | 2/15/2036 | | 40,000 | | 38,292 |
| CMBS 4 | | 1.9% | | 6/15/2037 | | 8,000 | | 7,892 |
| CMBS 5 | | 2.1% | | 9/15/2037 | | 24,000 | | 23,297 |
| CMBS 6 | | 2.3% | | 6/15/2034 | | 12,000 | | 11,580 |
| CMBS 7 | | 1.5% | | 12/15/2036 | | 20,000 | | 18,975 |
| CMBS 8 | | 1.8% | | 12/15/2036 | | 25,000 | | 23,268 |
| CMBS 9 | | 2.3% | | 3/15/2035 | | 25,665 | | 24,840 |
The Company classified its CMBS investments as available for sale and reported them at fair value in the consolidated balance sheets with changes in fair value recorded in accumulated other comprehensive income/(loss) as of December 31, 2020. The weighted average contractual maturity for CLO investments included within the CMBS portfolio as of December 31, 2020 was 14 years. The weighted average contractual maturity for single asset single borrower "SASB" investments as of December 31, 2020 was 14 years.
The following table shows the amortized cost, allowance for expected credit losses, unrealized gain/(loss) and fair value of the Company's CMBS investments by investment type as of December 31, 2020 (dollars in thousands):
| | | | | | | | | | | | | | | | | | | | | | | | | | | | | | | | |
| | Amortized Cost | | Credit Loss Allowance | | Unrealized Gain | | Unrealized Loss | | Fair Value |
| December 31, 2020 | | | | | | | | | | |
| CLO | | $ | 123,444 | | | $ | — | | | $ | — | | | (4,888) | | | $ | 118,556 | |
| SASB | | 55,948 | | | — | | | — | | | (3,368) | | | 52,580 | |
| Total | | $ | 179,392 | | | $ | — | | | $ | — | | | $ | (8,256) | | | $ | 171,136 | |
As of December 31, 2021 the Company did not hold any real estate securities, CMBS. As of December 31, 2020, the Company held 9 CMBS positions with an amortized cost basis of $179.4 million and an unrealized loss of $8.3 million of which 7 positions had an unrealized loss for a period greater than twelve months.
FRANKLIN BSP REALTY TRUST, INC.
NOTES TO CONSOLIDATED FINANCIAL STATEMENTS
December 31, 2021
The following table provides information on the unrealized losses and fair value on the Company's real estate securities, CMBS, available for sale that were in an unrealized loss position, and for which an allowance for credit losses has not been recorded, in each case as of December 31, 2020 (amounts in thousands):
| | | | | | | | | | | | | | | | | | | | | | | | | |
| Fair Value | | Unrealized Loss | | |
| Securities with an unrealized loss less than 12 months | | Securities with an unrealized loss greater than 12 months | | Securities with an unrealized loss less than 12 months | | Securities with an unrealized loss greater than 12 months | | |
| December 31, 2020 | | | | | | | | | |
| CLOs | $ | 63,131 | | | $ | 55,425 | | | $ | (2,824) | | | $ | (2,064) | | | |
| SASB | — | | | 52,580 | | | — | | | (3,368) | | | |
| Total | $ | 63,131 | | | $ | 108,005 | | | $ | (2,824) | | | $ | (5,432) | | | |
As of December 31, 2021 the Company did not hold any real estate securities, CMBS. As of December 31, 2020, there were 7 securities, respectively with unrealized losses for a period greater than twelve months reflected in the table above. After evaluating the securities, the Company concluded that the unrealized losses reflected above were noncredit-related and would be recovered from the securities’ estimated future cash flows. The Company considered a number of factors in reaching this conclusion, including that the Company did not intend to sell the securities, it was not considered more likely than not that we would be forced to sell the securities prior to recovering our amortized cost, the portfolio is made up of investment grade securities of recent originations and higher tranches, and that there were no material credit events that would have caused us to otherwise conclude that the Company would not recover our cost. The allowance for credit losses is calculated using a discounted cash flow approach and is measured as the difference between the original cash flows expected to be collected to the revised cash flows expected to be collected discounted using the effective interest rate, limited by the amount that the fair value is less than the amortized cost basis. Significant judgment is used in projecting cash flows. As a result, actual income and/or credit losses could be materially different from what is currently projected and/or reported.
The following table provides information on the amounts of gain/(loss) on the Company's real estate securities, CMBS, available for sale, recorded in other comprehensive income (dollars in thousands): | | | | | | | | | | | | | | | | | | | | |
| | Year Ended December 31, |
| | 2021 | | 2020 | | 2019 |
| Unrealized gain/(loss) available for sale securities | | $ | — | | | $ | (8,026) | | | $ | (978) | |
| Reclassification of net (gain)/loss on available for sale securities included in net income (loss) | | 8,256 | | | 748 | | | — | |
| Unrealized gain/(loss) available for sale securities, net of reclassification adjustment | | $ | 8,256 | | | $ | (7,278) | | | $ | (978) | |
The amounts reclassified for net (gain)/loss on available for sale securities are included in the realized (gain)/loss on sale of real estate securities in the Company's consolidated statements of operations. The Company's unrealized gain/(loss) on available for sale securities is net of tax. Due to the Company's designation as a REIT, there was no tax impact on unrealized gain/(loss) on available for sale securities.
The deterioration in fair value of real estate securities for both collateralized loan obligations and other securities as of December 31, 2020 can be attributed mainly to the market down-turn and volatility as a result of high unemployment and credit uncertainties related to the outbreak of COVID-19.
FRANKLIN BSP REALTY TRUST, INC.
NOTES TO CONSOLIDATED FINANCIAL STATEMENTS
December 31, 2021
Real Estate Securities Classified As Tradingtrading.
The following is a summary of the Company's real estate mortgage backed securities ("RMBS")ARMs classified by collateral type and interest rate characteristics as of December 31, 2022 (dollars in thousands): | | Carrying
Amount | | Average Yield (1) |
| December 31, 2021 | | | |
| | Carrying Amount | | | | Carrying Amount | | Average Yield (1) |
| December 31, 2022 | |
| Agency Securities: | |
| Agency Securities: | |
| Agency Securities: | Agency Securities: | |
| Fannie Mae/Freddie Mac ARMs | Fannie Mae/Freddie Mac ARMs | $ | 4,246,803 | | | 2.23 | % |
| Ginnie Mae ARMs | 320,068 | | | 2.72 | % |
| $ | 4,566,871 | | | 2.26 | % |
| December 31, 2020 | | | |
| Agency Securities: | |
| Fannie Mae/Freddie Mac ARMs | Fannie Mae/Freddie Mac ARMs | $ | — | | | — | % |
| Ginnie Mae ARMs | — | | | — | % |
| $ | — | | | — | % |
| Fannie Mae/Freddie Mac ARMs | | | $ | 235,728 | | | 2.42 | % |
________________________
(1) Average yield is presented for the year then ended, and is based on the cash component of interest income expressed as a percentage on average cost basis (the “cash yield”).
On October 19, 2021,During the Company completedyear ended December 31, 2023, the Capstead merger pursuant to which the Company acquired a portfolio of adjustable-rate mortgage ("ARM") securities issued and guaranteed by government sponsored enterprises, either Fannie Mae or Freddie Mac, or by an agencycarrying amount of the federal government, Ginnie Mae. Together, these securities are referredCompany's ARMs portfolio declined due to as “Agency Securities,” and are considered to have limited, if any, credit risk because the timely payment(i) $17.6 million of principal paydowns, (ii) $218.2 million of sales, and interest is guaranteed. The maturity(iii) $0.6 million of Agency Securities is directly affected by prepaymentsnet trading losses, related to principal paydowns, changes in market values and sales of these securities. During the year ended December 31, 2022, the carrying amount of the Company's ARMs portfolio declined due to (i) $480.2 million of principal on the underlying mortgage loans. Consequently, actual maturities will be significantly shorter than the portfolio’s weighted average contractual maturitypaydowns, (ii) $3.8 billion of 310 months.
sales, and (iii) $119.2 million of net trading losses related to principal paydowns, changes in market values and sales of these securities. The Company'snet trading gains/losses on ARM Agency Securities are backed by residential mortgage loans that have coupon interest rates that adjust at least annually to more current interest rates or begin doing so after an initial fixed-rate period. Afterwere included in Trading gain/(loss) in the initial fixed-rate period, if applicable, mortgage loans underlying ARM securities typically either (i) adjust annually based on specified margins over the one-year London interbank offered rate (“LIBOR”) or the one-year Constant Maturity U.S. Treasury Note Rate (“CMT”), (ii) adjust semiannually based on specified margins over six-month LIBOR or the six-month Secured Overnight Financing Rate (“SOFR”), or (iii) adjust monthly based on specified margins over indices such as one-month LIBOR, the Eleventh District Federal Reserve Bank Costconsolidated statements of Funds Index, or overoperations.
Real Estate Securities Classified As Available For Sale
The following is a rolling twelve month averagesummary of the one-year CMT index, usually subject to periodicCompany's real estate securities, available for sale, measured at fair value as of December 31, 2023 and lifetime limits, or caps, on2022 (dollars in thousands): | | | | | | | | | | | | | | | | | | | | | | | | | | | | | | | | | | | | | | |
| | CRE CLO Bonds |
| | Number of Bonds | | Benchmark Interest Rate | | Weighted Average Interest Rate | | Weighted Average Contractual Maturity (years) | | Par Value | | Fair Value |
| December 31, 2023 | | 7 | | 1 Month SOFR | | 8.12% | | 12.2 | | $ | 243,340 | | | $ | 242,569 | |
| December 31, 2022 | | 7 | | 1 Month SOFR | | 7.55% | | 15.4 | | $ | 221,000 | | | $ | 221,025 | |
The Company classified its CRE CLO bonds as available for sale and reports them at fair value in the amount of such adjustments during any single interest rate adjustment periodconsolidated balance sheets with changes in fair value recorded in Accumulated other comprehensive income/(loss) in the consolidated balance sheets.
The following table shows the amortized cost, allowance for expected credit losses, unrealized gain/(loss) and over the contractual termfair value of the underlying loans.Company's CRE CLO bonds by investment type as of December 31, 2023 and 2022 (dollars in thousands):
During 2021, | | | | | | | | | | | | | | | | | | | | | | | | | | | | | | | | |
| | Amortized Cost | | Credit Loss Allowance | | Unrealized Gain | | Unrealized (Loss) | | Fair Value |
| December 31, 2023 | | $ | 243,272 | | | $ | — | | | 74 | | | (777) | | | $ | 242,569 | |
| December 31, 2022 | | $ | 220,635 | | | $ | — | | | $ | 833 | | | (443) | | | $ | 221,025 | |
As of December 31, 2023, the Company sold trading securities using the specific identification method for proceeds totaling $1.9 billion recognizing $0.1held seven CRE CLO bonds with an amortized cost basis of $243.3 million and a net unrealized loss of $0.7 million, five of which were held in net realized gains. Subsequent to year end,a gross unrealized loss position of $0.8 million. As of December 31, 2022, the Company sold trading securities usingheld seven CRE CLO bonds with an amortized cost basis of $220.6 million and a net unrealized gain of $0.39 million, three of which were held in a gross unrealized loss position of $0.44 million. As of December 31, 2023 and 2022, zero positions had an unrealized loss for a period greater than twelve months. As of December 31, 2023 and 2022, the same methodfair value of the Company's CRE CLO bonds that were in an unrealized loss position for proceeds totaling $1.8 billion recognizing $12less than twelve months, and for which an allowance for credit loss has not been recorded was $184.2 million in net realized losses. The Company did not own any trading securities during 2020 or 2019.and $113.7 million, respectively.
FRANKLIN BSP REALTY TRUST, INC.
NOTES TO CONSOLIDATED FINANCIAL STATEMENTS
December 31, 20212023
Note 5 - Real Estate Owned
Real Estate Owned, Held for Investment
The following table summarizes the Company's real estate owned, held for investment assets as of December 31, 20212023 and 2022 (dollars in thousands): | | | | | | | | | | | | | | | | | | | | | | | | | | | | | | | | | | | | | | | | | | | | |
| As of December 31, 2021 | | | | | | | | |
| Acquisition Date | | Property Type | | Primary Location(s) | | Land | | Building and Improvements | | Furniture, Fixtures and Equipment | | Accumulated Depreciation | | Real Estate Owned, net |
September 2021 (1) | | Industrial | | Jeffersonville, GA | | $ | 3,436 | | | $ | 84,259 | | | $ | 2,928 | | | $ | (575) | | | $ | 90,048 | |
| | | | | | $ | 3,436 | | | $ | 84,259 | | | $ | 2,928 | | | $ | (575) | | | $ | 90,048 | |
| | | | | | | | | | | | | | | | | | | | | | | | | | | | | | | | | | | | | | | | | | | | |
| As of December 31, 2023 | | | | | | | | |
Acquisition Date | | Property Type | | Primary Location(s) | | Land | | Building and Improvements | | Furniture, Fixtures and Equipment | | Accumulated Depreciation | | Real Estate Owned, net |
September 2021(1) | | Industrial | | Jeffersonville, GA | | $ | 3,436 | | | $ | 84,259 | | | $ | 2,928 | | | $ | (5,179) | | | $ | 85,444 | |
August 2023(2) | | Office | | Portland, OR | | 16,479 | | | 2,065 | | | — | | | (13) | | | 18,531 | |
October 2023(3) | | Multifamily | | Lubbock, TX | | 1,618 | | | 10,076 | | | 185 | | | (24) | | | 11,855 | |
| | | | | | $ | 21,533 | | | $ | 96,400 | | | $ | 3,113 | | | $ | (5,216) | | | $ | 115,830 | |
________________________ See notes below. | | | | | | | | | | | | | | | | | | | | | | | | | | | | | | | | | | | | | | | | | | | | |
| As of December 31, 2022 | | | | | | | | |
Acquisition Date | | Property Type | | Primary Location(s) | | Land | | Building and Improvements | | Furniture, Fixtures and Equipment | | Accumulated Depreciation | | Real Estate Owned, net |
September 2021(1) | | Industrial | | Jeffersonville, GA | | $ | 3,436 | | | $ | 84,259 | | | $ | 2,928 | | | $ | (2,877) | | | $ | 87,746 | |
Various(4) | | Retail | | Various | | 9,105 | | | 31,036 | | | — | | | (115) | | | 40,026 | |
| | | | | | $ | 12,541 | | | $ | 115,295 | | | $ | 2,928 | | | $ | (2,992) | | | $ | 127,772 | |
________________________
(1) (1Refer to Note 2 for) In the useful lifethird quarter of the above asset.
The following table summarizes the Company's real estate owned assets as of December 31, 2020 (dollars in thousands): | | | | | | | | | | | | | | | | | | | | | | | | | | | | | | | | | | | | | | | | | | | | |
| As of December 31, 2020 | | | | | | | | |
| Acquisition Date | | Property Type | | Primary Location(s) | | Land | | Building and Improvements | | Furniture, Fixtures and Equipment | | Accumulated Depreciation | | Real Estate Owned, net |
October 2019 (1) | | Office | | Jeffersonville, IN | | $ | 1,887 | | | $ | 21,989 | | | $ | 3,565 | | | $ | (931) | | | $ | 26,510 | |
| | | | | | $ | 1,887 | | | $ | 21,989 | | | $ | 3,565 | | | $ | (931) | | | $ | 26,510 | |
________________________(1) Refer to Note 2 for the useful life of the above asset.
Depreciation expense for the years ended December 31, 2021 and 2020 totaled $1.0 million.
During the year ended December 31, 2021, the Company sold the real estate owned asset in Jeffersonville, IN to a third party, resulting in a $8.6 million gain recognized within Realized gain/loss on sale of real estate owned assets, held for sale in the consolidated statements of operations.
In August 2021, the Company and an investment fund managed byaffiliate of the AdvisorCompany entered into a joint venture agreement and formed a joint venture entity, Jeffersonville Member, LLC (the "Jeffersonville JV"“Jeffersonville JV”) to acquire a $139.5 million triple net lease property in Jeffersonville, GA. Refer to Note 11 - Related Party Transactions and Arrangements for details.
(2) In August 2023, the Company obtained, through deed-in-lieu of foreclosure, an office property located in Portland, OR in lieu of repayment of the associated loan.
(3) In October 2023, the Company obtained, through deed-in-lieu of foreclosure, a multifamily property located in Lubbock, TX in lieu of repayment of the associated loan.
(4) As of December 31, 2023 and 2022, the Company foreclosed upon 24 and ten retail properties respectively, located throughout the United States of America. During the year ended December 31, 2023, the Company classified the entire portfolio consisting of the 24 retail properties as Real estate owned, held for sale in the consolidated balance sheets as discussed in the paragraphs below. Refer to Note 11 - Related Party Transactions and Arrangements for details.
Depreciation expense for the years ended December 31, 2023 and 2022 totaled $3.3 million and $2.4 million, respectively.
Real Estate Owned, Held for Sale
The following table summarizes the Company's Real estate owned, held for sale assets and liabilities as of December 31, 2023 and 2022 (dollars in thousands):
| | | | | | | | | | | | | | | | | | | | | | | | |
| | | | As of December 31, 2023 | | | | |
| Property Type | | Primary Location(s) | | Assets, Net | | Liabilities, Net | | | | |
| Retail | | Various | | $ | 103,657 | | | $ | 12,297 | | | | | |
| | | | | | | | | | |
| | | | As of December 31, 2022 | | | | |
| Property Type | | Primary Location(s) | | Assets, Net | | Liabilities, Net | | | | |
| Multifamily | | New Rochelle, NY | | $ | 23,520 | | | $ | — | | | | | |
| Office | | St. Louis, MO | | 12,977 | | | — | | | | | |
| | | | $ | 36,497 | | | $ | — | | | | | |
During the year ended December 31, 2022, the Company entered into agreements with two borrowers to voluntarily transfer their assets in exchange for the removal of the borrowers' obligation to repay all of the associated commercial mortgage
FRANKLIN BSP REALTY TRUST, INC.
NOTES TO CONSOLIDATED FINANCIAL STATEMENTS
December 31, 2023
loans receivable with an amortized cost of $36.9 million, in aggregate, provided by the Company. One of the voluntary transfers collateralized by a multifamily portfolio was the result of the borrower experiencing financial difficulty and the recorded investment in the receivable was more than the fair value, less estimated costs to sell, for the collateral collected. Therefore, the voluntary transfer qualified as a TDR. The Company hasaccounted for both voluntary transfers and the real estate owned acquired as asset acquisitions. The voluntary transfers resulted in a 79% interesttotal realized loss of $0.4 million, in aggregate, and was recognized in Realized (gain)/loss on sale of commercial mortgage loan, held for sale in the Jeffersonville JV, whileconsolidated statements of operations for the affiliated fund hasyear ended December 31, 2022. As of December 31, 2022, the Company designated the properties included within the real estate owned business segment as held for sale in accordance with ASC 360. As of December 31, 2022, the Company recognized an unrealized loss of $0.7 million on real estate owned, held for sale assets resulting in a 21% interest. Thecarrying value of $36.5 million, in aggregate. During the year ended December 31, 2023, the Company investedsold the two properties for an aggregate amount of $34.8 million resulting in a total loss of $109.8$3.3 million made upincluded in Gain/(loss) on other real estate investments in the consolidated statements of $88.7 million in debtoperations.
In November 2022, the Company and $21.1 million in equity, representing 79%an affiliate of the ownership interestCompany entered into a joint venture agreement and formed a joint venture entity, BSPRT Walgreens Portfolio, LLC (the "Walgreens JV") to assume the retail Walgreens Portfolio consisting of 24 retail properties with various locations throughout the United States. Refer to Note 11 - Related Party Transactions and Arrangements. As of December 31, 2022, through foreclosures, the Company had acquired ten of the 24 properties, and subsequently acquired the remaining 14 properties during the year ended December 31, 2023. During the third quarter of 2023, the Company classified the real estate owned assets and liabilities as held for sale in accordance with ASC 360 - Property, Plant, and Equipment and recognized an impairment loss of $4.0 million included in Gain/(loss) on other real estate investments in the Jeffersonville JV. The affiliated fund made upconsolidated statements of operations. Refer to Note 12 - Fair Value of Financial Instruments for discussion on the properties fair value measurement. In addition, the Company sold one of the retail properties in the portfolio in September 2023, resulting in a loss of $22 thousand included in Gain/(loss) on other real estate investments in the consolidated statements of operations. As of December 31, 2023, the Company's real estate owned held for sale assets consisted of the remaining $29.8 million composed of a $24.0 million mortgage note payable and $5.7 million23 retail properties in equity. The Company has control of Jeffersonville JV with 79% ownership and, therefore, consolidates Jeffersonville JV on its consolidated balance sheet. The Company's $88.7 million mortgage note payable to Jeffersonville JV is eliminated in consolidation (see Note 7 - Debt).the Walgreens Portfolio.
FRANKLIN BSP REALTY TRUST, INC.
NOTES TO CONSOLIDATED FINANCIAL STATEMENTS
December 31, 20212023
Note 6 - Leases
Intangible Lease AssetAssets and Liabilities, Held for Investment
The following table summarizes the Company's identified intangible lease assetassets (primarily in-place leases) and liabilities (primarily below-market leases) recognized in the consolidated balance sheets as of December 31, 20212023 and 2022 (dollars in thousands):
| | | | | | | | | | | | | | | | | | | | | | | | | | | | | | | | |
| Acquisition Date | | Property Type | | Primary Location(s) | | Intangible Lease Asset, Gross | | Accumulated Amortization | | Intangible Lease Asset, Net of Amortization |
| September 2021 | | Industrial | | Jeffersonville, GA | | $ | 49,192 | | | $ | (720) | | | $ | 48,472 | |
| | | | | | $ | 49,192 | | | $ | (720) | | | $ | 48,472 | |
The following table summarizes the Company's intangible lease asset recognized in the consolidated balance sheets as of December 31, 2020 (dollars in thousands):
| | | | | | | | | | | | | | | | | | | | | | | | | | | | | | | | |
| Acquisition Date | | Property Type | | Primary Location(s) | | Intangible Lease Asset, Gross | | Accumulated Amortization | | Intangible Lease Asset, Net of Amortization |
| October 2019 | | Office | | Jeffersonville, IN | | $ | 14,509 | | | $ | (963) | | | $ | 13,546 | |
| | | | | | $ | 14,509 | | | $ | (963) | | | $ | 13,546 | |
| | | | | | | | | | | | | | |
| Identified intangible assets: | | December 31, 2023 | | December 31, 2022 |
| Gross amount | | $ | 49,285 | | | $ | 58,542 | |
| Accumulated amortization | | $ | (6,492) | | | (3,711) | |
| Total, net | | 42,793 | | | $ | 54,831 | |
| | | | |
| Identified intangible liabilities: | | | | |
| Gross amount | | $ | — | | | $ | 6,507 | |
| Accumulated amortization | | — | | | (79) | |
| Total, net | | $ | — | | | $ | 6,428 | |
Rental Income
On September 17, 2021, the Company purchased an industrial facility that was subject to an existing triple net lease. The minimum rental amount due under the lease is subject to annual increases of 2.0%. The initial term of the lease expires in 2038 and contains renewal options for 4 consecutive five-year terms. The remaining lease term is 16.8 years. Rental income for this operating lease for the year ended December 31, 2021 totaled $2.6 million and is included in Revenue from real estate owned in the consolidated statements of operations.
On October 15, 2019, the Company purchased an office building that was subject to an existing triple net lease. The minimum rental amount due under the lease was subject to annual increases of 1.5%. The initial term of the lease expires in 2037 and contained renewal options for 4 consecutive five-year terms. The Company sold the real estate owned asset during the year ended December 31, 2021 (see Note 5 - Real Estate Owned). Rental income for this lease for the years ended December 31, 20212023 and 20202022 totaled $2.1$17.9 million and $2.9$9.6 million, respectively. Rental income is included in Revenue from real estate owned in the consolidated statements of operations.
The following table summarizes the Company's schedule of future minimum rents on its real estate owned, held for investment properties, to be received under the lease (dollars in thousands): | | | | | | | | |
| Minimum Rents | | December 31, 2021 |
| 2022 | | $ | 9,248 | |
| 2023 | | 9,248 | |
| 2024 | | 9,248 | |
| 2025 | | 9,248 | |
| 2026 and beyond | | 118,683 | |
| Total minimum rent | | $ | 155,675 | |
| | | | | | | | |
| Future Minimum Rents | | December 31, 2023 |
| 2024 | | $ | 8,616 | |
| 2025 | | 8,374 | |
| 2026 | | 8,539 | |
| 2027 | | 8,710 | |
| 2028 | | 8,884 | |
| 2029 and beyond | | 97,388 | |
| Total future minimum rent | | $ | 140,511 | |
Amortization Expense
Intangible lease assets are amortized using the straight-line method over the contractual liferemaining term of the lease, of a period up to 20 years.lease. The weighted average life of the intangible assetassets as of December 31, 20212023 is approximately 16.814.8 years. Amortization expense for the years ended December 31, 20212023 and 20202022 totaled $1.1$3.8 million and $0.8$3.0 million, respectively.
Amortization of acquired below (above) market leases, net of acquired above-market leases, resulted in a decrease to rental revenues of $0.9 million for the year ended December 31, 2023 and an increase to rental revenues of $0.1 million for the year ended December 31, 2022, respectively.
The following table summarizes the Company's expected amortization of other identified intangible assets, net over the next five years, exclusive of intangible assets that are held for sale, assuming no further acquisitions or dispositions (dollars in thousands):
| | | | | | | | |
| Amortization Expense - Other identified intangible assets | | December 31, 2023 |
| 2024 | | $ | 2,880 | |
| 2025 | | 2,880 | |
| 2026 | | 2,880 | |
| 2027 | | 2,880 | |
| 2028 | | 2,880 | |
FRANKLIN BSP REALTY TRUST, INC.
NOTES TO CONSOLIDATED FINANCIAL STATEMENTS
December 31, 20212023
The following table summarizes the Company's expected amortization for intangible assets over the next five years, assuming no further acquisitions or dispositions (dollars in thousands):
| | | | | | | | |
| | December 31, 2021 |
| 2022 | | $ | (2,880) | |
| 2023 | | (2,880) | |
| 2024 | | (2,880) | |
| 2025 | | (2,880) | |
| 2026 | | (2,880) | |
Note 7 - Debt
Below is a summary of the Company's Repurchase Agreementsfacilities and revolving credit facilities - Commercial Mortgage Loans
The Company has entered into repurchase facilities with JPMorgan Chase Bank, National Association (the "JPM commercial mortgage loans ("Repo
Facility"and Revolving Credit Facilities"),
Barclays Bank PLC (the "Barclays Revolver Facility"Mortgage note payable, Other financing and
the "Barclays Repo Facility"), Wells Fargo Bank, National Association (the "WF Repo Facility"),Unsecured debt as of December 31, 2023 and
Credit Suisse AG (the "CS Repo Facility"2022 (dollars in thousands): | | | | | | | | | | | | | | | | | | | | | | | | | | | | | |
| As of December 31, 2023 |
Repo and revolving credit facilities - commercial mortgage loans(2): | Capacity | | Amount Outstanding | | Interest Expense(1) | | Ending Weighted Average Interest Rate | | Term Maturity |
JPM Repo Facility (3) | $ | 500,000 | | | $ | 108,574 | | | $ | 22,401 | | | 7.90 | % | | 07/2026 |
| | | | | | | | | |
Atlas Repo Facility (4) | 600,000 | | | 52,864 | | | 6,603 | | | 7.68 | % | | 03/2024 |
WF Repo Facility (5) | 400,000 | | | 71,730 | | | 9,580 | | | 7.85 | % | | 10/2025 |
Barclays Revolver Facility (6) | 250,000 | | | — | | | 940 | | | N/A | | 09/2024 |
Barclays Repo Facility (7) | 500,000 | | | 66,539 | | | 11,616 | | | 7.22 | % | | 03/2025 |
Churchill Repo Facility (8) | 225,000 | | | — | | | 30 | | | N/A | | N/A |
| Total | $ | 2,475,000 | | | $ | 299,707 | | | $ | 51,170 | | | 7.70 | % | | |
| Mortgage note payable: | | | | | | | | | |
Debt related to our REO (9) | N/A | | $ | 23,998 | | | $ | 1,982 | | | 8.48 | % | | 10/2024 |
| Other Financing | | | | | | | | | |
Other Financings (10) | N/A | | $ | 36,534 | | | $ | 5,330 | | | 7.36 | % | | Various(9) |
Unsecured Debt (11) | | | | | | | | | |
| Junior subordinated notes maturing in: | | | | | | | | | |
October 2035 (12) | N/A | | $ | 17,047 | | | $ | 1,940 | | | 9.15 | % | | 10/2035 |
| December 2035 | N/A | | $ | 39,550 | | | $ | 3,519 | | | 8.95 | % | | 12/2035 |
| September 2036 | N/A | | $ | 24,698 | | | $ | 2,199 | | | 8.95 | % | | 09/2036 |
| Total/Weighted average | N/A | | $ | 81,295 | | | $ | 7,658 | | | 8.99 | % | | |
________________________
See notes below.
FRANKLIN BSP REALTY TRUST, INC.
NOTES TO CONSOLIDATED FINANCIAL STATEMENTS
December 31, 2023
| | | | | | | | | | | | | | | | | | | | | | | | | | | | | | | | |
| | As of December 31, 2022 |
Repo and revolving credit facilities - commercial mortgage loans(2): | | Capacity | | Amount Outstanding | | Interest Expense(1) | | Ending Weighted Average Interest Rate | | Term Maturity |
JPM Repo Facility (3) | | $ | 500,000 | | | $ | 275,423 | | | $ | 11,773 | | | 7.42 | % | | 10/2024 |
| | | | | | | | | | |
Atlas Repo Facility (4) | | 600,000 | | | 168,046 | | | 8,676 | | | 7.12 | % | | 10/2023 |
WF Repo Facility (5) | | 500,000 | | | 79,807 | | | 7,492 | | | 7.11 | % | | 11/2023 |
Barclays Revolver Facility (6) | | 250,000 | | | — | | | 1,267 | | | N/A | | 09/2023 |
Barclays Repo Facility (7) | | 500,000 | | | 157,583 | | | 8,997 | | | 6.75 | % | | 03/2025 |
| Total | | $ | 2,350,000 | | | $ | 680,859 | | | $ | 38,205 | | | 7.16 | % | | |
| Mortgage note payable: | | | | | | | | | | |
Debt related to our REO (9) | | N/A | | $ | 23,998 | | | $ | 1,185 | | | 7.32 | % | | 10/2024 |
| Other Financing | | | | | | | | | | |
Other Financings (10) | | N/A | | $ | 76,301 | | | $ | 3,069 | | | 6.17 | % | | Various |
Unsecured Debt (11) | | | | | | | | | | |
| Junior subordinated notes maturing in: | | | | | | | | | | |
| October 2035 | | N/A | | $ | 34,508 | | | $ | 2,046 | | | 8.25 | % | | 10/2035 |
| December 2035 | | N/A | | 39,513 | | | 2,202 | | | 8.39 | % | | 12/2035 |
| September 2036 | | N/A | | 24,674 | | | 1,375 | | | 8.39 | % | | 09/2036 |
| Total/Weighted average | | N/A | | $ | 98,695 | | | $ | 5,623 | | | 8.34 | % | | |
________________________
(1) Represents year to date expense and together with JPM Repo Facility, USB Repo Facility, WF Repo Facility, Barclays Revolver Facility, and Barclays Repo Facility, the "Repo Facilities").includes amortization of deferred financing costs.
(2) The Repo Facilities are financing sources through which the Company may pledge one or more mortgage loans to the financing entity in exchange for funds typically at an advance rate of between 65%60% to 80%75% of the principal amount of the mortgage loan being pledged.
The details of the Company's Repo Facilities at December 31, 2021 and December 31, 2020 These loans are as follows (dollars in thousands): | | | | | | | | | | | | | | | | | | | | | | | | | | | | | |
| As of December 31, 2021 | | | | | | | | | |
| Repurchase Facility | Committed Financing | | Amount Outstanding | | Interest Expense(1) | | Ending Weighted Average Interest Rate | | Term Maturity |
| JPM Repo Facility | $ | 400,000 | | | $ | 136,470 | | | $ | 5,178 | | | 2.13 | % | | 10/6/2022 |
| | | | | | | | | |
CS Repo Facility (2) | 300,000 | | | 137,364 | | | 3,446 | | | 2.43 | % | | 9/30/2022 |
WF Repo Facility (3) | 450,000 | | | 186,734 | | | 2,090 | | | 1.64 | % | | 11/21/2023 |
Barclays Revolver Facility (4) | 250,000 | | | 166,700 | | | 1,976 | | | 6.12 | % | | 9/20/2023 |
Barclays Repo Facility (5) | 500,000 | | | 392,332 | | | 4,057 | | | 1.76 | % | | 3/14/2025 |
| Total | $ | 1,900,000 | | | $ | 1,019,600 | | | $ | 16,747 | | | | | |
________________________
(1) For the year ended December 31, 2021. Includes amortization of deferred financing costs.
(2) On August 12, 2021, the Company exercised the extension option upon the satisfaction of certain conditions, and extended the term maturity to September 30, 2022. Additionally, on November 3, 2021 the committed financing amount was amended from $200 million to $300 million with the option to increase to $400 millionall floating rate at the Company's discretion.
(3) On November 19, 2021 the committed financing amount was increased from $275 million to $450 million. There are 3 more one-year extension options available at the Company's discretion.
(4) On September 8, 2021, the Company amended the maturity date to September 20, 2023. On December 1, 2021 the committed financing amount was increased from $100 million to $250 million. The Company may increase the total commitment amount bySecured Overnight Financing Rate ("SOFR") plus an amount between $100 million and $150 million for three month intervals, on an unlimited basis prior to maturity.
(5) On December 3, 2021 the Company amended the maturity date to March 14, 2025 and the committed financing amount was increased from $300 million to $500 million. There are 2 one-year extension options available at the Company's discretion.
FRANKLIN BSP REALTY TRUST, INC.
NOTES TO CONSOLIDATED FINANCIAL STATEMENTS
December 31, 2021
| | | | | | | | | | | | | | | | | | | | | | | | | | | | | | | | |
| As of December 31, 2020 | | | | | | | | | | |
| Repurchase Facility | | Committed Financing | | Amount Outstanding | | Interest Expense(1) | | Ending Weighted Average Interest Rate | | Term Maturity |
JPM Repo Facility (2) | | $ | 300,000 | | | $ | 113,884 | | | $ | 5,020 | | | 2.54 | % | | 10/6/2022 |
USB Repo Facility (3) | | 100,000 | | | 5,775 | | | 599 | | | 2.40 | % | | 6/15/2021 |
CS Repo Facility (4) | | 200,000 | | | 106,971 | | | 3,539 | | | 2.84 | % | | 8/19/2021 |
WF Repo Facility (5) | | 175,000 | | | 27,150 | | | 1,041 | | | 2.50 | % | | 11/21/2021 |
Barclays Revolver Facility (6) | | 100,000 | | | — | | | 387 | | | N/A | | 9/20/2021 |
Barclays Facility (7) | | 300,000 | | | 22,560 | | | 1,046 | | | 2.51 | % | | 3/15/2022 |
| Total | | $ | 1,175,000 | | | $ | 276,340 | | | $ | 11,632 | | | | | |
________________________
(1) For the year ended December 31, 2020. Includes amortization of deferred financing costs.
(2) On October 6, 2020 the maturity date was amended to October 6, 2022.
(3) On June 9, 2020, the Company exercised the extension option upon the satisfaction of certain conditions, and extended the term maturity to June 15, 2021.
(4) On August 28, 2020, the Company exercised the extension option upon the satisfaction of certain conditions, and extended the term maturity to August 19, 2021.applicable spread. Additionally, in 2020 the committed financing amount was downsized from $300 million to $200 million.
(5) On November 17, 2020, the Company exercised the extension option upon the satisfaction of certain conditions, and extended the term maturity to November 21, 2021. There are 2 more one-year extension options available at the Company's discretion.
(6) There is 1 one-year extension option available at the Company's discretion.
(7) Includes 2 one-year extensions at the Company's option.
The Company expects to use the advances from the Repo Facilities to finance the acquisition or origination of eligible loans, including first mortgage loans, subordinated mortgage loans, mezzanine loans and participation interests therein.
The RepoRevolving Credit Facilities generally provide that in the event of a decrease in the value of the Company's collateral, the lenders can demand additional collateral. As of December 31, 20212023 and December 31, 2020,2022, the Company is in compliance with all debt covenants.
Other financing and loan participation - Commercial Mortgage Loans
(3)On March 23, 2020,July 27, 2023, the Company extended the maturity date from October 6, 2023 to July 26, 2026 with a one-year extension option.
(4) During the first quarter of 2023, this repurchase facility was transferred $15.2from Credit Suisse to Atlas SP partners. On January 4, 2024, the Company extended the maturity date to January 5, 2026 with a one-year extension option. Additionally, the committed financing was decreased from $600 million to $350 million.
(5) On October 25, 2023, the committed financing was decreased from $500 million to $400 million. Additionally, the maturity date was extended to November 21, 2025. There are two more one-year extension options.
(6)The Company may increase the total commitment amount by an amount between $100 million and $150 million for three month intervals, on an unlimited basis prior to maturity. Additionally, on April 24, 2023, the Company extended the maturity date to September 20, 2024.
(7) There are two one-year extension options.
(8) On October 12, 2023, the Company entered into a master repurchase agreement ("MRA") with Churchill MRA Funding, with a maximum facility amount of $225 million.
(9) Relates to a mortgage note payable in Jeffersonville JV, a consolidated joint venture. The loan has a principal amount of $112.7 million of its interestwhich $88.7 million of the loan is owned by the Company and was eliminated in a termour consolidated financial statements (see Note 5 - Real Estate Owned).
(10) Comprised of three note-on-note financings via participation agreements. From inception of the loan, to Sterling National Bank ("SNB") via a participation agreement. Since origination, the Company's outstanding loan increased resultantloans could increase as a result of future fundings, leading to an increase in amount outstanding via the participation agreement. The Company incurred $0.9weighted average contractual maturity date of these loans is August 2025.
(11) The notes are currently redeemable, in whole or in part, without penalty, at the Company’s option. Interest paid on unsecured debt, including related derivative cash flows, totaled $7.7 million of interest expense on SNB for the year ended December 31, 2021. As of December 31, 2021 and December 31, 2020 the outstanding participation balance was $37.92023, compared to $5.7 million and $31.4 million, respectively. The loan matures on February 9, 2023.
Mortgage Note Payable
On October 15, 2019, the Company obtained a commercial mortgage loan for $29.2 million related to the real estate owned portfolio. The Company incurred $0.9 million of interest expense for the twelve monthsyear ended December 31, 2021. As of December 31, 2021 the loan has been assumed by the purchaser of the underlying asset and is no longer held by the Company (see Note 5 - Real Estate Owned).
On September 17, 2021, the Company, in connection with the consolidating joint venture (as discussed in Note 5 - Real Estate Owned), originated a $112.7 million mortgage note payable, of which $88.7 million is eliminated in consolidation (see Note 5 - Real Estate Owned). As of December 31, 2021 the Company incurred $0.2 million of interest expense, of which $0.2 million is eliminated in consolidation, for the twelve months ended December 31, 2021. The remaining mortgage note payable of $24 million is included in the consolidated balance sheets under the caption Mortgage note payable. As of December 31, 2021, the loan accrued interest at an annual rate of 3.1% and matures on October 9, 2024.2022, respectively.
FRANKLIN BSP REALTY TRUST, INC.
NOTES TO CONSOLIDATED FINANCIAL STATEMENTS
December 31, 20212023
Unsecured Debt
In(12) During the merger with Capstead, we acquired 30-year junior subordinated notes issued in 2005 and 2006 and maturing in 2035 and 2036, with a total face amount of $100 million. Note balances net of deferred issuance costs, and related weighted average interest rates as of the indicated dates (calculated including issuance cost amortization and adjusted for the effects of related derivatives held as cash flow hedges) were as follows (dollars in thousands):
| | | | | | | | | | | | | | | | | | | | | | | | | | |
| | December 31, 2021 | | December 31, 2020 |
| | Borrowings
Outstanding | | Average
Rate | | Borrowings
Outstanding | | Average
Rate |
| Junior subordinated notes maturing in: | | | | | | | | |
| October 2035 ($35,000 face amount) | | $ | 34,470 | | | 7.86 | % | | $ | — | | | — | % |
| December 2035 ($40,000 face amount) | | 39,474 | | | 7.63 | % | | — | | | — | % |
| September 2036 ($25,000 face amount) | | 24,650 | | | 7.67 | % | | — | | | — | % |
| | $ | 98,594 | | | 7.72 | % | | $ | — | | | — | % |
The notes are currently redeemable, in whole or in part, without penalty, at the Company’s option.
Pursuant to a lending and security agreement with Security Benefit Life Insurance Company ("SBL"), which was entered into in February 2020 and amended in March and August 2020, the Company may borrow up to $100.0 million at a rate of one-month LIBOR + 4.5%. The facility has a maturity of February 10, 2023 and is secured by a pledge of equity interests in certain of the Company’s subsidiaries. The Company incurred $2.0 million of interest expense on the lending agreement with SBL for the twelve monthsyear ended December 31, 2021. As2023, the Company had a realized a gain on extinguishment for debt in the amount of December 31, 2021$4.4 million as a result of the outstanding balance was $50.0 million.repurchase of $17.5 million par value of the Company's unsecured debt during the first quarter of 2023 at a price equal to 75% of par value.
Repurchase Agreements - Real Estate Securities
The Company has entered into various Master Repurchase Agreements (the "MRAs") that allow the Company to sell real estate securities while providing a fixed repurchase price for the same real estate securities in the future. The repurchase contracts on each security under an MRA generally mature in 30-90 days and terms are adjusted for current market rates as necessary.
Below is a summary of the Company's MRAs as of December 31, 20212023 and 20202022 (dollars in thousands): | | | | | | | | | | | | | | | | | | | | | | | | | | | | | |
| | | | | | | Weighted Average |
| Counterparty | Amount Outstanding | | Accrued Interest | | Collateral Pledged (1) | | Interest Rate | | Days to Maturity |
| As of December 31, 2021 | | | | | | | | | |
| JP Morgan Securities LLC | $ | 19,025 | | | $ | 261 | | | $ | 24,087 | | | 1.14 | % | | 10 |
| Wells Fargo Securities, LLC | — | | | — | | | — | | | N/A | | N/A |
| Goldman Sachs International | — | | | 37 | | | — | | | N/A | | N/A |
| Barclays Capital Inc. | 15,286 | | | 526 | | | 19,131 | | | 1.21 | % | | 14 |
| Credit Suisse AG | — | | | — | | | — | | | N/A | | N/A |
| Citigroup Global Markets, Inc. | — | | | 81 | | | — | | | N/A | | N/A |
| Total/Weighted Average | $ | 34,311 | | | $ | 905 | | | $ | 43,218 | | | 1.17 | % | | 12 |
| | | | | | | | | |
| As of December 31, 2020 | | | | | | | | | |
| JP Morgan Securities LLC | $ | 33,791 | | | $ | 1,668 | | | $ | 43,612 | | | 1.75 | % | | 31 |
| Wells Fargo Securities, LLC | — | | | 1,057 | | | — | | | N/A | | N/A |
| Goldman Sachs International | 22,440 | | | 455 | | | 30,794 | | | 1.68 | % | | 16 |
| Barclays Capital Inc. | 76,809 | | | 2,102 | | | 97,244 | | | 1.71 | % | | 33 |
| Credit Suisse AG | — | | | 905 | | | — | | | N/A | | N/A |
| Citigroup Global Markets, Inc. | 53,788 | | | 2,532 | | | 71,723 | | | — | | | 29 |
| Total/Weighted Average | $ | 186,828 | | | $ | 8,719 | | | $ | 243,373 | | | 1.71 | % | | 33 |
| | | | | | | | | | | | | | | | | | | | | | | | | | | | | | | | |
| | As of December 31, 2023 |
| Counterparty | | Amount Outstanding | | Interest Expense | | Collateral Pledged (1) | | Weighted Average Interest Rate | | Weighted Average Days to Maturity |
| JP Morgan Securities LLC | | $ | 113,111 | | | $ | 6,717 | | | $ | 127,602 | | | 6.29 | % | | 15 |
| Wells Fargo Securities, LLC | | 8,994 | | | 235 | | | 9,975 | | | 6.14 | % | | 5 |
| | | | | | | | | | |
| Barclays Capital Inc. | | 51,950 | | | 3,371 | | | 58,250 | | | 6.19 | % | | 5 |
| | | | | | | | | | |
| | | | | | | | | | |
| Total/Weighted Average | | $ | 174,055 | | | $ | 10,323 | | | $ | 195,827 | | | 6.25 | % | | 11 |
| | | | | | | | | | |
| | As of December 31, 2022 |
| Counterparty | | Amount Outstanding | | Interest Expense | | Collateral Pledged (1) | | Weighted Average Interest Rate | | Weighted Average Days to Maturity |
| JP Morgan Securities LLC | | $ | 103,513 | | | $ | 1,281 | | | $ | 120,751 | | | 5.34 | % | | 22 |
| | | | | | | | | | |
| | | | | | | | | | |
| Barclays Capital Inc. | | 119,351 | | | 1,646 | | | 144,778 | | | 5.18 | % | | 50 |
| | | | | | | | | | |
| | | | | | | | | | |
| Total/Weighted Average | | $ | 222,864 | | | $ | 2,927 | | | $ | 265,529 | | | 5.25 | % | | 37 |
Table of Contents________________________FRANKLIN BSP REALTY TRUST, INC.
NOTES TO CONSOLIDATED FINANCIAL STATEMENTS
December 31, 2021
________________________
(1) Includes $43.2$27.9 million and $72.2$67.1 million of CLO notes, held by the Company, which is eliminated within the in Real estate securities, available for sale, measured at fair value line of in the consolidated balance sheets as of as of December 31, 20212023 and December 31, 2020,2022, respectively.
Repurchase Agreements - Real Estate Securities Classified As Trading
In the merger with Capstead, we acquiredThe Company did not have any outstanding repurchase agreements -collateralized by real estate securities classified as trading. The Company pledges its Real estate securities classified as trading as collateral forof December 31, 2023. Below is a summary of the Company's repurchase agreements with commercial banks and other financial institutions. collateralized by real estate securities classified as trading included in Repurchase arrangements entered into by the Company involve the sale and a simultaneous agreement to repurchase the transferred assets at a future date and are accounted for as financings. The Company maintains the beneficial interestagreements - real estate securities in the specific securities pledged during the term of each repurchase arrangement and receives the related principal and interest payments.
The terms and conditions of repurchase agreements are negotiated on a transaction-by-transaction basis when each such agreement is initiated or renewed. The amount borrowed is generally equal to the fair value of the securities pledged, as determined by the lending counterparty, less an agreed-upon discount, referred to as a “haircut.” Interest rates are generally fixed based on prevailing rates corresponding to the terms of the borrowings. Interest may be paid monthly or at the termination of an agreement at which time the Company may enter into a new agreement at prevailing haircuts and rates with the same lending counterparty or repay that counterparty and negotiate financing with a different lending counterparty. None of the Company’s lending counterparties are obligated to renew or otherwise enter into new agreements at the conclusion of existing agreements. In response to declines in fair value of pledged securities due to changes in market conditions or the publishing of monthly security pay-down factors, lending counterparties typically require the Company to post additional securities as collateral, pay down borrowings or fund cash margin accounts with the counterparties in order to re-establish the agreed-upon collateral requirements. These actions are referred to as margin calls. Conversely, in response to increases in fair value of pledged securities, the Company routinely margin calls its lending counterparties in order to have previously pledged collateral returned.
Repurchase agreements (and related pledged collateral, including accrued interest receivable), classified by collateral type and remaining maturities, and related weighted average borrowing ratesconsolidated balance sheet as of the indicated dates were as followsDecember 31, 2022 (dollars in thousands):
| | | | | | | | | | | | | | | | | | | | | | | | | | |
| Collateral Type | | Collateral
Carrying
Amount | | Accrued
Interest
Receivable | | Borrowings
Outstanding | | Average
Borrowing
Rates |
| December 31, 2021 | | | | | | | | |
| Repurchase arrangements secured by Agency securities with maturities of 30 days or less | | $ | 4,327,020 | | | $ | 8,908 | | | $ | 4,144,473 | | | 0.13 | % |
| | $ | 4,327,020 | | | $ | 8,908 | | | $ | 4,144,473 | | | 0.13 | % |
| | | | | | | | |
| December 31, 2020 | | | | | | | | |
| Repurchase arrangements secured by Agency securities with maturities of 30 days or less | | $ | — | | | $ | — | | | $ | — | | | — | % |
| | $ | — | | | $ | — | | | $ | — | | | — | |
| | | | | | | | | | | | | | | | | | | | | | | | | | |
| | December 31, 2022 |
| | Amount Outstanding | | Accrued
Interest Receivable | | Collateral Carrying Amount | | Weighted Average
Borrowing
Rates |
| Repurchase arrangements secured by trading securities with maturities of 30 days or less | | $ | 172,144 | | | $ | 544 | | | $ | 180,400 | | | 4.25 | % |
| Repurchase arrangements secured by Agency securities with maturities of 31 to 90 days | | 45,000 | | | 114 | | | 47,210 | | | 4.51 | % |
| Total/Weighted Average | | $ | 217,144 | | | $ | 658 | | | $ | 227,610 | | | 4.30 | % |
Average repurchase agreements outstanding were $3.97$1.0 billion in 2021.during the year ended December 31, 2022. Average repurchase agreements outstanding differed from respective year-end balances during the indicated periods primarily due to changes in portfolio levels and differences in the timing of portfolio acquisitions relative to portfolio runoff and asset sales. Interest paid on repurchase agreements, including related derivative payments, totaled $4.6 million and $8.5 million during the twelve months ended December 31, 2023 and 2022, respectively.
FRANKLIN BSP REALTY TRUST, INC.
NOTES TO CONSOLIDATED FINANCIAL STATEMENTS
December 31, 2023
Collateralized Loan Obligation
The following table represents the terms of the notes issued by 2019-FL5 Issuer, 2021-FL6 Issuer, 2021-FL7 Issuer, 2022-FL8 Issuer, 2022-FL9 Issuer and 2023-FL10 Issuer (collectively the "CLOs"), as of December 31, 2023 and December 31, 2022:
| | | | | | | | | | | | | | | | | | | | | | | | | | | | | | | | | | | | | | | | | | | | |
| | December 31, 2023 |
| CLO Facility | | Number of Loans in pool(1) | | Benchmark Interest Rate(2) | | Weighted Average Spread | | Par Value | | Par Value Outstanding (3) | | Principal Balance of Collateralized Mortgage Assets | | Maturity Dates |
| 2021-FL6 Issuer | | 54 | | Term SOFR | | 1.43 | % | | $ | 584,500 | | | $ | 558,040 | | | $ | 673,289 | | | 3/15/2036 |
| 2021-FL7 Issuer | | 40 | | Term SOFR | | 1.64 | % | | 722,250 | | | 720,000 | | | 864,079 | | | 12/21/2038 |
| 2022-FL8 Issuer | | 46 | | AVG SOFR | | 1.72 | % | | 960,000 | | | 960,000 | | | 1,184,931 | | | 2/15/2037 |
| 2022-FL9 Issuer | | 51 | | Term SOFR | | 2.80 | % | | 670,637 | | | 670,639 | | | 800,638 | | | 5/15/2039 |
| 2023-FL10 Issuer | | 27 | | Term SOFR | | 2.57 | % | | 717,243 | | | 689,294 | | | 895,525 | | | 9/15/2035 |
| | | | | | | $ | 3,654,630 | | | $ | 3,597,973 | | | $ | 4,418,462 | | | |
| | | | | | | | | | | | | | |
| | December 31, 2022 |
| CLO Facility | | Number of Loans in pool(1) | | Benchmark interest rate(2) | | Weighted Average Spread | | Par Value | | Par Value Outstanding (3) | | Principal Balance of Collateralized Mortgage Assets | | Maturity Dates |
| 2019-FL5 Issuer | | 25 | | LIBOR | | 1.77 | % | | $ | 664,199 | | | $ | 210,339 | | | $ | 378,786 | | | 5/15/2029 |
| 2021-FL6 Issuer | | 58 | | LIBOR | | 1.42 | % | | 584,500 | | | 584,500 | | | 691,148 | | | 3/15/2036 |
| 2021-FL7 Issuer | | 39 | | LIBOR | | 1.64 | % | | 722,250 | | | 722,250 | | | 899,729 | | | 12/21/2038 |
| 2022-FL8 Issuer | | 39 | | AVG SOFR | | 1.72 | % | | 960,000 | | | 960,000 | | | 1,198,477 | | | 2/15/2037 |
| 2022-FL9 Issuer | | 50 | | Term SOFR | | 3.04 | % | | 670,637 | | | 670,639 | | | 797,545 | | | 5/15/2039 |
| | | | | | | $ | 3,601,586 | | | $ | 3,147,728 | | | $ | 3,965,685 | | | |
| | | | | | | | | | | | | | |
________________________(1) Loan assets may be pledged towards one or multiple CLO pool.
(2)On March 5, 2021, the Financial Conduct Authority of the U.K. (the “FCA”) announced that LIBOR tenors relevant to 2019-FL5 Issuer, 2021- FL6 Issuer, and 2021-FL7 Issuer would cease to be published or no longer be representative after June 30, 2023. The Alternative Reference Rates Committee (the “ARRC”) interpreted this announcement to constitute a benchmark transition event. The benchmark index of 1M LIBOR interest rate converted from LIBOR to compounded SOFR, plus a benchmark adjustment of 11.448 basis points with a lookback period equal to the number of calendar days in the applicable interest accrual period plus two SOFR business days, conforming with the indenture agreement and recommendations from the ARRC. Compounded SOFR for any interest accrual period shall be the “30-Day Average SOFR” as published by the Federal Reserve Bank of New York on each benchmark determination date. On July 13, 2023, the Company converted the indices for 2021-FL6 Issuer and 2021-FL7 Issuer to 1M Term SOFR + 11.448 basis points and the applicable spreads remain unchanged.
(3) Excludes $495.0 million and $453.4 million, respectively, of CLO notes, held by the Company, which are eliminated in Collateralized loan obligations in the consolidated balance sheet as of December 14, 2021,31, 2023 and December 31, 2022, respectively.
FRANKLIN BSP REALTY TRUST, INC.
NOTES TO CONSOLIDATED FINANCIAL STATEMENTS
December 31, 2023
On July 17, 2023, the Company called all of the outstanding notes issued by BSPRT 2018-FL32019-FL5 Issuer, Ltd., a wholly owned indirect subsidiary of the Company. The outstanding principal of the notes on the date of the call was $99.3$122.0 million. The Company recognized all the remaining unamortized deferred financing costs of $4.6$2.9 million recorded within the Interest expense lineRealized gain/(loss) on extinguishment of debt in the consolidated statements of operations, which was a non-cash charge.
FRANKLIN BSP REALTY TRUST, INC.
NOTES TO CONSOLIDATED FINANCIAL STATEMENTS
December 31, 2021
As of December 31, 2021 and December 31, 2020 the notes issued by BSPRT 2018-FL4 Issuer, Ltd. and BSPRT 2018-FL4 Co-Issuer, LLC, each wholly owned indirect subsidiaries of the Company, are collateralized by interests in a pool of 31 and 59 mortgage assets having a principal balance of $503.3 million and $852.09 million, respectively (the "2018-FL4 Mortgage Assets"). The sale of the 2018-FL4 Mortgage Assets to BSPRT 2018-FL4 Issuer, Ltd. is governed by a Mortgage Asset Purchase Agreement dated as of October 12, 2018, between the Company and BSPRT 2018-FL4 Issuer, Ltd.
As of December 31, 2021 and December 31, 2020, the notes issued by BSPRT 2019-FL5 Issuer, Ltd. and BSPRT 2019-FL5 Co-Issuer, LLC, each wholly owned indirect subsidiaries of the Company, are collateralized by interests in a pool of 48 and 54 mortgage assets having a principal balance of $589.0 million and $799.77 million respectively (the "2019-FL5 Mortgage Assets"). The sale of the 2019-FL5 Mortgage Assets to BSPRT 2019-FL5 Issuer, Ltd. is governed by a Mortgage Asset Purchase Agreement dated as of May 30, 2019, between the Company and BSPRT 2019-FL5 Issuer, Ltd.
On March 25, 2021,September 28, 2023, BSPRT 2021-FL62023-FL10 Issuer, Ltd. and BSPRT 2021-FL6 Co-Issuer, LLC, both wholly owneda wholly-owned indirect subsidiariessubsidiary of the Company, entered into an indenture with the OP, as advancing agent, U.S. Bank Trust Company, National Association, as trustee and note administrator, and U.S. Bank National Association, as note administratorcustodian and trustee,in other capacities, which governs the issuance of approximately $645.8$896.6 million principal balance secured floating rate notes, of which $573.1$573.8 million were purchased by third party investors and $72.6$322.8 million were purchased by a wholly ownedwholly-owned subsidiary of the OP. During the three months ended December 31, 2023, an additional $115.5 million was sold by the wholly-owned subsidiary to third party investors. As of December 31, 2023 $689.3 million was outstanding. In addition, concurrently with the issuance of thesethe notes, BSPRT 2021-FL62023-FL10 Issuer, Ltd.LLC also issued 54,250 Preferred Shares,75,086 preferred shares, par value of $0.001 per share and with an aggregate liquidation preference and notional amount equal to $1,000 per share, which were not offered as part of closing the indenture. For U.S. federal income tax purposes, BSPRT 2021-FL62023-FL10 Issuer, Ltd. and BSPRT 2021-FL6 Co-Issuer, LLC areis a disregarded entities.
As of December 31, 2021, the notes issued by BSPRT 2021-FL6 Issuer, Ltd. and BSPRT 2021-FL6 Co-Issuer, LLC, are collateralized by interests in a pool of 44 mortgage assets having a principal balance of $682.3 million(the "2021-FL6 Mortgage Assets"). The sale of the 2021-FL6 Mortgage Assets to BSPRT 2021-FL6 Issuer, Ltd. is governed by a Collateral Interest Purchase Agreement dated as of March 25, 2021, between the Company and BSPRT 2021-FL6 Issuer, Ltd.
On December 21, 2021, BSPRT 2021-FL7 Issuer, Ltd. and BSPRT 2021-FL7 Co-Issuer, LLC, both wholly owned indirect subsidiaries of the Company entered into an indenture with the OP, as advancing agent and U.S. Bank National Association, as note administrator and trustee, which governs the issuance of approximately $817.9 million principal balance secured floating rate notes, of which $722.3 million were purchased by third party investors and $95.6 million were purchased by a wholly owned subsidiary of the OP. In addition, concurrently with the issuance of the notes, BSPRT 2021-FL7 Issuer, Ltd. also issued 82,125 Preferred Shares, par value of $0.001 per share and with an aggregate liquidation preference and notional amount equal to $1,000 per share, which were not offered as part of closing the indenture. For U.S. federal income tax purposes, BSPRT 2021-FL7 Issuer, Ltd. and BSPRT 2021-FL7 Co-Issuer, LLC are disregarded entities.
As of December 31, 2021, the notes issued by BSPRT 2021-FL7 Issuer, Ltd. and BSPRT 2021-FL7 Co-Issuer, LLC, are collateralized by interests in a pool of 47 mortgage assets having a principal balance of $871.4 million(the "2021-FL7 Mortgage Assets"). The sale of the 2021-FL7 Mortgage Assets to BSPRT 2021-FL7 Issuer, Ltd. is governed by a Collateral Interest Purchase Agreement dated as of December 21, 2021, between the Company and BSPRT 2021-FL7 Issuer, Ltd.
FRANKLIN BSP REALTY TRUST, INC.
NOTES TO CONSOLIDATED FINANCIAL STATEMENTS
December 31, 2021
The Company, through its wholly-owned subsidiaries, holds the preferred equity tranches of the above CLOs of approximately $329.2 million and $256.9 million as of December 31, 2021 and December 31, 2020, respectively. The following table represents the terms of the notes issued by 2018-FL4 Issuer, 2019-FL5 Issuer, 2021-FL6 Issuer, and 2021-FL7 Issuer (the "CLOs), respectively, as of December 31, 2021 (dollars in thousands): | | | | | | | | | | | | | | | | | | | | | | | | | | | | | | | | |
| CLO Facility | | Tranche | | Par Value Issued | | Par Value Outstanding (1) | | Interest Rate | | Maturity Date |
| 2018-FL4 Issuer | | Tranche A | | $ | 416,827 | | | $ | 75,263 | | | 1M LIBOR + 105 | | 9/15/2035 |
| 2018-FL4 Issuer | | Tranche A-S | | 73,813 | | | 73,813 | | | 1M LIBOR + 130 | | 9/15/2035 |
| 2018-FL4 Issuer | | Tranche B | | 56,446 | | | 56,446 | | | 1M LIBOR + 160 | | 9/15/2035 |
| 2018-FL4 Issuer | | Tranche C | | 68,385 | | | 68,385 | | | 1M LIBOR + 210 | | 9/15/2035 |
| 2018-FL4 Issuer | | Tranche D | | 57,531 | | | 57,531 | | | 1M LIBOR + 275 | | 9/15/2035 |
| 2018-FL4 Issuer | | Tranche E | | 28,223 | | | 28,223 | | | 1M LIBOR + 305 | | 9/15/2035 |
| 2019-FL5 Issuer | | Tranche A | | 407,025 | | | 299,529 | | | 1M LIBOR + 115 | | 5/15/2029 |
| 2019-FL5 Issuer | | Tranche A-S | | 76,950 | | | 76,950 | | | 1M LIBOR + 148 | | 5/15/2029 |
| 2019-FL5 Issuer | | Tranche B | | 50,000 | | | 50,000 | | | 1M LIBOR + 140 | | 5/15/2029 |
| 2019-FL5 Issuer | | Tranche C | | 61,374 | | | 61,374 | | | 1M LIBOR + 200 | | 5/15/2029 |
| 2019-FL5 Issuer | | Tranche D | | 48,600 | | | 5,000 | | | 1M LIBOR + 240 | | 5/15/2029 |
| 2019-FL5 Issuer | | Tranche E | | 20,250 | | | 20,250 | | | 1M LIBOR + 285 | | 5/15/2029 |
| 2021-FL6 Issuer | | Tranche A | | 367,500 | | | 367,500 | | | 1M LIBOR + 110 | | 3/15/2036 |
| 2021-FL6 Issuer | | Tranche A-S | | 86,625 | | | 86,625 | | | 1M LIBOR + 130 | | 3/15/2036 |
| 2021-FL6 Issuer | | Tranche B | | 33,250 | | | 33,250 | | | 1M LIBOR + 160 | | 3/15/2036 |
| 2021-FL6 Issuer | | Tranche C | | 41,125 | | | 41,125 | | | 1M LIBOR + 205 | | 3/15/2036 |
| 2021-FL6 Issuer | | Tranche D | | 44,625 | | | 44,625 | | | 1M LIBOR + 300 | | 3/15/2036 |
| 2021-FL6 Issuer | | Tranche E | | 11,375 | | | 11,375 | | | 1M LIBOR + 350 | | 3/15/2036 |
| 2021-FL7 Issuer | | Tranche A | | 508,500 | | | 508,500 | | | 1M LIBOR + 132 | | 12/21/2038 |
| 2021-FL7 Issuer | | Tranche A-S | | 13,500 | | | 13,500 | | | 1M LIBOR + 165 | | 12/21/2038 |
| 2021-FL7 Issuer | | Tranche B | | 52,875 | | | 52,875 | | | 1M LIBOR + 205 | | 12/21/2038 |
| 2021-FL7 Issuer | | Tranche C | | 66,375 | | | 66,375 | | | 1M LIBOR + 230 | | 12/21/2038 |
| 2021-FL7 Issuer | | Tranche D | | 67,500 | | | 67,500 | | | 1M LIBOR + 275 | | 12/21/2038 |
| 2021-FL7 Issuer | | Tranche E | | 13,500 | | | 13,500 | | | 1M LIBOR + 340 | | 12/21/2038 |
| | | | $ | 2,672,174 | | | $ | 2,179,514 | | | | | |
________________________(1) Excludes $320.6 million of CLO notes, held by the Company, which are eliminated within the collateralized loan obligation line of the consolidated balance sheets as of December 31, 2021.
FRANKLIN BSP REALTY TRUST, INC.
NOTES TO CONSOLIDATED FINANCIAL STATEMENTS
December 31, 2021
The following table represents the terms of the notes issued by the 2017-FL1 Issuer, 2017-FL2 Issuer, 2018-FL3 Issuer, 2018-FL4 Issuer, and 2019-FL5 Issuer (the "CLOs), respectively, as of December 31, 2020 (dollars in thousands): | | | | | | | | | | | | | | | | | | | | | | | | | | | | | | | | |
| CLO Facility | | Tranche | | Par Value Issued | | Par Value Outstanding (1) | | Interest Rate | | Maturity Date |
| 2018-FL3 Issuer | | Tranche A | | 286,700 | | | 161,745 | | | 1M LIBOR + 105 | | 10/15/2034 |
| 2018-FL3 Issuer | | Tranche A-S | | 77,775 | | | 77,775 | | | 1M LIBOR + 135 | | 10/15/2034 |
| 2018-FL3 Issuer | | Tranche B | | 41,175 | | | 41,175 | | | 1M LIBOR + 165 | | 10/15/2034 |
| 2018-FL3 Issuer | | Tranche C | | 39,650 | | | 39,650 | | | 1M LIBOR + 255 | | 10/15/2034 |
| 2018-FL3 Issuer | | Tranche D | | 42,700 | | | 42,700 | | | 1M LIBOR + 345 | | 10/15/2034 |
| 2018-FL4 Issuer | | Tranche A | | 416,827 | | | 416,659 | | | 1M LIBOR + 105 | | 9/15/2035 |
| 2018-FL4 Issuer | | Tranche A-S | | 73,813 | | | 73,813 | | | 1M LIBOR + 130 | | 9/15/2035 |
| 2018-FL4 Issuer | | Tranche B | | 56,446 | | | 56,446 | | | 1M LIBOR + 160 | | 9/15/2035 |
| 2018-FL4 Issuer | | Tranche C | | 68,385 | | | 68,385 | | | 1M LIBOR + 210 | | 9/15/2035 |
| 2018-FL4 Issuer | | Tranche D | | 57,531 | | | 57,531 | | | 1M LIBOR + 275 | | 9/15/2035 |
| 2019-FL5 Issuer | | Tranche A | | 407,025 | | | 407,025 | | | 1M LIBOR + 115 | | 5/15/2029 |
| 2019-FL5 Issuer | | Tranche A-S | | 76,950 | | | 76,950 | | | 1M LIBOR + 148 | | 5/15/2029 |
| 2019-FL5 Issuer | | Tranche B | | 50,000 | | | 50,000 | | | 1M LIBOR + 140 | | 5/15/2029 |
| 2019-FL5 Issuer | | Tranche C | | 61,374 | | | 61,373 | | | 1M LIBOR + 200 | | 5/15/2029 |
| 2019-FL5 Issuer | | Tranche D | | 48,600 | | | 5,000 | | | 1M LIBOR + 240 | | 5/15/2029 |
| 2019-FL5 Issuer | | Tranche E | | 20,250 | | | 3,000 | | | 1M LIBOR + 285 | | 5/15/2029 |
| | | | $ | 1,825,201 | | | $ | 1,639,227 | | | | | |
________________________
(1) Excludes $267.1 million of CLO notes, held by the Company, which are eliminated within the collateralized loan obligation line of the consolidated balance sheets as of December 31, 2020.
FRANKLIN BSP REALTY TRUST, INC.
NOTES TO CONSOLIDATED FINANCIAL STATEMENTS
December 31, 2021
entity.The below table reflects the total assets and liabilities of the Company's outstanding CLOs. The CLOs are considered VIEs and are consolidated into the Company's consolidated financial statements as of December 31, 20212023 and December 31, 20202022 as the Company is the primary beneficiary of the VIE. The Company is the primary beneficiary of the CLOs because (i) the Company has the power to direct the activities that most significantly affect the VIE’s economic performance and (ii) the right to receive benefits from the VIEs or the obligation to absorb losses of the VIEs that could be significant to the VIE. The VIE’s are non-recourse to the Company.
| | Assets (dollars in thousands) | Assets (dollars in thousands) | | December 31, 2021 | | December 31, 2020 | Assets (dollars in thousands) | | December 31, 2023 | | December 31, 2022 |
Cash and cash equivalents (1) | Cash and cash equivalents (1) | | $ | 187,668 | | | $ | 99,025 | |
Commercial mortgage loans, held for investment, net (2) | Commercial mortgage loans, held for investment, net (2) | | 2,629,431 | | | 2,044,956 | |
| Accrued interest receivable | Accrued interest receivable | | 5,918 | | | 5,626 | |
| Total Assets | Total Assets | | $ | 2,823,017 | | | $ | 2,149,607 | |
| | Liabilities | Liabilities | |
| Liabilities | |
| Liabilities | |
Notes payable (3)(4) | |
Notes payable (3)(4) | |
Notes payable (3)(4) | Notes payable (3)(4) | | $ | 2,482,762 | | | $ | 1,892,616 | |
| Accrued interest payable | Accrued interest payable | | 1,598 | | | 1,240 | |
| Total Liabilities | Total Liabilities | | $ | 2,484,360 | | | $ | 1,893,856 | |
(1) Includes $187.0$55.1 million and $98.6$42.5 million of cash held by the servicer related to CLO loan payoffsCLOs as of December 31, 20212023 and December 31, 2020.2022, respectively.
(2) The balance is presented net of allowance for credit losses of $8.7$32.6 million and $19.4$13.2 million as of December 31, 20212023 and December 31, 2020,2022, respectively.
(3) Includes $320.6$495.0 million and $267.1$453.4 million of CLO notes, held by the Company, which are eliminated within the collateralizedin Collateralized loan obligation line of in the consolidated balance sheets as of December 31, 20212023 and December 31, 2020.2022, respectively.
(4) The balance is presented net of deferred financing cost and discount of $17.3$30.8 million and $13.7$19.2 million as of December 31, 20212023 and December 31, 2020,2022, respectively.
FRANKLIN BSP REALTY TRUST, INC.
NOTES TO CONSOLIDATED FINANCIAL STATEMENTS
December 31, 20212023
Note 8 - Earnings Per Share
The Company uses the two-class method in calculating basic and diluted earnings per share. Net incomeincome/(loss) is allocated between our common stock and other participating securities based on their participation rights. Diluted net income per share has been computed using the weighted average number of shares of common stock outstanding and other dilutive securities. The following table presents a reconciliation of the numerators and denominators of the basic and diluted earnings per share computations and the calculation of basic and diluted earnings per share for the years ended December 31, 2021, 20202023, 2022 and 2019, respectively2021 (dollars in thousands, except share amounts)and per share data): | | Year Ended December 31, |
| | Year Ended December 31, | | | | Year Ended December 31, |
| Numerator | Numerator | 2021 | | 2020 | | 2019 | Numerator | | 2023 | | 2022 | | 2021 |
| Net income | $ | 25,702 | | | $ | 54,746 | | | $ | 83,924 | |
| Net income/(loss) | |
| Net (income)/loss from non-controlling interest | |
| Less: Preferred stock dividends | Less: Preferred stock dividends | 33,587 | | | 14,920 | | | 15,337 | |
| Less: Undistributed earnings allocated to preferred stock | — | | | — | | | 1,673 | |
| Net income/(loss) attributable to common stock | |
| Less: Participating securities' share in earnings | |
| Net income/(loss) attributable to common shareholders (for basic and diluted earnings per share) | Net income/(loss) attributable to common shareholders (for basic and diluted earnings per share) | $ | (7,885) | | | $ | 39,826 | | | $ | 66,914 | |
| | | Year Ended December 31, | |
| | Year Ended December 31, | |
| | Year Ended December 31, | |
| Denominator | Denominator | | Denominator | | 2023 | | 2022 | | 2021 |
| Weighted-average common shares outstanding for basic earnings per share | Weighted-average common shares outstanding for basic earnings per share | 43,419,209 | | | 44,384,813 | | | 41,859,142 | |
| Effect of dilutive shares: | |
| Unvested restricted shares | 15,521 | | | 14,066 | | | 12,504 | |
Effect of dilutive shares(1): | |
| Unvested restricted shares and stock units | |
| Unvested restricted shares and stock units | |
| Unvested restricted shares and stock units | |
| Weighted-average common shares outstanding for diluted earnings per share | Weighted-average common shares outstanding for diluted earnings per share | 43,434,731 | | | 44,398,879 | | | 41,871,646 | |
| | Basic earnings per share | Basic earnings per share | $ | (0.18) | | | $ | 0.90 | | | $ | 1.60 | |
| Basic earnings per share | |
| Basic earnings per share | |
| Diluted earnings per share | Diluted earnings per share | $ | (0.18) | | | $ | 0.90 | | | $ | 1.60 | |
Note 9 - Stock Transactions
As(1) The effect of December 31, 2021the weighted average dilutive shares excluded restricted shares and December 31, 2020, the Company had 43,965,928 and 44,510,051 shares of commonrestricted stock outstanding, respectively, including shares issued pursuant to the Company's distribution reinvestment plan (the "DRIP"), share repurchases and unvested restricted shares.
As of each of December 31, 2021 and December 31, 2020, the Company had 1,400 shares of Series C Preferred Stock outstanding. Additionally, as of December 31, 2021, the Company had 17,950 shares of Series D Preferred Stock, 39,733,299 shares of Series F Preferred Stock and 10,329,039 shares of Series E Preferred Stock outstanding. As of December 31, 2020 the Company had 0 shares of Series D Preferred Stock, Series F Preferred Stock, and Series E Preferred Stock outstanding. As of December 31, 2021 the Company had 0 shares of Series A Preferred Stock outstanding.
The following tables present the activity in the Company's Series A Preferred Stockunits for the periodsyears ended December 31, 20212023 and 2022 of 191,324 and 476,653, respectively, as the effect was anti-dilutive. Additionally, the effect of the weighted average dilutive shares excluded the common equivalent of convertible preferred shares for the year-ended December 31, 2020, (dollars in thousands, except share amounts). In March 2021, we exchanged 14,949 shares2023 and 2022 of Series A Preferred Stock for an equivalent amount of shares of Series D Preferred Stock5,385,254 and sold 3,000 new shares of Series D Preferred Stock for total proceeds of $14.0 million, representing17,521,845, respectively, as the $15.0 million aggregate liquidation preference per share of the 3,000 shares of Series D Preferred Stock sold less the accrued and unpaid dividends on the surrendered shares of Series A Preferred Stock:effect was anti-dilutive.
FRANKLIN BSP REALTY TRUST, INC.
NOTES TO CONSOLIDATED FINANCIAL STATEMENTS
December 31, 20212023
| | | | | | | | | | | | | | |
| Series A Preferred Stock | | Shares | | Amount |
| Beginning Balance, December 31, 2020 | | 40,515 | | | $ | 202,292 | |
| Surrender of Series A Preferred Stock in exchange for Series D Preferred Stock | | (14,950) | | | (74,748) | |
Conversion of Preferred Stock (1) | | (25,567) | | | (127,603) | |
| Dividends paid in Preferred Stock | | 2 | | | 5 | |
| Offering costs | | — | | | (14) | |
| Amortization of offering costs | | — | | | 68 | |
| Ending Balance, December 31, 2021 | | — | | | $ | — | |
The following table presents the summary of the Company's outstanding shares of redeemable convertible preferred stock, perpetual preferred stock, and common stock as of December 31, 2023 and 2022 (in thousands, except share and per share amounts):
| | | | | | | | | | | | | | | | | | | | | | | | | | | | | | | | |
| | Balance as of | | Shares Outstanding as of | | Fourth Quarter 2023 Dividend Per Share (1) |
| | December 31, 2023 | | December 31, 2022 | | December 31, 2023 | | December 31, 2022 | |
| Redeemable Convertible Preferred Stock: | | | | | | | | | | |
Series H Preferred Stock (2) | | $ | 89,748 | | | $ | 89,748 | | | 17,950 | | 17,950 | | $ | 106.22 | |
Series I Preferred Stock (3) | | $ | — | | | $ | 5,000 | | | — | | | 1,000 | | $ | — | |
| Perpetual Preferred Stock: | | | | | | | | | | |
| Series E Preferred Stock | | $ | 258,742 | | | $ | 258,742 | | | 10,329,039 | | 10,329,039 | | $ | 0.46875 | |
| Common Stock: | | | | | | | | | | |
Common Stock - at par value (4)(5) | | $ | 820 | | | $ | 826 | | | 82,751,913 | | 82,992,784 | | $ | 0.355 | |
________________________
________________________(1) As declared by the Company's board of directors.
(1)(2) In connection withOn January 10, 2024, the listingSeries H Preferred Stock was amended such that the mandatory conversion date was extended by one year, to January 21, 2025. Unless earlier converted, the Series H Preferred Stock will automatically convert into common stock at a rate of the Common Stock on the NYSE, on October 19, 2021 immediately prior to the closing299.2 shares of the Capstead merger, each outstandingcommon stock per share of Series AH Preferred Stock (subject to adjustments as described in the Articles Supplementary for the Series H Preferred Stock) on January 21, 2025. The holder of the Series H Preferred Stock has the right to convert up to 4,487 shares of Series H Preferred Stock one time in each calendar month through December 2024, upon 10 business days’ advance notice to the Company.
(3) On January 19, 2023, all 1,000 outstanding shares of the Company's Series I Preferred Stock each automatically converted into 299.2 shares of Common Stock, pursuant to the terms of the Series AI Preferred Stock, resulting in the issuance of 7,649,632299,200 shares of Common Stock.
| | | | | | | | | | | | | | |
| Series A Preferred Stock | | Shares | | Amount |
| Beginning Balance, December 31, 2019 | | 40,500 | | | $ | 202,144 | |
| Issuance of Preferred Stock | | 14 | | | 70 | |
| Dividends paid in Preferred Stock | | 1 | | | 7 | |
| Offering costs | | — | | | (23) | |
| Amortization of offering costs | | — | | | 94 | |
| Ending Balance, December 31, 2020 | | 40,515 | | | $ | 202,292 | |
The following tables present the activity in(4) Common Stock includes shares issued pursuant to the Company's Series C Preferred Stock fordividend reinvestment plan ("DRIP") and unvested restricted shares.
(5) During the periodsyear ended December 31, 2021 and December 31, 2020, (dollars in thousands, except share amounts):
| | | | | | | | | | | | | | |
| Series C Preferred Stock | | Shares | | Amount |
| Beginning Balance, December 31, 2020 | | 1,400 | | | $ | 6,962 | |
| Issuance of Preferred Stock | | — | | | — | |
| Dividends paid in Preferred Stock | | — | | | — | |
| Offering costs | | — | | | — | |
| Amortization of offering costs | | — | | | 9 | |
| Ending Balance, December 31, 2021 | | 1,400 | | | $ | 6,971 | |
| | | | | | | | | | | | | | |
| Series C Preferred Stock | | Shares | | Amount |
| Beginning Balance, December 31, 2019 | | 1,400 | | | $ | 6,966 | |
| Issuance of Preferred Stock | | — | | | — | |
| Dividends paid in Preferred Stock | | — | | | — | |
| Offering costs | | — | | | (11) | |
| Amortization of offering costs | | — | | | 7 | |
| Ending Balance, December 31, 2020 | | 1,400 | | | $ | 6,962 | |
FRANKLIN BSP REALTY TRUST, INC.
NOTES TO CONSOLIDATED FINANCIAL STATEMENTS
December 31, 2021
The following table presents the activity in the Company's Series D Preferred Stock for the period ended December 31, 2021 (dollars in thousands, except share amounts):
| | | | | | | | | | | | | | |
| Series D Preferred Stock | | Shares | | Amount |
| Balance, December 31, 2020 | | — | | | $ | — | |
| Issuance of Preferred Stock | | 17,950 | | | 89,748 | |
| Dividends paid in Preferred Stock | | — | | | — | |
| Offering Costs | | — | | | (82) | |
| Amortization of offering costs | | — | | | 18 | |
| Ending Balance, December 31, 2021 | | 17,950 | | | $ | 89,684 | |
As of December 31, 20202023, the Company did not have any Series D Preferred Stock outstanding.
Common Stock and Series F Preferred Stock Recapitalization
In accordance with the terms of the Merger Agreement (as defined below), on October 6, 2021, the Company filed Articles of Amendment to the Company’s Charter (the “Articles of Amendment”) with the State Department of Assessments and Taxation of Maryland (the “SDAT”) to effect (a) a Company name change and (b) a one-for-ten reverse stock split (the “Reverse Stock Split”). Pursuant to the Articles of Amendment, effective as of 9:00 a.m. eastern time on October 12, 2021, the Company’s name changed to “Franklin BSP Realty Trust, Inc.,” and effective as of the close of business on October 12, 2021, each outstanding share of the Company’s Common Stock, automatically combined into 1/10th of a share of Common Stock. Fractional shares that were created as a result of the Reverse Stock Split remained outstanding. As a result of the Reverse Stock Split, the number of outstandingrepurchased 1,026,105 shares of Common Stock at a net average price of $12.19 per share, for a total of $12.5 million. All of these shares were retired upon settlement, reducing the total outstanding shares as of December 31, 2023. See discussion in the "Stock Repurchases" section below.
During the year ended December 31, 2023 and 2022, the Company aspaid an aggregate of the date of the Reverse Stock Split were reduced to approximately 4.5$118.0 million shares.
In addition, also on October 6, 2021 the Company filed Articles Supplementary (the “Articles Supplementary”) to the Company’s charter with the SDAT, with an effective date of October 12, 2021. The Articles Supplementary (a) reclassified 50,000,000 shares of authorized but unissued shares of Common Stock as preferred stock, $0.01 par value per share, as a result of which the Company is authorized to issue 900,000,000 shares of Common Stock and 100,000,000 shares of preferred stock under the charter, and (b) designated and classified 40,000,000 shares of preferred stock as a new series of Series F Preferred Stock, with the rights, preferences and obligations set forth in the Articles Supplementary.
Also in accordance with the terms of the Merger Agreement, on October 4, 2021, the Board declared a stock dividend (the “Stock Dividend”) on the outstanding shares of Common Stock, payable at a rate of 9 shares of Series F Preferred Stock for each share of Common Stock issued and outstanding following the Reverse Stock Split on October 12, 2021. The record date used to determine the list of holders of Common Stock eligible to receive the Stock Dividend (following the Reverse Stock Split) was set by the Board as October 7, 2021. As a result of the Reverse Stock Split, holders of Common Stock collectively received 39,733,298 shares of Series F Preferred Stock.
The Reverse Stock Split and Stock Dividend resulted in each stockholder of Common Stock having the same economic value of equity securities in the Company as such holder did prior to the Reverse Stock Split and Stock Dividend, except that each such holder now has 10% of their holdings in Common Stock and 90% of their holdings in Series F Preferred Stock. Each share (or fractional share) of Series F Preferred Stock will automatically convert into 1 share of Common Stock (or equivalent fractional share, as applicable) on April 19, 2022.
Issuance of Common Stock and Series E Preferred Stock in the Merger with Capstead Mortgage Corporation
On October 19, 2021 (the “Closing Date”), the Company consummated the transactions contemplated by that certain Agreement and Plan of Merger, dated as of July 25, 2021, as amended pursuant to that certain First Amendment to Agreement and Plan of Merger, dated as of September 22, 2021 (as amended, the “Merger Agreement”), by and among the Company, Rodeo Sub I, LLC (“Merger Sub”), Capstead Mortgage Corporation (“Capstead”) and, solely for the purposes set forth therein, the Advisor. Pursuant to the Merger Agreement, on the Closing Date, Capstead merged with and into Merger Sub, with Merger Sub continuing as the surviving company (the “Merger”).
At the effective time of the merger (the "Effective Time"), each outstanding share$87.8 million, respectively, of common stock par value $0.01distributions comprised of quarterly common dividends of $0.355 per share, of Capstead (the “Capstead Common Stock”) (other than shares held by the Company or Merger Sub or by any wholly owned subsidiary of the Company or Merger Sub or any wholly owned subsidiary of Capstead immediately prior to the Effective Time, which were automatically canceled and retired and ceased to exist) was cancelled and converted into the right to receive:share.
FRANKLIN BSP REALTY TRUST, INC.
NOTES TO CONSOLIDATED FINANCIAL STATEMENTS
December 31, 2021
•from the Company, (A) 0.3288 newly-issued shares of the Company's Common Stock (the “Per Share Stock Payment”); and (B) a cash amount equal to $0.21 per share (the “Per Share Cash Payment” and together with the Per Share Stock Payment, the “Per Common Share FBRT Payment”); and
•from the Advisor, a cash amount equal to $0.73 per share (the “Advisor Cash Payment” and together with the Per Common Share FBRT Payment, the “Total Per Common Share Payment”).
No fractional shares of Common Stock were issued in the Merger, and the value of any fractional interests to which a former holder of Capstead Common Stock is otherwise entitled will be paid in cash.
Additionally, at the Effective Time, (i) each outstanding share of Capstead’s 7.50% Series E Cumulative Redeemable Preferred Stock, $0.10 par value per share (“Capstead Preferred Stock”), was cancelled and converted into the right to receive 1 newly-issued share of the Company's Series E Preferred Stock, which has the rights, preferences, and privileges and voting powers materially the same as those of the Capstead Preferred Stock. The Company filed Articles Supplementary to the Company’s charter with the SDAT, with an effective date of October 19, 2021, which designated and classified 10,329,039 shares of preferred stock as a new series of Series E Preferred Stock, with the rights, preferences and obligations set forth in the Articles Supplementary.
Furthermore, effective immediately prior to the Effective Time, all outstanding restricted stock under Capstead’s Amended and Restated 2014 Flexible Incentive Plan (the “Capstead Plan”) automatically became fully vested and non-forfeitable, and all shares of Capstead Common Stock represented thereby became eligible to receive the Total Per Common Share Payment. Also effective immediately prior to the Effective Time, all outstanding awards of performance units under the Capstead Plan automatically became earned and vested at the conversion rate of 1 share of Capstead Common Stock for each outstanding performance unit, and all shares of Capstead Common Stock represented thereby became eligible to receive the Total Per Common Share Payment. Each outstanding dividend equivalent right under the Capstead Plan was automatically cancelled as of the Effective Time; provided that any accrued amounts that were not paid as of immediately prior to the Effective Time were paid to the holders thereof at the Effective Time (or will be as soon as practicable thereafter but in no event later than the first payroll date following the Effective Time).
The issuances of shares of Common Stock and Series E Preferred Stock in connection with the Merger were registered under the Securities Act of 1933, as amended (the “Securities Act”), pursuant to the Company’s registration statement on Form S-4 (Registration No. 333-258947), which was declared effective by the U.S. Securities and Exchange Commission (the “SEC”) on September 3, 2021 (as amended or supplemented, the “S-4 Registration Statement”). The proxy statement/prospectus included in the S-4 Registration Statement contains additional information regarding the Merger.
Per the terms of the transactions described in the Merger Agreement, approximately 31.9 million shares of Common Stock were issued in connection with the Merger to former Capstead common stockholders, and the Company paid $20.5 million in cash payments to former Capstead common stockholders. In addition, the Company issued 10.3 million shares of Series E Preferred Stock to former holders of Capstead Preferred Stock. In addition, both the Company’s Common Stock and Series E Preferred Stock were listed on the New York Stock Exchange (“NYSE”) on October 19, 2021, under the ticker symbols “FBRT” and “FBRT PRE,” respectively.
7.50% Series E cumulative redeemable preferred stock
The Series E Preferred Stock has no stated maturity and is not subject to any sinking fund or mandatory redemption. The Series E Preferred Stock ranks, with respect to rights to the payment of dividends and the distribution of assets upon its liquidation, dissolution or winding up, senior to the Common Stock and Series F Preferred Stock and on a parity with the Series C Preferred Stock and Series D Preferred Stock. The liquidation preference is $25.00 per share, plus an amount equal to any accumulated and unpaid dividends.
Holders of shares of the Series E Preferred Stock are entitled to receive, when, as and if authorized by our board of directors and declared by the Company, out of funds legally available for the payment of dividends, cumulative cash dividends at the rate of 7.50% of the $25.00 per share liquidation preference per annum (equivalent to $1.875 per annum per share). Dividends on the Series E Preferred Stock are cumulative and payable quarterly in arrears.
Dividends on the Series E Preferred Stock will accumulate whether or not the Company has earnings, whether or not there are funds legally available for the payment of those dividends and whether or not those dividends are declared.
FRANKLIN BSP REALTY TRUST, INC.
NOTES TO CONSOLIDATED FINANCIAL STATEMENTS
December 31, 2021
The Company may, at its option, upon not less than 30 nor more than 60 days’ written notice, redeem the Series E Preferred Stock, in whole or in part, at any time or from time to time, for cash at a redemption price of $25.00 per share, plus any accumulated and unpaid dividends thereon to, but not including, the date fixed for redemption. Upon a change of control of the Company, in the event the Company does not redeem the Series E Preferred Stock, a holder of Series E Preferred Stock will have the right to convert to Common Stock upon the terms set forth in the applicable Articles Supplementary.
The Series E Preferred Stock is listed on the New York Stock Exchange under the symbol “FBRT PRE”.
Share Repurchase Program
Prior to the listing of the Common Stock on the NYSE on October 19, 2021, the Company maintained a share repurchase program (the “SRP”) that enabled stockholders to sell their shares to the Company.
The following table reflects the number of shares repurchased under the SRP cumulatively through December 31, 2021: | | | | | | | | | | | | | | | | | | | | |
| | Number of Requests | | Number of Shares Repurchased | | Average Price per Share |
| Cumulative as of December 31, 2020 | | 8,094 | | | 4,121,735 | | | $ | 19.88 | |
January 1 - January 31, 2021(1) | | 1,355 | | | 525,580 | | | 17.53 | |
| February 1 - February 28, 2021 | | — | | | — | | | N/A |
March 1 - March 31, 2021(1) | | — | | | — | | | N/A |
| April 1 - April 30, 2021 | | — | | | — | | | N/A |
May 1 - May 31, 2021(1) | | — | | | — | | | N/A |
| June 1 - June 30, 2021 | | — | | | — | | | N/A |
July 1 - July 31, 2021(2) | | 1,424 | | 123,257 | | 17.88 | |
| August 1 - August 31, 2021 | | — | | | — | | | N/A |
September 1 - September 30, 2021(2) | | — | | | — | | | N/A |
| October 1 - October 31, 2021 | | — | | | — | | | N/A |
| November 1 - November 30, 2021 | | — | | | — | | | N/A |
| December 1 - December 31, 2021 | | — | | | — | | | N/A |
| Cumulative as of December 31, 2021 | | 10,873 | | 4,770,572 | | $ | 19.57 | |
________________________(1) Reflects shares repurchased pursuant to repurchase requests submitted for the second semester of 2020, including 15,772 and 3,784 shares which for administrative reasons were processed in March 2021 and May 2021, respectively. Pursuant to the terms of the SRP, the Company is only authorized to repurchase up to the amount of proceeds reinvested through our DRIP during the applicable semester. As a result, redemption requests in the amount of 1,881,556 shares were not fulfilled for the second semester of 2020.
(2) Reflects shares repurchased pursuant to repurchase requests submitted for the first semester of 2021, including 1,776 shares which for administrative reasons were processed in September 2021. Pursuant to the terms of the SRP, the Company is only authorized to repurchase up to the amount of proceeds reinvested through our DRIP during the applicable semester. As a result, redemption requests in the amount of 761 shares were not fulfilled for the first semester of 2021.Repurchases
The Company’s board of directors has authorized a $65 million share repurchase program that will become operative following the conclusion of the $35 million open market share purchase program the Advisor agreed to implement in connection with the Capstead acquisition.Company’s common stock. The Company’s share repurchase program authorizes share repurchases at prices below the most recently reported book value per share as determined in accordance with GAAP. PurchasesRepurchases made under the Company’s program may be made through open market, block, and privately negotiated transactions, including Rule 10b5-1 plans, as permitted by securities laws and other legal requirements. The timing, manner, price and amount of any purchases by the Company and the Advisor will be determined by the respective teams responsible at the Company and the Advisor, as applicable, in theirits reasonable business judgment and consistent with the exercise of theirits legal duties and will be subject to economic and market conditions, stock price, applicable legal requirements and other factors. The Company share repurchase program does not obligate the Company to acquire any particular amount of common stock. The Company’s and the Advisor’sCompany's share purchase programsrepurchase program will remain open until at least November 2022December 31, 2024, or until the capital committed to the applicable repurchase program has been exhausted, whichever is sooner. Repurchases under the Company’s share repurchase program may be suspended from time to time at the Company’s discretion without prior notice. As of December 31, 2023, the Company had $35.9 million remaining under the share repurchase program.
FRANKLIN BSP REALTY TRUST, INC.
NOTES TO CONSOLIDATED FINANCIAL STATEMENTS
December 31, 20212023
The following table is a summary of the Company’s repurchase activity of its common stock during the year ended December 31, 2023 (in thousands, except share amounts): | | | | | | | | | | | | | | |
| | Year Ended December 31, 2023 |
| | Shares | | Amount (1)(2) |
| Beginning of period, authorized repurchase amount | | | | $ | 48,421 | |
| Repurchases paid | | 1,026,105 | | | (12,504) | |
| | | | |
| Remaining as of December 31, 2023 | | | | $ | 35,917 | |
________________________
(1) For the year ended December 31, 2023, the net average purchase price was 12.19 per share.
(2) Amount includes commissions paid associated with share repurchases.
Dividend Reinvestment and Direct Stock Purchase Plan
The Company has adopted a dividend reinvestment and direct stock purchase plan ("DRIP") under which we registered and reserved for issuance, in the aggregate, 63,000,000 shares of common stock. Under the dividend reinvestment component of this plan, the Company's common stockholders can designate all or a portion of their cash dividends to be reinvested in additional shares of common stock. The direct stock purchase component allows stockholders, subject to the Company's approval, to purchase shares of common stock directly from us. During the years ended December 31, 2023, 2022 and 2021, the Company issued 61,866 shares, 72,764 shares and zero shares, respectively, of common stock under the dividend reinvestment component of DRIP. As of December 31, 2023, 62,865,370 shares remained available for issuance under the DRIP.
At-the-Market Sales Agreement
On April 14, 2023, the Company established a $200 million at-the-market offering program ("ATM program") by entering into a Sales Agreement (the "Sales Agreement") with a financial syndicate as sales agents (the "Agents"), pursuant to which the Company may sell, from time to time, and at various prices, through the Agents, shares of the Company's common stock. Sales, if any, of the common stock made through the Agents, pursuant to the Sales Agreement, may be made in "at the market" offerings (as defined in Rule 415 under the Securities Act of 1933, as amended), by means of ordinary brokers' transactions on the New York Stock Exchange or otherwise, at market prices prevailing at the time of sale, in block transactions, in negotiated transactions, in any manner permitted by applicable law or as otherwise as may be agreed by the Company and any Agent.
As of December 31, 2023, the Company has not sold any shares of common stock under its ATM program, and sales of common stock with an aggregate sales price of $200 million remained available for issuance under the Sales Agreement.
Note 10 - Commitments and Contingencies
Unfunded Commitments Under Commercial Mortgage Loans
As of December 31, 20212023 and 2020,2022, the Company had the below unfunded commitments to the Company's borrowers (dollars in thousands): | | Funding Expiration | Funding Expiration | December 31, 2021 | | December 31, 2020 | Funding Expiration | December 31, 2023 | | December 31, 2022 |
| 2021 | $ | — | | | $ | 59,692 | |
| 2022 | 25,864 | | | 91,420 | |
| 2023 | 2023 | 123,860 | | | 69,880 | |
| 2024 | 2024 | 271,056 | | | 7,700 | |
| 2025 and beyond | 37,325 | | | — | |
| $ | 458,105 | | | $ | 228,692 | |
| 2025 | |
| 2026 | |
| 2027 and beyond | |
| $ | |
________________________
(1) The balance relates to four loans that are subject to modification as of December 31, 2023.
The borrowers are generally required to meet or maintain certain metrics in order to qualify for the unfunded commitment amounts.
FRANKLIN BSP REALTY TRUST, INC.
NOTES TO CONSOLIDATED FINANCIAL STATEMENTS
December 31, 2023
Litigation and Regulatory Matters
The Company is not presently involvednamed as a defendant in any material litigation arising outside the ordinary course of business. However, the Company is involved in routine litigation arising in the ordinary course of business, none of which the Company believes, individually or in the aggregate, will have a material impact on the Company’s financial condition, operating results or cash flows.
Capstead Merger Litigation
NaN lawsuits were filed by purported stockholders of Capstead with respect to the Capstead merger. The first suit, styled as Shiva Stein v. Capstead Mortgage Corporation, et al., No. 1:21-cv-7306 (the “Stein Lawsuit”), was filed in the United States District Court for the Southern District of New York on August 31, 2021, and asserted claims against Capstead, members of the Capstead board of directors (the “Capstead Board”) and the Company. The second suit, styled as Matthew Hopkins v. Capstead Mortgage Corporation, et al., No. 1:21-cv-07369 (the “Hopkins Lawsuit”), was filed in the United States District Court for the Southern District of New York on September 1, 2021, and asserted claims against Capstead, members of the Capstead Board, the Company and the Advisor. The third suit, styled as Bryan Harrington v. Capstead Mortgage Corporation, et al., No. 1:21-cv-05080 (the “Harrington Lawsuit”), was filed in the United States District Court for the Eastern District of New York on September 11, 2021, and asserted claims against Capstead and members of the Capstead Board. The fourth suit, styled as Randy Gill v. Capstead Mortgage Corporation, et al., No. 1:21-cv-07973 (the “Gill Lawsuit”), was filed in the United States District Court for the Southern District of New York on September 24, 2021, and asserted claims against Capstead and members of the Capstead Board. The fifth suit, styled as Jordan Wilson v. Capstead Mortgage Corporation, et al., No. 1:21-cv-08147-UA (the “Wilson Lawsuit”), was filed in the United States District Court for the Southern District of New York on October 1, 2021, and asserted claims against Capstead and members of the Capstead Board. Capstead also received demand letters from 2 purported stockholders, Brett Braafhart and Angelo Fisichella, threatening to assert claims against Capstead and members of the Capstead Board (such demand letters, together with the Stein Lawsuit, the Hopkins Lawsuit, the Harrington Lawsuit, the Gill Lawsuit and the Wilson Lawsuit, the “Lawsuits”).
Each of the Lawsuits alleged that certain of the disclosures in the Capstead proxy statement related to the merger were deficient, and sought preliminary and injunctive relief. While Capstead believed that the disclosures set forth in the proxy statement complied fully with applicable law, in order to address certain disclosure claims in the Lawsuits, minimize the cost, risk and uncertainty inherent in litigation, avoid nuisance and preclude any efforts to delay the completion of the merger, Capstead voluntarily supplemented the proxy statement with certain supplemental disclosures. The Company, as successor to Capstead in the merger, believes the claims asserted in the Lawsuits are without merit and expressly denies all allegations in the Lawsuits, including that any additional disclosure was or is required. Subsequent to the completion of the Capstead merger, each of the Stein Lawsuit, the Hopkins Lawsuit, the Harrington Lawsuit, the Gill Lawsuit and the Wilson Lawsuit was voluntarily dismissed without prejudice.
FRANKLIN BSP REALTY TRUST, INC.
NOTES TO CONSOLIDATED FINANCIAL STATEMENTS
December 31, 2021
Note 11 - Related Party Transactions and Arrangements
Advisory Agreement Fees and Reimbursements
Pursuant to the Advisory Agreement, the Company is required to make the following payments and reimbursements to the Advisor:
•The Company reimburses the Advisor’s costs of providing services pursuant to the Advisory Agreement, except the salaries and benefits paid by the Advisor to the Company’s executive officers.
•The Company pays the Advisor, or its affiliates, a monthly asset management fee equal to one-twelfth of 1.5% of stockholders' equity as calculated pursuant to the Advisory Agreement.
•The Company will pay the Advisor an annual subordinated performance fee calculated on the basis of total return to stockholders, payable monthly in arrears, such that for any year in which total return on stockholders’ capital (as defined in the Advisory Agreement) exceeds 6.0% per annum, our Advisor will be entitled to 15.0% of the excess total return; provided that in no event will the annual subordinated performance fee payable to our Advisor exceed 10.0% of the aggregate total return for such year.
•The Company reimburses the Advisor for insourced expenses incurred by the Advisor on the Company's behalf related to selecting, evaluating, originating and acquiring investments in an amount up to 0.5% of the principal amount funded by the Company to originate or acquire commercial mortgage loans and up to 0.5% of the anticipated net equity funded by the Company to acquire real estate securities investments.
The table below shows the costs incurred due to arrangements with our Advisor and its affiliates during the years ended December 31, 2021, 20202023, 2022 and 20192021 and the associated payable as of December 31, 20212023 and 20202022 (dollars in thousands): | | Year Ended December 31, | | Payable as of December 31, |
| 2021 | | 2020 | | 2019 | | 2021 | | 2020 |
| | Year Ended December 31, | | | | Year Ended December 31, | | Payable as of December 31, |
| | 2023 | | | | 2023 | | 2022 | | 2021 | | 2023 | | 2022 |
Acquisition expenses (1) | Acquisition expenses (1) | | $ | 1,203 | | | $ | 696 | | | $ | 900 | | | $ | — | | | $ | — | |
| Administrative services expenses | Administrative services expenses | | 7,658 | | | 13,120 | | | 16,363 | | | — | | | 2,940 | |
| Asset management and subordinated performance fee | Asset management and subordinated performance fee | | 28,110 | | | 15,178 | | | 16,226 | | | 15,595 | | | 4,773 | |
Other related party expenses (2)(3) | Other related party expenses (2)(3) | | 355 | | | 703 | | | 1,610 | | | 1,943 | | | 1,812 | |
| Total related party fees and reimbursements | Total related party fees and reimbursements | | $ | 37,326 | | | $ | 29,697 | | | $ | 35,099 | | | $ | 17,538 | | | $ | 9,525 | |
(1) Total acquisition fees and expenses paid during the years ended December 31, 2023, 2022 and 2021 2020 and 2019 were $15.0$5.8 million, $7.1$11.7 million and $8.4$15.0 million respectively, of which $13.8$4.6 million, $6.4$10.3 million and $7.5$13.8 million were capitalized within the commercialin Commercial mortgage loans, held for investment line of and Real estate securities, available for sale, measured at fair value in the consolidated balance sheets for the years ended December 31, 2021, 20202023, 2022 and 2019.2021.
(2) These are related to reimbursable costs incurred related to the increase in loan origination activities and are included in Other expenses in the Company's consolidated statements of operations.
(3) TheAs of December 31, 2023 and December 31, 2022, the related party payable includes $1.9payables include $0.7 million and $1.8$2.9 million respectively, of payments made by the Advisor to third party vendors on behalf of the Company.
The payables as of December 31, 20212023 and 20202022 in the table above are included in Due to affiliates on in the Company's consolidated balance sheets.
Other Transactions
Pursuant to a lending and security agreement with Security Benefit Life Insurance Company ("SBL"), which was entered into in February 2020 and amended in March and August 2020, the Company may borrow up to $100.0 million at a rate of one-month LIBOR + 4.5%. The facility has a maturity of February 10, 2023 and is secured by a pledge of equity interests in certain of the Company’s subsidiaries. The Company incurred $2.0 million and $0.2 million of interest expense on the lending agreement with SBL for the years ended December 31, 2021 and 2020, respectively. As of December 31, 2021 there was a $50.0 million outstanding balance under the lending agreement.
SBL is an entity that also holds 17,950 of the Company’s outstanding shares of Series D Preferred Stock of which, 14,950 shares were acquired in exchange for an equivalent number of shares of Series A Preferred Stock in March 2021. SBL also acquired an additional 3,000 shares of Series D Preferred Stock at the liquidation preference of $15.0 million (net of accrued and unpaid dividends on the exchanged Series A Preferred Stock) in such transaction.
FRANKLIN BSP REALTY TRUST, INC.
NOTES TO CONSOLIDATED FINANCIAL STATEMENTS
December 31, 20212023
Other Transactions
In Augustthe third quarter of 2021, the Company and an investment fund managed byaffiliate of the AdvisorCompany entered into a joint venture agreement and formed a joint venture entity,the Jeffersonville Member, LLC (the "Jeffersonville JV")JV to acquire a $139.5 million triple net lease property in Jeffersonville, GA. The Company has a 79% interest in the Jeffersonville JV, while the affiliated fund has a 21% interest. The Company invested a total of $109.8 million, made up of $88.7 million in debt and $21.1 million in equity, representing 79% of the ownership interest in the Jeffersonville JV. The affiliated fund made up the remaining $29.8 million composed of a $24.0 million mortgage note payable and $5.7$5.8 million in equity.non-controlling interest. The Company has majority control of Jeffersonville JV with 79% ownership and, therefore, consolidates the accounts of Jeffersonville JV onin its consolidated balance sheet.financial statements. The Company's $88.7 million mortgage note payable to Jeffersonville JV is eliminated in consolidation (see Note 7 - Debt).
Pursuant to the Company's 2021 Incentive Plan, in the first quarter of 2023, the Company issued awards of restricted stock units to its officers and certain other personnel of the Advisor who provide services to the Company under the Advisory Agreement.
As of December 31, 2023, our commercial mortgage loans, held for investment, includes an aggregate of $124.1 million carrying value of loans to affiliates of our Advisor. The Company recognized $10.0 million and $5.0 million in interest income from these loans for the year ended December 31, 2023 and 2022 respectively, in the consolidated statements of operations.
As disclosed in Note 3 - Commercial Mortgage Loans in April 2022, the Company fully funded a $113.2 million first mortgage consisting of 24 retail properties with various locations throughout the United States. The Company entered into a joint venture agreement and formed a joint venture entity, BSPRT Walgreens Portfolio, LLC (the "Walgreens Portfolio") to acquire 75.618% ownership interest in the Walgreens Portfolio, while the affiliated fund has 24.242% interest (see Note 5 - Real Estate Owned).
Note 12 - Share-Based Compensation
Share PlanPlans
The Company maintains the Franklin BSP Realty Trust, Inc.Company's 2021 Equity Incentive Plan (the “2021 Incentive Plan”), pursuant to whichplan provides the Company may, from timewith the ability to time, grant equityequity-based awards to the Company’sits directors, officers and employees (if itthe Company ever has employees), employees of the Advisor and its affiliates, or certain of the Company’sCompany's consultants, advisors or other service providersemployees of entities that provide services to the Company, or an affiliatedirectors of the Company. The 2021 Incentive Plan, which is administered byAdvisor or of entities that provide services to the Compensation CommitteeCompany, the Advisor and its affiliates.
As of the Board of Directors, provides for the grant of awards of share options, share appreciation rights, restricted shares, restricted share units, deferred share units, unrestricted shares, dividend equivalent rights, performance shares and other performance-based awards, other equity-based awards, LTIP units and cash bonus awards.
December 31, 2023, there wThe maximum number of sharesere 4,526,704 shares of common stock remaining available for issuance under the Company's 2021 Incentive Plan is 5,500,000 shares. No awards had been made under the 2021 Incentive Plan as of December 31, 2021.Plan. The Board may amend, suspend or terminate the 2021 Incentive Plan at any time; provided that no amendment, suspension or termination may impair rights or obligations under any outstanding award without the participant’s consent or violate the 2021 Incentive Plan’s prohibition on repricing. The Company's previous plan, the RSP, expired on February 7, 2023.
The Company also has an employeeService-based Restricted Stock and director incentive restricted share plan (the "RSP"), which providesRestricted Stock Units
In accordance with the 2021 Incentive Plan, the Company with the ability to grantissued awards of restricted sharesRSUs to the Company’s directors,its officers and employees (if the Company ever has employees), employeescertain other personnel of the Advisor and its affiliates, employees of entities thatwho provide services to the Company directorsunder the Advisory Agreement.
FRANKLIN BSP REALTY TRUST, INC.
NOTES TO CONSOLIDATED FINANCIAL STATEMENTS
December 31, 2023
Restricted Stock and its affiliates. The total number of common shares grantedRSU activity issued under the RSP shall not exceed 5.0% of the Company’s authorized common shares pursuant to the Offering, and in any event, will not exceed 4.0 million shares (as such number may be adjusted for stock splits, stock distributions, combinations and similar events). The RSP will expire on February 7, 2023.
Restricted share awards entitle the recipient to receive common shares from the Company under terms that provide for vesting over a specified period of time or upon attainment of pre-established performance objectives. Such awards would typically be forfeited with respect to the unvested shares upon the termination of the recipient’s employment or other relationship with the Company. Restricted shares may not, in general, be sold or otherwise transferred until restrictions are removed and the shares have vested. Holders of restricted shares may receive cash distributions prior to the time that the restrictions on the restricted shares have lapsed. Any distributions payable in common shares shall be subject to the same restrictions as the underlying restricted shares. The fair value of the restricted share awards are expensed over the vesting period.
As of December 31, 2021 the Company had granted 56,060 restricted shares to its independent directors, of which 5,333 were forfeited and 39,543 have vested, leaving a balance of 11,184 unvested restricted shares. As of December 31, 2020, the Company had granted 44,876 restricted shares to its independent directors, of which 5,333 were forfeited and 27,823 had vested, leaving a balance of 11,720 unvested restricted shares. The compensation expense associated with the restricted share grants was $0.2 million, $0.2 million and $0.2 million,Incentive Plan for the years ended December 31, 2021, 20202023 and 2019,2022 are summarized below:
| | | | | | | | | | | | | | | | | | | | | | | | | | | | | | | | |
| | Shares Outstanding | | Fourth Quarter 2023 Weighted Average Grant Date Fair Value |
| | For the Years Ended | |
| | December 31, 2023 | | December 31, 2022 | |
| | RSP | | 2021 Incentive Plan | | RSP | | 2021 Incentive Plan | |
| Unvested equity awards outstanding at beginning of period | | 20,934 | | | 492,107 | | | 11,184 | | | — | | | $ | 14.11 | |
| Grants | | — | | | 481,189 | | | 28,143 | | | 492,107 | | | 14.20 | |
| Forfeitures | | — | | | — | | | — | | | — | | | — | |
| Vested | | (20,934) | | | (164,039) | | | (18,393) | | | — | | | 14.34 | |
| Unvested equity awards outstanding at end of period | | — | | | 809,257 | | | 20,934 | | | 492,107 | | | $ | 14.11 | |
The Company recognized compensation expense associated with equity awards of $4.8 million and $2.5 million during the years ended December 31, 2023 and 2022, respectively, and arewhich is included within Other expenses line onin Share-based compensation in the consolidated statements of operations. Unrecognized estimated compensation expense for these awards totaled $7.1 million as of December 31, 2023 to be expensed over a weighted average period of 1.3 years. The fair value of equity awards that vested during the year ended December 31, 2023 was $2.7 million.
Note 13 - Fair Value of Financial Instruments
GAAP establishes a hierarchy of valuation techniques based on the observability of inputs used in measuring financial instruments at fair values. GAAP establishes market-based or observable inputs as the preferred source of values, followed by valuation models using management assumptions in the absence of market inputs. The three levels of the hierarchy are described below:
•Level I - Inputs are unadjusted, quoted prices in active markets for identical assets or liabilities at the measurement date.
FRANKLIN BSP REALTY TRUST, INC.
NOTES TO CONSOLIDATED FINANCIAL STATEMENTS
December 31, 2021
•Level II - Inputs (other than quoted prices included in Level I) are either directly or indirectly observable for the asset or liability through correlation with market data at the measurement date and for the duration of the instrument’s anticipated life.
•Level III - Unobservable inputs that reflect the entity's own assumptions about the assumptions that market participants would use in the pricing of the asset or liability and are consequently not based on market activity, but rather through particular valuation techniques.
The determination of where an asset or liability falls in the above hierarchy requires significant judgment and factors specific to the asset or liability. In instances where the determination of the fair value measurement is based on inputs from different levels of the fair value hierarchy, the level in the fair value hierarchy within which the entire fair value measurement falls is based on the lowest level input that is significant to the fair value measurement in its entirety. The Company evaluates its hierarchy disclosures each quarter and depending on various factors, it is possible that an asset or liability may be classified differently from quarter to quarter.
The Company has implemented valuation control processes to validate the fair value of the Company's financial instruments measured at fair value including those derived from pricing models. These control processes are designed to assure that the values used for financial reporting are based on observable inputs wherever possible. In the event that observable inputs are not available, the control processes are designed to assure that the valuation approach utilized is appropriate and consistently applied and the assumptions are reasonable.
Financial Instruments Measured at Fair Value on a Recurring Basis
CMBSCRE CLO bonds, recorded in realReal estate securities, available for sale, measured at fair value on in the consolidated balance
sheets are valued utilizing both observable and unobservable market inputs. These factors include projected future cash flows, ratings, subordination levels, vintage, remaining lives, credit issues, and recent trades of similar real estate securities. Depending upon the significance of the fair value inputs used in determining these fair values, these real estate securities are
FRANKLIN BSP REALTY TRUST, INC.
NOTES TO CONSOLIDATED FINANCIAL STATEMENTS
December 31, 2023
classified in either Level II or Level III of the fair value hierarchy. As of December 31, 2020, theThe Company obtainedobtains third party pricing for determining the fair value of each CMBSCRE CLO investment, resulting in a Level II classification.
Real estate securities classified as trading, RMBS, are measured at fair value by utilizing a third party pricing service to obtain a current estimated liquid price of the securities. The RMBS are classified in Level II of the fair value hierarchy.
Commercial mortgage loans held for sale, measured at fair value in the Company's TRS are initially recorded at transaction proceeds,price, which are considered to be the best initial estimate of fair value. The Company engaged the services of a third party independent valuation firm to determine fair value of certain investments held by the Company. Fair value is determined using a discounted cash flow model that primarily considers changes in interest rates and credit spreads, weighted average life and current performance of the underlying collateral. Commercial mortgage loans held for sale, measured at fair value that are originated in the last month of the reporting period are held and marked to the transaction proceeds.price. The Company classified the commercial mortgage loans held for sale, measured at fair value as Level III.
Other real estate investments, measured at fair value on in the consolidated balance sheets are valued using unobservable inputs. The Company engaged the services of a third party independent valuation firm to determine fair value of certain investments, including preferred equity investments, held by the Company. Fair value is determined using a discounted cash flow model that primarily considers changes in interest rates and credit spreads, weighted average life and current performance of the underlying collateral. The Company classified the other real estate investments, measured at fair value as Level III.
The fair value for Treasury note futures is derived using market prices. Treasury note futures trade on the Chicago Mercantile Exchange (“CME”). The instruments are a variety of recently issued 10-year U.S. Treasury notes. The future contracts are liquid and are centrally cleared through the CME. Treasury note futures are generally categorized in Level I of the fair value hierarchy.
FRANKLIN BSP REALTY TRUST, INC.
NOTES TO CONSOLIDATED FINANCIAL STATEMENTS
December 31, 2021
The fair value for credit default swaps and interest rate swaps contracts are derived using pricing models that are widely accepted by marketplace participants. Credit default swaps and some interest rate swaps are traded in the OTCover the counter ("OTC") market. The pricing models take into account multiple inputs including specific contract terms, interest rate yield curves, interest rates, credit curves, recovery rates, and/or current credit spreads obtained from swap counterparties and other market participants. Most inputs into the models are not subjective as they are observable in the marketplace or set per the contract. Valuation is primarily determined by the difference between the contract spread and the current market spread. The contract spread (or rate) is generally fixed and the market spread is determined by the credit risk of the underlying debt or reference entity. If the underlying indices are liquid and the OTC market for the current spread is active, credit default swaps and interest rate swaps are categorized in Level II of the fair value hierarchy. If the underlying indices are illiquid and the OTC market for the current spread is not active, credit default swaps are categorized in Level III of the fair value hierarchy. The credit default swaps and
interest rate swaps are generally categorized in Level II of the fair value hierarchy.
The fair value of exchange-traded swap agreements hedging RMBS repurchase agreements are calculated using the net discounted future fixed cash payments and the discounted future variable cash receipts which are based on expected future interest rates derived from observable market interest rate curves. The Company also incorporates both its own nonperformance risk and its counterparties’ nonperformance risk in determining fair value. In considering the effect of nonperformance risk, the Company considered the impact of netting and credit enhancements, such as collateral postings and guarantees, and has concluded that counterparty risk is not significant to the overall valuation. Interest rate swap agreements hedging the Company's RMBS repurchase agreements are measured at fair value on a recurring basis primarily using Level II inputs. The fair value of these derivatives are calculated including accrued interest and net of variation margin amounts received or paid through the exchange, resulting in separately presenting on the balance sheet a significantly reduced fair value amount representing the unsettled fair value of these derivatives.
A review of the fair value hierarchy classification is conducted on a quarterly basis. Changes in the type of inputs may result in a reclassification for certain assets or liabilities. The Company's policy with respect to transfers between levels of the fair value hierarchy is to recognize transfers into and out of each level as of the beginning of the reporting period. There were no material transfers between levels within the fair value hierarchy during the yearsyear ended December 31, 2021 and2023. Material transfers between levels within the fair value hierarchy during the year ended December 31, 2020. 2022 were specifically related to the transfer of ARM Agency Securities from Level II to Level III.
FRANKLIN BSP REALTY TRUST, INC.
NOTES TO CONSOLIDATED FINANCIAL STATEMENTS
December 31, 20212023
The following table presents the Company's financial instruments carried at fair value on a recurring basis in the consolidated balance sheets by its level in the fair value hierarchy as of December 31, 20212023 and 2022 (dollars in thousands). The Company did not have any liabilities carried at fair value as of December 31, 2020 (dollars in thousands):2023. | | December 31, 2021 | Total | | Level I | | Level II | | Level III |
| December 31, 2023 | | | December 31, 2023 |
| Total | | | Total | | Level I | | Level II | | Level III |
| Assets, at fair value | Assets, at fair value | | | | | | | |
| Real estate securities, available for sale, measured at fair value | |
| Real estate securities, available for sale, measured at fair value | |
| Real estate securities, available for sale, measured at fair value | |
| | Total assets, at fair value | |
| | Total assets, at fair value | |
| | Total assets, at fair value | |
| | December 31, 2022 | |
| | December 31, 2022 | |
| | December 31, 2022 | |
| Total | | | Total | | Level I | | Level II | | Level III |
| Assets, at fair value | |
| Real estate securities, available for sale, measured at fair value | |
| Real estate securities, available for sale, measured at fair value | |
| Real estate securities, available for sale, measured at fair value | Real estate securities, available for sale, measured at fair value | $ | — | | | $ | — | | | $ | — | | | $ | — | |
| Real estate securities, trading, measured at fair value | Real estate securities, trading, measured at fair value | 4,566,871 | | | — | | | 4,566,871 | | | — | |
| Commercial mortgage loans, held for sale, measured at fair value | Commercial mortgage loans, held for sale, measured at fair value | 34,718 | | | — | | | — | | | 34,718 | |
| Other real estate investments, measured at fair value | 2,074 | | | — | | | — | | | 2,074 | |
| | Credit default swaps | |
| Credit default swaps | |
| Credit default swaps | |
| Interest rate swaps | |
| Treasury note futures | Treasury note futures | 124 | | | — | | | 124 | | | — | |
| Interest rate swaps | 312 | | | — | | | 312 | | | — | |
| Total assets, at fair value | Total assets, at fair value | $ | 4,604,099 | | | $ | — | | | $ | 4,567,307 | | | $ | 36,792 | |
| | Liabilities, at fair value | Liabilities, at fair value | |
| Liabilities, at fair value | |
| Liabilities, at fair value | |
| | Credit default swaps | Credit default swaps | $ | 1,142 | | | $ | — | | | $ | 1,142 | | | $ | — | |
| | Treasury note futures | — | | | — | | | — | | | — | |
| Unsecured debt-related interest rate swap agreements | 31,153 | | | — | | | 31,153 | | | — | |
| Total liabilities, at fair value | $ | 32,295 | | | $ | — | | | $ | 32,295 | | | $ | — | |
| | December 31, 2020 | |
| Assets, at fair value | |
| Real estate securities, available for sale, measured at fair value | $ | 171,136 | | | $ | — | | | $ | 171,136 | | | $ | — | |
| Real estate securities. trading, measured at fair value | — | | | — | | | — | | | — | |
| Commercial mortgage loans, held for sale, measured at fair value | 67,649 | | | — | | | — | | | 67,649 | |
| Other real estate investments, measured at fair value | 2,522 | | | — | | | — | | | 2,522 | |
| | Interest rate swaps | 25 | | | — | | | 25 | | | — | |
| | Total assets, at fair value | $ | 241,332 | | | $ | — | | | $ | 171,161 | | | $ | 70,171 | |
| | Liabilities, at fair value | |
| Credit default swaps | Credit default swaps | $ | 297 | | | $ | — | | | $ | 297 | | | $ | — | |
| | Treasury note futures | 106 | | | 106 | | | — | | | — | |
| Unsecured debt-related interest rate swap agreements | — | | | — | | | — | | | — | |
| | Credit default swaps | |
| | Total liabilities, at fair value | Total liabilities, at fair value | $ | 403 | | | $ | 106 | | | $ | 297 | | | $ | — | |
| Total liabilities, at fair value | |
| Total liabilities, at fair value | |
FRANKLIN BSP REALTY TRUST, INC.
NOTES TO CONSOLIDATED FINANCIAL STATEMENTS
December 31, 2021
Both observable and unobservable inputs may be used to determine the fair value of positions that the Company has classified within the Level III category. As a result, the unrealized gains and losses for assets and liabilities within the Level III category may include changes in fair value that were attributable to both observable and unobservable inputs. The following table summarizes the valuation method and significant unobservable inputs used for the Company’s financial instruments that are categorized within Level III of the fair value hierarchy as of December 31, 20212023 and December 31, 20202022 (dollars in thousands).
The following table contains the Level III inputs used to value assets and liabilities on a recurring and nonrecurring basis or where the Company discloses fair value as of December 31, 2022. The Company did not hold any applicable positions as of December 31, 2023. | | | | | | | | | | | | | | | | | |
| Asset Category | Fair Value | Valuation Methodologies | Unobservable Inputs (1) | Weighted Average (2) | Range |
| December 31, 2021 | | | | | |
| Commercial mortgage loans, held for sale, measured at fair value | $ | 34,718 | | Discounted Cash Flow | Yield | 3.4% | 3.2% - 4.2% |
| Other real estate investments, measured at fair value | 2,074 | | Discounted Cash Flow | Yield | 10.9% | 9.9% - 11.9% |
| December 31, 2020 | | | | | |
| Commercial mortgage loans, held for sale, measured at fair value | $ | 67,649 | | Discounted Cash Flow | Yield | 16.6% | 15.6% - 17.6% |
| Other real estate investments, measured at fair value | 2,522 | | Broker Quotes | Yield | 13.2% | 12.2% - 14.2% |
| | | | | | | | | | | | | | | | | |
| |
| | | | | |
| | | | | |
| | | | | |
| | | | | |
| | | | | |
| December 31, 2022 |
| Asset Category | Fair Value | Valuation Methodologies | Unobservable Inputs (1) | Weighted Average (2) | Range |
| Commercial mortgage loans, held for sale, measured at fair value | $ | 15,559 | | Discounted Cash Flow | Yield | 7.2% | 6.3% - 7.7% |
| Real estate securities, trading, measured at fair value | $ | 235,728 | | Discounted Cash Flow | Yield | 3.3% | 2.0% - 6.5% |
________________________
(1) In determining certain inputs, the Company evaluates a variety of factors including economic conditions, industry and market developments, market valuations of comparable companies and company specific developments including exit strategies and realization opportunities. The Company has determined that market participants would take these inputs into account when valuing the investments.
(2) Inputs were weighted based on the fair value of the investments included in the range.
FRANKLIN BSP REALTY TRUST, INC.
NOTES TO CONSOLIDATED FINANCIAL STATEMENTS
December 31, 20212023
Increases or decreases in any of the above unobservable inputs in isolation would result in a lower or higher fair value measurement for such assets. The following table presents additional information about the Company’s financial instruments which are measured at fair value on a recurring basis as of December 31, 20212023 and December 31, 20202022 for which the Company has used Level III inputs to determine fair value (dollars in thousands):
| | | | | | | | | | | | | | |
| | December 31, 2021 |
| | Commercial mortgage loans, held for sale, measured at fair value | | Other real estate investments, measured at fair value |
| Beginning balance, January 1, 2021 | | $ | 67,649 | | | $ | 2,522 | |
Transfers into Level III (2) | | — | | | — | |
| Total realized and unrealized gain/(loss) included in earnings: | | | | |
| Realized gain/(loss) on sale of commercial mortgage loan, held for sale | | 24,208 | | | — | |
| Unrealized gain/(loss) on commercial mortgage loans, held for sale and other real estate investments | | 469 | | | (19) | |
| Net accretion | | — | | | (3) | |
| Purchases | | 420,673 | | | — | |
| Sales / paydowns | | (478,281) | | | (426) | |
| | | | |
| Cash repayments/receipts | | — | | | — | |
Transfers out of Level III (2) | | — | | | — | |
| Ending Balance, December 31, 2021 | | $ | 34,718 | | | $ | 2,074 | |
| | | | |
| | December 31, 2020 |
| | Commercial mortgage loans, held for sale, measured at fair value | | Other real estate investments, measured at fair value |
| Beginning balance, January 1, 2020 | | $ | 112,562 | | | $ | 2,557 | |
Transfers into Level III (2) | | 23,625 | | | — | |
| Total realized and unrealized gain/(loss) included in earnings: | | | | |
| Realized gain/(loss) on sale of commercial mortgage loan, held for sale | | 15,931 | | | — | |
| Unrealized gain/(loss) on commercial mortgage loans, held for sale and other real estate investments | | (75) | | | (32) | |
| Net accretion | | — | | | (3) | |
Purchases (1) | | 267,552 | | | — | |
Sales / paydowns (1) | | (328,321) | | | — | |
| Cash repayments/receipts | | — | | | — | |
Transfers out of Level III (2) | | (23,625) | | | — | |
December 31, 2020 balance (2) | | $ | 67,649 | | | $ | 2,522 | |
| | | | | | | | | | | | | | | |
| | December 31, 2023 |
| | Commercial mortgage loans, held for sale, measured at fair value | | Real estate securities, trading, measured at fair value | |
| Beginning balance, January 1, 2023 | | $ | 15,559 | | | $ | 235,728 | | |
Transfers into Level III (1) | | — | | | — | | |
| Total realized and unrealized gain/(loss) included in earnings: | | | | | |
| Realized gain/(loss) on sale of commercial mortgage loan, held for sale | | 3,873 | | | — | | |
| | | | | |
| Unrealized gain/(loss) on commercial mortgage loans, held for sale and other real estate investments | | 44 | | | — | | |
| Trading gain/(loss) | | — | | | (605) | | |
| | | | | |
| Originations | | 102,500 | | | — | | |
| Sales / paydowns | | (121,976) | | | (235,123) | | |
| | | | | |
| | | | | |
Transfers out of Level III (1) | | — | | | — | | |
| Ending balance, December 31, 2023 | | $ | — | | | $ | — | | |
________________________(1) Excluded from Purchases and Sales/paydowns are $679.1 million and $682.0 million, respectively,There were no transfers in or out of loans that collateralize a CMBS investment required to be consolidated in connection with the Company's retentionLevel III as of the B tranche during the year ended December 31, 2020. Upon disposition of the B tranche during the year ended December 31, 2020, the Company recognized a gain of $2.8 million that is recorded in Realized gain/loss on sale of real estate securities on the consolidated statements of operations.2023.
| | | | | | | | | | | | | | | | | | | | |
| | December 31, 2022 |
| | Commercial mortgage loans, held for sale, measured at fair value | | Real estate securities, trading, measured at fair value | | Other real estate investments, measured at fair value |
| Beginning balance, January 1, 2022 | | $ | 34,718 | | | $ | — | | | $ | 2,074 | |
Transfers into Level III (1) | | — | | | 4,566,871 | | | — | |
| Total realized and unrealized gain/(loss) included in earnings: | | | | | | |
| Realized gain/(loss) on sale of commercial mortgage loan, held for sale | | 2,358 | | | — | | | — | |
| Realized gain/(loss) on sale of available for sale trading securities | | — | | | — | | | (33) | |
| Unrealized gain/(loss) on commercial mortgage loans, held for sale and other real estate investments | | (511) | | | — | | | 4 | |
| Trading gain/(loss) | | — | | | (119,220) | | | — | |
| | | | | | |
| Originations | | 366,692 | | | — | | | — | |
| Sales / paydowns | | (387,698) | | | (4,211,923) | | | (2,045) | |
| | | | | | |
Transfers out of Level III (1) | | — | | | — | | | — | |
| Ending balance, December 31, 2022 | | $ | 15,559 | | | $ | 235,728 | | | $ | — | |
________________________(2)(1) Transfers in andinto Level III include transfers related to ARM Agency Securities transferred from Level II. There were no transfers out include transfers between Commercial mortgage loans, held for sale and Commercial mortgage loans, held for investment.
FRANKLIN BSP REALTY TRUST, INC.
NOTES TO CONSOLIDATED FINANCIAL STATEMENTS
December 31, 2021
The fair value of cash and cash equivalents and restricted cash are measured using observable quoted market prices, or Level I inputs and their carrying value approximates their fair value. The fair value of borrowings under repurchase agreements approximate their carrying value onin the consolidated balance sheets due to their short-term nature and are measured using Level IIIII inputs.
Financial Instruments Measured at Fair Value on a Nonrecurring Basis
Real Estate Owned, held for sale, recorded in Real estate owned, held for sale in the consolidated balance sheets are
FRANKLIN BSP REALTY TRUST, INC.
NOTES TO CONSOLIDATED FINANCIAL STATEMENTS
December 31, 2023
valued at fair value on a non-recurring basis in accordance with ASC 820. As of December 31, 2023 and 2022, there were no Real estate owned, held for sale assets measured at fair value on a nonrecurring basis in the consolidated balance sheets.
As of September 30, 2023, our Real estate owned, held for sale assets and liabilities, measured at fair value on a nonrecurring basis in the consolidated balance sheets, had an aggregate fair value of $91.4 million, net, that represented the remaining 23 retail properties in the Walgreens Portfolio and were written down to estimated fair value less cost to sell for impairment purposes and were classified as Level III investments. The significant unobservable inputs utilized in the analysis were the exit capitalization rates, which ranged from 5.00%-5.75%.
Financial Instruments Not Measured at Fair Value
The fair values of the Company's commercial mortgage loans, held for investmentfinancial assets and collateralized loan obligations, whichliabilities that are not reported at fair value onin the consolidated balance sheets are reported below as of December 31, 20212023 and 20202022 (dollars in thousands): | | | | | | | | | | | | | | | | | | | | | | | |
| | | Level | | Carrying Amount | | Fair Value |
| December 31, 2021 | | | | | | | |
Commercial mortgage loans, held for investment (1) | Asset | | III | | $ | 4,226,888 | | | $ | 4,249,118 | |
| Collateralized loan obligations | Liability | | III | | 2,162,190 | | | 2,181,571 | |
| Mortgage note payable | Liability | | III | | 23,998 | | | 23,998 | |
| Other financing and loan participation - commercial mortgage loans | Liability | | III | | 37,903 | | | 37,903 | |
| Unsecured debt | Liability | | III | | 148,594 | | | 125,400 | |
| December 31, 2020 | | | | | | | |
Commercial mortgage loans, held for investment (1) | Asset | | III | | $ | 2,714,734 | | | $ | 2,724,039 | |
| Collateralized loan obligation | Liability | | III | | 1,625,498 | | | 1,606,478 | |
| Mortgage Note Payable | Liability | | III | | 29,167 | | | 29,167 | |
| Other financing and loan participation - commercial mortgage loans | Liability | | III | | 31,379 | | | 31,379 | |
| | | | | | | | | | | | | | | | | | | | | | | | | | | | | | | | | | | | | | | | | |
| | | December 31, 2023 | | December 31, 2022 |
| | | Level | | Carrying Amount | | Fair Value | | Level | | Carrying Amount | | Fair Value |
Commercial mortgage loans, held for investment (1) | Asset | | III | | $ | 5,036,942 | | | $ | 5,010,580 | | | III | | $ | 5,269,776 | | | $ | 5,278,495 | |
Collateralized loan obligation (2) | Liability | | II | | 3,567,166 | | | 3,521,274 | | | III | | 3,121,983 | | | 3,055,810 | |
| Mortgage note payable | Liability | | III | | 23,998 | | | 23,998 | | | III | | 23,998 | | | 23,998 | |
| Other financings | Liability | | III | | 36,534 | | | 36,534 | | | III | | 76,301 | | | 76,301 | |
| Unsecured debt | Liability | | III | | 81,295 | | | 64,900 | | | III | | 98,695 | | | 66,300 | |
________________________
(1) The carrying value is gross of $15.8$47.2 million and $20.9$40.8 million of allowance for credit losses as of December 31, 20212023 and 2022, respectively.
(2) Depending upon the significance of the fair value inputs utilized in determining these fair values, our collateralized loan obligations are classified in either Level II or Level III of the fair value hierarchy. Beginning in the third quarter of 2023, the transfers from Level III to Level II were a result of the availability of current and reliable market data provided by third party pricing services or other valuation techniques which utilized observable inputs.
Repurchase agreements - commercial mortgage loans of $299.7 million and $680.9 million as of December 31, 2020, respectively.2023 and 2022, respectively, and repurchase agreements - real estate securities of $174.1 million and $440.0 million as of December 31, 2023 and 2022, respectively, are not carried at fair value and do not include accrued interest, which are presented in Note 7 – Debt. For these instruments, carrying value generally approximates fair value and are classified as Level III.
The fair value of the commercial mortgage loans, held for investment is estimated using a discounted cash flow analysis, based on the Advisor's experience with similar types of investments. The Company estimates the fair value of the collateralized loan obligations using external broker quotes. The fair value of the other financing and loan participation-commercial mortgage loans is generally estimated using a discounted cash flow analysis. At December 31, 2021, the Mortgage note payable was initially recorded at transaction proceeds, which are considered to be the best initial estimate of fair value. The fair value of the unsecured borrowingsOther financings is generally estimated using a discounted cash flow analysis. The fair value of the Unsecured debt is based on discounted cash flows using Company estimates for market yields on similarly structured debt instruments.
FRANKLIN BSP REALTY TRUST, INC.
NOTES TO CONSOLIDATED FINANCIAL STATEMENTS
December 31, 2021
Note 14 - Derivative Instruments
The Company uses derivative instruments primarily to manage the fair value variability of fixed rate assets caused by interest rate fluctuations and overall portfolio market risk.
FRANKLIN BSP REALTY TRUST, INC.
NOTES TO CONSOLIDATED FINANCIAL STATEMENTS
December 31, 2023
As of December 31, 2021, the net premiums received on2023, there were no derivative instrument assets were $6.5 million.
instruments outstanding. The following derivative instruments were outstanding as of December 31, 2021 and December 31, 20202022 (dollars in thousands): | | | | | Fair Value | |
| | | | Fair Value | |
| | | | Fair Value | |
| Contract type | |
| Contract type | |
| Contract type | |
| | Fair Value | |
| Contract type | | Notional | | Assets | | Liabilities | |
| As of December 31, 2021 | | | | | |
| As of December 31, 2022 | |
| | As of December 31, 2022 | |
| | As of December 31, 2022 | |
| Credit default swaps | |
| Credit default swaps | |
| Credit default swaps | Credit default swaps | | $ | 47,000 | | | $ | — | | | $ | 1,142 | | |
| Interest rate swaps | Interest rate swaps | | 3,649,500 | | | 312 | | | — | | |
| Interest rate swaps on unsecured debt | | 100,000 | | | — | | | 31,153 | | |
| Interest rate swaps | |
| Interest rate swaps | |
| Treasury note futures | |
| Treasury note futures | |
| Treasury note futures | Treasury note futures | | 360 | | | 124 | | | — | | |
| Total | Total | | $ | 3,796,860 | | | $ | 436 | | | $ | 32,295 | | |
| | As of December 31, 2020 | | |
| Credit default swaps | | $ | 46,000 | | | $ | — | | | $ | 297 | | |
| Interest rate swaps | | 32,517 | | | 25 | | | — | | |
| Treasury note futures | | 43,500 | | | — | | | 106 | | |
| Total | Total | | $ | 122,017 | | | $ | 25 | | | $ | 403 | | |
| Total | |
The following table indicates the net realized and unrealized gains and losses on derivatives, by primary underlying risk exposure, as included in loss on derivative instruments in the consolidated statements of operations for the year ended December 31, 20212023, 2022 and December 31, 2020:2021:
| | | | | | | | | | | | | | | | | | | | | | | | | | | | | | |
| | Year Ended December 31, 2021 | | Year Ended December 31, 2020 |
| Contract type | | Unrealized
(Gain)/Loss | | Realized
(Gain)/Loss | | | | Unrealized
(Gain)/Loss | | Realized
(Gain)/Loss | | |
| Credit default swaps | | $ | (101) | | | $ | 650 | | | | | $ | (143) | | | $ | 323 | | | |
| Interest rate swaps | | (7,070) | | | 70 | | | | | 296 | | | 7,463 | | | |
| Treasury note futures | | (231) | | | (1,478) | | | | | 842 | | | 4,665 | | | |
| Options | | — | | | 274 | | | | | — | | | 35 | | | |
| Total | | $ | (7,402) | | | $ | (484) | | | | | $ | 995 | | | $ | 12,486 | | | |
The following table includes disclosures regarding components of unsecured debt-related effects on interest expense and other comprehensive income for the year ended December 31, 2021 and December 31, 2020:
| | | | | | | | | | | | | | |
| | Year Ended December 31, 2021 | | Year Ended December 31, 2020 |
Related to the statement of operations | | | | |
Amount of loss reclassified from other comprehensive income (1)
| | $ | (790) | | | $ | — | |
| | | | |
Related to other comprehensive income | | | | |
Amount of gain/(loss) recognized in other comprehensive income | | $ | (852) | | | $ | — | |
________________________(1) Included in interest expense in the consolidated statements of operations
FRANKLIN BSP REALTY TRUST, INC.
NOTES TO CONSOLIDATED FINANCIAL STATEMENTS
December 31, 2021
The merger with Capstead has expanded the Company's portfolio of derivatives to additionally hedge the variability of the underlying benchmark interest rate of current and forecasted 30- to 90-day repurchase agreements. The Company attempts to mitigate exposure to higher interest rates primarily by entering into pay-fixed, receive-variable, interest rate swap agreements for terms between eighteen months and three years. From an economic perspective, this hedge relationship establishes a relatively stable fixed rate on related debt because the variable-rate payments received on the swap agreements offset a significant portion of the interest accruing on the debt, leaving the fixed-rate swap payments as the Company’s effective borrowing rate. Additionally, changes in fair value of these derivatives tend to offset opposing changes in fair value of the Company’s residential mortgage investments that can occur in response to changes in market interest rates.
Subsequent to the completion of the merger through December 31, 2021, the Company did not enter into any additional swap agreements and no swaps had matured. In the fourth quarter of 2021, the Company terminated $600 million notional amount of swaps related to the ARM portfolio requiring fixed-rate interest payments averaging 0.3%. Subsequent to December 31, 2021, the Company entered into swap agreements with notional amounts totaling $1 billion requiring fixed-rate interest payments averaging 0.98% and terminated $2.90 billion notional amount of swaps requiring fixed-rate interest payments averaging 0.28%.
At December 31, 2021, the Company’s trading securities portfolio financing-related swap positions, all of which were either SOFR or OIS-indexed, had the following characteristics (dollars in thousands):
| | | | | | | | | | | | | | |
| Period of Contract Expiration | | Swap Notional
Amounts | | Average Fixed Rates |
| Second quarter 2022 | | $ | 400,000 | | | 0.02 | % |
| Third quarter 2022 | | 1,200,000 | | | 0.01 | % |
| Fourth quarter 2022 | | 800,000 | | | 0.07 | % |
| First quarter 2023 | | 50,000 | | | 0.13 | % |
| Second quarter 2023 | | 350,000 | | | 0.20 | % |
| Third quarter 2023 | | 100,000 | | | 0.03 | % |
| Fourth quarter 2023 | | 374,500 | | | 0.09 | % |
| First quarter 2024 | | 150,000 | | | 0.28 | % |
| Second quarter 2024 | | 225,000 | | | 0.32 | % |
| | $ | 3,649,500 | | | |
| | | | | | | | | | | | | | | | | | | | | | | | | | | | | | | | | | | | | | | | | | |
| | Year Ended
December 31, 2023 | | Year Ended
December 31, 2022 | | Year Ended
December 31, 2021 | | |
| Contract type | | Unrealized
gain/(loss) | | Realized
gain/(loss) | | | | Unrealized
gain/(loss) | | Realized
gain/(loss) | | Unrealized
gain/(loss) | | Realized
gain/(loss) | | |
| Credit default swaps | | $ | 41 | | | $ | (36) | | | | | $ | 147 | | | $ | (405) | | | $ | 101 | | | $ | (650) | | | |
| Interest rate swaps | | (90) | | | 672 | | | | | (15,954) | | | 59,499 | | | 7,070 | | | (70) | | | |
| Treasury note futures | | (91) | | | 362 | | | | | (33) | | | 939 | | | 231 | | | 1,478 | | | |
| Options | | — | | | — | | | | | — | | | — | | | — | | | (274) | | | |
| Total | | $ | (140) | | | $ | 998 | | | | | $ | (15,840) | | | $ | 60,033 | | | $ | 7,402 | | | $ | 484 | | | |
The Company has three-month LIBOR-indexed, pay-fixed, receive-variable, interest rate swap agreements with notional amounts totaling $100 million and average fixed ratespaired out of 4.09% with 20-year payment terms coinciding with the floating-rate terms of the Company’s unsecured debt that mature in 2035 and 2036. These derivatives, which are designated as cash flow hedges for accounting purposes, hedge the variability of the underlying benchmark interest rate associated with the floating-rate terms of these long-term borrowings. Subsequent to year-end, the Company terminated the entirety of its $100 million notional amountARM portfolio-related swap agreements and does not hold any derivative positions related to the trading securities as of unsecured debt-related swap agreements.December 31, 2023 and 2022.
Interest rate swap agreements are measured at fair value on a recurring basis primarily using Level TwoII Inputs in accordance with ASU 2010-06, Fair Value Measurements and Disclosures (Topic 820). In determining fair value estimates for swaps, Thethe Company utilizes the standard methodology of netting the discounted future fixed cash payments and the discounted future variable cash receipts which are based on expected future interest rates derived from observable market interest rate curves. The Company also incorporates both its own nonperformance risk and its counterparties’ nonperformance risk in determining fair value. In considering the effect of nonperformance risk, the Company considered the impact of netting and credit enhancements, such as collateral postings and guarantees, and has concluded that counterparty risk is not significant to the overall valuation.
The fair value of exchange-traded swap agreements hedging repurchase agreements is calculated including accrued interest and net of variation margin amounts received or paid through the exchange, resulting in separately presenting on the balance sheet a fair value amount representing the unsettled fair value of these derivatives. Non-exchange traded swap agreements held as cash flow hedges of unsecured debt are reported at fair value calculated excluding accrued interest. At December 31, 2021, Cash collateral receivable from derivative counterparties includes initial margin for all derivatives and variation margin for non-exchange traded derivatives. Accrued interest for non-exchange traded swap agreements is included in accounts payable and accrued expenses.
FRANKLIN BSP REALTY TRUST, INC.
NOTES TO CONSOLIDATED FINANCIAL STATEMENTS
December 31, 20212023
Note 15 - Offsetting Assets and Liabilities
The Company's consolidated balance sheets used a gross presentation of repurchase agreements and collateral pledged. The table below provides a gross presentation, the effects of offsetting and a net presentation of the Company's derivative instruments and repurchase agreements within the scope of ASC 210-20, Balance Sheet—Offsetting, as of December 31, 20212023 and December 31, 20202022 (dollars in thousands): | | | | | | | | | | | | | | | | | | | | | | | | | | | | | | | | | | | | | | |
| | | | | | | Gross Amounts Not Offset on the Balance Sheet | |
| Assets | | Gross Amounts of Recognized Assets | | Gross Amounts Offset on the Balance Sheet | | Net Amount of Assets Presented on the Balance Sheet | | Financial Instruments | | Cash Collateral (1) | | Net Amount |
| December 31, 2021 | | | | | | | | | | | | |
| Derivative instruments, at fair value | | $ | 436 | | | $ | — | | | $ | 436 | | | $ | — | | | $ | — | | | $ | 436 | |
| December 31, 2020 | | | | | | | | | | | | |
| Derivative instruments, at fair value | | $ | 25 | | | $ | — | | | $ | 25 | | | $ | — | | | $ | — | | | $ | 25 | |
| | | | | | | | | | | | | | | | | | | | | | | | | | | | | | | | | | | | | | |
| | | | | | | Gross Amounts Not Offset on the Balance Sheet | |
Assets(1) | | Gross Amounts of Recognized Assets | | Gross Amounts Offset on the Balance Sheet | | Net Amount of Assets Presented on the Balance Sheet | | Financial Instruments | | Cash Collateral (2) | | Net Amount |
| | | | | | | | | | | | |
| | | | | | | | | | | | |
| December 31, 2022 | | | | | | | | | | | | |
| Derivative instruments, at fair value | | $ | 415 | | | $ | — | | | $ | 415 | | | $ | — | | | $ | — | | | $ | 415 | |
| | | | | | | | Gross Amounts Not Offset on the Balance Sheet | |
| Liabilities | |
| Liabilities | |
| Liabilities | | | Gross Amounts of Recognized Liabilities | | Gross Amounts Offset on the Balance Sheet | | Net Amount of Assets Presented on the Balance Sheet | | Financial Instruments | | Cash Collateral (2) | | Net Amount |
| December 31, 2023 | |
| Repurchase agreements, commercial mortgage loans | |
| Repurchase agreements, commercial mortgage loans | |
| Repurchase agreements, commercial mortgage loans | |
| Repurchase agreements, real estate securities | |
| | Gross Amounts Not Offset on the Balance Sheet | |
| Liabilities | | Gross Amounts of Recognized Liabilities | | Gross Amounts Offset on the Balance Sheet | | Net Amount of Assets Presented on the Balance Sheet | | Financial Instruments | | Cash Collateral (1) | | Net Amount |
| December 31, 2021 | | | | | | | | | | | | |
| December 31, 2022 | |
| December 31, 2022 | |
| December 31, 2022 | |
| Repurchase agreements, commercial mortgage loans | |
| Repurchase agreements, commercial mortgage loans | |
| Repurchase agreements, commercial mortgage loans | Repurchase agreements, commercial mortgage loans | | $ | 1,019,600 | | | $ | — | | | $ | 1,019,600 | | | $ | 1,460,317 | | | $ | 5,015 | | | $ | — | |
| Repurchase agreements, real estate securities | Repurchase agreements, real estate securities | | 4,178,784 | | | — | | | 4,178,784 | | | 4,370,239 | | | — | | | — | |
| Derivative instruments, at fair value | Derivative instruments, at fair value | | 32,295 | | | — | | | 32,295 | | | — | | | 64,393 | | | — | |
| December 31, 2020 | |
| Repurchase agreements, commercial mortgage loans | | $ | 276,340 | | | $ | — | | | $ | 276,340 | | | $ | 496,030 | | | $ | 5,016 | | | $ | — | |
| Repurchase agreements, real estate securities | | 186,828 | | | — | | | 186,828 | | | 245,956 | | | 1,146 | | | — | |
| Derivative instruments, at fair value | | 403 | | | — | | | 403 | | | — | | | 3,435 | | | — | |
________________________
(1) These cash collateral amounts are recordedAs of December 31, 2023, there were no assets which were presented gross within the scope of ASC 210-20, Balance Sheet—Offsetting.
(2) Included in Restricted cash Accounts payable and accrued expenses and Cash collateral receivable from derivative counterparties balances on in the consolidated balance sheets.
FRANKLIN BSP REALTY TRUST, INC.
NOTES TO CONSOLIDATED FINANCIAL STATEMENTS
December 31, 20212023
Note 16 - Segment Reporting
The Company conducts its business through the following reporting segments:
•The real estate debt business focuses on originating, acquiring and asset managing commercial real estate debt investments, including first mortgage loans,mortgages, subordinate mortgages, mezzanine loans and participations in such loans.
•The real estate securities business focuses on investing in and asset managing real estate securities. Historically this business has focused primarily on CMBS, unsecured REIT debt,CRE CLO bonds, CDO notes, and other securities. As a result of the October 2021 acquisition of Capstead, the Company acquired and continues to hold a significant portfolio of Residential Mortgage Backed Securities (“RMBS”) in the form of the ARM Agency Securities. AsThe portfolio was completely divested by the third quarter of December 31, 2021, all of the real estate securities in this segment were ARM Agency Securities acquired in the Capstead acquisition.2023.
•The commercial real estate conduit business operated through the Company's TRS, which is focused on generating risk-adjusted returns by originating and subsequently selling fixed-rate commercial real estate loans into the CMBS securitization market at a profit. The TRS may also hold certain mezzanine loans that don't qualify as good REIT assets due to any potential loss from foreclosure.
•The real estate owned business represents real estate acquired by the Company through foreclosure, deed in lieu of foreclosure, or purchase.
Profit or loss on segment operations is measured by Net income/(loss) included in the consolidated statements of operations. The following table represents the Company's operations by segment for the years ended December 31, 2021, December 31, 20202023, 2022 and December 31, 20192021 (dollars in thousands):
| | December 31, 2023 | | December 31, 2023 | | Total | | Real Estate Debt and Other Real Estate Investments | | Real Estate Securities | | TRS | | Real Estate Owned |
| Interest income | |
| Revenue from real estate owned | |
| Interest expense | |
| Net income/(loss) | |
| Total assets as of December 31, 2023 | |
| | December 31, 2022 | |
| December 31, 2022 | |
| December 31, 2022 | |
| Interest income | |
| Interest income | |
| Interest income | |
| Revenue from real estate owned | |
| Interest expense | |
| Net income/(loss) | |
| Total assets as of December 31, 2022 | |
| | December 31, 2021 | December 31, 2021 | | Total | | Real Estate Debt and Other Real Estate | | Real Estate Securities | | TRS | | Real Estate Owned |
| December 31, 2021 | |
| December 31, 2021 | |
| Interest income | |
| Interest income | |
| Interest income | Interest income | | $ | 216,890 | | | $ | 189,090 | | | $ | 24,740 | | | $ | 3,060 | | | $ | — | |
| Revenue from real estate owned | Revenue from real estate owned | | 4,759 | | | — | | | — | | | — | | | 4,759 | |
| Interest expense | Interest expense | | 60,835 | | | 54,774 | | | 3,682 | | | 992 | | | 1,387 | |
| Net income/(loss) | Net income/(loss) | | 25,702 | | | 86,863 | | | (85,381) | | | 13,149 | | | 11,071 | |
| Total assets as of December 31, 2021 | Total assets as of December 31, 2021 | | 9,474,701 | | | 4,205,883 | | | 5,054,394 | | | 72,840 | | | 141,584 | |
| December 31, 2020 | |
| Interest income | | $ | 179,872 | | | $ | 165,907 | | | $ | 10,854 | | | $ | 3,111 | | | $ | — | |
| Revenue from real estate owned | | 4,299 | | | — | | | — | | | — | | | 4,299 | |
| Interest expense | | 66,556 | | | 54,480 | | | 7,914 | | | 2,185 | | | 1,977 | |
| Net income/(loss) | | 54,746 | | | 66,383 | | | (7,207) | | | (5,559) | | | 1,129 | |
| Total assets as of December 31, 2020 | | 3,189,761 | | | 2,866,790 | | | 175,088 | | | 105,364 | | | 42,519 | |
| December 31, 2019 | |
| Interest income | | $ | 195,299 | | | $ | 181,434 | | | $ | 6,149 | | | $ | 7,716 | | | $ | — | |
| Revenue from real estate owned | | 3,169 | | | — | | | — | | | — | | | 3,169 | |
| Interest expense | | 90,418 | | | 83,597 | | | 2,911 | | | 3,670 | | | 240 | |
| Net income/(loss) | | 83,924 | | | 61,936 | | | 3,238 | | | 19,130 | | | (380) | |
| Total assets as of December 31, 2019 | | 3,540,620 | | | 2,964,233 | | | 388,170 | | | 131,193 | | | 57,024 | |
For the purposes of the table above, any expenses not associated with a specific segmentmanagement fees have been allocated to the business segments using aan agreed upon percentage of each respective segment's prior period equity. Administrative fees are derived by usingfrom an agreed upon reimbursable amount based on employee time charged and allocated to the sum of commercial mortgage loans originated during the year as the denominator and commercial mortgage loans, held for investment net of allowance and commercial mortgage loans, held for sale, measured at fair value as numerator.business segments.
FRANKLIN BSP REALTY TRUST, INC.
NOTES TO CONSOLIDATED FINANCIAL STATEMENTS
December 31, 20212023
Note 17 - Income Taxes
The Company has conducted its operations to qualify as a REIT for U.S. federal income tax purposes beginning with its taxable year ended December 31, 2013. As a REIT, if the Company meets certain organizational and operational requirements and distributes at least 90% of its "REIT taxable income" (determined before the deduction of dividends paid and excluding net capital gains) to its stockholders in a year, it will not be subject to U.S. federal income tax to the extent of the income that it distributes. However, even if the Company qualifies for taxation as a REIT, it may be subject to certain state and local taxes on income in addition to U.S. federal income and excise taxes on its undistributed income. The Company, through its TRSs, is indirectly subject to U.S. federal, state and local income taxes. The Company’s TRSs are not consolidated for U.S. federal income tax purposes, but is instead taxed as a C corporations. For financial reporting purposes, the TRSs are consolidated and a provision for current and deferred taxes is established for the portion of earnings recognized by the Company with respect to its interest in its TRSs. Total (provision)/benefit for income tax expense (benefit)taxes for the years ended December 31, 2023, 2022 and 2021 were $2.8 million, $0.4 million and $(3.6) million, respectively. As of December 31, 20202023, our taxable REIT subsidiaries have an estimated $13.1 million of federal net operating loss ("NOL") carryforwards and $5.7 million of state and local NOL carryforwards. The NOL carryforwards are subject to certain limitations. The Company has analyzed and determined that future earnings of the Company's TRS are sufficient to support a conclusion that valuation allowance is not necessary as of December 31, 2019 were $3.6 million, $(2.1) million and $4.5 million, respectively.2023.
The Company uses a more-likely-than-not threshold for recognition and derecognition of tax positions taken or to be taken in a tax return. The Company has assessed its tax positions for all open tax years beginning with December 31, 2018 and concluded that there were no uncertainties to be recognized. The Company’s accounting policy with respect to interest and penalties related to tax uncertainties is to classify these amounts as provision for income taxes.
Components of the provision for income taxes consist of the following (dollars in thousands):
| | | | | | | | | | | | | | | | | |
| Year Ended December 31, |
| 2021 | | 2020 | | 2019 |
| Current expense/(benefit) | | | | | |
| U.S. Federal | $ | 3,093 | | | $ | (2,086) | | | $ | 4,076 | |
| State and local | 349 | | | 370 | | | 397 | |
| Total current expense/(benefit) | $ | 3,442 | | | $ | (1,716) | | | $ | 4,473 | |
| Deferred expense/(benefit) | | | | | |
| U.S. Federal | $ | (1) | | | $ | — | | | $ | 10 | |
| State and local | 158 | | | (346) | | | — | |
| Total deferred expense/(benefit) | $ | 157 | | | $ | (346) | | | $ | 10 | |
| Provision for income tax expense/(benefit) | $ | 3,599 | | | $ | (2,062) | | | $ | 4,483 | |
| | | | | | | | | | | | | | | | | |
| Year Ended December 31, |
| 2023 | | 2022 | | 2021 |
| Current (provision)/benefit for income taxes | | | | | |
| U.S. Federal | $ | (12) | | | $ | 65 | | | $ | (3,093) | |
| State and local | (1) | | | 167 | | | (349) | |
| Total current (provision)/benefit for income taxes | $ | (13) | | | $ | 232 | | | $ | (3,442) | |
| Deferred (provision)/benefit for income taxes | | | | | |
| U.S. Federal | $ | 2,670 | | | $ | 99 | | | $ | 1 | |
| State and local | 100 | | | 68 | | | (158) | |
| Total deferred (provision)/benefit for income taxes | $ | 2,770 | | | $ | 167 | | | $ | (157) | |
| Total (provision)/benefit for income taxes | $ | 2,757 | | | $ | 399 | | | $ | (3,599) | |
The tax characteristics of $1.26$1.42 distributions per common share of Common Stock declared during 20212023 was $1.22$1.42 ordinary income and $0.04 capital gain.income. The tax characteristics of the $353.08 distributions per share of Series A Preferred stock declared during 2021 was $343.03 ordinary income and $10.05 capital gain. The tax characteristics of the $377.02 per share of Series C Preferred Stock and Series D Preferred stock declared during 2021 was $366.29 ordinary income and $10.73 capital gain. The tax characteristics of the $0.35 distributions per share of Series F Preferred stock declared during 2021 was $0.34 ordinary income and $0.01 capital gain. The tax characteristics of the $0.47 distributions$1.88 per share of Series E Preferred stockStock declared during 20212023 was $0.46$1.88 ordinary income and $0.01 capital gain.income. The tax characteristics of the $1.42 per as-converted share of Series H Preferred Stock declared during 2023 was $1.42 ordinary income. The ordinary income per share of each stockholder represents the amount of ordinary dividends that may be eligible for the 20% deduction applicable to qualified REIT dividends under Section 199A.
The tax characteristics of the $1.30 distributions per common share declared during 2020 was $1.24 ordinary income and $0.06 capital gain. Of the $1.24 of ordinary income, $1.24 represents the amount of the ordinary dividend that may be eligible for the 20% deduction applicable to qualified REIT dividends under Internal Revenue Code Section 199A.
The tax characteristics of the $390.48$1.42 distributions per common share declared during 2022 was $1.42 ordinary income. The tax characteristics of the $318.66 distributions per share of Series AC Preferred Stock andstock declared during 2022 was $318.66 ordinary income. The tax characteristics of the $106.22 per share of Series CI Preferred Stock declared during 20202022 was $370.93$106.22 ordinary income. The Series D Preferred Stock was exchanged for an equivalent number of shares of Series H Preferred Stock on June 24, 2022 and the tax characteristics of the $424.86 per share declared during 2022 was $424.86 ordinary income. The tax characteristics of the $0.355 distributions per share of Series F Preferred stock declared during 2022, prior to converting on a one-for-one basis into shares of Common Stock, was $0.355 ordinary income. The tax characteristics of the $1.875 distributions per share of Series E Preferred stock declared during 2022 was $1.875 ordinary income. The ordinary income and $19.55 capital gain. Of the $370.93per share of ordinary income, $370.93each stockholder represents the amount of the ordinary dividenddividends that may be eligible for the 20% deduction applicable to qualified REIT dividends under Section 199A.
The Company utilizes the TRSs to reduce the impact of the prohibited transaction tax and to avoid penalty for the holding of assets not qualifying as real estate assets for purposes of the REIT asset tests. Any income associated with a TRS is fully taxable because the TRS is subject to federal and state income taxes as a domestic C corporation based upon its net income.
FRANKLIN BSP REALTY TRUST, INC.
NOTES TO CONSOLIDATED FINANCIAL STATEMENTS
December 31, 20212023
On March 27, 2020, the Coronavirus Aid, Relief, and Economic Security Act (CARES Act) was enacted in response to the COVID-19 pandemic. The CARES Act, among other things, permits NOL carryovers and carrybacks to offset 100% of taxable income for taxable years beginning before 2021. In addition, the CARES Act allows NOLs incurred in 2018, 2019, and 2020 to be carried back to each of the five preceding taxable years to generate a refund of previously paid income taxes. The Company utilized the carryback provision in the CARES Act relating to the 2020 tax year NOL and is awaiting the refund.
Note 18 - Merger with Capstead
On October 19, 2021, the Company, Rodeo Sub I, LLC, a wholly-owned subsidiary of the Company (“Merger Sub”), Capstead Mortgage Corporation (“Capstead”), and the Advisor completed the Merger pursuant to the terms of the Merger Agreement. On the Closing Date, Capstead merged with and into Merger Sub, with Merger Sub continuing as the surviving company.
Asset Acquisition
The Company accounted for the acquisition of Capstead in accordance with Accounting Standards Codification Topic 805, “Business Combinations,” which is referred to as ASC 805. The Company determined the transaction did not meet the definition of a business combination under ASC 805 and was accounted for as an asset acquisition since substantially all of the fair value of the gross assets acquired was concentrated in a group of similar identifiable assets, a portfolio of agency mortgage-backed securities, which Capstead previously recognized as available for sale. In an asset acquisition, goodwill is not recognized, and any excess consideration transferred over the fair value of the net identifiable assets acquired is allocated on a relative fair value basis to the acquired assets.
The Company measured the cost of the net identifiable assets acquired on the basis of the fair value of the consideration given, inclusive of transaction costs, which was determined to be more reliably measurable. The fair value of the consideration paid of $870.1 million was comprised of $579.5 million of Common Stock, $258.7 million of Series E Preferred Stock, $20.5 million of Per Share Cash Payment, and $11.3 million of transaction costs. As the cost of the acquisition exceeded the fair value of the net identifiable assets acquired, the Company allocated the difference on the basis of relative fair values to certain assets which were not carried at fair value. The amount of excess consideration, including the Company's transaction costs, was capitalized on the balance sheet as a long-lived asset at the time of acquisition. In the fourth quarter of 2021, the Company concluded the long-lived asset had no potential value to the generation of future cash flows and fully impaired the asset, recognizing an expense totaling $88.3 million in the consolidated statements of operations with an associated reduction in stockholders' equity. Included in the expense was $15.9 million of consideration associated with change-in-control severance payments and accelerated equity award vesting paid to former Capstead employees upon the completion of the merger.
The allocation of the purchase price to assets acquired and liabilities assumed is as follows (amounts in thousands):
| | | | | | | | |
Assets Acquired | | As of October 19, 2021 |
Cash and cash equivalents | | $ | 174,083 | |
Real estate securities, trading, measured at fair value | | 6,841,482 | |
Prepaid expenses and other assets | | 275,127 | |
Cash collateral receivable from derivative counterparties | | 68,969 | |
| | |
Liabilities Assumed | | |
Repurchase agreements and secured borrowings - real estate securities | | 6,421,262 | |
Unsecured borrowings | | 98,574 | |
Derivative instruments, measured at fair value | | 31,091 | |
Distributions payable | | 1,345 | |
Accounts payable and accrued expenses | | 25,606 | |
| | |
Net Assets Acquired | | 781,783 | |
Note 1918 - Subsequent Events
The Company has evaluated subsequent events through the filing of this Annual Report on Form 10-K. The following activity took place subsequent to the year end:
Loan Activity: On February 7, 2024, we obtained, through deed-in-lieu of foreclosure, a multifamily property located in San Antonio, Texas. The loan had an amortized cost basis of $42.2 million as of December 31, 2023. On February 14, 2024, we sold the property for $42.8 million and fully recovered our loan basis.
Stock Repurchases: Subsequent to December 31, 2023, the Company repurchased 56,323 shares of common stock at a weighted average cost of$12.52 per share. As of February 7, 2024, $35.2 million remains available under the Company’s share repurchase program(see Part II, Item 5, "Purchases of Equity Securities by the Issuer and Affiliated Purchasers" for additional details).
FRANKLIN BSP REALTY TRUST, INC.
SCHEDULE IV - MORTGAGE LOANS ON REAL ESTATE
December 31, 20212023
(Dollars in thousands)
| | Description | Description | | Property Type | | Face Amount | | Carrying Amount | | Interest
Rate | | Payment
Terms | | Maturity Date | Description | | Property Type | | Face Value | | Amortized Cost | | Principal amount subject to delinquent principal or interest (1) | | Index (2) | | Spread | | Payment
Terms | | Maturity Date |
| Senior Debt 1 | Senior Debt 1 | | Hospitality | | $ | 4,858 | | | $ | 4,858 | | | 1 month LIBOR + 4.00% | | Amortizing Balloon | | 12/9/2023 | Senior Debt 1 | | Hospitality | | $ | 4,586 | | | $ | | $ | 4,586 | | | $ | | $ | — | | | Adj. 1 month SOFR Term | | Adj. 1 month SOFR Term | | 4.00% | | Amortizing Balloon | | 3/9/2024 |
| Senior Debt 2 | Senior Debt 2 | | Hospitality | | 57,075 | | | 57,075 | | | 1 month LIBOR + 5.19% | | Interest Only | | 6/9/2019 | Senior Debt 2 | | Multifamily | | 35,212 | | | 35,212 | | 35,212 | | | — | | — | | | 1 month SOFR Term | | 1 month SOFR Term | | 4.50% | | Interest Only | | 9/9/2024 |
| Senior Debt 3 | Senior Debt 3 | | Multifamily | | 26,568 | | | 26,568 | | | 1 month LIBOR + 4.50% | | Interest Only | | 12/31/2022 | Senior Debt 3 | | Hospitality | | 21,796 | | | 21,796 | | 21,796 | | | — | | — | | | 1 month SOFR Term | | 1 month SOFR Term | | 4.25% | | Amortizing Balloon | | 3/9/2024 |
| Senior Debt 4 | Senior Debt 4 | | Hospitality | | 22,150 | | | 22,150 | | | 1 month LIBOR + 6.00% | | Interest Only | | 1/9/2023 | Senior Debt 4 | | Office | | 13,937 | | | 13,937 | | 13,937 | | | — | | — | | | 1 month SOFR Term | | 1 month SOFR Term | | 5.50% | | Amortizing Balloon | | 9/9/2024 |
| Senior Debt 5 | Senior Debt 5 | | Office | | 6,901 | | | 6,901 | | | 1 month LIBOR + 5.15% | | Interest Only | | 3/9/2022 | Senior Debt 5 | | Office | | 41,185 | | | 41,185 | | 41,185 | | | — | | — | | | 1 month SOFR Term | | 1 month SOFR Term | | 3.56% | | Amortizing Balloon | | 5/9/2024 |
| Senior Debt 6 | Senior Debt 6 | | Multifamily | | 36,822 | | | 36,822 | | | 1 month LIBOR + 3.00% | | Interest Only | | 3/9/2022 | Senior Debt 6 | | Hospitality | | 18,398 | | | 18,398 | | 18,398 | | | — | | — | | | 1 month SOFR Term | | 1 month SOFR Term | | 3.84% | | Amortizing Balloon | | 1/9/2024 |
| Senior Debt 7 | Senior Debt 7 | | Multifamily | | 37,025 | | | 37,025 | | | 1 month LIBOR + 3.00% | | Interest Only | | 11/9/2022 | Senior Debt 7 | | Hospitality | | 12,900 | | | 12,900 | | 12,900 | | | — | | — | | | 1 month SOFR Term | | 1 month SOFR Term | | 4.41% | | Amortizing Balloon | | 10/9/2025 |
| Senior Debt 8 | Senior Debt 8 | | Hospitality | | 22,355 | | | 22,355 | | | 1 month LIBOR + 3.50% | | Interest Only | | 3/9/2023 | Senior Debt 8 | | Hospitality | | 4,805 | | | 4,805 | | 4,805 | | | — | | — | | | 1 month SOFR Term | | 1 month SOFR Term | | 5.25% | | Amortizing Balloon | | 5/9/2024 |
| Senior Debt 9 | Senior Debt 9 | | Office | | 20,685 | | | 20,685 | | | 1 month LIBOR + 3.75% | | Interest Only | | 9/9/2022 | Senior Debt 9 | | Office | | 14,852 | | | 14,852 | | 14,852 | | | — | | — | | | 1 month SOFR Term | | 1 month SOFR Term | | 4.00% | | Amortizing Balloon | | 12/9/2024 |
| Senior Debt 10 | Senior Debt 10 | | Office | | 15,722 | | | 15,722 | | | 1 month LIBOR + 3.40% | | Amortizing Balloon | | 9/9/2022 | Senior Debt 10 | | Office | | 24,444 | | | 24,442 | | 24,442 | | | — | | — | | | Adj. 1 month SOFR Term | | Adj. 1 month SOFR Term | | 4.35% | | Interest Only | | 1/9/2024 |
| Senior Debt 11 | Senior Debt 11 | | Retail | | 29,500 | | | 29,452 | | | 6.50% | | Interest Only | | 9/9/2023 | Senior Debt 11 | | Manufactured Housing | | 1,301 | | | 1,301 | | 1,301 | | | — | | — | | | | | 5.50% | | | | 5.50% | | Amortizing Balloon | | 5/9/2025 |
| Senior Debt 12 | Senior Debt 12 | | Multifamily | | 27,488 | | | 27,488 | | | 1 month LIBOR + 3.35% | | Interest Only | | 11/9/2022 | Senior Debt 12 | | Self Storage | | 27,440 | | | 27,440 | | 27,440 | | | 27,440 | | 27,440 | | | Adj. 1 month SOFR Term | | Adj. 1 month SOFR Term | | 5.00% | | Interest Only | | 1/9/2024 |
| Senior Debt 13 | Senior Debt 13 | | Hospitality | | 8,285 | | | 8,285 | | | 1 month LIBOR + 4.85% | | Amortizing Balloon | | 1/9/2023 | Senior Debt 13 | | Office | | 17,103 | | | 17,103 | | 17,103 | | | — | | — | | | Adj. 1 month SOFR Term | | Adj. 1 month SOFR Term | | 4.50% | | Amortizing Balloon | | 10/9/2024 |
| Senior Debt 14 | Senior Debt 14 | | Office | | 7,125 | | | 7,125 | | | 1 month LIBOR + 3.90% | | Interest Only | | 2/9/2022 | Senior Debt 14 | | Office | | 63,274 | | | 63,146 | | 63,146 | | | — | | — | | | | | 5.15% | | | | 5.15% | | Amortizing Balloon | | 10/9/2025 |
| Senior Debt 15 | Senior Debt 15 | | Hospitality | | 13,972 | | | 13,972 | | | 1 month LIBOR + 4.47% | | Interest Only | | 4/9/2022 | Senior Debt 15 | | Office | | 30,186 | | | 30,186 | | 30,186 | | | — | | — | | | 1 month SOFR Term | | 1 month SOFR Term | | 2.81% | | Interest Only | | 10/9/2024 |
| Senior Debt 16 | Senior Debt 16 | | Retail | | 11,924 | | | 11,924 | | | 1 month LIBOR + 3.95% | | Interest Only | | 4/9/2022 | Senior Debt 16 | | Office | | 9,175 | | | 9,175 | | 9,175 | | | — | | — | | | Adj. 1 month SOFR Term | | Adj. 1 month SOFR Term | | 5.00% | | Interest Only | | 11/9/2024 |
| Senior Debt 17 | Senior Debt 17 | | Office | | 42,631 | | | 42,601 | | | 1 month LIBOR + 3.50% | | Interest Only | | 5/9/2022 | Senior Debt 17 | | Multifamily | | 12,550 | | | 12,547 | | 12,547 | | | — | | — | | | Adj. 1 month SOFR Term | | Adj. 1 month SOFR Term | | 4.55% | | Interest Only | | 2/9/2024 |
| Senior Debt 18 | Senior Debt 18 | | Retail | | 8,203 | | | 8,203 | | | 1 month LIBOR + 8.00% | | Interest Only | | 9/9/2022 | Senior Debt 18 | | Multifamily | | 21,000 | | | 21,000 | | 21,000 | | | — | | — | | | Adj. 1 month SOFR Term | | Adj. 1 month SOFR Term | | 4.60% | | Interest Only | | 1/9/2024 |
| Senior Debt 19 | Senior Debt 19 | | Hospitality | | 10,580 | | | 10,570 | | | 1 month LIBOR + 4.50% | | Interest Only | | 6/9/2022 | Senior Debt 19 | | Office | | 10,855 | | | 10,855 | | 10,855 | | | — | | — | | | 1 month SOFR Term | | 1 month SOFR Term | | 5.56% | | Amortizing Balloon | | 1/9/2024 |
| Senior Debt 20 | Senior Debt 20 | | Hospitality | | 19,900 | | | 19,884 | | | 1 month LIBOR + 4.15% | | Interest Only | | 6/9/2022 | Senior Debt 20 | | Office | | 44,913 | | | 44,892 | | 44,892 | | | — | | — | | | Adj. 1 month SOFR Term | | Adj. 1 month SOFR Term | | 3.97% | | Interest Only | | 3/9/2024 |
| Senior Debt 21 | Senior Debt 21 | | Office | | 39,650 | | | 39,597 | | | 1 month LIBOR + 4.01% | | Interest Only | | 6/9/2022 | Senior Debt 21 | | Multifamily | | 34,476 | | | 34,457 | | 34,457 | | | — | | — | | | 1 month SOFR Term | | 1 month SOFR Term | | 8.00% | | Interest Only | | 2/9/2024 |
| Senior Debt 22 | Senior Debt 22 | | Hospitality | | 20,930 | | | 20,900 | | | 1 month LIBOR + 3.75% | | Interest Only | | 8/9/2022 | Senior Debt 22 | | Hospitality | | 23,000 | | | 22,992 | | 22,992 | | | — | | — | | | Adj. 1 month SOFR Term | | Adj. 1 month SOFR Term | | 5.79% | | Interest Only | | 3/9/2024 |
| Senior Debt 23 | Senior Debt 23 | | Hospitality | | 13,000 | | | 12,982 | | | 1 month LIBOR + 2.94% | | Interest Only | | 10/9/2022 | Senior Debt 23 | | Multifamily | | 34,750 | | | 34,750 | | 34,750 | | | — | | — | | | 1 month SOFR Term | | 1 month SOFR Term | | 4.10% | | Interest Only | | 3/9/2024 |
| Senior Debt 24 | Senior Debt 24 | | Hospitality | | 4,987 | | | 4,988 | | | 1 month LIBOR + 4.25% | | Interest Only | | 7/9/2023 | Senior Debt 24 | | Multifamily | | 55,000 | | | 55,000 | | 55,000 | | | — | | — | | | 1 month SOFR Term | | 1 month SOFR Term | | 4.00% | | Interest Only | | 5/9/2024 |
| Senior Debt 25 | Senior Debt 25 | | Hospitality | | 12,750 | | | 12,734 | | | 1 month LIBOR + 4.45% | | Interest Only | | 8/9/2022 | Senior Debt 25 | | Multifamily | | 14,700 | | | 14,696 | | 14,696 | | | — | | — | | | Adj. 1 month SOFR Term | | Adj. 1 month SOFR Term | | 3.39% | | Interest Only | | 4/9/2024 |
| Senior Debt 26 | Senior Debt 26 | | Hospitality | | 10,845 | | | 10,845 | | | 1 month LIBOR + 4.50% | | Interest Only | | 2/9/2022 | Senior Debt 26 | | Multifamily | | 8,898 | | | 8,893 | | 8,893 | | | — | | — | | | Adj. 1 month SOFR Term | | Adj. 1 month SOFR Term | | 3.80% | | Interest Only | | 4/9/2024 |
| Senior Debt 27 | Senior Debt 27 | | Retail | | 9,400 | | | 9,388 | | | 1 month LIBOR + 4.20% | | Interest Only | | 9/9/2022 | Senior Debt 27 | | Multifamily | | 19,804 | | | 19,798 | | 19,798 | | | — | | — | | | Adj. 1 month SOFR Term | | Adj. 1 month SOFR Term | | 3.60% | | Interest Only | | 4/9/2024 |
| Senior Debt 28 | Senior Debt 28 | | Hospitality | | 34,053 | | | 34,053 | | | 1 month LIBOR + 3.99% | | Amortizing Balloon | | 11/9/2022 | Senior Debt 28 | | Multifamily | | 43,246 | | | 43,237 | | 43,237 | | | — | | — | | | Adj. 1 month SOFR Term | | Adj. 1 month SOFR Term | | 2.95% | | Interest Only | | 4/9/2026 |
| Senior Debt 29 | Senior Debt 29 | | Industrial | | 56,933 | | | 56,933 | | | 1 month LIBOR + 3.75% | | Interest Only | | 12/9/2021 | Senior Debt 29 | | Hospitality | | 25,700 | | | 25,700 | | 25,700 | | | — | | — | | | Adj. 1 month SOFR Term | | Adj. 1 month SOFR Term | | 5.60% | | Interest Only | | 5/9/2024 |
| Senior Debt 30 | Senior Debt 30 | | Office | | 21,825 | | | 21,777 | | | 1 month LIBOR + 3.50% | | Interest Only | | 12/9/2022 | Senior Debt 30 | | Mixed Use | | 32,500 | | | 32,500 | | 32,500 | | | — | | — | | | Adj. 1 month SOFR Term | | Adj. 1 month SOFR Term | | 3.70% | | Interest Only | | 7/9/2024 |
| Senior Debt 31 | Senior Debt 31 | | Hospitality | | 7,100 | | | 7,088 | | | 1 month LIBOR + 4.00% | | Interest Only | | 12/9/2022 | Senior Debt 31 | | Multifamily | | 75,927 | | | 75,901 | | 75,901 | | | — | | — | | | Adj. 1 month SOFR Term | | Adj. 1 month SOFR Term | | 2.95% | | Interest Only | | 4/9/2026 |
| Senior Debt 32 | Senior Debt 32 | | Multifamily | | 15,342 | | | 15,309 | | | 1 month LIBOR + 2.75% | | Interest Only | | 12/9/2022 | Senior Debt 32 | | Multifamily | | 20,450 | | | 20,426 | | 20,426 | | | — | | — | | | Adj. 1 month SOFR Term | | Adj. 1 month SOFR Term | | 3.60% | | Interest Only | | 5/9/2024 |
| Senior Debt 33 | Senior Debt 33 | | Multifamily | | 27,650 | | | 27,601 | | | 1 month LIBOR + 3.15% | | Interest Only | | 12/9/2022 | Senior Debt 33 | | Multifamily | | 30,320 | | | 30,310 | | 30,310 | | | — | | — | | | Adj. 1 month SOFR Term | | Adj. 1 month SOFR Term | | 2.95% | | Interest Only | | 4/9/2026 |
| Senior Debt 34 | Senior Debt 34 | | Multifamily | | 27,094 | | | 27,064 | | | 1 month LIBOR + 2.70% | | Interest Only | | 12/9/2022 | Senior Debt 34 | | Multifamily | | 35,466 | | | 35,459 | | 35,459 | | | — | | — | | | Adj. 1 month SOFR Term | | Adj. 1 month SOFR Term | | 2.95% | | Interest Only | | 4/9/2026 |
| Senior Debt 35 | Senior Debt 35 | | Multifamily | | 9,016 | | | 9,016 | | | 1 month LIBOR + 3.95% | | Interest Only | | 12/9/2022 | Senior Debt 35 | | Multifamily | | 33,588 | | | 33,582 | | 33,582 | | | — | | — | | | Adj. 1 month SOFR Term | | Adj. 1 month SOFR Term | | 2.95% | | Interest Only | | 4/9/2026 |
| Senior Debt 36 | Senior Debt 36 | | Multifamily | | 25,000 | | | 24,999 | | | 1 month LIBOR + 3.30% | | Interest Only | | 1/9/2023 | Senior Debt 36 | | Multifamily | | 152,112 | | | 151,644 | | 151,644 | | | — | | — | | | 1 month SOFR Term | | 1 month SOFR Term | | 4.55% | | Interest Only | | 6/9/2024 |
| Senior Debt 37 | | Office | | 25,802 | | | 25,699 | | | 1 month LIBOR + 4.35% | | Interest Only | | 1/9/2024 |
| Senior Debt 38 | | Multifamily | | 15,150 | | | 15,128 | | | 1 month LIBOR + 3.10% | | Interest Only | | 2/9/2023 |
| Senior Debt 39 | | Office | | 58,714 | | | 58,491 | | | 1 month LIBOR + 3.70% | | Interest Only | | 2/9/2023 |
| Senior Debt 40 | | Multifamily | | 11,739 | | | 11,723 | | | 1 month LIBOR + 3.15% | | Interest Only | | 8/9/2022 |
| Senior Debt 41 | | Office | | 28,083 | | | 28,025 | | | 1 month LIBOR + 2.70% | | Interest Only | | 2/9/2023 |
| Senior Debt 42 | | Manufactured Housing | | 1,359 | | | 1,359 | | | 5.50% | | Interest Only | | 5/9/2025 |
| | Description | Description | | Property Type | | Face Amount | | Carrying Amount | | Interest
Rate | | Payment
Terms | | Maturity Date | Description | | Property Type | | Face Value | | Amortized Cost | | Principal amount subject to delinquent principal or interest (1) | | Index (2) | | Spread | | Payment
Terms | | Maturity Date |
| Senior Debt 37 | | Senior Debt 37 | | Hospitality | | 36,750 | | | 36,713 | | | — | | | Adj. 1 month SOFR Term | | 6.25% | | Interest Only | | 6/9/2024 |
| Senior Debt 38 | | Senior Debt 38 | | Multifamily | | 35,116 | | | 34,990 | | | — | | | Adj. 1 month SOFR Term | | 8.00% | | Interest Only | | 3/9/2025 |
| Senior Debt 39 | | Senior Debt 39 | | Multifamily | | 16,453 | | | 16,453 | | | — | | | Adj. 1 month SOFR Term | | 3.75% | | Interest Only | | 10/9/2024 |
| Senior Debt 40 | | Senior Debt 40 | | Multifamily | | 47,984 | | | 47,901 | | | — | | | Adj. 1 month SOFR Term | | 3.15% | | Interest Only | | 10/9/2024 |
| Senior Debt 41 | | Senior Debt 41 | | Multifamily | | 41,650 | | | 41,650 | | | — | | | Adj. 1 month SOFR Term | | 3.40% | | Interest Only | | 9/9/2024 |
| Senior Debt 42 | | Senior Debt 42 | | Multifamily | | 34,760 | | | 34,713 | | | — | | | Adj. 1 month SOFR Term | | 3.64% | | Interest Only | | 10/9/2024 |
| Senior Debt 43 | Senior Debt 43 | | Multifamily | | 7,060 | | | 7,054 | | | 1 month LIBOR + 4.75% | | Interest Only | | 5/9/2022 | Senior Debt 43 | | Multifamily | | 8,500 | | | 8,489 | | 8,489 | | | — | | — | | | Adj. 1 month SOFR Term | | Adj. 1 month SOFR Term | | 3.75% | | Interest Only | | 9/9/2024 |
| Senior Debt 44 | Senior Debt 44 | | Industrial | | 17,038 | | | 16,983 | | | 1 month LIBOR + 6.25% | | Interest Only | | 7/9/2023 | Senior Debt 44 | | Multifamily | | 14,890 | | | 14,890 | | 14,890 | | | — | | — | | | Adj. 1 month SOFR Term | | Adj. 1 month SOFR Term | | 3.15% | | Interest Only | | 9/9/2024 |
| Senior Debt 45 | Senior Debt 45 | | Multifamily | | 4,300 | | | 4,289 | | | 1 month LIBOR + 5.50% | | Interest Only | | 2/9/2023 | Senior Debt 45 | | Multifamily | | 69,500 | | | 69,312 | | 69,312 | | | — | | — | | | Adj. 1 month SOFR Term | | Adj. 1 month SOFR Term | | 3.25% | | Interest Only | | 10/9/2024 |
| Senior Debt 46 | Senior Debt 46 | | Manufactured Housing | | 7,680 | | | 7,658 | | | 1 month LIBOR + 4.50% | | Interest Only | | 8/9/2023 | Senior Debt 46 | | Multifamily | | 11,325 | | | 11,306 | | 11,306 | | | — | | — | | | Adj. 1 month SOFR Term | | Adj. 1 month SOFR Term | | 3.75% | | Interest Only | | 10/9/2024 |
| Senior Debt 47 | Senior Debt 47 | | Mixed Use | | 30,465 | | | 30,326 | | | 1 month LIBOR + 5.15% | | Interest Only | | 8/9/2023 | Senior Debt 47 | | Multifamily | | 27,199 | | | 27,160 | | 27,160 | | | — | | — | | | Adj. 1 month SOFR Term | | Adj. 1 month SOFR Term | | 3.20% | | Interest Only | | 10/9/2024 |
| Senior Debt 48 | Senior Debt 48 | | Hospitality | | 27,000 | | | 26,921 | | | 1 month LIBOR + 6.50% | | Interest Only | | 9/9/2023 | Senior Debt 48 | | Hospitality | | 17,122 | | | 17,122 | | 17,122 | | | — | | — | | | Adj. 1 month SOFR Term | | Adj. 1 month SOFR Term | | 5.25% | | Interest Only | | 10/9/2024 |
| Senior Debt 49 | Senior Debt 49 | | Multifamily | | 50,000 | | | 49,911 | | | 1 month LIBOR + 6.69% | | Interest Only | | 9/9/2022 | Senior Debt 49 | | Multifamily | | 56,150 | | | 56,071 | | 56,071 | | | — | | — | | | Adj. 1 month SOFR Term | | Adj. 1 month SOFR Term | | 3.10% | | Interest Only | | 10/9/2024 |
| Senior Debt 50 | Senior Debt 50 | | Self Storage | | 29,895 | | | 29,807 | | | 1 month LIBOR + 5.00% | | Interest Only | | 9/9/2023 | Senior Debt 50 | | Multifamily | | 38,242 | | | 38,116 | | 38,116 | | | — | | — | | | Adj. 1 month SOFR Term | | Adj. 1 month SOFR Term | | 2.90% | | Interest Only | | 11/9/2026 |
| Senior Debt 51 | Senior Debt 51 | | Multifamily | | 14,183 | | | 14,150 | | | 1 month LIBOR + 4.75% | | Interest Only | | 9/9/2022 | Senior Debt 51 | | Multifamily | | 55,394 | | | 55,394 | | 55,394 | | | — | | — | | | Adj. 1 month SOFR Term | | Adj. 1 month SOFR Term | | 3.10% | | Interest Only | | 1/9/2024 |
| Senior Debt 52 | Senior Debt 52 | | Manufactured Housing | | 3,400 | | | 3,393 | | | 1 month LIBOR + 5.00% | | Interest Only | | 9/9/2022 | Senior Debt 52 | | Multifamily | | 38,153 | | | 38,101 | | 38,101 | | | — | | — | | | Adj. 1 month SOFR Term | | Adj. 1 month SOFR Term | | 2.90% | | Interest Only | | 12/9/2024 |
| Senior Debt 53 | Senior Debt 53 | | Multifamily | | 27,550 | | | 27,500 | | | 1 month LIBOR + 5.75% | | Interest Only | | 9/9/2022 | Senior Debt 53 | | Multifamily | | 68,165 | | | 68,165 | | 68,165 | | | — | | — | | | Adj. 1 month SOFR Term | | Adj. 1 month SOFR Term | | 2.85% | | Interest Only | | 11/9/2024 |
| Senior Debt 54 | Senior Debt 54 | | Manufactured Housing | | 5,020 | | | 5,004 | | | 1 month LIBOR + 5.25% | | Interest Only | | 10/9/2023 | Senior Debt 54 | | Multifamily | | 32,567 | | | 32,510 | | 32,510 | | | — | | — | | | Adj. 1 month SOFR Term | | Adj. 1 month SOFR Term | | 3.25% | | Interest Only | | 12/9/2024 |
| Senior Debt 55 | Senior Debt 55 | | Office | | 18,603 | | | 18,542 | | | 1 month LIBOR + 4.50% | | Interest Only | | 10/9/2023 | Senior Debt 55 | | Multifamily | | 61,600 | | | 61,600 | | 61,600 | | | — | | — | | | Adj. 1 month SOFR Term | | Adj. 1 month SOFR Term | | 3.35% | | Interest Only | | 11/9/2024 |
| Senior Debt 56 | Senior Debt 56 | | Office | | 67,651 | | | 67,384 | | | 5.15% | | Interest Only | | 10/9/2025 | Senior Debt 56 | | Multifamily | | 44,987 | | | 44,987 | | 44,987 | | | — | | — | | | Adj. 1 month SOFR Term | | Adj. 1 month SOFR Term | | 3.00% | | Interest Only | | 12/9/2024 |
| Senior Debt 57 | Senior Debt 57 | | Office | | 30,900 | | | 30,748 | | | 1 month LIBOR + 5.20% | | Interest Only | | 10/9/2023 | Senior Debt 57 | | Multifamily | | 47,147 | | | 47,019 | | 47,019 | | | — | | — | | | Adj. 1 month SOFR Term | | Adj. 1 month SOFR Term | | 2.75% | | Interest Only | | 11/9/2025 |
| Senior Debt 58 | Senior Debt 58 | | Self Storage | | 11,600 | | | 11,574 | | | 1 month LIBOR + 4.76% | | Interest Only | | 11/9/2022 | Senior Debt 58 | | Multifamily | | 86,000 | | | 85,959 | | 85,959 | | | — | | — | | | 1 month SOFR Term | | 1 month SOFR Term | | 3.24% | | Interest Only | | 3/9/2024 |
| Senior Debt 59 | Senior Debt 59 | | Manufactured Housing | | 5,000 | | | 4,957 | | | 1 month LIBOR + 5.90% | | Interest Only | | 5/9/2023 | Senior Debt 59 | | Manufactured Housing | | 6,700 | | | 6,688 | | 6,688 | | | — | | — | | | Adj. 1 month SOFR Term | | Adj. 1 month SOFR Term | | 4.50% | | Interest Only | | 12/9/2024 |
| Senior Debt 60 | Senior Debt 60 | | Office | | 12,750 | | | 12,705 | | | 1 month LIBOR + 5.00% | | Interest Only | | 11/9/2023 | Senior Debt 60 | | Multifamily | | 58,680 | | | 58,677 | | 58,677 | | | — | | — | | | Adj. 1 month SOFR Term | | Adj. 1 month SOFR Term | | 3.45% | | Interest Only | | 1/9/2024 |
| Senior Debt 61 | Senior Debt 61 | | Multifamily | | 43,320 | | | 43,151 | | | 1 month LIBOR + 4.35% | | Interest Only | | 11/9/2023 | Senior Debt 61 | | Multifamily | | 26,068 | | | 26,068 | | 26,068 | | | — | | — | | | Adj. 1 month SOFR Term | | Adj. 1 month SOFR Term | | 2.90% | | Interest Only | | 3/9/2024 |
| Senior Debt 62 | Senior Debt 62 | | Multifamily | | 37,674 | | | 37,539 | | | 1 month LIBOR + 4.45% | | Interest Only | | 11/9/2023 | Senior Debt 62 | | Multifamily | | 14,933 | | | 14,905 | | 14,905 | | | — | | — | | | Adj. 1 month SOFR Term | | Adj. 1 month SOFR Term | | 3.20% | | Interest Only | | 12/9/2024 |
| Senior Debt 63 | Senior Debt 63 | | Multifamily | | 8,763 | | | 8,730 | | | 1 month LIBOR + 5.50% | | Interest Only | | 11/9/2023 | Senior Debt 63 | | Multifamily | | 38,283 | | | 38,219 | | 38,219 | | | — | | — | | | Adj. 1 month SOFR Term | | Adj. 1 month SOFR Term | | 3.00% | | Interest Only | | 12/9/2024 |
| Senior Debt 64 | Senior Debt 64 | | Retail | | 11,963 | | | 11,928 | | | 1 month LIBOR + 4.87% | | Interest Only | | 5/9/2022 | Senior Debt 64 | | Multifamily | | 42,235 | | | 42,234 | | 42,234 | | | — | | — | | | Adj. 1 month SOFR Term | | Adj. 1 month SOFR Term | | 2.90% | | Interest Only | | 1/9/2024 |
| Senior Debt 65 | Senior Debt 65 | | Multifamily | | 5,730 | | | 5,712 | | | 1 month LIBOR + 5.00% | | Interest Only | | 6/9/2023 | Senior Debt 65 | | Multifamily | | 69,415 | | | 69,415 | | 69,415 | | | — | | — | | | Adj. 1 month SOFR Term | | Adj. 1 month SOFR Term | | 2.88% | | Interest Only | | 12/9/2024 |
| Senior Debt 66 | Senior Debt 66 | | Multifamily | | 18,800 | | | 18,658 | | | 1 month LIBOR + 4.00% | | Interest Only | | 12/9/2024 | Senior Debt 66 | | Multifamily | | 66,742 | | | 66,742 | | 66,742 | | | — | | — | | | Adj. 1 month SOFR Term | | Adj. 1 month SOFR Term | | 2.88% | | Interest Only | | 12/9/2024 |
| Senior Debt 67 | Senior Debt 67 | | Industrial | | 14,985 | | | 14,923 | | | 1 month LIBOR + 4.50% | | Interest Only | | 12/9/2023 | Senior Debt 67 | | Multifamily | | 17,145 | | | 17,144 | | 17,144 | | | — | | — | | | 1 month SOFR Term | | 1 month SOFR Term | | 3.50% | | Interest Only | | 1/9/2025 |
| Senior Debt 68 | Senior Debt 68 | | Office | | 11,981 | | | 11,932 | | | 1 month LIBOR + 5.50% | | Interest Only | | 1/9/2024 | Senior Debt 68 | | Multifamily | | 59,232 | | | 59,175 | | 59,175 | | | — | | — | | | Adj. 1 month SOFR Term | | Adj. 1 month SOFR Term | | 2.75% | | Interest Only | | 12/9/2024 |
| Senior Debt 69 | Senior Debt 69 | | Multifamily | | 11,820 | | | 11,769 | | | 1 month LIBOR + 4.55% | | Interest Only | | 2/9/2024 | Senior Debt 69 | | Multifamily | | 22,240 | | | 22,239 | | 22,239 | | | — | | — | | | 1 month SOFR Term | | 1 month SOFR Term | | 2.96% | | Interest Only | | 7/9/2024 |
| Senior Debt 70 | Senior Debt 70 | | Multifamily | | 21,000 | | | 20,920 | | | 1 month LIBOR + 4.60% | | Interest Only | | 1/9/2024 | Senior Debt 70 | | Multifamily | | 25,241 | | | 25,195 | | 25,195 | | | — | | — | | | 1 month SOFR Term | | 1 month SOFR Term | | 2.96% | | Interest Only | | 1/9/2025 |
| Senior Debt 71 | Senior Debt 71 | | Office | | 26,000 | | | 25,932 | | | 1 month LIBOR + 5.00% | | Interest Only | | 1/9/2023 | Senior Debt 71 | | Multifamily | | 32,428 | | | 32,425 | | 32,425 | | | — | | — | | | 1 month SOFR Term | | 1 month SOFR Term | | 3.20% | | Interest Only | | 1/9/2024 |
| Senior Debt 72 | Senior Debt 72 | | Multifamily | | 54,500 | | | 54,422 | | | 1 month LIBOR + 3.80% | | Interest Only | | 2/9/2023 | Senior Debt 72 | | Multifamily | | 78,416 | | | 78,167 | | 78,167 | | | — | | — | | | 1 month SOFR Term | | 1 month SOFR Term | | 3.45% | | Interest Only | | 1/9/2027 |
| Senior Debt 73 | Senior Debt 73 | | Multifamily | | 11,672 | | | 11,620 | | | 1 month LIBOR + 3.50% | | Interest Only | | 2/9/2024 | Senior Debt 73 | | Multifamily | | 81,247 | | | 81,164 | | 81,164 | | | — | | — | | | 1 month SOFR Term | | 1 month SOFR Term | | 3.21% | | Interest Only | | 1/9/2025 |
| Senior Debt 74 | Senior Debt 74 | | Multifamily | | 21,000 | | | 20,956 | | | 1 month LIBOR + 4.95% | | Interest Only | | 8/9/2022 | Senior Debt 74 | | Multifamily | | 24,000 | | | 23,999 | | 23,999 | | | — | | — | | | 1 month SOFR Term | | 1 month SOFR Term | | 3.10% | | Interest Only | | 1/9/2024 |
| Senior Debt 75 | Senior Debt 75 | | Office | | 43,751 | | | 43,518 | | | 1 month LIBOR + 3.94% | | Interest Only | | 3/9/2024 | Senior Debt 75 | | Retail | | 31,000 | | | 30,946 | | 30,946 | | | — | | — | | | 1 month SOFR Term | | 1 month SOFR Term | | 3.29% | | Interest Only | | 1/9/2025 |
Senior Debt 76 (3) | | Multifamily | | — | | | — | | | 1 month LIBOR + 7.25% | | Interest Only | | 2/9/2024 |
| Senior Debt 76 | | Senior Debt 76 | | Multifamily | | 38,511 | | | 38,511 | | | — | | | 1 month SOFR Term | | 3.55% | | Interest Only | | 2/9/2024 |
| Senior Debt 77 | Senior Debt 77 | | Multifamily | | 5,400 | | | 5,384 | | | 1 month LIBOR + 5.25% | | Interest Only | | 2/9/2023 | Senior Debt 77 | | Multifamily | | 23,855 | | | 23,848 | | 23,848 | | | — | | — | | | 1 month SOFR Term | | 1 month SOFR Term | | 2.95% | | Interest Only | | 2/9/2024 |
| Senior Debt 78 | | Hospitality | | 23,000 | | | 22,914 | | | 1 month LIBOR + 5.79% | | Interest Only | | 3/9/2024 |
| Senior Debt 79 | | Multifamily | | 32,856 | | | 32,742 | | | 1 month LIBOR + 6.75% | | Interest Only | | 3/9/2023 |
| Senior Debt 80 | | Multifamily | | 12,325 | | | 12,278 | | | 1 month LIBOR + 4.50% | | Interest Only | | 3/9/2024 |
| Senior Debt 81 | | Multifamily | | 6,300 | | | 6,262 | | | 1 month LIBOR + 5.35% | | Interest Only | | 9/9/2023 |
| Senior Debt 82 | | Multifamily | | 31,023 | | | 30,955 | | | 1 month LIBOR + 3.00% | | Interest Only | | 4/9/2024 |
| Senior Debt 83 | | Multifamily | | 11,936 | | | 11,881 | | | 1 month LIBOR + 4.25% | | Interest Only | | 4/9/2024 |
| Senior Debt 84 | | Multifamily | | 5,575 | | | 5,556 | | | 1 month LIBOR + 4.50% | | Interest Only | | 4/9/2023 |
| Senior Debt 85 | | Multifamily | | 53,178 | | | 53,081 | | | 1 month LIBOR + 3.00% | | Interest Only | | 4/9/2023 |
| Senior Debt 86 | | Multifamily | | 14,045 | | | 14,012 | | | 1 month LIBOR + 3.39% | | Interest Only | | 4/9/2024 |
| Senior Debt 87 | | Multifamily | | 8,301 | | | 8,263 | | | 1 month LIBOR + 3.80% | | Interest Only | | 4/9/2024 |
| | Description | Description | | Property Type | | Face Amount | | Carrying Amount | | Interest
Rate | | Payment
Terms | | Maturity Date | Description | | Property Type | | Face Value | | Amortized Cost | | Principal amount subject to delinquent principal or interest (1) | | Index (2) | | Spread | | Payment
Terms | | Maturity Date |
| Senior Debt 78 | | Senior Debt 78 | | Multifamily | | 11,100 | | | 11,097 | | | — | | | 1 month SOFR Term | | 3.30% | | Interest Only | | 2/9/2024 |
| Senior Debt 79 | | Senior Debt 79 | | Multifamily | | 47,444 | | | 47,442 | | | — | | | 1 month SOFR Term | | 2.86% | | Interest Only | | 1/9/2024 |
| Senior Debt 80 | | Senior Debt 80 | | Multifamily | | 36,824 | | | 36,821 | | | — | | | 1 month SOFR Term | | 2.86% | | Interest Only | | 1/9/2024 |
| Senior Debt 81 | | Senior Debt 81 | | Hospitality | | 10,504 | | | 10,481 | | | — | | | 1 month SOFR Term | | 5.30% | | Interest Only | | 2/9/2025 |
| Senior Debt 82 | | Senior Debt 82 | | Multifamily | | 82,000 | | | 81,989 | | | — | | | 1 month SOFR Term | | 3.20% | | Interest Only | | 2/9/2024 |
| Senior Debt 83 | | Senior Debt 83 | | Industrial | | 55,000 | | | 54,973 | | | — | | | 1 month SOFR Term | | 3.50% | | Interest Only | | 3/9/2024 |
| Senior Debt 84 | | Senior Debt 84 | | Multifamily | | 39,864 | | | 39,843 | | | — | | | 1 month SOFR Term | | 3.10% | | Interest Only | | 3/9/2024 |
| Senior Debt 85 | | Senior Debt 85 | | Multifamily | | 35,220 | | | 35,202 | | | — | | | 1 month SOFR Term | | 2.95% | | Interest Only | | 3/9/2024 |
| Senior Debt 86 | | Senior Debt 86 | | Mixed Use | | 19,000 | | | 18,991 | | | — | | | 1 month SOFR Term | | 3.42% | | Interest Only | | 3/9/2024 |
| Senior Debt 87 | | Senior Debt 87 | | Multifamily | | 85,500 | | | 85,480 | | | — | | | 1 month SOFR Term | | 3.15% | | Interest Only | | 3/9/2024 |
| Senior Debt 88 | Senior Debt 88 | | Multifamily | | 13,582 | | | 13,533 | | | 1 month LIBOR + 4.50% | | Interest Only | | 10/9/2023 | Senior Debt 88 | | Multifamily | | 31,900 | | | 31,888 | | 31,888 | | | — | | — | | | 1 month SOFR Term | | 1 month SOFR Term | | 3.30% | | Interest Only | | 4/9/2024 |
| Senior Debt 89 | Senior Debt 89 | | Multifamily | | 18,277 | | | 18,200 | | | 1 month LIBOR + 5.25% | | Interest Only | | 4/9/2024 | Senior Debt 89 | | Hospitality | | 30,021 | | | 29,741 | | 29,741 | | | — | | — | | | 1 month SOFR Term | | 1 month SOFR Term | | 7.05% | | Interest Only | | 6/9/2025 |
| Senior Debt 90 | Senior Debt 90 | | Multifamily | | 17,985 | | | 17,938 | | | 1 month LIBOR + 3.60% | | Interest Only | | 4/9/2024 | Senior Debt 90 | | Multifamily | | 13,558 | | | 12,691 | | 12,691 | | | — | | — | | | 1 month SOFR Term | | 1 month SOFR Term | | 6.75% | | Interest Only | | 4/9/2025 |
| Senior Debt 91 | Senior Debt 91 | | Multifamily | | 41,823 | | | 41,808 | | | 1 month LIBOR + 2.95% | | Interest Only | | 4/9/2026 | Senior Debt 91 | | Hospitality | | 43,457 | | | 43,457 | | 43,457 | | | — | | — | | | 1 month SOFR Term | | 1 month SOFR Term | | 4.90% | | Interest Only | | 4/9/2024 |
| Senior Debt 92 | Senior Debt 92 | | Hospitality | | 25,785 | | | 25,686 | | | 1 month LIBOR + 5.60% | | Interest Only | | 5/9/2023 | Senior Debt 92 | | Hospitality | | 15,634 | | | 15,568 | | 15,568 | | | — | | — | | | 1 month SOFR Term | | 1 month SOFR Term | | 5.34% | | Interest Only | | 11/9/2025 |
| Senior Debt 93 | Senior Debt 93 | | Mixed Use | | 32,500 | | | 32,395 | | | 1 month LIBOR + 3.70% | | Interest Only | | 7/9/2023 | Senior Debt 93 | | Multifamily | | 35,949 | | | 35,949 | | 35,949 | | | 35,949 | | 35,949 | | | 1 month SOFR Term | | 1 month SOFR Term | | 6.05% | | Interest Only | | 6/9/2024 |
| Senior Debt 94 | Senior Debt 94 | | Multifamily | | 12,688 | | | 12,636 | | | 1 month LIBOR + 3.75% | | Interest Only | | 4/9/2023 | Senior Debt 94 | | Multifamily | | 56,616 | | | 56,479 | | 56,479 | | | — | | — | | | 1 month SOFR Term | | 1 month SOFR Term | | 3.95% | | Interest Only | | 5/9/2025 |
| Senior Debt 95 | Senior Debt 95 | | Multifamily | | 70,620 | | | 70,570 | | | 1 month LIBOR + 2.95% | | Interest Only | | 4/9/2026 | Senior Debt 95 | | Multifamily | | 29,905 | | | 29,816 | | 29,816 | | | — | | — | | | 1 month SOFR Term | | 1 month SOFR Term | | 4.00% | | Interest Only | | 11/9/2024 |
| Senior Debt 96 | Senior Debt 96 | | Multifamily | | 20,321 | | | 20,168 | | | 1 month LIBOR + 3.35% | | Interest Only | | 5/9/2024 | Senior Debt 96 | | Multifamily | | 56,859 | | | 56,806 | | 56,806 | | | — | | — | | | 1 month SOFR Term | | 1 month SOFR Term | | 6.70% | | Interest Only | | 3/9/2024 |
| Senior Debt 97 | Senior Debt 97 | | Multifamily | | 28,318 | | | 28,299 | | | 1 month LIBOR + 2.95% | | Interest Only | | 4/9/2026 | Senior Debt 97 | | Multifamily | | 12,536 | | | 12,523 | | 12,523 | | | — | | — | | | 1 month SOFR Term | | 1 month SOFR Term | | 3.55% | | Interest Only | | 5/9/2024 |
| Senior Debt 98 | Senior Debt 98 | | Multifamily | | 34,998 | | | 34,984 | | | 1 month LIBOR + 2.95% | | Interest Only | | 4/9/2026 | Senior Debt 98 | | Industrial | | 18,724 | | | 18,673 | | 18,673 | | | — | | — | | | 1 month SOFR Term | | 1 month SOFR Term | | 4.90% | | Interest Only | | 9/9/2024 |
| Senior Debt 99 | Senior Debt 99 | | Multifamily | | 32,557 | | | 32,546 | | | 1 month LIBOR + 2.95% | | Interest Only | | 4/9/2026 | Senior Debt 99 | | Multifamily | | 19,899 | | | 19,875 | | 19,875 | | | — | | — | | | 1 month SOFR Term | | 1 month SOFR Term | | 3.50% | | Interest Only | | 6/9/2024 |
| Senior Debt 100 | Senior Debt 100 | | Hospitality | | 25,771 | | | 25,563 | | | 1 month LIBOR + 9.00% | | Interest Only | | 5/9/2024 | Senior Debt 100 | | Multifamily | | 28,979 | | | 28,936 | | 28,936 | | | — | | — | | | 1 month SOFR Term | | 1 month SOFR Term | | 3.65% | | Interest Only | | 6/9/2024 |
| Senior Debt 101 | Senior Debt 101 | | Self Storage | | 15,000 | | | 14,948 | | | 1 month LIBOR + 4.26% | | Interest Only | | 5/9/2023 | Senior Debt 101 | | Multifamily | | 17,330 | | | 17,303 | | 17,303 | | | — | | — | | | 1 month SOFR Term | | 1 month SOFR Term | | 3.65% | | Interest Only | | 6/9/2024 |
| Senior Debt 102 | Senior Debt 102 | | Multifamily | | 24,248 | | | 24,142 | | | 1 month LIBOR + 3.25% | | Interest Only | | 6/9/2023 | Senior Debt 102 | | Multifamily | | 70,750 | | | 70,673 | | 70,673 | | | — | | — | | | 1 month SOFR Term | | 1 month SOFR Term | | 3.80% | | Interest Only | | 6/9/2024 |
| Senior Debt 103 | Senior Debt 103 | | Office | | 6,800 | | | 6,774 | | | 1 month LIBOR + 5.25% | | Interest Only | | 11/9/2023 | Senior Debt 103 | | Multifamily | | 83,914 | | | 83,810 | | 83,810 | | | — | | — | | | 1 month SOFR Term | | 1 month SOFR Term | | 3.95% | | Interest Only | | 6/9/2024 |
| Senior Debt 104 | Senior Debt 104 | | Multifamily | | 12,792 | | | 11,546 | | | 1 month LIBOR + 6.50% | | Interest Only | | 6/9/2024 | Senior Debt 104 | | Multifamily | | 45,469 | | | 45,414 | | 45,414 | | | — | | — | | | 1 month SOFR Term | | 1 month SOFR Term | | 3.95% | | Interest Only | | 6/9/2024 |
| Senior Debt 105 | Senior Debt 105 | | Multifamily | | 10,391 | | | 10,339 | | | 1 month LIBOR + 3.15% | | Interest Only | | 7/9/2024 | Senior Debt 105 | | Multifamily | | 58,003 | | | 57,930 | | 57,930 | | | — | | — | | | 1 month SOFR Term | | 1 month SOFR Term | | 3.95% | | Interest Only | | 6/9/2024 |
| Senior Debt 106 | Senior Debt 106 | | Hospitality | | 17,449 | | | 17,346 | | | 1 month LIBOR + 5.35% | | Interest Only | | 6/9/2023 | Senior Debt 106 | | Multifamily | | 20,716 | | | 20,688 | | 20,688 | | | — | | — | | | 1 month SOFR Term | | 1 month SOFR Term | | 3.95% | | Interest Only | | 6/9/2024 |
| Senior Debt 107 | Senior Debt 107 | | Hospitality | | 28,000 | | | 27,807 | | | 1 month LIBOR + 6.25% | | Interest Only | | 6/9/2024 | Senior Debt 107 | | Multifamily | | 146,810 | | | 146,608 | | 146,608 | | | — | | — | | | 1 month SOFR Term | | 1 month SOFR Term | | 3.95% | | Interest Only | | 6/9/2024 |
| Senior Debt 108 | Senior Debt 108 | | Multifamily | | 31,900 | | | 31,716 | | | 1 month LIBOR + 3.15% | | Interest Only | | 7/9/2026 | Senior Debt 108 | | Multifamily | | 56,000 | | | 55,938 | | 55,938 | | | — | | — | | | 1 month SOFR Term | | 1 month SOFR Term | | 3.80% | | Interest Only | | 6/9/2024 |
| Senior Debt 109 | Senior Debt 109 | | Multifamily | | 37,260 | | | 37,164 | | | 1 month LIBOR + 3.40% | | Interest Only | | 6/9/2024 | Senior Debt 109 | | Multifamily | | 11,675 | | | 11,661 | | 11,661 | | | — | | — | | | 1 month SOFR Term | | 1 month SOFR Term | | 4.45% | | Interest Only | | 11/9/2024 |
Senior Debt 110 (4) | | Multifamily | | — | | | — | | | 1 month LIBOR + 8.00% | | Interest Only | | 8/9/2024 |
| Senior Debt 110 | | Senior Debt 110 | | Multifamily | | 70,750 | | | 70,569 | | | — | | | 1 month SOFR Term | | 3.45% | | Interest Only | | 6/9/2024 |
| Senior Debt 111 | Senior Debt 111 | | Multifamily | | 29,500 | | | 29,370 | | | 1 month LIBOR + 2.88% | | Interest Only | | 8/9/2024 | Senior Debt 111 | | Hospitality | | 39,525 | | | 39,346 | | 39,346 | | | — | | — | | | 1 month SOFR Term | | 1 month SOFR Term | | 6.94% | | Interest Only | | 8/9/2025 |
| Senior Debt 112 | Senior Debt 112 | | Multifamily | | 10,050 | | | 10,009 | | | 1 month LIBOR + 4.50% | | Interest Only | | 8/9/2023 | Senior Debt 112 | | Multifamily | | — | | | — | | — | | | — | | — | | | 1 month SOFR Term | | 1 month SOFR Term | | 6.31% | | Interest Only | | 9/9/2025 |
| Senior Debt 113 | Senior Debt 113 | | Multifamily | | 13,259 | | | 13,168 | | | 1 month LIBOR + 3.75% | | Interest Only | | 10/9/2023 | Senior Debt 113 | | Hospitality | | 16,270 | | | 16,249 | | 16,249 | | | — | | — | | | 1 month SOFR Term | | 1 month SOFR Term | | 5.75% | | Interest Only | | 4/9/2024 |
| Senior Debt 114 | Senior Debt 114 | | Multifamily | | 29,250 | | | 29,103 | | | 1 month LIBOR + 3.00% | | Interest Only | | 9/9/2024 | Senior Debt 114 | | Manufactured Housing | | 11,617 | | | 11,587 | | 11,587 | | | — | | — | | | 1 month SOFR Term | | 1 month SOFR Term | | 4.75% | | Interest Only | | 9/9/2024 |
| Senior Debt 115 | Senior Debt 115 | | Multifamily | | 34,077 | | | 33,789 | | | 1 month LIBOR + 3.15% | | Interest Only | | 10/9/2024 | Senior Debt 115 | | Hospitality | | — | | | — | | — | | | — | | — | | | 1 month SOFR Term | | 1 month SOFR Term | | 7.50% | | Interest Only | | 11/9/2024 |
| Senior Debt 116 | Senior Debt 116 | | Multifamily | | 42,850 | | | 42,677 | | | 1 month LIBOR + 3.40% | | Interest Only | | 9/9/2023 | Senior Debt 116 | | Multifamily | | 48,764 | | | 48,684 | | 48,684 | | | — | | — | | | 1 month SOFR Term | | 1 month SOFR Term | | 4.20% | | Interest Only | | 1/9/2025 |
| Senior Debt 117 | Senior Debt 117 | | Multifamily | | 35,020 | | | 34,859 | | | 1 month LIBOR + 3.64% | | Interest Only | | 10/9/2024 | Senior Debt 117 | | Multifamily | | 51,000 | | | 50,875 | | 50,875 | | | — | | — | | | 1 month SOFR Term | | 1 month SOFR Term | | 3.75% | | Interest Only | | 12/9/2024 |
| Senior Debt 118 | Senior Debt 118 | | Multifamily | | 8,500 | | | 8,460 | | | 1 month LIBOR + 3.75% | | Interest Only | | 9/9/2024 | Senior Debt 118 | | Multifamily | | 14,635 | | | 14,594 | | 14,594 | | | — | | — | | | 1 month SOFR Term | | 1 month SOFR Term | | 4.25% | | Interest Only | | 1/9/2025 |
| Senior Debt 119 | | Multifamily | | 14,200 | | | 14,130 | | | 1 month LIBOR + 3.15% | | Interest Only | | 9/9/2023 |
| Senior Debt 120 | | Multifamily | | 13,350 | | | 13,284 | | | 1 month LIBOR + 3.75% | | Interest Only | | 10/9/2023 |
| Senior Debt 121 | | Multifamily | | 66,650 | | | 66,002 | | | 1 month LIBOR + 3.25% | | Interest Only | | 10/9/2024 |
| Senior Debt 122 | | Multifamily | | 18,750 | | | 18,688 | | | 1 month LIBOR + 2.95% | | Interest Only | | 10/9/2024 |
| Senior Debt 123 | | Multifamily | | 9,099 | | | 9,036 | | | 1 month LIBOR + 3.75% | | Interest Only | | 10/9/2024 |
| Senior Debt 124 | | Multifamily | | 26,160 | | | 26,024 | | | 1 month LIBOR + 3.20% | | Interest Only | | 10/9/2024 |
| Senior Debt 125 | | Hospitality | | 17,370 | | | 17,292 | | | 1 month LIBOR + 5.25% | | Interest Only | | 10/9/2023 |
| Senior Debt 126 | | Hospitality | | 16,500 | | | 16,423 | | | 1 month LIBOR + 7.10% | | Interest Only | | 11/9/2023 |
| Senior Debt 127 | | Multifamily | | 13,168 | | | 13,097 | | | 1 month LIBOR + 3.40% | | Interest Only | | 10/9/2023 |
| Senior Debt 128 | | Multifamily | | 88,500 | | | 88,499 | | | 1 month LIBOR + 2.75% | | Interest Only | | 10/9/2024 |
| Senior Debt 129 | | Multifamily | | 56,150 | | | 55,878 | | | 1 month LIBOR + 3.10% | | Interest Only | | 10/9/2024 |
| Senior Debt 130 | | Multifamily | | 36,750 | | | 36,540 | | | 1 month LIBOR + 2.90% | | Interest Only | | 11/9/2026 |
| Senior Debt 131 | | Multifamily | | 52,192 | | | 51,872 | | | 1 month LIBOR + 3.10% | | Interest Only | | 12/9/2023 |
| Senior Debt 132 | | Multifamily | | 37,100 | | | 36,940 | | | 1 month LIBOR + 2.90% | | Interest Only | | 12/9/2024 |
| | | | | | | | | | | | | | | | | | | | | | | | | | | | | | | | | | | | | | |
| Description | | Property Type | | Face Amount | | Carrying Amount | | Interest
Rate | | Payment
Terms | | Maturity Date |
| Senior Debt 133 | | Multifamily | | 60,267 | | | 60,005 | | | 1 month LIBOR + 2.85% | | Interest Only | | 11/9/2023 |
| Senior Debt 134 | | Multifamily | | 30,600 | | | 30,543 | | | 1 month LIBOR + 2.65% | | Interest Only | | 11/9/2023 |
| Senior Debt 135 | | Multifamily | | 30,650 | | | 30,476 | | | 1 month LIBOR + 3.25% | | Interest Only | | 12/9/2024 |
| Senior Debt 136 | | Multifamily | | 62,850 | | | 62,556 | | | 1 month LIBOR + 3.35% | | Interest Only | | 12/9/2023 |
| Senior Debt 137 | | Multifamily | | 42,474 | | | 42,231 | | | 1 month LIBOR + 3.00% | | Interest Only | | 12/9/2023 |
| Senior Debt 138 | | Multifamily | | 46,080 | | | 45,821 | | | 1 month LIBOR + 2.75% | | Interest Only | | 11/9/2025 |
| Senior Debt 139 | | Multifamily | | 28,880 | | | 28,745 | | | 1 month LIBOR + 2.90% | | Interest Only | | 12/9/2024 |
| Senior Debt 140 | | Manufactured Housing | | 6,700 | | | 6,666 | | | 1 month LIBOR + 4.50% | | Interest Only | | 12/9/2024 |
| Senior Debt 141 | | Multifamily | | 58,680 | | | 58,393 | | | 1 month LIBOR + 3.45% | | Interest Only | | 1/9/2024 |
| Senior Debt 142 | | Multifamily | | 26,600 | | | 26,459 | | | 1 month LIBOR + 2.90% | | Interest Only | | 12/9/2023 |
| Senior Debt 143 | | Multifamily | | 12,478 | | | 12,393 | | | 1 month LIBOR + 3.20% | | Interest Only | | 12/9/2024 |
| Senior Debt 144 | | Multifamily | | 35,996 | | | 35,801 | | | 1 month LIBOR + 3.00% | | Interest Only | | 12/9/2024 |
| Senior Debt 145 | | Multifamily | | 32,250 | | | 32,068 | | | 1 month LIBOR + 3.20% | | Interest Only | | 12/9/2023 |
| Senior Debt 146 | | Multifamily | | 38,631 | | | 38,394 | | | 1 month LIBOR + 2.90% | | Interest Only | | 12/9/2023 |
| Senior Debt 147 | | Multifamily | | 64,281 | | | 63,917 | | | 1 month LIBOR + 2.88% | | Interest Only | | 12/9/2023 |
| Senior Debt 148 | | Multifamily | | 62,003 | | | 61,654 | | | 1 month LIBOR + 2.88% | | Interest Only | | 12/9/2023 |
| Senior Debt 149 | | Multifamily | | 16,570 | | | 16,467 | | | 1 month SOFR + 3.50% | | Interest Only | | 1/9/2024 |
| Senior Debt 150 | | Multifamily | | 56,930 | | | 56,757 | | | 1 month LIBOR + 2.75% | | Interest Only | | 12/9/2024 |
| Senior Debt 151 | | Multifamily | | 65,000 | | | 64,592 | | | 1 month SOFR + 5.14% | | Interest Only | | 7/9/2023 |
| Senior Debt 152 | | Multifamily | | 22,240 | | | 22,122 | | | 1 month SOFR + 2.96% | | Interest Only | | 1/9/2024 |
| Senior Debt 153 | | Multifamily | | 25,573 | | | 25,441 | | | 1 month SOFR + 2.96% | | Interest Only | | 1/9/2025 |
| Senior Debt 154 | | Multifamily | | 31,678 | | | 31,383 | | | 1 month SOFR + 3.20% | | Interest Only | | 1/9/2024 |
| Senior Debt 155 | | Multifamily | | 78,050 | | | 77,650 | | | 1 month SOFR + 3.45% | | Interest Only | | 1/9/2027 |
| Senior Debt 156 | | Multifamily | | 77,870 | | | 77,632 | | | 1 month LIBOR + 3.21% | | Interest Only | | 1/9/2025 |
| Senior Debt 157 | | Multifamily | | 24,000 | | | 23,881 | | | 1 month SOFR + 3.11% | | Interest Only | | 1/9/2024 |
| Senior Debt 158 | | Retail | | 31,000 | | | 30,845 | | | 1 month SOFR + 3.29% | | Interest Only | | 1/9/2025 |
| Senior Debt 159 | | Multifamily | | 47,444 | | | 47,208 | | | 1 month SOFR + 2.86% | | Interest Only | | 1/9/2024 |
| Senior Debt 160 | | Multifamily | | 36,824 | | | 36,639 | | | 1 month SOFR + 2.86% | | Interest Only | | 1/9/2024 |
| Senior Debt 161 | | Hospitality | | 17,169 | | | 17,169 | | | 5.99% | | Amortizing Balloon | | 10/6/2023 |
| Mezzanine Loan 1 | | Multifamily | | 6,500 | | | 6,488 | | | 1 month LIBOR + 10.25% | | Interest Only | | 9/9/2022 |
| Mezzanine Loan 2 | | Multifamily | | 3,000 | | | 3,000 | | | 1 month LIBOR + 9.20% | | Interest Only | | 3/9/2022 |
| Mezzanine Loan 3 | | Multifamily | | 10,000 | | | 9,951 | | | 1 month SOFR + 15.29% | | Interest Only | | 7/9/2023 |
| Mezzanine Loan 4 | | Retail | | 3,000 | | | 2,985 | | | 1 month SOFR + 12.00% | | Interest Only | | 1/9/2025 |
| | | | $ | 4,242,962 | | | $ | 4,226,888 | | | | | | | |
| | | | | | | | | | | | | | | | | | | | | | | | | | | | | | | | | | | | | | | | | | | | | | | | | | |
| Description | | Property Type | | Face Value | | Amortized Cost | | Principal amount subject to delinquent principal or interest (1) | | Index (2) | | Spread | | Payment
Terms | | Maturity Date |
| Senior Debt 119 | | Hospitality | | 28,300 | | | 28,297 | | | — | | | 1 month SOFR Term | | 5.25% | | Interest Only | | 1/9/2024 |
| Senior Debt 120 | | Multifamily | | 55,500 | | | 55,353 | | | — | | | 1 month SOFR Term | | 3.85% | | Interest Only | | 4/9/2025 |
| Senior Debt 121 | | Hospitality | | 10,500 | | | 10,465 | | | — | | | 1 month SOFR Term | | 5.50% | | Interest Only | | 4/9/2025 |
| Senior Debt 122 | | Hospitality | | 120,000 | | | 119,559 | | | — | | | 1 month SOFR Term | | 4.90% | | Interest Only | | 2/9/2026 |
| Senior Debt 123 | | Multifamily | | 64,500 | | | 64,388 | | | — | | | 1 month SOFR Term | | 5.00% | | Interest Only | | 5/9/2024 |
| Senior Debt 124 | | Hospitality | | 39,549 | | | 39,661 | | | — | | | 1 month SOFR Term | | 3.75% | | Interest Only | | 12/27/2024 |
| Senior Debt 125 | | Multifamily | | 21,700 | | | 21,616 | | | — | | | 1 month SOFR Term | | 3.95% | | Interest Only | | 7/9/2025 |
| Senior Debt 126 | | Manufactured Housing | | 21,449 | | | 21,296 | | | — | | | 1 month SOFR Term | | 4.25% | | Interest Only | | 8/9/2025 |
| Senior Debt 127 | | Multifamily | | 19,793 | | | 19,881 | | | — | | | | | 4.75% | | Interest Only | | 7/9/2028 |
| Senior Debt 128 | | Multifamily | | 78,996 | | | 78,664 | | | — | | | 1 month SOFR Term | | 3.20% | | Interest Only | | 8/9/2025 |
| Senior Debt 129 | | Hospitality | | 23,000 | | | 22,861 | | | — | | | 1 month SOFR Term | | 5.45% | | Interest Only | | 8/9/2026 |
| Senior Debt 130 | | Hospitality | | 12,420 | | | 12,322 | | | — | | | 1 month SOFR Term | | 4.85% | | Interest Only | | 9/9/2026 |
| Senior Debt 131 | | Multifamily | | 38,750 | | | 38,572 | | | — | | | 1 month SOFR Term | | 4.50% | | Interest Only | | 11/9/2025 |
| Senior Debt 132 | | Hospitality | | 31,300 | | | 31,078 | | | — | | | 1 month SOFR Term | | 4.25% | | Interest Only | | 11/9/2026 |
| Senior Debt 133 | | Multifamily | | 42,750 | | | 42,555 | | | — | | | 1 month SOFR Term | | 3.85% | | Interest Only | | 11/9/2025 |
| Senior Debt 134 | | Multifamily | | 17,119 | | | 16,966 | | | — | | | 1 month SOFR Term | | 3.20% | | Interest Only | | 10/9/2026 |
| Senior Debt 135 | | Multifamily | | 21,000 | | | 20,887 | | | — | | | 1 month SOFR Term | | 3.75% | | Interest Only | | 12/9/2024 |
| Senior Debt 136 | | Hospitality | | 41,071 | | | 40,855 | | | — | | | 1 month SOFR Term | | 3.65% | | Interest Only | | 12/9/2026 |
| Senior Debt 137 | | Hospitality | | 25,750 | | | 25,595 | | | — | | | 1 month SOFR Term | | 3.95% | | Interest Only | | 1/9/2026 |
| Senior Debt 138 | | Hospitality | | 16,566 | | | 16,563 | | | — | | | | | 5.99% | | Amortizing Balloon | | 10/6/2024 |
| Mezzanine Loan 1 | | Retail | | 3,000 | | | 2,994 | | | — | | | 1 month SOFR Term | | 12.00% | | Interest Only | | 1/9/2025 |
| Mezzanine Loan 2 | | Mixed Use | | 1,000 | | | 1,000 | | | — | | | 1 month SOFR Term | | 11.00% | | Interest Only | | 3/9/2024 |
| Mezzanine Loan 3 | | Hospitality | | 1,350 | | | 1,346 | | | — | | | 1 month SOFR Term | | 9.25% | | Interest Only | | 11/9/2025 |
| Mezzanine Loan 4 | | Hospitality | | — | | | — | | | — | | | 1 month SOFR Term | | 10.00% | | Interest Only | | 11/9/2024 |
| Mezzanine Loan 5 | | Multifamily | | 2,378 | | | 2,378 | | | — | | | 1 month SOFR Term | | 4.50% | | Interest Only | | 9/9/2024 |
| Mezzanine Loan 6 | | Multifamily | | 11,700 | | | 11,655 | | | — | | | 1 month SOFR Term | | 3.95% | | Interest Only | | 7/9/2025 |
Commercial mortgage loans, held for investment (3) | | $ | 5,045,036 | | | $ | 5,036,942 | | | $ | 63,389 | | | | | | | | | |
| Allowance for credit losses | | $ | (47,175) | | | | | | | | | | | |
| Commercial mortgage loans, held for investment, net of allowance for credit losses | | $ | 4,989,767 | | | | | | | | | | | |
________________________
(1) Principal amount of loans subject to delinquent principal or interest is defined as loans in (a) maturity default or (b) receipt of interest outstanding for more than 90 days.
(2) On March 5, 2021, the Financial Conduct Authority of the U.K. (the “FCA”) announced that LIBOR tenors would cease to be published or no longer be representative. The Alternative Reference Rates Committee (the “ARRC”) interpreted this announcement to constitute a benchmark transition event. The benchmark index of LIBOR interest rate will convert from LIBOR to compounded SOFR, plus a benchmark adjustment of 11.448 basis points. As of December 31, 2023, all of our commercial mortgage loans, held for investment which had been indexed at LIBOR were converted to SOFR utilizing the 11.448 basis points adjustment and the applicable spreads remain unchanged. The loans which have the SOFR adjustment are indicated with "Adj. 1M SOFR Term." Effective yield is calculated as the spread of the loan plus the higher of any applicable index or index floor.
(3) The estimated aggregate cost for U.S. federal income tax purposes is approximately $5.0 billion.
For the activity within the Company's loan portfolio during the years ended December 31, 2023 and 2022, refer to Note 3 - Commercial Mortgage Loans on the consolidated financials of Form 10-K.