UNITED STATES
SECURITIES AND EXCHANGE COMMISSION
Washington, D.C. 20549
__________________
FORM 10‑K
☒ ANNUAL REPORT PURSUANT TO SECTION 13 OR 15(d) OF THE SECURITIES EXCHANGE ACT OF 1934
For the fiscal year ended December 31, 20132016
OR
☐ TRANSITION REPORT PURSUANT TO SECTION 13 OR 15(d) OF THE SECURITIES EXCHANGE ACT OF 1934
For the transition period from ____________to____________
Commission File No. 001-34220
__________________________

3D SYSTEMS CORPORATION
(Exact Name of Registrant as Specified in Its Charter)
_______________ _____________________________
| | |
| | |
DELAWARE | | 95‑4431352 |
(State or Other Jurisdiction of
Incorporation or Organization) | | (I.R.S. Employer
Identification No.) |
333 THREE D SYSTEMS CIRCLE
ROCK HILL, SOUTH CAROLINA | | 29730 |
(Address of Principal Executive Offices) | | (Zip Code) |
(Registrant’s Telephone Number, Including Area Code): (803) 326‑3900
Securities registered pursuant to Section 12(b) of the Act:
| | |
Title of each class | | Name of each exchange on which registered |
Common stock, par value $0.001 per share | | The New York Stock Exchange |
Securities registered pursuant to Section 12(g) of the Act: None
__________________________
Indicate by check mark if the registrant is a well-known seasoned issuer, as defined in Rule 405 of the Securities Act. Yes ☒ No ☐
Indicate by check mark if the registrant is not required to file reports pursuant to Section 13 or Section 15(d) of the Act. Yes ☐ No ☒
Indicate by check mark whether the registrant: (1) has filed all reports required to be filed by Section 13 or 15(d) of the Securities Exchange Act of 1934 during the preceding 12 months (or for such shorter period that the registrant was required to file such reports), and (2) has been subject to such filing requirements for the past 90 days. Yes ☒ No ☐
Indicate by check mark whether the registrant has submitted electronically and posted on its corporate Web site, if any, every Interactive Data File required to be submitted and posted pursuant to Rule 405 of Regulation S-T (§232.405 of this chapter) during the preceding 12 months (or for such shorter period that the registrant was required to submit and post such files). Yes ☒ No ☐
Indicate by check mark if disclosure of delinquent filers pursuant to Item 405 of Regulation S-K (§229.405 of this chapter) is not contained herein, and will not be contained, to the best of registrant’s knowledge, in definitive proxy or information statements incorporated by reference in Part III of this Form 10-K or any amendment to this Form 10-K. ☐
Indicate by check mark whether the registrant is a large accelerated filer, an accelerated filer, a non-accelerated filer, or a smaller reporting company. See the definitions of “large accelerated filer,” “accelerated filer” and “smaller reporting company” in Rule 12b-2 of the Exchange Act. (Check one):
| | | | |
| | | | |
Large accelerated filer | ☒ | | Accelerated filer | ☐ |
| | | | |
Non-accelerated filer | ☐ | (Do not check if smaller reporting company) | Smaller reporting company | ☐ |
Indicate by check mark whether the registrant is a shell company (as defined in Rule 12b‑2 of the Exchange Act.) Yes ☐ No ☒
The aggregate market value of the registrant’s common stock held by non-affiliates of the registrant on June 28, 201330, 2016 was $4,098,482,445.$1,437,534,741. For purposes of this computation, it has been assumed that the shares beneficially held by directors and executive officers of the registrant were “held by affiliates.” This assumption is not to be deemed an admission by these persons that they are affiliates of the registrant.
The number of outstanding shares of the registrant’s common stock as of February 19, 201422, 2017 was 103,210,661.113,163,336.
DOCUMENTS INCORPORATED BY REFERENCE: Portions of the registrant’s definitive proxy statement for its 20142017 Annual Meeting of Stockholders are incorporated by reference into Part III of this Form 10-K.
A
3D SYSTEMS CORPORATION
Annual Report on Form 10‑K for the
Year Ended December 31, 20132016
TABLE OF CONTENTS
This Annual Report on Form 10-K (“Form 10-K”) contains forward-looking statements, within the meaning of the Private Securities Litigation Reform Act of 1995, that involve risks and uncertainties. Many of the forward-looking statements are located in Part II, Item 7 of this Form 10-K under the heading “Management’s Discussion and Analysis of Financial Condition and Results of Operations.” Forward-looking statements involve known and unknown risks, uncertainties and other factors that may cause our actual results, performance or achievements to be materially different from historical results or from any future results expressed or implied by such forward-looking statements. In many cases, you can identify forward-looking statements by terms such as “believes,” “belief,” “expects,” “may”, “will”, “estimates,” “intends,” “anticipates,” or “plans” or the negative of these terms or other comparable terminology. Forward-looking statements are based upon management’s beliefs, assumptions and current expectations concerning future events and trends, using information currently available, and are necessarily subject to uncertainties, many of which are outside our control.Although we believe that the expectations reflected in the forward-looking statements are reasonable, forward-looking statements are not, and should not be relied upon as a guarantee of future performance or results, nor will they necessarily prove to be accurate indications of the times at or by which any such performance or results will be achieved. A number of important factors could cause actual results to differ materially from those expressed in or implied by the forward-looking statements. Factors that might cause such differences include, but are not limited to, those discussed in Part I, Item 1A of this Form 10-K under the heading “Risk Factors.” All subsequent written and oral forward-looking statements attributable to the Company or to individuals acting on our behalf are expressly qualified in their entirety by this discussion. The Company assumes no obligation to revise or update any forward-looking statements for any reason, except as required by law.
PART I
Item 1. Business
General
3D Systems Corporation (“3D Systems” or the “Company” or “we” or “us”) is a holding company incorporated in Delaware in 1993 that operates through subsidiaries in the United States,North America and South America (collectively referred to as “Americas”), Europe and the Asia-PacificMiddle East (collectively referred to as “EMEA”) and the Asia Pacific region (“APAC”). We market our products and distributes its productsservices in those areas as well as in other parts of the world. 3D Systems is a leading provider ofWe provide comprehensive 3D printing centric design-to-manufacturing solutions, including 3D printers, print materials, software, on demand manufacturing services and cloud sourced on-demand custom parts for professionalsdigital design tools. Our precision healthcare capabilities include simulation, Virtual Surgical Planning (“VSP™”), and consumers alikeprinting of medical and dental devices and surgical guides and instruments. Our solutions support advanced applications in materialsa wide range of industries including plastics, metals, ceramicshealthcare, aerospace, automotive and edibles. The company also providesdurable goods. 3D Systems has a variety30 year history of perceptual devices including 3D scan-to-CAD, freeform modelingexperience and inspection tools. Its products and services replace and complement traditional methods and reduce the time and costexpertise which have proven vital to our development of designing new products by printing real parts directly from digital input. These solutions are used to rapidly design, create, communicate, prototype or produce real parts, empoweringan ecosystem that enables customers to manufacture the future. optimize product designs, transform workflows, bring innovative products to market and drive new business models.
3D printersCustomers can print almost anything from personalized medical devices to functional airplane and car parts and from individualized accessories to customized jewelry and toys. Over the past three decades, entire industries transformed their design-to-manufacturing processes using 3D content-to-print solutions. Companies using 3D printing have the freedom to create and manufacture customized products with no additional cost for complexity and uniqueness. Instead of investing in expensive tooling and incurring long lead-times and costly freight charges, customers can use 3D printing to mass customize and locally print what they need, when they need it and in a more cost effective way, while significantly reducing undesired environmental impacts of traditional manufacturing.
We pioneered 3D printing and digital manufacturing with the invention of stereolithography (“SLA”) and the universally used .stl file format almost 30 years ago and we subsequently developed selective laser sintering (“SLS”), multi-jet printing (“MJP”), film transfer imaging (“FTI”), color jet printing (“CJP”), direct metal sintering (“DMS”) and plastic jet printing (“PJP”) 3D printing technologies. Over the past decades many companies enhanced their competitive advantage by embracing our 3D printing solutions to convert their new product design and rapidmanufacture complex and unique parts, eliminate expensive tooling, produce parts locally or in small batches and reduce lead times and time to market. A growing number of customers are shifting from prototyping activitiesapplications to also using 3D printing for production. We believe this shift will be further driven by our continued advancement and transitioned to new Direct Manufacturinginnovation of end use parts3D printing solutions that improve durability, repeatability, productivity and custom products. Today, we continue to drive the adoptiontotal cost of large-scale custom manufacturing solutions, including end use parts in a variety of aerospace, defense, transportation and healthcare applications worldwide. operations.
Products
We are committed to democratizing access and accelerating adoption of our products and services through affordability and simplicity for the benefit of professionals and consumers. We are extending theoffer a comprehensive range of our affordable printing solutions from the design department3D printers, print materials, software, haptic devices, scanners and production floor to classroomsvirtual surgical simulators.
3D Printers and living rooms. Materials
Our growing portfolio of 3D printers ranges from under $1,000 to nearly $1 million and includestransform digital data input generated by 3D design software, CAD software or other 3D design tools, into printed parts using several unique print engines that employ proprietary, additive layer printingby layer building processes designed to meet our customers’ most demanding design, prototyping, testing, tooling, production and manufacturing requirements. Our principalwith a variety of print engines include stereolithography, selective laser sintering, direct metal sintering, multi-jet printing, color-jet printing, film transfer imaging and plastic jet printing.materials. We believe that ouroffer a broad range of 3D printing solutionstechnologies including Stereolithography (“SLA”), Selective Laser Sintering (“SLS”), Direct Metal Printing (“DMP”), MultiJet Printing (“MJP”) and services enable our customers to develop and manufacture new products faster andColorJet Printing (“CJP”), which are discussed in more economically, with better quality and greater functionality, than with traditional methods.detail below.
Our printers utilize a wide range of print materials, the majority of which are proprietary print materials that we develop, blend and market to print real parts.market. Our comprehensive range of print materials range from realincludes plastic, nylon, metal, composite, elastomeric, wax, polymeric dental materials and plastic to real metals and engineered materials designed to replicate the performance of specific plastics, composites, nylons and metals.Class IV bio-compatible materials. We augment and complement our own portfolio of engineered print materials with materials that we purchase from third parties under private label and distribution arrangements.
We provide our customersdevelop with our Geomagic® software tools and Cubify® apps and downloads for creativity and design, including 3D scan-to-CAD and inspection tools, haptic design and sculpting and medical modeling. Our software solutions seamlessly integrate 3D content creation and manipulation with 3D scanners, CAD packages and 3D printers. We also offer proprietary software printer drivers and pre-sale and post-sale services, ranging from applications development and custom engineered production solutions to installation, warranty and maintenance services.
We also provide quick turn, short run custom manufacturing services via our leading Quickparts®, on-demand cloud printed parts services, to satisfy our customers’ entire design-to-manufacturing requirements. We offer a broad range of precision plastic and metal parts capabilities produced from a wide range of 3D printing and traditional materials using a variety of additive and traditional manufacturing processes.
In addition to 3D printing solutions, we provide digitizing scanners for medical and mechanical applications that are sold under our Vidar® brand.
We continue to develop new products and services and have expanded our technology platform and 3D ecosystem through internal developments, relationships with third parties and acquisitions. We maintain ongoing product development programs that are focused on providing our customers with the most comprehensive portfolio of 3D content-to-print solutions, targeting their entire design-to-manufacturing requirements, from desktop prototyping to fab-grade manufacturing. We are focusing on developing a comprehensive menu of affordable to own and operate 3D printing solutions to address applications in the aerospace, automotive, healthcare, education, MCAD, architecture and consumer marketplaces, which we believe represent significant growth opportunities for our business.
We offer a wide variety of products, tools and services including rapid manufacturing used to manufacture end-use parts, rapid prototyping used to quickly and efficiently generate product-concept models and functional testing prototypes, communication and design applications used to produce presentation models, healthcare solutions used for medical study models and tools, consumer solutions used to provide customers with easy to use printers and concept creation apps, and software solutions used to provide CAD modeling, reverse engineering and inspection tools.
We provide expertly integrated solutions consisting of printers, print materials, software tools, 3D scanners and a variety of related Quickparts and other customer services. Our extensive solutions portfolio enables us to offer our customers cost effective ways to transform the manner in which they design, develop and manufacture their products.
Recent Developments
We are continuing to expand our global facilities and increase manufacturing capacity to meet demand for our products and services. In October, we announced that we plan to expand our Rock Hill, SC, manufacturing operations, which we expect to generate approximately 145 new jobs. We are also expanding manufacturing capacity in our other facilities for printers, including at least tripling our direct metals printers’ production output.
In October, we announced the availability of Cubify Design™, a parametric CAD design tool for consumers and prosumers for complex projects requiring real-world functionality and accuracy.
In November, we announced the availability of the Sense™ 3D scanner, the first ever digital photography device, designed for the consumer and optimized for 3D printing. The Sense delivers precise, instant, physical photography and its user interface includes zoom, track, focus, crop, enhance and share tools. Sense printables can be sent to Cube® and CubeX and ProJet x60 series 3D printers, or directly uploaded to Cubify.com for cloud printing in a range of materials.
In November, we announced the availability of Geomagic Capture®, a family of integrated desktop, scanner and software tools for professional scan-based design and quality inspection. Geomagic Capture is available in six configurations and each package includes a compact, blue-light LED scanner directly integrated with Geomagic software. Using Geomagic Capture, designers and engineers can instantly incorporate real world objects into CAD at their desktops.
In November, we entered into a multi-year development agreement with Google, Inc., to create a continuous high-speed 3D printing production platform and fulfilment system and functional materials in support of its Project Ara. Project Ara aims to develop highly-custom, modular smartphones that allow users the opportunity to make functional and aesthetic choices about their device.
In December, we announced the availability of the ProJet® 4500 3D printer, a continuous-tone and full-color plastic 3D printer. This professional 3D printer delivers ready-to-use, full-color durable plastic parts for a wide range of modeling, functional prototyping and real-use products. The ProJet 4500 builds with a new class of sustainable VisiJet® C4 Spectrum materials that were launched simultaneously. This printer delivers both flexible and strong parts with pixel-by-pixel color, in high-resolution color with a superior surface finish.
In December, we announced the availability of the ProJet 5500X, a multi-material, 3D printer and a related family of engineered composite materials to deliver high quality, accurate and tough parts. The ProJet 5500X simultaneously prints and fuses together flexible, rigid and polycarbonate-like composite materials layer by layer at the pixel level in a variety of colors and shades including opaque, clear, black, white and shades of gray. Our printed multi-material composites result in realistic, functional, large and small prototypes and products for a wide range of manufacturers, designers and engineers.
In December, we announced the availability of the ProX™ 950 SLA® 3D printer, the largest-format, highest-speed, greatest accuracy and greenest 3D printer we currently provide. The ProX 950 is equipped with our PolyRay™ print head technology that can manufacture real parts at up to 10 times the speed of other 3D printers, drawing on a wide choice of high-performance engineered materials that are qualified for aerospace, medical device and industrial use-cases.
In December, we announced the availability of the ProX 500 SLS® 3D printer that delivers high-precision, durable and high-quality parts in a compact production-grade system. Designed for the manufacturing floor, the ProX 500 produces ready-to-use functional parts and complete assemblies for a variety of aerospace, automotive, patient-specific medical devices, fashion accessories and mobile device cases. The compact ProX 500 printer was developed in tandem with our new DuraForm® ProX material to produce smoother wall surfaces and injection molding-like part quality.
In December, we announced the availability of the ProX 300, the first Phenix system to be rebranded as part of our rapidly expanding DMS 3D printers family. The ProX 300 is a direct metal printer with an industrial grade direct metal platform that is specifically designed for demanding manufacturing floor conditions, delivering high density, metal-printed parts from a large choice of materials and to accurate precision. We also have available our rebranded ProX 100 and ProX 200 DMS 3D printers.
In December, we announced the availability of the ProJet 1200, a new micro-SLA 3D printer that is ideal for small, precise, detail-rich parts and casting patterns, such as jewelry, electronic components and dental wax-ups. With a footprint smaller than a coffee maker and an all-in-one cartridge materials delivery system that is economical to own, safe to operate anywhere and simple to use. We expect shipments for the ProJet 1200 to begin during the first quarter of 2014.
In December, we announced the acquisition of Figulo, a provider of 3D-printed ceramics. We plan to integrate Figulo’s operations into our Cubify ecosystem and our professional cloud printing service, Quickparts, and to leverage Figulo’s ceramics materials and process knowledge to fast track the commercialization of our own family of end-user real ceramic 3D printers based on our ColorJet Printing technology. 3D-printed ceramics enable new possibilities in complex designs for kitchenware, tiling, art and more.
In December, we announced the acquisition of Village Plastics Co., a manufacturer of filament-based ABS, PLA and HIPS 3D printing materials. Through its manufacturing facility in Norton, Ohio, Village Plastics delivers high quality, precision 3D printing filaments. We plan to integrate Village Plastics materials and manufacturing technologies to accelerate our development of advanced filament-based materials for our Cube and CubeX 3D printers. Additionally, we plan to support all Village Plastics’ existing customers by providing full access to our complete portfolio of design-to-manufacturing products and services.
In December, we announced the acquisition of Xerox Corporation’s Wilsonville, Oregon product design, engineering and chemistry group and related assets. As part of the agreement, we have added more than 100 Xerox engineers and contractors specializing in product design and materials science to our global R&D team and operate our own facility within the Xerox Wilsonville campus. Xerox will provide ink and print head development resources along with research relevant for digital printing and the 3D markets.
In December, we announced the acquisition of Gentle Giant Studios, a provider of 3D modeling for the entertainment and toy industry. Gentle Giant Studios develops high quality content using 3D scanning and modeling to develop and manufacture licensed 3D printed characters, toys and collectibles from a variety of franchise properties with global brand recognition. We plan to leverage Gentle Giant Studios’ technology and library of digital content into our consumer platform and extend existing brand relationships to further the reach of 3D scanning, modeling and printing for entertainment, toys, collectibles and action figures.
In January, we revealed several new consumer products at the 2014 International Consumer Electronics Show (“CES”), including six new 3D printers. The Cube® 3 3D printer, expected to be released during the second quarter of 2014, is the first sub-$1,000 plug-and-play home printer that is certified kid-safe and offers multi-material and dual color options. The CubePro™ 3D printer, expected to be priced below $5,000 and released during the second quarter of 2014, offers printing in up to 3 colors at a time and the largest build size in its class and utilizes a controlled print chamber that automatically adjusts for ABS and/or PLA print materials. The ChefJet™ and ChefJet Pro 3D printers, expected to be released during the second half of 2014 at sub-$5,000 and sub-$10,000, respectively, printing in real sugar and chocolate. The CeraJet™ 3D printer prints in real ceramic material that is ready for glazing and firing and is expected to be released during the second half of 2014 for under $10,000. The CubeJet™ 3D printer is the first desktop, full-color printer and we expect to release it during the second half of 2014 for less than $5,000. We also unveiled the Touch™, the first haptic-based, consumer mouse for 3D sculpting and design with instant force feedback, which is expected for commercial shipment during the second quarter of 2014 at $499, including software. We previewed the iSense, a 3D scanner for iPads for physical photography of objects up to 10 feet and optimized for seamless 3D printing, which is expected to be available in the second quarter of 2014 for $499. At CES, we also showcased the 3DMe® Photobooth, an integrated physical photography pod to bring the 3DMe experience to retail floors and event spaces, which we expect to commercialize in the second quarter of 2014.
In January, we announced a partnership with Intel Corporation to mainstream the adoption of 3D scanning and 3D printing. We will make available our consumer Sense scanning, editing and 3D printing software applications for Intel-powered Ultrabook, 2 in 1, AIO and tablet devices equipped with the new Intel 3D camera during the second half of 2014. Also in January, we announced a multi-year joint development agreement with The Hershey Company, a large producer of chocolate in North America and a global leader in chocolate, sweets and refreshment, to explore and develop innovative opportunities for using 3D printing technology in creating edible foods, including confectionery treats. In February of 2014, Hasbro, Inc., a global branded play company, announced their intent to co-develop, co-venture and deliver new immersive, creative play experiences powered by 3D printing for children and their families later in 2014.
Products
Printers and Other Products
All our 3D printers employ one of our seven print engines, which are discussed in more detail below. Our 3D printers convert data input from any CAD generated software format or 3D scanning and sculpting devices, to printed parts using our proprietary engineered plastic, metal, nylon, rubber, wax and composite print materials. Our professional and production printers comprise our SLA, SLS, DMS, MJP, CJP, and FTI printers. Our consumer printers price points include our PJP and CJP printers.
Customers use our professional and production printers to produce highly accurate geometries and/or very durable parts for applications in various industries, including aerospace, automotive and patient-specific medical devices for a variety of healthcare use cases. They are also used in engineering and design spaces for product development, architecture, marketing communication, education and research and for custom manufacturing of advanced oral and orthopedic restorative devices, custom jewelry and customized toys, action figures and collectibles. Our professional printers are capable of rapidly producing tools, fixtures, jigs, patterns, medical models and end-use parts.
Our consumer 3D printers produce ready-to-use functional parts at home, school or office workstations. These plug and print 3D printers enable students, consumers, designers, engineers, hobbyists and do-it-yourselfers to imagine, design and print their ideas at home or at their desks.
We develop, blend, compound, extrude and market a wide range of proprietary print materials that replicate the performance of engineered plastics, composites and metals. We augment and complement our own portfolio of print materials with materials that we purchase from third parties under private label and distribution arrangements.
We provide our customers proprietary software tools under our Geomagic brand name for professionals and Cubify brand for consumers. We provide a library of content files and content creation apps through our Cubify.com online destination. We also provide software drivers embedded within our printers. We provide pre-sale and post-sale services, ranging from applications development to installation, warranty and maintenance services. We also provide a comprehensive suite of printed parts services through our Quickparts branded, on-demand custom parts services. Our Quickparts services offer a broad range of precision plastic and metal parts service capabilities produced from a wide range of 3D printing and traditional materials using a variety of additive and traditional manufacturing processes.
3D Printer Solutions
SLA4Printers
Our stereolithography printers convert our proprietary, engineered print materials and composites into solid cross-sections, layer by layer, to print the desired fully fused objects. Our SLA printers are capable of making multiple distinct parts at the same time and are designed to produce highly accurate geometries in a wide range of sizes and shapes with a variety of material performance characteristics. Our family of SLA printers offers a wide range of capabilities, including size, speed, accuracy, throughput and surface finish in different formats and price points. Our SLA printers come in a variety of print formats and footprint sizes designed to quickly and economically produce durable plastic parts with unprecedented surface smoothness, feature resolution, edge definition and tolerances that rival the accuracy of CNC-machined plastic parts.
SLA parts are designed for uses from functional models to foundary patterns and end-use parts and are known for their ultra-high definition, fine feature detail, resolution and surface quality. Product designers, engineers and marketers in many manufacturing companies throughout the world use our SLA printers for a wide variety of applications, ranging from automotive, aerospace and consumer and electronic applications to healthcare for mass customization of orthodontics, hearing aids and surgical guides and kits.
SLS Printers
Our selective laser sintering printers convert our proprietary, engineered print materials and composites by melting and fusing (sintering) these print materials into solid cross‑sections, layer by layer, to produce finished parts. SLS printers can create parts from a variety of proprietary engineered plastic and nylon powders and are capable of processing multiple parts in a single build session.
Customer uses of our SLS printers include functional test models and end-use parts, which enable our customers to create customized parts economically without tooling. The combination of print materials flexibility, part functionality and high throughput of our SLS print engine makes it well suited for rapid manufacturing of durable parts for applications in various industries, including aerospace, automotive, packaging, machinery and motor-sports.
Our family of SLS printers comes in a variety of print formats and degrees of automation. Our SLS production printers are designed to enable our customers to mass customize and produce high-quality, end-use parts, patterns, fixtures and tools consistently and economically from our proprietary engineered plastics, nylons and composites, on site and on demand.
DMS Printers
Our direct metal sintering printers produce chemically pure, fully dense metal parts, by sintering very fine granularity powders in a variety of different metals materials and a ceramic material. We offer direct metal printers in several sizes, including the ProX 100, 200 and 300.
MJP Printers
Our professional MJP printers utilize jetting head technology to deliver high quality, accurate and tough parts in plastics, wax, engineered materials and the capability to print parts in multiple materials in a single part. Our MJP professional printers come with a five-year print head warranty and are designed to print high-definition, functional and durable models for form, fit and function analysis, including certain models that are capable of ultra-fine resolution for precision dental and jewelry applications.
CJP Printers
Our professional CJP printers produce parts in ceramic-like material and plastics using powder materials and binders. These printers are full color printers, capable of printing in a million colors pixel by pixel and are ideal for MCAD, architecture, design communication, education, art and medical modeling applications.
FTI Printers
Our film transfer imaging printers use DLP light curing technology to print durable plastic parts with a smooth surface finish and true to design detailed features. Parts printed on these ProJet printers can be drilled, machined, painted and metal-plated after building and parts can be printed in six different colors.
PJP Printers
Our PJP consumer 3D printers utilize a proven, simple, clean, compact and quiet plastic extrusion print engine technology designed for office, home and classroom use. Our PJP printers are designed and engineered to be simple, accurate and robust and some are equipped with up to three compact precision print heads for print speed, accuracy, multi-color, multi-material printing with fast material changeovers and multiple print modes available.
PJP printers offer an easy to use interface, affordable color printing in one to three colors in a single build in PLA or ABS plastic.
3D Print Materials
As part of our integrated solutions approach, we blend, market, sell and distribute proprietary, consumable, engineered plastic, nylon and metal materials and composites under several leading brand names for use in all our printers. We market our SLA materials under the Accura® brand, our SLS materials under the DuraForm, CastForm™ and LaserForm™ brands and materials for our MJP, CJP and FTI printers under the VisiJet brand. We augment and complement our own portfolio of print materials with materials that we purchase from third parties under private label and distribution arrangements.
With the exception of the recently acquired metals printers, our currently offered printers have built-in intelligence that communicates vital processing and quality statistics in real time. For these printers, we furnish integrated print materials that are specifically designed for use in those printers and that are packaged in smart cartridges designed to enhance system functionality, up-time, materials shelf life and overall printer reliability, with the objective of providing our customers with a built-in quality management system and a fully integrated work flow solution.
We work closely with our customers to optimize the performance of our print materials in their applications. Our expertise in print materials science and formulation, combined with our process, software and equipment, design strengths, enables us to help our customers select the print material that best meets their needs and obtainwith optimal cost and performance results. We also work
As part of our solutions approach, our currently offered printers, with third partiesthe exception of direct metal printers, have built-in intelligence to develop different types ofmake them integrated, closed systems. For these printers, we furnish print materials specifically designed for use in those printers and that are packaged in smart cartridges and delivery systems. These integrated materials are designed to meet the needs ofenhance system functionality, productivity, materials shelf life and overall printer reliability, in addition to providing our customers.customers with a built-in quality management system and a fully integrated workflow solution.
SLA Print Materials and CompositesPrinters
Our familySLA 3D printers cure liquid resin materials with a laser beam to produce durable plastic parts with surface smoothness, high resolution, edge definition and tolerances that rival the accuracy of proprietary stereolithographymachined or molded plastic parts. We offer SLA printers with a wide range of materials, sizes and composites offersprice points that are well-suited for prototypes, end-use parts, casting patterns and molds, tooling, fixtures and medical models.
For SLA printers, we offer a variety of plastic-like performance characteristics and attributesliquid resin materials under the Accura® brand name. The resins are designed to mimic specific, engineered thermoplasticthermoplastics and provide a wide range of characteristics, including tough, durable, clear, castable, polypropylene-like, ABS-like, high-temperature resistant and Class IV bio-compatible materials. When used
We are also developing a 3D printing technology that utilizes a light-curing process we refer to as our Figure 4 platform. Figure 4 is an ultra-fast additive manufacturing technology in our SLA printers, our proprietary liquid resins turndiscrete modules, allowing it to be placed into a solid surface one layer at a time,automated assembly lines and through an additive building process, allintegrated with secondary processes, including material recovery, washing, curing and finishing steps. Unlike other photopolymer 3D printing, Figure 4 is capable of manufacturing parts in hybrid materials (multi-mode polymerization) that offer toughness, durability, biocompatibility, high temperature deflection and even elastomeric properties. This opens the layers bonddoor to new end-use applications in the fields of healthcare, durable goods, automotive, aerospace and fuse to make a solid part. SLA print materials are ideal for fit and form testing, wind tunnel testing, patterns and molds, show models and healthcare applications such as in-the-ear hearing aids, surgical kits and medical models.beyond.
SLS Printers
Our portfolio of Accura stereolithographySLS 3D printers use a laser beam to melt and fuse powder-based nylon and engineered plastic and composite print materials includes general purpose as well as specialized materials and composites that offer customers the opportunity to choose the material that is best suited for the parts and models that they intend to produce.
To further complement and expand the range of materials we offer to our customers, we also distribute SLA materials under recognized third-party brand names.
SLS Print Materials and Composites
Our family of proprietary selective laser sintering materials and composites includes a range of rigid plastic, elastomeric and nylon materials as well as various composites of these ingredients. Our SLS printers have built-in versatility; therefore, the same printers can be used to process multiple materials.
Our DuraForm laser sintering materials include CastForm and LaserForm proprietary SLS materials. SLS materials are used to create durable, functional end-use parts, prototypesproduce very strong and durable patterns as well as assembly jigs and fixtures. They are also used to produce flexible, rubber-like parts, high-temperature resistant parts, patterns for investment casting, functional tooling such as injection molding tool inserts, and end-use parts for customized advanced manufacturing applications.
Examplesparts. Customer uses of rapid manufacturing parts produced by our customers using our SLS printers include air ducts for military aircraft and engine cowling parts for unmanned aerial vehicles. Product designers and developers from major automotive, aerospace and consumer products companies use DuraForm parts extensively as functional test models including in harsh test environment conditions. Aerospaceand end-use parts, such as housings, machinery components, ducting, tooling, jigs and fixtures and medical companies use ourdevices and personalized surgery kits and guides.
Our proprietary SLS printers to produce end-use parts directly, which enables them to create customized parts economically without tooling. Parts made frommaterials include a range of soft and rigid plastics, nylon and composite materials marketed under the DuraForm and®, LaserForm™® and CastForm™ brand names. These materials are cost effectiveavailable in a variety of lightweight, tough, versatile, high temperature, flexible and can compete favorably with traditional manufacturing methods, especially where part complexity is high.durable formulations.
Metal MaterialsDMP Printers
Our familyDMP solutions use a laser beam to sinter powders in a variety of DMS printmetals to produce fully dense parts with outstanding surface finish and resolution. We offer DMP printers that can process a wide range of materials includes metal and ceramicpowders, including materials with very fine powders with granularity of six to nine microns. Theseand proven manufacturing applications. We sell DMP systems in various sizes and certain models are optimized for specific metals, including titanium, stainless steel and nickel super alloys. Our DMP printers are well-suited for medical and dental implants, aerospace, automotive, and hi-tech and industrial applications, such as conformal cooling, simplifying assemblies, light weight parts, enhanced fluid flow, topology optimization and other complex parts.
We offer metal powder materials include ceramics,for our direct metal printers, including titanium, stainless steels, tool steels, super alloys, non-ferrous alloys, precious metals and alumina. Our DMS printers and materials are used for chemically pure, fully dense, fine feature detail printing of end use part and patterns in aerospace, automotive and healthcare applications. Super alloys are commonly used in parts of gas turbine engines that are subject to high temperatures and require high strength, high temperature creep resistance, phase stability and oxidation and corrosion resistance. Non-ferrous metals include aluminum and titanium. Precious metals such as gold, silver and platinum and exotic or rare metals such as cobalt, mercury or tungsten can also be processed. aluminum.
VisiJet Print MaterialsMJP Printers
Our family of MJP VisiJetprint materials includes3D printers utilize jetting head technology to deliver precise, tough parts with exceptional resolution in tough plastic, wax, elastomer and engineered part-buildingmaterials that we sell under the VisiJet® brand name. MJP printers offer the capability to print in rigid or flexible materials and compatible disposable supportmultiple materials that are used in the modeling processone build, making them ideal for mechanical functional testing, rapid tooling, jigs and facilitate an easily-melted support removal process. fixtures, casting patterns, over-molding and medical models.
CJP Printers
Our CJP 3D printers produce parts from our VisiJet materials includebranded, powder-based ceramic-like materials. CJP printers build high-definition, full-color parts that can be sanded, drilled, tapped, painted and plastic materials and binders. These print materials are sold to our customers packaged in proprietary smart cartridges designedelectroplated, which further expands the options available for our professional 3D printers. Our proprietary VisiJet plastic print materialsfinished part characteristics. CJP printers are ideal for studyproducing models used in mechanical design, healthcare, architecture, education, entertainment and form, fit and function engineering studies. VisiJetwax print materials and special dissolvable support materials are used for direct casting applications such as custom jewelry manufacturing, dental crowns and bridge work and other casting and micro-castingpackaging applications. Our VisiJet materials family also includes durable materials that provide injection-molded like properties for high-end prototyping and demanding applications and high performance powders for full-color printing in ceramic-like material and plastics for design communication, architecture, medical and education applications.
PJP Print Materials
Our family of print materials for use in our PJP 3D printers includes polylatic acid (PLA), acrylonitrile butadiene styrene (ABS), polypropylene (PP), high density polyethylene (HDPE), low density polyethylene (LDPE), and unplasticised polyvinyl chloride (uPVC). These print materials are packaged in proprietary smart cartridges and offer a variety of properties, including tough polymer materials for car bumpers, tough and flexible polymers for face masks or containers, and chemical and solvent resistant materials for fuel tanks, snowboards and water pipes. PLA and ABS plastics are for use in our consumer 3D printers, providing multi-color, durable, real plastic parts.
Software Solutionsand Related Products
We also provide our customers withdigital design tools, including software, toolsscanners and haptic devices. We offer solutions for product design, mold and die design, 3D scan-to-print, reverse engineering, production machining and inspection and proprietary digitalinspection. These products are designed to enable a more seamless workflow software tools. We offer Geomagic software packages and design tools for reverse engineering, inspection and haptic design packages, enabling our customers to open scan data directly in the CAD parametric environment, design in Voxel CAD and sculpt. We also offer Cubify Invent and Cubify Design CAD software solutions.customers. We also offer proprietary software and drivers embedded within our printers.printers that provide part preparation, part placement, support placement, build platform management and print queue management.
3D ScannersOther Products
As part of our solutions for precision healthcare, we also offer 3D virtual reality simulators and simulator modules for medical applications. These 3D simulators offer clinicians a realistic hands-on experience to master critical skills, prepare for upcoming procedures and create patient specific simulations. We offer affordable 3Dalso provide digitizing scanners enabling seamless integration with our software solutionsfor medical and 3D printers for consumers and professionals. Geomagic Capture™ is designed for the professional user and is available in six configuration packages, each including a compact, ultra-precise, blue light LED scanner directly integrated with our Geomagic software. The Sense™ 3D scanner is the first 3D scanner designed for the consumer and optimized for 3D printing. It delivers precise, instant digital data for physical photography or 3D design. Our scanners are easy to use and intuitive for a fraction of the cost of others available in their classes today.mechanical applications.
Services
Warranty, Maintenance and Training Services
We provide a variety of customer services, and local application support and field support on a worldwide basis for all our SLA, SLS and DMS 3D printers. For our 3D printers and software, we provide these services and field support either directly or through a network of authorized resellers or other sources. We are continuing to expand our reseller channel for our line of consumer and professional 3D printers and software and to train our resellers to perform installation and maintenance services for our printers.
The services and field support that we provide includesproducts, including installation of new printers at customers’ sites, printer warranties, several maintenance agreement options and a wide variety ofagreements, periodic hardware upgrades and software updates and performance enhancement packages.updates. We also provide services to assist our customers and resellerspartners in developing new applications for our technologies, to facilitate the use of our technology for the customers’specific applications, to train customers on the use of newly acquiredour printers and to maintain our printers at customers’ sites.
We provide these services and field support either directly or through a network of reseller partners. We employ customer-support sales engineers to support our worldwide customer base, and we are continuing to strengthen and enhance our partner network. We distribute spare parts on a worldwide basis to our customers.
All of our 3D printers are sold with maintenance support that generally covers a warranty period ranging from 90 days to one year. We generally offer service contracts that enable our customers to continue maintenance coverage beyond the initial warranty period. These service contracts are offered with various levels of support and options and are priced accordingly. We employ customer-support sales engineers in North America, in several countries in Europe and in parts of the Asia-Pacific region to support our worldwide customer base. As a key element of warranty and service contract maintenance, ourOur service engineers provide regularly scheduled preventive maintenance visits to customer sites. Wesites, and we also provide training to our distributors and resellerspartners to enable them to perform these services.
We distribute spare parts on a worldwide basis to our customers, primarily from locations in the U.S. and Europe.
We also offer upgrade kits for certain of our printers that enable our existing customers to take advantage of new or enhanced printer capabilities; however,capabilities. In some cases, we have discontinued upgrade support and maintenance agreements for certain of our older legacy printers.
Quickparts ServicesOn-Demand Solutions
We provide an extensive suite of on-demand parts servicesmanufacturing through our Quickparts branded global network of fulfillment facilities. Our Quickparts service offersfacilities worldwide in the Americas, EMEA and APAC. We provide a broad range of prototyping, production and finishing capabilities for precision plastic and metal parts service capabilities produced fromand tooling with a wide range of 3D printing and traditional materials using a variety of additive and traditional manufacturing processes. Customers may procure
In addition to the sales of parts, we, and our sales partners, utilize our on-demand parts operation as a complete range of precision plasticsales and metal parts services using a variety of finishing, molding and casting capabilities. In addition,lead generation tool. Third party preferred service providers and leading service bureaus can also use our on-demand custom parts service as their comprehensive order-fulfillment center. We also provide on-demand professional 3D scanning, printing and parts production related to the entertainment industry through our Gentle Giant brand™.
We are continuing to expand our Quickparts service by bringing together a wide range of production and additive grade print materials and the latest additive and traditional manufacturing systems to deliver to our customers the broadest available range of precision plastic and metal parts and assemblies. Since October 2009, we have acquired sixteen service providers in the U.S., Europe and Asia-Pacific, enhancing our North American and European presence and expanding our local presence in Australia and China.6
Consumer Services
In addition to our consumer 3D printers, we offer Cubify, our online hosting and publishing platform providing simple-to-use content creation tools, content downloads, cloud printing services and licensing arrangements and hosting for third parties. We are continuing to expand our Cubify offerings, including expanded content creation tools, content files and partnerships to offer personalized and customized jewelry, figurines, collectibles, toys, housewares, edibles and other items.
Software Services
In addition to our software license products, we offer customers post sale software maintenance, which includes updates and software support for our software products. Our software is sold with maintenance service that generally covers a period of one year. We offer multi-year maintenance contracts that enable our customers to continue maintenance coverage beyond the initial one year period. These software service contracts typically include free software updates and various levels of technical support.
Healthcare Services
Through our precision healthcare services, we provide surgical planning, modeling, prototyping and manufacturing services, including printing and finishing of medical and dental devices, models and tools, as well as modeling and design reverse engineering and inspection software packages.services, including VSP™. We also provide service on our surgical simulators that are sold under our SimbionixTM brand.
Global Operations
We operate in North America, Europethe Americas, EMEA and the Asia-PacificAPAC regions, and distributemarket our products and services in those areas as well as to other parts of the world. Revenue in countries outside the U.S. accounted for 44.5%, 44.5% and 48.9% of consolidated revenue in the years ended December 31, 2013, 2012 and 2011, respectively.
In maintaining foreign operations outside the U.S., we expose our business to risks inherent in such operations, including currency fluctuations. Information on foreign exchange risk appears in Part I, Item 1A, “Risk Factors”, Part II, Item 7A, “Quantitative and Qualitative Disclosures about Market Risk” and Item 8, “Financial Statements and Supplementary Data,” of this Form 10‑K, which information is incorporated herein by reference.10-K.
Financial information about geographic areas, including revenue, long-lived assets and cash balances, appears in Note 21 to the Consolidated Financial Statements and in Part I, Item 1A, “Risk Factors”, Part II, Item 7A, “Quantitative and Qualitative Disclosures about Market Risk” and Part II, Item 8, “Financial Statements and Supplementary Data,” of this Form 10-K which information is incorporated herein by reference.(“Consolidated Financial Statements”).
Marketing and Customers
Our sales and marketing strategy focuses on an integrated approach that is directed at providing 3D content-to-printcomprehensive solutions and servicesdesigned to meet customer needs. We use a widefull range of customer needs. This integrated approach includes the salesmarketing and marketing of our parts service, either as an adjunctlead generation tools to a customer’s in-house use of additive technologies or to the much broader audience of users who do not have 3D printers.
Our sales organization is responsible for the sale of all ofpromote our products and services on a worldwide basisbasis. Our marketing department supports our global sales organization and distribution channels by providing marketing materials, potential sales leads and co-marketing funds.
We sell our solutions globally through a direct sales force, partner channel and in certain geographies, appointed distributors. Our sales organization includes channel managers, direct sales people and application engineers throughout the Americas, EMEA and APAC, who are responsible for the sale of products and services and for the management and coordination of our growing network of authorized resellers. With the exception ofchannel partners.
Additionally, our online channels and direct Quickparts salespersons, we sell our products primarily through resellers who are supported by our own experienced channel sales managers consisting of salespersons who work throughout North America, Europe and Asia-Pacific. Our application engineers provide professional services through pre-sales and post-sales support, and assist existing customers so that they can take advantage ofwith leveraging our latest print materialssolutions and production techniques to improve part quality and machine productivity. This group also leverages our customer contacts to help identify new application opportunities that utilizeapplications and sales opportunities. Our on-demand manufacturing service also expands our proprietary processescustomer relationships and access to our Quickparts printing service. As of December 31, 2013, our worldwide sales, application and service staff consisted of 234 employees.
In certain areas of the world where we do not operate directly, we have appointed sales agents, resellers and distributors who are authorized to sell our production printers and the print materials used in them on our behalf. Certain of those agents, resellers and distributors also provide services to customers in those geographic areas.generates leads for future sales.
Our consumer and professional printers and related print materials, services, 3D scanners and software solutions are sold worldwide directly and through a network of authorized distributors and resellers who are managed and directed by a dedicated team of channel sales managers.
As a complement to our printers and print materials sales, we maintain our on demand parts service, a global network of parts printing service locations branded as Quickparts. Quickparts is designed to provide our customers a single source for all their design-to-manufacturing needs, through which we offer access to a wide range of additive and traditional manufacturing technologies, print materials from plastics to metals and our project management and finishing capabilities through a powerful e-commerce platform with on-line quoting, plug-ins and secure ordering.
Our consumer oriented 3D printers, design productivity tools, downloadable content, and curation services are available through Cubify and through hundreds of retail stores and traditional retail distributors.
Our commercial customers include major companies and small and midsize businesses in a broad range of industries, including manufacturers ofhealthcare, automotive, aerospace, computer, electronic,government, defense, technology, electronics, education, consumer energygoods and healthcare products. Purchasers of our printers include original equipment manufacturers (OEM’s), government agencies, universities and other educational institutions, independent service bureaus and individual consumers.energy. No single customer accounted for more than 10 percent of our consolidated revenue for the years ended December 31, 2013, 20122016, 2015 or 2011.2014.
Production and Supplies
We assemble our Cube X consumer 3D printers and our ProJet 1000 through 7000 professional 3D printers and other equipment atAt our Rock Hill, South Carolina facilities. Our Vidar digitizerslocation, we assemble MJP, CJP and Cube consumercertain models of our SLA 3D printers, are assembled inas well as other equipment related to these printers. We assemble certain models of our Herndon, Virginia facility. Our ProJet x60 series of professionalDMP printers are assembled at our Andover, Massachusetts location. Our direct metals printers are produced in our Riom, France facility, as part of the acquisition of Phenix Systems.facility. We produce our Simbionix branded 3D simulators in Airport City, Israel.
We outsource certain productionSLA, SLS and DMP printer assembly and refurbishment activities to selected design, engineering and engineeringmanufacturing companies and suppliers in the United States.States and Belgium. These suppliers also carry out quality control procedures on our printers prior to their shipment to customers. As part of these activities, these suppliers have responsibility for procuring the components and sub-assemblies that are used in our printers.either from us or third party suppliers. We purchase finished printers from these suppliers pursuant to forecasts and customer orders that we supply to them. While the outsourced suppliers of our printers have responsibility for the supply chain and inventory of the components for the printers they assemble, the components, parts and sub-assemblies that are used in our printers are generally available from several potential suppliers.
We produce print materials at our facilities in Andover, Massachusetts, Norton, Ohio, Marly, Switzerland and Rock Hill, South Carolina.Carolina; Barberton, Ohio; Marly and Grüningen, Switzerland. We also have arrangements with third parties who blend certain print materials according to our specifications certain print materials that we sell under our own brand names. As discussed above,names, and we also purchase certain print materials from third parties for resale to our customers.
Our equipment assembly and print materials blending activities, on-demand parts services and certain research and development activities are subject to compliance with applicable federal, state and local provisions regulating the storage, use and discharge of materials into the environment. We believe that we are in compliance, in all material respects, with such regulations as currently in effect and that continued compliance with them will not have a material adverse effect on our capital expenditures, results of operations or consolidated financial position.
Research and Development
The 3D printing industry is experiencingcontinues to experience rapid technological change.change and developments in hardware, software and materials. Consequently, we have ongoing research and development programs to develop new printers and print materialsproducts and to enhance our product linesportfolio of products and services, as well as to improve and expand the capabilities of our printers, print materials and software. This includes all significant technology platform developments for all our print engines, print materials, software products and perceptual devices which includes our scanners and haptic tools.solutions. Our development efforts are often augmented by development arrangements with research institutions, customers, suppliers, of material and hardware and the assembly and design firms, that we have engaged to assemble our printers. From time to time, we also engage third party engineering companies and specialty print materials companiescompanies.
Research and development expenses were $88.4 million, $92.8 million and $75.4 million in specific development projects.2016, 2015 and 2014, respectively.
In addition to our internally developed technology platforms, we have acquired products orand technologies developed by others by acquiring business entities that held ownership rights to thesuch products and technologies. In other instances, we have licensed or purchased the intellectual property rights of technologies developed by third parties through licensing agreements that may obligate us to pay a license fee or royalty, typically based upon a dollar amount per unit or a percentage of the revenue generated by such products. As noted below, the amount of such royalties was not material to our results of operations or consolidated financial position for the three-year period ended December 31, 2013.
Research and development expenses were $43.5 million, $23.2 million and $14.3 million in 2013, 2012 and 2011, respectively.
We capitalized software development costs of $0.3 million from acquisitions in 2013. We did not capitalize any software development costs in 2012. We capitalized software development costs of $7.9 million from acquisitions in 2011. See Note 6 to the Consolidated Financial Statements.
Intellectual Property
We regard our technology platforms and materials as proprietary and seek to protect them through copyrights, patents, trademarks and trade secrets. At December 31, 20132016 and 2012,2015, we held 9731,171 and 8521,114 patents worldwide, respectively. At December 31, 2013,2016 and 2015, we also had 204249 and 264 pending patent applications worldwide, including applications covering inventions contained in our recently introduced printers.respectively. The principal issued patents covering aspects of our various technologies will expire at varying times through the year 2027.
WeIn addition, we are also a party to various licenses that have had the effect of broadening the range of the patents, patent applications and other intellectual property available to us.
We have also entered into licensing or cross-licensing arrangements with various companies in the United States and in other countries that enable those companies to utilize our technologies in their products or that enable us to use their technologies in our products. Under certain of these licenses, we are entitled to receive, or we are obligated to pay, royalties for the sale of licensed products in the U.S. or in other countries. The amount of such royalties was not material to our results of operations or consolidated financial position for the three-year period ended December 31, 2013.2016.
We believe that, while our patents and licenses provide us with a competitive advantage, our success also depends primarily on our marketing, business development, and applications know-how and on our ongoing research and development efforts. Accordingly, we believe the expiration of any of the patents, patent applications or licenses discussed above would not be material to our business or financial position.
Competition
We face competition from the development of new technologies or techniques not encompassed by the patents that we own or license from the conventional machining, plastic molding and metal casting techniques discussed above and from improvements to existing technologies, such as Computer Numerical Control (“CNC”) machining and rotational molding.
Competition for most of our 3D printers is based primarily on process know-how, product application know-how and the ability to provide a full range of products and services to meet customer needs. Competition is also based upon innovations in 3D printing, rapid prototyping and rapid manufacturing printers and print materials. Accordingly, our ongoing research and development programs are intended to enable us to maintain technological leadership. Certain of the companies producing competing products or providing competing services are well established and may have greater financial resources.
Our principal competitors are companies that manufacture machines that make, or use machines to make, models, prototypes, molds and small-volume to medium-volume manufacturing parts. These competitors include suppliers of CNC, suppliers of plastics molding equipment, including injection-molding equipment, suppliers of traditional machining, milling and grinding equipment, and businesses that use such equipment to produce models, prototypes, molds and small-volume to medium-volume manufacturing parts. These conventional machining, plastic molding and metal casting techniques continue to be the most common methods by which plastic and metal parts, models, functional prototypes and metal tool inserts are manufactured.technologies.
Our competitors also include other suppliers of 3D printers printand materials, and software, including CAD design and scanningproduction software, tools and scanners, as well as suppliers of forming manufacturing solutions such as vacuum casting equipment. A number of companies currently sell print materials that compete with those we sell,equipment, and there are a wide number of suppliers of maintenance services for the equipment that we sell.healthcare simulators. Numerous suppliers of these products operate both internationally and regionally, and many of them have well-recognized product lines that compete with us in a wide range of our product applications. Our competitors are also companies that manufacture or utilize machines that are used to make models, prototypes, molds and parts. These competitors include suppliers of CNC machines, plastics molding equipment, including injection-molding equipment, traditional machining, milling and grinding equipment, and businesses and service bureaus that use such equipment to produce models, prototypes, and molds and to manufacture parts on demand. Conventional machining, plastic molding and metal casting techniques continue to be the most common methods by which plastic and metal parts and tool inserts are manufactured today.
Competition in the on-demand parts printing service business is highly fragmented, withfor most of our 3D printers is based primarily on technology capabilities, process know-how, product application know-how and the ability to provide a full range of products and services suppliers operating on a local level.to meet customer needs. Accordingly, our ongoing research and development programs are intended to enable us to maintain technological leadership. Certain of the companies providing competing products or services, and those currently developing 3D printing products and services, are well established and may have greater financial resources than we have.
We believe that our future success depends on our ability to provide high quality solutions, enhance our existing products and services,portfolio, introduce new products and services on a timely and cost-effective basis, meet changing customer needs, extend our core technologies to new applications and anticipate and respond to emerging standards, business models, service delivery methods and other technological changes.
Employees
At December 31, 2013,2016 and 2015, we had 1,3882,445 and 2,492 full-time employees.employees, respectively. Although some of our employees outside the U.S. are subject to local statutory employment and labor arrangements, none of our U.S. employees are covered by collective bargaining agreements. We have not experienced any material work stoppages and believe that our relations with our employees are satisfactory.
Available Information
Our website address is www.3DSystems.com. The information contained on our website is neither a part of, nor incorporated by reference into, this Form 10-K. We make available free of charge through our website our Annual Reports on Form 10‑K, Quarterly Reports on Form 10‑Q, Current Reports on Form 8‑K, amendments to those reports and other documents that we file with the Securities and Exchange Commission (“SEC”), as soon as reasonably practicable after we electronically file them with, or furnish them to, the SEC. In addition, theThe public may read and copy materials we file with the SEC at the SEC’s public reference room located at 100 F Street, N.E., Washington, D.C. 20549. Information on the operation of the public reference room can be obtained by calling the SEC at 1-800-SEC-0330. In addition, the SEC maintains a website at www.sec.gov that contains reports, proxy and information statements and other information regarding issuers that file electronically with the SEC, from which investors can electronically access our SEC filings.
SeveralMany of our corporate governance materials, including our Code of Conduct, Code of Ethics for Senior Financial Executives and Directors, Corporate Governance Guidelines, the current charters of each of the standing committees of the Board of Directors and our corporate charter documents and by-laws are available on our website.
Executive and Other Officers
The information appearing in the table below sets forth the current position or positions held by each of our executive officers and his or her age as of February 1, 2014.28, 2017. All of our executive officers serve at the pleasure of the Board of Directors. There are no family relationships among any of our executive officers or directors.
| |
Name and Current Position | Age as of February 1, 201428, 2017 |
Abraham N. ReichentalVyomesh I. Joshi
| |
President and Chief Executive Officer | 5762
|
Charles W. Hull | |
Executive Vice President and Chief Technology Officer | 7477
|
Damon J. GregoireAndrew M. Johnson
| |
SeniorExecutive Vice President, Chief Legal Officer and Chief Financial OfficerSecretary
| 4542
|
Kevin P. McAlea | |
SeniorExecutive Vice President and Chief ImpactOperating Officer, Healthcare
| 5558
|
Andrew M. JohnsonJohn N. McMullen
| |
Vice President, General Counsel and Secretary
| 39
|
Cathy L. Lewis
| |
Executive Vice President, Chief MarketingFinancial Officer | 6258
|
We have employed eachMr. Joshi was appointed the Company’s President and Chief Executive Officer, effective April 1, 2016. Prior to joining the Company, Mr. Joshi worked at Hewlett-Packard Company (“HP”) from 1980 until his retirement on March 21, 2012. From 2001 to 2012, he was Executive Vice President of HP’s Imaging and Printing Group, following two decades of research, engineering and management in HP’s imaging and printing systems. In addition to his service on our Board of Directors, Mr. Joshi currently serves on the Board of Directors of Harris Corporation and formerly served on the Board of Directors at Yahoo! Inc. and Wipro Ltd.
Mr. Hull is a founder of the individualsCompany and has served on our Board of Directors since 1993. He has served as Chief Technology Officer since 1997 and as Executive Vice President since 2000. He has also previously served in various other executive capacities at the foregoing table other than Ms. Lewis for more than five years.Company since 1986, including Chief Executive Officer, Vice Chairman of the Board of Directors and President and Chief Operating Officer.
Ms. Lewis joined usMr. Johnson has served as Executive Vice President and Chief Legal Officer since November 2014. He served as Interim President and Chief Executive Officer, Chief Legal Officer and Secretary from October 2015 to April 2016 and as Vice President, Global Marketing on October 15, 2009General Counsel and was elected an officer ofSecretary from April 2012 to November 2014. Previously, he served as Assistant General Counsel and Assistant Secretary.
Dr. McAlea currently serves as Executive Vice President, General Manager, Metals & Healthcare. Dr. McAlea joined the companyCompany in May 2010.2003 and has served in various executive positions since that time.
Mr. McMullen joined 3D Systems as Executive Vice President, Chief Financial Officer in July 2016. From 2006 until 2009, she2014 to 2016, he was Chief ExecutiveFinancial Officer of Desktop Factory, Inc.,Eastman Kodak Company, a venture financed technology start-upcompany focused on the developmentimaging. Before that, Mr. McMullen had a 32 year career at HP and delivery of a low cost 3D printer. For more than three years prior to 2006, Ms. Lewis servedits acquired companies, including positions as Senior Vice President Marketingof Finance and Corporate Treasurer of HP, Chief Financial Officer of HP’s Imaging and Printing Group and Vice President of Finance and Strategy for IKON Office Solutions, a global office copying/printing/imagingCompaq’s Worldwide Sales and related services company.Services Group.
Item 1A. Risk Factors
Forward-Looking Statements
Certain statements made in this Form 10-K that are not statements of historical or current facts are forward-looking statements within the meaning of the Private Securities Litigation Reform Act of 1995. Forward-looking statements include the cautionary statements and risk factors set forth below as well as other statements made in this Form 10-K that may involve known and unknown risks, uncertainties and other factors that may cause our actual results, performance or achievements to be materially different from historical results or from any future results or projections expressed or implied by such forward-looking statements.
In addition to the statements set forth below that explicitly describe risks and uncertainties to which our business and our financial condition and results of operations are subject, readers are urged to consider statements in future or conditional tenses or that include terms such as “believes,” “belief,” “expects,” “intends,” “anticipates” or “plans” that appear in this Form 10-K to be uncertain and forward-looking. Forward-looking statements may include comments as to our beliefs, expectations and projections as to future events and trends affecting our business. Forward-looking statements are based upon our beliefs, assumptions and current expectations concerning future events and trends, using information currently available to us, and are necessarily subject to uncertainties, many of which are outside our control. We assume no obligation, and do not intend, to update these forward-looking statements, except as required by applicable law. The factors stated under the heading “Cautionary Statements and Risk Factors” set forth below, as well as other factors, could cause actual results to differ materially from those reflected or predicted in forward-looking statements.
If one or more of these or other risks or uncertainties materialize, or if our underlying assumptions prove to be incorrect, actual results may vary materially from those reflected in or suggested by forward-looking statements. Any forward-looking statement that you read in this Form 10-K reflects our current views with respect to future events and is subject to these and other risks, uncertainties and assumptions relating to our operations, results of operations, financial condition, growth strategy and liquidity. All subsequent written and oral forward-looking statements attributable to us or to individuals acting on our behalf are expressly qualified in their entirety by this discussion. You should specifically consider the factors identified in this Form 10-K, which would cause actual results to differ from those referred to in forward-looking statements.
Cautionary Statements and Risk Factors
The risks and uncertainties described below are not the only risks and uncertainties that we face. Additional risks and uncertainties not currently known to us or that we currently deem not to be material also may impair our business operations, results of operations and financial condition. If any of the risks described below or if any other risks and uncertainties not currently known to us or that we currently deem not to be material actually occurs, our business, results of operations and financial condition could be materially adversely affected. In that event, the trading price of our common stock could decline, and you could lose all or part of your investment in our common stock.
The risks discussed belowWe face significant competition in many aspects of our business, which could cause our revenue and gross profit margins to decline. Competition could also include forward‑looking statementscause us to reduce sales prices or to incur additional marketing or production costs, which could result in decreased revenue, increased costs and reduced margins.
We compete for customers with a wide variety of producers of equipment and software for models, prototypes, other three-dimensional objects and end-use parts as well as producers of print materials and services for this equipment. Some of our existing and potential competitors are researching, designing, developing and marketing other types of competitive equipment and software, print materials and services. Certain of these competitors may have financial, marketing, manufacturing, distribution and other resources substantially greater than ours.
We also expect that future competition may arise from the development of allied or related techniques for equipment and materials that are not encompassed by our patents, from the issuance of patents to other companies that may inhibit our ability to develop certain products and from improvements to existing print materials and equipment technologies.
Some of our patents have recently expired and others will expire in coming years. Upon expiration of those patents, our competitors may introduce products using the technology previously protected by the expired patents and those products may have lower prices than those of our products. To compete, we may need to reduce our prices for those products, which could adversely affect our revenues, margins and profitability. Additionally, the expiration of our patents could reduce barriers to entry into additive manufacturing, which could result in the reduction of our sales and earnings potential. If competitors using technology previously protected by our expired patents were to introduce products of inferior quality, our potential customers may view the technology negatively, which would have an adverse effect on our image and reputation and on our ability to compete with systems using other additive fabrication technologies.
We intend to follow a strategy of continuing product development to enhance our position to the extent practicable. We cannot assure you that we will be able to maintain our current position in the field or continue to compete successfully against current and future sources of competition. If we do not keep pace with technological change and introduce new products, we may lose revenue and demand for our products. We also incur significant costs associated with the investment in our product development in furtherance of our strategy that may not result in increased revenue or demand for our products and which could negatively affect our operating results.
We believe that our future success depends on our ability to deliver products that meet changing technology and customer needs.
Our business may be affected by rapid technological change, changes in user and customer requirements and preferences, frequent new product and service introductions embodying new technologies and the emergence of new standards and practices, any of which could render our existing products and proprietary technology obsolete. Accordingly, our ongoing research and development programs are intended to provideenable us to maintain technological leadership. We believe that to remain competitive we must continually enhance and improve the functionality and features of our current expectations with regard to those risks. There canproducts, services and technologies. However, there is a risk that we may not be no assurance that our current expectations will be met, and our actual results may differ substantially from the expectations expressed in these forward‑looking statements.
Global economic, political and social conditions may harm our ability to do business, increase our costs and negatively affect our stock price.
We are subject to global economic, political and social conditions that may cause customers to delay or reduce technology purchases due to economic downturns, volatility in fuel and other energy costs, difficulties in the financial services sector and credit markets, geopolitical uncertainties and other macroeconomic factors affecting spending behavior. We face risks that may arise from financial difficulties experienced by our suppliers, resellers or customers, including:able to:
| · | | The risk that customersDevelop or resellers to whom we sellobtain leading technologies useful in our products and services may face financial difficulties or may become insolvent, which could lead to our inability to obtain payment of accounts receivable that those customers or resellers may owe;business;
|
| · | | The risk that key suppliers of raw materials, finished products or components used in the products that we sell may face financial difficulties or may become insolvent, which could lead to disruption in the supply of printers, print materials or spare parts toEnhance our customers; andexisting products;
|
| · | | The inabilityDevelop new products, services and technologies that address the increasingly sophisticated and varied needs of prospective customers, including resellers, suppliersparticularly in the area of printer speeds and contract manufacturersprint materials functionality;
|
| · | | Respond to obtain credit financing to finance purchases of our productstechnological advances and raw materials used to build those products. emerging industry standards and practices on a cost-effective and timely basis; or |
| · | | Recruit or retain key technology employees. |
We may incur substantial costs enforcing or acquiring intellectual property rightsIf we are unable to meet changing technology and defending against third party claims as a resultcustomer needs, our competitive position, revenue, results of litigation or other proceedings.
In connection with the enforcement of our own intellectual property rights, the acquisition of third-party intellectual property rights or disputes related to the validity or alleged infringement of third party intellectual property rights, including patent rights, we have been, are currentlyoperations and may in the futurefinancial condition could be subject to claims, negotiations or complex, protracted litigation. Intellectual property disputes and litigation may be costly and can be disruptive to our business operations by diverting attention and energies of management and key technical personnel, and by increasing our costs of doing business. Although we have successfully defended or resolved past litigation and disputes, we may not prevail in any ongoing or future litigation and disputes.
Third-party intellectual property claims asserted against us could subject us to significant liabilities, require us to enter into royalty and licensing arrangements on unfavorable terms, prevent us from assembling or licensing certain of our products, subject us to injunctions restricting our sale of products, cause severe disruptions to our operations or the marketplaces in which we compete, or require us to satisfy indemnification commitments with our customers including contractual provisions under various license arrangements. In addition we may incur significant costs in acquiring the necessary third-party intellectual property rights for use in our products. Any of these could seriously harm our business.
We may not be able to protect our intellectual property rights, including our digital content, from third-party infringers or unauthorized copying, use or disclosure.
Although we defend our intellectual property rights and endeavor to combat unlicensed copying and use of our digital content and intellectual property rights through a variety of techniques, preventing unauthorized use or infringement of our rights is inherently difficult. If our intellectual property becomes subject to piracy attacks, they may harm our business.
Additionally, we endeavor to protect the secrecy of our digital content, confidential information and trade secrets. If unauthorized disclosure of our trade secrets occurs, we could potentially lose trade secret protection. The loss of trade secret protection could make it easier for third parties to compete with our products by copying previously confidential features, which could adversely affect our revenue and operating margins. We also seek to protect our confidential information and trade secrets through the use of non-disclosure agreements. However there is a risk that our confidential information and trade secrets may be disclosed or published without our authorization, and in these situations it may be difficult and/or costly for us to enforce our rights.affected.
We have made, and expect to continue tomay make in the future, strategic acquisitions that may involve significant risks and uncertainties. We may not realize the anticipated benefits of past or future acquisitions and integration of these acquisitions may disrupt our business and divert management.
We completed eleven acquisitions in 2013. We also intendFrom time to continue totime, we evaluate acquisition opportunities in the future in an effort to expandcandidates that fit our business and enhance stockholder value.objectives. For example, in January 2017, we acquired Vertex-Global Holding B.V., a provider of dental materials. Acquisitions involve certain risks and uncertainties, including:including, among others, the following:
| · | | Difficulty in integrating newly acquired businesses and operations in an efficient and cost-effective manner, which may also impact our ability to realize the potential benefits associated with the acquisition; |
| · | | The risk that significant unanticipated costs or other problems associated with integration may be encountered; |
| · | | The challenges in achieving strategic objectives, cost savings and other anticipated benefits; |
| · | | The risk that our marketplaces do not evolve as anticipated and that the technologies acquired do not prove to be those needed to be successful in the marketplaces that we serve; |
| · | | The risk that we assume significant liabilities that exceed the limitations of any applicable indemnification provisions or the financial resources of any indemnifying party; |
| · | | The inability to maintain a relationship with key customers, vendors and other business partners of the acquired businesses; |
| · | | The difficulty in maintaining controls, procedures and policies during the transition and integration; |
| · | | The potential loss of key employees of the acquired businesses; |
| · | | The risk of diverting management attention from our existing operations; |
| · | | Difficulties in coordinating geographically disparate organizations and corporate cultures and integrating management personnel with different business backgrounds; |
| · | | The potential failure of the due diligence process to identify significant problems, liabilities or other challenges of an acquired company or technology; |
| · | | The risk that we incur significant costs associated with such acquisition activity that may negatively impact our operating results before the benefits of such acquisitions are realized, if at all; |
| · | | The risk of incurring significant goodwill and other intangible asset impairment charges; |
| · | | The risk of incurring significant exit costs if products or services are unsuccessful; |
| · | | The entry into marketplaces where we have no or limited direct prior experience and where competitors have stronger marketplace positions; |
| · | | The exposure to litigation or other claims in connection with our assuming claims or litigation risks from terminated employees, customers, former shareholders or other third parties; and |
| · | | The risk that historical financial information may not be representative or indicative of our results as a combined company. |
Historically, we have grown organically and from acquisitions, and we intend to continue to grow. Our infrastructure will require, among other things, continued development of our financial and management controls and management information systems, management of our sales channel, continued capital expenditures, the ability to attract and retain qualified management personnel and the training of new personnel. We cannot be sure that our infrastructure, systems, procedures, business processes and managerial controls will be adequate to support the growth in our operations. Any delays in, or problems associated with, implementing, or transitioning to, new or enhanced systems, procedures, or controls to accommodate and support the requirements of our business and operations and to effectively and efficiently integrate acquired operations may adversely affect our ability to meet customer requirements, manage our product inventory, and record and report financial and management information on a timely and accurate basis. These potential negative effects could prevent us from realizing the benefits of an acquisition transaction or other growth opportunity. In that event, our competitive position, revenues, results of operations and financial condition could be adversely affected.
Our balance sheet contains several categories of intangible assets that we could be required to write off or write down in the future in the event of the impairment of certain of those assets arising from any deterioration in our future performance or other circumstances. Such write-offs or write-downs could adversely impact our earnings and our ability to obtain financing in the future.
At December 31, 2016, we had $181.2 million in goodwill capitalized on our balance sheet and $121.5 million of other intangible assets, net capitalized on our balance sheet, which represented 35.7% of our total assets.
A majority of our acquisitions have resulted in our recording additional goodwill on our consolidated balance sheet. This goodwill typically arose because the purchase price for these businesses reflected a number of factors including the future earnings and cash flow potential of these businesses, the multiples to earnings, cash flow and other factors, such as prices at which similar businesses have been purchased by other acquirers, the competitive nature of the process by which we acquired the business, and the complementary strategic fit and resulting synergies these businesses bring to existing operations.
As a result of our annual impairment testing in 2015, we recorded goodwill impairment charges of $443.7 million and other intangible assets impairment charges of $93.5 million in the fourth quarter of 2015. The impairment charges were non-cash in nature and did not impact our cash position or cash flows, but such charges, and possible additional charges in the future could adversely affect our results of operations and stockholders’ equity and could adversely affect the trading price of our common stock. We will monitor our reporting units in an effort to determine whether events and circumstances warrant further interim impairment testing. We could be required to write off or write down additional amounts in the future in the event of deterioration in our future performance, sustained slower growth or other circumstances.
We may incur substantial costs enforcing or acquiring intellectual property rights and defending against third-party claims as a result of litigation or other proceedings.
In connection with the enforcement of our own intellectual property rights, the acquisition of third-party intellectual property rights or disputes related to the validity or alleged infringement of third party intellectual property rights, including patent rights, we have been, and may in the future be, subject to claims, negotiations or complex, protracted litigation. Intellectual property disputes and litigation may be costly and can be disruptive to our business operations by diverting attention and energies of management and key technical personnel, and by increasing our costs of doing business. Although we have successfully defended or resolved past litigation and disputes, we may not prevail in any ongoing or future litigation and disputes, which could adversely affect our results of operations and financial condition.
Third-party intellectual property claims asserted against us could subject us to significant liabilities, require us to enter into royalty and licensing arrangements on unfavorable terms, prevent us from assembling or licensing certain of our products, subject us to injunctions restricting our sale of products, cause severe disruptions to our operations or the marketplaces in which we compete or require us to satisfy indemnification commitments with our customers including contractual provisions under various license arrangements. In addition, we may incur significant costs in acquiring the necessary third-party intellectual property rights for use in our products. Any of these could seriously harm our business.
We may not be able to protect our intellectual property rights and confidential information, including our digital content, from third-party infringers or unauthorized copying, use or disclosure.
Although we defend our intellectual property rights and endeavor to combat unlicensed copying and use of our digital content and intellectual property rights through a variety of techniques, preventing unauthorized use or infringement of our rights (“piracy attacks”) is inherently difficult. If our intellectual property becomes subject to piracy attacks, they may harm our business.
Additionally, we endeavor to protect the secrecy of our digital content, confidential information and trade secrets. If unauthorized disclosure of our trade secrets occurs, we could potentially lose trade secret protection. The loss of trade secret protection could make it easier for third parties to compete with our products by copying previously confidential features, which could adversely affect our business, results of operations, revenue and operating margins. We also seek to protect our confidential information and trade secrets through the use of non-disclosure agreements. However, there is a risk that our confidential information and trade secrets may be disclosed or published without our authorization, and in these situations it may be difficult and/or costly for us to enforce our rights.
Our business could be adversely impacted in the event of a failure of our information technology infrastructure or adversely impacted by a successful cyber-attack.
We have experienced cyber security threats, threats to our information technology infrastructure and unauthorized attempts to gain access to our sensitive information. Prior cyber-attacks directed at us have not had a material impact on our business or financial results; however, this may not continue to be the case in the future. Cyber security assessment analyses undertaken by us have identified and prioritized steps to enhance our cyber security safeguards. We are in the process of implementing these recommendations to enhance our threat detection and mitigation processes and procedures. Despite the implementation of these new safeguards, there can be no assurance that we will adequately protect our information or that we will not experience any future successful attacks. The threats we face vary from attacks common to most industries to more advanced and persistent, highly organized adversaries who target us because of the products and services we provide. If we are unable to protect sensitive information, our customers or governmental authorities could question the adequacy of our threat mitigation and detection processes and procedures. Due to the evolving nature of these security threats, however, the impact of any future incident cannot be predicted.
We may be required to expend significant additional resources to modify our cyber security protective measures, to investigate and remediate vulnerabilities or other exposures or to make required notifications, and we may be subject to litigation and financial losses. These costs related to cyber or other security threats or disruptions may not be fully insured or indemnified by other means. Occurrence of any of these events could adversely affect our internal operations, the services we provide to our customers, our financial results or our reputation; or such events could result in the loss of competitive advantages derived from our research and development efforts or other intellectual property or early obsolescence of our products and services.
If we cease to generate net cash flow from operations and if we are unable to raise additional capital, our financial condition could be adversely affected and we may not be able to execute our growth strategy.
We cannot assure you that we will continue to generate cash from operations or other potential sources to fund future working capital needs and meet capital expenditure requirements.
If we are unable to generate such cash flow, we may be required to adopt one or more alternatives, such as selling assets, restructuring or incurring additional debt or obtaining additional equity capital on terms that may be onerous or highly dilutive. Our ability to obtain additional capital or refinance ourany indebtedness will depend on, among other things, the capital markets, our financial condition at such time and the terms and conditions of any such financing or indebtedness. We may not be able to engage in any of these activities or engage in these activities on desirable terms, which could result in a default on our debt obligations.
During 2013 we carried out one capital markets transaction and received $272.1 million of net proceeds. From time-to-time we may seek access to additional external sources of capital to fund working capital needs, capital expenditures, acquisitions and for other general corporate purposes. However, we cannot assure you that capital would be available from external sources such as bank credit facilities, debt or equity financings or other potential sources to fund any of those future needs.
If our ability to generate cash flow from operations and our existing cash becomes inadequate to meet our needs, our options for addressing such capital constraints include, but are not limited to, (i) obtaining a revolving credit facility from bank lenders, (ii) accessing the public capital markets, or (iii) delaying certain of our existing development projects. If it became necessary to obtain additional debt financing it is likely that such alternatives in the current market environment would be on less favorable terms than we have historically obtained, which could have a material adverse impact on our consolidated financial position, results of operations or cash flows.
The lack of additional capital resulting from any inability to generate cash flow from operations or to raise equity or debt financing could force us to substantially curtail or cease operations and would, therefore, have a materialan adverse effect on our business and financial condition. Furthermore, we cannot assure you that any necessary funds, if available, would be available on attractive terms or that they would not have a significantly dilutive effect on our existing stockholders. If our financial condition worsens and we become unable to attract additional equity or debt financing or enter into other strategic transactions, we could become insolvent or be forced to declare bankruptcy, and we would not be able to execute our growth strategy.
Global economic, political and social conditions and financial markets may harm our ability to do business, adversely affect our sales, costs, results of operations and cash flow.
We are subject to global economic, political and social conditions that may cause customers to delay or reduce technology purchases due to economic downturns, volatility in fuel and other energy costs, difficulties in the financial services sector and credit markets, geopolitical uncertainties and other macroeconomic factors affecting spending behavior. We face risks that may arise from financial difficulties experienced by our suppliers, resellers or customers, including, among others, the following:
| · | | Customers or partners to whom we sell our products and services may face financial difficulties or may become insolvent, which could lead to our inability to obtain payment of accounts receivable that those customers may owe; |
| · | | Customers and potential customers may experience deterioration of their businesses, which may result in the delay or cancellation of plans to purchase our products; |
| · | | Key suppliers of raw materials, finished products or components used in the products that we sell may face financial difficulties or may become insolvent, which could lead to disruption in the supply of printers, print materials or spare parts to our customers; and |
| · | | The inability of customers, including resellers, suppliers and contract manufacturers, to obtain credit financing to finance purchases of our products and raw materials used to build those products. |
Our uneven sales cycle makes planning and inventory management difficult and future financial results less predictable.
Our quarterly sales often have reflected a pattern in which a disproportionate percentage of each quarter’s total sales occurs towards the end of the quarter. This uneven sales pattern makes predicting net revenue, earnings, cash flow from operations and working capital for each financial period difficult, increases the risk of unanticipated variations in our quarterly results and financial condition and places pressure on our inventory management and logistics systems. If predicted demand is substantially greater than orders, there may be excess inventory. Alternatively, if orders substantially exceed predicted demand, we may not be able to fulfill all of the orders received in each quarter and such orders may be cancelled. Depending on when they occur in a quarter, developments such as a systems failure, component pricing movements, component shortages or global logistics disruptions could adversely impact our inventory levels and results of operations in a manner that is disproportionate to the number of days in the quarter affected.
The variety of products that we sell could cause significant quarterly fluctuations in our gross profit margins, and those fluctuations in margins could cause fluctuations in operating income or loss and net income or loss.
We continuously work to expand and improve our product offerings, including our printers, printproducts, materials and services offerings, the number of geographic areas in which we operate and the distribution channels we use to reach various target product applications and customers. This variety of products, applications and channels involves a range of gross profit margins that can cause substantial quarterly fluctuations in gross profit and gross profit margins depending upon the mix of product shipments from quarter to quarter. Additionally, the introduction of new products or services may further heighten quarterly fluctuations in gross profit and gross profit margins due to manufacturing ramp-up and start-up costs. We may experience significant quarterly fluctuations in gross profit margins or operating income or loss due to the impact of the mix of products, channels or geographic areas in which we sell our products from period to period. In some quarters, it is possible that results could be below expectations of analysts and investors. If so, the price of our common stock may be volatile or decline and our cost of capital may increase.
We believe that our future success may depend on our ability to deliver products that meet changing technology and customer needs.
Our business may be affected by rapid technological change, changes in user and customer requirements and preferences, frequent new product and service introductions embodying new technologies and the emergence of new standards and practices, any of which could render our existing products and proprietary technology and printers obsolete. Accordingly, our ongoing research and development programs are intended to enable us to maintain technological leadership. We believe that to remain competitive we must continually enhance and improve the functionality and features of our products, services and technologies. However, there is a risk that we may not be able to:
| ·
| | Develop or obtain leading technologies useful in our business;
|
| ·
| | Enhance our existing products;
|
| ·
| | Develop new products and technologies that address the increasingly sophisticated and varied needs of prospective customers, particularly in the area of print materials functionality;
|
| ·
| | Respond to technological advances and emerging industry standards and practices on a cost-effective and timely basis; or
|
| ·
| | Recruit or retain key technology employees.
|
We derive a significant portion of our revenue from business conducted outside the U.S and are subject to the risks of doing business outside the U.S.
Approximately 44.5 percent of our consolidated revenue is derived from customers in countries outside the U.S. There areWe face many risks inherent in conducting business activities outside the U.S. that, unless managed properly, may adversely affect our profitability, including our ability to collect amounts due from customers. While most of our operations outside the U.S. are conducted in highly developed countries, theyour operations could be adversely affected by:by, among others, the following:
| · | | Unexpected changes in laws, regulations and policies of non-U.S. governments relating to investments and operations, as well as U.S. laws affecting the activities of U.S. companies abroad; |
| · | | Changes in regulatory requirements, including export controls, tariffs and embargoes, other trade restrictions, competition, corporate practices and data privacy concerns; |
| · | | Political policies, political or civil unrest, terrorism or epidemics and other similar outbreaks; |
| · | | Fluctuations in currency exchange rates; |
| · | | Seasonal reductions in business activity in certain parts of the world, particularly during the summer months in Europe and extended holiday periods in various parts of the world;
|
| ·
| | Limited protection for the enforcement of contract and intellectual property rights in some countries; |
| · | | Difficulties in staffing and managing foreign operations; |
| · | | Operating in countries with a higher incidence of corruption and fraudulent business practices; |
| · | | Taxation;Potentially adverse changes in taxation; and
|
| · | | Other factors, depending upon the specific country in which we conduct business. |
These uncertainties may make it difficult for us and our customers to accurately plan future business activities and may lead our customers in certain countries to delay purchases of our products and services. More generally, these geopolitical, social and economic conditions could result in increased volatility in global financial markets and economies.
The consequences of terrorism or armed conflicts are unpredictable, and we may not be able to foresee events that could have an adverse effect on our market opportunities or our business. We are uninsured for losses and interruptions caused by terrorism, acts of war and similar events.
While the geographic areas outside the U.S. in which we operate are generally not considered to be highly inflationary, our foreign operations are sensitive to fluctuations in currency exchange rates arising from, among other things, certain intercompany transactions that are generally denominated, for example, in U.S. dollars rather than their respective functional currencies.
Moreover, our operations are exposed to market risk from changes in interest rates and foreign currency exchange rates and commodity prices, which may adversely affect our results of operations and financial condition. We seek to minimize these risks through regular operating and financing activities and, when we consider it to be appropriate, through the use of derivative financial instruments. We do not purchase, holdHowever, our efforts to minimize our exposure to market risks from changes in interest rates, foreign currency exchange rates and commodity prices may prove to be insufficient or sell derivative financial instruments for trading or speculative purposes.
We face significant competition in many aspects of our business, which could cause our revenue and gross profit margins to decline. Competition could also cause us to reduce sales prices or to incur additional marketing or production costs, which could result in decreased revenue, increased costs and reduced margins.
We compete for customers with a wide variety of producers of equipment for models, prototypes, other three-dimensional objects and end-use parts as well as producers of print materials and services for this equipment. Some of our existing and potential competitors are researching, designing, developing and marketing other types of competitive equipment, print materials and services. Many of these competitors have financial, marketing, manufacturing, distribution and other resources substantially greater than ours.
We also expect that future competition may arise from the development of allied or related techniques for equipment and print materials that are not encompassed by our patents, from the issuance of patents to other companies that may inhibit our ability to develop certain products, and from improvements to existing print materials and equipment technologies.
We intend to continue to follow a strategy of continuing product development to enhance our position to the extent practicable. We cannot assure you that we will be able to maintain our current position in the field or continue to compete successfully against current and future sources of competition. If we do not keep pace with technological change and introduce new products, we may lose revenue and demand for our products. We also incur significant costs associated with the investment in our product development in furtherance of our strategy that may not result in increased revenue or demand for our products and which could negatively affect our operating results.
New regulations related to conflict-free minerals may cause us to incur additional expenses and may create challenges with our customers.
The Dodd-Frank Wall Street Reform and Consumer Protection Act contains provisions to improve transparency and accountability regarding the use of “conflict” minerals mined from the Democratic Republic of Congo (the “DRC”) and adjoining countries. The SEC has established new annual disclosure and reporting requirements for those companies who use “conflict” minerals sourced from the DRC and adjoining countries in their products. We are currently conducting due diligence efforts in order to adhere to the initial disclosure requirements beginning in May 2014.These new requirements could adversely affect the sourcing, supply and pricing of materials used in our products. As there may be only a limited number of suppliers offering conflict-free minerals, we cannot ensure that we will be able to obtain these conflict-free minerals in sufficient quantities or at competitive prices. Compliance with these new requirements may also increase our costs, including costs that may be incurred in conducting due diligence procedures to determine the sources of certain minerals used in our products and other potential changes to products, processes or sources of supply as a consequence of such verification activities. In addition, we may face challenges with our customers if we are unable to sufficiently verify the origins of the minerals used in our products. unsuccessful.
We depend on our supply chain for components and sub-assemblies used in our 3D printers and other products and for raw materials used in our print materials. If these relationships were to terminate or be disrupted, our business could be disrupted while we locatedlocate alternative suppliers and our expenses may increase.
We have outsourced the assembly of certain of our printers to third party suppliers, we purchase components and sub-assemblies for our printers from third partythird-party suppliers, and we purchase raw materials that are used in our print materials, as well as certain of those print materials, from third partythird-party suppliers.
While there are several potential suppliers of the components, parts and sub-assemblies for our products, we currently choose to use only one or a limited number of suppliers for several of these components, including our lasers, print materials and certain jetting components. Our reliance on a single or limited number of suppliers involves many risks, including:including, among others, the following:
| · | | Potential shortages of some key components; |
| · | | Disruptions in the operations of these suppliers; |
| · | | Product performance shortfalls; and |
| · | | Reduced control over delivery schedules, assembly capabilities, quality and costs. |
While we believe that we can obtain all the components necessary for our products from other manufacturers, we require any new supplier to become “qualified” pursuant to our internal procedures, which could involve evaluation processes of varying durations. We generally have our printers and other products assembled based on our internal forecasts and the supply of raw materials, assemblies, components and finished goods from third parties, which are subject to various lead times. In addition, at any time, certain suppliers may decide to discontinue production of an assembly, component or raw material that we use. Any unanticipated change in the sources of our supplies, or unanticipated supply limitations, could increase production or related costs and consequently reduce margins.
If our forecasts exceed actual orders, we may hold large inventories of slow-moving or unusable parts, which could have an adverse effect on our cash flow, profitability and results of operations. Inversely, we may lose orders if our forecast is low and we are unable to meet demand.
We have engaged selected design and manufacturing companies to assemble certain of our production printers. In carrying out these outsourcing activities, we face a number of risks, including:including, among others, the following:
| · | | The risk that the parties that we retain to perform assembly activities may not perform in a satisfactory manner; |
| · | | The risk of disruption in the supply of printers or other products to our customers if such third parties either fail to perform in a satisfactory manner or are unable to supply us with the quantity of printers or other products that are needed to meet then current customer demand; and |
| · | | The risk of insolvency of these suppliers, as well as the risks that we face, as discussed above, in dealing with a limited number of suppliers. |
The costs and effects of litigation, investigations or similar matters involving us or our subsidiaries, or adverse facts and developments related thereto, could materially affect our business, operating results and financial condition.
We may be subjectinvolved from time to time in a variety of litigation, investigations, inquiries or similar matters arising out of our business, including those described in Note 22 to the Consolidated Financial Statements. The Company cannot predict the outcome of these or any other legal matters. In the future, we may need to record litigation reserves with respect to these matters because our insurance may not cover all claims that may be asserted against us. Should the ultimate judgments or settlements in any litigation or investigation significantly exceed our insurance coverage, they could have a material adverse effect on our business, financial condition and results of operations.
Our products and services may experience quality problems from time to time that can result in decreased sales and operating margin, product returns, product liability, warranty or other claims whichthat could result in material expense, diversion of management timesignificant expenses and attention and damageharm to our business reputation.
Products asWe sell complex as those we offer mayhardware and software products, materials and services that can contain undetected design and manufacturing defects or errors when first introduced or as enhancements are released that, despite testing, are not discovered until after the product has been installed and used by customers. ThisSophisticated software and applications, such as those sold by us, may contain “bugs” that can unexpectedly interfere with the software’s intended operation. Defects may also occur in components and products we purchase from third parties. There can be no assurance we will be able to detect and fix all defects in the hardware, software, materials and services we sell. Failure to do so could result in lost revenue, product returns, product liability, delayed marketplacemarket acceptance of the product,those products and services, claims from customersdistributors, end-users or others, increased end-user service and support costs, and significant warranty claims and other expenses to correct the defects, diversion of management time and attention and harm to our reputation.
Our operations could suffer if we are unable to attract and retain key management or other key employees.
Our success depends upon the continued service and performance of our senior management and other key personnel. Our senior executive team is critical to the management of our business and operations, as well as to the development and execution of our strategy. The loss of the services of one or more members of our senior executive team could delay or prevent the successful implementation of our growth strategy, or our commercialization of new applications for our systems or other products, or could otherwise adversely affect our ability to manage our company effectively and carry out our business plan. Members of our senior management team may resign at any time. High demand exists for senior management and other key personnel (including scientific, technical and sales personnel) in the 3D printing industry, and there can be no assurance that we will be able to retain such personnel. We experience intense competition for qualified personnel.
While we intend to continue to provide competitive compensation packages to attract and retain key personnel, some of our competitors for these employees have greater resources and more experience, making it difficult for us to compete successfully for key personnel. If we cannot attract and retain sufficiently qualified technical employees for our research and development and manufacturing operations, we may be unable to achieve the synergies expected from mergers and acquisitions that we may effect from time to time, or to develop and commercialize new products or new applications for existing products. Furthermore, possible shortages of key personnel, including engineers, in the regions surrounding our facilities could require us to pay more to hire and retain key personnel, thereby increasing our costs.
We may be subject to product liability claims, which could result in material expense, diversion of management time and attention and damage to our reputationbusiness reputation.
The sale and businesssupport of our products entails the risk of product liability claims.From time to time,we may become subject to product liability claims that could lead to significant expenses. The risk may be heightened when we provide products into certain markets, such as healthcare, aerospace and automotive industries.
This risk of product liability claims may also be greater due to the use of certain hazardous chemicals used in the production of certain of our products, including irritants, harmful chemicals and chemicals dangerous to the environment. We may also be subject to claims that our printers have been, or significant costsmay be used to, correctcreate parts that are not in compliance with legal requirements or that infringe on the defect or error.intellectual property rights of others.
We attempt to include provisions in our agreements with customers that are designed to limit our exposure to potential liability for damages arising from defects or errors in our products.products and other issues. However, the nature and extent of these limitations vary from customer to customer. Their effect is subject to a variety of legal limitations and it is possible that these limitations may not be effective as a result of unfavorable judicial decisions or laws enacted in the future.
The sale and support of our products entails the risk of product liability claims. Any product liability claim brought against us, regardless of its merit, could result in materialsignificant expense, diversion of management time and attention, damage to our business reputation and failure to retain existing customers or to fail to attract new customers. Although we maintain product liability insurance, such insurance is subject to deductibles and there is no guarantee that such insurance will be available or adequate to protect against all such claims. Costs or payments made in connection with product liability claims could adversely affect our financial condition and results of operations.
We face risksrely on our management information systems for inventory management, distribution and other key functions. If our information systems fail to adequately perform these functions, or if we experience an interruption in their operation, our business and operating results could be adversely affected.
The efficient operation of our business is dependent on our management information systems. We rely on our management information systems to, among other things, effectively manage our accounting and financial functions, including maintaining our internal controls; to manage our manufacturing and supply chain processes; and to maintain our research and development data. The failure of our management information systems to perform properly could disrupt our business and product development, which may result in decreased sales, increased overhead costs, excess or obsolete inventory, and product shortages, causing our business and operating results to suffer. Although we take steps to secure our management information systems, including our computer systems, intranet and Internet sites, email and other telecommunications and data networks, the security measures we have implemented may not be effective and our systems may be vulnerable to theft, loss, damage and interruption from a number of potential sources and events, including unauthorized access or security breaches, natural or man-made disasters, cyber-attacks, computer viruses, power loss or other disruptive events. Our reputation and financial condition could be adversely affected if, as a result of a significant cyber event or otherwise, our operations are disrupted or shut down; our confidential, proprietary information is stolen or disclosed; we incur costs or are required to pay fines in connection with changes in energy-related expenses.stolen customer, employee, or other confidential information; we must dedicate significant resources to system repairs or increase cyber security protection; or we otherwise incur significant litigation or other costs.
We are subject to U.S. and other anti-corruption laws, trade controls, economic sanctions and similar laws and regulations. Our failure to comply with these laws and regulations could subject us to civil, criminal and administrative penalties and harm our suppliers dependreputation.
Doing business on a worldwide basis requires us to comply with the laws and regulations of the U.S. government and various energy products in processes usedforeign jurisdictions. These laws and regulations place restrictions on our operations, trade practices, partners and investments.
In particular, our operations are subject to produce our products. Generally, we acquire products at market pricesU.S. and do not use financial instruments to hedge energy prices.foreign anti-corruption and trade control laws and regulations, such as the Foreign Corrupt Practices Act (“FCPA”) and United Kingdom Bribery Act (the “Bribery Act”), export controls and economic sanctions programs, including those administered by the U.S. Treasury Department’s Office of Foreign Assets Control (“OFAC”), the State Department's Directorate of Defense Trade Controls (“DDTC”) and the Bureau of Industry and Security (“BIS”). As a result of doing business in foreign countries and with foreign customers, we are exposed to market risks relateda heightened risk of violating anti-corruption and trade control laws and sanctions regulations.
As part of our business, we may deal with state-owned business enterprises, the employees of which are considered foreign officials for purposes of the FCPA’s prohibition on providing anything of value to changes in energy prices.foreign officials for the purposes of obtaining or retaining business or securing any improper business advantage. In addition, manythe provisions of the customersBribery Act extend beyond bribery of foreign public officials and industriesalso apply to whomtransactions with individuals that a government does not employ. Some of the international locations in which we marketoperate lack a developed legal system and have higher than normal levels of corruption. Our continued expansion outside the U.S., including in Brazil, China, India and developing countries, and our printersdevelopment of new partnerships and print materials are directlyjoint venture relationships worldwide, could increase the risk of FCPA, OFAC or indirectly dependent uponBribery Act violations in the cost and availability of energy resources.future.
As an exporter, we must comply with various laws and profitability may be materially and adversely affectedregulations relating to the extentexport of products and technology from the U.S. and other countries having jurisdiction over our operations. In the U.S., these laws include the International Traffic in Arms Regulations (“ITAR”) administered by the DDTC, the Export Administration Regulations (“EAR”) administered by the BIS and trade sanctions against embargoed countries and destinations administered by OFAC. The EAR governs products, parts, technology and software which present military or weapons proliferation concerns, so-called “dual use” items, and ITAR governs military items listed on the United States Munitions List. Prior to shipping certain items, we must obtain an export license or verify that license exemptions are available. Any failures to comply with these laws and regulations could result in fines, adverse publicity and restrictions on our or our customers’ energy-related expenses increase, both as a result of higher costs of producing, and potentially lower profit margins in selling,ability to export our products, and print materials and because increased energy costs may cause our customers to delay or reduce purchases of our printers and print materials.repeat failures could carry more significant penalties.
A cybersecurity incident could have negative impact.
A cyber-attack that bypasses our information technology (IT) security systems causing an IT security breach, may lead to a material disruptionViolations of our IT business systems and/anti-corruption and trade control laws and sanctions regulations are punishable by civil penalties, including fines, denial of export privileges, injunctions, asset seizures, debarment from government contracts and revocations or the lossrestrictions of business information resulting in adverse business impact. Risks may include:
| ·
| | future results could be adversely affected due to the theft, destruction, loss, misappropriation or release of confidential data or intellectual property;
|
| ·
| | operational or business delays resulting from the disruption of IT systems and subsequent clean-up and mitigation activities; and
|
| ·
| | negative publicity resulting in reputation or brand damage with our customers, partners or industry peers.
|
Historically, our common stock price has been volatile.
The market price of our common stock has experienced, and may continue to experience, considerable volatility. Between January 1, 2012 and December 31, 2013, after giving effect to the three-for-two stock split in the nature of a 50% stock dividend that we distributed in February 2013, the trading price of our common stock has ranged from a low of $9.82 per share to a high of $92.93 per share.
Numerous factors could have a significant effect on the price of our common stock, including those described or referred to in this “Risk Factors” section of this Form 10-K,licenses, as well as amongcriminal fines and imprisonment. We have established policies and procedures designed to assist our compliance with applicable U.S. and international anti-corruption and trade control laws and regulations, including the FCPA, the Bribery Act and trade controls and sanctions programs administered by OFAC, the DDTC and BIS, and have trained our employees to comply with these laws and regulations. However, there can be no assurance that all of our employees, consultants, agents or other things:
| ·
| | Our perceived value in the securities markets;
|
| ·
| | Overall trends in the stock market;
|
| ·
| | Announcements of fluctuations in our operating results or the operating results of one or more of our competitors;
|
| ·
| | The impact of changes in our results of operations, our financial condition or our prospects or on how we are perceived in the securities markets;
|
| ·
| | Future sales of our common stock or other securities (including any shares issued in connection with our outstanding senior convertible notes or earn-out obligations for any past or future acquisition);
|
| ·
| | Market conditions for providers of products and services such as ours;
|
| ·
| | Changes in recommendations or earnings estimates by securities analysts; and
|
| ·
| | Announcements of acquisitions by us or one of our competitors.
|
The numberassociated persons will not take actions in violation of shares of common stock issuableour policies and these laws and regulations. Additionally, there can be no assurance that our policies and procedures will effectively prevent us from violating these regulations in every transaction in which we may engage or provide a stock offering,defense to any alleged violation. In particular, we may be held liable for the issuance of restricted stock awardsactions that our joint venture partners take inside or the issuance of shares in connection with certain acquisitions or the conversionoutside of the notes could dilute the ownership interest of existing stockholders andUnited States, even though our partners may affect the market price fornot be subject to these laws. Such a violation, even if our common stock.
We have an effective registration statement on Form S-3 under which, among other things, we may issue up to $500.0 million of securities. We issued $272.1 million of Common Stock in 2013 and $112.1 million of Common in Stock in 2012 in reliance upon this registration statement and the remaining $115.8 million of securities covered bypolicies prohibit it, may be issued until June 12, 2015. We may file a new registration statement at any time to increase these available amounts as necessary to provide flexibility to execute our growth strategy.
In February 2013, the Company announced that its Board of Directors declared a three-for-two split of the Company’s common stock in the nature of a 50% stock dividend. On February 22, 2013, each stockholder of record at the close of business on February 15, 2013 received one additional share for every two shares held on the record date. In lieu of fractional shares, shareholders received a cash payment based on the closing market price of our stock on the record date. Trading began on a split-adjusted basis on February 25, 2013.
Our Certificate of Incorporation, as amended, authorizes our issuance of up to a total 220.0 million shares of common stock, of which 103.8 million shares have been issued or are otherwise currently reserved for issuance. Future issuances could have the effect of diluting our earnings per share as well as our existing stockholders’ individual ownership percentages and could lead to volatility in our common stock price.
Additionally, subject to the limitations of our Certificate of Incorporation and applicable law, we are not restricted from issuing additional common stock, including securities that are convertible into or exchangeable for, or that represent the right to receive, common stock. The issuance of additional shares of our common stock in connection with future acquisitions or other issuances of our common stock or convertible securities, including outstanding options, may dilute the ownership interest of our common stockholders.
Sales of a substantial number of shares of our common stock or other equity-related securities in the public market could depress the market price of our common stock and impair our ability to raise capital through the sale of additional equity or equity-linked securities. We cannot predict the effect that future sales of our common stock or other equity-related securities would have on the market price of our common stock.
Our Board of Directors is authorized to issue up to 5 million shares of preferred stock.
The Board of Directors is authorized to issue up to 5 million shares of preferred stock, none of which is currently issued or outstanding. The Board of Directors is authorized to issue these shares of preferred stock in one or more classes or series without further action of the stockholders and in that regard to determine the issue price, rights, preferences and privileges of any such class or series of preferred stock generally without any further vote or action by the stockholders. The rights of the holders of any outstanding series of preferred stock may adversely affect the rights of holders of common stock.
Our ability to issue preferred stock gives us flexibility concerning possible acquisitions and financings, but it could make it more difficult for a third party to acquire a majority of our outstanding common stock. In addition, any preferred stock that is issued may have other rights, including dividend rights, liquidation preferences and other economic rights, senior to the common stock, which could have a materialan adverse effect on the market valueour reputation, business, financial condition and results of our common stock.
Certain provisions of Delaware law contain anti-takeover provisions that may make it more difficult to effect a change in our control.
Certain provisions of the Delaware General Corporation Law could delay or prevent an acquisition or change in control and the replacement of our incumbent directors and management, even if doing so might be beneficial to our stockholders by providing them with the opportunity to sell their shares, possibly at a premium over the then market price of our common stock. One of these Delaware laws prohibits us from engaging in a business combination with any interested stockholder (as defined in the statute) for a period of three years from the date that the person became an interested stockholder, unless certain conditions are met.
Our balance sheet contains several categories of intangible assets totaling $511.8 million at December 31, 2013 that we could be required to write off or write down in the event of the impairment of certain of those assets arising from any deterioration in our future performance or other circumstances. Such write-offs or write-downs could adversely impact our future earnings and stock price, our ability to obtain financing and affect our customer relationships.
At December 31, 2013, we had $370.1 million in goodwill capitalized on our balance sheet. Accounting Standards Codification (“ASC”) 350, “Intangibles – Goodwill and Other,” requires that goodwill and some long-lived intangibles be tested for impairment at least annually.operations. In addition, goodwillvarious state and intangible assets are tested for impairment at other times as circumstances warrant, and such testing could result in write-downs of some of our goodwill and long‑lived intangibles. Impairment is measured as the excess of the carrying value of the goodwill or intangible asset over the fair value of the underlying asset. A key factor in determining whether impairment has occurred is the relationship between our market capitalization and our book value. Accordingly, we may, from time to time, incur impairment charges, which are recorded as operating expenses when they are incurred and would reduce our net income and adversely affect our operating results in the period in which they are incurred.
As of December 31, 2013, we had $141.7 million of other intangible assets, net, consisting of licenses, patents,municipal governments, universities and other intangiblesinvestors maintain prohibitions or restrictions on investments in companies that we amortize over time. Any material impairment to any of these items would result in a non-cash chargedo business with sanctioned countries, persons and would not impact our cash position or cash flows, but such a chargeentities, which could adversely affect our reputation, business, financial condition and results of operations and equity and could affect the trading price of our common stock in the period in which they are incurred.
As discussed below, we completed several business acquisitions during 2013, 2012 and 2011. The majority of the acquisitions have resulted in our recording additional goodwill on our consolidated balance sheet. This goodwill typically arises because the purchase price for these businesses reflects a number of factors including the future earnings and cash flow potential of these businesses, the multiples to earnings, cash flow and other factors, such as prices at which similar businesses have been purchased by other acquirers, the competitive nature of the process by which we acquired the business, and the complementary strategic fit and resulting synergies these businesses bring to existing operations.
For additional information, see Notes 6 and 7to the Consolidated Financial Statements and “Management’s Discussion and Analysis of Financial Condition and Results of Operations—Critical Accounting Policies and Significant Estimates—Goodwill and other intangible and long-lived assets.”
Changes in, or interpretation of, tax rules and regulations may impact our effective tax rate and future profitability.
We are a U.S. based, multinational company subject to taxation in multiple U.S. and foreign tax jurisdictions. Our future effective tax rates could be adversely affected by changes in statutory tax rates or interpretation of tax rules and regulations in jurisdictions in which we do business, changes in the amount of revenue or earnings in the countries with varying statutory tax rates, or by changes in the valuation of deferred tax assets and liabilities.
In addition, we are subject to audits and examinations of previously filed income tax returns by the Internal Revenue Service (“IRS”) and other domestic and foreign tax authorities. We regularly assess the potential impact of such examinations to determine the adequacy of our provision for income taxes and have reserved for potential adjustments that we expect may result from the current examinations. We believe such estimates to be reasonable; however, there is no assurance that the final determination of any examination will not have an adverse effect on our operating results and financial position.
Our business involves the use of hazardous materials, and we must comply with environmental, health and safety laws and regulations, which can be expensive and restrict how we do business.
Our business involves the blending, controlled storage, use and disposal of hazardous materials. We and our suppliers are subject to federal, state and local as well as foreign laws and regulations governing the use, manufacture, storage, handling and disposal of these hazardous materials. Although we believe that the safety procedures utilized by us for handling and disposing of these materials comply with the standards prescribed by these laws and regulations, we cannot eliminate the risk of accidental contamination or injury from these materials. In the event of an accident, local, state, federal or foreign authorities may curtail the use of these materials and interrupt our business operations. If we are subject to any liability as a result of activities involving hazardous materials, our business and financial condition may be adversely affected and our reputation may be harmed.
Our common stock price has been and may continue to be volatile.
The market price of our common stock has experienced, and may continue to experience, considerable volatility. Between January 1, 2015 and December 31, 2016, the trading price of our common stock has ranged from a low of $6.00 per share to a high of $33.97 per share. Numerous factors could have a significant effect on the price of our common stock, including those described or referred to in this “Risk Factors” section of this Form 10-K, as well as, among other things:
| · | | Our perceived value in the securities markets; |
| · | | Overall trends in the stock market; |
| · | | Announcements of fluctuations in our operating results or the operating results of one or more of our competitors; |
| · | | The impact of changes in our results of operations, our financial condition or our prospects; |
| · | | Future sales of our common stock or other securities (including any shares issued in connection with earn-out obligations for any past or future acquisition); |
| · | | Market conditions for providers of products and services such as ours; |
| · | | Executive level management uncertainty or change; |
| · | | Changes in recommendations or earnings estimates by securities analysts; and |
| · | | Announcements of acquisitions by us or one of our competitors. |
Some anti-takeover provisions contained in our certificate of incorporation and bylaws, as well as provisions of Delaware law, could impair a takeover attempt.
We have provisions in our certificate of incorporation and by-laws each of which could have the effect of rendering more difficult or discouraging an acquisition of the Company deemed undesirable by our Board of Directors. These include provisions:
| · | | Authorizing blank check preferred stock, which we could issue with voting, liquidation, dividend and other rights superior to our common stock; |
| · | | Limiting the liability of, and providing indemnification to, our directors and officers; |
| · | | Specifying that our stockholders may take action only at a duly called annual or special meeting of stockholders and otherwise in accordance with our bylaws and limiting the ability of our stockholders to call special meetings; |
| · | | Requiring advance notice of proposals by our stockholders for business to be conducted at stockholder meetings and for nominations of candidates for election to our Board of Directors; and |
| · | | Controlling the procedures for conduct of our Board of Directors and stockholder meetings and election, appointment and removal of our directors. |
These provisions, alone or together, could deter or delay hostile takeovers, proxy contests and changes in control or our management. As a Delaware corporation, we are also subject to provisions of Delaware law, including Section 203 of the Delaware General Corporation Law, which prevents some stockholders from engaging in certain business combinations without approval of the holders of substantially all of our outstanding common stock.
Any provision of our certificate of incorporation or by-laws or Delaware law that has the effect of delaying or deterring a change in control of the Company could limit the opportunity for our stockholders to receive a premium for their shares of our stock and also could affect the price that some investors are willing to pay for our stock.
Item 1B. Unresolved Staff Comments
None.
Item 2. Properties
We occupy an 80,000Our headquarters is located in Rock Hill, South Carolina. As of December 31, 2016, we leased 1.1 million square footfeet and owned 0.1 million square feet, primarily located in the U.S., as summarized below.
| | | | | | | | | | | | |
| | Square Feet (in thousands) |
| | Americas | | EMEA | | APAC | | TOTAL |
| | Leased | Owned | | Leased | Owned | | Leased | Owned | | Leased | Owned |
Primary Function Category: | | | | | | | | | | | | |
Corporate headquarters | | 80 | — | | — | — | | — | — | | 80 | — |
Manufacturing and warehouse | | 232 | — | | 76 | — | | — | — | | 308 | — |
Research and development | | 241 | — | | 36 | — | | 24 | — | | 301 | — |
Services | | 199 | 74 | | 80 | — | | 38 | — | | 317 | 74 |
Sales, general and other administrative | | 15 | — | | 46 | — | | 18 | — | | 79 | — |
Total square feet | | 767 | 74 | | 238 | — | | 80 | — | | 1,085 | 74 |
Our corporate headquarters research and development and manufacturing facility in Rock Hill, South Carolina which we lease pursuant toalso serves as a lease agreement with Lex Rock Hill, LP. After its initial term ending August 31, 2021, the lease provides us with the option to renew the lease for two additional five-year terms as well as the right to cause Lex Rock Hill, LP, subject to certain termsresearch and conditions, to expand the leased premises during the term of the lease,development site. Other major research and development locations include Cary, North Carolina; San Diego, California; Seoul, Korea; Tel Aviv, Israel; Valencia, California and Wilsonville, Oregon, among others. We believe our existing facilities and equipment are in which case the term of the lease would be extended. The lease is a triple net leasegood operating condition and providesare suitable for the paymentconduct of base rent of approximately $0.7 million annually from 2013 through 2020, including a rent escalationour business. We will continue to make investments in 2016,capital equipment as needed to meet anticipated demand for our products. See “Item 1. Business – Production and $0.5 million in 2021. Under the terms of the lease, we are obligated to pay all taxes, insurance, utilitiesSupplies” and other operating costs with respectNotes 12 and 21 to the leased premises. Pursuant to the termsConsolidated Financial Statements for further discussion of the lease, we exercised the right to purchase the undeveloped land surrounding the leased premises in March 2011. We purchased this 11-acre parcel contiguous to our Rock Hill facility for future expansion and additional facility capacity to continue to expand in-house manufacturing activities for printers and print materials.facilities.
In addition, we lease a second property in Rock Hill, SC for production and warehouse facilities and several other properties globally, which are summarized in the table below:
| | | | |
Location
| | Square Feet
| | Primary Function
|
Wilsonville, Oregon
| | 80,000
| | Research and development
|
Baja, Mexico
| | 63,400
| | Quickparts services
|
Andover, Massachusetts
| | 57,600
| | Production and research and development
|
Lawrenceburg, Tennessee
| | 35,000
| | Quickparts services
|
Rock Hill, South Carolina
| | 33,700
| | Production and warehouse
|
Riom, France
| | 33,300
| | Production and research and development
|
Turin, Italy
| | 32,300
| | Quickparts services
|
Morrisville, North Carolina
| | 32,200
| | Research and development and sales
|
Seoul, Korea
| | 30,900
| | Research and development and sales
|
Seattle, Washington
| | 30,000
| | Quickparts services
|
Herndon, Virginia
| | 27,000
| | Production and research and development
|
Burbank, California
| | 23,000
| | Production and sales
|
High Wycombe, United Kingdom
| | 22,300
| | Quickparts services
|
Le Mans, France
| | 21,300
| | Quickparts services
|
Budel, Netherlands
| | 19,900
| | Quickparts services
|
Langhorne, Pennsylvania
| | 18,800
| | Quickparts services
|
Marly, Switzerland
| | 15,300
| | Production and research and development
|
Hemel Hempstead, United Kingdom
| | 12,400
| | General and corporate
|
Norton, Ohio
| | 12,000
| | Production
|
Valencia, California
| | 11,000
| | Research and development
|
Atlanta, Georgia
| | 10,900
| | Quickparts services
|
We also lease various other sales and service offices in Germany, the United Kingdom, the Netherlands, Australia, Japan, China, and India as well as various other facilities used in the U.S., Australia and the Netherlands.
Item 3. Legal Proceedings
For informationSecurities and Derivative Litigation
The Company and certain of its former executive officers have been named as defendants in a consolidated putative stockholder class action lawsuit pending in the United States District Court for the District of South Carolina. The consolidated action is styled KBC Asset Management NV v. 3D Systems Corporation, et al., Case No. 0:15-cv-02393-MGL. The Amended Consolidated Complaint (the “Complaint”), which was filed on December 9, 2015, alleges that defendants violated the Securities Exchange Act of 1934, as amended (the “Exchange Act”), and Rule 10b-5 promulgated thereunder by making false and misleading statements and omissions and that the former officers are control persons under Section 20(a) of the Exchange Act. The Complaint was filed on behalf of stockholders who purchased shares of the Company’s common stock between October 29, 2013, and May 5, 2015 and seeks monetary damages on behalf of the purported class. Defendants filed a motion to dismiss the Complaint in its entirety on January 14, 2016, which was denied by Memorandum Opinion and Order dated July 25, 2016 (the “Order”). Defendants filed a motion for reconsideration of the Order on August 4, 2016, which was denied by Order dated February 24, 2017.
Nine related derivative complaints have been filed by purported Company stockholders against certain of the Company’s former executive officers and members of its Board of Directors. The Company is named as a nominal defendant in all nine actions. The derivatives complaints are styled as follows: (1) Steyn v. Reichental, et al., Case No. 2015-CP-46-2225, filed on July 27, 2015 in the Court of Common Pleas for the 16th Judicial Circuit, County of York, South Carolina (“Steyn”); (2) Piguing v. Reichental, et al., Case No. 2015-CP-46-2396, filed on August 7, 2015 in the Court of Common Pleas for the 16th Judicial Circuit, County of York, South Carolina (“Piguing”); (3) Booth v. Reichental, et al., Case No. 15-692-RGA, filed on August 6, 2015 in the United States District Court for the District of Delaware; (4) Nally v. Reichental, et al., Case No. 15-cv-03756-MGL, filed on September 18, 2015 in the United States District Court for the District of South Carolina; (5) Gee v. Hull, et al., Case No. BC-610319, filed on February 17, 2016 in the Superior Court for the State of California, County of Los Angeles (“Gee”); (6) Foster v. Reichental, et al., Case No. 0:16-cv-01016-MGL, filed on April 1, 2016 in the United States District Court for the District of South Carolina; (7) Lu v. Hull, et al., Case No. BC629730, filed on August 5, 2016 in the Superior Court for the State of California, County of Los Angeles (“Lu”); (8) Howes v. Reichental, et al., Case No. 0:16-cv-2810-MGL, filed on August 11, 2016 in the United States District Court for the District of South Carolina; and (9) Ameduri v. Reichental, et al., Case No. 0:16-cv-02995-MGL, filed on September 1, 2016 in the United States District Court for the District of South Carolina. Steyn and Piguing were consolidated into one action styled as In re 3D Systems Corp. Shareholder Derivative Litig., Lead Case No. 2015-CP-46-2225 in the Court of Common Pleas for the 16th Judicial Circuit, County of York, South Carolina. Gee and Lu were consolidated into one action styled as Gee v. Hull, et al., Case No. BC610319 in the Superior Court for the State of California, County of Los Angeles.
The derivative complaints allege claims for breach of fiduciary duty, abuse of control, gross mismanagement, waste of corporate assets and unjust enrichment and seek, among other things, monetary damages and certain corporate governance actions.
All of the derivative complaints listed above have been stayed until the earlier of the close of discovery or the deadline for appealing a dismissal in the KBC Asset Management NV securities class action.
The Company believes the claims alleged in the putative securities class action and the derivative lawsuits are without merit and intends to defend the Company and its officers and directors vigorously.
Ronald Barranco and Print3D Corporation v. 3D Systems Corporation, et. al.
On August 23, 2013, Ronald Barranco, a former Company employee, filed two lawsuits against the Company and certain officers in the United States District Court for the District of Hawaii. The first lawsuit (“Barranco I”) is captioned Ronald Barranco and Print3D Corporation v. 3D Systems Corporation, 3D Systems, Inc., and Damon Gregoire, Case No. CV 13-411 LEK RLP, and alleges seven causes of action relating to legal proceedings, see Note 22the Company’s acquisition of Print3D Corporation (of which Mr. Barranco was a 50% shareholder) and the subsequent employment of Mr. Barranco by the Company. The second lawsuit (“Barranco II”) is captioned Ronald Barranco v. 3D Systems Corporation, 3D Systems, Inc., Abraham Reichental, and Damon Gregoire, Case No. CV 13-412 LEK RLP, and alleges the same seven causes of action relating to the Consolidated Financial Statements containedCompany’s acquisition of certain website domains from Mr. Barranco and the subsequent employment of Mr. Barranco by the Company. Both Barranco I and Barranco II allege the Company breached certain purchase agreements in order to avoid paying Mr. Barranco additional monies pursuant to royalty and earn out provisions in the agreements. The Company and its officers timely filed responsive pleadings on October 22, 2013 seeking, inter alia, to dismiss Barranco I due to a mandatory arbitration agreement and for lack of personal jurisdiction and to dismiss Barranco II for lack of personal jurisdiction.
With regard to Barranco I, the Hawaii district court, on February 28, 2014, denied the Company’s motion to dismiss and its motion to transfer venue to South Carolina for the convenience of the parties. However, the Hawaii court recognized that the plaintiff’s claims are all subject to mandatory and binding arbitration in Charlotte, North Carolina. Because the Hawaii court was without authority to compel arbitration outside of Hawaii, the court ordered that the case be transferred to the district court encompassing Charlotte (the United States District Court for the Western District of North Carolina) so that court could compel arbitration in Charlotte. On April 17, 2014, Barranco I was transferred in to the Western District of North Carolina. Plaintiff filed a demand for arbitration on October 29, 2014. On December 9, 2014, the Company filed its answer to plaintiff’s demand for arbitration. On February 2, 2015, plaintiff filed an amended demand that removed Mr. Gregoire as a defendant from the matter, and on February 4, 2015 the Company filed its amended answer. The parties selected an arbitrator and arbitration took place in June 2015 in Charlotte, North Carolina.
On September 28, 2015, the arbitrator issued a final award in favor of Mr. Barranco with respect to two alleged breaches of contract and implied covenants arising out of the contract. The arbitrator found that the Company did not commit fraud or make any negligent misrepresentations to Mr. Barranco. Pursuant to the award, the Company is to pay approximately $11.3 million, which includes alleged actual damages of approximately $7.3 million, fees and expenses of approximately $2.3 million and prejudgment interest of approximately $1.7 million. The Company disagrees with the single arbitrator’s findings and conclusions and believes the arbitrator’s decision exceeds his authority and disregards the applicable law. As an initial response, the Company filed a motion for modification on September 30, 2015, based on mathematical errors in the computation of damages and fees. On October 16, 2015, the arbitrator issued an order denying the Company’s motion and sua sponte issuing a modified final award in favor of Mr. Barranco in the same above-referenced amounts, but making certain substantive changes to the award, which changes the Company believes were improper and outside the scope of his authority and the American Arbitration Association rules. On November 20, 2015, the Company filed a motion to vacate the arbitration award in the federal court in the Western District of North Carolina. Claimants also filed a motion to confirm the arbitration award. A hearing was held on the motions on June 29, 2016 in federal court in the Western District of North Carolina. The court requested supplemental briefing by the parties, which briefs were filed on July 11, 2016.
On August 31, 2016, the court issued an Order granting in part and denying in part Plaintiff’s motion to confirm the arbitration award and for judgment, entering judgment in the principal amount of the arbitration award and denying Plaintiff’s motion for fees and costs. The court denied the Company’s motion to vacate. On September 7, 2016, Plaintiff filed a motion to amend the judgment to include prejudgment interest. The Company opposed that motion and the parties submitted briefing, which is currently pending before the court. On September 28, 2016 the Company filed a motion to alter or amend the judgment. Plaintiff opposed the motion and the parties submitted briefing, which is currently pending before the court.
Notwithstanding the Company’s right to appeal, given the arbitrator’s decision, the Company recorded an $11.3 million expense provision for this matter in the quarter ended September 30, 2015. The provision is subject to adjustment based on the ultimate outcome of the Company’s appeal. If it is ultimately determined that money is owed following the full appellate process in federal court, the Company intends to fund any amounts to be paid from cash on hand. This amount has been classified as a long-term liability given the customary timeline of an appeals process. The Company will review this classification periodically.
With regard to Barranco II, the Hawaii district court, on March 17, 2014, denied the Company’s motion to dismiss and its motion to transfer venue to South Carolina. However, the Hawaii court dismissed Count II in plaintiff’s complaint alleging breach of the employment agreement. The Company filed an answer to the complaint in the Hawaii district court on March 31, 2014. On November 19, 2014, the Company filed a motion for summary judgment on all claims which was heard on January 20, 2015. On January 30, 2015, the court entered an order granting in part and denying in Part II, Item 8the Company’s motion for summary judgment. The Order narrowed the plaintiff’s claim for breach of this Annual Reportcontract and dismissed the plaintiff’s claims for fraud and negligent misrepresentation. As a result, Messrs. Reichental and Gregoire were dismissed from the lawsuit. The case was tried to a jury in May 2016, and on Form 10-K.May 27, 2016 the jury found that the Company was not liable for either breach of contract or breach of the implied covenant of good faith and fair dealing. Additionally, the jury found in favor of the Company on its counterclaim against Mr. Barranco and determined that Mr. Barranco violated his non-competition covenant with the Company. The Court is expected to order an accounting with respect to the counterclaim.
The Company is involved in various other legal matters incidental to its business. Although the Company cannot predict the results of litigation with certainty, the Company believes that the disposition of these legal matters will not have a material adverse effect on its consolidated results of operations or consolidated financial position.
Item 4. Mine Safety Disclosures
Not applicable.
PART II
Item 5. Market for Registrant’s Common Equity, Related Stockholder Matters and Issuer Purchases of Equity Securities
On May 26, 2011, we transferred the listing of our Common Stock toOur common stock is listed on the New York Stock Exchange (“NYSE”) under the trading symbol “DDD.” Prior to that, our Common Stock was listed on The NASDAQ Global Market (“NASDAQ”) and traded under the symbol “TDSC.” The following table sets forth, for the periods indicated, the range of high and low prices of our common stock, $0.001 par value, as quoted on The NASDAQ Global Market and the NYSE, with tickers TDSC and DDD, respectively. In addition, we completed a three-for-two stock split in the form of a 50% stock dividend, effective February 15, 2013, which is reflected in the prices in the table below.NYSE.
| | | | | | | |
Year | Period | | | High | | | Low |
2012 | First Quarter | | $ | 17.18 | | $ | 9.82 |
| Second Quarter | | | 23.32 | | | 14.83 |
| Third Quarter | | | 29.87 | | | 20.25 |
| Fourth Quarter | | | 35.65 | | | 22.21 |
2013 | First Quarter | | $ | 46.53 | | $ | 29.16 |
| Second Quarter | | | 50.22 | | | 30.75 |
| Third Quarter | | | 55.69 | | | 44.87 |
| Fourth Quarter | | | 92.93 | | | 49.46 |
| | | | | | | |
Year | Period | | High | | Low |
2015 | Q1 | | $ | 33.97 | | $ | 26.29 |
| Q2 | | | 32.88 | | | 19.43 |
| Q3 | | | 19.68 | | | 10.85 |
| Q4 | | | 13.93 | | | 8.44 |
2016 | Q1 | | $ | 15.90 | | $ | 6.00 |
| Q2 | | | 19.76 | | | 11.59 |
| Q3 | | | 18.23 | | | 11.98 |
| Q4 | | | 18.51 | | | 12.34 |
As of February 19, 2014,22, 2017, our outstanding common stock was held by approximately 633955 stockholders of record. This figure does not reflect the beneficial ownership of shares held in the nominee name.
Dividends
We do not currently pay, and have not paid, any dividends on our common stock, and we currently intend to retain any future earnings for use in our business. Any future determination as to the declaration of dividends on our common stock will be made at the discretion of the Board of Directors and will depend on our earnings, operating and financial condition, capital requirements and other factors deemed relevant by the Board of Directors, including the applicable requirements of the Delaware General Corporation Law, which provides that dividends are payable only out of surplus or current net profits.
Thepayment of dividends on our common stock may be restricted by the provisions of credit agreements or other financing documents that we may enter into or the terms of securities that we may issue from time to time. Currently, no such agreements or documents limit our declaration of dividends or payments of dividends.dividends, other than our $150 million five-year revolving, unsecured credit facility with PNC Bank, National Association, which limits the amount of cash dividends that we may pay in any one fiscal year to $30.0 million.
Issuance of Unregistered Securities and Issuer Purchases of Equity Securities
On November 21, 2011, we issued $152 million aggregate principal amount of 5.50% Senior Convertible Notes due 2016 to institutional accredited investors and qualified institutional buyers in a transaction exempt from registration under Section 4(2) of the Securities Act of 1933, as amended. During 2013, note holders converted $80.8 million aggregate principal amount of 5.50% Senior Convertible Notes, which converted into 5.5 million shares of common stock. During 2012, note holders converted $61.0 million aggregate principal amount of 5.50% Senior Convertible Notes, which converted into 2.8 million shares of common stock. As of December 31, 2013, the aggregate principal amount of notes outstanding was $12.5 million. See Note 11 to the Consolidated Financial Statements.
We did not repurchase any of our equity securities during the year ended 2013,2016, except for unvested restricted stock awards repurchased or forfeited pursuant to our 2004 and 2015 Incentive Stock Plan. See Note 14 to the Consolidated Financial Statements.Plans. For information regarding the securities authorized for issuance under our equity compensation plans, see “Security Ownership of Certain Beneficial Owners and Management and Related Stockholder Matters – Equity Compensation Plans” under Part III, Item 12.12 of this Form 10-K. Also see Note 14 to the Consolidated Financial Statements.
Issuer purchases of equity securities
| | | | | | | | | |
| Total number of shares (or units) purchased | | | Average price paid per share (or unit) | | Total number of shares (or units) purchased as part of publicly announced plans or programs | | | Maximum number (or approximate dollar value) of shares (or units) that may yet be purchased under the plans or programs |
January 1, 2016 - January 31, 2016 | — | | $ | — | | — | | $ | — |
February 1, 2016 - February 29, 2016 | 36,787 | | | 9.13 | | — | | | — |
March 1, 2016 - March 31, 2016 | 17,623 | | | 15.12 | | — | | | — |
April 1, 2016 - April 30, 2016 | — | | | — | | — | | | — |
May 1, 2016 - May 31, 2016 | 8,139 | | | 12.31 | | — | | | — |
June 1, 2016 - June 30, 2016 | 25,056 | | | 12.92 | | — | | | — |
July 1, 2016 - July 31, 2016 | 6,777 | | | 13.30 | | — | | | — |
August 1, 2016 - August 31, 2016 | 2,016 | | | 16.06 | | — | | | — |
September 1, 2016 - September 30, 2016 | 4,114 | | | 15.75 | | — | | | — |
October 1, 2016 - October 31, 2016 | — | | | — | | — | | | — |
November 1, 2016 - November 30, 2016 | 93,306 | | | 14.28 | | — | | | — |
December 1, 2016 - December 31, 2016 | — | | | — | | — | | | — |
Total | 193,818 | (a) | $ | 13.61 | (b) | — | | $ | — |
| (a) | | Reflects shares of common stock surrendered to the Company for payment of tax withholding obligations in connection with the vesting of restricted stock. |
| (b) | | The average price paid reflects the average market value of shares withheld for tax purposes. |
Stock Performance Graph
The graph below shows, for the five years ended December 31, 2013,2016, the cumulative total return on an investment of $100 assumed to have been made on December 31, 20082011 in our common stock. For purposes of the graph, cumulative total return assumes the reinvestment of all dividends. The graph compares such return with those of comparable investments assumed to have been made on the same date in (a) the NYSE Composite Index, (b) the S&P 500 Information Technology Index and (c) the S&P Mid-Cap 400 Index, which are published market indices with which we are sometimes compared.
Although total return for the assumed investment assumes the reinvestment of all dividends on December 31 of the year in which such dividends were paid, we paid no cash dividends on our common stock during the periods presented.
Our common stock is listed on the NYSE (trading symbol: DDD).
COMPARISON OF 5-YEAR CUMULATIVE TOTAL RETURN*
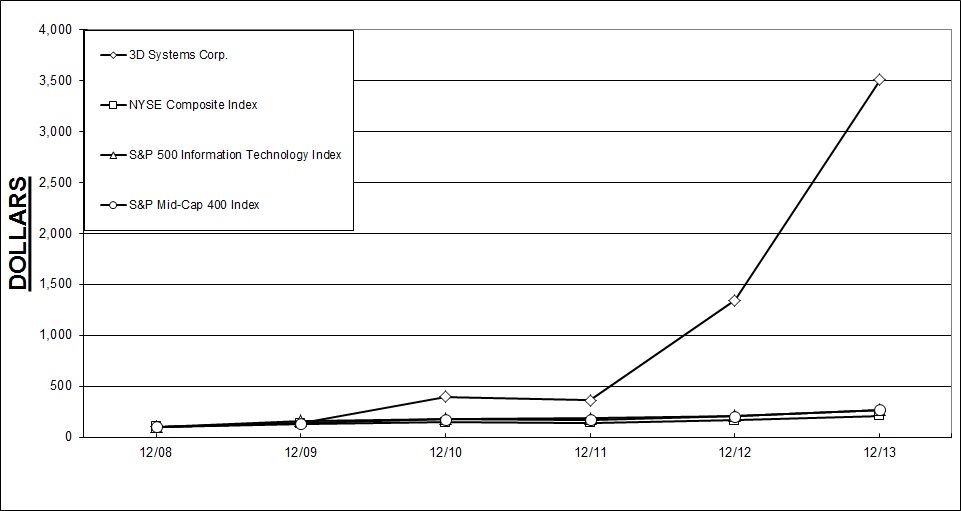
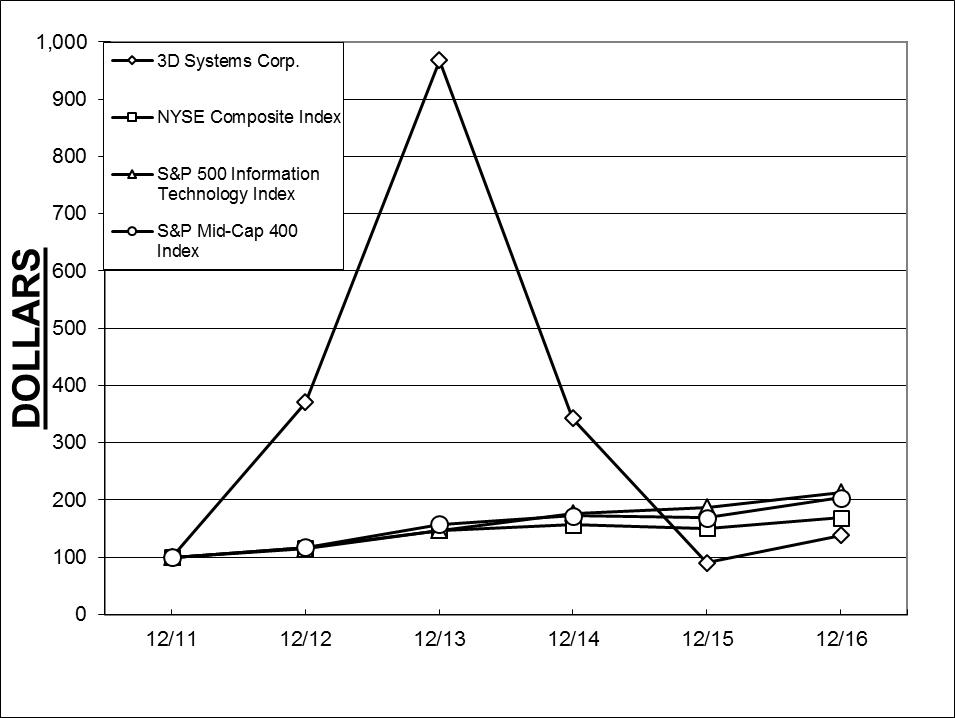
* $100 invested on 12/31/08 in stock or index, including reinvestment of dividends. Fiscal yearyears ending December 31.
| | | | | |
| | 12/08 | 12/09 | 12/10 | 12/11 | 12/12 | 12/13 | | 12/11 | 12/12 | 12/13 | 12/14 | 12/15 | 12/16 |
3D Systems Corporation | | $ 100 | $ 142 | $ 396 | $ 362 | $ 1,342 | $ 3,507 | | $ 100 | $ 371 | $ 968 | $ 342 | $ 91 | $ 138 |
NYSE Composite Index | | 100 | 129 | 147 | 141 | 164 | 208 | | 100 | 116 | 147 | 157 | 151 | 169 |
S&P 500 Information Technology Index | | 100 | 162 | 178 | 183 | 210 | 269 | | 100 | 115 | 147 | 177 | 188 | 214 |
S&P 500 Mid-Cap 400 Index | | 100 | 137 | 174 | 171 | 202 | 269 | | 100 | 118 | 157 | 173 | 169 | 204 |
Item 6. Selected Financial Data
The selected consolidated financial data set forth below for the five years ended December 31, 20132016 have been derived from our historical Consolidated Financial Statements. You should read this information together with Management’s Discussion and Analysis of Financial Condition and Results of Operations, the notes to the selected consolidated financial data and our Consolidated Financial Statements and the notes thereto for December 31, 2013 and prior years included in this Form 10-K.
| | | | | | | | | | | | | | | | | | | | | | | | | | | | | | | | | | | | | | |
| | Year ended December 31, | | Year ended December 31, |
(in thousands, except per share amounts) | | 2013 | | 2012 | | 2011 | | 2010 | | 2009 | | 2016 | | 2015 | | 2014 | | 2013 | | 2012 |
Consolidated Statement of Operations and Other Comprehensive Income Data: | | | | | | | | | | | | | | | | | | | | |
Consolidated Statement of Income (Loss) and Other Comprehensive Income (Loss) Data: | | | | | | | | | | | | | | | | | | | | |
Consolidated Revenue: | | | | | | | | | | | | | | | | | | | | | | | | | | | | | | | | | | | | | | |
Printers and other products | | $ | 227,627 | | | $ | 126,798 | | | $ | 66,665 | | | $ | 54,686 | | | $ | 30,501 | |
Products | | | $ | 223,544 | | | $ | 257,379 | | | $ | 283,339 | | | $ | 227,627 | | | $ | 126,798 |
Materials | | | 128,405 | | | | 103,182 | | | | 70,641 | | | | 58,431 | | | | 50,297 | | | 156,839 | | | | 150,740 | | | | 158,859 | | | | 128,405 | | | | 103,182 |
Services | | | 157,368 | | | | 123,653 | | | | 93,117 | | | | 46,751 | | | | 32,037 | | | 252,582 | | | | 258,044 | | | | 211,454 | | | | 157,368 | | | | 123,653 |
Total | | | 513,400 | | | | 353,633 | | | | 230,423 | | | | 159,868 | | | | 112,835 | | | 632,965 | | | | 666,163 | | | | 653,652 | | | | 513,400 | | | | 353,633 |
Gross Profit | | | 267,594 | | | | 181,196 | | | | 109,028 | | | | 73,976 | | | | 49,730 | |
Income from operations | | | 80,861 | | | | 60,571 | | | | 34,902 | | | | 20,920 | | | | 3,073 | |
Net income (a) | | | 44,119 | | | | 38,941 | | | | 35,420 | | | | 19,566 | | | | 1,139 | |
Net income available to common stockholders | | | 44,107 | | | | 38,941 | | | | 35,420 | | | | 19,566 | | | | 1,066 | |
Net income available to common stockholders per share: | | | | | | | | | | | | | | | | | | | | |
Gross profit | | | | 309,751 | | | | 291,809 | | | | 317,434 | | | | 267,594 | | | | 181,196 |
Impairment of goodwill and other intangible assets (a) | | | | — | | | | 537,179 | | | | — | | | | — | | | | — |
Income (loss) from operations | | | | (38,420) | | | | (641,924) | | | | 26,315 | | | | 80,861 | | | | 60,571 |
Net income (loss) | | | | (39,265) | | | | (663,925) | | | | 11,946 | | | | 44,119 | | | | 38,941 |
Net income (loss) available to common stockholders | | | | (38,419) | | | | (655,492) | | | | 11,637 | | | | 44,107 | | | | 38,941 |
Net income (loss) available to common stockholders per share: | | | | | | | | | | | | | | | | | | | | |
Basic and diluted | | $ | 0.45 | | | $ | 0.48 | | | $ | 0.47 | | | $ | 0.28 | | | $ | 0.01 | | $ | (0.35) | | | $ | (5.85) | | | $ | 0.11 | | | $ | 0.45 | | | $ | 0.48 |
| | | | | | | | | | | | | | | | | | | | | | | | | | | | | | | | | | | | | | |
Consolidated Balance Sheet Data: | | | | | | | | | | | | | | | | | | | | | | | | | | | | | | | | | | | | | | |
Working capital | | $ | 416,399 | | | $ | 212,285 | | | $ | 202,357 | | | $ | 42,475 | | | $ | 36,718 | | $ | 302,545 | | | $ | 286,996 | | | $ | 432,864 | | | $ | 416,399 | | | $ | 212,285 |
Total assets | | | 1,097,856 | | | | 677,442 | | | | 462,974 | | | | 208,800 | | | | 150,403 | | | 849,153 | | | | 891,959 | | | | 1,530,310 | | | | 1,097,856 | | | | 677,442 |
Current portion of long-term debt and capitalized lease obligations | | | 187 | | | | 174 | | | | 163 | | | | 224 | | | | 213 | |
Long-term debt and capitalized lease obligations, less current portion | | | 18,693 | | | | 87,974 | | | | 138,716 | | | | 8,055 | | | | 8,254 | |
Current portion of debt and capitalized lease obligations | | | | 572 | | | | 529 | | | | 684 | | | | 187 | | | | 174 |
Long term debt and capitalized lease obligations, less current portion | | | | 7,587 | | | | 8,187 | | | | 8,905 | | | | 18,693 | | | | 87,974 |
Total stockholders' equity | | | 933,792 | | | | 480,333 | | | | 254,788 | | | | 133,119 | | | | 104,697 | | | 626,700 | | | | 654,646 | | | | 1,294,125 | | | | 933,792 | | | | 480,333 |
| | | | | | | | | | | | | | | | | | | | | | | | | | | | | | | | | | | | | | |
Other Data: | | | | | | | | | | | | | | | | | | | | | | | | | | | | | | | | | | | | | | |
Depreciation and amortization | | $ | 30,444 | | | $ | 21,229 | | | $ | 11,093 | | | $ | 7,520 | | | $ | 5,886 | | $ | 60,535 | | | $ | 83,069 | | | $ | 55,188 | | | $ | 30,444 | | | $ | 21,229 |
Interest expense | | | 3,425 | | | | 12,468 | | | | 2,090 | | | | 587 | | | | 618 | | | 1,282 | | | | 2,011 | | | | 1,227 | | | | 3,425 | | | | 12,468 |
Capital expenditures (b) | | | 6,972 | | | | 3,224 | | | | 2,870 | | | | 1,283 | | | | 974 | |
| | | | | | | | | | | | | | | | | | | | |
Capital expenditures | | | | 16,567 | | | | 22,399 | | | | 22,727 | | | | 6,972 | | | | 3,224 |
| (a) | | In 2013, 2012For further discussion of goodwill and 2011, based upon our recent results of operationsother intangible assets impairment charges recorded in 2015, see Notes 2, 6 and expectation of continued profitability in future years, we concluded that it is more likely than not that our net U.S. deferred tax assets will be realized. In accordance with ASC 740, in 2012 and 2011 we released valuation allowances associated with U.S. deferred tax assets resulting in non-cash income tax benefits of $5,372 and $6,221, respectively.7 to the Consolidated Financial Statements.
|
| (b)
| | Excludes capital lease additions.
|
Item 7. Management’s Discussion and Analysis of Financial Condition and Results of Operations
The following discussion and analysis should be read together with the selected consolidated financial data and our Consolidated Financial Statements and notes thereto set forth in this Form 10-K. Certain statements contained in this discussion may constitute forward‑looking statements within the meaning of the Private Securities Litigation Reform Act of 1995. These statements involve a number of risks, uncertainties and other factors that could cause actual results to differ materially from those reflected in any forward-looking statements, as discussed more fully in this Form 10-K. See “Forward-Looking Statements” and “Cautionary Statements and Risk“Risk Factors” in Part I, Item 1A.
The forward-looking information set forth in this Form 10-K is provided as of the date of this filing,Overview and except as required by law, we undertake no duty to update that information.Strategy
Overview
We are a leading global provider ofprovide comprehensive 3D printing centric design-to-manufacturing solutions, including 3D printers, print materials, on-demand manufacturing services, software and on-demand custom parts for professionalsdigital design and consumers alike. Our materials include plastics, metals, ceramics and edibles. We also provide integrated 3D scan-based design, freeform modeling and inspectionmanufacturing tools. Our productsprecision healthcare capabilities include simulation, VSPTM, and services replaceprinting of medical and complement traditional methodsdental devices, implants and reduce the timesurgical guides and costinstruments. Our ecosystem supports advanced applications from product design to 3D production in a wide range of designing new products by printing real parts directly from digital input. These solutions are used to rapidly design, create, communicate, prototype or produce real parts, empoweringindustries. We enable customers to manufacture the future.
Growth strategy optimize product designs, transform workflows, bring innovative products to market and drive new business models.
We are pursuing a growth strategy that focuses on five strategic initiatives:offering a comprehensive ecosystem that provides solutions aimed at healthcare, aerospace, automotive and durable goods verticals to address professional and industrial applications. We believe we are at an inflection point for 3D printing and a shift from prototyping to production is underway. We are focused on innovation to drive expansion into 3D production through improving durability, reliability, repeatability and total cost of operation of 3D printing solutions.
| ·Expand global Quickparts services;
|
| ·Accelerate 3D printer penetration;
|
| ·Grow healthcare solutions revenue;
|
| ·Build 3D consumer and retail products and services; and
|
| ·Reimagine the engineer’s desktop.
|
We have launched new 3D printers with increased speeds and capabilities as well as introduced print materials with improved strength, temperature, durability and elasticity, developments that we believe are workingwell suited for advanced and demanding applications. We have also expanded and strengthened our software portfolio to accomplishhelp enhance our customers’ workflows from digitize to design to simulate to manufacture, inspect and manage. We plan to continue to invest in development of hardware, software, materials and comprehensive solutions in plastics and metals to address significant opportunities with a use case by use case approach, focusing on solving specific customer applications and needs within healthcare, aerospace, automotive and durable goods vertical markets.
To execute this strategy, we are focusing on an operating framework with a regional go-to-market model that drives growth initiatives organicallywhile balancing investments to support process improvement, infrastructure enhancement and as opportunities arise, through selective acquisitions, including those we have already completed.operational excellence. We expect to be able to support organic growth by prioritizing and focusing our resources and leveraging our comprehensive toolkit of solutions in order to sell more productstechnology, domain expertise and services to our existingstrong customer base.and partner relationships. As with any growth strategy, there can be no assurance that we will succeed in accomplishing our strategic initiatives.
Expand Quickparts Services. AsRecent Developments
On January 31, 2017, we announced the acquisition of Vertex-Global Holding B.V., a supplementprovider of dental materials worldwide under the Vertex and NextDent brands. Vertex Dental and NextDent are manufacturers of photopolymer, thermoplastic, polymer and monomer materials for traditional and 3D printing dental applications. NextDent has developed 12 dental 3D printing materials to date and has obtained regulatory approval for use of these materials in more than 70 countries worldwide. NextDent’s portfolio of 3D printing materials allow dental professionals to produce trays, models, drilling templates, dentures, orthodontic splints, crowns and bridges with enhanced speed, precision and efficiency and lower cost compared to conventional procedures. We believe together, our Figure 4 platform and NextDent’s advanced 3D printerprinting materials provide a strategic foothold in the multi-billion-dollar digital dentistry opportunity and will deliver materials innovation, regulatory compliance, manufacturing efficiency and vertical solutions we believe growingexpertise to advance our solutions across healthcare and expanding our Quickparts services, through organic growth and acquisitions, enables us to impart the latest technology to our customers months or years in advance of their ability to invest in new printers for their own use. We view this as an opportunity to introduce customers to the newest 3D additive production technologies and to build brand experience and customer loyalty. We also view it as a significant cross-selling and upselling opportunity from single parts all the way to advanced manufacturing printers. In connection with this initiative, we launched our Quickparts services in October 2009. Quickparts services generated revenue of $101.1 million and $79.2 million for the years ended 2013 and 2012, respectively.other verticals.
2016 Summary
Accelerate 3D Printer Penetration. We believe that accelerating 3D printer penetration through channel expansion, new products and enhanced 3D printing materials will provide a growing installed base to enable higher revenue from recurring sales of print materials and services. With this objective in mind, we have developed an extensive portfolio of 3D printers. We are continuing to expand our reseller channel for our printers and to train our resellers to perform installation and services for those printers. In 2013, revenue from the sale of printers was $207.1 million, or 40.3% of our total revenue, compared to $121.2 million or 34.3% of revenue, in 2012.
Grow Healthcare Solutions Revenue. We believe that, by leveraging our rapid manufacturing core competencies in healthcare solutions applications and expanding into new applications, we can grow revenue within this marketplace. Healthcare solutions revenue includes the related sales of printers, print materials and services for hearing aid, dental, medical device and other health-related applications. In 2013, healthcare revenue was $71.7 million, or 14.0% of our total revenue, compared to $49.3 million or 14.0% of revenue, in 2012.
Build 3D Consumer and Retail Products and Services. We believe that the affordability of our consumer printers makes 3D consumer content critical to accelerated adoption. Recognizing the opportunity to deliver 3D content to an expanded audience, we have begun work to identify the tools and services required to deliver 3D content to consumers. We believe that the creation and expansion of a consumer ecosystem, including content, products and services, could make affordable 3D printers more widely adopted and used. We expect to build this capability through a combination of internal developments and acquisitions. In 2013, consumer solutions revenue was $34.8 million, or 6.8% of our total revenue, compared to $11.4 million or 3.2% of revenue, in 2012.
Reimagine the Engineer’s Desktop.We believe that by providing an integrated 3D authoring solutions platform, including software, perceptual devices and tools to combine, capture, mesh, surface, model and measure, we will be able to continue to expand the applications and utilization of 3D printing, enabling seamless integration throughout the design and manufacturing processes. During 2013, we continued to build this platform through a combination of internal developments and acquisitions. In 2013, software revenue was $20.6 million, or 4.0% of our total revenue, compared to $4.6 million or 1.3% of revenue, in 2012.
We intend to accomplish growth in all areas of our growth strategy organically and, as opportunities present themselves, through selective acquisitions. As with any growth strategy, there can be no assurance that we will succeed in accomplishing our strategic initiatives.
Summary of 2013 Financial Results
As discussed in greater detail below,Total consolidated revenue for the year ended 2013 increasedDecember 31, 2016 decreased by 5.0%, or $33.2 million, to $633.0 million, compared to $666.2 million for the year ended December 31, 2015. These results primarily due to higherreflect an increase in materials revenue that was more than offset by a decrease in products revenue, including the exit of consumer products, and a decrease in services revenue, as further discussed below.
Healthcare revenue includes sales across all revenue categories. Ourof products, materials and services for healthcare-related applications, including simulation, training and planning, 3D printing of surgical guides and instruments and medical and dental devices. For the year ended December 31, 2016, healthcare revenue increased by 45.2%5.0%, or $7.0 million, to $513.4$148.1 million, in 2013,and made up 23.4% of total revenue, compared to $353.6$141.1 million, in 2012 and $230.4 million in 2011. These results reflected growth in demand for 3D printers and increased demand in several key industries we serve, increased print material sales from a growing installed base, increased software revenue and higher service revenue from Quickparts.
We calculate organic growth by comparing last year’sor 21.2% of total revenue, to this year’s total revenue, excluding the revenue of all acquired businesses that we have owned for less than twelve months. Once we have owned a business for one year, the revenue is included in organic revenue and organic growth is calculated based on our prior year total revenue. In 2013, our organic growth was 34.3% for the fourth quarteryear ended December 31, 2015. The increase in healthcare revenue reflects customers expanding their capabilities and 29.4% for the full year. In 2012, our organic growth was 18.8% for the fourth quartercapacity as well as timing of orders, including large orders from certain customer, which resulted in increased sales of products and 22.4% for the full year.services and lower materials sales.
For the year ended 2013, healthcare solutionsDecember 31, 2016, total software revenue grew 45.3% and accounted for $71.7 million, or 14.0%, of our total revenue and included sales of printers, print materials and services for hearing aid, dental, medical device and other health-related applications, compared to $49.3 million, or 14.0%, in 2012.
Consumer solutions revenue includes sales of Cube® and Cube X® consumer 3D printers and their related print materials and otherfrom products and services provided through Cubify.comincreased by 12.3%, to $87.7 million, and other retail channels. For the fourth quartermade up 13.9% of 2013, consumer solutions revenue was $8.9 million, or 5.8% of our total revenue, compared to $3.4$78.1 million, or 3.3%11.7% of revenue, in the fourth quarter of 2012. For the year ended 2013, consumer solutions revenue was $34.8 million, or 6.8% of our total revenue compared to $11.4 million or 3.2% of revenue, in 2012.
Our gross profit for the year ended 2013 increased by 47.7%, to $267.6 million, from $181.2 million in 2012, after increasing from $109.0 million in 2011. Our higher gross profit for the year ended 2013 arose primarily from an increase in sales and our increased gross profit margin printers and other products and materials. Our gross profit margin percentage improved to 52.1% in 2013 from 51.2% in 2012 and 47.3% in 2011. Gross profit margin benefited from improvements in our cost structure, higher print materials gross profit margin, and the addition of software products, partially offset by increased sales of lower margin on-demand custom parts services and an adverse revenue mix. December 31, 2015.
Our total operating expenses for the year ended 2013 increased by 54.8%, to $186.7 million, from $120.6 million in 2012, reflecting a $45.8 million, or 47.0%, increase in SG&A expenses, primarily due to increased sales and marketing expenses and higher staffing due to our expanding portfolio. The increase also reflected a $20.3 million, or 87.4%, increase in research and development expenses related to our portfolio expansion and diversification and concentrated and accelerated new products developments.
Our operating income improved by $20.3 million to $80.9 million in 2013, compared to operating incomeAs of $60.6 million in 2012 and $34.9 million in 2011. This was primarily due to higher revenue and the increase in our gross profit noted above, partially offset by higher operating expenses.
Our net income for 2013 included $51.4 million of non-cash expenses, which primarily consisted of depreciation and amortization, loss on conversion of convertible debt, stock-based compensation and non-cash interest expense, compared to $38.9 million of non-cash expenses in 2012, which primarily consisted of depreciation and amortization, deferred tax benefits and stock-based compensation. The increase in non-cash expenses is primarily due to increased amortization from acquired intangibles, the loss on conversion of convertible debt as well as an increase in stock-based compensation.
A number of actions or events occurred in 2013 that affected our liquidity and our balance sheet including the following:
| ·
| | Our unrestricted cash and cash equivalents increased by $150.4 million to $306.3 million at December 31, 2013 from $155.9 million at December 31, 2012. Our cash included $272.1 million of net proceeds from the issuance of common stock, partially offset by $162.3 million of cash paid for acquisitions. Cash at December 31, 2012 included $183.7 million of cash paid for acquisitions, partially offset by $106.9 million of net proceeds from a public equity offering carried out in June 2012 and $51.5 million of net cash from operations. See “Liquidity and Capital Resources” below.
|
| ·
| | During 2013, we used $162.3 million of cash to acquire eleven businesses, including deferred purchase payments from prior acquisitions, to augment our printers business, Quickparts services and consumer solutions initiative. See “Liquidity and Capital Resources –Cash Flow-Cash flow from investing activities.”
|
| ·
| | Our working capital increased by $204.1 million from $212.3 million at December 31, 2012 to $416.4 million at December 31, 2013. See “Liquidity and Capital Resources – Working capital” below.
|
| ·
| | Among major components of working capital, accounts receivable, net of allowances, increased by $52.3 million from December 31, 2012 to December 31, 2013, primarily reflecting higher revenue from an increased portion of revenue categories sold on credit terms. Inventory at December 31, 2013, net of reserves, was $33.3 million higher than its December 31, 2012 level, primarily reflecting timing of orders and delivery of finished goods print materials and raw materials, which are ordered in large quantities. Accounts payable increased by $19.6 million primarily reflecting timing of orders and payments to vendors associated with inventory and printer assembly.
|
Results of Operations for 2013, 2012 and 2011
Table 1 below sets forth revenue and percentage of revenue by class of product and service.
Table 1
| | | | | | | | | | | | | | | | | | |
(Dollars in thousands) | | 2013 | | 2012 | | 2011 |
Printers and other products | | $ | 227,627 | | 44.3 | % | | $ | 126,798 | | 35.8 | % | | $ | 66,665 | | 28.9 | % |
Materials | | | 128,405 | | 25.0 | | | | 103,182 | | 29.2 | | | | 70,641 | | 30.7 | |
Services | | | 157,368 | | 30.7 | | | | 123,653 | | 35.0 | | | | 93,117 | | 40.4 | |
Totals | | $ | 513,400 | | 100.0 | % | | $ | 353,633 | | 100.0 | % | | $ | 230,423 | | 100.0 | % |
Consolidated revenue
Consolidated revenue increased in 2013 due primarily to a 233.7% increase in printer unit sales over 2012 coupled with increased sales of print materials and increased software and Quickparts revenue, from both acquired and organic growth. These changes are explained in greater detail in the Revenue by class of product and service and Revenue by geographic region sections below.
At December 31, 20132016 and 2015, our backlog was approximately $28.6$31.7 million compared to $11.4and $38.4 million, at December 31, 2012 and $8.3 million at December 31, 2011.respectively. Production and delivery of our printers is generally not characterized by long lead times,times; backlog is more dependent on timing of customers’ requested delivery.deliveries. In addition, Quickpartson-demand parts services lead time and backlog depends on whether orders are for rapid prototyping or longer-range production runs. TheAs of December 31, 20132016 and 2015, backlog included a portion from each of our revenue categories, but primarily consisted of $17.2$9.2 million and $13.0 million of printer sales drivenon-demand manufacturing services orders, respectively.
Gross profit for the year ended December 31, 2016 increased by demand6.1%, or $17.9 million, to $309.8 million, compared to $291.8 million for advanced manufacturing. Thethe year ended December 2012 backlog31, 2015. Gross profit margin for the years ended December 31, 2016 and 2015 was well distributed48.9%, and 43.8%, respectively. Our shift away from lower margin consumer products combined with a portion from each of ourcost reduction efforts drove higher gross profit and margin, notwithstanding lower revenue categories, including printer sales of $3.2 million. Thein 2016.
Operating expenses for the year ended December 2011 backlog included orders31, 2016 decreased by 62.7%, or $585.6 million, to $348.2 million, compared to $933.7 million for production printersthe year ended December 31, 2015. Excluding goodwill and other intangible asset impairment charges that amountedwere recorded during 2015, operating expenses for the year ended December 31, 2016 decreased 12.2% compared to $1.0the year ended December 31, 2015, due to lower selling, general and administrative expense and lower research and development expense, as further discussed below.
Our operating loss for the years ended December 31, 2016 and 2015 was $38.4 million and three orders for print materials$641.9 million, respectively.Excluding goodwill and other intangible asset impairment charges that amounted to $1.2 million. The backlogwere recorded in 2015, our operating loss improved 63.3%, as further discussed below.
For the years ended December 31, 2016 and 2015, we generated $56.9 million and used $3.1 million, respectively, of cash in operations, as further discussed below. In total, our unrestricted cash balance at December 31, 2013 includes $8.42016 and 2015, was $184.9 million of Quickparts orders, compared to $5.9and $155.6 million, at December 31, 2012 and $4.8 million at December 31, 2011.
Revenue by class of product and servicerespectively.
2013 compared to 2012Results of Operations for 2016, 2015 and 2014
Table 2 sets forth the change inComparison of revenue by class of product and service for 2013 compared to 2012.
Table 2
| | | | | | | | | | | | | | | | | | | | | | | | |
(Dollars in thousands) | | Printers and Other Products | | Print Materials | | Services | | Total |
2012 Revenue | | $ | 126,798 | | 35.8 | % | | $ | 103,182 | | 29.2 | % | | $ | 123,653 | | 35.0 | % | | $ | 353,633 | | 100.0 | % |
Change in revenue: | | | | | | | | | | | | | | | | | | | | | | | | |
Volume | | | | | | | | | | | | | | | | | | | | | | | | |
Core products and services | | | 409,370 | | 322.9 | | | | 38,839 | | 37.6 | | | | 27,976 | | 22.6 | | | | 476,185 | | 134.7 | |
New products and services | | | 89,574 | | 70.6 | | | | 4,546 | | 4.4 | | | | 5,430 | | 4.4 | | | | 99,550 | | 28.2 | |
Price/Mix | | | (397,719) | | (313.7) | | | | (16,793) | | (16.3) | | | | — | | — | | | | (414,512) | | (117.2) | |
Foreign currency translation | | | (396) | | (0.3) | | | | (1,369) | | (1.3) | | | | 309 | | 0.2 | | | | (1,456) | | (0.5) | |
Net change | | | 100,829 | | 79.5 | | | | 25,223 | | 24.4 | | | | 33,715 | | 27.2 | | | | 159,767 | | 45.2 | |
2013 Revenue | | $ | 227,627 | | 44.3 | % | | $ | 128,405 | | 25.0 | % | | $ | 157,368 | | 30.7 | % | | $ | 513,400 | | 100.0 | % |
We earn revenues from the sale of printers and other products, print materials and services. On a consolidated basis, revenue for the year ended 2013 increased by $159.8 million, or 45.2%, compared to 2012, primarily due to increased sales ofThe products category includes 3D printers, coupled with acquiredhealthcare simulators and digitizers, as well as software, revenue.
The $100.8 million increase in revenue from printers and other products compared to the year ended 2012 is primarily due to increased printer unit sales volume for the year ended 2013, driven by increased demand for consumer and professional printers. Printers revenue increased $80.8 million, or 72.7%, compared to 2012. As we have introduced new printers and price points, the professional and production printer capabilities have converged. Revenue from professional printers, including production printers, increased 59.7% and consumer printers revenue increased 238.4% over 2012. In connection with the rapid expansion of our professional and retail channels, certain resellers may purchase stock inventory in the ordinary course of business. For the years ended 2013 and 2012, we estimate that revenue related to reseller inventory amounted to approximately 2.0% of total revenue. These transactions were reviewed for revenue recognition criteria and these sales met all the requirements of our revenue recognition policy.
Other products revenue includes software products, Sensable haptic devices, 3D scanners and Vidar digitizers. Other products revenue totaled $36.0 millionhaptic devices. The materials category includes a wide range of revenue forprint materials to be used with our 3D printers, the year ended 2013, including $20.6 millionmajority of which are proprietary. The services category includes warranty and maintenance on 3D printers and simulators, software products revenue. For the year ended 2012, other products revenue totaled $15.7 million, including $4.6 million of software revenue.maintenance, on demand solutions and healthcare services.
Due to the relatively high price of certain professional3D printers and a corresponding lengthy selling cycle and relatively low unit volume of the higher priced professional printer salesprinters in any particular period, a shift in the timing and concentration of orders and shipments of a few printers from one period to another can significantly affect reported revenue in any given period. Revenue reported for printers sales in any particular period is also affected by timing of revenue recognition under rules prescribed by U.S. generally accepted accounting principles. The increase in printer revenue is consistent with our ongoing plan to accelerate printer adoption in the marketplace by introducing lower priced printers, expanded capabilities and increased printing speeds.principles (“GAAP”).
The $25.2 million increase in revenue from print materials was aided by the improvement in printers sales and by the continued expansion of printers installed over past periods. Sales of integrated materials increased 40.2% and represented 70.6% of total materials revenue for the year ended 2013, compared to 62.6% for 2012.
The increase in service revenue primarily reflects revenue from our Quickparts solutions, coupled with the addition of software maintenance revenue. Service revenue from Quickparts services was $101.1 million, or 64.2% of total service revenue, for the year ended 2013, compared to $79.2 million, or 64.1% of total service revenue for 2012. Services revenue from software maintenance services added $8.2 million of revenue for the year ended 2013. For the fourth quarter of 2013, revenue from Quickparts services was $28.4 million, or 18.4% of total fourth quarter revenue compared to $21.0 million, or 20.6% of total 2012 fourth quarter revenue.
In addition to changes in sales volumes, including the impact of revenue from acquisitions, there are two other primary drivers of changes in revenue from one period to another: (1) the combined effect of changes in product mix and average selling prices, sometimes referred to as price and mix effects, and (2) the impact of fluctuations in foreign currencies.
As used in this Management’s Discussion and Analysis, the price and mix effects relate to changes in revenue that are not able to be specifically related to changes in unit volume. Among these changes are changes
2016 compared to 2015
Table 1 sets forth the change in revenue by class for the years ended December 31, 2016 and 2015.
Table 1
| | | | | | | | | | | | | | | | | | | | | | | | |
| | | | | | | | | | | | | | | | | | | | | | | | |
(Dollars in thousands) | | Products | | Materials | | Services | | Totals |
Revenue – 2015 | | $ | 257,379 | | 38.6 | % | | $ | 150,740 | | 22.6 | % | | $ | 258,044 | | 38.8 | % | | $ | 666,163 | | 100 | % |
Change in revenue: | | | | | | | | | | | | | | | | | | | | | | | | |
Volume | | | (19,336) | | (7.5) | | | | 21,685 | | 14.4 | | | | (3,622) | | (1.4) | | | | (1,273) | | (0.2) | |
Price/Mix | | | (13,786) | | (5.4) | | | | (15,125) | | (10.0) | | | | — | | — | | | | (28,911) | | (4.3) | |
Foreign currency translation | | | (713) | | (0.3) | | | | (461) | | (0.3) | | | | (1,840) | | (0.7) | | | | (3,014) | | (0.5) | |
Net change | | | (33,835) | | (13.2) | | | | 6,099 | | 4.1 | | | | (5,462) | | (2.1) | | | | (33,198) | | (5.0) | |
Revenue – 2016 | | $ | 223,544 | | 35.3 | % | | $ | 156,839 | | 24.8 | % | | $ | 252,582 | | 39.9 | % | | $ | 632,965 | | 100 | % |
Total consolidated revenue decreased by 5.0%, primarily driven by lower sales of 3D printers and on-demand parts services, partially offset by higher materials revenue and software revenue.
The discontinuation of consumer products coupled with lower sales of professional printers offset higher sales of production printers, resulting in overall lower revenue from 3D printers. For the year ended December 31, 2016, software revenue included in the product mixproducts category, including scanners and haptic devices, contributed $44.5 million, compared to $44.3 million for the year ended December 31, 2015.
The increase in materials revenue for the year ended December 31, 2016 primarily reflects increased demand for materials driven by industrial customers with production printers. For the year ended December 31, 2016, sales of integrated materials increased by 4.1% to $120.9 million and represented 77.1% of total materials revenue for the years ended December 31, 2016 and 2015.
The decrease in services revenue for the year ended December 31, 2016 was primarily driven by a decrease in on-demand parts manufacturing services which more than offset the growth in healthcare and software services revenue. For the year ended December 31, 2016, services revenue from on-demand parts decreased 17.8%, to $104.8 million, compared to $127.4 for the year ended December 31, 2015. For the years ended December 31, 2016 and 2015, software revenue included in the services category contributed $43.2 million and $33.8 million, respectively.
2015 compared to 2014
Table 2 sets forth the change in revenue by class for the years ended December 31, 2015 and 2014.
Table 2
| | | | | | | | | | | | | | | | | | | | | | | | |
(Dollars in thousands) | | Products | | Materials | | Services | | Totals |
Revenue – 2014 | | $ | 283,339 | | 43.3 | % | | $ | 158,859 | | 24.3 | % | | $ | 211,454 | | 32.4 | % | | $ | 653,652 | | 100 | % |
Change in revenue: | | | | | | | | | | | | | | | | | | | | | | | | |
Volume | | | (5,674) | | (2.0) | | | | (11,691) | | (7.4) | | | | 63,967 | | 30.3 | | | | 46,602 | | 7.1 | |
Price/Mix | | | (1,744) | | (0.6) | | | | 13,495 | | 8.5 | | | | — | | — | | | | 11,751 | | 1.8 | |
Foreign currency translation | | | (18,542) | | (6.5) | | | | (9,923) | | (6.2) | | | | (17,377) | | (8.2) | | | | (45,842) | | (7.0) | |
Net change | | | (25,960) | | (9.1) | | | | (8,119) | | (5.1) | | | | 46,590 | | 22.1 | | | | 12,511 | | 1.9 | |
Revenue – 2015 | | $ | 257,379 | | 38.6 | % | | $ | 150,740 | | 22.6 | % | | $ | 258,044 | | 38.8 | % | | $ | 666,163 | | 100 | % |
Total consolidated revenue increased by 1.9%, primarily due to an increase in services revenue, partially offset by a decrease in products and materials volume and an unfavorable foreign currency impact.
The decrease in products revenue was primarily driven by lower sales of 3D printers coupled with an unfavorable foreign currency impact. For the year ended December 31, 2015, software revenue included in the products category, including scanners and haptic devices, contributed $44.3 million, compared to $20.1 million for the year ended December 31, 2014, primarily reflecting expanded software products from our acquisition of 100% of the outstanding shares and voting rights of Cimatron Ltd. (“Cimatron”) in 2015.
The decrease in materials and our printers as the trend toward smaller, lower-priced printers has continued and the influence of newrevenue was primarily driven by softness in demand for printers and timing of sales of materials. For the year ended December 31, 2015, sales of integrated materials on our operating results has grown.decreased by 0.2% to $116.2 million and represented 77.1% of total materials revenue, compared to 73.3% for the year ended December 31, 2014.
2012The increase in services revenue primarily reflects our expanded offerings of services. For the year ended December 31, 2015, services revenue from on-demand parts increased 4.1%, to $127.4 million, compared to 2011$122.4 for the year ended December 31, 2014. For the years ended December 31, 2015 and 2014, software revenue included in the services category contributed $33.8 million and $15.2 million, respectively, primarily reflecting expanded software products, including the acquisition of Cimatron in 2015.
Comparison of revenue by geographic region
2016 compared to 2015
Table 3 sets forth the change in revenue by class of productgeographic region for the years ended December 31, 2016 and service for 2012 compared to 2011.2015:
Table 3
| | | | | | | | | | | | | | | | | | | | | | | | | |
| | | | | | | | | | | | | | | | | | | | | | | | | | | | | | | | | | | | | | | | | | | | | |
(Dollars in thousands) | | Printers and Other Products | | Print Materials | | Services | | Total | | Americas | | EMEA | | Asia Pacific | | Total |
2011 Revenue | | $ | 66,665 | | 28.9 | % | | $ | 70,641 | | 30.7 | % | | $ | 93,117 | | 40.4 | % | | $ | 230,423 | | 100.0 | % | |
Revenue – 2015 | | | $ | 357,976 | | 53.7 | % | | $ | 200,104 | | 30.0 | % | | $ | 108,083 | | 16.3 | % | | $ | 666,163 | | 100 | % |
Change in revenue: | | | | | | | | | | | | | | | | | | | | | | | | | | | | | | | | | | | | | | | | | | | | | | | | |
Volume | | | | | | | | | | | | | | | | | | | | | | | | | | | 550 | | 0.2 | | | | (58) | | 0.0 | | | | (1,765) | | (1.6) | | | | (1,273) | | (0.2) | |
Core products and services | | | 145,224 | | 217.8 | | | | 6,084 | | 8.6 | | | | 32,010 | | 34.4 | | | | 183,318 | | 79.6 | | |
New products and services | | | 25,975 | | 39.0 | | | | 26,695 | | 37.8 | | | | 752 | | 0.8 | | | | 53,422 | | 23.2 | | |
Price/Mix | | | (109,109) | | (163.7) | | | | 1,766 | | 2.5 | | | | — | | — | | | | (107,343) | | (46.6) | | | | (16,619) | | (4.6) | | | | (4,066) | | (2.0) | | | | (8,226) | | (7.6) | | | | (28,911) | | (4.3) | |
Foreign currency translation | | | (1,957) | | (2.9) | | | | (2,004) | | (2.8) | | | | (2,226) | | (2.4) | | | | (6,187) | | (2.7) | | | | (1,022) | | (0.3) | | | | (2,839) | | (1.4) | | | | 847 | | 0.8 | | | | (3,014) | | (0.5) | |
Net change | | | 60,133 | | 90.2 | | | | 32,541 | | 46.1 | | | | 30,536 | | 32.8 | | | | 123,210 | | 53.5 | | | | (17,091) | | (4.7) | | | | (6,963) | | (3.4) | | | | (9,144) | | (8.4) | | | | (33,198) | | (5.0) | |
2012 Revenue | | $ | 126,798 | | 35.8 | % | | $ | 103,182 | | 29.2 | % | | $ | 123,653 | | 35.0 | % | | $ | 353,633 | | 100.0 | % | |
Revenue – 2016 | | | $ | 340,885 | | 53.9 | % | | $ | 193,141 | | 30.5 | % | | $ | 98,939 | | 15.6 | % | | $ | 632,965 | | 100 | % |
As set forthThe decrease in Table 1revenue in all geographic regions for the year ended December 31, 2016, primarily reflects lower sales of 3D printers and Table 3:
| ·
| | Revenue from printers and other products increased by $60.1 million, or 90.2%, to $126.8 million for 2012 from $66.7 million for 2011 and increased to 35.8% of consolidated revenue in 2012 from 28.9% in 2011. The increase in revenue from printers and other products that is due to volume for 2012 compared to 2011 was primarily the result of higher volume with a shift in the mix of printers and other products toward lower priced consumer and professional printers. This increase wason-demand parts manufacturing services, partially offset by a $109.1 million unfavorable effect of price and mix and a negative $2.0 million foreign currency translation impact.
|
| ·
| | Revenue from materials increased by $32.6 million, or 46.1%, to $103.2 million for 2012 from $70.6 million for 2011. Revenue from materials was aided by the improvement in production printer sales, which are typically accompanied by significant initial materials purchases to charge up new printers and commence production, and the continued expansion of printers installed over the past periods. This increase was partially offset by a negative $2.0 million foreign currency translation impact.
|
| ·
| | Revenue from services increased $30.5 million for 2012 compared to 2011 and decreased to 35.0% of consolidated revenue in 2012 from 40.4% in 2011.
|
Revenue by geographic regionincreased sales from materials, software and healthcare-related solutions.
2013For the years ended December 31, 2016 and 2015, revenue from operations outside the U.S., including Latin America, EMEA and APAC, was 49.3% and 49.0% of total revenue, respectively.
2015 compared to 20122014
All geographic regions experienced higher levels of revenue in 2013 compared to 2012. This was principally due to continued global R&D spending, which we believe, led to higher levels of printer sales and print materials sales.
Table 4 sets forth the change in revenue by geographic arearegion for 2013 compared to 2012:the years ended December 31, 2015 and 2014:
Table 4
| | | | | | | | | | | | | | | | | | | | | | | | | |
| | | | | | | | | | | | | | | | | | | | | | | | | | | | | | | | | | | | | | | | | | | | | |
(Dollars in thousands) | | U.S. | | Europe | | Asia-Pacific | | Total | | Americas | | EMEA | | APAC | | Total |
2012 Revenue | | $ | 196,414 | | 55.5 | % | | $ | 100,687 | | 28.5 | % | | $ | 56,532 | | 16.0 | % | | $ | 353,633 | | 100.0 | % | |
Revenue – 2014 | | | $ | 333,925 | | 51.1 | % | | $ | 196,087 | | 30.0 | % | | $ | 123,640 | | 18.9 | % | | $ | 653,652 | | 100 | % |
Change in revenue: | | | | | | | | | | | | | | | | | | | | | | | | | | | | | | | | | | | | | | | | | | | | | | | | |
Volume | | | 183,799 | | 93.6 | | | | 212,287 | | 210.8 | | | | 179,649 | | 317.8 | | | | 575,735 | | 162.8 | | | | 38,699 | | 11.6 | | | | 25,100 | | 12.8 | | | | (17,197) | | (13.9) | | | | 46,602 | | 7.1 | |
Price/Mix | | | (95,461) | | (48.6) | | | | (182,048) | | (180.8) | | | | (137,003) | | (242.3) | | | | (414,512) | | (117.2) | | | | (10,171) | | (3.0) | | | | 12,529 | | 6.4 | | | | 9,393 | | 7.6 | | | | 11,751 | | 1.8 | |
Foreign currency translation | | | — | | — | | | | 2,855 | | 2.8 | | | | (4,311) | | (7.6) | | | | (1,456) | | (0.4) | | | | (4,477) | | (1.3) | | | | (33,612) | | (17.1) | | | | (7,753) | | (6.3) | | | | (45,842) | | (7.0) | |
Net change | | | 88,338 | | 45.0 | | | | 33,094 | | 32.8 | | | | 38,335 | | 67.9 | | | | 159,767 | | 45.2 | | | | 24,051 | | 7.3 | | | | 4,017 | | 2.1 | | | | (15,557) | | (12.6) | | | | 12,511 | | 1.9 | |
2013 Revenue | | $ | 284,752 | | 55.4 | % | | $ | 133,781 | | 26.1 | % | | $ | 94,867 | | 18.5 | % | | $ | 513,400 | | 100.0 | % | |
Revenue – 2015 | | | $ | 357,976 | | 53.7 | % | | $ | 200,104 | | 30.0 | % | | $ | 108,083 | | 16.3 | % | | $ | 666,163 | | 100 | % |
Revenue from U.S. operations,The growth in the Americas and EMEA for the year ended 2013, increasedDecember 31, 2015 was driven by $88.4 million, or 45.0%, to $284.8 million from $196.4 million in 2012. This increase was due primarily to higher volume, partially offset by the unfavorable combined effect of price and mix.
Revenue from non-U.S. operations, for the year ended 2013, increased by $71.4 million, or 45.4%, to $228.6 million from $157.2 million in 2012 and comprised 44.5% of consolidated revenue in 2013 compared to 44.5% in 2012. The increase in non-U.S. revenue, excluding the impact of foreign currency translation, was 46.4% for the year ended 2013 compared to 45.0% in 2012.
Revenue from European operations increased by $33.1 million, or 32.8%, to $133.8 million in 2013 from $100.7 million in 2012. This increase was due primarily to higher volume, partially offset by the unfavorable combined effect of price and mix.
Revenue from Asia-Pacific operations increased by $38.4 million, or 67.9%, to $94.9 million in 2013 from $56.5 million in 2012. This increase was due primarily to higher volume, partially offset by the unfavorable combined effect of price and mix.
2012 compared to 2011
All geographic regions experienced higher levels of revenue in 2012 compared to 2011. This was principally due to an increase in R&D spending, which we believe led to higher levels of printer salesservices revenue, while continued macroeconomic weaknesses compressed printers and print material sales. Revenuematerials revenue in the APAC region.
For the years ended December 31, 2015 and 2014, revenue from U.S. operations increased as a percentageoutside the U.S., including Latin America, EMEA and APAC, was 49.0% and 49.1% of total revenue, due to revenue related to increased acquisition activity in the U.S., including the acquisition of Quickparts, Z Corp and Vidar. The banking crisis combined with economic weakness in several European countries led to increased negative impact of foreign currency translation for the European region, while a strengthening Japanese Yen for most of 2012 resulted in a favorable foreign currency translation for the Asia-Pacific region.respectively.
Table 5 sets forth the change in revenue by geographic area for 2012 compared to 2011.
Table 5
| | | | | | | | | | | | | | | | | | | | | | | | |
(Dollars in thousands) | | U.S. | | Europe | | Asia-Pacific | | Total |
2011 Revenue | | $ | 117,739 | | 51.1 | % | | $ | 83,324 | | 36.2 | % | | $ | 29,360 | | 12.7 | % | | $ | 230,423 | | 100.0 | % |
Change in revenue: | | | | | | | | | | | | | | | | | | | | | | | | |
Volume | | | 174,459 | | 148.2 | | | | 28,016 | | 33.6 | | | | 34,265 | | 116.7 | | | | 236,740 | | 102.7 | |
Price/Mix | | | (95,784) | | (81.4) | | | | (4,015) | | (4.8) | | | | (7,544) | | (25.7) | | | | (107,343) | | (46.6) | |
Foreign currency translation | | | — | | — | | | | (6,638) | | (8.0) | | | | 451 | | 1.5 | | | | (6,187) | | (2.7) | |
Net change | | | 78,675 | | 66.8 | | | | 17,363 | | 20.8 | | | | 27,172 | | 92.5 | | | | 123,210 | | 53.5 | |
2012 Revenue | | $ | 196,414 | | 55.5 | % | | $ | 100,687 | | 28.5 | % | | $ | 56,532 | | 16.0 | % | | $ | 353,633 | | 100.0 | % |
As shown in Table 5:
| ·
| | Revenue from U.S. operations increased by $78.7 million or 66.8% in 2012 to $196.4 million from $117.7 million in 2011. This increase was due primarily to higher volume, partially offset by an unfavorable combined effect of price and mix.
|
| ·
| | Revenue from non-U.S. increased by $44.5 million or 39.5% to $157.2 million in 2012 from $112.7 million in 2011 and comprised 44.5% of consolidated revenue in 2012 compared to 48.9% in 2011. The increase in non-U.S. revenue, excluding the impact of foreign currency translation, was 45.0% in 2012 compared to 23.5% in 2011.
|
| ·
| | Revenue from European operations increased by $17.4 million, or 20.8%, to $100.7 million in 2012 from $83.3 million in 2011. This increase was due primarily to higher volume, partially offset by a unfavorable combined effect of price and mix and foreign currency translation.
|
| ·
| | Revenue from Asia-Pacific operations increased by $27.1 million or 92.5% to $56.5 million in 2012 from $29.4 million in 2011. This increase was due primarily to higher volume coupled with a favorable effect of foreign currency translation, partially offset by an unfavorable combined effect of price and mix.
|
Gross profit and gross profit margins
2016 compared to 2015
Table 5 sets forth gross profit and gross profit margins for the years ended December 31, 2016 and 2015.
Table 5
| | | | | | | | | | | | | | | | | | | | | | | |
| Year Ended December 31, | | | | | | | | | | | | |
| 2016 | | 2015 | | Change in Gross Profit | | Change in Gross Profit Margin |
(Dollars in thousands) | Gross Profit | | Gross Profit Margin | | Gross Profit | | Gross Profit Margin | | $ | | % | | Percentage Points | | % |
Products | $ | 63,925 | | 28.6 | % | | $ | 50,304 | | 19.5 | % | | $ | 13,621 | | 27.1 | % | | | 9.1 | | 46.6 | % |
Materials | | 121,030 | | 77.2 | | | | 114,176 | | 75.7 | | | | 6,854 | | 6.0 | | | | 1.5 | | 1.9 | |
Services | | 124,796 | | 49.4 | | | | 127,329 | | 49.3 | | | | (2,533) | | (2.0) | | | | 0.1 | | 0.2 | |
Total | $ | 309,751 | | 48.9 | % | | $ | 291,809 | | 43.8 | % | | $ | 17,942 | | 6.1 | % | | | 5.1 | | 11.7 | % |
The increase in total consolidated gross profit is primarily driven by higher products and materials gross profit, as further discussed below.
Gross profit margin improvedfor products increased, primarily due to cost reduction measures and favorable impact of sales mix from our shift away from lower margin consumer products. Additionally, cash and non-cash charges recorded in both 2013the fourth quarter of 2015 related to the end-of-life of the Cube 3D printer and 2012. our shift away from consumer products in 2015 were higher than charges recorded in the third quarter of 2016 which related product and project discontinuations in connection with our updated strategy.
Gross profit margin for materials increased, reflecting the favorable impact of mix.
Gross profit margin for services increased slightly, primarily driven by higher revenues from healthcare and software solutions, partially offset by lower on-demand parts margin. On-demand parts services gross profit margin decreased to 43.0% for the year ended December 31, 2016, compared to 43.9% for the year ended December 31, 2015.
2015 compared to 2014
Table 6 sets forth gross profit and gross profit marginmargins for our productsthe years ended December 31, 2015 and services.2014.
Table 6
| | | | | | | | | | | | | | | | | | | | | | | | | | | | | | | | | | | | | | | |
| | Year Ended December 31, | Year Ended December 31, | | | | | | | | | | | |
| | 2013 | | 2012 | | 2011 | 2015 | | 2014 | | Change in Profit | | Change in Gross Profit Margin |
(Dollars in thousands) | | Gross Profit | | Gross Profit Margin | | Gross Profit | | Gross Profit Margin | | Gross Profit | | Gross Profit Margin | Gross Profit | | Gross Profit Margin | | Gross Profit | | Gross Profit Margin | | $ | | % | | Percentage Points | | % |
Printers and other products | | $ | 101,838 | | 44.7 | % | | $ | 54,276 | | 42.8 | % | | $ | 24,967 | | 37.4 | % | |
Print materials | | | 94,581 | | 73.7 | | | | 70,418 | | 68.2 | | | | 45,751 | | 64.8 | | |
Products | | $ | 50,304 | | 19.5 | % | | $ | 101,681 | | 35.9 | % | | $ | (51,377) | | (50.5) | % | | | (16.4) | | (45.7) | % |
Materials | | | 114,176 | | 75.7 | | | 116,526 | | 73.4 | | | | (2,350) | | (2.0) | | | 2.3 | | 3.1 | |
Services | | | 71,175 | | 45.2 | | | | 56,502 | | 45.7 | | | | 38,310 | | 41.1 | | | 127,329 | | 49.3 | | | 99,227 | | 46.9 | | | | 28,102 | | 28.3 | | | 2.4 | | 5.1 | |
Total | | $ | 267,594 | | 52.1 | % | | $ | 181,196 | | 51.2 | % | | $ | 109,028 | | 47.3 | % | $ | 291,809 | | 43.8 | % | | $ | 317,434 | | 48.6 | % | | $ | (25,625) | | (8.1) | % | | | (4.8) | | (9.9) | % |
On aTotal consolidated basis, gross profit fordecreased, primarily driven by cash and non-cash charges related to the year ended 2013 increased by $86.4 million, or 47.7%,end-of-life of the Cube 3D printer and our shift away from consumer products, in addition to $267.6 million compared to $181.2 million and $109.0 million for 2012 and 2011, respectively. lower products revenue, as discussed below.
Gross profit margin for products decreased primarily due to lower sales of 3D printers, coupled with cash and non-cash charges of approximately $27.4 million related to the year ended 2013end-of-life of the Cube 3D printer and our shift away from lower margin consumer products, which more than offset increased 0.9 percentage points, from 51.2% in 2012, to 52.1% in 2013.The higher gross profit margin reflects increased revenue from higher gross profit margins on consumer and professional materials, increased revenuecontributions from higher margin software products and continued operational efficiencies.
Printers and other products gross profit increased by 87.6%, to $101.8 million, for the year ended 2013, from $54.3 million in 2012, while the gross profit margin increased by 1.9 percentage points in 2013 to 44.7%. The increase in gross profit margin is due to sales of higher margin software products, expanding printer margins, partially offset by the adverse mix of increased sales of lower marginhealthcare products.
Gross profit margin for materials increased, by 34.3% to $94.6 millionreflecting a favorable mix of materials sold during the period and improved supply chain efficiencies in 2013, with the grossmaterials production.
Gross profit margin increasing 5.5 percentage points to 73.7% from 68.2% in 2012. This isfor services increased primarily due to the favorable shiftaddition of the mix of materials towards higher gross profit margin print materialshealthcare and integrated materials.
Gross profit for services increased by 26.0% to $71.2 million compared to $56.5 million in 2012, with the gross profit margin decreasing 0.5 percentage points to 45.2%. The gross profit increase is primarily due to increased revenue from Quickpartssoftware services. The decrease in gross profit margin for services was due to lower consumer margins, partially offset by a 0.2 percentage point increase in QuickpartsOn-demand parts services gross profit margin increased to 42.9%,43.9% for the year ended 2013,December 31, 2015, compared to 42.7% in 2012 and a 1.0 percentage point increase of printer services margin, to 51.1%,43.5% for the year ended 2013, compared to 50.1% in 2012.December 31, 2014.
Operating expenses
As shown in2016 compared to 2015
Table 7 sets forth the table below, totalcomponents of operating expenses increased by $66.1 million, or 54.8%, to $186.7 million for the yearyears ended 2013, after increasing to $120.6 million for 2012 from $74.1 million for 2011,December 31, 2016 and increased to 36.4% of revenue compared to 34.1% and 32.2% in 2012 and 2011, respectively. This increase consists of $45.8 million of higher selling, general and administrative expenses and $20.3 million of higher research and development expenses, both of which are discussed below.2015.
Table 7
| | | | | | | | | | | | | | | | | | | | | | | | | | | | | | | | | |
| | Year Ended December 31, | Year Ended December 31, | | | | | | |
| | 2013 | | 2012 | | 2011 | 2016 | | 2015 | | Change |
(Dollars in thousands) | | Amount | | % Revenue | | Amount | | % Revenue | | Amount | | % Revenue | Amount | | % Revenue | | Amount | | % Revenue | | $ | | % |
Selling, general and administrative expenses | | $ | 143,244 | | 27.9 | % | | $ | 97,422 | | 27.5 | % | | $ | 59,795 | | 26.0 | % | $ | 259,776 | | 41.0 | % | | $ | 303,784 | | 45.6 | % | | $ | (44,008) | | (14.5) | % |
Research and development expenses | | | 43,489 | | 8.5 | | | | 23,203 | | 6.6 | | | | 14,331 | | 6.2 | | | 88,395 | | 14.0 | | | | 92,770 | | 13.9 | | | | (4,375) | | (4.7) | |
Impairment of goodwill and other intangible assets | | | — | | — | | | | 537,179 | | 80.6 | | | | (537,179) | | (100.0) | |
Total operating expenses | | $ | 186,733 | | 36.4 | % | | $ | 120,625 | | 34.1 | % | | $ | 74,126 | | 32.2 | % | $ | 348,171 | | 55.0 | % | | $ | 933,733 | | 140.1 | % | | $ | (585,562) | | (62.7) | % |
2013Total operating expenses decreased, primarily reflecting the fact that impairment charges related to goodwill and other intangible assets were recorded in the fourth quarter of 2015, in addition to lower selling, general and administrative expenses and lower research and development expenses, as discussed below.
For the year ended December 31, 2016, selling, general and administrative expenses decreased, primarily due to a $25.9 million decrease in amortization expense, an $11.5 million decrease in litigation costs primarily related to a provision for arbitration award recorded in the third quarter of 2015 and a $5.8 million decrease in compensation costs, driven by lower stock-based compensation expense.
For the year ended December 31, 2016, research and development expenses decreased, primarily due to a $4.1 million decrease in outside services associated with product development, a $3.1 million decrease in compensation costs and a $2.2 million decrease in purchased materials, partially offset by $4.6 million of expenses related to our updated strategy and re-prioritization of certain R&D projects and a $1.1 million increase in depreciation expense.
2015 compared to 20122014
Table 8 sets forth the components of operating expenses for the years ended December 31, 2015 and 2014.
Table 8
| | | | | | | | | | | | | | | | | |
| Year Ended December 31 | | | | | | |
| 2015 | | 2014 | | Change |
(Dollars in thousands) | Amount | | % Revenue | | Amount | | % Revenue | | $ | | % |
Selling, general and administrative expenses | $ | 303,784 | | 45.6 | % | | $ | 215,724 | | 33.0 | % | | $ | 88,060 | | 40.8 | % |
Research and development expenses | | 92,770 | | 13.9 | | | | 75,395 | | 11.5 | | | | 17,375 | | 23.0 | |
Impairment of goodwill and other intangible assets | | 537,179 | | 80.6 | | | | — | | — | | | | 537,179 | | NA | |
Total operating expenses | $ | 933,733 | | 140.1 | % | | $ | 291,119 | | 44.5 | % | | $ | 642,614 | | 220.7 | % |
Total operating expenses increased, reflecting impairment charges related to goodwill and other intangible assets that were recorded in the fourth quarter of 2015, in addition to higher selling, general and administrative expenses and higher research and development expenses, as discussed below.
Selling, general and administrative expenses increased by $45.8 million, or 47.0%,due primarily to $143.2 million for the year ended 2013, from $97.4 million in 2012. The $45.8a $37.9 million increase in selling, generalcompensation costs due to acquisitions and administrative expenses in 2013 was primarily driven by support of concentrated new product launches, channel expansion and training and includedincreased staffing, a $16.8 million increase in salary, benefits and contract labor costs, a $7.9 $21.6 million increase in amortization, an $11.3 million arbitration award expense a $5.0 million increaserecorded in marketing expense, a $3.4 million increase in occupancy costs, a $2.6 million increase in travel expenses, a $1.9 million increase in bad debt expense, a $1.2 million increase in operating supplies expense and a $1.0 million increase in consultant fees.
Depreciation and amortization increased $9.2 million, to $30.4 million for the year ended 2013, from $21.2 million in 2012. The increase in depreciation and amortization in 2013 and 2012 is primarily due to intangible assets from acquired businesses and additional capital equipment placed in service.
Research and development expenses increased by 87.4%, to $43.5 million for the year ended 2013, from $23.2 million in 2012. The $20.3 million increase in 2013 was primarily driven by an $8.1 million increase in supplies and materials in supportthird quarter of our accelerated new product developments and investments, a $7.2 million increase in R&D salary and compensation expenses primarily due to talent expansion and a $2.0 million increase in outside consulting and outsourcing services.
2012 compared to 2011
Selling, general and administrative expenses increased by $37.6 million, or 62.9%, to $97.4 million in 2012, from $59.8 million in 2011. The $37.6 million increase in selling, general and administrative expenses in 2012 included an $18.4 million increase in salary, benefits and contract labor costs. The majority of that was2015 related to increased commissions on higher revenues and operating costs for newly acquired businesses. SG&A expenses were also impacted byan earnout in connection with an acquisition completed in 2011, a $3.7$4.6 million increase in marketing expenses, a $2.5 million increase in agent commissions,travel expenses and a $1.7$1.4 million increase in occupancy costs, a $1.3 million increase in bad debt expense and a $1.2 million increase in travel costs, partially offset by a $4.2 million improvement in legal expenses. In addition, SG&A included $5.1 million of acquisition expenses.
Depreciation and amortization increased $10.1 million to $21.2 million in 2012 from $11.1 million in 2011. The increases in depreciation and amortization in 2012 and 2011 were primarily due to additional capital equipment placed in service and intangible assets from acquired businesses. outside consulting services.
Research and development expenses increased by 61.9%primarily due to $23.2 million in 2012 from $14.3 million in 2011. The $8.9an $11.0 million increase in 2012 was duecompensation costs related to a $4.5 million increase in R&D salaryacquisitions and compensation expenses primarily due to new product development and investment in support of our portfolio expansion and diversification efforts, a $2.0 million increase in supplies and equipmentincreased staffing and a $0.4$5.7 million increase in outside consultingservices associated with product development.
In connection with our annual goodwill and outsourcing services.other intangible assets testing, we recorded goodwill and other intangible asset impairment charges of $537.2 million related to our geographic reporting units. See Notes 2, 6 and 7 to the Consolidated Financial Statements.
Income (loss) from operations
OperatingTable 9 sets forth income increased $20.3 million, to $80.9 million(loss) from operations by geographic region for the years ended December 31, 2016, 2015 and 2014.
Table 9
| | | | | | | | |
| Year Ended December 31, |
(Dollars in thousands) | 2016 | | 2015 | | 2014 |
Income (loss) from operations | | | | | | | | |
Americas | $ | (53,725) | | $ | (596,283) | | $ | (24,663) |
Germany | | 8,032 | | | 5,271 | | | 2,749 |
Other EMEA | | (9,645) | | | (76,472) | | | 9,181 |
Asia Pacific | | 19,591 | | | 27,432 | | | 40,131 |
Subtotal | | (35,747) | | | (640,052) | | | 27,398 |
Inter-segment elimination | | (2,673) | | | (1,872) | | | (1,083) |
Total | $ | (38,420) | | $ | (641,924) | | $ | 26,315 |
The improvement in operating loss for the year ended 2013, compared to $60.6 million in 2012 and $34.9 million in 2011. The increase in operating incomeDecember 31, 2016 was primarily due to increased revenue in all categories, which led to improved overhead absorption, partially offsetdriven by increasedlower operating expenses. See “Gross profit and gross profit margins” and “Selling, general and administrative costsOperating expenses” above.
The following table sets forth income from operations by geographic area for 2013, 2012 and 2011.
Table 8
| | | | | | | | | |
| | Year Ended December 31, |
(Dollars in thousands) | | 2013 | | 2012 | | 2011 |
Income from operations | | | | | | | | | |
United States | | $ | 43,743 | | $ | 37,743 | | $ | 19,045 |
Germany | | | 302 | | | 1,305 | | | 1,509 |
Other Europe | | | 7,849 | | | 5,415 | | | 6,645 |
Asia Pacific | | | 30,499 | | | 16,528 | | | 7,152 |
Subtotal | | | 82,393 | | | 60,991 | | | 34,351 |
Inter-segment elimination | | | (1,532) | | | (420) | | | 551 |
Total | | $ | 80,861 | | $ | 60,571 | | $ | 34,902 |
With respect to the U.S., in 2013, 2012Americas, for the years ended December 31, 2016 and 2011, 2015, the changes in operating income by geographic area(loss) reflected the same factors relating to our consolidated operating income (loss) that are discussed above.
As most of our operations outside the U.S. are conducted through sales and marketing subsidiaries, theabove. The changes in operating income (loss) in our operations outside the U.S. in each of 2013, 2012Americas for the years ended December 31, 2016 and 20112015 resulted primarily from transfer pricing, changes in sales volume transfer pricing and foreign currency translation.translation.
Interest and other expenses, net
InterestTable 10 sets forth the components of interest and other expenses, net, which consisted primarily of interest and other expense and foreign exchange gain or loss, amounted to $16.9 million of net expense for the yearyears ended 2013, compared to $17.3 million for 2012December 31, 2016, 2015 and $2.5 million for 2011. 2014.
Table 10
| | | | | | | | |
| Year Ended December 31, |
(Dollars in thousands) | 2016 | | 2015 | | 2014 |
Interest and other expense, net: | | | | | | | | |
Interest income | $ | (807) | | $ | (521) | | $ | (482) |
Foreign exchange (gain) loss | | (94) | | | 3,263 | | | 5,727 |
Interest expense | | 1,282 | | | 2,011 | | | 1,227 |
Other (income) expense, net | | 1,011 | | | 8,276 | | | 2,456 |
Total interest and other expense, net | $ | 1,392 | | $ | 13,029 | | $ | 8,928 |
For the yearyears ended 2013, interestDecember 31, 2016 and 2015, other expense, net, included $3.4includes impairment charges of $1.2 million of interest expense, including $2.7and $7.4 million, of interest expense related to the 5.50% senior convertible notes, $14.1 millioncertain minority investments of other expense, primarily related to loss on conversion of convertible notes; partially offset by $1.4 million of interest and other income, including a gain that was deferred in a prior year and recognized upon settlement of a long-term note receivable, and $0.8 million of foreign exchange loss. For the year ended 2012, interest and other expense, net included $12.5 million of interest expense, including $12.0 million of interest expense relatedless than 20% ownership, for which we do not exercise significant influence. See Note 2 to the 5.50% senior convertible notes, $7.3 million of other expense, primarily related to loss on conversion of convertible notes; partially offset by $2.4 million of interest and other income and $0.1 million of foreign exchange gain. The 2013 and 2012 changes resulted primarily from the senior convertible notes interest and losses on conversion. Consolidated Financial Statements.
ProvisionsBenefit and provision for income taxes
We recorded a $19.9$0.5 million benefit for income taxes for the year ended December 31, 2016 and a $9.0 and $5.4 million provision for income taxes for the yearyears ended 2013. We recordedDecember 31, 2015 and 2014, respectively.
In 2016, this benefit primarily reflected a $4.3 million provision for income taxes and a $3.0 million benefit for income taxes in 2012 and 2011, respectively. In 2013, this expense primarily reflects an $18.4$3.3 million U.S. tax expensebenefit and $1.5$2.8 million of tax expense in foreign jurisdictions. In 2012,2015, this expense primarily reflectsreflected a $6.2$5.5 million U.S. tax expense related to the use of U.S. net operating losses against which the valuation allowance had been released during 2011; $2.8and $3.5 million of tax expense in foreign jurisdictions; partially offset byjurisdictions. In 2014, this expense primarily reflected a $5.4$1.7 million benefit due to the release of valuation allowances associated with U.S. deferred tax assets. In 2011, this benefit primarily reflects a $6.2 million benefit due to a $17.0 million release of valuation allowances associated with U.S. deferred tax assets, partially offset by $1.6expense and $3.7 million of tax expense in foreign jurisdictions.
During 2013, based upon our recent results of operations2016 and expected profitability in the future,2015, we concluded that it is more likely than not that all our U.S. deferred tax assets will not be realized. Asrealized in certain jurisdictions, including the U.S. and certain foreign jurisdictions; therefore, we have a result, in accordance with ASC 740, no valuation allowances have beenallowance recorded for 2013.against our deferred tax assets on our consolidated balance sheets totaling $109.9 million and $107.3 million as of December 31, 2016 and 2015, respectively. During the fourth quarter of 2012,2014, based upon our results of operations and expected profitability in the future, we concluded that it iswas more likely than not that the remainder ofall our current U.S. deferred tax assets wouldwill be realized. Asrealized, and as a result, in accordance with ASC 740, during 2012 we reversed $5.4 million of theno valuation allowance related to $12.4 million of reserves, accruals and tax credits and to $7.6 million of net operating lossesallowances were recorded for state income tax purposes. The reversal of the valuation allowance resulted in a non-cash income tax benefit of $5.4 million, which resulted in a benefit of $0.10 per share. During the second quarter of 2011, based upon our results of operations and expected profitability in the future, we concluded that it is more likely than not that a portion of our U.S. net deferred tax assets would be realized. As a result, in accordance with ASC 740, during 2011 we reversed $6.2 million of the valuation allowance related to $17.0 million of net operating carryforwards. The reversal of the valuation allowance resulted in a non-cash income tax benefit of $6.2 million, which resulted in a benefit of $0.12 per share.2014.
In 2012For further discussion, see Notes 2 and 2011, we utilized U.S. net operating loss carryforwards, which had had a full valuation allowance against them, to eliminate any U.S. federal income taxes and to significantly reduce U.S state taxes. These U.S. net operating loss carryforwards which had full valuation allowances against them were recognized in full in 2012. Their use does not impact income tax expense and income tax rate in 2013.
Absent the use of these net operating loss carryforwards, income tax expense would have been $10.8 million and $5.1 million, respectively, and the income tax rate would have been 24.9% and 15.6%, respectively for the years ended 2012 and 2011. Absent the combined impact of the use of these net operating loss carryforwards and the release of the valuation allowances in 2012 and 2011, income tax expense would have been $16.2 million and $11.3 million, respectively, and the income tax rate would have been 37.3% and 34.8%, respectively.
Our $19.9 million expense for income taxes for the year ended 2013 increased from 2012 principally due to increased U.S. income in 2013 and to there being no tax benefit from utilizing net operating loss carryforwards against which valuation allowance had been released in 2012.
Our $4.3 million expense for income taxes in 2012 increased from 2011 principally due to increased U.S. income in 2012 and to the deferred tax expense impact of utilizing net operating loss carryforwards against which valuation allowance had been released in 2011, offset by the favorable impact of the valuation allowance release during the fourth quarter of 2012.
See Note 20 to the Consolidated Financial Statements.
Net income; net income available to 3D Systems common stockholders34
Net income was $44.1 million, $38.9 million and $35.4 million,(loss) attributable to 3D Systems
2016 compared to 2015
Table 11 sets forth the primary components of net loss attributable to 3D Systems for the years ended 2013, 2012December 31, 2016 and 2011. 2015.
Table 11
| | | | | | | | |
| Year Ended December 31, | | |
(Dollars in thousands) | 2016 | | 2015 | | Change |
Operating loss | $ | (38,420) | | $ | (641,924) | | $ | 603,504 |
Less: | | | | | | | | |
Interest and other expense, net | | 1,392 | | | 13,029 | | | (11,637) |
Provision (benefit) for income taxes | | (547) | | | 8,972 | | | (9,519) |
Net loss attributable to noncontrolling interests | | (846) | | | (8,433) | | | 7,587 |
Net loss attributable to 3D Systems | $ | (38,419) | | $ | (655,492) | | $ | 617,073 |
| | | | | | | | |
Weighted average shares, basic and diluted | | 111,189 | | | 111,969 | | | |
Loss per share, basic and diluted | $ | (0.35) | | $ | (5.85) | | | |
See “Gross profit and gross profit margins” and “Operating expenses” above.
2015 compared to 2014
Table 12 sets forth the primary components of net income attributable to 3D Systems for the years ended December 31, 2015 and 2014.
Table 12
| | | | | | | | |
| Year Ended December 31, | | |
(Dollars in thousands) | 2015 | | 2014 | | Change |
Operating income (loss) | $ | (641,924) | | $ | 26,315 | | $ | (668,239) |
Less: | | | | | | | | |
Interest and other expense, net | | 13,029 | | | 8,928 | | | 4,101 |
Provision for income taxes | | 8,972 | | | 5,441 | | | 3,531 |
Net income (loss) attributable to noncontrolling interests | | (8,433) | | | 309 | | | (8,742) |
Net income (loss) attributable to 3D Systems | $ | (655,492) | | $ | 11,637 | | $ | (667,129) |
| | | | | | | | |
Weighted average shares, basic and diluted | | 111,969 | | | 108,023 | | | |
Earnings (loss) per share, basic and diluted | $ | (5.85) | | $ | 0.11 | | | |
The principal reasons for our higherlower net income in 2013, which are discussed in more detail above,for the year ended December 31, 2015 were a $159.8 million increase in revenue and an $86.4 million increasedecrease in gross profit partially offset by $66.1 million higherand increased operating expenses as a result of $537.2 million of impairment charges related to goodwill and other intangible assets, costs related to acquisitions, including higher salesamortization, compensation and marketingtravel expenses, in addition to higher research and R&D expense in support of concentrated new product launches and channeldevelopment expenses related to our portfolio expansion and training.
The principal reasons for our higher net income in 2012, which are discussed in more detail above, were a $123.2 million increase in revenuedevelopment of new products. See “Gross profit and a $72.2 million increase in gross profit partially offset by $46.5 million higher operatingmargins” and “Operating expenses as a result of commissions, operating costs of acquired companies and acquisition expenses.
Net income available to common stockholders was $44.1 million for 2013, $38.9 million for 2012 and $35.4 million for 2011. On a per share basis, our basic and diluted net income per share available to the common stockholders was $0.45 in 2013. In 2012, our basic and diluted net income per share available to the common stockholders was $0.48. In 2011, our basic and diluted net income per share available to the common stockholders was $0.47 per share.
The average outstanding diluted shares calculation excluded shares that may be issued upon conversion of the outstanding senior convertible notes because the effect of their inclusion would have been anti-dilutive resulting in an increase to the net earnings per share.
In February 2013, we announced a three-for-two stock split, in the form of a stock dividend. Trading began on a split-adjusted basis on February 25, 2013.” above.
See Notes 17 and 24 to the Consolidated Financial Statements.
Other Financial Information
In addition to our results determined under U.S. generally accepted accounting principles (“GAAP”)GAAP discussed above, management believes non-GAAP financial measures which adjust net income and earnings per share are useful to investors in evaluating our operating performance.
We use non-GAAP financial measures of adjusted net incomeperformance and adjusted earnings per share to supplement our consolidated financial statements presented on a GAAP basis to facilitate a better understanding of the impact that several strategic acquisitions, non-recurring charges and certain non-cash expenses had on our financial results.
These non-GAAP financial measures have not been prepared in accordance with GAAP, and may be different from non-GAAP financial measures used by other companies and they are subject to inherent limitations as they reflect the exercise of judgments by our management about which costs, expenses and other items are excluded from our GAAP financial statements in determining our non-GAAP financial measures. We have sought to compensate for these limitations by analyzing current and expected future results on a GAAP basis as well as a non-GAAP basis and also by providing GAAP financial statements as required in our public disclosures as well as reconciliations of our non-GAAP financial measures of adjusted net income and adjusted earnings per share to our GAAP financial statements.
The presentation of ourmeasures. Our non-GAAP financial measures which adjust net income and earnings per share are not meant to be considered in isolation or as a substitute for the directly comparable financial measures prepared in accordance with GAAP. These non-GAAP financial measures are meant to supplement, and be viewed in conjunction with, GAAP financial measures. We urge investors to review the reconciliation of our non-GAAP financial measures to the comparable GAAP financial measures included below, and not to rely on any single financial measure to evaluate our business.
Our non-GAAP financial measures which adjust net income and earnings per share are adjusted forto exclude the following:following items:
| | | |
| | | Amortization, stock-based compensation and other non-cash items. We exclude intangible asset amortization expense and non-cash stock based compensation expense, as well as any loss in connection with the conversion of convertible notes. |
Non-cash stock-based compensation expenses. We exclude the tax-effected stock-based compensation expenses from our operating expenses primarily because they are non-cash.
| | | |
| | | Legal and acquisition related expenses. We exclude charges associated with arbitration awards, litigation settlements and certain severance costs, in addition to charges in connection with business acquisitions, which generally include earnout amortization and other acquisition-related fees, as well as goodwill and other intangible asset impairment charges. |
Amortization of intangibles. We exclude the tax-effected amortization of intangible assets from our cost of sales and operating expenses. The increase in recent periods is primarily in connection with acquisitions of businesses.
Acquisition and severance expenses. We exclude the tax-effected charges associated with the acquisition of businesses and the related severance expenses from our operating expenses.
Non-cash interest expenses. We exclude tax-effected, non-cash interest expenses, primarily related to the amortization costs associated with our outstanding senior convertible notes, from interest and other expenses, net.
Loss on conversion of convertible notes. We exclude the tax-effected, loss on conversion of convertible notes, from interest and other expenses, net.
Net gain (loss) on litigation and tax settlements. We exclude the tax-effected, net gain or loss on acquisitions and litigation settlements from other expenses, net. | | | |
| | | Portfolio re-alignment. We exclude charges associated with discontinued product lines, strategic decisions and re-prioritization of projects. |
Reconciliation of Non-GAAP Financial Measures to GAAP Financial Measures
Table 913
| | | | | | | | | |
| | Year Ended December 31, |
(Dollars in thousands, except per share) | | 2013 | | 2012 | | 2011 |
GAAP net income | | $ | 44,107 | | $ | 38,941 | | $ | 35,420 |
Cost of sales adjustments: | | | | | | | | | |
Amortization of intangibles | | | 250 | | | 193 | | | 237 |
Operating expense adjustments: | | | | | | | | | |
Amortization of intangibles | | | 20,448 | | | 11,259 | | | 4,813 |
Acquisition and severance expenses | | | 7,057 | | | 4,982 | | | 3,664 |
Non-cash stock-based compensation expense | | | 13,495 | | | 4,613 | | | 2,637 |
Other expense adjustments: | | | | | | | | | |
Non-cash interest expense | | | 973 | | | 3,489 | | | 400 |
Loss on convertible notes | | | 11,275 | | | 6,295 | | | — |
Net (gain) loss on litigation and tax settlements | | | 2,457 | | | (1,296) | | | — |
Tax effect | | | (16,327) | | | (610) | | | (6,221) |
Non-GAAP net income | | $ | 83,735 | | $ | 67,866 | | $ | 40,950 |
| | | | | | | | | |
Non-GAAP basic earnings per share | | $ | 0.85 | | $ | 0.84 | | $ | 0.55 |
Non-GAAP diluted earnings per share | | $ | 0.85 | | $ | 0.83 | | $ | 0.54 |
| | | | | | | | | | | | | | | |
| | Year Ended December 31, 2016 |
| | | | | | Adjustments | | | |
(in thousands, except per share amounts) | | | GAAP | | | Amortization, Stock-Based Compensation and Other Non-Cash Items (b) | | | Legal and Acquisition-Related | | | Portfolio Re-alignment | | | Non-GAAP |
| | | | | | | | | | | | | | | |
Revenue | | $ | 632,965 | | $ | — | | $ | — | | $ | — | | $ | 632,965 |
Cost of sales | | | 323,214 | | | (332) | | | — | | | (10,723) | | | 312,159 |
Gross profit | | | 309,751 | | | 332 | | | — | | | 10,723 | | | 320,806 |
Gross profit margin | | | 48.9% | | | | | | | | | | | | 50.7% |
Operating expenses: | | | | | | | | | | | | | | | |
Selling, general and administrative | | | 259,776 | | | (66,087) | | | (5,741) | | | (34) | | | 187,914 |
Research and development | | | 88,395 | | | — | | | — | | | (6,072) | | | 82,323 |
Total operating expenses | | | 348,171 | | | (66,087) | | | (5,741) | | | (6,106) | | | 270,237 |
Income (loss) from operations | | | (38,420) | | | 66,419 | | | 5,741 | | | 16,829 | | | 50,569 |
Interest and other expense, net | | | 1,392 | | | — | | | — | | | — | | | 1,392 |
Income (loss) before income taxes | | | (39,812) | | | 66,419 | | | 5,741 | | | 16,829 | | | 49,177 |
Benefit for income taxes (a) | | | (547) | | | (207) | | | (67) | | | — | | | (821) |
Net income (loss) | | | (39,265) | | | 66,626 | | | 5,808 | | | 16,829 | | | 49,998 |
Less: net loss attributable to noncontrolling interests | | | (846) | | | — | | | — | | | — | | | (846) |
Net income (loss) attributable to 3D Systems Corporation | | $ | (38,419) | | $ | 66,626 | | $ | 5,808 | | $ | 16,829 | | $ | 50,844 |
| | | | | | | | | | | | | | | |
Net income (loss) per share available to 3D Systems Corporation common stockholders — basic and diluted | | $ | (0.35) | | | | | | | | | | | $ | 0.46 |
| | | | | | | | | | | | | | | |
| (a) | | Tax effect for the quarter ended March 31, 2016 and earlier periods was calculated quarterly, based on the Company’s overall tax rate for each quarter. Tax effect for subsequent quarters was calculated based on the Company’s quarterly U.S. tax rate, which was 0% as a result of the valuation allowance that was recorded in the fourth quarter of 2015, in connection with GAAP net losses. The amount in the fourth quarter of 2016 also includes a $1.2 million adjustment related to a prior period. |
| (b) | | The following table details the ‘Amortization, Stock-Based Compensation and Other Non-Cash Items’ column from above: |
| | | | | | | | | | | | |
| | | Adjustments |
| | | Amortization | | | Stock-Based Compensation | | | Other Non-Cash Items | | | Totals |
| | | | | | | | | | | | |
Revenue | | $ | — | | $ | — | | $ | — | | $ | — |
Cost of sales | | | (332) | | | — | | | — | | | (332) |
Operating expenses | | | (34,792) | | | (31,295) | | | — | | | (66,087) |
Interest and other expense, net | | | — | | | — | | | — | | | — |
Tax effect | | | (625) | | | (827) | | | 1,245 | | | (207) |
Total non-GAAP adjustment | | $ | (35,749) | | $ | (32,122) | | $ | 1,245 | | $ | (66,626) |
| | | | | | | | | | | | |
Table 13 continued
| | | | | | | | | | | | | | | |
| | Year Ended December 31, 2015 |
| | | | | | Adjustments | | | |
(in thousands, except per share amounts) | | | GAAP | | | Amortization, Stock-Based Compensation and Other Non-Cash Items (b) | | | Legal and Acquisition-Related | | | Portfolio Re-alignment | | | Non-GAAP |
| | | | | | | | | | | | | | | |
Revenue | | $ | 666,163 | | $ | — | | $ | — | | $ | — | | $ | 666,163 |
Cost of sales | | | 374,354 | | | (303) | | | — | | | (27,390) | | | 346,661 |
Gross profit | | | 291,809 | | | 303 | | | — | | | 27,390 | | | 319,502 |
Gross profit margin | | | 43.8% | | | | | | | | | | | | 48.0% |
Operating expenses: | | | | | | | | | | | | | | | |
Selling, general and administrative | | | 303,784 | | | (95,496) | | | (20,556) | | | — | | | 187,732 |
Research and development | | | 92,770 | | | — | | | — | | | — | | | 92,770 |
Impairment of goodwill and other intangible assets | | | 537,179 | | | — | | | (537,179) | | | — | | | — |
Total operating expenses | | | 933,733 | | | (95,496) | | | (557,735) | | | — | | | 280,502 |
Income (loss) from operations | | | (641,924) | | | 95,799 | | | 557,735 | | | 27,390 | | | 39,000 |
Interest and other expense, net | | | 13,029 | | | — | | | — | | | — | | | 13,029 |
Income (loss) before income taxes | | | (654,953) | | | 95,799 | | | 557,735 | | | 27,390 | | | 25,971 |
Provision (benefit) for income taxes (a) | | | 8,972 | | | 21,493 | | | (24,663) | | | (1,408) | | | 4,394 |
Net income (loss) | | | (663,925) | | | 74,306 | | | 582,398 | | | 28,798 | | | 21,577 |
Less: net loss attributable to noncontrolling interests | | | (8,433) | | | — | | | — | | | — | | | (8,433) |
Net income (loss) attributable to 3D Systems Corporation | | $ | (655,492) | | $ | 74,306 | | $ | 582,398 | | $ | 28,798 | | $ | 30,010 |
| | | | | | | | | | | | | | | |
Net income (loss) per share available to 3D Systems Corporation common stockholders — basic and diluted | | $ | (5.85) | | | | | | | | | | | $ | 0.27 |
| | | | | | | | | | | | | | | |
| (c) | | Tax effect was calculated quarterly, based on the Company’s overall tax rate for each quarter. |
| (d) | | The following table details the ‘Amortization, Stock-Based Compensation and Other Non-Cash Items’ column from above: |
| | | | | | | | | | | | |
| | | Adjustments |
| | | Amortization | | | Stock-Based Compensation | | | Other Non-Cash Items | | | Totals |
| | | | | | | | | | | | |
Revenue | | $ | — | | $ | — | | $ | — | | $ | — |
Cost of sales | | | (303) | | | — | | | — | | | (303) |
Operating expenses | | | (60,763) | | | (34,733) | | | — | | | (95,496) |
Interest and other expense, net | | | — | | | — | | | — | | | — |
Tax effect | | | 13,262 | | | 8,231 | | | | | | 21,493 |
Total non-GAAP adjustment | | $ | (47,804) | | $ | (26,502) | | $ | — | | $ | (74,306) |
| | | | | | | | | | | | |
Table 13 continued
| | | | | | | | | | | | | | | |
| | Year Ended December 31, 2014 |
| | | | | | Adjustments | | | |
(in thousands, except per share amounts) | | | GAAP | | | Amortization, Stock-Based Compensation and Other Non-Cash Items (b) | | | Legal and Acquisition-Related | | | Portfolio Re-alignment | | | Non-GAAP |
| | | | | | | | | | | | | | | |
Revenue | | $ | 653,652 | | $ | — | | $ | — | | $ | — | | $ | 653,652 |
Cost of sales | | | 336,218 | | | (280) | | | — | | | — | | | 335,938 |
Gross profit | | | 317,434 | | | 280 | | | — | | | — | | | 317,714 |
Gross profit margin | | | 48.6% | | | | | | | | | | | | 48.6% |
Operating expenses: | | | | | | | | | | | | | | | |
Selling, general and administrative | | | 215,724 | | | (71,988) | | | (7,994) | | | — | | | 135,742 |
Research and development | | | 75,395 | | | — | | | — | | | — | | | 75,395 |
Total operating expenses | | | 291,119 | | | (71,988) | | | (7,994) | | | — | | | 211,137 |
Income from operations | | | 26,315 | | | 72,268 | | | 7,994 | | | — | | | 106,577 |
Interest and other expense, net | | | 8,928 | | | (2,031) | | | — | | | — | | | 6,897 |
Income before income taxes | | | 17,387 | | | 74,299 | | | 7,994 | | | — | | | 99,680 |
Provision for income taxes (a) | | | 5,441 | | | 17,307 | | | 1,504 | | | — | | | 24,252 |
Net income | | | 11,946 | | | 56,992 | | | 6,490 | | | — | | | 75,428 |
Less: net loss attributable to noncontrolling interests | | | 309 | | | — | | | — | | | — | | | 309 |
Net income attributable to 3D Systems Corporation | | $ | 11,637 | | $ | 56,992 | | $ | 6,490 | | $ | — | | $ | 75,119 |
| | | | | | | | | | | | | | | |
Net income per share available to 3D Systems Corporation common stockholders — basic and diluted | | $ | 0.11 | | | | | | | | | | | $ | 0.70 |
| | | | | | | | | | | | | | | |
| (a) | | Tax effect was calculated quarterly, based on the Company’s overall tax rate for each quarter. |
| (b) | | The following table details the ‘Amortization, Stock-Based Compensation and Other Non-Cash Items’ column from above: |
| | | | | | | | | | | | |
| | | Adjustments |
| | | Amortization | | | Stock-Based Compensation | | | Other Non-Cash Items | | | Totals |
| | | | | | | | | | | | |
Revenue | | $ | — | | $ | — | | $ | — | | $ | — |
Cost of sales | | | (280) | | | — | | | — | | | (280) |
Operating expenses | | | (39,195) | | | (32,793) | | | — | | | (71,988) |
Interest and other expense, net | | | — | | | — | | | (2,031) | | | (2,031) |
Tax effect | | | 9,198 | | | 7,565 | | | 544 | | | 17,307 |
Total non-GAAP adjustment | | $ | (30,277) | | $ | (25,228) | | $ | (1,487) | | $ | (56,992) |
| | | | | | | | | | | | |
Other non-cash items consist of noncash interest expense and a loss recognized in connection with the conversion of convertible notes.
Liquidity and Capital Resources
Our cash flow from operationsTable 14 sets forth the components of working capital and the net proceeds from capital markets transactions in 2013 have enabled us to continue to execute our growth strategies, including our acquisitions in 2013. During 2013, we generated $25.2 million of cash from operations and utilized $162.3 million of cash to fund acquisitions.liquidity.
Operating cash flow, a key source of our liquidity, was $25.2 million in 2013, a decrease of $26.3 million, or 51.1%, as compared to 2012. In 2012, cash provided by operations was $51.5 million.Table 14
���
| | | | | | | | | | | |
| At December 31, | | Change |
(Dollars in thousands) | 2016 | | 2015 | | $ | | % |
Cash and cash equivalents | $ | 184,947 | | $ | 155,643 | | $ | 29,304 | | 18.8 | % |
Accounts receivable: | | | | | | | | | | | |
Gross accounts receivable | | 140,034 | | | 171,545 | | | (31,511) | | (18.4) | |
Allowance for doubtful accounts | | (12,920) | | | (14,139) | | | 1,219 | | (8.6) | |
Accounts receivable, net | | 127,114 | | | 157,406 | | | (30,292) | | (19.2) | |
Inventories: | | | | | | | | | | | |
Raw materials | | 45,122 | | | 59,444 | | | (14,322) | | (24.1) | |
Work in process | | 3,109 | | | 4,067 | | | (958) | | (23.6) | |
Finished goods | | 69,870 | | | 70,591 | | | (721) | | (1.0) | |
Inventories, gross | | 118,101 | | | 134,102 | | | (16,001) | | (11.9) | |
Inventory reserves | | (14,770) | | | (28,225) | | | 13,455 | | (47.7) | |
Inventories, net | | 103,331 | | | 105,877 | | | (2,546) | | (2.4) | |
Prepaid expenses and other current assets | | 17,558 | | | 13,541 | | | 4,017 | | 29.7 | |
Total current assets | $ | 432,950 | | $ | 432,467 | | $ | 483 | | 0.1 | % |
| | | | | | | | | | | |
Current portion of debt and capitalized lease obligations | | 572 | | | 529 | | | 43 | | 8.1 | |
Accounts payable | | 40,514 | | | 46,869 | | | (6,355) | | (13.6) | |
Accrued and other liabilities | | 49,968 | | | 54,699 | | | (4,731) | | (8.6) | |
Customer deposits | | 5,857 | | | 8,229 | | | (2,372) | | (28.8) | |
Deferred revenue | | 33,494 | | | 35,145 | | | (1,651) | | (4.7) | |
Total current liabilities | $ | 130,405 | | $ | 145,471 | | $ | (15,066) | | (10.4) | % |
| | | | | | | | | | | |
Working capital | $ | 302,545 | | $ | 286,996 | | $ | 15,549 | | 5.4 | % |
| | | | | | | | | | | |
Stockholders' equity attributable to 3D Systems Corporation | $ | 629,873 | | $ | 655,909 | | $ | (26,036) | | (4.0) | % |
UnrestrictedWe believe our existing cash and cash equivalents increased by $150.4 millionwill be sufficient to $306.3 million at December 31, 2013 from $155.9 million at December 31, 2012 and $179.1 million at December 31, 2011.
During 2013, we completed a common stock offering that resulted in $272.1 million in net proceeds. During 2012, we completed a common stock offering that resulted in $106.9 million in net proceeds. The cash at December 31, 2011 included $145.4 million net proceeds from senior convertible notes, of which $135.5 million was used to complete the acquisition of Z Corp and Vidar on January 3, 2012. During 2011, we also completed a common stock offering that resulted in net proceeds of $62.1 million.
Acquisitions constituted a $162.3 million use of cash in 2013, including the completion of eleven acquisitions, as compared to a $183.7 million use of cash in 2012 for nine acquisitions and a $92.7 million use of cash for the completion of twelve acquisitions in 2011.
Our netsatisfy our working capital increased by $204.1 million to $416.4 million at December 31, 2013 from $212.3 million at December 31, 2012.
See Cash flow and Lease obligations below.
We have an effective registration statement on Form S-3 under which, among other things, we may issue up to $500.0 million of securities. We issued $272.1 million of common stock in 2013 and $112.1 million in 2012 in reliance upon this registration statement and the remaining $115.8 million of securities covered by it may be issued until June 12, 2015. We may file a new registration statement at any time to increase these available amounts as necessary to provide flexibility to execute our growth strategy.
We have relied upon our unrestricted cash, cash flow from operations, and capital markets transactions to meet our cash requirements for working capital,needs, capital expenditures, outstanding commitments and acquisitions. However, it is possible that we may need to raise additional funds to financeother liquidity requirements associated with our activities beyondexisting operations in the next twelve monthsforeseeable future, or to consummate significant acquisitions of other businesses, assets, products or technologies. However, it is possible that, in the future, we may need to raise additional funds to finance our activities. If needed, we may be able to raise such funds through the sales ofby issuing equity or debt securities to the public or selected investors, by borrowing from financial institutions, drawing down on our credit facility, selling assets or restructuring debt. There is no assurance, however, that funds will be available from these sources in the amounts or on terms acceptable to us.
Even thoughIf we may not need to raise additional funds we may still electin the future to sell additional equityfund our activities, or debt securities or enter into a credit facility for other reasons. If wereasons, and raise additional funds by issuing equity or convertible debt securities, the ownership percentages of existing shareholders would be reduced.diluted. In addition, the equity or debt securities that we may issue may have rights, preferences or privileges senior to those of our common stock.
Cash held outside the U.S. at December 31, 2016 was $83.5 million, or 45.2% of total cash and equivalents, compared to $59.0, or 37.6% of total cash and equivalents at December 31, 2015. Cash held outside the U.S. is used in our foreign operations for working capital purposes and is considered to be permanently invested; consequently, we have not provided for any taxes on repatriation.
Cash equivalents comprise funds held in money market instruments and are reported at their current carrying value, which approximates fair value due to the short term nature of these instruments. We strive to minimize our credit risk by investing primarily in investment grade, liquid instruments and limit exposure to any one issuer depending upon credit quality. See Cash flow, Credit facilities and Capitalized lease obligations below.
A summaryDays’ sales outstanding was 70 days at December 31, 2016 compared to 79 days at December 31, 2015 and accounts receivable more than 90 days past due decreased to 12.5% of gross receivables, from 17.6% at December 31, 2015. We review specific receivables periodically to determine the appropriate reserve for accounts receivable, as further discussed below in Critical Accounting Policies and Significant Estimates.
The majority of our inventory consists of finished goods, including products, materials and service parts. Inventory also consists of raw materials and spare parts for the in-house assembly and support service products. We outsource the assembly of certain 3D printers; therefore, we generally do not hold most parts for the assembly of these printers in inventory. See Note 4 to the Consolidated Financial Statements.
The changes that make up the other components of liquidity is shown belowworking capital not discussed above arose in Table 10.the ordinary course of business. Differences between the amounts of working capital item changes in the cash flow statement and the balance sheet changes for the corresponding items are primarily the result of foreign currency translation adjustments.
Table 10
| | | | | | |
| | December 31, |
(Dollars in thousands) | | 2013 | | 2012 |
Cash and cash equivalents | | $ | 306,316 | | $ | 155,859 |
Working capital | | $ | 416,399 | | $ | 212,285 |
Stockholders’ equity attributable to 3D Systems Corporation | | $ | 932,646 | | $ | 480,333 |
| | | | | | |
Cash flow
A summary of theTable 15 below sets forth components of cash flows is shown below in Table 11.flow for the years ended December 31, 2016, 2015 and 2014, respectively.
Table 1115
| | | | | | | | | | |
| | | | | | | | | | | Year Ended December 31, |
| | Year Ended December 31, | | 2016 | | 2015 | | 2014 |
(Dollars in thousands) | | 2013 | | 2012 | | 2011 | | | | | | | | | |
Cash provided by operating activities | | $ | 25,184 | | $ | 51,530 | | $ | 27,660 | |
Cash provided by (used in) operating activities | | | $ | 56,902 | | $ | (3,128) | | $ | 51,111 |
Cash used in investing activities | | | (173,757) | | | (187,654) | | | (95,709) | | | (21,882) | | | (120,855) | | | (375,441) |
Cash provided by financing activities | | | 298,696 | | | 112,640 | | | 209,975 | |
Cash provided by (used in) financing activities | | | | (3,926) | | | (2,157) | | | 308,582 |
Effect of exchange rate changes on cash | | | 334 | | | 223 | | | (155) | | | (1,790) | | | (3,079) | | | (5,706) |
Net increase (decrease) in cash and cash equivalents | | $ | 150,457 | | $ | (23,261) | | $ | 141,771 | | $ | 29,304 | | $ | (129,219) | | $ | (21,454) |
| | | | | | | | | | |
Cash flow from operations
2013 compared to 2012Table 16
| | | | | | | | | |
| | Year Ended December 31, |
| | 2016 | | 2015 | | 2014 |
(Dollars in thousands) | | | | | | | | | |
Net income (loss) | | $ | (39,265) | | | (663,925) | | $ | 11,946 |
Non-cash charges | | | 109,016 | | | 696,093 | | | 76,262 |
Changes in working capital and all other operating assets | | | (12,849) | | | (35,296) | | | (37,097) |
Net cash provided by (used in) operating activities | | $ | 56,902 | | | (3,128) | | $ | 51,111 |
For the year ended December 31, 2013, we generated $25.2 millionfurther discussion of net cash from operating activities. This change in cash primarily consisted of our $44.1 millionincome (loss), see “Net income (loss); net income $51.4 million of non-cash charges that were included in our net income and $70.4 million of cash used in net changes of operating accounts. (loss) attributable to 3D Systems” above.
The principal changes in non-cash items that favorably affected operating cash flow included $30.4 millionNon-cash charges primarily consist of depreciation, amortization, stock-based compensation and amortization expense, $11.3 million loss on conversion of convertible notes,asset impairment, partially offset by $9.9 millionthe benefit of deferred tax benefit.income taxes.
For further discussion of changes in working capital, that resulted in a source of cash included the following:
| ·
| | a $7.6 million increase in accounts payable;
|
| ·
| | a $7.5 million increase in deferred revenue; and
|
| ·
| | a $1.9 million increase in customer deposits.
|
Changes in working capital that resulted in a use of cash included the following:
| ·
| | a $43.7 million increase in accounts receivable, net;
|
| ·
| | a $30.9 million increase in inventory;
|
| ·
| | a $6.5 million increase in accrued liabilities; and
|
| ·
| | a $4.6 million increase in other operating assets and liabilities.
|
| ·
| | a $1.8 million increase in prepaid expenses and other current assets.
|
Accounts receivable, net increased as a result of the record revenues for 2013see “
Liquidity and days sales outstanding increased to 79 days in 2013 from 72 days in 2012. Inventories increased primarily due to the implementation of new product launches and the timing of orders and delivery of finished goods materials and raw materials, which are purchased in large quantities.
2012 compared to 2011
For the year ended December 31, 2012, we generated $51.5 million of net cash from operating activities. This change in cash primarily consisted of our $38.9 million net income, $38.9 million of non-cash charges that were included in our net income and $24.8 million of cash used in net changes in operating accounts.
The principal changes in non-cash items that favorably affected operating cash flow included $21.2 million of depreciation and amortization expense, $7.0 million loss on conversion of convertible notes, and $5.1 million of stock-based compensation expense, partially offset by $0.7 million deferred tax benefit.
Changes in working capital that resulted in a source of cash included the following:
| ·
| | a $7.6 million increase in accrued liabilities.
|
Accrued liabilities increased primarily due to an increase in accrued compensation and benefits from the timing of payroll cycles, increased salaries related to acquisitions and higher commissions as a result of increased revenue.
Changes in working capital that resulted in a use of cash included the following:
| ·
| | a $19.2 million increase in accounts receivable, net;
|
| ·
| | a $12.2 million increase in inventory;
|
| ·
| | a $1.3 million decrease in customer deposits;
|
| ·
| | a $0.8 million increase in prepaid expenses and other current assets; and
|
| ·
| | a $0.2 million decrease in accounts payable.
|
Accounts receivable, net increased as a result of the record revenues in 2012 and days sales outstanding increased to 72 days in 2012 from 67 days in 2011. Inventories increased primarily due to the timing of orders and delivery of finished goods materials and raw materials, which are purchased in large quantities.Capital Resources” above.
Cash flow from investing activities
Net cash used in investing activities for the year ended 2013 decreased to $173.8 million, from $187.7 million in 2012. In 2013, this consisted of $162.3 million related to acquisitions, $7.0 million of net purchasesTable 17
| | | | | | | | | |
| | Year Ended December 31, |
| | 2016 | | 2015 | | 2014 |
(Dollars in thousands) | | | | | | | | | |
Cash paid for acquisitions, net of cash assumed | | $ | — | | $ | (91,799) | | $ | (345,361) |
Purchases of property and equipment | | | (16,567) | | | (22,399) | | | (22,727) |
Purchase of noncontrolling interest | | | (3,533) | | | | | | |
Proceeds from disposition of property and equipment | | | 350 | | | — | | | — |
Other investing activities | | | (1,000) | | | (5,750) | | | (6,600) |
Additions to license and patent costs | | | (1,132) | | | (907) | | | (753) |
Net cash used in investing activities | | $ | (21,882) | | $ | (120,855) | | $ | (375,441) |
Purchases of property and equipment $1.6 millionprimarily consisted of additionsexpenditures for leasehold improvements, including expanding facilities and investing in infrastructure, equipment to licensesupport our on-demand parts manufacturing service and patent costs and $4.7 million in printers associated with new product development efforts. Other investing activities consist of minority investments of less than 20% made through 3D Ventures, our venture investment initiative, in promising enterprises that we believe will benefit from or be powered by our technologies, partially offset by $1.9 million of proceeds fromtechnologies. We made no acquisitions during the disposition of property and equipment. See Notes 3, 5 and 6 to the Consolidated Financial Statements.
Net cash used in investing activities in 2012 increased to $187.7 million from $95.7 million in 2011. In 2012, this consisted of $183.7 million related to acquisitions and $3.2 million of net purchases of property and equipment and $0.7 million of additions to license and patent costs.
Capital expenditures were $7.0 million in 2013, $3.2 million in 2012 and $2.9 million in 2011. Capital expenditures in 2013, 2012 and 2011 primarily consisted of expenditures for equipment to support our Quickparts service, tooling and printers associated with our new product development efforts and leasehold improvements. year ended December 31, 2016.
As discussed below, we completed thirty-two business14 acquisitions during 2011, 20122015 and 2013.2014. The majority of the acquisitions have resulted in the recording of goodwill. This goodwill typically arises because the purchase price for these businesses reflects a number of factors including the future earnings and cash flow potential of these businesses; the multiples to earnings, cash flow and other factors at which similar businesses have been purchased by other acquirers; the competitive nature of the process by which we acquired the business; and the complementary strategic fit and resulting synergies these businesses bring to existing operations. See NoteNotes 2, 3 and 7 to the Consolidated Financial Statements.
20132016 acquisitions
We made no acquisitions during the year ended December 31, 2016.
2015 acquisitions
We acquired eleven4 businesses in 20132015 for cash consideration of $162.3$91.8 million, net of cash acquired, with an additional $13.1$0.7 million of consideration paid in the form of common stock. Fourforgiveness of the acquisitions were related to accelerating our 3D printer penetration through new products and materials, three of the acquisitions were related to building our 3D consumer and retail products and services, twoa note. Two of the acquisitions were related to expanding our software solutions, one acquisition was related to expanding our global Quickparts customon-demand parts services and two acquisitions wereprinter sales footprint, and one acquisition was related to reinventing the engineer’s desktop. See Note 3expanding our offering related to the Consolidated Financial Statements.education marketplace opportunity. See Note 3 to the Consolidated Financial Statements.
20122014 acquisitions
We acquired nine10 businesses in 20122014 for cash consideration of $183.7$345.4 million, net of cash acquired, with an additional $7.7 million of consideration paid in the form of common stock. Two of the acquisitions were related to Quickparts custom parts services, three were building blocks for our consumer growth initiative, two acquisitions were related to our printers business, one was related to healthcare solutions and one was related to our 3D authoring solutions initiative. In addition, we made deferred purchase payments of $0.4 million in connection with acquisitions completed in 2011.
2011 acquisitions
We acquired twelve businesses in 2011 for cash consideration of $92.7 million, net of cash acquired, with an additional $3.0$24.6 million of consideration paid in the form of common stock. Five of the acquisitions were related to Quickparts customexpanding our global on-demand parts services, four were building blocks for our consumer growth initiative and threetwo of the acquisitions were related to enhancing our printershealthcare offerings, two of the acquisitions were related to consumer and retail products and services, and one acquisition was related to our materials business. In addition, we made deferred purchase payments of $3.7 million in connection with acquisitions completed in 2010. See Note 3 to the Consolidated Financial Statements.
Recent acquisition developments
See Notes 3 and 25 to the Consolidated Financial Statements.
Cash flow from financing activities
As previously discussed, we have an effective registration statement on Form S-3 under which, among other things, weTable 18
| | | | | | | | | |
| | Year Ended December 31, |
| | 2016 | | 2015 | | 2014 |
(Dollars in thousands) | | | | | | | | | |
Tax benefits (provision) from share-based payment arrangements | | $ | — | | $ | (1,243) | | $ | 7,653 |
Proceeds, repurchase and retirement of stock, net | | | (2,871) | | | 135 | | | 1,896 |
Proceeds from issuance of common stock | | | — | | | — | | | 299,729 |
Repayment of capital lease obligations | | | (1,055) | | | (1,049) | | | (696) |
Net cash provided (used) by financing activities | | $ | (3,926) | | $ | (2,157) | | $ | 308,582 |
We may issue up to $500.0 millionadditional securities in the form of securities. We issued $272.1 million of Common Stock in 2013 and $112.1 million in 2012 in reliance upon this registration statement and the remaining $115.8 million of securities covered by it may be issued until June 12, 2015. Subject to the limitations of our Certificate of Incorporation and applicable law, we are not restrictedequity offerings from issuing additional common stock, including securities that are convertible into or exchangeable for, or that represent the right to receive, common stock. We may file a new registration statement at any time to increase these available amountstime as necessary to provide flexibility to execute our growth strategy.
In May 2013, we completed an equity offering netting $272.1 No shares were issued for the years ended December 31, 2016 and 2015. We issued approximately 6.0 million shares of common stock, resulting in net proceeds after deducting related expenses. In June 2012, we completed an equity offering netting $106.9 million in proceeds after deducting related expenses. In early 2011, we completed an equity offering netting $62.1 million in proceeds after deducting related expenses. In November 2011, we issued $152.0 million in senior convertible notes due 2016 in a private placement, netting $145.4 million in proceeds after deducting related expenses, of which $135.5 million was subsequently paid to complete the acquisition of Z Corp and Vidar on January 3, 2012. See Note 3 to the Consolidated Financial Statements.
Net cash provided by financing activities increased to $298.7approximately $299.7 million for the year ended 2013 from $112.6 million in 2012. Net cash provided by financing activities in 2011 was $210.0 million. The 2013 cash provided by financing activities primarily resulted from the $272.1 million of net proceeds from the common stock issuance, $26.0 million of tax benefits from share-based paymentDecember 31, 2014.
Off-Balance Sheet Arrangements
We have no off-balance sheet arrangements and from $0.9 million of stock-based compensation proceeds, partially offset by a $0.2 million repayment of capital lease obligations. The 2012 cash provided bydo not utilize any “structured debt,” “special purpose,” or similar unconsolidated entities for liquidity or financing primarily resulted from the $106.9 million of net proceeds from the common stock issuance and from $4.4 million of stock-based compensation proceeds. The 2011 proceeds primarily resulted from the previously discussed net proceeds of the common stock issuance and net proceeds of the convertible notes issuance and from $2.8 million of stock-based compensation proceeds. purposes.
Contractual Commitments and Off-Balance Sheet Arrangements
Our principal commitments at December 31, 20132016 consisted of the capital lease on our Rock Hill, South Carolina facility, operating leases, deferred purchase price and earnouts on acquisitions and purchase obligations, which are discussed in greater detail below. Tables 12 and 1319 below summarizesummarizes our contractual obligations as of December 31, 2013.
Future contractual payments at December 31, 2013 are set forth below. 2016.
Table 1219
| | | | | | | | | | | | | | | | | | | | | | | | | | | | | | |
| | Years Ending December 31, | | Years Ending December 31, |
(Dollars in thousands) | | 2014 | | 2015-2016 | | 2017-2018 | | Later Years | | Total | | 2017 | | 2018-2019 | | 2020-2021 | | Later Years | | Total |
Capitalized lease obligations | | $ | 696 | | $ | 1,400 | | $ | 1,433 | | $ | 9,636 | | $ | 13,165 | | $ | 1,074 | | $ | 2,139 | | $ | 1,723 | | $ | 7,491 | | $ | 12,427 |
Non-cancelable operating leases | | | 6,756 | | | 10,031 | | | 6,342 | | | 2,100 | | | 25,229 | | | 12,686 | | | 21,337 | | | 11,279 | | | 14,749 | | | 60,051 |
Purchase obligations | | | 41,091 | | | — | | | — | | | — | | | 41,091 | | | 54,937 | | | — | | | — | | | — | | | 54,937 |
Deferred purchase price on acquisitions | | | 4,500 | | | — | | | — | | | — | | | 4,500 | |
Earnouts on acquisitions | | | 1,372 | | | 4,206 | | | — | | | — | | | 5,578 | |
Principal of senior convertible notes | | | — | | | 12,540 | | | — | | | — | | | 12,540 | |
Interest on senior convertible notes | | | 1,087 | | | 2,242 | | | — | | | — | | | 3,329 | |
Earnouts related to acquisitions | | | | 3,238 | | | 7,568 | | | — | | | — | | | 10,806 |
Total | | $ | 55,502 | | $ | 30,419 | | $ | 7,775 | | $ | 11,736 | | $ | 105,432 | | $ | 71,935 | | $ | 31,044 | | $ | 13,002 | | $ | 22,240 | | $ | 138,221 |
| | | | | | | | | | | | | | | | |
Debt and
Capitalized lease obligations
DebtOur capitalized lease obligations include a lease agreement that we entered into during 2006 with respect to our Rock Hill, SC facility, in addition to other lease agreements assumed through acquisitions. In accordance with ASC 840, “Leases,” we are considered an owner of the properties, therefore, we have recorded these amounts as “building” in our consolidated balance sheet with a corresponding capitalized lease obligation in the liabilities section of the consolidated balance sheet.
Non-cancelable operating leases
We lease certain other facilities under non-cancelable operating leases expiring through 2024. The leases are generally on a net-rent basis, under which we pay taxes, maintenance and insurance. Rental expense for the years ended December 31, 2016, 2015 and 2014 was $13.2 million, $14.0 million and $10.4 million, respectively.
Purchase obligations
As previously discussed,of December 31, 2016, we have supply commitments related to printer assemblies that total $54.9 million compared to $50.7 million at December 31, 2015.
Earnouts related to acquisitions
Certain of our acquisitions contain earnout provisions under which the sellers of the acquired businesses can earn additional amounts. The total liability recorded for these earnouts at December 31, 2016 was $10.8 million. At December 31, 2015, in addition to earnout provisions, certain of our acquisitions also contained deferred purchase payment arrangements. The total liability recorded for these earnouts and deferred purchase payment arrangements totaled $9.8 million at December 31, 2015.
Other Contractual Commitments
Credit facilities
In October 2014, we entered into a $150.0 million five-year revolving, unsecured credit facility. The agreement provides for advances in the initial aggregate principal amount of up to $150.0 million. Subject to certain terms and conditions contained in the agreement, we may, at our option, request an increase in the aggregate principal amount available under the credit facility by an additional $75.0 million. As of December 31, 2016 and December 31, 2015, there was no outstanding balance on the credit facility. As of December 31, 2016, we met all financial covenant requirements and had full availability on the credit facility. Future results may impact availability. See Note 11 to the Consolidated Financial Statements.
Redeemable noncontrolling interests
The minority interest shareholders of a certain subsidiary have the right to require us to acquire either a portion of or all ownership interest under certain circumstances pursuant to a contractual arrangement, and we have a similar call option under the same contractual terms. The amount of consideration under the put and call rights is not a fixed amount, but rather is dependent upon various valuation formulas and on future events, such as revenue and gross margin performance of the subsidiary through the date of exercise, as described in Note 22 to the Consolidated Financial Statements. Management estimates, assuming that the subsidiary owned by us at December 31, 2016 performs over the relevant future periods at its forecasted earnings levels, that these rights, if exercised, could require us in a future period to pay a maximum of approximately $8.9 million to the owners of such put rights. This amount has been recorded as redeemable noncontrolling interests on the balance sheet at December 31, 2016 and 2015.
Convertible notes
In November 2011, we issued $152.0 million of 5.50% senior convertible notes due 2016 inDecember 2016. The notes were issued with an aggregate principal amounteffective yield of $152.05.96% based upon an original issue discount at 98.0%. The net proceeds from the issuance of these notes, after deducting original issue discount and capitalized issuance costs of $6.6 million, amounted to $145.4 million. These notes bear interest at a fixed rate of 5.50% per annum, payable June 15 and December 15 of each year while they are outstanding. Interest payments began June 15, 2012. The net proceeds of the notes were used to fund the acquisition of Z Corp and Vidar and for general corporate purposes.
The notes are convertible into shares of the Company’s Common Stock at a conversion rate equivalent to 69.932 shares of Common Stock per $.001 million principal amount of notes, which amounts to a conversion price of $14.31 per common share. Upon conversion, the Company has the option to pay cash or issue Common Stock, or a combination thereof. The aggregate principal amount of these notes then outstanding matures on December 15, 2016, unless earlier converted or repurchased in accordance with the terms of the notes.
Conditions for conversion have been satisfied and the notes are convertible. During 2013, note holders converted $80.8 million aggregate principal amount of notes, which converted into 5.5 million shares of common stock. We recognized an $11.3 million loss on conversion of these notes in interest and other expense, net. As of December 31, 2013,2016 and 2015, there was no outstanding balance for the aggregate principal amountnotes. During the third quarter of notes outstanding was $12.5 million. If additional conversions occur, we will recognize the impact of those conversions in interest and other expense, net and interest expense going forward will be reduced.
As of February 19, 2014, the aggregate principal amountremaining $12.5 million of outstanding notes outstanding was $12.5 million.
The notes containwere converted, reflecting a numberloss of covenants covering, among other things, payment of notes, reporting, maintenance of existence, and payment of taxes. Failure to comply with these covenants, or any other event of default, could result in acceleration of the principal amount and accrued and unpaid interest on the notes. We were in compliance with all covenants as of December 31, 2013. See Note 11 to the Consolidated Financial Statements. The notes are senior in right of payment (as defined in the Note Agreement).
Leases
On February 8, 2006, we entered into a lease agreement with KDC-Carolina Investments 3, LP (now Lex Rock Hill, LP successor) pursuant to which KDC constructed and leased to us an approximately 80,000 square foot building in Rock Hill, South Carolina. Under the terms of this lease the landlord agreed to lease the building to us for an initial 15‑year term following completion. We took occupancy of the building in November 2006. See Note 12 to the Consolidated Financial Statements.
After its initial term, the lease provides us with the option to renew the lease for two additional five-year terms as well as the right to cause the landlord, subject to certain terms and conditions, to expand the leased premises during the term of the lease, in which case the term of the lease would be extended. The lease is a triple net lease and provides$1.8 million for the payment of base rent of approximately $0.7 million in 2013 through 2021, including a rent escalation in 2016. Under the terms of the lease, we are obligated to pay all taxes, insurance, utilities and other operating costs with respect to the leased premises.
In accordance with ASC 840, “Leases,” we are considered an owner of the property. Therefore, we have recorded $7.5 million and $7.6 million at December 31, 2013 and 2012, respectively, as building in our consolidated balance sheet with a corresponding capitalized lease obligation in the liabilities section of the consolidated balance sheet. See Note 12 to the Consolidated Financial Statements.
Our outstanding capitalized lease obligations at December 31, 2012 and December 31, 2011 were as follows:
Table 13
| | | | | | |
(Dollars in thousands) | | 2013 | | 2012 |
Capitalized lease obligations: | | | | | | |
Current portion of capitalized lease obligations | | $ | 187 | | $ | 174 |
Capitalized lease obligations, long-term portion | | | 7,277 | | | 7,443 |
Total capitalized lease obligations | | $ | 7,464 | | $ | 7,617 |
Capitalized lease obligations of $7.5 million at December 31, 2013 decreased from $7.6 million at December 31, 2012 primarily due to scheduled payments of principal on capital lease installments.
We lease certain other facilities under non-cancelable operating leases expiring through 2023. The leases are generally on a net-rent basis, under which we pay taxes, maintenance and insurance. We expect leases that expire to be renewed or replaced by leases on other properties. Rental expense for the yearsyear ended December 31, 2013, 2012 and 2011 was $6.9 million, $5.0 million and $2.7 million, respectively.
Other contractual commitments
The Company has supply commitments for printer assemblies that total $41.1 at December 31, 2013, compared to $10.9 at December 31, 2012.
For certain of our acquisitions, we are obligated for the payment of deferred purchase price totaling $4.5 million. Certain of the acquisition purchase agreements contain earnout provisions under which the sellers of the acquired businesses can earn additional amounts. The total amount of liabilities recorded for these earnouts is $5.6 million at December 31, 2013 compared to $2.6 million at December 31, 2012. See Note 3 for details of acquisitions and related commitments. 2014.
Indemnification
In the normal course of business we periodically enter into agreements to indemnify customers or suppliers against claims of intellectual property infringement made by third parties arising from the use of our products. Historically, costs related to these indemnification provisions have not been significant. We are unable to estimate the maximum potential impact of these indemnification provisions on our future results of operations.
To the extent permitted under Delaware law, we indemnify our directors and officers for certain events or occurrences while the director or officer is, or was, serving at our request in such capacity, subject to limited exceptions. The maximum potential amount of future payments we could be required to make under these indemnification obligations is unlimited; however, we have directorsdirectors’ and officersofficers’ insurance coverage that may enable us to recover future amounts paid, subject to a deductible and to the policy limits.
We do not utilize any “structured debt,” “special purpose” or similar unconsolidated entities for liquidity or financing purposes.
Financial instruments
We conduct business in various countries using both the functional currencies of those countries and other currencies to effect cross border transactions. As a result, we are subject to the risk that fluctuations in foreign exchange rates between the dates that those transactions are entered into and their respective settlement dates will result in a foreign exchange gain or loss. When practicable, we endeavor to match assets and liabilities in the same currency on our balance sheet and those of our subsidiaries in order to reduce these risks. We also, when we consider it to be appropriate, enter into foreign currency contracts to hedge exposures arising from those transactions. There were no foreign exchange contracts at December 31, 2016 or 2015.
We do not hedge for trading or speculative purposes, and our foreign currency contracts are generally short-term in nature, typically maturing in 90 days or less. We have elected not to prepare and maintain the documentation to qualify for hedge accounting treatment under ASCFinancial Accounting Standards Board (“FASB”) Accounting Standard Codification (“ASC”) 815, “Derivatives“Derivatives and Hedging,” and therefore, we recognize all gains and losses (realized or unrealized) in interest and other expense, net in our Consolidated Statements of IncomeOperations and Other Comprehensive Income.Loss.
Changes in the fair value of derivatives are recorded in interest and other expense, net, in our Consolidated Statements of IncomeOperations and Other Comprehensive Income.Loss. Depending on their fair value at the end of the reporting period, derivatives are recorded either in prepaid and other current assets or in accrued liabilities in our Consolidated Balance Sheets.
The total impact of foreign currency related items on ourSee Note 10 to the Consolidated Statements of Income and Comprehensive Income was a loss of $0.8 million for 2013, a gain of $0.1 million in 2012, and a loss of $0.1 million in 2011.Financial Statements.
Critical Accounting Policies and Significant Estimates
The discussion and analysis of our results of operations and financial condition set forth in this Form 10-K is based on our Consolidated Financial Statements, which have been prepared in accordance with U.S. generally accepted accounting principles.GAAP. The preparation of these financial statements requires us to make critical accounting estimates that directly impact our Consolidated Financial Statements and related disclosures.
Critical accounting estimates are estimates that meet two criteria:
| · | | The estimates require that we make assumptions about matters that are highly uncertain at the time the estimates are made; and |
| · | | There exist different estimates that could reasonably be used in the current period, or changes in the estimates used are reasonably likely to occur from period to period, both of which would have a material impact on our results of operations or financial condition. |
On an ongoing basis, we evaluate our estimates, including those related to stock-based compensation, revenue recognition, the allowance for doubtful accounts, income taxes, inventories, pensions, goodwill and other intangible and long-lived assets and contingencies. We base our estimates and assumptions on historical experience and on various other assumptions that we believe are reasonable under the circumstances, the results of which form the basis for making judgments about the carrying values of assets and liabilities that are not readily apparent from other sources. Actual results may differ from these estimates under different assumptions or conditions.
The following paragraphs discuss the items that we believe are the critical accounting policies most affected by significant management estimates and judgments. Management has discussed and periodically reviews these critical accounting policies, the basis for their underlying assumptions and estimates and the nature of our related disclosures herein with the Audit Committee of the Board of Directors.
Revenue recognition
Net revenue is derived primarily from the sale of products and services. The following revenue recognition policies define the manner in which we account for sales transactions.
We recognize revenue when persuasive evidence of a sale arrangement exists, delivery has occurred or services are rendered, the sales price or fee is fixed or determinable and collectability is reasonably assured. Revenue generally is recognized net of allowances for returns and any taxes collected from customers and subsequently remitted to governmental authorities. We sell our products through our direct sales force and through authorized resellers. We recognize revenue on sales to resellersreseller partners at the time of sale when the resellerpartner has economic substance apart from us, and we have completed our obligations related to the sale.
We enter into sales arrangements that may provide for multiple deliverables to a customer. Sales of printers may include ancillary equipment, print materials, warrantywarranties on the equipment, training and installation. We identify all goods and/or services that are to be delivered separately under a sales arrangement and allocate revenue to each deliverable based on either vendor-specific objective evidence (“VSOE”) or if VSOE is not determinable then we use best estimated selling price (“BESP”) of each deliverable. We establish VSOE of selling price using the price charged for a deliverable when sold separately. The objective of BESP is to determine the price at which we would transact a sale if the deliverable was sold regularly on a stand-alone basis. We consider multiple factors including, but not limited to, market conditions, geographies, competitive landscape and entity-specific factors such as internal costs, gross margin objectives and pricing practices when estimating BESP. Consideration in a multiple element arrangement is then allocated to the elements on a relative sales value basis using either VSOE or BESP for all the elements. We also evaluate the impact of undelivered items on the functionality of delivered items for each sales transaction and, where appropriate, defer revenue on delivered items when that functionality has been affected. Functionality is determined to be met if the delivered products or services represent a separate earnings process.
Hardware
In general, revenues are separated between printers and other products, print materials, training services, maintenance services and installation services. The allocated revenue for each deliverable is then recognized based on relative fair values of the components of the sale, consistent within the scope of Financial Accounting Standards Board (“FASB”) Accounting Standards Codification (“ASC”) 605 Revenue Recognition.
Under our standard terms and conditions of sale, title and risk of loss transfertransfers to the customer at the time product is shipped to the customer and revenue is recognized accordingly, unless customer acceptance is uncertain or significant obligations remain. We defer the estimated revenue associated with post-sale obligations that are not essential to the functionality of the delivered items, and recognize revenue in the future as the conditions for revenue recognition are met.
Software
We also market and sell software tools that enable our customers to capture and customize content using our printers, as well as reverse engineering and inspection software. The software does not require significant modification or customization. We apply the guidance in ASC 985-605, Software-Revenue Recognition (“ASC 985”) in recognizing revenue when software is more than incidental to the product or service as a whole based on fair value using vendor-specific objective evidence. Revenue from perpetual software licenses is recognized either upon delivery of the product or delivery of a key code which allows the customer to access the software. In instances where software access is provided for a trial period, revenue is not recognized until the customer has purchased the software at the expiration of the trial period. We use the residual method to allocate revenue to software licenses at the inception of the license term when VSOE of fair value for all undelivered elements, such as maintenance, exists and all other revenue recognition criteria have been satisfied. In instances in which customers purchase post sale support, it is considered a separate element from the software and is deferred at the time of sale and subsequently amortized in future periods.
We also sell equipment with embedded software to our customers. The embedded software is not sold separately, it is not a significant focus of the marketing effort and we do not provide post-contract customer support specific to the software or incur significant costs that are within the scope of ASC 985. Additionally, the functionality that the software provides is marketed as part of the overall product. The software embedded in the equipment is incidental to the equipment as a whole such that ASC 985 is not applicable. Sales of these products are recognized in accordance with ASC 605.25,605-25, “Multiple-Element Arrangements.”
Services
Printers and certain other products include a warranty under which we provide maintenance for periods up to one year, as well as training, installation and non-contract maintenance services. We defer this portion of the revenue at the time of sale based on the relative fair value of these services. Deferred revenue is recognized ratably according to the term of the warranty. Costs associated with our obligations during the warranty period are expensed as incurred. After the initial warranty period, we offer these customers optional maintenance contracts. Deferred maintenance revenue is recognized ratably, on a straight-line basis, over the period of the contract, and recognizes the costs associated with these contracts are recognized as incurred. Revenue from training, installation and non-contract maintenance services is recognized at the time of performance.
Quickparts
On-demand parts service sales and healthcare services are included within services revenue and revenue is recognized upon shipment or delivery of the parts, based on the terms of the sales arrangement.
Terms of sale
Shipping and handling costs billed to customers for equipment sales and sales of print materials are included in product revenue in the consolidated statements of incomeoperations and other comprehensive income.loss. Costs we incur associated with shipping and handling are included in product cost of sales in the Consolidated Statementsconsolidated statements of Incomeoperations and Other Comprehensive Income.other comprehensive loss.
Credit is extended, and creditworthiness is determined, based on an evaluation of each customer’s financial condition. New customers are generally required to complete a credit application and provide references and bank information to facilitate an analysis of creditworthiness. Customers with a favorable profile may receive credit terms that differ from our general credit terms. Creditworthiness is considered, among other things, in evaluating our relationship with customers with past due balances.
Our terms of sale generally require payment within 30 to 60 days after shipment of a product, although we also recognize that longer payment periods are customary in some countries where we transact business. To reduce credit risk in connection with printer sales, we may, depending upon the circumstances, require significant deposits prior to shipment and may retain a security interest in a system sold until fully paid. In some circumstances, we may require payment in full for our products prior to shipment and may require international customers to furnish letters of credit. For maintenance services, we either bill customers on a time-and-materials basis or sell customers service agreements that are recorded as deferred revenue and provide for payment in advance on either an annual or other periodic basis.
Allowance for doubtful accounts
In evaluating the collectability of our accounts receivable, we assess a number of factors, including a specific customer’s abilitycustomers’ abilities to meet itstheir financial obligations to us, such as whether a customer declares bankruptcy. Other factors include the length of time the receivables are past due and historical collection experience. Based on these assessments, we may record a reserve for specific customers, as well as a general reserve based on our historical experienceand allowance for bad debts.returns and discounts. If circumstances related to specific customers change, or economic conditions deteriorate such that our past collection experience is no longer relevant, our estimate of the recoverability of our accounts receivable could be further reduced from the levels provided for in the Consolidated Financial Statements.
Our estimate for the allowance for doubtful accounts related to trade receivables is based on two methods. The amounts calculated from each of these methods are combined to determine the total amount reserved.
First, weWe evaluate specific accounts wherefor which we have information that thebelieve a customer may have an inability to meet their financial obligations (for example, aging over 90 days past due or bankruptcy). In these cases, we use our judgment, based on available facts and circumstances, and record a specific reserve for that customer against amounts due to reduce the receivable to thean amount that is expectedwe expect to be collected.collect. These specific reserves are re-evaluated and adjusted as additional information is received that impacts the amount reserved.
Second, a general reserve is established for all customers based on historical collection and write-off experience.
Our estimate of the allowance for doubtful accounts for financing receivables is determined by evaluating specific accounts for which the borrower is past due more than 90 days, or for which it has information that the borrower may be unable to meet its financial obligations (for example, bankruptcy). In these cases, we use judgment, based on the available facts and circumstances, and record a specific reserve for that borrower against amounts due to reduce the outstanding receivable balance to the amount that is expected to be collected. If there are any specific reserves, they are re-evaluated and adjusted as additional information is received that impacts the amount reserved.
We also provide an allowance account for returns and discounts. This allowance is evaluated on a specific account basis. In addition, we provide a general reserve for all customers that have not been specifically identified based on historical experience.
Our bad debt expense increased to $5.0was $1.6 million, in 2013 from $3.0$3.8 million in 2012 and $1.7$8.7 million in 2011. The higher expense in 2013 was due to higher receivables related to increased revenue.for the years ended December 31, 2016, 2015 and 2014.
Our allowance for doubtful accounts increased to $8.1 million, or 6.2% of outstanding accounts receivable, at December 31, 2013 from $4.3 million, or 5.4% of outstanding accounts receivable, at December 31, 2012. Our percent of accounts receivable over 90 days past due increased to 9.1% in 2013 from 6.4% in 2012. We believe that our allowance for doubtful accounts is a critical accounting estimate because it is susceptible to change and dependent upon events that may or may not occur and because the impact of recognizing additional allowances for doubtful accounts may be material to the assets reported on our balance sheet and in our results of operations. See “Liquidity and Capital Resources” above.
Income taxes
We and the majority of our domestic subsidiaries file a consolidated U.S. federal income tax return.return, while we have two entities that file separate U.S. federal tax returns. Our non-U.S. subsidiaries file income tax returns in their respective local jurisdictions. We provide for income taxes on those portions of our foreign subsidiaries’ accumulated earnings (deficit) that we believe are not reinvested indefinitely in their businesses.
We account for income taxes under the asset and liability method. Deferred income tax assets and liabilities are recognized for the future tax consequences attributable to differences between the financial statement carrying amounts of existing assets and liabilities and their respective tax bases and tax benefit carryforwards. Deferred income tax liabilities and assets at the end of each period are determined using enacted tax rates.
We record deferred income tax assets arising from temporary differences between recorded net income and taxable net income when and if we believe that future earnings will be sufficient to realize
Under the tax benefit. We provideprovisions of ASC 740, “Income Taxes,” we establish a valuationvaluation allowance for those jurisdictions and on those deferred tax assets wherein which the expiration date of tax benefit carryforwards or the projected taxable earnings indicateleads us to conclude that realization is not likely.
Under the provisions of ASC 740, “Income Taxes,” a valuation allowance is required to be established or maintained when, based on currently available information and other factors, it is more“more likely than notnot” that all or a portion of a deferred income tax asset will not be realized. ASC 740 provides that an important factorThe evaluation process includes the consideration of all available evidence regarding historical results and future projections including the estimated timing of reversals of existing taxable temporary differences and potential tax planning strategies. Once a valuation allowance is established, it is maintained until a change in determining whether a deferred income tax asset will be realized is whether there has beenfactual circumstances gives rise to sufficient income in recent yearsof the appropriate character and whether sufficient income is expected in future years in order to utilizetiming that will allow a partial or full utilization of the deferred income tax asset.
We believe that our estimate of deferred income tax assets and our maintenance of a valuation allowance against such assets are critical accounting estimates because they are subject to, among other things, an estimate of future taxable income in the U.S. and in other non-U.S. tax jurisdictions, which are susceptible to change and dependent upon events that may or may not occur, and because the impact of our valuation allowance may be material to the assets reported on our balance sheet and in our results of operations.
The determination of our income tax provision is complex because we have operations in numerous tax jurisdictions outside the U.S. that are subject to certain risks that ordinarily would not be expected in the U.S. Tax regimes in certain jurisdictions are subject to significant changes, which may be applied on a retroactive basis. If this were to occur, our tax expense could be materially different than the amounts reported.
We periodically estimate the probable tax obligations using historical experience in tax jurisdictions and our informed judgment. There are inherent uncertainties related to the interpretation of tax regulations in the jurisdictions in which we transact business. The judgments and estimates made at a point in time may change based on the outcome of tax audits, as well as changes to, or further interpretations of, regulations. Income tax expense is adjusted in the period in which these events occur, and these adjustments are included in our Consolidated Statements of IncomeOperations and Other Comprehensive Income.Loss. If such changes take place, there is a risk that our effective tax rate may increase or decrease in any period.
Inventories
Inventories are stated at the lower of cost or net realizable value, cost being determined predominantly on the first-in, first-out method. Reserves for inventories are provided based on historical experience and current product demand. Our inventory reserve was $4.3 million at December 31, 2013, compared with $3.5 million at December 31, 2012. We evaluate the adequacy of these reserves quarterly. Our determination of the allowance for inventory reserves is subject to change because it is based on management’s current estimates of required reserves and potential adjustments.
We believe that the allowance for inventory obsolescence is a critical accounting estimate because it is susceptible to change and dependent upon events that may or may not occur and because the impact of recognizing additional obsolescence reserves may be material to the assets reported on our balance sheet and in our results of operations.
Goodwill and other intangible and long-lived assetsSee Note 4 to the Consolidated Financial Statements.
We evaluate long-livedGoodwill
Goodwill reflects the excess of the consideration transferred plus the fair value of any non-controlling interest in the acquiree at the acquisition date over the fair values of the identifiable net assets other than goodwillacquired. Goodwill is not amortized but rather is tested for impairment annually, or whenever events or changescircumstances present an indication of impairment. Goodwill is an asset representing the future economic benefits arising from other assets acquired in circumstances indicatea business combination that are not individually identified and separately recognized. The primary items that generate goodwill include the carrying value of the synergies between the acquired companies and us and the acquired assembled workforce, neither of which qualifies for recognition as an asset may not be recoverable. If the estimated future cash flows (undiscounted and without interest charges) from the use of an asset are less than the carrying value, a write-down would be recorded to reduce the related asset to its estimated fair value.identifiable intangible asset.
The annual impairment testing required by ASC 350, “Intangibles – Goodwill and Other,”Other” requires us to use our judgment and could require us to write down the carrying value of our goodwill and other intangible assets in future periods. As required by ASC 350, we have allocatedWe allocate goodwill to our identifiable geographic reporting units, the Americas, EMEA and APAC regions, which are tested for impairment using a two-step process detailed in that statement. See Notes 6 and 7 to the Consolidated Financial Statements.process. The first step requires comparing the fair value of each reporting unit with ourthe carrying amount, including goodwill. If that fair value exceeds the carrying amount, the second step of the process is not required to be performed, and no impairment charge is required to be recorded. If that fair value does not exceed thethat carrying amount, we must perform the second step, which requires an allocation of the fair value of the reporting unit to all assets and liabilities of that unit as if the reporting unit had been acquired in a purchase business combination and the fair value of the reporting unit was the purchase price. The goodwill resulting from that purchase price allocation is then compared to the carrying amount with any excess recorded as an impairment charge.
The evaluation of goodwill impairment requires us to make assumptions about future cash flows of the reporting unit being evaluated that include, among others, growth in revenues, margins realized, level of operating expenses and cost of capital. These assumptions require significant judgment and actual results may differ from assumed and estimated amounts.
Goodwill set forth on the Consolidated Balance Sheet as of December 31, 20132016 arose from acquisitions carried out in 2013, 2012, 2011, 2010,from 2009 to 2015 and in years prior to December 31, 2007. Goodwill arising from acquisitions prior to 2007 was allocated to geographic reporting units based on the percentage of SLS printers then installed by geographic area. Goodwill arising from acquisitions sincein 2009 to 2015 was allocated to geographic reporting units based on geographic dispersion of the acquired companies’ sales or capitalization at the time of their acquisition.
Pursuant to the requirements of ASC 350, we are required to perform a valuation of each of our three geographic reporting units annually, or upon significant changes in our business environment. We conducted our annual impairment analysistesting for the year ended December 31, 2016 in the fourth quarter of 2013. To determine2016. There was no goodwill impairment for the year ended December 31, 2016.
We conducted our annual impairment testing for the year ended December 31, 2015 in the fourth quarter of 2015. The results of the first step of our annual impairment testing indicated the carrying amount of goodwill assigned to the Americas and EMEA reporting units exceeded fair value and that the carrying amount of goodwill assigned to APAC did not exceed fair value. Based on these results, management completed the second step of annual impairment testing for the Americas and EMEA reporting units. Management determined that the fair value associated with goodwill assigned to the Americas was zero, resulting in a non-cash, non-tax deductible impairment charge of each reporting unit we utilized discounted cash flows, using five years of projected unleveraged free cash flows and terminal EBITDA earnings multiples. The discount rates used$382.3 million for the analysis reflected a weighted average costyear ended December 31, 2015. Management determined that the carrying amount of capital based on industry and capital structure adjusted for equity risk premiums and size risk premiums based on market capitalization. The discounted cash flow valuation uses projections of future cash flows and includes assumptions concerning future operating performance and economic conditions and may differ from actual future cash flows. We also considered the current trading multiples of comparable publicly-traded companies andgoodwill assigned to the historical pricing multiples for comparable merger and acquisition transactions that have occurred in the industry. Under each fair value measurement methodology considered, the fair value of eachEMEA reporting unit exceeded its carrying value; accordingly, no goodwillfair value by approximately 29%, resulting in a non-cash, non-tax deductible impairment adjustments were recorded oncharge of $61.4 million for the year ended December 31, 2015. See Notes 2 and 7 to our Consolidated Balance Sheet.
The control premium that a third party would be willing to pay to obtain a controlling interest in 3D Systems Corporation was considered when determining fair value. In addition, factors such as the performance of competitors were also considered.
Management concluded that there was a reasonable basis for the excess of the estimated fair value of the geographic reporting units over its market capitalization.
The estimated fair value of the three geographic reporting units incorporated judgment and the use of estimates by management. Potential factors requiring assessment include a further or sustained decline in our stock price, variance in results of operations from projections, and additional acquisition transactions in the industry that reflect a lower control premium. Any of these factors may cause us to re-evaluate goodwill during any quarter throughout the year. If an impairment charge was to be taken for goodwill it would be a non-cash charge and would not impact our cash position or cash flows; however such a charge could have a material impact to equity and the Consolidated Statement of Income and Comprehensive Income.Financial Statements.
There was no goodwill impairment for the yearsyear ended December 31, 2013, 2012 or 2011.2014.
We will evaluatemonitor our reporting units in an effort to determine whether events and circumstances warrant further interim impairment testing. We could be required to write off or write down additional amounts in the future in the event of deterioration in our future performance, sustained slower growth or other circumstances.
Other Intangible Assets
Intangible assets other than goodwill primarily represent acquired intangible assets including licenses, patent costs, acquired technology, internally developed technology, customer relationships, non-compete agreements, trade names and trademarks. Intangible assets with finite lives are amortized using the straight-line method over their estimated useful life, which is determined by identifying the period over which most of the cash flows are expected to be generated.
For intangibles with finite lives, we review the carrying amounts for potential impairment when events or changes in circumstances indicate that the carrying amount of an asset may not be recoverable. Examples of such a change in circumstances include a significant decrease in selling price, a significant adverse change in the extent or manner in which an asset is being used, or a significant adverse change in the legal or business climate. In evaluating recoverability, we group assets and liabilities at the lowest level such that the identifiable cash flows relating to the group are largely independent of the cash flows of other assets and liabilities. We then compare the carrying amounts of the assets or asset groups with the related estimated undiscounted future cash flows. In the event impairment exists, an impairment charge is recorded as the amount by which the carrying amount of the asset or asset group exceeds the fair value. Fair value is determined by reference to estimated selling values of long-lived assets in accordance with ASC 360, “Property, Plantsimilar condition or by using a discounted cash flow model. In addition, the remaining amortization period for the impaired asset would be reassessed and, Equipment” if events transpire to indicate potential impairment. necessary, revised.
No impairment loss wascharges for intangible assets with finite lives were recorded for the periods presented.year ended December 31, 2016. We recorded non-cash impairment charges of $93.5 million as a result of our other intangible assets impairment testing for the year ended December 31, 2015. No impairment charges for intangible assets with finite lives were recorded for the year ended December 31, 2014.
DeterminingSee Notes 2 and 6 to the fair value of a reporting unit, intangible asset or a long-lived asset is judgmental and involves the use of significant estimates and assumptions. Management bases its fair value estimates on assumptions that it believes are reasonable but are uncertain and subject to changes in market conditions.Consolidated Financial Statements.
Stock-based compensation
ASC 718, “Compensation – Stock Compensation,” requiresWe maintain stock-based compensation plans that are described more fully in Note 14 to the recognition of the fair value of stock-based compensation. Under the fair value recognition provisions of ASC 718,Consolidated Financial Statements. For service-based awards, stock-based compensation is estimated at the grant date based on the fair value of the awards expected to vest and recognized as expense ratably over the requisite service period of the award. See Note 14 toFor stock options and awards with market conditions, compensation cost is determined at the Consolidated Financial Statements. individual tranche level. We estimate the forfeiture rate based on historical experience.
Contingencies
We account for contingencies in accordance with ASC 450, “Contingencies.”“Contingencies” (“ASC 450”). ASC 450 requires that we record an estimated loss from a loss contingency when information available prior to issuance of our financial statements indicates that it is probable that an asset has been impaired or a liability has been incurred at the date of the financial statements and the amount of the loss can be reasonably estimated. Accounting for contingencies such as legal matters requires us to use our judgment.
Non-GAAP Measures
In addition See Note 22 to our results determined in accordance with U.S. GAAP, management uses certain non-GAAP financial measures, which adjust net income and earnings per share, in assessing our operating performance. Management believes these non-GAAP financial measures of adjusted net income and adjusted earnings per share serve as useful measures in evaluating the overall performance of our business.
Management uses these non-GAAP financial measures to supplement our Consolidated Financial Statements presented on a GAAP basis to facilitate a better understanding of the impact that several significant, strategic acquisitions had on our ongoing financial results.
These non-GAAP financial measures are not prepared in accordance with GAAP and may be different from non-GAAP financial measures used by other companies and they are subject to inherent limitations as they reflect the exercise of judgments by our management about which costs, expenses and other items are excluded from our GAAP financial statements in determining our non-GAAP financial measures. We compensate for these limitations by analyzing current and expected future results on a GAAP basis as well as a non-GAAP basis and also by providing GAAP measures as required in our public disclosures and reconciliations of our non-GAAP financial measures to our GAAP financial statements. The presentation of non-GAAP financial information is not meant to be considered in isolation or as a substitute for the directly comparable financial performance or liquidity measures prepared in accordance with GAAP. The non-GAAP financial measures are meant to supplement, and be viewed in conjunction with, GAAP financial measures. We urge investors to review the reconciliation of our non-GAAP financial measures to the comparable GAAP financial measures included below, and not to rely on any single financial measure to evaluate our business.
As discussed in detail above, we report non-GAAP measures which adjust both net income and earnings per share by excluding the impact of acquisition and severance expenses, intangible amortization, non-cash interest expense, non-cash stock-based compensation and releases of valuation allowances on deferred tax assets. We provide the required reconciliation of GAAP net income and earnings per share to non-GAAP adjusted net income and adjusted earnings per share. See Other Financial Information above.Statements.
Recent Accounting Pronouncements
See Note 2 to ourthe Consolidated Financial Statements included in this report for recently issued accounting standards, including the expected dates of adoption and expected impact to ourthe Consolidated Financial Statements upon adoption.
Item 7A. Quantitative and Qualitative Disclosures about Market Risk
We are exposed to market risk from fluctuations in interest rates, foreign currency exchange rates and commodity prices, which may adversely affect our results of operations and financial condition. We seek to minimize these risks through regular operating and financing activities and, when we consider it to be appropriate, through the use of derivative financial instruments. We do not purchase, hold or sell derivative financial instruments for trading or speculative purposes.
Interest rates
Our exposure to market risk for changes in interest rates relates primarily to our cash and cash equivalents.equivalents and revolving credit facility. We seek to minimize the risk to our cash and cash equivalents by investing cash in excess of our operating needs in short-term, high-quality instruments issued by highly creditworthy financial institutions, corporations or governments. With the amount of cash and cash equivalents and revolving credit facility that we maintained at December 31, 2013,2016, a hypothetical interest rate change of 1 percentage point, or 100 basis points, would have a $3.1$0.3 million effect on our financial position and results of operations.
From time to time, we may use derivative financial instruments, including interest rate swaps, collars or options, to manage our exposure to fluctuations in interest rates. At December 31, 2013,2016 and 2015, we had no such financial instruments outstanding.
Foreign exchange rates
We transact business globally and are subject to risks associated with fluctuating foreign exchange rates. Approximately 44.5% of our consolidated revenue is derived from sales outside the U.S. See “Business—Global Operations” above. ThisOur revenue is generated primarily from the operations of our foreign sales subsidiaries in their respective countries and surrounding geographic areas and the operations of our research and production subsidiary in Switzerland, and is denominated in each subsidiary’s local functional currency although certain sales are denominated in other currencies, rather than the local functional currency. These subsidiaries incur most of their expenses (other than intercompany expenses) in their local functional currencies. These currencies include the Euro, Australian Dollar,Dollars, Brazilian Real, British Pound, Swiss Franc,Pounds, Chinese Yuan, Euros, Indian Rupee, Israeli Shekel, Japanese Yen, Mexican Peso, South Korean Won, Japanese YenSwiss Francs and Indian Rupee.Uruguayan Peso.
The geographic areas outside the U.S. in which we operate are generally not considered to be highly inflationary. Nonetheless, these foreign operations are sensitive to fluctuations in currency exchange rates arising from, among other things, certain intercompany transactions that are generally denominated in U.S. dollars rather than in their respective functional currencies. Our operating results, as well as our assets and liabilities, are also subject to the effects of foreign currency translation when the operating results, assets and liabilities of our foreign subsidiaries are translated into U.S. dollars in our Consolidated Financial Statements.
We and our subsidiaries conduct business in various countries using both the functional currencies of those countries and other currencies to effect cross border transactions. As a result, we and our subsidiaries are subject to the risk that fluctuations in foreign exchange rates between the dates that those transactions are entered into and their respective settlement dates will result in a foreign exchange gain or loss. When practicable, we endeavor to match assets and liabilities in the same currency on our U.S. balance sheet and those of our subsidiaries in order to reduce these risks. We also, when we consider it appropriate, enter into foreign currency contracts to hedge exposures arising from those transactions.
We do not hedge for trading or speculative purposes, and our foreign currency contracts are generally short-term in nature, typically maturing in 90 days or less. We have elected not to prepare and maintain the documentation to qualify for hedge accounting treatment under ASC 815, “Derivatives and Hedging,” and therefore, we recognize all gains and losses (realized or unrealized) in interest and other expense, net in our Consolidated Statements of IncomeOperations and Comprehensive Income.Loss.
As noted above, we may use derivative financial instruments, including foreign exchange forward contracts and foreign currency options, to fix or limit our exposure to currency fluctuations. We do not hedge our foreign currency exposures in a manner that would entirely eliminate the effects of changes in foreign exchange rates on our consolidated net income or loss.
At December 31, 20132016, a hypothetical change of 10% in foreign currency exchange rates would cause approximately a $22.9$31.2 million change in revenue in our Consolidated StatementStatements of IncomeOperations and Comprehensive IncomeLoss assuming all other variables were held constant.
Commodity prices
We use various raw materials and energy products in conjunction with our printer assembly and print materials blending processes. Generally, we acquire such components at market prices and do not use financial instruments to hedge commodity prices. As a result, we are exposed to market risks related to changes in commodity prices of these components. At December 31, 2013,2016, a hypothetical 10% change in commodity prices for raw materials would cause approximately a $0.9an approximate $1.4 million change to cost of sales in our Consolidated StatementStatements of IncomeOperations and Comprehensive Income.Loss.
Item 8. Financial Statements and Supplementary Data
Our Consolidated Financial Statements and the related notes, together with the Report of Independent Registered Public Accounting Firm thereon, are set forth below beginning on pagespage F-1 through F-43and are incorporated herein by reference.
Item 9. Changes in and Disagreements with Accountants on Accounting and Financial Disclosure
Not applicable.
Item 9A. Controls and Procedures
Evaluation of Disclosure Controls and Procedures
Disclosure controls and procedures (as defined in Rules 13a-15(e) and 15d-15(e) under the Securities Exchange Act of 1934, as amended (“the Exchange Act”)), are controls and procedures that are designed to provide reasonable assurance that information required to be disclosed in the reports that we file or submit under the Exchange Act is recorded, processed, summarized and reported within the time periods specified in the SEC’s rules and forms, and that such information is accumulated and communicated to our management, including our Chief Executive Officer and Chief Financial Officer, in a manner to allow timely decisions regarding required disclosures.
As of December 31, 2013,2016, we carried out an evaluation, under the supervision and with the participation of our management, including our Chief Executive Officer and Chief Financial Officer, of the effectiveness of the design and operation of our disclosure controls and procedures (as defined in Rules 13a-15(e) and 15d-15(e) of the Securities Exchange Act of 1934, as amended (the “Exchange Act.”)) pursuant to Rules 13a-1513a-15(e) and 15d-1515d-15(e) under the Exchange Act. These controls and procedures were designed to provide reasonable assurance that information required to be disclosed in the reports that we file or submit under the Exchange Act is recorded, processed, summarized and reported within the time periods specified in the SEC’s rules and forms and that such information is accumulated and communicated to management, including our Chief Executive Officer and Chief Financial Officer, in a manner to allow timely decisions regarding required disclosures.
Based on this evaluation, including an evaluation of the rules referred to above in this Item 9A, management has concluded that our disclosure controls and procedures were effective as of December 31, 20132016 to provide reasonable assurance that information required to be disclosed in the reports that we file or submit under the Exchange Act is recorded, processed, summarized and reported within the time periods specified in the SEC’s rules and forms and that such information is accumulated and communicated to management, including our Chief Executive Officer and Chief Financial Officer, in a manner to allow timely decisions regarding required disclosures.
Management’s Report on Internal Control over Financial Reporting
Our management is responsible for establishing and maintaining adequate internal control over financial reporting, as such term is defined in Rules 13a-15(f) and 15d-15(f) under the Securities Exchange Act of 1934.Act. Internal control over financial reporting is a process designed under the supervision of our principal executive and principal financial officers to provide reasonable assurance regarding the reliability of financial reporting and the preparation of financial statements for external purposes in accordance with accounting principles generally accepted in the United States of America.GAAP.
Our internal control over financial reporting is supported by written policies and procedures that pertain to the maintenance of records that, in reasonable detail, accurately and fairly reflect the transactions and dispositions of our assets, provide reasonable assurance that transactions are recorded as necessary to permit the preparation of financial statements in accordance with accounting principles generally accepted in the United States of AmericaGAAP and that our receipts and expenditures are being made and recorded only in accordance with authorizations of our management and provide reasonable assurance regarding the prevention or timely detection of unauthorized acquisition, use or disposition of our assets that could have a material effect on our financial statements.
In connection with the preparation of this Form 10-K, with the participation of our Chief Executive Officer and Chief Financial Officer, we conducted an evaluation of the effectiveness of our internal control over financial reporting as of December 31, 20132016 based on the criteria established in Internal Control—Integrated Framework issued by the Committee of Sponsoring Organizations of the Treadway Commission in 19922013 (“COSO”). Our assessment included an evaluation of the design of our internal control over financial reporting and testing of the operational effectiveness of our internal control over financial reporting. Based on this evaluation, our management has concluded that our internal control over financial reporting was effective as of December 31, 2013.2016.
Because of its inherent limitations, a system of internal control over financial reporting can provide only reasonable assurance and may not prevent or detect misstatements. In addition, projections of any evaluation of effectiveness to future periods are subject to the risks that controls may become inadequate because of changes in conditions and that the degree of compliance with the policies or procedures may deteriorate.
BDO USA, LLP, the independent registered public accounting firm whothat audited our Consolidated Financial Statements included in this Form 10-K, has issued a report on our internal control over financial reporting, which is included in Item 8 of this Form 10-K.
Changes in Internal Controls over Financial Reporting
There were no changes in our internal control over financial reporting (as defined in Rules 13a-15(f) and 15d-15(f) under the Securities Exchange Act) during the quarter ended December 31, 2013period covered by this Form 10-K that materially affected, or are reasonably likely to materially affect, our internal control over financial reporting.
Item 9B. Other Information
None.
PART III
Item 10. Directors, Executive Officers and Corporate Governance
The information required in response to this Item will be set forth in our Proxy Statement for our 20142017 Annual Meeting of Stockholders (“Proxy Statement”) under the captions “Election of Directors,” “Corporate Governance Matters,” “Section 16(a) Beneficial Ownership Reporting Compliance,” “Corporate Governance Matters—Code of Conduct and Code of Ethics,” “Corporate Governance Matters—Corporate Governance and Nominating Committee,” and “Corporate Governance Matters—Audit Committee.” Such information is incorporated herein by reference.
Item 11. Executive Compensation
The information in response to this Item will be set forth in our Proxy Statement for our 2014 Annual Meeting of Stockholders under the captions “Director Compensation,” “Executive Compensation,” “Corporate Governance Matters—Compensation Committee,” and “Executive Compensation—Compensation Committee Report.” Such information is incorporated herein by reference.
Item 12. Security Ownership of Certain Beneficial Owners and Management and Related Stockholder Matters
Except as set forth below, the information required in response to this Item will be set forth in our Proxy Statement for our 20142017 Annual Meeting of Stockholders under the caption “Security Ownership of Certain Beneficial Owners and Management.” Such information is incorporated herein by reference.
Equity Compensation Plans
The following table summarizes information about the equity securities authorized for issuance under our compensation plans as of December 31, 2013.2016. For a description of these plans, please see Note 14 to the Consolidated Financial Statements.
| | | | | | | | | |
(in thousands) | | Number of securities to be issued upon exercise of outstanding stock options, warrants and rights (a) | | Weighted average exercise price of outstanding options, warrants and rights (b) | | Number of securities remaining available for future issuance under equity compensation plans |
Plan Category | | | | | | | | | |
Equity compensation plans approved by stockholders | | | 2,927 | | $ | 13.92 | | | 1,835 |
Equity compensation plans not approved by stockholders | | | — | | | — | | | — |
Total | | | 2,927 | | $ | 13.92 | | | 1,835 |
| | | | | | | | | |
| (a) | | | | | | | | |
(Dollars in thousands)
| | Number of securities to be issued upon exercise of outstandingIncludes 667 restricted stock options, warrants and rights
| | Weighted average exercise price of outstanding options, warrants and rights
| | Number of securities remaining available for future issuanceunits approved under equity compensation plans
|
Plan Category
| | | | | | | | | |
Equity compensation plans approved by stockholders
| | | —
| | $
| —
| | | 1,445 |
Equity compensation plans not approved by stockholders
| | | —
| | | —
| | | —
|
Total
| | | —
| | $
| —
| | | 1,445 |
| | | | | | | | | our stockholders. |
| (b) | | Does not reflect the restricted stock units included in the first column that do not have an exercise price. |
Item 13. Certain Relationships and Related Transactions and Director Independence
The information required in response to this Item will be set forth in our Proxy Statement for our 2014 Annual Meeting of Stockholders under the captions “Corporate Governance Matters—Director Independence” and “Corporate Governance Matters – Related Party Transaction Policies and Procedures.” Such information is incorporated herein by reference.
Item 14. Principal Accounting Fees and Services
The information in response to this Item will be set forth in our Proxy Statement for our 2014 Annual Meeting of Stockholders under the caption “Fees of Independent Registered Public Accounting Firm.” Such information is incorporated herein by reference.
PART IV
Item 15. Exhibits, Financial Statement Schedules
| | |
(a)(3) | | Exhibits |
| | The following exhibits are included as part of this filing and incorporated herein by this reference: |
| | |
2.1
| | Acquisition Agreement, dated October 12, 2010, by and among 3D Systems Corporation, 3D Systems Italia, Mr. Francesco Giorgio Buson and Glas S.S. (Incorporated by reference to Exhibit 2.1 to Form 8‑K filed on October 12, 2010.)
|
| | |
2.2
| | Asset Purchase Agreement, dated as of November 1, 2011, by an among 3D Systems Corporation, 3D Systems SA, Huntsman Advanced Materials Americas LLC, and Huntsman Advanced Materials (Switzerland) GmbH. (Incorporated by reference to Exhibit 2.1 to Form 8-K filed on November 1, 2011.)
|
| | |
2.3
| | Stock Purchase Agreement, dated November 21, 2011, by and among 3D Systems Corporation, 3D Systems, Inc., Contex Group A/S, and Ratos AB. (Incorporated by reference to Exhibit 2.1 to Form 8-K filed on November 22, 2011.)
|
| | |
3.1 | | Certificate of Incorporation of Registrant. (Incorporated by reference to Exhibit 3.1 to Registrant’s Form 8‑B filed on August 16, 1993, and the amendment thereto, filed on Form 8‑B/A on February 4, 1994.) |
| | |
3.2 | | Amendment to Certificate of Incorporation filed on May 23, 1995. (Incorporated by reference to Exhibit 3.2 to Registrant’s Registration Statement on Form S‑2/A, filed on May 25, 1995.) |
| | |
3.3 | | Certificate of Designation of Rights, Preferences and Privileges of Preferred Stock. (Incorporated by reference to Exhibit 2 to Registrant’s Registration Statement on Form 8‑A filed on January 8, 1996.) |
| | |
3.4 | | Certificate of Designation of the Series B Convertible Preferred Stock, filed with the Secretary of State of Delaware on May 2, 2003. (Incorporated by reference to Exhibit 3.1 to Registrant’s Current Report on Form 8‑K, filed on May 7, 2003.) |
| | |
3.5 | | Certificate of Elimination of Series A Preferred Stock filed with the Secretary of State of Delaware on March 4, 2004. (Incorporated by reference to Exhibit 3.6 ofto Registrant’s Annual Report on Form 10‑K for the year ended December 31, 2003, filed on March 15, 2004.) |
| | |
3.6 | | Certificate of Elimination of Series B Preferred Stock filed with the Secretary of State of Delaware on June 9, 2006. (Incorporated by reference to Exhibit 3.1 ofto Registrant’s Current Report on Form 8‑K, filed on June 9, 2006.) |
| | |
3.7 | | Certificate of Amendment of Certificate of Incorporation filed with Secretary of State of Delaware on May 19, 2004. (Incorporated by reference to Exhibit 3.1 of theto Registrant’s Quarterly Report on Form 10‑Q for the quarterly period ended June 30, 2004, filed on August 5, 2004.) |
| | |
3.8 | | Certificate of Amendment of Certificate of Incorporation filed with Secretary of State of Delaware on May 17, 2005. (Incorporated by reference to Exhibit 3.1 of theto Registrant’s Quarterly Report on Form 10‑Q for the quarterly period ended June 30, 2005, filed on August 1, 2005.) |
| | |
3.9 | | Certificate of Amendment of Certificate of Incorporation filed with the Secretary of State of Delaware on October 7, 2011. (Incorporated by reference to Exhibit 3.1 to Registrant’s Current Report on Form 8-K filed on October 7, 2011.) |
| | |
3.10 | | Certificate of Designations, Preferences and Rights of Series A Preferred Stock, filed with the Secretary of State of Delaware on December 9, 2008. (Incorporated by reference to Exhibit 3.1 ofto Registrant’s Current Report on Form 8-K, filed on December 9, 2008.) |
| | |
3.11 | | Certificate of Elimination of Series A Preferred Stock filed with the Secretary of State of Delaware on November 14, 2011. (Incorporated by reference to Exhibit 3.1 to Registrant’s Current Report on Form 8-K filed on November 15, 2011.) |
| | |
3.12
| | Amended and Restated By‑Laws. (Incorporated by reference to Exhibit 3.2 of the Registrant’s Current Report on Form 8‑K, filed on December 1, 2006.)
|
| | |
3.133.12
| | Certificate of Amendment of Certificate of Incorporation filed with the Secretary of State of Delaware on May 21, 2013. (Incorporated by reference to Exhibit 3.1 of theto Registrant’s Current Report on Form 8-K filed on May 22, 2013.) |
| | |
3.13 | | Amended and Restated By‑Laws. (Incorporated by reference to Exhibit 3.1 to Registrant’s Current Report on Form 8‑K, filed on December 28, 2016.) |
| | |
4.1* | | Amended and Restated 2004 Incentive Stock Plan of 3D Systems Corporation (Incorporated by reference to Exhibit 4.110.1 to the Registrant’s Amendment No.1 to Registration StatementCurrent Report on Form S-8,8-K, filed May 20, 2009.February 5, 2015.) |
| | |
4.2* | | Form of Restricted Stock Purchase Agreement for Employees.Employees under the 2004 Incentive Stock Plan. (Incorporated by reference to Exhibit 4.2 to the Registrant’s Registration Statement on Form S‑8, filed on May 19, 2004.) |
| | |
4.3* | | Form of Restricted Stock Purchase Agreement for Officers.Officers under the 2004 Incentive Stock Plan. (Incorporated by reference to Exhibit 4.3 to the Registrant’s Registration Statement on Form S‑8 (Registration No. 333-115642), filed on May 19, 2004.) |
| | |
4.4* | | Form of Restricted Stock Purchase Agreement under the Amended and Restated 2004 Incentive Stock Plan. (Incorporated by reference to Exhibit 10.3 to Registrant’s Current Report on Form 8-K (Registration No. 333-115642), filed on February 5, 2015.) |
| | |
4.5* | | Form of Restricted Stock Unit Purchase Agreement under the Amended and Restated 2004 Incentive Stock Plan. (Incorporated by reference to Exhibit 10.2 to Registrant’s Current Report on Form 8-K, filed on February 5, 2015.) |
| | |
4.6* | | Restricted Stock Plan for Non‑Employee Directors of 3D Systems Corporation. (Incorporated by reference to Exhibit 4.4 to the Registrant’s Registration Statement on Form S‑8 (Registration No. 333-115642), filed on May 19, 2004.) |
| | |
4.5*4.7*
| | Amendment No. 1 to Restricted Stock Plan for Non-Employee Directors. (Incorporated by reference to Exhibit 10.1 to the Registrant’s Quarterly Report on Form 10‑Q for the quarterly period ended June 30, 2005, filed on August 1, 2005.) |
| | |
4.6*4.8*
| | Form of Restricted Stock Purchase Agreement for Non‑Employee Directors. (Incorporated by reference to Exhibit 4.5 to the Registrant’s Registration Statement on Form S‑8 (Registration No. 333-115642), filed on May 19, 2004.) |
| | |
4.74.9
| | Indenture, dated as of November 22, 2011, by and between 3D Systems Corporation and Wells Fargo Bank, National Association, as Trustee (incorporated by reference to Exhibit 4.1 to Registrant’s Form 8-K, filed on November 22, 2011.) |
| | |
4.84.10
| | Specimen Common Stock Certificate. (Incorporated by reference to Exhibit 4.1 to the Registrant’s Registration Statement on Form S-3 (No.(Registration No. 333-182065), filed on June 12, 2012.) |
| | |
4.11* | | Appendix A to the Amended and Restated 2004 Incentive Stock Plan of 3D Systems Corporation effective March 11, 2015. (Incorporated by reference to Exhibit 10.1 to Registrant’s Quarterly Report on Form 10-Q for the quarter ended March 31, 2015, filed on May 6, 2015.) |
| | |
4.12* | | 2015 Incentive Plan of 3D Systems Corporation as Amended and Restated on February 1, 2016 (Incorporated by reference to Exhibit 4.17 to Registrant’s Annual Report on Form 10-K for the year ended December 31, 2015, filed on March 14, 2016.) |
| | |
4.13* | | Appendix A to the 2015 Incentive Plan of 3D Systems Corporation effective May 19, 2015. (Incorporated by reference to Exhibit 10.3 to Registrant’s Quarterly Report on Form 10-Q for the quarter ended June 30, 2015, filed on August 6, 2015.) |
| | |
4.14* | | Form of Restricted Stock Award Agreement. (Incorporated by reference to Exhibit 4.2 to Registrant’s Registration Statement on Form S-8 (Registration No. 333-204305), filed on May 19, 2015.) |
| | |
4.15* | | Form of Restricted Stock Unit Award Agreement. (Incorporated by reference to Exhibit 4.3 to Registrant’s Registration Statement on Form S-8 (Registration No. 333-204305), filed on May 19, 2015.) |
| | |
4.16* | | Form of Stock Option Award Agreement (Incorporated by reference to Exhibit 10.2 to Registrant’s Quarterly Report on Form 10-Q for the quarter ended March 31, 2016, filed on May 5, 2016.) |
| | |
4.17* | | Form of Restricted Stock Award Agreement with Share Price Vesting Conditions |
| | |
4.18* | | Form of Stock Option Award Agreement with Share Price Vesting Conditions |
| | |
10.1 | | Patent License Agreement dated December 16, 1998 by and between 3D Systems, Inc., NTT Data CMET, Inc. and NTT Data Corporation. (Incorporated by reference to Exhibit 10.56 to Registrant’s Annual Report on Form 10‑K for the year ended December 31, 1998, filed on March 31, 1999.) |
| | |
10.2 | | Lease Agreement dated February 8, 2006 between the Registrant and KDC-Carolina Investments 3, LP. (Incorporated by reference to Exhibit 99.1 to Registrant’s Current Report on Form 8‑K, filed on February 10, 2006.) |
| | |
10.3 | | First Amendment to Lease Agreement dated August 7, 2006 between the Registrant and KDC-Carolina Investments 3, LP. (Incorporated by reference to Exhibit 10.1 ofto Registrant’s Current Report on Form 8‑K, filed on August 14, 2006.) |
| | |
10.4 | | Second Amendment to Lease Agreement effective as of October 6, 2006 to Lease Agreement dated February 8, 2006 between 3D Systems Corporation and KDC-Carolina Investments 3, LP. (Incorporated by reference to Exhibit 10.1 ofto Registrant’s Current Report on Form 8‑K, filed on October 10, 2006.) |
| | |
10.5 | | Third Amendment to Lease Agreement effective as of December 18, 2006 to Lease Agreement dated February 8, 2006 between 3D Systems Corporation and KDC-Carolina Investments 3, LP. (Incorporated by reference to Exhibit 10.1 ofto Registrant’s Current Report on Form 8‑K, filed on December 20, 2006.) |
| | |
10.6 | | Fourth Amendment to Lease Agreement effective as of February 26, 2007 to Lease Agreement dated February 8, 2006 between 3D Systems Corporation and KDC-Carolina Investments 3, LP. (Incorporated by reference to Exhibit 10.1 ofto Registrant’s Current Report on Form 8‑K, filed on March 1, 2007.) |
| | |
10.7 | | Fifth Amendment to Lease Agreement effective as of March 17, 2011 to Lease Agreement dated February 8, 2006 between 3D Systems Corporation and KDC-Carolina Investments 3, LP. (Incorporated by reference to Exhibit 10.1 to Registrant’s Form 8-K, filed on March 18,21, 2011.) |
10.8*
| | Employment Letter Agreement, effective September 19, 2003, by and between Registrant and Abraham N. Reichental. (Incorporated by reference to Exhibit 10.1 to Registrant’s Current Report on Form 8‑K, filed on September 22, 2003.)
|
| | |
10.9*
| | Agreement, dated December 17, 2003, by and between Registrant and Abraham N. Reichental. (Incorporated by reference to Exhibit 10.43 to Registrant’s Amendment No. 1 to Registration Statement on Form S‑1, filed on January 21, 2004.)
|
| | |
10.10*
| | First Amendment to Employment Agreement, dated July 24, 2007, by and between Registrant and Abraham N. Reichental. (Incorporated by reference to Exhibit 10.1 to Registrant’s Quarterly Report on Form 10‑Q for the quarterly period ended June 30, 2007, filed on August 6, 2007.)
|
| | |
10.11*10.8*
| | Charles W. Hull consulting arrangement (Incorporated by reference to Exhibit 10.1 of the Registrant’s Quarterly Report on Form 10-Q for the quarter ended June 30, 2010, filed on July 29, 2010.) |
| | |
10.9* | | Kevin P. McAlea severance arrangement (Incorporated by reference to Exhibit 10.2 of the Registrant’s Quarterly Report on Form 10-Q for the quarter ended June 30, 2010, filed on July 29, 2010.) |
| | |
10.10* | | Transition Agreement, dated March 28, 2014, by and between 3D Systems Corporation and Damon Gregoire. (Incorporated by reference to Exhibit 10.1 of the Registrant’s Current Report on Form 8-K, filed on March 31, 2014.) |
| | |
10.11 | | Credit Agreement, dated as of October 10, 2014, among 3D Systems Corporation, the Guarantors party thereto, PNC Bank, National Association, as Administrative Agent, PNC Capital Markets LLC, as Sole Lead Arranger and Sole Bookrunner, HSBC Bank USA, N.A., as Syndication Agent, and the other lender’s party thereto. (Incorporated by reference to Exhibit 10.1 to Registrant’s Current Report on Form 8-K, filed on October 14, 2014.) |
| | |
10.12* | | Kevin P. McAlea severance arrangementSeverance and Release Agreement, dated May 14, 2015, between 3D Systems Corporation and Theodore A. Hull. (Incorporated by reference to Exhibit 10.1 of theto Registrant’s Quarterly Report on Form 10-Q for the quarter ended June 30, 2015, filed on July 29, 2010.August 6, 2015.)
|
| | |
14.110.13*
| | Code of Conduct, as amended effective as of November 30, 2006Executive Severance Agreement, dated May 14, 2015, between 3D Systems Corporation and David R. Styka. (Incorporated by reference to Exhibit 99.1 of the10.2 to Registrant’s CurrentQuarterly Report on Form 8‑K,10-Q for the quarter ended June 30, 2015, filed on December 1, 2006.August 6, 2015.)
|
| | |
14.210.14*
| | 3D SystemsConsulting Agreement, dated January 25, 2016, between the Corporation Code of Ethics for Senior Financial Executives and Directors.ECG Ventures, Inc. (Incorporated by reference to Exhibit 14.2 of the10.17 to Registrant’s Annual Report on Form 10‑K10-K for the year ended December 31, 2003,2015, filed on March 14, 2016.)
|
| | |
10.15* | | Employment Agreement, dated April 1, 2016, between 3D Systems Corporation and Vyomesh I. Joshi. (Incorporated by reference to Exhibit 10.1 to Registrant’s Current Report on Form 8-K, filed on April 4, 2016.) |
| | |
10.16* | | Severance Agreement, dated June 15, 2004.2016, between 3D Systems Corporation and Mark W. Wright. (Incorporated by reference to Exhibit 10.1 to Registrant’s Current Report on Form 8-K/A, filed on June 16, 2016.) |
| | |
10.17* | | First Amendment, dated June 15, 2016, to the Restricted Stock Purchase Agreement, dated October 27, 2014, by and between 3D Systems Corporation and Mark W. Wright. (Incorporated by reference to Exhibit 10.2 to Registrant’s Current Report on Form 8-K/A, filed on June 16, 2016.) |
| | |
10.18* | | First Amendment, dated June 15, 2016, to the Restricted Stock Purchase Agreement, dated November 13, 2015, by and between 3D Systems Corporation and Mark W. Wright. (Incorporated by reference to Exhibit 10.3 to Registrant’s Current Report on Form 8-K/A, filed on June 16, 2016.) |
| | |
10.19* | | Consulting Agreement, dated June 15, 2016, between 3D Systems Corporation and Mark W. Wright. (Incorporated by reference to Exhibit 10.4 to Registrant’s Current Report on Form 8-K/A, filed on June 16, 2016.) |
| | |
10.20* | | Severance Agreement, dated June 15, 2016, between 3D Systems Corporation and Cathy L. Lewis. (Incorporated by reference to Exhibit 10.5 to Registrant’s Current Report on Form 8-K/A, filed on June 16, 2016.) |
| | |
10.21* | | First Amendment, dated June 15, 2016, to the Restricted Stock Purchase Agreement, dated November 18, 2013, by and between 3D Systems Corporation and Cathy L. Lewis. (Incorporated by reference to Exhibit 10.6 to Registrant’s Current Report on Form 8-K/A, filed on June 16, 2016.) |
| | |
10.22* | | First Amendment, dated June 15, 2016, to the Restricted Stock Purchase Agreement, dated November 17, 2014, by and between 3D Systems Corporation and Cathy L. Lewis. (Incorporated by reference to Exhibit 10.7 to Registrant’s Current Report on Form 8-K/A, filed on June 16, 2016.) |
| | |
10.23* | | First Amendment, dated June 15, 2016, to the Restricted Stock Purchase Agreement, dated November 13, 2015, by and between 3D Systems Corporation and Cathy L. Lewis. (Incorporated by reference to Exhibit 10.8 to Registrant’s Current Report on Form 8-K/A, filed on June 16, 2016.) |
| | |
10.24* | | Employment Agreement, dated June 15, 2016, between 3D Systems Corporation and John N. McMullen. (Incorporated by reference to Exhibit 10.1 to Registrant’s Current Report on Form 8-K, filed on June 16, 2016.) |
| | |
10.25* | | Employment Agreement, dated June 15, 2016, between 3D Systems Corporation and Andy M. Johnson. (Incorporated by reference to Exhibit 10.2 to Registrant’s Current Report on Form 8-K, filed on June 16, 2016.) |
| | |
10.26* | | First Amendment, dated June 15, 2016, to the Restricted Stock Purchase Agreement, dated February 4, 2014, by and between 3D Systems Corporation and Andy M. Johnson. (Incorporated by reference to Exhibit 10.3 to Registrant’s Current Report on Form 8-K, filed on June 16, 2016.) |
| | |
10.27* | | First Amendment, dated June 15, 2016, to the Restricted Stock Purchase Agreement, dated February 3, 2015, by and between 3D Systems Corporation and Andy M. Johnson. (Incorporated by reference to Exhibit 10.4 to Registrant’s Current Report on Form 8-K, filed on June 16, 2016.) |
| | |
10.28* | | First Amendment, dated June 15, 2016, to the Restricted Stock Purchase Agreement, dated November 13, 2015, by and between 3D Systems Corporation and Andy M. Johnson. (Incorporated by reference to Exhibit 10.5 to Registrant’s Current Report on Form 8-K, filed on June 16, 2016.) |
| | |
10.29* | | Employment Agreement, dated July 1, 2016, between 3D Systems Corporation and David R. Styka. (Incorporated by reference to Exhibit 10.1 to Registrant’s Current Report on Form 8-K, filed on July 5, 2016.) |
| | |
10.30* | | First Amendment, dated July 1, 2016, to the Restricted Stock Purchase Agreement, dated January 14, 2015, by and between 3D Systems Corporation and David R. Styka. (Incorporated by reference to Exhibit 10.2 to Registrant’s Current Report on Form 8-K, filed on July 5, 2016.) |
| | |
10.31* | | First Amendment, dated July 1, 2016, to the Restricted Stock Purchase Agreement, dated May 19, 2015, by and between 3D Systems Corporation and David R. Styka. (Incorporated by reference to Exhibit 10.3 to Registrant’s Current Report on Form 8-K, filed on July 5, 2016.) |
| | |
10.32* | | First Amendment, dated July 1, 2016, to the Restricted Stock Purchase Agreement, dated November 13, 2015, by and between 3D Systems Corporation and David R. Styka. (Incorporated by reference to Exhibit 10.4 to Registrant’s Current Report on Form 8-K, filed on July 5, 2016.) |
| | |
10.33* | | Employment Agreement, dated August 4, 2016, between 3D Systems Corporation and Charles W. Hull. (Incorporated by reference to Exhibit 10.1 to Registrant’s Current Report on Form 8-K, filed on August 8, 2016.) |
| | |
10.34* | | First Amendment, dated August 4, 2016, to the Restricted Stock Purchase Agreement, dated November 8, 2013, by and between 3D Systems Corporation and Charles W. Hull. (Incorporated by reference to Exhibit 10.2 to Registrant’s Current Report on Form 8-K, filed on August 8, 2016.) |
| | |
10.35* | | First Amendment, dated August 4, 2016, to the Restricted Stock Purchase Agreement, dated November 17, 2014, by and between 3D Systems Corporation and Charles W. Hull. (Incorporated by reference to Exhibit 10.3 to Registrant’s Current Report on Form 8-K, filed on August 8, 2016.) |
| | |
10.36* | | First Amendment, dated August 4, 2016, to the Restricted Stock Purchase Agreement, dated November 13, 2015, by and between 3D Systems Corporation and Charles W. Hull. (Incorporated by reference to Exhibit 10.3 to Registrant’s Current Report on Form 8-K, filed on August 8, 2016.) |
| | |
21.1 | | Subsidiaries of Registrant. |
| | |
23.1 | | Consent of Independent Registered Public Accounting Firm dated February 28, 2014.Firm. |
| | |
31.1 | | Certification of Principal Executive Officer Pursuant to Section 302 of the Sarbanes‑Oxley Act of 2002, dated February 28, 2014.2017. |
| | |
31.2 | | Certification of Principal Financial Officer Pursuant to Section 302 of the Sarbanes‑Oxley Act of 2002, dated February 28, 2014.2017. |
| | |
32.1 | | Certification of Principal Executive Officer pursuant to Section 906 of the Sarbanes‑Oxley Act of 2002, dated February 28, 2014.2017. |
| | |
32.2 | | Certification of Principal Financial Officer pursuant to Section 906 of the Sarbanes‑Oxley Act of 2002, dated February 28, 2014.2017. |
| | |
101.INS | | XBRL Instance Document |
| | |
101.SCH | | XBRL Taxonomy Extension Scheme Document |
| | |
101.CAL | | XBRL Taxonomy Extension Calculation Linkbase Document |
| | |
101.DEF | | XBRL Taxonomy Extension Definition Linkbase Document |
| | |
101.LAB | | XBRL Taxonomy Extension Label Linkbase Document |
| | |
101.PRE | | XBRL Taxonomy Extension Presentation Linkbase Document |
* Management contract or compensatory plan or arrangement
Item 16. Form 10-K Summary
None.
SIGNATURES
Pursuant to the requirements of Section 13 or 15(d) of the Securities Exchange Act of 1934, the Registrant has duly caused this report to be signed on our behalf by the undersigned, thereunto duly authorized.
| | |
| | 3D Systems Corporation |
| | |
| By: | /s/ AVBRAHAMYOMESH N. RI. JEICHENTALOSHI |
| | Abraham N. ReichentalVyomesh I. Joshi
|
| | President and Chief Executive Officer,
|
| | President and Director |
| Date: | February 28, 20142017 |
Pursuant to the requirements of the Securities Exchange Act of 1934, this report has been signed below by the following persons on behalf of registrant and in the capacities and on the dates indicated.
| | |
Signature | Title | Date |
| | |
/s/ ABRAHAM N. REICHENTALVYOMESH I. JOSHI Vyomesh I. Joshi | Chief Executive Officer, President and Director (principal executive officer) | February 28, 20142017 |
Abraham
| | |
/s/ JOHN N. ReichentalMCMULLEN | Executive Vice President and Chief Financial Officer | February 28, 2017 |
John N. McMullen | (Principal Executive Officer)principal financial and accounting officer) | |
| | |
/s/ DAMON J. GREGOIRE | Senior Vice President and Chief Financial Officer
| February 28, 2014
|
Damon J. Gregoire
| (Principal Financial and Accounting Officer)
| |
| | |
/s/ CHARLESCHARLES W. HULLHULL
| Executive Vice President, Chief Technology | February 28, 20142017 |
Charles W. Hull | Officer and Director | |
| | |
/s/ G. WALTER LOEWENBAUM,WALTER LOEWENBAUM, II | Chairman of the Board of Directors | February 28, 20142017 |
G. Walter Loewenbaum, II | | |
| | |
/s/ JIMJIM D. KEVERKEVER | Director | February 28, 20142017 |
Jim D. Kever | | |
| | |
/s/ KEVINKEVIN S. MOOREMOORE | Director | February 28, 20142017 |
Kevin S. Moore | | |
| | |
/s/ DANIELDANIEL S. VAN RIPERVAN RIPER | Director | February 28, 20142017 |
Daniel S. Van Riper | | |
| | |
/s/ WILLIAMWILLIAM E. CURRANCURRAN | Director | February 28, 20142017 |
William E. Curran | | |
| | |
/s/ KARENKAREN E. WELKEWELKE | Director | February 28, 20142017 |
Karen E. Welke | | |
| | |
/s/ PETER H. DIAMANDISWILLIAM D. HUMES | Director | February 28, 20142017 |
Peter H. DiamandisWilliam D. Humes
| | |
| | |
/s/ THOMAS ERICKSON | Director | February 28, 2017 |
Thomas Erickson | | |
3D Systems Corporation
Index to Consolidated Financial Statements
and Consolidated Financial Statement Schedule
| |
| |
Consolidated Financial Statements | |
Report of Independent Registered Public Accounting Firm | F-2 |
Report of Independent Registered Public Accounting Firm | F-3 |
Consolidated Balance Sheets as of December 31, 20132016 and 20122015 | F-4 |
Consolidated Statements of IncomeOperations and Comprehensive IncomeLoss for the Years Ended December 31, 2013, 2012,2016, 2015, and 20112014 | F-5 |
Consolidated Statements of Stockholders’ Equity for the Years Ended December 31, 2013, 20122016, 2015, and 20112014 | F-6 |
Consolidated Statements of Cash Flows for the Years Ended December 31, 2013, 2012,2016, 2015, and 20112014 | F-7 |
Notes to Consolidated Financial Statements for the Years Ended December 31, 2013, 20122016, 2015, and 20112014 | F-8 |
Consolidated Financial Statement Schedule | |
Report of Independent Registered Public Accounting Firm | F-42F-38
|
Schedule II—Valuation and Qualifying Accounts for the Years Ended December 31, 2013, 20122016, 2015, and 20112014 | F-43F-39
|
REPORT OF INDEPENDENT REGISTERED PUBLIC ACCOUNTING FIRM
To the Stockholders and Board of Directors
3D Systems Corporation
Rock Hill, South Carolina
We have audited 3D Systems Corporation and its subsidiaries’ (the “Company”) internal control over financial reporting as of December 31, 2013,2016, based on criteria established in Internal Control – Integrated Framework (1992)(2013) issued by the Committee of Sponsoring Organizations of the Treadway Commission in (the COSO criteria). 3D Systems Corporation’s management is responsible for maintaining effective internal control over financial reporting and for its assessment of the effectiveness of internal control over financial reporting, included in the accompanying “Item 9A, Management’s Report on Internal Control over Financial Reporting.” Our responsibility is to express an opinion on the Company’s internal control over financial reporting based on our audit.
We conducted our audit in accordance with the standards of the Public Company Accounting Oversight Board (United States). Those standards require that we plan and perform the audit to obtain reasonable assurance about whether effective internal control over financial reporting was maintained in all material respects. Our audit included obtaining an understanding of internal control over financial reporting, assessing the risk that a material weakness exists, and testing and evaluating the design and operating effectiveness of internal control based on the assessed risk. Our audit also included performing such other procedures as we considered necessary in the circumstances. We believe that our audit provides a reasonable basis for our opinion.
A company’s internal control over financial reporting is a process designed to provide reasonable assurance regarding the reliability of financial reporting and the preparation of financial statements for external purposes in accordance with generally accepted accounting principles. A company’s internal control over financial reporting includes those policies and procedures that (1) pertain to the maintenance of records that, in reasonable detail, accurately and fairly reflect the transactions and dispositions of the assets of the company; (2) provide reasonable assurance that transactions are recorded as necessary to permit preparation of financial statements in accordance with generally accepted accounting principles, and that receipts and expenditures of the company are being made only in accordance with authorizations of management and directors of the company; and (3) provide reasonable assurance regarding prevention or timely detection of unauthorized acquisition, use, or disposition of the company’s assets that could have a material effect on the financial statements.
Because of its inherent limitations, internal control over financial reporting may not prevent or detect misstatements. Also, projections of any evaluation of effectiveness to future periods are subject to the risk that controls may become inadequate because of changes in conditions, or that the degree of compliance with the policies or procedures may deteriorate.
In our opinion, 3D Systems Corporation did maintain, in all material respects, effective internal control over financial reporting as of December 31, 2013,2016, based on the COSO criteria.
We also have audited, in accordance with the standards of the Public Company Accounting Oversight Board (United States), the consolidated balance sheets of 3D Systems Corporation and its subsidiaries as of December 31, 20132016 and 2012,2015, and the related consolidated statements of incomeoperations and comprehensive income,loss, stockholders’ equity and cash flows for each of the three years in the period ended December 31, 20132016 and our report dated February 28, 20142017 expressed an unqualified opinion thereon.
/s/ BDO USA, LLP
BDO USA, LLP
Charlotte, North Carolina
February 28, 2014
2017
REPORT OF INDEPENDENT REGISTERED PUBLIC ACCOUNTING FIRM
To the Stockholders and Board of Directors of
3D Systems Corporation
Rock Hill, South Carolina
We have audited the accompanying consolidated balance sheets of 3D Systems Corporation and its subsidiaries (the “Company”) as of December 31, 20132016 and 20122015 and the related consolidated statements of incomeoperations and comprehensive income,loss, stockholders’ equity and cash flows for each of the three years in the period ended December 31, 2013.2016. These financial statements are the responsibility of the Company’s management. Our responsibility is to express an opinion on these financial statements based on our audits.
We conducted our audits in accordance with the standards of the Public Company Accounting Oversight Board (United States). Those standards require that we plan and perform the audit to obtain reasonable assurance about whether the financial statements are free of material misstatement. An audit includes examining, on a test basis, evidence supporting the amounts and disclosures in the financial statements, assessing the accounting principles used and significant estimates made by management, as well as evaluating the overall financial statement presentation. We believe that our audits provide a reasonable basis for our opinion.
In our opinion, the Consolidated Financial Statementsconsolidated financial statements referred to above present fairly, in all material respects, the financial position of 3D Systems Corporation and its subsidiaries as of December 31, 20132016 and 20122015 and the results of its operations and its cash flows for each of the three years in the period ended December 31, 20132016 in conformity with accounting principles generally accepted in the United States of America.
We have also audited, in accordance with the standards of the Public Company Accounting Oversight Board (United States), the Company’s internal control over financial reporting as of December 31, 2013,2016, based on criteria established in Internal Control—Integrated Framework (1992)(2013) issued by the Committee of Sponsoring Organizations of the Treadway Commission in (COSO) and our report dated February 28, 20142017 expressed an unqualified opinion thereon.
/s/ BDO USA, LLP
BDO USA, LLP
Charlotte, North Carolina
February 28, 20142017
3D Systems Corporation
Consolidated Balance Sheets
Asas of December 31, 20132016 and 20122015
| | | | | | | | | | | | |
| | | | | | | | | | | | |
| | December 31, | | December 31, | | December 31, | | December 31, |
(in thousands, except par value) | | 2013 | | 2012 | | 2016 | | 2015 |
ASSETS | | | | | | | | | | | | |
Current assets: | | | | | | | | | | | | |
Cash and cash equivalents | | $ | 306,316 | | $ | 155,859 | | $ | 184,947 | | $ | 155,643 |
Accounts receivable, net of allowance for doubtful accounts of $8,133 (2013) and $4,317 (2012) | | | 132,121 | | | 79,869 | |
Inventories, net | | | 75,148 | | | 41,820 | |
Accounts receivable, net of reserves — $12,920 (2016) and $14,139 (2015) | | | | 127,114 | | | 157,406 |
Inventories, net of reserves — $14,770 (2016) and $28,225 (2015) | | | | 103,331 | | | 105,877 |
Prepaid expenses and other current assets | | | 7,203 | | | 4,010 | | | 17,558 | | | 13,541 |
Current deferred income taxes | | | 6,067 | | | 5,867 | |
Restricted cash | | | — | | | 13 | |
Total current assets | | | 526,855 | | | 287,438 | | | 432,950 | | | 432,467 |
Property and equipment, net | | | 45,208 | | | 34,353 | | | 79,978 | | | 85,995 |
Intangible assets, net | | | 141,709 | | | 108,377 | | | 121,501 | | | 157,466 |
Goodwill | | | 370,066 | | | 240,314 | | | 181,230 | | | 187,875 |
Long term deferred income taxes | | | 548 | | | 107 | |
Long term deferred income tax asset | | | | 8,123 | | | 1,900 |
Other assets, net | | | 13,470 | | | 6,853 | | | 25,371 | | | 26,256 |
Total assets | | $ | 1,097,856 | | $ | 677,442 | | $ | 849,153 | | $ | 891,959 |
LIABILITIES AND EQUITY | | | | | | | | | | | | |
Current liabilities: | | | | | | | | | | | | |
Current portion of capitalized lease obligations | | $ | 187 | | $ | 174 | | $ | 572 | | $ | 529 |
Accounts payable | | | 51,729 | | | 32,095 | | | 40,514 | | | 46,869 |
Accrued and other liabilities | | | 28,430 | | | 24,789 | | | 49,968 | | | 54,699 |
Customer deposits | | | 5,466 | | | 2,786 | | | 5,857 | | | 8,229 |
Deferred revenue | | | 24,644 | | | 15,309 | | | 33,494 | | | 35,145 |
Total current liabilities | | | 110,456 | | | 75,153 | | | 130,405 | | | 145,471 |
Long term portion of capitalized lease obligations | | | 7,277 | | | 7,443 | | | 7,587 | | | 8,187 |
Convertible senior notes, net | | | 11,416 | | | 80,531 | |
Deferred income tax liability | | | 19,714 | | | 23,142 | |
Long term deferred income tax liability | | | | 17,601 | | | 17,944 |
Other liabilities | | | 15,201 | | | 10,840 | | | 57,988 | | | 56,839 |
Total liabilities | | | 164,064 | | | 197,109 | | | 213,581 | | | 228,441 |
Commitments and Contingencies | | | | | | | |
Redeemable noncontrolling interests | | | | 8,872 | | | 8,872 |
Commitments and contingencies (Note 22) | | | | | | | |
Stockholders’ equity: | | | | | | | | | | | | |
Common stock, $0.001 par value, authorized 220,000 shares (2013) and 120,000 (2012); issued 103,818 (2013) and 89,783 (2012) | | | 104 | | | 60 | |
Common stock, $0.001 par value, authorized 220,000 shares; issued 115,113 (2016) and 113,115 (2015) | | | | 115 | | | 113 |
Additional paid-in capital | | | 866,552 | | | 460,237 | | | 1,307,428 | | | 1,279,738 |
Treasury stock, at cost: 600 shares (2013) and 355 shares (2012) | | | (286) | | | (240) | |
Accumulated earnings | | | 60,487 | | | 16,410 | |
Accumulated other comprehensive income | | | 5,789 | | | 3,866 | |
Treasury stock, at cost — 1,498 shares (2016) and 892 shares (2015) | | | | (2,658) | | | (1,026) |
Accumulated deficit | | | | (621,787) | | | (583,368) |
Accumulated other comprehensive loss | | | | (53,225) | | | (39,548) |
Total 3D Systems Corporation stockholders' equity | | | 932,646 | | | 480,333 | | | 629,873 | | | 655,909 |
Noncontrolling interest | | | 1,146 | | | — | |
Noncontrolling interests | | | | (3,173) | | | (1,263) |
Total stockholders’ equity | | | 933,792 | | | 480,333 | | | 626,700 | | | 654,646 |
Total liabilities and stockholders’ equity | | $ | 1,097,856 | | $ | 677,442 | |
Total liabilities, redeemable noncontrolling interests and stockholders’ equity | | | $ | 849,153 | | $ | 891,959 |
See accompanying notes to consolidated financial statements.Consolidated Financial Statements.
3D Systems Corporation
Consolidated Statements of IncomeOperations and Comprehensive IncomeLoss
Years Ended December 31, 2013, 20122016, 2015 and 20112014
| | | | | | | | | | | | | | | | |
| | | | | | | | | | | |
(in thousands, except per share amounts) | 2013 | | 2012 | | 2011 | 2016 | | 2015 | | 2014 |
Revenue: | | | | | | | | | | | | | | | | |
Products | $ | 356,032 | | $ | 229,980 | | $ | 137,306 | $ | 380,383 | | $ | 408,119 | | $ | 442,198 |
Services | | 157,368 | | | 123,653 | | | 93,117 | | 252,582 | | | 258,044 | | | 211,454 |
Total revenue | | 513,400 | | | 353,633 | | | 230,423 | | 632,965 | | | 666,163 | | | 653,652 |
Cost of sales: | | | | | | | | | | | | | | | | |
Products | | 159,628 | | | 105,286 | | | 66,589 | | 195,428 | | | 243,639 | | | 223,991 |
Services | | 86,178 | | | 67,151 | | | 54,806 | | 127,786 | | | 130,715 | | | 112,227 |
Total cost of sales | | 245,806 | | | 172,437 | | | 121,395 | | 323,214 | | | 374,354 | | | 336,218 |
Gross profit | | 267,594 | | | 181,196 | | | 109,028 | | 309,751 | | | 291,809 | | | 317,434 |
Operating expenses: | | | | | | | | | | | | | | | | |
Selling, general and administrative | | 143,244 | | | 97,422 | | | 59,795 | | 259,776 | | | 303,784 | | | 215,724 |
Research and development | | 43,489 | | | 23,203 | | | 14,331 | | 88,395 | | | 92,770 | | | 75,395 |
Impairment of goodwill and other intangible assets | | | — | | | 537,179 | | | — |
Total operating expenses | | 186,733 | | | 120,625 | | | 74,126 | | 348,171 | | | 933,733 | | | 291,119 |
Income from operations | | 80,861 | | | 60,571 | | | 34,902 | |
Income (loss) from operations | | | (38,420) | | | (641,924) | | | 26,315 |
Interest and other expense, net | | 16,855 | | | 17,292 | | | 2,456 | | 1,392 | | | 13,029 | | | 8,928 |
Income before income taxes | | 64,006 | | | 43,279 | | | 32,446 | |
Provision for (benefit of) income taxes | | 19,887 | | | 4,338 | | | (2,974) | |
Net income | | 44,119 | | | 38,941 | | | 35,420 | |
Net (income) attributable to noncontrolling interest | | (12) | | | — | | | — | |
Net income attributable to 3D Systems Corporation | $ | 44,107 | | $ | 38,941 | | $ | 35,420 | |
Income (loss) before income taxes | | | (39,812) | | | (654,953) | | | 17,387 |
Provision (benefit) for income taxes | | | (547) | | | 8,972 | | | 5,441 |
Net income (loss) | | | (39,265) | | | (663,925) | | | 11,946 |
Less: net income (loss) attributable to noncontrolling interests | | | (846) | | | (8,433) | | | 309 |
Net income (loss) attributable to 3D Systems Corporation | | $ | (38,419) | | $ | (655,492) | | $ | 11,637 |
| | | | | | | | | | | | | | | | |
Other comprehensive income: | | | | | | | | | |
Pension adjustments, net of taxes: $78 (2013), $316 (2012) and $122 (2011) | $ | (168) | | $ | (714) | | $ | (275) | |
Foreign currency translation gain (loss) attributable to 3D Systems Corporation | | 1,968 | | | 1,640 | | | (1,743) | |
Liquidation of non-US entity | | 173 | | | — | | | — | |
Total other comprehensive income (loss) | | 1,973 | | | 926 | | | (2,018) | |
Comprehensive income | | 46,080 | | | 39,867 | | | 33,402 | |
Foreign currency translation (gain) attributable to noncontrolling interest | | (50) | | | — | | | — | |
Comprehensive income attributable to 3D Systems Corporation | $ | 46,030 | | $ | 39,867 | | $ | 33,402 | |
Net income (loss) per share available to 3D Systems Corporation common stockholders — basic and diluted | | $ | (0.35) | | $ | (5.85) | | $ | 0.11 |
| | | | | | | | | | | | | | | | |
Net income per share available to 3D Systems common stockholders — basic and diluted | $ | 0.45 | | $ | 0.48 | | $ | 0.47 | |
Other comprehensive loss: | | | | | | | | | |
Pension adjustments, net of taxes | | $ | (902) | | $ | 338 | | $ | (1,135) |
Gain on liquidation of non-US entity | | | 288 | | | — | | | — |
Foreign currency translation loss | | | (12,958) | | | (16,300) | | | (29,183) |
Total other comprehensive loss | | | (13,572) | | | (15,962) | | | (30,318) |
Less foreign currency translation gain (loss) attributable to noncontrolling interests | | | 105 | | | (820) | | | (123) |
Other comprehensive loss attributable to 3D Systems Corporation | | | (13,677) | | | (15,142) | | | (30,195) |
| | | | | | | | | |
Comprehensive loss | | | (52,837) | | | (679,887) | | | (18,372) |
Less: comprehensive income (loss) attributable to noncontrolling interests | | | (741) | | | (9,253) | | | 186 |
Comprehensive loss attributable to 3D Systems Corporation | | $ | (52,096) | | $ | (670,634) | | $ | (18,558) |
See accompanying notes to consolidated financial statements.Consolidated Financial Statements.
3D Systems Corporation
Consolidated Statements of Stockholders’ Equity
Years Ended December 31, 2013, 20122016, 2015 and 20112014
| | | | | | | | | | | | | | | | | | | | | | | | | | | |
| Common Stock | | Treasury Stock | | | | | | | | | | | | | | | |
(In thousands, except par value) | Shares | | Par Value $0.001 | | Additional Paid In Capital | | Shares | | Amount | | Accumulated Earnings | | Accumulated Other Comprehensive Income (Loss) | | Total 3D Systems Corporation Stockholders' Equity | | Equity Attributable to Noncontrolling Interest | | Total Stockholders' Equity |
Balance at December 31, 2010 | 23,474 | | $ | 23 | | $ | 186,252 | | 134 | | $ | (189) | | $ | (57,925) | | $ | 4,958 | | | 133,119 | | $ | — | | | 133,119 |
Exercise of stock options | 306 | | | — | (a) | | 2,536 | | — | | | — | | | — | | | — | | | 2,536 | | | — | | | 2,536 |
Issuance (repurchase) of restricted stock, net | 253 | | | — | (a) | | 253 | | 190 | | | (25) | | | — | | | — | | | 228 | | | — | | | 228 |
Issuance of common stock | 1,495 | | | 2 | | | 62,052 | | — | | | — | | | — | | | — | | | 62,054 | | | — | | | 62,054 |
Issuance of stock for 5.50% senior convertible notes | — | | | — | | | 17,770 | | — | | | — | | | — | | | — | | | 17,770 | | | — | | | 17,770 |
Common stock split | 25,329 | | | 26 | | | — | | — | | | — | | | (26) | | | — | | | — | | | — | | | — |
Issuance of stock for acquisitions | 110 | | | — | | | 3,042 | | — | | | — | | | — | | | — | | | 3,042 | | | — | | | 3,042 |
Stock-based compensation expense | 8 | | | — | | | 2,637 | | — | | | — | | | — | | | — | | | 2,637 | | | — | | | 2,637 |
Net income | — | | | — | | | — | | — | | | — | | | 35,420 | | | — | | | 35,420 | | | — | | | 35,420 |
Pension adjustment | — | | | — | | | — | | — | | | — | | | — | | | (275) | | | (275) | | | — | | | (275) |
Foreign currency translation adjustment | — | | | — | | | — | | — | | | — | | | — | | | (1,743) | | | (1,743) | | | — | | | (1,743) |
Balance at December 31, 2011 | 50,975 | | $ | 51 | | $ | 274,542 | | 324 | | $ | (214) | | $ | (22,531) | | $ | 2,940 | | $ | 254,788 | | $ | — | | $ | 254,788 |
Exercise of stock options | 1,055 | | | 1 | | | 3,903 | | — | | | — | | | — | | | — | | | 3,904 | | | — | | | 3,904 |
Tax benefits from share-based payment arrangements | — | | | — | | | 1,514 | | — | | | — | | | — | | | — | | | 1,514 | | | — | | | 1,514 |
Issuance (repurchase) of restricted stock, net | 524 | | | 1 | | | 524 | | 31 | | | (26) | | | — | | | — | | | 499 | | | — | | | 499 |
Issuance of common stock | 4,151 | | | 4 | | | 106,885 | | — | | | | | | — | | | | | | 106,889 | | | — | | | 106,889 |
Issuance of stock for 5.50% senior convertible notes | 2,845 | | | 3 | | | 60,079 | | — | | | — | | | — | | | — | | | 60,082 | | | — | | | 60,082 |
Issuance of stock for acquisitions | 294 | | | — | (a) | | 7,672 | | — | | | — | | | — | | | — | | | 7,672 | | | — | | | 7,672 |
Stock-based compensation expense | 11 | | | — | | | 5,118 | | — | | | — | | | — | | | — | | | 5,118 | | | — | | | 5,118 |
Net income | — | | | — | | | — | | — | | | — | | | 38,941 | | | — | | | 38,941 | | | — | | | 38,941 |
Pension adjustment | — | | | — | | | — | | — | | | — | | | — | | | (714) | | | (714) | | | — | | | (714) |
Foreign currency translation adjustment | — | | | — | | | — | | — | | | — | | | — | | | 1,640 | | | 1,640 | | | — | | | 1,640 |
Balance at December 31, 2012 | 59,855 | | $ | 60 | | $ | 460,237 | | 355 | | $ | (240) | | $ | 16,410 | | $ | 3,866 | | $ | 480,333 | | $ | — | | $ | 480,333 |
Tax benefits from share-based payment arrangements | — | | | — | | | 26,038 | | — | | | — | | | — | | | — | | | 26,038 | | | — | | | 26,038 |
Issuance (repurchase) of restricted stock, net | 1,001 | | | 1 | | | 947 | | 68 | | | (46) | | | — | | | — | | | 902 | | | — | | | 902 |
Issuance of stock for 5.50% senior convertible notes | 4,675 | | | 5 | | | 80,749 | | — | | | — | | | — | | | — | | | 80,754 | | | — | | | 80,754 |
Common stock split | 30,867 | | | 31 | | | (177) | | 177 | | | — | | | (30) | | | — | | | (176) | | | — | | | (176) |
Issuance of stock for acquisitions | 293 | | | — | | | 13,131 | | — | | | — | | | — | | | — | | | 13,131 | | | — | | | 13,131 |
Issuance of stock for equity raise | 7,112 | | | 7 | | | 272,069 | | — | | | — | | | — | | | — | | | 272,076 | | | — | | | 272,076 |
Stock-based compensation expense | 15 | | | — | | | 13,558 | | — | | | — | | | — | | | — | | | 13,558 | | | — | | | 13,558 |
Net income | — | | | — | | | — | | — | | | — | | | 44,107 | | | — | | | 44,107 | | | 12 | | | 44,119 |
Noncontrolling interest for business combinations | — | | | — | | | — | | — | | | — | | | — | | | — | | | — | | | 1,084 | | | 1,084 |
Pension adjustment | — | | | — | | | — | | — | | | — | | | — | | | (168) | | | (168) | | | — | | | (168) |
Liquidation of non-US entity | — | | | — | | | — | | — | | | — | | | — | | | 173 | | | 173 | | | — | | | 173 |
Foreign currency translation adjustment | — | | | — | | | — | | — | | | — | | | — | | | 1,918 | | | 1,918 | | | 50 | | | 1,968 |
Balance at December 31, 2013 | 103,818 | | $ | 104 | | $ | 866,552 | | 600 | | $ | (286) | | $ | 60,487 | | $ | 5,789 | (b) | $ | 932,646 | | $ | 1,146 | | $ | 933,792 |
| (a)
| | Amounts not shown due to rounding.
|
| (b)
| | Accumulated other comprehensive income of $5,789 consists of a cumulative unrealized loss on pension plan of $1,076, a $173 gain on the liquidation of a non-US entity and foreign currency translation gain of $6,692.
|
| | | | | | | | | | | | | | | | | | | | | | | | | | | |
| Common Stock | | Treasury Stock | | | | | | | | | | | | | | | |
(In thousands, except par value) | Shares | | Par Value $0.001 | | Additional Paid In Capital | | Shares | | Amount | | Accumulated Earnings (Deficit) | | Accumulated Other Comprehensive Income (Loss) | | Total 3D Systems Corporation Stockholders' Equity | | Equity Attributable to Noncontrolling Interests | | Total Stockholders' Equity |
Balance at December 31, 2013 | 103,818 | | $ | 104 | | $ | 866,552 | | 600 | | $ | (286) | | $ | 60,487 | | $ | 5,789 | | $ | 932,646 | | $ | 1,146 | | $ | 933,792 |
Tax benefits from share-based payment arrangements | — | | | — | | | 7,653 | | — | | | — | | | — | | | — | | | 7,653 | | | — | | | 7,653 |
Issuance and repurchase of restricted stock, net | 1,152 | | | 1 | | | 1,983 | | 109 | | | (88) | | | — | | | — | | | 1,896 | | | — | | | 1,896 |
Issuance of stock for convertible notes, net of taxes | 877 | | | 1 | | | 12,133 | | — | | | — | | | — | | | — | | | 12,134 | | | — | | | 12,134 |
Issuance of stock for acquisitions | 436 | | | — | | | 24,625 | | — | | | — | | | — | | | — | | | 24,625 | | | — | | | 24,625 |
Issuance of stock for equity raise | 5,950 | | | 6 | | | 299,723 | | — | | | — | | | — | | | — | | | 299,729 | | | — | | | 299,729 |
Stock-based compensation expense | — | | | — | | | 32,793 | | — | | | — | | | — | | | — | | | 32,793 | | | — | | | 32,793 |
Net income | — | | | — | | | — | | — | | | — | | | 11,637 | | | — | | | 11,637 | | | 309 | | | 11,946 |
Noncontrolling interests for business combinations | — | | | — | | | — | | — | | | — | | | — | | | — | | | — | | | (125) | | | (125) |
Pension adjustment | — | | | — | | | — | | — | | | — | | | — | | | (1,135) | | | (1,135) | | | — | | | (1,135) |
Foreign currency translation adjustment | — | | | — | | | — | | — | | | — | | | — | | | (29,060) | | | (29,060) | | | (123) | | | (29,183) |
Balance at December 31, 2014 | 112,233 | | $ | 112 | | $ | 1,245,462 | | 709 | | $ | (374) | | $ | 72,124 | | $ | (24,406) | | $ | 1,292,918 | | $ | 1,207 | | $ | 1,294,125 |
Tax provision from share-based payment arrangements | — | | | — | | | (1,243) | | — | | | — | | | — | | | — | | | (1,243) | | | — | | | (1,243) |
Issuance and repurchase of restricted stock, net | 882 | | | 1 | | | 786 | | 183 | | | (652) | | | — | | | — | | | 135 | | | — | | | 135 |
Stock-based compensation expense | — | | | — | | | 34,733 | | — | | | — | | | — | | | — | | | 34,733 | | | — | | | 34,733 |
Net loss | — | | | — | | | — | | — | | | — | | | (655,492) | | | — | | | (655,492) | | | (8,433) | | | (663,925) |
Noncontrolling interests for business combinations | — | | | — | | | — | | — | | | — | | | — | | | — | | | — | | | 6,783 | | | 6,783 |
Pension adjustment | — | | | — | | | — | | — | | | — | | | — | | | 338 | | | 338 | | | — | | | 338 |
Foreign currency translation adjustment | — | | | — | | | — | | — | | | — | | | — | | | (15,480) | | | (15,480) | | | (820) | | | (16,300) |
Balance at December 31, 2015 | 113,115 | | $ | 113 | | $ | 1,279,738 | | 892 | | $ | (1,026) | | $ | (583,368) | | $ | (39,548) | | $ | 655,909 | | $ | (1,263) | | $ | 654,646 |
Issuance and repurchase of restricted stock, net, and retirement of treasury stock | 1,998 | | | 2 | | | (1,241) | | 606 | | | (1,632) | | | — | | | — | | | (2,871) | | | — | | | (2,871) |
Acquisition of noncontrolling interest | — | | | — | | | (2,364) | | — | | | — | | | — | | | — | | | (2,364) | | | (1,169) | | | (3,533) |
Stock-based compensation expense | — | | | — | | | 31,295 | | — | | | — | | | — | | | — | | | 31,295 | | | — | | | 31,295 |
Net loss | — | | | — | | | — | | — | | | — | | | (38,419) | | | — | | | (38,419) | | | (846) | | | (39,265) |
Pension adjustment | — | | | — | | | — | | — | | | — | | | — | | | (902) | | | (902) | | | — | | | (902) |
Liquidation of non-US entity | — | | | — | | | — | | — | | | — | | | — | | | 288 | | | 288 | | | — | | | 288 |
Foreign currency translation adjustment | — | | | — | | | — | | — | | | — | | | — | | | (13,063) | | | (13,063) | | | 105 | | | (12,958) |
Balance at December 31, 2016 | 115,113 | | $ | 115 | | $ | 1,307,428 | | 1,498 | | $ | (2,658) | | $ | (621,787) | | $ | (53,225) | | $ | 629,873 | | $ | (3,173) | | $ | 626,700 |
See accompanying notes to consolidated financial statements.Consolidated Financial Statements.
3D Systems Corporation
Consolidated Statements of Cash Flows
Years Ended December 31, 2013, 20122016, 2015 and 20112014
| | | | | | | | | | | | | | | | |
(in thousands) | | 2013 | | | 2012 | | | 2011 | |
| | |
(In thousands) | | | 2016 | | | 2015 | | | 2014 |
Cash flows from operating activities: | | | | | | | | | | | | | | | | |
Net income | $ | 44,119 | | $ | 38,941 | | $ | 35,420 | |
Adjustments to reconcile net income to net cash provided by operating activities: | | | | | | | | | |
Net income (loss) | | $ | (39,265) | | $ | (663,925) | | $ | 11,946 |
Adjustments to reconcile net loss to net cash provided by (used in) operating activities: | | | | | | | | | |
Benefit of deferred income taxes | | (9,892) | | | (661) | | | (5,140) | | (6,566) | | | (2,875) | | | (24,555) |
Depreciation and amortization | | 30,444 | | | 21,229 | | | 11,093 | | 60,535 | | | 83,069 | | | 55,188 |
Provision for arbitration award | | | — | | | 11,282 | | | — |
Impairment of assets | | | 8,618 | | | 544,611 | | | — |
Non-cash interest on convertible notes | | 974 | | | 3,876 | | | 409 | | — | | | — | | | 224 |
Provision for bad debts | | 4,961 | | | 3,039 | | | 1,731 | | 1,552 | | | 3,766 | | | 8,699 |
Provision for inventory reserves and revaluation, net | | | 11,053 | | | 21,550 | | | 2,334 |
Stock-based compensation | | 13,558 | | | 5,118 | | | 2,637 | | 31,295 | | | 34,733 | | | 32,793 |
(Gain) loss on the disposition of property and equipment | | 1,128 | | | (674) | | | 256 | | 2,529 | | | (43) | | | (227) |
Deferred interest income | | (1,018) | | | — | | | — | |
Loss on conversion of convertible debt | | 11,275 | | | 7,021 | | | — | | — | | | — | | | 1,806 |
Changes in operating accounts: | | | | | | | | | |
Changes in operating accounts, net of acquisitions: | | | | | | | | | |
Accounts receivable | | (43,684) | | | (19,246) | | | (12,090) | | 27,130 | | | 20,890 | | | (55,977) |
Inventories | | (30,893) | | | (12,225) | | | (2,608) | | (22,178) | | | (31,241) | | | (33,088) |
Prepaid expenses and other current assets | | (1,780) | | | (794) | | | 45 | | (4,369) | | | 2,197 | | | (9,235) |
Accounts payable | | 7,620 | | | (238) | | | (3,457) | | (5,878) | | | (18,904) | | | 23,482 |
Accrued liabilities | | (6,495) | | | 7,567 | | | (2,496) | |
Customer deposits | | 1,904 | | | (1,336) | | | 857 | |
Deferred revenue | | 7,526 | | | 1,164 | | | 525 | |
Other operating assets and liabilities | | (4,563) | | | (1,251) | | | 478 | |
Net cash provided by operating activities | | 25,184 | | | 51,530 | | | 27,660 | |
Accrued and other current liabilities | | | (6,652) | | | 624 | | | 15,406 |
All other operating activities | | | (902) | | | (8,862) | | | 22,315 |
Net cash provided by (used in) operating activities | | | 56,902 | | | (3,128) | | | 51,111 |
Cash flows from investing activities: | | | | | | | | | | | | | | | | |
Purchases of property and equipment | | (6,972) | | | (3,224) | | | (2,870) | | (16,567) | | | (22,399) | | | (22,727) |
Additions to license and patent costs | | (1,648) | | | (729) | | | (336) | | (1,132) | | | (907) | | | (753) |
Proceeds from disposition of property and equipment | | 1,882 | | | — | | | 174 | | 350 | | | — | | | — |
Purchase of noncontrolling interest | | | (3,533) | | | — | | | — |
Cash paid for acquisitions, net of cash assumed | | (162,318) | | | (183,701) | | | (92,677) | | — | | | (91,799) | | | (345,361) |
Other investing activities | | (4,701) | | | — | | | — | | (1,000) | | | (5,750) | | | (6,600) |
Net cash used in investing activities | | (173,757) | | | (187,654) | | | (95,709) | | (21,882) | | | (120,855) | | | (375,441) |
Cash flows from financing activities: | | | | | | | | | | | | | | | | |
Tax benefits (provision) from share-based payment arrangements | | | — | | | (1,243) | | | 7,653 |
Proceeds from issuance of common stock | | 272,076 | | | 106,889 | | | 62,054 | | — | | | — | | | 299,729 |
Proceeds from 5.50% convertible notes | | — | | | — | | | 148,960 | |
Tax benefits from share-based payment arrangements | | 26,038 | | | 1,514 | | | — | |
Convertible notes capitalized costs | | — | | | — | | | (3,594) | |
Proceeds from exercise of stock options and restricted stock, net | | 902 | | | 4,400 | | | 2,764 | |
Cash disbursed in lieu of fractional shares related to stock split | | (176) | | | — | | | — | |
Proceeds, repurchase and retirement of stock, net | | | (2,871) | | | 135 | | | 1,896 |
Repayment of capital lease obligations | | (157) | | | (163) | | | (221) | | (1,055) | | | (1,049) | | | (696) |
Restricted cash | | 13 | | | — | | | 12 | |
Net cash provided by financing activities | | 298,696 | | | 112,640 | | | 209,975 | |
Effect of exchange rate changes on cash | | 334 | | | 223 | | | (155) | |
Net cash provided by (used in) financing activities | | | (3,926) | | | (2,157) | | | 308,582 |
Effect of exchange rate changes on cash and cash equivalents | | | (1,790) | | | (3,079) | | | (5,706) |
Net increase (decrease) in cash and cash equivalents | | 150,457 | | | (23,261) | | | 141,771 | | 29,304 | | | (129,219) | | | (21,454) |
Cash and cash equivalents at the beginning of the period | | 155,859 | | | 179,120 | | | 37,349 | | 155,643 | | | 284,862 | | | 306,316 |
Cash and cash equivalents at the end of the period | $ | 306,316 | | $ | 155,859 | | $ | 179,120 | $ | 184,947 | | $ | 155,643 | | $ | 284,862 |
| | | | | | | | | | | | | | | | |
Interest payments | $ | 1,584 | | $ | 9,113 | | $ | 1,188 | |
Income tax payments | | 5,642 | | | 3,506 | | | 1,523 | |
Cash interest payments | | $ | 839 | | $ | 707 | | $ | 888 |
Cash income tax payments | | | 11,045 | | | 12,512 | | | 15,602 |
Transfer of equipment from inventory to property and equipment, net (a) | | 4,886 | | | 4,057 | | | 3,714 | | 12,493 | | | 9,902 | | | 5,891 |
Transfer of equipment to inventory from property and equipment, net (b) | | 612 | | | 1,924 | | | 1,068 | | 1,102 | | | 2,764 | | | 944 |
Stock issued for acquisitions of businesses | | 13,131 | | | 7,672 | | | 3,042 | | — | | | — | | | 24,625 |
Notes redeemed for shares of common stock | | 80,754 | | | 60,082 | | | — | | — | | | — | | | 12,134 |
See accompanying notes to consolidated financial statements.
| (a) | | Inventory is transferred from inventory to property and equipment at cost when the Company requires additional machines for training or demonstration or for placement into Quickpartson-demand parts services locations. |
| (b) | | In general, an asset is transferred from property and equipment, net into inventory at its net book value when the Company has identified a potential sale for a used machine. |
See accompanying notes to Consolidated Financial Statements.
Note 1 Basis of Presentation
The consolidated financial statementsConsolidated Financial Statements include the accounts of 3D Systems Corporation and all majority-owned subsidiaries and entities in which a controlling interest is maintained (the “Company”).
A non-controlling interest in a subsidiary is considered an ownership interest in a majority-owned subsidiary that is not attributable to the parent. The Company includes noncontrolling interests as a component of total equity in the Consolidated Balance Sheets and the net income attributable to noncontrolling interests are presented as an adjustment from net income used to arrive at net income attributable to 3D Systems Corporation in the consolidated statements of operations and comprehensive loss.
All significant intercompany accounts and transactions have been eliminated in consolidation. The Company’s annual reporting period is the calendar year.
The consolidated financial statementsConsolidated Financial Statements have been prepared in accordance with accounting principles generally accepted in the United States (“GAAP”). Certain prior period amounts have been reclassified to conform to the current year presentation.
The preparation of financial statements in accordance with GAAP requires management to make estimates and assumptions that affect the amounts reported in the financial statements. Actual results may differ from these estimates and assumptions.
All amounts presented in the accompanying footnotes are presented in thousands, except for per share information.
The Company’s Board of Directors approved a three-for-two stock split, effected in the form of a 50% stock dividend, which was paid on February 22, 2013 to stockholders of record at the close of business on February 15, 2013. The Company’s stockholders received one additional share of common stock for every two shares of common stock owned. This did not change the proportionate interest that a stockholder maintained in the Company. In lieu of fractional shares, shareholders received a cash payment based on the closing market price of DDD stock on the record date. All share and per share amounts set forth in this report, including earnings per share and the weighted average number of shares outstanding for basic and diluted earnings per share, for each respective period have been adjusted to reflect the three-for-two stock split.
Note 2 Significant Accounting Policies
Use of Estimates
The consolidated financial statementsConsolidated Financial Statements have been prepared in accordance with accounting principles generally accepted in the United States. The preparation of these financial statements requires the Company to make estimates and judgments that affect the reported amounts of assets, liabilities, revenue and expenses and related disclosure of contingent assets and liabilities. On an ongoing basis, the Company evaluates its estimates, including, among others, those related to the allowance for doubtful accounts, income taxes, inventory reserves, goodwill, other intangible assets contingencies and revenue recognition.contingencies. The Company bases its estimates on historical experience and on various other assumptions that are believed to be reasonable, the results of which form the basis for making judgments about the carrying values of assets and liabilities that are not readily apparent from other sources. Actual results may differ from these estimates.
Revenue Recognition
Net revenue is derived primarily from the sale of products and services. The following revenue recognition policies define the manner in which the Company accounts for sales transactions.
The Company recognizes revenue when persuasive evidence of a sale arrangement exists, delivery has occurred or services are rendered, the sales price or fee is fixed or determinable and collectability is reasonably assured. Revenue generally is recognized net of allowances for returns and any taxes collected from customers and subsequently remitted to governmental authorities. The Company sells its products through its direct sales force and through authorized resellers.reseller partners. The Company recognizes revenue on sales to resellersreseller partners at the time of sale when the resellerpartner has economic substance apart from Company, and the Company has completed its obligations related to the sale.
The Company enters into sales arrangements that may provide for multiple deliverables to a customer. Sales of printers may include ancillary equipment, print materials, a warranty on the equipment, training and installation. The Company identifies all goods and/or services that are to be delivered separately under a sales arrangement and allocates revenue to each deliverable based on either vendor-specific objective evidence (“VSOE”) or if VSOE is not determinable then the Company uses best estimated selling price (“BESP”) of each deliverable. The Company established VSOE of selling price using the price charged for a deliverable when sold separately. The objective of BESP is to determine the price at which the Company would transact a sale if the deliverable was sold regularly on a stand-alone basis. The Company considers multiple factors including, but not limited to, market conditions, geographies, competitive landscapes, and entity-specific factors such as internal costs, gross margin objectives and pricing practices when estimating BESP. Consideration in a multiple element arrangement is then allocated to the elements on a relative sales value basis using either VSOE or BESP for all the elements. The Company also evaluates the impact of undelivered items on the functionality of delivered items for each sales transaction and, where appropriate, defers revenue on delivered items when that functionality has been affected. Functionality is determined to be met if the delivered products or services represent a separate earnings process.
Hardware
In general, revenues are separated between printers and other products, print materials, training services, maintenance services and installation services. The allocated revenue for each deliverable is then recognized based on relative fair values of the components of the sale, consistent within the scope of Financial Accounting Standards Board (“FASB”) Accounting Standards Codification (“ASC”) 605 Revenue Recognition.
Under the Company’s standard terms and conditions of sale, title and risk of loss transfer to the customer at the time product is shipped to the customer and revenue is recognized accordingly, unless customer acceptance is uncertain or significant obligations remain. The Company defers the estimated revenue associated with post-sale obligations that are not essential to the functionality of the delivered items, and recognizes revenue in the future as the conditions for revenue recognition are met.
Software
The Company also markets and sells software tools that enable our customers to capture and customize content using our printers, as well as reverse engineering and inspection software. The software does not require significant modification or customization. The Company applies the guidance in ASC 985-605, Software-Revenue Recognition in recognizing revenue when software is more than incidental to the product or service as a whole based on fair value using vendor-specific objective evidence. Revenue from perpetual software licenses is recognized either upon delivery of the product or delivery of a key code which allows the customer to access the software. In instances where software access is provided for a trial period, revenue is not recognized until the customer has purchased the software at the expiration of the trial period. The Company uses the residual method to allocate revenue to software licenses at the inception of the license term when VSOE of fair value for all undelivered elements, such as maintenance, exists and all other revenue recognition criteria have been satisfied. In instances in which customers purchase post sale support, it is considered a separate element from the software and is deferred at the time of sale and subsequently amortized in future periods.
The Company also sells equipment with embedded software to its customers. The embedded software is not sold separately, it is not a significant focus of the marketing effort and the Company does not provide post-contract customer support specific to the software or incur significant costs that are within the scope of ASC 985. Additionally, the functionality that the software provides is marketed as part of the overall product. The software embedded in the equipment is incidental to the equipment as a whole such that ASC 985 is not applicable. Sales of these products are recognized in accordance with ASC 605.25, “Multiple-Element Arrangements.605-25, “Multiple-Element Arrangements.”
Services
Printers and certain other products include a warranty under which the Company provides maintenance for periods up to one year, as well as training, installation and non-contract maintenance services. The Company defers this portion of the revenue at the time of sale based on the relative fair value of these services. Deferred revenue is recognized ratably according to the term of the warranty. Costs associated with our obligations during the warranty period are expensed as incurred. After the initial warranty period, the Company offers these customers optional maintenance contracts. Deferred maintenance revenue is recognized ratably, on a straight-line basis, over the period of the contract, and recognizes the costs associated with these contracts are recognized as incurred. Revenue from training, installation and non-contract maintenance services is recognized at the time of performance.
Quickparts printedOn-demand parts and healthcare service sales are included within services revenue and revenue is recognized upon shipment or delivery of the parts, based on the terms of the sales arrangement.
Terms of sale
Shipping and handling costs billed to customers for equipment sales and sales of print materials are included in product revenue in the consolidated statementsConsolidated Statements of incomeOperations and other comprehensive income.Other Comprehensive Loss. Costs incurred by the Company associated with shipping and handling are included in product cost of sales in the consolidated statementsConsolidated Statements of incomeOperations and other comprehensive income.Other Comprehensive Loss.
Credit is extended, and creditworthiness is determined, based on an evaluation of each customer’s financial condition. New customers are generally required to complete a credit application and provide references and bank information to facilitate an analysis of creditworthiness. Customers with a favorable profile may receive credit terms that differ from the Company’s general credit terms. Creditworthiness is considered, among other things, in evaluating the Company’s relationship with customers with past due balances.
The Company’s terms of sale generally require payment within 30 to 60 days after shipment of a product, although the Company also recognizes that longer payment periods are customary in some countries where it transacts business. To reduce credit risk in connection with printer sales, the Company may, depending upon the circumstances, require significant deposits prior to shipment and may retain a security interest in a system sold until fully paid. In some circumstances, the Company may require payment in full for its products prior to shipment and may require international customers to furnish letters of credit. For maintenance services, the Company either bills customers on a time-and-materials basis or sells customers service agreements that are recorded as deferred revenue and provide for payment in advance on either an annual or other periodic basis.
Cash and Cash Equivalents
Investments with original maturities of three months or less at the date of purchase are considered to be cash equivalents. The Company’s policy is to invest cash in excess of short-term operating and debt-service requirements in such cash equivalents. These instruments are stated at cost, which approximates market value because of the short maturity of the instruments. The Company places its cash with highly creditworthy financial institutions, corporations or governments, and believes its risk of loss is limited; however, at times, account balances may exceed international and U.S. federally insured limits.
Investments
Investments in non-consolidated affiliates (20-50 percent owned companies and joint ventures) are accounted for using the equity method. Investments through which we are not able to exercise significant influence over the investee and which we do not have readily determinable fair values are accounted for under the cost method.
The Company assesses declines in the fair value of investments to determine whether such declines are other-than-temporary. This assessment is made considering all available evidence, including changes in general market conditions, specific industry and individual company data, the length of time and the extent to which the fair value has been less than cost, the financial condition and the near-term prospects of the entity issuing the security, and the Company’s ability and intent to hold the investment until recovery. Other-than-temporary impairments of investments are recorded to interest and other expense, net, on the Company’s Consolidated Statements of Operations and Other Comprehensive Loss in the period in which they become impaired.
For the years ended December 31, 2016 and 2015, the Company recorded impairment charges of $1,210 and $7,432, respectively, related to certain minority investments of less than 20% ownership, for which we do not exercise significant influence. The aggregate carrying amount of all investments accounted for under the cost method totaled $9,116 and $10,687 at December 31, 2016 and 2015, respectively, and is included in other assets, net, on the Company’s Consolidated Balance Sheets.
Allowance for Doubtful Accounts
TheIn evaluating the collectability of accounts receivable, the Company assesses a number of factors, including specific customers’ ability to meet their financial obligations to us, the length of time receivables are past due and historical collection experience. Based on these assessments, the Company may record a reserve for specific customers, as well as a general reserve and allowance for returns and discounts. If circumstances related to specific customers change, or economic conditions deteriorate such that the Company’s past collection experience is no longer relevant, its estimate of the allowancerecoverability of accounts receivable could be further reduced from the levels provided for doubtful accounts related to trade receivables is based on two methods. The amounts calculated from each of these methods are combined to determinein the total amount reserved.Consolidated Financial Statements.
First, theThe Company evaluates specific accounts for which it has information that thebelieves a customer may be unablehave an inability to meet itstheir financial obligations (for example, aging over 90 days past due or bankruptcy). In these cases, the Company uses its judgment, based on the available facts and circumstances, and records a specific reserve for that customer against amounts due to reduce the outstanding receivable balance to an amount the amount that is expectedCompany expects to be collected.collect. These specific reserves are reevaluatedre-evaluated and adjusted as additional information is received that impacts the amount reserved.
Second, a reserve is established for all customers based on percentages applied to aging categories. These percentages are based on historical collection and write-off experience. If circumstances change (for example, the Company experiences higher-than-expected defaults or an unexpected adverse change in a customer’s financial condition), estimates of the recoverability of amounts due to the Company could be reduced. Similarly, if the Company experiences lower-than-expected defaults or customer financial condition improves, estimates of the recoverability of amounts due the Company could be increased.
The Company also provides an allowance account for returns and discounts. This allowance is evaluated on a specific account basis. In addition, the Company provides a general reserve for returns from customers that have not been specifically identified based on historical experience.
The Company’s estimate of the allowance for doubtful accounts for financing receivables is determined by evaluating specific accounts for which the borrower is past due more than 90 days, or for which it has information that the borrower may be unable to meet its financial obligations (for example, bankruptcy). In these cases, the Company uses its judgment, based on the available facts and circumstances, and records a specific reserve for that borrower against amounts due to reduce the outstanding receivable balance to the amount that is expected to be collected. If there are any specific reserves, they are reevaluated and adjusted as additional information is received that impacts the amount reserved.
Inventories
Inventories are stated at the lower of cost or net realizable market value, cost being determined using the first-in, first-out method. Reserves for slow-moving and obsolete inventories are provided based on historical experience and current product demand. The Company evaluates the adequacy of these reserves quarterly.
Property and Equipment
Property and equipment are carried at cost and depreciated on a straight-line basis over the estimated useful lives of the related assets, generally three to thirty years.assets. Leasehold improvements are amortized on a straight-line basis over the shorter of (i) their estimated useful lives and (ii) the estimated or contractual lives of the leases. Realized gains and losses are recognized upon disposal or retirement of the related assets and are reflected in results of operations. Charges for repairs and maintenance are expensed as incurred.
GoodwillIn accordance with ASC 360, “Property, Plant and Intangible AssetsEquipment,” the Company assesses potential impairments of property and equipment when events or changes in circumstances indicate that the carrying amount may not be fully recoverable. If required, an impairment loss is recognized as the difference between the carrying value and the fair value of the assets.
Goodwill
Goodwill reflects the excess of the consideration transferred plus the fair value of any non-controlling interest in the acquiree at the acquisition date over the fair values of the identifiable net assets acquired. Goodwill is not amortized but rather is tested for impairment annually, or whenever events or circumstances present an indication of impairment. Goodwill is an asset representing the future economic benefits arising from other assets acquired in a business combination that are not individually identified and separately recognized. The primary items that generate goodwill include the value of the synergies between the acquired companies and the Company and the acquired assembled workforce, neither of which qualifies for recognition as an identifiable intangible asset.
The annual impairment testing required by ASC 350, “Intangibles“Intangibles – Goodwill and Other”Other” requires the Company to use judgment and could require the Company to write down the carrying value of its goodwill and other intangible assets in future periods. The Company allocates goodwill to its identifiable geographic reporting units, the Americas, EMEA and APAC regions, which are tested for impairment using a two-step process detailed in that statement. See Note 7 to the consolidated financial statements.process. The first step requires comparing the fair value of each reporting unit with the carrying amount, including goodwill. If that fair value exceeds the carrying amount, the second step of the process is not required to be performed, and no impairment charge is required to be recorded. If that fair value does not exceed that carrying amount, the Company must perform the second step, which requires an allocation of the fair value of the reporting unit to all assets and liabilities of that unit as if the reporting unit had been acquired in a purchase business combination and the fair value of the reporting unit was the purchase price. The goodwill resulting from that purchase price allocation is then compared to the carrying amount with any excess recorded as an impairment charge.
The evaluation of goodwill impairment requires the Company to make assumptions about future cash flows of the reporting unit being evaluated that include, among others, growth in revenues, margins realized, level of operating expenses and cost of capital. These assumptions require significant judgement and actual results may differ from assumed and estimated amounts.
Goodwill set forth on the Consolidated Balance Sheet as of December 31, 20132016 arose from acquisitions carried out in 2013, 2012, 2011, 2010 andfrom 2009 to 2015 and in years prior to December 31, 2007. Goodwill arising from acquisitions prior to 2007 was allocated to geographic reporting units based on the percentage of SLS printers then installed by geographic area. Goodwill arising from acquisitions in 2009 through 2013to 2015 was allocated to geographic reporting units based on geographic dispersion of the acquired companies’ sales or capitalization at the time of their acquisition.
The Company is required to perform a valuation of each ofconducted its three geographic reporting units annually, or upon significant changesannual impairment testing for the year ended December 31, 2016 in the Company’s business environment. fourth quarter of 2016. There was no goodwill impairment for the year ended December 31, 2016.
The Company conducted its annual impairment analysistesting for the year ended December 31, 2015 in the fourth quarter of 2013. To determine2015. The results of the Company’s first step of annual impairment testing indicated the carrying amount of goodwill assigned to the Americas and EMEA reporting units exceeded fair value and that the carrying amount of goodwill assigned to APAC did not exceed fair value. Based on these results, management completed the second step of annual impairment testing for the Americas and EMEA reporting units. Management determined that the fair value of each reporting unitgoodwill assigned to the Company utilized discounted cash flows, using five years of projected unleveraged free cash flows and terminal EBITDA earnings multiples. The discount rates used for the analysis reflected a weighted average cost of capital based on industry and capital structure adjusted for equity risk premiums and size risk premiums based on market capitalization. The discounted cash flow valuation uses projections of future cash flows and includes assumptions concerning future operating performance and economic conditions and may differ from actual future cash flows. The Company also considered the current trading multiples of comparable publicly-traded companies and the historical pricing multiples for comparable merger and acquisition transactions that have occurred in the industry. The control premium that a third party would be willing to pay to obtain a controlling interestAmericas was zero, resulting in a reporting unit 3D Systems Corporation was a componentnon-cash, non-tax deductible impairment charge of $382,271. Management determined that the carrying amount of the reporting unit’s considered when determining fair value. In addition, factors such as the performance of competitors were also considered. Under eachgoodwill assigned to EMEA exceeded fair value measurement methodology considered, the fair value of each reporting unit exceeded its carrying value; accordingly, noby approximately 29%, resulting in a non-cash, non-tax deductible goodwill impairment adjustments were recorded. In addition, factors such as the performancecharge of competitors were also considered. The Company concluded that there was a reasonable basis for the excess of the estimated fair value of the geographic reporting units over its market capitalization.
The estimated fair value of the three geographic reporting units incorporated judgment and the use of estimates by management. Potential factors requiring assessment include the relationship between our market capitalization and our book value, variance in results of operations from projections, and additional acquisition transactions in the industry that reflect a lower control premium. Any of these factors may cause management to reevaluate goodwill during any quarter throughout the year. If an impairment charge were to be taken for goodwill it would be a non-cash charge and would not impact the Company’s cash position or cash flows; however, such a charge could have a material impact to equity and the statement of income and comprehensive income.$61,388. See Note 7.
There was no goodwill impairment for the yearsyear ended December 31, 2013, 20122014.
The Company will monitor its reporting units in an effort to determine whether events and circumstances warrant further interim impairment testing. The Company could be required to write off or 2011.write down additional amounts in the future in the event of deterioration in future performance, sustained slower growth or other circumstances.
Determining the fair value of a reporting unit, intangible asset or a long-lived asset is judgmental and involves the use of significant estimates and assumptions. The Company bases its fair value estimates on assumptions that it believes are reasonable, but are uncertain and subject to changes in market conditions.
Licenses, Patent Costs and Other Long-LivedIntangible Assets
Licenses,Intangible assets other than goodwill primarily represent acquired intangible assets including licenses, patent costs, acquired technology, internally developed technology, customer relationships, non-compete agreements, trade names and other long-livedtrademarks. Intangible assets include costs incurred to perfect license or patent rights under applicable domestic and foreign laws and the amount incurred to acquire existing licenses and patents. Licenses and patent costswith finite lives are amortized on ausing the straight-line basismethod over their estimated useful lives,life, which is determined by identifying the period over which most of the cash flows are approximately sevenexpected to twenty years. be generated.
Amortization expenseof license and patent costs is included in cost of sales, research and development expenses and selling, general and administrative expenses, depending upon the nature and use of the technology.technology. Amortization of trade names, customer relationships and non-compete agreements are recorded in selling, general and administrative expenses.
TheFor intangibles with finite lives, the Company evaluates long-lived assets other than goodwillreviews the carrying amounts for potential impairment wheneverwhen events or changes in circumstances indicate that the carrying valueamount of an asset may not be recoverable. IfExamples of such a change in circumstances include a significant decrease in selling price, a significant adverse change in the extent or manner in which an asset is being used, or a significant adverse change in the legal or business climate. In evaluating recoverability, the Company groups assets and liabilities at the lowest level such that the identifiable cash flows relating to the group are largely independent of the cash flows of other assets and liabilities. The Company then compares the carrying amounts of the assets or asset groups with the related estimated undiscounted future cash flows (undiscounted and without interest charges) fromflows. In the useevent impairment exists, an impairment charge is recorded as the amount by which the carrying amount of the asset are less than its carryingor asset group exceeds the fair value. Fair value is determined by reference to estimated selling values of assets in similar condition or by using a write-downdiscounted cash flow model. In addition, the remaining amortization period for the impaired asset would be recorded to reduce the related asset to its estimated fair value.reassessed and, if necessary, revised.
No impairment loss wascharges for intangible assets with finite lives were recorded for the periods presented.year ended December 31, 2016. For the year ended December 31, 2015, the Company recorded non-cash impairment charges of $93,520 arising from the Company’s other intangible assets impairment testing. No impairment charges were recorded by the Company for the year ended December 31, 2014.
Capitalized Software CostsRedeemable Noncontrolling Interests
Certain software development and production costs are capitalized whenThe minority interest shareholders of a certain subsidiary have the right in certain circumstances to require the Company to acquire either a portion of or all of the remaining ownership interests held by them. The owners’ ability to exercise any such “put option” right is subject to the satisfaction of certain conditions, including conditions requiring notice in advance of exercise. In addition, these rights cannot be exercised prior to a specified exercise date. The exercise of these rights at their earliest contractual date would result in obligations of the Company to fund the related product reaches technological feasibility. Software development costsamounts in 2019. See Note 22.
The Company has recorded the put option as mezzanine equity at their current estimated redemption amount. The Company accrues changes in the redemption amounts over the period from the date of $250 were capitalized in 2013. No software development costs were capitalized in 2012. Software development costs capitalized in 2011 were $7,863. Capitalized software costs include internally developed software and certain costs that relateissuance to developed software that the Company acquired through acquisitionearliest redemption date of businesses. Amortization of software development costs begins when the related products are available for use in related printers. Amortization expense, included in cost of sales, amounted to $1,439, $1,440 and $1,046 for 2013, 2012 and 2011, respectively, based onput option. For the straight-line method using an estimated useful life ranging from two years to eight years. Net capitalized software costs aggregated $5,234, $6,424 and $7,864 atyear ended December 31, 2013, 2012 and 2011, respectively, and are included in intangible assets2016, there has been no change to redeemable noncontrolling interests. Changes in the accompanying consolidated balance sheets.estimated redemption amounts of the put options are adjusted at each reporting period with a corresponding adjustment to equity.
The following table presents changes in Redeemable Noncontrolling Interests:
| | | | | |
(in thousands) | 2016 | | 2015 |
Beginning balance – January 1 | $ | 8,872 | | $ | 8,872 |
Changes in redemption value | | — | | | — |
Ending balance – December 31 | $ | 8,872 | | $ | 8,872 |
Contingencies
The Company follows the provisions of ASC 450, “Contingencies,“Contingencies,” which requires that an estimated loss from a loss contingency be accrued by a charge to income if it is both probable that an asset has been impaired or that a liability has been incurred and that the amount of the loss can be reasonably estimated.
Foreign Currency Translation
The Company transacts business globally and is subject to risks associated with fluctuating foreign exchange rates. Approximately 44.5% of theThe Company’s consolidated revenue that is derived from sales outside the U.S. This revenue is generated primarily from sales of subsidiaries operating outside the U.S. in their respective countries and surrounding geographic areas. This revenue is primarily denominated in each subsidiary’s local functional currency, although certain sales are denominated in other currencies. These subsidiaries incur most of their expenses (other than intercompany expenses) in their local functional currencies. These currencies include Australian Dollars, Brazilian Real, British Pounds, Chinese Yuan, Euros, Indian Rupee, Israeli Shekel, Japanese Yen, Mexican Pesos, Swiss Francs, South Korean Won and Indian Rupee.Uruguayan Pesos.
The geographic areas outside the U.S. in which the Company operates are generally not considered to be highly inflationary. Nonetheless, these foreign operations are sensitive to fluctuations in currency exchange rates arising from, among other things, certain intercompany transactions that are generally denominated in U.S. dollars rather than their respective functional currencies. The Company’s operating results, assets and liabilities are subject to the effect of foreign currency translation when the operating results and the assets and liabilities of the Company’s foreign subsidiaries are translated into U.S. dollars in the Company’s consolidated financial statements.Consolidated Financial Statements. The assets and liabilities of the Company’s foreign subsidiaries are translated from their respective functional currencies into U.S. dollars based on the translation rate in effect at the end of the related reporting period.
The operating results of the Company’s foreign subsidiaries are translated to U.S. dollars based on the average conversion rate for the related period. Gains and losses resulting from these conversions are recorded in accumulated other comprehensive incomeloss in the consolidated balance sheets.
Gains and losses resulting from foreign currency transactions (transactions denominated in a currency other than the functional currency of the Company or a subsidiary) are included in the consolidated statements of incomeoperations and other comprehensive income,loss, except for intercompany receivables and payables for which settlement is not planned or anticipated in the foreseeable future, which are included as a component of accumulated other comprehensive incomeloss in the consolidated balance sheets.
Derivative Financial Instruments
The Company is exposed to market risk from changes in interest rates and foreign currency exchange rates and commodity prices, which may adversely affect its results of operations and financial condition. The Company seeks to minimize these risks through regular operating and financing activities and, when the Company considers it to be appropriate, through the use of derivative financial instruments.
The Company does not purchase, hold or sell derivative financial instruments for trading or speculative purposes. The Company has elected not to prepare and maintain the documentation to qualify for hedge accounting treatment under ASC 815, “Derivatives“Derivatives and Hedging,” and therefore, all gains and losses (realized or unrealized) related to derivative instruments are recognized in interest and other expense, net in the consolidated statements of incomeoperations and comprehensive incomeloss and depending on the fair value at the end of the reporting period, derivatives are recorded either in prepaid and other current assets or in accrued liabilities in the consolidated balance sheets.
The Company and its subsidiaries conduct business in various countries using both their functional currencies and other currencies to effect cross border transactions. As a result, they are subject to the risk that fluctuations in foreign exchange rates between the dates that those transactions are entered into and their respective settlement dates will result in a foreign exchange gain or loss. When practicable, the Company endeavors to match assets and liabilities in the same currency on its U.S. balance sheet and those of its subsidiaries in order to reduce these risks. The Company, when it considers it to be appropriate, enters into foreign currency contracts to hedge the exposures arising from those transactions. See Note 10 to the consolidated financial statements.10.
The Company is exposed to credit risk if the counterparties to such transactions are unable to perform their obligations. However, the Company seeks to minimize such risk by entering into transactions with counterparties that are believed to be creditworthy financial institutions.
The 5.50% senior convertible notes provide the noteholders with certain rights that the Company considers being embedded derivatives. Embedded derivatives could be required to be bifurcated and accounted for separately from the underlying notes. The Company evaluated the embedded derivatives and determined that they were not required to be bifurcated.
Research and Development Costs
Research and development costs are expensed as incurred.
Earnings (Loss) per Share
Basic net income (loss) per share is computed by dividing net income available to common stockholders by the weighted average number of shares of common stock outstanding during the period. Diluted net income (loss) per share is computed by dividing net income, as adjusted for the assumed issuance of all dilutive shares, by the weighted average number of shares of common stock outstanding plus the number of additional common shares that would have been outstanding if all dilutive common shares issuable upon exercise of outstanding stock options or conversion of convertible securities had been issued. Common shares related to stock options are excluded from the computation when their effect is anti-dilutive, that is, when their inclusion would increase the Company’s net income per share or reduce its net loss per share. The average outstanding diluted shares calculation also excludes shares that may be issued upon conversion of the outstanding senior convertible notes because at December 31, 2013 and 2012 their inclusion would have been anti-dilutive. At December 31, 2011, the average outstanding diluted shares calculation also excluded shares that may be issued upon conversion of the outstanding senior convertible notes because their conversion price exceeded the market price of the shares at December 31, 2011. See Note 17 to the consolidated financial statements.17.
Advertising Costs
Advertising costs are expensed as incurred. Advertising expensescosts, including trade shows, were $6,010, $3,972$12,469, $15,245 and $1,516$8,799 for the years ended December 31, 2013, 20122016, 2015 and 2011,2014, respectively.
Pension costs
The Company sponsors a retirement benefit for one of its non-U.S. subsidiaries in the form of a defined benefit pension plan. Accounting standards require the cost of providing this pension benefit be measured on an actuarial basis. Actuarial gains and losses resulting from both normal year-to-year changes in valuation assumptions and differences from actual experience are deferred and amortized. The application of these accounting standards requires management to make assumptions and judgmentsjudgements that can significantly affect these measurements. Critical assumptions made by management in performing these actuarial valuations include the selection of the discount rate to determine the present value of the pension obligations that affects the amount of pension expense recorded in any given period. Changes in the discount rate could have a material effect on the Company’s reported pension obligations and related pension expense. See Note 15 to the consolidated financial statements.15.
Equity Compensation Plans
The Company maintains stock-based compensation plans that are described more fully in Note 14 to the consolidated financial statements. Under the fair value recognition provisions of ASC 718, “Compensation – Stock Compensation,”14. For service-based awards, stock-based compensation is estimated at the grant date based on the fair value of the awards expected to vest and recognized as expense ratably over the requisite service period of the award. For stock options and awards with market conditions, compensation cost is determined at the individual tranche level. The Company estimates the forfeiture rate based on historical experience.
Income Taxes
The Company and the majority of its domestic subsidiaries file a consolidated U.S. federal income tax return.return while it has two entities that file separate U.S. federal tax returns. The Company’s non-U.S. subsidiaries file income tax returns in their respective jurisdictions. The Company provides for income taxes on those portions of its foreign subsidiaries’ accumulated earnings (deficit) that the Company believes are not reinvested permanently in their business.
Income taxes are accounted for under the asset and liability method. Deferred income tax assets and liabilities are recognized for the future tax consequences attributable to differences between the financial statement carrying amounts of existing assets and liabilities and their respective tax bases and tax benefit carryforwards. Deferred income tax liabilities and assets at the end of each period are determined using enacted tax rates.
The Company providesestablishes a valuation allowance for those jurisdictions in which the expiration date of tax benefit carryforwards or projected taxable earnings leads the Company to conclude that it is “more likely than not” that a deferred tax asset will not likelybe realized. The evaluation process includes the consideration of all available evidence regarding historical results and future projections including the estimated timing of reversals of existing taxable temporary differences and potential tax planning strategies. Once a valuation allowance is established, it is maintained until a change in factual circumstances gives rise to sufficient income of the appropriate character and timing that it will be able to realizeallow a partial or full utilization of the deferred tax benefit of those carryforwards.asset.
Based upon the Company’s recent results of operations and its expected profitability in the future, the Company concluded that it is more likely than not that its U.S. deferred tax assets will be realized.
The Company appliesIn accordance with ASC 740, to determine“Income Taxes,” the impact of an uncertain tax position on the Company’s income tax returns. In accordance with ASC 740, this impact must bereturns is recognized at the largest amount that is more likely than not to be required to be recognized upon audit by the relevant taxing authority.
The Company includes interest and penalties accrued in the consolidated financial statementsConsolidated Financial Statements as a component of income tax expense.
See Note 20 to the consolidated financial statements.Consolidated Financial Statements.
Recent Accounting Pronouncements
Recently Adopted Accounting Standards Implemented in 2013
In July 2012, the Financial Accounting Standards Board (“FASB”) issued Accounting Standards Update 2012-2 (“ASU 2012-2”), “Intangibles – Goodwill and Other (Topic 350).” ASU 2012-2 is intended to simplify the testing of intangible assets for impairment by permitting an entity the option to first assess qualitative factors to determine whether it is more likely than not that the fair value of indefinite-lived intangible assets is less than their carrying amounts. If an entity determines on the basis of the qualitative factors this is the case, then it is required to perform the currently prescribed two-step impairment test described in Topic 350. The Company adopted the standard in January 2013 and it did not have a significant impact on the Company’s consolidated financial statements.
In February 2013,March 2016, the FASB issued Accounting Standards Update 2013-2(“ASU”) No. 2016-09, “Stock Compensation (Topic 718)” (“ASU 2013-2”2016-09”). ASU 2016-09 simplifies the accounting for share-based payment transactions, including the income tax consequences, classification of awards as either equity or liabilities, and classification on the statement of cash flows. It is effective for annual reporting periods beginning after December 15, 2016 and interim periods within those annual periods. The Company adopted ASU 2016-09 in the first quarter of 2017 and expects to recognize additional tax benefits (expenses) in net income (losses) rather than additional paid in capital and as a change in operating cash flows rather than a change in financing cash flows under this guidance.
In April 2015, the FASB issued Accounting Standards Update No. 2015-03, “Simplifying the Presentation of Debt Issuance Costs” (“ASU 2015-03”), “Reportingwhich changes the presentation of Amounts Reclassified Out of Accumulated Other Comprehensive Income (Topic 220).”debt issuance costs in financial statements. ASU 2013-22015-03 requires an entity to provide information aboutpresent such costs in the amounts reclassified out of accumulated other comprehensive income by component. In addition,balance sheet as a direct deduction from the related debt liability rather than as an entity is required to present, either on the faceasset. Amortization of the statement where net incomecosts will continue to be reported as interest expense. It is presented oreffective for annual reporting periods beginning after December 15, 2016. Early adoption is permitted. The new guidance will be applied retrospectively to each prior period presented. The Company has elected to adopt this guidance in the notes, significant amounts reclassified outfirst quarter of accumulated other comprehensive income by the respective line items of net income, but only if the amount reclassified is required under U.S. GAAP to be reclassified to net income in its entirety in the same reporting period. For other amounts that are not required under U.S. GAAP to be reclassified in their entirety to net income, an entity is required to cross-reference to other disclosures required under U.S. GAAP that provide additional detail about those amounts.2017. The Company adoptedexpects that the standard in January 2013, and it didimplementation of this guidance will not have a significant impactmaterial effect on the Company’sits consolidated financial statements. See Note 23.statements
NewRecently Issued Accounting Standards to be Implemented
NoIn January 2017, the FASB issued ASU No. 2017-04, “Intangibles - Goodwill and Other (Topic 350): Simplifying the Test for Goodwill Impairment” (“ASU 2017-04”), which eliminates the performance of Step 2 from the goodwill impairment test. In performing its annual or interim impairment testing, an entity will instead compare the fair value of the reporting unit with its carrying amount and recognize any impairment charge for the amount by which the carrying amount exceeds the reporting unit’s fair value. Additionally, an entity should consider income tax effects from any tax deductible goodwill on the carrying amount of the reporting unit when measuring the goodwill impairment loss. The standard is effective for fiscal years beginning after December 15, 2019. Early adoption is permitted for interim or annual impairment tests performed on testing dates after January 1, 2017. The Company is currently in the process of evaluating when it will adopt ASU 2017-04 and its impact on its consolidated financial statements.
In October 2016, the FASB issued ASU No. 2016-16, “Income Taxes (Topic 740): Intra-Entity Transfers of Assets Other Than Inventory” (“ASU 2016-16”). ASU 2016-16 permits the recognition of income tax consequences related to an intra-entity transfer of an asset other new accounting pronouncementsthan inventory when the transfer occurs. It is effective for annual reporting periods beginning after December 15, 2017 and interim periods within those annual periods. Early adoption is permitted for any interim or annual period. The Company is currently in the process of evaluating the impact of adoption of ASU 2016-16 on its consolidated financial statements.
In August 2016, the FASB issued ASU No. 2016-15, “Statement of Cash Flows (Topic 230) – Classification of Certain Cash Receipts and Cash Payments” (“ASU 2016-15”). With the objective of reducing the existing diversity in practice, ASU 2016-15 addresses the manner in which certain cash receipts and cash payments are presented and classified in the statement of cash flows. ASU 2016-15 is effective for annual reporting periods beginning after December 15, 2017. The amendments should be applied retrospectively with earlier application permitted as of the beginning of an interim or effective during 2013 have had or are expected toannual reporting period. The Company expects that the implementation of this guidance will not have a significantmaterial effect on its consolidated financial statements.
In February 2016, the FASB issued ASU No. 2016-02, “Leases (Topic 842)” (“ASU 2016-02”). ASU 2016-02 requires lessees to recognize assets and liabilities arising from operating leases on the balance sheet. It is effective for annual reporting periods beginning after December 15, 2018, including interim periods within those fiscal years. Though still evaluating the impact of ASU 2016-02, the Company expects changes to its balance sheet due to the recognition of right-of-use assets and lease liabilities related to its real estate leases, but it does not anticipate material impacts to its results of operations or liquidity.
In August 2015, the FASB issued ASU No. 2015-14, “Revenue from Contracts with Customers: Deferral of the Effective Date” (“ASU 2015-14”), a revision to Accounting Standards Update No. 2014-09, “Revenue from Contracts with Customers”, which was originally issued on May 28, 2014. For public business entities, certain not-for-profit entities, and certain employee benefit plans, the effective date was for annual reporting periods beginning after December 15, 2016, including interim periods within that reporting period. ASU 2015-14 will defer these effective dates for all entities by one year. During 2016, the Company continued its evaluation of ASU 2014-09, including the expected impact on its business processes, systems and controls, and potential differences in the Company’s consolidated financial statements.timing and/or method of revenue recognition for its contracts. The Company expects to complete its assessment of the cumulative effect of adopting ASU 2014-09 as well as the expected impact of adoption during 2017. The Company will continue its evaluation of ASU 2014-09, including how it may impact new contracts it receives as well as new or emerging interpretations of the standard, through the date of adoption.
Note 3 Acquisitions
2013 AcquisitionsSubsequent Acquisition
On January 31, 2017, the Company acquired 100 percent of the shares of Vertex-Global Holding B.V., a provider of dental materials worldwide under the Vertex and NextDent brands. See Note 25.
2016 Acquisitions
No acquisitions were made by the Company for the year ended December 31, 2016.
2015 Acquisitions
On February 9, 2013,2015, the Company acquired 100% of the outstanding shares of common stock and voting equityrights of Co-Web, located in Paris, France. Co-Web isCimatron Ltd. (“Cimatron”), a start-up that creates consumer customizedprovider of integrated 3D printed productsCAD/CAM software and collectibles. Co-Web’s operations have been integrated into the Company’s Cubify consumer solutions and included in services revenue.for manufacturing. The fair value of the consideration paid for this acquisition, net of cash acquired, was $262,$77,984, all of which was paid in cash. The operations of Cimatron have been integrated into the Company’s products and service revenues. The fair value of the consideration paid for this acquisition was allocated to the assets purchased and liabilities assumed, based on the exchange ratetheir estimated fair values as of the Euro atacquisition date, with any excess recorded as goodwill, and is included in the table below, which summarizes 2015 acquisitions.
On April 2, 2015, the Company acquired 65% of the equity interests in Wuxi Easyway Model Design and Manufacture Co. Ltd. (“Easyway”), a manufacturing service bureau and distributor of 3D printing and scanning products in China. The fair value of the consideration paid for this acquisition, net of cash acquired, was $11,265, all of which was paid in cash. Under the terms of the agreement, the Company has an option to acquire the remainder of the equity interests in Easyway between the third and fifth anniversaries of the closing. The operations of Easyway have been integrated into the Company’s products and service revenues. The fair value of the consideration paid for this acquisition was allocated to the assets purchased and liabilities assumed, based on their estimated fair values as of the acquisition date, with any excess recorded as goodwill, and is included in the table below, which summarizes 2015 acquisitions.
On June 16, 2015, the Company acquired certain assets of STEAMtrax, LLC (“STEAMtrax”), a curricula provider. The fair value of the consideration paid for this acquisition, net of cash acquired, was $2,550, all of which was paid in cash. The fair value of the consideration paid for this acquisition was allocated to the assets purchased and liabilities assumed, based on their estimated fair values as of the acquisition date, with any excess recorded as goodwill, and is included in the table below, which summarizes 20132015 acquisitions. Factors considered in determinationAs of goodwill include synergies, vertical integration and strategic fit forDecember 31, 2016, the Company.Company has exited this investment.
On February 27, 2013,June 17, 2015, the Company acquired 100%certain assets of the shares of common stock and voting equity of Geomagic, Inc.NOQUO INC. (“Geomagic”Noquo”). Geomagic is, a leading global provider of 3D authoring solutions including design, sculpt and scan software tools that are used to create 3D content and inspect products throughout the entire design and manufacturing process. Geomagic’s operations have been integrated into the Company and are included in products and services revenue.provider. The fair value of the consideration paid for this acquisition, net of cash acquired, was $52,687, all of$651, which was paid in cash.with cash and the cancellation of a note. The fair value of the consideration paid for this acquisition was allocated to the assets purchased and liabilities assumed, based on their estimated fair values as of the acquisition date, with any excess recorded as goodwill, and is included in the table below, which summarizes 20132015 acquisitions. Factors considered in determination of goodwill include synergies, workforce, vertical integration and strategic fit for the Company.
On May 1, 2013, the Company acquired certain assets and liabilities of Rapid Product Development Group, Inc. (“RPDG”). RPDG is a global provider of additive and traditional quick turn manufacturing services. RPDG’s operations have been integrated into the Company’s Quickparts services and are included in services revenue. The fair value of the consideration that will be paid for this acquisition, net of cash acquired, is $44,413, of which $33,163 has been paid in cash and $6,750 has been paid in shares of the Company’s stock. The remaining $4,500 deferred purchase price, to paid on the 12 month anniversary of the closing date, will be paid with $3,750 of cash and $750 in shares of the Company’s stock. These shares will be issued in a private transaction exempt from registration under the Securities Act of 1933. The fair value of the consideration paid for this acquisition was allocated to the assets purchased and liabilities assumed, based on their estimated fair values as of the acquisition date, with any excess recorded as goodwill, and is included in the table below, which summarizes 2013 acquisitions. Factors considered in determination of goodwill include synergies, workforce, vertical integration and strategic fit for the Company.
On July 15, 2013, the Company acquired approximately 82% of the outstanding shares and voting rights of Phenix Systems, a leading global provider of direct metal selective laser sintering 3D Printers based in Riom, France. During 2013, the Company acquired additional shares and completed a tender offer. As of December 31, 2013,2016, the Company owned 94.7% of the capital and voting rights of Phenix Systems. Phenix Systems designs, manufactures and sells proprietary direct metal 3D printers that can print chemically pure, fully dense metal and ceramic parts from very fine powders. The fair value of the consideration paid forhas exited this acquisition, net of cash acquired, was approximately $16,975 based on the exchange rate at the date of acquisition, all of which was paid in cash. Phenix’s operations have been integrated into printers and other products and services revenue. The fair value of the consideration paid for this acquisition was allocated to the assets purchased and liabilities assumed, based on their estimated fair values as of the acquisition date, with any excess recorded as goodwill, and is included in the table below, which summarizes 2013 acquisitions. Factors considered in determination of goodwill include synergies, workforce, vertical integration and strategic fit for the Company.investment.
On August 6, 2013,For all acquisitions made in 2015, factors considered by the Company acquired 100% of the common stock, preferred stock and voting equity of VisPower Technology, Inc., a cloud-based, collaborative design and project management platform (“TeamPlatform”). The fair value of the consideration paid for this acquisition, net of cash acquired, was $4,998, all of which was paid in cash. TeamPlatform’s operations have been integrated into the Company’s professional and consumer offerings, including Geomagic Solutions and Cubify.com. The fair value of the consideration paid for this acquisition was allocated to the assets purchased and liabilities assumed, based on their estimated fair values as of the acquisition date, with any excess recorded as goodwill, and is included in the table below, which summarizes 2013 acquisitions. Factors considered in determination of goodwill include synergies, workforce, vertical integration and strategic fit for the Company.
On August 20, 2013, the Company acquired 100% of the common stock and voting equity of CRDM, Ltd. (“CRDM”), a U.K. provider of rapid prototyping and rapid tooling services. The fair value of the consideration paid for this acquisition, net of cash acquired, was approximately $6,399 based on the exchange rate at the date of acquisition, all of which was paid in cash. CRDM’s operations have been integrated into the Company’s global Quickparts Solutions custom parts and manufacturing services revenue. The fair value of the consideration paid for this acquisition was allocated to the assets purchased and liabilities assumed, based on their estimated fair values as of the acquisition date, with any excess recorded as goodwill, and is included in the table below, which summarizes 2013 acquisitions. Factors considered in determination of goodwill include synergies, workforce, vertical integration and strategic fit for the Company.
On September 6, 2013, the Company acquired the assets of The Sugar Lab, a start-up micro-design firm based in Los Angeles, California, that is dedicated to 3D printing customized, multi-dimensional, edible confections. The fair value of the consideration paid for this acquisition, net of cash acquired, was $1,500, of which $1,000 was paid in cash and $500 was paid in shares of the Company’s stock. These shares were issued in a private transaction exempt from registration under the Securities Act of 1933. The Sugar Lab’s operations have been integrated into the Company’s printers and services revenue. The fair value of the consideration paid for this acquisition was allocated to the assets purchased and liabilities assumed, based on their estimated fair values as of the acquisition date, with any excess recorded as goodwill, and is included in the table below, which summarizes 2013 acquisitions. Factors considered in determination of goodwill include synergies, vertical integration and strategic fit for the Company.
On December 4, 2013, the Company acquired 100% of the common stock and voting equity of Figulo Corporation, a provider of 3D-printed ceramics. The fair value of the consideration paid for this acquisition, net of cash acquired, was $2,846, of which $1,996 was paid in cash and $850 was paid in shares of the Company’s stock. These shares were issued in a private transaction exempt from registration under the Securities Act of 1933. Figulo’s operations have been integrated into the Company’s printers and services revenue. The fair value of the consideration paid for this acquisition was allocated to the assets purchased and liabilities assumed, based on their estimated fair values as of the acquisition date, with any excess recorded as goodwill, and is included in the table below, which summarizes 2013 acquisitions. Factors considered in determination of goodwill include synergies, workforce, vertical integration and strategic fit for the Company.
On December 13, 2013, the Company acquired 100% of the common stock and voting equity of Village Plastics Co., a manufacturer of filament-based ABS, PLA and HIPS 3D printing materials. The fair value of the consideration paid for this acquisition, net of cash acquired, was $6,361, of which $4,361 was paid in cash and $2,000 was paid in shares of the Company’s stock. These shares were issued in a private transaction exempt from registration under the Securities Act of 1933. Village Plastics operations have been integrated into the Company’s supply chain and manufacturing operations. The fair value of the consideration paid for this acquisition was allocated to the assets purchased and liabilities assumed, based on their estimated fair values as of the acquisition date, with any excess recorded as goodwill, and is included in the table below, which summarizes 2013 acquisitions. Factors considered in determination of goodwill include synergies, workforce, vertical integration and strategic fit for the Company.
On December 23, 2013, the Company acquired 100% of the common stock and voting rights of Gentle Giant Studios, Inc., a provider of 3D scanning and modeling content for the entertainment and toy industries. The fair value of the consideration paid for this acquisition, net of cash acquired, was $10,650, of which $7,975 was paid in cash and $2,675 was paid in shares of the Company’s stock. These shares were issued in a private transaction exempt from registration under the Securities Act of 1933. Gentle Giant Studios’ technology and content have been integrated into the Company’s service revenue. The fair value of the consideration paid for this acquisition was allocated to the assets purchased and liabilities assumed, based on their estimated fair values as of the acquisition date, with any excess recorded as goodwill, and is included in the table below, which summarizes 2013 acquisitions. Factors considered in determination of goodwill include synergies, workforce, vertical integration and strategic fit for the Company. The Company’s purchase price allocations are preliminary and subject to revision as more detailed analyses are completed and additional information about fair value of assets and liabilities becomes available.
Subject to the terms and conditions of the Gentle Giant Share Purchase Agreement, additional consideration will be paid on the third, fourth and fifth anniversaries of the Closing Date, calculated based on revenues of Gentle Giant for the twelve month period prior to each such anniversary date.
On December 31, 2013, the Company acquired certain assets of Xerox Corporation’s Wilsonville, Oregon product design, engineering and chemistry group and related assets. The fair value of the consideration paid for this acquisition, net of cash acquired, was $32,500, all of which was paid in cash. The Wilsonville team and assets have been integrated into the Company’s R&D operations. The fair value of the consideration paid for this acquisition was allocated to the assets purchased and liabilities assumed, based on their estimated fair values as of the acquisition date, with any excess recorded as goodwill, and is included in the table below, which summarizes 2013 acquisitions. Factors considered in determination of goodwill include synergies, workforce, vertical integration and strategic fit for the Company. The Company’s purchase price allocations are preliminary and subject to revision as more detailed analyses are completed and additional information about fair value of assets and liabilities becomes available.
The acquisitions completed during the year2015 are not material relative to the Company’s assets or operating results; therefore, no proforma financial information is provided.
The Company’s purchase price allocations for the acquired companies are preliminary and subject to revision as more detailed analyses are completed and additional information about fair value of assets and liabilities becomes available. The amounts related to the acquisitions of these businesses were allocated to the assets acquired and the liabilities assumed and included in the Company’s condensed consolidated balance sheet at December 31, 20132015 as follows:
| | | |
(in thousands) | | 20132015
|
Fixed assets | | $ | 9,8301,505 |
Other intangible assets, net | | | 51,93057,066 |
Goodwill | | | 128,32844,772 |
Other assets, net of cash acquired | | | 21,84322,449 |
Liabilities | | | (32,340)(33,342) |
Net assets acquired | | $ | 179,59192,450 |
Subsequent2014 Acquisitions
On February 19,18, 2014, we announced the acquisitionCompany acquired the assets of Digital PlaySpace,Playspace, Inc. (DPS), an innovative digital playonline platform that connects brands and retailers with consumers around printable play activities with creativity and design through its two digital properties, DigitalDollhouse.com and Dreamhouse Designer, a Facebook social gaming app. The DPS platform combines home design, gaming, and community sharing to deliver a vivid 3D create-and-make experience for children, families and their parents. The DPS acquisition is not significant to the Company’s financial statements. See Note 25.
2012 Acquisitions
On January 3, 2012, the Company acquired 100% of the outstanding shares and voting rights of Z Corporation (“Z Corp”) and Vidar Systems Corporation (“Vidar”), located in Burlington, MA and Herndon, VA, respectively. Z Corp is a provider of consumer and professional 3D printers, 3D scanners, proprietary print materials and printer services. Z Corp’s operations have been integrated into the Company and are included in printers and other products and services revenue. Vidar is a provider of medical film scanners that digitize film for radiology, oncology, mammography and dental applications. Vidar’s operations have been integrated into the Company and included in printers and other products revenue. The fair value of the consideration paid for this acquisition was $134,918, net of cash acquired, all of which was paid in cash, and was allocated to the assets purchased and liabilities assumed based on their estimated fair values as of the acquisition date, and is included in the table below which summarizes 2012 acquisitions. Factors considered in determination of goodwill include synergies, workforce, vertical integration and strategic fit for the Company.
Z Corp and Vidar, the only significant acquisitions in 2012, have been recorded in the printers and other products, print materials and services categories of the Company’s consolidated financial statements since the date of acquisition. Revenue for Z Corp and Vidar for 2012 was $55,637 and operating income was $8,478.
If the 2012 acquisition of Z Corp and Vidar had been included in the Company’s results of operations since January 1, 2011, the consolidated revenue for 2012 and 2011 would have been $353,633 and $286,956, respectively. Net income would have been $38,941 and $27,487 for 2012 and 2011. The unaudited pro forma results provided reflect certain adjustments related to the acquisitions, such as amortization expense on intangible assets acquired, and do not include any cost synergies or other effects of the integration of the acquisition. These pro forma amounts are not necessarily indicative of the results that would have occurred if the acquisition had been completed at the beginning of 2011, nor are they indicative of the future operating results from the combined companies.
On April 5, 2012, the Company acquired 100% of the outstanding shares and voting rights of Fresh Fiber B.V. (“Fresh Fiber”), moving from a minority shareholder to 100% ownership. Fresh Fiber designs and markets innovative 3D printed accessories for retail consumer electronics. Fresh Fiber’s operations have been integrated into the Company and are included in products revenue.adults. The fair value of the consideration paid for this acquisition, net of cash acquired, was $1,243, based on the Euro exchange rate at the date of acquisition,$4,000, of which $848$2,000 was paid in cash and $395$2,000 was paid in shares of the Company’s common stock. These shares were issued in a private transaction exempt from registration under the Securities Act of 1933. The fair value of the consideration paid for this acquisition was allocated to the assets purchased and liabilities assumed, based on their estimated fair values as of the acquisition date, with any excess recorded as goodwill, and is included in the table below, which summarizes 20122014 acquisitions. The Fresh Fiber acquisition is not significant to the Company’s financial statements. Factors considered in determination of goodwill include synergies, workforce, vertical integration and strategic fit for the Company.
Subject to the terms and conditions of the Fresh Fiber acquisition agreement, the seller has the right to earn an additional amount pursuant to an earnout formula over a three-year period as set forth in the acquisition agreement. The earnout was determined to be acquisition consideration and therefore is reflected as part of goodwill and was accrued based on the acquisition date fair value.
On April 10, 2012,2, 2014, the Company acquired 100% of the outstanding shares and voting rights of Kodama Studios, LLC, which operates My Robot Nation, (“My Robot Nation”), Medical Modeling Inc. Medical Modeling Inc. is a consumer technology platform that provides intuitive, game-like content creation forprovider of 3D printing. My Robot Nation’s operations have been integrated into the Companyprinting-centric personalized surgical treatments and revenue from this acquisition is included in services revenue.patient specific medical devices, including virtual surgical planning, personalized medical devices and clinical transfer tools. The fair value of the consideration paid for this acquisition, net of cash acquired, was $2,749,$69,026 of which $1,499$51,526 was paid in cash and $1,250$17,500 was paid in shares of the Company’s stock. These shares were issued in a private transaction exempt from registration under the Securities Act of 1933. The operations of Medical Modeling Inc. have been integrated into the Company’s service revenues. The fair value of the consideration paid for this acquisition was allocated to the assets purchased and liabilities assumed, based on their estimated fair values as of the acquisition date, with any excess recorded as goodwill, and is included in the table below, which summarizes 2014 acquisitions.
On August 6, 2014, the Company acquired certain assets of Bordner and Associates, Inc. d/b/a Laser Reproductions (“Laser Reproductions”). Laser Reproductions is a provider of advanced manufacturing, tooling and rapid prototyping solutions. The fair value of the consideration paid for this acquisition, net of cash acquired, was $17,450, of which $13,075 was paid in cash and $4,375 was paid in shares of the Company’s common stock. These shares were issued in a private transaction exempt from registration under the Securities Act of 1933. The operations of Laser Reproductions have been integrated into the Company’s service revenues. The fair value of the consideration paid for this acquisition was allocated to the assets purchased and liabilities assumed, based on their estimated fair values as of the acquisition date, with any excess recorded as goodwill, and is included in the table below, which summarizes 2014 acquisitions.
On August 13, 2014, the Company acquired certain assets of sister companies American Precision Machining, L.L.C. (“APM”) and American Precision Prototyping, LLC (“APP”). APM and APP are providers of precision machining and manufacturing services and 3D printing services. The fair value of the consideration paid for these acquisitions, net of cash acquired, was $14,089, all of which was paid in cash. The operations of APM and APP have been integrated into the Company’s service revenues. The fair value of the consideration paid for these acquisitions was allocated to the assets purchased and liabilities assumed, based on their estimated fair values as of the acquisition date, with any excess recorded as goodwill, and is included in the table below, which summarizes 2014 acquisitions.
On August 28, 2014, the Company acquired 100% of the outstanding shares and voting rights of Simbionix USA Corporation (“Simbionix”). Simbionix is a provider of patient-specific surgical simulation solutions. The fair value of the consideration paid for this acquisition, net of cash acquired, was $121,562, all of which was paid in cash. The operations of Simbionix have been integrated into the Company’s products and service revenues. The fair value of the consideration paid for this acquisition was allocated to the assets purchased and liabilities assumed, based on their estimated fair values as of the acquisition date, with any excess recorded as goodwill, and is included in the table below, which summarizes 2014 acquisitions.
On September 3, 2014, the Company acquired 100% of the outstanding shares and voting rights of LayerWise NV (“LayerWise”). LayerWise is a provider of advanced direct metal 3D printing and manufacturing services and delivers quick-turn, 3D-printed metal parts, manufactured on its own proprietary line of direct metal 3D printers, for aerospace, high-precision equipment, and medical and dental customers. The fair value of the consideration paid for this acquisition, net of cash acquired, was $41,933, all of which was paid in cash. The operations of LayerWise have been integrated into the Company’s product and service revenues. The fair value of the consideration paid for this acquisition was allocated to the assets purchased and liabilities assumed, based on their estimated fair values as of the acquisition date, with any excess recorded as goodwill, and is included in the table below, which summarizes 2014 acquisitions.
On November 25, 2014, the Company acquired 70% of the outstanding shares and voting rights of Robtec, an additive manufacturing service bureau and distributor of 3D printing and scanning products. Under the terms of the agreement, the Company acquired 70% of the shares of Robtec at closing and the remainder of the shares will be acquired by the Company on the fifth anniversary of the closing. The fair value of the consideration paid for this acquisition, net of cash acquired, was $21,880, all of which was paid in cash. The operations of Robtec have been integrated into the Company’s product and service revenues. The fair value of the consideration paid for this acquisition was allocated to the assets purchased and liabilities assumed, based on the estimated fair values as of the acquisition date, with any excess recorded as goodwill, and is included in the table below, which summarizes 20122014 acquisitions. The My Robot Nation acquisition is not significant to the Company’s financial statements. Factors considered in determination of goodwill include synergies, workforce, vertical integration and strategic fit for the Company.
On April 17, 2012,December 16, 2014, the Company acquired 100% of the assetsoutstanding shares and voting rights of Paramount IndustriesbotObjects Ltd. (“Paramount”botObjects”), a direct rapid manufacturing provider of product development solutions for aerospace and medical device applications, from design to production of certified end-use parts and products. Paramount’s operations have been integrated into the Company and revenue since the date of acquisition is reported in services revenue.company that develops consumer 3D printers. The fair value of the consideration paid for this acquisition, net of cash acquired, was $7,953,$24,743, all of which $6,138 was paid in cash and $1,815 was paid in shares of the Company’s common stock. These shares were issued in a private transaction exempt from registration under the Securities Act of 1933.cash. The fair value of the consideration paid for this acquisition was allocated to the assets purchased and liabilities assumed, based on the estimated fair values as of the acquisition date, with any excess recorded as goodwill, and is included in the table below, which summarizes 20122014 acquisitions. The Paramount acquisition is not significant to the Company’s financial statements. Factors considered in determination of goodwill include synergies, workforce, vertical integration and strategic fit for the Company.
SubjectPursuant to the terms and conditions of the Paramount acquisitionbotObejcts purchase agreement, the seller hassellers had the right to earn an additional amount, of up to a maximum of approximately $25,000, pursuant to an earnout formula over a five-yearthree-year period as set forth in the acquisition agreement. The earnout was determined notPursuant to be acquisition consideration and therefore will be recorded as compensation expense in the period earned. In connection with the acquisition the Company entered into a leasesettlement agreement with the former owner of Paramount pursuant to which the Company agreed to lease the facilities at which Paramount conducts its operations. The lease provides for an initial term of five years, with options for two successive three-year terms.
On May 23, 2012, the Company acquired 100% of the outstanding shares and voting rights of Bespoke Innovations, Inc. (“Bespoke”), a startup that is bringing a more personal approach to the way a broad spectrum of medical devices are developed and used. Bespoke develops proprietary, integrated scan, design and print technology that is designed to deliver custom fit prosthetics, orthotics and orthopedic devices that improve treatment and lifestyle outcomes. Bespoke’s operations have been integrated intobetween the Company and revenue since the datesellers, the parties agreed that no amounts would be paid pursuant to the terms of acquisition is reported in products revenue.the earnout provision.
On December 17, 2014, the Company acquired a product line related to its materials business. The fair value of the consideration paid for this acquisition, net of cash acquired, was $7,903$54,552, all of which $4,064 was paid in cashcash. The company completed this acquisition as part of its improved business continuity and $3,144 was paid in shares ofoperational excellence initiatives. The operations have been integrated into the Company’s common stock. These shares were issued in a private transaction exempt from registration under the Securities Act of 1933. Subject to the terms and conditions of the acquisition agreement, the sellers have the right to a deferred payment of $695.materials production. The fair value of the consideration paid for this acquisition was allocated to the assets purchased and liabilities assumed, based on the estimated fair values as of the acquisition date, with any excess recorded as goodwill, and is included in the table below, which summarizes 20122014 acquisitions. The Bespoke acquisition is not significant to
For all acquisitions made in 2014, factors considered by the Company’s financial statements. Factors consideredCompany in determination of goodwill include synergies, workforce, vertical integration and strategic fit for the Company.
On July 23, 2012, The acquisitions completed during the Company acquired 100% of the outstanding shares and voting rights of Viztu Technologies, Inc. (“Viztu”). Viztu is the developer of Hypr3D™, an online platform that allows anyone to turn their pictures and videos into printable 3D creations. Viztu’s operations have been integrated into the Company and revenue since the date of acquisition is included in services revenue. The fair value of the consideration paid for this acquisition, net of cash acquired, was $1,000, of which $500 was paid in cash and $500 was paid in shares of the Company’s common stock. These shares were issued in a private transaction exempt from registration under the Securities Act of 1933. The fair value of the consideration paid for this acquisition was allocated to the assets purchased and liabilities assumed, based on their estimated fair values as of the acquisition date, with any excess recorded as goodwill, and is included in the table below which summarizes 2012 acquisitions. The Viztu acquisition isyear are not significantmaterial relative to the Company’s assets or operating results; therefore, no proforma financial statements. Factors considered in determination of goodwill include synergies, workforce, vertical integration and strategic fit for the Company.
Subject to the terms and conditions of the Viztu acquisition agreement, the seller has the right to earn an additional amount, of up to a maximum of $1,000, pursuant to an earnout formula over a four-year period as set forth in the acquisition agreement. The earnout was determined not to be acquisition consideration and therefore will be recorded as compensation expense in the period earned.
On October 1, 2012, the Company acquired 100% of the outstanding shares and voting rights of The Innovative Modelmakers B.V. (“TIM”), a full service provider of Quickparts custom parts services, located in the Netherlands. The fair value of the consideration paid for this acquisition, net of cash acquired, was $1,714, based on the exchange rate of the Euro at the date of acquisition, of which $1,148 was paid in cash and $566 was paid in shares of the Company’s common stock. These shares were issued in a private transaction exempt from registration under the Securities Act of 1933. The fair value of the consideration paid for this acquisition was allocated to the assets purchased and liabilities assumed, based on their estimated fair values as of the acquisition date, with any excess recorded as goodwill, andinformation is included in the table below which summarizes 2012 acquisitions. The Company integrated TIM into its European Quickparts services, and revenue since the acquisition date is reported in services revenue. The TIM acquisition is not significant to the Company’s financial statements. Factors considered in determination of goodwill include synergies, workforce, vertical integration and strategic fit for the Company.
On October 9, 2012, the Company acquired 100% of the outstanding shares and voting rights of INUS Technology, Inc., a developer of scan-to-CAD and inspection software tools, known as Rapidform (“Rapidform”). Rapidform is located in Seoul, South Korea. The fair value of the consideration paid for this acquisition, net of cash acquired, was $33,918, all of which was paid in cash. The fair value of the consideration paid for this acquisition was allocated to the assets purchased and liabilities assumed, based on their estimated fair values as of the acquisition date, with any excess recorded as goodwill, and is included in the table below which summarizes 2012 acquisitions. Rapidform revenue is reported in products revenue. The Rapidform acquisition is not significant to the Company’s financial statements. Factors considered in determination of goodwill include synergies, workforce, vertical integration and strategic fit for the Company.provided.
The amounts related to the acquisitions of these businesses were allocated to the assets acquired and the liabilities assumed and included in the Company’s condensed consolidated balance sheet at December 31, 2012 as follows:
| | | |
(in thousands)
| | 2012
|
Fixed assets
| | $
| 9,599 |
Intangible assets
| | | 200,407 |
Other liabilities, net of cash acquired and assets assumed
| | | (18,719) |
Net assets acquired
| | $
| 191,287 |
2011 Acquisitions
On January 5, 2011, the Company acquired the assets of National RP Support, Inc. (“NRPS”). NRPS is a provider of customer support services and a factory-authorized source of parts, maintenance, and other services for 3D Systems’ equipment. NRPS operations have been integrated into the Company and included in services revenue. The fair value of the consideration paid for this acquisition was $5,550, all of which was paid in cash, and was allocated to the assets purchased and liabilities assumed based on their estimated fair values as of the acquisition date, and is included in the table below which summarizes 2011 acquisitions. Factors considered in determination of goodwill include synergies, workforce, vertical integration and strategic fit for the Company.
On February 22, 2011, the Company acquired 100% of the outstanding shares and voting rights of Quickparts.com, Inc. (“Quickparts”). Quickparts is a custom parts services company. Quickparts operations have been integrated into the Company and included in services revenue. The fair value of the consideration paid for this acquisition, net of cash acquired, was $22,775, all of which was paid in cash, and was allocated to the assets purchased and liabilities assumed, based on the estimated fair values at the date of acquisition, and is included in the table below which summarizes 2011 acquisitions. Factors considered in determination of goodwill include synergies, workforce, vertical integration and strategic fit for the Company.
Quickparts, the only significant acquisition in 2011, has been recorded in the services category of the Company’s consolidated financial statements since the date of acquisition. Revenue for Quickparts for 2011 was $24,127 and operating income was $2,799. If the 2011 acquisition of Quickparts had been included in the Company’s results of operations since January 1, 2010, the consolidated revenue for 2011 and 2010 would have been $233,612 and $185,055, respectively. Net income would have been $34,144 and $20,102 for 2011 and 2010. The unaudited pro forma results provided reflect certain adjustments related to the acquisitions, such as amortization expense on intangible assets acquired, and do not include any cost synergies or other effects of the integration of the acquisition. These pro forma amounts are not necessarily indicative of the results that would have occurred if the acquisition had been completed at the beginning of 2010, nor are they indicative of the future operating results from the combined companies.
On March 8, 2011, the Company acquired the assets of Accelerated Technologies, Inc. (“ATI”). ATI is a custom parts services company. ATI operations have been integrated into the Company and included in services revenue. The fair value of the consideration paid for this acquisition, net of cash acquired, was $1,000, all of which was paid in cash, and was allocated to the assets purchased and liabilities assumed based on their estimated fair values as of the acquisition date, and is included in the table below which summarizes 2011 acquisitions. Factors considered in determination of goodwill include synergies, workforce, vertical integration and strategic fit for the Company.
On April 13, 2011, the Company acquired the assets of Print3D Corporation (“Print3D”), a startup company that develops custom parts services for Computer Aided Design (“CAD”) users through advanced desktop tools that integrate directly into their design environment. Print3D operations have been integrated into consumer solutions and revenue is included in services revenue. The fair value of the consideration paid for this acquisition, net of cash acquired, was $1,250 and was allocated to the assets purchased based on their estimated fair values at the date of acquisition, and is included in the table below which summarizes 2011 acquisitions. Of the consideration, $1,000 was paid in cash and $250 was paid in shares of the Company’s common stock. These shares were issued in a private transaction exempt from registration under the Securities Act of 1933. Factors considered in determination of goodwill include synergies, workforce, vertical integration and strategic fit for the Company.
Subject to the terms and conditions of the Print 3D acquisition agreement, the sellers have the right to earn an additional amount of up to approximately $8,925, pursuant to an earnout formula set forth in the acquisition agreement, for a period of thirty-six months, which commenced on June 1, 2011. The earnout was determined not to be acquisition consideration and therefore has been recorded as compensation expense in the period earned.
On April 14, 2011, the Company acquired the assets of Sycode, a software development company based in India. Sycode specializes in providing plug-ins for all commercially available CAD packages. Sycode operations have been integrated into the Company and revenue is included in products revenue. The fair value of the consideration paid for this acquisition, net of cash acquired, was $500, all of which was paid in cash, and was allocated to the assets purchased based on their estimated fair values at the date of acquisition, and is included in the table below which summarizes 2011 acquisitions. Factors considered in determination of goodwill include synergies, workforce, vertical integration and strategic fit for the Company.
On May 6, 2011, the Company acquired the assets of The3dStudio.com, Inc. (“3dStudio”), a provider of 3D and 2D digital media libraries, offering resources and expert support through a vibrant online marketplace exchange for consumers and professionals. 3dStudio operations have been integrated into the Company and included in services revenue. The fair value of the consideration paid for this acquisition, net of cash acquired, was $2,500 and was allocated to the assets purchased and liabilities assumed based on the estimated fair values at the date of acquisition, and is included in the table below which summarizes 2011 acquisitions. Of the consideration, $1,875 was paid in cash and $625 was paid in shares of the Company’s common stock. These shares were issued in a private transaction exempt from registration under the Securities Act of 1933. Factors considered in determination of goodwill include synergies, workforce, vertical integration and strategic fit for the Company.
On May 12, 2011, the Company acquired 100% of the outstanding shares and voting rights of Freedom of Creation (“FOC”), based in the Netherlands, a provider of printable collections of innovative and practical 3D content, including products commercialized by fashion and design labels. FOC operations have been integrated into the Company and included in services revenue. The fair value of the consideration paid for this acquisition, net of cash acquired, was $2,286 and was allocated to the assets purchased and liabilities assumed based on their estimated fair values at the date of acquisition, and is included in the table below which summarizes 2011 acquisitions. Of the consideration, $1,136 was paid in cash and $1,150 was paid in shares of the Company’s common stock. These shares were issued in a private transaction exempt from registration under the Securities Act of 1933. Factors considered in determination of goodwill include synergies, workforce, vertical integration and strategic fit for the Company.
On July 19, 2011, the Company acquired the assets of Alibre Inc. (“Alibre”), a provider of design productivity solutions. Alibre’s operations have been integrated into the Company and revenue is included in products and services revenue. The fair value of the consideration paid for this acquisition was $3,800, all of which was paid in cash and was allocated to the assets purchased and liabilities assumed, based on their estimated fair values at the date of acquisition, and is included in the table below which summarizes 2011 acquisitions. Factors considered in determination of goodwill include synergies, workforce, vertical integration and strategic fit for the Company.
On August 9, 2011, the Company acquired certain assets of Content Media, Inc. related to the Botmill printer (“Botmill”). Botmill is a manufacturer of desktop 3D printers, kits, materials and accessories. Botmill’s operations have been integrated into the Company and revenue is included in products revenue. The fair value of the consideration paid for this acquisition was $17, all of which was paid in cash, and was allocated to the assets purchased based on their estimated fair values at the date of acquisition, and is included in the table below which summarizes 2011 acquisitions. Factors considered in determination of goodwill include synergies, workforce, vertical integration and strategic fit for the Company.
Subject to the terms and conditions of the Botmill acquisition agreement, the sellers have the right to earn an additional amount up to a maximum of $1,000, pursuant to an earn-out formula set forth in the acquisition agreement, for a period of three years, which commenced on September 1, 2011. The earnout was determined not to be acquisition consideration and therefore will be recorded as compensation expense in the period earned. Factors considered in determination of goodwill include synergies, workforce, vertical integration and strategic fit for the Company.
On September 20, 2011, the Company acquired 100% of the outstanding shares and voting rights of Formero Pty, Ltd. and its wholly-owned subsidiary XYZ Innovation (“Formero”). Formero, based in Australia, with an additional office in China, is a provider of on-demand custom parts services and a distributor of 3D printers. Formero’s operations have been integrated into the Company and included in services revenue and products revenue. The fair value of the consideration paid for this acquisition, net of cash acquired, was $5,967 and was allocated to the assets purchased and liabilities assumed, based on their estimated fair values at the date of acquisition, and is included in the table below which summarizes 2011 acquisitions. Of the consideration, $4,967 was paid in cash and $1,000 was paid in shares of the Company’s common stock. These shares were issued in a private transaction exempt from registration under the Securities Act of 1933. Factors considered in determination of goodwill include synergies, workforce, vertical integration and strategic fit for the Company.
Subject to the terms and conditions of the Formero acquisition agreement, the sellers have the right to earn an additional amount of up to a maximum of approximately $2,012, based on the exchange rate at the date of acquisition, pursuant to an earn-out formula set forth in the acquisition agreement, for a period of three years, which commenced on October 1, 2011. The earnout was determined not to be acquisition consideration and therefore has been recorded as compensation expense in the period earned.
On October 4, 2011, the Company acquired 100% of the outstanding shares and voting rights of Kemo Modelmakerij B.V. (“Kemo”). Kemo, based in the Netherlands, is a provider of on-demand custom parts services. Kemo’s operations have been integrated into the Company and revenue is recorded in services revenue. The fair value of the consideration paid for this acquisition, net of cash acquired, was approximately $3,719, based on the exchange rate at the date of acquisition, all of which was paid in cash, and was allocated to the assets purchased and liabilities assumed based on their estimated fair values at the date of acquisition, and is included in the table below which summarizes 2011 acquisitions. Factors considered in determination of goodwill include synergies, workforce, vertical integration and strategic fit for the Company.
On November 1, 2011, the Company acquired the RenShape® stereolithography print materials and Digitalis® rapid manufacturing 3D printer product line from the Advanced Materials Division of Huntsman Corporation (“Huntsman”). Huntsman’s print materials operations have been integrated into the Company and revenue is included in products revenue. The fair value of the consideration paid for this acquisition was $41,286 all of which was paid in cash, and was allocated to the assets purchased based on the estimated fair values at the date of acquisition, and is included in the table below which summarizes 2011 acquisitions. Factors considered in determination of goodwill include synergies, workforce, vertical integration and strategic fit for the Company.
The amounts related to the acquisition of these businesses were allocated to the assets acquired and the liabilities assumed2014 as follows:
| | | |
(in thousands) | | 20112014
|
Fixed assets | | $ | 3,59719,279 |
IntangibleOther intangible assets, net
| | 127,315 |
Goodwill | | 89,881259,422 |
Other liabilities,assets, net of cash acquired and assets assumed | | 38,583 |
Liabilities | | (2,828)(75,364) |
Net assets acquired | | $ | 90,650369,235 |
Note 4 Inventories
Components of inventories, net, at December 31, 20132016 and 20122015 are as follows:
| | | | | | |
| | | | | | | | | | | |
(in thousands) | | 2013 | | 2012 | 2016 | | 2015 |
Raw materials | | $ | 34,144 | | $ | 19,785 | $ | 38,383 | | $ | 43,960 |
Work in process | | | 3,050 | | | 477 | | 3,109 | | | 4,067 |
Finished goods and parts | | | 37,954 | | | 21,558 | | 61,839 | | | 57,850 |
Inventories, net | | $ | 75,148 | | $ | 41,820 | $ | 103,331 | | $ | 105,877 |
Note 5 Property and Equipment
Property and equipment at December 31, 20132016 and 20122015 are summarized as follows:
| | | | | | | | |
| | | | | | | | | | | | | | | |
(in thousands) | | 2013 | | 2012 | | Useful Life (in years) | 2016 | | 2015 | | Useful Life (in years) |
Land | | $ | 541 | | $ | 541 | | N/A | $ | 903 | | $ | 903 | | N/A |
Building | | | 9,315 | | | 9,315 | | 25 | | 11,122 | | | 11,007 | | 25-30 |
Machinery and equipment | | | 56,962 | | | 45,869 | | 3-7 | | 108,682 | | | 105,383 | | 2-7 |
Capitalized software — ERP | | | 3,872 | | | 3,181 | | 5 | |
Capitalized software | | | 8,651 | | | 7,391 | | 3-5 |
Office furniture and equipment | | | 3,586 | | | 3,357 | | 5 | | 3,130 | | | 4,714 | | 1-5 |
Leasehold improvements | | | 9,395 | | | 6,467 | | Life of lease (a) | | 24,423 | | | 17,867 | | Life of lease (a) |
Rental equipment | | | — | | | 57 | | 5 | | 144 | | | 149 | | 5 |
Construction in progress | | | 4,014 | | | 2,595 | | N/A | | 7,760 | | | 9,578 | | N/A |
Total property and equipment | | | 87,685 | | | 71,382 | | | | 164,815 | | | 156,992 | | |
Less: Accumulated depreciation and amortization | | | (42,477) | | | (37,029) | | | | (84,837) | | | (70,997) | | |
Total property and equipment, net | | $ | 45,208 | | $ | 34,353 | | | $ | 79,978 | | $ | 85,995 | | |
| (a) | | Leasehold improvements are amortized on a straight-line basis over the shorter of (i) their estimated useful lives and (ii) the estimated or contractual life of the related lease. |
Depreciation and amortization expense on property and equipment for the years ended 2013, 20122016, 2015 and 20112014 was $9,746, $8,441$24,331, $20,979 and $6,267,$14,727, respectively.
Capitalized leases related to buildings had a cost of $8,496 at December 31, 2013 and $8,496 at December 31, 2012. Capitalized leases related to office furniture and equipment had a cost of $47 at December 31, 2013 and $125 at December 31, 2012.
For the years ended December 31, 20132016 and 2012,2015, the Company recognized no software amortization expense for enterprise resource planning (“ERP”) system capitalization costs compared to $225impairment charges of $7,408 and $614, respectively, on property and equipment, net. No impairment charges were recognized for the year ended December 31, 2011.2014.
Note 6 Intangible Assets
Intangible assets other than goodwill at December 31, 20132016 and December 31, 20122015 are summarized as follows:
| | | | | | | | | | | | | | | | | | | | | | |
| | | | | | | | | | | | | | | | | | | | | | | | | | | | | | | | | | | | | |
| | 2013 | | 2012 | | | | | 2016 | | 2015 | | | | |
(in thousands) | | Gross | | Accumulated Amortization | | Net | | Gross | | Accumulated Amortization | | Net | | Useful Life (in years) | | Weighted Average Useful Life Remaining (in years) | Gross | | Accumulated Amortization | | Net | | Gross | | Accumulated Amortization | | Net | | Useful Life (in years) | | Weighted Average Useful Life Remaining (in years) |
Intangible assets with finite lives: | | | | | | | | | | | | | | | | | | | | | | | | | | | | | | | | | | | | | | | | | | | |
Licenses | | $ | 5,875 | | $ | (5,875) | | $ | — | | $ | 5,875 | | $ | (5,875) | | $ | — | | | | | |
Patent costs | | | 21,545 | | | (5,960) | | | 15,585 | | | 27,635 | | (14,047) | | | 13,588 | | 6 - 19 | | 3 | $ | 16,263 | | $ | (5,873) | | $ | 10,390 | | $ | 16,251 | | $ | (4,895) | | $ | 11,356 | | 1-20 | | 9 |
Acquired technology | | | 30,095 | | | (13,615) | | | 16,480 | | | 26,262 | | (11,852) | | | 14,410 | | 5 - 10 | | 5 | | 52,881 | | | (27,543) | | | 25,338 | | | 52,809 | | | (16,405) | | | 36,404 | | 1-16 | | 4 |
Internally developed software | | | 18,097 | | | (12,863) | | | 5,234 | | | 17,847 | | (11,424) | | | 6,423 | | 5 | | <1 | | 4,730 | | | (3,522) | | | 1,208 | | | 4,730 | | | (2,919) | | | 1,811 | | 2 | | 2 |
Customer relationships | | | 95,793 | | | (18,283) | | | 77,510 | | | 60,329 | | (7,754) | | | 52,575 | | 5 - 20 | | 5 | | 99,067 | | | (46,252) | | | 52,815 | | | 101,933 | | | (36,158) | | | 65,775 | | 1-14 | | 6 |
Non-compete agreements | | | 16,848 | | | (6,666) | | | 10,182 | | | 14,051 | | (3,836) | | | 10,215 | | 3 - 11 | | 3 | | 9,423 | | | (7,277) | | | 2,146 | | | 12,163 | | | (8,558) | | | 3,605 | | 1-4 | | 2 |
Trade names | | | 9,302 | | | (2,211) | | | 7,091 | | | 5,814 | | (723) | | | 5,091 | | 2 - 10 | | 3 | | 28,110 | | | (16,015) | | | 12,095 | | | 28,108 | | | (12,498) | | | 15,610 | | 1-8 | | 5 |
Other | | | 11,598 | | | (4,081) | | | 7,517 | | | 6,356 | | (3,051) | | | 3,305 | | <1 - 7 | | 2 | | 45,377 | | | (27,868) | | | 17,509 | | | 46,435 | | | (23,530) | | | 22,905 | | 1-6 | | 4 |
Intangible assets with indefinite lives: | | | | | | | | | | | | | | | | | | | | | | |
Trademarks | | | 2,110 | | | — | | | 2,110 | | | 2,770 | | | — | | | 2,770 | | N/A | | N/A | |
Total intangible assets | | $ | 211,263 | | $ | (69,554) | | $ | 141,709 | | $ | 166,939 | | $ | (58,562) | | $ | 108,377 | | <1 - 20 | | 4 | $ | 255,851 | | $ | (134,350) | | $ | 121,501 | | $ | 262,429 | | $ | (104,963) | | $ | 157,466 | | 1-20 | | 4 |
During 2013, 2012 and 2011, the Company capitalized $1,648, $729 and $336, respectively, for costs incurred to acquire, develop and extend patents in the United States and various other countries. Amortization of such previously capitalized patent costs was $250 in 2013, $215 in 2012 and $237 in 2011.
At December 31, 2013, the gross acquired technology balance increased by $3,833, to $30,095, compared to $26,262 in 2012, due to technology from acquisitions and foreign currency exchange effects. The related accumulated amortization increased by $1,763, net of foreign currency exchange impacts.
The Company had $109,644 and $80,276 of other net intangible assets, consisting of internally developed software, non-compete agreements, customer relationships and trade names and other intangibles from acquisitions, as of December 31, 2013 and 2012, respectively. Internally developed software also includes certain software costs that relate to developed software the Company obtained through acquisitions. Acquisition activities during the year ended December 31, 2013 yielded $51,930 of other intangible assets compared to $65,957 in 2012. Amortization expense related to such intangible assets was $20,447, $12,573$35,124, $61,066 and $4,588$39,484 for the years ended December 31, 2013, 20122016, 2015 and 2011,2014, respectively. Amortization of these intangible assets is calculated on a straight-line basis over periods ranging from less than one year to twenty years.basis.
Annual amortization expense for intangible assets is expected to be $22,120 in 2014, $20,302 in 2015, $18,119 in 2016, $16,109$33,286 in 2017, $28,287 in 2018, $19,883 in 2019, $16,121 in 2020 and $13,616$11,865 in 2018.2021.
No intangible asset impairment charges were recorded by the Company for the year ended December 31, 2016.
For the year ended December 31, 2015, the Company recorded impairment charges of $93,520, reflecting $92,248 of impairment charges related to the Company’s Americas reporting unit and $1,272 of impairment charges related to the Company’s EMEA reporting unit. Further, impairment charges reflected approximately $63,852 of charges to customer relationships, $19,164 of charges to acquired technology, $5,952 of charges to trade names, $3,416 of charges to non-compete agreements, $791 of charges to other intangibles and $345 of charges to internally developed software. The impairment charges were measured as the difference between the carrying amount of the assets and their fair value. The fair value of the assets was determined under the income approach based on a discounted cash flow model using updated future revenue and operating income projections. In addition to impairment charges, gross intangible assets were negatively impacted by foreign currency translation. See Note 2 to the Consolidated Financial Statements.
No intangible asset impairment charges were recorded by the Company for the year ended December 31, 2014.
Note 7 Goodwill
The following are the changes in the carrying amount of goodwill by geographic reporting unit:
| | | | | | | | | | | | |
(in thousands) | | U.S. | | Europe | | Asia-Pacific | | Total |
Balance at January 1, 2012 | | $ | 61,312 | | $ | 34,489 | | $ | 11,850 | | $ | 107,651 |
Effect of foreign currency exchange rates | | | — | | | 697 | | | 630 | | | 1,327 |
Goodwill acquired through acquisitions | | | 106,890 | | | 5,090 | | | 19,356 | | | 131,336 |
Balance at December 31, 2012 | | | 168,202 | | | 40,276 | | | 31,836 | | | 240,314 |
Effect of foreign currency exchange rates | | | — | | | 2,145 | | | (967) | | | 1,178 |
Goodwill acquired through acquisitions | | | 96,533 | | | 28,734 | | | 3,307 | | | 128,574 |
Balance at December 31, 2013 | | $ | 264,735 | | $ | 71,155 | | $ | 34,176 | | $ | 370,066 |
| | | | | | | | | | | | |
(in thousands) | | Americas | | EMEA | | Asia Pacific | | Total |
Balance at December 31, 2014 | | $ | 339,411 | | | 216,942 | | | 33,184 | | | 589,537 |
Acquisitions and adjustments | | | 47,452 | | | 2,602 | | | 5,208 | | | 55,262 |
Impairment of goodwill | | | (382,271) | | | (61,388) | | | — | | | (443,659) |
Effect of foreign currency exchange rates | | | (4,592) | | | (7,635) | | | (1,038) | | | (13,265) |
Balance at December 31, 2015 | | | — | | $ | 150,521 | | $ | 37,354 | | $ | 187,875 |
Acquisitions and adjustments | | | — | | | (137) | | | 189 | | | 52 |
Effect of foreign currency exchange rates | | | — | | | (5,413) | | | (1,284) | | | (6,697) |
Balance at December 31, 2016 | | $ | — | | $ | 144,971 | | $ | 36,259 | | $ | 181,230 |
The effect of foreign currency exchange in this table reflects the impact on goodwill of amounts recorded in currencies other than the U.S. dollar on the financial statements of subsidiaries in these geographic areas resulting from the yearly effect of foreign currency translation between the applicable functional currency and the U.S. dollar. The remaining
For discussion on goodwill for Europe andimpairment testing, see Note 2 to the entire amount of goodwill for Asia-Pacific represent amounts allocated in U.S. dollars from the U.S. to those geographic areas for financial reporting purposes.Consolidated Financial Statements.
Note 8 Employee Benefits
The Company sponsors a Section 401(k) plan (the “Plan”) covering substantially all its eligible U.S. employees. The Plan entitles eligible employees to make contributions to the Plan after meeting certain eligibility requirements. Contributions are limited to the maximum contribution allowances permitted under the Internal Revenue Code. The Company matches 50% of the employee contributions up to a maximum match of $3 of the employees contributions,$1.5, as set forth in the Plan. The Company may also make discretionary contributions to the Plan, which would be allocable to participants in accordance with the Plan.
The In addition, the Company sponsors a Z Corporation 401(k) plan (the “Z Corp Plan”)has several other U.S. and non-U.S. defined contribution plans covering eligible U.S. and non-U.S. employees, of Z Corporation, which was acquired in 2012. The Z Corp Plan entitles eligible employees to make contributions to the Z Corp Plan after meeting certain eligibility requirements. Contributions are limited to the maximum contribution allowances permitted under the Internal Revenue Code. The Company matches 50% of the first 6% of the employee’s 401(k) contributions, as set forth in the Z Corp Plan. The Company may also make discretionary contributions to the Plan, which would be allocable to participants in accordance with the Plan.
The Company sponsors a Vidar Systems Corporation Retirement Savings Plan (the “Vidar Plan”) covering employees of Vidar Corporation, which was acquired in 2012. The Vidar Plan entitles eligible employees to make contributions to the Vidar Plan after meeting certain eligibility requirements. Contributions are limited to the maximum contribution allowances permitted under the Internal Revenue Code. The Company matches 50% of employee contributions up to a maximum of 6% of the employee’s pay, as set forth in the Z Corp Plan. The Company may also make discretionary contributions to the Plan, which would be allocable to participants in accordance with the Plan.
The Company sponsors a Rapidform 401(k) plan (the “Rapidform Plan”) covering employees of Rapidform, Inc., which was acquired in 2012. The Rapidform Plan entitles eligible employees to make contributions to the Rapidform Plan after meeting certain eligibility requirements. Contributions are limited to the maximum contribution allowances permitted under the Internal Revenue Code. The Company matches up to a maximum of $4.5 of the employee’s 401(k) contributions, as set forth in the Rapidform Plan. The Company may also make discretionary contributions to the Plan, which would be allocable to participants in accordance with the Plan.respectively.
For the years ended December 31, 2013, 20122016, 2015 and 2011,2014, the Company expensed $527, $489$1,175, $956 and $241,$721, respectively, for matching contributions to the Plan.defined contribution plans.
Note 9 Accrued and Other Liabilities
Accrued liabilities at December 31, 20132016 and 20122015 are as follows:
summarized below:
| | | | | | |
| | | | | | | | | | | |
(in thousands) | | 2013 | | 2012 | 2016 | | 2015 |
Compensation and benefits | | $ | 13,197 | | $ | 13,582 | $ | 22,771 | | $ | 24,152 |
Vendor accruals | | | 5,449 | | | 3,357 | | 8,231 | | | 12,883 |
Accrued professional fees | | | 493 | | | 533 | | 810 | | | 491 |
Accrued taxes | | | 1,834 | | | 3,382 | | 9,831 | | | 11,317 |
Royalties payable | | | 750 | | | 550 | | 2,092 | | | 1,431 |
Accrued interest | | | 73 | | | 266 | | 39 | | | 42 |
Earnouts and deferred payments related to acquisitions | | | 5,872 | | | 2,657 | |
Accrued earnouts related to acquisitions | | | 3,238 | | | 159 |
Accrued other | | | 762 | | | 462 | | 2,956 | | | 4,224 |
Total | | $ | 28,430 | | $ | 24,789 | $ | 49,968 | | $ | 54,699 |
Other liabilities at December 31, 20132016 and 20122015 are summarized below:
| | | | | | |
| | | | | | | | | | | |
(in thousands) | | 2013 | | 2012 | 2016 | | 2015 |
Arbitration award | | $ | 11,282 | | $ | 11,282 |
Long term employee indemnity | | | 11,152 | | | 9,794 |
Defined benefit pension obligation | | $ | 5,861 | | $ | 5,139 | | 7,613 | | | 6,211 |
Long-term tax liability | | | 90 | | | 803 | |
Earnouts related to acquisitions | | | 4,206 | | | 1,454 | |
Long term tax liability | | | 7,183 | | | 6,996 |
Long term earnouts related to acquisitions | | | 7,568 | | | 9,673 |
Long term deferred revenue | | | 4,218 | | | 2,787 | | 7,464 | | | 7,956 |
Other long-term liabilities | | | 826 | | | 657 | |
Other long term liabilities | | | 5,726 | | | 4,927 |
Total | | $ | 15,201 | | $ | 10,840 | $ | 57,988 | | $ | 56,839 |
Note 10 Hedging Activities and Financial Instruments
Generally accepted accounting principles require the Company to disclose its estimate of the fair value of material financial instruments, including those recorded as assets or liabilities in its consolidated financial statements. The carrying amounts of current assets and liabilities approximate fair value due to their short-term maturities. Generally, the fair value of a fixed-rate instrument will increase as interest rates fall and decrease as interest rates rise.
The carrying amounts and fair values of the Company’s other financial instruments at December 31, 2013 and 2012 were as follows:
| | | | | | | | | | | | |
| | 2013 | | 2012 |
(in thousands) | | Carrying Amount | | Fair Value | | Carrying Amount | | Fair Value |
Grand Junction note receivable | | $ | — | | $ | — | | $ | 1,891 | | $ | 1,711 |
5.50% convertible notes | | $ | 11,416 | | $ | 12,035 | | $ | 80,531 | | $ | 86,981 |
In December 2008, the Company sold its Grand Junction, Colorado facility for $5,500, consisting of $3,500 of cash proceeds (before deducting closing costs) and a zero interest five-year promissory note from the buyer. The Company discounted the note receivable by $1,017, reducing the net gain on the sale to $636. The note receivable was settled during 2013 and the deferred gain of $636 was recognized in interest and other expense, net.
The note was secured by (i) a guarantee from the principals of the entity that purchased the facility and (ii) a second deed of trust on the facility.
The fair value of the Grand Junction note receivable was calculated at December 31, 2012 by discounting the remaining payments using a discount rate of 13.63%. This rate was derived by taking the risk-free interest rate for similar maturities and adding an estimated risk premium intended to reflect the credit risk.
In November 2011, the Company entered into an indenture under which it privately placed $152,000 of 5.50% senior convertible notes due December 15, 2016 with institutional and accredited investors. The estimated fair value of the fixed-rate convertible notes in the table above differs from the amounts reflected on the balance sheet based on the difference between the mandatory redemption value and the market value of the notes. The interest rate used to discount the contractual payments associated with the debentures was 6.91% for 2013 and 6.67% for 2012.
The foregoing estimates are subjective and involve uncertainties and matters of significant judgment. Changes in assumptions could significantly affect the Company’s estimates.
The Company conducts business in various countries using both the functional currencies of those countries and other currencies to effect cross border transactions. As a result, the Company is subject to the risk that fluctuations in foreign exchange rates between the dates that those transactions are entered into and their respective settlement dates will result in a foreign exchange gain or loss. When practicable, the Company endeavors to match assets and liabilities in the same currency on its balance sheet and those of its subsidiaries in order to reduce these risks. When appropriate, the Company enters into foreign currency contracts to hedge exposures arising from those transactions. The Company has elected not to prepare and maintain the documentation to qualify for hedge accounting treatment under ASC 815, “Derivatives“Derivatives and Hedging,” and therefore, all gains and losses (realized or unrealized) are recognized in “Interest"Interest and other expense, net” in the consolidated statements of incomeoperations and comprehensive income.loss. Depending on their fair value at the end of the reporting period, derivatives are recorded either in prepaid expenses and other current assets or in accrued liabilities on the consolidated balance sheet.
There were no foreign currency contracts outstanding at December 31, 20132016 or at December 31, 2012.
The total impact of foreign currency related items on the consolidated statements of income and comprehensive income was a loss of $773, a gain of $145 and a loss of $118 for the years ended December 31, 2013, 2012 and 2011, respectively.2015.
Note 11 Borrowings
5.5% senior convertible notes and interest expenseCredit Facility
In November 2011,On October 10, 2014, the Company completedand certain of its subsidiaries entered into a $150,000five-year revolving, unsecured credit facility (the “Credit Agreement”) with PNC Bank, National Association, as Administrative Agent, PNC Capital Markets LLC, as Sole Lead Arranger and Sole Bookrunner, HSBC Bank USA, N.A., as Syndication Agent, and the private placementother lenders party thereto (collectively, the “Lenders”). The Credit Agreement comprises a revolving loan facility that provides for advances in the initial aggregate principal amount of $152,000 of 5.50% senior convertible notes dueup to $150,000 (the “Credit Facility”). Subject to certain terms and conditions contained in December 2016. These notes are senior unsecured obligations and rank equal in right of payment with all the Company’s existing and future senior unsecured indebtedness. They are also senior in right of payment to any subordinated indebtedness thatCredit Agreement, the Company may, incurat its option, request an increase in the future.aggregate principal amount available under the Credit Facility by an additional $75,000. The notes accrue interest at the rate of 5.50% per year payable in cash semi-annually on June 15 and December 15 of each year.
In May 2008, the FASB issued guidance contained in ASC Topic 470-20, “Debt with Conversion and Other Options” which applies to all convertible debt instruments that have a “net settlement feature”, which means that such convertible debt instruments, by their terms, may be settled either wholly or partially in cash upon conversion. This topic requires issuers of convertible debt instruments that may be settled wholly or partially in cash upon conversion to separately accountCredit Agreement includes provisions for the liabilityissuance of letters of credit and equity components in a manner reflective of the issuers’ non-convertible debt borrowing rate.swingline loans.
The Company recognized the estimated equity componentCredit Agreement is guaranteed by certain of the convertible notes as $17,770, consisting of $18,210 inCompany’s material domestic subsidiaries (the “Guarantors”). From time to time, the Company may be required to cause additional paid-in capital reduced by $440 of unamortized debt issuance costs allocatedmaterial domestic subsidiaries to become Guarantors under the equity component and recognized this amount as a reduction to additional paid-in capital. The company also recognized a discount on convertible notes of $3,040, which is being amortized as non-cash interest expense over the life of the notes.Credit Agreement.
The Company recognized
Generally, amounts outstanding under the Credit Facility bear interest, at the Company’s option, at either the Base Rate or the London interbank offered rate (“LIBOR”), in each case, plus an applicable margin. Base Rate advances bear interest at a deferred tax liabilityrate per annum equal to the sum of $7,200 as(i) the tax effecthighest of (A) the Administrative Agent’s prime rate, (B) the Federal Funds Open Rate plus 0.5% or (C) the Daily LIBOR Rate for a one month interest period plus 1%, and (ii) an applicable margin that ranges from 0.25% to 0.50% based upon the Company’s consolidated total leverage ratio. LIBOR Rate advances bear interest at a rate based upon the LIBOR Rate for the applicable interest period, plus an applicable margin that ranges from 1.25% to 1.50% based upon the Company’s consolidated total leverage ratio. Under the terms of the basis difference between carrying valuesCredit Agreement, (i) accrued interest on each loan bearing interest at the Base Rate is payable quarterly in arrears and tax basis(ii) accrued interest on each loan bearing interest at the LIBOR Rate is payable in arrears on the earlier of (A) quarterly and (B) the convertible notes.last day of each applicable interest payment date for each loan. The carrying value of this deferred tax liability offset certain net deferred tax assets for determining valuation allowances against those deferred tax assets. See Note 20Credit Facility is scheduled to the consolidated financial statements.mature on October 10, 2019, at which time all amounts outstanding thereunder will be due and payable.
The following table summarizesCompany is required to pay certain fees in connection with the principal amounts and related unamortized discount on convertible notes:Credit Facility, including a quarterly commitment fee equal to the product of the amount of the average daily available revolving commitments under the Credit Agreement multiplied by a percentage that ranges from 0.20% to 0.25% depending upon the Company’s consolidated total leverage ratio, as well as customary administrative fees.
| | | | | | |
(in thousands) | | 2013 | | 2012 |
Principal amount of convertible notes | | $ | 12,540 | | $ | 90,960 |
Unamortized discount on convertible notes | | | (1,124) | | | (10,429) |
Net carrying value | | $ | 11,416 | | $ | 80,531 |
The following table summarizes other information relatedCredit Agreement contains customary representations, warranties, covenants and default provisions for a Credit Facility of this type, including, but not limited to, financial covenants, limitations on liens and the convertible notes:
| | |
| | |
Total amortization period for debt discount
| | 5 years
|
Remaining amortization period for debt discount
| | 3 years
|
Effective interest rates on convertible notes
| | 9.51%
|
The following table summarizes interest costs recognized on convertible notes:
| | | | | | | | | |
(in thousands) | | 2013 | | 2012 | | 2011 |
Contractual interest coupon | | $ | 1,685 | | $ | 8,053 | | $ | 906 |
Amortization of debt discount | | | 974 | | | 3,876 | | | 409 |
Total | | $ | 2,659 | | $ | 11,929 | | $ | 1,315 |
These notes are convertible into sharesincurrence of debt, covenants to preserve corporate existence and comply with laws and covenants regarding the use of proceeds of the Credit Facility. The financial covenants include a maximum consolidated total leverage ratio, which is the ratio of consolidated total funded indebtedness to consolidated EBITDA (earnings before interest, taxes, depreciation and amortization expense), as defined in the Credit Agreement, of 3.00 to 1.00, and a minimum interest coverage ratio, which is the ratio of consolidated EBITDA to cash interest expense, of 3.50 to 1.00. The Company is only required to be in compliance with the financial covenants as of the end of any fiscal quarter in which there are any loans outstanding at any time during such fiscal quarter. Based on the Company’s Common Stock at an initial conversion rate equivalent to 69.9032 sharescurrent results of Common Stock per $1 principal amount of notes, which represents an initial conversion rate of approximately $14.31 per share of Common Stock. The conversion rate is subject to adjustment in certain circumstances as more fullyoperations and financial covenants set forth in the indenture covering the notes. During 2013 note holders converted $80,754 aggregate principal amount of notes which converted into 5,482 shares of common stock on a split-adjusted basis. The Company recognized a loss of $11,275 and $7,021, respectively,Credit Agreement, availability at December 31, 20132016 would be approximately $150,000. Future results may impact availability.
The payment of dividends on the Company’s common stock is restricted under provisions of the Credit Facility, which limits the amount of cash dividends that the Company may pay in any one fiscal year to $30,000. The Company currently does not pay, and 2012has not paid, any dividends on conversions of these notesits common stock, and currently intends to retain any future earnings for use in interest and other expense, net. Asits business.
There was no outstanding balance on the Credit Facility as of December 31, 2013 and 2012, the aggregate principal of notes outstanding was $12,540 and $90,960, respectively.2016 or 2015.
If converted, the aggregate principal amount of the notes then outstanding may be settled in cash, shares of common stock, or a combination thereof, at the Company’s election. Subject to the terms of the indenture, holders may convert their notes at any time. The remaining notes are convertible into approximately 876 shares of common stock. In certain circumstances provided by the indenture, the number of shares of common stock issuable upon conversion of the notes may be increased,Interest Income and with it, the aggregate principal amount of the notes. Unless earlier repurchased or converted, the notes will mature on December 15, 2016.
The notes were issued with an effective yield of 5.96% based upon an original issue discount at 98.0%. The net proceeds from the issuance of these Notes, after deducting original issue discount and capitalized issuance costs of $6,634, amounted to $145,366. The capitalized issuance costs are being amortized to interest expense over the life of the notes.
Redemption Features – convertible securities
Upon certain terms and conditions, the Company may elect to satisfy its conversion obligation with respect to the notes by paying cash, in whole or in part, for specified aggregate principal amount of the notes. In the event of certain types of fundamental changes, the Company will increase the conversion rate by a number of additional shares, up to a maximum of 1,118 shares which equates to a conversion price of approximately $11.22 per share at December 31, 2013.
Interest Expense
Interest expenseincome totaled $3,425, $12,468,$807, $521 and $2,090$482 for the years ended December 31, 2013, 20122016, 2015 and 2011,2014, respectively.
Interest incomeexpense totaled $1,258, $168,$1,282, $2,011 and $51$1,227 for the years ended December 31, 2013, 20122016, 2015 and 2011, respectively, reflecting the combined effect of the issuance and conversion of the senior convertible notes, lower interest rates on investments, and higher cash balances.2014, respectively.
Note 12 Lease Obligations
The Company leases certain of its facilities and equipment under capitalized leases and other facilities and equipment under non-cancelable operating leases. The leases are generally on a net-rent basis, under which the Company pays taxes, maintenance and insurance. Leases that expire at various dates through 2031 are expected to be renewed or replaced by leases on other properties.
Rent expense for the years ended December 31, 2013, 20122016, 2015 and 2011 aggregated $6,891, $4,9682014 was $13,232, $13,960 and $2,738,$10,427, respectively.
The Company’s future minimum lease payments as of December 31, 20132016 under capitalized leases and non-cancelable operating leases, with initial or remaining lease terms in excess of one year, were as follows:
| | | | | | | | | | | | |
(in thousands) | | Capitalized Leases | | Operating Leases | | Capitalized Leases | | Operating Leases |
Years ending December 31: | | | | | | | | | | | | |
2014 | | $ | 696 | | $ | 6,756 | |
2015 | | | 709 | | | 5,615 | |
2016 | | | 691 | | | 4,416 | |
2017 | | | 718 | | | 3,452 | | $ | 1,074 | | $ | 12,686 |
2018 | | | 715 | | | 2,890 | | | 1,071 | | | 11,674 |
2019 | | | | 1,068 | | | 9,663 |
2020 | | | | 987 | | | 5,915 |
2021 | | | | 736 | | | 5,364 |
Later years | | | 9,636 | | | 2,100 | | | 7,491 | | | 14,749 |
Total minimum lease payments | | | 13,165 | | $ | 25,229 | | | 12,427 | | $ | 60,051 |
Less: amounts representing imputed interest | | | (5,701) | | | | | | (4,268) | | | |
Present value of minimum lease payments | | | 7,464 | | | | | | 8,159 | | | |
Less: current portion of capitalized lease obligations | | | (187) | | | | | | (572) | | | |
Capitalized lease obligations, excluding current portion | | $ | 7,277 | | | | | $ | 7,587 | | | |
Rock Hill Facility
The Company leases its headquarters and research and development facility pursuant to a lease agreement with Lex Rock Hill, LP. After its initial term ending August 31, 2021, the lease provides the Company with the option to renew the lease for two additional five-year terms. The lease also grants the Company the right to cause Lex Rock Hill, subject to certain terms and conditions, to expand the leased premises during the term of the lease, in which case the term of the lease would be extended. The lease is a triple net lease and provides for the payment of base rent of $669 in 2013 through 2015, $683 in 2016, including a rent escalation in 2016, $709 in 2017 through 2020 and $723 in 2021. Under the terms of the lease, the Company is obligated to pay all taxes, insurance, utilities and other operating costs with respect to the leased premises. The lease also grants the Company the right to purchase the leased premises and undeveloped land surrounding the leased premises on terms and conditions described more particularly in the lease. In 2011, the Company exercised its right to purchase the undeveloped land for $370. This lease is recorded as a capitalized lease obligation under ASC 840, “Leases.“Leases.” The implicit interest rate atwas 6.93% as of December 31, 20132016 and 2012 was 6.93%.2015.
Other Capital Lease Obligations
The Company leases other equipment with lease terms through August 2018. In accordance with ASC 840, the Company has recorded these leases as capitalized leases. The implicit interest rate ranged from 1.75% to 7.80%8.06% at December 31, 20132016 and 1.55% to 7.80% at December 31, 2012.2015.
Note 13 Preferred Stock
The Company had 5,000 shares of preferred stock that were authorized but unissued at December 31, 20132016 and 2012.2015.
Note 14 Stock-Based Compensation
Effective May 19, 2004, the Company adopted its 2004 Incentive Stock Plan, as further amended and restated on February 3, 2015 (the “2004 Stock Plan”), and its 2004 Restricted Stock Plan for Non-Employee Directors, as further amended and restated on April 1, 2013 (the “2004 Director“Director Plan”). Effective upon the adoption of these Plans, allOn May 19, 2015, the Company’s previous stock option plans terminated, exceptstockholders approved the 2015 Incentive Plan of 3D Systems Corporation (the “2015 Plan” and, together with respect to options outstanding under those plans. As of December 31, 2013 and 2012, all vested options had been exercised and there were no options outstanding. All stock-based compensation expense for vested options was recognized prior to 2008.
In 2013, the maximum number of shares of common stock reserved for issuance under the 2004 Stock Plan, was increased from 4,000 to 6,000. Total awards issued under this plan, net of repurchases, amounted to 1,046the “Incentive Plans”).
The 2004 Stock Plan authorizes shares of restricted stock, in 2013, 540 shares of restricted stock in 2012,units, stock appreciation rights and 384 shares of restricted stock in 2011. The Company estimated the future value associated with awards granted in 2013, 2012 and 2011 as $67,942, $20,458 and $8,007, respectively, which is calculated based on the fair market value of the common stock on the date of grant less the amount paid by the recipient and is expensed over the vesting period of each award. The compensation expense recognized in 2013, 2012 and 2011 was $12,958, $4,818 and $2,337, respectively. Generally, each of these awards is made with a vesting period of three years to five years from the date of grant and requires the recipient to pay the lesser of $1.00 for each share or an amount equal to ten percent of the fair market value of the Company’s common stock per share at the date of grant.
The purpose of the 2014 Stock Plan is to provide an incentive that permits the persons responsible for the Company’s growth to share directly in that growth and to further the identity of their interests with the interests of the Company’s stockholders. Any person who is an employee of or consultant to the Company, or a subsidiary or an affiliate of the Company, is eligible to be considered for the grant of restricted stock awards, stock options or performance awards pursuant to the 2004 Stock Plan. The 2004 Stock Plan is administered by the Compensation Committee of the Board of Directors, which, pursuant to the provisions of the 2004 Stock Plan, has the sole authority to determine recipients of awards under that plan, the number ofpurchase shares to be covered by such awards and the terms and conditions of each award. The 2004 Stock Plan may be amended, altered or discontinued at the sole discretion of the Board of Directors at any time.
The 2004 Director Plan provides for the grant of up to 600 shares of common stock to non-employee directors (as defined in the Plan) of the Company, subject to adjustment in accordance with the terms of the Plan. The purpose of this Plan is to attract, retain and motivate non-employee directors of exceptional ability and to promote the common interests of directors and stockholders in enhancing the value of the Company’s common stock. Each non-employee director of the Company is eligible to participate in thisThe 2004 Stock Plan upon their election to the Board of Directors.also designates measures that may be used for performance awards. The Director Plan provides for initial grants of 1 share of common stock to each newly elected non-employee director, annual grants of 3authorizes shares of commonrestricted stock as of the close of business on the date of each annual meeting of stockholders, and interim grants of 3 shares of common stock, or a pro rata portion thereof, to non-employee directors elected at meetings other than the annual meeting. Effective April 1, 2011, the Board of Directors amended this Plan to limit the value of any award of shares made to an eligible director to $50, valued on the date of the award. Effective April 1, 2013, the Board of Directors amended this Plan to increase the limit of the value of any award of shares made to an eligible director to $100, valued on the date of award. The issue price of common stock awarded under this Plan is equal to the par value per share of the common stock. The Company accounts for the fair value of awards of common stock made under this Plan, net of the issue price, as director compensation expense in the period in which the award is made. During the years ended December 31, 2013, 2012 and 2011, the Company recorded $600, $300 and $300, respectively, as director compensation expense in connection with awards of 12 shares in 2013, 11 shares in 2012 and 16 shares in 2011 of common stock made to the non-employee directors of the Company pursuantCompany. The 2015 Plan authorizes shares of restricted stock, restricted stock units, stock appreciation rights, cash incentive awards and the grant of options to this Plan.purchase shares of the Company’s common stock. The 2015 Plan also designates measures that may be used for performance awards.
Generally, awards granted prior to November 13, 2015 become fully-vested on the three-year anniversary of the grant date and awards granted on or after November 13, 2015 will vest one third each year over three years.
As
The Company records stock-based compensation expense in selling, general and administrative expenses in the condensed consolidated statements of operations and comprehensive income (loss). Stock-based compensation expense for the years ended December 31, 2013, 1502016, 2015 and 1,295 shares of common stock were available for future grants under the 2004 Director Plan and the 2004 Stock Plan, respectively. The status of the Company’s stock options is summarized below:2014 was as follows:
| | | | | | | | | | | | | | | |
| | 2013 | | 2012 | | 2011 |
(shares and options in thousands) | | Options | | Weighted Average Exercise Price | | Options | | Weighted Average Exercise Price | | Options | | Weighted Average Exercise Price |
Outstanding at beginning of year | | — | | $ | — | | 1,076 | | $ | 3.76 | | 1,554 | | $ | 4.34 |
Exercised | | — | | | — | | (1,056) | | | 3.70 | | (452) | | | 5.61 |
Lapsed or canceled | | — | | | — | | (20) | | | 7.12 | | (26) | | | 6.72 |
Outstanding at end of year | | — | | $ | — | | — | | $ | — | | 1,076 | | $ | 3.76 |
Options exercisable at end of year | | — | | | | | — | | | | | 1,076 | | | |
Shares available for future option grants (a) | | 1,445 | | | | | 1,667 | | | | | 2,217 | | | |
| (a)
| | Assumes the issuance of options permitted by the 2004 Incentive Stock Plan.
|
| | | | | | | | |
| Year Ended December 31, |
(in thousands) | 2016 | | 2015 | | 2014 |
Stock-based compensation expense | $ | 31,295 | | $ | 34,733 | | $ | 32,793 |
As ofRestricted Stock
Stock award activity for the years ended December 31, 2012,2016, 2015 and 2014 was as follows:
| | | | | | | | | | | | | | | | | |
| | Year Ended December 31, |
| | 2016 | | | 2015 | | | 2014 |
(in thousands, except per share amounts) | | Number of Shares/Units | | Weighted Average Grant Date Fair Value | | | Number of Shares/Units | | Weighted Average Grant Date Fair Value | | | Number of Shares/Units | | Weighted Average Grant Date Fair Value |
Outstanding at beginning of period — unvested | | 2,942 | | $ | 36.55 | | | 2,806 | | $ | 41.08 | | | 2,523 | | $ | 41.21 |
Granted | | 2,516 | | $ | 11.57 | | | 1,438 | | $ | 16.12 | | | 1,031 | | $ | 49.46 |
Cancelled | | (526) | | $ | 38.64 | | | (672) | | $ | 46.20 | | | (85) | | $ | 39.52 |
Vested | | (1,151) | | $ | 40.99 | | | (630) | | $ | 23.89 | | | (663) | | $ | 12.59 |
Outstanding at end of period — unvested | | 3,781 | | $ | 36.34 | | | 2,942 | | $ | 36.55 | | | 2,806 | | $ | 41.08 |
During the year ended December 31, 2016, the Company awarded certain employees 469 shares of restricted stock under the 2015 Plan, included in the activity above, that vests under specified market conditions. Each of these employees was generally awarded two equal tranches of market condition restricted stock that immediately vests when the Company’s common stock trades at either $30 or $40 per share for ninety consecutive calendar days.
At December 31, 2016, there was $5,517 of unrecognized pre-tax stock-based compensation expense related to non-vested restricted stock awards with market conditions, which the Company expects to recognize over the remaining weighted-averagethree year period.
At December 31, 2016, there was $40,306 of unrecognized pre-tax stock-based compensation expense related to all other non-vested restricted stock options were exercised or expired; consequently, no stock options were outstanding or exercised during 2013. award shares and units, which the Company expects to recognize over the remaining weighted-average vesting period of two years.
Stock Options
The aggregate intrinsicCompany estimates the fair value of stock options exercised during 2012with market conditions using a binomial lattice Monte Carlo simulation model. The weighted-average fair value and 2011the assumptions used to measure fair value were as follows:
| | | | | | | | |
| Year Ended December 31, |
| 2016 | | 2015 | | 2014 |
Stock option assumptions: | | | | | | | | |
Weighted-average fair value | $ | 7.80 | | $ | — | | $ | — |
Expected volatility | | 60.0% | | | — | | | — |
Risk-free interest rate | | 0.76%-1.46 | | | — | | | — |
Expected dividend yield | | 0% | | | — | | | — |
Derived term in years | | 3-4 | | | — | | | — |
Stock option activity for the year ended December 31, 2016 was $39,165 and $5,298, respectively, determined as follows:
| | | | | | | | |
| | Year Ended December 31, 2016 |
(in thousands, except per share amounts) | | Number of Shares | | Weighted Average Exercise | | | Weighted Average Remaining Term (in years) |
Stock option activity: | | | | | | | | |
Outstanding at beginning of period | | — | | $ | — | | | |
Granted | | 2,260 | | | 13.92 | | | |
Exercised | | — | | | — | | | |
Forfeited and expired | | — | | | — | | | |
Outstanding at end of period | | 2,260 | | $ | 13.92 | | | 9.5 |
Exercisable at end of period | | — | | $ | — | | | — |
During the year ended December 31, 2016, the Company awarded certain employees market condition stock options under the 2015 Plan, included in the activity above, that vest under specified market conditions. Each employee was generally awarded two equal tranches of market condition stock options that immediately vest when the dateCompany’s common stock trades at either $30 or $40 per share for ninety consecutive calendar days. At December 31, 2016, there was $14,956 of exercise.unrecognized pre-tax stock-based compensation expense related to non-vested stock options with market conditions, which the Company expects to recognize over the remaining weighted-average three year period.
Note 15 International Retirement Plan
The Company sponsors a non-contributory defined benefit pension plan for certain employees of a non-U.S. subsidiary initiated by a predecessor of the subsidiary. The Company maintains insurance contracts that provide an annuity that is used to fund the current obligations under this plan. The net present value of thatthe annuity was $3,144$2,760 and $2,819$2,741 as of December 31, 20132016 and 2012,2015, respectively. The net present value of that annuity is included in “Other assets, net” on the Company’s consolidated balance sheets at December 31, 20132016 and 2012.2015. The following table provides a reconciliation of the changes in the projected benefit obligation for the years ended December 31, 20132016 and 2012:
2015:
| | | | | | | | | | | | |
(in thousands) | | 2013 | | 2012 | | 2016 | | 2015 |
Reconciliation of benefit obligations: | | | | | | | | | | | | |
Obligations as of January 1 | | $ | 5,240 | | $ | 3,936 | | $ | 6,328 | | $ | 7,194 |
Service cost | | | 144 | | | 92 | | | 154 | | | 178 |
Interest cost | | | 198 | | | 191 | | | 159 | | | 156 |
Actuarial loss | | | 246 | | | 1,030 | |
Actuarial (gain) loss | | | | 1,437 | | | (338) |
Benefit payments | | | (122) | | | (98) | | | (120) | | | (119) |
Effect of foreign currency exchange rate changes | | | 281 | | | 89 | | | (231) | | | (743) |
Obligations as of December 31 | | | 5,987 | | | 5,240 | | | 7,727 | | | 6,328 |
Funded status as of December 31 (net of tax benefit) | | $ | (5,987) | | $ | (5,240) | | $ | (7,727) | | $ | (6,328) |
The projected benefit obligation inFor the table above includes $246 and $1,030 of unrecognized net loss for the yearsyear ended December 31, 2013 and 2012, respectively. At December 31, 2013,2016, the Company recorded the $246a $1,437 loss, net of $128 of actuarial amortization and a $78$407 tax benefit, as a $168$902 adjustment to “Accumulated other comprehensive income”income (loss)” in accordance with ASC 715, “Compensation“Compensation – Retirement Benefits.Benefits.” AtFor the year ended December 31, 2012,2015, the Company recorded the $1,030 loss,a $338 gain and $154 of actuarial amortization, net of a $316$154 tax benefit,provision, as a $714$338 adjustment to “Accumulated other comprehensive income” in accordance with ASC 715, “Compensation – Retirement Benefits.income (loss)”
The Company has recognized the following amounts in the consolidated balance sheets at December 31, 20132016 and 2012:2015:
| | | | | | | | | | | | |
(in thousands) | | 2013 | | 2012 | | 2016 | | 2015 |
Accrued liabilities | | $ | 127 | | $ | 101 | | $ | 114 | | $ | 117 |
Other liabilities | | | 5,860 | | | 5,139 | | | 7,613 | | | 6,211 |
Projected benefit obligation | | | 5,987 | | | 5,240 | | | 7,727 | | | 6,328 |
Accumulated other comprehensive income | | | (1,076) | | | (908) | | | (2,775) | | | (1,873) |
Total | | $ | 4,911 | | $ | 4,332 | | $ | 4,952 | | $ | 4,455 |
The following projected benefit obligation and accumulated benefit obligation were estimated as of December 31, 20132016 and 2012:2015:
| | | | | | | | | | | | |
(in thousands) | | 2013 | | 2012 | | 2016 | | 2015 |
Projected benefit obligation | | $ | 5,987 | | $ | 5,240 | | $ | 7,727 | | $ | 6,328 |
Accumulated benefit obligation | | $ | 5,553 | | $ | 4,840 | | $ | 6,905 | | $ | 5,738 |
The following table shows the components of net periodic benefit costs and other amounts recognized in other comprehensive income:
income (loss):
| | | | | | | | | | | | |
(in thousands) | | 2013 | | 2012 | | 2016 | | 2015 |
Net periodic benefit cost: | | | | | | | | | | | | |
Service cost | | $ | 144 | | $ | 92 | | $ | 154 | | $ | 178 |
Interest cost | | | 198 | | | 191 | | | 159 | | | 156 |
Amortization of actuarial loss | | | 55 | | | — | | | 128 | | | 154 |
Total | | $ | 397 | | $ | 283 | | $ | 441 | | $ | 488 |
Other changes in plan assets and benefit obligations recognized in other comprehensive income: | | | | | | | | | | | | |
Net loss | | | 168 | | | 714 | |
Net (gain) loss | | | | 1,437 | | | (338) |
Total expense recognized in net periodic benefit cost and other comprehensive income | | $ | 565 | | $ | 997 | | $ | 1,878 | | $ | 150 |
The following assumptions are used to determine benefit obligations as of December 31:
| | | | | | | | | | | | |
| | 2013 | | 2012 | | | 2016 | | | 2015 |
Discount rate | | | 3.50% | | | 3.80% | | | 1.60% | | | 2.50% |
Rate of compensation | | | 2.00% | | | 2.00% | | | 3.00% | | | 2.50% |
The following benefit payments, including expected future service cost, are expected to be paid:
| | | | | | |
(in thousands) | | | | |
Estimated future benefit payments: | | | | | | |
2014 | | $ | 153 | |
2015 | | | 156 | |
2016 | | | 176 | |
2017 | | | 179 | | $ | 129 |
2018 | | | 183 | | | 131 |
2019-2023 | | | 1,224 | |
2019 | | | | 145 |
2020 | | | | 173 |
2021 | | | | 176 |
2022-2026 | | | | 1,077 |
Note 16 Warranty Contracts
The Company provides product warranties for up to one year, or longer if required by applicable laws or regulations, as part of sales transactions for certain of its printers. Warranty revenue is recognized ratably over the term of the warranties, which is the period during which the related costs are incurred. This warranty provides the customer with maintenance on the equipment during the warranty period and provides for certain repair, labor and replacement parts that may be required. In connection with this activity, the Company recognized warranty revenue and incurred warranty costs as shown in the table below.
| | | | | | | | | | | | | | | | | | | | | | | | |
Warranty Revenue Recognition: | | | | | | | | | | | | | | | | | | | | | | | | |
(in thousands) | | Beginning Balance Deferred Warranty Revenue | | Warranty Revenue Deferred | | Warranty Revenue Recognized | | Ending Balance Deferred Warranty Revenue | | Beginning Balance Deferred Warranty Revenue | | Warranty Revenue Deferred | | Warranty Revenue Recognized | | Ending Balance Deferred Warranty Revenue |
Year Ended December 31, | | | | | | | | | | | | | | | | | | | | | | | | |
2013 | | $ | 4,081 | | $ | 14,681 | | $ | (9,621) | | $ | 9,141 | |
2012 | | | 3,094 | | | 7,540 | | | (6,553) | | | 4,081 | |
2011 | | | 4,433 | | | 4,210 | | | (5,549) | | | 3,094 | |
2016 | | | $ | 10,663 | | $ | 12,859 | | $ | (14,471) | | $ | 9,051 |
2015 | | | | 11,914 | | | 15,349 | | | (16,600) | | | 10,663 |
2014 | | | | 9,141 | | | 17,185 | | | (14,412) | | | 11,914 |
| | | | | | | | | | | | | | | | | | | | | | | | |
Warranty Costs Incurred: | | | | | | | | | | | | | | | | | | | | | | | | |
(in thousands) | | | | Materials | | Labor and Overhead | | Total | | | | | Materials | | Labor and Overhead | | Total |
Year Ended December 31, | | | | | | | | | | | | | | | | | | | | | | | | |
2013 | | | | | $ | 4,441 | | $ | 4,821 | | $ | 9,262 | |
2012 | | | | | | 2,672 | | | 3,720 | | | 6,392 | |
2011 | | | | | | 2,020 | | | 3,565 | | | 5,585 | |
2016 | | | | | | $ | 6,851 | | $ | 6,862 | | $ | 13,713 |
2015 | | | | | | | 6,202 | | | 5,559 | | | 11,761 |
2014 | | | | | | | 5,958 | | | 5,440 | | | 11,398 |
Note 17 Computation of Net Income (Loss) per Share
The Company presents basic and diluted earningsincome (loss) per share (“EPS”) amounts. Basic EPSincome (loss) per share is calculated by dividing net income availableloss attributable to common stockholders3D Systems Corporation by the weighted average number of common shares outstanding during the applicable period. Diluted EPSincome (loss) per share is calculated by dividing net income available to 3D Systems’ common stockholdersloss by the weighted average number of common and common equivalent shares outstanding during the applicable period. The following table is a reconciliation of the numerator and denominator of thereconciles basic andweighted average outstanding shares to diluted income per share computationsweighted average outstanding for the years ended December 31, 2013, 20122016, 2015 and 2011:2014:
| | | | | | | | | |
(in thousands, except per share amounts) | | 2013 | | 2012 | | 2011 |
Numerator: | | | | | | | | | |
Net income attributable to 3D Systems – numerator for basic net earnings per share | | $ | 44,107 | | $ | 38,941 | | $ | 35,420 |
Add: Effect of dilutive securities | | | | | | | | | |
Interest expense on 5.50% convertible notes (after-tax)(a) | | | — | | | — | | | — |
Numerator for diluted earnings per share | | $ | 44,107 | | $ | 38,941 | | $ | 35,420 |
| | | | | | | | | |
Denominator: | | | | | | | | | |
Weighted average shares – denominator for basic net
earnings per share | | $ | 98,393 | | $ | 80,817 | | $ | 74,622 |
Add: Effect of dilutive securities | | | | | | | | | |
Stock options and other equity compensation | | | — | | | 906 | | | 1,463 |
5.50% convertible notes (after-tax)(a) | | | — | | | — | | | — |
Denominator for diluted earnings per share | | $ | 98,393 | | $ | 81,723 | | $ | 76,085 |
| | | | | | | | | |
Earnings per share | | | | | | | | | |
Basic and Diluted | | $ | 0.45 | | $ | 0.48 | | $ | 0.47 |
| | | | | | | | | |
Interest expense excluded from diluted earnings per share calculation (a) | | $ | 1,835 | | $ | 9,002 | | | 906 |
5.50% Convertible notes shares excluded from diluted earnings per share calculation (a) | | | 1,764 | | | 5,957 | | | 7,084 |
| | | | | | | | |
(in thousands, except per share amounts) | 2016 | | 2015 | | 2014 |
Numerator for basic and diluted net loss per share: | | | | | | | | |
Net income (loss) attributable to 3D Systems Corporation | $ | (38,419) | | $ | (655,492) | | $ | 11,637 |
| | | | | | | | |
Denominator for basic and diluted net loss per share: | | | | | | | | |
Weighted average shares | | 111,189 | | | 111,969 | | | 108,023 |
| | | | | | | | |
Net income (loss) per share, basic and diluted | $ | (0.35) | | $ | (5.85) | | $ | 0.11 |
For the year ended December 31, 2016, there were 2,060 potential common shares of unvested stock options excluded from diluted loss per share and 3,003 potential common shares of unvested restricted stock awards and shares issuable upon the vesting of restricted stock units excluded from diluted loss per share, as the Company had a net loss for the year. | (a)
| | Average outstanding diluted earnings per share calculation excludes shares that may be issued upon conversion of the outstanding senior convertible notes since the effect of their inclusion would have been anti-dilutive.
|
For the year ended December 31, 2015, there were 1,117 potential common shares of unvested restricted stock awards and shares issuable upon the vesting of restricted stock units excluded from diluted loss per share, as the Company had a net loss for the year.
Note 18 Noncontrolling InterestInterests
On July 15, 2013, the Company acquired approximately 82% of the outstanding shares and voting rights of Phenix Systems, a global provider of direct metal selective laser sintering 3D printers based in Riom, France. Phenix’s operating results are included in these consolidated financial statements. In accordance with ASC 810, “Consolidation,” the carrying value of the noncontrolling interest is reported in the consolidated balance sheets as a separate component of equity and consolidated net income has been adjusted to report the net loss attributable to the noncontrolling interest. Subsequent to the acquisition, the Company completed a tender offer and acquired additional shares and voting rights of Phenix Systems. As of December 31, 2013,2016, the Company owned 94.7%approximately 70% of the capital and voting rights of Phenix Systems.Robtec, a service bureau and distributor of 3D printing and scanning products. Robtec was acquired on November 25, 2014.
As of December 31, 2016, the Company owned approximately 65% of the capital and voting rights of Easyway, a service bureau and distributor of 3D printing and scanning products in China. Easyway was acquired on April 2, 2015.
Note 19 Fair Value Measurements
ASC 820, “Fair“Fair Value Measurements and Disclosures,” defines fair value as the exchange price that would be received for an asset or paid to transfer a liability (an exit price) in the principal or most advantageous market for the asset or liability in an orderly transaction between market participants on the measurement date. ASC 820 also establishes a fair value hierarchy whichthat requires an entity to maximize the use of observable inputs that may be used to measure fair value:
Level 1 - Quoted prices in active markets for identical assets or liabilities;
Level 2 - Observable inputs other than Level 1 prices, such as quoted prices for similar assets or liabilities, quoted prices in markets that are not active, or other inputs that are observable or can be corroborated by observable market data for substantially the full term of the assets or liabilities; or
| ·
| | Level 1 – Quoted prices in active markets for identical assets or liabilities;
|
| ·
| | Level 2 – Observable inputs other than Level 1 prices such as quoted prices for similar assets or liabilities; quoted prices in markets that are not active; or other inputs that are observable or can be corroborated by observable market data for substantially the full term of the assets or liabilities; or
|
| ·
| | Level 3 –- Unobservable inputs that are supported by little or no market activity and that are significant to the fair value of the assets or liabilities. |
For the Company, the above standard applies to cash equivalents convertible senior notes and foreign exchange contracts.earnout consideration. The Company utilizes the market approach to measure fair value for its financial assets and liabilities. The market approach uses prices and other relevant information generated by market transactions involving identical or comparable assets or liabilities.
Assets and liabilities measured at fair value on a recurring basis are summarized below:
:
| | | | | | | | | | | | | | | | | | | | | | | | | | | | | | | | | | | |
| | | Fair Value Measurements as of: | | | | | | | | | | | |
| | December 31, 2013 | | December 31, 2012 | Fair Value Measurements as of December 31, 2016 |
(in thousands) | | | Level 1 | | | Level 2 | | | Level 3 | | | Total | | | Level 1 | | | Level 2 | | | Level 3 | | | Total | | Level 1 | | | Level 2 | | | Level 3 | | | Total |
Description | | | | | | | | | | | | | | | | | | | | | | | | | | | | | | | | | | | |
Cash equivalents (a) | Cash equivalents (a) | $ | 226,895 | | $ | — | | $ | — | | $ | 226,895 | | $ | 101,906 | | $ | — | | $ | — | | $ | 101,906 | $ | 25,206 | | $ | — | | $ | — | | $ | 25,206 |
Earnout consideration (b) | | $ | — | | $ | — | | $ | 10,806 | | $ | 10,806 |
| | | | | | | | | | | | |
| | Fair Value Measurements as of December 31, 2015 |
(in thousands) | | | Level 1 | | | Level 2 | | | Level 3 | | | Total |
Description | | | | | | | | | | | | |
Cash equivalents (a) | | $ | 26,648 | | $ | — | | $ | — | | $ | 26,648 |
Earnout consideration (b) | | $ | — | | $ | — | | $ | 9,673 | | $ | 9,673 |
| (a) | | Cash equivalents include funds held in money market instruments and are reported at their current carrying value, which approximates fair value due to the short-term nature of these instruments and are included in cash and cash equivalents in the consolidated balance sheet. |
| (b) | | The fair value of the earnout consideration, which is based on the present value of the expected future payments to be made to the sellers of the acquired businesses, was derived by analyzing the future performance of the acquired businesses using the earnout formula and performance targets specified in each purchase agreement and adjusting those amounts to reflect the ability of the acquired entities to achieve the stated targets. Given the significance of the unobservable inputs, the valuations are classified in Level 3 of the fair value hierarchy. The change in earnout consideration from December 31, 2015 to December 31, 2016 reflects a $54 adjustment to the expected payment and $1,079 of accretion. |
The Company did not have any transfers of assets and liabilities between Level 1 and Level 2levels of the fair value measurement hierarchy during the quarter or year ended December 31, 2013.2016.
The carrying value of the senior convertible notes as of December 31, 2013 and December 31, 2012 was $11,416 and $80,531, respectively, net of the unamortized discount. As of December 31, 2013 and December 31, 2012, the estimated fair value of the senior convertible notes was $12,035 and $86,981, respectively, based on quoted market prices. The Company determined the fair value of the convertible notes utilizing transactions in the listed markets for identical or similar liabilities. As such, the fair value of the senior convertible notes is considered Level 2
In addition to the financial assets and liabilities included in the above table, certain of our non-financial assets and liabilities are to be initially measured at fair value on a non-recurring basis. This includes items such as non-financial assetsgoodwill and liabilities initially measured at fair value in a business combination (but not measured at fair value in subsequent periods) and non-financial, long-livedother intangible assets measured at fair value for an impairment assessment. In general, non-financial assetsFor further discussion on the valuation techniques and liabilities includinginputs used in the fair value measurement of goodwill and other intangible assets, see Notes 2, 6 and property and equipment are measured at fair value when there is an indication of impairment and are recorded at fair value only when impairment is recognized. The Company has not recorded any impairments related to such assets and has had no other significant non-financial assets or non-financial liabilities requiring adjustments or write-downs to fair value as of December 31, 2013 and 2012.7.
Note 20 Income Taxes
The components of the Company’s income before income taxes are as follows:
| | | | | | | | | | | | | | | | | | | | |
(in thousands) | 2013 | | | 2012 | | | 2011 | 2016 | | | 2015 | | | 2014 |
Income before income taxes: | | | | | | | | | | | | | | | | | | | | |
Domestic | $ | 55,826 | | | $ | 34,105 | | | $ | 25,057 | $ | (53,868) | | | $ | (580,720) | | | $ | 5,751 |
Foreign | | 8,180 | | | | 9,174 | | | | 7,389 | | 14,056 | | | | (74,233) | | | | 11,636 |
Total | $ | 64,006 | | | $ | 43,279 | | | $ | 32,446 | $ | (39,812) | | | $ | (654,953) | | | $ | 17,387 |
The components of income tax provision for the years ended December 31, 2013, 20122016, 2015 and 20112014 are as follows:
| | | | | | | | | | | | | | | | | | | | |
(in thousands) | 2013 | | | 2012 | | | 2011 | |
| | 2016 | | | 2015 | | | 2014 |
Current: | | | | | | | | | | | | | | | | | | | | |
U.S. federal | $ | 24,688 | | | $ | 441 | | | $ | — | $ | (2,110) | | | $ | 10,753 | | | $ | 23,336 |
State | | 1,926 | | | | 1,031 | | | | 367 | | 30 | | | | 169 | | | | 72 |
Foreign | | 3,165 | | | | 3,527 | | | | 1,799 | | 8,099 | | | | 925 | | | | 6,588 |
Total | | 29,779 | | | | 4,999 | | | | 2,166 | | 6,019 | | | | 11,847 | | | | 29,996 |
| | | | | | | | | | | | | | | | | | | | |
Deferred: | | | | | | | | | | | | | | | | | | | | |
U.S. federal | | (7,760) | | | | 869 | | | | (4,727) | | (1,245) | | | | (5,252) | | | | (21,624) |
State | | (450) | | | | (798) | | | | (189) | | — | | | | (225) | | | | (87) |
Foreign | | (1,682) | | | | (732) | | | | (224) | | (5,321) | | | | 2,602 | | | | (2,844) |
Total | | (9,892) | | | | (661) | | | | (5,140) | | (6,566) | | | | (2,875) | | | | (24,555) |
Total income tax provision | $ | 19,887 | | | $ | 4,338 | | | $ | (2,974) | |
Total income tax (benefit) provision | | $ | (547) | | | $ | 8,972 | | | $ | 5,441 |
The overall effective tax rate differs from the statutory federal tax rate for the years ended December 31, 2013, 20122016, 2015 and 20112014 as follows
follows:
| | | | | | | | | | | | | | | | | | | | | | |
| % of Pretax Income | % of Pretax Income |
| 2013 | | 2012 | | 2011 | 2016 | | 2015 | | 2014 |
Tax provision based on the federal statutory rate | | 35.0 | % | | | 35.0 | % | | | 35.0 | % | | 35.0 | % | | | 35.0 | % | | | 35.0 | % |
Release of valuation allowances | | — | | | | (12.4) | | | | (19.2) | | |
Use of non-operating losses against U.S. taxable income, taxes | | — | | | | (14.6) | | | | (24.8) | | |
Nondeductible expenses | | | (1.1) | | | | (0.1) | | | | 12.5 | |
Foreign exchange loss | | | 9.4 | | | | — | | | | — | |
Uncertain tax positions | | | (25.1) | | | | (0.5) | | | | 11.2 | |
Deemed income related to foreign operations | | 0.2 | | | | 0.1 | | | | 0.7 | | | (8.4) | | | | (0.6) | | | | 8.1 | |
Income not subject to tax | | — | | | | — | | | | (2.0) | | |
Return to provision adjustments — foreign tax credit | | | 8.4 | | | | (0.7) | | | | 2.5 | |
Return to provision adjustments — research and development credit | | | 4.0 | | | | — | | | | — | |
Return to provision adjustments — non-consolidated U.S. entities | | | 6.4 | | | | — | | | | — | |
Impairment of definite lived intangibles | | | 3.1 | | | | — | | | | — | |
Foreign income tax rate differential | | | 3.1 | | | | (2.0) | | | | 0.5 | |
State taxes, net of federal benefit, before valuation allowance | | 2.4 | | | | 2.3 | | | | 1.3 | | | 3.9 | | | | 0.9 | | | | 0.3 | |
Increase in valuation allowances | | | (58.5) | | | | (16.4) | | | | — | |
Impairment of goodwill with no tax basis | | | — | | | | (16.8) | | | | — | |
Foreign tax credits related to above | | | 6.5 | | | | 0.2 | | | | (6.3) | |
Deferred tax adjustment — deferred revenue | | | 7.6 | | | | — | | | | — | |
Deferred tax adjustment — state tax credits | | | 1.4 | | | | — | | | | — | |
Deferred tax adjustments — other | | | 4.0 | | | | — | | | | — | |
Domestic production activities deduction | | | — | | | | — | | | | (12.0) | |
Research credits | | (0.6) | | | | — | | | | — | | | — | | | | — | | | | (21.9) | |
Foreign income tax rate differential | | (0.3) | | | | (0.7) | | | | (0.6) | | |
Domestic production activities deduction | | (3.6) | | | | — | | | | — | | |
Return to provision adjustments, foreign current and deferred balances | | (0.4) | | | | 0.5 | | | | (0.7) | | |
Other | | (1.6) | | | | (0.2) | | | | 1.1 | | | 1.7 | | | | (0.4) | | | | 1.4 | |
Effective tax rate | | 31.1 | % | | | 10.0 | % | | | (9.2) | % | | 1.4 | % | | | (1.4) | % | | | 31.3 | % |
The difference between the Company’s effective tax rate for 20132016 and the federal statutory rate was 3.933.6 percentage points. The difference in the effective rate is due primarily to the change in valuation allowance that was recorded during the year, as well as the Company’s foreign income inclusions, return to provision adjustments and lower foreign statutory rates.
The difference between the Company’s effective tax rate for 2015 and the federal statutory rate was 36.4 percentage points. The Company is reporting positive U.S. taxable income,recorded nondeductible expenses, including non-deductible goodwill impairment charges and is therefore entitled to use the domestic production activities deduction provided to producersa valuation allowance in the United States, effectively loweringU.S. and certain foreign jurisdictions, which contributed to a difference in the U.S.effective tax rate applicable to production activities.rate.
The difference between the Company’s effective tax rate for 20122014 and the federal statutory rate resulted primarily from changeswas 3.7 percentage points. The Company incurred nondeductible expenses and recognized income for tax purposes, net of tax credits, not included in valuation allowances. These comprised:
| ·
| | The release of valuation allowances against certain U.S. deferred tax assets. This release was based uponfinancial statement income, increasing the Company’s results of operations. The Company concluded during the 2012 that it is more likely than not that a portion of its current U.S. deferred tax assets will be realized. As a result, in accordance with ASC 740, the Company released the remainder of its valuation allowances related to $12,388 of reserves, accruals and tax credits and to $7,602 of net operating loss carryforwards for state income tax purposes, resulting in no valuation allowance as of December 31, 2012. This resulted in a non-cash income tax benefit of $5,372.
|
| ·
| | Other changes in valuation allowances were a result of utilizing U.S. loss carryforwards, which had had a full valuation allowance against them, to eliminate all federal and most state income tax expense otherwise arising.
|
The difference between the Company’s effective tax rate for 2011rate. The Company is benefiting from the U.S. domestic production activities deduction and from research credits, reducing the federal statutory rate resulted primarily from changes in valuation allowances. These comprised:effective tax rate.
| ·
| | The release of valuation allowances against certain U.S. deferred tax assets. This release was based upon the Company’s results of operations and its expected profitability in future years. The Company concluded, during 2011 that it is more likely than not that a portion of its net U.S. deferred tax assets will be realized. As a result, in accordance with ASC 740, $17,000 of the valuation allowance applied to such net deferred tax assets was reversed. This reversal resulted in a non-cash income tax benefit of $6,221.
|
| ·
| | Other changes in valuation allowances were a result of utilizing U.S. loss carryforwards, which had had a full valuation allowance against them, to eliminate all federal and most state income tax expense otherwise arising.
|
In 2013,2016, there were no changes to the Company’s valuation allowance assertions. During the fourth quarter of 2015, based upon the Company’s review of results of operations and forecast estimates in connection with the assessment of deferred tax benefits, the Company determined that it is more likely than not that the deferred tax assets in the US and certain foreign jurisdictions will not be realized. In 2014, the Company had no valuation allowance against net deferred income tax assets.
In 2012, the Company’s valuation allowance against net deferred income tax assets decreased by $8,781. This decrease consisted of an $8,781 decrease against the U.S. deferred income tax assets. The decrease in the valuation allowance against the net U.S. deferred income tax assets resulted primarily from the increase in the Company’s domestic net operating income, an increase in the amount of deferred income tax liabilities and from the release of valuation allowances against U.S. net deferred tax assets.
In 2011, the Company’s valuation allowance against net deferred income tax assets decreased by $25,892. This decrease consisted of a $25,892 decrease against the U.S. deferred income tax assets. The decrease in the valuation allowance against the net U.S. deferred income tax assets resulted primarily from the increase in the Company’s domestic net operating income and an increase in the amount of net operating loss carryforwards for state income tax purposes.
The components of the Company’s net deferred income tax assets and net deferred income tax liabilities at December 31, 20132016 and 20122015 are as follows:
| | | | | | | | | | | | |
(in thousands) | 2013 | | | 2012 | 2016 | | | 2015 |
Deferred income tax assets: | | | | | | | | | | | | |
Intangibles | | $ | 40,014 | | | $ | 46,293 |
Stock options and restricted stock awards | | | 14,384 | | | | 22,010 |
Reserves and allowances | | | 20,022 | | | | 18,738 |
Net operating loss carryforwards | | | 29,398 | | | | 16,796 |
Tax credit carryforwards | $ | 2,713 | | | $ | 3,390 | | 13,571 | | | | 8,610 |
Net operating loss carryforwards | | 5,725 | | | | 1,949 | |
Reserves and allowances | | 5,927 | | | | 4,706 | |
Stock options and restricted stock awards | | 3,174 | | | | 3,701 | |
Deferred lease revenue | | 86 | | | | 280 | |
Senior convertible notes | | 1,042 | | | | — | |
Accrued liabilities | | 342 | | | | — | | 5,330 | | | | 4,943 |
Property, plant and equipment | | 629 | | | | — | |
Deferred revenue | | | 3,502 | | | | 405 |
Valuation allowance | | | (109,913) | | | | (107,312) |
Total deferred income tax assets | | 19,638 | | | | 14,026 | | 16,308 | | | | 10,483 |
Deferred income tax liabilities | | | | | | | |
Senior convertible notes | | — | | | | 3,933 | |
| | | | | | | |
Deferred income tax liabilities: | | | | | | | |
Intangibles | | 32,737 | | | | 27,041 | | 16,968 | | | | 22,676 |
Property, plant and equipment | | — | | | | 90 | | 8,818 | | | | 3,851 |
Accrued liabilities | | — | | | | 130 | |
Total deferred income tax liabilities | | 32,737 | | | | 31,194 | | 25,786 | | | | 26,527 |
| | | | | | | |
Net deferred income tax liabilities | $ | (13,099) | | | $ | (17,168) | $ | (9,478) | | | $ | (16,044) |
The Company’s net deferred income tax liabilities include both current and noncurrent amounts. Accrued liabilities and deferred lease revenue are classified as current. Portions of reserves and allowances, tax credit carryforwards, and net operating loss carryforwards that would be available within the next year are classified as current, with the remainder of the balance classified as noncurrent. Stock options and restricted stock awards, property, plant and equipment, the senior convertible notes and intangibles are also classified as noncurrent.
The Company accounts for income taxes in accordance with ASC 740. Under ASC 740, deferred income tax assets and liabilities are determined based on the differences between financial statement and tax bases of assets and liabilities, using enacted rates in effect for the year in which the differences are expected to reverse. The provision for income taxes is based on domestic and international statutory income tax rates in the jurisdictions in which the Company operates.
At December 31, 2013, $5,7252016, $29,398 of the Company’s deferred income tax assets was attributable to $52,177$148,199 of netgross operating loss carryforwards, which consisted of $6,856$50,587 loss carryforwards for U.S. federal income tax purposes, $38,934$78,274 of loss carryforwards for U.S. state income tax purposes and $6,387$19,338 of loss carryforwards for foreign income tax purposes.
At December 31, 2012, $1,9492015, $16,796 of the Company’s deferred income tax assets was attributable to $42,202$85,609 of gross net operating loss carryforwards, which consisted of no$33,606 loss carryforwards for U.S. federal income tax purposes, $41,047$34,492 of loss carryforwards for U.S. state income tax purposes and $1,155$17,511 of loss carryforwards for foreign income tax purposes.
The net operating loss carryforwards for U.S. federal income tax purposes begin to expire in 2022. The net operating loss carryforwards for U.S. state income tax purposes beganbegin to expire in 2014.2017. In addition, certain loss carryforwards for foreign income tax purposes begin to expire in 2018 and certain other loss carryforwards for foreign purposes do not expire. Ultimate utilization of these loss carryforwards depends on future taxable earnings of the Company and its subsidiaries.
At December 31, 2013,2016, tax credit carryforwards included in the Company’s deferred income tax assets consisted of $2,040$2,544 of research and experimentation credit carryforwards for U.S. federal income tax purposes, $2,649 of research and experimentation tax credit carryforwards for U.S. state income tax purposes, $58$7,155 of suchforeign tax credits for U.S. federal income tax purposes, $474 of other U.S. federal tax credits, $149 of research and experimentation tax credit carryforwards for foreign income tax purposes and $600 of other state tax credits. Certain state research and experimentation credits begin to expire in 2017; other state credits begin to expire in 2024. The Company recorded a valuation allowance related to the U.S. federal and state tax credits.
At December 31, 2015, tax credit carryforwards included in the Company’s deferred income tax assets consisted of $2,544 of research and experimentation credit carryforwards for U.S. federal income tax purposes, $2,082 of research and experimentation tax credit carryforwards for U.S. state income tax purposes, $2,740 of foreign tax credits for U.S. federal income tax purposes, $474 of other U.S. federal tax credits, $155 of research and experimentation tax credit carryforwards for foreign income tax purposes and $615 of other state tax credits. The state research and experimentation credits do not expire; the other state credits begin to expire in 2017.
At December 31, 2012, tax credit carryforwards included in The Company recorded a valuation allowance related to the Company’s deferred income tax assets consisted of $735 of research and experimentation tax credit carryforwards for U.S. federal income tax purposes, $2,040 of such tax credit carryforwards for U.S. state income tax purposes and $615 of other state tax credits. The state research and experimentation credits do not expire; the other federal and state credits begintax credits.
During 2016, the Company decreased its deferred tax asset in the amount of approximately $17,849 with the offset to expireother comprehensive loss. Additionally, a decrease in 2017.
The Company recorded $26,038the Company's valuation allowance of approximately$17,849 was allocated to additional paid-in capital during 2013 with respect toaccumulated other comprehensive loss in the exercised stock options and the vesting of restricted stock awards.consolidated balance sheets.
The Company has not provided for any taxes on approximately $19,752$38,545 of unremitted earnings of its foreign subsidiaries, as the Company intends to permanently reinvest all such earnings outside the U.S. We believeThe Company believes a calculation of the deferred tax liability associated with these undistributed earnings is impracticable.impracticable.
TheIncluding interest and penalties, the Company decreased its ASC 740 reserve by $852, before any offsetting tax benefit, for the year ended December 31, 2013 and decreased this reserve by $298, before any offsetting tax benefit, for the year ended December 31, 2012. The Company decreasedincreased its unrecognized benefits by $459$10,077 and $6,451 for the yearyears ended December 31, 20132016 and decreased these benefits by $82 for the year ended December 31, 2012.2015, respectively. The Company does not anticipate any additional unrecognized tax benefits during the next twelve12 months that would result in a material change to its consolidated financial position.
| | | | | | | | | | |
| Unrecognized Tax Benefits |
(in thousands) | 2013 | | | 2012 | | | 2011 |
Balance at January 1 | $ | (475) | | | $ | (393) | | | $ | (429) |
Increases related to prior year tax positions | | 380 | | | | 300 | | | | 28 |
Decreases related to prior year tax positions | | — | | | | (378) | | | | (2) |
Increases related to current year tax positions | | — | | | | — | | | | — |
Decreases related to current year tax positions | | — | | | | (4) | | | | — |
Decreases in unrecognized liability due to settlements with foreign tax authorities | | 79 | | | | — | | | | 10 |
Balance at December 31 | $ | (16) | | | $ | (475) | | | $ | (393) |
The Company includes interest and penalties in the consolidated financial statementsConsolidated Financial Statements as a component of income tax expense.
The principal tax jurisdictions in which the Company files income tax returns are the United States, France, Germany, Japan, Korea, China, India, Italy, Switzerland, Australia, the Netherlands and the United Kingdom.
| | | | | | | | | | |
| Unrecognized Tax Benefits |
(in thousands) | 2016 | | | 2015 | | | 2014 |
Balance at January 1 | $ | (8,296) | | | $ | (1,845) | | | $ | (16) |
Increases related to prior year tax positions | | (2,658) | | | | — | | | | — |
Decreases related to prior year tax positions | | — | | | | 1,475 | | | | — |
Increases related to current year tax positions | | (7,297) | | | | (7,926) | | | | (1,829) |
Decreases related to current year tax positions | | — | | | | — | | | | — |
Decreases in unrecognized liability due to settlements with foreign tax authorities | | — | | | | — | | | | — |
Balance at December 31 | $ | (18,251) | | | $ | (8,296) | | | $ | (1,845) |
Tax years 20102003 through 20132015 remain subject to examination by the U.S. Internal Revenue Service.Service, with most of the years open to examination due to the generation and utilization of net operating losses. The Company has utilized a portion of its U.S. loss carryforwards causing the years from 1997 through 2007 to be subject to examination. The Company’s non-U.S. subsidiaries’files income tax returns (which are open to possible examination beginning in the year shown in parenthesesparentheses) in the following countries:Australia (2012), Belgium (2013), Brazil (2011), China (2013), France (2011)(2013), Germany (2012), India (2013), Israel (2012), Italy (2011), Japan (2007)(2011), Italy (2009)Korea (2011), Mexico (2011), Netherlands (2011), Switzerland (2008)(2011), the United Kingdom (2009), the Netherlands (2007), Australia (2009), Korea (2008)(2015) and China (2013)Uruguay (2011).
Note 21 Segment Information
The Company operates in one reportable business segment in which it develops, manufactures and markets worldwide 3D printing, rapid prototyping and manufacturing printers and parts solutions, which produce three-dimensional objects more quickly than traditional manufacturing.segment. The Company conducts its business through subsidiaries invarious offices and facilities located throughout the U.S.APAC region (Australia, China, India, Japan and Korea), a subsidiary in Switzerland that operates a research and production facility and sales and service offices operated by subsidiaries in Europe (France,(Belgium, France, Germany, Italy, the Netherlands, Switzerland and the United Kingdom), Israel, Latin America (Brazil, Mexico and in Asia Pacific (Australia, China, India, KoreaUruguay), Russia and Japan).the United States. The Company has historically disclosed summarized financial information for the geographic areas of operations as if they were segments in accordance with ASC 280, “Segment Reporting.“Segment Reporting.” Our geographic external sales and operating profits are attributed toFinancial information concerning the geographic regionsCompany’s geographical locations is based on theirthe location of origin.the selling entity. Such summarized financial information concerning the Company’s geographical operations is shown in the following tables:
| | | | | | | | | |
(in thousands) | | 2013 | | 2012 | | 2011 |
Revenue from unaffiliated customers: | | | | | | | | | |
United States | | $ | 284,752 | | $ | 196,414 | | $ | 117,739 |
Germany | | | 51,245 | | | 39,748 | | | 34,978 |
Other Europe | | | 82,536 | | | 60,939 | | | 48,346 |
Asia Pacific | | | 94,867 | | | 56,532 | | | 29,360 |
Total | | $ | 513,400 | | $ | 353,633 | | $ | 230,423 |
| | | | | | | | | |
(in thousands) | | 2016 | | 2015 | | 2014 |
Revenue from unaffiliated customers: | | | | | | | | | |
Americas | | $ | 340,885 | | $ | 357,976 | | $ | 333,925 |
Germany | | | 78,979 | | | 82,872 | | | 87,021 |
Other EMEA | | | 114,162 | | | 117,232 | | | 109,066 |
Asia Pacific | | | 98,939 | | | 108,083 | | | 123,640 |
Total revenue | | $ | 632,965 | | $ | 666,163 | | $ | 653,652 |
| | | | | | | | | |
The Company’s revenue from unaffiliated customers by type is as follows:
| | | | | | | | | |
(in thousands) | | 2013 | | 2012 | | 2011 |
Printers and other products | | $ | 227,627 | | $ | 126,798 | | $ | 66,665 |
Materials | | | 128,405 | | | 103,182 | | | 70,641 |
Services | | | 157,368 | | | 123,653 | | | 93,117 |
Total revenue | | $ | 513,400 | | $ | 353,633 | | $ | 230,423 |
Intercompany sales were as follows:
| | | | | | | | | | | | | | | |
| | Year Ended December 31, 2013 |
| | Intercompany Sales to |
(in thousands) | | United States | | Germany | | Other Europe | | Asia Pacific | | Total |
United States | | $ | — | | $ | 23,100 | | $ | 15,622 | | $ | 5,438 | | $ | 44,160 |
Germany | | | 1,825 | | | — | | | 4,135 | | | — | | | 5,960 |
Other Europe | | | 26,862 | | | 1,688 | | | 2,090 | | | 566 | | | 31,206 |
Asia Pacific | | | 1,659 | | | 641 | | | 67 | | | 1,431 | | | 3,798 |
Total | | $ | 30,346 | | $ | 25,429 | | $ | 21,914 | | $ | 7,435 | | $ | 85,124 |
| | | | | | | | | | | | | | | |
| | Year Ended December 31, 2012 |
| | Intercompany Sales to |
(in thousands) | | United States | | Germany | | Other Europe | | Asia Pacific | | Total |
United States | | $ | — | | $ | 6,823 | | $ | 4,153 | | $ | 1,044 | | $ | 12,020 |
Germany | | | 197 | | | — | | | 2,205 | | | — | | | 2,402 |
Other Europe | | | 4,812 | | | 26 | | | 255 | | | 38 | | | 5,131 |
Asia Pacific | | | 195 | | | — | | | — | | | — | | | 195 |
Total | | $ | 5,204 | | $ | 6,849 | | $ | 6,613 | | $ | 1,082 | | $ | 19,748 |
| | | | | | | | | | | | | | | |
| | Year Ended December 31, 2011 |
| | Intercompany Sales to |
(in thousands) | | United States | | Germany | | Other Europe | | Asia Pacific | | Total |
United States | | $ | — | | $ | 17,634 | | $ | 10,213 | | $ | 3,984 | | $ | 31,831 |
Germany | | | 372 | | | — | | | 3,523 | | | — | | | 3,895 |
Other Europe | | | 13,388 | | | 9 | | | 118 | | | — | | | 13,515 |
Asia Pacific | | | 18 | | | 4 | | | — | | | — | | | 22 |
Total | | $ | 13,778 | | $ | 17,647 | | $ | 13,854 | | $ | 3,984 | | $ | 49,263 |
Income from operations was as follows:
| | | | | | | | | |
(in thousands) | | 2013 | | 2012 | | 2011 |
Income from operations: | | | | | | | | | |
United States | | $ | 43,743 | | $ | 37,743 | | $ | 19,045 |
Germany | | | 302 | | | 1,305 | | | 1,509 |
Other Europe | | | 7,849 | | | 5,415 | | | 6,645 |
Asia Pacific | | | 30,499 | | | 16,528 | | | 7,152 |
Subtotal | | | 82,393 | | | 60,991 | | | 34,351 |
Inter-segment elimination | | | (1,532) | | | (420) | | | 551 |
Total | | $ | 80,861 | | $ | 60,571 | | $ | 34,902 |
(in thousands) | | 2016 | | 2015 | | 2014 |
Revenue by class of product and service: | | | | | | | | | |
Products | | $ | 223,544 | | $ | 257,379 | | $ | 283,339 |
Materials | | | 156,839 | | | 150,740 | | | 158,859 |
Services | | | 252,582 | | | 258,044 | | | 211,454 |
Total revenue | | $ | 632,965 | | $ | 666,163 | | $ | 653,652 |
| | | | | | | | | | | | | | | |
| | Year Ended December 31, 2016 |
| | Intercompany Sales to |
(in thousands) | | Americas | | Germany | | Other EMEA | | Asia Pacific | | Total |
Americas | | $ | 3,013 | | $ | 28,881 | | $ | 10,958 | | $ | 21,639 | | $ | 64,491 |
Germany | | | 4,123 | | | — | | | 3,850 | | | 166 | | | 8,139 |
Other EMEA | | | 61,086 | | | 3,365 | | | 5,071 | | | 5,925 | | | 75,447 |
Asia Pacific | | | 3,046 | | | — | | | 369 | | | 3,959 | | | 7,374 |
Total | | $ | 71,268 | | $ | 32,246 | | $ | 20,248 | | $ | 31,689 | | $ | 155,451 |
| | | | | | | | | | | | | | | |
| | Year Ended December 31, 2015 |
| | Intercompany Sales to |
(in thousands) | | Americas | | Germany | | Other EMEA | | Asia Pacific | | Total |
Americas | | $ | 3,073 | | $ | 36,552 | | $ | 17,133 | | $ | 17,602 | | $ | 74,360 |
Germany | | | 70 | | | — | | | 6,149 | | | 125 | | | 6,344 |
Other EMEA | | | 58,419 | | | 4,232 | | | 3,494 | | | 6,047 | | | 72,192 |
Asia Pacific | | | 3,027 | | | 4 | | | 79 | | | 3,585 | | | 6,695 |
Total | | $ | 64,589 | | $ | 40,788 | | $ | 26,855 | | $ | 27,359 | | $ | 159,591 |
| | | | | | | | | | | | | | | |
| | Year Ended December 31, 2014 |
| | Intercompany Sales to |
(in thousands) | | Americas | | Germany | | Other EMEA | | Asia Pacific | | Total |
Americas | | $ | 201 | | $ | 43,841 | | $ | 20,581 | | $ | 14,433 | | $ | 79,056 |
Germany | | | 3,217 | | | — | | | 6,742 | | | 8 | | | 9,967 |
Other EMEA | | | 42,622 | | | 3,115 | | | 2,066 | | | 2,739 | | | 50,542 |
Asia Pacific | | | 2,283 | | | — | | | — | | | 2,774 | | | 5,057 |
Total | | $ | 48,323 | | $ | 46,956 | | $ | 29,389 | | $ | 19,954 | | $ | 144,622 |
| | | | | | | | | |
(in thousands) | | 2016 | | 2015 | | 2014 |
Income (loss) from operations: | | | | | | | | | |
Americas | | $ | (53,725) | | $ | (596,283) | | $ | (24,663) |
Germany | | | 8,032 | | | 5,271 | | | 2,749 |
Other EMEA | | | (9,645) | | | (76,472) | | | 9,181 |
Asia Pacific | | | 19,591 | | | 27,432 | | | 40,131 |
Subtotal | | | (35,747) | | | (640,052) | | | 27,398 |
Inter-segment elimination | | | (2,673) | | | (1,872) | | | (1,083) |
Total | | $ | (38,420) | | $ | (641,924) | | $ | 26,315 |
| | | | | | | | | |
(in thousands) | | 2016 | | 2015 | | 2014 |
Depreciation and amortization: | | | | | | | | | |
Americas | | $ | 25,892 | | $ | 43,613 | | $ | 38,876 |
Germany | | | 881 | | | 1,011 | | | 1,075 |
Other EMEA | | | 29,065 | | | 33,585 | | | 11,427 |
Asia Pacific | | | 4,697 | | | 4,860 | | | 3,810 |
Total | | $ | 60,535 | | $ | 83,069 | | $ | 55,188 |
| | | | | | | | | |
(in thousands) | | 2013 | | 2012 | | 2011 | | 2016 | | 2015 | | 2014 |
Depreciation and amortization: | | | | | | | | | | |
United States | | $ | 21,826 | | $ | 17,049 | | $ | 7,666 | |
Capital expenditures: | | | | | | | | | | |
Americas | | | $ | 8,172 | | $ | 14,062 | | $ | 18,187 |
Germany | | | 961 | | | 178 | | | 234 | | | 307 | | | 613 | | | 235 |
Other Europe | | | 4,410 | | | 2,983 | | | 2,475 | |
Other EMEA | | | | 5,640 | | | 6,856 | | | 3,680 |
Asia Pacific | | | 3,247 | | | 1,019 | | | 718 | | | 2,448 | | | 868 | | | 625 |
Total | | $ | 30,444 | | $ | 21,229 | | $ | 11,093 | | $ | 16,567 | | $ | 22,399 | | $ | 22,727 |
| | | | | | | | | |
| | | | | | | | | | At December 31, |
(in thousands) | | 2013 | | 2012 | | 2011 | 2016 | | 2015 | | 2014 |
Capital expenditures: | | | | | | | | | | |
United States | | $ | 5,166 | | $ | 2,177 | | $ | 1,964 | |
Assets: | | | | | | | | | |
Americas | | $ | 345,412 | | $ | 382,738 | | $ | 1,018,113 |
Germany | | | 21 | | | 49 | | | 6 | | 40,547 | | | 36,782 | | | 47,524 |
Other Europe | | | 1,171 | | | 857 | | | 896 | |
Other EMEA | | | 341,616 | | | 369,302 | | | 384,830 |
Asia Pacific | | | 614 | | | 141 | | | 4 | | 121,578 | | | 103,137 | | | 79,843 |
Total | | $ | 6,972 | | $ | 3,224 | | $ | 2,870 | $ | 849,153 | | $ | 891,959 | | $ | 1,530,310 |
| | | | | | | | | |
| | At December 31, |
(in thousands) | | 2016 | | 2015 | | 2014 |
Cash and cash equivalents: | | | | | | | | | |
Americas | | $ | 105,750 | | $ | 98,913 | | $ | 245,219 |
Germany | | | 8,885 | | | 3,901 | | | 6,640 |
Other EMEA | | | 35,992 | | | 30,487 | | | 15,556 |
Asia Pacific | | | 34,320 | | | 22,342 | | | 17,447 |
Total | | $ | 184,947 | | $ | 155,643 | | $ | 284,862 |
| | | | | | | | | |
| | At December 31, |
(in thousands) | | 2016 | | 2015 | | 2014 |
Long-lived assets: | | | | | | | | | |
Americas | | $ | 96,016 | | $ | 113,364 | | $ | 570,049 |
Germany | | | 14,757 | | | 14,088 | | | 19,994 |
Other EMEA | | | 247,786 | | | 271,892 | | | 312,384 |
Asia Pacific | | | 57,644 | | | 60,148 | | | 47,193 |
Total | | $ | 416,203 | | $ | 459,492 | | $ | 949,620 |
| | | | | | |
(in thousands) | | 2013 | | 2012 |
Assets: | | | | | | |
United States | | $ | 870,208 | | $ | 501,157 |
Germany | | | 38,685 | | | 24,264 |
Other Europe | | | 120,562 | | | 86,494 |
Asia Pacific | | | 68,401 | | | 65,527 |
Total | | $ | 1,097,856 | | $ | 677,442 |
| | | | | | |
(in thousands) | | 2013 | | 2012 |
Cash and cash equivalents: | | | | | | |
United States | | $ | 286,377 | | $ | 132,890 |
Germany | | | 3,441 | | | 5,846 |
Other Europe | | | 8,915 | | | 10,247 |
Asia Pacific | | | 7,583 | | | 6,876 |
Total | | $ | 306,316 | | $ | 155,859 |
| | | | | | |
(in thousands) | | 2013 | | 2012 |
Long-lived assets: | | | | | | |
United States | | $ | 426,221 | | $ | 278,590 |
Germany | | | 23,134 | | | 10,142 |
Other Europe | | | 71,269 | | | 51,029 |
Asia Pacific | | | 50,377 | | | 50,243 |
Total | | $ | 571,001 | | $ | 390,004 |
Note 22 Commitments and Contingencies
The Company leases office spacecertain of its facilities and certain furniture and fixturesequipment under various non-cancelable operating leases. Rent expense under operating leases was $6,891, $4,968 and $2,738 for 2013, 2012 and 2011, respectively. See Note 12.
As of December 31, 2013,2016, the Company has supply commitments for printer and other product assemblies for the first quarter of 2014 that total $41,091totaled $54,937 compared to $10,894$50,663 at December 31, 2012.2015.
For certainCertain of the recentCompany’s acquisitions the Company is obligated to pay deferred purchase price totaling $4,500, due in 2014, based upon the exchange rates at the dates of acquisitions. In addition, certain of the agreements contain earnout provisions under which the sellers of the acquired businesses can earn additional amounts. The total liabilitiesliability recorded for these earnouts as of December 31, 2013 was $5,578 compared to $2,647 at December 31, 2012. See Note 32016 was $10,806. At December 31, 2015, in addition to earnout provisions, certain of the Company’s acquisitions also contained deferred purchase payment arrangements. The total liability recorded for detailsthese earnouts and deferred purchase payment arrangements totaled $9,832 at December 31, 2015.
Put Options
The minority interest shareholders of acquisitionsa certain subsidiary have the right in certain circumstances to require the Company to acquire either a portion of or all of the remaining ownership interests held by them. The owners’ ability to exercise any such “put option” right is subject to the satisfaction of certain conditions, including conditions requiring notice in advance of exercise. In addition, these rights cannot be exercised prior to a specified exercise date. The exercise of these rights at their earliest contractual date would result in obligations of the Company to fund the related amounts in 2019.
Management estimates, assuming that the subsidiary owned by the Company at December 31, 2016 performs over the relevant future periods at its forecasted earnings levels, that these rights, if exercised, could require the Company, in future periods, to pay approximately$8,872 to the owners of such put rights that require the Company to acquire such ownership interests in the relevant subsidiary. This amount has been recorded as redeemable noncontrolling interests on the balance sheet as of December 31, 2016 and related commitments. 2015. The ultimate amount payable relating to this transaction will vary because it is dependent on the future results of operations of the subject business.
Indemnification
In the normal course of business, the Company periodically enters into agreements to indemnify customers or suppliers against claims of intellectual property infringement made by third parties arising from the use of the Company’s products. Historically, costs related to these indemnification provisions have not been significant, and the Company is unable to estimate the maximum potential impact of these indemnification provisions on ourits future results of operations.
To the extent permitted under Delaware law, the Company indemnifies its directors and officers for certain events or occurrences while the director or officer is, or was, serving at the Company’s request in such capacity, subject to limited exceptions. The maximum potential amount of future payments the Company could be required to make under these indemnification obligations is unlimited; however, the Company has directors and officers insurance coverage that may enable the Company to recover future amounts paid, subject to a deductible and the policy limits. There is no assurance that the policy limits will be sufficient to cover all damages, if any.any.
Litigation
In 2008, DSM Desotech Inc. filed a complaint, which it has subsequently amended, in an action titled DSM Desotech Inc. v. 3D Systems CorporationSecurities and 3D Systems, Inc. in the United States District Court for the Northern District of Illinois (Eastern Division) asserting that theDerivative Litigation
The Company engaged in anticompetitive behavior with respect to resins used inand certain of its stereolithography machines. The complaint further asserted that the Company infringed upon two of DSM Desotech’s patents relating to stereolithography machines.
On January 31, 2013, the Court granted the Company summary judgment for all seven of the counts alleging anticompetitive behavior. On February 28, 2013, the parties filedformer executive officers have been named as defendants in a stipulation of dismissal of the remaining counts, and the Court dismissed those counts in connection with the settlement of these portions of the litigation. On March 29, 2013, DSM Desotech filed a notice of appeal to the United States Court of Appeals for the Federal Circuit regarding the Court’s granting of summary judgment in favor of the Company on all seven counts of alleged anticompetitive behavior. DSM Desotech filed its opening appellate brief on May 28, 2013. The Company filed its response appellate brief on July 11, 2013, and DSM Desotech filed its reply appellate brief on August 12, 2013. The parties participated in an oral hearing on January 6, 2014. The Company intends to continue to vigorously contest all the claims asserted by DSM Desotech.
On November 20, 2012, the Company filed a complaint in anconsolidated putative stockholder class action titled 3D Systems, Inc. v. Formlabs, Inc. and Kickstarter, Inc.lawsuit pending in the United States District Court for the District of South Carolina (Rock Hill Division) assertingCarolina. The consolidated action is styled KBC Asset Management NV v. 3D Systems Corporation, et al., Case No. 0:15-cv-02393-MGL. The Amended Consolidated Complaint (the “Complaint”), which was filed on December 9, 2015, alleges that Formlabs’defendants violated the Securities Exchange Act of 1934, as amended (the “Exchange Act”), and Kickstarter’s salesRule 10b-5 promulgated thereunder by making false and misleading statements and omissions and that the former officers are control persons under Section 20(a) of the Form 1 3D printer infringed oneExchange Act. The Complaint was filed on behalf of stockholders who purchased shares of the Company’s patents relating to stereolithography machines. Formlabscommon stock between October 29, 2013, and KickstarterMay 5, 2015 and seeks monetary damages on behalf of the purported class. Defendants filed a motion to dismiss or transfer venuethe Complaint in its entirety on FebruaryJanuary 14, 2016, which was denied by Memorandum Opinion and Order dated July 25, 2013, and the Company2016 (the “Order”). Defendants filed a first amended complaintmotion for reconsideration of the Order on March 8, 2013. On May 8, 2013,August 4, 2016, which was denied by Order dated February 24, 2017.
Nine related derivative complaints have been filed by purported Company stockholders against certain of the Company’s former executive officers and members of its Board of Directors. The Company is named as a nominal defendant in all nine actions. The derivatives complaints are styled as follows: (1) Steyn v. Reichental, et al., Case No. 2015-CP-46-2225, filed on July 27, 2015 in the Court grantedof Common Pleas for the parties’ joint motion to stay the case until September 3, 2013 to enable the parties to continue settlement discussions. On November 8, 2013, the Company voluntarily dismissed the16th Judicial Circuit, County of York, South Carolina complaint and(“Steyn”); (2) Piguing v. Reichental, et al., Case No. 2015-CP-46-2396, filed a new complainton August 7, 2015 in the Court of Common Pleas for the 16th Judicial Circuit, County of York, South Carolina (“Piguing”); (3) Booth v. Reichental, et al., Case No. 15-692-RGA, filed on August 6, 2015 in the United States District Court for the Southern District of NewDelaware; (4) Nally v. Reichental, et al., Case No. 15-cv-03756-MGL, filed on September 18, 2015 in the United States District Court for the District of South Carolina; (5) Gee v. Hull, et al., Case No. BC-610319, filed on February 17, 2016 in the Superior Court for the State of California, County of Los Angeles (“Gee”); (6) Foster v. Reichental, et al., Case No. 0:16-cv-01016-MGL, filed on April 1, 2016 in the United States District Court for the District of South Carolina; (7) Lu v. Hull, et al., Case No. BC629730, filed on August 5, 2016 in the Superior Court for the State of California, County of Los Angeles (“Lu”); (8) Howes v. Reichental, et al., Case No. 0:16-cv-2810-MGL, filed on August 11, 2016 in the United States District Court for the District of South Carolina; and (9) Ameduri v. Reichental, et al., Case No. 0:16-cv-02995-MGL, filed on September 1, 2016 in the United States District Court for the District of South Carolina. Steyn and Piguing were consolidated into one action styled as In re 3D Systems Corp. Shareholder Derivative Litig., Lead Case No. 2015-CP-46-2225 in the Court of Common Pleas for the 16th Judicial Circuit, County of York, asserting that Formlabs’ salesSouth Carolina. Gee and Lu were consolidated into one action styled as Gee v. Hull, et al., Case No. BC610319 in the Superior Court for the State of California, County of Los Angeles.
The derivative complaints allege claims for breach of fiduciary duty, abuse of control, gross mismanagement, waste of corporate assets and unjust enrichment and seek, among other things, monetary damages and certain corporate governance actions.
All of the Form 1 3D printer infringed eightderivative complaints listed above have been stayed until the earlier of the Company’s patentsclose of discovery or the deadline for appealing a dismissal in the KBC Asset Management NV securities class action.
The Company believes the claims alleged in the putative securities class action and the derivative lawsuits are without merit and intends to defend the Company and its officers and directors vigorously.
Ronald Barranco and Print3D Corporation v. 3D Systems Corporation, et. al.
On August 23, 2013, Ronald Barranco, a former Company employee, filed two lawsuits against the Company and certain officers in the United States District Court for the District of Hawaii. The first lawsuit (“Barranco I”) is captioned Ronald Barranco and Print3D Corporation v. 3D Systems Corporation, 3D Systems, Inc., and Damon Gregoire, Case No. CV 13-411 LEK RLP, and alleges seven causes of action relating to stereolithography machines.the Company’s acquisition of Print3D Corporation (of which Mr. Barranco was a 50% shareholder) and the subsequent employment of Mr. Barranco by the Company. The second lawsuit (“Barranco II”) is captioned Ronald Barranco v. 3D Systems Corporation, 3D Systems, Inc., Abraham Reichental, and Damon Gregoire, Case No. CV 13-412 LEK RLP, and alleges the same seven causes of action relating to the Company’s acquisition of certain website domains from Mr. Barranco and the subsequent employment of Mr. Barranco by the Company. Both Barranco I and Barranco II allege the Company breached certain purchase agreements in order to avoid paying Mr. Barranco additional monies pursuant to royalty and earn out provisions in the agreements. The Company and its officers timely filed responsive pleadings on October 22, 2013 seeking, inter alia, to dismiss Barranco I due to a mandatory arbitration agreement and for lack of personal jurisdiction and to dismiss Barranco II for lack of personal jurisdiction.
With regard to Barranco I, the Hawaii district court, on February 28, 2014, denied the Company’s motion to dismiss and its motion to transfer venue to South Carolina for the convenience of the parties. However, the Hawaii court recognized that the plaintiff’s claims are all subject to mandatory and binding arbitration in Charlotte, North Carolina. Because the Hawaii court was without authority to compel arbitration outside of Hawaii, the court ordered that the case be transferred to the district court encompassing Charlotte (the United States District Court for the Western District of North Carolina) so that court could compel arbitration in Charlotte. On April 17, 2014, Barranco I was transferred in to the Western District of North Carolina. Plaintiff filed a demand for arbitration on October 29, 2014. On December 9, 2014, the Company filed its answer to plaintiff’s demand for arbitration. On February 2, 2015, plaintiff filed an amended demand that removed Mr. Gregoire as a defendant from the matter, and on February 4, 2015 the Company filed its amended answer. The parties selected an arbitrator and arbitration took place in June 2015 in Charlotte, North Carolina.
On September 28, 2015, the arbitrator issued a final award in favor of Mr. Barranco with respect to two alleged breaches of contract and implied covenants arising out of the contract. The arbitrator found that the Company did not commit fraud or make any negligent misrepresentations to Mr. Barranco. Pursuant to the award, the Company is to pay approximately $11,282, which includes alleged actual damages of $7,254, fees and expenses of $2,318 and prejudgment interest of $1,710. The Company disagrees with the single arbitrator’s findings and conclusions and believes the arbitrator’s decision exceeds his authority and disregards the applicable law. As an initial response, the Company filed a motion for modification on September 30, 2015, based on mathematical errors in the computation of damages and fees. On October 16, 2015, the arbitrator issued an order denying the Company’s motion and sua sponte issuing a modified final award in favor of Mr. Barranco in the same above-referenced amounts, but making certain substantive changes to the award, which changes the Company believes were improper and outside the scope of his authority and the American Arbitration Association rules. On November 20, 2013, Formlabs2015, the Company filed a motion to dismissvacate the arbitration award in the federal court in the Western District of North Carolina. Claimants also filed a motion to confirm the arbitration award. A hearing was held on the motions on June 29, 2016 in federal court in the Western District of North Carolina. The court requested supplemental briefing by the parties, which briefs were filed on July 11, 2016.
On August 31, 2016, the court issued an Order granting in part and denying in part Plaintiff’s motion to confirm the arbitration award and for judgment, entering judgment in the principal amount of the arbitration award and denying Plaintiff’s motion for fees and costs. The court denied the Company’s claims of indirectmotion to vacate. On September 7, 2016, Plaintiff filed a motion to amend the judgment to include prejudgment interest. The Company opposed that motion and willful infringement, andthe parties submitted briefing, which is currently pending before the court. On September 28, 2016 the Company filed a memorandummotion to alter or amend the judgment. Plaintiff opposed the motion and the parties submitted briefing, which is currently pending before the court.
Notwithstanding the Company’s right to appeal, given the arbitrator’s decision, the Company recorded an $11,282 expense provision for this matter in oppositionthe quarter ended September 30, 2015. The provision is subject to adjustment based on January 6, 2014. Formlabs filed a reply on January 16, 2014.Thethe ultimate outcome of the Company’s appeal. If it is ultimately determined that money is owed following the full appellate process in federal court, the Company intends to pursuefund any amounts to be paid from cash on hand. This amount has been classified as a long-term liability given the customary timeline of an appeals process. The Company will review this classification periodically.
With regard to Barranco II, the Hawaii district court, on March 17, 2014, denied the Company’s motion to dismiss and its motion to transfer venue to South Carolina. However, the Hawaii court dismissed Count II in plaintiff’s complaint alleging breach of the employment agreement. The Company filed an answer to the complaint in the Hawaii district court on March 31, 2014. On November 19, 2014, the Company filed a motion for summary judgment on all claims which was heard on January 20, 2015. On January 30, 2015, the court entered an order granting in part and denying in Part the Company’s motion for summary judgment. The Order narrowed the plaintiff’s claim for breach of contract and dismissed the plaintiff’s claims for damagesfraud and negligent misrepresentation. As a result, Messrs. Reichental and Gregoire were dismissed from the lawsuit. The case was tried to a jury in May 2016, and on May 27, 2016 the jury found that the Company was not liable for either breach of contract or breach of the implied covenant of good faith and fair dealing. Additionally, the jury found in favor of the Company on its counterclaim against Formlabs.Mr. Barranco and determined that Mr. Barranco violated his non-competition covenant with the Company. The Court is expected to order an accounting with respect to the counterclaim.
The Company is also involved in various other legal matters incidental to its business. TheAlthough the Company believes, after consultingcannot predict the results of litigation with counsel,certainty, the Company believes that the disposition of these other legal matters will not have a material adverse effect on ourits consolidated results of operations or consolidated financial position.
Note 23 Accumulated Other Comprehensive Income (Loss)
The changes in the balances of accumulated other comprehensive income (loss) by component are as follows.follows:
| | | | | | | | | | | |
(in thousands) | Foreign currency translation adjustment | | Defined benefit pension plan | | Liquidation of non-US entity | | | Total |
Balance at December 31, 2012 | $ | 4,774 | | $ | (908) | | $ | — | | $ | 3,866 |
Other comprehensive income (loss) | | 1,918 | | | (168) | | | 173 | | | 1,923 |
Amounts reclassified to net income | | — | | | — | | | — | | | — |
Balance at December 31, 2013 | $ | 6,692 | | $ | (1,076) | | $ | 173 | | $ | 5,789 |
| | | | | | | | | | | |
(in thousands) | Foreign currency translation adjustment | | Liquidation of non-US entity | | Defined benefit pension plan | | | Total |
Balance at December 31, 2014 | $ | (22,195) | | $ | — | | $ | (2,211) | | $ | (24,406) |
Other comprehensive income (loss) | | (15,480) | | | — | | | 338 | | | (15,142) |
Balance at December 31, 2015 | | (37,675) | | | — | | | (1,873) | | | (39,548) |
Other comprehensive income (loss) | | (13,063) | | | 288 | | | (902) | | | (13,677) |
Balance at December 31, 2016 | $ | (50,738) | | $ | 288 | | $ | (2,775) | | $ | (53,225) |
The amounts presented above are in other comprehensive incomeloss and are net of taxes. For additional information about foreign currency translation, see Note 10. For additional information about the pension plan, see Note 15. See Note 3.
Note 24 Selected Quarterly Financial Data (unaudited)
The following tables set forth unaudited selected quarterly financial data:
| | | | | | | | | | | | |
| | 2016 |
| | Quarter Ended |
(in thousands, except per share amounts) | | December 31 | | September 30 | | June 30 | | March 31 |
Consolidated revenue | | $ | 165,937 | | $ | 156,362 | | $ | 158,111 | | $ | 152,555 |
Gross profit | | | 82,890 | | | 68,937 | | | 80,411 | | | 77,513 |
Total operating expenses | | | 78,817 | | | 90,954 | | | 84,128 | | | 94,272 |
Income (loss) from operations | | | 4,073 | | | (22,017) | | | (3,717) | | | (16,759) |
Provision (benefit) for income taxes | | | (1,212) | | | (2,214) | | | 1,700 | | | 1,179 |
Net income (loss) attributable to 3D Systems | | | 5,230 | | | (21,213) | | | (4,648) | | | (17,788) |
Basic and diluted net income (loss) per share | | $ | 0.05 | | $ | (0.19) | | $ | (0.04) | | $ | (0.16) |
| | | | | | | | | | | | |
| | 2015 |
| | Quarter Ended |
(in thousands, except per share amounts) | | December 31 | | September 30 | | June 30 | | March 31 |
Consolidated revenue | | $ | 183,363 | | $ | 151,574 | | $ | 170,504 | | $ | 160,722 |
Gross profit | | | 60,160 | | | 71,038 | | | 81,627 | | | 78,984 |
Total operating expenses | | | 626,081 | | | 105,675 | | | 105,469 | | | 96,508 |
Loss from operations (a) | | | (565,921) | | | (34,637) | | | (23,842) | | | (17,524) |
Provision (benefit) for income taxes | | | 29,535 | | | (3,524) | | | (10,096) | | | (6,943) |
Net loss attributable to 3D Systems | | | (596,366) | | | (32,249) | | | (13,696) | | | (13,181) |
Basic and diluted net loss per share | | $ | (5.32) | | $ | (0.29) | | $ | (0.12) | | $ | (0.12) |
| | | | | | | | | | | | |
| | | | | | | | | | | | |
| | Quarter Ended |
(in thousands, except per share amounts) | | December 31, 2013 | | September 30, 2013 | | June 30, 2013 | | March 31, 2013 |
Consolidated revenue | | $ | 154,817 | | $ | 135,717 | | $ | 120,787 | | $ | 102,079 |
Gross profit | | | 80,097 | | | 71,437 | | | 62,583 | | | 53,477 |
Total operating expenses | | | 62,121 | | | 42,867 | | | 45,787 | | | 35,958 |
Income from operations | | | 17,976 | | | 28,570 | | | 16,796 | | | 17,519 |
Income tax expense | | | 5,248 | | | 8,279 | | | 4,791 | | | 1,569 |
Net income attributable to 3D Systems | | $ | 11,224 | | $ | 17,640 | | $ | 9,343 | | $ | 5,883 |
Basic and diluted net income per share | | $ | 0.11 | | $ | 0.17 | | $ | 0.10 | | $ | 0.06 |
| | | | | | | | | | | | |
| | Quarter Ended |
(in thousands, except per share amounts) | | December 31, 2012 | | September 30, 2012 | | June 30, 2012 | | March 31, 2012 |
Consolidated revenue | | $ | 101,571 | | $ | 90,532 | | $ | 83,610 | | $ | 77,920 |
Gross profit | | | 52,496 | | | 46,879 | | | 42,968 | | | 38,853 |
Total operating expenses | | | 34,330 | | | 28,443 | | | 28,969 | | | 28,883 |
Income from operations | | | 18,166 | | | 18,436 | | | 13,999 | | | 9,970 |
Income tax expense (benefit) | | | (1,449) | | | 2,752 | | | 1,935 | | | 1,100 |
Net income | | $ | 10,912 | | $ | 13,517 | | $ | 8,324 | | $ | 6,188 |
Basic and diluted net income per share | | $ | 0.13 | | $ | 0.16 | | $ | 0.11 | | $ | 0.08 |
| | 2014 |
| | Quarter Ended |
(in thousands, except per share amounts) | | December 31 | | September 30 | | June 30 | | March 31 |
Consolidated revenue | | $ | 187,438 | | $ | 166,944 | | $ | 151,512 | | $ | 147,758 |
Gross profit | | | 89,766 | | | 79,798 | | | 72,398 | | | 75,472 |
Total operating expenses | | | 85,538 | | | 71,590 | | | 68,036 | | | 65,955 |
Income from operations | | | 4,228 | | | 8,208 | | | 4,362 | | | 9,517 |
Provision for income taxes | | | 75 | | | 1,113 | | | 694 | | | 3,559 |
Net income attributable to 3D Systems | | | 1,551 | | | 3,084 | | | 2,125 | | | 4,877 |
Basic and diluted net income per share | | $ | 0.01 | | $ | 0.03 | | $ | 0.02 | | $ | 0.05 |
| (a) | | For the quarter ended December 31, 2015, loss from operations includes $443,659 of impairment charges related to goodwill and $93,520 of impairment charges related to other intangible assets. In addition, the Company recognized cash and non-cash charges related to the end of life of the Cube printer and shift from consumer products and services, which totaled $8,771 and $18,619, respectively. See Notes 2, 4, 6 and 7 to the Consolidated Financial Statements. |
The sum of per share amounts for each of the quarterly periods presented does not necessarily equal the total presented for the year because each quarterly amount is independently calculated at the end of each period based on the net income (loss) available to common stockholders for such period and the weighted average shares of outstanding common stock for such period.
Note 25 Subsequent Events
On February 19, 2014,January 31, 2017, the Company announcedacquired 100 percent of the shares of Vertex-Global Holding B.V., a provider of dental materials worldwide under the Vertex and NextDent brands. The fair value of the consideration paid for this acquisition, net of Digital PlaySpace, Inc. (DPS), an innovative digital play platform that connects brandscash acquired, was approximately $37,562, of which approximately $34,342 was paid in cash and retailersapproximately $3,220 was paid in shares of the Company’s common stock. Vertex Dental and NextDent are manufacturers of photopolymer, thermoplastic, polymer and monomer materials for traditional and 3D printing dental applications. NextDent has developed 12 dental 3D printing materials to date and has obtained regulatory approval for use of these materials in more than 70 countries worldwide. NextDent’s portfolio of 3D printing materials allow dental professionals to produce trays, models, drilling templates, dentures, orthodontic splints, crowns and bridges with consumers around printable play activities with creativityenhanced speed, precision and design through its two leading digital properties, DigitalDollhouse.comefficiency and Dreamhouse Designer, a Facebook social gaming app. The DPS platform combines home design, gaming, and community sharinglower cost compared to deliver a vivid 3D create-and-make experience for children and their parents. The DPS acquisition is not significantconventional procedures. See Note 3 to the Company’s operating results. See Note 3.Consolidated Financial Statements.
REPORT OF INDEPENDENT REGISTERED PUBLIC ACCOUNTING FIRM
To the Stockholders and Board of Directors of
3D Systems Corporation
Rock Hill, South Carolina
The audits referred to in our report dated February 28, 2014,2017, relating to the consolidated financial statementsConsolidated Financial Statements of 3D Systems Corporation for the years ended December 31, 2013, 20122016, 2015 and 2011,2014, which is contained in Item 8 of the Form 10‑K, also included the audit of the financial statement schedule listed in the accompanying index. This financial statement schedule is the responsibility of the Company’s management. Our responsibility is to express an opinion on the financial statement schedule based upon our audits.
In our opinion, the financial statement schedule, when considered in relation to the basic consolidated financial statementsConsolidated Financial Statements taken as a whole, presents fairly, in all material respects, the information set forth therein.
/s/ BDO USA, LLP
BDO USA, LLP
Charlotte, North Carolina
February 28, 20142017
SCHEDULE II
3D Systems Corporation
Valuation and Qualifying Accounts
Years ended December 31, 2013, 20122016, 2015 and 20112014
| | | | | | | | | | | | | | | | |
Year Ended | | Item | Balance at beginning of year | | Additions charged to expense | | Charged to other accounts | | Deductions/ other | | Balance at end of year |
2013 | | Allowance for doubtful accounts | $ | 4,317 | | $ | 4,961 | | $ | (941) | | $ | (204) | | $ | 8,133 |
2012 | | Allowance for doubtful accounts | | 3,019 | | | 3,039 | | | (541) | | | (1,200) | | | 4,317 |
2011 | | Allowance for doubtful accounts | | 2,017 | | | 1,731 | | | 83 | | | (812) | | | 3,019 |
| | | | | | | | | | | | | | | | |
2013 | | Reserve for excess and obsolete inventory | $ | 3,534 | | $ | 1,801 | | $ | — | | $ | (994) | | $ | 4,341 |
2012 | | Reserve for excess and obsolete inventory | | 2,542 | | | 777 | | | — | | | 215 | | | 3,534 |
2011 | | Reserve for excess and obsolete inventory | | 2,205 | | | 431 | | | — | | | (94) | | | 2,542 |
| | | | | | | | | | | | | | | | |
2013 | | Deferred income tax asset allowance accounts | $ | — | | $ | — | | $ | — | | $ | — | | $ | — |
2012 | | Deferred income tax asset allowance accounts(a) | | 8,781 | | | 11,146 | | | — | | | (19,927) | | | — |
2011 | | Deferred income tax asset allowance accounts(a) | | 34,673 | | | 2,318 | | | — | | | (28,210) | | | 8,781 |
| | | | | | | | | | | | |
Year Ended | Item | Balance at beginning of year | | Additions charged to expense | | Other | | Balance at end of year |
2016 | Allowance for doubtful accounts | $ | 14,139 | | $ | 1,552 | | $ | (2,771) | | $ | 12,920 |
2015 | Allowance for doubtful accounts | | 10,300 | | | 3,766 | | | 73 | | | 14,139 |
2014 | Allowance for doubtful accounts | | 8,133 | | | 8,699 | | | (6,532) | | | 10,300 |
| | | | | | | | | | | | |
2016 | Deferred income tax asset valuation allowance | $ | 107,312 | | $ | 20,450 | | $ | (17,849) | | $ | 109,913 |
2015 | Deferred income tax asset valuation allowance | | — | | | 107,312 | | | — | | | 107,312 |
2014 | Deferred income tax asset valuation allowance | | — | | | — | | | — | | | — |
| (a)
| | Additions represent increases in valuation allowances against deferred tax assets; deductions represent decreases in valuation allowances against deferred tax assets.
|