(Title of Each Class) | Trading Symbol(s) | (Name of Each Exchange on Which Registered) | ||||||
Veris Residential, Inc. | ||||||||
Common Stock, $0.01 par value | VRE | New York Stock Exchange | ||||||
Veris Residential, L.P. | ||||||||
None | N/A | None | ||||||
Veris Residential, Inc. Veris Residential, L.P. Veris Residential, Inc. Veris Residential, L.P. Veris Residential, Inc. Veris Residential, L.P. Veris Residential, Inc. Veris Residential, L.P. Veris Residential, Inc.: Large accelerated filer x o o o Veris Residential, L.P.: Large accelerated filer x o o o Veris Residential, Inc. Veris Residential, L.P. EXPLANATORY NOTE business. These sources include working capital, net cash provided by operating activities, borrowings under the Company’s revolving credit facility, the issuance of secured and unsecured debt and equity securities, and proceeds received from the disposition of properties and joint ventures. FORM 10-K PART I developments. The Company expects to The Company provides a comprehensive benefits package intended to meet and exceed the needs of its employees and their families. The Company’s competitive offerings help its employees stay healthy, balance their work and personal lives, and meet their financial and retirement goals. . materials. In connection with the ownership described in more detail in Item 1A. Risk Factors – Operating Risks. SIGNIFICANT TENANTS Rockpoint's interest in VRT. The (732) 590-1010. The Company’s internet website is www.verisresidential.com. Information contained on or accessed through the Company's website is not considered part of this Annual Report nor any registration statement that incorporates this Annual Report by reference. The Company makes available free of charge on or through its website the annual reports on Form 10-K, quarterly reports on Form 10-Q, current reports on Form 8-K and amendments to those reports filed or furnished by the 07311 or to investorrelations@verisresidential.com. For further information on factors which could impact us and the statements contained herein, see Item 1A: Risk Factors. We assume no obligation to update and supplement forward-looking statements that become untrue because of subsequent events, new information or otherwise. Our performance is subject to risks associated with the canceled as a result of those proceedings, we cannot guarantee that we would be able to find alternative coverage in adequate amounts or at reasonable prices. In such case, we could experience a lapse in any or adequate insurance coverage with respect to one or more properties and be exposed to potential losses relating to any claims that may arise during such period of lapsed or inadequate coverage. We cannot guarantee that material losses in excess of insurance proceeds will not occur in the future. : A portion of our operating expenses is sensitive to inflation. These include expenses for property-related contracted services such as janitorial and engineering services, utilities, repairs and maintenance, and insurance. Property taxes are also impacted by inflationary changes as taxes are regularly reassessed based on changes in the fair value of our properties. We also have ground lease expenses in certain of our properties. Ground lease costs are contractual, but in some cases, lease payments reset every few years based on changes of consumer price indexes. reducing the number of suitable investment opportunities offered to us; Although we believe that our properties are substantially in compliance with present requirements, noncompliance with the ADA or related laws or regulations could result in the United States government imposing fines or private litigants being awarded damages against us. Such costs may adversely affect our ability to make distributions or payments to our investors. results could be adversely impacted. Property ownership through joint ventures could subject us to the contrary business objectives of our co-venturers: We : The price of commodities and skilled labor for our construction projects may increase unpredictably due to external factors, including, but not limited to, performance of third-party suppliers and contractors; overall market supply and demand; government regulation; international trade; and changes in general business, economic, or political conditions. As a result, the costs of raw construction materials and skilled labor required for the completion of our development and redevelopment projects may fluctuate significantly from time to time. sell its office properties that are held or may be designated for sale promptly or on favorable terms, which could have a material adverse effect on the Company’s financial condition. As of December 31, entity. sector, the Company may become increasingly dependent on non-executive personnel with residential development and leasing expertise to effectively execute the Company’s long-term strategy. If the General Partner’s ownership interest in the Operating Partnership were to drop below 85 percent as the result of future issuances of partnership units, then the General Partner’s inability to take any of the foregoing actions without the consent of some of the limited partners could have a material adverse effect on the Company’s ability to complete any of those transactions and negatively impact the Company’s business and operations. Ownership Limit: In order to preserve the General Partner's status as a real estate investment trust under the IRS Code, its charter generally prohibits any single stockholder, or any group of affiliated stockholders, from beneficially owning more than 9.8 percent of its outstanding capital stock unless its Board of Directors waives or modifies this ownership limit. Consequences of the General Partner's failure to qualify as a real estate investment trust could adversely affect our financial condition. OTHER RISKS external cybersecurity resources. The CISO has over 30 years of experience in corporate enterprise infrastructure and data security management held at a senior management level, acting in both a corporate as well as consulting role within many highly regulated industries. The CISO is responsible for having successfully developed and implemented several cyber security programs within prominent companies within the retail, financial and life science sectors. Multifamily Rental Properties 2021 2021 Average Net % Leased Base Rent Percentage Base Rent Year Rentable Area 12/31/21 ($000’s) of Total 2021 Per Home Location Built (SF/Units/Rooms) (%) (a) (b) (c) Base Rent (%) ($) (c) (d) NEW JERSEY The Upton (g) Short Hills, NJ 2021 193 99.5 4,259 1.60 2,205 BLVD 475 N Jersey City, NJ 2011 243 95.9 8,344 3.14 2,984 BLVD 475 S Jersey City, NJ 2011 280 96.8 8,342 3.14 2,565 BLVD 425 Jersey City, NJ 2003 412 95.6 12,348 4.65 2,612 BLVD 401 Jersey City, NJ 2016 311 96.2 10,162 3.83 2,832 Liberty Towers Jersey City, NJ 2003 648 95.5 21,663 8.16 2,916 Soho Lofts Jersey City, NJ 2017 377 97.1 14,297 5.39 3,255 Riverhouse11 at Port Imperial Weehawken, NJ 2018 295 97.6 10,553 3.98 3,054 Riverhouse9 at Port Imperial (g) Weehawken, NJ 2021 313 94.6 2,899 1.09 1,619 Signature Place Morris Plains, NJ 2018 197 99.0 5,650 2.12 2,415 Total New Jersey Multifamily Rental 3,269 96.5 98,517 37.10 2,701 NEW YORK Quarry Place at Tuckahoe Eastchester, NY 2016 108 97.2 4,118 1.55 3,268 Total New York Multifamily Rental 108 97.2 4,118 1.55 3,268 MASSACHUSETTS The Emery at Overlook Ridge Revere, MA 2020 326 96.0 7,487 2.82 1,993 Portside at Pier One East Boston, MA 2015 181 92.3 5,367 2.02 2,678 Portside 5/6 East Boston, MA 2018 296 96.9 8,766 3.30 2,545 145 Front at City Square Worcester, MA 2018 365 94.6 8,262 3.11 1,923 Total Massachusetts Multifamily Rental 1,168 96.3 29,882 11.25 2,213 TOTAL MULTIFAMILY PROPERTIES 4,545 96.4 132,517 49.90 2,511 the joint ventures. Office Properties 2021 2021 2021 Average Average Net % Leased Base Rent Percentage Base Rent Effective Rent Year Rentable Area 12/31/21 ($000’s) of Total 2021 Per Sq. Ft. Per Sq. Ft. Property Location Location Built (SF/Units/Rooms) (%) (a) (b) (c) Base Rent (%) ($) (c) (e) ($) (c) (f) 111 River Street (h) Hoboken, NJ 2002 566,215 81.3 21,041 7.93 45.71 42.03 Harborside Plaza 2 Jersey City, NJ 1990 761,200 78.6 24,307 9.16 40.63 34.31 Harborside Plaza 3 (c) Jersey City, NJ 1990 726,022 94.3 23,220 8.75 33.92 28.66 Harborside Plaza 5 Jersey City, NJ 2002 977,225 42.8 23,380 8.81 55.90 49.81 Harborside Plaza 6 Jersey City, NJ 2000 231,856 20.5 2,966 1.11 62.40 60.59 101 Hudson Street (c) (h) Jersey City, NJ 1992 1,246,283 83.1 32,089 12.11 30.98 25.42 23 Main Street Holmdel, NJ 1977 350,000 100.0 4,566 1.72 13.05 10.31 TOTAL OFFICE PROPERTIES (q) 4,858,801 74.0 (i) 131,569 49.59 36.60 31.48 Retail/Garage Properties 100 Avenue at Port Imperial (j) (k) Weehawken, NJ 2016 8,400 100.0 273 0.10 32.50 31.19 500 Avenue at Port Imperial (l) Weehawken, NJ 2013 18,064 88.1 682 0.26 42.85 37.51 Port Imperial North Retail West New York, NJ 2008 30,745 58.0 402 0.15 22.54 18.56 TOTAL RETAIL/GARAGE PROPERTIES 57,209 73.7 1,357 0.51 32.20 28.23 Hotel Properties Envue Autograph Collection Weehawken, NJ 2019 208 - (m) - - - Residence Inn at Port Imperial Weehawken, NJ 2018 164 - (n) - - - TOTAL HOTEL PROPERTIES 372 - - - - - TOTAL COMMERCIAL PROPERTIES 74.0 (i) 132,926 50.10 36.54 31.43 TOTAL PROPERTIES 265,443 (o)(p) 100.00 (dollars in thousands) Expected Costs Property Development Incurred Development Initial Property Location Type # of Units Costs to Date Start Occupancy Haus 25 - 25 Christopher Columbus Jersey City, NJ Multifamily 750 $ 469,510 $ 424,963 1Q 2019 2Q 2022 750 $ 469,510 $ 424,963 Percent Leased (%) December 31, Multifamily Commercial (a)(b) 2021 96.4 74.0 2020 85.4 78.7 2019 92.1 80.7 (c) 2018 94.2 83.2 (c) 2017 95.8 87.6 (c) (a)Percentage OCCUPANCY Percentage of Annualized Company Square Percentage Year of Number of Base Rental Annualized Base Feet Total Company Lease Properties (a) Revenue ($) (b) Rental Revenue (%) Leased Leased Sq. Ft. (%) Expiration John Wiley & Sons Inc. 1 10,888,238 9.1 290,353 8.6 2033 (c) MUFG Bank Ltd. 1 9,939,269 8.3 237,350 7.0 2029 (d) Merrill Lynch Pierce Fenner 1 9,417,902 7.9 388,207 11.4 2027 E-Trade Financial Corporation 1 5,396,412 4.5 132,265 3.9 2031 Vonage America Inc. 1 5,022,500 4.2 350,000 10.3 2023 Arch Insurance Company 1 4,326,008 3.6 106,815 3.1 2024 Sumitomo Mitsui Banking Corp 1 4,185,456 3.5 111,105 3.3 2036 Brown Brothers Harriman & Co. 1 4,017,930 3.4 114,798 3.4 2026 First Data Corporation 1 3,773,775 3.2 88,374 2.6 (e) TP ICAP Americas Holdings Inc 1 3,446,090 2.9 100,759 3.0 (f) Cardinia Real Estate LLC 1 3,174,886 2.7 79,771 2.3 2032 New Jersey City University 1 3,010,854 2.5 84,929 2.5 2035 Zurich American Ins. Co. 1 2,915,378 2.4 64,414 1.9 2032 BETMGM, LLC 1 2,800,234 2.3 71,343 2.1 (g) Amtrust Financial Services 1 2,614,328 2.3 76,892 2.3 2023 Totals 74,929,260 62.8 2,297,375 67.7 Average Annual Base Percentage Of Rent Per Net Net Rentable Total Leased Annualized Rentable Percentage Of Area Subject Square Feet Base Rental Square Foot Annual Base Number Of To Expiring Represented Revenue Under Represented Rent Under Year Of Leases Leases By Expiring Expiring By Expiring Expiring Expiration Expiring (a) (Sq. Ft.) Leases (%) Leases ($) (b) Leases ($) Leases (%) 2022 15 131,204 3.9 5,170,429 39.41 4.3 2023 13 676,899 19.9 17,669,977 26.10 14.8 2024 15 260,680 7.7 10,775,435 41.34 9.0 2025 10 108,891 3.2 3,322,280 30.51 2.8 2026 13 255,355 7.5 9,917,380 38.84 8.3 2027 8 446,554 13.1 11,759,843 26.33 9.9 2028 5 88,842 2.6 3,517,877 39.60 2.9 2029 5 311,594 9.2 13,355,949 42.86 11.2 2030 1 13,662 0.4 696,762 51.00 0.6 2031 3 147,814 4.4 6,027,109 40.77 5.1 2032 13 377,451 11.1 15,417,965 40.85 12.9 2033 and thereafter 15 576,553 17.0 21,711,742 37.66 18.2 Totals/Weighted Average 116 3,395,499 (c)(d) 100.0 119,342,748 35.15 100.0 The following table lists the Company’s markets, based on annualized contractual base rent of the Company's Consolidated Percentage Of Annualized Base Annualized Rental Revenue Base Rental Market Property Type ($) (a) (b) Revenue (%) Hudson County, NJ Commercial/Multifamily 241,401,737 80.2 Suffolk/Worcester Counties, MA Multifamily 34,225,284 11.4 Morris/Essex Counties, NJ Multifamily 15,278,895 5.1 Monmouth County, NJ Commercial 5,022,500 1.7 Westchester County, NY Multifamily 4,946,124 1.6 Totals 300,874,540 100.0 For the Year Ended December 31, 2021 High Low Close First Quarter $ 16.80 $ 11.74 $ 15.48 Second Quarter $ 17.95 $ 15.28 $ 17.15 Third Quarter $ 18.40 $ 16.04 $ 17.12 Fourth Quarter $ 19.90 $ 16.45 $ 18.38 For the Year Ended December 31, 2020 High Low Close First Quarter $ 23.89 $ 13.83 $ 15.23 Second Quarter $ 18.83 $ 12.90 $ 15.29 Third Quarter $ 15.85 $ 12.14 $ 12.62 Fourth Quarter $ 15.06 $ 10.35 $ 12.46 On The following graph compares total stockholder returns from the last five fiscal years to the Standard & Poor’s 500 Index (“S&P 500”) and to the National Association of Real Estate Investment Trusts, Inc.’s FTSE NAREIT Equity REIT Index (“NAREIT”). The graph assumes that the value of the investment in the General Partner's Common Stock and in the S&P 500 and NAREIT indices was $100 at December 31, Critical Accounting Policies and Estimates On a periodic basis, management assesses whether there are any indicators, including property operating performance, changes in anticipated holding period, and general market conditions, that the value of the Company’s rental properties held for use may be impaired. Results From Operations Year Ended December 31, Years Ended December 31, Dollar Percent (dollars in thousands) 2021 2020 Change Change Revenue from rental operations and other: Revenue from leases $ 282,791 $ 272,970 $ 9,821 3.6 % Parking income 15,003 15,604 (601) (3.9) Hotel income 10,618 4,287 6,331 147.7 Other income 11,309 9,311 1,998 21.5 Total revenues from rental operations 319,721 302,172 17,549 5.8 Property expenses: Real estate taxes 47,859 45,801 2,058 4.5 Utilities 14,802 13,717 1,085 7.9 Operating services 71,851 68,313 3,538 5.2 Total property expenses 134,512 127,831 6,681 5.2 Non-property revenues: Real estate services 9,596 11,390 (1,794) (15.8) Total non-property revenues 9,596 11,390 (1,794) (15.8) Non-property expenses: Real estate services expenses 12,857 13,555 (698) (5.1) General and administrative 57,198 71,058 (13,860) (19.5) Dead deal and transaction-related costs 12,221 2,583 9,638 373.1 Depreciation and amortization 111,618 122,035 (10,417) (8.5) Property impairments 13,467 36,582 (23,115) (63.2) Land and other impairments, net 23,719 16,817 6,902 41.0 Total non-property expenses 231,080 262,630 (31,550) (12.0) Operating income (loss) (36,275) (76,899) 40,624 52.8 Other (expense) income: Interest expense (65,192) (80,991) 15,799 19.5 Interest and other investment income (loss) 524 43 481 1,118.6 Equity in earnings (loss) of unconsolidated joint ventures (4,251) (3,832) (419) (10.9) Realized gains (losses) and unrealized losses on disposition of rental property, net 3,022 5,481 (2,459) (44.9) Gain on disposition of developable land 2,115 5,787 (3,672) (63.5) Gain on sale from unconsolidated joint ventures (1,886) 35,184 (37,070) (105.4) Gain (loss) from extinguishment of debt, net (47,078) (272) (46,806) (17,208.1) Total other (expense) income (112,746) (38,600) (74,146) (192.1) Income (loss) from continuing operations (149,021) (115,499) (33,522) (29.0) Discontinued operations: Income from discontinued operations 13,930 70,700 (56,770) (80.3) Realized gains (losses) and unrealized gains (losses) on disposition of rental property and impairments, net 25,552 11,201 14,351 128.1 Total discontinued operations 39,482 81,901 (42,419) (51.8) Net income (loss) $ (109,539) $ (33,598) $ (75,941) (226.0) % The following is a summary of the changes in revenue from rental operations and other, and property expenses, in Total Same-Store Acquired and Developed Properties Company Properties Properties Sold in 2020 and 2021 Dollar Percent Dollar Percent Dollar Percent Dollar Percent (dollars in thousands) Change Change Change Change Change Change Change Change Revenue from rental operations and other: Revenue from leases $ 9,821 3.6 % $ 1,638 0.6 % $ 13,014 4.8 % $ (4,831) (1.8) % Parking income (601) (3.9) (1,074) (7.0) 587 3.8 (114) (0.7) Hotel income 6,331 147.7 6,331 147.7 - - - - Other income 1,998 21.5 1,588 17.1 449 4.8 (39) (0.4) Total $ 17,549 5.8 % $ 8,483 2.8 % $ 14,050 4.6 % $ (4,984) (1.6) % Property expenses: Real estate taxes $ 2,058 4.5 % $ 1,704 3.7 % $ 1,496 3.3 % $ (1,142) (2.5) % Utilities 1,085 7.9 905 6.6 566 4.1 (386) (2.8) Operating services 3,538 5.2 1,661 2.5 2,756 4.0 (879) (1.3) Total $ 6,681 5.2 % $ 4,270 3.3 % $ 4,818 3.8 % $ (2,407) (1.9) % OTHER DATA: Number of Consolidated Properties 27 23 4 39 Commercial Square feet (in thousands) 4,916 4,885 31 5,755 Multifamily portfolio (number of units) 4,545 3,713 832 1,025 Years Ended December 31, Dollar Percent (dollars in thousands) 2020 2019 Change Change Revenue from rental operations and other: Revenues from leases $ 272,970 $ 302,409 $ (29,439) (9.7) % Parking income 15,604 21,857 (6,253) (28.6) Hotel income 4,287 9,841 (5,554) (56.4) Other income 9,311 9,222 89 1.0 Total revenues from rental operations 302,172 343,329 (41,157) (12.0) Property expenses: Real estate taxes 45,801 44,785 1,016 2.3 Utilities 13,717 17,881 (4,164) (23.3) Operating services 68,313 70,409 (2,096) (3.0) Total property expenses 127,831 133,075 (5,244) (3.9) Non-property revenues: Real estate services 11,390 13,873 (2,483) (17.9) Total non-property revenues 11,390 13,873 (2,483) (17.9) Non-property expenses: Real estate services expenses 13,555 15,918 (2,363) (14.8) General and administrative 71,058 59,805 11,253 18.8 Dead deal and transaction-related costs 2,583 - 2,583 - Depreciation and amortization 122,035 133,597 (11,562) (8.7) Property impairments 36,582 - 36,582 - Land and other impairments, net 16,817 32,444 (15,627) (48.2) Total non-property expenses 262,630 241,764 20,866 8.6 Operating income (76,899) (17,637) (59,262) (336.0) Other (expense) income: Interest expense (80,991) (90,569) 9,578 10.6 Interest and other investment income 43 2,412 (2,369) (98.2) Equity in earnings (loss) of unconsolidated joint ventures (3,832) (1,319) (2,513) (190.5) Gain on change of control of interests - 13,790 (13,790) (100.0) Realized gains (losses) and unrealized losses on disposition of rental property, net 5,481 343,102 (337,621) (98.4) Gain on disposition of developable land 5,787 522 5,265 1,008.6 Gain on sale from unconsolidated joint ventures 35,184 903 34,281 3,796.3 Gain (loss) from extinguishment of debt, net (272) 1,648 (1,920) (116.5) Total other (expense) income (38,600) 270,489 (309,089) (114.3) Income (loss) from continuing operations (115,499) 252,852 (368,351) (145.7) Discontinued operations: Income from discontinued operations 70,700 24,334 46,366 190.5 Realized gains (losses) and unrealized losses on disposition of rental property and impairments, net 11,201 (133,350) 144,551 108.4 Total discontinued operations, net 81,901 (109,016) 190,917 175.1 Net income (loss) $ (33,598) $ 143,836 $ (177,434) (123.4) % Total Same-Store Acquired and Developed Properties Company Properties Properties Sold in 2019 and 2020 Dollar Percent Dollar Percent Dollar Percent Dollar Percent (dollars in thousands) Change Change Change Change Change Change Change Change Revenue from rental operations and other: Revenue from leases $ (29,439) (9.7) % $ (8,595) (2.8) % $ 28,928 9.6 % $ (49,772) (16.5) % Parking income (6,253) (28.6) (6,666) (30.5) 1,446 6.6 (1,033) (4.7) Hotel Income (5,554) (56.4) (3,138) (31.8) (2,416) (24.6) - - Other income 89 1.0 1,963 21.3 694 7.5 (2,568) (27.8) Total $ (41,157) (12.0) % $ (16,436) (4.8) % $ 28,652 8.3 % $ (53,373) (15.5) % Property expenses: Real estate taxes $ 1,016 2.3 % $ 1,409 3.2 % $ 7,354 16.4 % $ (7,747) (17.3) % Utilities (4,164) (23.3) (1,236) (6.9) 1,289 7.2 (4,217) (23.6) Operating services (2,096) (3.0) (4,794) (6.8) 11,429 16.2 (8,731) (12.4) Total $ (5,244) (3.9) % $ (4,621) (3.5) % $ 20,072 15.1 % $ (20,695) (15.5) % OTHER DATA: Number of Consolidated Properties 26 20 6 104 Commercial Square feet (in thousands) 4,916 4,885 31 10,916 Multifamily portfolio (number of units) 4,039 2,377 1,662 1,745 transaction-related expenses. The Company expects to meet its short-term liquidity requirements generally through its working capital, which may include proceeds from the sales of rental properties and land, net cash provided by operating activities and Distribution Requirements applicable maturity dates. The following is a breakdown of the Company’s debt between fixed and variable-rate financing as of December 31, 2023: Balance Weighted Average Weighted Average ($000’s) % of Total Interest Rate (a) Maturity in Years Fixed Rate Secured $ 1,682,662 70.10 % 3.71 % 5.25 Variable Rate Secured Debt 717,628 29.90 % 3.32 % 2.74 Totals/Weighted Average: $ 2,400,290 100.00 % 3.60 % (b) 4.50 Unamortized deferred financing costs (11,220) Total Debt, Net $ 2,389,070 (a) Scheduled Principal Weighted Avg. Amortization Maturities Total Effective Interest Rate of Period ($000’s) ($000’s) ($000’s) Future Repayments (a) 2022 $ 550 $ 87,175 $ 87,725 2.24 % 2023 2,047 147,998 150,045 3.55 % 2024 (b) 3,403 711,453 714,856 3.77 % 2025 3,300 - 3,300 3.98 % 2026 3,407 733,000 736,407 3.47 % Thereafter 9,415 698,542 707,957 3.73 % Sub-total 22,122 2,378,168 2,400,290 3.60 % Unamortized deferred financing costs (11,220) - (11,220) - Totals/Weighted Average $ 10,902 $ 2,378,168 $ 2,389,070 3.60 % (c) Interest Rate - Applicable Interest Rate - Basis Points Applicable Above LIBOR for Basis Points Alternate Base Facility Fee Total Leverage Ratio Above LIBOR Rate Loans Basis Points <45% 125.0 25.0 20.0 ≥45% and <50% 130.0 30.0 25.0 ≥50% and <55% (ratio through May 6, 2021) 135.0 35.0 30.0 ≥55% 160.0 60.0 35.0 February 15, 2024. Common Common Units/Vested Stock LTIP Units Total Outstanding at January 1, 2021 90,712,417 9,649,031 100,361,448 Restricted stock issued 55,554 - 55,554 Conversion of deferred stock units for common stock - - - Common units redeemed for common stock 175,257 (175,257) - Conversion of LTIP units for common units - 205,434 205,434 Vested RSU/LTIP units 2,501 65,176 67,677 Cancellation of restricted stock (262) - (262) Shares issued under Dividend Reinvestment and Stock Purchase Plan 2,541 - 2,541 Redemption of common units - (730,850) (730,850) Outstanding at December 31, 2021 90,948,008 9,013,534 99,961,542 Common Common Units/Vested Stock LTIP Units Total Outstanding at January 1, 2020 90,595,176 9,612,064 100,207,240 Restricted stock issued 52,974 - 52,974 Conversion of deferred stock units for common stock 61,277 - 61,277 Common units redeemed for common stock - - - Conversion of LTIP units for common units - 38,626 38,626 Vested LTIP Units - 136,957 136,957 Cancellation of common units - (1) (1) Shares issued under Dividend Reinvestment and Stock Purchase Plan 2,990 - 2,990 Redemption of common units - (138,615) (138,615) Outstanding at December 31, 2020 90,712,417 9,649,031 100,361,448 Dividend Reinvestment and Stock Purchase Plan Off-Balance Sheet Arrangements In January 2024, the joint venture repaid the $17.2 million loan. Year Ended December 31, 2021 2020 2019 Net income (loss) available to common shareholders $ (119,042) $ (51,387) $ 111,861 Add (deduct): Noncontrolling interests in Operating Partnership (15,469) (13,277) 23,724 Noncontrolling interests in discontinued operations 3,590 7,878 (10,460) Real estate-related depreciation and amortization on continuing operations (a) 120,416 132,816 144,932 Real estate-related depreciation and amortization on discontinued operations 974 4,806 70,614 Property impairments on continuing operations 13,467 36,582 - Property impairments on discontinued operations - - 11,696 Impairment of unconsolidated joint venture investment - - - (included in Equity in earnings) (2) 2,562 3,661 Gain on change of control of interests - - (13,790) Gain on sale from unconsolidated joint ventures 1,886 (35,184) (903) Continuing operations: Realized (gains) losses and unrealized (gains) losses on disposition of rental property, net (3,022) (5,481) (343,102) Discontinued operations: Realized (gains) losses and unrealized (gains) losses on disposition of rental property, net (25,552) (11,201) 117,898 Funds from operations available to common stock and Operating Partnership unitholders (b) $ (22,754) $ 68,114 $ 116,131 yields. Approximately December 31, 2021 Debt, including current portion Fair ($s in thousands) 2022 2023 2024 2025 2026 Thereafter Sub-total Other (a) Total Value Fixed Rate $ 550 $ 61,045 $ 311,403 $ 3,300 $ 598,407 $ 707,957 $ 1,682,662 $ (7,309) $ 1,675,353 $ 1,701,632 Average Interest Rate 4.85 % 3.59 % 3.43 % 3.98 % 3.85 % 3.73 % 3.71 % Variable Rate $ 87,175 $ 89,000 $ 403,453 $ - $ 138,000 $ - $ 717,628 $ (3,911) $ 713,717 $ 713,717 While the Company has not experienced any significant credit losses, in liquidity, including its ability to pay its debt obligations. Management’s Report on Internal Control Over Financial Reporting. Internal control over financial reporting, as such term is defined in Rules 13a-15(f) and 15d-15(f) under the Exchange Act, is a process designed by, or under the supervision of, the General Partner’s chief executive officer and chief financial officer, or persons performing similar functions, and effected by the General Partner’s board of directors, management and other personnel, to provide reasonable assurance regarding the reliability of financial reporting and the preparation of financial statements for external purposes in accordance with generally accepted accounting principles. The General Partner’s management, with the participation of the General Partner’s chief executive officer and chief financial officer, has established and maintained policies and procedures designed to maintain the adequacy of the General Partner’s internal control over financial reporting, and includes those policies and procedures that: Management’s Report on Internal Control Over Financial Reporting. Internal control over financial reporting, as such term is defined in Rules 13a-15(f) and 15d-15(f) under the Exchange Act, is a process designed by, or under the supervision of, the General Partner’s chief executive officer and chief financial officer, or persons performing similar functions, and effected by the General Partner’s board of directors, management and other personnel, to provide reasonable assurance regarding the reliability of financial reporting and the preparation of financial statements for external purposes in accordance with generally accepted accounting principles. The General Partner’s management, with the participation of the General Partner’s chief executive officer and chief financial officer, has established and maintained policies and procedures designed to maintain the adequacy of the Operating Partnership’s internal control over financial reporting, and includes those policies and procedures that: ITEM 12. SECURITY OWNERSHIP OF CERTAIN BENEFICIAL OWNERS AND MANAGEMENT AND RELATED STOCKHOLDER MATTERS Reports of Independent Registered Public Accounting Firm (PCAOB ID 238) Schedule III – Real Estate Investments and Accumulated Depreciation as of December 31, Report of Independent Registered Public Accounting Firm matter below, providing a separate 1994. Report of Independent Registered Public Accounting Firm it relates. December 31, December 31, ASSETS 2021 2020 Rental property Land and leasehold interests $ 494,935 $ 639,636 Buildings and improvements 3,375,266 3,743,831 Tenant improvements 106,654 171,623 Furniture, fixtures and equipment 100,011 83,553 4,076,866 4,638,643 Less – accumulated depreciation and amortization (583,416) (656,331) 3,493,450 3,982,312 Real estate held for sale, net 618,646 656,963 Net investment in rental property 4,112,096 4,639,275 Cash and cash equivalents 31,754 38,096 Restricted cash 19,701 14,207 Investments in unconsolidated joint ventures 137,772 162,382 Unbilled rents receivable, net 72,285 84,907 Deferred charges, goodwill and other assets, net 151,347 199,541 Accounts receivable 2,363 9,378 Total assets $ 4,527,318 $ 5,147,786 LIABILITIES AND EQUITY Senior unsecured notes, net $ - $ 572,653 Revolving credit facility and term loans 148,000 25,000 Mortgages, loans payable and other obligations, net 2,241,070 2,204,144 Dividends and distributions payable 384 1,493 Accounts payable, accrued expenses and other liabilities 134,977 194,717 Rents received in advance and security deposits 26,396 34,101 Accrued interest payable 5,760 10,001 Total liabilities 2,556,587 3,042,109 Commitments and contingencies Redeemable noncontrolling interests 521,313 513,297 Equity: Veris Residential, Inc. stockholders’ equity: Common stock, $0.01 par value, 190,000,000 shares authorized, 90,948,008 and 90,712,417 shares outstanding 909 907 Additional paid-in capital 2,530,383 2,528,187 Dividends in excess of net earnings (1,249,319) (1,130,277) Accumulated other comprehensive income (loss) 9 - Total Veris Residential, Inc. stockholders’ equity 1,281,982 1,398,817 Noncontrolling interests in subsidiaries: Operating Partnership 127,053 148,791 Consolidated joint ventures 40,383 44,772 Total noncontrolling interests in subsidiaries 167,436 193,563 Total equity 1,449,418 1,592,380 Total liabilities and equity $ 4,527,318 $ 5,147,786 Year Ended December 31, REVENUES 2021 2020 2019 Revenue from leases $ 282,791 $ 272,970 $ 302,409 Real estate services 9,596 11,390 13,873 Parking income 15,003 15,604 21,857 Hotel income 10,618 4,287 9,841 Other income 11,309 9,311 9,222 Total revenues 329,317 313,562 357,202 EXPENSES Real estate taxes 47,859 45,801 44,785 Utilities 14,802 13,717 17,881 Operating services 71,851 68,313 70,409 Real estate services expenses 12,857 13,555 15,918 General and administrative 57,198 71,058 59,805 Dead deal and transaction-related costs 12,221 2,583 - Depreciation and amortization 111,618 122,035 133,597 Property impairments 13,467 36,582 - Land and other impairments, net 23,719 16,817 32,444 Total expenses 365,592 390,461 374,839 OTHER (EXPENSE) INCOME Interest expense (65,192) (80,991) (90,569) Interest and other investment income (loss) 524 43 2,412 Equity in earnings (loss) of unconsolidated joint ventures (4,251) (3,832) (1,319) Gain on change of control of interests - - 13,790 Realized gains (losses) and unrealized gains (losses) on disposition of rental property, net 3,022 5,481 343,102 Gain on disposition of developable land 2,115 5,787 522 Gain (loss) on sale of unconsolidated joint venture interests (1,886) 35,184 903 Gain (loss) from extinguishment of debt, net (47,078) (272) 1,648 Total other income (expense) (112,746) (38,600) 270,489 Income (loss) from continuing operations (149,021) (115,499) 252,852 Discontinued operations: Income from discontinued operations 13,930 70,700 24,334 Realized gains (losses) and unrealized gains (losses) on disposition of rental property and impairments, net 25,552 11,201 (133,350) Total discontinued operations, net 39,482 81,901 (109,016) Net income (loss) (109,539) (33,598) 143,836 Noncontrolling interests in consolidated joint ventures 4,595 2,695 3,904 Noncontrolling interests in Operating Partnership of income from continuing operations 15,469 13,277 (23,724) Noncontrolling interests in Operating Partnership in discontinued operations (3,590) (7,878) 10,460 Redeemable noncontrolling interests (25,977) (25,883) (22,615) Net income (loss) available to common shareholders $ (119,042) $ (51,387) $ 111,861 Basic earnings per common share: Income (loss) from continuing operations $ (1.79) $ (1.51) $ 2.04 Discontinued operations 0.40 0.81 (1.09) Net income (loss) available to common shareholders $ (1.39) $ (0.70) $ 0.95 Diluted earnings per common share: Income (loss) from continuing operations $ (1.79) $ (1.51) $ 2.04 Discontinued operations 0.40 0.81 (1.09) Net income (loss) available to common shareholders $ (1.39) $ (0.70) $ 0.95 Basic weighted average shares outstanding 90,839 90,648 90,557 Diluted weighted average shares outstanding 99,893 100,260 100,689 Year Ended December 31, 2021 2020 2019 Net income (loss) $ (109,539) $ (33,598) $ 143,836 Other comprehensive income (loss): Net unrealized gain (loss) on derivative instruments for interest rate swaps 10 (16) (10,158) Comprehensive (income) loss $ (109,529) $ (33,614) $ 133,678 Comprehensive (income) loss attributable to noncontrolling interests in consolidated joint ventures 4,595 2,695 3,904 Comprehensive (income) loss attributable to redeemable noncontrolling interests (25,977) (25,883) (22,615) Comprehensive (income) loss attributable to noncontrolling interests in Operating Partnership 11,878 5,433 (12,284) Comprehensive income (loss) attributable to common shareholders $ (119,033) $ (51,369) $ 102,683 The accompanying notes are an integral part of these consolidated financial statements. Accumulated Additional Dividends in Other Noncontrolling Common Stock Paid-In Excess of Comprehensive Interests Shares Par Value Capital Net Earnings Income (Loss) in Subsidiaries Total Equity Balance at January 1, 2019 90,320 $ 903 $ 2,561,503 $ (1,084,518) $ 8,770 $ 210,523 $ 1,697,181 Net income (loss) - - - 111,861 - 31,975 143,836 Common stock dividends - - - (72,401) - - (72,401) Common unit distributions - - - - - (8,705) (8,705) Redeemable noncontrolling interest - - (25,885) - - (25,470) (51,355) Change in noncontrolling interests in consolidated joint ventures - - (1,958) - - 9,050 7,092 Redemption of common units for common stock 38 1 704 - - (705) - Redemption of common units - - (1,665) - - (12,799) (14,464) Shares issued under Dividend - Reinvestment and Stock Purchase Plan 2 - 39 - - - 39 Directors' deferred compensation plan 194 2 317 - - - 319 Stock compensation 41 - 627 - - 7,534 8,161 Cancellation of unvested LTIP units - - - 2,819 - (2,889) (70) Other comprehensive income - - - (390) (8,788) (980) (10,158) Rebalancing of ownership percentage between parent and subsidiaries - - 1,758 - - (1,758) - Balance at December 31, 2019 90,595 $ 906 $ 2,535,440 $ (1,042,629) $ (18) $ 205,776 $ 1,699,475 Net income (loss) - - - (51,387) - 17,789 (33,598) Common stock dividends - - - (36,261) - - (36,261) Common unit distributions - - - - - (3,509) (3,509) Redeemable noncontrolling interests - - (11,814) - - (27,137) (38,951) Change in noncontrolling interests in consolidated joint ventures - - - - - 171 171 Redemption of common units for common stock - - - - - - - Redemption of common units - - - - - (2,693) (2,693) Shares issued under Dividend Reinvestment and Stock Purchase Plan 3 - 37 - - - 37 Directors' deferred compensation plan 61 1 290 - - - 291 Stock compensation 53 - 1,614 - - 6,021 7,635 Cancellation of unvested LTIP units - - - - - (201) (201) Other comprehensive income (loss) - - - - 18 (34) (16) Rebalancing of ownership percentage between parent and subsidiaries - - 2,620 - - (2,620) - Balance at December 31, 2020 90,712 $ 907 $ 2,528,187 $ (1,130,277) $ - $ 193,563 $ 1,592,380 Net income (loss) - - - (119,042) - 9,503 (109,539) Common stock dividends - - - - - - - Common unit distributions - - - - - 645 645 Redeemable noncontrolling interests - - (7,290) - - (26,703) (33,993) Change in noncontrolling interests in consolidated joint ventures - - - - - 206 206 Redemption of common units for common stock 175 2 2,714 - - (2,716) - Redemption of common units - - - - - (11,357) (11,357) Shares issued under Dividend Reinvestment and Stock Purchase Plan 3 - 28 - - - 28 Directors' deferred compensation plan - - 314 - - - 314 Stock compensation 58 - 5,139 - - 5,708 10,847 Cancellation of restricted stock - - (123) - - - (123) Other comprehensive income (loss) - - - - 9 1 10 Rebalancing of ownership percentage between parent and subsidiaries - - 1,414 - - (1,414) - Balance at December 31, 2021 90,948 $ 909 $ 2,530,383 $ (1,249,319) $ 9 $ 167,436 $ 1,449,418 The accompanying notes are an integral part of these consolidated financial statements. December 31, CASH FLOWS FROM OPERATING ACTIVITIES 2021 2020 2019 Net income (loss) $ (109,539) $ (33,598) $ 143,836 Net income (loss) from discontinued operations (39,482) (81,901) 109,016 Net income (loss) from continuing operations (149,021) (115,499) 252,852 Adjustments to reconcile net income (loss) to net cash provided by Operating activities: Depreciation and amortization, including related intangible assets 108,839 118,345 129,725 Amortization of directors deferred compensation stock units 314 291 319 Amortization of stock compensation 10,847 7,635 8,161 Amortization of deferred financing costs 4,568 4,625 4,625 Amortization of debt discount and mark-to-market 232 (1,083) (949) Equity in (earnings) loss of unconsolidated joint ventures 4,251 3,832 1,319 Distributions of cumulative earnings from unconsolidated joint ventures 759 5,300 6,923 Gain on change of control of interests - - (13,790) Write-off transaction-related costs 7,922 - - Realized (gains) losses and unrealized (gains) losses on disposition of rental property, net (3,022) (5,481) (343,102) Gain on disposition of developable land (2,115) (5,787) (522) Property impairments 13,467 36,582 - Land and other impairments, net 23,719 16,817 32,444 (Gain) Loss from sale of investment in unconsolidated joint venture 1,886 (35,184) (903) (Gain) Loss from extinguishment of debt 47,078 272 (1,648) Changes in operating assets and liabilities: Increase in unbilled rents receivable, net (6,976) (1,135) (7,240) Increase in deferred charges, goodwill and other assets (5,022) (806) (21,921) Decrease (increase) in accounts receivable, net 5,544 (5,117) 2,132 Increase (decrease) in accounts payable, accrued expenses and other liabilities (11,268) (9,577) 1,820 (Decrease) Increase in rents received in advance and security deposits 55 (2,446) 2,002 Increase (decrease) in accrued interest payable 258 (184) 1,068 Net cash flows provided by operating activities - continuing operations 52,315 11,400 53,315 Net cash flows provided by operating activities - discontinued operations 3,800 74,022 78,527 Net cash provided by operating activities $ 56,115 $ 85,422 $ 131,842 CASH FLOWS FROM INVESTING ACTIVITIES Rental property acquisitions and related intangibles $ - $ (16,811) $ (956,040) Rental property additions and improvements (65,101) (138,688) (88,240) Development of rental property and other related costs (211,617) (295,892) (172,309) Proceeds from the sales of rental property 52,391 64,947 825,613 Proceeds from the sale of investments in unconsolidated joint ventures 3,865 64,773 4,039 Repayment of notes receivable 7,257 458 46,597 Investment in unconsolidated joint ventures (1,280) (2,959) (9,011) Distributions in excess of cumulative earnings from unconsolidated joint ventures 15,703 13,826 8,697 Net cash used in investing activities - continuing operations (198,782) (310,346) (340,654) Net cash provided by investing activities - discontinued operations 645,011 338,811 (75,421) Net cash provided by investing activities $ 446,229 $ 28,465 $ (416,075) CASH FLOW FROM FINANCING ACTIVITIES Borrowings from revolving credit facility $ 196,000 $ 212,000 $ 829,000 Repayment of revolving credit facility (73,000) (516,000) (617,000) Borrowings from term loans 150,000 - - Repayment of term loans (150,000) - (675,000) Repayment of senior unsecured notes (573,727) - - Proceeds from mortgages and loans payable 226,422 381,577 877,126 Repayment of mortgages, loans payable and other obligations (192,995) (86,561) (155,115) Acquisition of noncontrolling interests - - (5,017) (Redemption) issuance of redeemable noncontrolling interests, net - (3,153) 145,000 Payment of early debt extinguishment costs (49,874) - - Common unit redemptions (898) (2,693) (7,769) Payment of financing costs (8,874) (1,677) (12,339) (Contributions) distributions to noncontrolling interests 207 171 (466) Distributions to redeemable noncontrolling interests (25,977) (25,883) (21,883) Payment of common dividends and distributions (475) (60,532) (80,692) Net cash used in financing activities $ (503,191) $ (102,751) $ 275,845 Net (decrease) increase in cash and cash equivalents $ (847) $ 11,136 $ (8,388) Cash, cash equivalents and restricted cash, beginning of period (1) 52,302 41,166 49,554 Cash, cash equivalents and restricted cash, end of period (2) $ 51,455 $ 52,302 $ 41,166 December 31, December 31, ASSETS 2021 2020 Rental property Land and leasehold interests $ 494,935 $ 639,636 Buildings and improvements 3,375,266 3,743,831 Tenant improvements 106,654 171,623 Furniture, fixtures and equipment 100,011 83,553 4,076,866 4,638,643 Less – accumulated depreciation and amortization (583,416) (656,331) 3,493,450 3,982,312 Real estate held for sale, net 618,646 656,963 Net investment in rental property 4,112,096 4,639,275 Cash and cash equivalents 31,754 38,096 Restricted cash 19,701 14,207 Investments in unconsolidated joint ventures 137,772 162,382 Unbilled rents receivable, net 72,285 84,907 Deferred charges, goodwill and other assets, net 151,347 199,541 Accounts receivable 2,363 9,378 Total assets $ 4,527,318 $ 5,147,786 LIABILITIES AND EQUITY Senior unsecured notes, net $ - $ 572,653 Revolving credit facility and term loans 148,000 25,000 Mortgages, loans payable and other obligations, net 2,241,070 2,204,144 Distributions payable 384 1,493 Accounts payable, accrued expenses and other liabilities 134,977 194,717 Rents received in advance and security deposits 26,396 34,101 Accrued interest payable 5,760 10,001 Total liabilities 2,556,587 3,042,109 Commitments and contingencies Redeemable noncontrolling interests 521,313 513,297 Partners’ Capital: General Partner, 90,948,008 and 90,712,417 common units outstanding 1,211,790 1,330,048 Limited partners, 9,013,534 and 9,649,031 common units/LTIPs outstanding 197,236 217,560 Accumulated other comprehensive income (loss) 9 - Total Veris Residential, L.P. partners’ capital 1,409,035 1,547,608 Noncontrolling interests in consolidated joint ventures 40,383 44,772 Total equity 1,449,418 1,592,380 Total liabilities and equity $ 4,527,318 $ 5,147,786 The accompanying notes are an integral part of these consolidated financial statements. Year Ended December 31, REVENUES 2021 2020 2019 Revenue from leases $ 282,791 $ 272,970 $ 302,409 Real estate services 9,596 11,390 13,873 Parking income 15,003 15,604 21,857 Hotel income 10,618 4,287 9,841 Other income 11,309 9,311 9,222 Total revenues 329,317 313,562 357,202 EXPENSES Real estate taxes 47,859 45,801 44,785 Utilities 14,802 13,717 17,881 Operating services 71,851 68,313 70,409 Real estate services expenses 12,857 13,555 15,918 General and administrative 57,198 71,058 59,805 Dead deal and transaction-related costs 12,221 2,583 - Depreciation and amortization 111,618 122,035 133,597 Property impairments 13,467 36,582 - Land and other impairments, net 23,719 16,817 32,444 Total expenses 365,592 390,461 374,839 OTHER (EXPENSE) INCOME Interest expense (65,192) (80,991) (90,569) Interest and other investment income (loss) 524 43 2,412 Equity in earnings (loss) of unconsolidated joint ventures (4,251) (3,832) (1,319) Gain on change of control of interests - - 13,790 Realized gains (losses) and unrealized gains (losses) on disposition of rental property, net 3,022 5,481 343,102 Gain on disposition of developable land 2,115 5,787 522 Gain (loss) on sale of unconsolidated joint venture interests (1,886) 35,184 903 Gain (loss) from extinguishment of debt, net (47,078) (272) 1,648 Total other income (expense) (112,746) (38,600) 270,489 Income (loss) from continuing operations (149,021) (115,499) 252,852 Discontinued operations: Income from discontinued operations 13,930 70,700 24,334 Realized gains (losses) and unrealized gains (losses) on disposition of rental property and impairments, net 25,552 11,201 (133,350) Total discontinued operations, net 39,482 81,901 (109,016) Net income (loss) (109,539) (33,598) 143,836 Noncontrolling interests in consolidated joint ventures 4,595 2,695 3,904 Redeemable noncontrolling interests (25,977) (25,883) (22,615) Net income (loss) available to common unitholders $ (130,921) $ (56,786) $ 125,125 Basic earnings per common unit: Income (loss) from continuing operations $ (1.79) $ (1.51) $ 2.04 Discontinued operations 0.40 0.81 (1.09) Net income (loss) available to common unitholders $ (1.39) $ (0.70) $ 0.95 Diluted earnings per common unit: Income (loss) from continuing operations $ (1.79) $ (1.51) $ 2.04 Discontinued operations 0.40 0.81 (1.09) Net income (loss) available to common unitholders $ (1.39) $ (0.70) $ 0.95 Basic weighted average units outstanding 99,893 100,260 100,520 Diluted weighted average units outstanding 99,893 100,260 100,689 The accompanying notes are an integral part of these consolidated financial statements. Year Ended December 31, 2021 2020 2019 Net income (loss) $ (109,539) $ (33,598) $ 143,836 Other comprehensive income (loss): Net unrealized gain (loss) on derivative instruments for interest rate swaps 10 (16) (10,158) Comprehensive (income) loss $ (109,529) $ (33,614) $ 133,678 Comprehensive (income) loss attributable to noncontrolling interests in consolidated joint ventures 4,595 2,695 3,904 Comprehensive (income) loss attributable to redeemable noncontrolling interests (25,977) (25,883) (22,615) Comprehensive loss attributable to common unitholders $ (130,911) $ (56,802) $ 114,967 Accumulated Noncontrolling Limited Partner General Partner Limited Partner Other Interest General Partner Common Units/ Common Common Comprehensive in Consolidated Common Units Vested LTIP Units Unitholders Unitholders Income (Loss) Joint Ventures Total Equity Balance at January 1, 2019 90,320 10,229 $ 1,413,497 $ 232,764 $ 8,770 $ 42,150 $ 1,697,181 Net income (loss) - - 111,861 13,264 - 18,711 143,836 Distributions to unitholders - - (72,401) (8,705) - - (81,106) Redeemable noncontrolling interests - - (25,885) (2,855) - (22,615) (51,355) Change in noncontrolling interests in consolidated joint ventures - - (1,958) - - 9,050 7,092 Redemption of limited partner common units for shares of general partner common units 38 (20) 705 (705) - - - Vested LTIP units - 68 - - - - - Redemption of limited partner common units - (665) (1,665) (12,799) - - (14,464) Shares issued under Dividend Reinvestment and Stock Purchase Plan 2 - 39 - - - 39 Directors' deferred compensation plan 194 - 319 - - - 319 Other comprehensive income - - (390) (980) (8,788) - (10,158) Stock compensation 41 - 627 7,534 - - 8,161 Cancellation of restricted shares - - - - - - - Cancellation of unvested LTIP units - - 2,819 (2,889) - - (70) Balance at December 31, 2019 90,595 9,612 $ 1,427,568 $ 224,629 $ (18) $ 47,296 $ 1,699,475 Net income (loss) - - (51,387) (5,399) - 23,188 (33,598) Distributions - - (36,261) (3,509) - - (39,770) Redeemable noncontrolling interests - - (11,814) (1,254) - (25,883) (38,951) Change in noncontrolling interests in consolidated joint ventures - - - - - 171 171 Redemption of limited partner common units for shares of general partner common units - - - - - - - Vested LTIP units - 175 - - - - - Redemption of limited partners common units - (138) - (2,693) - - (2,693) Shares issued under Dividend Reinvestment and Stock Purchase Plan 3 - 37 - - - 37 Directors' deferred compensation plan 61 - 291 - - - 291 Other comprehensive income (loss) - - - (34) 18 - (16) Stock compensation 53 - 1,614 6,021 - - 7,635 Cancellation of unvested LTIP units - - - (201) - - (201) Balance at December 31, 2020 90,712 9,649 $ 1,330,048 $ 217,560 $ - $ 44,772 $ 1,592,380 Net income (loss) - - (119,042) (11,879) - 21,382 (109,539) Distributions - - - 645 - - 645 Redeemable noncontrolling interests - - (7,290) (726) - (25,977) (33,993) Change in noncontrolling interests in consolidated joint ventures - - - - - 206 206 Redemption of limited partner common units for shares of general partner common units 175 (175) 2,716 (2,716) - - - Vested LTIP units - 270 - - - - - Redemption of limited partners common units - (731) - (11,357) - - (11,357) Shares issued under Dividend Reinvestment and Stock Purchase Plan 3 - 28 - - - 28 Directors' deferred compensation plan - - 314 - - - 314 Other comprehensive income (loss) - - - 1 9 - 10 Stock compensation 58 - 5,139 5,708 - - 10,847 Cancellation of restricted shares - - (123) - - - (123) Balance at December 31, 2021 90,948 9,013 $ 1,211,790 $ 197,236 $ 9 $ 40,383 $ 1,449,418 The accompanying notes are an integral part of these consolidated financial statements. December 31, CASH FLOWS FROM OPERATING ACTIVITIES 2021 2020 2019 Net income (loss) $ (109,539) $ (33,598) $ 143,836 Net income (loss) from discontinued operations (39,482) (81,901) 109,016 Net income (loss) from continuing operations (149,021) (115,499) 252,852 Adjustments to reconcile net income (loss) to net cash provided by Operating activities: Depreciation and amortization, including related intangible assets 108,839 118,345 129,725 Amortization of directors deferred compensation stock units 314 291 319 Amortization of stock compensation 10,847 7,635 8,161 Amortization of deferred financing costs 4,568 4,625 4,625 Amortization of debt discount and mark-to-market 232 (1,083) (949) Equity in (earnings) loss of unconsolidated joint ventures 4,251 3,832 1,319 Distributions of cumulative earnings from unconsolidated joint ventures 759 5,300 6,923 Gain on change of control of interests - - (13,790) Write-off transaction-related costs 7,922 - - Realized (gains) losses and unrealized (gains) losses on disposition of rental property, net (3,022) (5,481) (343,102) Gain on disposition of developable land (2,115) (5,787) (522) Property impairments 13,467 36,582 - Land and other impairments, net 23,719 16,817 32,444 (Gain) Loss from sale of investment in unconsolidated joint venture 1,886 (35,184) (903) (Gain) Loss from extinguishment of debt 47,078 272 (1,648) Changes in operating assets and liabilities: Increase in unbilled rents receivable, net (6,976) (1,135) (7,240) Increase in deferred charges, goodwill and other assets (5,022) (806) (21,921) Decrease (increase) in accounts receivable, net 5,544 (5,117) 2,132 Increase (decrease) in accounts payable, accrued expenses and other liabilities (11,268) (9,577) 1,820 (Decrease) Increase in rents received in advance and security deposits 55 (2,446) 2,002 Increase (decrease) in accrued interest payable 258 (184) 1,068 Net cash flows provided by operating activities - continuing operations 52,315 11,400 53,315 Net cash flows provided by operating activities - discontinued operations 3,800 74,022 78,527 Net cash provided by operating activities $ 56,115 $ 85,422 $ 131,842 CASH FLOWS FROM INVESTING ACTIVITIES Rental property acquisitions and related intangibles $ - $ (16,811) $ (956,040) Rental property additions and improvements (65,101) (138,688) (88,240) Development of rental property and other related costs (211,617) (295,892) (172,309) Proceeds from the sales of rental property 52,391 64,947 825,613 Proceeds from the sale of investments in unconsolidated joint ventures 3,865 64,773 4,039 Repayment of notes receivable 7,257 458 46,597 Investment in unconsolidated joint ventures (1,280) (2,959) (9,011) Distributions in excess of cumulative earnings from unconsolidated joint ventures 15,703 13,826 8,697 Net cash used in investing activities - continuing operations (198,782) (310,346) (340,654) Net cash provided by investing activities - discontinued operations 645,011 338,811 (75,421) Net cash provided by investing activities $ 446,229 $ 28,465 $ (416,075) CASH FLOW FROM FINANCING ACTIVITIES Borrowings from revolving credit facility $ 196,000 $ 212,000 $ 829,000 Repayment of revolving credit facility (73,000) (516,000) (617,000) Borrowings from term loans 150,000 - - Repayment of term loans (150,000) - (675,000) Repayment of senior unsecured notes (573,727) - - Proceeds from mortgages and loans payable 226,422 381,577 877,126 Repayment of mortgages, loans payable and other obligations (192,995) (86,561) (155,115) Acquisition of noncontrolling interests - - (5,017) (Redemption) issuance of redeemable noncontrolling interests, net - (3,153) 145,000 Payment of early debt extinguishment costs (49,874) - Common unit redemptions (898) (2,693) (7,769) Payment of financing costs (8,874) (1,677) (12,339) (Contributions) distributions to noncontrolling interests 207 171 (466) Distributions to redeemable noncontrolling interests (25,977) (25,883) (21,883) Payment of distributions (475) (60,532) (80,692) Net cash used in financing activities $ (503,191) $ (102,751) $ 275,845 Net (decrease) increase in cash and cash equivalents $ (847) $ 11,136 $ (8,388) Cash, cash equivalents and restricted cash, beginning of period (1) 52,302 41,166 49,554 Cash, cash equivalents and restricted cash, end of period (2) $ 51,455 $ 52,302 $ 41,166 (1)Includes Restricted Cash of Inc. Additional paid-in capital. December 31, December 31, 2021 2020 Land held for development (including pre-development costs, if any) (a)(b) $ 341,496 $ 364,946 Development and construction in progress, including land (c) 694,768 733,560 Total $ 1,036,264 $ 1,098,506 The Company considers a construction project as substantially completed and held available for occupancy upon the substantial completion of improvements, but no later than one year from cessation of major construction activity (as distinguished from activities such as routine maintenance and cleanup). If portions of a rental project are substantially completed and occupied by tenants or residents, or held available for occupancy, and other portions have not yet reached that stage, the substantially completed portions are accounted for as a separate project. The Company allocates costs incurred between the portions under construction and the portions substantially completed and held available for occupancy, primarily based on a percentage of the relative commercial square footage or multifamily units of each portion, and capitalizes only those costs associated with the portion under construction. Remaining lease term Buildings and improvements 5 to 40 years Tenant improvements The shorter of the term of the related lease or useful life Furniture, fixtures and equipment 5 to 10 years weighted approach to estimating future cash If the venture subsequently makes distributions and the Company does not have an implied or actual commitment to support the operations of the venture, the Company will not record a basis less than zero, rather such amounts will be recorded as equity in earnings of unconsolidated joint ventures. Cash and Cash Equivalents purchased. costs. million in Land and other impairments, net on the Consolidated Statement of Operations. operating expenses), from the associated lease component since (1) the non-lease components have the same timing and pattern of transfer as the associated lease component and (2) the lease component, if accounted for separately, would be classified as an operating component. managing member. these amounts in our consolidated balance sheets. certain property management, development, construction and other related services, as well as to hold a joint venture interest in a hotel and other matters. The TRS has sold the hotel during the year ended December 31, 2023. Pursuant to the amended provisions related to uncertain tax provisions of ASC 740, Income Taxes, the Company recognized September 30, 2023. The Company has determined that the 2022 represent amounts payable on unvested LTIP units. Stock Compensation hedges. Company's revolving credit facility. As of December 31, 2022, all apartment units were in service. The development costs included approximately $53.4 million in land costs. dollars in thousands ): Total In Service Property # of Development Date Property Location Type Apartment Units Costs Incurred 03/01/21 The Upton (a) Short Hills, NJ Multifamily 193 $ 101,269 07/01/21 Riverhouse 9 at Port Imperial (b) Weehawken, NJ Multifamily 313 164,633 Totals 506 $ 265,902 Total In Service Property # of Development Date Property Location Type Apartment Units Costs Incurred 03/01/20 Emery at Overlook Ridge Malden, MA Multifamily 326 $ 103,993 Totals 326 $ 103,993 Dispositions of Rental Properties and Developable Land Dispositions during 2022 (a) $2.5 million. Discontinued Operations: Realized Realized Gains Gains Rentable Net Net (Losses)/ (losses)/ Disposition # of Square Property Sales Carrying Unrealized Unrealized Date Property/Address Location Bldgs. Feet Type Proceeds Value Losses, net Losses, net 01/13/21 100 Overlook Center Princeton, New Jersey 1 149,600 Office $ 34,724 (a) $ 26,488 $ - $ 8,236 03/25/21 Metropark portfolio (b) Edison and Iselin, New Jersey 4 926,656 Office 247,351 233,826 - 13,525 04/20/21 Short Hills portfolio (c) Short Hills, New Jersey 4 828,413 Office 248,664 245,800 - 2,864 06/11/21 Red Bank portfolio Red Bank, New Jersey 5 659,490 Office 80,730 78,364 - 2,366 06/30/21 Retail land leases Hanover and Parsippany, New Jersey - - Land Lease 41,957 37,951 4,006 - 07/26/21 7 Giralda Farms Madison, New Jersey 1 236,674 Office 28,182 30,143 - (1,961) 10/20/21 4 Gatehall Drive Parsippany, New Jersey 1 248,480 Office 24,239 23,717 - 522 12/16/21 Retail land lease Unit B Hanover, New Jersey - - Land Lease 5,423 6,407 (984) - Totals 16 3,049,313 $ 711,270 $ 682,696 $ 3,022 $ 25,552 (a)As part of the consideration from the buyer, a related party, 678,302 Common Units were redeemed by the Company at a book value of $10.5 million, which was a non-cash portion of this sales transaction. The balance of the proceeds was received in cash and used to repay the Company's borrowings on its revolving credit facility. See Note Realized Gains Net Net (losses)/ Disposition Sales Carrying Unrealized Date Property Address Location Proceeds Value Losses, net 05/24/21 Horizon common area Hamilton, New Jersey $ 745 $ 634 $ 111 12/22/21 346/360 University Ave Newark, New Jersey 4,266 2,262 2,004 Totals $ 5,011 $ 2,896 $ 2,115 2022 Suburban Other Office Assets Portfolio (a) Held for Sale Total Land $ 87,815 $ 76,396 $ 164,211 Building & Other 737,669 42,202 779,871 Less: Accumulated depreciation (161,040) (7,991) (169,031) Less: Cumulative unrealized losses on property held for sale (77,357) (40,731) (118,088) Real estate held for sale, net $ 587,087 $ 69,876 $ 656,963 Suburban Other Office Assets Other assets and liabilities Portfolio (a) Held for Sale Total Unbilled rents receivable, net (b) $ 17,216 $ 2,102 $ 19,318 Deferred charges, net (b) 15,320 661 15,981 Total intangibles, net (b) 26,069 - 26,069 Total deferred charges & other assets, net 42,513 665 43,178 Mortgages & loans payable, net (b) (123,768) - (123,768) Total below market liability (b) (6,538) - (6,538) Accounts payable, accrued exp & other liability (16,972) (80) (17,052) Unearned rents/deferred rental income (b) (8,422) (217) (8,639) (a) Classified as discontinued operations at December 31, 2019 for all periods presented. See Note 7: Discontinued Operations. (b) Expected to be removed with the completion of the sales. Discontinued Operations: Realized Realized Gains Gains Rentable Net Net (Losses)/ (losses)/ Disposition # of Square Property Sales Carrying Unrealized Unrealized Date Property/Address Location Bldgs. Feet/Units Type Proceeds Value Losses, net Losses, net 03/17/20 One Bridge Plaza Fort Lee, New Jersey 1 200,000 Office $ 35,065 $ 17,743 $ - $ 17,322 07/22/20 3 Giralda Farms (a) Madison, New Jersey 1 141,000 Office 7,510 9,534 - (2,024) 09/15/20 Morris portfolio (b) Parsippany and Madison, New Jersey 10 1,448,420 Office 155,116 175,772 - (20,656) 09/18/20 325 Columbia Turnpike Florham Park, New Jersey 1 168,144 Office 24,276 8,020 - 16,256 09/24/20 9 Campus Drive (c) Parsippany, New Jersey 1 156,945 Office 20,678 22,162 - (1,484) 10/21/20 3&5 Vaughn Drive Princeton, New Jersey 1 98,500 Office 7,282 5,754 - 1,528 11/18/20 7 Campus Drive (d) Parsippany, New Jersey 1 154,395 Office 12,278 11,804 - 474 12/03/20 581 Main Street Woodbridge, New Jersey 1 200,000 Office 58,400 43,113 15,287 12/22/20 500 College Road (e) Princeton, New Jersey 1 158,235 Office 4,582 6,044 (1,462) 12/23/20 5/10 Dennis St and 100 Hiram Sq New Brunswick, New Jersey 2 200 units Multifamily 45,567 38,404 7,163 - Sub-total 20 2,725,639 370,754 338,350 7,163 25,241 Unrealized losses on real estate held for sale (1,682) (14,040) Totals 20 2,725,639 $ 370,754 $ 338,350 5,481 $ 11,201 Realized Gains Net Net (losses)/ Disposition Sales Carrying Unrealized Date Property Address Location Proceeds Value Losses, net 01/03/20 230 & 250 Half Mile Road Middletown, New Jersey $ 7,018 $ 2,969 $ 4,049 03/27/20 Capital Office Park land Greenbelt, Maryland 8,974 8,210 764 12/18/20 14 & 16 Skyline Drive Mount Pleasant, New York 2,925 1,951 974 Totals $ 18,917 $ 13,130 $ 5,787 2021 — On September 1, 2021, the Company sold its interest in the Offices at Crystal Lake joint venture to its venture partner for $1.9 million and recorded a loss on the sale of approximately $1.9 million (included in discontinued operations) in the year ended December 31, 2021. On strategic shift in the Company’s operations beginning in 2019. See Note 7: Discontinued Operations. The Company has agreed to guarantee repayment of a portion of the debt of its unconsolidated joint ventures. As of December 31, The following is a summary of the Company's unconsolidated joint ventures as of December 31, Property Debt Number of Company's Carrying Value As of December 31, 2021 Apartment Units Effective December 31, December 31, Maturity Interest Entity / Property Name or Rentable SF Ownership % (a) 2021 2020 Balance Date Rate Multifamily Metropolitan and Lofts at 189 units 25.00 % $ 2,547 $ 3,347 $ 60,767 (d) (d) RiverTrace at Port Imperial 316 units 22.50 % 6,077 6,667 82,000 11/10/26 3.21 % PI North - Riverwalk C (e) 360 units 40.00 % 27,401 36,992 135,000 12/22/24 SOFR+ 1.2 % Riverpark at Harrison 141 units 45.00 % - 681 30,192 07/01/35 3.19 % Station House 378 units 50.00 % 33,004 34,026 93,329 07/01/33 4.82 % Urby at Harborside (f) 762 units 85.00 % 66,418 72,752 191,160 08/01/29 5.197 % PI North - Land (b) (g) 771 potential units 20.00 % 1,678 1,678 - - - Liberty Landing (h) 850 potential units 50.00 % 300 337 - - - Office 12 Vreeland Road (i) 139,750 sf 50.00 % - 1,811 - - - Offices at Crystal Lake (j) 106,345 sf 31.25 % - 3,744 - - - Other Hyatt Regency Hotel Jersey City 351 rooms 50.00 % - - 100,000 10/01/26 3.668 % Other (k) 347 347 - - - Totals: $ 137,772 $ 162,382 $ 692,448 The following is a summary of the Company’s equity in earnings (loss) of unconsolidated joint ventures for the years ended December 31, Year Ended December 31, Entity / Property Name 2021 2020 2019 Multifamily Metropolitan and Lofts at 40 Park $ (801) $ (1,010) $ (422) RiverTrace at Port Imperial 92 111 317 Crystal House (a) - (924) (687) PI North - Riverwalk C (b) (506) (368) (279) Riverpark at Harrison (c) (1,153) (273) (172) Station House (1,647) (1,650) (2,000) Urby at Harborside (580) 1,095 1,587 PI North - Land (250) - - Liberty Landing (d) (40) (5) - Office - 12 Vreeland Road (e) 2 (2,035) (3,172) Offices at Crystal Lake (f) (113) 224 79 Other Riverwalk Retail (g) - (10) (72) Hyatt Regency Hotel Jersey City - 625 3,388 Other 745 388 114 Company's equity in earnings (loss) of unconsolidated joint ventures (h) $ (4,251) $ (3,832) $ (1,319) (dollars in thousands) : December 31, December 31, (dollars in thousands) 2021 2020 Deferred leasing costs $ 88,265 $ 112,421 Deferred financing costs - revolving credit facility (a) 6,684 5,559 94,949 117,980 Accumulated amortization (40,956) (52,428) Deferred charges, net 53,993 65,552 Notes receivable (b) 4,015 1,167 In-place lease values, related intangibles and other assets, net (c)(d) 42,183 71,608 Goodwill (e) - 2,945 Right of use assets (f) 22,298 22,298 Prepaid expenses and other assets, net 28,858 35,971 Total deferred charges, goodwill and other assets, net (g) $ 151,347 $ 199,541 (c) Acquired Above- Acquired Below- Market Lease Market Lease Total Year Intangibles Intangibles Amortization 2022 $ (358) $ 2,209 $ 1,851 2023 (352) 2,205 1,853 2024 (308) 2,197 1,889 2025 (293) 2,151 1,858 2026 (275) 2,247 1,972 Year 2022 $ 2,244 2023 2,224 2024 2,145 2025 2,001 2026 1,994 Total $ 10,608 The table below presents the fair value of the Company’s derivative financial instruments as well as their classification on the Fair Value Asset Derivatives designated December 31, December 31, as hedging instruments 2021 2020 Balance sheet location Interest rate caps $ 850 $ - Deferred charges, goodwill and other assets Derivatives in Cash Flow Hedging Relationships Amount of Gain or (Loss) Recognized in OCI on Derivative Location of Gain or (Loss) Reclassified from Accumulated OCI into Income Amount of Gain or (Loss) Reclassified from Accumulated OCI into Income Location of Gain or (Loss) Recognized in Income on Derivative Amount of Gain or (Loss) Recognized in Income on Derivative and Reclassification for Forecasted Transactions No Longer Probable of Occurring Total Amount of Interest Expense presented in the consolidated statements of operations Year Ended December 31, Year Ended December 31, 2021 2020 2019 2021 2020 2019 2021 2020 2019 2021 2020 2019 Interest Rate Caps $ 10 $ - $ - Interest expense $ - $ - $ - $ - $ - $ - $ (65,192) $ (80,991) $ (90,569) Interest rate swaps $ - $ - $ (4,682) Interest expense $ - $ 16 $ 3,551 Interest and other investment income (loss) $ - $ - $ 1,926 $ (65,192) $ (80,991) $ (90,569) December 31, December 31, 2021 2020 Security deposits $ 6,884 $ 5,289 Escrow and other reserve funds 12,817 8,918 Total restricted cash $ 19,701 $ 14,207 presented. The following table summarizes income (loss) from discontinued operations and the related realized gains (losses) and unrealized Year Ended December 31, 2021 2020 2019 Total revenues $ 28,614 $ 134,915 $ 169,672 Operating and other expenses (12,140) (54,153) (69,077) Depreciation and amortization (974) (4,806) (71,021) Interest expense (1,570) (5,256) (5,240) Income from discontinued operations 13,930 70,700 24,334 Unrealized gains (losses) on disposition of rental property (a) 569 (14,040) (141,266) Realized gains (losses) on disposition of rental property (b) 24,983 25,241 7,916 Realized gains (losses) and unrealized gains (losses) on disposition of rental property and impairments, net 25,552 11,201 (133,350) Total discontinued operations, net $ 39,482 $ 81,901 $ (109,016) December 31, December 31, Effective 2021 2020 Rate 4.500% Senior Unsecured Notes, due April 18, 2022 (1) $ - $ 300,000 - % 3.150% Senior Unsecured Notes, due May 15, 2023 (1) - 275,000 - % Principal balance outstanding - 575,000 Adjustment for unamortized debt discount - (1,504) Unamortized deferred financing costs - (843) Total senior unsecured notes, net $ - $ 572,653 facilities. Facility. Interest on borrowings under the Operations. Interest Rate - Applicable Interest Rate - Basis Points Applicable Above LIBOR for Basis Points Alternate Base Facility Fee Total Leverage Ratio Above LIBOR Rate Loans Basis Points <45% 125.0 25.0 20.0 ≥45% and <50% 130.0 30.0 25.0 ≥50% and <55% (ratio through May 6, 2021) 135.0 35.0 30.0 ≥55% 160.0 60.0 35.0 The Company was in compliance with its debt covenants under its revolving credit facility as of December 31, . Effective December 31, December 31, Property/Project Name Lender Rate (a) 2021 2020 Maturity RXR - Short Hills (b) Wells Fargo CMBS 4.15 % $ - $ 124,500 Port Imperial South 4/5 Retail American General Life & A/G PC 4.56 % - 3,866 Riverhouse 9 at Port Imperial (c) Bank of New York Mellon LIBOR+ 2.13 % 87,175 46,357 12/19/22 Port Imperial 4/5 Hotel (d) Fifth Third Bank LIBOR+ 3.40 % 89,000 94,000 04/01/23 Portside at Pier One CBRE Capital Markets/FreddieMac 3.57 % 58,998 58,998 08/01/23 Signature Place Nationwide Life Insurance Company 3.74 % 43,000 43,000 08/01/24 Liberty Towers (e) American General Life Insurance Company 3.37 % 265,000 265,000 10/01/24 Haus 25 (f) QuadReal Finance LIBOR+ 2.70 % 255,453 161,544 12/01/24 Portside 5/6 (g) New York Life Insurance Company 4.56 % 97,000 97,000 03/10/26 BLVD 425 New York Life Insurance Company 4.17 % 131,000 131,000 08/10/26 BLVD 401 New York Life Insurance Company 4.29 % 117,000 117,000 08/10/26 101 Hudson Wells Fargo CMBS 3.20 % 250,000 250,000 10/11/26 The Upton (h) Bank of New York Mellon LIBOR+ 1.58 % 75,000 42,459 10/27/26 145 Front at City Square MUFG Union Bank LIBOR+ 1.84 % 63,000 63,000 12/10/26 Quarry Place at Tuckahoe Natixis Real Estate Capital LLC 4.48 % 41,000 41,000 08/05/27 BLVD 475 N/S (i) The Northwestern Mutual Life Insurance Co. 2.91 % 165,000 165,000 11/10/27 Riverhouse 11 at Port Imperial The Northwestern Mutual Life Insurance Co. 4.52 % 100,000 100,000 01/10/29 Soho Lofts (j) New York Community Bank 3.77 % 160,000 160,000 07/01/29 111 River St. (k) Athene Annuity and Life Company 3.90 % 150,000 150,000 09/01/29 Port Imperial South 4/5 Garage (l) American General Life & A/G PC 4.85 % 32,664 33,138 12/01/29 Emery at Overlook Ridge (m) New York Community Bank 3.21 % 72,000 72,000 01/01/31 Principal balance outstanding 2,252,290 2,218,862 Unamortized deferred financing costs (11,220) (14,718) Total mortgages, loans payable and other obligations, net $ 2,241,070 $ 2,204,144 (c) Scheduled Principal Period Amortization Maturities Total 2022 $ 550 $ 87,175 $ 87,725 2023 2,047 147,998 150,045 2024 3,403 711,453 714,856 2025 3,300 - 3,300 2026 3,407 733,000 736,407 Thereafter 9,415 698,542 707,957 Sub-total 22,122 2,378,168 2,400,290 Unamortized deferred financing costs (11,220) - (11,220) Totals $ 10,902 $ 2,378,168 $ 2,389,070 December 31, December 31, (dollars in thousands) 2021 2020 Weighted Average Weighted Average Balance Interest Rate (a) Balance Interest Rate (a) Fixed Rate Debt $ 1,675,353 3.71 % $ 2,374,378 3.83 % Revolving Credit Facility & Other Variable Rate Debt 713,717 3.32 % 427,419 3.38 % Totals/Weighted Average: $ 2,389,070 3.60 % $ 2,801,797 3.60 % 2022. Non-Recurring Basis (Including Impairment Charges) on a non-recurring basis: Pilot Payments PILOT 2021 2020 2019 Property Name Location Asset Type Expiration Dates (Dollars in Thousands) Port Imperial South 1/3 Garage (a) Weehawken, NJ Parking Garage 12/2020 $ - $ 303 $ 289 BLVD 475 (Monaco) (b) Jersey City, NJ Multifamily 2/2021 443 1,811 2,149 111 River Street Hoboken, NJ Office 4/2022 1,470 1,470 1,406 Harborside Plaza 4A (c) Jersey City, NJ Office 2/2022 1,057 1,062 1,080 Harborside Plaza 5 (d) Jersey City, NJ Office 6/2022 4,324 4,415 4,352 BLVD 401 (Marbella 2) (e) Jersey City, NJ Multifamily 4/2026 1,277 1,151 1,394 RiverHouse 11 at Port Imperial (f) Weehawken, NJ Multifamily 7/2033 1,369 1,143 1,030 Port Imperial 4/5 Hotel (g) Weehawken, NJ Hotel 12/2033 2,925 2,161 2,214 RiverHouse 9 at Port Imperial (h) Weehawken, NJ Multifamily 6/2046 350 - - Haus 25 (i) Jersey City, NJ Mixed-Use (i) - - - Park Apartments at Port Imperial (j) Weehawken, NJ Multifamily (j) - - - Total Pilot taxes $ 13,215 $ 13,516 $ 13,914 (a) OFFICE AND GROUND LEASE AGREEMENTS As of December 31, 2021 Year Amount (a) 2022 $ 1,695 2023 1,702 2024 1,721 2025 1,728 2026 1,728 2027 through 2101 151,253 Total lease payments 159,827 Less: imputed interest (136,141) Total $ 23,686 As of December 31, 2020 Year Amount 2021 $ 1,750 2022 1,750 2023 1,756 2024 1,776 2025 1,742 2026 through 2101 152,980 Total lease payments 161,754 Less: imputed interest (138,152) Total $ 23,602 As of December 31, As of December 31, 2021 Year Amount 2022 $ 115,256 2023 114,355 2024 98,374 2025 94,042 2026 91,297 2027 and thereafter 416,712 Total $ 930,036 As of December 31, 2020 Year Amount 2021 $ 117,228 2022 114,101 2023 108,406 2024 92,605 2025 88,309 2026 and thereafter 462,920 Total $ 983,569 Multifamily rental property residential leases are excluded from the above table as they generally expire within one year. Transactions On June VRLP’s cash flow from capital events will generally be distributable by VRLP to Rockpoint and VRT as follows: Partnership Agreement. After the Lockout Period, either VRT may acquire from Rockpoint, or Rockpoint may sell to VRT, all, but not less than all, of Rockpoint’s interest in the Preferred Units (each, a “Put/Call Event”) for a purchase price equal to the Purchase before the redemption occurred on July 25, 2023. (dollars in thousands) : Series A and Total A-1 Preferred Rockpoint Redeemable Units Interests Noncontrolling In VRLP in VRLP Interests Balance January 1, 2021 $ 52,324 $ 460,973 $ 513,297 Redeemable Noncontrolling Interests Issued - - - Net 52,324 460,973 513,297 Income Attributed to Noncontrolling Interests 1,820 24,157 25,977 Distributions (1,820) (24,157) (25,977) Redemption Value Adjustment - 8,016 8,016 Redeemable noncontrolling interests as of December 31, 2021 $ 52,324 $ 468,989 $ 521,313 Series A and Total A-1 Preferred Rockpoint Redeemable Units Interests Noncontrolling In VRLP in VRLP Interests Balance January 1, 2020 $ 52,324 $ 451,058 $ 503,382 Redeemable Noncontrolling Interests Issued - - - Net 52,324 451,058 503,382 Income Attributed to Noncontrolling Interests 1,820 24,063 25,883 Distributions (1,820) (24,063) (25,883) Other Distributions - (3,153) (3,153) Redemption Value Adjustment - 13,068 13,068 Redeemable noncontrolling interests as of December 31, 2020 $ 52,324 $ 460,973 $ 513,297 At December 31, 2023, 269,072 shares remained available for issuance under the 2013 Plan. Weighted Aggregate Average Intrinsic Shares Exercise Value Under Options Price $(000’s) Outstanding at January 1, 2019 ($17.31) 800,000 $ 17.31 $ 1,824 Granted, Lapsed or Cancelled - - Outstanding at December 31, 2019 ($17.31) 800,000 $ 17.31 4,656 Granted 172,495 14.39 Outstanding at December 31, 2020 ($14.39 - $17.31) 972,495 $ 16.79 - Granted 1,107,505 16.10 Outstanding at December 31, 2021 ($14.39 - $20.00) 2,080,000 $ 16.42 $ 4,072 Options exercisable at December 31, 2021 1,130,000 Available for grant at December 31, 2021 1,633,689 2021 2021 2021 2020 March June regular June premium stock options Expected life (in years) 4.5 4.6 5.3 5.3 Risk-free interest rate 0.79 % 0.71 % 0.94 % 0.41 % Volatility 35.0 % 35.0 % 34.0 % 31.0 % Dividend yield 1.6 % 1.5 % 1.4 % 2.7 % As of December 31, summarized below: Weighted-Average Grant – Date Shares Fair Value Outstanding at January 1, 2019 67,289 $ 22.43 Granted 42,690 21.08 Vested (65,353) 22.34 Forfeited (1,936) 25.83 Outstanding at December 31, 2019 42,690 $ 21.08 Granted 52,974 15.29 Vested (42,690) 21.08 Forfeited - - Outstanding at December 31, 2020 52,974 $ 15.29 Granted 39,529 17.71 Vested (52,974) 15.29 Forfeited - - Outstanding at December 31, 2021 39,529 $ 17.71 targets ("OPRSUs"). As of December 31, 2023, there are 660,710 OPRSUs outstanding and unvested. stock. Year Ended December 31, Computation of Basic EPS 2021 2020 2019 Income (loss) from continuing operations $ (149,021) $ (115,499) $ 252,852 Add (deduct): Noncontrolling interests in consolidated joint ventures 4,595 2,695 3,904 Add (deduct): Noncontrolling interests in Operating Partnership 15,469 13,277 (23,724) Add (deduct): Redeemable noncontrolling interests (25,977) (25,883) (22,615) Add (deduct): Redemption value adjustment of redeemable noncontrolling interests attributable to common shareholders (7,290) (11,814) (25,885) Income (loss) from continuing operations available to common shareholders (162,224) (137,224) 184,532 Income (loss) from discontinued operations available to common shareholders 35,892 74,023 (98,556) Net income (loss) available to common shareholders for basic earnings per share $ (126,332) $ (63,201) $ 85,976 Weighted average common shares 90,839 90,648 90,557 Basic EPS: Income (loss) from continuing operations available to common shareholders $ (1.79) $ (1.51) $ 2.04 Income (loss) from discontinued operations available to common shareholders 0.40 0.81 (1.09) Net income (loss) available to common shareholders $ (1.39) $ (0.70) $ 0.95 Year Ended December 31, Computation of Diluted EPS 2021 2020 2019 Net income (loss) from continuing operations available to common shareholders $ (162,224) $ (137,224) $ 184,532 Add (deduct): Noncontrolling interests in Operating Partnership (15,469) (13,277) 23,724 Add (deduct): Redemption value adjustment of redeemable noncontrolling interests attributable to the Operating Partnership unitholders (726) (1,254) (2,855) Income (loss) from continuing operations for diluted earnings per share (178,419) (151,755) 205,401 Income (loss) from discontinued operations for diluted earnings per share 39,482 81,901 (109,016) Net income (loss) available for diluted earnings per share $ (138,937) $ (69,854) $ 96,385 Weighted average common shares 99,893 100,260 100,689 Diluted EPS: Income (loss) from continuing operations available to common shareholders $ (1.79) $ (1.51) $ 2.04 Income (loss) from discontinued operations available to common shareholders 0.40 0.81 (1.09) Net (income) loss available to common shareholders $ (1.39) $ (0.70) $ 0.95 The following schedule reconciles the weighted average shares used in the basic EPS calculation to the shares used in the diluted EPS calculation (in thousands): Year Ended December 31, 2021 2020 2019 Basic EPS shares 90,839 90,648 90,557 Add: Operating Partnership – common and vested LTIP units 9,054 9,612 9,963 Stock Options - - 169 Diluted EPS Shares 99,893 100,260 100,689 Veris Residential, L.P.: Year Ended December 31, Computation of Basic EPU 2021 2020 2019 Income (loss) from continuing operations $ (149,021) $ (115,499) $ 252,852 Add (deduct): Noncontrolling interests in consolidated joint ventures 4,595 2,695 3,904 Add (deduct): Redeemable noncontrolling interests (25,977) (25,883) (22,615) Add (deduct): Redemption value adjustment of redeemable noncontrolling interests (8,016) (13,068) (28,740) Income (loss) from continuing operations available to unitholders (178,419) (151,755) 205,401 Income (loss) from discontinued operations available to unitholders 39,482 81,901 (109,016) Net income (loss) available to common unitholders for basic earnings per unit $ (138,937) $ (69,854) $ 96,385 Weighted average common units 99,893 100,260 100,520 Basic EPU: Income (loss) from continuing operations available to unitholders $ (1.79) $ (1.51) $ 2.04 Income (loss) from discontinued operations available to unitholders 0.40 0.81 (1.09) Net income (loss) available to common unitholders for basic earnings per unit $ (1.39) $ (0.70) $ 0.95 Year Ended December 31, Computation of Diluted EPU 2021 2020 2019 Net income (loss) from continuing operations available to common unitholders $ (178,419) $ (151,755) $ 205,401 Income (loss) from discontinued operations for diluted earnings per unit 39,482 81,901 (109,016) Net income (loss) available to common unitholders for diluted earnings per unit $ (138,937) $ (69,854) $ 96,385 Weighted average common unit 99,893 100,260 100,689 Diluted EPU: Income (loss) from continuing operations available to common unitholders $ (1.79) $ (1.51) $ 2.04 Income (loss) from discontinued operations available to common unitholders 0.40 0.81 (1.09) Net income (loss) available to common unitholders $ (1.39) $ (0.70) $ 0.95 Year Ended December 31, 2021 2020 2019 Basic EPU units 99,893 100,260 100,520 Add: Stock Options - - 169 Diluted EPU Units 99,893 100,260 100,689 $4.1 million. $142 thousand. Unit Transactions Common Units/ Unvested LTIP Vested LTIP Units Units Balance at January 1, 2019 10,229,349 1,707,106 Redemption of common units for shares of common stock (38,011) - Redemption of common units (665,918) - Conversion of vested LTIP units to common units 18,438 - Vested LTIP units 68,206 (86,644) Issuance of units - 565,623 Cancellation of units - (359,754) Balance at December 31, 2019 9,612,064 1,826,331 Redemption of common units for shares of common stock - - Redemption of common units (138,615) - Conversion of vested LTIP units to common units 38,626 Vested LTIP units 136,957 (175,583) Issuance of units - 1,287,568 Cancellation of units (1) (1,215,387) Balance at December 31, 2020 9,649,031 1,722,929 Redemption of common units for shares of common stock (175,257) - Redemption of common units (730,850) - Conversion of vested LTIP units to common units 205,434 - Vested LTIP units 65,176 (270,610) Issuance of units - 334,449 Cancellation of units - (540,016) Balance at December 31, 2021 9,013,534 1,246,752 noncontrolling interests in these ventures. Selected results of operations for the years ended December 31, Commercial Multifamily Corporate Total & Other Real Estate Real Estate & Services (d) & Other (e) Company Total revenues: 2021 $ 159,532 $ 171,030 $ (1,245) $ 329,317 2020 155,045 156,841 1,676 313,562 2019 184,966 170,833 1,403 357,202 Total operating and interest expenses (a): 2021 $ 64,409 $ 108,197 $ 108,850 $ 281,456 2020 73,160 95,631 127,184 295,975 2019 80,018 89,512 127,425 296,955 Equity in earnings (loss) of unconsolidated joint ventures: 2021 $ (111) $ (4,140) $ $ (4,251) 2020 (2,254) (1,578) - (3,832) 2019 (1,194) (125) - (1,319) Net operating income (loss) (b): Three months ended: 2021 $ 95,012 $ 58,693 $ (110,095) $ 43,610 2020 79,631 59,632 (125,508) 13,755 2019 103,754 81,196 (126,022) 58,928 Total assets: 2021 $ 1,216,717 $ 3,294,226 $ 16,375 $ 4,527,318 2020 1,881,161 3,249,516 17,109 5,147,786 Total long-lived assets (c): 2021 $ 1,087,198 $ 3,098,492 $ (1,309) $ 4,184,381 2020 1,693,054 3,035,485 (1,411) 4,727,128 Total investments in unconsolidated joint ventures: 2021 $ - $ 137,772 $ - $ 137,772 2020 5,555 156,827 - 162,382 Veris Residential, Inc. Year Ended December 31, 2021 2020 2019 Net operating income $ 43,610 $ 13,755 $ 58,928 Add (deduct): Depreciation and amortization (111,618) (122,035) (133,597) Land and other impairments, net (23,719) (16,817) (32,444) Property impairments (13,467) (36,582) - Gain on change of control of interests - - 13,790 Realized gains (losses) and unrealized losses on disposition of rental property, net 3,022 5,481 343,102 Gain on disposition of developable land 2,115 5,787 522 Gain on sale from unconsolidated joint ventures (1,886) 35,184 903 Gain (loss) from extinguishment of debt, net (47,078) (272) 1,648 Income (loss) from continuing operations (149,021) (115,499) 252,852 Discontinued operations Income from discontinued operations 13,930 70,700 24,334 Realized gains (losses) and unrealized gains (losses) on disposition of rental property and impairments, net 25,552 11,201 (133,350) Total discontinued operations, net 39,482 81,901 (109,016) Net income (loss) (109,539) (33,598) 143,836 Noncontrolling interests in consolidated joint ventures 4,595 2,695 3,904 Noncontrolling interests in Operating Partnership 15,469 13,277 (23,724) Noncontrolling interest in discontinued operations (3,590) (7,878) 10,460 Redeemable noncontrolling interests (25,977) (25,883) (22,615) Net income (loss) available to common shareholders $ (119,042) $ (51,387) $ 111,861 Veris Residential, L.P. Year Ended December 31, 2021 2020 2019 Net operating income $ 43,610 $ 13,755 $ 58,928 Add (deduct): Depreciation and amortization (111,618) (122,035) (133,597) Land and other impairments, net (23,719) (16,817) (32,444) Property impairments (13,467) (36,582) - Gain on change of control of interests - - 13,790 Realized gains (losses) and unrealized losses on disposition of rental property, net 3,022 5,481 343,102 Gain on disposition of developable land 2,115 5,787 522 Gain on sale from unconsolidated joint ventures (1,886) 35,184 903 Gain (loss) from extinguishment of debt, net (47,078) (272) 1,648 Income (loss) from continuing operations (149,021) (115,499) 252,852 Discontinued operations Income from discontinued operations 13,930 70,700 24,334 Realized gains (losses) and unrealized gains (losses) on disposition of rental property and impairments, net 25,552 11,201 (133,350) Total discontinued operations, net 39,482 81,901 (109,016) Net income (loss) (109,539) (33,598) 143,836 Noncontrolling interests in consolidated joint ventures 4,595 2,695 3,904 Redeemable noncontrolling interests (25,977) (25,883) (22,615) Net income (loss) available to common unitholders $ (130,921) $ (56,786) $ 125,125 Quarter Ended 2021 December 31 September 30 June 30 March 31 Total revenues $ 88,233 $ 83,744 $ 81,247 $ 76,093 Net income (loss) $ (23,237) $ (25,792) $ (74,031) $ 13,521 Net income (loss) available to common shareholders $ (26,272) $ (28,314) $ (72,079) $ 7,623 ` Basic earnings per common share: Income from continuing operations $ (0.32) $ (0.34) $ (0.86) $ (0.28) Discontinued operations - 0.01 0.05 0.34 Net income (loss) available to common shareholders $ (0.32) $ (0.33) $ (0.81) $ 0.06 Diluted earnings per common share: Income from continuing operations $ (0.32) $ (0.34) $ (0.86) $ (0.28) Discontinued operations - 0.01 0.05 0.34 Net income (loss) available to common shareholders $ (0.32) $ (0.33) $ (0.81) $ 0.06 Quarter Ended 2020 December 31 September 30 June 30 March 31 Total revenues $ 76,564 $ 79,197 $ 74,197 $ 83,604 Net income (loss) $ 78,298 $ (41,118) $ (32,934) $ (37,844) Net income (loss) available to common shareholders $ 65,632 $ (42,208) $ (34,887) $ (39,924) ` Basic earnings per common share: Income from continuing operations $ 0.22 $ (0.83) $ (0.50) $ (0.40) Discontinued operations 0.45 0.34 0.09 (0.07) Net income (loss) available to common shareholders $ 0.67 $ (0.49) $ (0.41) $ (0.47) Diluted earnings per common share: Income from continuing operations $ 0.22 $ (0.83) $ (0.50) $ (0.40) Discontinued operations 0.45 0.34 0.09 (0.07) Net income (loss) available to common shareholders $ 0.67 $ (0.49) $ (0.41) $ (0.47) Quarter Ended 2021 December 31 September 30 June 30 March 31 Total revenues $ 88,233 $ 83,744 $ 81,247 $ 76,093 Net income (loss) $ (23,237) $ (25,792) $ (74,031) $ 13,521 Net income (loss) available to common unitholders $ (28,876) $ (31,126) $ (79,304) $ 8,385 Basic earnings per common unit: Income from continuing operations $ (0.32) $ (0.34) $ (0.86) $ (0.28) Discontinued operations - 0.01 0.05 0.34 Net income (loss) available to common unitholders $ (0.32) $ (0.33) $ (0.81) $ 0.06 Diluted earnings per common units: Income from continuing operations $ (0.32) $ (0.34) $ (0.86) $ (0.28) Discontinued operations - 0.01 0.05 0.34 Net income (loss) available to common unitholders $ (0.32) $ (0.33) $ (0.81) $ 0.06 Quarter Ended 2020 December 31 September 30 June 30 March 31 Total revenues $ 76,564 $ 79,197 $ 74,197 $ 83,604 Net income (loss) $ 78,298 $ (41,118) $ (32,934) $ (37,844) Net income (loss) available to common unitholders $ 72,623 $ (46,694) $ (38,576) $ (44,139) Basic earnings per common unit: Income from continuing operations $ 0.22 $ (0.83) $ (0.50) $ (0.40) Discontinued operations 0.45 0.34 0.09 (0.07) Net income (loss) available to common unitholders $ 0.67 $ (0.49) $ (0.41) $ (0.47) Diluted earnings per common unit: Income from continuing operations $ 0.22 $ (0.83) $ (0.50) $ (0.40) Discontinued operations 0.45 0.34 0.09 (0.07) Net income (loss) available to common unitholders $ 0.67 $ (0.49) $ (0.41) $ (0.47) VERIS RESIDENTIAL, INC., VERIS RESIDENTIAL, L.P. AND SUBSIDIARIES REAL ESTATE INVESTMENTS AND ACCUMULATED DEPRECIATION December 31, 2021 (dollars in thousands) SCHEDULE III Gross Amount at Which Costs Carried at Close of Initial Costs Capitalized Period (a) Property Year Related Building and Subsequent to Building and Accumulated Property Location Type Built Acquired Encumbrances Land Improvements Acquisition (c) Land Improvements Total (d) Depreciation (b) NEW JERSEY Essex County Millburn (Short Hills) The Upton Multifamily 2021 74,328 2,850 - 91,673 2,850 91,673 94,523 2,154 Hudson County Hoboken 111 River Street Office 2002 2016 148,897 - 198,609 15,604 - 214,213 214,213 31,096 Soho Lofts Multifamily 2017 2019 159,112 27,601 224,039 4,663 27,601 228,702 256,303 18,774 Jersey City Harborside Plaza 2 Office 1990 1996 - 17,655 101,546 73,669 8,363 184,507 192,870 87,603 Harborside Plaza 3 Office 1990 1996 - 17,655 101,878 73,337 8,363 184,507 192,870 87,603 Harborside Plaza 5 Office 2002 2002 - 6,218 170,682 63,367 5,705 234,562 240,267 118,295 Harborside Plaza 6 Office 2000 2000 - 1,244 56,144 13,364 1,244 69,508 70,752 31,273 101 Hudson Street Office 1992 2005 249,056 45,530 271,376 49,831 45,530 321,207 366,737 128,442 Liberty Towers Multifamily 2003 2019 263,888 66,670 328,347 7,344 66,670 335,691 402,361 19,718 BLVD 475 N/S Multifamily 2011 2017 164,915 58,761 240,871 6,323 58,761 247,194 305,955 33,036 BLVD 425 Multifamily 2003 2018 130,420 48,820 160,740 5,611 48,820 166,351 215,171 16,350 BLVD 401 Multifamily 2016 2019 116,447 36,595 152,440 438 36,595 152,878 189,473 12,038 Weehawken 100 Avenue at Port Imperial Other 2016 2016 - 350 - 30,734 1,958 29,126 31,084 5,313 500 Avenue at Port Imperial Other 2013 2013 32,443 13,099 56,669 (19,331) 13,099 37,338 50,437 7,898 Riverhouse 9 Multifamily 2021 86,917 2,686 - 131,280 2,686 131,280 133,966 1,323 Riverhouse 11 Multifamily 2018 2018 99,854 22,047 - 112,301 22,047 112,301 134,348 11,257 Residence Inn/Envue Autograph Collection Other 2019 2015 88,714 23,660 - 74,655 16,866 81,449 98,315 13,101 West New York Port Imperial North Retail Other 2008 2020 - 4,305 8,216 695 4,305 8,911 13,216 647 Monmouth County Holmdel 23 Main Street Office 1977 2005 - 4,336 19,544 6,400 4,336 25,944 30,280 11,671 Morris County Morris Plains Signature Place Multifamily 2018 2018 42,752 930 - 56,414 930 56,414 57,344 6,103 NEW YORK Westchester County Eastchester Quarry Place at Tuckahoe Multifamily 2016 2016 40,631 5,585 3,400 48,953 5,585 52,353 57,938 7,780 MASSACHUSETTS Middlesex County Malden The Emery at Overlook Ridge Multifamily 2020 2014 71,426 4,115 86,093 10,023 9,103 91,128 100,231 5,310 Suffolk County East Boston Portside at Pier One Multifamily 2015 2016 58,880 - 73,713 656 - 74,369 74,369 14,022 Portside 5/6 Multifamily 2018 2018 96,633 - 37,114 77,248 - 114,362 114,362 12,335 Worcester County Worcester 145 Front Street Multifamily 2018 2015 62,645 4,380 - 92,178 4,380 92,178 96,558 10,752 Projects Under Development and Developable Land 253,112 259,107 761,990 - 259,106 761,990 1,021,096 49,059 Furniture, Fixtures and Equipment - - - 100,011 - 100,011 100,011 TOTALS 2,241,070 674,199 3,053,411 1,127,441 654,903 4,200,147 4,855,050 (e) 742,953 (a)The aggregate cost for federal income tax purposes at December 31, 2021 2020 2019 Rental Properties Balance at beginning of year $ 4,638,643 $ 4,256,681 $ 5,306,017 Additions 1,002,342 1,776,276 1,349,959 Real estate held for sale (778,184) (944,082) (1,553,383) Properties sold (744,810) (443,755) (824,167) Impairments (27,547) - - Retirements/disposals (13,578) (6,477) (21,745) Balance at end of year $ 4,076,866 $ 4,638,643 $ 4,256,681 Accumulated Depreciation Balance at beginning of year $ 656,331 $ 558,617 $ 1,097,868 Depreciation expense 102,062 104,421 156,250 Real estate held for sale (159,541) 2,238 (411,833) Properties sold - - (261,923) Impairments (1,858) (2,469) - Retirements/disposals (13,578) (6,477) (21,745) Balance at end of year $ 583,416 $ 656,331 $ 558,617 VERIS RESIDENTIAL, INC. Exhibit Exhibit Title 3.1 3.2 3.3 3.4 4.1 4.2 21.1* 21.2* 23.1* 23.2* 31.1* 31.2* 31.3* 31.4* 32.1* 32.2* 101.1* The following financial statements from Veris Residential, Inc. and Veris Residential, L.P. from their combined Report on Form 10-K for the year ended December 31, 104.1* The cover page from this Annual Report on Form 10-K formatted in Inline XBRL. VERIS RESIDENTIAL, INC. Veris Residential, Inc. (Registrant) Date: February By: /s/ Mahbod Nia Mahbod Nia Chief Executive Officer (principal executive officer) Date: February By: /s/ Amanda Lombard Amanda Lombard Chief (principal financial officer and principal accounting officer) Veris Residential, L.P. (Registrant) By: Veris Residential, Inc. its General Partner Date: February By: /s/ Mahbod Nia Mahbod Nia Chief Executive Officer (principal executive officer) Date: February By: /s/ Amanda Lombard Amanda Lombard Chief (principal financial officer and principal accounting officer) Pursuant to the requirements of the Securities Exchange Act of 1934, this report has been signed below by the following persons on behalf of the Registrant and in the capacities and on the dates indicated: /s/ Tammy K. Jones Chair of the Board Tammy K. Jones /s/ Chief Executive Officer and Director Mahbod Nia (principal executive officer) /s/ Amanda Lombard Chief Financial Officer (principal financial /s/ Frederic Cumenal Director /s/ Ronald Dickerman February 21, 2024 Ronald Dickerman /s/ Nori Gerardo Lietz February 21, 2024 /s/ Victor MacFarlane February 21, 2024 Victor MacFarlane Director Howard S SternYESx No o NO YESYes x NONo oYESYes o No NOxYESYes o NONo xYESx No o NO YESYes x NONo oYESx No o NO YESYes x NONo oAccelerated filer Non-accelerated filer Smaller reporting company Emerging growth company o Accelerated filer Non-accelerated filer Smaller reporting company Emerging growth company o YES x NO If securities are registered pursuant to Section 12(b) of the Act, indicate by check mark whether the financial statements of the registrant included in the filing reflect the correction of an error to previously issued financial statements.oVeris Residential, Inc. o Veris Residential, L.P. o Veris Residential, Inc. o Veris Residential, L.P. o o NO ☒o NO ☒2021,2023, the aggregate market value of the voting stock held by non-affiliates of Veris Residential, Inc. was $1,484,991,935.$1,287,891,323. The aggregate market value was computed with reference to the closing price on the New York Stock Exchange on such date. This calculation does not reflect a determination that persons are affiliates for any other purpose. The registrant has no non-voting common stock.18, 2022, 90,948,67515, 2024, 92,229,209 shares of common stock, $0.01 par value, of Veris Residential, Inc. (“Common Stock”) were outstanding.20212023 to be issued in conjunction with the registrant’s annual meeting of shareholders expected to be held on June 15, 202212, 2024 are incorporated by reference in Part III of this Form 10-K. The definitive proxy statement will be filed by the registrant with the SEC not later than 120 days from the end of the registrant’s fiscal year ended December 31, 2021. 2023.20212023 of Veris Residential, Inc. and Veris Residential, L.P. Unless stated otherwise or the context otherwise requires, references to the “Operating Partnership” mean Veris Residential, L.P., a Delaware limited partnership, and references to the “General Partner” mean Veris Residential, Inc., a Maryland corporation and real estate investment trust (“REIT”), and its subsidiaries, including the Operating Partnership. References to the “Company,” “Veris,” “we,” “us” and “our” mean collectively the General Partner, the Operating Partnership and those entities/subsidiaries consolidated by the General Partner. construction and tenant-related services for its General Partner. The Operating Partnership, through its operating divisions and subsidiaries, including the Veris property-owning partnerships and limited liability companies, is the entity through which all of the General Partner’s operations are conducted. The General Partner is the sole general partner of the Operating Partnership and has exclusive control of the Operating Partnership’s day-to-day management.2021,2023, the General Partner owned an approximate 91.091.4 percent common unit interest in the Operating Partnership. The remaining approximate 9.08.6 percent common unit interest is owned by limited partners. The limited partners of the Operating Partnership are (1) persons who contributed their interests in properties to the Operating Partnership in exchange for common units (each, a “Common Unit”) or preferred units of limited partnership interest in the Operating Partnership or (2) recipients of long term incentive plan units of the Operating Partnership pursuant to the General Partner’s executive compensation plans.·•enhance investors’ understanding of the General Partner and the Operating Partnership by enabling investors to view the business as a whole in the same manner as management views and operates the business of the Company;·•eliminate duplicative disclosure and provide a more streamlined and readable presentation because a substantial portion of the disclosure applies to both the General Partner and the Operating Partnership; and·•create time and cost efficiencies through the preparation of one combined report instead of two separate reports.other significant assets, liabilities or operations, other than its interests in the Operating Partnership, nor does the Operating·•Item 7. Management’s Discussion and Analysis of Financial Condition and Results of Operations includes information specific to each entity, where applicable;·•Item 8. Financial Statements and Supplementary Data which includes the following specific disclosures for Veris Residential, Inc.the General Partner and Veris Residential, L.P.:the Operating Partnership:•Note 2. Significant Accounting Policies, where applicable;•Note 15.14. Redeemable Noncontrolling Interests;•Note 16.15. Veris Residential, Inc.’s Stockholders’ Equity and Veris Residential, L.P.’s Partners’ Capital;•Note 17.16. Noncontrolling Interests in Subsidiaries; and•Note 18.17. Segment Reporting, where applicable; andapplicable.Note 20. Condensed Quarterly Financial Information (unaudited).
fully-integrated,fully-integrated, self-administered and self-managed real estate investment trust (“REIT”). In December 2021,changed its names from Mack-Cali Realty Corporationis focused on conducting business in a socially, ethically, and environmentally responsible manner, while seeking to maximize value for all stakeholders.Veris Residential, Inc. and Mack-Cali Realty, L.P. to Veris Residential, L.P. reflecting the Company’s continued transition to a multifamily REIT, andwas incorporated on December 10, 2021, the General Partner began trading on the New York Stock Exchange (“NYSE”) under its new ticker symbol, “VRE.” May 24, 1994.91.091.4 percent and 90.490.7 percent common unit interest in the Operating Partnership as of December 31, 20212023 and 2020,2022, respectively. The General Partner’s business is the ownership of interests in and operation of the Operating Partnership and all of the General Partner’s expenses are incurred for the benefit of the Operating Partnership. The General Partner is reimbursed by the Operating Partnership for all expenses it incurs relating to the ownership and operation of the Operating Partnership.The Operating Partnership conducts the business of providing management, leasing, acquisition, development, construction and tenant-related services for its General Partner. The Operating Partnership, through its operating divisions and subsidiaries, including the Veris property-owning partnerships and limited liability companies, is the entity through which all of the General Partner’s operations are conducted. Unless stated otherwise or the context requires, the “Company” refers to the General Partner and its subsidiaries, including the Operating Partnership and its subsidiaries.The Company owns and operates a real estate portfolio comprised predominantly of multifamily rental properties located primarily in the Northeast, as well as a portfolio of Class A office properties. The Company performs substantially all real estate management, leasing, acquisition and development on an in-house basis. Veris Residential, Inc. was incorporated on May 24, 1994. The Company’s executive offices are located at Harborside 3, 210 Hudson Street, Suite 400, Jersey City, New Jersey 07311, and its telephone number is (732) 590-1010. The Company has an internet website at www.verisresidential.com.2021,2023, the Company owned or had interests in 2224 multifamily rental properties as well as non-corenon-strategic assets comprised of sevenone office buildings,property and four parking/retail properties, and three hotels, plus developable land (collectively, the “Properties”"Properties"). The Properties are comprised of: (a) 2721 wholly-owned or Company-controlled properties, comprised of 1517 multifamily properties and 12four non-core assets, and (b) nineeight properties owned by unconsolidated joint ventures in which the Company has investment interests, including seven multifamily properties and twoone non-core assets.asset. The Properties are located in three states in the Northeast, plus the District of Columbia. For more information on the Properties, refer to Item 2.STRATEGIC DIRECTIONOn December 19, 2019,announced thatsubstantially completed its Board had determinedmulti-year transformation to sell the Company’s entire suburban New Jersey office portfolio totaling approximately 6.6 million square feet, which had excluded the Company’s office properties in Jersey City and Hoboken, New Jersey (collectively, the “Suburban Office Portfolio”).a pure-play multifamily REIT. As the decision to sell the Suburban Office Portfolio represented apart of this strategic shift in the Company’s operations, these properties’ results (other than a single property not qualified to be classified as held for sale) are being classified as discontinued operations for all periods presented herein. In late 2019 and through December 31, 2021,initiative, the Company completedsought to unlock shareholder value by simplifying its business, strengthening its balance sheet, enhancing its operational platform and aligning the sale of all but oneCompany with its corporate values and the sustainability-conscious lifestyle preferences of its 37residents.in its Suburban Office Portfolio, totaling 6.3 million square feet, for net sales proceeds of $1.0 billion.Transitionwith premium amenities and offerings that reflect our commitment to Multifamily CompanyIn December 2021, the Company announced that it has rebranded to Veris Residential, Inc. reflecting its ongoing transition into a multifamily Companysustainability. This includes facilities such as clubrooms and lounges, state-of-the-art fitness centers, dog parks and rooftop swimming pools, as well as sustainability-driven features like electric vehicle (EV) charging stations, bee hives, hydroponic gardens and green roofs. The Company believes that amenities such as the ones offered at our multifamily properties drive resident satisfaction, command higher monthly rents, and generate additional revenues through amenity fees. When coupled with our commitment to providing premium resident services, such as concierges and professionally-curated events, the Company seeks to offer a multifamily experience that will maximize resident satisfaction and optimize rental revenue.new corporate valuesportfolio of Class A multifamily assets through a combination of acquisitions, value-add redevelopments and focus on conducting business in a socially, ethically, and environmentally responsible manner, while seeking to maximize value for all stakeholders.continue to pursue opportunities to streamline its portfolio and enhance the stabilitygenerate internal growth through organic optimization of its revenue stream,existing portfolio by recycling capital from non-strategic asset dispositions into debt repayments, value-add redevelopments, share buybacks, new developments, and acquisitions. These investments will convert low- to no-yieldingpursue overall expense savings from internal reorganizations which may result from the transitionin its core focus area of the Company’s real estate portfolio.Environmental- and Socially-Conscious ConsiderationsThe Company’s Board of Directors and management team have worked on weaving environmental, social, and governance considerations (“ESG”) into the fabric ofnon-strategic assets. When considering acquisitions, the Company including throughmay seek opportunities that improve the establishmentgeographic diversity, asset quality, and product offering of its Environmental, Social and Governance Committee (“ESG Committee”) in July 2020. By strategically assessing and managing evolving ESG risks and opportunities while integrating ESG considerations into its overall business model, theportfolio.is seeking to not only generate long-term value for its shareholders, but also positively impact its residents, tenants, employees and the communities it serves.SUSTAINABILITYOur Sustainability StrategyAt Veris Residential, the Company’s goal isaims to conduct its business, development, and operations of new and existing buildings in a manner that contributes to positive environmental, social and economic outcomes for all its shareholders, employees, residents, tenants and communities.The Company is focused on developing and maintaining high-quality properties, while reducing operational costs and mitigating the potential external impacts of energy, water, waste, greenhouse gas emissions and climate change.stakeholders. The Company’s dedicated in-house team initiates and applies sustainable practices throughout all aspects of its business from investment and development toincluding property operations and resident experience.Veris Residential is a signatory to the Ten Principles of the United Nations Global Compact and was the first U.S. real estate company to join the Climate Group's EV 100 initiative. The Company is also a corporate member of the U.S. Green Building Council® and has a history of developing properties certified under the USGBC’s Leadership in Energy and Environmental Design™ (LEED®) rating system. In 2021, 25 percent (by number of units) of its wholly ownedCompany’s multifamily portfolio was LEED® certified and Harborside 1, its 399,600 square feet office property in Jersey City is expected to achieve LEED® Gold certification.The Company’s existing multifamily portfolio has a sector-leading average property age of 6 years, and environmental considerations – particularly focused on energy consumption, water consumption and greenhouse gas emissions – have been integrated into many existing properties and development projects since the design stage.properties. The Company has also invested in energy-saving technology, such as those for irrigation, lighting, and HVAC to positively impact resident experience and its assets’asset value over the long-term. To improve its overall carbon footprint, the Company carefully assesses its buildings’ location based on walkability as well as accessibility to public transport, neighborhoods and parks. The Company’s office properties are located on the Jersey City Waterfront, adjacent to the PATH station, light rail, ferry and other transport hubs. In addition, halfAs a result of the Company’s wholly ownedthese efforts 80% of our multifamily portfolio is classified as “Walkers Paradise,”green certified (LEED®, ENERGY STAR® or equivalent). The Company believes that its focus on sustainability also enhances value for the highest standard by WalkScore®.Company in the short-term, through savings in utility expenses and higher interest from sustainability conscious residents.wellbeingwell-being of its employees, residents and tenants, which the Company has enhanced through the inclusion of on-site amenity offerings, including hydroponics gardens, fitness centers and on-demand fitness programs, as well as health and safety considerations across the portfolio and within its corporate offices. The Company’s efforts led to the achievement of WELL® Health-Safety rating across all of its managed locations.obtain WELL® Healthinvestors, lenders, and Safety certification for 14 multifamily properties in 2021.other stakeholders. The Company publishes an annual ESG Report that is aligned with the Global Reporting Initiative reporting framework and United Nations Sustainable Development Goals, and includes the Company’s strategy, key performance indicators, annual like-for-like comparisons, and year-over-year achievements.reality andreality. As a result, the Company is taking measured stepsaction to mitigate its carbon footprint by assessing risks and adapting its business to ensure it is well positioned over the long-term. Event-driven (acute) and longer-term (chronic) physical risks that may result from climate change could have a material adverse effect on the Company’s properties, operations, and business. Management’s role inResponsibility for assessing and managing these climate-related risks and initiatives is spread across multiple teamsowned by every team throughout the Company’s organization, including its executive leadershipCompany, with oversight by the management team's ESG Task Force and its Sustainability, Development,the Board's Nominating, Environmental, Social and Property Management departments.Governance Committee. The Company views its proactive assessment of risks related to climate change as an opportunity to protect asset value, and as such, is implementing measures, planning and decision-making processes to protect its investments by improving resilience.ReportingA significant part of the Company’s commitment to sustainable development and operations is its commitment to transparent reporting of ESG performance indicators, as it recognizes the importance of this information to investors, lenders, and other stakeholders. The Company publishes an annual Corporate Social Responsibility (“CSR”) report that is aligned with the Global Reporting Initiative reporting framework, United Nations Sustainable Development Goals and includes the Company’s strategy, key performance indicators,annual like-for-like comparisons, and year-over-year achievements. In addition, Since 2022 the Company continueshas met its target validated by the Science Based Target initiative to work to further alignreduce its reporting with the recommendations of the Financial Stability Board’s Task Force on Climate-related Financial Disclosures to disclose climate-related financial riskslike-for-like Scope 1 and opportunities.2 greenhouse gas emissions by 50%.OverviewVeris Residential is a fully-integrated REIT that, unlike many other real estate companies that outsource management and leasing to third party vendors, performs substantially all real estate management, leasing, property transactions, and development in-house.2021,2023, the Company had approximately 234197 employees, 24 fewer than it had as of December 31, 2020. The reduction in the number of employees was primarily due to the ongoing disposition of its Suburban Office Portfolio and consolidation of its operational and organization infrastructure across its office and multifamily businesses. Regarding employee tenure, 36 percent30% of its employees have been with the Company for at least 10 years, of which 24 percent of those employees have a tenure of at least 15 years, and 12 percent have a tenure of at least 20 years.Approximately 64 percent of the Company’s employees are directly involved in property management, management services, and on-site leasing and maintenance of its portfolio, including property managers, maintenance engineers, technicians, HVAC technicians, and project managers. All these personnel salaries and related costs are allocated to its real estate portfolio and management businesses and recorded in operating services or real estate services expenses. Less than five percent of the Company’s employees work in the corporate development department and are directly involved in the Company’s development pipeline. When applicable, personnel salaries and related costs of such development employees are capitalized as a development expenditure. Generally, all other employee costs, are recorded as general and administrative expense, including corporate office leasing personnel.Diversity, Equity and Inclusion (DE&I)At Veris Residential, the Company believes that valuing individual differences, maintaining a unified culture grounded in equality and meritocracy and creating an environment of inclusion across all facets of its business is critical to its continued success. its responsibility towards the diverse and all-inclusive communities it serves and has taken proactivefocused efforts to enhance this support to have positive impact on residents, employees and others.employees. Such efforts have included: increasing gender and ethnic diversity within the Company and its Board of Directors,included establishing employee affinity groups and introducing company wide diversity training. The Company has also becomeis a signatory of the CEO Action for Diversity & Inclusion Pledge and the UN WomenPrinciples.Principles and is included in the Bloomberg GEI index since 2023. Currently, five of the nine members (or 56 percent) of the Company’s Board of Directors are female and/or racially diverse.•5956 percent of the Company’s employees identified as male, 40%43 percent as female and 1%below one percent as non-binary as of December 31, 2021•5052 percent of the Company’s employees were persons of color or other minority groups, as of December 31, 2021down from 53 percent a year earlier.Currently, 4 of the 8 members (or 50 percent) of the Company’s Board of Directors are female and/or racially diverseIt does so in a culture built on the foundations of collegiality, teamwork, hard work, humility, creativity, humor, respect, acceptance, expertise and dedication to one another, its stockholders and its residents.ForThe Company is also committed to ensuring that these benefits are attainable and affordable to its employees earning less than $50,000 annually, the Company pays 100 percent of theby limiting health insurance coverage premiums for its employees and their families, and generally 75 percent of the premiums of health and dental insurance coverage for all employees, as well as 100 percent of the cost ofproviding life insurance and short-term and long-term disability insurance. insurance at no cost to the employee.itsall eligible employees:•The Company maintains aA 401(k) plan with a history of annual discretionary Company employee match or profit sharing contributions;•The Company offersMinimum paid time off of 20 days in addition to public holidays, sick leave and other leaves offered by the company;costs for employees who have been with it for at least one year;costs.Employees receive numerous training resources, including modules on preventing unlawful harassment, hazardous communications and real estate licensing;The Company also promotes the philanthropic efforts of its employees by providing 24 hours of paid time off toward volunteerism and matching employee charitable contributions dollar for dollar (up to $1,000 per employee per year); andThe Company offers flexible working arrangements.CSRESG Report. Information contained on or accessed through the Company’s website is not considered part of this Annual Report nor any registration statement that incorporates this Annual Report by reference.COMPETITIONThe leasing ofis highly competitive. The Properties compete for residentscompanies to acquire, develop and tenants with lessors and developers of similar properties located in their respective markets primarily on the basis of location, the quality of properties, leasing terms (including rent and other charges and allowances for tenant improvements), services or amenities provided, the design and condition of the Properties, and reputation asmanage multifamily properties. As an owner and operator of multifamily properties, we also face competition for prospective residents from other operators whose properties may be perceived to offer a better location or better amenities or whose pricing may be perceived as a better value given the quality, properties inlocation, terms and amenities that the relevant markets. Additionally, the number of competitive multifamily rental properties in a particular area could have a material effect on the Company’s ability to lease residential unitsprospective resident seeks. We also compete against condominiums and on rents charged. Other forms of multifamily rental propertiessingle-family homes that are for sale or single family housing may also provide alternatives to potentialrent, including those offered through online platforms. Although we often compete against large, sophisticated developers and operators for development opportunities and for prospective residents, of multifamily properties. The Company also experiences competition when attempting to acquire or dispose of real estate includingdevelopers and operators of any size can provide effective competition from domesticfor both real estate assets and foreign financial institutions, other REITs, life insurance companies, pension trusts, trust funds, partnerships, individual investors and others. The Company competes with other entities, some of which may have significant resources or who may be willing to accept lower returns or pay higher prices than the Company in terms of acquisition and development opportunities. potential residents.Manygovernmental regulations, including those concerning entitlement, building, health and safety, site and building design, environment, zoning, sales, and similar matters which apply to or affect the ownership and/or operation of the Propertiesreal estate industry. Multifamily properties and changes in thesetheir owners are subject to various laws, ordinances, and regulations, or their interpretation by agencies and the courts, occur frequently.Under various lawsincluding those related to real estate broker licensing and regulations relating to the protection of the environmentrecreational facilities such as swimming pools, activity centers, and human health,other common areas. As an owner and operator of multifamily properties, we also may be subject to rent or rent stabilization laws. In addition, various federal, state, and local laws subject real estate may be held liableowners or operators to liability for management, and the costs of removal or remediation, of certain potentially hazardous or toxic substances located on or in the property. materials that may be present. even knew of, the presence of such substances. The presence of such substances may adversely affect the owner’s ability to rent or sell the property or to borrow using such property as collateral and may expose it to liability resulting from any release of, or exposure to, such substances. Persons who arrange for the disposal or treatment of hazardous or toxic substances at another location may also be liable for the costs of removal or remediation of such substances at the disposal or treatment facility, whether or not such facility is owned or operated by such person. Certain environmental laws impose liability for the release of asbestos-containing materials into the air, and third parties may also seek recovery from owners or operators of real properties for personal injury associated with asbestos-containing materials and other hazardous or toxic substances.(direct or indirect), operation, management and development of real properties, the Company mayestate, we could potentially be considered an owner or operator of such properties or as having arranged for the disposal or treatment of hazardous or toxic substances and, therefore, potentially liable for removalenvironmental liabilities or remediation costs as well as certain other related costs, including governmental penalties and injuries to persons and property.There can be no assurance that (i) future laws, ordinances or regulations will not impose any material environmental liability, (ii) the current environmental condition of the Properties will not be affected by tenants, by the condition of land or operationsassociated with our real estate, whether currently owned, acquired in the vicinity offuture, or owned in the Properties (such as the presence of underground storage tanks), or by third parties unrelatedpast. The risks related to the Company, or (iii) the Company’s assessments reveal allgovernment regulation, including health, safety and environmental liabilities and that therematters, are no material environmental liabilities of which the Company is aware. If compliance with the various laws and regulations, now existing or hereafter adopted, exceeds the Company’s budgets for such items, the Company’s ability to make expected distributions to stockholders could be adversely affected.There are no other laws or regulations which have a material effect on the Company’s operations, other than typical federal, state and local laws affecting the development and operation of real property, such as zoning laws.2021,2023, the Company does not have any foreign revenues and its business is not seasonal. Please see our financial statements attached hereto and incorporated by reference herein for financial information relating to our industry segments.2021,2023, no commercial tenant accounted for more than 10 percent of the Company’s consolidated revenues.Properties Commencing Initial OperationsDuring the year ended December 31, 2021,commenced initial operationsaccomplished a number of twoimportant milestones in substantially completing its transformation to a pure play multifamily REIT.locatedand four land parcels.Short HillsVRT for $520 million. Refer to Note 14: Redeemable Noncontrolling Interests for more details and Weehawken, New Jerseydefined terms.containing 506 apartment units, which was completed for total costs of approximately $265.9 million. See Note 3 to the Financial Statements: Recent Transactions.Dispositions/Real Estate Held for SaleDuring the year ended December 31, 2021, the Company disposed of 16 office properties, three land leases and two developable land properties in New Jersey for net sales$60 million revolving credit facility. The full proceeds of approximately $716the term loan and $52 million with net gains recorded onof the salesrevolving credit facility were drawn in July 2023 to fund the early redemption of approximately $30.7 million from the dispositions. See Note 3 to the Financial Statements: Recent Transactions.Company identified two office properties and several developable land parcels as held for salefull balances were repaid as of December 31, 2021. The total estimated2023 using proceeds from non-strategic sales, cash flow from operations, and proceeds netfrom the refinancing of expected selling costs, from these sales are expectedHaus25.be approximately $920 million. In January 2022, the Company completedprior construction loan while improving the disposition of oneterm and distribution of the office properties held for sale atCompany's overall debt maturity profile.2021 for gross sales proceeds2023, 99.9% of $210 million. See Note 3the Company's total debt portfolio (consolidated and unconsolidated) was hedged or fixed at a weighted average interest rate of 4.5%. The debt portfolio has a weighted average maturity of 3.7 years.Financial Statements: Recent Transactions.2019 baseline.Unconsolidated Joint Venture ActivityOn April 29, 2021,Surpassing its goal of reducing energy consumption by 20 percent by 2030 well ahead of schedule, cutting consumption by 24 percent over the Company soldlast three years.interesttarget of sustainability addenda in the 12 Vreeland Road joint venture formore than 99 percent of residential leases.gross sales pricenational average of approximately $2 million, with no gain or loss on the transaction. See Note63.63.to the Financial Statements: Recent Transactions.On September 1, 2021, the Company sold its interest in the Offices at Crystal Lake joint venture to its venture partner for $1.9 million and recorded a loss on the sale of approximately $1.9 million in the year ended December 31, 2021. See Note 3 to the Financial Statements: Recent Transactions.Development ActivityThe Company is developing a 750-unit multifamily project at 25 Christopher Columbus, also known as Haus 25, in210 Hudson Street, Suite 400, Jersey City, New Jersey which began construction in the first quarter of 2019. The construction project, which07311, and its telephone number is estimated to cost $469.5 million, of which $425 million has been incurred through December 31, 2021, is expected to be ready for occupancy in the second quarter of 2022. The Company has funded $169.5 million of the construction costs, and the remaining construction costs are expected to be funded from a $300 million construction loan (of which $255.5 million was drawn as of December 31, 2021). See Note 13 to the Financial Statements: Commitments and Contingencies.Capital Markets ActivityIn May 2021, the Company entered into a revolving credit and term loan agreement that provides for a $250 million senior secured revolving credit facility (the “2021 Credit Facility”) and a $150 million senior secured term loan facility (the “2021 Term Loan”) and terminated its previous 2017 credit facility scheduled to mature in July 2021. The 2021 Team Loan was repaid in July of 2021. The Company also repaid various mortgages through a combination of sales, retirements and defeasances, and refinanced a construction loan with permanent financing. See Note 10 to the Financial Statements: Mortgages, loans payable and other obligations.In December 2021, the Company established an At-The-Market share offering program (“ATM Program”) through which the Company may issue and sell, from time to time, up to $200 million of shares of its common stock. See Note 16 to the Financial Statements: Veris Residential, Inc. Stockholders’ Equity and Veris Residential, L.P.’s Partners’ Capital.AVAILABLE INFORMATIONGeneral Partner or the Operating PartnershipCompany pursuant to Section 13(a) of the Securities Exchange Act of 1934, as amended, as soon as reasonably practicable after it electronically files or furnishes such materials to the Securities and Exchange Commission. In addition, the Company’s internet website includes other items related to corporate governance matters, including, among other things, the General Partner’sCompany’s corporate governance principles, charters of variousthe standing committees of the Board of Directors, of the General Partner and the General Partner’s code of business conduct and ethics applicable to all employees, officers and directors.directors, the Dodd-Frank clawback policy and insider trading policy. The General Partner intends to disclose on the Company’s internet website any amendments to or waivers from its code of business conduct and ethics as well as any amendments to its other governance documents, including without limitation the corporate governance principles, Dodd-Frank clawback policy, insider trading policy or the charters of variousthe standing committees of the Board of Directors. Copies of these documents may be obtained, free of charge, from our internet website. Any shareholder also may obtain copies of these documents, free of charge, by sending a request in writing to: Veris Residential, Inc. Investor Relations Department, Harborside 3, 210 Hudson St., Ste. 400, Jersey City, NJ 07311.Disclosure Regarding Forward-Looking StatementsIn addition, the extent to which the ongoing COVID-19 pandemic impacts us and our tenants and residents will depend on future developments, which are highly uncertain and cannot be predicted with confidence, including the scope, severity and duration of the pandemic, the actions taken to contain the pandemic or mitigate its impact, and the direct and indirect economic effects of the pandemic and containment measures, among others. Moreover, investors are cautioned to interpret many of the risks identified in the risk factors discussed in this Annual Report on Form 10-K for the year ended December 31, 2021, as well as the risks set forth below, as being heightened as a result of the ongoing and numerous adverse impacts of COVID-19.•risks and uncertainties affecting the general economic climate and conditions, which in turn may have a negative effect on the fundamentals of our business and the financial condition of our tenantsresidents and residents;tenants;•the value of our real estate assets, which may limit our ability to dispose of assets at attractive prices or obtain or maintain debt financing secured by our properties or on an unsecured basis;the extent of any tenant bankruptcies or of any early lease terminations;our ability to lease or re-lease space at current or anticipated rents;•changes in the supply of and demand for our properties, as well as demand for services or amenities at our properties;•our ability to attract, hire and retain qualified personnel;interest rate levels and volatility in the securities markets;operating costs;•our ability to complete construction and development activities on time and within budget, including without limitation obtaining regulatory permits and the availability and cost of materials, labor and equipment;our ability to attract, hire and retain qualified personnel;forward-looking financial and operational information, including information relating to future development projects, potential acquisitions or dispositions, leasing activities, capitalization rates, and projected revenue and income;changes in operating costs;•our ability to obtain adequate insurance, including coverage for losses resulting from catastrophes, natural disasters, pandemics and terrorist acts;•the extent of any tenant bankruptcies or of any early lease terminations;matters;matters, including rent stabilization laws or other housing laws and regulations; and•other risks associated with the development and acquisition of properties, including risks that the development may not be completed on schedule, that the tenantsresidents or residentstenants will not take occupancy or pay rent, or that development or operating costs may be greater than anticipated.The ongoing coronavirus ("COVID-19") pandemic and measures intended to prevent its spread present material uncertainty and risk and could have a material adverse effect on our business, results of operations, cash flows and financial condition.The global outbreak of COVID-19 across many countries around the globe, including the United States, has significantly slowed global economic activity, caused significant volatility in financial markets, and resulted in unprecedented job losses causing many to fear an imminent global recession. Certain states and cities, including all of the jurisdictions in which our properties are located, have taken measures to prevent or slow the spread of COVID-19, including by instituting quarantines, vaccination mandates, restrictions on travel, "stay-at-home" rules, restrictions on types of business that may continue to operate and/or restrictions on the types of construction projects that may continue. As a result, the COVID-19 pandemic is negatively impacting almost every industry directly or indirectly, including industries in which we and our customers operate. We have modified, and might further modify, our business practices as a result of the COVID-19 pandemic, the economic and social ramification of the disease, and the societal and governmental responses in the communities in which we operate. In addition, we have adapted our operations to protect our employees, including by implementing a work from home policy. As a result, many of our employees are currently working remotely. An extended period of remote work arrangements could strain our business continuity plans, introduce operational risk, including but not limited to cybersecurity risks, and impair our ability to manage our business.The COVID-19 pandemic presents material uncertainty and risk with respect to our financial condition, results of operations, cash flows and performance. The COVID-19 pandemic could negatively impact our business in a number of ways, including:a complete or partial closure of, or other operational issues at, one or more of our properties resulting from government or customer action;deterioration in the financial condition or liquidity of our tenants, customers or other counterparties, which could result in their inability to pay rents or failure to meet their contractual obligations to us;the potential negative impact on our ability to complete planned acquisitions or dispositions of assets on expected terms or timelines, or at all;reduced demand for space at our office properties and units at our multifamily residential properties, which could have a negative impact on our prospects for leasing current or additional space and/or renewing leases with existing tenants;difficulty accessing debt and equity capital on attractive terms, or at all, which could result in reduced availability and increased cost of capital necessary to fund business operations, finance our development pipeline or address maturing liabilities on a timely basis;costs associated with construction delays and cost overruns at our development and redevelopment projects;unanticipated costs and operating expenses associated with remote work arrangements, sanitation measures performed at each of our properties, and other measures to protect the welfare of our employees and tenants; andthe potential negative impact on the health of our employees, particularly if a significant number of them are impacted, which could result in a deterioration in our ability to ensure business continuity during this disruption.The extent to which the COVID-19 pandemic may adversely affect our business will depend on future developments, including, among others, the severity and duration of the pandemic, the effectiveness of COVID-19 vaccines in curbing the spread of the virus, the nature and duration of other measures taken to contain the pandemic or mitigate its impact, and the direct and indirect economic impact of the pandemic and containment measures on the industries in which we and our customers operate. Among other things COVID-19 and government and our responses to the virus could (1) adversely affect the ability of our suppliers and vendors to provide products and services to us; (2) make it more difficult for us to serve our tenants, including as a result of delays or suspensions in the issuance of permits or other authorizations needed to conduct our business; (3) cause labor shortages in the available labor force due to quarantine requirements thereby making it more difficult for us to attract, hire and retain qualified personnel; and (4) increase our cost of capital and adversely impact our access to capital. Due to factors beyond our knowledge or control, including the duration and severity of COVID-19, as well as third-party actions taken to contain its spread and mitigate its public health effects, at this time we cannot estimate or predict with certainty the impact of COVID-19 or the measures the government and we take in response thereto on our financial position, results of operations and cash flows.Adverse economic and geopolitical conditions in general and the Northeastern office markets in particular could have a material adverse effect on our results of operations, financial condition and our ability to pay distributions to you.Our business may be affected by the continuing volatility in the financial and credit markets, the general global economic conditions, continuing high unemployment, and other market or economic challenges experienced by the U.S. economy or the real estate industry as a whole. Our business also may be adversely affected by local economic conditions, as substantially all of our revenues are derived from our properties located in New Jersey, New York and Massachusetts.Because our portfolio currently consists primarily of multifamily and office rental buildings (as compared to a more diversified real estate portfolio) located in the Northeast, if economic conditions persist or deteriorate, then our results of operations, financial condition and ability to service current debt and to pay distributions to our shareholders may be adversely affected by the following, among other potential conditions:significant job losses in the financial and professional services industries may occur, which may decrease demand for our office space, causing market rental rates and property values to be negatively impacted;our ability to borrow on terms and conditions that we find acceptable, or at all, may be limited, which could reduce our ability to pursue acquisition and development opportunities and refinance existing debt, reduce our returns from both our existing operations and our acquisition and development activities and increase our future interest expense;reduced values of our properties may limit our ability to dispose of assets at attractive prices or to obtain debt financing secured by our properties and may reduce the availability of unsecured loans;the value and liquidity of our short-term investments and cash deposits could be reduced as a result of a deterioration of the financial condition of the institutions that hold our cash deposits or the institutions or assets in which we have made short-term investments, the dislocation of the markets for our short-term investments, increased volatility in market rates for such investments or other factors;reduced liquidity in debt markets and increased credit risk premiums for certain market participants may impair our ability to access capital; andone or more lenders under our line of credit could refuse or be unable to fund their financing commitment to us and we may not be able to replace the financing commitment of any such lenders on favorable terms, or at all.These conditions, which could have a material adverse effect on our results of operations, financial condition and ability to pay distributions, may continue or worsen in the future.real estate industry.operation of multifamily properties.•changes in the general economic climate and conditions;changes in local conditions, such as an oversupply of office space, a reduction in demand for office space, or reductions in office market rental rates;an oversupply or reduced demand for multifamily apartmentsproperties caused by a decline in household formation decline inor employment, a lack of employment growth or otherwise;•decreasedcorporate restructurings and/or layoffs, and industry slowdowns;to tenants and residents;are located or the quality of local schools;competition from other office and multifamily properties;•development by competitors of competing multifamily communities;•the inability or unwillingness of tenantsresidents to pay rent or rent increases;•changes in the financial condition of Fannie Mae or Freddie Mac which provide a major source of financing to the multifamily rental sector;•our inability to provide adequate maintenance;•increased operating costs, including insurance premiums, utilities and real estate taxes, due to inflation and other factors which may not necessarily be offset by increased rents;•changes in laws and regulations (including tax, environmental, zoning and building codes, landlord/tenant and other housing laws and regulations) and agency or court interpretations of such laws and regulations and the related costs of compliance;changes in interest rate levels and the availability of financing;the inability of a significant number of tenants or residents to pay rent;our inability to rent multifamily or office rental space on favorable terms; and•civil unrest, earthquakes, pandemics, acts of terrorism and other natural disasters or acts of God that may result in uninsured losses. also increase while our revenues do not. If our operating costs increase butsignificantly to the point that they exceed our rental revenues, do not, we may be forced to borrow to cover our costs and we may incur losses. Such losses may adversely affect our ability to make distributions or payments to our investors.Adverse developments concerning some:The Company has determined to sell over time properties deemed non-core assets. While we intend to dispose of these properties opportunistically over time, there can be no assurance that these dispositions will be completed during the period of our major tenantsstrategic initiative. In addition, market conditions will impact our ability to dispose of these properties, and industry concentrationsthere can be no assurance that we will be successful in disposing of these properties for their estimated sales prices. A failure to dispose of these properties for their estimated market values as planned, or unfavorable tax consequences of the disposition of these properties could have a negative impactmaterial adverse effect on our revenueability to finance our acquisition and development plans and could adversely affect our ability to make distributions or payments to our investors.: have tenants concentrated in various industries that may be experiencing adverse effects of current economic conditions. For instance, 13.5 percent of our revenue is derived from tenants inface general market and operational risks associated with the Securities, Commodity Contracts and Other Financial Servicesreal estate industry. Our business could be adversely affected if any of these industries suffered a downturn and/or these tenants or any other tenants became insolvent, declared bankruptcy or otherwise refused to pay rent in a timely manner or at all.We cannot guarantee that material losses in excess of insurance proceeds will not occur in the future. If any of our properties were to experience a catastrophic loss, it could seriously disrupt our operations, delay revenue and result in large expenses to repair or rebuild the property. Such events could adversely affect our ability to make distributions or payments to our investors. If one or more of our insurance providers were to fail to pay a claim as a result of insolvency, bankruptcy or otherwise, the nonpayment of such claims could have an adverse effect on our financial condition and results of operations. In addition, if one or more of our insurance providers were to become subject to insolvency, bankruptcy or other proceedings and our insurance policies with the provider were terminated ormightmay not recoupbe recouped or may exceed the amount of our investment. The prohibition in the Internal Revenue Code of 1986, asIn addition, we acquired a significant number of our properties from individuals to whom the Operating Partnership issued Units as part of the purchase price. In connection with the acquisition of these properties, in order to preserve such individual’s income tax deferral, we contractually agreed not to sell or otherwise transfer the properties for a specified period of time, except in a manner which does not result in recognition of any built-in-gain (which may result in an income tax liability) or which reimburses the appropriate individuals for the income tax consequences of the recognition of such built-in-gains. These restrictions expired in February 2016. Upon the expiration of such restrictions we are generally required to use commercially reasonable efforts to prevent any sale, transfer or other disposition of the subject properties from resulting in the recognition of built-in gain to the appropriate individuals. After the effects of tax-free exchanges on certain of the originally contributed properties, either wholly or partially, over time, five of our properties, as well as certain land and development projects, including properties classified as held for sale as of December 31, 2021, with an aggregate carrying value of approximately $1.0 billion, are subject to these conditions. The above limitations on our ability to sell our investments could adversely affect our ability to make distributions or payments to our investors.disposemitigate the effects of non-core office assets within our anticipated timeframe or at favorable prices: The Company has determined to sell over time properties at total estimated sales proceedsinflation and related impacts, and the duration and extent of up to $732 million. While we intend to disposeany prolonged periods of these properties opportunistically over time, there can be no assurance that these dispositions will be completed during the period of our strategic initiative. In addition, market conditions will impact our ability to dispose of these properties,inflation, and there can be no assurance that we will be successful in disposing of these properties for their estimated sales prices. A failure to dispose of these properties for their estimated market values as planned, or unfavorable tax consequences of the disposition of these properties could have a materialany related adverse effecteffects on our ability to finance our acquisitionresults of operations and development plans andfinancial condition, are unknown at this time. Inflation may also cause increased volatility in financial markets, which could adversely affect our ability to make distributionsaccess the capital markets or paymentsimpact the cost or timing at which we are able to do so.investors.New acquisitions,development and redevelopment projects, including, acquisitionsbut not limited to, costs of multifamily rental properties, may fail to perform as expectedconstruction materials, labor, and will subject us to additional new risksservices from third-party contractors and suppliers. Higher acquisition and construction costs could adversely affectimpact our net investments in real estate and expected yields on our development and redevelopment projects, which may make otherwise lucrative investment opportunities less profitable to us. Our commercial leases have fixed rent increases which may not increase in line with inflation, this causing our net operating income to decrease. As a result, our financial condition, results of operations, and cash flows, as well as our ability to make distributions or payments to our investorspay dividends, could be adversely affected over time.As our portfolio shifts from primarily commercial office properties to increasingly more multifamily rental properties we will face additional and new risks such as:shorter-term leases of one-year on average for multifamily rental communities, which allow residents to leave after the term of the lease without penalty;increased competition from other housing sources such as other multifamily rental communities, condominiums and single-family houses that are available for rent as well as for sale;dependency on the convenience and attractiveness of the communities or neighborhoods in which our multifamily rental properties are located and the quality of local schoolsIn addition, developers and other amenities;dependency on the financial condition of Fannie Mae or Freddie Mac which provide a major source of financing to the multifamily rental sector;real estate companies may compete with us in seeking properties for acquisition, land for development andcompliance with housing and other new regulations.The above factors could prospective tenants. Such competition may adversely affect our ability to make distributions or payments to our investors.investors by:asbestos-containingasbestos-containing or other materials into the air, water or otherwise into the environment. As owners and operators of property and as potential arrangers for hazardous substance disposal, we may be liable under such laws and regulations for removal or remediation costs, governmental penalties, property damage, personal injuries and related expenses. Payment of such costs and expenses could adversely affect our ability to make distributions or payments to our investors.Our: Certain investors, customers, regulators and other stakeholders have focused more on corporate sustainability strategies may not be effective. Our sustainability strategyresponsibility, specifically related to environmental, social and governance (“ESG”) factors. Additionally, there is focusedincreased attention on building and maintaining healthy, high-performance properties, while mitigating operational coststhese matters by various regulatory authorities, including the SEC, and the potential external impactsexpense and activities necessary to comply with new regulations or standards may be significant. Third-party providers of energy, water, waste, greenhouse gas emissionscorporate responsibility ratings and climate change. Failurereports on companies have also increased in number, resulting in varied, and in some cases, inconsistent standards. Some investors use these factors to developguide their investment strategies and, maintain sustainable buildings relativein some cases, may choose not to invest in us if they believe our peerspolicies relating to ESG are inadequate or objectionable.adversely impactresult in our abilityundertaking costly initiatives and activities to lease space at competitive ratesmeet any new regulations or criteria. Additionally, if we are unable to or elect not to satisfy any new regulation or criteria, or do not meet the criteria of a specific third-party provider, some investors may conclude our policies with respect to ESG are inadequate, and negatively impact our results of operations and portfolio attractiveness.Wewe may face risks associated with property acquisitions: reputational damage.acquiredcommunicated certain initiatives and goals regarding ESG matters in our 2022 ESG Report on our website, and we may communicate revised or additional initiatives or goals in the past, and our long-term strategy isfuture. We could be unsuccessful or perceived to continue to pursue the acquisition of rental properties, primarilybe unsuccessful in the Northeast, particularly multifamily rental properties. We mayachievement of our ESG initiatives or goals, or we could be competingcriticized for investment opportunities with entities that have greater financial resources. Several developersthe scope of our initiatives or goals. If we fail to meet the expectations of investors, customers, regulators, and real estate companies may compete with us in seeking properties for acquisition, land for development and prospective tenants. Such competition may adversely affectother stakeholders; our ability to make distributions or payments to our investors by:reducing the number of suitable investment opportunities offered to us;increasing the bargaining power of property owners;interfering with our ability to attract and retain tenants;increasing vacancies which lowers market rental rates and limits our ability to negotiate rental rates; and/oradversely affecting our ability to minimize expenses of operation.Our acquisition activities and their success are subject to the following risks:adequate financing to complete acquisitions may not be available on favorable terms or at all as a result of the continuing volatility in the financial and credit markets;even if we enter into an acquisition agreement for a property, we may be unable to complete that acquisition and risk the loss of certain non-refundable deposits and incurring certain other acquisition-related costs;the actual costs of repositioning or redeveloping acquired properties may be greater than our estimates;any acquisition agreement will likely contain conditions to closing, including completion of due diligence investigations to our satisfaction or other conditions thatinitiatives are not withinexecuted as planned; or we do not achieve our control, which may not be satisfied; andwe may be unable to quickly and efficiently integrate new acquisitions, particularly acquisitions of portfolios of properties, intogoals, our existing operations, and acquired properties may fail to perform as expected; which may adversely affect our results of operationsreputation and financial condition.•financing for development projects may not be available on favorable terms;•long-termlong-term financing may not be available upon completion of construction;•failure to complete construction and lease-up on schedule or within budget may increase debt service expense and construction and other costs; and•failure to rent the development at all or at rent levels originally contemplated. from time to time, invest in joint ventures or partnerships in which we do not hold a controlling interest in the assets underlying the entities in which we invest, including joint ventures in which (i) we own a direct interest in an entity which controls such assets, or (ii) we own a direct interest in an entity which owns indirect interests, through one or more intermediaries, of such assets. These investments involve risks that do not exist with properties in which we own a controlling interest with respect to the(ii)(v) we may be responsible to our co-venturers or partners for indemnifiable losses, (iii)(vi) we may become liable with respect to guarantees of payment or performance by the joint ventures, (iv)(vii) we may become subject to buy-sell arrangements which could cause us to sell our interests or acquire our co-venturer’s or partner’s interests in a joint venture, or (v)(viii) our co-venturers or partners may, at any time, have business, economic or other objectives that are inconsistent with our objectives. Because we lack a controlling interest, our co-venturers or partners may be in a position to take action contrary to our instructions or requests or contrary to our policies or objectives. While we seek protective rights against such contrary actions, there can be no assurance that we will be successful in procuring any such protective rights, or if procured, that the rights will be sufficient to fully protect us against contrary actions. Our organizational documents do not limit the amount of available funds that we may invest in joint ventures or partnerships. If the objectives of our co-venturers or partners are inconsistent with ours, it may adversely affect our ability to make distributions or payments to our investors.projects.projectscontrol, including, but not limited to, effects of COVID-19.control. We may be forced to purchase supplies and materials in larger quantities or in advance of when we would typically purchase them. This may cause us to require use of capital sooner than anticipated. Alternatively, we may also be forced to seek new third-party suppliers or contractors, whom we have not worked with in the past, and it is uncertain whether these new suppliers will be able to adequately meet our materials or labor needs. Our dependence on unfamiliar supply chains or relatively small supply partners may adversely affect the cost and timely completion of our construction projects. In addition, we may be unable to compete with entities that may have more favorable relationships with their suppliers and contractors or greater access to the required construction materials and skilled labor.During 2021,for certain construction materials, including steel, copper, lumber, plywood, electrical materials,or to obtain debt financing secured by our properties and HVAC materials, experienced significant increasesmay reduce the availability of unsecured loans;low inventories; surging demand fueled bya deterioration of the U.S. economy rebounding fromfinancial condition of the effectsinstitutions that hold our cash deposits or the institutions or assets in which we have made short-term investments, the dislocation of COVID-19; tariffs imposedthe markets for our short-term investments, increased volatility in market rates for such investments or other factors;imports of foreign steel, including on products from key competitors in the European Union (“EU”) and China; and significant changes in the U.S. steel production landscape stemming from the consolidation of certain steel-producing companies. Price surges on construction materials may result in corresponding increases in our development costs.favorable terms, or at all.CAPITAL AND FINANCING RISKS a significant portion of the Company’s portfolio from officediversified asset classes to exclusively multifamily rental properties.impairment charges or less than expected returns on office properties andcould adversely affect our ability to make distributions or payments to our investors: There can be no assurance that the Company, as it seeks to repositioncomplete the repositioning of a portion of its portfolio from office to the multifamily rental sector, will be able to sell office properties and purchase multifamily rental properties at prices that in the aggregate are profitable for the Company or are efficient uses of its capital or that would not result in a reduction of the Company’s cash flow, and such transactions could adversely affect our ability to make distributions or payments to our investors. Because real estate investments are relatively illiquid, it also may be difficult for the Company to promptlyIn addition, as the Company identifies non-core office properties that may be held for sale or that it intends to hold for a shorter period of time than previously, it may determine that the carrying value of a property is not recoverable over the anticipated holding period of the property. As a result, the Company may incur impairment charges for certain of these properties to reduce their carrying values to the estimated fair market values. Moreover, as the Company seeks to repositioncomplete the repositioning of a portion of its portfolio from office to the multifamily rental sector, the Company may be subject to a Federal income tax on gain from sales of properties due to limitations in the IRS Code and related regulations on a real estate investment trust’s ability to sell properties. The Company intends to structure its property dispositions in a tax-efficient manner and avoid the prohibition in the IRS Code against a real estate investment trust holding properties for sale. There is no guaranty, however, that such dispositions can be achieved without the imposition of federal income tax on any gain recognized.Unfavorable changes in market and economic conditions could adversely affect multifamily rental occupancy, rental rates, operating expenses, and the overall market value of our assets, including joint ventures. Local conditions that may adversely affect conditions in multifamily residential markets include the following:plant closings, industry slowdowns and other factors that adversely affect the local economy;an oversupply of, or a reduced demand for, apartment units;a decline in household formation or employment or lack of employment growth;the inability or unwillingness of residents to pay rent increases;rent control or rent stabilization laws, or other laws regulating housing, that could prevent us from raising rents to offset increases in operating costs; andeconomic conditions that could cause an increase in our operating expenses, such as increases in property taxes, utilities, compensation of on-site associates and routine maintenance.Failure to succeed in new markets, or with new brands and community formats, or in activities other than the development, ownership and operation of residential rental communities may have adverse consequences: We are actively engaged in development and acquisition activity in new submarkets within our core, Northeast markets where we have owned and operated our historical portfolio of office properties. Our historical experience with properties in our core, Northeast markets in developing, owning and operating properties does not ensure that we will be able to operate successfully in the new multifamily submarkets. We will be exposed to a variety of risks in the multifamily submarkets, including:an inability to accurately evaluate local apartment market conditions;an inability to obtain land for development or to identify appropriate acquisition opportunities;an acquired property may fail to perform as we expected in analyzing our investment;our estimate of the costs of repositioning or developing an acquired property may prove inaccurate; andlack of familiarity with local governmental and permitting procedures.market interest rates on loans to refinance indebtedness on our properties at maturity may be significantly higher than the interest rates on that existing indebtedness;•payments of principal and interest on borrowings may leave us with insufficient cash resources to pay operating expenses;•we may not be able to refinance indebtedness on our properties at maturity; and•if refinanced, the terms of refinancing may not be as favorable as the original terms of the related indebtedness.2021,2023, we had total outstanding indebtedness of $2.4$1.9 billion, comprised of no outstanding borrowings of $148 million under our revolving credit facility and approximately $2.2$1.9 billion of mortgages, loans payable and other obligations. We may have to refinance the principal due on our current or future indebtedness at maturity, and we may not be able to do so.•we may need to dispose of one or more of our properties upon disadvantageous terms or adjust our capital expenditures in general or with respect to our strategy of acquiring multifamily residential properties and development opportunities in particular;•prevailing interest rates or other factors at the time of refinancing could increase interest rates and, therefore, our interest expense;•we may be subject to an event of default pursuant to covenants for our indebtedness;•foreclosures upon mortgaged property could create taxable income without accompanying cash proceeds and, therefore, hinder our ability to meet the real estate investment trust distribution requirements of the IRS Code.TheSome of the mortgages on our properties contain customary negative covenants, including limitations on our ability, without the prior consent of the lender, to further mortgage the property, to enter into new leases outside of stipulated guidelines or to materially modify existing leases. In addition, our revolving credit facility containsand term loan facilities contain customary requirements, including restrictions and other limitations on our ability to incur debt, debt to assets ratios and interest coverage ratios. These revolving credit and term loan covenants may limit our flexibility in conducting our operations and create a risk of default on our indebtedness if we cannot continue to satisfy them. Some of our debt instruments are cross-collateralized and contain cross default provisions with other debt instruments. Due to this cross-collateralization, a failure or default with respect to certain debt instruments or properties could have an adverse impact on us or our properties that are subject to the cross-collateralization under the applicable debt instrument. Failure to comply with these covenants could cause a default under the agreements and, in certain circumstances, our lenders may be entitled to accelerate our debt obligations. Defaults under our debt agreements could materially and adversely affect our financial condition and results of operations.2021,2023, we have no outstanding borrowings of approximately $148 million under our revolving credit facility and approximately $570$304.5 million of our hedged mortgage indebtedness bearbears interest at variable rates. We may incur additional indebtedness in the future that bears interest at variable rates. Variable rate debt creates higher debt service requirements if market interest rates increase. Higher debt service requirements could adversely affect our ability to make distributions or payments to our investors and/or cause us to default under certain debt covenants.short-termshort-term borrowings (including our revolving credit facility), as well as from proceeds from property sales and undistributed cash. We expect to refinance projects purchased with short-termshort-term debt either with long-termlong-term indebtedness or equity financing depending upon the economic conditions at the time of refinancing. The Board of Directors has a general policy of limiting the ratio of our indebtedness to total undepreciated assets (total debt as a percentage of total undepreciated assets) to 50 percent or less, although there is no limit in our organizational documents on the amount of indebtedness that we may incur. However, we have entered into certain financial agreements which contain financial and operating covenants that limit our ability under certain circumstances to incur additional secured and unsecured indebtedness. The Board of Directors could alter or eliminate its current policy on borrowing at any time at its discretion. If this policy were changed, we could become more highly leveraged, resulting in an increase in debt service that could adversely affect our cash flow and our ability to make distributions or payments to our investors and/or could cause an increased risk of default on our obligations.$200$100 million At-The-Market equity offering commenced in December 2021,November 2023, may result in substantial dilution of our shareholders’ interests, and additional debt financing may substantially increase our leverage.leverage.Adverse changesobjectives, our partners may have interests that differ from ours and may be in a position to take actions without our credit ratings could adversely affectconsent that are inconsistent with our business and financial condition: The credit ratings previously assignedinterests. Further, if our partners were to our senior unsecured notes by nationally recognized statistical rating organizations (the “NRSROs”) were based on our operating performance, liquidity and leverage ratios, overall financial position and other factors employed byfail to invest additional capital in the NRSROs in their rating analyses of us. These ratings and similar ratings of us and any debt or preferred securitiesentity when required, we may issue are subjecthave to ongoing evaluation byinvest additional capital to protect our investment. Our partners have in the NRSROs,past failed, and we cannot assure you that any such ratings willmay in the future fail, to develop or operate the real property, operate the entity, refinance property indebtedness or sell the real property in the manner intended and as a result the entity may not be changed by the NRSROs if, in their judgment, circumstances warrant. Our credit ratings can affect the amount of capital we can access, as well as the terms of any financings we may obtain. There can be no assurance that we will be able to maintainredeem our current credit ratings, andinvestment or pay the return expected to us in the event our current credit ratings are downgraded, we would likely incur higher borrowing costs and may encounter difficulty in obtaining additional financing.Some of our costs, such as operating and general and administrative expenses, interest expense, and real estate acquisition and construction costs, are subject to inflation.A portion of our operating expenses is sensitive to inflation. These include expenses for property-related contracted services such as janitorial and engineering services, utilities, repairs and maintenance, and insurance. Property taxes are also impacted by inflationary changes as taxes are regularly reassessed based on changes in the fair value of our properties. We also have ground lease expenses in certain of our properties. Ground lease costs are contractual, but in some cases, lease payments reset every few years based on changes of consumer price indexes.Our operating expenses, with the exception of ground lease rental expenses, are typically recoverable through our lease arrangements, which allow us to pass through substantially all expenses associated with property taxes, insurance, utilities, repairs and maintenance, and other operating expenses (including increases thereto) to our tenants. During inflationary periods,a timely manner if at all. In addition, we may not be able to recoverdispose of our investment in the cost of increasesentity in operating expensesa timely manner or at the price at which we would want to divest. In the event that exceedsuch an entity fails to meet expectations or becomes insolvent, we may lose our entire investment in the fixed amounts for these expenses pursuant to our leases with tenants in our commercial office properties.Additionally, inflationary pricing may have a negative effect on the real estate acquisitions and construction costs necessary to complete our development and redevelopment projects, including, but not limited to, costs of construction materials, labor, and services from third-party contractors and suppliers. Higher acquisition and construction costs could adversely impact our net investments in real estate and expected yields on our development and redevelopment projects, which may make otherwise lucrative investment opportunities less profitable to us. Our commercial leases have fixed rent increases which may not increase in line with inflation, this causing our net operating income to decrease. As a result, our financial condition, results of operations, and cash flows, as well as our ability to pay dividends, could be adversely affected over time.the ongoing effects of the COVID-19 pandemic, including vaccination mandates, any diminution of our reputation, decrease in compensation levels relative to our competitors or modifications to our total compensation philosophy or competitor hiring programs. Competitive pressures may require that we enhance our pay and benefits package to compete effectively for such personnel. We may not be able to offset such added costs by increasing the rates we charge our tenants.residents. If we cannot attract, hire and retain qualified personnel, our business, financial condition and results of operations would be negatively impacted. Our future success also depends upon our ability to manage the performance of our personnel. Failure to successfully manage the performance of our personnel could affect our profitability by causing operating inefficiencies that could increase operating expenses and reduce operating income. officer, chief accounting officer and general counsel. While we believe that we could find replacements for these key personnel, loss of their services could adversely affect our operations. We do not have key man life insurance for our key personnel. In addition, as the Company seeks to repositioncomplete the repositioning of a portion of its portfolio from office to the multifamily rentalOur real estate construction management activities are subject to risks particular to third-party construction projects.As weperform fixed price construction services for third parties, we are subject to a variety of risks unique to these activities. If construction costs of a project exceed original estimates, such costs may have to be absorbed by us. In addition, a construction project may be delayed due to circumstances beyond our control, or the time required to complete a construction project may be greater than originally anticipated. If any such excess costs or project delays were to be material, such events may adversely affect our cash flow and liquidity and thereby impactlimit our ability to make distributionstake certain actions without the consent of some of the limited partners.paymentswind up the Operating Partnership; or (iii) to our investors.convey or otherwise transfer all or substantially all of the Operating Partnership’s assets.Partner'sPartner’s charter, as amended, subject to the rights of one or more classes or series of preferred stock to elect one or more directors, a director may be removed only forfrom office at any time, with or without cause, and only by the affirmative vote of at least two-thirdsa majority of allthe votes entitled to be cast by our stockholders generally in the election of directors. Neither the Maryland General Corporation Law nor the General Partner's charter define the term “cause.” As a result, removal for “cause” is subject to Maryland common law and to judicial interpretation and review in the context of the facts and circumstances of any particular situation.provisionsprovision of Maryland law which vest in the Board of Directors the exclusive right to determine the number of directors anddirectors. This provision of Maryland law is applicable even if other provisions of Maryland law, the charter or the bylaws provide to the contrary. The General Partner revoked its election to be subject to a certain other provision of Maryland law which vests in the Board of Directors the exclusive right, by the affirmative vote of a majority of the remaining directors, even if the remaining directors do not constitute a quorum, to fill vacancies on the board. These provisions ofThus under the General Partner’s bylaws, as amended, and Maryland law, which are applicable even ifany vacancy on the Board of Directors for any cause other provisionsthan an increase in the number of Maryland law ordirectors may be filled by a majority of the charter or bylaws provideremaining directors except that the stockholders have right to fill any vacancy resulting from removal of a director; and any vacancy on the contrary, also provide that anyBoard of Directors created by an increase in the number of directors may be filled by a majority of the entire Board of Directors. Any director elected by the Board of Directors to fill a vacancy shall hold office for the remainder of the full term of the class of directors in which the vacancy occurred, rather thanserves until the next annual meeting of stockholders as would otherwise be the case, and until his or hersuch director’s successor is elected and qualifies.qualifies, and any director elected by the stockholders to fill a vacancy resulting from removal of a director serves for the balance of the term of the removed director. The General Partner has, in its corporate governance principles, adopted a mandatory retirement age of 80 years old for directors.a majority25% of all the votes entitled to be cast at such meeting, provided that unless requested by the stockholders entitled to cast a majority of all votes entitled to be cast at such meeting.meeting, a special meeting need not be called to consider any matter which is substantially the same as a matter voted on at any special meeting of stockholders held during the preceding 12 months.General Partner’sCompany’s common stock.General Partner'sCompany's common stock depends on various market conditions, which may change from time to time. The market price of the General Partner'sCompany's common stock could change in ways that may or may not be related to our business, the General Partner'sCompany's industry or our operating performance and financial condition. Among the market conditions that may affect the value of the General Partner'sCompany's common stock are the following:•the general reputation of REITs and the attractiveness of the General Partner'sCompany's equity securities in comparison to other equity securities, including securities issued by other real estate-based companies;•our financial performance; and•general stock and bond market conditions.General Partner'sCompany's common stock is based primarily upon the market’s perception of our growth potential and our current and potential future earnings and cash dividends. Consequently, the General Partner'sCompany's common stock may trade at prices that are higher or lower than its net asset value per share of common stock.The enactment of significant new tax legislation, generally effective for tax years beginning after December 31, 2017, could have a material and adverse effect on us and the market price of our shares.On December 22, 2017, Pub. L. No. 15-97 (informally known as the Tax Cuts and Jobs Act (the “Act”)) was enacted into law. The Act made major changes to the Code, including a number of provisions of the Code that affect the taxation of REITs and their stockholders. The long-term effect of the significant changes made by the Act remains uncertain, and additional administrative guidance will be required in order to fully evaluate the effect of many provisions. The effect of any technical corrections with respect to the Act could have an adverse effect on us or our stockholders or holders of our debt securities.”In addition, the consent of the holders of at least 85 percent of the Operating Partnership’s partnership units is required: (i) to merge (or permit the merger of) the Operating Partnership with another unrelated person, pursuant to a transaction in which the Operating Partnership is not the surviving entity; (ii) to dissolve, liquidate or wind up the Operating Partnership; or (iii) to convey or otherwise transfer all or substantially all of the Operating Partnership’s assets. As of February 18, 2022, the General Partner owned approximately 91.0 percent of the Operating Partnership’s outstanding common partnership units.•it will not be allowed a deduction for dividends paid to shareholders;•it will be subject to federal income tax at regular corporate rates, including any alternative minimum tax, if applicable; and•unless it is entitled to relief under certain statutory provisions, it will not be permitted to qualify as a real estate investment trust for the four taxable years following the year during which was disqualified.2021,2023, the Company’s Consolidated Properties consisted of 1517 multifamily rental properties, as well as tenfour in-service commercial properties, and two hotels.several developable land parcels. The Consolidated Properties are located primarily in the Northeast. The Consolidated Properties are easily accessible from major thoroughfares and are in close proximity to numerous amenities. The Consolidated Properties contain a total of approximately 4,5455,535 apartment units and 4.91.0 million square feet of commercial space withspace.Multifamily Properties Property Location Apartment Units NEW JERSEY WATERFRONT Haus25 Jersey City, NJ 2022 750 94.1 4,396 Liberty Towers Jersey City, NJ 2003 648 93.2 4,058 BLVD 401 Jersey City, NJ 2016 311 97.4 4,025 BLVD 425 Jersey City, NJ 2003 412 95.6 3,921 BLVD 475 S Jersey City, NJ 2011 280 96.8 3,853 BLVD 475 N Jersey City, NJ 2011 243 96.3 4,200 Soho Lofts Jersey City, NJ 2017 377 94.4 4,557 RiverHouse 9 at Port Imperial Weehawken, NJ 2021 313 96.2 4,064 RiverHouse 11 at Port Imperial Weehawken, NJ 2018 295 94.6 4,044 Total New Jersey Waterfront Multifamily 3,629 95.0 4,154 MASSACHUSETTS Portside at East Pier East Boston, MA 2015 181 94.9 3,132 Portside 2 at East Pier East Boston, MA 2018 296 96.2 3,243 145 Front at City Square Worcester, MA 2018 365 92.9 2,601 The Emery at Overlook Ridge Revere, MA 2020 326 92.3 2,684 Total Massachusetts Multifamily 1,168 93.9 2,869 OTHER The Upton Short Hills, NJ 2021 193 91.7 4,693 The James Park Ridge, NJ 2021 240 96.3 2,947 Signature Place Morris Plains, NJ 2018 197 97.5 3,110 Quarry Place at Tuckahoe Eastchester, NY 2016 108 93.5 4,203 Total Other Multifamily 738 95.0 3,631 TOTAL MULTIFAMILY PROPERTIES 5,535 94.8 3,813 Office Properties Property Location Harborside Plaza 5 Jersey City, NJ 2002 977,225 34.6 17,027 45.93 49.23 TOTAL OFFICE PROPERTIES 977,225 34.6 17,027 45.93 49.23 Retail/Garage Properties Property Location 100 Avenue at Port Imperial Weehawken, NJ 2016 8,400 100.0 4,431 500 Avenue at Port Imperial Weehawken, NJ 2013 18,064 100.0 1,767 Riverwalk at Port Imperial West New York, NJ 2008 30,426 59.2 1,102 TOTAL RETAIL/GARAGE PROPERTIES 56,890 78.1 7,300 Developable Land Property Location Ownership Percentage Potential Units NEW JERSEY WATERFRONT 107 Morgan Jersey City, NJ 100% 783 Plaza 8 Jersey City, NJ 100% 680 Plaza 9 Jersey City, NJ 100% 597 PI South - Building 2 Weehawken, NJ 50% 245 Total New Jersey Waterfront Developable Land 2,305 MASSACHUSETTS Overlook Site 15 Revere, MA 100% 310 Overlook Site 1 (Retail) Revere, MA 100% (g) Overlook Site 13 Malden, MA 100% 307 Overlook Site 14 (Retail) Malden, MA 100% (g) Overlook Site 14 (Hotel) Malden, MA 100% 112 Overlook Site 14 Malden, MA 100% 120 Total Massachusetts Developable Land 849 OTHER Wall Land Wall Township, NJ 100% 228 Short Hills (Hotel) Short Hills, NJ 100% 160 keys 1633 Littleton Parsippany, NJ 100% (h) 65 Livingston Roseland, NJ 100% 252 6 Becker Farm / 85 Livingston Roseland, NJ 100% 439 1 Water Street White Plains, NY 100% 299 Total Other Developable Land 1,378 TOTAL DEVELOPABLE LAND 4,532 individualCompany’s Unconsolidated Joint Venture Properties consisted of seven multifamily rental properties, an in-service commercial properties ranging from 8,400 to 1,246,283property, and a developable land parcel. The Unconsolidated Joint Venture Properties are located in the Northeast and Washington, D.C. The Unconsolidated Joint Venture Properties contain a total of approximately 2,146 apartment units and 51.0 thousand square feet. The Consolidated Properties, managed by on-site employees, generally have attractively landscaped sites and atriums in addition to quality design and construction.feet of commercial space. The Company’s commercial tenants include many service sector employers, including a large numberunconsolidated interests range from 20 percent to 85 percent subject to specified priority allocations in certain of professional firms and national and international businesses. The Company believes that all of its in-service properties are well-maintained and do not require significant capital improvements.Unconsolidated Joint Ventures - Multifamily Properties Property Location Ownership Percentage Apartment Units NEW JERSEY WATERFRONT Urby at Harborside Jersey City, NJ 2017 85.00% 762 92.3 3,844 RiverTrace at Port Imperial West New York, NJ 2014 22.50% 316 95.6 3,641 The Capstone at Port Imperial West New York, NJ 2021 40.00% 360 95.0 4,272 Total New Jersey Waterfront Multifamily Properties 1,438 93.7 3,907 OTHER Riverpark at Harrison Harrison, NJ 2014 45.00% 141 92.2 2,746 The Metropolitan at 40 Park Morristown, NJ 2010 25.00% 130 95.4 3,577 Metropolitan Lofts Morristown, NJ 2018 50.00% 59 94.4 3,591 Station House Washington, DC 2015 50.00% 378 92.1 2,529 Total Other Multifamily Properties 708 92.9 2,853 TOTAL MULTIFAMILY PROPERTIES 2,146 93.4 3,559 Unconsolidated Joint Ventures - Retail Properties Property Location Ownership Percentage Shops at 40 Park Morristown, NJ 2010 25.00% 50,973 69.0 1,369 TOTAL RETAIL PROPERTIES 50,973 69.0 1,369 Unconsolidated Joint Ventures - Developable Land Property Location Ownership Percentage Potential Units PI North - Land West New York, NJ 20.00% 829 TOTAL DEVELOPABLE LAND 829 (a)Percentage leased includes all leases in effect as of the period end date, some of which have commencement dates in the future and leases expiring December 31, 2021 aggregating 24,545 square feet (representing 0.5 percent of the Company’s total net rentable square footage) for which no new leases were signed.(b)Total base rent for the year ended December 31, 2021, determined in accordance with generally accepted accounting principles (“GAAP”). Substantially all of the commercial leases provide for annual base rents plus recoveries and escalation charges based upon the tenant’s proportionate share of and/or increases in real estate taxes and certain operating costs, as defined, and the pass through of charges for electrical usage. For the 12 months ended December 31, 2021, total escalations and recoveries from tenants were: $16,821, or $5.40 per leased square foot, for office properties.(c) Excludes space leased by the Company.(d)Annualized base rent for the 12 months ended December 31, 2021 divided by units occupied at December 31, 2021, divided by 12.(e)Base rent for the 12 months ended December 31, 2021 divided by net rentable commercial square feet leased at December 31, 2021.(f) Total base rent, determined in accordance with GAAP, for 2021 minus 2021 amortization of tenant improvements, leasing commissions and other concessions and costs, determined in accordance with GAAP, divided by net rentable square feet leased at December 31, 2021.(g)As this property was acquired, commenced initial operations or initially consolidated by the Company during the 12 months ended December 31, 2021, the amounts represented in 2021 base rent reflect only that portion of those 12 months during which the Company owned or consolidated the property. Accordingly, these amounts may not be indicative of the property’s full year results. For comparison purposes, the amounts represented in 2021 average base rent per sq. ft. and per unit for this property have been calculated by taking the 12 months ended December 31, 2021 base rent for such property and annualizing these partial-year results, dividing such annualized amounts by the net rentable square feet leased or occupied units at December 31, 2021. These annualized per square foot and per unit amounts may not be indicative of the property’s results had the Company owned or consolidated the property for the entirety of the 12 months ended December 31, 2021.(h)Property is held for sale by the Company as of December 31, 2021.(i)Excludes properties being considered for repositioning, redevelopment, potential sale, or being prepared for lease up.(j)This property had Parking Income of $480 in 2021.(k)Excludes $(833) of adjustments to Base Rent in 2021.(l)This property had Parking Income of $2,064 in 2021.(m)This property had Hotel Income of $5,526 in 2021.(n)This property had Hotel Income of $5,092 in 2021.(o)Excludes approximately $27.8 million from properties which were disposed of or removed from service during the year ended December 31, 2021.(p)Includes $55.4 million from properties held for sale as of December 31, 2021.(q)Excludes Harborside Plaza 1, a 400,000 square foot office property which has been removed from service.IN-DEVELOPMENT PROPERTIESPERCENTAGE LEASEDThe following table sets forth the year-end percentages of multifamily units and commercial square feet leased in the Company’s stabilized operating Consolidated Properties for the last five years: of square-feet leased includes all leases in effect as of the period end date, some of which have commencement dates in the future and leases that expire at the period end date. For all years, excludes properties being prepared for lease up.future.Includes properties classifiedAverage Revenue per Home is calculated as heldtotal apartment revenue for sale asthe year divided by the average percent occupied for the year, divided by the number of apartments.2021.2023, determined in accordance with generally accepted accounting principles (“GAAP”). Substantially all of the commercial leases provide for annual base rents plus recoveries and escalation charges based upon the tenant’s proportionate share of and/or increases in real estate taxes and certain operating costs, as defined, and the pass through of charges for electrical usage. For the year ended December 31, 2023, total escalations and recoveries from tenants were: $3.3 million, or $8.89 per leased square foot, for office properties.(c)(d)Excludes properties being consideredBase rent for repositioning or redevelopment. Inclusive of such properties, percentage ofthe year ended December 31, 2023 divided by net rentable commercial square feet leased asat December 31, 2023.2019, 2018tenant improvements, leasing commissions and 2017 was 80.6, 81.7other concessions and 85.6 percent, respectively.costs, determined in accordance with GAAP, divided by net rentable square feet leased at December 31, 2023.
Significant Tenantsa schedulethe year-end occupancy of the Company’s 15 largest commercial tenantsConsolidated Multifamily Portfolio for the Consolidated Properties as of December 31, 2021 based upon annualized base rental revenue:(a)Includes office property tenants only. Excludes leases for amenity, retail, parking and month‑to‑month tenants. Some tenants have multiple leases.(b)Annualized base rental revenue is based on actual December 2021 billings times 12. For leases whose rent commences after January 1, 2022, annualized base rental revenue is based on the first full month’s billing times 12. As annualized base rental revenue is not derived from historical GAAP results, historical results may differ from those set forth above.(c)In January 2022, the Company completed the disposition of the office property where the tenant leases space.(d)MUFG Bank Ltd. Entered into a Surrender Agreement in January 2022. 100,274 square feet expired on January 31, 2022.(e)32,193 square feet expire in 2026; 56,181 expire in 2029.(f)63,372 square feet expire in 2023; 37,387 square feet expire in 2033.(g)22,300 square feet expire in 2022; 49,043 square feet expire in 2032.Schedule of Lease ExpirationsThe following table sets forth a schedule of lease expirations for the total of the Company’s office and stand-alone retail properties included in the Consolidated Properties beginning January 1, 2022, assuming that none of the tenants exercise renewal or termination options:(a)Includes office property tenants only. Excludes leases for amenity, retail, parking and month-to-month tenants. Some tenants have multiple leases.(b)Annualized base rental revenue is based on actual December 2021 billings times 12. For leases whose rent commences after January 1, 2022 annualized base rental revenue is based on the first full month’s billing times 12. As annualized base rental revenue is not derived from historical GAAP results, historical results may differ from those set forth above.(c)Includes leases expiring December 31, 2021 aggregating 24,545 square feet and representing annualized rent of $0.9 million for which no new leases were signed.(d)Reconciliation to Company’s total net rentable square footage is as follows:Square FeetSquare footage leased to commercial tenants3,395,499Square footage used for corporate offices, management offices, building use, retail tenants, food services, other ancillary service tenants and occupancy adjustments199,154Square footage unleased1,264,148Total net rentable commercial square footage (does not include land leases)4,858,801Market DiversificationProperties:Multifamily Portfolio:Market Annualized Base
Rental Revenue
($ in thousands) (a) (b)Percentage Of
Annualized
Base Rental
Revenue (%)New Jersey Waterfront 174,822 72.2 Massachusetts 37,768 15.6 Other 29,500 12.2 Totals 242,090 100.0 20212023 billings times 12. For leases whose rent commences after January 1, 2022,2024, annualized base rental revenue is based on the first full month’s billing times 12. As annualized base rental revenue is not derived from historical GAAP results, historical results may differ from those set forth above.future, and leases expiring December 31, 2021 aggregating 24,545 square feet and representing annualized base rent of $0.9 million for which no new leases were signed.future.Company’sCompany's common stock previously traded on the NYSE under the symbol “CLI”"CLI" prior to its name change discussed in Item 1.change. There is no established public trading market for the Operating Partnership’sPartnership's common units.The following table sets forth the quarterly high, low, and closing price per share of the General Partner's Common Stock reported on the NYSE for the years ended December 31, 2021 and 2020, respectively:February 18, 2022, the closing Common Stock price reported on the NYSE was $17.43 per share.On July 6, 2021,August 8, 2023, the General Partner filed with the NYSE its annual CEO Certification and Annual Written Affirmation pursuant to Section 303A.12 of the NYSE Listed Company Manual, each certifying that the General Partner was in compliance with all of the listing standards of the NYSE.HOLDERSOn February 18, 2022, the General Partner had 249 common shareholders of record (this does not include beneficial owners for whom Cede & Co. or others act as nominee) and the Operating Partnership had 62 owners of limited partnership units and one owner of General Partnership units.RECENT SALES OF UNREGISTERED SECURITIES; USES OF PROCEEDS FROM REGISTERED SECURITIESNone.DIVIDENDS AND DISTRIBUTIONSOn September 30, 2020, the Company announced that its Board of Directors was suspending its common dividends and distributions attributable to the third and fourth quarters 2020. As the Company’s management estimated that as of September 2020 it had satisfied its dividends obligations as a REIT on taxable income expected for 2020, the Board made the strategic decision to suspend its common dividends and distributions for the remainder of 2020 in an effort to provide greater financial flexibility during the pandemic and to retain incremental capital to support leasing initiatives at its Harborside commercial office properties on the Jersey City waterfront. On March 19, 2021, the Company announced that its Board of Directors would continue to suspend its common dividend for the remainder of 2021 in order to conserve capital and allow for greater financial flexibility during this period of heightened economic uncertainty and based on the Company’s projected 2021 taxable income estimates. The Company believes that with its estimated taxable income/loss for 2021, it will meet its dividend obligations as a REIT for the year with no dividends paid. The Company anticipates its regular quarterly common dividend to remain suspended while it seeks to conclude its transition into a pureplay multifamily REIT.The declaration and payment of dividends and distributions will continue to be determined by the Board of Directors of the General Partner in light of conditions then existing, including the Company’s earnings, cash flows, financial condition, capital requirements, debt maturities, the availability of debt and equity capital, applicable REIT and legal restrictions and the general overall economic conditions and other factors.PERFORMANCE GRAPH20162018 and that all dividends were reinvested. The price of the General Partner's Common Stock on December 31, 20162018 (on which the graph is based) was $29.02.$19.59. The past stockholder return shown on the following graph is not necessarily indicative of future performance.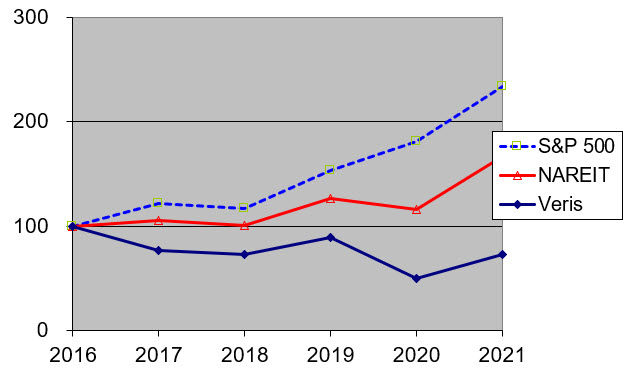

HOLDERS
Executive OverviewVeris Residential, Inc. together with its subsidiaries, (collectively, the “General Partner”), including Veris Residential, L.P. (the “Operating Partnership”), has been involved in all aspects of commercial real estate development, management and ownership for over 60 years and the General Partner has been a publicly traded real estate investment trust (“REIT”) since 1994.The Operating Partnership conducts the business of providing management, leasing, acquisition, development, construction and tenant-related services for its General Partner. The Operating Partnership, through its operating divisions and subsidiaries, including the Veris property-owning partnerships and limited liability companies, is the entity through which all of the General Partner’s operations are conducted. Unless stated otherwise or the context requires, the “Company” refers to the General Partner and its subsidiaries, including the Operating Partnership and its subsidiaries. The Company owns or has interests in 36 properties (collectively, the “Properties”), consisting of 22 multifamily rental properties containing 6,691 apartment units as well as non-core assets comprised of seven office properties, four parking/retail properties, three hotels plus developable land. The Properties are located in three states in the Northeast, plus the District of Columbia.The Company is a forward-thinking, environmentally and socially conscious REIT that primarily owns, operates, acquires, and develops holistically-inspired, Class A multifamily properties that meet the sustainability conscious lifestyle needs of today's residents while seeking to positively impact the communities it serves and the planet at large. The Company is guided by an experienced management team and Board of Directors and is underpinned by leading corporate governance principles, a best-in-class and sustainable approach to operations, and an inclusive culture based on equality and meritocratic empowerment.STRATEGIC DIRECTIONIn December 2021, the Company announced that it had rebranded to Veris Residential, Inc. reflecting its on-going transition into a multifamily Company as well as its new corporate values and focus on conducting business in a socially, ethically, and environmentally responsible manner, while seeking to maximize value for all stakeholders.The Company expects to continue to pursue opportunities to streamline its portfolio and enhance the stability of its revenue stream, as well as pursue overall expense savings from internal reorganizations which may result from the transition of the Company’s real estate portfolio.On December 19, 2019, the Company announced that its Board had determined to sell the Company’s entire suburban New Jersey office portfolio totaling approximately 6.6 million square feet, which had excluded the Company’s office properties in Jersey City and Hoboken, New Jersey (collectively, the “Suburban Office Portfolio”). As the decision to sell the Suburban Office Portfolio represented a strategic shift in the Company’s operations, these properties’ results (other than a single property not qualified to be classified as held for sale) are being classified as discontinued operations for all periods presented herein. See Note 7: Discontinued Operations – to the Financial Statements.Between late 2019 and December 31, 2021, the Company completed the sale of all but one of its 37 properties in its Suburban Office Portfolio, totaling 6.3 million square feet, for net sales proceeds of $1.0 billion.Starting in the third quarter 2021, and as a result of the recent completion of the Suburban Office Portfolio dispositions for all but one asset, the Company’s multifamily properties accounted for more than half of the Company’s total revenue for the first time (See Note 18: Segment Reporting – to the Financial Statements). As of December 31, 2021, the Company has classified two office properties located in Jersey City and Hoboken, New Jersey totaling approximately 1.8 million square feet as held for sale which is consistent with the Company’s ongoing efforts and strategy to continue to transition into a primarily multifamily residential company.The accompanying consolidated financial statements include all accounts of the Company, its majority-owned and/or controlled subsidiaries, which consist principally of the Operating Partnership and variable interest entities for which the Company has determined itself to be the primary beneficiary, if any. SeeStatements, for the Company’s treatmentStatements. Certain of unconsolidated joint venture interests. Intercompany accounts and transactions have been eliminated.Accounting Standards Codification (“ASC”) 810, Consolidation, provides guidance on the identification of entities for which control is achieved through means other than voting rights (“variable interest entities” or “VIEs”)these accounting policies require judgment and the determinationuse of which business enterprise, if any, should consolidate the VIEs. Generally, the consideration of whether an entity is a VIE applies when either: (1) the equity investors (if any) lack (i) the ability to make decisions about the entity's activities through voting or similar rights, (ii) the obligation to absorb the expected losses of the entity, or (iii) the right to receive the expected residual returns of the entity; (2) the equity investment at risk is insufficient to finance that entity’s activities without additional subordinated financial support; or (3) the equity investors have voting rights that are not proportionate to their economic interests and substantially all of the activities of the entity involve or are conducted on behalf of an investor with a disproportionately small voting interest. The Company consolidates VIEs in which it is considered to be the primary beneficiary. The primary beneficiary is defined by the entity having both of the following characteristics: (1) the power to direct the activities that, when taken together, most significantly impact the variable interest entity’s performance: and (2) the obligation to absorb losses and right to receive the returns from the VIE that would be significant to the VIE.The financial statements have been prepared in conformity with generally accepted accounting principles (“GAAP”). The preparation of financial statements in conformity with GAAP requires management to make estimates and assumptions that affectwhen applying these policies in the reported amountspreparation of assets and liabilities and disclosure of contingent assets and liabilities at the date of theour consolidated financial statements and the reported amounts of revenues and expenses during the reporting period. Thesestatements. On a quarterly basis, we evaluate these estimates and assumptions arejudgments based on management’s historical experience as well as other factors that are believedwe believe to be reasonable atunder the time. However, becausecircumstances. These estimates are subject to change in the future events and their effects cannot be determined with certainty,if underlying assumptions or factors change. Certain accounting policies, while significant, may not require the determinationuse of estimates requiresestimates. We believe the exercise of judgment. Actual results could differ from those estimates. Certain reclassifications have been made to prior period amounts in order to conform with current period presentation, primarily related to classification of certain properties as discontinued operations. The Company’sfollowing critical accounting policies are those which require assumptions to be made about matters that are highly uncertain. Different estimates could have a material effect on the Company’s financial results. Judgments and uncertainties affecting the application of these policiesaffect our more significant judgments and estimates may resultused in materially different amounts being reported under different conditions and circumstances.Rental PropertyRental properties are stated at cost less accumulated depreciation and amortization. Costs directly related to the acquisition, development and constructionpreparation of rental properties are capitalized. The Company adopted Financial Accounting Standards Board (“FASB”) guidance Accounting Standards Update (“ASU”) 2017-01 on January 1, 2017, which revises the definition of a business and is expected to result in more transactions to be accounted for as asset acquisitions and significantly limit transactions that would be accounted for as business combinations. Where an acquisition has been determined to be an asset acquisition, acquisition-related costs are capitalized. Capitalized development and construction costs include pre-construction costs essential to the development of the property, development and construction costs, interest, property taxes, insurance, salaries and other project costs incurred during the period of development. Interest capitalized by the Company for the years ended December 31, 2021, 2020 and 2019 was $30.5 million, $26.4 million and $19.3 million, respectively. Ordinary repairs and maintenance are expensed as incurred; major replacements and betterments, which improve or extend the life of the asset, are capitalized and depreciated over their estimated useful lives. Fully-depreciated assets are removed from the accounts.The Company considers a construction project as substantially completed and held available for occupancy upon the substantial completion of improvements, but no later than one year from cessation of major construction activity (as distinguished from activities such as routine maintenance and cleanup). If portions of a rental project are substantially completed and occupied by tenants or residents, or held available for occupancy, and other portions have not yet reached that stage, the substantially completed portions are accounted for as a separate project. The Company allocates costs incurred between the portions under construction and the portions substantially completed and held available for occupancy, primarily based on a percentage of the relative commercial square footage or multifamily units of each portion, and capitalizes only those costs associated with the portion under construction.Properties are depreciated using the straight-line method over the estimated useful lives of the assets. The estimated useful lives are as follows:Leasehold interestsRemaining lease termBuildings and improvements5 to 40 yearsTenant improvementsThe shorter of the term of therelated lease or useful lifeFurniture, fixtures and equipment5 to 10 yearsUpon acquisition of rental property, the Company estimates the fair value of acquired tangible assets, consisting of land, building and improvements, and identified intangible assets and liabilities assumed, generally consisting of the fair value of (i) above and below market leases, (ii) in-place leases and (iii) tenant relationships. For asset acquisitions, the Company allocates the purchase price to the assets acquired and liabilities assumed based on their relative fair values. The Company records goodwill or a gain on bargain purchase (if any) if the net assets acquired/liabilities assumed differ from the purchase consideration of a business combination transaction. In estimating the fair value of the tangible and intangible assets acquired, the Company considers information obtained about each property as a result of its due diligence and marketing and leasing activities, and utilizes various valuation methods, such as estimated cash flow projections utilizing appropriate discount and capitalization rates, estimates of replacement costs net of depreciation, and available market information. The fair value of the tangible assets of an acquired property considers the value of the property as if it were vacant.Above-market and below-market lease values for acquired properties are initially recorded based on the present value (using a discount rate which reflects the risks associated with the leases acquired) of the difference between (i) the contractual amounts to be paid pursuant to each in-place lease and (ii) management’s estimate of fair market lease rates for each corresponding in-place lease, measured over a period equal to the remaining term of the lease for above-market leases and the remaining initial term plus the term of any below-market fixed rate renewal options for below-market leases. The capitalized above-market lease values are amortized as a reduction of base rental revenue over the remaining terms of the respective leases, and the capitalized below-market lease values are amortized as an increase to base rental revenue over the remaining initial terms plus the terms of any below-market fixed rate renewal options of the respective leases.Other intangible assets acquired include amounts for in-place lease values and tenant relationship values, which are based on management’s evaluation of the specific characteristics of each tenant’s lease and the Company’s overall relationship with the respective tenant. Factors to be considered by management in its analysis of in-place lease values include an estimate of carrying costs during hypothetical expected lease-up periods considering current market conditions, and costs to execute similar leases. In estimating carrying costs, management includes real estate taxes, insurance and other operating expenses and estimates of lost rentals at market rates during the expected lease-up periods, depending on local market conditions. In estimating costs to execute similar leases, management considers leasing commissions, legal and other related expenses. Characteristics considered by management in valuing tenant relationships include the nature and extent of the Company’s existing business relationships with the tenant, growth prospects for developing new business with the tenant, the tenant’s credit quality and expectations of lease renewals. The values of in-place leases are amortized to expense over the remaining initial terms of the respective leases. The values of tenant relationship intangibles are amortized to expense over the anticipated life of the relationships or leases.In addition to identifying any specific circumstances which may affectA property’s value is considered impaired when the expected undiscounted cash flows for a property or properties, management considers other criteria for determining which properties may require assessment for potential impairment. The criteria considered by management, depending on the type of property, may include reviewing low leased percentages, significant near-term lease expirations, current and historical operating and/or cash flow losses, construction cost overruns and/or other factors, including those that might impact the Company’s intent and ability to hold the property. A property’s value is impaired only if management’s estimate of the aggregate future cash flows (undiscounted and without interest charges) to be generated by the property over its estimated holding period isare less than theits carrying value of the property.value. If there are different possible scenariospotential outcomes for a property, the Company will take a probability-weightedprobability weighted approach to estimating future cash flow scenarios.flows. To the extent impairment has occurred, the impairment loss is measured as the excess of the carrying value of the property over the estimated fair value of the property. The Company’s estimates of aggregate future cash flows expected to be generated and estimatedEstimated fair values for each propertywhich are based on discounted cash flow models include all estimated cash inflows and outflows over a number of assumptions, including but not limited to estimatedspecified holding periods, outcome probabilities, market capitalizationperiod. Capitalization rates and discount rates if applicable. For developable land holdings, an estimated per-unitutilized in these models are based upon unobservable rates that the Company believes to be within a reasonable range of current market value assumption is also considered based on development rights or plans for the land. These assumptions are generally based on management’s experience in its local real estate marketsrates. In addition, such cash flow models consider factors such as expected future operating income, trends and prospects, as well as the effects of current market conditions. The assumptions are subjectdemand, competition and other factors. To the extent impairment has occurred, the carrying value of the property would be adjusted to economic and market uncertainties including, among others, demand for space, competition for tenants, changes in market rental rates, and costsan amount to operate eachreflect the estimated fair value of the property. As these factors are difficult to predict and are subject tofuture events that may alter management’s assumptions, the future cash flows estimated by management in its impairment analyses may not be achieved, and additional losses or impairments may be realized in the future.Real Estate Held for Sale and Discontinued OperationsWhen assets are identified by management as held for sale, the Company discontinues depreciating the assets and estimates the sales price, net of expected selling costs, of such assets. The Company generally considers assets (as identified by their disposal groups) to be held for sale when the transaction has received appropriate corporate authority, it is probable to be soldthat the disposition will occur within the following 12 months,one year and there are no significant contingencies relating to a sale. If, in management’s opinion, the estimated net sales price, net of expected selling costs, of the disposal groups which have beenWhen assets are identified by management as held for sale, the Company discontinues depreciating the assets and estimates the fair value. If the fair value of the assets, less estimated cost to sell, is less than the carrying value of the assets, a valuation allowance (which isan adjustment to the carrying value would be recognized and recorded as unrealized losseswithin the Unrealized gains (losses) on disposition of rental property) is established. Inproperty to reflect the absence of an executed sales agreement with a set sales price, management’s estimateestimated fair value of the net sales price may be based on a number of assumptions, including but not limitedassets. The Company will continue to review the Company’s estimates of future cash flows, market capitalization rates and discount rates, if applicable. For developable land holdings, an estimated per-unit market value assumption is also considered based on development rights or plansproperty for the land. In addition, the Company classifies assets held for sale or sold as discontinued operations if the disposal groups represent a strategic shift that will have a major effect on the Company’s operations and financial results. For any disposals qualifying as discontinued operations, the assets and their results are presentedsubsequent changes in discontinued operations in the financial statements for all periods presented. See Note 7: Discontinued Operations – to the Financial Statements.If circumstances arise that previously were considered unlikely and, as a result, the Company has determined that an asset previously classified as held for sale no longer meets the held for sale criteria, the asset is reclassified as held and used. An asset that is reclassified is measured and recorded individually at the lower of (a) its carrying value before the asset was classified as held for sale, adjusted for any depreciation (amortization) expense that would have been recognized had the asset been continuously classified as held and used, or (b) the fair value, at the date the asset, qualified as held for sale.Investments in Unconsolidated Joint VenturesThe Company accounts for its investments in unconsolidated joint ventures under the equity method of accounting. The Company applies the equity method by initially recording these investments at cost, as Investments in Unconsolidated Joint Ventures, subsequently adjusted for equity in earnings and cash contributions and distributions. The outside basis portion of the Company’s joint ventures is amortized over the anticipated useful lives of the underlying ventures’ tangible and intangible assets acquired and liabilities assumed. Generally, the Company would discontinue applying the equity method when the investment (and any advances) is reduced to zero and would not provide formay recognize an additional losses unless the Company has guaranteed obligations of the venture or is otherwise committed to providing further financial support for the investee. If the venture subsequently generates income, the Company only recognizes its share of such income to the extent it exceeds its share of previously unrecognized losses.impairment charge, if warranted.If the venture subsequently makes distributions and the Company does not have an implied or actual commitment to support the operations of the venture, the Company will not record a basis less than zero, rather such amounts will be recorded as equity in earnings of unconsolidated joint ventures. OnThe Company’s estimates of value for each investment (particularly in real estate joint ventures)Estimated fair values which are based on discounted cash flow models include all estimated cash inflows and outflows over a number of assumptions including but not limited to estimates of future and stabilized cash flows, market capitalizationspecified holding period. Capitalization rates and discount rates if applicable. These assumptionsutilized in these models are based on management's experience in its local real estate markets andupon unobservable rates that the effectsCompany believes to be within a reasonable range of current market conditions. The assumptions are subject to economic and market uncertainties including, among others, demand for space, competition for tenants, changes in market rental rates, and operating costs. As these factors are difficult to predict and are subject to future events that may alter management’s assumptions, the values estimated by management in its impairment analyses may not be realized, and actual losses or impairment may be realized in the futurerates.. See Note 4: Investments in Unconsolidated Joint Ventures – to the Financial Statements.Revenue RecognitionRevenue from leases includes fixed base rents under leases, which are recognized on a straight-line basis over the terms of the respective leases.Unbilled rents receivable represents the cumulative amount by which straight-line rental revenue exceeds rents currently billed in accordance with the lease agreements.The Company elected a practical expedient for its rental properties (as lessor) to avoid separating non-lease components that otherwise would need to be accounted for under the recently-adopted revenue accounting guidance (such as tenant reimbursements of property operating expenses) from the associated lease component since (1) the non-lease components have the same timing and pattern of transfer as the associated lease component and (2) the lease component, if accounted for separately, would be classified as an operating lease; this enables the Company to account for the combination of the lease component and non-lease components as an operating lease since the lease component is the predominant component of the combined components. Due to the Company’s adoption of the practical expedient discussed above to not separate non-lease component revenue from the associated lease component, the Company is aggregating revenue from its lease components and non-lease components (comprised predominantly of tenant operating expense reimbursements) into the line entitled “Revenue from leases.” Revenue from leases also includes reimbursements and recoveries from tenants received from tenants for certain costs as provided in the lease agreements. These costs generally include real estate taxes, utilities, insurance, common area maintenance and other recoverable costs. See Note 14: Tenant Leases – to the Financial Statements.Real estate services revenue includes property management, development, construction and leasing commission fees and other services, and payroll and related costs reimbursed from clients. Fee income derived from the Company’s unconsolidated joint ventures (which are capitalized by such ventures) are recognized to the extent attributable to the unaffiliated ownership interests.Parking income is comprised of income from parking spaces leased to tenants and others.Hotel income includes all revenue generated from hotel properties.Other income includes income from tenants for additional services arranged for by the Company and income from tenants for early lease terminations.All bad debt expense is being recorded as a reduction of the corresponding revenue account starting on January 1, 2019. Management performs a detailed review of amounts due from tenants for collectability based on factors affecting the billings and status of individual tenants. The factors considered by management in determining which individual tenant’s revenues are affected include the age of the receivable, the tenant’s payment history, the nature of the charges, any communications regarding the charges and other related information. Management’s estimate of bad debt write-off’s requires management to exercise judgment about the timing, frequency and severity of collection losses, which affects the revenue recorded.Redeemable Noncontrolling InterestsThe Company evaluates the terms of the partnership units issued in accordance with the FASB’s Distinguishing Liabilities from Equity guidance. Units which embody an unconditional obligation requiring the Company to redeem the units for cash after a specified or determinable date (or dates) or upon the occurrence of an event that is not solely within the control of the issuer are determined to be contingently redeemable under this guidance and are included as Redeemable noncontrolling interests and classified within the mezzanine section between Total liabilities and Stockholders’ equity on the Company’s Consolidated Balance Sheets. The carrying amount of the redeemable noncontrolling interests will be changed by periodic accretions, so that the carrying amount will equal the estimated future redemption value at the redemption date.20212023 (“2021”2023”), as compared to the year ended December 31, 20202022 (“2020”2022”), and for 20202022 as compared to the year ended December 31, 20192021 (“2019”2021”) make reference to the following:2019,2021, (for the 20212023 versus 20202022 comparisons), and which represent all in-service properties owned by the Company at December 31, 20182020 (for the 20202022 versus 20192021 comparisons), excluding properties sold, disposed of, removed from service, or being redeveloped or repositioned from January 1, 20192021 through December 31, 2021;2023;20202022 through December 31, 20212023 (for the 20212023 versus 20202022 comparisons), and which represents all properties acquired by the Company or commencing initial operations from January 1, 20192021 through December 31, 20202022 (for the 20202022 versus 20192021 comparisons); and20192021 through December 31, 2021. 2023.20212023 Compared to Year Ended December 31, 20202022Years Ended
December 31,Dollar
ChangePercent
Change(dollars in thousands) 2023 2022 Revenue from rental operations and other: Revenue from leases $ 252,144 $ 206,052 $ 46,092 22.4 % Parking income 18,036 15,819 2,217 14.0 Other income 5,811 7,996 (2,185) (27.3) Total revenues from rental operations 275,991 229,867 46,124 20.1 Property expenses: Real estate taxes $ 40,810 39,112 1,698 4.3 Utilities 9,922 8,921 1,001 11.2 Operating services 57,925 52,797 5,128 9.7 Total property expenses 108,657 100,830 7,827 7.8 Non-property revenues: Real estate services 3,868 3,581 287 8.0 Total non-property revenues 3,868 3,581 287 8.0 Non-property expenses: Real estate services expenses 14,188 10,549 3,639 34.5 General and administrative 44,472 56,014 (11,542) (20.6) Transaction-related costs 7,627 3,468 4,159 119.9 Depreciation and amortization 93,589 85,434 8,155 9.5 Property impairments 32,516 — 32,516 100.0 Land and other impairments, net 9,324 9,368 (44) (0.5) Total non-property expenses 201,716 164,833 36,883 22.4 Operating loss (30,514) (32,215) 1,701 (5.3) Other (expense) income: Interest expense (89,355) (66,381) (22,974) 34.6 Interest cost of mandatorily redeemable noncontrolling interests (49,782) — (49,782) 100.0 Interest and other investment income (loss) 5,515 729 4,786 656.5 Equity in earnings (loss) of unconsolidated joint ventures 3,102 1,200 1,902 158.5 Gain on disposition of developable land 7,068 57,262 (50,194) (87.7) Loss from extinguishment of debt, net (5,606) (129) (5,477) 4,245.7 Other income, net 2,871 — 2,871 100.0 Total other (expense) income (126,187) (7,319) (118,868) 1624.1 Loss from continuing operations before income tax expenses (156,701) (39,534) (117,167) 296.4 Provision for income taxes (492) — (492) 100.0 Loss from continuing operations after income tax (157,193) (39,534) (117,659) 297.6 Discontinued operations: Income (Loss) from discontinued operations 3,150 (64,704) 67,854 (104.9) Realized gains (losses) and unrealized gains (losses) on disposition of rental property and impairments, net 41,682 69,353 (27,671) (39.9) Total discontinued operations 44,832 4,649 40,183 864.3 Net loss $ (112,361) $ (34,885) $ (77,476) 222.1 % 20212023 as compared to 20202022 divided into Same-Store Properties, Acquired and Developed Properties and Properties Sold in 20202022 and 20212023 (excluding properties classified as discontinued operations):Total
CompanyTotal
CompanySame-Store
PropertiesAcquired and Developed
PropertiesProperties
Sold in 2022 and 2023Dollar
ChangePercent
ChangeDollar
ChangePercent
ChangeDollar
ChangePercent
ChangeDollar
ChangePercent
ChangeRevenue from leases Revenue from leases $ 46,092 22.4 22.4 % $ 18,523 9.8 9.8 % $ 27,569 164.7 164.7 % $ — — — % Other income Other income Total $ 46,124 20.1 20.1 % $ 17,607 8.3 8.3 % $ 28,517 164.0 164.0 % $ — — — % Property expenses: Property expenses: Real estate taxes Real estate taxes $ 1,698 4.3 4.3 % $ (1,050) (2.8) (2.8) % $ 2,748 181.7 181.7 % $ — — — % Total $ 7,827 7.8 7.8 % $ (585) (0.6) (0.6) % $ 8,412 135.5 135.5 % $ — — — % OTHER DATA: OTHER DATA: Number of Consolidated Properties Number of Consolidated Properties $1.6$18.5 million, or 0.69.8 percent, for 20212023 as compared to 2020, of which an increase of $3.2 million at the commercial properties is2022, due primarily to an increase in escalation settle-ups. This is partially offset bymarket rental rates and a decrease of $1.6 million ofreduction in concessions at the multifamily properties, due primarily to lower in-place rents in 2021 as compared to 2020 as a result of increased rent concessions.rental properties. Revenue from leases at the Acquired and Developed Properties increased $13.0$27.6 million, or 164.7 percent, in 20212023 as compared to 2020,2022, due to an increase in market rental rates and the commencement of operations at a multifamily property as well as the acquisition of threeone multifamily properties and one retail property.property during mid-2022.decreased $1.1increased $1.4 million, or 7.09.1 percent for 20212023 as compared to 20202022 due primarily to a decreasean increase in usage at the parking garages, in 2021 as compared to 2020, which was more impacted by the COVID-19 pandemic, as well as the recognition in 2020 of approximately $0.6 million income from a settlement of prior period unpaid parking fees by a tenant in Jersey City, New Jersey.garages.Hotel income. Hotel income for the Same-Store properties increased $6.3 million, or 147.7 percent, for 2021 as compared to 2020, primarily due to fully reopening the hotels in 2021 following a partial shutdown of hotel operations in 2020 as a result of the COVID-19 pandemic.increased $1.6decreased $2.3 million, or 17.130.0 percent for 20212023 as compared to 20202022 due primarily to the return of escrow on a previous transaction and post sales items received in 2022.Years Ended
December 31,Dollar
ChangePercent
Change(dollars in thousands) 2022 2021 Revenue from rental operations and other: Revenue from leases $ 206,052 $ 162,082 $ 43,970 27.1 % Parking income 15,819 12,274 3,545 28.9 Other income 7,996 10,693 (2,697) (25.2) Total revenues from rental operations 229,867 185,049 44,818 24.2 Property expenses: Real estate taxes 39,112 28,818 10,294 35.7 Utilities 8,921 8,307 614 7.4 Operating services 52,797 45,460 7,337 16.1 Total property expenses 100,830 82,585 18,245 22.1 Non-property revenues: Real estate services 3,581 9,596 (6,015) (62.7) Total non-property revenues 3,581 9,596 (6,015) (62.7) Non-property expenses: Real estate services expenses 10,549 12,858 (2,309) (18.0) General and administrative 56,014 56,977 (963) (1.7) Transaction-related costs 3,468 12,208 (8,740) (71.6) Depreciation and amortization 85,434 68,506 16,928 24.7 Land and other impairments, net 9,368 23,719 (14,351) (60.5) Total non-property expenses 164,833 174,268 (9,435) (5.4) Operating income (loss) (32,215) (62,208) 29,993 (48.2) Other (expense) income: Interest expense (66,381) (47,505) (18,876) 39.7 Interest and other investment income (loss) 729 524 205 39.1 Equity in earnings (loss) of unconsolidated joint ventures 1,200 (4,250) 5,450 (128.2) Realized gains (losses) and unrealized losses on disposition of rental property, net — 3,023 (3,023) (100.0) Gain on disposition of developable land 57,262 2,115 55,147 2607.4 Loss on sale from unconsolidated joint ventures — (1,886) 1,886 (100.0) Loss from extinguishment of debt, net (129) (47,078) 46,949 (99.7) Total other (expense) income (7,319) (95,057) 87,738 (92.3) Loss from continuing operations (39,534) (157,265) 117,731 (74.9) Discontinued operations: (Loss) income from discontinued operations (64,704) 22,174 (86,878) (391.8) Realized gains (losses) and unrealized gains (losses) on disposition of rental property and impairments, net 69,353 25,552 43,801 171.4 Total discontinued operations 4,649 47,726 (43,077) (90.3) Net loss $ (34,885) $ (109,539) $ 74,654 (68.2) % Total
CompanySame-Store
PropertiesAcquired and Developed
PropertiesProperties
Sold in 2021 and 2022Dollar
ChangePercent
ChangeDollar
ChangePercent
ChangeDollar
ChangePercent
ChangeDollar
ChangePercent
ChangeRevenue from leases $ 43,970 27.1 % $ 17,324 11.2 % $ 28,717 100.0 % $ (2,071) (100.0) % Parking income 3,545 28.9 2,655 22.7 1,103 100.0 (213) (100.0) Other income (2,697) (25.2) (3,191) (30.5) 472 100.0 22 (100.0) Total $ 44,818 24.2 % $ 16,788 9.5 % $ 30,292 100.0 % $ (2,262) (100.0) % Property expenses: Real estate taxes $ 10,294 35.7 % $ 7,450 27.2 % $ 3,275 100.0 % $ (431) (100.0) % Utilities 614 7.4 (332) (4.2) 1,004 100.0 (58) (100.0) Operating services 7,337 16.1 1,235 2.9 6,784 100.0 (682) (100.0) Total $ 18,245 22.1 % $ 8,353 10.7 % $ 11,063 100.0 % $ (1,171) (100.0) % OTHER DATA: Number of Consolidated Properties 27 23 4 2 3,104 3,104 — — 5,535 4,039 1,496 — $1.7$7.5 million, or 3.727.2 percent, for 20212022 as compared to 20202021 due primarily to increased tax rates on properties located in Jersey City, New Jersey as well as the expiration in early 20212022 of the PILOT agreements on two multifamily properties located in Jersey City, New Jersey.properties.increased $0.9 million, or 6.6 percent,remained relatively unchanged for 2021 as2022 compared to 2020, due primarily to higher electricity rates in 2021 as compared to 2020.2021.$1.7$1.2 million, or 2.52.9 percent, for 20212022 as compared to 2020,2021, due primarily to an increase in severance and relatedinsurance expenses in 2021 as compared to 2020.2022.(primarilywhich is primarily related to management fees and reimbursement of property personnel costs)costs from the Company's third party/ joint ventures management businesses, decreased $1.8$6.0 million, or 15.8 percent,62.7%, for 20212022 as compared to 2020,2021, due primarily to decreaseda reduction in third party development and management activity in 2021 as compared to 2020.2022.$0.7$2.3 million, or 5.118.0 percent, for 20212022 as compared to 2020,2021, due primarily to lower salaries and related expenses from a reduction in third-party services activities in 20212022 as compared to 2020.2021.decreased $13.9 million, or 19.5 percent in 2021 asremained relatively unchanged for 2022 compared to 2020. This decrease is2021 due primarily to costs incurred for a contested election of the Board of Directors of $12.8 million in 2020 and a decreaseincreases in severance and related costs of $2.5 million ($7.6 million in 2022 as compared to 2021, versus $10.1 million in 2020). These were partially offset by $2.1 million of costs from CEO andcost saving reductions in 2022. management changes in 2021.Dead deal and transaction costs. The Company incurred costs of $3.5 million in 2022 and $12.2 million in 2021 and $2.6 million in 2020 in connection with transactions that were not consummated and ATM Program costs.consummated.decreased $10.4increased $16.9 million, or 8.524.7 percent for 2021 over 2020. This decrease was due primarily to lower depreciation of fully-amortized assets of approximately $13.6 million for the Same-Store Properties for 2021 as2022 compared to 20202021, primarily due to additional depreciation and a decrease of approximately $1.6 million for properties sold or removed from service, partially offset by an increaseamortization in depreciation of $4.7 million for 2021 as compared to 2020 from the Acquired and Developed Properties.Property impairments. In 2021, the Company recorded impairment charges of $7.4 million on its held and used hotel properties in Weehawken, New Jersey and $6.0 million on its then held and used office property in Hoboken, New Jersey. In 2020, the Company recorded impairment charges of $36.6 million on its held and used hotel properties in Weehawken, New Jersey. In 2020, the Company recorded valuation impairment charges of $16.8 million on developable land parcels.decreased $15.8increased $18.9 million, or 19.539.7 percent, for 20212022 as compared to 2020.2021. This decreaseincrease was primarily the result of lower average debt balancesthe cessation of the capitalization of mortgage interest related to a multifamily property which was placed in 2021 as compared to 2020, due to the Company’s redemption of its Senior Unsecured Notesservice in 2021, using proceeds from sales of office properties.2022 and higher interest rates on our floating rate indebtedness.increased $0.5 millionremained relatively unchanged for 20212022 as compared to 2020 primarily due to interest received on a note receivable, partially offset by the write-down of a note receivable in 2021.decreased $0.4increased $5.5 million, or 11.0128.2 percent, for 20212022 as compared to 2020. The decrease is2021, due primarily due to an increase inhigher revenues resulting from lower concessions and discounts to tenantshigher market rents at various unconsolidated multifamily joint ventures in 20212022 as compared to 2020 resulting in a reduction of $1.7 million of rental revenue for 2021 as compared to 2020 from the Urby at Harborside venture.2021.of $3.0in 2022 and 3.0 million in 2021 and $5.5 million in 2020.2021. See Note 3: Recent TransactionsInvestment in Rental Property – Dispositions of Rental Properties and Developable Land – to the Financial Statements.In 2020, the Company recorded a gain of $5.8 million on the sale of land holdings located in Mount Pleasant, New York; Middletown, New Jersey; and Greenbelt, Maryland. See Note 3: Recent TransactionsInvestment in Rental Property – Dispositions of Rental Properties and Developable Land – to the Financial Statements.loss of $1.9 million on the sale of its interest in a joint venture which owns an office property in West Orange, New Jersey. In 2020, the Company recorded a $35.2 million gainloss for its share on the sale of the joint venture - owned property in Arlington, Virginia and land in Hillsborough, New Jersey. See Note 4: Investments3: Investment in Rental Property - Dispositions of Unconsolidated Joint VenturesVenture – to the Financial Statements.defeasementdefeasance of the mortgage loan. In 2020, the Company recorded a loss on early retirement of debt of $0.3 million in connection with the repayment of a construction loan on a multifamily property located in Malden, Massachusetts.For all periods presented, theThe Company classified 36 office properties totaling 6.3 million square feet as discontinued operations, somerecognized income of which were sold during the periods. The income from these properties decreased $56.8 million for2021 as compared to 2020, due primarily to the sale of 16 properties in 2021 and 20 properties in 2020. Included within discontinued operations are realized gains (losses) and unrealized losses on disposition of rental property and impairments, net, of a gain of $25.6$4.6 million in 20212022 and a gain of $11.2$47.7 million in 2020.Year Ended December 31, 2020 Compared to Year Ended December 31, 2019 2019The following is a summary of the changes in revenue from rental operations and other, and property expenses, in 2020 as compared to 2019 divided into Same-Store Properties, Acquired and Developed Properties and Properties Sold in 2019 and 2020:Revenue from leases. Revenue from leases for the Same-Store Properties decreased $8.6 million, or 2.8 percent, for 2020 as compared to 2019, of which a decrease of $5.7 million is due to the multifamily properties, due primarily to a decrease in average same store occupancy from 93.9 to 89.4 percent at the multifamily residential portfolio in 2020, as compared to 2019, primarily as a result of the impacts from the COVID-19 pandemic in 2020. A decrease of $2.9 million is due to the commercial properties, due primarily to a decrease in occupancy for 2020 as compared to 2019. Revenue from leases at the Acquired and Developed Properties increased $28.9 million in 2020 as compared to 2019, due to the commencement of operations of three multifamily properties.Parking income. Parking income for the Same-Store Properties decreased $6.7 million, or 30.5 percent for 2020 as compared to 2019 due primarily to a reduction in usage at the commercial properties, due to the COVID-19 pandemic in 2020.Hotel income. Hotel income for the Same-Store properties decreased $3.1 million, or 31.8 percent, for 2020 as compared to 2019 due to the partial shutdown of hotel operations related to the COVID-19 pandemic in 2020.Other income. Other income for the Same-Store Properties increased $2.0 million, or 21.3 percent for 2020 as compared to 2019 due primarily to an increase in lease breakage fees for both, multifamily and commercial properties recognized in 2020, as compared to 2019.Real estate taxes. Real estate taxes on the Same-Store Properties increased $1.4 million, or 3.1 percent, for 2020 as compared to 2019 due primarily to a decrease in tax appeal proceeds received 2020 as compared to 2019.Utilities. Utilities for the Same-Store Properties decreased $1.2 million, or 6.9 percent, for 2020 as compared to 2019, due primarily to decreased usage in 2020 as compared to 2019 as a result of lower occupancy in 2020 as compared to 2019.Operating services. Operating services for the Same-Store properties decreased $4.8 million, or 6.8 percent, for 2020 as compared to 2019, due primarily to a reduction in property maintenance and other services expense in 2020 as compared to 2019.Real estate services revenue. Real estate services revenue (primarily reimbursement of property personnel costs) decreased $2.5 million, or 17.9 percent, for 2020 as compared to 2019, due primarily to a reduction in third-party development and property management activity in multifamily services in 2020 as compared to 2019.Real estate services expenses. Real estate services expenses decreased $2.4 million, or 14.8 percent, for 2020 as compared to 2019, due primarily to decreased salaries and related expenses from less third-party service activities in 2020.General and administrative. General and administrative expenses increased $11.3 million, or 18.8 percent in 2020 as compared to 2019. This increase is due primarily to an increase in management restructuring costs, including severance, separation and related costs of $8.8 million ($10.1 million in 2020 versus $1.3 million in 2019), and an increase in costs incurred in connection with contested elections of the Board of Directors of $8.7 million ($12.8 million in 2020 versus $4.1 million in 2019). These were partially offset by a reduction in salaries and related expenses and leasing personnel costs of $2.8 million for 2020 as compared to 2019 and a reduction in travel, office and public relations events expenditures of $2.7 million for 2020 as compared to 2019 due to the COVID-19 pandemic.Dead deal and transaction costs. The Company incurred costs of $2.6 million in 2020 in connection with transaction and capital market activities.Depreciation and amortization. Depreciation and amortization decreased $11.6 million, or 8.7 percent, for 2020 over 2019. This decrease was due primarily to lower depreciation of approximately $14.1 million for properties sold or removed from service during 2019 and 2020, partially offset by an increase in depreciation of $2.5 million for 2020 as compared to 2019 from the Acquired and Developed Properties.Property impairments. In 2020, the Company recorded impairment charges of $36.6 million on its hotel properties in Weehawken, New Jersey.Land and other impairments. In 2020, the Company recorded $16.8 million of impairments on developable land parcels. In 2019, the Company recorded impairment charges of $32.4 million on developable land parcels.Interest expense. Interest expense decreased $9.6 million, or 10.6 percent, for 2020 as compared to 2019. This decrease was primarily the result of lower average interest rates in 2020, as compared to 2019.Interest and other investment income. Interest and other investment income decreased $2.4 million for 2020 as compared to 2019 primarily due to lower average notes receivable balances outstanding in 2020 as compared to 2019.Equity in earnings (loss) of unconsolidated joint ventures. Equity in earnings of unconsolidated joint ventures decreased $2.5 million for 2020 as compared to 2019. The decrease is primarily due to a decrease of $2.8 million for 2020 as compared to 2019 from the Hyatt Regency Hotel Jersey City venture, because the hotel was shut down beginning in March 2020 on account of the COVID-19 pandemic, and a decrease of $0.5 million for 2020 as compared to 2019 from the Urby at Harborside venture. These were partially offset by an increase of $1.1 million for 2020 as compared to 2019 from the 12 Vreeland Road venture, due to impairment charges recorded of $2.6 million in 2020 and $3.7 million in 2019.Gain on change of control of interests. The Company recorded a gain on change of control of interests of $13.8 million in 2019 as a result of its acquisition of the controlling interest of its equity partners in a joint venture that owns a multifamily property located in Jersey City, New Jersey.Realized gains (losses) and unrealized losses on disposition of rental property, net. The Company had realized gains (unrealized losses) on disposition of rental property of $5.5 million in 2020 and $343.1 million in 2019.2021. See Note 3: Recent Transactions – Dispositions –7: Discontinued Operations to the Financial Statements.Gain on disposition of developable land. In 2020, the Company recorded a gain of $5.8 million on the sale of land holdings located in Mount Pleasant, New York; Middletown, New Jersey; and Greenbelt, Maryland. The Company recorded a gain of $0.5 million in 2019 on the sale of land holdings located in Malden and Revere, Massachusetts. See Note 3: Recent Transactions – Dispositions to the Financial Statements.Gain on sale from unconsolidated joint ventures. In 2020, the Company recorded a $35.2 million gainStatements for its share on the sale of the joint venture - owned property in Arlington, Virginia and land in Hillsborough, New Jersey. In 2019, the Company recorded a $0.9 million gain on the sale of its interests in a joint venture, which owned a property in Red Bank, New Jersey. See Note 4: Investments in Unconsolidated Joint Ventures – to the Financial Statements.additional details.Gain/(loss) from extinguishment of debt, net. In 2020, the Company recorded a loss on early retirement of debt of $0.3 million in connection with the repayment of a construction loan on a multifamily property located in Malden, Massachusetts. In 2019, the Company recognized a gain from early retirement of debt of $1.6 million in connection with the early termination of a portion of interest rate swap agreements, in connection with the prepayment of term loan balances in 2019.Discontinued operations. In 2019, the Company classified 37 office properties totaling 6.6 million square feet as discontinued operations, some of which were sold during 2019 and 2020. In 2020, the Company reclassified one of the discontinued operations properties as held for use. The income from these properties increased $46.4 million for 2020 as compared to 2019, due primarily to a decrease in depreciation and amortization costs. Upon classifying these properties as held for sale in December 2019, the Company ceased recording depreciation and amortization on the long lived assets, thereby resulting in a decrease of depreciation and amortization in 2020 compared to 2019. The Company recognized realized gains (losses) and unrealized losses on disposition of rental property and impairments, net, of a gain of $11.2 million in 2020 and a loss of $133.4 million in 2019.Liquidity and Capital Resources
Company’s principal source of funds that is used to pay its material cash commitments consisting of operating expenses, debt service, general and administrative expenses, operating capital expenditures, dividends, and dividends, excluding non-recurring capital expenditures. To the extent that the Company’s cash flow from operating activities is insufficient to finance its non-recurring capital expenditures such as property acquisitions, development and construction costs and other capital expenditures, the Company has and expects to continue to finance such activities through borrowings under its revolving credit facility, other debt and equity financings, proceeds from the sale of properties and joint venture capital.drawdraws from its revolving credit facility.The COVID-19 pandemic continueshave a significant impact in the U.S. and around the globe. The global impact$54.6 million at December 31, 2023, compared to $47.6 million at December 31, 2022. This increase is comprised of the outbreak is rapidly evolving and has included quarantines, restrictions on businessfollowing net cash flow items:including construction activities, restrictions on group gatherings, and restrictions on travel. These actions have and may in the future create disruption in the global economy and supply chains. The extent to which COVID-19 impacts the Company’s results will depend on future developments, many of which are highly uncertain and cannot be predicted, including new information which may emerge concerning the severity of COVID-19 and the actions taken to contain it or treat its impact. If the outbreak continues, there will likely be continued negative economic impacts, market volatility, and business disruption which could negatively impact the Company’s tenants’ ability to pay rent, the Company’s ability to lease vacant space, the Company’s ability to complete development and redevelopment projects and the Company’s ability to dispose of assets held for sale and these consequences, in turn, could materially impact the Company’s results of operations.Construction ProjectsThe Company is developing a 750-unit multifamily project at 25 Christopher Columbus, also known as Haus 25, in Jersey City, New Jersey which began construction in the first quarter of 2019. The construction project, which is estimated to cost $469.5 million, of which $425 million have been incurred through December 31, 2021, is expected to be ready for occupancy in the second quarter of 2022. The Company has funded $169.5 millionconsisting primarily of the constructionfollowing:remaining construction costs are expectedfollowing:be fundedredeemable noncontrolling interests; plusa $300 million construction loan (of which $255.5 million was drawn as of December 31, 2021).proceeds from mortgages and loans payable.RestrictionsIn September 2020,announced thatsubstantially completing its transformation to a pure-play multifamily REIT, as well as the Company’s current estimates of taxable income, the Board of Directors had madeof the strategic decision to suspend its commonGeneral Partner (the "Board of Directors") reinstated a quarterly dividend beginning in the third quarter of 2023.attributablewill continue to be determined by the thirdBoard of Directors of the General Partner in light of conditions then existing, including the Company's earnings, cash flows, financial condition, capital requirements, debt maturities, the availability of debt and fourth quarters 2020equity capital, applicable REIT and legal restrictions and general overall economic conditions and other factors.Company’s management estimatedclose of business on December 29, 2023. At December 31, 2023, the balance of theit had satisfied its dividend obligations as a REIT on taxable income expected for 2020. the total distribution of $0.05 per common share paid during the year ended December 31, 2023 represented 100% return of capital distributions. Board made this strategic decision to suspend its common dividends and distributions for the remainderpayable at December 31, 2022 represent amounts payable on unvested LTIP units.2020 in an effortcorporate and property level indebtedness. The Company will seek to provide greater financial flexibility during the pandemic and to retain incremental capital to support leasing initiativesrefinance or retire its debt obligations at its Harborside commercial office properties on the Jersey City waterfront. In March 2021, the Company announced that its Board of Directors would continue to suspend its common dividend for the remainder of 2021 in order to conserve capital and allow for greater financial flexibility during this period of heightened economic uncertainty andbased onmaturity with available proceeds received from the Company’s projected 2021 taxable income estimates. The Company believes that with this suspension, it will satisfy its dividend obligation as a REIT on taxable income estimated for 2021.Property Lock-UpsCertain Company properties acquired by contribution from unrelated common unitholders of the Operating Partnership, were subject to restrictions on disposition, except in a manner which did not result in recognition of built-in-gain allocable to such unitholders or which reimbursed the unitholders for the tax consequences thereof (collectively, the “Property Lock-Ups”). While these Property Lock-Ups have expired, the Company is generally required to use commercially reasonable efforts to prevent any disposition of the subject properties from resulting in the recognition of built-in gain to these unitholders, which include members of the Mack Group (which includes William L. Mack, a former director and David S. Mack, a former director). As of December 31, 2021, taking into account tax-free exchanges on the originally contributed properties, either wholly or partially, over time, five of the Company’s properties,planned non-strategic asset sales, as well as certain land and development projects, with an aggregate carrying value of approximately $1.0 billion, are subject to these conditions.Unencumbered PropertiesAs of December 31, 2021,new corporate or property level indebtedness on or before the Company had one unencumbered property with a carrying value of $18.6 million representing 3.7 percent of the Company’s total consolidated property count.Cash FlowsCash, cash equivalents and restricted cash decreased by $0.8 million to $51.5 million at December 31, 2021, compared to $52.3 million at December 31, 2020. This decrease is comprised of the following net cash flow items:(1)$56.1 million provided by operating activities.(2) $446.2 million provided by investing activities, consisting primarily of the following:(a)$645 million net cash from investing activities - discontinued operations, primarily comprised of sales proceeds from assets classified as held for sale; plus(b)$7.3 million received from repayments of notes receivables; plus(c)$52.4 million received from proceeds from the sales of rental property; plus(d)$65.1 million used for additions to rental property and improvements; minus(e)$211.6 million used for the development of rental property, other related costs and deposits.(3)$503.2 million used in financing activities, consisting primarily of the following:(a)$73 million used for repayments of revolving credit facility and term loan; plus(b)$150 million used for repayment of term loans; plus(c)$573.7 million used for repayment of senior unsecured notes; plus(d)$193 million used for repayments of mortgages, loans payable and other obligations; plus(e)$26 million used for distribution to redeemable noncontrolling interests; plus(f)$49.9 million used for payment of early debt extinguishment costs, minus(g)$196 million from borrowings under the revolving credit facility; minus(h)$226.4 million from proceeds received from mortgages and loans payable; minus(i)$150 million from borrowings from term loans.Debt FinancingSummary of Debt2021:% of Total Weighted Average
Interest RateWeighted Average
Maturity in YearsFixed Rate & Hedged Secured (a) $ 1,868,983 100.00 % 4.34 % 3.46 Variable Rate Secured Debt — — % — % — Totals/Weighted Average: $ 1,868,983 100.00 % 4.34 % 3.46 Unamortized deferred financing costs (15,086) Total Debt, Net $ 1,853,897 The actual weighted average LIBORIncludes debt with interest rate for the Company’scaps outstanding variable rate debt was 0.11 percent aswith a notional amount of December 31, 2021, plus the applicable spread.$304.5 million.(b)Excludes amortized deferred financing costs primarily pertaining to the Company’s revolving credit facility which amounted to $3.1 million for the year ended December 31, 2021.20212023 are as follows:Period Weighted Avg.
Effective Interest Rate of
Future Repayments2024 $ 6,076 $ 308,000 $ 314,076 3.43 % 2025 9,487 — 9,487 3.67 % 2026 9,651 536,487 546,138 4.44 % 2027 8,158 305,320 313,478 3.66 % 2028 5,331 343,061 348,392 6.01 % Thereafter 5,574 331,838 337,412 3.98 % Sub-total 44,277 1,824,706 1,868,983 4.34 % Unamortized deferred financing costs (15,086) — (15,086) Totals/Weighted Average $ 29,191 $ 1,824,706 $ 1,853,897 4.34 % (a)The actual weighted average LIBOR rate for the Company’s outstanding variable rate debt was 0.11 percent as2021, plus the applicable spread.(b)Excludes amortized deferred financing costs primarily pertaining to the Company’s revolving credit facility which amounted to $3.1 million for the year ended December 31, 2021.(c)Includes outstanding borrowings of the Company’s revolving credit facility of $148 million. Senior Unsecured NotesOn May 6, 2021,2023, the Company retired these notes earlier than their maturity, using net sales proceeds from completed suburban office property saleshad three unencumbered properties, with a carrying value of $115.9 million.borrowings under its 2021 credit facility and term loan. In conjunctionRegistration Statementsnotes being discharged, the Company incurred costs of $24.2 million (including a make-whole premium) which was expensed as loss from extinguishment of debt during the year ended December 31, 2021. See Note 9: Revolving Credit Facility and Term Loans.Revolving Credit Facility and Term LoansOn May 6, 2021, the Company entered into a revolving credit and term loan agreement (“2021 Credit Agreement”) with a group of seven lenders that providesSEC for a $250 million senior secured revolving credit facility (the “2021 Credit Facility”) and a $150 million senior secured term loan facility (the “2021 Term Loan”), and delivered written notice to the administrative agents to terminate the 2017 credit agreement, which termination became effective May 13, 2021.The terms of the 2021 Credit Facility include: (1) a three-year term ending in May 2024; (2) revolving credit loans may be made to the Company in an aggregate principal amount of up to $250 million (subject to increase as discussed below), with a sublimit under the2021 Credit Facility for the issuance of letters of credit in an amount not to exceed $50 million; and (3) a first priority lien in unencumbered properties of the Company with an appraised value greater than or equal to $800 million which must include the Company’s Harborside 2/3 and Harborside 5 properties; and (4) a facility fee payable quarterly equal to 35 basis points if usage of the 2021 Credit Facility is less than or equal to 50%, and 25 basis points if usage of the 2021 Credit Facility is greater than 50%.The terms of the 2021 Term Loan included: (1) an eighteen month term ending in November 2022; (2) a single draw of the term loan commitments up to an aggregate principal amount of $150 million; and (3) a first priority lien in unencumbered properties of the Company with an appraised value greater than or equal to $800 million which must include the Company’s Harborside 2/3 and Harborside 5 properties.Interest on borrowings under the 2021 Credit Facility and 2021 Term Loan shall be based on applicable base rate (the “Base Rate”) plus a margin ranging from 125 basis points to 275 basis points depending on the Base Rate elected, currently 0.12%. The Base Rate shall be either (A) the highest of (i) the Wall Street Journal prime rate, (ii) the greater of the then effective (x) Federal Funds Effective Rate, or (y) Overnight Bank Funding Rate plus 50 basis points, and (iii) a LIBO Rate, as adjusted for statutory reserve requirements for eurocurrency liabilities (the “Adjusted LIBO Rate”) and calculated for a one-month interest period, plus 100 basis points (such highest amount being the “ABR Rate”), or (B) the Adjusted LIBO Rate for the applicable interest period; provided, however, that the ABR Rate shall not be less than 1% and the Adjusted LIBO Rate shall not be less than zero.The 2021 Credit Agreement, which applies to both the 2021 Credit Facility and 2021 Term Loan, includes certain restrictions and covenants which limit, among other things the incurrence of additional indebtedness, the incurrence of liens and the disposition of real estate properties, and which require compliance with financial ratios relating to the minimum collateral pool value ($800 million), maximum collateral pool leverage ratio (40 percent), minimum number of collateral pool properties (two), the maximum total leverage ratio (65 percent), the minimum debt service coverage ratio (1.10 times until May 6, 2022, 1.20 times from May 7, 2022 through May 6, 2023, and 1.40 times thereafter), and the minimum tangible net worth ratio (80% of tangible net worth as of December 31, 2020 plus 80% of net cash proceeds of equity issuances by the General Partner, orunder which $100 million of shares of common stock have been allocated for sale pursuant to the Company's ATM Program commenced in November 2023 and no securities have been sold as of February 15, 2024.Partnership).The 2021 Credit Agreement contains “changePartnership also have an effective shelf registration statement on Form S-3 filed with the SEC for an aggregate amount of control” provisions that permit the lenders to declare a default$2.5 billion in common stock, preferred stock, depositary shares and require the immediate repaymentguarantees of all outstanding borrowings under the 2021 Credit Facility. These change of control provisions, which have been an event of default under the agreements governing the Company’s revolving credit facilities since June 2000, are triggered if, among other things, a majority of the seats on the Board of Directors (other than vacant seats) become occupied by directors who were neither nominated by the Board of Directors, nor appointed by the Board of Directors. Furthermore, construction loans secured by two multifamily residential property development projects contain cross-acceleration provisions that would constitute an event of default requiring immediate repayment of the construction loans if the change of control provisions under the 2021 Credit Facility are triggered and the lenders declare a default and exercise their rights under the 2021 Credit Facility and accelerate repayment of the outstanding borrowings thereunder. If these change of control provisions were triggered, the Company could seek a forbearance, waiver or amendment of the change of control provisions from the lenders, however there can be no assurance that the Company would be able to obtain such forbearance, waiver or amendment on acceptable terms or at all. If an event of default has occurred and is continuing, the entire outstanding balance under the 2021 Credit Agreement may (or, in the case of any bankruptcy event of default, shall) become immediately due and payable, and the Company will not make any excess distributions except to enable the General Partner to continue to qualify as a REIT under the IRS Code.On May 6, 2021, the Company drew the full $150 million available under the 2021 Term Loan and borrowed $145 million from the 2021 Credit Facility to retire the Company’s Senior Unsecured Notes. In June 2021, the Company paid down a total of $123 million of borrowings under the 2021 Term Loan, using sales proceeds from several of the Company’s suburban office property dispositions. On July 27, 2021, the Company repaid the outstanding balance of the 2021 Term Loan of $27 million, using proceeds from the disposition of a suburban office property previously held for sale. (See Note 3: Recent Transactions – Real Estate Held for Sale/Discontinued Operations/Dispositions).The terms of the 2017 credit facility included: (1) a four-year term ending in January 2021, with two six-month extension options, subject to the Company not being in default on the facility and with the payment of a fee of 7.5 basis points for each extension; (2) revolving credit loans may be made to the Company in an aggregate principal amount of up to $600 million, with a sublimit under the 2017 credit facility for the issuance of letters of credit in an amount not to exceed $60 million (subject to increase as discussed below), of which $10.6 million of letters of credit had been issued as of May 6, 2021; (3) an interest rate based on the Operating Partnership’s unsecured debt ratings from Moody’s or S&P, or, at the Operating Partnership’s option, if it no longer maintained a debt rating from Moody’s or S&P or such debt ratings fell below Baa3 and BBB-, based on a defined leverage ratio; and (4) a facility fee, payable quarterly based on the Operating Partnership’s unsecured debt ratings from Moody’s or S&P, or, at the Operating Partnership’s option, if it no longer maintained a debt rating from Moody’s or S&P or such debt ratings fell below Baa3 and BBB-, based on a defined leverage ratio. In January 2021, the Company elected to exercise the first option to extend the 2017 credit facility maturity date for aperiod of six months. Accordingly, the term of the 2017 credit facility was extended through its termination in May 2021, with the Company’s payment of the 7.5 basis point extension fee.After electing to use the defined leverage ratio in 2018 to determine the interest rate, the interest rate under the 2017 credit facility was based on the following total leverage ratio grid:Mortgages, Loans Payable and Other ObligationsThe Company has other mortgages, loans payable and other obligations which consist of various loans collateralized by certain of the Company’s rental properties. Payments on mortgages, loans payable and other obligations are generally due in monthly installments of principal and interest, or interest only.Debt StrategyThe Company does not intend to reserve funds to retire the Company’s outstanding borrowings under its revolving credit facility or its mortgages, loans payable and other obligations upon maturity. Instead, the Company will seek to retire such debt primarily with available proceeds to be received from the Company’s planned sales of its assets, as well as obtaining additional mortgage financings on or before the applicable maturity dates. If it cannot raise sufficient proceeds to retire the maturing debt, the Company may draw on its revolving credit facility to retire the maturing indebtedness, which would reduce the future availability of funds under such facility. As of February 18, 2022, the Company had outstanding borrowings of $125.0 million under its revolving credit facilityand no outstanding borrowings under its term loan. The Company is reviewing various financing and refinancing options, including the issuance of additional, or exchange of current, unsecured debtsecurities of the Operating Partnership, or common and preferred stockunder which no securities have been sold as of the General Partner, and/or obtaining additional mortgage debt of the Operating Partnership, some or all of which may be completed in 2022. The Company currently anticipates that its available cash and cash equivalents, cash flows from operating activities and proceeds from the sale of real estate assets and joint ventures investments, together with cash available from borrowings and other sources, will be adequate to meet the Company’s capital and liquidity needs in the short term. However, if these sources of funds are insufficient or unavailable, due to current economic conditions or otherwise, or if capital needs to fund acquisition and development opportunities in the multifamily rental sector arise, the Company’s ability to make the expected distributions discussed in “REIT Restrictions” above may be adversely affected.Equity Financing and Registration StatementsCommon EquityThe following table presents the changes in the General Partner’s issued and outstanding shares of common stock and the Operating Partnership’s common units for the years ended December 31, 2021 and 2020, respectively.5.55.4 million shares of the General Partner’s common stock have been reserved for future issuance. The DRIP provides for automatic reinvestment of all or a portion of a participant’s dividends from the General Partner’s shares of common stock. The DRIP also permits participants to make optional cash investments up to $5,000 a month without restriction and, if the Company waives this limit, for additional amounts subject to certain restrictions and other conditions set forth in the DRIP prospectus filed as part of the Company’s effective registration statement on Form S-3 filed with the Securities and Exchange Commission (“SEC”) for the approximately 5.55.4 million shares of the General Partner’s common stock reserved for issuance under the DRIP.Shelf Registration StatementsThe General Partner has an effective shelf registration statement on Form S-3 filed with the SEC for an aggregate amount of $2.0 billion in common stock, preferred stock, depositary shares, and/or warrants of the General Partner, under which $200 million of shares of common stock have been allocated for sales pursuant to the Company’s ATM Program commenced in December 2021 and no securities have been sold as of February 18, 2022.The General Partner and the Operating Partnership also have an effective shelf registration statement on Form S-3 filed with the SEC for an aggregate amount of $2.5 billion in common stock, preferred stock, depositary shares and guarantees of the General Partner and debt securities of the Operating Partnership, under which no securities have been sold as of February 18, 2022.2021,2023, the outstanding balance of such debt subject to guarantees, totaled $191.2$17.2 million of which $22$1.5 million was guaranteed by the Company.2021, 20202023, 2022 and 20192021 (in thousands):Year Ended December 31, 2023 2022 2021 Net loss available to common shareholders $ (107,265) $ (52,066) $ (119,042) Add (deduct): Noncontrolling interests in Operating Partnership (14,267) (5,652) (16,212) Noncontrolling interests in discontinued operations 3,872 378 4,333 Real estate-related depreciation and amortization on continuing operations (a) 103,049 95,103 77,908 Real estate-related depreciation and amortization on discontinued operations 5,335 26,370 43,482 Property impairments on continuing operations 32,516 — — Property impairments on discontinued operations — 94,811 13,467 Impairment of unconsolidated joint venture investment (included in Equity in earnings) — — (1) Discontinued operations: Gain on sale from unconsolidated joint ventures — (7,677) 1,886 Continuing operations: Realized (gains) losses and unrealized (gains) losses on disposition of rental property, net — — (3,023) Discontinued operations: Realized (gains) losses and unrealized (gains) losses on disposition of rental property, net (2,411) (61,676) (25,552) Funds from operations available to common stock and Operating Partnership unitholders (b) (c) $ 20,829 $ 89,591 $ (22,754) $10.1$10.3 million, $12.4$10.4 million and $13.0$10.1 million for the years ended December 31, 2021, 20202023, 2022 and 2019,2021, respectively. Excludes non-real estate-related depreciation and amortization of $1,304, $1,610$1.0 million, $1.3 million and $2,092$1.3 million for the years ended December 31, 2023, 2022 and 2021, 2020 and 2019, respectively.incomeloss available to common shareholders in 2023, 2022 and 2021 2020 and 2019 included $23.7$9.3 million, $16.8$9.4 million and $36.2$23.7 million, respectively, of land impairment charges and $2.1$46.3 million, $5.8$94.8 million and $0.5$2.1 million, respectively, from a gain on disposition of developable land, which are included in the calculation to arrive at funds from operations as such gains and charges relate to non-depreciable assets.MarketThe Company is exposed to market risk is the exposure to loss resultingfrom its indebtedness primarily from changes in market interest rates. The Company monitors interest rate risk as an integral part of its overall risk management. The Company manages its exposure to interest rate risk by utilizing fixed rate indebtedness or by hedging the majority of its floating rate indebtedness with interest rate swaps or caps, as appropriate.foreign currency exchange rates, commodity prices and equity prices. In pursuing its business plan,impact the primaryfair value of the Company's fixed rate debt instruments, computed using current market risk to which the Company is exposed is interest rate risk. Changes in the general level of interest rates prevailing in the financial markets may affect the spread between the Company’s yield on invested assets and cost of funds and, in turn, its ability to make distributions or payments to its investors.$1.7$1.6 billion of the Company’s long-term debt as of December 31, 20212023 bears interest at fixed rates with a weighted average coupon of 4.29% and therefore the fair value of these instruments is affected by changes in market interest rates. The following table presents principal cash flows (in thousands) based upon maturity datesIf market rates of interest increased or decreased by 100 basis points, the fair value of the debt obligations and the related weighted-average interest rates by expected maturity dates for theCompany’s fixed rate debt. debt as of December 31, 2023 would be approximately $47.9 million higher or lower, respectively.20212023 ranged from LIBORSOFR plus 158141.0 basis points to LIBORSOFR plus 340275.0 basis points. Assuming interest-rate swaps and caps are not in effect as of December 31, 2023, if market rates of interest on the Company’s variable rate debt increased or decreased by$7.1$3.0 million annuallyannually.increase or decrease in the fair value of the Company’s fixed raterelated weighted average interest rates by expected maturity dates.December 31, 2023 2024 2025 2026 2027 2028 Thereafter Sub-total Other (a) Total Fixed Rate & Hedged Debt $ 314,076 $ 9,487 $ 546,138 $ 313,478 $ 348,392 $ 337,412 $ 1,868,983 $ (15,086) $ 1,853,897 $ 1,791,121 Average Interest Rate 3.43 % 3.67 % 4.44 % 3.66 % 6.01 % 3.98 % 4.34 % 2021 would be approximately $78.4 million.2023.the event of a significant rising interest rate environment and/or economic downturn, tenant vacancies or defaults could increase and result in losses to the Company which could adversely affect its operating results and liquidity. 20212023 based on the criteria established in a report entitled Internal Control—Integrated Framework, issued by the Committee of Sponsoring Organizations of the Treadway Commission (COSO) in 2013. Based on our assessment and those criteria, the General Partner’s management has concluded that the General Partner’s internal control over financial reporting was effective as of December 31, 2021.2023.20212023 has been audited by PricewaterhouseCoopers LLP, an independent registered public accounting firm, as stated in their report which appears herein.20212023 based on the criteria established in a report entitled Internal Control—2021.2023.20212023 has been audited by PricewaterhouseCoopers LLP, an independent registered public accounting firm, as stated in their report which appears herein.On February 23, 2022, David Smetana, the Company’s Chief Financial Officer, notified the Company that he would step down as Chief Financial Officer and terminate his employment with the Company effective March 31, 2022. This information is being disclosed under this Item 9B of Form 10-K in lieu of Item 5.02(b) of Form 8-K.JURISDICTIONSJURISDICTIONS THAT PREVENT INSPECTIONS15, 2022,12, 2024, and is incorporated herein by reference.15, 2022,12, 2024, and is incorporated herein by reference.15, 2022,12, 2024, and is incorporated herein by reference.15, 2022,12, 2024, and is incorporated herein by reference.15, 2022,12, 2024, and is incorporated herein by reference.PART IV
20212023 with reconciliations for the years ended December 31, 2021, 20202023, 2022 and 2019.2021.
20212023 and 2020,2022, and the related consolidated statements of operations, of comprehensive income (loss), of changes in equity and of cash flows for each of the three years in the period ended December 31, 2021,2023, including the related notes and financial statement schedule listed in the index appearing under Item 15(a)(2) (collectively referred to as the “consolidated financial statements”). We also have audited the Company's internal control over financial reporting as of December 31, 2021,2023, based on criteria established in Internal Control - Integrated Framework (2013) issued by the Committee of Sponsoring Organizations of the Treadway Commission (COSO).20212023 and 2020,2022, and the results of its operations and its cash flows for each of the three years in the period ended December 31, 20212023 in conformity with accounting principles generally accepted in the United States of America. Also in our opinion, the Company maintained, in all material respects, effective internal control over financial reporting as of December 31, 2021,2023, based on criteria established in Internal Control - Integrated Framework (2013) issued by the COSO.Overover Financial Reporting appearing under Item 9A. Our responsibility is to express opinions on the Company’s consolidated financial statements and on the Company's internal control over financial reporting based on our audits. We are a public accounting firm registered with the Public Company Accounting Oversight Board (United States) (PCAOB) and are required to be independent with respect to the Company in accordance with the U.S. federal securities laws and the applicable rules and regulations of the Securities and Exchange Commission and the PCAOB.mattersmatter communicated below are mattersis a matter arising from the current period audit of the consolidated financial statements that werewas communicated or required to be communicated to the audit committee and that (i) relaterelates to accounts or disclosures that are material to the consolidated financial statements and (ii) involved our especially challenging, subjective, or complex judgments. The communication of critical audit matters does not alter in any way our opinion on the consolidated financial statements, taken as a whole, and we are not, by communicating the critical audit mattersopinionsopinion on the critical audit mattersmatter or on the accounts or disclosures to which they relate.it relates.Impairment and Estimated Net Sales Price of Real Estate Held for Sale in the Absence of an Executed Sales AgreementUse, NetNotesNote 2 and 3 to the consolidated financial statements, the Company’s net investment in rental property and real estate held for sale,use, net was $4$2.9 billion and $619 million, respectively, as of December 31, 2021.2023. On a periodic basis, management assesses whether there are any indicators, including property operating performance, changes in anticipated holding period, and general market conditions, that the value of the Company’s rental properties held for use may be impaired.impaired. A property’s value is impaired only if management’s estimate of the aggregate future cash flows (undiscounted and without interest charges) to be generated by the property over its estimated holding period is less than the carrying value of the property. If there are different possible scenarios for(ii) a property, the Company will take a probability weighted approach to estimating future cash flow scenarios. To the extent impairment has occurred, the impairment loss is measured as the excess of the carrying value of the property over the fair value of the property. Management’s estimates of aggregate future cash flows expected to be generated and estimated fair values for each property are based on a number of assumptions, including but not limited to estimated holding periods, outcome probabilities, market capitalization rates and discount rates, if applicable. When assets are identified by management as held for sale, management discontinues depreciating the assets and estimates the sales price, net of expected selling costs, of such assets. If, in management’s opinion, the estimated net sales price, net of expected selling costs, of the disposal groups which have been identified as held for sale is less than the carrying value of the assets, a valuation allowance is established. For developable land holdings, which can be classified as either rental property or real estate held for sale, an estimated per-unit market value assumption is considered based on development rights or plans for the land.The principal considerations for our determination that performing procedures relating to the impairment assessment of rental property and estimated net sales price of real estate held for sale in the absence of an executed sales agreement is a critical audit matter are (i) the high degree of auditor judgment, subjectivity, and subjectivity involvedeffort in performing procedures relatingand evaluating audit evidence related to management’s estimates of the aggregate future cash flows and fair value used in the impairment assessment of rental property and estimated net sales priceindicators of real estate held for sale in the absence of an executed sales agreement due to the significant judgment by management when developing these estimates; (ii) the significant audit effort in evaluating the significant assumptionsimpairment related to estimatedproperty operating performance, changes in anticipated holding periods, outcome probabilities,period, and general market capitalization rates and discount rates used in estimating the aggregate future cash flows and fair value used in the impairment assessment of rental property and the estimated per-unit market value used in estimating the net sales price or fair value for developable land holdings; and (iii) the audit effort involved the use of professionals with specialized skill and knowledge.conditions.estimates of the aggregate future cash flows and fair value used in the impairment assessment of indicators of impairment for rental property and estimated net sales price of real estateproperties held for saleuse. in the absence of an executed sales agreement, including controls over the reasonableness of the significant assumptions used in the estimates. These procedures also included, among others (i) testing management’s process by (i) evaluatingfor assessing whether there are any indicators that the appropriatenessvalue of the methods used to estimate the aggregate future cash flows and fair value and the net sales price;Company’s rental properties held for use may be impaired; (ii) testing the completeness and accuracy of the underlying data provided by management;used in management’s assessment of indicators of impairment; and (iii) evaluating the reasonableness of significant assumptionsmanagement’s assessment of indicators of impairment related to estimatedproperty operating performance, changes in anticipated holding periods, outcome probabilities,period, and general market capitalization rates and discount rates used in estimating the aggregate future cash flows and fair value used in the impairment assessment of rentalconditions. Evaluating property and the estimated per-unit market value used in estimating the net sales price or fair value for developable land holdings. Evaluating the reasonableness of these significant assumptionsoperating performance involved considering thecurrent and past performance of the assets, market data for similar investments, and whether this evidence was consistentproperties. Evaluating the anticipated holding period involved considering management’s intent with evidence obtained in other areasrespect to holding or disposing of the audit. For a sample of rental properties and real estate held for sale properties. Evaluating the general market conditions involved considering changes in the absence of an executed sales agreement, professionals with specialized skill and knowledge were used to assist in evaluating the reasonableness of estimates of aggregate future cash flows, market capitalization rates and discount rates used in the impairment assessment of rental property and the estimated per-unit market value used in estimating the net sales price or fair value for developable land holdings.EstimatedFuture Redemption Value of Redeemable Non-controlling Interest – Valuation of the Veris Residential Trust Real Estate PortfolioAs described in Note 15 to the consolidated financial statements, the Company’s redeemable non-controlling interest balance in Veris Residential Trust (“VRT”), a consolidated subsidiary, was $469 million and the estimated future redemption value of Rockpoint’s Preferred Units was approximately $479 million as of December 31, 2021. Management determines the redemption value of these interests by hypothetically liquidating the estimated net asset value of the VRT real estate portfolio including debt principal through the applicable waterfall provisions of the investment agreement. Management estimates net asset value based on unobservable inputs after considering the assumptions that market participants would make in valuing the real estate assets of VRT which is the basis for pricing the future redemption value of the Rockpoint interests. Management estimates the net asset value of VRT by (i) applying a discount rate to the estimated future cash flows for properties under development during the period under construction and then applying a direct capitalization method to the estimated stabilized cash flows, (ii) using the direct capitalization method by applying a capitalization rate to the projected net operating income for operating properties, and (iii) estimating per-unit market value rate assumptions for developable land holdings based on development rights or plans available for the land. Estimated future cash flows used in such analyses are based on management’s business plan for each respective property including capital expenditures, management’s views of market and economic conditions and considers items such as current and future rental rates, occupancies and market transactions for comparable properties.The principal considerations for our determination that performing procedures relating to the estimated future redemption value of redeemable non-controlling interest - valuation of the VRT real estate portfolio is a critical audit matter are (i) the high degree of auditor judgment and subjectivity in performing procedures and evaluating audit evidence relating to the valuation of the VRT real estate portfolio due to the significant judgment by management when developing these estimates; (ii) the significant audit effort in evaluating the significant assumptions related to capitalization rates for operating properties and properties under development and per-unit market value rate assumptions for developable land holdings; and (iii) the audit effort involved the use of professionals with specialized skill and knowledge.Addressing the matter involved performing procedures and evaluating audit evidence in connection with forming our overall opinion on the consolidated financial statements. These procedures included testing the effectiveness of controls relating to the estimated future redemption value of redeemable non-controlling interest - valuation of the VRT real estate portfolio, including controls over the reasonableness of the significant assumptions related to capitalization rates and per-unit market value rate assumptions. These procedures also included, among others, testing management’s process by (i) evaluating the appropriateness of the methods used to estimate the value of the VRT real estate portfolio; (ii) evaluating the reasonableness of significant assumptions related to capitalization rates for operating properties and properties under development and per-unit market value rate assumptions for developable land holdings; and (iii) testing the completeness and accuracy of data provided by management. For a sample of properties within the VRT real estate portfolio, professionals with specialized skill and knowledge were used to assist in evaluating the reasonableness of management’s significant assumptions related to capitalization rates and per-unit market value rate assumptions. Evaluating the reasonableness of these significant assumptions related to the valuation of the VRT real estate portfolio involved considering the past performance of the properties, market data for similar investments, and whether this evidence was consistent with evidence obtained in other areas of the audit.23, 202221, 20241994.20212023 and 2020,2022, and the related consolidated statements of operations, of comprehensive income (loss), of changes in equity and of cash flows for each of the three years in the period ended December 31, 2021,2023, including the related notes and financial statement schedule listed in the index appearing under Item 15(a)(2) (collectively referred to as the “consolidated financial statements”). We also have audited the Company's internal control over financial reporting as of December 31, 2021,2023, based on criteria established in Internal Control - Integrated Framework (2013) issued by the Committee of Sponsoring Organizations of the Treadway Commission (COSO).20212023 and 2020,2022, and the results of its operations and its cash flows for each of the three years in the period ended December 31, 20212023 in conformity with accounting principles generally accepted in the United States of America. Also in our opinion, the Company maintained, in all material respects, effective internal control over financial reporting as of December 31, 2021,2023, based on criteria established in Internal Control - Integrated Framework (2013) issued by the COSO.Overover Financial Reporting appearing under Item 9A. Our responsibility is to express opinions on the Company’s consolidated financial statements and on the Company's internal control over financial reporting based on our audits. We are a public accounting firm registered with the Public Company Accounting Oversight Board (United States) (PCAOB) and are required to be independent with respect to the Company in accordance with the U.S. federal securities laws and the applicable rules and regulations of the Securities and Exchange Commission and the PCAOB.mattersmatter communicated below are mattersis a matter arising from the current period audit of the consolidated financial statements that werewas communicated or required to be communicated to the audit committee and that (i) relaterelates to accounts or disclosures that are material to the consolidated financial statements and (ii) involved our especially challenging, subjective, or complex judgments. The communication of critical audit matters does not alter in any way our opinion on the consolidated financial statements, taken as a whole, and we are not, by communicating the critical audit mattersmatter below, providing a separate opinionsopinion on the critical audit mattersmatter or on the accounts or disclosures to which they relate.Impairment Assessment of Indicators of Impairment for Rental Property and Estimated Net Sales Price of Real Estate Held for Sale in the Absence of an Executed Sales AgreementUse, NetNotesNote 2 and 3 to the consolidated financial statements, the Company’s net investment in rental property and real estate held for sale,use, net was $4$2.9 billion and $619 million, respectively, as of December 31, 2021.2023. On a periodic basis, management assesses whether there are any indicators, including property operating performance, changes in anticipated holding period, and general market conditions, that the value of the Company’s rental properties held for use may be impaired.impaired. A property’s value is impaired only if management’s estimate of the aggregate future cash flows (undiscounted and without interest charges) to be generated by the property over its estimated holding period is less than the carrying value of the property. If there are different possible scenarios for(ii) a property, the Company will take a probability weighted approach to estimating future cash flow scenarios. To the extent impairment has occurred, the impairment loss is measured as the excess of the carrying value of the property over the fair value of the property. Management’s estimates of aggregate future cash flows expected to be generated and estimated fair values for each property are based on a number of assumptions, including but not limited to estimated holding periods, outcome probabilities, market capitalization rates and discount rates, if applicable. When assets are identified by management as held for sale, management discontinues depreciating the assets and estimates the sales price, net of expected selling costs, of such assets. If, in management’s opinion, the estimated net sales price, net of expected selling costs, of the disposal groups which have been identified as held for sale is less than the carrying value of the assets, a valuation allowance is established. For developable land holdings, which can be classified as either rental property or real estate held for sale, an estimated per-unit market value assumption is considered based on development rights or plans for the land.The principal considerations for our determination that performing procedures relating to the impairment assessment of rental property and estimated net sales price of real estate held for sale in the absence of an executed sales agreement is a critical audit matter are (i) the high degree of auditor judgment, subjectivity, and subjectivity involvedeffort in performing procedures relatingand evaluating audit evidence related to management’s estimates of the aggregate future cash flows and fair value used in the impairment assessment of rental property and estimated net sales priceindicators of real estate held for sale in the absence of an executed sales agreement due to the significant judgment by management when developing these estimates; (ii) the significant audit effort in evaluating the significant assumptionsimpairment related to estimatedproperty operating performance, changes in anticipated holding periods, outcome probabilities,period, and general market capitalization rates and discount rates used in estimating the aggregate future cash flows and fair value used in the impairment assessment of rental property and the estimated per-unit market value used in estimating the net sales price or fair value for developable land holdings; and (iii) the audit effort involved the use of professionals with specialized skill and knowledge.conditions.estimates of the aggregate future cash flows and fair value used in the impairment assessment of indicators of impairment for rental property and estimated net sales price of real estateproperties held for saleuse. in the absence of an executed sales agreement, including controls over the reasonableness of the significant assumptions used in the estimates. These procedures also included, among others (i) testing management’s process by (i) evaluatingfor assessing whether there are any indicators that the appropriatenessvalue of the methods used to estimate the aggregate future cash flows and fair value and the net sales price;Company’s rental properties held for use may be impaired; (ii) testing the completeness and accuracy of the underlying data provided by management;used in management’s assessment of indicators of impairment; and (iii) evaluating the reasonableness of significant assumptionsmanagement’s assessment of indicators of impairment related to estimatedproperty operating performance, changes in anticipated holding periods, outcome probabilities,period, and general market capitalization rates and discount rates used in estimating the aggregate future cash flows and fair value used in the impairment assessment of rentalconditions. Evaluating property and the estimated per-unit market value used in estimating the net sales price or fair value for developable land holdings. Evaluating the reasonableness of these significant assumptionsoperating performance involved considering thecurrent and past performance of the assets, market data for similar investments, and whether this evidence was consistentproperties. Evaluating the anticipated holding period involved considering management’s intent with evidence obtained in other areasrespect to holding or disposing of the audit. For a sample of rental properties and real estate held for sale properties. Evaluating the general market conditions involved considering changes in the absence of an executed sales agreement, professionals with specialized skill and knowledge were used to assist in evaluating the reasonableness of estimates of aggregate future cash flows, market capitalization rates and discount rates used in the impairment assessment of rental property and the estimated per-unit market value used in estimating the net sales price or fair value for developable land holdings.EstimatedFuture Redemption Value of Redeemable Non-controlling Interest – Valuation of the Veris Residential Trust Real Estate PortfolioAs described in Note 15 to the consolidated financial statements, the Company’s redeemable non-controlling interest balance in Veris Residential Trust (“VRT”), a consolidated subsidiary, was $469 million and the estimated future redemption value of Rockpoint’s Preferred Units was approximately $479 million as of December 31, 2021. Management determines the redemption value of these interests by hypothetically liquidating the estimated net asset value of the VRT real estate portfolio including debt principal through the applicable waterfall provisions of the investment agreement. Management estimates net asset value based on unobservable inputs after considering the assumptions that market participants would make in valuing the real estate assets of VRT which is the basis for pricing the future redemption value of the Rockpoint interests. Management estimates the net asset value of VRT by (i) applying a discount rate to the estimated future cash flows for properties under development during the period under construction and then applying a direct capitalization method to the estimated stabilized cash flows, (ii) using the direct capitalization method by applying a capitalization rate to the projected net operating income for operating properties, and (iii) estimating per-unit market value rate assumptions for developable land holdings based on development rights or plans available for the land. Estimated future cash flows used in such analyses are based on management’s business plan for each respective property including capital expenditures, management’s views of market and economic conditions and considers items such as current and future rental rates, occupancies and market transactions for comparable properties.The principal considerations for our determination that performing procedures relating to the estimated future redemption value of redeemable non-controlling interest - valuation of the VRT real estate portfolio is a critical audit matter are (i) the high degree of auditor judgment and subjectivity in performing procedures and evaluating audit evidence relating to the valuation of the VRT real estate portfolio due to the significant judgment by management when developing these estimates; (ii) the significant audit effort in evaluating the significant assumptions related to capitalization rates for operating properties and properties under development and per-unit market value rate assumptions for developable land holdings; and (iii) the audit effort involved the use of professionals with specialized skill and knowledge.Addressing the matter involved performing procedures and evaluating audit evidence in connection with forming our overall opinion on the consolidated financial statements. These procedures included testing the effectiveness of controls relating to the estimated future redemption value of redeemable non-controlling interest - valuation of the VRT real estate portfolio, including controls over the reasonableness of the significant assumptions related to capitalization rates and per-unit market value rate assumptions. These procedures also included, among others, testing management’s process by (i) evaluating the appropriateness of the methods used to estimate the value of the VRT real estate portfolio; (ii) evaluating the reasonableness of significant assumptions related to capitalization rates for operating properties and properties under development and per-unit market value rate assumptions for developable land holdings; and (iii) testing the completeness and accuracy of data provided by management. For a sample of properties within the VRT real estate portfolio, professionals with specialized skill and knowledge were used to assist in evaluating the reasonableness of management’s significant assumptions related to capitalization rates and per-unit market value rate assumptions. Evaluating the reasonableness of these significant assumptions related to the valuation of the VRT real estate portfolio involved considering the past performance of the properties, market data for similar investments, and whether this evidence was consistent with evidence obtained in other areas of the audit.23, 202221, 2024VERIS RESIDENTIAL, INC. AND SUBSIDIARIESCONSOLIDATED BALANCE SHEETS(in thousands, except per share amounts)ASSETS December 31,
2023December 31,
2022Land and leasehold interests Land and leasehold interests 3,391,488 2,947,707 Deferred charges and other assets, net Total assets Total assets LIABILITIES AND EQUITY LIABILITIES AND EQUITY Mortgages, loans payable and other obligations, net Mortgages, loans payable and other obligations, net Commitments and contingencies Commitments and contingencies Equity: Equity: Veris Residential, Inc. stockholders’ equity: Veris Residential, Inc. stockholders’ equity: Common stock, $0.01 par value, 190,000,000 shares authorized, Common stock, $0.01 par value, 190,000,000 shares authorized, 92,229,424 and 91,141,649 shares outstanding 92,229,424 and 91,141,649 shares outstanding 92,229,424 and 91,141,649 shares outstanding Accumulated other comprehensive income Noncontrolling interests in subsidiaries: Noncontrolling interests in subsidiaries: Operating Partnership Operating Partnership Total equity Total equity Total liabilities and equity Total liabilities and equity VERIS RESIDENTIAL, INC. AND SUBSIDIARIESCONSOLIDATED STATEMENTS OF OPERATIONS(in thousands, except per share amounts)Year Ended December 31, Year Ended December 31, REVENUES 2023 2022 2021 Other income Other income EXPENSES EXPENSES Real estate taxes Real estate taxes Transaction-related costs OTHER (EXPENSE) INCOME OTHER (EXPENSE) INCOME Interest expense Interest expense Interest cost of mandatorily redeemable noncontrolling interests Realized gains (losses) and unrealized gains (losses) on disposition of rental property, net Realized gains (losses) and unrealized gains (losses) on disposition of rental property, net Realized gains (losses) and unrealized gains (losses) on disposition of rental property, net Loss on sale of unconsolidated joint venture interests Loss from extinguishment of debt, net Other income, net Total other income (expense), net Loss from continuing operations before income tax expense Loss from continuing operations before income tax expense Loss from continuing operations before income tax expense Provision for income taxes Loss from continuing operations after income tax expense Discontinued operations: Discontinued operations: Income (Loss) from discontinued operations Income (Loss) from discontinued operations Income (Loss) from discontinued operations Realized gains (losses) and unrealized gains (losses) on disposition of rental property and impairments, net Net loss Net loss Net loss Noncontrolling interests in Operating Partnership of income from continuing operations Net loss available to common shareholders Basic earnings per common share: Basic earnings per common share: Loss from continuing operations Loss from continuing operations Loss from continuing operations Net loss available to common shareholders Diluted earnings per common share: Diluted earnings per common share: Loss from continuing operations Loss from continuing operations Loss from continuing operations Net loss available to common shareholders Basic weighted average shares outstanding Basic weighted average shares outstanding Diluted weighted average shares outstanding Diluted weighted average shares outstanding VERIS RESIDENTIAL, INC. AND SUBSIDIARIESCONSOLIDATED STATEMENTS OF COMPREHENSIVE INCOME (in thousands)Year Ended December 31, 2023 2022 2021 Net loss $ (112,361) $ (34,885) $ (109,539) Other comprehensive income (loss): Net unrealized (loss) gain on derivative instruments for interest rate caps (2,375) 4,366 10 Comprehensive loss $ (114,736) $ (30,519) $ (109,529) Comprehensive loss attributable to noncontrolling interests in consolidated joint ventures 2,319 3,079 4,595 Comprehensive income attributable to redeemable noncontrolling interests (7,618) (25,534) (25,977) Comprehensive loss attributable to noncontrolling interests in Operating Partnership 10,601 4,876 11,878 Comprehensive loss attributable to common shareholders $ (109,434) $ (48,098) $ (119,033)
VERIS RESIDENTIAL, INC. AND SUBSIDIARIESCONSOLIDATED STATEMENT OF CHANGES IN EQUITY(in thousands)Common Stock Additional Paid-In Capital Dividends in Excess of Net Earnings Accumulated Other Comprehensive Income (Loss) Noncontrolling Interests in Subsidiaries Total Equity Shares Par Value Balance at January 1, 2021 90,712 $ 907 $ 2,528,187 $ (1,130,277) $ — $ 193,563 $ 1,592,380 Net (loss) income — — — (119,042) — 9,503 (109,539) Common unit distributions — — — — — 645 645 Redeemable noncontrolling interests — — (7,290) — — (26,703) (33,993) Change in noncontrolling interests in consolidated joint ventures — — — — — 206 206 Redemption of common units for common stock 175 2 2,714 — — (2,716) — Redemption of common units — — — — — (11,357) (11,357) Shares issued under Dividend Reinvestment and Stock Purchase Plan 3 — 28 — — — 28 Directors' deferred compensation plan — — 314 — — — 314 Stock compensation 58 — 5,139 — — 5,708 10,847 Cancellation of restricted shares — — (123) — — — (123) Other comprehensive income — — — — 9 1 10 Rebalancing of ownership percentage between parent and subsidiaries — — 1,414 — — (1,414) — Balance at December 31, 2021 90,948 $ 909 $ 2,530,383 $ (1,249,319) $ 9 $ 167,436 $ 1,449,418 Net (loss) income — — — (52,066) — 17,181 (34,885) Common unit distributions — — — — — 218 218 Redeemable noncontrolling interests — — (5,475) — — (26,082) (31,557) Change in noncontrolling interests in consolidated joint ventures — — — — — 239 239 Redemption of common units for common stock 12 — 161 — — (161) — Redemption of common units — — — — — (1,826) (1,826) Shares issued under Dividend Reinvestment and Stock Purchase Plan 2 — 23 — — — 23 Directors' deferred compensation plan — — 440 — — — 440 Stock compensation 231 2 9,926 — — 3,839 13,767 Cancellation of restricted shares (51) — (866) — — — (866) Other comprehensive income — — — — 3,968 398 4,366 Rebalancing of ownership percentage between parent and subsidiaries — — (2,410) — — 2,410 — Balance at December 31, 2022 91,142 $ 911 $ 2,532,182 $ (1,301,385) $ 3,977 $ 163,652 $ 1,399,337 Net loss — — — (107,265) — (5,096) (112,361) Shares issued under ATM Program, net — — (540) — — — (540) Common stock dividends — — — (9,662) — — (9,662) Common unit distributions — — — — — (891) (891) Redeemable noncontrolling interests — — (4,516) — — (8,079) (12,595) Change in noncontrolling interests in consolidated joint ventures — — (530) — — (355) (885) Redemption of common units for common stock 821 8 11,363 — — (11,371) — Redemption of common units — — — — — (142) (142) Shares issued under Dividend Reinvestment and Stock Purchase Plan — — 4 — — — 4 Directors' deferred compensation plan 21 — 394 — — — 394 Stock compensation 284 3 19,386 — — 487 19,876 Cancellation of restricted shares (39) — (607) — — — (607) Other comprehensive loss — — — — (2,169) (206) (2,375) Rebalancing of ownership percentage between parent and subsidiaries — — (4,076) — 4,076 — Balance at December 31, 2023 92,229 $ 922 $ 2,553,060 $ (1,418,312) $ 1,808 $ 142,075 $ 1,279,553
VERIS RESIDENTIAL, INC. AND SUBSIDIARIESCONSOLIDATED STATEMENTS OF CASH FLOWS(in thousands) December 31, CASH FLOWS FROM OPERATING ACTIVITIES 2023 2022 2021 Net loss Net income from discontinued operations Net loss from continuing operations Operating activities: Operating activities: Depreciation and amortization, including related intangible assets Depreciation and amortization, including related intangible assets Write-off transaction-related costs Write-off transaction-related costs Loss from sale of investment in unconsolidated joint venture Loss from extinguishment of debt Gain on insurance proceeds Interest cost of mandatorily redeemable noncontrolling interests Decrease (Increase) in unbilled rents receivable, net Decrease (Increase) in unbilled rents receivable, net Decrease (Increase) in unbilled rents receivable, net Decrease (Increase) in deferred charges and other assets Decrease (Increase) in accounts receivable, net (Decrease) Increase in accounts payable, accrued expenses and other liabilities Increase in rents received in advance and security deposits Increase in accrued interest payable Net cash flows provided by (used in) operating activities - continuing operations Net cash flows (used in) provided by operating activities - discontinued operations Net cash provided by operating activities Net cash provided by operating activities CASH FLOWS FROM INVESTING ACTIVITIES CASH FLOWS FROM INVESTING ACTIVITIES Rental property acquisitions and related intangibles Rental property acquisitions and related intangibles Development of rental property, other related costs and deposits Proceeds from the sales of rental property and developable land Proceeds from insurance settlements Other investing activities Net cash provided by (used in) investing activities - continuing operations Net cash provided by investing activities Net cash provided by investing activities CASH FLOW FROM FINANCING ACTIVITIES CASH FLOW FROM FINANCING ACTIVITIES Borrowings from revolving credit facility Borrowings from revolving credit facility Redemption of redeemable noncontrolling interests, net Redemption of redeemable noncontrolling interests, net Redemption of redeemable noncontrolling interests, net Contributions from noncontrolling interests Distributions to noncontrolling interests Share issuance proceeds (costs), net Other financing activities Net cash used in financing activities Net cash used in financing activities Net increase (decrease) in cash and cash equivalents Net increase (decrease) in cash and cash equivalents Net increase (decrease) in cash and cash equivalents Cash, cash equivalents and restricted cash, end of period (2) Cash, cash equivalents and restricted cash, end of period (2) $14,207, $15,577$20,867, $19,701 and $19,921$14,207 as of December 31, 2022, 2021 and 2020, 2019 and 2018, respectively.$19,701, $14,207$26,572, $20,867 and $15,577$19,701 as of December 31, 2023, 2022 and 2021, 2020 and 2019, respectively.
VERIS RESIDENTIAL, L.P. AND SUBSIDIARIESCONSOLIDATED BALANCE SHEETS(in thousands, except per unit amounts)ASSETS December 31,
2023December 31,
2022Rental property Land and leasehold interests $ 474,499 $ 492,204 Buildings and improvements 2,782,468 3,332,315 Tenant improvements 30,908 122,509 Furniture, fixtures and equipment 103,613 99,094 3,391,488 4,046,122 Less – accumulated depreciation and amortization (443,781) (631,910) 2,947,707 3,414,212 Real estate held for sale, net 58,608 193,933 Net investment in rental property 3,006,315 3,608,145 Cash and cash equivalents 28,007 26,782 Restricted cash 26,572 20,867 Investments in unconsolidated joint ventures 117,954 126,158 Unbilled rents receivable, net 5,500 39,734 Deferred charges and other assets, net 53,956 96,162 Accounts receivable 2,742 2,920 Total assets $ 3,241,046 $ 3,920,768 LIABILITIES AND EQUITY Mortgages, loans payable and other obligations, net $ 1,853,897 $ 1,903,977 Dividends payable 5,540 110 Accounts payable, accrued expenses and other liabilities 55,492 72,041 Rents received in advance and security deposits 14,985 22,941 Accrued interest payable 6,580 7,131 Total liabilities 1,936,494 2,006,200 Commitments and contingencies Redeemable noncontrolling interests 24,999 515,231 Partners’ Capital: General Partner, 92,229,424 and 91,141,649 common units outstanding 1,071,973 1,163,935 Limited partners, 8,692,561 and 9,301,521 common units/LTIPs outstanding 170,903 193,882 Accumulated other comprehensive income 1,808 3,977 Total Veris Residential, L.P. partners’ capital 1,244,684 1,361,794 Noncontrolling interests in consolidated joint ventures 34,869 37,543 Total equity 1,279,553 1,399,337 Total liabilities and equity $ 3,241,046 $ 3,920,768
VERIS RESIDENTIAL, L.P. AND SUBSIDIARIESCONSOLIDATED STATEMENTS OF OPERATIONS(in thousands, except per unit amounts) Year Ended December 31, REVENUES 2023 2022 2021 Revenue from leases $ 252,144 $ 206,052 $ 162,082 Real estate services 3,868 3,581 9,596 Parking income 18,036 15,819 12,274 Other income 5,811 7,996 10,693 Total revenues 279,859 233,448 194,645 EXPENSES Real estate taxes 40,810 39,112 28,818 Utilities 9,922 8,921 8,307 Operating services 57,925 52,797 45,460 Real estate services expenses 14,188 10,549 12,858 General and administrative 44,472 56,014 56,977 Transaction-related costs 7,627 3,468 12,208 Depreciation and amortization 93,589 85,434 68,506 Property impairments 32,516 — — Land and other impairments, net 9,324 9,368 23,719 Total expenses 310,373 265,663 256,853 OTHER (EXPENSE) INCOME Interest expense (89,355) (66,381) (47,505) Interest cost of mandatorily redeemable noncontrolling interests (49,782) — — Interest and other investment income (loss) 5,515 729 524 Equity in earnings (loss) of unconsolidated joint ventures 3,102 1,200 (4,250) Realized gains (losses) and unrealized gains (losses) on disposition of rental property, net — — 3,023 Gain on disposition of developable land 7,068 57,262 2,115 Loss on sale of unconsolidated joint venture interests — — (1,886) Loss from extinguishment of debt, net (5,606) (129) (47,078) Other income, net 2,871 — — Total other income (expense), net (126,187) (7,319) (95,057) Loss from continuing operations before income tax expense (156,701) (39,534) (157,265) Provision for income taxes (492) — — Loss from continuing operations after income tax expense (157,193) (39,534) (157,265) Discontinued operations: Income (Loss) from discontinued operations 3,150 (64,704) 22,174 Realized gains (losses) and unrealized gains (losses) on disposition of rental property and impairments, net 41,682 69,353 25,552 Total discontinued operations, net 44,832 4,649 47,726 Net loss (112,361) (34,885) (109,539) Noncontrolling interests in consolidated joint ventures 2,319 3,079 4,595 Redeemable noncontrolling interests (7,618) (25,534) (25,977) Net loss available to common unitholders $ (117,660) $ (57,340) $ (130,921) Basic earnings per common unit: Loss from continuing operations $ (1.66) $ (0.68) $ (1.87) Discontinued operations 0.44 0.05 0.48 Net loss available to common unitholders $ (1.22) $ (0.63) $ (1.39) Diluted earnings per common unit: Loss from continuing operations $ (1.66) $ (0.68) $ (1.87) Discontinued operations 0.44 0.05 0.48 Net loss available to common unitholders $ (1.22) $ (0.63) $ (1.39) Basic weighted average units outstanding 100,812 100,265 99,893 Diluted weighted average units outstanding 100,812 100,265 99,893 VERIS RESIDENTIAL, L.P. AND SUBSIDIARIESCONSOLIDATED STATEMENTS OF COMPREHENSIVE INCOME (in thousands)Year Ended December 31, 2023 2022 2021 Net loss $ (112,361) $ (34,885) $ (109,539) Other comprehensive income (loss): Net unrealized (loss) gain on derivative instruments for interest rate caps (2,375) 4,366 10 Comprehensive loss $ (114,736) $ (30,519) $ (109,529) Comprehensive loss attributable to noncontrolling interests in consolidated joint ventures 2,319 3,079 4,595 Comprehensive income attributable to redeemable noncontrolling interests (7,618) (25,534) (25,977) Comprehensive loss attributable to common unitholders $ (120,035) $ (52,974) $ (130,911)
VERIS RESIDENTIAL, L.P. AND SUBSIDIARIESCONSOLIDATED STATEMENT OF CHANGES IN EQUITY(in thousands) General Partner Common Units Limited Partner Common Units/ Vested LTIP Units General Partner Common Unitholders Limited Partner Common Unitholders Accumulated Other Comprehensive Income (Loss) Noncontrolling Interest in Consolidated Joint Ventures Total Equity Balance at January 1, 2021 90,712 9,649 $ 1,330,048 $ 217,560 $ — $ 44,772 $ 1,592,380 Net (loss) income — — (119,042) (11,879) — 21,382 (109,539) Units Distributions — — — 645 — — 645 Redeemable noncontrolling interests — — (7,290) (726) — (25,977) (33,993) Change in noncontrolling interests in consolidated joint ventures — — — — — 206 206 Redemption of limited partner common units for shares of general partner common units 175 (175) 2,716 (2,716) — — — Vested LTIP units — 270 — — — — — Redemption of limited partners common units — (731) — (11,357) — — (11,357) Shares issued under Dividend Reinvestment and Stock Purchase Plan 3 — 28 — — — 28 Directors' deferred compensation plan — — 314 — — — 314 Other comprehensive income — — — 1 9 — 10 Stock compensation 58 — 5,139 5,708 — — 10,847 Cancellation of restricted shares — — (123) — — — (123) Balance at December 31, 2021 90,948 9,013 $ 1,211,790 $ 197,236 $ 9 $ 40,383 $ 1,449,418 Net (loss) income — — (52,066) (5,274) — 22,455 (34,885) Units Distributions — — — 218 — — 218 Redeemable noncontrolling interests — — (5,475) (548) — (25,534) (31,557) Change in noncontrolling interests in consolidated joint ventures — — — — — 239 239 Redemption of limited partner common units for shares of general partner common units 12 (12) 161 (161) — — — Vested LTIP units — 410 — — — — — Redemption of limited partners common units — (110) — (1,826) — — (1,826) Shares issued under Dividend Reinvestment and Stock Purchase Plan 2 — 23 — — — 23 Directors' deferred compensation plan — — 440 — — — 440 Other comprehensive income — — — 398 3,968 — 4,366 Stock compensation 231 — 9,928 3,839 — — 13,767 Cancellation of restricted shares (51) — (866) — — (866) Balance at December 31, 2022 91,142 9,301 $ 1,163,935 $ 193,882 $ 3,977 $ 37,543 $ 1,399,337 Net (loss) income — — (107,265) (10,395) — 5,299 (112,361) Shares issued under ATM Program, net — — (540) — — — (540) Units Distributions — — (9,662) (891) — — (10,553) Redeemable noncontrolling interests — — (4,516) (461) — (7,618) (12,595) Change in noncontrolling interests in consolidated joint ventures — — (530) — — (355) (885) Redemption of limited partner common units for shares of general partner common units 821 (821) 11,371 (11,371) — — — Vested LTIP units — 221 — — — — — Redemption of limited partners common units — (8) — (142) — — (142) Shares issued under Dividend Reinvestment and Stock Purchase Plan — — 4 — — — 4 Directors' deferred compensation plan 21 — 394 — — — 394 Other comprehensive loss — — — (206) (2,169) — (2,375) Stock compensation 284 — 19,389 487 — — 19,876 Cancellation of restricted shares (39) — (607) — — (607) Balance at December 31, 2023 92,229 8,693 $ 1,071,973 $ 170,903 $ 1,808 $ 34,869 $ 1,279,553 December 31, CASH FLOWS FROM OPERATING ACTIVITIES 2023 2022 2021 Net loss $ (112,361) $ (34,885) $ (109,539) Net income from discontinued operations (44,832) (4,649) (47,726) Net loss from continuing operations (157,193) (39,534) (157,265) Adjustments to reconcile net income (loss) to net cash provided by Operating activities: Depreciation and amortization, including related intangible assets 93,542 85,425 68,525 Amortization of directors deferred compensation stock units 394 440 314 Amortization of stock compensation 19,876 13,767 10,847 Amortization of deferred financing costs 4,416 4,394 3,652 Amortization of debt discount and mark-to-market — — 232 Equity in (earnings) loss of unconsolidated joint ventures (3,102) (1,200) 4,250 Distributions of cumulative earnings from unconsolidated joint ventures — 13 759 Write-off transaction-related costs — — 7,922 Realized (gains) losses and unrealized (gains) losses on disposition of rental property, net — — (3,023) Gain on disposition of developable land (7,068) (57,262) (2,115) Property impairments 32,516 — — Land and other impairments, net 9,324 9,368 23,719 Loss from sale of investment in unconsolidated joint venture — — 1,886 Loss from extinguishment of debt 5,606 129 47,078 Gain on insurance proceeds (2,871) — — Interest cost of mandatorily redeemable noncontrolling interests 49,782 — — Changes in operating assets and liabilities: Decrease (Increase) in unbilled rents receivable, net 2,826 3,567 (1,928) Decrease (Increase) in deferred charges and other assets 2,081 (5,050) (1,401) Decrease (Increase) in accounts receivable, net 215 (609) 157 (Decrease) Increase in accounts payable, accrued expenses and other liabilities (4,263) 1,496 (8,086) Increase in rents received in advance and security deposits 202 3,040 1,050 Increase in accrued interest payable 42 2,152 280 Net cash flows provided by (used in) operating activities - continuing operations 46,325 20,136 (3,147) Net cash flows (used in) provided by operating activities - discontinued operations (785) 46,318 59,262 Net cash provided by operating activities $ 45,540 $ 66,454 $ 56,115 CASH FLOWS FROM INVESTING ACTIVITIES Rental property acquisitions and related intangibles $ — $ (130,500) $ — Rental property additions and improvements (12,464) (16,784) (41,632) Development of rental property and other related costs (8,395) (45,817) (154,926) Proceeds from the sales of rental property and developable land 23,035 153,015 52,391 Proceeds from the sale of investments in unconsolidated joint ventures — — 3,865 Repayment of notes receivable 1,303 2,926 7,257 Investment in unconsolidated joint ventures (762) (162) (1,280) Distributions in excess of cumulative earnings from unconsolidated joint ventures 12,068 13,132 15,703 Proceeds from insurance settlements 3,812 — — Other investing activities 1,030 — — Net cash provided by (used in) investing activities - continuing operations 19,627 (24,190) (118,622) Net cash provided by investing activities - discontinued operations 560,023 244,278 564,851 Net cash provided by investing activities $ 579,650 $ 220,088 $ 446,229 VERIS RESIDENTIAL, L.P. AND SUBSIDIARIESCONSOLIDATED STATEMENTS OF CASH FLOWS(in thousands)CASH FLOW FROM FINANCING ACTIVITIES Borrowings from revolving credit facility $ 81,000 $ 102,000 $ 196,000 Repayment of revolving credit facility (81,000) (250,000) (73,000) Borrowings from term loans 115,000 — 150,000 Repayment of term loans (115,000) — (150,000) Repayment of senior unsecured notes — — (573,727) Proceeds from mortgages and loans payable 399,561 154,720 226,422 Repayment of mortgages, loans payable and other obligations (442,066) (245,522) (192,995) Redemption of redeemable noncontrolling interests, net (535,488) (12,000) — Payment of early debt extinguishment costs (255) (5,140) (49,874) Common unit redemptions (142) (2,692) (898) Payment of financing costs (16,158) (6,037) (8,874) Contributions from noncontrolling interests 84 24 207 Distributions to noncontrolling interests (409) — — Distributions to redeemable noncontrolling interests (17,121) (25,640) (25,977) Payment of common dividends and distributions (5,123) (61) (475) Share issuance proceeds (costs), net (540) — — Other financing activities (603) — — Net cash used in financing activities $ (618,260) $ (290,348) $ (503,191) Net increase (decrease) in cash and cash equivalents $ 6,930 $ (3,806) $ (847) Cash, cash equivalents and restricted cash, beginning of period (1) 47,649 51,455 52,302 Cash, cash equivalents and restricted cash, end of period (2) $ 54,579 $ 47,649 $ 51,455 $14,207, $15,577$20,867, $19,701 and $19,921$14,207 as of December 31, 2022, 2021 and 2020, 2019 and 2018, respectively.$19,701, $14,207$26,572, $20,867 and $15,577$19,701 as of December 31, 2023, 2022 and 2021, 2020 and 2019, respectively.VERIS RESIDENTIAL, INC., VERIS RESIDENTIAL, L.P. AND SUBSIDIARIESNOTES TO CONSOLIDATED FINANCIAL STATEMENTS(square footage, apartment unit, room, and building counts unaudited)Organization. In December 2021, the Company changed its name from Mack-Cali Realty Corporation to Veris Residential, Inc. reflecting the Company’s continued transition to a multifamily REIT, and on December 10, 2021, the Company began trading on the New York Stock Exchange (“NYSE”) under its new ticker symbol, “VRE”. The General Partner controls Veris Residential, L.P., a Delaware limited partnership, together with its subsidiaries (collectively, the “Operating Partnership”), as its sole general partner and owned a 91.091.4 and 90.490.7 percent common unit interest in the Operating Partnership as of December 31, 20212023 and 2020,2022, respectively.General Partner’sCompany develops, owns and operates predominantly multifamily rental properties located primarily in the Northeast, as well as a portfolio of non-strategic commercial properties and land parcels. The Company recently completed its transition to a pure-play multifamily REIT and is focused on conducting business is the ownership of interests in a socially, ethically, and operation of the Operating Partnership and all of the General Partner’s expenses are incurred for the benefit of the Operating Partnership. The General Partner is reimbursed by the Operating Partnershipenvironmentally responsible manner, while seeking to maximize value for all expenses it incurs relating to the ownership and operation of the Operating Partnership.stakeholders.The Operating Partnership conducts the business of providing management, leasing, acquisition, development and tenant-related services for its General Partner. The Operating Partnership, through its operating divisions and subsidiaries, including the Veris property-owning partnerships and limited liability companies, is the entity through which all of the General Partner’s operations are conducted. Residential, Inc. was incorporated on May 24, 1994.2021,2023, the Company owned or had interests in 36 properties (the “Properties”). The Properties are comprised of 2224 multifamily rental properties as well as non-core assets comprised of 7one office properties, 4property and four parking/retail properties, 3 hotels, plus developable land (collectively, the “Properties”"Properties"). The propertiesProperties are comprised of: (a) 2721 wholly-owned or Company-controlled properties, comprised of 1517 multifamily properties and 12four non-core assets, and (b) 9eight properties owned by unconsolidated joint ventures in which the Company has investment interests, including 7seven multifamily properties and 2one non-core assets.On December 19, 2019, the Company announced that its Board had determined to sell the Company’s entire suburban New Jersey office portfolio totaling approximately 6.6 million square feet, which had excluded the Company’s office properties in Jersey City and Hoboken, New Jersey (collectively, the “Suburban Office Portfolio”). As the decision to sell the Suburban Office Portfolio represented a strategic shift in the Company’s operations, these properties’ results (other than a single property not qualified to be classified as held for sale) are being classified as discontinued operations for all periods presented herein. See Note 7: Discontinued Operations.asset.
includereflect all accounts of the Company, including its majority-owned and/or controlled subsidiaries, which consist principally of the Operating Partnership and variable interest entities for which the Company has determined itself to be the primary beneficiary, if any. The portions of equity in consolidated subsidiaries that are not attributable, directly or indirectly, to us are presented as noncontrolling interests. See Note 2: Significant Accounting Policies – Investments in Unconsolidated Joint Ventures, for the Company’s treatment of unconsolidated joint venture interests. Intercompany accounts and transactions have been eliminated.Accounting Standards Codification (“ASC”) 810, Consolidation, provides guidance on the identification of entities for which control is achieved through means other than voting rights (“variable interest entities” or “VIEs”) and the determination of which business enterprise, if any, should consolidate the VIEs. Generally, the consideration of whether an entity is a VIE applies when either: (1) the equity investors (if any) lack (i) the ability to make decisions about the entity's activities through voting or similar rights, (ii) the obligation to absorb the expected losses of the entity, or (iii) the right to receive the expected residual returns of the entity; (2) the equity investment at risk is insufficient to finance that entity’s activities without additional subordinated financial support; or (3) the equity investors have voting rights that are not proportionate to their economic interests and substantially all of the activities of the entity involve or are conducted on behalf of an investor with a disproportionately small voting interest. VIEsvariable interest entities ("VIEs") in which it is considered to be the primary beneficiary. VIEs are entities in which the equity investors do not have sufficient equity at risk to finance their endeavors without additional financial support or that the holders of the equity investment at risk do not have a controlling financial interest. The primary beneficiary is defined by the entity having both of the following characteristics: (1) the power to direct the activities of a VIE that when taken together, most significantly impact the variable interest entity’s performance:VIE’s economic performance; and (2) the obligation to absorb losses andof or the right to receive the returnsbenefits from the VIE that wouldcould potentially be significant to the VIE.On January 1, 2016, The Company continuously assesses its determination of the Company adopted accounting guidance under ASC 810, Consolidation, modifyingprimary beneficiary for each entity and assesses reconsideration events that may cause a change in the analysis it must perform to determine whether it should consolidate certain types of legal entities.original determinations. The guidance does not amend the existing disclosurerequirements for variable interest entities or voting interest model entities. The guidance, however, modified the requirements to qualify under the voting interest model. Under the revised guidance, the Operating Partnership will beis considered a variable interest entityVIE of the parent company, Veris Residential, Inc..Inc. As the Operating Partnership is already consolidated in the balance sheets of Veris Residential, Inc., the identification of this entity as a variable interest entity has no impact on the consolidated financial statements of Veris Residential, Inc.. There were no other legal entities qualifying under the scope of the revised guidance that were consolidated as a result of the adoption.20212023 and 2020,2022, the Company’s investments in consolidated real estate joint ventures, which are variable interest entities in which the Company is deemed to be the primary beneficiary, other than Veris Residential Partners, L.P., formerly known as Roseland Residential, L.P. (See Note 15:14: Redeemable Noncontrolling Interests-Rockpoint Transaction)Interests - Rockpoint Transactions, the Rockpoint interests have been fully redeemed during 2023), have total real estate assets of $477.5$449.8 million and $486.1$468.1 million, respectively, other assets of $5.3$6.7 million and $4.5$6.0 million, respectively, mortgages of $285.7$285.2 million and $284.8$285.5 million, respectively, and other liabilities of $21.2$14.7 million and $21$17.3 million, respectively.The financial statements have been prepared in conformity with GAAP. GAAPaccounting principles generally accepted in the United States of America ("GAAP") requires management to make estimates and assumptions that affect the reported amounts of assets and liabilities and disclosure of contingent assets and liabilities at the date of the financial statements and the reported amounts of revenues and expenses during the reporting period. These estimates and assumptions are based on management’s historical experience that are believed to be reasonable at the time. However, because future events and their effects cannot be determined with certainty, the determination of estimates requires the exercise of judgment. Actual results could differ from those estimates. Certain2020,2023, the Company’s managementCompany identified and recorded an out-of-period adjustment relatingadjustments related to Land and other impairments expense, which was understated for the period ended December 31, 2019. Management concluded that this error wasstock-based compensation expenses incurred in prior years. These adjustments were deemed not material to the Company’sour consolidated financial statements for any periods presented resulting in an increase of the current or prior periods. The adjustment is reflected herein as a $2.5$2.9 million increase to Land and other impairments expense$0.6 million in the Company’s consolidated statements of operations for the year ended December 31, 2020,General and Administrative and Operating Services, respectively, with a corresponding decrease in Real estate held for sale, net, in the Company’s balance sheets asincrease of December 31, 2020.statedreported at cost less accumulated depreciation and amortization. Costs directly related to the acquisition, development and construction of rental properties are capitalized. The Company adopted Financial Accounting Standards Board (“FASB”) guidance Accounting Standards Update (“ASU”) 2017-01 on January 1, 2017, which revises the definition of a business and is expected to result in more transactions to be accounted for as asset acquisitions and significantly limit transactions that would be accounted for as business combinations. Where an acquisition has been determined to be an asset acquisition, acquisition-related transaction costs are capitalized. Capitalized development and construction costs include pre-construction costs essential to the development of the property, development and construction costs, interest, property taxes, insurance, salaries and other project costs incurred during the period of development. Capitalized development and construction salaries and related costs approximated $2.4$0.7 million, $2.0$1.5 million and $2.1$2.4 million for the years ended December 31, 2021, 20202023, 2022 and 2019,2021, respectively. Ordinary repairs and maintenance are expensed as incurred; major replacements and betterments,improvements, which improveenhance or extend the life of the asset, are capitalized and depreciated over their estimated useful lives. Fully-depreciated assets are removed from the accounts.Included in net investment in rental property as of December 31, 2021 and 2020 is real estate and building and tenant improvements not in service; as follows (dollars in thousands):(a)Includes predevelopment and infrastructure costs included in buildings and improvements of $150.9 million and $160.3 million as of December 31, 2021 and December 31, 2020, respectively.(b)Includes $115.5 million of land and $81.3 million of building and improvements pertaining to assets held for sale at December 31, 2020.(c)Includes land of $68.8 million and $74.9 million as of December 31, 2021 and December 31, 2020, respectively.Leasehold interests utilizesuses various valuation methods, such as estimated cash flow projections utilizing appropriate discount and capitalization rates, estimates of replacement costs net of depreciation, and available market information. The fair value of the tangible assets of an acquired property considers the value of the property as if it were vacant. values and tenant relationship values, which are based on management’s evaluation of the specific characteristics of each tenant’s lease and the Company’s overall relationship with the respective tenant.lease. Factors to be considered by management in its analysis of in-place lease values include an estimate of carrying costs during hypothetical expected lease-up periods considering current market conditions, and costs to execute similar leases. In estimating carrying costs, management includes real estate taxes, insurance and other operating expenses and estimates of lost rentals at market rates during the expected lease-up periods, depending on local market conditions. In estimating costs to execute similar leases, management considers leasing commissions, legal and other related expenses. Characteristics considered by management in valuing tenant relationships include the nature and extent of the Company’s existing business relationships with the tenant, growth prospects for developing new business with the tenant, the tenant’s credit quality and expectations of lease renewals. The values of in-place leases are amortized to expense over the remaining initial terms of the respective leases. The values of tenant relationship intangibles are amortized to expense over the anticipated life of the relationships or leases.In addition to identifying any specific circumstances which may affectA property’s value is considered impaired when the expected undiscounted cash flows for a property or properties, management considers other criteria for determining which properties may require assessment for potential impairment. The criteria considered by management, depending on the type of property, may include reviewing low leased percentages, significant near-term lease expirations, current and historical operating and/or cash flow losses, construction cost overruns and/or other factors, including those that might impact the Company’s intent and ability to hold the property. A property’s value is impaired only if management’s estimate of the aggregate future cash flows (undiscounted and without interest charges) to be generated by the property over its estimated holding period isare less than theits carrying value of the property.value. If there are different possible scenariospotential outcomes for a property, the Company will take a probabilityflow scenarios.flows. To the extent impairment has occurred, the impairment loss is measured as the excess of the carrying value of the property over the estimated fair value of the property. The Company’s estimates of aggregate future cash flows expected to be generated and estimatedEstimated fair values for each propertywhich are based on discounted cash flow models include all estimated cash inflows and outflows over a number of assumptions, including but not limited to estimatedspecified holding periods, outcome probabilities, market capitalizationperiod. Capitalization rates and discount rates if applicable. For developable land holdings, an estimated per-unitutilized in these models are based upon unobservable rates that the Company believes to be within a reasonable range of current market value assumption is also considered based on development rights or plans for the land. These assumptions are generally based on management’s experience in its local real estate marketsrates. In addition, such cash flow models consider factors such as expected future operating income, trends and prospects, as well as the effects of current market conditions. The assumptions are subjectdemand, competition and other factors. To the extent impairment has occurred, the carrying value of the property would be adjusted to economic and market uncertainties including, among others, demand for space, competition for tenants, changes in market rental rates, food, beverage and lodging demands, and costsan amount to operate eachreflect the estimated fair value of the property. As these factors are difficult to predict and are subject to future events that may alter management’s assumptions, the future cash flows estimated by management in its impairment analyses may not be achieved, and actual losses or impairments may be realized in the future.When assets are identified by management as held for sale, the Company discontinues depreciating the assets and estimates the sales price, net of expected selling costs, of such assets. to be soldthat the disposition will occur within the following 12 months,one year and there are no significant contingencies relating to a sale. If, in management’s opinion, the estimated net sales price, net of expected selling costs, of the disposal groups which have beenWhen assets are identified by management as held for sale, the Company discontinues depreciating the assets and estimates the fair value. If the fair value of the assets, less estimated cost to sell, is less than the carrying value of the assets, a valuation allowance (which isan adjustment to the carrying value would be recognized and recorded as unrealized losseswithin the Unrealized gains (losses) on disposition of rental property) is established. Inproperty to reflect the absence of an executed sales agreement with a set sales price, management’s estimateestimated fair value of the net sales priceassets. The Company will continue to review the property for subsequent changes in the fair value, and may be based on a number of assumptions, including but not limited to the Company’s estimates of future cash flows, market capitalization rates and discount rates,recognize an additional impairment charge, if applicable. For developable land holdings, an estimated per-unit market value assumption is also considered based on development rights or plans for the land. In addition, thewarranted.If circumstances arise that previously were considered unlikely and, as a result, the Company has determined that an asset previously classified as held for sale, no longer meets the held for sale criteria, the asset is reclassified as held and used. An asset that is reclassified is measured and recorded individually at the lower of (a) its carrying value before the asset was classified as held for sale, adjusted for any depreciation (amortization) expense that would have been recognized had the asset been continuously classified as held and used, or (b) the fair value at the date the asset qualified as held for sale. 0zero and would not provide for additional losses unless the Company has guaranteed obligations of the venture or is otherwise committed to providing further financial support for the investee. If the venture subsequently generates income, the Company only recognizes its share of such income to the extent it exceeds its share of previously unrecognized losses.The Company’s estimates of value for each investment (particularly in real estate joint ventures)Estimated fair values which are based on discounted cash flow models include all estimated cash inflows and outflows over a number of assumptions including but not limited to estimates of future cash flows, market capitalizationspecified holding period. Capitalization rates and discount rates if applicable. These assumptionsutilized in these models are based on management's experience in its local real estate markets andupon unobservable rates that the effectsCompany believes to be within a reasonable range of current market conditions. The assumptions are subject to rates.economic and market uncertainties including, among others, demand for space, competition for tenants, changes in market rental rates, and operating costs. As these factors are difficult to predict and are subject to future events that may alter management’s assumptions, the values estimated by management in its impairment analyses may not be realized, and actual lossesor impairment may be realized in the future. See Note 4: Investments in Unconsolidated Joint Ventures. Allpurchased are considered to be cash equivalents. 2020 and 2019.respectively. If a financing obligation is extinguished early, any unamortized deferred financing costs are written off and included in gains (losses) from extinguishment of debt. Included in the gains(losses)losses from extinguishment of debt, net, of $(47.1)$5.6 million, $(0.3)$7.4 million and $1.6$47.1 million for the years ended December 31, 2021, 20202023, 2022 and 20192021 were unamortized deferred financing costs which were written off (as non-cash transactions) amounting to 0, 0 and $0.4 million, respectively.Costs/Leasing Personnel Costsand residential leases wereare capitalized and amortized on a straight-line basis over the terms of the related leases and included in depreciation and amortization. Unamortized deferred leasing costs wereare charged to amortization expense upon early termination of the lease. Certain employees of the Company are compensated for providing leasing services to the Properties. Upon the adoption of ASC 842 on January 1, 2019, the Company no longer capitalizes such costs, and includes such leasing personnel costs in General and Administrative expense costs in the Company’s Consolidated Statements of Operations, which amounted to $1.5 million, $1.5 million and $2.3 million (excluding any severance – related costs) for the years ended December 31, 2021, 2020 and 2019, respectively.million. For derivatives designated and qualifying as fair value hedges, the changes in the fair value of both the derivative instrument and the hedged item are recorded in earnings. For derivatives designated as cash flow hedges, the effective portions of the derivative are reported in other comprehensive income (“OCI”) and are subsequently reclassified into earnings when the hedged item affects earnings. Changes in fair value of derivative instruments not designated as hedging and ineffective portions of hedges are recognized in earnings in the affected period.Revenueincludes fixed base rents under leases, which areis recognized on a straight-line basis over the termsnon-cancellable term of the respective leases.the recently-adopted revenue accounting guidanceASC 606, Revenue from Contracts with Customers (such as tenant reimbursements of propertylease; thislease. This enables the Company to account for the combination of the lease component and non-lease components as an operating lease since the lease component is the predominant component of the combined components. Due to the Company’s adoption of the practical expedient discussed above to not separate non-lease component revenue from the associated lease component, the Company is aggregating revenue from its lease components and non-lease components (comprised predominantly of tenant operating expense reimbursements) into the line entitled “Revenue from leases.” Revenue from leases also includes reimbursements and recoveries from tenants received from tenants for certain costs as provided in the lease agreements. These costs generally include real estate taxes, utilities, insurance, common area maintenance and other recoverable costs. See Note 14: Tenant Leases.clients. Fee income derived from the Company’s unconsolidated joint ventures (which are capitalized by such ventures) are recognized toin which the extent attributable toCompany is the unaffiliated ownership interests.Hotel income includes all revenue generated from hotel properties.All bad debt expense is being recorded as a reduction of the corresponding revenue account starting on January 1, 2019. Management performs a detailed review of amounts due from tenantscollectability, based on factors affecting the billings and status of individual tenants.collectability. The factors considered by management in determining which individual tenant’s revenues are affecteduncollectible include the age of the receivable, the tenant’s payment history, the nature of the charges, any communications regarding the charges and other related information. Management’sIf a lessee’s accounts receivable balance is considered uncollectible, the Company will write-off the uncollectible receivable balances associated with the lease and will only recognize lease income on a cash basis. The Company includes provision for doubtful accounts as a reduction of corresponding revenue account, in accordance with Topic 842.bad debt write-off’s requires management to exercise judgment aboutuse assets are amortized on a straight-line basis over the timing, frequencylease term. See Note 5: Deferred Charges and severityOther Assets, Net for additional disclosures on the presentation of collection losses, which affects the revenue recorded. Accordingly, no provision or benefit for income taxes has been made in the accompanying financial statements.of the General Partner may perform additional services for tenants of the Companyhold certain assets and generally may engage in any real estategenerate certain income that a REIT could not otherwise hold or non-real estate related business (except for the operation or management of health care facilities or lodging facilities or the providing to any person, under a franchise, license or otherwise, rights to any brand name under which any lodging facility or health care facility is operated).generate. A TRS is subject to corporate federal income tax. The General Partner has conducted business through its TRS entities for0no material adjustments regarding its tax accounting treatment. The Company expects to recognize interest and penalties related to uncertain tax positions, if any, as income tax expense, which is included in general and administrative expense.2021,2023, the Company’s open tax years that remain subject to examination by the major tax jurisdictions under the statute of limitations are generally from the year 2018December 31, 2019 forward.amount.amount, using the treasury stock method. Shares or units whose issuance is contingent upon the satisfaction of certain conditions shall be considered outstanding and included in the computation of diluted EPS or EPU as follows (i) if all necessary conditions have been satisfied by the end of the period (the events have occurred), those shares or units shall be included as of the beginning of the period in which the conditions were satisfied (or as of the date of the grant, if later) or (ii) if all necessary conditions have not been satisfied by the end of the period, the number of contingently issuable shares or units included in diluted EPS or EPU shall be based on the number of shares or units, if any, that would be issuable if the end of the reporting period were the end of the contingency period (for example, the number of shares or units that would be issuable based on current period earnings or period-end market price) and if the result would be dilutive. Those contingently issuable shares or units shall be included in the denominator of diluted EPS or EPU as of the beginning of the period (or as of the date of the grant, if later).On September 30, 2020,announced thatsubstantially completing its transformation to a pure-play multifamily REIT, as well as the Company’s current estimates of taxable income, the Board of Directors was suspending its commonof the General Partner (the "Board of Directors") reinstated a quarterly dividend beginning with the third quarter of 2023.attributablewill continue to be determined by the third and fourth quarters 2020. As the Company’s management estimated that as of September 2020 it had satisfied its dividend obligations as a REIT on taxable income expected for 2020, the Board made the strategic decision to suspend its common dividends and distributions for the remainder of 2020 in an effort to provide greater financial flexibility during the pandemic and to retain incremental capital to support leasing initiatives at its Harborside commercial office properties on the Jersey City waterfront. On March 19, 2021, the Company announced that its Board of Directors would continue to suspend its common dividend forof the remainderGeneral Partner in light of 2021 in order to conserve capital and allow for greater financial flexibility during this period of heightened economic uncertainty and based onconditions then existing, including the Company’s projected 2021 taxable income estimates.earnings, cash flows, financial condition, capital requirements, debt maturities, the availability of debt and equity capital, applicable REIT and legal restrictions and the general overall economic conditions and other factors.Company believes that with its estimated taxable income/loss for 2021, it$0.0525 distribution per common share will meet its dividend obligations as a REITbe reported to shareholders for the year with no dividends paid. The Company anticipates its regular quarterly common dividend to remain suspended while it seeks to conclude its transition into a pureplay multifamily REIT.The dividends and distributions payable atending December 31, 2021 and 2020 represent amounts payable2024.unvested LTIP units.$0.60 dividendtotal20202023 represented approximately 19 percent ordinary income100% return of capital distributions.approximately 81 percent capital gain and the $0.80 dividend per common share paid during the year endeddistributions payable at December 31, 2019 represented 100 percent capital gain.paid-inpaid-in capital.$10.8$19.9 million, $7.6$13.8 million and $8.2$10.8 million for the years ended December 31, 2023, 2022 and 2021, 2020 and 2019, respectively.hedges or unrealized holding gains or losses on marketable securities available for sale.evaluates the terms of the partnership units issuedaccounts for noncontrolling interests in accordance with the FASB’s Distinguishing Liabilities from Equity guidance. UnitsNoncontrolling interests represent the portion of equity that the Company does not own in those entities it consolidates. The Company identifies its noncontrolling interests separately within the equity section on the Company’s Consolidated Balance Sheets. The amounts of consolidated net earnings attributable to the Company and to the noncontrolling interests are presented separately on the Company’s Consolidated Statements of Operations.unitsinterests for cash afteror other assets at a specifiedfixed or determinable price on a fixed or determinable date (or dates) or upon the occurrence of an event that is not solely within the control of the issuer are determined to be contingently redeemable under this guidance and are included as Redeemable noncontrolling interests and classified within the mezzanine section between Total liabilities and Stockholders’ equity on the Company’s Consolidated Balance Sheets. The carrying amount of the redeemable noncontrolling interests will be changed by periodic accretions, so that the carrying amount will equal the estimated future redemption value at the redemption date.•Level 1: Quoted prices in active markets that are unadjusted and accessible at the measurement date for identical, unrestricted assets or liabilities;•Level 2: Quoted prices for identical assets and liabilities in markets that are inactive, quoted prices for similar assets and liabilities in active markets or financial instruments for which significant inputs are observable, either directly or indirectly, such as interest rates and yield curves that are observable at commonly quoted intervals and•Level 3: Prices or valuations that require inputs that are both significant to the fair value measurement and unobservable.level in the fair value hierarchy within which the fair value measurement in its entirety falls has been determinedwill be based onupon the lowest level input that is significant to the fair value measurement in its entirety.measurement. The Company’s assessment of the significance of a particular input to the fair value measurement in its entirety requires judgment and considers factors specific to the asset or liability.June 2016,November 2023, the FASB issued ASU 2016-13, Financial Instruments – Credit Losses (“2023-07, Segment Reporting—Improvements to Reportable Segment Disclosures ("ASU 2016-13”2023-07"). The guidance introducesrequires incremental disclosures related to a new model for estimating credit losses for certain types of financial instruments, including trade and lease receivables, loans receivable, held-to-maturity debt securities, and net investments in direct financing leases, amongst other financial instruments.public entity’s reportable segments. ASU 2016-13 also modifies the impairment model for available-for-sale debt securities and expands the disclosure requirements regarding an entity’s assumptions, models, and methods for estimating the allowance for losses. ASU 2016-132023-07 is effective for annual reporting periodspublic entities for fiscal years beginning after December 15, 2019, including2023, and interim periods within thosein fiscal years beginning after December 15, 2024, with early adoption permitted. The adoption of ASU 2016-13 did not have a material impact on the Company’s consolidated financial statements.In March 2020, the FASB issued ASU 2020-04 Reference Rate Reform (Topic 848) Facilitation of the Effects of Reference Rate Reform on Financial Reporting. The amendments provide practical expedients for reference rate reform related activities that impact debt, leases, derivatives and other contracts. The guidance is optional and is effective between March 12, 2020 and December 31, 2022. The guidance may be elected over time as reference rate reform activities occur. The Company is currently in the process of evaluating the impact the adoption of adopting ASU 2020-042023-07 will have on the Company’sCompany's consolidated financial statements.783. In April 2020,During the FASB issued a Staff Question-and-Answer (“Q&A”) to clarify whether lease concessions related toyear ended December 31, 2022, the effects ofCompany acquired the following rental property (dollars in thousands):COVID-19 requireAcquisition Date Property Location Property
Type# of
Apartment UnitsAcquisition
Cost7/21/2022 The James (a) Park Ridge, NJ Multifamily 240 $ 130,308 Totals 240 $ 130,308 application of the lease modification guidanceCompany's qualified intermediary from prior property sales proceeds and through borrowing under the new lease standard, which was adopted on January 1,2019. Under the new leasing standard, an entity would have to determine, on a lease by lease basis, if a lease concession was the resultof a new arrangement reached with the tenant, which would be accounted for under the lease modification framework, or if the lease concession was under the enforceable rights and obligations that existed in the original lease, which would be accounted for outside thelease modification framework. The Q&A provides entities with the option to elect to account for lease concessions as though theenforceable rights and obligations existed in the original lease as long as the total cash flows from the modified lease are substantiallysimilar to the cash flows in the original lease. The Company elected this option and therefore, to the extent that rent concession is grantedas a deferral of payments but total payments are substantially the same, will account for the concession as if no change has been madeto the original lease.3. RECENT TRANSACTIONSTheDuring the year ended December 31, 2022, the following propertiesproperty commenced initial operations during the years ended December 31, 2021 and 2020 (dollars in thousands):In Service
DateProperty Location Property
Type# of
Apartment Units Total Development
Costs Incurred04/01/22 Haus25 (a) Jersey City Multifamily 750 $ 485,587 Totals 750 $ 485,587 In Service
DateIn Service
DateProperty Location Property
Type# of
Apartment UnitsTotal Development
Costs Incurred03/01/21 The Upton (a) Short Hills, NJ Multifamily 193 $ 101,269 07/01/21 RiverHouse 9 at Port Imperial (b) Weehawken, NJ Multifamily 313 164,633 Totals 506 $ 265,902 arewere in service. The development costs included approximately $2.9 million in land costs.arewere in service. The development costs included approximately $2.7 million in land costs.2020ConsolidationsOn March 12, 2020, theThe Company acquired its equity partner's 80 percent interest in Port Imperial North Retail L.L.C., a ground floor retail space totaling 30,745 square feet located at Port Imperial, West New York, New Jersey for $13.3 million in cash (funded through borrowing under the Company’s unsecured credit facility.) The resultsdisposed of the transaction increased the Company’s interest to 100 percent. Upon the acquisition, the Company consolidated the joint venture, a voting interest entity. As an acquisition of the remaining interests in the venture which owns the Port Imperial North Retail L.L.C., the Company accounted for the transaction as an asset acquisition under a cost accumulation model, and as such 0 gain on change of control of interest was recognized in consolidation, resulting in total consolidated net assets of $15.0 million, which were allocated as follows:Port Imperial North Retail L.L.C.Land and leasehold interests$4,305Buildings and improvements and other assets, net8,912In-place lease values (a)1,503Above/Below market lease value, net (a)313Net assets recorded upon consolidation$15,033(a)In-place and below market lease values are being amortized over a weighted-average term of 7.5 years.Real Estate Held for Sale/Discontinued Operations/Dispositions2021On December 19, 2019, the Company announced that its Board had determined to sell the Company’s entire suburban New Jersey office portfolio totaling approximately 6.6 million square feet, which had excluded the Company’s office properties in Jersey City and Hoboken, New Jersey, (collectively, the “Suburban Office Portfolio”). As the decision to sell the Suburban Office Portfolio represented a strategic shift in the Company’s operations, these properties’ results (other than a singlefollowing rental property not qualified to be classified as held for sale) are being classified as discontinued operations for all periods presented herein. See Note 7: Discontinued Operations.In late 2019 through December 31, 2021, the Company completed the sale of all but one of its 37 properties in its Suburban Office Portfolio, totaling 6.3 million square feet, for net sales proceeds of $1.0 billion. As of December 31, 2021, the Company identified as held for sale 2 office properties totaling approximately 1.8 million square feet to be sold separately, which are located in Jersey City and Hoboken, New Jersey. The total estimated sales proceeds, net of expected selling costs but before the required aggregate paydown of $400 million of mortgages encumbering the properties and related costs, are expected to be approximately $575 million. The Company may need to pay significant prepayment costs of approximately $20 million to pay down these mortgage loans which will be expensed when incurred at the time of such paydown. In January 2022, the Company completed the disposition of one of the office properties held for sale at December 31, 2021 for gross sales proceeds of $210 million and the paydown of the $150 million mortgage encumbering the property.Additionally, the Company also identified several developable land parcels as held for sale as of December 31, 2021. As a result of recent sales contracts in place and after considering the current market conditions due to the challenging economic climate with the current worldwide COVID-19 pandemic, the Company determined that the carrying value of several land parcels held for sale was not expected to be recovered from estimated net sales proceeds, and accordingly, during the year ended December 31, 2021, recognized land impairments2023 (dollars in thousands):Disposition
DateProperty Location # of
Bldgs.Rentable
Square
FeetProperty
TypeNet
Sales
ProceedsNet
Carrying
ValueDiscontinued
Operations
Realized
Gains
(losses)/
Unrealized
Losses, net02/10/23 XS Hotels Weehawken, New Jersey 2 — Hotel $ 93,358 (a) $ 92,578 $ 780 04/04/23 Harborside 1, 2 and 3 Jersey City, New Jersey 3 1,886,800 Office 362,446 362,304 142 09/13/23 Harborside 6 Jersey City, New Jersey 1 231,856 Office 44,145 43,722 423 10/13/23 23 Main Street Holmdel, New Jersey 1 350,000 Office 15,884 (b) 13,372 2,512 Others (c) 2,184 Unrealized gains (losses) on real estate held for sale (3,630) Totals 7 2,468,656 $ 515,833 $ 511,976 $ 2,411 $10.2 million. $84.0 million used to repay the mortgage loan encumbering the property at closing.also recognized an unrealized gaindisposed of $3.7 millionthe following developable land during the year ended December 31, 2021 (reversing cumulative held for sale loss allowances recognized) for a held for sale land parcel that was previously impaired when2023 (dollars in thousands):Disposition
DateProperty Location Net
Sales
ProceedsNet
Carrying
ValueRealized
Gains
(losses)/
Unrealized
Losses, netDiscontinued
Operations
Realized
Gains
(losses)/
Unrealized
Losses, net03/17/23 Columbia-Honeywell Morris Township, New Jersey $ 8,214 (a) $ 8,236 $ (22) $ — 10/12/23 3 Campus Parsippany-Troy Hills, New Jersey 13,248 7,847 5,401 — 10/05/23 Harborside 4 Jersey City, New Jersey 53,656 14,385 — 39,271 Others (b) 1,689 — Totals $ 75,118 $ 30,468 $ 7,068 $ 39,271 entered into a contract to sell thein December 2022 and January 2023.parcel.holdings.table summarizesrental property during the real estate held for sale, net, and other assets and liabilitiesyear ended December 31, 2022 (dollars in thousands):AssetsHeld for SaleLand$159,968Building & Other618,216Less: Accumulated depreciation(159,538)Real estate held for sale, net$618,646Disposition
DateProperty Location # of
Bldgs.Rentable
Square
FeetProperty
TypeNet
Sales
ProceedsNet
Carrying
ValueDiscontinued
Operations
Realized
Gains
(losses)/
Unrealized
Losses, net01/21/22 111 River Street Hoboken, New Jersey 1 566,215 Office $ 208,268 (a) $ 206,432 $ 1,836 10/07/22 101 Hudson Street Jersey City, New Jersey 1 1,246,283 Office 342,578 (b) 270,198 72,380 Unrealized gains (losses) on real estate held for sale (12,540) Totals 2 1,812,498 $ 550,846 $ 476,630 $ 61,676 AssetsOther assets and liabilitiesHeld for SaleUnbilled rents receivable, net (a)$30,526Deferred charges, net (a)16,056Total intangibles, net (a)31,155Total deferred charges & other assets, net (b)69,410Mortgages & loans payable, net (a)(397,953)Total below market liability (a)(24,098)Accounts payable, accrued exp & other liability (c)(49,648)Unearned rents/deferred rental income (a)(5,831)Expected to be removed with The $150 million mortgage loan encumbering the completionproperty was repaid at closing, for which the Company incurred costs of $6.3 million. These costs were expensed as loss from extinguishment of debt during the year ended December 31, 2022.sales.(b)following developable land during the year ended December 31, 2022 Includes $19.2 million(dollars in thousands):Disposition
DateProperty Location Net
Sales
ProceedsNet
Carrying
ValueRealized
Gains
(losses)/
Unrealized
Losses, net03/22/22 Palladium residential land West Windsor, New Jersey $ 23,908 $ 24,182 $ (274) 03/22/22 Palladium commercial land West Windsor, New Jersey 4,688 1,791 2,897 04/15/22 Port Imperial Park parcel Weehawken, New Jersey 29,331 29,744 (413) 04/21/22 Urby II/III Jersey City, New Jersey 68,854 13,316 55,538 11/03/22 Port Imperial Parcels 3 & 16 (a) Weehawken, New Jersey 24,885 25,371 (486) Totals $ 151,666 $ 94,404 $ 57,262 right of use assets expected to be removed with the completion of the sales.(c)Includes $20.5 million of right of use liabilities expected to be removed with the completion of the sales.Disposition
DateProperty Location # of
Bldgs.Rentable
Square
FeetProperty
TypeNet
Sales
ProceedsNet
Carrying
Value Realized
Gains
(Losses)/
Unrealized
Losses, netDiscontinued
Operations
Realized
Gains
(losses)/
Unrealized
Losses, net01/13/21 100 Overlook Center Princeton, New Jersey 1 149,600 Office $ 34,724 (a) $ 26,488 $ — $ 8,236 03/25/21 Metropark portfolio (b) Edison and Iselin, New Jersey 4 926,656 Office 247,351 233,826 — 13,525 04/20/21 Short Hills portfolio (c) Short Hills, New Jersey 4 828,413 Office 248,664 245,800 — 2,864 06/11/21 Red Bank portfolio Red Bank, New Jersey 5 659,490 Office 80,730 78,364 — 2,366 06/30/21 Retail land leases Hanover and Parsippany, New Jersey — — Land Lease 41,958 37,951 4,007 — 07/26/21 7 Giralda Farms Madison, New Jersey 1 236,674 Office 28,182 30,143 — (1,961) 10/20/21 4 Gatehall Drive Parsippany, New Jersey 1 248,480 Office 24,239 23,717 — 522 12/16/21 Retail land lease Unit B Hanover, New Jersey — — Land Lease 5,423 6,407 (984) — Totals 16 3,049,313 $ 711,271 $ 682,696 $ 3,023 $ 25,552 17:16: Noncontrolling Interests in Subsidiaries - Noncontrolling Interests in Operating Partnership.goodwill and other assets, net. holdings during the year ended December 31, 2021 (dollars in thousands):Disposition
DateProperty Location Net
Sales
ProceedsNet
Carrying
ValueRealized
Gains
(losses)/
Unrealized
Losses, net05/24/21 Horizon common area Hamilton, New Jersey $ 745 $ 634 $ 111 12/22/21 346/360 University Ave Newark, New Jersey 4,266 2,262 2,004 Totals $ 5,011 $ 2,896 $ 2,115 2020As of December 31, 2020,— On November 30, 2022, the Company's Hyatt Regency Hotel Jersey City joint venture was sold for $117.0 million and the Company had identified as heldrecorded a gain on the sale (included in discontinued operations) for sale 16 office properties (comprisedits interest of 6 identified disposal groups)approximately $7.7 million in the Suburban Office Portfolio, totaling 3.0 million square feet (of which the Company had 15 properties totaling 2.8 million square feet under contract for sale for aggregate gross proceeds of $652.4 million). As a result of a signed contract to dispose of a portfolio of four of the properties in an identified disposal group of assets held for sale, the Company paid significant costs to defease the mortgage loan encumbering the properties, which was expensed when incurred at the time of such defeasance in 2021. See Note 10: Mortgages, loans payable and other obligations.As of December 31, 2020, the Company determined that a 350,000 square foot office property in the Suburban Office Portfolio, located in Holmdel, New Jersey no longer met the held for sale criteria. The property had originally been classified as held for sale as of December 31, 2019. The reclassified property has an aggregate book value of $19.8 million as of December 31, 2020, net of accumulated depreciation of $10.5 million (including catch-up depreciation). $2.8 million of previously recorded valuation allowance was reversed upon the reclassification of the asset from held for sale at December 31, 2020, and the corresponding property’s results and valuation allowance are also reclassified out of discontinued operations to continuing operations for all periods presented. See Note 7: Discontinued Operations.The Company also identified a retail pad leased to others and several developable land parcels as held for sale as of December 31, 2020. The properties were located in Parsippany, Madison, Short Hills, Edison and Red Bank, New Jersey. As a result of recent sales contract amendments and after considering the current market conditions due to the challenging economic climate with the current worldwide COVID-19 pandemic, the Company determined that the carrying value of 6 of the remaining held for sale properties (comprised of 3 disposal groups), and several land parcels held for sale was not expected to be recovered from estimated net sales proceeds, and accordingly, during the year ended December 31, 2020, recognized an unrealized loss allowance of $15.7 million for the properties ($14 million of which are from discontinued operations), respectively, and also recorded land and other impairments of $9.5 million. As of December 31, 2020, the Company determined that 2 developable land parcels located in Parsippany, New Jersey were no longer being held for sale. The properties had originally been classified as held for sale as of December 31, 2019. The reclassified properties had an aggregate book value of $11.3 million.2022.The following table summarizes the real estate held for sale, net, and other assets and liabilities (dollars in thousands):The Company disposed of the following rental properties during the year ended December 31, 2020 (dollars in thousands):(a)The Company recorded valuation allowances of $2.0 million on the held for sale property during the year ended December 31, 2020 and of $16.7 million during the year ended December 31, 2019.(b)The Company recorded valuation allowances of $21.6 million on the held for sale properties during the year ended December 31, 2020 and of $32.5 million during the year ended December 31, 2019.(c)The Company recorded a valuation allowance of $3.5 million on this property during the year ended December 31, 2019.(d)The Company recorded valuation allowance of $6.0 million on the held for sale property during the year ended December 31, 2019.(e)The Company recorded valuation allowance of $1.9 million on the held for sale property during the year ended December 31, 2020.The Company disposed of the following developable land holdings during the year ended December 31, 2020 (dollars in thousands):Impairments on Properties and Land Held and UsedThe Company determined that, due to the shortening of its expected hold period for one office property and its land parcels, it was necessary to reduce the carrying value of these assets to their estimated fair values. Accordingly, the Company recorded an impairment charge of $6.0 million on the office asset, which is included in property impairments on the consolidated statement of operations for the year ended December 31, 2021 and $14.3 million on the land parcels in land and other impairments on the consolidated statement of operations for the year ended December 31, 2021. Additionally, the Company determined that, due to the shortening of its expected hold period and as a result of the adverse effect the COVID-19 pandemic has had, and continues to have, on its hotel operations, the Company evaluated the recoverability of the carrying values of its 2 adjacent hotel properties and determined that it was necessary to reduce the carrying values of its 2 hotel assets located in Weehawken, New Jersey to their estimated fair values. Accordingly, the Company recorded an impairment charge of $7.4 million on these hotels at December 31, 2021, which is included in property impairments on the consolidated statement of operations for the year ended December 31, 2021.2020The Company determined that, due to the shortening of its expected hold period and as a result of the adverse effect the COVID-19 pandemic has had, and continues to have, on its hotel operations, the Company evaluated the recoverability of the carrying values of its2 adjacent hotel properties and determined that it was necessary to reduce the carrying values of its 2 hotel assets located in Weehawken, New Jersey to their estimated fair values. NaN of these hotels had closed its rooms from March 2020 to May 2021. Accordingly, the Company recorded an impairment charge of $36.6 million on these hotels at September 30, 2020, which is included in property impairments on the consolidated statement of operations for the year ended December 31, 2020. The Company also evaluated the recoverability of the carrying values of its land parcels and determined that it was necessary to reduce the carrying values of 3 held-and-used land parcels to their estimated fair values and recorded land and other impairment charges of $7.3 million for the year ended December 31, 2020.Unconsolidated Joint Venture Activity2021On April 29, 2021, the Company sold its interest in the 12 Vreeland Road joint venture for a gross sales price of approximately $2 million, with 0 gain or loss on the transaction.2020December 31, 2020, the Crystal House Apartment Investors LLC, an unconsolidated joint venture property located in Arlington, Virginia sold its sole apartment property for an aggregate sales price of $376.6 million. The Company received $62.7 million for its share of net sale proceeds from the joint venture and realized its share of the gain on the property sale from the unconsolidated joint venture of $35.1 million.On December 17, 2020,April 29, 2021, the Company sold its interest in the Hillsborough 206 Holdings12 Vreeland Road joint venture which ownsfor a gross sales price of approximately $2.0 million, with no gain or loss on the transaction.Year Ended December 31, 2023 2022 Land $ 59,464 $ 92,843 Building & Other 9,688 142,554 Less: Accumulated depreciation — (28,924) Less: Cumulative unrealized losses on property held for sale (10,544) (12,540) Real estate held for sale, net $ 58,608 $ 193,933 Hillsborough,Jersey City and Parsippany, New Jersey. In January 2024, a land parcel was sold for gross proceeds of $10.2 million.foroffice and hotel portfolio (collectively, the “Office Portfolio”) which represented a sale price of $2.1 million, and realized a gain on sale from unconsolidated joint ventures of $0.1 million.2021,2023, the Company had an aggregate investment of approximately $137.8$118.0 million in its equity method joint ventures. The Company formed these ventures with unaffiliated third parties, or acquired interests in them, to develop or manage properties, or to acquire land in anticipation of possible development of rental properties. As of December 31, 2021,2023, the unconsolidated joint ventures owned: 7seven multifamily properties totaling 2,146 apartment units, a retail a 351-room hotel, and interests and/or rights to developable land parcels able to accommodate up to 1,621829 apartment units. The Company’s unconsolidated interests range from 20 percent to 85 percent subject to specified priority allocations in certain of the joint ventures. Unless otherwise noted below, the2021,2023, the outstanding balance of such debt, subject to guarantees, totaled $191.2$17.2 million of which $22$1.5 million was guaranteed by the Company.$3.4$3.9 million, $4.9$3.6 million and $5.3$3.4 million for such services in the years ended December 31, 2021, 20202023, 2022 and 2019,2021, respectively. The Company had $0.2$0.7 million and $0.3$0.2 million in accounts receivable due from its unconsolidated joint ventures as of December 31, 20212023 and 2020.Included in2022.Company’sCompany does not have any investments in unconsolidated joint ventures that are three VIEs for which the Company is not the primary beneficiary. These joint ventures were primarily established to develop real estate property for long-term investment and were deemed VIEs primarily based on the fact that the equity investment at risk was not sufficient to permit the entities to finance their activities without additional financial support. As of December 31, 2021, the Company has determined that these unconsolidated joint venturesconsidered VIEs.are no longer VIEs since these ventures have completed their development projects and are now in operation with leased percentages ranging from 89.8% to 99.2%.20212023 and 2020 (dollars2022 (dollars in thousands):
40 Park (b) (c) Number of Company's Carrying Value Property Debt
As of December 31, 2023Entity / Property Name Apartment Units Effective
Ownership % (a)December 31,
2023December 31,
2022 Balance Maturity
Date Interest
RateMultifamily Metropolitan and Lofts at 40 Park (b) (c) 189 units 25.00 % $ 908 $ 1,747 $ 57,367 (d) (d) RiverTrace at Port Imperial 316 units 22.50 % 4,506 5,114 82,000 11/10/26 3.21 % The Capstone at Port Imperial 360 units 40.00 % 21,361 23,234 135,000 12/22/24 SOFR+ 1.20 % Riverpark at Harrison 141 units 45.00 % — — 30,192 07/01/35 3.19 % Station House 378 units 50.00 % 32,022 32,372 89,440 07/01/33 4.82 % Urby at Harborside (e) 762 units 85.00 % 57,060 61,594 185,742 08/01/29 5.20 % PI North - Land (b) (f) 829 potential units 20.00 % 1,678 1,678 — — — Other Other (g) 419 419 — — — Totals: $ 117,954 $ 126,158 $ 579,741 5five story multifamily rental property ("Lofts at 40 Park").$36,500,$34.1 million as of December 31, 2023, bears interest at LIBOR +2.85 percent,SOFR +2.85%, matures inon October 2023;10, 2024; (ii) an amortizableinterest only loan, collateralized by the Shops at 40 Park, with a balance of $6,067, bears$6.1 million. On January 10, 2023, the loan was modified bearing interest at LIBOR +1.50 percentSOFR +2.00% and matures in October 2022;on January 9, 2025; (iii) an interest only loan, collateralized by the Lofts at 40 Park, with a balance of $18,200,$17.2 million as of December 31, 2023, which bears interest at LIBOR +1.50 percentSOFR +2.00% and matures inon February 1, 2024. In January 2023.(e)On December 22, 2021,2024, the joint venture paid off $108.3 million construction loan and simultaneously obtained a new $135 million mortgage loan, collateralized bysold the Lofts at 40 Park property and received its share of net loanthe proceeds of $9.2 million. The property commenced operations in second quarter 2021.were used to repay the $17.2 million loan.(f)(e)The Company owns an 85 percent interest with shared control over major decisions such as, approval of budgets, property financings and leasing guidelines. The Company hasformerly guaranteed $22 million of the principal outstanding debt.debt, which on February 1, 2023, the lender released the Company of all obligations under the Guaranty Agreement.(g)(f)The Company owns a 20 percent residual interest in undeveloped land parcels: parcels 6 I, and JI that can accommodate the development of 771829 apartment units.(h)Pursuant to a notice letter to its joint venture partner dated January 6, 2022, the Company intends to not proceed with the acquisition and developmentTable of Liberty Landing.Contents(i)On April 29, 2021, the Company sold its interest in the joint venture for a gross sales price of approximately $2 million.(j)On September 1, 2021, the Company sold its interest in the joint venture for a gross sales price of approximately $1.9 million.(k)(g)The Company owns other interests in various unconsolidated joint ventures, including interests in assets previously owned and interest in ventures whose businesses are related to its core operations. These ventures are not expected to significantly impact the Company's operations in the near term.2021, 20202023, 2022 and 20192021 (dollars in thousands): Year Ended December 31, Entity / Property Name 2023 2022 2021 Metropolitan and Lofts at 40 Park (a) Metropolitan and Lofts at 40 Park (a) Metropolitan and Lofts at 40 Park (a) The Capstone at Port Imperial (b) 12 Vreeland Road (e) 12 Vreeland Road (e) Other Other Company's equity in earnings (loss) of unconsolidated joint ventures (g) Company's equity in earnings (loss) of unconsolidated joint ventures (g) Company's equity in earnings (loss) of unconsolidated joint ventures (g) December 31, 2020,January 12, 2024, the Crystal House Apartment Investors LLC, an unconsolidated joint venture sold the Lofts at 40 Park property sold its sole apartment property. The Company realized itsfor a net sale proceeds of $12.1 million of which the Company's share of the gain on the property sale from the unconsolidated joint venture of $35.1is approximately $6 million.On March 12, 2020, the Company acquired the remaining 80 percent interest from its equity partner and consolidated the asset.(h)Amounts are net of amortization of basis differences of $618 thousand, $154 thousand and $138 and $143thousand for the year ended December 31, 2023, 2022 and 2021, respectively.2020, respectively.2022 December 31,
2023December 31,
2022Assets: Rental Property, net $ 741,932 $ 745,210 Other assets 31,480 39,241 Total assets $ 773,412 $ 784,451 Liabilities and partners'/members' capital: Mortgages and loans payable $ 579,741 $ 587,913 Other liabilities 8,898 15,545 Partners'/members' capital 184,773 180,993 Total liabilities and partners'/members' capital $ 773,412 $ 784,451 Year Ended December 31, 2023 2022 2021 Total revenues $ 94,272 $ 140,637 $ 173,169 Operating and other expenses (36,045) (81,914) (131,709) Depreciation and amortization (22,341) (25,412) (25,095) Interest expense (30,488) (29,777) (27,145) Net income (loss) $ 5,398 $ 3,534 $ (10,780) GOODWILL AND OTHER ASSETS, NET(dollars in thousands) December 31,
2023December 31,
2022Right of use assets (e) Total deferred charges and other assets, net (f) Total deferred charges and other assets, net (f) Total deferred charges and other assets, net (f) Includes asAs of December 31, 2021 and 2020, respectively,2022, balance included an interest-free note receivable with a net present value of $0.7 million and $1.2$0.2 million which maturesmatured in April 2023,. The Company believes this balance is fully collectible. Also includes $3.1 and seller-financing of $1.0 million, net of a loan loss allowance of $0.2 million, as of December 31, 2021, of seller-financing provided by the Company$26.0 thousand, to the buyers of the Metropark portfolio. The receivable is secured against available cash of one of the Metropark properties disposed of and earned an annual return of four percent for 90 days after the disposition, with the interest rate increased to 15 percent through November 18, 2021 and to 10 percent thereafter, pursuant to an amended operating agreement. The Company recorded a loan loss allowance charge of $0.2 million at December 31, 2021 based on expected losses, byportfolio, which matured in May 2023.calculating the net present value of the contractual cash flows of the total receivable (See Note 12: Disclosure of fair value of assets and liabilities). Such charge was recorded in Interest and other investment income (loss) for the year ended December 31, 2021. See Note 3: Transactions – Real Estate Held for Sale/Discontinued Operations/Dispositions.In accordance with ASC 805, Business Combinations, theThe Company recognizes rental revenue of acquired above and below market lease intangibles over the terms of the respective leases. The impact of amortizing the acquired above and below-market lease intangibles increased revenue by approximately $2.7$0.1 million, $3.7$0.2 million and $4.3$2.7 million for the years ended December 31, 2021, 20202023, 2022 and 2019,2021, respectively. The following table summarizes, as of December 31, 2021,2023, the scheduled amortization of the Company’s acquired above and below-market lease intangibles for each of the five succeeding years (dollars in thousands):Year Acquired Above-
Market Lease
IntangiblesAcquired Below-
Market Lease
IntangiblesTotal
Amortization2027 2028 $2.1$2.0 million, $9.1$1.5 million and $34.2$2.1 million for the years ended December 31, 2021, 20202023, 2022 and 2019,2021, respectively. The following table summarizes, as of2021,2023, the scheduled amortization of the Company’s acquired in-place lease values for each of the five succeeding years (dollars in thousands):Year Acquired In-place Lease Intangibles 2024 $ 310 2025 209 2026 195 2027 2027 127 2028 2028 105 All goodwill was attributable to the Company’s Multifamily Real Estate and Services segment and was fully impaired as of December 31, 2021.(f)This amount has a corresponding liability of $23.7$7.4 million and $3.2 million as of December 31, 2023 and 2022, respectively, which is included in Accounts payable, accrued expense and other liabilities. See Note 12: Commitments and Contingencies – Ground Lease agreements for further details.(g)The amount as of December 31, 2021 and 2020, includes $0.5 million and $42.5 million, respectively, for properties classified as held for sale. to add stability to interest expense and to manage its exposure to interest rate movements. To accomplish this objective, the Company primarily uses interest rate swaps and caps as part of its interest rate risk management strategy. Interest rate swaps designated as cash flow hedges involve the receipt of variable amounts from a counterparty in exchange for the Company making fixed-rate payments over the life of the agreements without exchange of the underlying notional amount. Interest rate caps designated as cash flow hedges involve the receipt of variable amounts from a counterparty if interest rates rise above the strike rate on the contract in exchange for an up-front premium. is subsequently reclassified into earnings in the period that the hedged forecasted transaction affects earnings. Amounts reported in accumulated other comprehensive income related to derivatives will be reclassified to interest expense as interest payments are made on the Company’s variable-rate debt. During the next 12 months, the Company estimates an additional $35 thousand$3.8 million will be reclassified as an increasea decrease to interest expense.2021,2023, the Company had onefour interest rate capcaps outstanding with a notional amount of $75$304.5 million designated as a cash flow hedgehedges of interest rate risk.consolidated balance sheetsConsolidated Balance Sheets as of December 31, 20212023 and 20202022 (dollars in thousands): Fair Value Asset Derivatives designated
as hedging instrumentsDecember 31,
2023December 31,
2022Balance sheet location Interest rate caps $ 5,098 $ 9,808 Deferred charges and other assets, net endingended December 31, 2021, 20202023, 2022 and 20192021 (dollars in thousands):Derivatives in Cash Flow Hedging Relationships Derivatives in Cash Flow Hedging Relationships Amount of Gain or (Loss) Recognized in OCI on Derivative Location of Gain or (Loss) Reclassified
from Accumulated OCI into Income Amount of Gain or (Loss) Reclassified from Accumulated OCI into Income Year Ended December 31, 2023 2022 2021 2023 2022 2021 2023 2022 2021 Interest rate caps 2021,2023, the Company did 0tnot have any interest rate derivatives in a net liability position. If the Company had breached anytenantresident and residenttenant security deposits for certain of the Company’s properties, and escrow and reserve funds for debt service, real estate taxes, property insurance, capital improvements, tenant improvements, and leasing costs established pursuant to certain mortgage financing arrangements, and is comprised of the following (dollars in thousands):December 31,
2023December 31,
2023December 31,
2022Security deposits $ 9,996 $ 9,175 Escrow and other reserve funds 16,576 11,692 Total restricted cash Total restricted cash $ 26,572 $ 20,867 On19, 2019,31, 2023, the Company announced that its Board had determined to sellcompleted the Company’ssale of the entire Suburban Office Portfolio totaling approximately 6.6 million square feet, which had excluded the Company’sexcept for one waterfront office properties in Jersey City and Hoboken, New Jersey.property. As the decision to sellsale of the Suburban Office Portfolio represented a strategic shift in the Company’s operations, the results of these properties’ results (other than a single property not qualified to beproperties that were disposed of or classified as held for sale)sale are being classified as discontinued operations for all periods presented herein.In late 2019 through December 31, 2021, the Company completed the sale of all but one of its 37 properties in its Suburban Office Portfolio, totaling 6.3 million square feet, for net sales proceeds of $1.0 billion. lossesgains (losses) on disposition of rental property and impairments, net, for the years ended December 31, 2021, 20202023, 2022 and 20192021 (dollars in thousands):Year Ended December 31, 2023 2022 2021 Total Revenues $ 21,085 $ 127,541 $ 163,284 Operating and other (expenses) income, net (12,437) (63,157) (83,557) Property impairments — (94,811) (13,467) Depreciation and amortization (5,486) (26,974) (44,086) Loss from extinguishment of debt, net (12) (7,303) — Income (Loss) from discontinued operations 3,150 (64,704) 22,174 Gain on disposition of developable land 39,271 — — Gain on sale of unconsolidated joint venture interests — 7,677 — Realized gains (losses) and unrealized gains (losses) on disposition of rental property, net 2,411 61,676 25,552 Realized gains (losses) and unrealized gains (losses) on disposition of rental property and impairments, net 41,682 69,353 25,552 Total discontinued operations, net $ 44,832 $ 4,649 $ 47,726 (a)Represents valuation allowances and impairment charges on properties classified as discontinued operations in 2020.(b)See Note 3: Real Estate Transactions – Dispositions for further information regarding properties sold and related gains (losses).SENIOR UNSECURED NOTESA summary of the Company’s senior unsecured notes as of December 31, 2021 and 2020 is as follows (dollars in thousands):(1)On May 6, 2021, the Company retired these notes earlier than their maturity, using net sales proceeds from completed office property sales and borrowings under its 2021 credit facility and term loan. In conjunction with the notes being discharged, the Company incurred costs of $24.2 million (including a make-whole premium) which was expensed as loss from extinguishment of debt during the year ended December 31, 2021. See Note 9: Revolving Credit Facility and Term Loans.9. REVOLVING CREDIT FACILITY AND TERM LOANSMay 6, 2021,July 25, 2023, the Company entered into a revolving credit and term loan agreement (“20212023 Credit Agreement”) with a group of seventwo lenders that provides for a $250$60 million senior secured revolving credit facility (the “2021“2023 Revolving Credit Facility"Facility”) and a $150$115 million senior secured term loan facility (the “2021“2023 Term Loan”),. On July 25, 2023, the Operating Partnership drew the full $115 million available under the 2023 Term Loan and delivered written noticeborrowed $52 million from the 2023 Revolving Credit Facility which proceeds, together with available cash, were used to fund the administrative agent to terminatepurchase price under the 2017Rockpoint Purchase Agreement. During the fourth quarter of 2023, the Company fully repaid the remaining balances of the 2023 Term Loan and 2023 Revolving Credit Facility.agreement, which termination became effective on May 13, 2021.20212023 Revolving Credit Facility included:include: (1) a three yearone-year term ending in May 2024;July 2024, subject to one six-month extension option; (2) revolving credit loans may be made to the Company in an aggregate principal amount of up to $250 million (subject to increase as discussed below), with a sublimit under the 2021 Credit Facility for the issuance of letters of credit in an amount not to exceed $50$60 million; and (3) a first priority lien inon the unencumbered properties of the Company with an appraised value greater than or equal to $800 million which must include the Company’s Harborside 2/3 and Harborside 5 properties;property known as The James, a 240 unit multi-family residential property located at 87 Madison Avenue, Park Ridge, New Jersey (the “Collateral Pool Property”); and (4) a facilitycommitment fee payable quarterly equal to 35 basis points if usageper annum on the daily unused amount of the 20212023 Revolving Credit Facility is less than or equal to 50%, and 25 basis points if usage of the 2021 Credit Facility is greater than 50%.20212023 Term Loan included: (1) an eighteen montha one-year term ending in November 2022;July 2024, subject to one six-month extension option; (2) a single draw of the term loan commitments up to an aggregate principal amount of $150$115 million; and (3) a first priority lien in unencumbered properties of the Company with an appraised value greater than or equal to $800 million which must include the Company’s Harborside 2/3 andCollateral Pool Property.Harborside 5 properties.20212023 Revolving Credit Facility and 2021the 2023 Term Loan shall be based on applicable baseinterest rate (the “Base“Interest Rate”) plus a margin ranging from 125250 basis points to 275350 basis points (the “Applicable Margin”) depending on the BaseInterest Rate elected, currently 0.12%.elected. The BaseApplicable Margin is subject to automatic increases of 25 basis points every three months. With respect to borrowings under the 2023 Revolving Credit Facility and the 2023 Term Loan, the Interest Rate shall be either (A) the Alternative Base Rate plus the Applicable Margin and/or (B) the Adjusted Term SOFR Rate plus the Applicable Margin or, with respect to the 2023 Revolving Credit Facility only, (C) the Adjusted Daily Effective SOFR Rate plus the Applicable Margin. As used herein: “Alternative Base Rate” means, subject to a floor of 1.00%, the highest of (i) the rate of interest last quoted by The Wall Street Journal in the U.S. as the prime rate in effect (the “Prime Rate”), (ii) the greater of the then effective (x) Federal Funds EffectiveNYFRB Rate or (y) Overnight Bank Funding Ratefrom time to time plus 50 basis points,0.50% and (iii) a LIBOthe Adjusted Term SOFR Rate as adjusted for statutory reserve requirements for eurocurrency liabilities (the “Adjusted LIBO Rate”) and calculated for a one-monthone month interest period plus 1001%; “Adjusted Term SOFR Rate” means, subject to a floor of 0.0%, the Term SOFR Rate, plus 10 basis points (such highest amount beingpoints; and “Adjusted Daily Effective SOFR Rate” means, subject to a floor of 0.0%, for any day, the “ABR Rate”), or (B)secured overnight financing rate for such business day published by the Adjusted LIBO RateNYFRB on the NYFRB’s on the immediately succeeding business day (“SOFR”) plus 10 basis points. As of December 31, 2023, the effective interest rate for the applicable interest period; provided, however, that2023 Revolving Credit Facility was SOFR + 3.85%.ABR Rate shall not be less than 1% andOperating Partnership are the Adjusted LIBO Rate shall not be less than 0.The 2021guarantors of the obligations of the Operating Partnership under the 2023 Credit Agreement, which appliesand certain subsidiaries of the Operating Partnership also granted the lenders a security interest in certain subsidiary guarantors in order to bothfurther secure the 2021obligations, liabilities and indebtedness of the Operating Partnership under the 2023 Credit Facility and 2021 Term Loan,Agreement.the minimum collateral pool value ($800 million), maximum collateral pool leverage ratio (40 percent), minimum number of collateral pool properties (2),(a) the maximum total leverage ratio (65 percent)(65%), (b) the minimum debt service coverage ratio (1.10 times until May 6, 2022, 1.20 times from May 7, 2022 through May 6, 2023, and 1.40 times thereafter)(1.25 times), and(c) the minimum tangible net worth ratio (80% of tangible net worth as of December 31, 2020July 25, 2023 plus 80% of net cash proceeds of equity issuances by the General Partner or the Operating Partnership), and (d) the maximum unhedged variable rate debt ratio (30%).The 2021 Subject to certain exceptions, the net proceeds from any property sales are to be used to mandatorily repay the 2023 Term Loan until it is retired. In addition, the 2023 Credit Agreement contains “changeincludes a mandatory cash sweep provision that provides that any cash, cash equivalents or marketable securities of control” provisions that permit the lendersGeneral Partner or Operating Partnership in excess of $25 million as of the end of the last business day of any calendar week shall be applied to declare a default and require the immediate repayment of allany outstanding borrowings under the 20212023 Credit Facility. These change of control provisions, which have been an event of default underAgreement.agreements governing the Company’s revolving credit facilities since June 2000, are triggered if, among other things, a majority of the seats on the Board of Directors (other than vacant seats) become occupied by directors who were neither nominated by the Board of Directors, nor appointed by the Board of Directors. Furthermore, construction loans secured by two multifamily residential property development projects contain cross-acceleration provisions that would constitute an event of default requiring immediate repayment of the construction loans if the change of control provisions underCompany terminated the 2021 Credit Facility are triggered and the lenders declare a default and exercise their rights underAgreement for both the 2021 Credit Facility and accelerate repayment2021 Term Loan. As a result of the outstanding borrowings thereunder. If these change of control provisions were triggered,termination, the Company could seek a forbearance, waiver or amendment ofwrote off the change of control provisions from the lenders, however there can be no assurance that the Company would be able to obtain such forbearance, waiver or amendment on acceptable terms or at all. If an event of default has occurred and is continuing, the entire outstanding balance under the 2021 Credit Agreement may (or, in the case of any bankruptcy event of default, shall) become immediately due and payable, and the Company will not make any excess distributions except to enable the General Partner to continue to qualify as a REIT under the IRS Code.On May 6, 2021, the Company drew the full $150 million available under the 2021 Term Loan and borrowed $145 million from the 2021 Credit Facility to retire the Company’s Senior Unsecured Notes. (See Note 8: Senior Unsecured Notes.) In June 2021, the Company paid down a total of $123 million of borrowings under the 2021 Term Loan, using sales proceeds from several of the Company’s suburban office property dispositions. On July 27, 2021, the Company repaid the outstanding balance of the 2021 Term Loan of $27 million using proceeds from the disposition of a suburban office properties previously held for sale. (See Note 3: Recent Transactions – Real Estate Held for Sale/Discontinued Operations/Dispositions).The terms of the 2017 credit facility included: (1) a four year term ending in January 2021, with 2 six month extension options, subject to the Company not being in default on the facility and with the payment of a fee of 7.5 basis points for each extension; (2) revolving credit loans may be made to the Company in an aggregate principal amount of up to $600 million, with a sublimit under the 2017 credit facility for the issuance of letters of creditunamortized deferred financing costs in an amount not to exceed $60of $2.7 million (subject to increase as discussed below),during the second quarter of 2023, which $10.6 millionis recorded within Loss from extinguishment of letters of credit had been issued as of May 6, 2021; (3) an interest rate, baseddebt, net, on the Operating Partnership’s unsecured debt ratings from Moody’s or S&P, or, at the Operating Partnership’s option, if it no longer maintained a debt rating from Moody’s or S&P, or such debt ratings fell below Baa3 and BBB-, based on a defined leverage ratio; and (4) a facility fee, payable quarterly based on the Operating Partnership’s unsecured debt ratings from Moody’s or S&P, or, at the Operating Partnership’s option, if it no longer maintained a debt rating from Moody’s or S&P or such debt ratings fell below Baa3 and BBB-, based on a defined leverage ratio. In January 2021, the Company elected to exercise the first option to extend the 2017 credit facility maturity date for a periodConsolidated Statements of six months. Accordingly, the term of the 2017 credit facility was extended through its termination in May 2021, with the Company’s payment of the 7.5 basis point extension fee.After electing to use the defined leverage ratio in 2018 to determine the interest rate, the interest rates on outstanding borrowings, alternate base rate loans and the facility fee on the borrowing capacity, payable quarterly in arrears, on the 2017 credit facility were based on the following total leverage ratio grid:2021.2023As of December 31, 2021 and December 31, 2020, the Company had borrowings of $148 million and $25 million under its revolving credit facility, respectively, and had 0 outstanding borrowings under its term loan as of both December 31, 2021 and December 31, 2020. 10.9. MORTGAGES, LOANS PAYABLE AND OTHER OBLIGATIONS2021, 222023, 17 of the Company’s properties, with a total carrying value of approximately $3.4$2.6 billion and 1 of the Company’s land and development projects, with a total carrying value of approximately $463 million, are encumbered by the Company’s mortgages and loans payable. Payments on mortgages, loans payable and other obligations are generally due in monthly installments of principal and interest, or interest only. The Company was in compliance with its debt covenants under its mortgages and loans payable as of December 31, 2023.20212023 and 20202022 is as follows (dollars in thousands):Property/Project Name Lender December 31,
2023December 31,
2022Maturity Port Imperial 4/5 Hotel (b) Fifth Third Bank N/A — 84,000 N/A Signature Place Nationwide Life Insurance Company 3.74 % 43,000 43,000 08/01/24 Liberty Towers American General Life Insurance Company 3.37 % 265,000 265,000 10/01/24 Portside 2 at East Pier (c) New York Life Insurance Company 4.56 % 97,000 97,000 03/10/26 BLVD 425 New York Life Insurance Company 4.17 % 131,000 131,000 08/10/26 BLVD 401 New York Life Insurance Company 4.29 % 117,000 117,000 08/10/26 Portside at East Pier (d) KKR SOFR+ 2.75 % 56,500 58,998 09/07/26 The Upton (e) Bank of New York Mellon SOFR+ 1.58 % 75,000 75,000 10/27/26 145 Front at City Square (f) US Bank SOFR+ 1.84 % 63,000 63,000 12/10/26 RiverHouse 9 at Port Imperial (g) JP Morgan SOFR+ 1.41 % 110,000 110,000 06/21/27 Quarry Place at Tuckahoe Natixis Real Estate Capital LLC 4.48 % 41,000 41,000 08/05/27 BLVD 475 N/S The Northwestern Mutual Life Insurance Co. 2.91 % 165,000 165,000 11/10/27 Haus25 (h) Freddie Mac 6.04 % 343,061 297,324 09/01/28 RiverHouse 11 at Port Imperial The Northwestern Mutual Life Insurance Co. 4.52 % 100,000 100,000 01/10/29 Soho Lofts (i) New York Community Bank 3.77 % 158,777 160,000 07/01/29 Port Imperial Garage South American General Life & A/G PC 4.85 % 31,645 32,166 12/01/29 The Emery at Overlook Ridge (j) New York Community Bank 3.21 % 72,000 72,000 01/01/31 Principal balance outstanding 1,868,983 1,911,488 Unamortized deferred financing costs (15,086) (7,511) Total mortgages, loans payable and other obligations, net $ 1,853,897 $ 1,903,977 ReflectsReflects effective rate of debt, including deferred financing costs, comprised of the cost of terminated treasury lock agreements (if any), debt initiation costs, mark-to-market adjustment of acquired debt and other transaction costs, as applicable.Properties which were collateral for this mortgageThe loan were disposed ofwas paid off on April 20, 2021. This mortgage loan does not permit early pre-payment. In April 2021, as a resultdisposition of the disposal of the properties, the Company paid costs of approximately $hotels on February 10, 2023.22.6 million at closing to defease this loan, which was expensed as loss from extinguishment of debt in the second quarter 2021. See Note 3-Recent Transactions.This construction loan has a maximum borrowing capacity of $92 million and provides, subject to certain conditions, and a one year extension option with a fee of 15 basis points, of which the Company has guaranteed 10 percent of the outstanding principal, subject to certain conditions.(d)In May 2021, the Company executed an agreement extending its maturity date to April 2023, with a six month extension option. The Company repaid $5 million of the outstanding principal and has guaranteed $14.5 million of the outstanding principal, subject to certain conditions. The loan requires a one month trailing debt service coverage charge test (“DSCR Test”), which the Company expects to not be in compliance with for the quarter ended December 31, 2021. If the Company is not in compliance with the DSCR Test, the Company will either be required to make a partial principal repayment or to deposit three months of interest into an escrow account and sweep all excess property level cash flows into such escrow account until two consecutive periods have passed where the Company is in compliance with the DSCR Test. The Company does not believe this will have a material impact on its results of operations or financial condition.(e)In January 2020, the Company increased the size of the loan on Liberty Towers to $265 million, generating $33 million of additional proceeds.(f)This construction loan has a LIBOR floor of 2.0 percent, has a maximum borrowing capacity of $300 million and provides, subject to certain conditions, 1 one year extension option with a fee of 25 basis points.(g) The Company has guaranteed 10 percent of the outstanding principal, subject to certain conditions.(h) (d)This construction loan had a maximum borrowing capacity of $64 million and provided, subject to certain conditions, an 18 month extension option with a fee of 30 basis points, of whichOn August 10, 2023, the Company had guaranteed 15 percentrefinanced the Freddie Mac fixed rate loan. Additionally, a 3-year cap at a strike rate of the outstanding principal, subject to certain conditions. On October 27, 2021, the Company obtained a new $75 million mortgage loan from a different lender maturing in October 2026 and repaid the existing loan. The Company entered into3.5% was placed. the new mortgage.(i) In November 2020, the Company modified this mortgage loan extendingwith a strike rate of 1.0%, expiring in October 2024.maturity date from February 2021Company placed a 9-month SOFR cap at a strike rate of 4.0%.November 2027.compute the interest rate for this loan: (a) the floating-rate option, the sum of the highest prime rate as published in the New York Times on each applicable Rate Change Date plus 2.75% annually or (b) the fixed-rate option, the sum of the Five Year Fixed Rate Advance of the Federal Home Loan Bank of New York in effects as of the first business day of the month which is three months prior to the Rate Change Date plus 3.00% annually.first five years of interest payments at a fixed rate. Interest payments afterrate period, which ends on January 1, 2026. After that period ends, are basedthe Company must make a one-time election of how to compute the interest rate for this loan: (a) the floating-rate option, the sum of the highest prime rate as published in the New York Times on LIBOReach applicable Rate Change Date plus 2.75% annually.(k)In January 2022,annually or (b) the Company repaid this mortgage loan upon dispositionfixed-rate option, the sum of the propertyFive Year Fixed Rate Advance of the Federal Home Loan Bank of New York in effects as of the first business day of the month which was collateral against the mortgage loan.(l)The loan was modified to defer interest and principal payments for a six month period ending December 31, 2020. As of December 31, 2021, deferred interest of $0.8 million has been addedis three months prior to the principal balance.Rate Change Date plus 3.00% annually.(m)In December 2020, the Company obtained a new $72 million mortgage loan that matures on January 1, 2031 and received net loan proceedsTable of $10.4 million after repaying its construction loan.Contentsrevolving credit facility (see Note 9) and mortgages, loans payable and other obligations (See Note 10) as of December 31, 20212023 are as follows (dollars in thousands):Period Total 2024 $ 6,076 $ 308,000 $ 314,076 2025 9,487 — 9,487 2026 9,651 536,487 546,138 2027 2027 8,158 305,320 313,478 2028 2028 5,331 343,061 348,392 Thereafter 5,574 331,838 337,412 Sub-total 44,277 1,824,706 1,868,983 Totals Totals $ 29,191 $ 1,824,706 $ 1,853,897 2020 and 2019 was $85.2$81.6 million, $103.5$80.3 million and $108.3$85.2 million, (of which $1.7$1.4 million, $5.1$13.3 million and $5.1$18.5 million pertained to properties classified as discontinued operations), respectively. Interest capitalized by the Company for the years ended December 31, 2023, 2022 and 2021 2020 and 2019 was $30.5 million, $26.4zero, $12.2 million and $19.3$30.5 million, respectively (which amounts included $0.3 million, $1.4 millionzero, zero and $1.3$0.3 million for the years ended December 31, 2021, 20202023, 2022 and 2019,2021, respectively, of interest capitalized on the Company’s investments in unconsolidated joint ventures which were substantially in development).(dollars in thousands) December 31,
2023December 31,
2022Balance Balance Fixed Rate & Hedged Debt (a) $ 1,853,897 4.34 % $ 1,757,308 4.27 % Revolving Credit Facility & Other Variable Rate Debt — — % 146,669 6.86 % Totals/Weighted Average: $ 1,853,897 4.34 % $ 1,903,977 4.47 % 11.10. EMPLOYEE BENEFIT 401(k) PLANS1one percent up to 60 percent of their annual compensation on a pre-tax basis to the 401(k) Plan, subject to certain limitations imposed by federal law. The amounts contributed by employees are immediately vested and non-forfeitable. The Company may make discretionary matching or profit sharing contributions to the 401(k) Plan on behalf of eligible participants in any plan year. Participants are always 100 percent vested in their pre-tax and post-tax contributions, and will begin vesting inas well as any matching or profit sharing contributions made on their behalf after two years of service with the Company at a rate of 20 percent per year, becoming 100 percent vested after a total of six years of service withby the Company. All contributions are allocated as a percentage of compensation of the eligible participants for the Plan year. The assets of the 401(k) Plan are held in trust and a separate account is established for each participant. A participant may receive a distribution of his or her vested account balance in the 401(k) Plan in a single sum or in installment payments upon his or her termination of service with the Company. Total expense recognized by the Company for the 401(k) Plan for the years ended December 31, 2023, 2022 and 2021 2020was $507 thousand, $631 thousand and 2019 was $537 thousand, $771 thousand and $773 thousand, respectively.12.11. DISCLOSURE OF FAIR VALUE OF ASSETS AND LIABILITIES20212023 and 2020.2022. The use of different market assumptions and/or estimation methodologies may have a material effect on the estimated fair value amounts.20212023 and 2020.senior unsecured notes, revolving credit facility and mortgages, loans payable and other obligations aggregated approximately $2.4$1.8 billion and $2.9$1.8 billion as compared to the book value of approximately $2.4$1.9 billion and $2.8$1.9 billion as of December 31, 20212023 and 2020,2022, respectively. The fair value of the Company’s long-term debt was valued using level 3 inputs (as provided by ASC 820, Fair Value Measurements and Disclosures). The fair value was estimated using a discounted cash flow analysis valuation based on the borrowing rates currently available to the Company for loans with similar terms and maturities. The fair value of the mortgage debt and the unsecured notes was determined by discounting the future contractual interest and principal payments by a market rate.The notes receivable by the Company are presentedthe lower of cost basis or net amount expected to be collected in accordance with ASC 326. For its seller-financing note receivable provided to the buyers of the Metropark portfolio, the Company calculated the net present value of contractual cash flows of the total receivable. The Company accordingly recordedFair Value on a loan loss allowance charge of $0.2 million at December 31, 2021, which was deducted from the amortized cost basis of the note receivable. Such charge was recorded in Interest and other investment income (loss) for the year ended December 31, 2021. See Note 5: Deferred charges, goodwill and other assets, net.room rental and food and beverage revenue rates, third-party broker information and information from potential buyers, as applicable.As of December 31, 2021, assumptionsThe following table presents information about assets for which we recorded an impairment charge and that were utilized in themeasured at fair value calculation included:Primary ValuationUnobservableLocationRange ofDescriptionTechniquesAssumptionsTypeRatesLand holdings held for sale and held and used on which the Company recognized impairment lossesDevelopable area and units and market rate per square foot or sale prices per purchase and sale agreementsMarket rate per residential unitWaterfront$76,000 - $78,000Hotel properties on which the Company recognized impairment lossesDiscounted cash flowsExit Capitalization rateWaterfront6.50%Discount ratesWaterfront8.67%Years Ended December 31, 2023 2022 2021 (dollars in thousands) Fair Value Measurements Impairment Charges Fair Value Measurements Impairment Charges Fair Value Measurements Impairment Charges Investment in Real Estate $ 169,839 $ 45,471 $ 314,512 $ 116,718 $ 421,053 $ 34,241 Goodwill — — — — — 2,945 Company identified 2 officeimpairment charges described below are reflected within Property impairments, Land and other impairments, net or Unrealized gains (losses) on disposition of rental property for real estate in our Consolidated Statements of Operations. For properties (comprised of 2 disposal groups) and several developable land parcelsclassified as held for salediscontinued operations as of December 31, 2023, the impairment charges described below are reflected within the Discontinued operations section in our Consolidated Statements of Operations for all periods presented.with an aggregate carrying valuewere as follows:2021. The2023, the Company recognized an unrealized gain of $3.7impairment charges for the following properties in order to reduce their carrying values to their estimated fair values, as follows:during the year ended December 31, 2021 (reversing cumulative held for sale loss allowances recognized) for a held for sale land parcel that was previously impaired when the Company entered into a contract to sell the land parcel, resulting in a carrying value of $24.8 million foron one office property and its land parcels.The Company determined that, due to the shortening of its expected hold period, itperiod; the fair value measurement was necessary to reducedetermined by estimating discounted cash flows using two significant unobservable inputs, which were the carrying value ofcash flow discount rate (11%) and terminal capitalization rate (9%);andbased on its estimated selling price; the property was sold in September 2023;tobased on their estimated fair values. Accordingly, the Company recorded an impairment charge of $6.0 million on the office asset, which is included in property impairments on the consolidated statement of operations forselling prices.2021 and $14.32022, the Company recognized impairment charges for the following properties in order to reduce their carrying values to their estimated fair values, as follows:parcelswas sold in land and other impairments on the consolidated statement of operations forNovember 2022.2021. Additionally,2021, the Company determined that,recognized impairment charges for the following properties in order to reduce their carrying values to their estimated fair values, as follows:periodperiod; the fair value measurement was determined by estimating discounted cash flows using two significant unobservable inputs, which were the cash flow discount rate (8.0%) and as a result ofterminal capitalization rate (5.75%); the property was sold in January 2022;continues to have, on its hotel operations,terminal capitalization rate (6.5%); the Company evaluated the recoverability of the carrying values of its 2 adjacent hotel properties and determined that it was necessary to reduce the carrying values of its 2 hotel assets locatedtwo hotels were sold in Weehawken, New Jersey to their estimated fair values. Accordingly, the Company recorded an impairment charge of $7.4February 2023; these hotels at December 31, 2021, which is included in property impairments on the consolidated statement of operations for the year ended December 31, 2021.As of December 31, 2020, the Company identified 16 office properties (comprised of 6 disposal groups), a retail pad leased to others, several developable land parcels as held for sale with an aggregate carrying value of $657 million. As a result of recent sales contract amendments and after considering the current market conditions due to the challenging economic climate with the current worldwide COVID-19 pandemic, the Company determined that the carrying value of 6 of those remaining held for sale properties (comprised of 3 disposal groups) and several land parcels was not expected to be recovered from estimated net sales proceeds and accordingly, during the year ended December 31, 2020, recognized an unrealized held-for-sale loss allowance of $15.7 million for the properties and recorded land and other impairments of $9.5 million.The Company determined that, due to the shortening of its expected hold period and as a result of the adverse effect the COVID-19 pandemic has had, and continues to have,based on its hotel operations, the Company evaluated the recoverability of the carrying values of its 2 adjacent hotel properties and determined that it was necessary to reduce the carrying values of its 2 hotel assets located in Weehawken, New Jersey to their estimated fair values. NaN of these hotels had closed its rooms from March 2020 to May 2021. Accordingly, the Company recorded an impairment charge of $36.6selling price;these hotelsgoodwill which is included in property impairments on the consolidated statement of operations for the year ended December 31, 2020. The Company also evaluated the recoverability of the carrying values of its land parcels and determined that it was necessary to reduce the carrying values of 3 held-and-used land parcels to their estimated fair values and recorded land and other impairment charges of $7.3 million for the year ended December 31, 2020.Disclosure about fair value of assets and liabilities isfully impaired based on pertinent information available to management as of December 31, 2021 and 2020. Although management is not aware of any factors that would significantly affect the fair value amounts, such amounts have not been comprehensively revalued for purposes of these financial statements since December 31, 2021 and current estimates of fair value may differ significantly from the amounts presented herein.management's impairment test.The ongoing impact of COVID-19 worldwide has slowed global economic activity and caused significant volatility in financial markets. As such, there is currently significant uncertainty around the breadth and duration of business disruptions related to COVID-19, as well as its impact on the U.S. economy. The current economic environment can and will be significantly adversely affected by many factors beyond the Company’s control. The extent to which COVID-19 impacts the Company’s fair value estimates in the futurewill depend on developments going forward, many of which are highly uncertain and cannot be predicted. In consideration of the magnitude of such uncertainties under the current climate, management has considered all available information at its properties and in the marketplace to provide its estimates as of December 31, 2021.13.12. COMMITMENTS AND CONTINGENCIESPILOT Payments PILOT 2023 2022 2021 Property Name Location Asset Type Expiration Dates (Dollars in Thousands) BLVD 475 (Monaco) (a) Jersey City, NJ Multifamily 2/2021 — — 443 111 River Street (b) Hoboken, NJ Office 4/2022 — — 1,470 Harborside Plaza 4A (c) Jersey City, NJ Office 2/2022 — — 1,057 Harborside Plaza 5 (d) Jersey City, NJ Office 6/2022 — — 4,324 BLVD 401 (Marbella 2) (e) Jersey City, NJ Multifamily 4/2026 1,754 1,692 1,277 RiverHouse 11 at Port Imperial (f) Weehawken, NJ Multifamily 7/2033 1,735 1,514 1,369 Port Imperial 4/5 Hotel (g) Weehawken, NJ Hotel 12/2033 224 2,925 2,925 RiverHouse 9 at Port Imperial (h) Weehawken, NJ Multifamily 6/2046 1,608 1,295 350 Haus25 (i) Jersey City, NJ Mixed-Use 3/2047 2,619 975 — The James (j) Park Ridge, NJ Multifamily 6/2051 714 318 — Total Pilot taxes $ 8,654 $ 8,719 $ 13,215 Taxes to be paid at 100 percent on the land value of the project only over five year period and allows for a phase in of real estate taxes on the building improvement value at zero percent in year one and 95 percent in years two through five.(b) The annual PILOT is equal to 10ten percent of Gross Revenues, as defined.annual PILOT is equal to 2 percentproperty was disposed of Total Project Costs, as defined. The total Project Costs are $49.5 million.in the third quarter of 2023.2two percent of Total Project Costs, as defined. The total Project Costs are $170.9 million.10ten percent of Gross Revenues for years 1-4, 12 percent for years 5-8 and 14 percent for years 9-10, as defined.2two percent of Total Project Costs, as defined. The property was disposed of during the first quarter of 2023.ForThe annual PILOT is equal to seven percent of Gross Revenues, as defined, for a term of 25 years following the substantial completion which is anticipated to occuroccurred in the second quarterApril 2022.2022.30 years following substantial completion which occurred in June 2021. The annual PILOT is equal to 7 percent of Gross Revenues, as defined.(j)For a term of 25 years following substantial completion. The annual PILOT is equal to 1110 percent of Gross Revenues for years 1-10, 11.5 percent for years 11-21 and 12.5 percent for years 11-18 and 14 percent for years 19-25,22-30; as defined.2021,2023, are as follows (dollars in thousands):As of December 31, 2023 Year Amount 2024 $ 1,272 2025 1,279 2026 1,279 2027 1,280 2028 494 2029 through 2101 31,447 Total lease payments 37,051 Less: imputed interest (29,700) Total $ 7,351 (a)The Company completed the dispositionTable of 111 River in January 2022. This disposition will reduce the total future lease payments by $127.0 millionContents.As of December 31, 2022 As of December 31, 2022 Year Amount 2023 $ 192 2024 192 2025 199 2026 2026 199 2027 2027 200 2028 through 2101 2028 through 2101 31,664 Total lease payments 32,646 Total Total $ 3,228 Groundduringfor the years ended December 31, 2021, 20202023, 2022 and 20192021 amounted to $2.0 million, $0.9 million and $1.8 million, $1.6 millionrespectively.$2.6 million, respectively.In conjunction with the adoption of ASU 2016-02 (Topic 842), starting on January 1, 2019, the Company capitalized operatingtwo ground leases, which had a balancebalances of $22.3$4.1 million and $2.1 million, respectively, at December 31, 2021 for 3 ground leases.2023. Such amount representsamounts represent the net present value (“NPV”) of future payments detailed above. The office and two ground leases used incremental borrowing rates usedof 6.0 percent and 7.6 percent, respectively, to arrive at the NPV ranged from 7.58 percent to 7.62 percent for theand have weighted average remaining ground lease terms ranging from 80.83of 4.3 years to 82.58 years.and 77.6 years, respectively. These rates were arrived at by adjusting the fixed rates of the Company’s mortgage debt with debt having terms approximating the remaining lease term of the Company’s office and ground leases and calculating notional rates for fully-collateralized loans.CONSTRUCTION PROJECTSCompanyinitial recognition of a lease liability and right-of-use asset in an amount of $4.7 million for the office lease is developing a 750-unit multifamily project at 25 Christopher Columbus, also known as Haus 25, in Jersey City, New Jersey, which began construction innoncash activity during the first quarter of 2019. The construction project, which is estimated to cost $469.5 million, of which $425 million has been incurred throughyear ended December 31, 2021, is expected to be ready for occupancy in the second quarter of 2022. The Company has funded $169.5 million of the construction costs, and the remaining construction costs are expected to be funded from a $300 million construction loan (of which $255.5 million was drawn as of December 31, 2021).OTHERCertain Company properties acquired by contribution from unrelated common unitholders of the Operating Partnership, were subject to restrictions on disposition, except in a manner which did not result in recognition of built-in-gain allocable to such unitholders or which reimbursed the unitholders for the tax consequences thereof (collectively, the “Property Lock-Ups”). While these Property Lock-Ups have expired, the Company is generally required to use commercially reasonable efforts to prevent any disposition of the subjectproperties from resulting in the recognition of built-in gain to these unitholders, which include members of the Mack Group (which includes William L. Mack, a former director and David S. Mack, a former director). As of December 31, 2021, taking into account tax-free exchanges on the originally contributed properties, either wholly or partially, over time, five of the Company’s properties, as well as certain land and development projects, with an aggregate carrying value of approximately $1.0 billion, are subject to these conditions.2021,2023, the Company has outstanding stay-on award agreements with 3520 select employees, which provides them with the potential to receive compensation, in cash or Company stock at the employees’ option, contingent upon remaining with the Company in good standing until the occurrence of certain corporate transactions, which have not been identified. The total potential cost of such awards is currently estimated to be up to approximately $5.2$2.8 million, including the potential future issuance of up to 82,62942,095 shares of the Company’s common stock. Such cash or stock awards would only be earned and payable if such transaction was identified and communicated to the employee within seven years of the agreement dates, all of which all occurredwere signed in late 2020 and early 2021, and all other conditions were satisfied.In September 2020, the General Partner's Board of Directors approved a discretionary reimbursement of approximately $6.1 million in fees and expenses incurred by Bow Street LLC in connection with its proxy solicitations in 2019 and 2020 that resulted in the election of Bow Street's nominees as directors of the General Partner at the 2019 and 2020 annual meetings of stockholders of the General Partner. The Board of Directors determined that the reimbursement was appropriate in light of the benefit to the General Partner and its stockholders of the refreshment of the Board of Directors that resulted from the proxy contests. The Company reimbursed this amount to Bow Street in 3 substantially equal payments in November 2020, January 2021 and April 2021. The Company recorded the full $6.1 million as general and administrative expense in the year ended December 31, 2020 when the obligation was committed to. Bow Street is an affiliate of A. Akiva Katz, a director of the General Partner, who is a co-founder and managing partner of Bow Street.14.13. TENANT LEASESproperties areproperty is leased to tenants under operating leases with various expiration dates through 2036.2034. Substantially all of the commercial leases provide for annual base rents plus recoveries and escalation charges based upon the tenant’s proportionate share of and/or increases in real estate taxes and certain operating costs, as defined, and the pass-throughpass-through of charges for electrical usage.20212023 and 20202022 are as follows (dollars in thousands):As of December 31, 2023 Year Amount 2024 $ 12,231 2025 10,952 2026 8,822 2027 5,748 2028 2,113 2029 and thereafter 5,706 Total $ 45,572 As of December 31, 2022 As of December 31, 2022 Year Amount 2023 $ 14,798 2024 12,231 2025 10,952 2026 8,822 2027 2027 5,748 2028 and thereafter 2028 and thereafter 7,819 Total Total $ 60,370 15.14. REDEEMABLE NONCONTROLLING INTERESTSThe Company evaluates the terms of the partnership units issued in accordance with the FASB’s Distinguishing Liabilities from Equity guidance. Units which embody an unconditional obligation requiring the Company to redeem the units for cash after a specified or determinable date (or dates) or upon the occurrence of an event that is not solely within the control of the issuer are determined to be contingently redeemable under this guidance and are included as Redeemable noncontrolling interests and classified within the mezzanine section between Total liabilities and Stockholders’ equity on the Company’s Consolidated Balance Sheets. Convertible units for which the Company has the option to settle redemption amounts in cash or Common Stock are included in the caption Noncontrolling interests in subsidiaries within the equity section on the Company’s Consolidated Balance Sheet.TransactionFebruary 27, 2017, the Company,April 5, 2023, Veris Residential Trust (“VRT”), formerly known as Roseland Residential Trust, the Company’s subsidiary through which the Company conducts its multifamily residential real estate operations, exercised its right to purchase and redeem direct and indirect interests (the “Put/Call Interests”) in preferred units of limited partnership interests in VRLP (the "Preferred Units") from certain affiliates of Rockpoint Group, L.L.C. (Rockpoint Group, L.L.C. and its affiliates, collectively, “Rockpoint”). On April 6, 2023, Rockpoint exercised its right under the Veris Residential Partners, L.P. (“VRLP”) Partnership Agreement to defer the closing of VRT’s purchase and redemption of the Put/Call Interests for one year. The exercise of the call right caused Rockpoint's interests to be reclassified as mandatorily redeemable noncontrolling interests under the accounting guidance, and included within the Total liabilities on the Company's Consolidated Balance Sheets. The impact of subsequent change in redemption value at each period end is recorded as interest cost. The carrying amount is not reduced below the initial measurement amount.formerly knownRockpoint ceased to be, direct or indirect, as Roseland Residential, L.P.,applicable, members of VRLP, and all obligations of VRT and VRLP and all rights, titlecertain affiliates of Rockpoint Group, L.L.C. (Rockpoint Group, L.L.C. and its affiliates, collectively, “Rockpoint”). TheRockpoint. Under the Original Investment Agreement, provided for VRT to contributecontributed property to VRLP in exchange for common units of limited partnership interests in VRLP (the “Common Units”) and for multiple equity investments by Rockpoint in VRLP from time to time for up to an aggregate of $300 million of preferred units of limited partnership interests in VRLP (the “Preferred Units”). The initial closing under the Original Investment Agreement occurred on March 10, 2017 for $150 million of Preferred Units and the parties agreed that the Company’s contributed equity value (“VRT Contributed Equity Value”), was $1.23 billion at closing. During the year ended December 31, 2018, a total additional amount of $105 million of Preferred Units were issued and sold to Rockpoint pursuant to the Original Investment Agreement. During the three months ended March 31, 2019, a total additional amount of $45 million of Preferred Units were issued and sold to Rockpoint pursuant to the Original Investment Agreement, which brought the Preferred Units to the full balance of $300 million.Units. In addition, certain contributions of property to VRLP by VRT subsequent to the execution of the Original Investment Agreement resulted in VRT being issued approximately $46 million of Preferred Units and Common Units in VRLP prior to June 26, 2019.26,28, 2019, the Company, VRT, VRLP, certain other affiliates of the Company and Rockpoint entered into an additional preferred equity investment agreement (the “Add On Investment Agreement”). The closing under the Add On Investment Agreement occurred on June 28, 2019. Pursuantpursuant to the Add On Investment Agreement, Rockpoint invested an additional $100 million in Preferred Units and the Company and VRT agreed to contribute to VRLP 2two additional properties located in Jersey City, New Jersey. The Company used the $100 million in proceeds received to repay outstanding borrowings under its revolving credit facility and other debt by June 30, 2019. In addition, Rockpoint has a right of first refusal to invest another $100 million in Preferred Units in the event VRT determines that VRLP requires additional capital prior to March 1, 2023 and, subject thereto, VRLP may issue up to approximately $154 million in Preferred Units to VRT or an affiliate so long as at the time of such funding VRT determines in good faith that VRLP has a valid business purpose to use such proceeds. Included in general and administrative expenses for the year ended December 31, 2019 were $371 thousand in fees associated with the modifications of the Original Investment Agreement, which were made upon signing of the Add On Investment Agreement.the new transaction with Rockpoint,VRLP, dated as of June 28, 2019 (the “VRLP Partnership Agreement”), the cash flow from operations of VRLP will be distributable to Rockpoint and VRT as follows:•first, to provide a 6% annual return to Rockpoint and VRT on their capital invested in Preferred Units (the “Preferred Base Return”);•second, 95.36% to VRT and 4.64% to Rockpoint until VRT has received a 6% annual return (the “VRT Base Return”) on the equity value of the properties contributed by it to VRLP in exchange for Common Units (previously 95% and 5%, respectively, under the Original Investment Agreement), subject to adjustment in the event VRT contributes additional property to VRLP in the future; and•third, pro rata to Rockpoint and VRT based on total respective capital invested in and contributed equity value of Preferred Units and Common Units (based on Rockpoint’s $400 million of invested capital at December 31, 2021,2023, this pro rata distribution would be approximately 21.89% to Rockpoint in respect of Preferred Units, 2.65% to VRT in respect of Preferred Units and 75.46% to VRT in respect of Common Units).•first, to Rockpoint and VRT to the extent there is any unpaid, accrued Preferred Base Return;•second, as a return of capital to Rockpoint and to VRT in respect of Preferred Units;•third, 95.36% to VRT and 4.64% to Rockpoint until VRT has received the VRT Base Return in respect of Common Units (previously 95% and 5%, respectively, under the Original Investment Agreement), subject to adjustment in the event VRT contributes additional property to VRLP in the future;•fourth, 95.36% to VRT and 4.64% to Rockpoint until VRT has received a return of capital based on the equity value of the properties contributed by it to VRLP in exchange for Common Units (previously 95% and 5%, respectively, under the Original Investment Agreement), subject to adjustment in the event VRT contributes additional property to the capital of VRLP in the future;•fifth, pro rata to Rockpoint and VRT based on respective total capital invested in and contributed equity value of Preferred and Common Units until Rockpoint has received an 11% internal rate of return (based on Rockpoint’s $400 million of invested capital at December 31, 2021,2023, this pro rata distribution would be approximately 21.89% to Rockpoint in respect of Preferred Units, 2.65% to VRT in respect of Preferred Units and 75.46% to VRT in respect of Common Units); and•sixth, to Rockpoint and VRT in respect of their Preferred Units based on 50% of their pro rata shares described in “fifth” above and the balance to VRT in respect of its Common Units (based on Rockpoint’s $400 million of invested capital at December 31, 2021,2023, this pro rata distribution would be approximately 10.947% to Rockpoint in respect of Preferred Units, 1.325% to VRT in respect of Preferred Units and 87.728% to VRT in respect of Common Units).In general, VRLP may not sell its properties in taxable transactions, although it may engage in tax-deferred like-kind exchangesTable of properties or it may proceed in another manner designed to avoid the recognition of gain for tax purposes.ContentsIn connection with the Add On Investment Agreement, on June 26, 2019, VRT increased the size of its board of trustees from six to seven persons, with five trustees being designated by the Company and two trustees being designated by Rockpoint.In addition, as was the case under the Original Investment Agreement, VRT and VRLP are required to obtain Rockpoint’s consent with respect to:debt financings in excess of a 65% loan-to-value ratio;corporate level financings that are pari-passu or senior to the Preferred Units;new investment opportunities to the extent the opportunity requires an equity capitalization in excess of 10% of VRLP’s NAV;new investment opportunities located in a Metropolitan Statistical Area where VRLP owns no property as of the previous quarter; declaration of bankruptcy of VRT; transactions between VRT and the Company, subject to certain limited exceptions;any equity granted or equity incentive plan adopted by VRLP or any of its subsidiaries; andcertain matters relating to the Credit Enhancement Note (as defined below) between the Company and VRLP (other than ordinary course borrowings or repayments thereunder).Under a Discretionary Demand Promissory Note (the “Credit Enhancement Note”), the Company may provide periodic cash advances to VRLP. The Credit Enhancement Note provides for an interest rate equal to the London Inter-Bank Offered Rate plus fifty (50) basis points above the applicable interest rate under the Company’s revolving credit facility. The maximum aggregate principal amount of advances at any one time outstanding under the Credit Enhancement Note is limited to $50 million, an increase of $25 million from the prior transaction.VRT and VRLP also have agreed, as was the case under the Original Investment Agreement, to register the Preferred Units under certain circumstances in the future in the event VRT or VRLP becomes a publicly traded company.endingended on March 1, 2023 (the “Lockout Period”), Rockpoint’s interest in the Preferred Units cannot be redeemed or repurchased, except in connection with (a) a sale of all or substantially all of VRLP or a sale of a majority of the then-outstanding interests in VRLP, in each case, which sale is not approved by Rockpoint, or (b) a spin-out or initial public offering of common stock of VRT, or distributions of VRT equity interests by the Company or its affiliates to shareholders or their respective parent interestholders (an acquisition pursuant clauses (a) or (b) above, an “Early Purchase”). VRT has the right to acquire Rockpoint’s interestfor certain conditions stated in the Preferred Units in connection with an Early Purchase for a purchase price generally equal to (i) the amount that Rockpoint would receive upon the sale of the assets of VRLP for fair market value and a distribution of the net sale proceeds in accordance with (A) the capital event distribution priorities discussed above (in the case of certain Rockpoint Preferred Holders) and(B) the distribution priorities applicable in the case of a liquidation of VRLP (in the case of the other Rockpoint Preferred Holder), plus (ii) a make whole premium (such purchase price, the “Purchase Payment”). The make whole premium is an amount equal to (i) $173.5 million until December 28, 2020, or $198.5 million thereafter, less distributions theretofore made to Rockpoint with respect to its Preferred Base Return or any deficiency therein, plus (ii) $1.5 million less certain other distributions theretofore made to Rockpoint.The fair market value of VRLP’s assets is determined by a third party appraisal of the net asset value (“NAV”) of VRLP and the fair market value of VRLP’s assets, to be completed within ninety (90) calendar days of March 1, 2023 and annually thereafter.Payment (determined without regardPayments determined based on the VRLP Partnership Agreement. Upon a Put/Call Event, other than in the eventthe make whole premium and any related tax allocations).convert all, but not less than all, of its Preferred Units to Common Units in VRLP. An acquisition of Rockpoint’s interest in the Preferred Units pursuant to a Put/Call Event is generally required to be structured as a purchase of the common equity in the applicable Rockpoint entities holding direct or indirect interests in the Preferred Units.Units (the “Put/Call Interests”). Subject to certain exceptions, Rockpoint also has a right of first offer and a participation right with respect to other common equity interests of VRLP or any subsidiary of VRLP that may be offered for sale by VRLP or its subsidiaries from time to time. Upon a Put/Call Event, other than in the event of a sale of VRLP, Rockpoint may elect to convert all, but not less than all, of its Preferred Units to Common Units in VRLP.AsVRLP.As such, the Preferred Units containcontained a substantive redemption feature that iswas outside of the Company’s control and accordingly, pursuant to ASC 480-1—S99-3A, the Preferred Units arewere previously classified in mezzanine equity measured based on the estimated future redemption value as of December 31, 2021. before the redemption right was exercised.determinesdetermined the redemption value of these interests by hypothetically liquidating the estimated NAV of the VRT real estate portfolio including debt principal through the applicable waterfall provisions of the new transaction with Rockpoint. The estimation of NAV includesincluded unobservable inputs that consider assumptions of market participants in pricing the underlying assets of VRLP. For properties under development, the Company appliesapplied a discount rate to the estimated future cash flows allocable to the Company during the period under construction and then applies a direct capitalization method to the estimated stabilized cash flows. For operating properties, the direct capitalization method iswas used by applying a capitalization rate to the projected net operating income. For developable land holdings, an estimated per-unit market value assumption iswas considered based on development rights or plans for the land. Estimated future cash flows used in such analyses arewere based on the Company’s business plan for each respective property including capital expenditures, management’s views of market and economic conditions, and considersconsidered items such as current and future rental rates, occupancies and market transactions for comparable properties. The estimated future redemption value of the Preferred Units, isincluding current preferred return payments of $2.0 million, was approximately $479.2$487.6 million as of December 31, 2021.On February 3, 2017, the42,800 sharestwo classes of a new class of 3.5 percent Series A Preferred Limited Partnership Units of the Operating Partnership (the “Series A“Preferred Units”). The key terms of the Preferred Units are summarized as follows:Series A Preferred Units Series A-1 Preferred Units Issuance date February 2017 February and April, 2017 Number of units issued 42,800 9,213 Stated value per unit $1,000 $1,000 Annual dividend rate paid quarterly 3.50 % (a) Conversion rate 28.15 27.936 Conversion value per unit $35.52 $35.80 Maximum common unit conversion 1,204,820 257,375 AA-1 Preferred Units were issued to the Company’s partners in the Plaza VIII & IX Associates L.L.C. joint venture that owns a development site adjacent to the Company’s Harborside property in Jersey City, New Jersey as non-cash consideration for their approximate 37.5 percent interest in the joint venture.Each Series A Unit has a stated value of $1,000, payspay dividends quarterly at an annual rate equal to the greater of 3.5(x) 3.50 percent, (subject to increase under certain circumstances), is convertible into 28.15or (y) the then-effective annual dividend yield on the General Partner’s common units of limited partnership interests of the Operating Partnership beginning generally five years from the date of issuance, or an aggregate of up to 1,204,820 common units. The conversion rate was based on a value of $35.52 per common unit. stock.Series APreferred Units are convertible into common units of limited partnership interests of the Operating Partnership beginning generally five years from the date of issuance. In addition, the Preferred Units are redeemable for cash at their stated value beginning five years from the date of issuance at the option of the holder.On February 28, 2017,Operating Partnership authorized the issuance of 9,213 shares of a new class of 3.5 percentyear ended December 31, 2023 and 2022, 15,100 and 12,000 Series A-1 Preferred Limited Partnership Units of the Operating Partnership (the “Series A-1 Units”). 9,122 Series A-1A Units were issued on February 28, 2017 and an additional 91 Series A-1 Units were issued in April 2017 pursuant to acquiring additional interests in a joint venture that owns Monaco Towers in Jersey City, New Jersey. The Series A-1 Units were issued as non-cash consideration for the partner’s approximate 13.8 percent ownership interest in the joint venture.Each Series A-1 Unit has a stated value of $1,000 (the “Stated Value”), pays dividends quarterly at an annual rate equal to the greater of (x) 3.5 percent, or (y) the then-effective annual dividend yield on the General Partner’s common stock, and is convertible into 27.936 common units of limited partnership interests of the Operating Partnership beginning generally five years from the date of issuance, or an aggregate of up to 257,375 Common Units. The conversion rate was based on a value of $35.80 per common unit. The Series A-1 Units have a liquidation and dividend preference senior to the Common Units and include customary anti-dilution protections for stock splits and similar events. The Series A-1 Units are redeemableredeemed for cash at theirthe stated value, beginning five years from the daterespectively.issued onfor cash at the stated value. Additionally, during February 3,2024, the Company received notice from a unit holder electing to have 10,000 Series A Units redeemed for cash at the stated value, which the Company expects to settle in March 2024.2017.The following tables set forth the changes in Mandatorily redeemable noncontrolling interests for the year ended December 31, 2023 Rockpoint
Interests
in VRTBalance at April 5, 2023 $ — Reclassification from Redeemable Non-controlling Interests 479,977 Income Attributed to Noncontrolling Interests 7,365 Distributions (9,371) Redemption Value Adjustment 42,417 Redemption (520,388) Balance at December 31, 2023 $ — yearyears ended December 31, 20212023 and 2022 (dollars in thousands):Balance at January 1, 2023 $ 40,231 $ 475,000 $ 515,231 Redeemable Noncontrolling Interests Redemption (15,100) — (15,100) Net 25,131 475,000 500,131 Income Attributed to Noncontrolling Interests 1,336 6,282 7,618 Distributions (1,468) (6,282) (7,750) Redemption Value Adjustment — 4,977 4,977 Reclassification to Mandatorily Redeemable Non-controlling Interests — (479,977) (479,977) Balance at December 31, 2023 $ 24,999 $ — $ 24,999 Balance at January 1, 2022 $ 52,324 $ 468,989 $ 521,313 Redeemable Noncontrolling Interests Redemption (12,000) — (12,000) Net 40,324 468,989 509,313 Income Attributed to Noncontrolling Interests 1,471 24,063 25,534 Distributions (1,564) (24,063) (25,627) Redemption Value Adjustment — 6,011 6,011 Balance at December 31, 2022 $ 40,231 $ 475,000 $ 515,231 16.15. VERIS RESIDENTIAL, INC. STOCKHOLDERS’ EQUITY AND VERIS RESIDENTIAL, L.P.’S PARTNERS’ CAPITAL17:16: Noncontrolling Interests in Subsidiaries. the Company entered into a distribution agreement (the “Distribution Agreement”) with J.P. Morgan Securities LLC, BofA Securities, Inc., BNY Mellon Capital Markets, LLC, Capital One Securities, Inc., Comerica Securities, Inc., Goldman Sachs & Co. LLC, R. Seelaus & Co., LLC and Samuel A. Ramirez & Company, Inc., as sales agents. Pursuantunder which we were able to the Distribution Agreement, the Company may issueoffer and sell shares of our common stock from time to time, shares of common stock, par value $0.01 per share, having a combinedup to an aggregate offeringgross sales price of up to $200 million. The Company will paymillion, with a commission that will not exceed, but may be lower than, 2%of the gross proceeds of all shares sold through the ATM Program. As of December 31, 2021,2023, the Company had not sold any shares pursuant to the ATM Program.5.55.4 million shares of the General Partner’s common stock have been reserved for future issuance. The DRIP provides for automatic reinvestment of all or a portion of a participant’s dividends from the General Partner’s shares of common stock. The DRIP also permits participants to make optional cash investments up to $5,000 a month without restriction and, if the Company waives this limit, for additional amounts subject to certain restrictions and other conditions set forth in the DRIP prospectus filed as part of the Company’s effective registration statement on Form S-3 filed with the SEC for the approximately 5.55.4 million shares of the General Partner’s common stock reserved for issuance under the DRIP.chief executive officerChief Executive Officer as an employment “inducement award” that is intended to comply with New York Stock Exchange Rule 303A.08. TheIn April 2022, the General Partner granted 250,000 stock options will vest in one-third increments on eachwith an exercise price equal to the closing price of the first three anniversaries ofCompany’s common stock on the grant date of grant, subject$16.33 per share to earlierthe Chief Investment Officer as an employment “inducement award” that is intended to comply with New York Stock Exchange Rule 303A.08. Both of these inducement awards have a three-year vesting on certain termination events.period. Shares
Under OptionsWeighted
Average
Exercise
PriceAggregate
Intrinsic
Value
$(000’s)Outstanding at January 1, 2021 ($17.31) 972,495 $ 16.79 $ — Granted 1,107,505 16.10 Outstanding at December 31, 2021 ($14.39 - $17.31) 2,080,000 $ 16.42 4,072 Granted 250,000 16.33 Outstanding at December 31, 2022 ($14.39 - $20.00) 2,330,000 $ 16.41 — Granted — — Outstanding at December 31, 2023 ($14.39 - $20.00) 2,330,000 $ 16.41 $ — Options exercisable at December 31, 2023 1,846,666 The weighted average fair value of options granted during the year ended December 31, 2021 was $4.18 per option. weighted average assumptions are included in the Company’s fair value calculations of stock options granted during the yearyears ended December 31, 2023, 2022 and 2021:2022
April2022
April2021
March2021
June regular2021
June premiumExpected life (in years) 4.0 4.5 4.6 5.3 Risk-free interest rate 2.77 % 0.79 % 0.71 % 0.94 % Volatility 38.0 % 35.0 % 35.0 % 34.0 % Dividend yield 2.6 % 1.6 % 1.5 % 1.4 % 0no stock options that were exercised under any stock option plans for the years ended December 31, 2021, 20202023, 2022 and 2019.2021. The Company has a policy of issuing new shares to satisfy stock option exercises.20212023 and 2020,2022, the stock options outstanding had a weighted average remaining contractual life of approximately 5.53.6 years and 3.64.6 years, respectively.expense of $1.7 million, $1.2 million and $844 thousand $446 thousand and 0 for the years ended December 31, 2023, 2022 and 2021, 2020 and 2019, respectively.Appreciation-Only LTIP UnitsIn March 2019, thegranted 625,000 Appreciation-Only LTIP Units (“AO LTIP Units”has issued Restricted Stock Awards ("RSAs") which are a class of partnership interests in the Operating Partnership that are intendedform of restricted stock units to qualify as “profits interests” for federal income tax purposes. The value of vested AO LTIP Units is realized through conversionnon-employee members of the AO LTIP Units into common unitsBoard of limited partnership interests of the Operating Partnership (the “Common Units”). The AO LTIP UnitsDirectors, which allow the former executiveholders to earn zero to 100% of the AO LTIP Units granted on a graduated basis of 250,000, 250,000 and 125,000 AO LTIP Units if the fair market valueeach receive shares of the Company’s common stock exceeds the threshold levels of $25.00, $28.00 and $31.00 for 30 consecutive days prior to March 13, 2023.Upon conversion of AO LTIP Units to Common Units,following a special cash distribution will be granted equal to 10% (or such other percentage specified in the applicable award agreement)one-year vesting period. Vesting of the distributions received by a holder of an equivalent number of Common Units duringRSAs issued is based on time and service. On June 14, 2023, the period from the grant dateCompany issued RSAs to non-employee members of the AO LTIP Units throughBoard of Directors, of which 54,184 unvested RSAs were outstanding at December 31, 2023.date of conversion in respect of each such AO LTIP Unit, on a per unit basis.The weighted average fair value of the AO LTIP Units granted during the yearyears ended December 31, 2019 was $3.98 per AO LTIP Unit. The fair value2023, 2022 and 2021, respectively.estimated on the date of grant using the Monte Carlo method. The following weighted average assumptions were included in the Company’s fair value calculations of AO LTIP Units granted during the year ended December 31, 2019:AO LTIPUnitsExpected life (in years)5.5 - 6.0Risk-free interest rate2.6%Volatility29.0%Dividend yield3.5%Shares Weighted-Average
Grant – Date
Fair ValueOutstanding at January 1, 2021 52,974 $ 15.29 Granted 39,529 17.71 Vested (52,974) 15.29 Outstanding at December 31, 2021 39,529 $ 17.71 Granted 49,784 14.06 Vested (39,529) 17.71 Outstanding at December 31, 2022 49,784 $ 14.06 Granted 54,184 16.98 Vested (49,784) 14.06 Outstanding at December 31, 2023 54,184 $ 16.98 2021,2023, the Company had $0.7$0.4 million of total unrecognized compensation cost related to unvested AO LTIP Units granted under the Company’s stock compensation plans. That cost is expected to be recognized over a remaining weighted average period of 1.2 years. The Company recognized AO LTIP unit expense of $622 thousand, $622 thousand and $498 thousand for the years ended December 31, 2021, 2020 and 2019, respectively.Time-based Restricted Stock Awards and Restricted Stock UnitsThe Company has issued restricted stock units and common stock (“Restricted Stock Awards”) to officers, certain other employees and non-employee members of the Board of Directors of the General Partner, which allow the holders to each receive a certain amount of shares of the General Partner’s common stock generally over a one-year to three-year vesting period. On June 9, 2021, the Company issued Restricted Stock Awards to non-employee members of the Board of Directors of the General Partner which vest within one year, of which 39,529 unvested Restricted Stock Awards were outstanding at December 31, 2021. From July to September, 2021, the Company granted restricted stock units to certain non-executive employees of the Company, which vest after three years, of which 203,663 were outstanding at December 31, 2021. Restricted Stock Awards allow holders to receive shares of the Company’s common stock upon vesting. Vesting of the Restricted Stock Awards issued is based on time and service. All currently outstanding and unvested Restricted Stock Awards provided to the officers, certain other employees, and members of the Board of Directors of the General Partner were issued under the 2013 Plan.Information regarding the Restricted Stock Awards grant activity is summarized below:As of December 31, 2021, the Company had $0.3 million of total unrecognized compensation cost related to unvested Restricted Stock AwardsRSAs granted under the Company’s stock compensation plans. That cost is expected to be recognized over a weighted average period of 0.40.5 years.Company, including the General Partner’s executive officers.Company. LTIP Awards generally are granted in the form of LTIP Units, except for awards granted in 2021 which were in the form of restricted stock units (each, an “RSU” and collectively, the “RSU LTIP Awards”) and constitute awards under the 2013 Plan. LTIP Awards are typically issued from the Company’s Outperformance Plan adopted by the General Partner’s Board of Directors.For LTIP Awards granted in 2018, 2019, and 2020, approximately 25 percent to 100 percent of the grant date fair value of the LTIP Awards were in the form of time-based awards that vest after three years and the remaining of the grant date fair value of those awards consist of multi-year, market-based awards. Participants of performance-based awards will only earn the full awards if, over the three year performance period, the Company achieves a 36 percent absolute total stockholder return (“TSR”) and if the Company’s TSR is in the 75th percentile of performance as compared to the office REITs in the NAREIT index for awards granted in 2018 and 2019 and as compared to the REITs in the NAREIT index for awards granted in 2020. The performance period for the 2018 performance-based awards ended in 2021 and 31.25 percent of LTIP Units vested while the remaining awards were forfeited.In January 2021, the Company granted LTIP Units (the “J Series 2021 LTIP Awards”) under the 2013 Plan. The J Series 2021 LTIP Awards are subject to the achievement of certain sales performance milestones with respect to commercial asset dispositions by the Company over a performance period from August 1, 2020 through December 31, 2022. These sales milestones will be based on the aggregate gross sales prices of the assets, provided that the asset will only be included in the milestone if it is sold for not less than 85% of its estimated net asset value, as defined in the agreement.In 2021, the Company also granted LTIP Units in the form of restricted stock units (each, an “RSU”). Each RSU entitles the holder to one share of the General Partner’s common stock upon settlement. Approximately 292,000 of the RSUs are subject to time-based vesting conditions and will vest inover three-year period ("TRSUs"). In April 2022, the General Partner granted 59,707 TRSUs subject to time-vesting conditions, vesting over three equal, annual installments over ayears, to three year period ending in April 2024. Approximately 453,000executive officers as “inducement awards” intended to comply with New York Stock Exchange Rule 303A.08. As of December 31, 2023, there are 781,972 TRSUs outstanding and unvested.RSUs are subject to market-basedannual LTIP Awards have market-based vesting conditions. Recipientsconditions ("PRSUs"), and recipients will only earn the full amount of the market-based RSUs if, over the three yearthree-year performance period, the General Partner achieves a thirty-six percentan absolute TSR target and if the General Partner’s relative TSR is in the 75th percentile of performance as compared to a group of 24 peer REITs.Up to an additional approximately 292,000REITs exceeds certain thresholds. The market-based award targets are determined annually by the compensation committee of the Board of Directors. As of December 31, 2023, there are 853,430 PRSUs outstanding and unvested.were grantedwith a three-year cliff vest subject to the achievement of adjusted funds from operations of $0.60 per share in the fiscal year ending December 31, 2023. The 2021 RSU LTIP Awards are designed to align the interests of senior management to relative and absolute performance of the Company over a three year performance period.LTIP Awards are subject to forfeiture depending on the extent that awards vest. The number of market-based and performance-based LTIP Units that actually vest for each award recipient will be determined at the end of the related measurement period.Prior to vesting, recipients of LTIP Units will generally be entitled to receive per unit distributions equal to one-tenth of the regular quarterly distributions payable on a common share but will not be entitled to receive any special distributions. Distributions with respect to the other nine-tenths of regular quarterly distributions payable on a common share will accrue but shall only become payable upon vesting of the LTIP Unit.$4.9$9.9 million of total unrecognized compensation cost related to unvested LTIP awardsAwards granted under the Company’s stock compensation plans. That cost is expected to be recognized over a remaining weighted average period of 1.51.7 years.non-employeenon-employee directors of the Company to elect to defer up to 100 percent of their annual retainer fee into deferred stock units. The deferred stock units are convertible into an equal number of shares of common stock upon the directors’ termination of service from the Board of Directors or a change in control of the Company, as defined in the plan. Deferred stock units are credited to each director quarterly using the closing price of the Company’s common stock on the applicable dividend record date for the respective quarter. Each participating director’s account is also credited for an equivalent amount of deferred stock units based on the dividend rate for each quarter.2021, 20202023, 2022 and 2019, 17,894, 22,086 and 14,3372021, deferred stock units earned were earned,25,671, 30,899 and 17,894, respectively. TheAs of December 31, 2023 and 2022, there were 77,975 and 73,071 deferred stock units outstanding, respectively. Pursuant to the retirement of a director from the Board of Directors in May 2023, the Company converted 193,949 and 61,27720,767 deferred stock units into shares of common stock during the years ended December 31, 2019 and December 31, 2020, respectively. As of December 31, 2021 and 2020, there were 37,603 and 17,854 deferred stock units outstanding, respectively.2021, 20202023, 2022 and 20192021 in accordance with ASC 260, Earnings Per Share (dollars in thousands, except per share amounts): Year Ended December 31, Computation of Basic EPS 2023 2022 2021 Loss from continuing operations after income tax expense $ (157,193) $ (39,534) $ (157,265) Add (deduct): Noncontrolling interests in consolidated joint ventures 2,319 3,079 4,595 Add (deduct): Noncontrolling interests in Operating Partnership 14,267 5,652 16,212 Add (deduct): Redeemable noncontrolling interests (7,618) (25,534) (25,977) Add (deduct): Redemption value adjustment of redeemable noncontrolling interests attributable to common shareholders (4,516) (5,475) (7,290) Loss from continuing operations available to common shareholders (152,741) (61,812) (169,725) Loss from discontinued operations available to common shareholders 40,960 4,271 43,393 Net loss available to common shareholders for basic earnings per share $ (111,781) $ (57,541) $ (126,332) Weighted average common shares 91,883 91,046 90,839 Loss from continuing operations available to common shareholders $ (1.66) $ (0.68) $ (1.87) Loss from discontinued operations available to common shareholders 0.44 0.05 0.48 Net loss available to common shareholders $ (1.22) $ (0.63) $ (1.39) Year Ended December 31, Computation of Diluted EPS 2023 2022 2021 Net loss from continuing operations available to common shareholders $ (152,741) $ (61,812) $ (169,725) Add (deduct): Noncontrolling interests in Operating Partnership (14,267) (5,652) (16,212) Add (deduct): Redemption value adjustment of redeemable noncontrolling interests attributable to the Operating Partnership unitholders (461) (548) (726) Loss from continuing operations for diluted earnings per share (167,469) (68,012) (186,663) Loss from discontinued operations for diluted earnings per share 44,832 4,649 47,726 Net loss available for diluted earnings per share $ (122,637) $ (63,363) $ (138,937) Weighted average common shares 100,812 100,265 99,893 Loss from continuing operations available to common shareholders $ (1.66) $ (0.68) $ (1.87) Loss from discontinued operations available to common shareholders 0.44 0.05 0.48 Net loss available to common shareholders $ (1.22) $ (0.63) $ (1.39) Year Ended December 31, Year Ended December 31, 2023 2023 2022 2021 Basic EPS Shares Add: Operating Partnership – common and vested LTIP units Diluted EPS Shares Diluted EPS Shares in the years ended December 31, 2021 and 2020during all periods presented as such securities were anti-dilutive during the period.periods. Also not included in the computations of diluted EPS were the unvested LTIP Units and unvested AO LTIP Units as such securities were anti-dilutive during all periods presented. Unvested LTIP Units outstanding as of December 31, 2021, 2020 and 2019 were 1,246,752, 1,722,929 and 1,826,331, respectively. Unvested restricted stock outstanding as of December 31, 2021, 2020 and 2019 were 39,529, 52,974 and 42,690 shares, respectively. Unvested AO LTIP Units outstanding as of each of December 31, 2021, 2020 and 2019 were 625,000.Dividends declared per common share for the years ended December 31, 2021, 2020 and 2019 were 0, $0.40 and $0.80 per share, respectively.Year Ended December 31, Computation of Basic EPU 2023 2022 2021 Loss from continuing operations after income tax expense $ (157,193) $ (39,534) $ (157,265) Add (deduct): Noncontrolling interests in consolidated joint ventures 2,319 3,079 4,595 Add (deduct): Redeemable noncontrolling interests (7,618) (25,534) (25,977) Add (deduct): Redemption value adjustment of redeemable noncontrolling interests (4,977) (6,023) (8,016) Loss from continuing operations available to unitholders (167,469) (68,012) (186,663) Loss from discontinued operations available to unitholders 44,832 4,649 47,726 Net loss available to common unitholders for basic earnings per unit $ (122,637) $ (63,363) $ (138,937) Weighted average common units 100,812 100,265 99,893 Loss from continuing operations available to unitholders $ (1.66) $ (0.68) $ (1.87) Loss from discontinued operations available to unitholders 0.44 0.05 0.48 Net loss available to common unitholders for basic earnings per unit $ (1.22) $ (0.63) $ (1.39) Year Ended December 31, Computation of Diluted EPU 2023 2022 2021 Net loss from continuing operations available to common unitholders $ (167,469) $ (68,012) $ (186,663) Loss from discontinued operations for diluted earnings per unit 44,832 4,649 47,726 Net loss available to common unitholders for diluted earnings per unit $ (122,637) $ (63,363) $ (138,937) Weighted average common unit 100,812 100,265 99,893 Loss from continuing operations available to common unitholders $ (1.66) $ (0.68) $ (1.87) Loss from discontinued operations available to common unitholders 0.44 0.05 0.48 Net loss available to common unitholders $ (1.22) $ (0.63) $ (1.39) Year Ended December 31, 2023 2022 2021 Basic EPU Units 100,812 100,265 99,893 Diluted EPU Units 100,812 100,265 99,893 in the years ended December 31, 2021 and 2020during all periods presented as such securities were anti-dilutive during the period.periods. Also not included in the computations of diluted EPU were the unvested LTIP Units and unvested AO LTIP Units as such securities were anti-dilutive during all periods presented. Unvested LTIP Units outstanding as of December 31, 2021, 2020 and 2019 were 1,246,752, 1,722,929 and 1,826,331, respectively. Unvested restricted stock outstanding as of December 31, 2021, 2020 and 2019 were 39,529, 52,974 and 42,690 shares, respectively. Unvested AO LTIP Units outstanding as of each of December 31, 2021, 2020 and 2019 were 625,000.Distributions declared per common unit for the years ended December 31, 2021, 2020 and 2019 were 0, $0.40 and $0.80 per unit, respectively.17.16. NONCONTROLLING INTERESTS IN SUBSIDIARIES2021,2023, the Company has decreasedincreased noncontrolling interests in the Operating Partnership and increaseddecreased additional paid-in capital in Veris Residential, Inc. stockholders’ equity by approximately $1.4 million as of December 31, 2021.2021, the Company redeemed 678,302 common units at their fair market value of $10.5 million, which was included as part of the buyer’s purchase consideration in the disposition of an office property in January 2021. See Note 3: Recent Transactions. During the year ended December 31, 2021,2023, the Company redeemed for cash 53,0009,229 common units at their fair value of $0.9 million.1one share of the General Partner’s Common Stock, or cash equal to the fair market value of a share of the General Partner’s Common Stock at the time of redemption, for each common unit. The General Partner, in its sole discretion, determines the form of redemption of common units (i.e., whether a common unitholder receives Common Stock, cash, or any combination thereof). If the General Partner elects to satisfy the redemption with shares of Common Stock as opposed to cash, it is obligated to issue shares of its Common Stock to the redeeming unitholder. Regardless of the rights described above, the common unitholders may not put their units for cash to the General Partner or the Operating Partnership under any circumstances. When a unitholder redeems a common unit, noncontrolling interests in the Operating Partnership is reduced and Veris Residential, Inc. Stockholders’ equity is increased.On March 8, 2016,2016 LTIP Awardsawards to executive officers/senior management of the Company, including the General Partner’s executive officers. On April 4, 2017, the Company granted 2017 LTIP Awards to senior management of the Company, including the General Partner’s executive officers. On April 20, 2018, the Company granted 2018 LTIP Awards to senior management of the Company, including the General Partner’s executive officers. On March 22, 2019, the Company granted 2019 LTIP Awards to senior management of the Company, including the General Partner’s executive officers. On March 24, 2020, the Company granted 2020 LTIP Awards to senior management of the Company, including the General Partner’s executive officers. On January 4, 2021, the Company granted J Series 2021 LTIP Awards to one of the General Partner’s executive officers.Company. All of the 2016 LTIP Awards 2017 LTIP Awards, 2018 LTIP Awards,2019 LTIP Awards. 2020 LTIP Awards and J Seriesgranted through January 2021 LTIP Awards arewere in the form of units in the Operating Partnership. See Note 16: Veris Residential, Inc. Stockholders’ Equity and Veris Residential, L.P.’s Partners’ Capital – Long-Term Incentive Plan Awards.LTIP Units arePartnership, which were designed to qualify as “profits interests” in the Operating Partnership for federal income tax purposes. As a general matter, the profits interests characteristics of the LTIP Units mean that initially they will not be economically equivalent in value to a common unit. If and when events specified by applicable tax regulations occur, LTIP Units can over time increase in value up to the point where they are equivalent to common units on a one-for-one basis. After LTIP Units are fully vested, and to the extent the special tax rules applicable to profits interests have allowed them to become equivalent in value to common units, LTIP Units may be converted on a one-for-one basis into common units. Common units in turn have a one-for-one relationship in value with shares of the General Partner’s common stock, and are redeemable on a one-for-one basis for cash or, at the election of the Company, shares of the General Partner’s common stock.AO LTIP Units (Appreciation-Only LTIP Units)On March 13, 2019, the Company granted 625,000 AO LTIP Units to Mr. DeMarco pursuant to the AO Long-Term Incentive Plan Award Agreement. See Note 16: Veris Residential, Inc. Stockholders’ Equity and Veris Residential, L.P.’s Partners’ Capital – AO LTIP Units (Appreciation-Only LTIP Units).AO LTIP Units are a class of partnership interests in the Operating Partnership that are intended to qualify as “profit interests” for federal income tax purposes and generally only allow the recipient to realize value to the extent the fair market value of a share of Common Stock exceeds the threshold level set at the time the AO LTIP Units are granted, subject to any vesting conditions applicable to the award. The value of vested AO LTIP Units is realized through conversion of the AO LTIP Units into Common Units. The number of Common Units into which vested AO LTIP Units may be converted is determined based on the quotient of (i) the excess of the fair market value of the Common Stock on the conversion date over the threshold level designated at the time the AO LTIP Unit was granted, divided by (ii) the fair market value of the Common Stock on the conversion date. AO LTIP Units, once vested, have a finite term during which they may be converted into Common Units, not in excess of ten years from the grant date of the AO LTIP Units.2021, 20202023, 2022 and 2019:2021:Common Units/
Vested LTIP UnitsCommon Units/
Vested LTIP UnitsUnvested LTIP
UnitsBalance at January 1, 2021 Balance at January 1, 2021 9,649,031 1,722,929 Redemption of common units for shares of common stock (175,257) — Redemption of common units (730,850) — 65,176 (270,610) Issuance of units — 334,449 Cancellation of units — (540,016) Balance at December 31, 2021 Balance at December 31, 2021 9,013,534 1,246,752 Redemption of common units for shares of common stock Redemption of common units for shares of common stock Redemption of common units for shares of common stock (11,508) — Redemption of common units Redemption of common units (110,084) — Conversion of vested LTIP units to common units Conversion of vested LTIP units to common units 228,579 Vested LTIP units Vested LTIP units 181,000 (409,579) Cancellation of units Cancellation of units Cancellation of units — (279,089) Balance at December 31, 2022 Balance at December 31, 2022 Balance at December 31, 2022 9,301,521 558,084 Redemption of common units for shares of common stock Redemption of common units for shares of common stock Redemption of common units for shares of common stock (820,540) — Redemption of common units Redemption of common units (9,229) — Conversion of vested LTIP units to common units Conversion of vested LTIP units to common units 452,328 — Vested LTIP units Vested LTIP units (231,519) (220,809) Cancellation of units Cancellation of units Cancellation of units — (335,392) Balance at December 31, 2023 Balance at December 31, 2023 Balance at December 31, 2023 8,692,561 1,883 20212023 and 2020,2022, the noncontrolling interests common unitholdersunit and LTIP units holders owned 9.08.6 percent and 9.69.3 percent of the Operating Partnership, respectively.18.17. SEGMENT REPORTING2two business segments: (i) multifamily real estate and services and (ii) commercial and other real estate. The Company provides leasing, property management, leasing, acquisition, development, construction and tenant-related services for its multifamily real estate portfolio and commercial and other real estate and multifamily real estate portfolio.located in the United States. The The Company had 0 revenues from foreign countries recorded for the years ended December 31, 2021, 2020 and 2019. The Company had 0 long lived assets in foreign locations as of December 31, 2021 and 2020. The accounting policies of the segments are the same as those described in Note 2: Significant Accounting Policies, excluding depreciation and amortization.(commercial(multifamily real estate and services, and commercial and other real estate, and multifamily real estate and services)estate). All properties classified as discontinued operations have been excluded.2021, 20202023, 2022 and 2019,2021, and selected asset information as of December 31, 20212023 and 20202022 regarding the Company’s operating segments are as follows. Amounts for prior periods have been restated to conform to the current period segment reporting presentation (dollars in thousands):Commercial
& Other Real EstateMultifamily
Real Estate & Services (d)Corporate
& Other (e)Total
CompanyTotal revenues: 2023 $ 19,171 $ 259,523 $ 1,165 $ 279,859 2022 2,956 224,733 5,759 233,448 2021 14,936 171,030 8,679 194,645 Total operating and interest expenses (a): 2023 $ 14,267 $ 103,776 $ 187,652 $ 305,695 2022 (1,089) 114,448 123,154 236,513 2021 2,828 108,197 100,584 211,609 Equity in earnings (loss) of unconsolidated joint ventures: 2023 $ — $ 3,102 $ — $ 3,102 2022 — 1,200 — 1,200 2021 (111) (4,139) — (4,250) Net operating income (loss) (b): 2023 $ 4,904 $ 158,849 $ (186,487) $ (22,734) 2022 4,045 111,485 (117,395) (1,865) 2021 11,997 58,694 (91,905) (21,214) Total assets: 2023 $ 97,253 $ 3,119,602 $ 24,191 $ 3,241,046 2022 597,459 3,302,188 21,121 3,920,768 Total long-lived assets (c): 2023 $ 83,785 $ 2,929,884 $ (1,854) $ 3,011,815 2022 547,923 3,101,286 (1,330) 3,647,879 Total investments in unconsolidated joint ventures: 2023 $ — $ 117,954 $ — $ 117,954 2022 — 126,158 — 126,158 acquisition-relatedtransaction-related costs and interest expense, (netnet of interest income).and other investment income and other income, net. All interest expense, net of interest and other investment income (including for property-level mortgages)mortgages interests, and interest cost of mandatorily redeemable noncontrolling interests) is excluded from segment amounts and classified inincluded under Corporate & Other for all periods.period.periods.receivable and goodwill. receivable.entity commencing in February 2018, and which also include the Company’s consolidated hotel operations.entity.Year Ended December 31, 2023 2022 2021 Net operating income $ (22,734) $ (1,865) $ (21,214) Add (deduct): Depreciation and amortization (a) (93,589) (85,434) (68,506) Land and other impairments, net (9,324) (9,368) (23,719) Property impairments (32,516) — — Realized gains (losses) and unrealized gains (losses) on disposition of rental property, net — — 3,023 Gain on disposition of developable land 7,068 57,262 2,115 Loss on sale from unconsolidated joint venture interests — — (1,886) Loss from extinguishment of debt, net (5,606) (129) (47,078) Loss from continuing operations before income tax expense (156,701) (39,534) (157,265) Provision for income taxes (492) — — Loss from continuing operations after income tax expense (157,193) (39,534) (157,265) Discontinued operations Income (loss) from discontinued operations 3,150 (64,704) 22,174 Realized gains (losses) and unrealized gains (losses) on disposition of rental property and impairments, net 41,682 69,353 25,552 Total discontinued operations, net 44,832 4,649 47,726 Net loss (112,361) (34,885) (109,539) Noncontrolling interests in consolidated joint ventures 2,319 3,079 4,595 Noncontrolling interests in Operating Partnership of income from continuing operations 14,267 5,652 16,212 Noncontrolling interests in Operating Partnership of income from discontinued operations (3,872) (378) (4,333) Redeemable noncontrolling interests (7,618) (25,534) (25,977) Net loss available to common shareholders $ (107,265) $ (52,066) $ (119,042) Year Ended December 31, 2023 2022 2021 Net operating income $ (22,734) $ (1,865) $ (21,214) Add (deduct): Depreciation and amortization (a) (93,589) (85,434) (68,506) Land and other impairments, net (9,324) (9,368) (23,719) Property impairments (32,516) — — Realized gains (losses) and unrealized gains (losses) on disposition of rental property, net — — 3,023 Gain on disposition of developable land 7,068 57,262 2,115 Loss on sale from unconsolidated joint venture interests — — (1,886) Loss from extinguishment of debt, net (5,606) (129) (47,078) Loss from continuing operations before income tax expense (156,701) (39,534) (157,265) Provision for income taxes (492) — — Income (loss) from continuing operations after income tax expense (157,193) (39,534) (157,265) Discontinued operations Income (loss) from discontinued operations 3,150 (64,704) 22,174 Realized gains (losses) and unrealized gains (losses) on disposition of rental property and impairments, net 41,682 69,353 25,552 Total discontinued operations, net 44,832 4,649 47,726 Net loss (112,361) (34,885) (109,539) Noncontrolling interests in consolidated joint ventures 2,319 3,079 4,595 Redeemable noncontrolling interests (7,618) (25,534) (25,977) Net loss available to common unitholders $ (117,660) $ (57,340) $ (130,921) 19. RELATED PARTY TRANSACTIONSWilliam L. Mack, a former director of the General Partner(a) Depreciation and David S. Mack, a former director of the General Partner, are the executive officers, directors and stockholders of a corporation that leased 5,930 square feet at 1 of the Company’s office properties, which was scheduled to expireamortization included in January 2025 (the Company disposed of this property in March 2020). The corporation previously leased approximately 7,034 square feet at another 1 of the Company’s office properties (the Company disposed of this property in January 2019). The Company recognized $48,000 and $18,000 in revenue under these leaseseach segment for the years endedending December 31, 20202023, 2022 and 2019, respectively2021 is $7.4 million, $3.9 million and had 0 accounts receivable from the corporation as of December 31, 2021$3.0 million for Commercial & Other Real Estate, $85.1 million, $80.6 million and 2020.The adult children of Marshall Tycher, former Chairman of VRT, own minority equity interests in a vendor to the Company. Additionally, Mr. Tycher’s son-in-law is an employee of the vendor. The Company recognized $84,000, $99,000$64.6 million for Multifamily Real Estate & Services, and $120,000 in expense$1.1 million, $0.9 million and $0.9 million for this vendor during the years ended December 31, 2021, 2020 and 2019, respectively, and had 0 accounts payable to this vendor as of December 31, 2021 and 2020.Corporate & Other, respectively.Certain executive officers of VRT and/or their family members (“RG”) directly or indirectly hold small noncontrolling interests in a certain consolidated joint venture. Additionally, the Company earned 0, 0, and $674,000 from entities in which RG has ownership interests for the years ended December 31, 2021, 2020 and 2019, respectively.In September 2020, the General Partner's Board of Directors approved a discretionary reimbursement of approximately $6.1 million in fees and expenses incurred by Bow Street LLC in connection with its proxy solicitations in 2019 and 2020 that resulted in the election of Bow Street's nominees as directors of the General Partner at the 2019 and 2020 annual meetings of stockholders of the General Partner. The Board of Directors determined that the reimbursement was appropriate in light of the benefit to the General Partner and its stockholders of the refreshment of the Board of Directors that resulted from the proxy contests. The Company reimbursed this amount to Bow Street in 3 substantially equal payments in November 2020, January 2021 and April 2021, which the Company has recorded the $6.1 million as general and administrative expense for the year ended December 31, 2020. Bow Street is an affiliate of A. Akiva Katz, a director of the General Partner, who is a co-founder and managing partner of Bow Street.20. CONDENSED QUARTERLY FINANCIAL INFORMATION (unaudited)Veris Residential, Inc.The following summarizes the condensed quarterly financial information for the Company VERIS RESIDENTIAL, INC., VERIS RESIDENTIAL, L.P. AND SUBSIDIARIES:Veris Residential, L.P.The following summarizes the condensed quarterly financial information for the Company (dollars in thousands):Property Location Property
TypeYear
BuiltAcquired Related
EncumbrancesInitial Costs Costs
Capitalized
Subsequent to
Acquisition (c)Gross Amount at Which
Carried at Close of
Period (a)Total (d) Accumulated
Depreciation (b)Land Building and
ImprovementsLand Building and
Improvements NEW JERSEY Bergen County Park Ridge The James Multifamily 2022 — 12,047 114,208 584 12,047 114,792 126,839 4,419 Essex County Millburn (Short Hills) The Upton Multifamily 2021 — 74,606 2,850 — 91,960 2,850 91,960 94,810 8,930 Hudson County Jersey City Harborside Plaza 5 Office 2002 2002 6,218 170,682 (8,422) 3,996 164,482 168,478 92,411 Haus25 Multifamily 2022 333,512 53,421 420,959 (384) 53,421 420,575 473,996 21,888 Liberty Towers Multifamily 2003 2019 264,697 66,670 328,347 11,341 66,670 339,688 406,358 38,466 BLVD 475 N/S Multifamily 2011 2017 164,944 58,761 240,871 8,471 58,761 249,342 308,103 49,205 Soho Lofts Multifamily 2017 2019 158,126 27,601 224,039 6,060 27,601 230,099 257,700 32,837 BLVD 425 Multifamily 2003 2018 130,673 48,820 160,740 5,525 48,820 166,265 215,085 27,463 BLVD 401 Multifamily 2016 2019 116,642 36,595 152,440 391 36,595 152,831 189,426 20,555 Weehawken 100 Avenue at Port Imperial Other 2016 2016 — 350 — 30,644 1,958 29,036 30,994 7,053 500 Avenue at Port Imperial Other 2013 2013 31,480 13,099 56,669 (19,213) 13,099 37,456 50,555 9,894 RiverHouse 9 at Port Imperial Multifamily 2021 — 109,221 2,686 — 154,575 2,686 154,575 157,261 11,925 RiverHouse 11 at Port Imperial Multifamily 2018 2018 99,896 22,047 — 112,471 22,047 112,471 134,518 18,946 West New York Port Imperial North Retail Other 2008 2020 — 4,305 8,216 1,123 4,305 9,339 13,644 1,230 Morris County Morris Plains Signature Place Multifamily 2018 2018 42,944 930 — 56,498 930 56,498 57,428 9,528 NEW YORK Westchester County Eastchester Quarry Place at Tuckahoe Multifamily 2016 2016 40,763 5,585 3,400 49,002 5,585 52,402 57,987 11,086 MASSACHUSETTS Middlesex County Malden The Emery at Overlook Ridge Multifamily 2020 2014 71,554 4,115 86,093 10,091 9,104 91,195 100,299 12,150 Suffolk County East Boston Portside at East Pier Multifamily 2015 2016 55,252 — 73,713 861 — 74,574 74,574 19,008 Portside 2 at East Pier Multifamily 2018 2018 96,809 — 37,114 77,324 — 114,438 114,438 19,654 Worcester County Worcester 145 Front at City Square Multifamily 2018 2015 62,778 4,380 — 92,306 4,380 92,306 96,686 16,933 Projects Under Development and Developable Land — 99,644 59,052 — 99,644 59,052 158,696 10,200 Furniture, Fixtures and Equipment — — — 103,613 — 103,613 103,613 TOTALS 1,853,897 470,124 2,136,543 784,821 474,499 2,916,989 3,391,488 (e) 443,781
20212023 was approximately $3.2$2.4 billion.(d)Includes properties classified as held for sale at December 31, 2021. The gross amount includes $160.0 millionTable of land and $618.2 million of building improvements related to these held for sale assets at period end.Contents(e)Accumulated depreciation includes $159.5 million from assets classified as held for sale as of December 31, 2021.2021, 20202023, 2022 and 20192021 are as follows: (dollars in thousands)
2023 2022 2021 Rental Properties Balance at beginning of year $ 4,046,122 $ 4,076,866 $ 4,638,643 Additions 25,661 845,900 1,002,342 Sales and assets held-for-sale (608,276) (747,407) (1,522,994) Impairments (72,019) (129,237) (27,547) Retirements/disposals — — (13,578) Balance at end of year $ 3,391,488 $ 4,046,122 $ 4,076,866 Accumulated Depreciation Balance at beginning of year $ 631,910 $ 583,416 $ 656,331 Depreciation expense 94,590 102,476 102,062 Sales and assets held-for-sale (243,217) (28,924) (159,541) Impairments (39,502) (25,058) (1,858) Retirements/disposals — — (13,578) Balance at end of year $ 443,781 $ 631,910 $ 583,416
NumberExhibit Number3.53.5 3.6 3.7 3.73.83.83.93.93.103.103.113.113.123.123.133.133.143.143.153.153.163.17 3.163.173.183.183.193.193.2010.110.1#10.2#10.310.410.5#10.6#10.2#10.710.310.810.410.910.510.1010.610.1110.7 10.1210.1310.810.14#10.9#10.15#10.1610.1010.1710.1810.1910.2010.1110.2110.1210.2210.1310.2310.1410.2410.1510.2510.1610.2610.1710.2710.18#10.28#10.29#10.30#10.31#10.32#10.33#10.34#10.35#10.36#10.19#10.37#10.20#10.38#10.21#10.39#10.22#10.23# 10.40#10.24#10.41#10.25#10.26 10.4210.2710.28 10.29 10.30 10.31 10.4310.4410.4510.4610.47#10.48#10.49#20212023 formatted in Inline XBRL: (i) Consolidated Balance Sheets, (ii) Consolidated Statements of Operations, (iii) Consolidated Statements of Comprehensive Income (Loss), (iv) Consolidated Statements of Changes in Equity, (v) Consolidated Statements of Cash Flows and (vi) Notes to Consolidated Financial Statements.* filed herewith# management contract or compensatory plan or arrangement23, 202223, 2022/s/ David J. SmetanaDavid J. SmetanaChief Financial Officer(principal financial officer)Date: February 23, 2022By:AccountingFinancial Officer23, 202223, 2022/s/ David J. SmetanaDavid J. SmetanaChief Financial Officer(principal financial officer)Date: February 23, 2022By:AccountingFinancial OfficerName Title Date NameTitleDateFebruary 23, 202221, 2024MahbodMahbod NiaFebruary 23, 202221, 2024David J. SmetanaFebruary 23, 202221, 2024David J. SmetanaAmanda Lombardofficer)/s/ Amanda LombardChief Accounting OfficerFebruary 23, 2022Amanda Lombard(officer and principal accounting officer)Alan R. BatkinFebruary 23, 202221, 2024Alan R. Batkin/s/ Frederic CumenalDirectorFebruary 23, 2022Frederic CumenalDirector /s/ A. Akiva Katz Director February 21, 2024 A. Akiva Katz DirectorFebruary 23, 2022A. Akiva KatzDirector /s/ Nori Gerardo LietzDirectorFebruary 23, 2022Nori Gerardo LietzDirector /s/ Victor McFarlaneDirectorFebruary 23, 2022Victor McFarlane/s/ Howard S. SternFebruary 23, 202221, 2024/s/ Stephanie L. Williams Director February 21, 2024 Stephanie L. Williams