UNITED STATES
SECURITIES AND EXCHANGE COMMISSION
Washington, D.C. 20549
FORM 10-K
(Mark One)
☒ ANNUAL REPORT PURSUANT TO SECTION 13 OR 15(d) OF THE SECURITIES EXCHANGE ACT OF 1934
For the fiscal year ended December 31, 20222023
OR
☐ TRANSITION REPORT PURSUANT TO SECTION 13 OR 15(d) OF THE SECURITIES EXCHANGE ACT OF 1934
Commission file number: 000-55610
GREENBACKER RENEWABLE ENERGY COMPANY LLC
(Exact Name of Registrant as Specified in its Charter)
| | | | | | | | |
| Delaware | | 80-0872648 |
(State or Other Jurisdiction of
Incorporation or Organization) | | (I.R.S. Employer
Identification No.) |
230 Park Avenue, Suite 1560
New York, NY 10169
Tel (646) 720-9463
(Address, including zip code and telephone number, including area code, of registrants principal executive office)
Charles Wheeler
230 Park Avenue, Suite 1560
New York, NY 10169
Tel (646) 720-9463
(Name, address, including zip code, and telephone number, including area code, of agent for service)
Securities registered pursuant to Section 12(b) of the Act:
| | | | | | | | | | | | | | |
| Title of each class | | Trading Symbol(s) | | Name of each exchange on which registered |
Limited liability company interestsNone | | N/A | | N/A |
Securities registered pursuant to section 12(g) of the Act: None
| | | | | | | | | | | | | | |
| Title of each class | | Trading Symbol(s) | | Name of each exchange on which registered |
| Class A Shares of Limited Liability Company Interests | | N/A | | N/A |
| Class C Shares of Limited Liability Company Interests | | N/A | | N/A |
| Class I Shares of Limited Liability Company Interests | | N/A | | N/A |
Indicate by check mark if the registrant is a well-known seasoned issuer, as defined in Rule 405 of the Securities Act of 1933. Yes ☐ No ☒
Indicate by check mark if the registrant is not required to file reports pursuant to Section 13 or Section 15(d) of the Securities Exchange Act of 1934. Yes ☐ No ☒
Indicate by check mark whether the registrant: (1) has filed all reports required to be filed by Section 13 or 15(d) of the Securities Exchange Act of 1934 during the preceding 12 months (or for such shorter period that the registrant was required to file such reports), and (2) has been subject to such filing requirements for the past 90 days. Yes ☒ No ☐
Indicate by check mark whether the registrant has submitted electronically every Interactive Data File required to be submitted pursuant to Rule 405 of Regulation S-T (§ 232.405 of this chapter) during the preceding 12 months (or for such shorter period that the registrant was required to submit such files). Yes ☒ No ☐
Indicate by check mark whether the registrant is a large accelerated filer, an accelerated filer, a non-accelerated filer, smaller reporting company, or an emerging growth company. See the definitions of “large accelerated filer,” “accelerated filer,” “smaller reporting company,” and “emerging growth company” in Rule 12b-2 of the Exchange Act.
| | | | | | | | | | | |
| Large accelerated filer | ☐ | Accelerated filer | ☐ |
| Non-accelerated filer | ☒ | Smaller reporting company | ☒ |
| | Emerging growth company | ☐ |
If an emerging growth company, indicate by check mark if the registrant has elected not to use the extended transition period for complying with any new or revised financial accounting standards provided pursuant to Section 13(a) of the Exchange Act. ☐
Indicate by check mark whether the registrant has filed a report on and attestation to its management’s assessment of the effectiveness of its internal control over financial reporting under Section 404(b) of the Sarbanes-Oxley Act (15 U.S.C. 7262(b)) by the registered public accounting firm that prepared or issued its audit report. ☐
If securities are registered pursuant to Section 12(b) of the Act, indicate by check mark whether the financial statements of the registrant included in the filing reflect the correction of an error to previously issued financial statements. ☐
Indicate by check mark whether any of those error corrections are restatements that required a recovery analysis of incentive-based compensation received by any of the registrant’s executive officers during the relevant recovery period pursuant to §240.10D-1(b). ☐
Indicate by check mark whether the registrant is a shell company (as defined in Rule 12b-2 of the Exchange Act). Yes ☐ No ☒
As of March 1, 2023,2024, the registrant had 198,482,500199,056,630 shares of common interests, $0.001 par value, outstanding.
DOCUMENTS INCORPORATED BY REFERENCE
The Registrant intends to file a definitive proxy statement pursuant to Regulation 14A within 120 days after the end of the year ended December 31, 20222023 (the “2023“2024 Proxy Statement”). Portions of the Registrant’s 20232024 Proxy Statement to be filed pursuant to Regulation 14A are incorporated herein by reference into Part III of this Form 10-K.
EXPLANATORY NOTE
As previously announced by Greenbacker Renewable Energy Company LLC (the “Company”) in its Current Report on Form 8-K filed with the Securities and Exchange Commission on May 23, 2022, the Company completed the acquisition of Greenbacker Capital Management LLC (“GCM”), Greenbacker Administration LLC (“Greenbacker Administration”) and other affiliated companies on May 19, 2022 (the “Acquisition”). As a result of the Acquisition and other steps taken by the Company to transition the focus of the Company's business from being an investor in clean energy projects to a diversified independent power producer coupled with an investment management business, the Company was required to transition the basis of its accounting. Since inception, the Company's historical financial statements have been prepared using the investment company basis of accounting in accordance with Accounting Standards Codification (“ASC”) Topic 946, Financial Services – Investment Companies (“ASC 946”). ASC 946 (or “Investment Basis”) requires that if there is a subsequent change in the purpose and design of an entity, the entity should reevaluate its status as an investment company. Based on the above noted changes, management determined the Company no longer exhibited the fundamental characteristics of, and no longer qualified as, an investment company as defined in ASC 946. As a result, the Company was required to discontinue the application of ASC 946 and, in connection therewith, began applying other non-investment company U.S. generally accepted accounting principles (“U.S. GAAP”) prospectively beginning May 19, 2022 (the closing of the Acquisition).
As the change in status occurred during the Company’s second fiscal quarter of 2022, the results of operations as included in this annual report on Form 10-K (this “Annual Report”) will be presented as they would be for an investment company under ASC 946 for all historical periods and the period(s) through May 18, 2022, and presented as they would be under other non-investment company U.S. GAAP accounting (“Non-Investment Basis”) for the time period betweenas of and subsequent to May 19, 2022, the effective date of the change in status, through December 31, 2022.status. Given that the financial statements prior to and subsequent to the change in status are not comparable, the Company will present separate Consolidated Financial Statements, including footnotes as applicable, for the time periods prior to and subsequent to May 19, 2022.
TABLE OF CONTENTS
GLOSSARY OF KEY TERMS
InWhen the following terms and abbreviations appear in the text of this annual report, on Form 10-K (this “Annual Report”), except as otherwise indicated, they have the following terms mean:meanings indicated below:
| | | | | |
| Acquisition | The management internalization transaction completed by the Company on May 19, 2022 |
| Adjusted EBITDA | A non-GAAP financial measure that the Company uses as a performance measure as well as for internal planning purposes |
| Administration Agreement | First Amended and Restated Administration Agreement between Greenbacker Renewable Energy Company LLC, Greenbacker Renewable Energy Corporation and Greenbacker Administration LLC |
| Advisers Act | The Investment Advisers Act of 1940 |
| Advisory Agreement | Fourth Amended and Restated Advisory Agreement between Greenbacker Renewable Energy Company LLC and Greenbacker Capital Management LLC |
| AEC Companies | LED Funding LLC and Renew AEC One LLC |
| ARO | Asset Retirement Obligation |
| ASC | Accounting Standards Codification |
| ASC 946 or Investment Basis | ASC Topic 946, Financial Services – Investment Companies. The accounting method used by the Company prior to the Acquisition on May 19, 2022 |
| Aurora Solar | Aurora Solar Holdings, LLC |
| CES | Clean Energy Standards |
| COD | Commercial Operations Date |
| CODM | Chief Operating Decision Maker |
| Contribution Agreement | Contribution agreement between Greenbacker Renewable Energy Company LLC and Greenbacker Capital Management LLC’s former parent, Greenbacker Group LLC under which the Acquisition was implemented |
| DRP | Distribution Reinvestment Plan |
Earnout ShareShares | Class EO common shares issued as part of the Acquisition |
| EBITDA | A non-GAAP financial measure that adjusts income before income taxes to exclude interest, depreciation expense and amortization expense, as well as other income and expense items |
| EIA | U.S. Energy Information Administration |
| EPC | Engineering, procurement, and construction companies |
| Exchange Act | Securities Exchange Act of 1934 |
| FASB | Financial Accounting Standards Board |
| FERC | U.S. Federal Energy Regulatory Commission |
| FFO | A non-GAAP financial measure that the Company uses as a performance measure to analyze net earnings from operations without the effects of certain non-recurring items that are not indicative of the ongoing operating performance of the business |
| Fifth Operating Agreement | Fifth Amended and Restated Limited Liability Company Operating Agreement of Greenbacker Renewable Energy Company LLC |
| Fourth Operating Agreement | Fourth Amended and Restated Limited Liability Company Operating Agreement of Greenbacker Renewable Energy Company LLC |
| FPA | Federal Power Act |
| GCM | Greenbacker Capital Management LLC |
| GDEV | Greenbacker Development Opportunities Fund I, LP |
| GDEV B | Greenbacker Development Opportunities Fund I (B), LP |
| GDEV GP | Greenbacker Development Opportunities Fund GP I, LLC |
| GDEV GP II | Greenbacker Development Opportunities GP II, LLC |
| GDEV I | Refers collectively to GDEV and parallel fund, GDEV B |
| GDEV II | Greenbacker Development Opportunities Fund II, LP |
| GREC | Greenbacker Renewable Energy Corporation, a Maryland corporation |
| GREC HoldCo or GREC Entity Holdco | GREC Entity HoldCo LLC, a wholly owned subsidiary of GREC |
| GREC II | Greenbacker Renewable Energy Company II, LLC |
| | | | | |
| Greenbacker Administration or Administrator | Greenbacker Administration LLC |
| | | | | |
| Group LLC | Greenbacker Group LLC |
| GROZ | Greenbacker Renewable Opportunity Zone Fund LLC |
| GROZ, GDEV I, GDEV II and GREC II | The managed funds |
| GW | Gigawatts |
| HLBV | Hypothetical Liquidation at Book Value |
| IM | The Investment Management segment represents GCM’s investment management platform – a renewable energy, energy efficiency and sustainability-related project acquisition, consulting and development company that is registered as an investment adviser under the Advisers Act |
| Investment Basis | Investment Basis ASC Topic 946, Financial Services – Investment Companies |
| IPP | The Independent Power Producer segment represents the active management and operations of the Company's fleet of renewable energy projects, including those in late-stage development and under construction |
| IRA | Inflation Reduction Act of 2022 |
| IRS | Internal Revenue Service
| ITC | Investment Tax Credit |
| JOBS Act | Jumpstart Our Business Startups Act |
| kW | Kilowatts |
| kWh | Kilowatt hours |
| LIBOR | London Interbank Offered Rate |
| LP | Limited partner |
| |
| LPU Holder | GB Liquidation Performance Holder LLC |
| MIPA | Membership Interest Purchase Agreement |
| MSV | Monthly share value |
| MW | Megawatts: (DC) for all solar assets and (AC) for wind assets |
| MWh | Megawatt Hours |
| N/A | Not applicable |
| NAV | Net asset value |
| NCI | Noncontrolling interests |
| NM | Not meaningful |
NOL | Net Operating Losses |
| Non-Investment Basis | Non-investment company U.S. GAAP accounting the Company applied subsequent to the Acquisition |
| NTP | Notice to Proceed |
| O&O costs | Organization and Offering Costs |
OYA Solar | OYA-Rosewood Holdings LLC, previously OYA Solar B1 Intermediate Holdco LLC |
PCAOB | Public Company Accounting Oversight Board |
| PPA | Power Purchase Agreement |
| PTC | Production Tax Credit |
| PTO | Permission to operate |
| REC | Renewable Energy Credit |
| RNCI | Redeemable noncontrolling interests |
| ROU | Right-of-use asset |
| RPS | Renewable Portfolio Standard |
| SEC | Securities and Exchange Commission |
| SOFR | Secured Overnight Financing Rate |
Special unitUnit | Prior to the Acquisition, referred to the special unit of the limited liability company interest in the Greenbacker Renewable Energy Company LLC entitling the Special Unitholder to a performance participation fee |
| Special Unitholder | GREC Advisors, LLC, a Delaware limited liability company, which is a subsidiary of GCM |
| | | | | |
| SRP | Share Repurchase Program |
| Tax Equity Investors | Third-party investors under tax equity financing facilities |
| U.S. GAAP | U.S. generally accepted accounting principles |
| VIE | Variable interest entities |
| We, us, our and the Company | Greenbacker Renewable Energy Company LLC and its subsidiaries as of and subsequent to May 19, 2022 |
| | | | | |
| We, us, our and the LLC | Greenbacker Renewable Energy Company LLC, Greenbacker Renewable Energy Corporation, GREC Entity HoldCo LLC, GREC Administration LLC and Danforth Shared Services LLC as of and prior tothrough May 18, 2022 |
Forward Looking Statements
Various statements in this Annual Report on Form 10-K (this “Annual Report”), including those that express a belief, expectation or intention, as well as those that are not statements of historical fact, are forward-looking statements. The forward-looking statements may include projections and estimates concerning the timing and success of specific projects, revenues, income and capital spending. We generally identify forward-looking statements with the words “believe,” “intend,” “expect,” “seek,” “may,” “will,” “should,” “would,” “anticipate,” “could,” “estimate,” “plan,” “predict,” “project” or their negatives, and other similar expressions. All statements we make relating to our estimated and projected earnings, margins, costs, expenditures, cash flows, growth rates and financial results, or to our expectations regarding future industry trends, are forward-looking statements. These forward-looking statements are subject to risks and uncertainties that may change at any time, and, therefore, our actual results may differ materially from those that we expected. The forward-looking statements contained in this Annual Report are largely based on our expectations, which reflect many estimates and assumptions made by our management. These estimates and assumptions reflect our best judgment based on currently known market conditions and other factors. Although we believe such estimates and assumptions are reasonable, we caution that it is very difficult to predict the impact of known factors, and it is impossible for us to anticipate all factors that could affect our actual results. In addition, assumptions about future events may prove to be inaccurate. We caution all readers that the forward-looking statements contained in this Annual Report are not guarantees of future performance, and we cannot assure any reader that such statements will prove correct or that the forward-looking events and circumstances will occur. Actual results may differ materially from those anticipated or implied in the forward-looking statements due to the numerous risks and uncertainties as described under Part I — Item 1A. Risk Factors and elsewhere in this Annual Report. All forward-looking statements are based upon information available to us on the date of this Annual Report. We undertake no obligation to update or revise any forward-looking statements as a result of new information, future events or otherwise, except as otherwise required by law. You are advised to consult any additional disclosures that we may make directly to you or through reports that we in the future may file with the SEC, including Annual Reports on Form 10-K, Quarterly Reports on Form 10-Q and Current Reports on Form 8-K. These cautionary statements qualify all forward-looking statements attributable to us, or persons acting on our behalf. The risks, contingencies and uncertainties associated with our forward-looking statements relate to, among other matters, the following:
•volatility of the global financial markets and uncertain economic conditions, including rising interest rates, inflationary pressures, recessionary concerns or global supply chain issues;
•other changes in the economy;
•the ability to complete the under construction renewable energy projects that we acquire;
•our inability to obtain or re-negotiate long-term contracts for the sale of our power produced by our projects on favorable terms and our inability to meet certain milestones and other performance criteria under existing PPAs;
•our relationships with project developers, lawyers, investment and commercial banks, individual and institutional investors, consultants, diligence specialists, EPCs, contractors, renewable energy technology manufacturers (such as panel manufacturers), solar insurance specialists, component manufacturers, software providers and other industry participants in the renewable energy, capital markets and project finance sectors;
•fluctuations in supply, demand, prices and other conditions for electricity, other commodities and RECs;
•public response to and changes in the local, state and federal regulatory framework affecting renewable energy projects, including the potential expiration or extension of the PTC, ITC and the related United States (“U.S.”) Treasury grants, potential reductions in RPS requirements and the impacts of the recent passage of the IRA;
•competition from other energy developers and asset managers;
•the worldwide demand for electricity and the market for renewable energy;
•the ability or inability of conventional fossil fuel-based generation technologies to meet the worldwide demand for electricity;
•our competitive position and our expectation regarding key competitive factors;
•risks associated with our hedging strategies;
•potential environmental liabilities and the cost of compliance with applicable environmental laws and regulations, which may be material;
•our electrical production projections (including assumptions of curtailment and facility availability) for our renewable energy projects;
•our ability to operate our business efficiently, manage costs (including salary and compensation related expenses and other general and administrative expenses) effectively and generate cash flow;
•availability of suitable renewable energy resources and other weather conditions that affect our electricity production;
•the effects of litigation, including administrative and other proceedings or investigations relating to our renewable energy projects;
•non-payment by customers and enforcement of certain contractual provisions;
•the lack of a public trading market for our shares;
•the ability to make and the amount and timing of anticipated future distributions;
•risks associated with possible disruption in our operations or the economy generally due to terrorism, natural or man-made disasters, pandemics or threatened or actual armed conflicts;
•future changes in laws or regulations and conditions in our operating areas;
•the loss of our exemption from the definition of an “investment company” under the Investment Company Act of 1940, as amended;
•fiscal policies or inaction at the U.S. federal government level, which may lead to federal government shutdowns or negative impacts on the U.S economy;
•failure to attract and retain qualified personnel, increased labor costs, and the unavailability of skilled workers; and
•our ability to achieve the cost savings and economies of scale expected to be realized as a result of the Company's management internalization.
PART I
ITEM 1. BUSINESS
The use of “we”, “us”, “our” and the “Company” refer, collectively to the Greenbacker Renewable Energy Company LLC and its subsidiaries, unless otherwise expressly stated or context otherwise requires. This report does not constitute an offer of any of the Company'sCompany’s managed funds described herein.
Organizational Overview
Greenbacker Renewable Energy Company LLC (the “Company”) is a Delaware limited liability company formed in December 2012. The Company is an energy transition, renewable energy and investment management company that acquires, constructs and operates renewable energy and energy efficiency projects, as well as finances the construction and/or operation of these and other sustainable development projects and businesses and provides through GCM investment management services to funds within the sustainable infrastructure and renewable energy industry. As of December 31, 2022,2023, the Company’s fleet comprised 456435 renewable energy projects with an aggregate power production capacity of approximately 3.13.3 GW, when fully operational.which includes operating capacity of approximately 1.5 GW and pre-operational capacity of approximately 1.8 GW. As of December 31, 2022,2023, GCM serves as the registered investment adviser of four funds in the sustainable and renewable energy industry.
The Company conducts substantially all its operations through its wholly owned subsidiary, GREC. Until May 19, 2022, the Company was externally managed by GCM. As of and after May 19, 2022, the Company operates as a fully integrated and internally managed company after acquiring GCM and several other related entities, which are now wholly owned subsidiaries of GREC. The Company’s fiscal year-end is December 31.
The Company previously conducted continuous public offerings of Class A, C, and I shares of limited liability company interests, along with Class A, C, and I shares pursuant to the Company’s DRP. The public offerings were initially commenced in August 2013 and terminated March 29, 2019, raising a total of $253.4 million. The Company also privately offered Class P-A, P-I, P-D, P-T and P-S shares. These private offerings were conducted between April 2016 and March 16, 2022, raising a total of $1.4 billion. The Company currently offers the DRP pursuant to which shareholders may elect to have the full amount of cash distributions reinvested in additional shares. The Company also offersoffered the SRP pursuant to which quarterly share repurchases arewere conducted to allow shareholders to sell shares back to the Company. On September 23, 2023, the Company suspended the SRP (except with respect to repurchase requests made in connection with the death, qualifying disability or determination of incompetence of a shareholder).
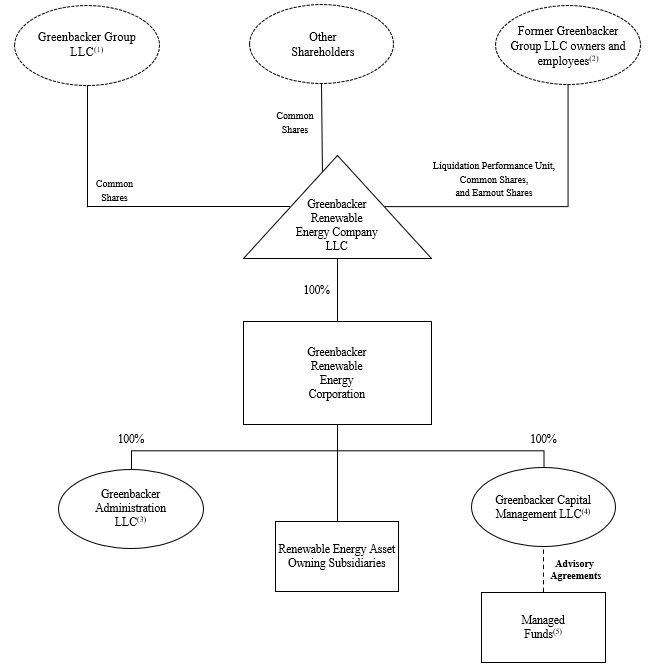
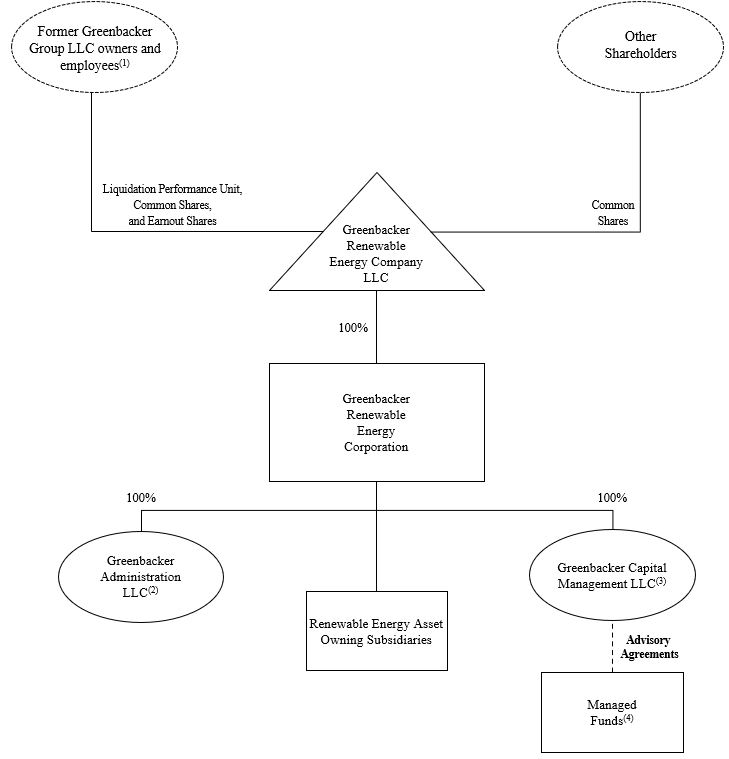
The organizational structure chart below depicts a simplified version of our structure as of the date of the filing of this Annual Report. This structure chart does not include all legal entities.
(1) Includes common shares, representing less than 1% of the Company’s outstanding shares, issued to Group LLC and held back in the event Group LLC breaches its representations and warranties under the Contribution Agreement, and until such time as the survival period specified therein expires.
(2) Held directly or through entities owned by them. Refer to Note 3. Acquisitions under the Non-Investment Basis for a summary of these interests that were issued in connection with the Acquisition.
(3)(2) Greenbacker Administration performs certain operational management, construction management, compliance and oversight services, as well as asset accounting and administrative services, for certain of our managed funds. In connection with the Acquisition, Greenbacker Administration also provides certain transitional services, which include financial and corporate recordkeeping services, to Group LLC and certain other parties. Refer to Note 14.16. Related Parties underin the Non-Investment BasisNotes to the Consolidated Financial Statements (Non-Investment Basis) for further details on these agreements.
(4)(3) GCM is ana SEC-registered investment adviser and provides investment management services to our managed funds,funds: GROZ, GDEV I, GDEV II, and GREC II.
(5)(4) We hold a 75.00% interest in the general partner of one of our managed funds, GDEV GP. The amended and restated limited partnership agreements of GDEV I provides for a 20.00% carried interest over an 8.00% hurdle, subject to side letter agreements. In addition, we hold 90.00% interest in the general partner of one of our managed funds, GDEV GP II. The amended and restated limited partnership agreement of GDEV II provide for a 20.00% carried interest over an 8.00% hurdle, subject to a side letter agreement. Refer to Note 14.16. Related Parties underin the Non-Investment BasisNotes to the Consolidated Financial Statements (Non-Investment Basis) for further details on these interests.
Management Internalization
On May 19, 2022, the Company completed the Acquisition pursuant to which it acquired substantially all of the business and assets, including intellectual property and personnel of its external advisor, GCM, an investment management and energy transition, renewable energy, energy efficiency and sustainability-related project acquisition, consulting and development company that is registered as an investment adviser under the Advisers Act, Greenbacker Administration and certain other affiliated companies. All of the acquired businesses and assets were immediately thereafter contributed by the Company to GREC. As a result of the Acquisition, the Company operates as a fully integrated and internally managed company with its own dedicated executive management team and other employees to manage its business and operations. The Company now operates with the capabilities of both an actively managed owner-operator of sustainable infrastructure and renewable energy businesses and as an active third-party investment manager of other funds within the sustainable infrastructure and renewable energy industry.
Business Overview
The Company’s business objective is to generate attractive risk-adjusted returns for its shareholders, consisting of both current income and long-term capital appreciation, by acquiring and financing the construction and/or operation of income-generating renewable energy, energy efficiency and sustainable development projects, primarily within North America, as well as by providing investment management services to funds within the sustainable infrastructure and renewable energy industry where the Company expectexpects to receive investment management and incentive fees.
The Company operates with the capabilities of both an actively managed owner-operator of renewable energy businesses and as an active third-party investment manager of other funds within the sustainable infrastructure and renewable energy industry. The Company currently operates in two reportable segments described below.
•IPP – The IPP business represents the active management and operations of the Company's fleet of renewable energy projects, including those in late-stage development and under construction. The Company's renewable energy projects generally earn revenue through the sale of generated electricity as well as frequently through the sale of other commodities such as RECs. In certain cases, the Company also serves as a minority member in renewable energy projects where it does not actively manage and operate the project but receives periodic dividends. The Company also provides loans to developers for the construction of renewable energy and energy efficiency projects as an incremental revenue stream for IPP.
The IPP business includes the direct costs to operate the Company's fleet, including costs such as operations and maintenance, repairs, and other costs incurred at the project / site level. Additionally, the Company employs a dedicated team of technical asset managers as well as a construction team to oversee the development and operations of our fleet. Such costs are recorded as Direct operating costs for IPP.
The IPP business also includes the allocable portion of the Company’s General and administrative expenses, which represents overhead functions such as: finance and accounting, legal, information technology, human resources and other general functions that support the operations of IPP.
•IM – The IM business represents GCM’s investment management platform – a renewable energy, energy efficiency and sustainability-related project acquisition, consulting and development company that is registered as an investment adviser under the Advisers Act. The IM business will also includeincludes administrative services provided by Greenbacker Administration for managed funds in the renewable energy industry as an additional revenue stream.
The Company's IM business includes the direct costs incurred for the investment management services for managed funds and other marketing and investor relation services. This includes the costs to raise and deploy capital for such funds. Such costs are recorded as Direct operating costs for IM.
The IM business also includes the allocable portion of the Company’s General and administrative expenses, which represents overhead functions such as: finance and accounting, legal, information technology, human resources and other general functions that support the operations of IM.
The segment discussion following, and included in Part II — Item 7. Management’s Discussion and Analysis of Financial Condition and Results of Operations within this Annual Report, reflects information on our business as of December 31, 20222023 and includes the impact of the Acquisition.
Independent Power Producer Segment
Our IPP segment represents the active management and operations of our fleet of renewable energy projects, including those in late-stage development and construction. Our growth strategy for the IPP segment is to continue to build a diversified portfolio of renewable energy, energy efficiency and other sustainability-related projects and businesses.
We target IPP acquisitions that generally range between approximately $1 million and $250 million. We will seek to maximize our risk-adjusted returns by: (1) capitalizing on market opportunities; (2) focusing on hard assets that produce dependable cash flows; (3) efficiently utilizing government incentives where available; (4) employing creative deal structuring to optimize capital and ownership structures; (5) partnering with experienced financial, legal, engineering and other professional firms; (6) employing sound due diligence and risk mitigation processes; and (7) monitoring and managing our portfolio of assets on an ongoing basis. We may change our acquisition strategies without prior notice or shareholder approval.
Our preferred acquisition strategy is to acquire controlling equity stakes in our target assets or to be named the managing member of a limited liability company in order to oversee and supervise its operations. We define controlling equity stakes as companies in which we own 25% or more of the voting securities of such company, have greater than 50% representation on such company’s board of directors, or as the managing member of a limited liability company. However, we will also provide financing to projects owned by others, including through the provision of secured loans which may or may not include some form of equity participation.
We from time to time also provide projects with senior unsecured debt, subordinated secured debt, subordinated unsecured debt, mezzanine debt, convertible debt, convertible preferred equity and preferred equity, and make minority equity investments. We from time to time also participate in projects by acquiring contractual payment rights or rights to receive a proportional interest in the operating cash flow or net income of a project. We may also make equity investments in or loans to parties financing the supply of renewable energy and energy efficiency to residential and commercial customers or adopting strategies that encourage energy conservation to reduce the consumption of energy by those customers. Our strategy is flexible, and we balance long-term cash flow certainty, which we can achieve through long-term agreements for our projects, with shorter-term arrangements that allow us to potentially generate higher risk-adjusted returns.
We expect to supplement our equity capital and increase potential returns to our shareholders through the use of prudent levels of borrowings, both at the corporate level and the project level. In addition to any corporate credit facility or other secured and unsecured borrowings, we use a variety of other financing methods at the project level as necessary, including but not limited to joint venture structures, back leverage loans, construction loans, tax equity bridge loans, property mortgages, letters of credit, sale and leaseback transactions, other lease transactions and other arrangements, any of which may be unsecured or may be secured by mortgages or other interests in our assets. In addition, we may issue publicly or privately placed debt instruments. When appropriate, we will seek to replace short-term sources of capital with long-term financing.
We have historically focused on solar, wind and energy efficiency projects. We believe solar energy projects generally offer more predictable power generation characteristics due to the relative predictability of sunlight over the course of time compared to other renewable energy technologies, and therefore we expect them to provide more stable income streams. However, technological advances in wind turbines and other energy-generation technologies, as well as government incentives, also make wind energy and other types of projects attractive. In 2023, the Company invested in three wind repower projects. These assets were retrofit with new and/or refurbished technology, including erecting taller, more efficient wind turbines to increase productivity. Solar energy projects provide maximum energy production during daylight hours in the summer months when days are longer and nights shorter. Conversely, wind energy projects tend to provide more energy production during nighttime hours and during the winter months thus providing a diversified production profile. Solar energy projects vary in size from hundreds of kW to hundreds of MW and tend to have minimal environmental impact, enabling such projects to be developed close to areas of dense population where electricity demand is highest.
Over time, we have broadened our strategy, and expect to continue to broaden our strategy to include other types of renewable energy projects and energy efficiency projects and businesses, which may include battery storage, hydropower assets, geothermal plants, biomass and biofuel assets, combined heat and power technology assets, fuel cell assets and other energy efficiency assets, among others, and to the extent we deem the opportunity attractive, other energy and sustainability-related assets and businesses.
As of December 31, 2022,2023, our fleet comprised 456435 renewable energy projects with an aggregate power production capacity of approximately 3.13.3 GW when fully operational, as summarized below.
4 | | | | | | | | | | | | | | |
| Technology | Number of Assets | Capacity in MW |
| Operating | Pre-Operating | Operating | Pre-Operating |
| Solar | 324 | 65 | 1,123.6 | 1,685.8 |
| Wind | 16 | 1 | 389.0 | 54.4 |
| Biomass | 1 | N/A | 12.0 | N/A |
| Battery Storage | 19 | 5 | 8.3 | 10.8 |
| Energy Efficiency | 4 | N/A | N/A | N/A |
| Total | 364 | 71 | 1,532.9 | 1,751.0 |
| | | | | | | | | | | | | | |
| Technology | Number of Assets | Capacity in MW |
| Operating | Pre-Operating | Operating | Pre-Operating |
| Solar | 285 | 119 | 834.4 | 1,812.6 |
| Wind | 16 | 1 | 386.1 | 54.4 |
| Biomass | 1 | N/A | 12.0 | N/A |
| Battery Storage | 19 | 11 | 8.3 | 14.1 |
| Energy Efficiency | 4 | N/A | N/A | N/A |
| Total | 325 | 131 | 1,240.8 | 1,881.1 |
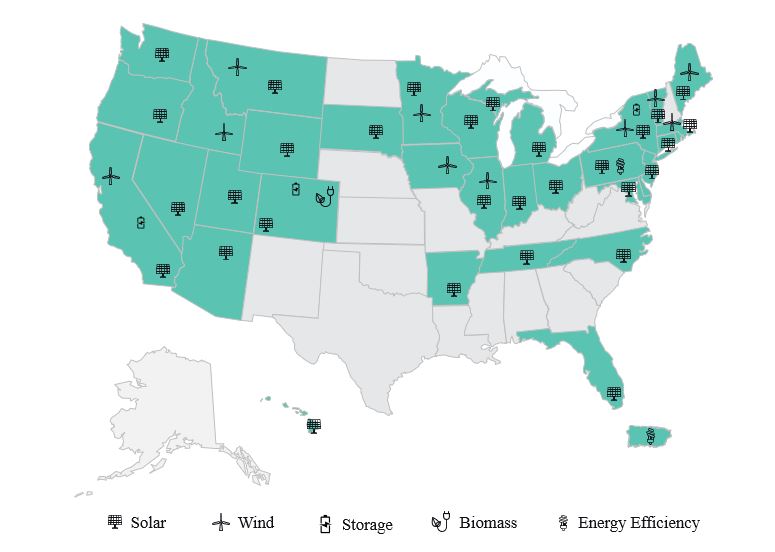
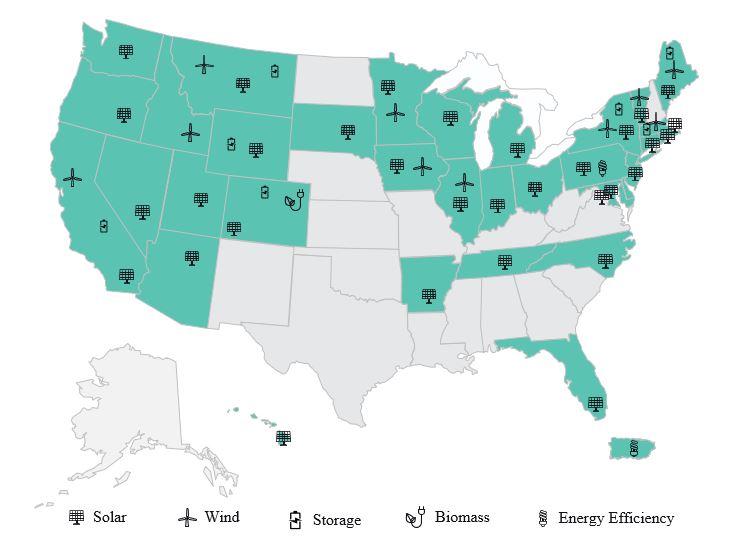
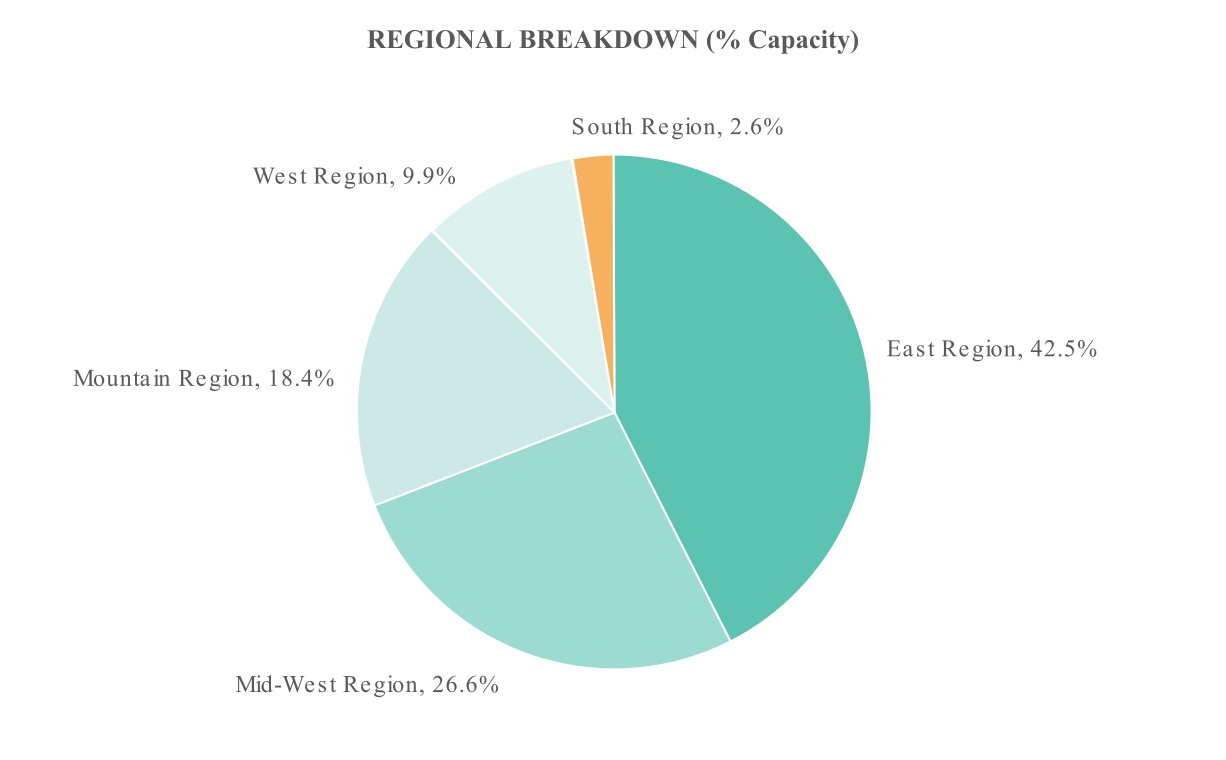
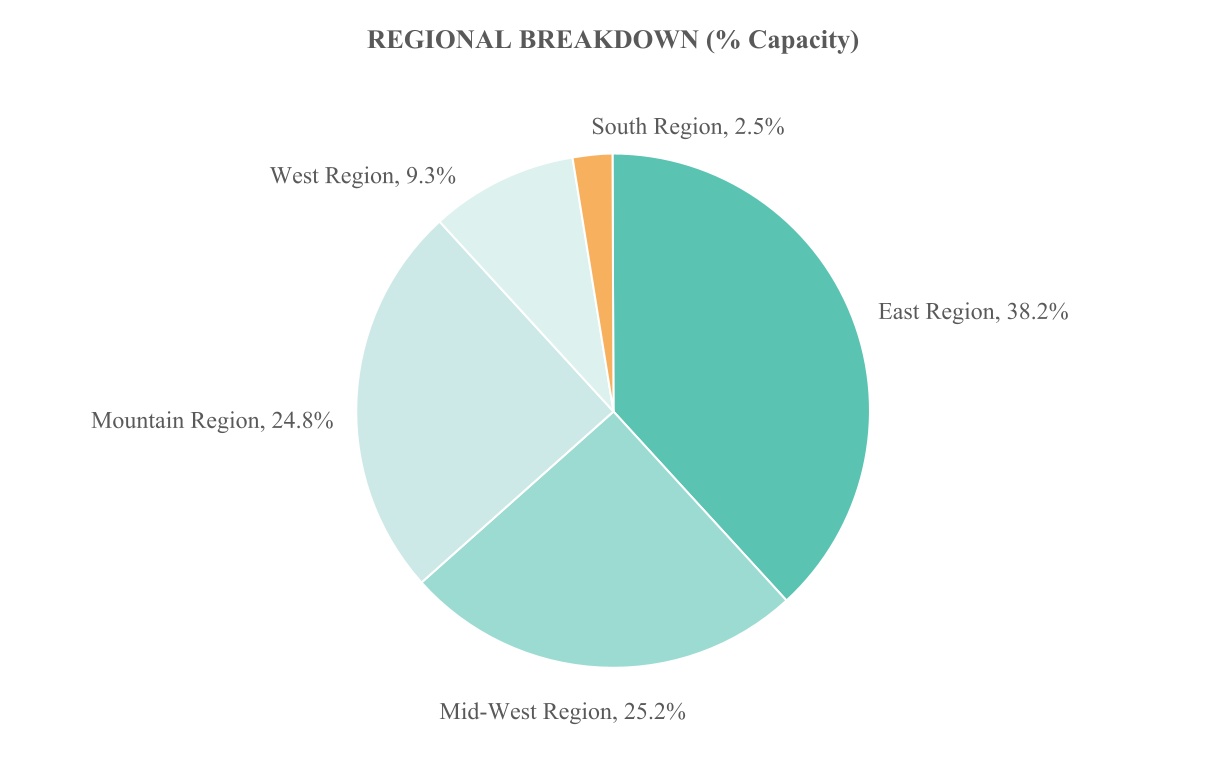
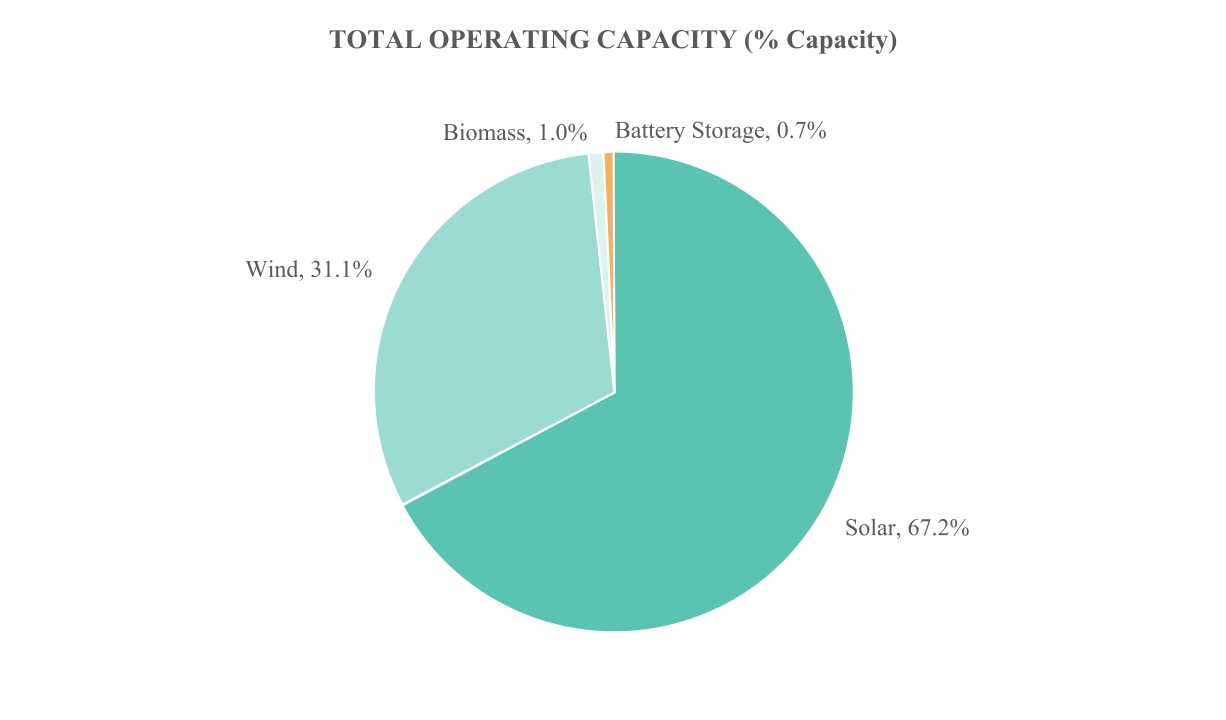
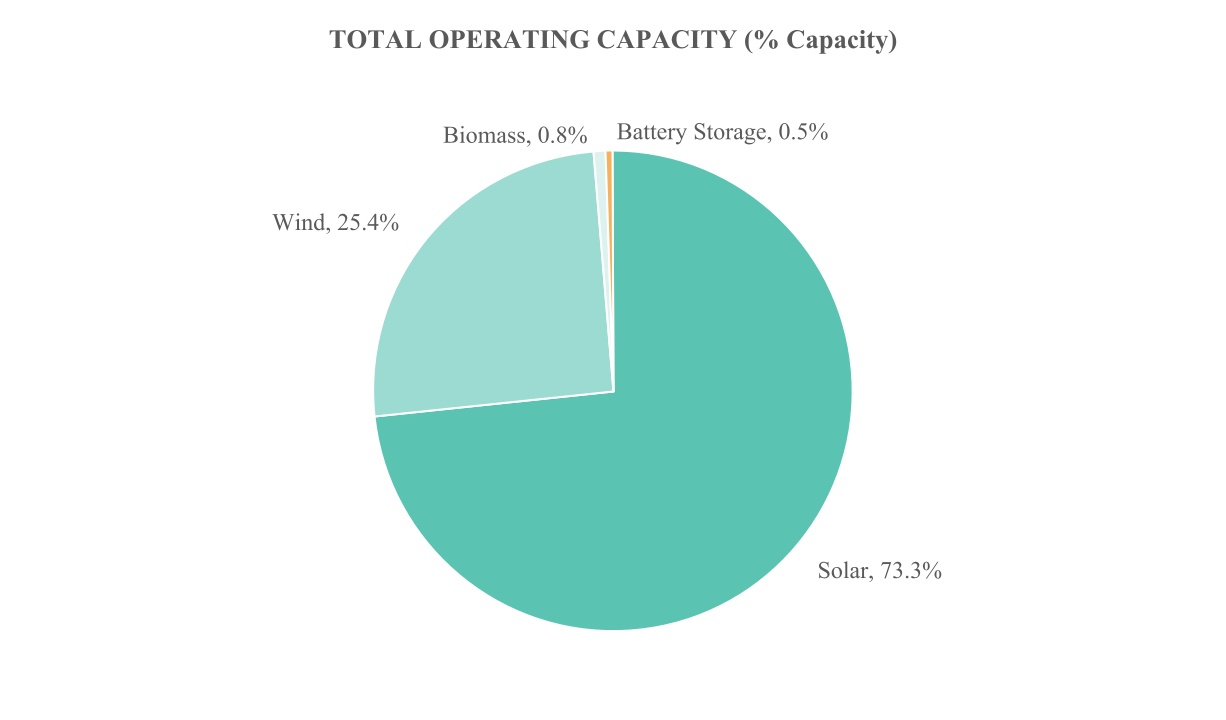
We have diversified our fleet of renewable energy projects both by industry type, as illustrated above, and geographically.As of December 31, 2022,2023, our fleet was spread across 32 states, Canada, Puerto Rico and Washington, D.C., as illustrated below.
PORTFOLIO ASSET MAP
* Solar asset in Canada is not shown on the map
| | CAPACITY BREAKDOWN | CAPACITY BREAKDOWN | CAPACITY BREAKDOWN |
| Technology | Technology | Percent capacity (%) | Size (MW) | Technology | Percent capacity (%) | Size (MW) |
| Solar | Solar | 84.8 | 2,647.0 | Solar | 85.5 | 2,809.4 |
| Wind | Wind | 14.1 | 440.5 | Wind | 13.5 | 443.4 |
| Biomass | | Biomass | 0.4 | 12.0 |
| Battery Storage | Battery Storage | 0.7 | 22.4 | Battery Storage | 0.6 | 19.1 |
| Biomass | 0.4 | 12.0 |
Our renewable energy projects generate revenue primarily by selling (1) generated electric energy and/or capacity to local utilities and high-quality utility, municipal, corporate and in the case of community solar, residential counterparties; and (2) in some cases, RECs and other commodities associated with renewable generation or related incentives. We seek to acquire or finance projects that contain transmission infrastructures and access to power grids or networks that will enable the generated power to be sold. We generally expect our projects will have PPAs with one or more counterparties, including local utilities or other high-credit-quality counterparties, who agree to purchase the electricity generated from the project. We refer to these PPAs as “must-take contracts,” and we refer to these other counterparties as “offtakers.” These must-take contracts in general are output-based and guarantee that all electricity generated by each project will be purchased.
As of December 31, 2022,2023, the PPA contracts in our existing operating fleet have approximately 18 weighted average years remaining prior to exposure to market prices.
Although we intend to work primarily with high-credit-quality counterparties, if an offtaker cannot fulfill its contractual obligation to purchase the power, we generally can sell the power to the local utility or other suitable counterparty, which would potentially ensure that revenue is generated for all solar electricity generation. We may also generate revenue from the receipt of interest, fees, capital gains and distributions from investments in our target assets.
We employ a rigorous credit underwriting process for each of our contractual counterparties, including: (1) identification of high-credit-quality counterparties with appropriate bonding and insurance capacity; (2) where available, the review of counterparty financial statements and/or publicly available credit rating reports; (3) worst-case analysis testing of assets; and (4) ongoing monitoring of acquired assets and counterparty creditworthiness, including monitoring the public credit ratings reports issued by Moody’s and Standard and Poor’s.
Our PPAs, when structured with utilities and other large commercial users of electricity, are generally long-term in nature, tied to 100% of the output of the specific generating asset. Although we focus on projects with long-term contracts that ensure
price certainty, we may also look for projects with shorter-term arrangements that will allow us to participate in market rate changes, which may lead to higher current income.
A number of the PPAs for our projects are structured as “behind-the-meter” agreements with residential, commercial or government entities. Under the agreements, all electricity generated by a project will be purchased by the offtaker at an agreed-upon rate that may be set at a slight discount to the retail electric tariff rate for the offtaker. These agreements also typically provide for annual rate increases over the term of the agreement, although that is not a necessary requirement. The behind-the-meter agreement is generally long termlong-term in nature, and further typically provides that, should the offtaker fail to fulfill its contractual obligation, in some cases electricity that is not purchased by the offtaker may be sold to the local utility, usually at an equivalent wholesale spot electric rate, more typically the projects would have remedies available in terms of make whole and termination provisions that seek to satisfy the required economics of the deal.
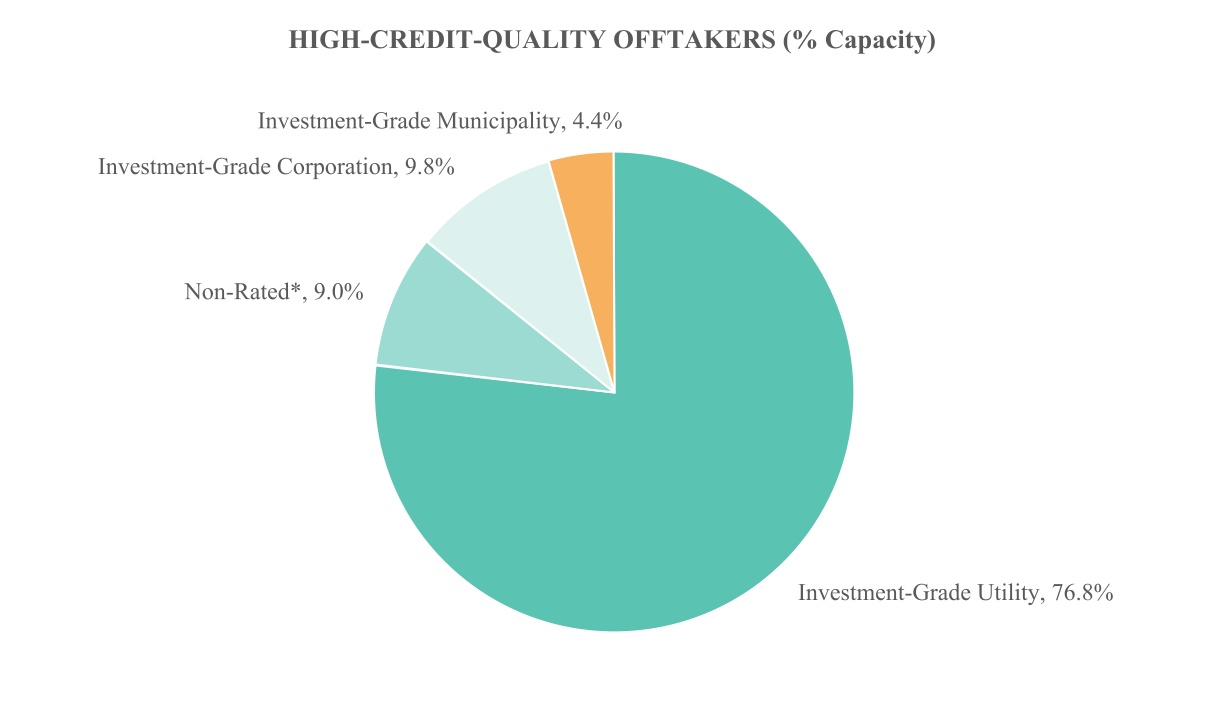
The following chart illustrates the allocation by percentage of the Company’s contracted offtakers by counterparty type and creditworthiness as of December 31, 2022:2023:
* Non-rated offtakers are unrated by credit rating agencies.
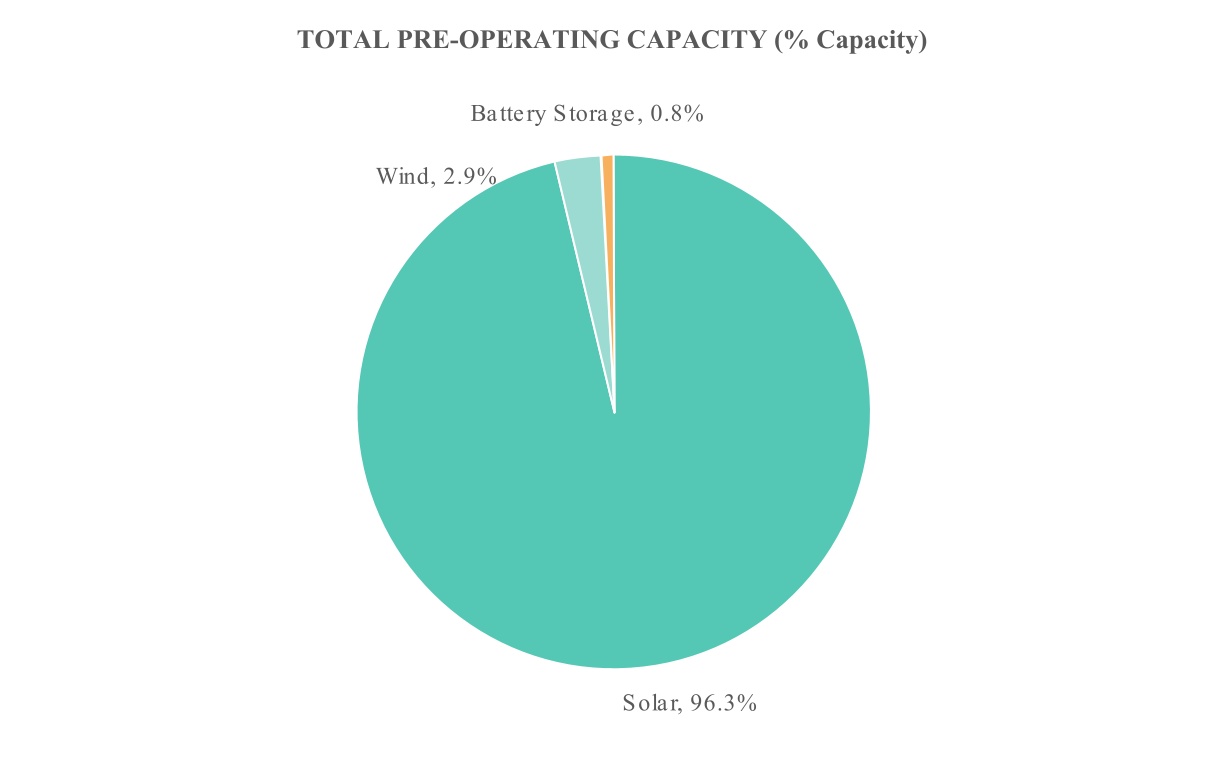
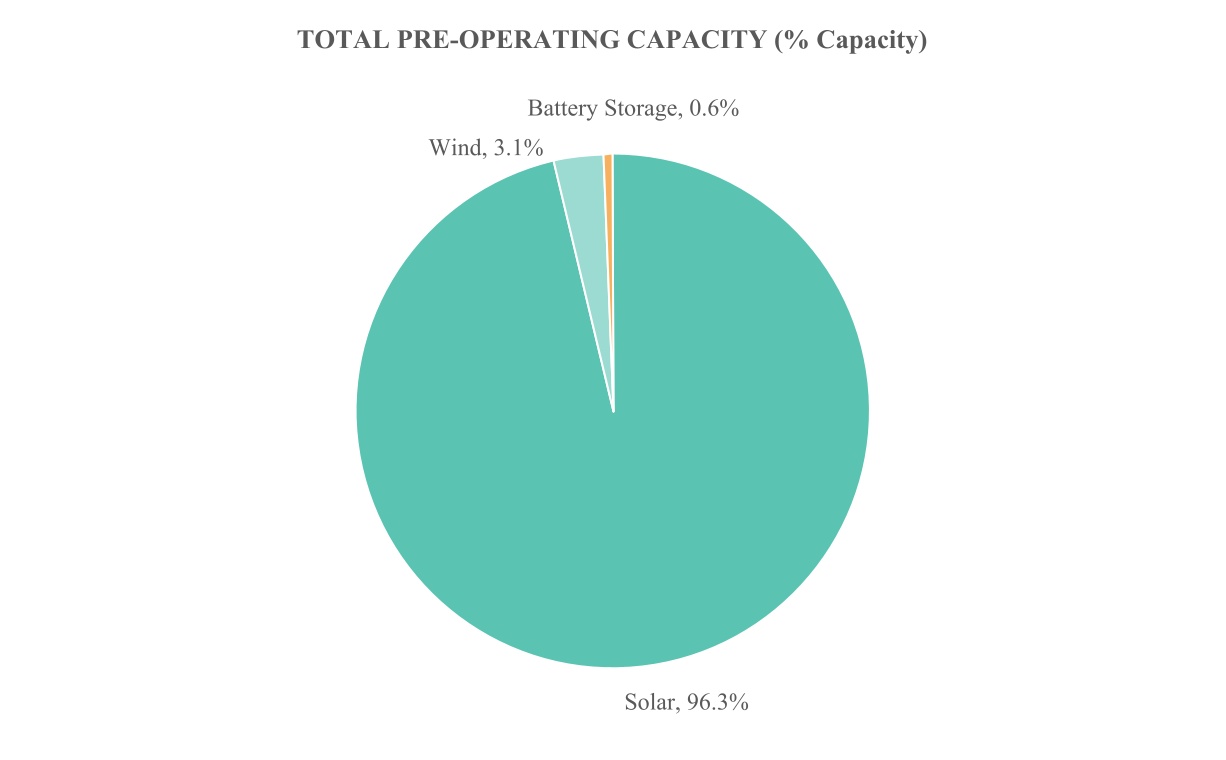
Acquisition of Pre-Operating Assets
We believe that the hallmark of a successful acquisition strategy is the ability to take advantage of new opportunities and adjust to changing market conditions. Over the years, the Company observed an increase in the opportunities to participate in projects that were largely similar to our operating assets in terms of the long-term risks, but which promised additional returns if we could manage additional risks in the early stages of the investment lifecycle. As a result, we expanded our investment capabilities to include four basic investment categories:
1.Operating Assets – We will continue to acquire and invest in solar, wind and other alternative energy assets that are already in commercial operation and generating investment returns through the sale of contracted electricity and environmental attributes.
2.Assets before their COD – We will also purchase assets that have been constructed by developers but have not been placed in service. Functionally these assets are generally ready to generate electricity but have not reached a milestone known as PTO with the local utility or COD. While we have determined that a modest investment premium could be obtained by investing before PTO and COD, most importantly the term of the contracted cash flows is maximized through this strategy.
3.Assets at NTP – We further determined that we could invest in assets that had not yet been constructed but that had received substantially all of the contracts necessary to operate and permits necessary to begin construction, a milestone
known as NTP. While potentially riskier than operating or pre-COD projects due to the level of construction risk, we believe that the additional return associated with these projects more than compensates for the additional risk. Furthermore, when we invest in NTP assets we generally have the added benefit of having more control of equipment selection and implementation of construction best practices, which positively affects the long-term performance of our plants. With the continued growth of the renewable energy market, driven by increases in the level of Renewable Portfolio Standards in several states and the recent passage of the IRA, we identified a significant number of NTP transactions coming to market and an opportunity to develop strong pipeline-type relationships with the developers of these projects. Besides increasing returns to investors, this has enabled management to substantially increase our access to a proprietary pipeline of sound projects.
4.Special Situations – We also determined there are market opportunities for selected projects driven by either technical or financial issues, either at the project or owner level, that can be resolved by accessing the broad range of expertise we have in-house to deal with our day-to-day operations. Therefore, we determined that on a limited basis we would make investments that have these characteristics, since by resolving the issues, we have the potential to generate attractive returns. We believe that the number of these “distressed” assets may increase materially over the coming years.
In order to execute this broader investment strategy, we have built a dedicated team of technical asset management professionals. We now have a team of experienced engineers, operations and maintenance experts, and construction professionals, which enabled us to expand our investment focus into these additional categories of investment. In addition to the expansion of our current investment strategy as laid out above, havehaving a team of experienced engineers and construction managers increases our ability to extract revenue from aging renewable energy assets through repowers and plant optimization. Having access to this level and breadth of expertise is a major competitive advantage for us in the marketplace.
Strategic Considerations of Acquiring NTP Projects
We believe that acquiring renewable energy projects across the four categories discussed above provides the best opportunity for us to generate attractive returns over the medium term, diversify our portfolio, and create a proprietary pipeline of sound investment opportunities for future growth. The downside of this approach is that investing in pre-operational solar and wind projects has a negative impact on near-term cash flows as material amounts of our capital is invested in non-yielding assets. To minimize the downside effects of the strategy, management continues to explore more sophisticated financing tools to enable us to direct more of our investable capital into current income-generating investments going forward. As the size of our portfolio grows, our ability to access the more sophisticated financial products increases.
Our Financing Strategy
We supplement our equity capital and increase potential returns to our shareholders through the use of prudent levels of borrowings both at the corporate level and the project level. The Company's Fifth Operating Agreement does not impose limitations on the amount of borrowings we may employ, either at the corporate level or the project level. Our current policy is to generally target a leverage ratio of up to $2 of debt for every $1 of equity on our overall acquisition strategy for IPP, with individual allocations of leverage based on the mix of asset types and obligors; however, we will in no event exceed a leverage ratio of $3 of debt for every $1 of equity, unless any excess is approved by a majority of our independent directors. In addition to any corporate-level credit facility or other secured and unsecured borrowings, we expect to use other financing methods at the project level as necessary, including joint venture structures, back leverage loans, construction loans, tax equity bridge loans, property mortgages, letters of credit, sale and leaseback transactions, other lease transactions, and other arrangements, any of which may be unsecured or may be secured by mortgages or other interests in our assets. In addition, we may issue publicly or privately placed debt instruments. Our indebtedness may be recourse or non-recourse and may be cross-collateralized. In addition, we may invest in assets subject to existing liens, or may refinance the indebtedness on assets acquired on a leveraged basis. We may use the proceeds from any borrowings to acquire assets, refinance existing indebtedness, finance investments, fund distributions or for general corporate purposes. In addition to these financing methods, we may utilize tax equity structures to monetize U.S. federal income tax attributes.
General Market Overview for Alternative Energy Projects
The U.S. electric consumer expects a virtually error-free, consistent supply of sufficient electricity at all times for all purposes. The U.S. power industry, which includes energy generation and transmission, is structured to ensure sufficient, constant supply of energy to all end-users to meet varying demand requirements on a minute-by-minute basis. Historically, the mix of electricity supply was dependent largely on fossil fuels such as coal and natural gas as well as nuclear and hydroelectric power. However, this is changing rapidly due to the rise of renewable energy and the ongoing electrification of the transportation fleet. According to the EIA, as late as 2014, fossil fuels such as coal, petroleum and gas supplied about 67%more than half of
the U.S.’s energy requirements.power generation mix in past years. Since then, however, there has been a shift in the mix of energy sources highlighted by a substantial rise in renewables, which grew to 22% of the U.S. power generation mix in 2022.2023. The EIA expects this trend to continue, estimating that in 20232024 renewables will rise to 24% of the U.S.’s power generation mix, (and continuebefore increasing to increase26% in 2024).2025. The advanceadvancement of renewable energy has also created new opportunities in adjacent energy transition investments including energy storage and grid enhancements. Furthermore, advances in electric vehicle adoption have created a substantial need for investment in charging stations and other related infrastructure.
According to BloombergNEF (“BNEF”), renewable energy, which includes wind, solar, biofuels, and other renewables, remained the largest sector in investment terms, achieving a new record of $495 billion committed in 2022, up 17% from the year prior.1
We believe that renewable energy and the energy transition are poised to gain even more market share, driven by several supportive trends:
The decline of coal. The U.S. coal industry is rapidly declining — the EIA expects coal-burning plants will account for the majority of retiring utility scale power generation in 2023 — in the face of lower-cost natural gas and renewable energy, as well as regulations designed to reduce greenhouse gas emissions and protect public health. Coal burning power plants accounted for the majority of retiring utility scale power generation in 2023, and the EIA expects coal production to drop by 19% in 2024, as both consumption and inventories decrease.
Falling price of renewables and storage. The cost of renewable energy and energy storage has fallen substantially over the past decade, making renewable energy the lowest-cost provider of new generation in many markets.
State mandates. States' clean energy goals and mandates to use more renewable energy sources have contributed to the historic growth of renewables and are likely to drive further growth.
Federal support. Availability of government policy and other financial incentives for building new renewable capacity has supported the case for renewables when they were priced. This includes the passage of the IRA.
Environmental concerns. Reliance on fossil fuels has resulted in excessive production of harmful greenhouse gas emissions, which has been identified as one of the major causes of global climate change and numerous other environmental issues. This has led to growing support among the voting public for an energy transition based upon renewable energy.
The result of these and other factors is that renewable energy has gone from being a niche player in energy markets to being widely perceived as the present and future of energy generation in the United States.U.S. We anticipate that these trends will continue accelerating the growth of renewable energy, particularly solar and wind for power generation and batteries for storage.
The U.S. Renewable Energy Industry Has Been a High-Growth Market
The market for renewable energy has grown rapidly over the past decade. According to the EIA, renewables will now accountaccounts for 24%22% of U.S. electric generation in 2023. In 2022,2023, renewable energy sources generated over 1,087868 billion kWh of electricity and are expected to generate more than 1,109981 billion kWh of power in 2023.2024, before increasing further to 1,062 billion kWh in 2025.
The U.S. Renewable Energy Industry Is Expected to Be a High-Growth Market for Decades
We believe that demand for renewable energy will continue to grow as countries seek to reduce their dependence on outside sources of energy, and as the political and social climate continues to demand social responsibility on environmental matters. The EIA anticipates that consumption of renewable energy and the need for additional battery storage will grow significantly by 2050, supported by decreasing technology costs, as well as wind and solar incentives.
Energy Transition Investments Have Grown Substantially and Are Expected to Continue
According to BNEF, annual global investment in the energy transition has more than quadrupled in the past decade, reaching new heights each year of that period. In 2022,2023, energy transition investments topped $1reached a record-high $1.8 trillion, for the first time, significantly surpassing the previous record of $849 billion$1.1 trillion in 2021.2022.
Tax Equity Capital Sources in the Renewable Energy Market
Our ability to raise capital from tax equity investorsTax Equity Investors and lenders on competitive terms to help finance the development, construction, and operations of our projects will be a significant driver of our further growth. We have historically used a
1 Global Low-Carbon Energy Technology Investment Surges Past $1 Trillion for the First Time - BloombergNEF
variety of structures including tax equity financing, construction loan financing, tax equity bridge loan financing, back leverage loan financing, and subordinated non-recourse financing to help fund our operations. Our ability to raise capital from tax equity investorsTax Equity Investors and lenders is also affected by general economic conditions, the state of the capital markets, inflation levels, and concerns about our industry or business. See “LiquidityRefer to Part II — Item 7. Management’s Discussion and Analysis of Financial Condition and Results of Operations — Liquidity and Capital Resources” belowResources within this Annual Report for further details on capital raising and the effective management of our capital structure.
Tax equity is an important source of financing for renewable energy projects. The federal government first introduced renewable energy tax credits with the Energy Tax Act of 1978, with the aim of supporting sustainable energy infrastructure and reducing dependence on foreign and non-renewable energy sources. The Act allowed businesses and individuals to reduce their tax bills by a percentage of the amount they spent on qualified investments in property and equipment for solar and wind energy (up to certain limits). These tax benefits have expanded in the decades since, and today the federal government offers renewable energy investors larger tax credits, along with other incentives. The wide appeal of these tax benefits has given rise to a robust tax equity market with sophisticated capital market participation. A tax equity investor — which could be a financial institution, insurance company or corporation — contributes capital based on construction milestones in exchange for a share of the tax credits (and other tax benefits such as accelerated depreciation) and cash flows generated by a qualifying physical investment.
There are two main tax federal credits provided for renewable energy projects:
1. ITC: This tax credit is equal to 30% of a renewable energy or energy storage project’s eligible cost.
2. PTC: This tax credit, currently stands at 2.62.75 cents per kWh of electricity generated during the first 10 years of operation.
In general, our tax equity investments are structured using the "partnership flip"“partnership flip” structure. Under partnership flip structures, we and our tax equity investorsTax Equity Investors contribute cash into a partnership to fund the acquisition of renewable energy or energy storage systems. Upon the satisfaction of certain conditions precedent, tax equity fund commitments become available. The conditions precedent to funding vary across our tax equity funds but generally require that we have entered into a PPA with a credit worthy off taker,offtaker, the renewable energy system is expected to be eligible for the Section 48(a) ITC or Section 45(a) PTC, there is a recent appraisal from an independent appraiser establishing the fair market value of the renewable energy system, certain construction milestones are met and verified by an independent engineer and the property is in an approved state or territory. Initially, the tax equity investor receives substantially all of the non-cash value attributable to the renewable energy systems and energy storage systems, which includes accelerated depreciation and Section 48(a) ITCs or Section 45(a) PTC;PTCs; however, we typically receive a majority of the cash distributions, which are generally paid quarterly. These allocations then flip once certain time or yield basedyield-based milestones are met. Time basedTime-based flips occur on a set date after a five-year recapture period while yield basedyield-based flips occur after the tax equity investor achieves a specified return typically on an after-tax basis. After the flip occurs, we receive substantially all of the cash and tax allocations.
Current Competition in the Alternative Energy — Solar Marketplace
The solar financing market started as a cottage industry where developers would bring together high-net-worth investors to fund single solar and wind transactions. Though successful in jump starting the industry, true capital formation is a relatively new phenomenon and is not as well developed as in other asset classes. Currently in the renewable energy — marketplace, there are several sources of capital:
•Developer/Owner Operators. The major competition we face in the market for the assets we target comes from privately backed developer/owner operators. The capital from these organizations has generally been sourced from a combination of family offices/private equity funds and hedge funds. These organizations are generally set up as developers, with investment return expectations in the 20%-30% range.
However, to facilitate the most favorable exit for the sponsors, the developer/owner operators seek to accumulate a significant portfolio of operating assets to provide a base level of stable and predictable earnings for the enterprise. Through a combination of developer profits and leverage they can generate satisfactory ongoing returns, with the bulk of the upside being generated for the sponsors through the exit. Particularly in circumstances where equity markets experience a downturn, we are of the opinion this group of buyers will ultimately be capital constrained.
•Single-Purpose Limited Partnerships. These entities are typically funded by high-net-worth individuals or family offices and are generally focused on a small number of deals, as they have a limited amount of capital to invest.
•Institutional Investors and Utilities. Comprised of large life insurance companies, pension funds, infrastructure funds, and large public utilities. This sector dominates investment in the larger projects (e.g., $100.0 million or
greater). We tend not to encounter this group in our middle market Commercial and Industrial (“C&I”) sector but do see these players when targeting the larger projects in our portfolio.
In management’s view, the Company has been competitive in bidding for solar assets against all these sources of capital and maintains a significant pipeline of deals which can be consummated as offering proceeds are raised.
Opportunities in Solar Power Today
Solar is again expectedcontinues to be the leadingfastest-growing renewable energy source, with the EIA expecting a 38% increase in installed capacity during 2024, increasing total capacity from 95 GW to 131 GW by the end of new utility scale capacity in 2023, accounting for 54% of new electric-generating capacity.the year.
We believe that the greatest opportunity exists within the smallmiddle market utility scale, as well as the large commercial solar and community solar sectors of the market. In the smallmiddle market utility scale market, the Company can buy assets with similar commercial attributes to the large utility scale projects —(e.g., investment-grade offtaker, same equipment and warranties, same operations and maintenance service provider —provider) but where returns are higher.
We have also noted a growing trend among U.S. corporations to work with developers and financiers to provide renewable power for their operations. Driven by a desire to save money, create certainty around long-term electricity prices and support green marketing initiatives, the C&I sector is rapidly becoming one of the most exciting parts of the renewable energy project market. These deals tend to be smaller than utility scale solar, which fits well with our strategy of focusing on the middle market sector of the industry.
A number of U.S. states have adopted programs that encourage the development of community solar projects, where groups of companies, municipalities and individuals can buy renewable power from solar and wind plants that are located within the customers' utility zone. While there are certain complexities associated with such projects, we are closely monitoring the rapid growth of this sector.
In our view, there is a significant opportunity to aggregate portfolios of high-quality small utility scale, commercial solar and community solar projects that have experienced developers looking for a reliable and sustainable source of capital to increase the certainty of their closing transactions. As a result, we have been focusing on building relationships with respected developers with a view toward acquiring pipelines of projects rather than one-off deals.
By working closely with developers to efficiently close their transactions, we are seeking to create a sustainable competitive advantage which will lead to recurring and consistent deal flow. Importantly, our strategy is differentiated from the developer/owner operators mentioned above, because we do not seek to compete with the developers. Rather, we work with developers so that they can focus their activities on development while we focus on the financing and long-term ownership of their developed assets. This symbiotic alignment of interests has proven to be mutually beneficial.
Current Competition in the Alternative Energy — Wind Marketplace
We believe that market conditions remain favorable for wind development and, according to the EIA, the U.S. wind industry already has 6.0is expected to add 7 GW of new wind capacity scheduled for 2023.in 2024. Particularly for smaller middle market transactions involving assets similar to those in our current portfolio, we believe that we will continue to be competitive in bidding for wind assets. We also believe that we may see opportunities to purchase operating wind assets which have run through their tax credits.
Opportunities in Wind Power Today
We believe that the middle market segment presents the best opportunities for investment. This sector faces less competition for assets than the large utility scale sector, which tends to be highly competitive. Furthermore, we believe that targeted investments in select wind opportunities provide us with increased diversification of cash flows stemming from the fact that wind assets tend to perform better in the winter months, while solar tends to perform better in the summer months.
We believe that this countercyclical diversification is highly beneficial in managing our cash flows throughout the year. We also believe that we are well positioned to find target assets in this sector. In the past two years alone, we have acquired over 200275 MW of wind assets. These purchases have enabled us to build relationships with respected developers, with whom we may be able to work with in the near future.
General Market Overview for Battery Storage
According to Mercom Capital, in 2022, annual corporate funding in the battery storage sector reached a record high $26.7$26.4 billion across more than 120 deals, marking an increase of 55% from the $17 billion seen in 2021. This was2021 driven by falling costs, particularly in certain battery chemistries such as lithium-ion. AccordingIn the first nine months of 2023, corporate funding for battery storage exceeded $15 billion, putting it on track to make the second highest total annual investment behind 2022. Moreover, venture capital funding in the energy storage space reached a recent analysis by Lazardrecord high $9.2 billion across 86 deals in its “Levelized Costthe year ended 2023, an increase of Storage Analysis (LCOS 6.0)59%,” storage costs have declined across most use cases and technologies, particularly for shorter-duration applications. In addition, long-duration compared to 2022. Long-duration storage has been gaining particular traction as a commercially viable solution to challenges created by intermittent energy resources such as solar or wind. Additionally, under the IRA—and for the first time ever—standalone projects are now eligible for the 30% ITC.
Due to its potential for rapid growth, as well as new state mandates and rapidly falling costs for both short-term and long-term storage, we believe battery storage represents a large and growing investment opportunity for the foreseeable future.
Investment Management Segment
Our IM segment represents GCM’s investment management platform –— a sustainable infrastructure, renewable energy, energy efficiency and sustainability-related asset management company that focuses on project acquisition, financing, consulting and development and that is registered as an investment adviser under the Advisers Act. The Company believes that the IM business will enable it to further diversify its revenue streams through investment management and certain administrative services for investment funds on behalf of external stakeholders whichthat invest in adjacent areas of the sustainable infrastructure space. GCM’s platform will allow the Company to raise and deploy capital for the managed funds, – consistent with our overall mission and expanding our ability to positively impact social and environmental challenges.
Since inception, GCM’s management team has developed significant commercial relationships and capital raising processprocesses across multiple industries that we can continue to develop and grow. Both the IPP business and IM business have complementary growth strategies that will continue to provide the Company with diversification in its revenue streams, as well as givinggive us several alternate ways of raising capital, decreasing our reliance upon public capital markets for growth. Additionally, we expect that the combination will enable the Company to benefitcontinue benefiting from cost savings through the sharing of overhead and through the elimination of management fees that were formerly being charged to the Company by its external investment manager. We believe that this has the potential to result in an increase in the value of the Company, as the fully integrated and internally managed company will representrepresents a platform that can take advantage of many market opportunities while at the same time reducing the Company's overhead and increasing its profitability through the inclusion of IM revenue streams.
The services performed by our IM business include capital raise and deployment, marketing, and other investor relations functions, as well as technical asset management, finance and accounting, and other administrative serviceservices for managed funds in the sustainable infrastructure renewable energy industries.
The primary source of IM revenues are management fees earned. Management fee revenue earned by our IM business areis generally based upon the underlying net asset value of the managed funds for which GCM provides investment management services. For certain of our IM customers, the Company is also eligible to receive certain performance-based incentive fees.
An additional revenue source for IM will include, for certain managed funds, administrative services performed by Greenbacker Administration. These services include technical asset management, finance and accounting, legal and other costs incurred by the Company in performing its administrative services. GCM managed funds will be charged their allocable portion of such costs with no margin.
Prior to the Acquisition, GCM served as the external manager of four investment entities –— the Company, GROZ, GDEV I, and GREC II. The Advisory Agreement between GCM and the Company was terminated in connection with the Acquisition. However, the Company continues to provide, through GCM, investment management services to GROZ, GDEV I and GREC II as a result of the acquisition of GCM. In addition, the Company now provides, through GCM, investment management services to GDEV II. A summary of the managed funds is included below.
In addition, the Company launched its fourth sustainability driven investment strategy during the year ended December 31, 2023. The new strategy focuses on acquiring energy transition real estate where the Company can leverage access to power to host distributed generation, storage and charging infrastructure.
Greenbacker Renewable Opportunity Zone Fund
GROZ is an investment vehicle dedicated to investing in renewable energy investment opportunities that are located within “Qualified Opportunity Zones” as designated by the Internal Revenue Service, in order to capture the potential growth from, and the advantages offered under, the JOBS Act. Qualified Opportunity Zones target lower income communities in the United States that,U.S., with capital investment, have significant potential for economic development and job creation. GROZ is now closed to new investment.
Base management fees under GCM's advisory fee agreement with GROZ are calculated at a monthly rate of 0.125% (1.50% annually) of the average gross invested capital for GROZ. The Company is also eligible to receive certain performance-
basedperformance-based incentive fee distributions from GROZ, including upon liquidation of GROZ, subject to certain distribution thresholds as defined in the amended and restated limited liability company operating agreement of GROZ.
Greenbacker Development Opportunities Fund I & II
In October 2020, GDEV was launched to make private equity and development capital investments in the sustainable infrastructure industry. GREC’s investment in GDEV is synergistic with the Company’s core business, and it is expected to help retain and strengthen existing project developer relationships, increase the number of developer relationships that do business with the Company going forward, generate incremental investment opportunities for the Company and give the Company insights into new markets and trends within the industry. GDEV B was launched in March 2022 as a parallel fund to GDEV.
As the initial investor, GREC was awarded a 10.00% carried interest participation in GDEV GP, GDEV I’s general partner. The amended and restated limited partnership agreements of GDEV I provide for a 20.00% carried interest over an 8.00% hurdle, subject to side letter agreements. On May 19, 2022, the Company acquired a 75.00% equity interest stake in GDEV GP.
In conjunction with the Acquisition and specifically the acquisition of a 75.00% equity interest in GDEV GP, the Company also assumed GDEV GP's additional commitment to GDEV and gained control over GDEV GP. Additionally, the Company through the GDEV GP’s role as general partner of GDEV, assumed operational control over GDEV. As a result of the Company consolidating GDEV during the period from May 19, 2022 through November 17, 2022, the management fee revenue earned under the advisory agreement with GDEV was considered intercompany revenue and is therefore eliminated in consolidation. On November 18, 2022, GREC sold its investment in GDEV to an unrelated third party. As of December 31, 2022,2023, GDEV GP held 3.70%2.80% of the interests in GDEV. The Company has determined that it no longer has the obligation to absorb losses of GDEV, nor the right to receive benefits from GDEV that could be potentially significant to GDEV, and therefore, no longer consolidates GDEV. As a result of the deconsolidation of GDEV on November 18, 2022, management fee revenue is no longer eliminated and is recorded on the Consolidated StatementStatements of Operations.
In March 2022, GCM closed GDEV I to new investors and in November 2022, launched a successor fund called GDEV II, which also aims to makemakes private equity and development capital investments in the sustainable infrastructure industry. The Company receives management fees from GDEV I based on the aggregate cost basis of all portfolio securities, management fees from GDEV II based on committed capital, as well as certain performance-based incentive fees from GDEV II.
Greenbacker Renewable Energy Company II, LLC
GREC II was launched in May 2022 and is an investment vehicle that intends to acquire, ownacquires, owns and operateoperates renewable energy projects with an emphasis on up-and-coming areas of the energy investment sector, including battery storage, mobility and other related investments. GREC II is structured as a total return vehicle which is expected to prioritize long termlong-term internal rates of return over near-term cash yields. GREC II intends to deploydeploys into pre-construction and operating renewable energy projects, as well as energy efficiency, battery storage, mobility and other related investments. The Company is eligible to receivereceives management fees, as well as certain performance-based incentive fees and administrative fees from GREC II under the advisory agreement. Due to GREC II’s early stage of development, the Company did not record any management fees under the advisory agreement during the period from May 19, 2022 through December 31, 2022.
Refer to Note 14.16. Related Parties underin the Non-Investment BasisNotes to the Consolidated Financial Statements (Non-Investment Basis) for further details.
General Market Overview for Investment Management
While there continues to be turmoil in the public equity and debt markets, and therefore headwinds in the investment management industry in general, alternative investment managers experiencedcontinue to experience strong capital inflows as investors lookedlook to diversify away from public stocks and bonds and towards investments in alternative strategies that they judge to be less correlated to public market movements, despite the downward trends in the fourth quarter of 2022. According to Robert A. Stanger and Company,movements. Indeed, through December 2023, fundraising for non-traded alternative investments totaled a record $104 billion; a 23% increase over 2021.nearly $73.1 billion, according to Robert A. Stanger and Company.21 Despite the challenging market conditions, we believe there is an opportunity for higher investment returns due to less competition in the marketplace and, more recently, some of the macro factors have moved in our favor; such as interest rates, which have fallen from their highs in 2023.
Seasonality
Certain types of renewable power generation may exhibit seasonal behavior. For example, wind power generation is generally stronger in winter than in summer as wind speed tends to be higher when the weather is colder. In contrast, solar power generation is typically stronger in the summer than in the winter. This is primarily due to the brighter sunshine, longer days and shorter nights of the summer months, which generally result in the highest power output of the year for solar power. Because these seasonal variations are relatively predictable for these types of assets, we factor in the effects of seasonality when
2Non-Traded Alternative Investments Raised Record $104 Billion in 2022, The DI Wire, January 20, 2023
analyzing a potential acquisition in these target assets. Therefore, the impact that seasonality may have on our business, including the income from our renewable energy projects, will depend on the diversity of our acquisitions in renewable energy, energy efficiency and other sustainability-related projects in our overall portfolio. However, to the extent our acquisitions are concentrated in either solar or wind power, we expect our business to be seasonal based on the mix of renewable power generation technology.
Overview of Significant Government Incentives
The renewable energy and energy efficiency sector attracts significant U.S. federal, state and local government support and incentives to address technical barriers to the deployment of renewable energy and energy efficiency technologies and to promote the use of renewable energy and energy-saving strategies. These U.S. federal, state and local government incentives have historically functioned to increase (1) the revenue generated by, and (2) the equity returns available from, renewable energy projects. Energy efficiency projects are also eligible to receive government incentives at the U.S. federal, state and local levels that can be applied to offset project development costs. Governments in other jurisdictions also provide several types of incentives.
Corporate entities are eligible to receive benefits through tax credits, such as PTCs, ITCs, tax deductions, accelerated depreciation and U.S. federal grants and loan guarantees (from the U.S. Department of Energy, for instance), as described below.
The following is a description of certain U.S. federal and state government incentives, which we may utilize in executing our business strategy.
U.S. Federal Incentives
Corporate Depreciation: Modified Accelerated Cost Recovery System (“MACRS”)
Under MACRS, owners of renewable energy and some energy efficiency projects can recover capital invested through accelerated depreciation, which reduces the payment of corporate tax. Bonus depreciation under Section 168(k) of the Internal Revenue Code was extended and modified by the Tax Cuts and Jobs Act of 2017 (“TCJA”). Businesses can now immediately deduct 100% of the cost of eligible property in the year it is placed in service, through 2022. For property placed in service in 2023, the bonus depreciation percentage will drop to 80%, and then phase down by 20% each year until it expires after 2026. Also, the TCJA eliminated the rule that made bonus depreciation available only for new property. The changes in the TCJA provided more flexibility than the prior bonus depreciation rules in that they permit a taxpayer to depreciate an asset that is not new; however, the asset must be acquired from a third party in an arm’s-length sale.
Inflation Reduction Act
On August 16, 2022, U.S. President Joe Biden signed the IRA into law, ratifying the most significant climate legislation in U.S. history. The IRA’s $369 billion federal package is designed to enhance U.S. energy security, reduce greenhouse gas emissions, increase domestic development, employment, and investment in the clean energy sector, and ultimately tackle the climate crisis. This landmark legislation makes decarbonization a national priority of the United States and serves as an acknowledgement of the urgency of the global climate crisis.
1Non-Traded Alts on Pace to Raise $70 Billion in 2023 Says Stanger - The DI Wire, January 26, 2023
According to Princeton University's Rapid Energy Policy Evaluation and Analysis Toolkit Project (“REPEAT”), the IRA would drive nearly $3.5 trillion in cumulative capital investments into the energy industry through the next decade and cut annual emissions in 2030 by an additional ~1 billion metric tons below current policy, which would be 50% below 2005 levels. REPEAT projects an increase to 49 GW of solar deployed per year by 2025, which is approximately five times higher than capacity additions in 2020.
The IRA provides strong tailwinds to the renewable energy industry – amongst other provisions, the long-awaited increases to the ITCs and PTCs are expected to improve economics for wind, solar, and storage projects.
| | | | | | | | |
| SOLAR/WIND ITC | | •Increases back to 30% (was 26% in 2022 and planned(planned to be 22%23% in 2023)2034) |
| | |
| WIND PTC | | •Increases rate to $0.026/$0.0275/kWh (extended to 100% of credit amount; was down to 40%) |
| | |
| SOLAR PTC | | •Included a new rate of $0.026/$0.0275/kWh (in line with Wind PTC) |
| | |
| STORAGE ITC | | •New ITC of 30% •Encourages stand-alone storage vs. current incentives which push towards solar + storage |
| | |
ADDITIONAL POTENTIAL CREDITS
(for both ITC & PTC) | | •10-20% for low-income communities •10% for energy communities •10% for domestic content |
| | |
| TRANSFERABILITY OF CREDITS | | •Owner can sell their tax credits directly to corporate taxpayers seeking to reduce their tax liability |
| | |
| OTHER NOTABLE MENTIONS | | •Incentive levels described above require project to meet several requirements such as prevailing wage and apprenticeship requirements (projects >1MWac) •Interconnection eligibility (projects <5MWac) •EV and Hydrogen credits, resource neutrality after 2024 and direct pay and transferability |
Production Tax Credits
Production Tax Credits, or PTCs, are provided to owners of certain renewable energy projects that produce electricity for sale to unrelated persons. This credit is applicable for a 10-year period from the time a project is placed into service and benefits owners with tax liabilities against which to claim the tax credit. Under current law, for wind projects that began construction prior to January 1, 2025, there is a 2.62.75 cent per kilowatt hour PTC.
Investment Tax Credits
Investment Tax Credits, or ITCs, provide that eligible systems, such as solar systems and fuel cell systems, receive a credit of 26%up to 30% of the eligible cost-basis with no maximum limit. This credit is currently structured as a tax credit, whereby the owners of a qualifying renewable energy or energy efficient project can elect to receive the tax credit once the project is placed into service. The ITC for solar energy will decreasebegin to 22%phase out for any propertyeligible projects that begancommence construction after December 31, 2022 and before January 1, 2024, and will remainthe later of 2032 or the year the U.S. treasury secretary determines that the annual U.S. greenhouse gas emissions from electricity production has been reduced by at 10% permanently for construction beginning on or after January 1, 2024.least 75% as compared to the calendar year 2022.
State Incentives
Renewable Portfolio Standards
Renewable Portfolio Standards, or RPS, whileWhile varying based on jurisdiction, RPS specify that a portion of the power utilized by local utilities must be derived from renewable energy sources. States have created these standards to diversify their energy resources, promote domestic energy production anand encourage economic development. Certain states have also adopted CES, which includes all sources of energy that have zero carbon emissions. According to the EIA, 3639 states and the District of Columbia have enacted RPS or CES programs, set mandates, or set goals that require utilities to include or obtain a minimum percentage of their energy from specific renewable and other clean energy sources. Under the RPS programs, utilities can (1) build or own renewable energy generation facilities, (2) purchase energy or RECs generated from renewable energy generation facilities, or (3) pay a penalty for any shortfalls in meeting the RPS.
Renewable Energy Credits
Renewable Energy Credits, or RECs are used in conjunction with compliance with an RPS program or as tradable certificates that represent a certain number of kilowatt hours of energy that have been generated by a renewable source or that
have been saved by an energy efficiency project, which provide further support to renewable energy initiatives. RECs are produced in conjunction with the generation of renewable energy and can be used for state RPS compliance or traded or sold to load-serving entities or to third parties, brokers and other market makers for investment purposes. Many states have specific compliance carve-outs for different types of renewable generation.
Feed-In Tariffs
Certain U.S. states and provinces of Canada have implemented feed-in tariffs (“FITs”) that entitle the renewable energy producer to enter into long-term contracts pursuant to which payment is based on the cost of generation for the diverse types of renewable energy projects. In addition to differences in FITs based on the type of project, FITs vary based on projects in various locations, such as rooftops or ground-mounted for solar photovoltaic projects, different sizes, and different geographic regions. FITs are available to anyone including homeowners, business owners, farmers, as well as private investors. The tariffs are typically designed to ratchet downward over time to both track and encourage technological change.
Environmental Regulation
We are subject to extensive environmental regulation, which has become more stringent over time. Various U.S. federal, state and local permits are required to construct renewable energy and energy efficiency projects. The projects in which we invest must conform to all applicable environmental regulations and codes, including those relating to the discharge of materials into the air, water and ground, which will vary from place to place and time to time, as well as be based on the type of renewable energy asset involved in the project. Each of these sources is subject to periodic modifications and what we anticipate will be increasingly stringent requirements. Compliance with such environmental regulations and codes is an important aspect of our ability to continue our operations.
We seek to purchase, finance or otherwise invest in projects that are at least “shovel ready,” meaning that all, or substantially all, planning, engineering and permitting, including all major permits and approvals from local and state regulatory agencies, are in place and construction can begin immediately or upon receipt of certain final permits that must be obtained immediately prior to construction. However, the projects in which we invest may incur significant costs in the ordinary course of business related to operations, maintenance and continued compliance with laws, regulations and permit requirements.
We are subject to the requirements of the federal Occupational Safety and Health Act, as amended (“OSHA”), and comparable state laws that protect and regulate employee health and safety. We endeavor to maintain compliance with applicable OSHA and other comparable government regulations.
Failure to comply with these laws, regulations and permit requirements may result in administrative, civil and criminal penalties, imposition of investigatory, clean-up and site restoration costs and liens, denial or revocation of permits or other authorizations and issuance of injunctions to limit or cease operations. In addition, claims for damages to persons or property have been brought and may in the future result from environmental and other impacts of the activities of our projects. Historically, environmental compliance costs have not had an adverse effect on our operations or financial position.
Competition
Although we believe there is currently a capital shortage in the renewable energy sector, we still compete for projects with other energy corporations, including investment funds (such as private equity funds and mezzanine funds) and traditional financial services companies (such as commercial banks and other sources of funding), as well as utilities and other producers of electricity. Moreover, alternative investment vehicles also make investments in renewable energy projects. Our competitors may be substantially larger and have considerably greater financial, technical and marketing resources than we do.
Human Capital
As of December 31, 2022,2023, the Company had 182203 employees.
The Company focuses on attracting, developing and retaining a team of highly talented and motivated employees. The Company regularly conducts assessments of its compensation and benefit practices and pay levels to help ensure that staff members are compensated fairly and competitively. The value and performance of the Company directly correlates with the character and talent of its employees. In addition to recruiting the best fit for the job, we take pride in creating an open and accessible work community where employees at all levels can thrive.
The Company is committed to maintaining a workplace that encourages, supports, and values diversity, equity and inclusion (“DEI”) and, as such, the Company launched its DEI committee in 2021. DEI is a strategic priority that is central to our culture, embedded in our values and integral to our business. The Company is making strides in achieving our vision of a
fully-inclusive global workplace that celebrates diversity and fosters a sense of belonging by providing equal access, opportunities and treatment. The Company embraces our employees’ unique experiences and backgrounds—the cultural influences and identities that make up who we are—to enable a fully engaged and thriving workplace to drive our business forward. The Company’s DEI committee is dedicated to facilitating bold initiatives and advocacy across our organization.
Key Agreements Prior to the Acquisition
Advisory and Administration Agreements
Prior to the Acquisition, GCM managed our day-to-day operations and provided advisory and management services to us pursuant to the Advisory Agreement. The Advisory Agreement was terminated in connection with the Acquisition and GCM is now a wholly-owned subsidiary of the Company.
Prior to the Acquisition, Greenbacker Administration served as our Administrator pursuant to the Administration Agreement. The Administration Agreement was terminated in connection with the Acquisition. Greenbacker Administration continues to perform certain asset management, construction management, compliance and oversight services, as well as asset accounting and administrative services, for many of the Company’s assets.
Refer to Note 5. Related Party Agreements and Transaction Agreements in the Notes to the Consolidated Financial Statements (Investment Basis) for further details.
Available Information
We file registration statements, proxy statements, our Annual Report on Form 10-K, Quarterly Reports on Form 10-Q, Current Reports on Form 8-K, and all amendments to those statements and reports with the SEC. Investors may obtain copies of these statements and reports by accessing the SEC’s website at www.sec.gov. Our statements and reports and any amendments to any of those statements and reports that we file with the SEC are available free of charge as soon as reasonably practicable on our website at www.greenbackercapital.com/greenbacker-renewable-energy-company/.www.greenbackercapital.com. The contents of our website are not incorporated by reference in or are otherwise a part of this Annual Report.
ITEM 1A. RISK FACTORS
Investing in the shares involves several significant risks. In addition to the other information contained herein, you should consider carefully the following information before making an investment decision regarding the shares. If any of the following events occur, our business, financial condition and results of operations could be materially and adversely affected. In such case, the value of the shares could decline, and you may lose part or all of your investment.
Summary of Risk Factors
Below is a summary listing of key risks, which are discussed in more detail later in this section:
Risks Related to Our Business and Structure
•Our ability to achieve our business objectives depends on our executive management team’s ability to manage and support our asset strategy. If we were to lose certain key members of our executive management team, our ability to achieve our business objectives could be significantly harmed.
•We have not previously operateda limited history operating as an internally managed company, which could negatively impact our future performance and we may be exposed to risks which we have not historically encountered.
•Because our business model depends to a significant extent upon relationships with renewable energy developers, utilities, energy companies, investment banks, commercial banks, individual and institutional investors, consultants, engineering, procurement and construction companies, contractors, and renewable energy technology manufacturers (such as panel manufacturers), the inability to maintain relationships, or the failure of these relationships to generate business opportunities, as well as failure by such entities to comply with applicable laws and regulations or follow ethical business practices, could adversely affect our business.
•Our success is subject to general market and economic conditions we cannot control or predict, including but not limited to acts of terrorism or related acts of war, natural disaster, pandemics (such as the COVID-19 pandemic)COVID-19), adverse developments affecting the financial services industry, inflation, supply chain disruptions or other catastrophic events.
•The amount of any distributions we may pay is uncertain. We may not be able to sustain the payment of distributions, and our distributions may not grow over time.
•Investment return may be reduced if we are required to register as an investment company under the Investment Company Act.
•Cybersecurity risks could result in the loss of data, interruptions in our business and damage to our reputation, and subject us to regulatory actions, increased costs and financial losses, each of which could have a material adverse effect on our business and results of operations.
•Our Board of Directors may change our business and acquisition policies and strategies without prior notice or shareholder approval, the effects of which may be adverse to investors.
•Conflicts of interest may arise in the allocation of acquisition opportunities.
•We are not required to comply with certain reporting requirements, including those relating to auditor’s attestation reports on the effectiveness of our system of internal control over financial reporting, accounting standards and disclosure about our executive compensation, that apply to other public companies.
•The transition of the focus of our business has resulted in a change in accounting that does not purport to represent our historical consolidated financial information and is not necessarily indicative of our future results of operations and financial performance.
•Our business in the future may be different from our current business.
Risks Related to Our Acquisitions and Industry Focus
•Our strategic focus is on the renewable energy, energy efficiency and related sectors, which subjects us to more risks than if we were broadly diversified.
•Existing regulations and policies and changes to these regulations and policies may present technical, regulatory and economic barriers to the purchase and use of energy generation and consumption projects, including solar and wind energy projects, which may significantly reduce our ability to meet our investment objectives.
•The profitability of our projects may be adversely affected if they are subject to regulation under the Federal Power Act, or state or local public utility laws and regulations that regulate the sale of electricity.
•Our projects may rely on electric transmission lines and other transmission facilities that are owned and operated by third parties. In these situations, our projects will be exposed to transmission facility curtailment risk, including but not limited to curtailment caused by breakdown of the power grid system, which may delay and increase the costs of our projects or reduce the return to us on those investments.
•Liability relating to environmental matters may impact the value of properties that we may acquire or the properties underlying our projects.
•We may invest in tax equity partnerships, which creates additional risk because, among other things, we cannot exercise sole decision-making power and our partners may have different economic interests than we have.
•If the market for various types of climate solutions projects or the investment techniques related to such projects do not develop as we anticipate, new business generation in this target area may be adversely impacted.
•Our assets may be exposed to an increase in climate change or other change in meteorological conditions which could have an impact on electric generation, revenue or insurance costs, all of which could adversely affect our business, financial condition and results of operations and cash flows.
•Changes in the treatment or qualification of RECs may adversely impact our business.
•We may be exposed to uninsured losses and may experience increased insurance costs.
•We do not own all of the land on which the projects in our portfolio are located.
•We will be required to make substantial capital expenditures to develop the projects in our growth pipeline, repower existing assets and pursue new growth opportunities.
•Certain of our investments are subject to changes in market value and other risks, which may materially adversely affect our liquidity, financial condition and results of operations.
•If the solar power industry experiences a shortage of key inputs, such as polysilicon, the profitability of solar power-producing projects may decrease, which may result in slower growth in the solar power market than we anticipate.
•The operating results of the projects in which we invest that produce solar power may be negatively affected by a number of factors.
•If wind conditions are unfavorable or below our estimates on any of our wind projects, the electricity production on such project and therefore, our income, may be substantially below our estimates.
•Our investmentsinvestment in a biomass facilitiesfacility may be negatively affected by our inability to maintain stockpiles of the products on which such facilitiesfacility operate and/or to source the necessary personnel to operate such facilities.facility.
•Our investments in energy storage facilities may be negatively affected by a number of factors, including increases in storage costs, risk of fire and decreases in retail peak electricity pricing.
•In our due diligence review of potential investments, we may rely on third-party consultants and advisors and representations made by sellers of potential portfolio projects, and we may not identify all relevant facts that may be necessary or helpful in evaluating potential investments.
•There can be no guarantee that newly developed technologies that we invest in will perform as anticipated.
•Our investment management business is subjecthighly regulated and failure to risks.comply with the various rules and regulations of the jurisdictions in which we operate could have adverse effects.
Risks Related to Debt Financing and Lending
•We may need to incur financial leverage to be able to achieve our investment objectives. We cannot guarantee the availability of such financings.
•If we borrow money, the potential for gain or loss on the amounts invested in us will be magnified and may increase the risk of investing in us. Borrowed money may also adversely affect the return on our assets, reduce cash available for distribution to our members, and result in losses.
•We will be exposed to risks associated with changes in interest rates.
•Cross-collateral arrangements among projects within our portfolio could expand the negative impact of a problem with one project to negatively affect other projects in our portfolio.
•The discontinuation of the LIBOR may adversely affect interest expense related to our borrowings or the borrowings of our managed funds.
•We are subject to credit and performance risk from customers, hedging counterparties and vendors.
Risks Related to Our Shares
•Our calculations of NAV and MSV are based on internally established procedures and not governed by governmental or independent securities, financial or accounting rules or standards.
•The shares that were sold in our security offerings will not be listed on an exchange or quoted through a quotation system for the foreseeable future, if ever. Therefore, when purchasing any class of shares, investors have limited liquidity and may not receive a full return of their invested capital if they sell their shares.
Risks Related to Tax
•Members may realize taxable income without cash distributions, and may have to use funds from other sources to fund tax liabilities.
•The U.S. IRS could adjust or reallocate items of income, gain, deduction, loss and credit with respect to the shares if the IRS does not accept the assumptions or conventions we utilize.
•If we were to become taxable as a corporation for U.S. federal income tax purposes, we would be required to pay income tax at corporate rates on our net income, and distributions by us to members would constitute dividend income taxable to such members, to the extent of our earnings and profits.
•Indemnification claims by a tax equity investor, project lender, or other counterparty may reduce our right to cash flows generated by a project and could result in a cross-default under project-level debt financing.
Risks Related to Our Business and Structure
Our ability to achieve our business objectives depends on our executive management team’s ability to manage and support our asset strategy. If we were to lose certain key members of our executive management team, our ability to achieve our business objectives could be significantly harmed.
We are dependent on the diligence, skill and network of industry relationships and other business contacts of our executive management team to execute our asset acquisition strategy and achieve our objectives. Our executive management team evaluates, negotiates, structures, closes and monitors our assets. Our success depends to a significant extent on the continued service of our executive management team, particularly Charles Wheeler, David Sher, Mehul Mehta, Spencer MashChristopher Smith and Matt Murphy. The departure of any of our executive management team could have a material adverse effect on our ability to achieve our business objectives.
There is intense competition for experienced senior management and personnel with technical and industry expertise in the renewable energy industry, and we may not be able to retain these officers or key team members. We have entered into employment letters with certain members of our executive management team including non-competition agreements. The non-competition agreements do not ensure the continued service of these executive officers. In addition, we currently do not maintain “key person” insurance covering any member of our management team. Additionally, the employment letters with certain members of our executive management team provide that if their employment with us terminates under certain circumstances we may be required to pay them significant amounts of severance compensation, thereby making it costly to terminate their employment. The loss of any of our key team members, particularly to competitors, could have a material adverse effect on our business, financial condition and results of operations and cash flows.
We have not previously operateda limited history operating as an internally managed company, which could negatively impact our future performance and we may be exposed to risks which we have not historically encountered.
AsWe have a result of the Acquisition,limited operating history as an internally managed company, which could negatively impact our future performance and we operatemay be exposed to risks which we have not historically encountered. We have only operated as a fully integrated and internally managed company with our own executive management team and other employees to manage our business and operations. Weoperations since the Acquisition. Although we no longer bear the costs of the various fees and expense reimbursements previously paid to GCM under the now terminated Advisory Agreement. However,Agreement, we have experienced increased expenses as our expenses now include the compensation and benefits of our officers and employees, as well as overhead previously incurred by GCM and Greenbacker Administration. Our employees now provide services historically provided by GCM and Greenbacker Administration. In addition, weWe have not previously operated as an internally managed company and may in the future encounter unforeseen or increased costs, expenses and difficulties associated with providing these services internally.our internal operations. If we incur unexpected or increased expenses, as a result of the Acquisition, our results of operations could be adversely affected.
Further, in connection with internalizing our operating structure, we have experienced and may continue to experience difficulty in the continued integration of the functions performed by GCM and Greenbacker Administration as stand-alone entities, and we could have difficulty retaining our personnel, including those performing management, capital raising, investment and general and administrative functions. These personnel have a great deal of know-how and experience and replacing such personnel could prove challenging. We may also fail to properly identify the appropriate mix of personnel and capital needs to operate successfully as a stand-alone entity. An inability to effectively manage our internal operations could result in our incurring excess costs and operating inefficiencies and may divert our management’s attention from operating our business.
Such risks may impact our ability to achieve the cost savings and economies of scale expected to be realized as a result of the Acquisition. A failure to achieve such cost savings and economies of scale could have a material adverse effect on our business, financial condition and results of operations and affect the value of our common shares.
Because our business model depends to a significant extent upon relationships with renewable energy developers, utilities, energy companies, investment banks, commercial banks, individual and institutional investors, consultants, engineering, procurement and construction companies, contractors, and renewable energy technology manufacturers (such as panel manufacturers), the inability to maintain relationships, or the failure of these relationships to generate business opportunities, as well as failure by such entities to comply with applicable laws and regulations or follow ethical business practices, could adversely affect our business.
We rely to a significant extent on our relationships with renewable energy developers, energy consultants, retail energy providers, utilities; energy companies, investment banks, commercial banks, individual and institutional investors, consultants, EPC companies,EPCs, contractors, and renewable energy technology manufacturers (such as panel manufacturers), among others, as a source of potential investment opportunities. If we fail to maintain our relationships with other sponsors or sources of business opportunities, we will not be able to grow our portfolio, or will grow it at a slower rate. In addition, individuals with whom we have relationships are not obligated to provide us with business opportunities, and, therefore, there is no assurance that such
relationships will generate business opportunities for us. Further, although we are dependent on such relationships to generate business opportunities, we have no control over the actions or business practices of such entities. Accordingly, we cannot guarantee that they will follow ethical business practices, such as fair wage practices and compliance with environmental, safety, and other local laws. A lack of demonstrated compliance could lead us to seek alternative relationships, which could increase our costs and result in delayed projects, delivery of components and materials, or other disruptions of our operations. Violation of labor or other laws divergence of labor or other practices from these generally accepted as ethical in the U.S. or other markets in which we do business could also attract negative publicity for us and harm our business.
Our success is subject to general market and economic conditions we cannot control or predict, including but not limited to acts of terrorism or related acts of war, natural disaster, pandemics (such as the COVID-19 pandemic)COVID-19), adverse developments affecting the financial services industry, inflation, supply chain disruptions or other catastrophic events.
Our business is affected by conditions in the financial markets and economic and political conditions throughout the world, such as interest rates, the availability and cost of credit, adverse developments affecting the financial services industry, inflation rates, economic uncertainty, changes in laws (including laws relating to our taxation, taxation of our investors and the possibility of changes to regulations applicable to alternative asset managers such as GCM), trade policies, commodity prices, tariffs, currency exchange rates and controls and national and international political circumstances (including wars and other forms of conflict, civil unrest, terrorist acts, and security operations) and catastrophic events such as fires, floods, earthquakes, tornadoes, hurricanes and pandemics (including the COVID-19 pandemic)(such as COVID-19) could materially affect our business to the extent it materially affects global economies or global financial markets. These factors are outside of our control and may affect our performance and the liquidity and value of our assets, and we may not be able to or may choose not to manage our exposure to these conditions, which may result in adverse consequences for us and result in substantial losses.
We, and the funds we manage, maintain cash assets at commercial banks in the United States in amounts in excess of the Federal Deposit Insurance Corporation insurance limit of $250,000 and have entered into or may in the future enter into credit agreements, letters of credit and other financial instruments with one or more lenders or other counterparties. In the event any bank at which we, or the funds we manage, maintain deposits or any lender or such other counterparty fails, is or was to be placed into receivership or suffers or is perceived to be in similar economic distress, we, and the funds we manage, may be unable to access cash assets or funds at such institutions, which could adversely affect our financial condition and our results of operations. In addition, if any of our customers, suppliers or other parties with whom we conduct business are unable to access funds pursuant to such instruments or lending arrangements with such a financial institution, such parties’ ability to pay their obligations to us or to enter into new commercial arrangements requiring additional payments to us could be adversely affected.
Furthermore, aA depression, recession or slowdown in the U.S. would have a pronounced impact on us, the value of our assets and our profitability, impede the ability of our assets to perform under or refinance their existing obligations, and impair our ability to effectively deploy our capital or realize upon investments on favorable terms. DuringBeginning in 2021, the U.S. began experiencing increased wage and price inflation, as evidenced by increases in the consumer price index. The annual rate of inflation in the U.S. reached 6.5% in December 2022, a reduction from the 9.1% annual rate reportedand reached 3.4% in June 2022. Through December 31, 2022,2023. In response to inflationary pressure, the United States Federal Reserve (the “Federal Reserve”) has approved sevenand other global central banks raised interest rates in 2022 and 2023; however, we cannot predict with certainty any future action that the Federal Reserve and/or any other global central bank may take with respect to interest rates. To the extent that interest rate hikes that totalcuts do not occur at all or result in a 4.25 percentage point increase. The Federal Reserve has indicated additional rate increases may be approvedlower-than-expected reduction in interest rates, the future.effects of inflationary pressure could continue to affect our success. The degree of any continued inflation, and length of time it continues, will be impacted by any further steps the Federal Reserve takes to combat inflationary pressures, such as by continuing to adjust interest rates. Concerns over increasingcontinuing inflation, as well as interest rate volatility and fluctuations in oil and gas prices resulting from global production and demand levels as well as geopolitical tension, have precipitated market volatility. Inflation or the absence of cost decreases could adversely affect us by increasing the actual or expected costs of land, raw materials, and labor, and other goods and services needed to operate our business, which in turn may raise our cost of capital and the costs of developing, constructing, and operating a project, making it more difficult to develop and operate our projects. Should cost increases occur, prospective counterparties may also choose to forego or delay signing PPAs or other agreements with us. Significant increases in actual or expected costs could negatively impact the Company’s business in a manner that could adversely affect the Company’s financial condition and results of operations.
Moreover, market disruptions in a single country could cause a worsening of conditions on a regional and even global level, and economic problems in a single country are increasingly affecting other markets and economies. A continuation of this trend could result in problems in one country adversely affecting regional and even global economic conditions and markets. For example, concerns about the fiscal stability and growth prospects of certain European countries in the last economic downturn had a negative impact on most economies of the Eurozone and global markets and the current ongoing conflict between Russia, Belarus and Ukraine could have a negative impact on those countries and others in the region. Similarly, the more recent conflict between Israel and Hamas could have a negative impact on the global markets and affect the fiscal stability and growth prospects of countries in the region. In addition, facilities of third parties on which the Company relies on to obtain supplies from may be at greater risk of future terrorist activities. The
occurrence of similar crises in the future could cause increased volatility in the economies and financial markets of countries throughout a region, or even globally.
The results ofIn August 2023, the U.S. Department of Commerce’s investigation intoCommerce announced the final determinations in the circumvention inquiries of solar cells and modules from the People’s Republic of China. The Department of Commerce found that certain Chinese producers were shipping their solar products through Cambodia, Malaysia, Thailand, and/or Vietnam for minor processing in an attempt to avoid paying antidumping and countervailing duties circumvention claim on solar cells and panels supplied from Malaysia, Vietnam, Thailand, and Cambodia are uncertain. If the investigation results in additionalduties. Additional taxes, tariffs, duties, or other assessments on renewable energy or the equipment necessary to generate or deliver it, such as antidumping and countervailing duty rates, such developmentsas a result of this final determination, or further investigations and determinations, could impede the realization of our U.S. renewables strategy by resulting in, among other items, lack of a satisfactory market for the development and/or financing of our U.S. renewable energy projects, abandoning the development of certain U.S. renewable energy projects, a loss of our investments in the projects, and/or reduced project returns.
The length and severity of any economic slowdown or downturn, or any such terrorist attacks, cannot be predicted with confidence at this time. Any of the foregoing could have a significant impact on our business and result in substantial losses.
The amount of any distributions we may pay is uncertain. We may not be able to sustain the payment of distributions, and our distributions may not grow over time.
Subject to our Boardthe Company’s board of Directors’directors’ (the “Board of Directors”) discretion, based upon management’s recommendations, and applicable legal restrictions, we authorize and declare distributions quarterly and pay distributions monthly. However, while we intend to pay these distributions to our members out of assets legally available for distribution, we cannot assure that we will achieve investment results that will allow us to make a targeted level of cash distributions or year-to-year increases in cash distributions. Our ability to pay distributions might be adversely affected by, among other things, the impact of the risks described herein. All distributions will be paid at the discretion of our Board of Directors, based on management’s recommendations, and will depend on our earnings, our financial condition, compliance with applicable regulations and such other factors as our Board of Directors may deem relevant from time to time. We cannot assure that we will pay distributions to our members in the future. In the event that we encounter delays in locating suitable business opportunities, we may pay all or a substantial portion of our distributions from borrowings the proceeds of our offering and other sources, without limitation. If we fund distributions from financings, then such financings will need to be repaid, and if we fund distributions from offering proceeds, then we will have fewer funds available for investments in renewable energy and energy efficiency projects, which may affect our ability to generate future cash flows from operations and, therefore, reduce overall return. Accordingly, members who receive the payment of a dividend or other distribution from us should not assume that such dividend or other distribution is the result of a net profit earned by us.
Investment return may be reduced if we are required to register as an investment company under the Investment Company Act.
We conduct our operations directly and through wholly or majority-owned subsidiaries, so that the Company and each of its subsidiaries do not fall within, or are excluded from, the definition of an “investment company” under the Investment Company Act of 1940, as amended (the “Investment Company Act”). Under Section 3(a)(1)(A) of the Investment Company Act, a company is deemed to be an “investment company” if it is, or holds itself out as being, engaged primarily, or proposes to engage primarily, in the business of investing, reinvesting or trading in securities. Under Section 3(a)(1)(C) of the Investment Company Act, a company is deemed to be an “investment company” if it is engaged, or proposes to engage, in the business of investing, reinvesting, owning, holding or trading in securities, and owns or proposes to acquire “investment securities” having a value exceeding 40% of the value of its total assets (exclusive of U.S. government securities and cash items) on an unconsolidated basis, which we refer to as the “40% test.” Excluded from the term “investment securities,” among other instruments, are U.S. government securities and securities issued by majority-owned subsidiaries that are not themselves investment companies and are not relying on the exception from the definition of “investment company” set forth in Section 3(c)(1) or Section 3(c)(7) of the Investment Company Act.
We conduct our operations so that the Company, and most, if not all, of its wholly-ownedwholly owned and majority-owned subsidiaries comply with the 40% test. We will monitor our holdings on an ongoing basis and determine compliance with this test in connection with new acquisitions. We expect most, if not all, of our wholly-ownedwholly owned and majority-owned subsidiaries to rely on an exception from the definition of “investment company” other than the exceptions under Section 3(c)(1) and Section 3(c)(7) of the Investment Company Act. Consequently, interests in these subsidiaries (which constitute most, if not all, of our assets) generally will not constitute “investment securities.” Accordingly, we believe the Company, and most, if not all, of its wholly-ownedwholly owned and majority-owned subsidiariessubsidiaries. will not be considered investment companies under Section 3(a)(1)(C) of the Investment Company Act.
We are organized as a holding company and will conduct our business through our wholly-ownedwholly owned and majority-owned subsidiaries. Accordingly, we believe that our companyCompany will not be considered an investment company under Section 3(a)(1)(A)
of the Investment Company Act because we will not engage primarily or hold ourselves out as being engaged primarily in the business of investing, reinvesting or trading in securities. Rather, through the Company’s wholly owned or majority-owned subsidiaries, the companyCompany is primarily engaged in the non-investment company businesses of these subsidiaries; namely, the business of acquiring and financing renewable energy and energy efficiency projects.
We make the determination of whether an entity is a majority-owned subsidiary of the Company for purposes of the analysis of our status as an investment company pursuant to Section 3(a)(1)(C) of the Investment Company Act. The Investment Company Act defines a “majority-owned subsidiary” of a person as a company that represents 50% or more of the outstanding voting securities owned by such person, or by another company which is a majority-owned subsidiary of such person. The Investment Company Act further defines “voting securities” as any security presently entitling the owner or holder thereof to vote for the election of directors of a company. We treat companies in which we own at least a majority of the outstanding voting securities as majority-owned subsidiaries for purposes of the 40% test. We have not requested the SEC or its staff to approve our treatment of any company as a majority-owned subsidiary and neither the SEC nor its staff has done so. If the SEC or its staff were to disagree with our treatment of one of more companies as majority-owned subsidiaries, we would need to adjust our strategy and our assets in order to continue to pass the 40% test. Any such adjustment in our strategy could have a material adverse effect on us.
Some of our majority-owned subsidiaries may also rely on the exceptions from the definition of investment company under Section 3(c)(5)(A) or (B) of the Investment Company Act, which except from the definition of investment company, respectively, (i) any person who is primarily engaged in the business of purchasing or otherwise acquiring notes, drafts, acceptances, open accounts receivable and other obligations representing part or all of the sales price of merchandise, insurance and services; or (ii) any person who is primarily engaged in the business of making loans to manufacturers, wholesalers and retailers of, and to prospective purchasers of, specified merchandise, insurance and services. The SEC staff has issued no-action letters interpreting Section 3(c)(5)(A) and (B) and has taken the position that these exceptions are available to a company with at least 55% of its assets consisting of eligible loans and receivables of the type specified in Section 3(c)(5)(A) and (B). We believe that most of the loans that we provide to finance renewable energy and energy efficiency projects relate to the purchase price of specific equipment or the cost to engage contractors to install equipment for such projects. Accordingly, we believe that most of these loans are eligible loans that qualify for this 55% test. However, no assurance can be given that the SEC or its staff will concur with this position. In addition, the SEC or its staff may, in the future, issue further guidance that may require us to reclassify our assets for purposes of qualifying with these exceptions. A change in the value of our assets could cause us or one or more of our wholly or majority-owned subsidiaries, including those relying on Section 3(c)(5)(A) or (B), to fall within the definition of “investment company,” and negatively affect our ability to maintain our exemption from regulation under the Investment Company Act. To avoid being required to register the company or any of its subsidiaries as an investment company under the Investment Company Act, we may be unable to sell assets we would otherwise want to sell and may need to sell assets we would otherwise wish to retain. In addition, we may have to acquire additional income- or loss-generating assets that we might not otherwise have acquired, or may have to forgo opportunities to acquire interests in companies that we would otherwise want to acquire and that would be important to our investment strategy. There can be no assurance that the laws or regulations governing the Investment Company Act, including the Division of Investment Management of the SEC providing more specific or different guidance regarding these exceptions, will not change in a manner that adversely affects our operations.
If we become obligated to register the Company or any of its subsidiaries as an investment company, the registered entity would have to comply with a variety of substantive requirements under the Investment Company Act, imposing, among other things:
•limitations on capital structure;
•restrictions on specified investments;
•prohibitions on transactions with affiliates; and
•compliance with reporting, record keeping, voting, proxy disclosure and other rules and regulations that would significantly change our operations.
If we were required to register the Company as an investment company but failed to do so, we would be prohibited from engaging in our business, and criminal and civil actions could be brought against us. In addition, our contracts would be unenforceable unless a court required enforcement, and a court could appoint a receiver to take control of us and liquidate our business.
Cybersecurity risks could result in the loss of data, interruptions in our business and damage to our reputation, and subject us to regulatory actions, increased costs and financial losses, each of which could have a material adverse effect on our business and results of operations.
Our operations are highly dependent on our information systems and technology, and we rely heavily on them for our financial, accounting, treasury, communications, asset management and other data-processing needs. Such systems may fail to operate properly, become disabled or unavailable. In addition, such systems are from time to time subject to cyberattacks. Cybersecurity incidents and cyberattacks have been occurring globally at a higher frequency and severity. Threats are expected to continue to increase in frequency in the future according to the Cybersecurity & Infrastructure Security Agency (CISA). Our information technology systems, as well as those of other related parties, such as service providers, may be vulnerable to damage or interruption from cybersecurity breaches, computer viruses or other malicious code, “phishing” attempts and other forms of social engineering, network failures, computer and telecommunication failures, infiltration by unauthorized persons or other security breaches, usage errors by their respective professionals or service providers, power outages, communications or other service outages, or catastrophic events such as fires, tornadoes, floods, hurricanes or earthquakes. Cyberattacks and other security threats could originate from a wide variety of external sources, including cyber criminals, nation-state actors, hacktivists or other outside parties. Damages or interruptions may also result from cyberattacks or security threats originating from malicious or accidental acts of insiders, such as employees, or third-party agents and consultants. There can be no absolute assurance that the measures we take will ensure the integrity of our systems and will provide protection from cyberattacks or other threats. Cyberattack techniques change frequently and are not often recognizable until after successful execution.
The costs related to cyber or other security threats or disruptions may not be fully insured or indemnified by other means. In addition, we could also suffer losses related to the failure to timely update or incorrectly change our information systems and technology. Furthermore, we have become increasingly reliant on third-party service providers for most aspects of our business. These third-party service providers could also face ongoing cybersecurity threats and compromises of their systems, and as a result, unauthorized individuals could gain access to certain confidential data.
Cybersecurity has become a top priority for regulators around the world. Many jurisdictions in which we operate have laws and regulations relating to data privacy, cybersecurity and protection of personal information, including, for example, the California Consumer Privacy Act that went into effect in January 2020. Some jurisdictions have also enacted laws requiring companies to notify individuals and government agencies of data security breaches involving certain types of personal data. Further, the SEC adopted its final rule on Cybersecurity Risk Management, Strategy, Governance, and Incident Disclosure in July 2023, which requires public companies to disclose material cybersecurity incidents on Form 8-K and which modified Form 10-K to include specific cybersecurity risk management and governance disclosure. Breaches in security, whether malicious in nature or through inadvertent transmittal or other loss of data, could potentially jeopardize our, our employees’ or our investors’ or counterparties’ confidential, proprietary and other information processed and stored in, and transmitted through, our computer systems and networks, or otherwise cause interruptions or malfunctions in our, our employees’, our investors’, our counterparties’ or third parties’ business and operations, which could result in significant financial losses, increased costs, liability to our investors and other counterparties, regulatory intervention and reputational damage. Furthermore, if we fail to comply with the relevant laws and regulations or fail to provide the appropriate regulatory or other notifications of breach in a timely manner, it could result in regulatory investigations and penalties.
Our Board of Directors may change our business and acquisition policies and strategies without prior notice or shareholder approval, the effects of which may be adverse to investors.
Our Board of Directors determines our operational policies and may amend or revise our policies, including our policies with respect to our business, acquisitions, growth, operations, compensation, indebtedness, capitalization and distributions, or approve transactions that deviate from these policies, without a vote of, or notice to, our shareholders at any time. We may change our investment guidelines and our strategy at any time with the approval of our Board Directors, but without the consent of our shareholders, which could result in originating assets that are different in type from, and possibly riskier than, the assets initially contemplated. These changes could adversely affect our business, financial condition, results of operations and our ability to make distributions to our shareholders.
Conflicts of interest may arise in the allocation of acquisition opportunities.
GCM currently manages, and may in the future manage, other investment funds that pursue investment strategies involving our target assets. Accordingly, GCM has obligations to the other entities it manages, and may have additional obligations to entities it manages in the future, the fulfillment of which might not be in the best interests of the Company or its shareholders. In addition, the Company may compete with any such investment vehicle for the same investors and acquisition opportunities.
GCM has adopted policies regarding the allocation of acquisition opportunities, however the application of such policies may result in the Company not participating, or not participating to the same extent, in acquisition opportunities in which it would have otherwise participated had the related allocations been determined without regard to such guidelines. Among the factors GCM considers in making investment allocations among the Company and our managed funds are the following: (i)
each investment entity’s investment objectives and investment focus, (ii) sourcing of an investment opportunity (and with respect to an investment opportunity originated by a third-party, the relationship of a particular investment entity to or with such third-party), (iii) each investment entity’s liquidity and reserves (including whether an investment entity is able to commit to invest all capital required to consummate a particular investment opportunity), (iv) the anticipated future pipeline of suitable investments, (v) each investment entity’s diversification (including the actual, relative or potential exposure of an investment entity to the type of investment opportunity in terms of its existing portfolio), (vi) the amount of capital available for investment by each investment entity as well as each investment entity’s projected future capacity for investment (including whether an investment entity is able to invest all capital required to consummate a particular investment opportunity), (vii) the size, liquidity and duration of the investment, (viii) the availability of other suitable investments for each investment entity, (ix) legal, tax, accounting, regulatory and other considerations, (x) any other relevant limitations imposed by or conditions set forth in the applicable offering and organizational documents of each investment entity and (x) any other consideration deemed relevant by GCM.
We are not required to comply with certain reporting requirements, including those relating to auditor’s attestation reports on the effectiveness of our system of internal control over financial reporting, accounting standards and disclosure about our executive compensation, that apply to other public companies.
We are a “ smaller reporting company,” as such term is defined in the Exchange Act. As a smaller reporting company, we are eligible to take advantage of certain exemptions from various reporting and disclosure requirements that are applicable to public companies that are not smaller reporting companies. To the extent that we continue to qualify as a smaller reporting company, certain of the exemptions that were previously available to us as an emerging growth company may continue to be available to us as a smaller reporting company, including: (1) scaled executive compensation disclosures and (2) the requirement to provide only two years of audited financial statements, instead of three years.
Once we are no longer a smaller reporting company, so long as shares of our common stock are not traded on a securities exchange, we will be deemed to be a “ non-accelerated filer” under the Exchange Act, and as a non-accelerated filer, we will be exempt from compliance with the auditor attestation requirements of Section 404(b) of the Sarbanes-Oxley Act.
The transition of the focus of our business has resulted in a change in accounting that does not purport to represent our historical consolidated financial information and is not necessarily indicative of our future results of operations and financial performance.
Since inception, the Company’s historical financial statements were prepared using the Investment Basis. As a result of internalizing our operating structure, we were required to discontinue the application of ASC 946 and instead present our financial statements according to the Non-Investment Basis. The results reflected in the historical financial statements included in this Annual Report have been presented prior to and subsequent to this change in status and are not comparable and therefore may not be indicative of our future financial condition or operating results. We urge you to carefully consider the basis on which the historical financial information included herein was prepared and presented.
Our business in the future may be different from our current business.
Along with the Acquisition, weWe have taken steps to transition the focus of our business from being an investor in clean energy projects to a diversified independent power producer coupled with an investment management business. Our current IPP business consists of wind, solar, storage and ancillary power generation assets primarily across the United States and Canada. We may own interests in other renewable power operations, and we may seek to divest of certain of our existing assets or business in the future. The risks associated with the operations of our future business may differ from those associated with our current business. We expect our investment management business will continue to expand and future managed funds that we provide services to may change over time as that business grows.
Risks Related to Our Acquisitions and Industry Focus
Our strategic focus is on the renewable energy, energy efficiency and related sectors, which subjects us to more risks than if we were broadly diversified.
Because we are specifically focused on the renewable energy, energy efficiency and related sectors, investments in our shares may present more risks than if we were broadly diversified over more sectors of the economy. Therefore, a downturn in the renewable energy or energy efficiency sectors would have a greater impact on us than on a company that is not concentrated in limited segments of the economy. For example, biofuel companies operating in the renewable energy sector can be significantly affected by the supply of and demand for specific products and services, especially biomass such as corn or soybean oil, the supply and demand for energy commodities, the price of capital expenditures, government regulation, world
and regional events and economic conditions. Companies that produce renewable energy can be negatively affected by lower energy output resulting from variable inputs, mechanical breakdowns, faulty technology, competitive electricity markets or changing laws that mandate the use of renewable energy sources by electric utilities.
In addition, companies that engage in energy efficiency projects may be unable to protect their intellectual property, or face declines in the demand for their services due to changing governmental policies or budgets. At times, the returns from investments in the renewable energy and energy efficiency sectors may lag the returns of other sectors or the broader market.
Furthermore, with respect to the construction and operation of individual renewable energy and energy efficiency projects, there are several additional risks, including (i) substantial construction risk, including the risk of delay, that may arise due to inclement weather or labor disruptions; (ii) the risk of entering into markets where we have limited experience; (iii) the need for substantially more capital to complete than initially budgeted and exposure to liabilities as a result of unforeseen environmental, construction, technological or other complications; (iv) a decrease in the availability, pricing and timeliness of delivery of raw materials and components necessary for the projects to function; (v) the continued good standing of permits, authorizations and consents from local city, county, state and U.S. federal governments as well as local and U.S. federal governmental organizations; and (vi) the consent and authorization of local utilities or other energy development offtakers to ensure successful interconnection to energy grids to enable power sales.
Existing regulations and policies and changes to these regulations and policies may present technical, regulatory and economic barriers to the purchase and use of energy generation and consumption projects, including solar and wind energy projects, which may significantly reduce our ability to meet our investment objectives.
The market for electricity generation and consumption projects is influenced by U.S. federal, state and local government regulations and policies concerning the electric utility industry, as well as policies promulgated by electric utilities. Similar governmental influences apply in the other jurisdictions in which we may invest. These regulations and policies often relate to electricity pricing and technical interconnection of customer-owned electricity generation. In the United States and in several other countries, these regulations and policies are being modified and may continue to be modified. Customer purchases of, or further investment in the research and development of, alternative energy sources, including solar energy technology, could be deterred by these regulations and policies, which could result in a significant reduction in the potential demand for renewable energy and energy efficiency project development and investments. For example, without certain major incentive programs and/or the regulatory mandated exception for renewable energy or energy efficiency systems, utility customers are often charged interconnection or standby fees for putting distributed power generation on the electric utility network. These fees could increase the cost to our customers of using our renewable energy and energy efficiency projects and make them less desirable, thereby harming our business, prospects, results of operations and financial condition.
We anticipate that our renewable energy and energy efficiency projects will be subject to oversight and regulation in accordance with national and local ordinances relating to building codes, safety, environmental protection, utility interconnection and metering and related matters. It is difficult to track the requirements of individual states and design equipment to comply with the varying standards. Any new government regulations or utility policies pertaining to our renewable energy or energy efficiency projects may result in significant additional expenses or related development costs and, as a result, could cause a significant reduction in demand for our investments.
The profitability of our projects may be adversely affected if they are subject to regulation under the Federal Power Act, or state or local public utility laws and regulations that regulate the sale of electricity.
Companies owning or operating electric generation projects may be subject to regulatory requirements under the FPA or state or local public utility laws. The FPA grants the FERC jurisdiction over the sale of electric power for resale (i.e., sales at wholesale) in interstate commerce. Jurisdiction over retail sales (i.e., the sale of power to end users) is left to the states. Rates and charges for wholesale sales of electric power are subject to FERC’s supervision. Upon an appropriate showing, FERC will authorize an entity to engage in wholesale sales of electricity at negotiated rates based on market conditions (i.e., market-based rates) rather than at cost-based rates pre-approved by FERC. FERC continues to have jurisdiction over entities granted market-based rate authority and retains the authority to remove the authorization to sell at market-based rates and otherwise impose additional conditions.
On the state level, public utility regulatory commissions have jurisdiction over retail electric sales and regulate the rates and other terms and conditions of “public utilities” as defined by relevant state law.
Certain of our future projects will be Qualifying Facilities (“QFs”) and/or Exempt Wholesale Generators (“EWGs”). Depending on their production capacity, certain QFs are exempt from regulation (i) under most of the FPA (including the need to obtain market-based rate authority); (ii) under the Public Utility Holding Company Act of 2005 (“PUHCA”); and (iii) under
state law as to rates and financial and organizational regulation of electric utilities. EWGs are generally exempt from FERC regulation under PUHCA, but remain subject to general FERC regulation under the FPA (including the requirement to obtain market-based authority).
If any of our portfolio companies are deemed to have violated the FPA, we may be subject to potential disgorgement of profits associated with the violation and/or suspension or revocation of our market-based rate authority, as well as potential penalties.
Certain projects, depending on their production capacity and configuration, may be subject to the reliability standards of the North American Electric Reliability Corporation. If we fail to comply with the mandatory reliability standards, we could be subject to sanctions, including monetary penalties and additional compliance obligations.
Although the sale of electric energy has been to some extent deregulated, the industry remains subject to extensive regulation. We cannot predict the future design of wholesale power markets or the ultimate effect ongoing regulatory changes will have on our business, or certain market changes that could impact our financial condition and adversely affect our operations.
Our projects may rely on electric transmission lines and other transmission facilities that are owned and operated by third parties. In these situations, our projects will be exposed to transmission facility curtailment risk, including but not limited to curtailment caused by breakdown of the power grid system, which may delay and increase the costs of our projects or reduce the return to us on those investments.
Our projects may rely on electric transmission lines and other transmission facilities owned and operated by third parties to deliver the electricity our projects generate. We expect some of our projects will have limited access to interconnection and transmission capacity because there are many parties seeking access to the limited capacity that is available. We may not be able to secure access to this limited interconnection or transmission capacity at reasonable prices or at all. Moreover, a failure in the operation by third parties of these transmission facilities could result in our losing revenues, because such a failure could limit the amount of electricity we deliver. In addition, our production of electricity may be curtailed due to third-party transmission limitations or limitations on the grid’s ability to accommodate intermittent energy sources, reducing our revenues and impairing our ability to capitalize fully on a project’s potential. Such a failure or curtailment at levels significantly above which we expect could have a material adverse effect on our business, financial condition and results of operations.
Liability relating to environmental matters may impact the value of properties that we may acquire or the properties underlying our projects.
Under various U.S. federal, state and local laws, an owner or operator of a project may become liable for the costs of removal of certain hazardous substances released from the project of any underlying real property. These laws often impose liability without regard to whether the owner or operator knew of, or was responsible for, the release of such hazardous substances.
The presence of hazardous substances may adversely affect an owner’s ability to sell a contaminated project or borrow using the project as collateral. To the extent that a project owner becomes liable for removal costs, the ability of the owner to make payments to us may be reduced.
We typically have title to projects or their underlying real estate assets underlying our equity investments, or, in the course of our business, we may take title to a project or its underlying real estate assets relating to one of our debt investments, and, in either case, we could be subject to environmental liabilities with respect to these assets. To the extent that we become liable for the removal costs, our results of operation and financial condition may be adversely affected. The presence of hazardous substances, if any, may adversely affect our ability to sell the affected project, and we may incur substantial remediation costs, thus harming our financial condition.
We may invest in tax equity partnerships, which creates additional risk because, among other things, we cannot exercise sole decision-making power and our partners may have different economic interests than we have.
We currently invest in tax equity partnerships with third parties. There are additional risks involved in such transactions. As a co-investor in a tax equity partnership, we may not always be in a position to exercise sole decision-making authority relating to the project or asset. As a result, the operations of a project may be subject to the risk that the tax equity partners may make business, financial or management decisions with which we do not agree, or the management of the project may take risks or otherwise act in a manner that does not serve our interests. Because we may not have the ability to exercise sole control over such operations, we may not be able to realize some or all the benefits that we believe will be created from our involvement. In
addition, there is the potential of our tax equity partner becoming bankrupt and the possibility of diverging or inconsistent economic or business interests between us and our partner. These diverging interests could, among other things, expose us to liabilities of the partnership in excess of our proportionate share of these liabilities. If any of the foregoing were to occur, our business, financial condition and results of operations could suffer as a result.
If the market for various types of climate solutions projects or the investment techniques related to such projects do not develop as we anticipate, new business generation in this target area may be adversely impacted.
The market for various types of climate solutions projects is emerging and rapidly evolving, leaving their future success uncertain. Similarly, various investing techniques, such as leasing land for renewable energy projects, purchasing interests in existing renewable energy projects, the use of C-PACECommercial Property Assessed Clean Energy financing and the use of taxable debt for state and local energy efficiency or sustainable infrastructure financings are emerging and the future success of these investing techniques is also uncertain. If some or all market segments or investing techniques prove unsuitable for widespread commercial deployment or if demand for such projects or techniques fail to grow sufficiently, the demand for our capital may decline or develop more slowly than we anticipate. Many factors will influence the widespread adoption and demand for such projects and investing techniques, including general and local economic conditions, commodity prices of fossil fuel energy sources, the cost and availability of energy storage, the cost-effectiveness of various projects and techniques, performance and reliability of such technologies compared to conventional power sources and technologies, and the extent of government subsidies and regulatory developments. Any changes in the markets, products, technologies, financing techniques, or the regulatory environment could adversely impact the demand or financial performance for such projects.
Our assets may be exposed to an increase in climate change or other change in meteorological conditions which could have an impact on electric generation, revenue or insurance costs, all of which could adversely affect our business, financial condition and results of operations and cash flows.
The electricity produced and revenues generated by a renewable electric generation facility are highly dependent on suitable weather conditions, which are beyond our control. Components of renewable energy systems, such as turbines, solar panels and inverters, could be damaged by natural disasters or severe weather, including extreme temperatures, wildfires, hurricanes, hailstorms or tornadoes. Furthermore, the potential physical impacts of climate change may impact our investments, including the result of changes in weather patterns (including floods, tsunamis, drought, and rainfall levels), wind speeds, water availability, storm patterns and intensities, and temperature levels. The projects in which we invest will be obligated to bear the expense of repairing the damaged renewable energy systems and replacing spare parts for key components and insurance may not cover the costs or the lost revenue. Natural disasters or unfavorable weather and atmospheric conditions could impair the effectiveness of the renewable energy assets, reduce their output beneath their rated capacity, require shutdown of key equipment or impede operation of the renewable energy assets, which could adversely affect our business, financial condition and results of operations and cash flows. Sustained unfavorable weather could also unexpectedly delay the installation of renewable energy systems, which could result in a delay in our investing in new projects or increase the cost of such projects. The resulting effects of climate change can also have an impact on the cost of, and the ability of a project to obtain, adequate insurance coverage to protect against related losses.
We typically base our acquisition decisions with respect to each renewable energy facility on the findings of studies conducted on-site prior to construction or based on historical conditions at existing facilities. However, actual climatic conditions at a facility site may not conform to the findings of these studies. Even if an operating project’s historical renewable energy resources are consistent with the long-term estimates, the unpredictable nature of weather conditions often results in daily, monthly and yearly material deviations from the average renewable resources anticipated during a particular period. Therefore, renewable energy facilities in which we invest may not meet anticipated production levels or the rated capacity of the generation assets, which could adversely affect our business, financial condition and results of operations and cash flows.
The amount of electricity renewable energy generation assets produce is also dependent in part on the time of year. For example, because shorter daylight hours in winter months results in less solar irradiation, the generation of particular assets will vary depending on the season. Further, time-of-day pricing factors vary seasonally which contributes to variability of revenues. As a result, we anticipate the revenue and cash flow from certain of our assets to vary based on the time of year.
In addition, many of a project’s end-customers could be large entities with wide ranging activities. A climate related event in a non-related part of the business could have a material adverse impact on the financial strength of such end-customer and their ability to honor their contractual obligations which could negatively impact on revenue and the cash flow of the project and our business.
Changes in the treatment or qualification of RECs may adversely impact our business.
We currently generate a portion of our revenue from the sale of RECs. RECs represent the “renewable” nature of the electricity. Creation of RECs depends on the type of renewable energy and can include other criteria such as location, size, date of operation of the project and energy delivery needs. RECs are sometimes sold bundled with electricity in PPAs that we are party to and other times may be sold separately to entities seeking to neutralize the emissions associated with their purchase and use of electricity from non-renewable sources. The demand for RECs, and their associated price, may change depending on the availability of renewable electricity in a particular jurisdiction, state and federal policies on the qualification of RECs to satisfy RPS requirements, and the need for entities to purchase such RECs to meet regulatory or other requirements or expectations. To the extent that renewable energy becomes more prevalent or the types of energy generation that qualify for RECs change, REC revenue generated by our assets may fall. Policy and legislative developments related to the creation, qualification status, and value of RECs are subject to change, and we cannot guarantee that the RECs we generate will have or retain value. Moreover, regulatory changes that reduce the quality or classification of RECs generated by certain of our assets have the potential to materially and adversely impact our financial condition and results of operation.
We may be exposed to uninsured losses and may experience increased insurance costs.
The insurance coverages and limits we carry, and the coverages and limits we require our contractual counterparties to carry, may not cover all losses that may arise in the course of our operations. Property insurance business income coverage is limited to a certain duration following a covered loss, which may not be adequate time to restore production in all cases. Some of our properties contain obsolete technology, for which insurance coverage is restricted. Some of the original equipment manufacturers who supplied equipment for our properties, and contractors who installed our equipment, are no longer in business, making their insurance and warranties unavailable for recovery. It is possible that incidents may occur resulting in losses greater than the insurance limits we have purchased. Some coverages are only available with aggregate limits, meaning that insurance coverage is eroded over the course of the policy period by payment of covered claims, reducing the amount available for subsequent claims in the same term. Some of our properties are located in areas exposed to natural disasters including earthquakes, floods, and windstorms. Our property insurance contains sublimits for such perils, reducing the limits available for resulting claims. In the event that the insurance we carry is insufficient to cover the full extent of losses that we experience, our financial position may be materially and adversely affected. The rates charged for the coverages we currently carry may increase substantially in the future, depending on our loss history; the losses experienced by the global insurance industry related to the energy sector; prevailing conditions in the insurance marketplace as insurers come and go and change their business appetites; and overall economic conditions. Due to the same reasons, the limits available to purchase may be reduced; or we may only be able to procure coverage with deductibles higher than we currently carry.
We do not own all of the land on which the projects in our portfolio are located.
Many of our projects are located on land occupied under long-term leases. The ownership interests in the land that we lease may be subject to mortgages securing loans or other liens and other easements, lease rights and rights-of-way of third parties, rights to develop minerals, including oil and gas, and other rights that were created prior to our rights in the land. As a result, our rights under such easements, leases or rights-of-way may be subject, and subordinate, to the rights of these third parties. Additionally, our operations located on properties owned by others are subject to termination for violation of the terms and conditions of the various easements, leases or rights-of-way under which such operations are conducted. Any loss or curtailment of our rights to use the land on which our projects are or will be located could have a material adverse effect on our business, financial condition, or results of operation.
We will be required to make substantial capital expenditures to develop the projects in our growth pipeline, repower existing assets and pursue new growth opportunities.
A variety of factors will affect our ability to execute on our growth strategy, including, but not limited to, market conditions, the failure of the assumptions we have made about our market opportunities to materialize, costs relating to site control and transmission interconnections, costs of materials, construction costs and delays and other risks and factors discussed herein. To the extent that our liquidity, together with cash flows generated by our operating assets, is not sufficient to fund our development projects, we may be obligated to seek equity or debt financing.
If we are unable to secure funding, or if it is only available on terms that we determine are not acceptable to us, we may be unable to fully execute our business plan and our business, financial condition or results of operations may be adversely affected. Additionally, we may need to adjust the timing of our planned capital expenditures, and project development and repower projects depending on the availability of such additional funding. Our ability to raise capital will depend on financial, economic and market conditions and other factors, many of which are beyond our control. We cannot assure you that such funding will be available on acceptable terms, or at all. Debt financing, if available, may subject us to restrictive covenants that could limit our
flexibility in conducting future business activities and could result in us expending significant resources to service our obligations.
Certain of our investments are subject to changes in market value and other risks, which may materially adversely affect our liquidity, financial condition and results of operations.
The Company holds certain investments where changes in the fair value affect our financial results. In some cases, there may be no observable market values for these investments, requiring fair value estimates to be based on other valuation techniques. This type of analysis requires significant judgment and the actual values realized in a sale of these investments could differ materially from those estimated. A sale of an investment below previously estimated value, or other decline in the fair value of an investment, could result in losses or the write-off of such investment, and may have a material adverse effect on our liquidity, financial condition and results of operations.
If the solar power industry experiences a shortage of key inputs, such as polysilicon, the profitability of solar power-producing projects may decrease, which may result in slower growth in the solar power market than we anticipate.
Solar power companies depend on certain technologies and key inputs, such as polysilicon. If the solar power industry experiences shortages of these technologies and key inputs, the profitability of the solar businesses in which we invest may be negatively impacted due to the resulting increase in prices of these technologies and key inputs. In addition, increases in polysilicon prices have in the past increased manufacturing costs for solar power producers and may impact manufacturing costs and net income or cause a shortage of polysilicon in the future. Polysilicon is also used in the semiconductor industry generally, and any increase in demand from that sector may cause a shortage. To the extent a shortage results in these types of technologies and key inputs due to price increases, the solar power market may experience slower growth than we anticipate.
The operating results of the projects in which we invest that produce solar power may be negatively affected by a number of factors.
In addition to shortages in technologies and key inputs and changes in governmental policies, the results of the projects in which we invest that produce solar power can be affected by a variety of factors, including the following:
•the average selling price of solar cells, solar panels and solar power systems;
•a decrease in the availability, pricing and timeliness of delivery of raw materials and components, particularly solar panels and components, including steel, necessary for solar power systems to function;
•the rate and cost at which solar power producers are able to expand their manufacturing and product assembly capacity to meet customer demand, including costs and timing of adding personnel;
•construction cost overruns, including those associated with the introduction of new products;
•the impact of seasonal variations in demand and/or revenue recognition linked to construction cycles and weather conditions;
•unplanned additional expenses such as manufacturing failures, defects or downtime;
•the impact of seasonal variations in sunlight on energy production;
•the impact of weather variations on energy production;
•acquisition and investment-related costs;
•the loss of one or more key customers or the significant reduction or postponement of orders from these customers;
•changes in manufacturing costs;
•the availability, pricing and timeliness of delivery of products necessary for solar power products to operate;
•changes in electric rates due to changes in fossil fuel prices;
•the lack of a viable secondary market for positions in solar energy projects; and
•the ability of a solar energy project to generate cash and pay yield substantially depends on power generation, which depends on the continuing productive capability of the solar energy hardware, including proper operations and maintenance of the solar energy hardware and fair sunlight for the life of the investment.
If wind conditions are unfavorable or below our estimates on any of our wind projects, the electricity production on such project and therefore, our income, may be substantially below our estimates.
The financial performance of our projects that produce wind energy will be dependent upon the availability of wind resources. The strength and consistency of wind resources at wind projects will vary. Weather patterns could change, or the historical data could prove to be an inaccurate reflection of the strength and consistency of the wind in the future. If wind resources are insufficient, the assumptions underlying the economic feasibility about the amount of electricity to be generated by wind projects will not be met, and the project’s income and cash flows will be adversely impacted. Wind-producing projects and our evaluations of wind projects will be based on assumptions about certain conditions that may exist and events that may occur in the future. A number of additional factors may cause the wind resource and energy capture at wind projects to differ, possibly materially, from those initially assumed by the project’s management, including: (1) the limited time period over which the site-specific wind data were collected; (2) the potential lack of close correlation between site-specific wind data and the longer-term regional wind data; (3) inaccurate assumptions related to wake losses and wind shear; (4) the limitations in the accuracy with which anemometers measure wind speed; (5) the inherent variability of wind speeds; (6) the lack of independent verification of the turbine power curve provided by the manufacturer; (7) the potential impact of global warming and other climatic factors, including icing and soiling of wind turbines; (8) the potential impact of topographical variations, turbine placement and local conditions, including vegetation; (9) the power delivery schedule being subject to uncertainty; (10) the inherent uncertainty associated with the use of models, in particular future-oriented models; and (11) the potential for electricity losses to occur before delivery.
Furthermore, a project’s wind resources may be insufficient for it to become and remain profitable. Wind is naturally variable. The level of electricity production at any of our wind projects, therefore, will also be variable. If there are insufficient wind resources at a project site due to variability, the assumptions underlying our belief about the amount of electricity to be generated by the wind project will not be met. Accordingly, there is no assurance that a project’s wind resources will be sufficient for it to become or remain profitable.
If our wind energy production assessments turn out to be wrong, our wind energy projects could suffer several material adverse consequences, including (i) our wind energy production and sales for the project may be significantly lower than we predict; (ii) our hedging arrangements may be ineffective or more costly; (iii) we may not produce sufficient energy to meet our commitments to sell electricity or RECs and, as a result, we may have to buy electricity or RECs on the open market to cover our obligations or pay damages; and (iv) our projects may not generate sufficient cash flow to make payments of principal and interest as they become due on the debt we provided on the project, and we may have difficulty refinancing such debt.
Our investmentsinvestment in a biomass facilitiesfacility may be negatively affected by our inability to maintain stockpiles of the products on which such facilitiesfacility operate and/or to source the necessary personnel to operate such facilities.facility.
The production of biomass facilities can be significantly affected by the supply of and demand for specific products and services, especially biomass such as corn, wood chips or soybean oil, the supply and demand for energy commodities, the price of capital expenditures, government regulation, world and regional events and economic conditions. Generally, we will need to maintain a sufficient stockpile of the specific products on which biomass facilities operate. Our investmentsinvestment in such facilitiesfacility may be negatively affected by any such supply and/or demand shortages.
In addition, investments in biomass facilities require a team of experienced personnel to manage such facilities and are, therefore, more susceptible than our other investments to shortages in experienced personnel.
Our investments in energy storage facilities may be negatively affected by a number of factors, including increases in storage costs, risk of fire and decreases in retail peak electricity pricing.
Energy storage is a segment of the energy markets that has experienced significant growth in recent years as storage costs have fallen. The continued growth of the energy storage industry depends on a number of uncertain factors, including continued decreases in storage costs. Our investments in energy storage facilities may be negatively affected by increases in storage costs and/or decreases in procurement of energy storage. Energy storage technologies are immature and, thus, the performance of such technologies is uncertain. To the extent we invest in lithium-ion battery storage systems, such systems may be subject to risk of fire due to the fire risk associated with lithium-ion batteries
In addition, our investments in energy storage systems may require us to guarantee an electricity customer’s utility bill cost savings by providing offsetting load during peak electricity consumption hours. If we are required to guarantee such cost savings and a customer’s cost savings decrease below the guaranteed amount, due to a decrease in retail peak electricity pricing or otherwise, we would be required to pay an amount equal to the difference between the customer’s actual cost savings and the guaranteed amount.
In our due diligence review of potential investments, we may rely on third-party consultants and advisors and representations made by sellers of potential portfolio projects, and we may not identify all relevant facts that may be necessary or helpful in evaluating potential investments.
Before making investments, due diligence will typically be conducted in a manner that we deem reasonable and appropriate based on the facts and circumstances applicable to each investment. Due diligence may entail evaluation of important and complex business, financial, tax, accounting, environmental and legal issues. Outside consultants, legal advisors, appraisers, accountants, independent engineers, investment banks and other third parties may be involved in the due diligence process to varying degrees depending on the type of investment, the costs of which will be borne by us. Such involvement of third-party advisors or consultants may present a number of risks primarily relating to our reduced control of the functions that are outsourced. In addition, if we are unable to timely engage third-party providers, the ability to evaluate and acquire more complex targets could be adversely affected. In the due diligence process and in making an assessment regarding a potential investment, the Company will rely on the resources available to it, including information provided by the target of the investment and, in some circumstances, third-party investigations. The due diligence investigation carried out with respect to any investment opportunity may not reveal or highlight all relevant facts that may be necessary or helpful in evaluating such investment opportunity, particularly for large portfolio investments. Moreover, such an investigation will not necessarily result in the investment being successful. There can be no assurance that attempts to provide downside protection with respect to investments, including pursuant to the risk management procedures described in this annual report, will achieve their desired effect, and potential investors should regard an investment in us as being speculative and having a high degree of risk.
There can be no guarantee that newly developed technologies that we invest in will perform as anticipated.
We may invest in and use newly developed, less proven, technologies in our development projects or in maintaining or enhancing our existing assets. There is no guarantee that such new technologies will perform as anticipated. The failure of a new technology to perform as anticipated may materially and adversely affect the profitability of a particular development project or existing asset. All new technology integrated on our sites goes through a rigorous review and approval process, adheres to all prudent industry codes and & standards relating to renewable energy production, and is integrated in small batches as a proof of concept before being rolled out to larger parts of our fleet.
Our investment management business is subjecthighly regulated and failure to risks.comply with the various rules and regulations of the jurisdictions in which we operate could have adverse effects.
In acquiring GCM, weWe have acquired a growing investment management business which is subject to risks. This business is extensively regulated by governmental agencies and other self-regulatory organizations in the U.S. and the foreign jurisdictions in which we operate. Any failure to comply with the various rules and regulations of these jurisdictions could result in liability or other risks, including the inability to carry on activities related to this line of our business, incurring additional expenses as a result of increased regulatory oversight, examinations relating to, among other things, antitrust law, anti-money laundering laws, anti-bribery laws, laws relating to foreign officials, tax laws and privacy laws and fines if we or GCM are deemed to have violated any regulations, and a decrease in profitability as a result of costs of complying with these regulatory matter and/or responding to any regulatory inquiries. Termination of advisory agreements with respect to GCM’s existing or future managed funds could also result in lost revenue for the Company and significant reputational damage impacting GCM’s ability to provide advisory services to other alternative investment funds. Any of these risks could have a material adverse effect on our business, financial condition and results of operations.
Risks Related to Debt Financing and Lending
We may need to incur financial leverage to be able to achieve our investment objectives. We cannot guarantee the availability of such financings.
To achieve our investment objectives, we may be required to utilize financial leverage. We may borrow money to make investments, for working capital, and to make distributions to our members. We are subject to the risk that we are unable to obtain financing at all or on commercial terms that are acceptable to us. Moreover, if we are able to obtain financing, we will be subject to the risk that our cash flow will not be sufficient to cover the required debt service payments and other risks associated with complying with required financial covenants. Our failure to comply with our obligations under these debt financings from time to time, may result in an event of default. A default, if not cured or waived, may permit acceleration of our indebtedness. If our indebtedness is accelerated, we may not have sufficient funds available to pay the accelerated indebtedness or the ability to refinance the accelerated indebtedness on terms favorable to us or at all. To the extent that we cannot meet our financing obligations, we risk the loss of some or all of our assets to liquidation or sale, at significantly
depressed prices in some cases due to market conditions or otherwise, to satisfy the obligations. Furthermore, any amounts that we use to service our indebtedness will not be available for distributions to our members.
As described below under Part II — Item 7. Management’s Discussion and Analysis of Financial Condition and Results of Operations — Liquidity and Capital Resources within this Annual Report, we were not in compliance with the debt service coverage ratio (as defined in the credit agreement) for the credit agreement related to GREC Entity HoldCo as of and for the fiscal quarter ended December 31, 2023. A default under the credit agreement permits the administrative agent, among other things, to declare all or any part of the outstanding principal amount of the loans under the credit agreement and related interest immediately due and payable. We are working in good faith with the lenders to secure a waiver of default. While we expect to receive a waiver of default, there is no guarantee that we will receive such waiver.
If we borrow money, the potential for gain or loss on the amounts invested in us will be magnified and may increase the risk of investing in us. Borrowed money may also adversely affect the return on our assets, reduce cash available for distribution to our members, and result in losses.
We currently use leverage to finance certain of our investments. We generally target a leverage ratio of up to $2 of debt for every $1 of equity on our overall portfolio, with individual allocations of leverage based on the mix of asset types and obligors; however, we will in no event exceed a leverage ratio of $3 of debt for every $1 of equity, unless any excess is approved by a majority of our independent directors. The amount of leverage that we employ will depend on our assessment of market and other factors at the time of any proposed borrowing. The Operating Agreement does not impose limits on the amount of leverage we may employ. There can be no assurance that leveraged financing will be available to us on attractive terms or at all. The use of leverage increases the volatility of investments by magnifying the potential for gain or loss on invested equity capital. If we use leverage to partially finance our investments, through borrowing from banks and other lenders, there will be an increased risk of investing in our shares. If the value of our assets decreases, leveraging would cause such value to decline more sharply than it otherwise would have had we not leveraged. Similarly, any decrease in our income would cause net income to decline more sharply than it would have had we not borrowed. Such a decline could negatively affect our ability to make distributions to our members.
We will be exposed to risks associated with changes in interest rates.
To the extent we borrow to finance our investments, we will be subject to financial market risks, including changes in interest rates. In response to increasing inflation,inflationary pressure, the Federal Reserve began to raiseand other global central banks raised interest rates in March 2022.2022 and 2023; however, we cannot predict with certainty any future action that the Federal Reserve and/or any other global central bank may take with respect to interest rates. An increase in interest rates, or the continuation of high interest rates, would make it more expensive to use debt for our financing needs. When we borrow, our net investment income will depend, in part, upon the difference between the rate at which we borrow funds and the rate at which we employ those funds. As a result, we can offer no assurance that a meaningful change in market interest rates will not have a material adverse effect on our net income. In periods of rising interest rates when we have debt outstanding, our cost of funds may increase, which could reduce our net investment income. We expect that our long-term fixed-rate investments will be financed primarily with equity and long-term debt. We may use interest rate risk management techniques to limit our exposure to interest rate fluctuations. These techniques may include borrowing at fixed rates or various interest rate hedging activities. These activities may limit our ability to participate in the benefits of lower interest rates with respect to the hedged portfolio. Adverse developments resulting from changes in interest rates or hedging transactions could have a material adverse effect on our business, financial condition and results of operations.
Cross-collateral arrangements among projects within our portfolio could expand the negative impact of a problem with one project to negatively affect other projects in our portfolio.
Certain of our projects are subject to cross-collateral arrangements pursuant to which their assets are pledged to secure obligations related to projects that our respective operating subsidiary does not own. Under the terms of these arrangements, the failure of one or more of our subsidiaries to perform its obligations under contracts related to one of our projects could allow the counterparty to foreclose on one or more projects that might otherwise not have been negatively affected. The result of a foreclosure event under a cross-collateral arrangement could amplify the negative impact of an issue that might have otherwise affected only the specific project for which the performance obligations were not satisfied and have a material adverse effect on our business, financial condition, and results of operations.
The discontinuation of the LIBOR may adversely affect interest expense related to our borrowings or the borrowings of our managed funds.
As of December 31, 2022, certain of our debt agreements are linked to the U.S. dollar LIBOR. Additionally, funds GCM manages hold a number of contracts that reference LIBOR.
As announced on March 5, 2021 by the ICE Benchmark Administration Limited (“IBA”), the IBA will cease the publication of LIBOR for the most commonly used U.S. dollar LIBOR tenors after June 30, 2023. The Alternative Reference Rates Committee (“AARC”), a steering committee comprised of large U.S. financial institutions convened by the U.S. Federal Reserve Board and the New York Federal Reserve, has recommended the SOFR as a more robust reference rate alternative to U.S. dollar LIBOR. The ARRC has also recommended the use of the CME Group’s computation of forward-looking SOFR term rates, subject to certain recommended limitations on the scope of its use. In March 2022, the Adjustable Interest Rate (LIBOR) Act was enacted at the federal level in the United States, pursuant to which the Board of Governors of the Federal Reserve System has designated benchmark replacement rates based on SOFR for U.S. law governed legacy contracts that have
no or insufficient fallback provisions. Market practices related to calculation conventions for replacement benchmark rates continue to develop and may vary, and inconsistent calculation conventions may develop among financial products. It is not possible to predict all consequences of the IBA's plans to cease publishing U.S. dollar LIBOR, any related regulatory actions and the expected discontinuance of the use of U.S. dollar LIBOR as a reference rate for financial contracts. Any transition from LIBOR to alternative reference rates could result in financial market disruptions, or significant increases in the borrowing costs for us, the funds we manage and their portfolio companies, any of which could have an adverse effect on our business, results of operations, and financial condition.
We are subject to credit and performance risk from customers, hedging counterparties and vendors.
We are exposed to risks associated with the creditworthiness and performance of ourtheir customers, hedging counterparties and vendors under contracts for the supply of equipment, materials and other goods and services required for our business operations and for the construction and operation of, and for capital improvements to, our facilities. Adverse conditions in the energy industry or the general economy, as well as circumstances of individual customers, hedging counterparties and vendors, may adversely affect the ability of some customers, hedging counterparties and vendors to perform as required under their contracts with us.
If any hedging, vending or other counterparty fails to fulfill its contractual obligations, we may need to make arrangements with other counterparties or vendors, which could result in material financial losses, higher costs, untimely completion of power generation facilities and other projects, and/or a disruption of our operations. If a defaulting counterparty is in poor financial condition, we may not be able to recover damages for any contract breach.
Risks Related to Our Shares
Our calculations of NAV and MSV are based on internally established procedures and not governed by governmental or independent securities, financial or accounting rules or standards.
The method we use to calculate NAV is based on internally established procedures to estimate fair value of our assets and is not prescribed by the rules of the SEC or any other regulatory agency. Therefore, NAV should not be considered in isolation from or as superior to or as a substitute for other financial measures determined in accordance with U.S. GAAP, such as net income (loss) or operating income (loss). Further, as of and after May 19, 2022, NAV is not audited by our independent registered public accounting firm. Our calculation of NAV is based on valuation estimates and assumptions that may not prove accurate or complete, and as a result the actual NAV may differ materially from our calculation. The Board of Directors has approved the selection of an independent valuation firm to review the Company's valuation methodology and to work with management to provide additional inputs for consideration by the Company's Board of Directors with respect to the fair value of investments. These fair value estimates and assumptions are inherently uncertain and are subject to a wide variety of significant business, economic, and competitive risks and uncertainties that could cause actual values to differ materially from the NAV presented herein. These risks could cause NAV to vary significantly and our future NAV may be materially lower than expected. To the extent those estimates and assumptions prove to be incorrect or are modified in the future, the price of our common shares could be materially and adversely affected. Using different assumptions and fair value estimates than those described above could result in a NAV materially different from ours. Furthermore, because other renewable energy companies may define NAV differently, our definition of NAV may not be comparable to a similarly titled measure of other companies, thereby diminishing its utility as a comparative measure.
The method we use to calculate our MSV, is based on internally established procedures and is not prescribed by the rules of the SEC or any other regulatory agency. Further, there are no accounting rules or standards that prescribe which components should be used in calculating MSV, and our MSV is not audited by our independent registered public accounting firm. We calculate and publish MSV solely for purposes of establishing the price of our common shares pursuant to our DRP and SRP, and for publishing the value of each shareholder’s investment in us on such investor’s customer account statement. Our MSV should not be viewed as a measure of our historical or future financial condition or performance. The components and methodology used in calculating our MSV may differ from those used by other companies now or in the future. Errors may occur in calculating our MSV, which could impact the price of our common shares pursuant to our DRP and SRP, and the value of our shareholder's investment in us.
Refer to Part II — Item 7. Management’s Discussion and Analysis of Financial Condition and Results of Operations — Non-GAAP Financial Measures — Net Asset Value and Monthly Share Value for further details on the calculation of NAV and MSV.
The shares that were sold in our security offerings will not be listed on an exchange or quoted through a quotation system for the foreseeable future, if ever. Therefore, when purchasing any class of shares, investors have limited liquidity and may not receive a full return of their invested capital if they sell their shares.
The shares offered by us are illiquid assets for which there is not expected to be any secondary market, nor is it expected that any will develop in the future. Investors' ability to transfer shares is limited. Pursuant to the Fifth Operating Agreement, we have the discretion under certain circumstances to prohibit transfers of shares, or to refuse to consent to the admission of a transferee as a member. Moreover, our shareBoard of Directors approved the suspension of our SRP effective September 23, 2023, except for repurchase programrequests made in connection with the death, disability or determination of incompetence of a shareholder. As a result of the suspension of the SRP, the Company will not accept or otherwise process any additional repurchase requests (except as noted above) until such time, if any, as the Board of Directors affirmatively authorizes the recommencement of the SRP. However, the Company can make no assurances as to whether this will happen, or the timing or terms of any recommencement. Even if recommenced, the SRP should not be relied on as a method to sell shares promptly, because our share repurchase programthe SRP includes numerous restrictions that limit investors' ability to sell their shares to us, and we may further amend, suspend or terminate our share repurchase programthe SRP at any time without advance notice. In particular, the share repurchase programSRP provides that we may make repurchase offers only to members that have held their shares for a minimum of one year, which one-year holding period will be waived in the event of the departure of certain of our key personnel. In addition, commencing with the quarter ended September 30, 2021, we have limitedThe SRP limits repurchases (i) during any 12-month period, to 20% of our weighted average number of outstanding shares; and (ii) during any fiscal quarter, to 5.00% of the weighted average number of shares outstanding in the prior four fiscal quarters. For the fiscal quarters prior to the quarter ended September 30, 2021, the share repurchase limits were lower, ranging from 1.25% of the weighted average number of shares outstanding in the prior four fiscal quarters to 3.75% of the weighted average number of shares outstanding in the prior four fiscal quarters.
Our ability to repurchase shares is subject to and may be limited by the Company’s available funds. Therefore, it will be difficult for investors to sell their shares promptly or at all. In addition, we have no present intention to consummate a liquidity event, and the price received for any shares sold prior to any such liquidity event is likely to be less than the proportionate value of our assets. The shares should be purchased as a long-term investment only.
Risks Related to Tax
Members may realize taxable income without cash distributions, and may have to use funds from other sources to fund tax liabilities.
Because we are taxed as a partnership for U.S. federal income tax purposes, members may realize taxable income in excess of cash distributions by us. There can be no assurance that we will pay distributions at a specific rate or at all. As a result, members may have to use funds from other sources to pay their tax liability.
In addition, the payment of any distribution fees over time with respect to certain classes of shares will be deemed to be paid from cash distributions that would otherwise be distributable to the holders of such classes of shares. Accordingly, the holders of such classes of shares will receive a lower cash distribution to the extent of such holders’ obligation to pay such fees. Because the payment of such fees is not a deductible expense for tax purposes, the taxable income of the Company allocable to the holders of such classes of shares may, therefore, exceed the amount of cash distributions made to such holders.
The U.S. IRS could adjust or reallocate items of income, gain, deduction, loss and credit with respect to the shares if the IRS does not accept the assumptions or conventions we utilize.
U.S. federal income tax rules applicable to partnerships are complex, and their application is not always clear. Moreover, the rules generally were not written for, and in some respects are difficult to apply to, publicly traded interests in partnerships. We apply certain assumptions and conventions intended to comply with the intent of the rules and to report income, gain, deduction, loss and credit to members in a manner that reflects members’ economic gains and losses, but these assumptions and conventions require judgment in application with the applicable Treasury regulations. It is possible therefore that the IRS will successfully assert that these assumptions or conventions do not satisfy the technical requirements of the Internal Revenue Code of 1986 (the “Internal Revenue Code”), and will require that items of income, gain, deduction, loss and credit be adjusted or reallocated in a manner that could be adverse to investors.
If we were to become taxable as a corporation for U.S. federal income tax purposes, we would be required to pay income tax at corporate rates on our net income, and distributions by us to members would constitute dividend income taxable to such members, to the extent of our earnings and profits.
While we plan to continue to operate so that we will qualify to be treated for U.S. federal income tax purposes as a partnership, and not as an association or a publicly traded partnership taxable as a corporation, given the highly complex nature of the rules governing partnerships, the ongoing importance of factual determinations, the lack of direct guidance with respect to the application of tax laws to the activities we are undertaking and the possibility of future changes in its circumstances, it is possible that we will not so qualify for any particular year. Our taxation as a partnership will depend on our ability to meet, on a
continuing basis, through actual operating results, the “qualifying income exception.” We expect to satisfy this exception by ensuring that most of our investments that do not generate “qualifying income” are held through taxable corporate subsidiaries. However, we may not properly identify income as “qualifying.” Accordingly, no assurance can be given that the actual results of our operations for any taxable year will satisfy the qualifying income exception.
If, for any reason, we become taxable as a corporation for U.S. federal income tax purposes, our items of income and deduction would not pass through to our members, and our members would be treated for U.S. federal income tax purposes as shareholders in a corporation. We would be required to pay income tax at corporate rates on our net income. Distributions by us to members would constitute dividend income taxable to such members, to the extent of our earnings and profits, and the payment of these distributions would not be deductible by us. These consequences would have a material adverse effect on us, our members and the value of the shares.
While it is expected that we will operate so that we will qualify to be treated for U.S. federal income tax purposes as a partnership, we expect that a significant portion of our investments will not generate “qualifying income,” and that we will conduct a significant portion of our operations through GREC, our wholly owned subsidiary treated as a C-corporation for U.S. federal income tax purposes and subject to U.S. federal income tax on its net income. Conducting our operations through GREC will allow us to effectively utilize tax incentives generated from projects in which we hold controlling equity stakes to reduce the taxable income generated by our other investments through tax incentives that are better utilized by C-corporations than other forms of entities. Because a significant portion of our investments will be held through GREC, the tax benefit of our being a partnership for U.S. federal income tax purposes will be limited to the income generated by the investments that we directly hold.
Indemnification claims by a tax equity investor, project lender, or other counterparty may reduce our right to cash flows generated by a project and could result in a cross-default under project-level debt financing.
Certain of our project subsidiaries have made representations, warranties, and covenants to tax equity investors,Tax Equity Investors, project lenders, or other counterparties with respect to, among other things, a project’s initial and continued eligibility for tax credits, the tax basis of those assets and accelerated tax depreciation, and fulfillment of obligations under construction contracts, purchase and sale agreements, tax equity financing documents, and certain other project and finance agreements. The potential exposure of our project subsidiaries under such representations, warranties, or covenants is significant, and in certain cases, we or our subsidiaries provide guarantees or undertakings with respect to such obligations that could result in substantial liabilities that are recourse to us or our subsidiaries and not limited to the specific project. If any representation, warranty, or covenant is untrue or breached, we or our subsidiary may be required to indemnify the tax equity investorsTax Equity Investors and the project subsidiary may be required to pay all of the project’s operating cash flow to the tax equity investorsTax Equity Investors until such indemnity obligation is satisfied. Any such indemnity obligation or cash sweep by us or our project subsidiary could result in a cross-default under the terms of the project’s debt or impose material liabilities on us or our other subsidiaries, and correspondingly have a material adverse effect on our business, financial condition, and results of operations.
ITEM 1B. UNRESOLVED STAFF COMMENTS
None.
ITEM 1C. CYBERSECURITY
Cybersecurity Program
As an energy transition, renewable energy and investment management company that acquires, constructs and operates renewable energy and energy efficient projects, as well as finances the construction and/or operation of these and other sustainable development projects and businesses and provides through GCM investment management services to funds within the sustainable infrastructure and renewable energy industry, cybersecurity risk management is an integral part of our overall enterprise risk management program.
A robust cybersecurity program to protect our assets from cyber and information security threats is critical to managing risk effectively. Our cybersecurity program is designed to align with internationally recognized information security standards and best practices. Our multi-layered data protection and information security programs and practices are designed to ensure the safety, security and responsible use of the information and data our stakeholders entrust to us. The approach blends defense-in-depth and zero-trust principles. Our cybersecurity program is periodically informed and assessed by third-party assessments and advice regarding best practices from consultants, business partners and advisors and incorporates benchmarking and other data from peer companies. We have processes for evaluating (among other things) the data protection and information security infrastructure of our third-party providers (including examining any relevant records such as service organization controls reports), and we seek to manage third-party risk with procedures to onboard our third-party providers, monitor their activity during our engagement (where possible) and off-board such third-party service providers at the end of our engagement.
We have implemented and maintain various measures to mitigate information security challenges, including maintaining an information security program, an enterprise resilience program, a business continuity program and cyber insurance coverage, as well as regularly testing our systems to discover and address any potential vulnerabilities. The Company also conducts periodic cybersecurity awareness training for employees and provides cybersecurity updates to its employees during regularly scheduled meetings. These updates are designed to educate employees and to raise awareness of cybersecurity threats to reduce vulnerability as well as to encourage consideration of cybersecurity risks.
We monitor and respond to a range of cyber threats, including threats and incidents associated with the use of services provided by third-party providers. We utilize automation and artificial intelligence enabled tools to address threats. Our cybersecurity framework for handling cybersecurity threats and incidents includes steps for identifying the nature of a cybersecurity threat, assessing the severity of the threat (including advancing to key members of management where appropriate for determination of potential materiality) and implementing cybersecurity processes and procedures to address the threat.
Despite our efforts to identify and respond to cybersecurity threats, we cannot eliminate all risks from cybersecurity threats, or provide assurances that we have not experienced an undetected cybersecurity incident. We are not aware of any risks from cybersecurity threats, including as a result of any cybersecurity incidents, which have materially affected or are reasonably likely to materially affect the Company, including our business strategy, results of operations, or financial condition. Refer to Part I —Item 1A. Risk Factors in this Annual Report, including “Cybersecurity risks could result in the loss of data, interruptions in our business and damage to our reputation, and subject us to regulatory actions, increased costs and financial losses, each of which could have a material adverse effect on our business and results of operations,” for additional discussion about cybersecurity-related risks.
Governance
Our Board of Directors and certain members of our senior management team have specific oversight responsibilities with respect to cybersecurity risk.
Board of Directors and Committee Oversight
Our Board of Directors is responsible for understanding the issues and risks that are central to our business, including cybersecurity matters. In general, our Board of Directors and senior management team coordinate to oversee our guidelines and policies with respect to risk assessment and risk management and the Audit Committee of our Board of Directors (the “Audit Committee”) discusses our financial and operational risk exposures, and the steps management has taken to monitor and control such exposures. In this context, the Audit Committee would be informed of a material cybersecurity incident that could impact our financial statements.
Senior Management’s Role in Managing Risk
We have a leadership group consisting of certain members of our senior management team that is responsible for assessing and managing risk and implementing policies, procedures and strategies pertaining to security governance and data privacy, that is led and informed by our VP of Technology who develops and oversees the programs, policies and controls we have implemented across the organization to reduce and prevent logical and physical risks, including information security and cyber risks to our people, intellectual property, data and tangible property. Our VP of Technology has over 20 years of relevant experience in roles such systems controls, audit, governance, software development/design, systems implementation, IT infrastructure operations, cybersecurity, and overall management of the technology function. Most of that experience has been in the energy and financial services sector. The Company has also engaged a third-party IT expert to assist the Company’s in-house IT function in managing cybersecurity risks and evaluating, monitoring, and testing the Company’s cybersecurity program.
How Senior Management is Informed of and Monitors Incidents
Certain members of our senior management team are responsible for identifying, considering and assessing material cybersecurity risks on an ongoing basis, establishing processes to ensure that such potential cybersecurity risks are monitored, implementing appropriate mitigation measures and maintaining our cybersecurity program. Our cybersecurity program is under the direction of our VP of Technology (in coordination with certain members of our senior management team), who receives reports from our information technology team and monitors the prevention, detection, mitigation and remediation of cybersecurity incidents. Certain members of our senior management team are notified as appropriate when the information technology team identifies an emerging risk or material issue.
Reporting to our Board of Directors
Given the importance of information security and privacy to our stakeholders, our Board of Directors receives an annual presentation from our senior management team discussing our program for managing information security risks, including cyber and data security risks. Our senior management team receives regular reports on our cybersecurity readiness, our risk profile status, our cybersecurity program, material cybersecurity risks and mitigation strategies, third-party assessments of our cybersecurity program and other cybersecurity developments. Our senior management team reports to the Board of Directors and the Audit Committee on such topics, as needed, and at regularly scheduled meetings of the Board of Directors and Audit Committee as part of the business, legal and regulatory update portions of such meetings.
ITEM 2. PROPERTIES
The Company maintains properties consisting of its executive offices located at 230 Park Avenue, Suite 1560, New York, NY 10169 and renewable energy projects which are adequate for its operations and are described in Item 1. Business, which description is incorporated herein by reference.
ITEM 3. LEGAL PROCEEDINGS
The Company is not currently subject to any material legal proceedings, nor, to its knowledge, is any material legal proceeding threatened against the Company.
ITEM 4. MINE SAFETY DISCLOSURES
Not applicable.
PART II
ITEM 5. MARKET FOR REGISTRANT’S COMMON EQUITY, RELATED MEMBER MATTERS AND ISSUER PURCHASES OF EQUITY SECURITIES
Current and Historical Monthly Share Values
There is no established public trading market for our common shares, therefore, there is a risk that a shareholder may not be able to sell our shares at a time or price acceptable to the shareholder, or at all. Unless and until our shares are listed on a national securities exchange, it is not expected that a public market for the shares will develop.
The MSV for each class of the Company'sCompany’s shares, and the dates they were effective, are as follows:
| | Period | Period | | Class | Period | | Class |
| From | From | | To | | A | | C | | I | | P-A | | P-I | | P-S | | P-T | | P-D | From | | To | | A | | C | | I | | P-A | | P-I | | P-S | | P-T | | P-D | | EO |
| 1-Feb-21 | | 28-Feb-21 | | $ | 8.550 | | | $ | 8.300 | | | $ | 8.550 | | | $ | 8.680 | | | $ | 8.960 | | | $ | 9.005 | | | $ | 9.005 | | | $ | 9.005 | |
| 1-Mar-21 | | 31-Mar-21 | | $ | 8.607 | | | $ | 8.351 | | | $ | 8.605 | | | $ | 8.731 | | | $ | 9.020 | | | $ | 9.005 | | | $ | 9.005 | | | $ | 9.005 | |
| 1-Apr-21 | | 2-May-21 | | $ | 8.607 | | | $ | 8.351 | | | $ | 8.605 | | | $ | 8.760 | | | $ | 9.019 | | | $ | 9.005 | | | $ | 9.005 | | | $ | 9.005 | |
| 3-May-21 | | 31-May-21 | | $ | 8.488 | | | $ | 8.241 | | | $ | 8.487 | | | $ | 8.682 | | | $ | 8.923 | | | $ | 8.994 | | | $ | 8.975 | | | $ | 8.968 | |
| 1-Jun-21 | | 30-Jun-21 | | $ | 8.488 | | | $ | 8.241 | | | $ | 8.487 | | | $ | 8.682 | | | $ | 8.923 | | | $ | 8.994 | | | $ | 8.975 | | | $ | 8.968 | |
| 1-Jul-21 | | 1-Aug-21 | | $ | 8.488 | | | $ | 8.241 | | | $ | 8.487 | | | $ | 8.682 | | | $ | 8.923 | | | $ | 8.994 | | | $ | 8.975 | | | $ | 8.968 | |
| 2-Aug-21 | | 31-Aug-21 | | $ | 8.466 | | | $ | 8.236 | | | $ | 8.466 | | | $ | 8.735 | | | $ | 8.914 | | | $ | 8.972 | | | $ | 9.012 | | | $ | 8.962 | |
| 1-Sep-21 | | 30-Sep-21 | | $ | 8.466 | | | $ | 8.236 | | | $ | 8.466 | | | $ | 8.735 | | | $ | 8.914 | | | $ | 8.972 | | | $ | 9.012 | | | $ | 8.962 | |
| 1-Oct-21 | | 31-Oct-21 | | $ | 8.466 | | | $ | 8.236 | | | $ | 8.466 | | | $ | 8.735 | | | $ | 8.914 | | | $ | 8.972 | | | $ | 9.012 | | | $ | 8.962 | |
| 1-Nov-21 | | 30-Nov-21 | | $ | 8.339 | | | $ | 8.128 | | | $ | 8.339 | | | $ | 8.630 | | | $ | 8.803 | | | $ | 8.852 | | | $ | 8.894 | | | $ | 8.859 | |
| | 1-Dec-21 | |
| | 1-Dec-21 | |
| | 1-Dec-21 | 1-Dec-21 | | 2-Jan-22 | | $ | 8.339 | | | $ | 8.128 | | | $ | 8.339 | | | $ | 8.630 | | | $ | 8.803 | | | $ | 8.852 | | | $ | 8.894 | | | $ | 8.859 | |
| 3-Jan-22 | 3-Jan-22 | | 31-Jan-22 | | $ | 8.339 | | | $ | 8.128 | | | $ | 8.339 | | | $ | 8.630 | | | $ | 8.803 | | | $ | 8.852 | | | $ | 8.894 | | | $ | 8.859 | |
| 1-Feb-22 | 1-Feb-22 | | 28-Feb-22 | | $ | 8.323 | | | $ | 8.129 | | | $ | 8.321 | | | $ | 8.619 | | | $ | 8.798 | | | $ | 8.858 | | | $ | 8.878 | | | $ | 8.842 | |
| 1-Mar-22 | 1-Mar-22 | | 31-Mar-22 | | $ | 8.323 | | | $ | 8.129 | | | $ | 8.321 | | | $ | 8.619 | | | $ | 8.798 | | | $ | 8.858 | | | $ | 8.878 | | | $ | 8.842 | |
| 1-Apr-22 | 1-Apr-22 | | 1-May-22 | | $ | 8.323 | | | $ | 8.129 | | | $ | 8.321 | | | $ | 8.619 | | | $ | 8.798 | | | $ | 8.858 | | | $ | 8.878 | | | $ | 8.842 | |
| 2-May-22 | 2-May-22 | | 31-May-22 | | $ | 8.323 | | | $ | 8.129 | | | $ | 8.321 | | | $ | 8.619 | | | $ | 8.798 | | | $ | 8.858 | | | $ | 8.878 | | | $ | 8.842 | |
| 1-Jun-22 | 1-Jun-22 | | 30-Jun-22 | | $ | 8.323 | | | $ | 8.129 | | | $ | 8.321 | | | $ | 8.619 | | | $ | 8.798 | | | $ | 8.858 | | | $ | 8.878 | | | $ | 8.842 | |
| 1-Jul-22 | 1-Jul-22 | | 31-Jul-22 | | $ | 8.323 | | | $ | 8.129 | | | $ | 8.321 | | | $ | 8.619 | | | $ | 8.798 | | | $ | 8.858 | | | $ | 8.878 | | | $ | 8.842 | |
| 1-Aug-22 | 1-Aug-22 | | 30-Aug-22 | | $ | 8.323 | | | $ | 8.129 | | | $ | 8.321 | | | $ | 8.619 | | | $ | 8.798 | | | $ | 8.858 | | | $ | 8.878 | | | $ | 8.842 | |
| 31-Aug-22 | 31-Aug-22 | | 2-Oct-22 | | $ | 8.493 | | | $ | 8.340 | | | $ | 8.500 | | | $ | 8.817 | | | $ | 8.987 | | | $ | 9.049 | | | $ | 9.059 | | | $ | 9.003 | |
| 3-Oct-22 | 3-Oct-22 | | 31-Oct-22 | | $ | 8.493 | | | $ | 8.340 | | | $ | 8.500 | | | $ | 8.817 | | | $ | 8.987 | | | $ | 9.049 | | | $ | 9.059 | | | $ | 9.003 | |
| 1-Nov-22 | 1-Nov-22 | | 30-Nov-22 | | $ | 8.301 | | | $ | 8.159 | | | $ | 8.300 | | | $ | 8.612 | | | $ | 8.801 | | | $ | 8.853 | | | $ | 8.863 | | | $ | 8.817 | |
| 1-Dec-22 | 1-Dec-22 | | 1-Jan-23 | | $ | 8.301 | | | $ | 8.159 | | | $ | 8.300 | | | $ | 8.612 | | | $ | 8.801 | | | $ | 8.853 | | | $ | 8.863 | | | $ | 8.817 | |
| 2-Jan-23 | 2-Jan-23 | | 31-Jan-23 | | $ | 8.301 | | | $ | 8.159 | | | $ | 8.300 | | | $ | 8.612 | | | $ | 8.801 | | | $ | 8.853 | | | $ | 8.863 | | | $ | 8.817 | |
| 1-Feb-23 | 1-Feb-23 | | 28-Feb-23 | | $ | 8.308 | | | $ | 8.185 | | | $ | 8.310 | | | $ | 8.626 | | | $ | 8.810 | | | $ | 8.872 | | | $ | 8.864 | | | $ | 8.828 | |
| 1-Mar-23 | 1-Mar-23 | | Current | | $ | 8.308 | | | $ | 8.185 | | | $ | 8.310 | | | $ | 8.626 | | | $ | 8.810 | | | $ | 8.872 | | | $ | 8.864 | | | $ | 8.828 | |
| 3-Apr-23 | |
| 1-May-23 | |
| 1-Jun-23 | |
| 3-Jul-23 | |
| 1-Aug-23 | |
| 1-Sept-23 | |
| 2-Oct-23 | |
| 31-Oct-23 | |
| 1-Dec-23 | |
| 2-Jan-24 | |
| 1-Feb-24 | |
| 1-Mar-24 | |
Refer to Part II — Item 7. Management’s Discussion and Analysis of Financial Condition and Results of Operations — Non-GAAP Financial Measures — Net Asset Value and Monthly Share Value for further discussion.
Holders
As of December 31, 2022,2023, the Company had approximately 10,70010,500 holders of its common shares. Such information was obtained from the Company’s transfer agent.
Distributions
The Company intends to make regular monthly distributions to holders of its common shares. Any distributions the Company makes will be at the discretion of the Board of Directors and will depend upon, among other things, the Company's earnings, financial condition, compliance with applicable regulations and such other factors as the Board of Directors may deem
relevant from time to time. These results and the Company'sCompany’s ability to pay distributions will be affected by various factors, including its net income, operating expenses and any other expenditures. See Part I — Item 1A. Risk Factors, and Part II — Item 7. Management’s Discussion and Analysis of Financial Condition and Results of Operations, of this Annual Report, for information regarding the sources of funds used for distributions and for a discussion of factors, if any, which may adversely affect the Company's ability to pay distributions.
The following table reflects the distributions declared during the year ended December 31, 2023:
| | | | | | | | | | | | | | | | | | | | |
| (in thousands) | | | | | | |
| Pay Date | | Paid in Cash | | Value of Shares Issued under DRP | | Total |
| February 1, 2023 | | $ | 7,386 | | | $ | 1,975 | | | $ | 9,361 | |
| March 1, 2023 | | 6,679 | | | 1,777 | | | 8,456 | |
| March 31, 2023 | | 7,420 | | | 1,942 | | | 9,362 | |
| May 1, 2023 | | 7,114 | | | 1,888 | | | 9,002 | |
| June 1, 2023 | | 7,373 | | | 1,934 | | | 9,307 | |
| July 3, 2023 | | 7,145 | | | 1,871 | | | 9,016 | |
| August 1, 2023 | | 7,232 | | | 1,926 | | | 9,158 | |
| September 1, 2023 | | 7,226 | | | 1,935 | | | 9,161 | |
| October 2, 2023 | | 7,003 | | | 1,872 | | | 8,875 | |
| November 2, 2023 | | 7,352 | | | 1,841 | | | 9,193 | |
| December 1, 2023 | | 7,964 | | | 1,746 | | | 9,710 | |
| January 2, 2024 | | 7,606 | | | 1,786 | | | 9,392 | |
| Total | | $ | 87,500 | | | $ | 22,493 | | | $ | 109,993 | |
The following table reflects the distributions declared during the year ended December 31, 2022:
| | | | | | | | | | | | | | | | | | | | |
| Pay Date | | Paid in Cash | | Value of Shares Issued under DRP | | Total |
| February 1, 2022 | | $ | 6,216,132 | | | $ | 1,856,347 | | | $ | 8,072,479 | |
| March 1, 2022 | | 5,712,141 | | | 1,720,315 | | | 7,432,456 | |
| April 1, 2022 | | 6,496,827 | | | 1,975,380 | | | 8,472,207 | |
| May 2, 2022 | | 6,291,008 | | | 1,934,690 | | | 8,225,698 | |
| June 1, 2022 | | 6,954,111 | | | 2,020,049 | | | 8,974,160 | |
| July 1, 2022 | | 7,344,811 | | | 1,889,655 | | | 9,234,466 | |
| August 1, 2022 | | 7,570,118 | | | 1,955,461 | | | 9,525,579 | |
| September 1, 2022 | | 7,564,952 | | | 1,973,079 | | | 9,538,031 | |
| October 3, 2022 | | 7,312,905 | | | 1,922,613 | | | 9,235,518 | |
| November 1, 2022 | | 7,507,085 | | | 1,986,513 | | | 9,493,598 | |
| December 1, 2022 | | 7,270,876 | | | 1,930,103 | | | 9,200,979 | |
| January 3, 2023 | | 7,702,756 | | | 1,967,527 | | | 9,670,283 | |
| Total | | $ | 83,943,722 | | | $ | 23,131,732 | | | $ | 107,075,454 | |
The following table reflects the distributions declared during the year ended December 31, 2021:
| | | | | | | | | | | | | | | | | | | | |
| Pay Date | | Paid in Cash | | Value of Shares Issued under DRP | | Total |
| February 1, 2021 | | $ | 2,555,800 | | | $ | 538,241 | | | $ | 3,094,041 | |
| March 4, 2021 | | 3,063,308 | | | 487,868 | | | 3,551,176 | |
| April 1, 2021 | | 4,783,092 | | | 523,715 | | | 5,306,807 | |
| May 3, 2021 | | 4,733,419 | | | 565,208 | | | 5,298,627 | |
| June 1, 2021 | | 4,762,355 | | | 886,124 | | | 5,648,479 | |
| July 1, 2021 | | 4,709,348 | | | 960,096 | | | 5,669,444 | |
| August 2, 2021 | | 5,217,796 | | | 1,071,227 | | | 6,289,023 | |
| September 1, 2021 | | 5,423,345 | | | 1,145,375 | | | 6,568,720 | |
| October 1, 2021 | | 5,516,811 | | | 1,229,494 | | | 6,746,305 | |
| November 1, 2021 | | 5,946,262 | | | 1,463,710 | | | 7,409,972 | |
| December 1, 2021 | | 5,938,698 | | | 1,662,579 | | | 7,601,277 | |
| January 3, 2022 | | 6,174,878 | | | 1,755,921 | | | 7,930,799 | |
| Total | | $ | 58,825,112 | | | $ | 12,289,558 | | | $ | 71,114,670 | |
| | | | | | | | | | | | | | | | | | | | |
| (in thousands) | | | | | | |
| Pay Date | | Paid in Cash | | Value of Shares Issued under DRP | | Total |
| February 1, 2022 | | $ | 6,216 | | | $ | 1,856 | | | $ | 8,072 | |
| March 1, 2022 | | 5,712 | | | 1,720 | | | 7,432 | |
| April 1, 2022 | | 6,497 | | | 1,975 | | | 8,472 | |
| May 2, 2022 | | 6,291 | | | 1,935 | | | 8,226 | |
| June 1, 2022 | | 6,954 | | | 2,020 | | | 8,974 | |
| July 1, 2022 | | 7,345 | | | 1,890 | | | 9,235 | |
| August 1, 2022 | | 7,570 | | | 1,955 | | | 9,525 | |
| September 1, 2022 | | 7,565 | | | 1,973 | | | 9,538 | |
| October 3, 2022 | | 7,313 | | | 1,923 | | | 9,236 | |
| November 1, 2022 | | 7,507 | | | 1,987 | | | 9,494 | |
| December 1, 2022 | | 7,271 | | | 1,930 | | | 9,201 | |
| January 3, 2023 | | 7,703 | | | 1,968 | | | 9,671 | |
| Total | | $ | 83,944 | | | $ | 23,132 | | | $ | 107,076 | |
All distributions paid for the year ended December 31, 20222023 are expected to be reported as a return of capital to members for tax reporting purposes, and all distributions paid for the year ended December 31, 20212022 were reported as a return of capital to members for tax purposes.
Performance Graph
Not applicable.
Sales of Unregistered Securities
Through the Company’s DRP, shareholders of all share classes may elect to purchase additional shares with distributions from the Company rather than receiving cash distributions. For the three months ended December 31, 2023, the Company issued 9.5 thousand Class P-A shares for net proceeds of $0.1 million, 0.3 million Class P-I shares for net proceeds of $2.4 million, 0.4 thousand Class P-D shares for net proceeds of $3.0 thousand, 0.2 million Class P-S shares for net proceeds of $1.3 million and 1.7 thousand Class P-T shares for net proceeds of $14.0 thousand under the DRP. For the three months ended December 31, 2022, the Company issued 8.3 thousand Class P-A shares for net proceeds of $0.1 million, 0.3 million Class P-I shares for net proceeds of $2.7 million, 0.3 thousand Class P-D shares for net proceeds of $3.0 thousand, 0.2 million Class P-S shares for net proceeds of $1.5 million, and 1.5 thousand Class P-T shares for net proceeds of $13.0 thousand, under the DRP. These issuances were made in reliance upon the applicable exemption from registration under Section 4(a)(2) of the Securities Act. No dealer manager fees, selling commissions or other sales charges were paid with respect to shares issued pursuant to the DRIP except for distribution fees on Class P-S and Class P-T Shares.
During the year ended December 31, 2022, we sold in a private offering 11,257,26711.3 million Class P-I shares for net proceeds of approximately $101.0 million and 713,1960.7 million Class P-S shares for net proceeds of approximately $6.4 million. In addition, in connection with the Acquisition, Group LLC received consideration of 24,393,02524.4 million Class P-I shares, which were valued at $8.81 per Class P-I share, or an aggregate value of approximately $214.9 million, net of deal related fees and expenses, and 13,071,15313.1 million Earnout Shares. We conducted the private offering pursuant to the applicable exemption from registration under Section 4(a)(2) of the Securities Act and Rule 506(b) of Regulation D promulgated under the Securities Act. The issuance of the Class P-I shares and the Earnout Shares to Group LLC in connection with the Acquisition was made in reliance upon the applicable exemption from registration under Section 4(a)(2) of the Securities Act. There were no selling commissions or placement agent fees for the sale of Class P-I shares and Class P-S shares in the private offering.
During the year ended December 31, 2021, the Company sold 711,897 Class P-A shares, 56,416,202 Class P-I, 197,405 Class P-D, 237,124 Class P-T and 46,075,796 Class P-S shares under a private placement memorandum for net proceeds of approximately $927.6 million. We conducted the private offering pursuant to the applicable exemption from registration under Section 4(a)(2) of the Securities Act and Rule 506(b) of Regulation D promulgated under the Securities Act. There were no selling commissions or placement agent fees for the sale of Class P-I shares and Class P-S shares in the private offering.
Issuer Purchases of Equity Securities
Effective September 1, 2020, theThe Company, through approval by its Board of Directors, adopted an amendedthe SRP, pursuant to which the Company willwould conduct quarterly share repurchases to allow members to sell all or a portion of their shares (of any class) back to the Company.Company at a price equal to the then current monthly share value for that class of shares.
On September 23, 2023, the Board of Directors approved the suspension of the SRP effective immediately, except for repurchase requests made in connection with the death, qualifying disability or determination of incompetence of a shareholder. As a result of the suspension of the SRP, the Company will not accept or otherwise process any additional repurchase requests (except as noted above) until such time, if any, as the Board of Directors affirmatively authorizes the recommencement of the SRP. However, the Company can make no assurances as to whether this will happen, or the timing or terms of any recommencement.
For the yearthree months ended December 31, 2022,2023, and in connection with the death, disability or determination of incompetence of a shareholder, the Company repurchased 832,31434.0 thousand Class A shares, 161,128nil Class C shares, 281,4623.0 thousand Class I shares, 1,160nil Class P-A shares, 3,821,9989.0 thousand Class P-I shares, 5,436nil Class P-D shares and 1,231,6288.0 thousand Class P-S shares at a total purchase price of $7.2$0.2 million, $1.3 million, $2.4 million, $10.0nil, $27.6 thousand, $33.7 million,nil, $0.1 million, nil and $11.0 million,$77.8 thousand, respectively, pursuant to the Company’s SRP. For the yearthree months ended December 31, 2021,2022, the Company repurchased 661,9260.4 million Class A shares, 85,82818.4 thousand Class C shares, 296,5750.1 million Class I shares, and 1,493,8681.2 thousand Class P-A shares, 3.0 million Class P-I shares and 0.2 million Class P-S shares at a total purchase price of $5.6$3.7 million, $0.7$0.2 million, $2.6$0.6 million, $10.0 thousand, $26.2 million and $13.3$1.5 million, respectively, pursuant to the Company’s SRP.
The table below provides information concerning the Company’s repurchase of shares during the yearsthree months ended December 31, 20222023 and 20212022, pursuant to the Company’s SRP.
| | | | | | | | | | | | | | | | | | | | | | | | | | |
| Period | | Total
Number of
Shares
Repurchased | | Average
Price Paid
per Share | | Total Number of Shares Purchased as Part of Publicly Announced Plans or Programs | | Maximum
Number of Repurchase
Shares
Offered |
| January 1 to March 31, 2022 | | 720,146 | | | $ | 8.71 | | | 720,146 | | | 7,125,628 | |
| April 1 to June 30, 2022 | | 576,790 | | | 8.94 | | | 576,790 | | | 7,941,211 | |
| July 1 to September 30, 2022 | | 1,349,690 | | | 8.92 | | | 1,349,690 | | | 8,830,961 | |
| October 1 to December 31, 2022 | | 3,688,500 | | | 8.73 | | | 3,688,500 | | | 9,409,681 | |
| Total - 2022 | | 6,335,126 | | | $ | 8.79 | | | 6,335,126 | | | 33,307,481 | |
| | | | | | | | |
| January 1 to March 31, 2021 | | 490,835 | | | $ | 8.76 | | | 490,835 | | | 1,742,360 | |
| April 1 to June 30, 2021 | | 734,959 | | | 8.81 | | | 734,959 | | | 3,309,562 | |
| July 1 to September 30, 2021 | | 452,514 | | | 8.60 | | | 452,514 | | | 5,126,281 | |
| October 1 to December 31, 2021 | | 859,889 | | | 8.76 | | | 859,889 | | | 5,990,988 | |
| Total - 2021 | | 2,538,197 | | | $ | 8.75 | | | 2,538,197 | | | 16,169,191 | |
| | | | | | | | |
| | | | | | | | |
| | | | | | | | |
| | | | | | | | |
| | | | | | | | |
| | | | | | | | |
| | | | | | | | | | | | | | | | | | | | | | | | | | |
| Period | | Total
Number of
Shares
Repurchased | | Average
Price Paid
per Share | | Total Number of Shares Purchased as Part of Publicly Announced Plans or Programs | | Maximum
Number of Repurchase
Shares
Offered |
| | | | | | | | |
| | | | | | | | |
| | | | | | | | |
| October 1 to December 31, 2023 | | 54,000 | | | $ | 7.67 | | | 54,000 | | | 9,820,630(1) |
| | | | | | | | |
| October 1 to December 31, 2022 | | 3,688,500 | | | $ | 8.73 | | | 3,688,500 | | | 9,409,681 | |
| | | | | | | | |
| | | | | | | | |
| | | | | | | | |
| | | | | | | | |
| | | | | | | | |
| | | | | | | | |
| | | | | | | | |
| | | | | | | | |
| | | | | | | | |
| | | | | | | | |
| | | | | | | | |
| | | | | | | | |
| | | | | | | | |
Commencing(1)On September 23, 2023, the Board of Directors approved the suspension of the SRP effective immediately, except for repurchase requests made in connection with the quarter ended September 30, 2021, we limitdeath, qualifying disability or determination of incompetence of a shareholder.
The SRP limits repurchases (i) during any 12-month period, to 20% of our weighted average number of outstanding shares; and (ii) during any fiscal quarter, to 5.00% of the weighted average number of shares outstanding in the prior four fiscal quarters. For the fiscal quarters prior to the quarter ended September 30, 2021, the share repurchase limits were lower, ranging from 1.25% of the weighted average number of shares outstanding in the prior four fiscal quarters to 3.75% of the weighted average number of shares outstanding in the prior four fiscal quarters.
ITEM 6. RESERVED
ITEM 7. MANAGEMENT’S DISCUSSION AND ANALYSIS OF FINANCIAL CONDITION AND RESULTS OF OPERATIONS
The following discussion and analysis should be read in conjunction with Greenbacker Renewable Energy Company LLC'sthe Company’s Consolidated Financial Statements and related notes and other financial information appearing elsewhere in this Annual Report for the year ended December 31, 2022.2023. The use of “we”, “us”, “our” and the “Company” refer, collectively to the Greenbacker Renewable Energy Company LLC and its subsidiaries, unless otherwise expressly stated or context otherwise requires. This Annual Report does not constitute an offer of any of the Company’s managed funds described herein.
Overview
Greenbacker Renewable Energy Company LLC (the “Company”) is a Delaware limited liability company formed in December 2012. The Company is an energy transition, renewable energy and investment management company that acquires, constructs and operates renewable energy and energy efficiency projects, as well as finances the construction and/or operation of these and other sustainable development projects and businesses and provides through GCM investment management services to funds within the sustainable infrastructure and renewable energy industry. As of December 31, 2022,2023, the Company’s fleet comprised 456435 renewable energy projects with an aggregate power production capacity of approximately 3.13.3 GW, when fully operational.which includes operating capacity of approximately 1.5 GW and pre-operational capacity of approximately 1.8 GW. As of December 31, 2022,2023, GCM serves as the registered investment adviser of four funds in the sustainable and renewable energy industry.
The Company conducts substantially all its operations through its wholly owned subsidiary, GREC. Until May 19, 2022, the Company was externally managed by GCM. As of and after May 19, 2022, the Company operates as a fully integrated and internally managed company after acquiring GCM and several other related entities, which are now wholly owned subsidiaries of GREC. The Company’s fiscal year-end is December 31.
The Company’s business objective is to generate attractive risk-adjusted returns for its shareholders, consisting of both current income and long-term capital appreciation, by acquiring and financing the construction and/or operation of income-generating renewable energy, energy efficiency and sustainable development projects, primarily within North America, as well as by providing investment management services to funds within the sustainable infrastructure and renewable energy industry where the Company expectexpects to receive investment management and incentive fees.
The Company operates with the capabilities of both an actively managed owner-operator of renewable energy businesses and as an active third-party investment manager of other funds within the sustainable infrastructure and renewable energy industry. The Company currently operates in two reportable segments: IPP and IM.
As of December 31, 2022,2023, the Company provides, through GCM, investment management services to four investment entities – GROZ, GDEV I, GDEV II and GREC II.
See Part I — Item 1. Business for a further discussion of our business.
Presentation of Key Factors Impacting Our Operating Results and Financial Condition
The results of our operations are affected by a number of factors and will primarily depend on, among other things,things: the supply of renewable energy assets in the marketplace; the revenues we receive from renewable energy and energy efficiency projects and businesses; the market price of electricity; the availability of government incentives; local, regional and national economies; general market conditions; and the amount of our assets that are operating versus those that are non-operatingpre-operating because they are currently under construction and the cost to construct such assets. Additionally, our operations are impacted by interest rates and the cost of financing provided by other financial market participants. Many of the factors that affect our operating results are beyond our control. The results of our operations are further affected by the growth of GCM'sGCM’s investment management platform and the related generation of management fee and incentive fee revenue. Additionally, our results of operations will be impacted by our ability to achieve synergies and economies of scale expected from the Acquisition.
General Market Risks
Our business and the success of our strategies are affected by global and national economic, political and market conditions generally and also by the local economic conditions where its assets are located. Certain external events such as public health crises including the COVID-19 and its variants,(such as COVID-19), natural disasters and geopolitical events, including the ongoing conflict between Russia, Belarus and Ukraine, and the more recent conflict between Israel and Hamas, have recently led to increased financial and credit market volatility and disruptions, leading to record inflationary pressure, rising interest rates, supply chain issues, labor shortages and recessionary concerns.
Although more normalized activities have resumed and there has been improvement due to global and domestic vaccination efforts, at this time we cannot predict the full extent of the impacts of the COVID-19 pandemic on the Company and the economy as a whole. Additionally, in In response to recent inflationary pressure, the U.S. Federal Reserve and other global central banks havehad raised interest rates in 2022 and have indicated likely further2023; however, we cannot predict with certainty any future action that the Federal Reserve and/or any other global central bank may take with respect to interest rate increases.rates. The full impact of such external events on the financial and credit markets and consequently on ourthe Company’s future financial conditions and results of operations is uncertain and cannot be fully predicted. We will continue to monitor these events and will adjust our operations as necessary.
Size of Fleet
The size of our fleet of operating renewable energy projects is a key revenue driver. Generally, as the size of our operating fleet grows, the amount of revenue we receive will increase. In addition, our fleet of renewable energy projects may grow at an uneven pace as opportunities to make investments in our target assets may be irregularly timed, and the timing and extent of our success in acquiring such assets cannot be predicted.
Credit Risk
We expect to encounter credit risk relating toto: (1) counterparties to the electricity sales agreements (including power purchase agreements) for our projects, (2) counterparties responsible for project construction and equipment supply, (3) companies in which we may invest, and (4) any potential debt financing we or our projects may obtain. When we are able to do so, we seek to mitigate credit risk by entering into contracts with high qualityhigh-quality counterparties. However, it is still possible that these counterparties may be unable to fulfill their contractual obligations to us.
If counterparties to the electricity sales agreements for our projects or the companies in which we invest are unable to make payments to us when due, or at all, our financial condition and results of operations could be materially adversely affected. While we seek to mitigate construction related credit risk by entering into contracts with high quality EPC companieshigh-quality EPCs with appropriate bonding and insurance capacity, if EPCs to the construction agreements for our projects are unable to fulfill their contractual obligations to us, our financial condition and results of operation could be materially adversely affected.
Pre-Operational Assets
The increasing amount of pre-operational renewable energy projects in our IPP business is a significant factor in our future revenue streams. AsFor pre-operational assets the Company acquires additional pre-operational assets,has previously acquired, we must finalize construction and reach commercial operations before revenue is generated. We believe these assets, once operational, will generate significant operating revenues and cash flow for our business.
Electricity Prices
Investments in renewable energy and energy efficiency projects and businesses expose us to volatility in the market prices of electricity. Although we generally seek projects that have long-term contracts, ranging from 10 to 25 years, which mitigate the effects of volatility in energy prices on our business, to the extent that our projects have shorter term contracts that have the potential of producing higher risk-adjusted returns, such shorter term contracts may subject us to risk should energy prices change.
Generally, our projects benefit from take-or-pay agreements with terms structured to take 100% of the power output. We believe the take-or-pay nature of our contracts is a significant factor in managing our exposure to the daily volatility of the electricity market prices. On average, the contracts in our existing operating portfolio have an approximate remaining life of 18 years.
Changes in Market Interest Rates
To the extent that we use debt financing with both hedged and unhedged floating interest rates, or in the case of any refinancing, general increases in interest rates over time may cause the interest expense associated with our borrowings to increase and the value of our debt investments to decline. Conversely, general decreases in interest rates over time may cause the interest expense associated with our borrowings to decrease and the value of our debt investments to increase.
Management Fee and Incentive Fee Revenue
Following the completion of the Acquisition, we no longer pay management fees or incentive fees, which had historically increased in correlation to the size of our portfolio. However, following the completion of the Acquisition, we will generate management fee and incentive fee revenue from the provision of investment management services through GCM'sGCM’s platform.
We will also earn administrative revenue, which will represent a reimbursement of costs incurred for such services for certain of our managed funds.
General and Administrative Expenses
Following the completion of the Acquisition, our general and administrative expenses primarily consist of direct employee compensation costs. In addition, our general and administrative expenses include certain professional fees, consulting, and other general and administrative expenses not previously incurred based upon our externally managed structure. Given our current team and structure, we expect that as our portfolio grows, we will experience reduced increases in general and administrative expenses in the next few years, after 2022, such that those expenses will grow at a slower rate than the overall portfolio and corresponding revenues.
Key Factors Affecting the Comparability of our Results of Operations
As a result of the Acquisition and other steps taken by the Company to transition the focus of the Company'sCompany’s business from being an investor in clean energy projects to a diversified independent power producer coupled with an investment management business, the Company was required to transition the basis of its accounting. Since inception, the Company's historical financial statements havehad been prepared using the investment company basis of accounting in accordance with ASC 946. ASC 946, or Investment Basis, requiresrequired that if there is a subsequent change in the purpose and design of an entity, the entity should reevaluate its status as an investment company. Based on the above noted changes, management determined the Company no longer exhibited the fundamental characteristics of and no longer qualified as an investment company as defined in ASC 946. As a result, the Company was required to discontinue the application of ASC 946 and, in connection therewith, began applying other non-investment company U.S. GAAP prospectively beginning May 19, 2022 (the closing of the Acquisition).
As the change in status occurred during the Company’s second fiscal quarter of 2022, the results of operations as included in this Annual Report have been presented as they would be for an investment company under ASC 946 for all historical periods presented and through May 18, 2022, and presented as they would be under other non-investment company U.S. GAAP accounting, orthe Non-Investment Basis, for the time period betweenas of and subsequent to May 19, 2022, the effective date of the change in status, through December 31, 2022 and for the three months ended December 31, 2022.status. Given that the financial statements prior to and subsequent to the change in status are not comparable, the Company will presentpresents separate Consolidated Financial Statements, including footnotes as applicable, for the time periods prior to and as of and subsequent to May 19, 2022.
In order to provide investors with more meaningful information regarding results of our operations, we present the following discussion of our results of operations. This information does not purport to represent our historical consolidated financial information, and it is not necessarily indicative of our future results of operations. However, in light of the significant differences that will exist between our future financial information and our historical consolidated financial information due to our transition to a Non-Investment Basis, as well as the Acquisition, we believe that this presentation will be useful to investors in understanding the historical performance of our assets.
Impact of Transition to Non-Investment Basis
As noted above, for periods prior to the completion of the Acquisition, our assets are reflected on our Consolidated Statements of Assets and Liabilities at fair value as opposed to historical cost. In addition, our Consolidated Statements of Operations do not reflect revenues and other income or operating and other expenses from these assets. Instead, these Consolidated Statements of Operations reflect the change in fair value of our assets, whether realized or unrealized. Income from our assets consists of distributions from the entities when received, or expected to be received, to the extent distributed from the estimated taxable earnings and profits of the underlying asset owningasset-owning vehicle and as a return of capital to the extent not in excess of estimated taxable earnings and profits. Because the majority of our assets consist of equity investments in entities established to own and operate our renewable energy projects, the majority of the revenue we generate is presented in the form of dividend income. Dividend income is not equivalent to the gross revenue produced at the project level, but is instead the amount of free cash that is distributed from the project entities to us from time to time after paying for all project-level expenses, remitting principal payments not funded by us, and complying with any specific project-level debt and tax equity covenants. Thus, the presentation of investment income in our historical financial statements differs from the traditional presentation shown in the financial statements of entities not prepared in accordance with ASC 946 and, most notably, is not equivalent to revenue as presented in financial statements not prepared in accordance with ASC 946.
Impact of Management Internalization
We completed the Acquisition on May 19, 2022. Accordingly, our financial statements under Non-Investment Basis reflect our transition to an internally managed structure. As a result, our financial statements no longer include the payment of
management fees to GCM and now include the direct compensation expense associated with all of our employees following the Acquisition.
The Company also has, by acquiring GCM, an active third-party investment management business which is currently managing four funds. This resulted in the Company recording management fee revenue as of the effective date of the Acquisition, which is expected to continue to grow in future periods.
Results
Year ended December 31, 2023 and the period from May 19, 2022 through December 31, 2022
A discussion of the results of operations for the three monthsyear ended December 31, 2023 and the period from May 19, 2022 through December 31, 2022 is included below.
| | For the three months ended December 31, 2022 |
| Independent Power Producer | Investment Management | Corporate | Total |
| (dollars in thousands) | | (dollars in thousands) | For the year ended December 31, 2023 | | For the period from May 19, 2022 through December 31, 2022 |
| Independent Power Producer | | | Independent Power Producer | | Investment Management | | Corporate | | Total | | Independent Power Producer | | Investment Management | | Corporate | | Total |
| Revenue | Revenue | |
| Energy revenue | |
| Energy revenue | |
| Energy revenue | Energy revenue | $ | 40,042,050 | | $ | — | | $ | — | | $ | 40,042,050 |
| Investment Management revenue | Investment Management revenue | — | | 1,510,113 | | — | | 1,510,113 |
| Other revenue | Other revenue | 2,133,911 | | — | | — | | 2,133,911 |
| Operating revenue | Operating revenue | $ | 42,175,961 | | $ | 1,510,113 | | $ | — | | $ | 43,686,074 |
| Contract amortization, net | Contract amortization, net | (4,267,844) | | — | | — | | (4,267,844) |
| Total revenue | Total revenue | $ | 37,908,117 | | $ | 1,510,113 | | $ | — | | $ | 39,418,230 |
| | Operating expenses | Operating expenses | | |
| Operating expenses | |
| Operating expenses | |
| Direct operating costs | |
| Direct operating costs | |
| Direct operating costs | Direct operating costs | $ | 20,699,289 | | $ | 4,349,732 | $ | — | | $ | 25,049,021 |
| General and administrative | General and administrative | 3,062,955 | | 2,113,884 | | 16,363,215 | | 21,540,054 |
| Depreciation, amortization and accretion | Depreciation, amortization and accretion | 15,606,309 | | — | | 3,157,257 | | 18,763,566 |
| | Impairment of long-lived assets | |
| Impairment of long-lived assets | |
| Impairment of long-lived assets | |
| Total operating expenses | Total operating expenses | $ | 39,368,553 | | $ | 6,463,616 | | $ | 19,520,472 | | $ | 65,352,641 |
| | Operating loss | $ | (1,460,436) | | $ | (4,953,503) | | $ | (19,520,472) | | $ | (25,934,411) |
Operating loss margin(1) | (4) | % | NM | N/A | (66) | % |
| Operating (loss) income | |
| Operating (loss) income | |
| Operating (loss) income | |
Operating (loss) income margin(1) | | Operating (loss) income margin(1) | (76)% | | (29)% | | N/A | | (102)% | | 11% | | NM | | N/A | | (40)% |
| | Adjusted EBITDA | Adjusted EBITDA | $ | 18,419,031 | | $ | (4,953,503) | | $ | (9,358,448) | | $ | 4,107,080 |
| Adjusted EBITDA | |
| Adjusted EBITDA | |
Adjusted EBITDA margin(2)(3) | Adjusted EBITDA margin(2)(3) | 44 | % | NM | N/A | 9 | % | Adjusted EBITDA margin(2)(3) | 37% | | (20)% | | N/A | | 18% | | 49% | | NM | | N/A | | 24% |
(1)Operating loss(loss) income margin is calculated by dividing operating loss(loss) income by total revenue.
(2)Adjusted EBITDA margin is calculated by dividing Adjusted EBITDA by total revenue, excluding the impact of contract amortization.operating revenue.
(3)The Company'sCompany’s CODM evaluates the financial performance of each segment using Segment Adjusted EBITDA, which excludes: (i) unallocated corporate expenses; (ii) interest expense; (iii) income taxes; (iv) depreciation expense; (v) amortization expense (including contract amortization); (vi) accretion; (vii) impairment of long-lived assets; (viii) share-based compensation; (viii)(ix) other non-recurring costs that are unrelated to the continuing operations of the Company'sCompany’s segments; and (ix)(x) amounts attributable to our redeemable and non-redeemable controlling interests. Additionally, the Company does not allocate foreign currency gains and losses, other income and losses, change in fair value of contingent consideration (if any), and unrealized gains and losses to our operating segments. See later in this Item 72 for a reconciliation of total Segment Adjusted EBITDA to net loss. See also Part II – Item 8 – Note 19.21. Segment Reporting, in the Notes to the Consolidated Financial Statements prepared under the Non-Investment Basis for more information regarding our segment determination.
Independent Power Producer
Energy Revenue
Energy revenue within the IPP segment primarily represents revenues associated with the sale of electricity under our long-term PPAs as well as from REC sales. The Company also generates energy revenue from capacity markets, whereby revenue is generated for our ability to meet peak demand if and when needed. The Company also generates revenues through performing energy optimization services for customers, which includes providing a battery storage system and services.
Intangible assets and liabilities recognized from PPAs and REC contracts related to the sale of energy or RECs in future periods for which the fair value has been determined to be less (more) than market are amortized to revenue over the term of each underlying contract on a straight-line basis.
For the three monthsyear ended December 31, 2022,2023, the Company generated $40.0$159.3 million of Energy revenue, which includes $30.9$134.6 million of PPA revenue and is driven by the underlying electricity production from our operating renewable energy projects. PPA revenue is impacted by the underlying availability of the natural resource (i.e., wind or solar) and the underlying mix of operating assets by technology type.
For Specifically, the three months ended December 31, 2022, Energy revenue was primarily comprised of PPA contracts of $30.9 million. The Company’s operating wind fleet, which includes 16 operating assets comprising 386.1 MW of capacity, generated $17.8 million in PPA revenue from 334,616 MWh of production during the three months ended December 31, 2022. The Company’s operating solar fleet, which includes 285 operating assets comprising 834.4 MW of capacity,and wind fleets generated $11.2$74.1 million in PPA revenue from 202,513 MWh of production during the three months ended December 31, 2022.and $53.9 million, respectively. The remaining PPA revenue generated during the three monthsperiod ended December 31, 20222023 was from our biomass and battery storage assets. PPA revenue generated by the Company’s wind fleet was partially impacted due to the Company engaging in three wind repower projects where the existing assets were strategically taken offline in order to repower them with new equipment including erecting taller, more efficient wind turbines to increase productivity.
DuringFor the three monthsyear ended December 31, 2022,2023, the Company recorded $8.3$20.8 million in REC and other incentive revenue, primarily from itsour operating solar fleet, which is included in Energy revenue in the table above and on the Consolidated StatementStatements of Operations.
During the three monthsyear ended December 31, 2022,2023, the Company recorded a net non-cash amortization expense of $4.3$8.1 million driven by favorable PPA and REC contract intangible assets, net of the impact of out-of-market contracts, which is reflected as a reduction to total IPP revenue in the table above and on the Consolidated StatementStatements of Operations.
Other Revenue - IPP
For the three months ended December 31, 2022, the Company generated $2.1 million of Other revenue from the IPP segment. Other revenue was driven by interest income generated from the Company’s secured loans to developers of renewable energy projects and dividends declared on equity method investments.
Direct Operating Costs - IPP
| | | | | |
| For the three months ended December 31,
2022 |
Operations and maintenance | $ | 12,058,910 | |
Property taxes, insurance and site lease | 4,953,692 | |
Salaries and benefits, professional fees and other | 3,686,687 | |
Direct operating costs - IPP | $ | 20,699,289 | |
Direct operating costs within the IPP segment represents the costs to operate our fleet of renewable energy projects, including operations and maintenance, site lease expense, project level insurance and property taxes, and other costs incurred at the project level. Additionally, the Company employs a dedicated team of technical asset managers to monitor the operational performance of the projects within IPP. The salaries, benefits and professional service costs directly related to the operations of IPP are included within Direct operating costs in the table above and on the Consolidated Statement of Operations. Direct operating costs excludes any depreciation, amortization and accretion expense.
Direct operating costs for the IPP segment was $20.7 million for the three months ended December 31, 2022. This includes $17.0 million of direct costs incurred at the project level as well as $3.7 million of salary and compensation related expenses as well as professional and other costs directly attributable to the revenue generating activities of IPP.
General and administrative
General and administrative expenses related to the IPP segment were $3.1 million for the three months ended December 31, 2022. These expenses are the indirect costs allocable to IPP and include primarily salary and compensation related expenses, professional service fees and other costs associated with the Company’s overhead functions. This primarily represents finance and accounting, information technology, human resources, legal and other functions providing indirect support to the IPP segment.
Depreciation, amortization and accretion
Depreciation, amortization and accretion expense was $15.6 million for the IPP segment for the three months ended December 31, 2022. This expense includes $15.3 million of depreciation expense on the property, plant and equipment associated with IPP.
Investment Management
Revenue
The IM segment and the related revenue will be driven primarily by GCM’s investment management platform through management fee and incentive, performance-based fee revenues from current and future third-party funds managed by GCM. The IM segment also will generate administrative revenue from certain of the managed funds, from services performed by Greenbacker Administration.
The primary source of IM revenues are management fees and performance participation fees earned. Management fee revenue earned by our IM business are generally based upon the underlying net asset value of the managed funds for which GCM provides investment management services, primarily relating to capital raise and deployment as well as other investor relation functions for third party funds. For certain of our IM customers, the Company is also eligible to receive certain performance-based incentive fees.
An additional revenue source for the IM segment will include, for certain managed funds, administrative services performed by Greenbacker Administration. These services include technical asset management, finance and accounting, legal and other costs incurred by the Company in performing its administrative services. GCM managed funds will be charged their allocable portion of such costs with no margin.
Revenue from the IM segment was $1.5 million for the three months ended December 31, 2022 and was generated from the managed funds discussed previously. As a result of the Company consolidating GDEV during the period October 1, 2022 through November 17, 2022, additional management fee revenue of $0.2 million earned under the advisory agreement with GDEV was considered intercompany revenue and was therefore eliminated in consolidation. During the period from November 18, 2022 through December 31, 2022, the Company earned $0.2 million in management fees from GDEV. The Company recognized $0.9 million in revenue related to GREC II performance-based incentive fees during the three months ended December 31, 2022. Due to GREC II’s early stage of development, the Company did not earn any management fees under the advisory agreement during the three months ended December 31, 2022. GREC II was launched in May 2022 and is currently in its fundraising stage and intends to deploy capital into pre-construction and operating renewable energy projects, as well as energy efficiency, battery storage, mobility and other related investments. The Company expects to receive management fee and administrative revenue from GREC II, as well as performance-based incentive fee revenue, with management fee revenue beginning in the first quarter of 2023.
Direct Operating Costs – IM
Direct operating costs within the IM segment represents the costs for the investment management services for the managed funds. This includes the costs to raise and deploy capital for such funds.
Direct operating costs for the IM segment were $4.3 million for the three months ended December 31, 2022. Direct operating costs primarily consisted of the salary and compensation related expenses for GCM’s dedicated professionals who raise capital and then invest it in renewable energy projects for the managed funds.
General and administrative
General and administrative expenses related to the IM segment were $2.1 million for the three months ended December 31, 2022. These expenses represent the indirect costs allocable to the IM segment and include primarily salary and compensation related expenses, professional service fees and other costs associated with the Company’s overhead functions supporting such third-party funds. This primarily represents finance and accounting, information technology, human resources, legal and other functions providing indirect support to the IM segment.
Corporate
Unallocated corporate expenses represent the portion of expenses relating to general corporate functions, including expenses associated with the Acquisition, certain finance, legal, information technology, human resources, administrative and
executive expenses, and other expenses not directly attributable to a reportable segment. Unallocated corporate expenses also include non-recurring professional fees associated with the Acquisition and change in status.
General and administrative expenses for Corporate were $16.4 million for the three months ended December 31, 2022. This included overhead costs not directly allocable to the Company’s two segments as well as professional fees associated with the Acquisition.
Depreciation, amortization and accretion expense was $3.2 million for the period ended December 31, 2022, which primarily relate to amortization expense on finite lived intangible assets.
Non-operating income and expense
During the three months ended December 31, 2022, the Company recorded $6.5 million of interest expense associated with outstanding debt. Refer to “Liquidity and Capital Resources” for additional discussion. Additionally, the Company recorded a net unrealized gain on investments of $4.8 million, primarily related to the Company’s investment in Aurora Solar. Additionally, the Company recorded a realized loss on interest rate swaps of $1.3 million. The impact of other non-operating income and expense for the period ended December 31, 2022 was not material.
A discussion of the results of operations for the period from May 19, 2022 through December 31, 2022 is included below.
| | | | | | | | | | | | | | |
| For the period from May 19, 2022 through December 31, 2022 |
| Independent Power Producer | Investment Management | Corporate | Total |
| Revenue | | | | |
| Energy revenue | $ | 101,595,947 | | $ | — | | $ | — | | $ | 101,595,947 |
| Investment Management revenue | — | | 1,918,911 | | — | | 1,918,911 |
| Other revenue | 7,505,530 | | — | | — | | 7,505,530 |
| Operating revenue | $ | 109,101,477 | | $ | 1,918,911 | | $ | — | | $ | 111,020,388 |
| Contract amortization, net | (10,529,266) | | — | | — | | (10,529,266) |
| Total revenue | $ | 98,572,211 | | $ | 1,918,911 | | $ | — | | $ | 100,491,122 |
| | | | |
| Operating expenses | | | | |
| Direct operating costs | $ | 48,713,974 | | $ | 7,174,721 | | $ | — | | $ | 55,888,695 |
| General and administrative | 6,769,425 | | 3,224,086 | | 35,448,835 | | 45,442,346 |
| Depreciation, amortization and accretion | 32,463,870 | | — | | 6,685,366 | | 39,149,236 |
| Total operating expenses | $ | 87,947,269 | | $ | 10,398,807 | | $ | 42,134,201 | | $ | 140,480,277 |
| | | | |
| Operating income (loss) | $ | 10,624,942 | | $ | (8,479,896) | | $ | (42,134,201) | | $ | (39,989,155) |
Operating income (loss) margin(1) | 11 | % | NM | N/A | (40) | % |
| | | | |
| Adjusted EBITDA | $ | 53,626,933 | | $ | (8,479,896) | | $ | (18,766,648) | | $ | 26,380,389 |
Adjusted EBITDA margin(2)(3) | 49 | % | NM | N/A | 24 | % |
(1)Operating income (loss) margin is calculated by dividing operating income (loss) by total revenue.
(2)Adjusted EBITDA margin is calculated by dividing Adjusted EBITDA by total revenue, excluding the impact of contract amortization.
(3)The Company's CODM evaluates the financial performance of each segment using Segment Adjusted EBITDA, which excludes: (i) unallocated corporate expenses; (ii) interest expense; (iii) income taxes; (iv) depreciation expense; (v) amortization expense (including contract amortization); (vi) accretion; (vii) share-based compensation; (viii) other non-recurring costs that are unrelated to the continuing operations of the Company's segments; and (ix) amounts attributable to our redeemable and non-redeemable controlling interests. Additionally, the Company does not allocate foreign currency gains and losses, other income and losses, change in fair value of contingent consideration (if any), and unrealized gains and losses to our operating segments. Seelater in this Item 7 for a reconciliation of total Segment Adjusted EBITDA to net loss. See also Part II – Item 8 – Note 19. Segment Reporting, in the Notes to the Consolidated Financial Statements prepared under the Non-Investment Basis for more information regarding our segment determination.
Independent Power Producer
Energy Revenue
Energy revenue within the IPP segment primarily represents revenues associated with the sale of electricity under our long-term PPAs as well as from REC sales. The Company also generates energy revenue from capacity markets, whereby revenue is generated for our ability to meet peak demand if and when needed. The Company also generates revenues through performing energy optimization services for customers, which includes providing a battery storage system and services.
Intangible assets and liabilities recognized from PPAs and REC contracts related to the sale of energy or RECs in future periods for which the fair value has been determined to be less (more) than market are amortized to revenue over the term of each underlying contract on a straight-line basis.
For the period from May 19, 2022 through December 31, 2022, the Company generated $101.6 million of Energy revenue, which includes $83.6 million of PPA revenue and is driven by the underlying electricity production from our operating renewable energy projects. PPA revenue is impacted by the underlying availability of the natural resource (i.e., wind or solar) and the underlying mix of operating assets by technology type.
For the period from May 19, 2022 through December 31, 2022, Energy revenue is primarily comprised of PPA contracts of $83.6 million. For the period from May 19, 2022 through December 31, 2022, the Company’s operating solar and wind fleets generated $39.6 million and $39.2 million, respectively, in PPA revenue. The remaining PPA revenue generated during the period endedfrom May 19, 2022 through December 31, 2022 was from our biomass and battery storage assets.
During the period from May 19, 2022 through December 31, 2022, the Company recorded $15.4 million in REC and other incentive revenue, primarily from our operating solar fleet, which is included in Energy revenue in the table above and on the Consolidated StatementStatements of Operations.
During the period from May 19, 2022 through December 31, 2022, the Company recorded a net non-cash amortization expense of $10.5 million driven by favorable PPA and REC contract intangible assets, net of the impact of out-of-market contracts, which is reflected as a reduction to total IPP revenue in the table above and on the Consolidated StatementStatements of Operations.
The Company’s operating solar fleet as of December 31, 2023 includes 324 operating assets comprising 1,124 MW of capacity, an increase of 39 operating assets and 289 MW capacity compared to the prior year end. In addition, total production was 1,473,384 MWh for the year ended December 31, 2023, an increase of 406,270 MWh compared to the prior year end. The increase is primarily due to under-construction projects entering commercial operation.
The Company’s operating wind fleet includes 16 operating assets comprising 389 MW of capacity, which is the same number of assets and an increase of 3 MW of capacity compared to the prior year end. In addition, total production was 978,236 MWh for the year ended December 31, 2023, a decrease of 220,000 MWh compared to the prior year end. This decrease in total production was primarily due to the Company engaging in three wind repower projects where the existing assets will be retrofit with new and/or refurbished technology, including erecting taller, more efficient wind turbines to increase production.
The table below provides summary statistics on the IPP fleet as of and for the years ended December 31, 20222023 and 2021. Given the Company’s change in status, the Energy revenue recorded on the Consolidated Statement of Operations is for the three months ended December 31, 2022.
| | Portfolio Metrics | Portfolio Metrics | December 31, 2022 | December 31, 2021 | Change | Change as % | Portfolio Metrics | December 31, 2023 | December 31, 2022 | Change | Change as % |
| Power-production capacity of operating fleet at end of period | Power-production capacity of operating fleet at end of period | 1,241 MW | 1,063 MW | 178 MW | 17 | % | Power-production capacity of operating fleet at end of period | 1.5 GW | 1.2 GW | 0.3 GW | 24 | % |
| Power-generating capacity of pre-operational fleet at end of period | Power-generating capacity of pre-operational fleet at end of period | 1,881 MW | 1,568 MW | 313 MW | 20 | % | Power-generating capacity of pre-operational fleet at end of period | 1.8 GW | 1.9 GW | (0.1) GW | (7) | % |
| Total power-generating capacity of fleet at end of period | Total power-generating capacity of fleet at end of period | 3,122 MW | 2,630 MW | 491 MW | 19 | % | Total power-generating capacity of fleet at end of period | 3.3 GW | 3.1 GW | 0.2 GW | 5 | % |
| | YTD total energy produced at end of period (MWh) | YTD total energy produced at end of period (MWh) | 2,355,735 | | 1,479,921 | | 875,814 | | 59 | % |
| YTD total energy produced at end of period (MWh) | |
| YTD total energy produced at end of period (MWh) | | 2,509,500 | | 2,355,735 | | 153,765 | | 7 | % |
| Total number of fleet assets at end of period | Total number of fleet assets at end of period | 456 | | 404 | | 52 | 13 | % | Total number of fleet assets at end of period | 435 | | 456 | 456 | | (21) | (21) | (5) | % |
Other Revenue - IPP
For the year ended December 31, 2023, the Company generated $8.4 million of Other revenue from the IPP segment. Total Other revenue was driven by dividends declared on equity method investments, primarily driven by Aurora Solar, and interest income generated from the Company’s secured loans to developers of renewable energy projects.
For the period from May 19, 2022 through December 31, 2022, the Company generated $7.5 million of Other revenue from the IPP segment. Total Other revenue was driven by dividends declared on equity method investments, primarily driven by Aurora Solar, and interest income generated from the Company’s secured loans to developers of renewable energy projects.
Direct Operating Costs - IPP
| | | | | |
| For the period from May 19, 2022 through December 31, 2022 |
Operations and maintenance | $ | 25,286,301 | |
Property taxes, insurance and site lease | 13,604,629 | |
Salaries and benefits, professional fees and other | 9,823,044 | |
Direct operating costs - IPP | $ | 48,713,974 | |
Direct operating costs within the IPP segment represents the costs to operate our fleet of renewable energy projects, including operations and maintenance, site lease expense, project level insurance and property taxes, and other costs incurred at the project level. Additionally, the Company employs a dedicated team of technical asset managers to monitor the operational performance of the projects within IPP. The salaries, benefits and professional service costs directly related to the operations of IPP are included within Direct operating costs in the table above and on the Consolidated Statement of Operations. Direct operating costs excludes any depreciation, amortization and accretion expense. | | | | | | | | | | | | | | | |
| (in thousands) | For the year ended December 31, 2023 | | For the period from May 19, 2022 through December 31, 2022 | | | | |
| Operations and maintenance | $ | 44,360 | | | $ | 25,286 | | | | | |
| Property taxes, insurance and site lease | 27,282 | | | 13,605 | | | | | |
| Salaries and benefits, professional fees and other | 20,269 | | | 9,823 | | | | | |
| Direct operating costs - IPP | $ | 91,911 | | | $ | 48,714 | | | | | |
Direct operating costs for the IPP segment werewas $91.9 million and $48.7 million for the year ended December 31, 2023 and the period from May 19, 2022 through December 31, 2022.2022, respectively. This includes $71.6 million and $38.9 million of direct costs incurred at the project level as well as $20.3 million and $9.8 million of salary and compensation related expenses as well as professional and other costs directly attributable to the revenue generating activities of IPP.IPP for the year ended December 31, 2023 and the period from May 19, 2022 through December 31, 2022, respectively.
General and administrative
General and administrative expenses related to the IPP segment were $14.0 million and $6.8 million for the year ended December 31, 2023 and the period from May 19, 2022 through December 31, 2022.2022, respectively. These expenses are the indirect costs allocable to IPP and include primarily salary and compensation related expenses, professional service fees and other costs associated with the Company’s overhead functions. This primarily represents finance and accounting, information technology, human resources, legal and other functions providing indirect support to the IPP segment.
Depreciation, amortization and accretion
Depreciation, amortization and accretion expense was $116.5 million for the IPP segment for the year ended December 31, 2023. This expense includes $62.0 million of depreciation expense on the property, plant and equipment associated with IPP. Additionally, in 2023, the Company engaged in three wind repower projects where the existing assets will be retrofit/replaced with new and/or refurbished technology, including erecting taller, more efficient wind turbines to increase productivity. Depreciation of such fixed assets replaced was accelerated between the mobilization milestone date in the related EPC contract and the date of taking such assets offline. Accelerated depreciation related to these three projects resulted in $51.9 million of additional depreciation during the year ended December 31, 2023. The remaining amount of the expense for the IPP segment related to accretion expense.
Depreciation, amortization and accretion expense was $32.5 million for the IPP segment for the period from May 19, 2022 through December 31, 2022. This expense includes $31.6 million of depreciation expense on the property, plant and equipment associated with IPP.
Impairment of long-lived assets
Impairment of long-lived assets expense from the IPP segment was $59.3 million for the year ended December 31, 2023. As discussed in Part II — Item 8 — Note 8. Property, Plant and Equipment, the Company determined that there was an impairment of an intangible asset contract, and as such, recorded a charge of $59.3 million associated with a certain renewable energy asset, of which $7.3 million was associated with the plant and equipment asset, and the remainder of which was associated with the favorable PPA contract. The Company did not record any impairment for the period from May 19, 2022 through December 31, 2022.
Investment Management
Revenue
TheRevenue from the IM segment was $13.5 million for the year ended December 31, 2023 and the related revenue will be driven primarily by GCM’s investment management platform through management fee and incentive, performance-based fee revenueswas generated from current and future third-party funds managed by GCM. The IM segment also will generate administrative revenue from certain of its managed funds, from services performed by Greenbacker Administration.
The primary source of IM revenues are management fees earned. Management fee revenue earned by our IM business are generally based upon the underlying net asset value of the managed funds for which GCM provides investmentdiscussed previously. IM revenue was driven by management services, primarily relating to capital raisefees, administrative fees and deployment as well as other investor relation functions for third party funds. For certain of our IM customers,performance participation fees. During the year ended December 31, 2023, the Company is also eligibleearned management fees of $2.4 million and $2.0 million from GDEV I and GDEV II, respectively. In addition, total revenue related to receive certain performance-based fees.
An additional revenue sourceGREC II was $9.1 million for the IM segment will include,year ended December 31, 2023, which consists of $3.9 million in revenue related to GREC II management fees, $1.7 million in performance-based incentive fees and $3.5 million in administrative fee revenue for certain managed funds, administrative services performed by Greenbacker Administration. These services include technical asset management, finance and accounting, legal and other costs incurred by the Company in performing its administrative services. GCM managed funds will be charged their allocable portionAdministration for GREC II.
Revenue from the IM segment was $1.9 million for the period from May 19, 2022 through December 31, 2022 and was generated from the managedGROZ and GDEV B funds discussed previously. As a result of the Company consolidating GDEV, additional management fee revenue of $0.9 million earned under the advisory agreement with GDEV iswas considered intercompany revenue and iswas therefore eliminated in consolidation for the period from May 19, 2022 through December 31, 2022. During the period from November 18,May 19, 2022 through December 31, 2022, the Company earned $0.2$0.9 million in managementof performance-based incentive fees from GDEV. Forrelated to GREC II.
Direct Operating Costs – IM
Direct operating costs for the IM segment were $13.7 million and $7.2 million for the year ended December 31, 2023 and the period from May 19, 2022 through December 31, 2022, the Company recognized $0.9 million in revenue related to GREC
II performance-based incentive fees. Due to GREC II's early stage of development, the Company did not earn any management fees under the advisory agreement during the period from May 19, 2022 through December 31, 2022. GREC II was launched in May 2022 and is currently in its fundraising stage and intends to deploy capital into pre-construction and operating renewable energy projects, as well as energy efficiency, battery storage, mobility and other related investments. The Company expects to receive management fee and administrative revenue from GREC II, as well as performance-based incentive fee revenue, with management fee revenue beginning in the first quarter of 2023.
Direct Operating Costs – IM
Direct operating costs within the IM segment represents the costs for the investment management services for the managed funds. This includes the costs to raise and deploy capital for such funds.
Direct operating costs for the IM segment were $7.2 million for the period from May 19, 2022 through December 31, 2022.respectively. Direct operating costs primarily consisted of the salary and compensation relatedcompensation-related expenses for GCM’s dedicated professionals who raise capital and then invest it in renewable energy projects for the managed funds. Such expenses also include marketing, other investor relations and legal costs associated with the IM segment.
General and administrative
General and administrative expenses related to the IM segment were $3.7 million and $3.2 million for the year ended December 31, 2023 and the period from May 19, 2022 through December 31, 2022.2022, respectively. These expenses represent the indirect costs allocable to the IM segment and include primarily salary and compensation relatedcompensation-related expenses, professional service fees and other costs associated with the Company’s overhead functions supporting such third-party funds. This primarily represents finance and accounting, information technology, human resources, legal and other functions providing indirect support to the IM segment.
Corporate
Unallocated corporateGeneral and administrative expenses representallocated to Corporate were $42.3 million for the portion of expenses relating to general corporate functions, including expenses associated with the Acquisition, certain finance, legal, information technology, human resources, administrative and executive expenses, and other expensesyear ended December 31, 2023. This included overhead costs not directly attributableallocable to a reportable segment. Unallocated corporate expenses also include non-recurring professional fees associated with the Acquisition and change in status.Company’s two segments.
General and administrative expenses for Corporate were $35.4 million for the period from May 19, 2022 through December 31, 2022. This included overhead costs not directly allocable to the Company’s two segments as well as professional and legal fees associated with the Acquisition.
Depreciation, amortization and accretion expenses were $9.2 million and $6.7 million for the year ended December 31, 2023 and the period from May 19, 2022 through December 31, 2022, respectively, which primarily relate to amortization expense on finite livedfinite-lived intangible assets.
Non-operating income and expense
During the year ended December 31, 2023, the Company recorded $40.5 million of net interest expense which primarily consists of interest expense associated with outstanding debt. Refer to “Liquidity and Capital Resources” below for additional discussion. The Company recorded a net unrealized gain of $0.9 million on investments driven by the Company’s investments in Aurora Solar and GDEV I, offset by an unrealized loss on the Company’s investment in OYA. Additionally, the Company recorded an unrealized gain on interest rate swaps of $17.8 million related to designated and not-designated interest rate swaps. The impact of other non-operating income and expense for the year ended December 31, 2023 was not material.
During the period from May 19, 2022 through December 31, 2022, the Company recorded $15.9 million of interest expense associated with outstanding debt. Refer to “Liquidity and Capital Resources” below for additional discussion. The Company recorded a net unrealized gain on investments of $0.4 million, driven by an unrealized gain on GDEV offset by unrealized losses on Aurora Solar. Additionally, the Company recorded a realized loss on interest rate swaps of $1.3 million. The impact of other non-operating income and expense for the period from May 19, 2022 through December 31, 2022 was not material.
Segment Adjusted EBITDA
ASC Topic 280, Segment Reporting establishes standards for reporting information about operating segments. Operating segments are defined as components of an enterprise where discrete financial information is available and evaluated regularly by the CODM, or decision-making group, in deciding how to allocate resources and in assessing performance. The Company’s CODM is its Chief Executive Officer. The Company manages its business as two operating segments and two reportable segments – IPP and IM. Segment information is consistent with how the CODM reviews the business, makes resource allocation decisions, and assesses performance.
The Company determines its operating segments and reports segment information in accordance with how the Company’s CODM allocates resources and assesses performance. The CODM of the Company uses Segment Adjusted EBITDA to evaluate the financial performance of and allocate resources among our operating segments. Also see Part II — Item 8 — Note 19. Segment Reporting, in the Notes to the Consolidated Financial Statements prepared under the Non-Investment Basis for more information regarding our segment determination.
The Company's CODM evaluates the financial performance of each segment using Segment Adjusted EBITDA, which excludes: (i) unallocated corporate expenses; (ii) interest expense; (iii) income taxes; (iv) depreciation expense; (v) amortization expense (including contract amortization); (vi) accretion; (vi) share-based compensation; (vii) other non-recurring costs that are unrelated to the continuing operations of the Company's segments; and (viii) amounts attributable to our redeemable and non-redeemable controlling interests. Additionally, the Company does not allocate foreign currency gains and losses, other income and losses, change in fair value of contingent consideration (if any), and unrealized gains and losses to our operating segments.
Segment Adjusted EBITDA is determined for our segments consistent with the adjustments noted above for but further excludes unallocated corporate expenses, including non-recurring professional fees associated with the Acquisition and change in status, as these items are centrally controlled and are not directly attributable to any reportable segment.
The following table reconciles total Segment Adjusted EBITDA to Net income (loss)loss attributable to Greenbacker Renewable Energy Company LLC:
| | For the three months ended December 31, 2022 | | For the period from May 19, 2022 through December 31, 2022 |
| (in thousands) | | (in thousands) | For the year ended December 31, 2023 | | For the period from May 19, 2022 through December 31, 2022 |
| Segment Adjusted EBITDA: | Segment Adjusted EBITDA: | | | |
| IPP Adjusted EBITDA | |
| IPP Adjusted EBITDA | |
| IPP Adjusted EBITDA | IPP Adjusted EBITDA | $ | 18,419,031 | | | $ | 53,626,933 | |
| IM Adjusted EBITDA | IM Adjusted EBITDA | (4,953,503) | | | (8,479,896) | |
| Total Segment Adjusted EBITDA | Total Segment Adjusted EBITDA | $ | 13,465,528 | | | $ | 45,147,037 | |
| | Reconciliation: | Reconciliation: | |
| Reconciliation: | |
| Reconciliation: | |
| Total Segment Adjusted EBITDA | |
| Total Segment Adjusted EBITDA | |
| Total Segment Adjusted EBITDA | Total Segment Adjusted EBITDA | $ | 13,465,528 | | | $ | 45,147,037 | |
| Unallocated corporate expenses | Unallocated corporate expenses | (9,358,448) | | | (18,766,648) | |
| Total Adjusted EBITDA | Total Adjusted EBITDA | 4,107,080 | | | 26,380,389 | |
| | Less: | Less: | |
| Less: | |
| Less: | |
| Share-based compensation expense | |
| Share-based compensation expense | |
| Share-based compensation expense | Share-based compensation expense | 2,726,900 | | | 6,903,931 | |
| Change in fair value of contingent consideration | Change in fair value of contingent consideration | 1,300,000 | | | 2,100,000 | |
| Non-recurring professional fees associated with the Acquisition and change in status | 2,893,260 | | | 7,593,649 | |
| Non-recurring professional services and legal fees | |
| Non-recurring salaries and personnel related expenses | |
Depreciation, amortization and accretion(1) | Depreciation, amortization and accretion(1) | 23,121,330 | | | 49,771,964 | |
| | Impairment of long-lived assets | |
| Impairment of long-lived assets | |
| Impairment of long-lived assets | |
| | Operating loss | |
| Operating loss | |
| Operating loss | Operating loss | $ | (25,934,410) | | | $ | (39,989,155) | |
| | Interest expense, net | Interest expense, net | (6,509,062) | | | (15,889,125) | |
| Realized loss on interest rate swaps, net | (1,322,219) | | | (1,322,219) | |
| Unrealized loss on interest rate swaps, net | (249,150) | | | (249,150) | |
| Interest expense, net | |
| Interest expense, net | |
| Realized gain (loss) on interest rate swaps, net | |
| Unrealized gain (loss) on interest rate swaps, net | |
| Unrealized gain on investments, net | Unrealized gain on investments, net | 4,750,173 | | | 398,479 | |
| Other income (expense), net | 363,849 | | | (107,890) | |
| Other expense, net | |
| Net loss before income taxes | Net loss before income taxes | $ | (28,900,819) | | | $ | (57,159,060) | |
| | Provision for income taxes | (4,123,471) | | | (3,005,119) | |
| Benefit from (provision for) income taxes | |
| Benefit from (provision for) income taxes | |
| Benefit from (provision for) income taxes | |
| Net loss | Net loss | $ | (33,024,290) | | | $ | (60,164,179) | |
| | Less: Net loss attributable to noncontrolling interests | Less: Net loss attributable to noncontrolling interests | (35,340,385) | | | (59,439,202) | |
| Net income (loss) attributable to Greenbacker Renewable Energy Company LLC | $ | 2,316,095 | | | $ | (724,977) | |
| Less: Net loss attributable to noncontrolling interests | |
| Less: Net loss attributable to noncontrolling interests | |
| Less: Net income attributable to redeemable noncontrolling interests | |
| Net loss attributable to Greenbacker Renewable Energy Company LLC | |
(1)Includes contract amortization, net in the amount of $4.3$8.1 million and $10.5 million for the three monthsyear ended December 31, 20222023 and for the period from May 19, 2022 through December 31, 2022, respectively, which is included in Contract amortization, net on the Consolidated StatementStatements of Operations.
Non-GAAP Financial Measures
In addition to evaluating the Company’s performance on a U.S. GAAP basis, the Company utilizes certain non-GAAP financial measures to analyze the operating performance of our consolidated business (Adjusted EBITDA and FFO). Each of these measures should not be considered in isolation from or as superior to or as a substitute for other financial measures determined in accordance with U.S. GAAP, such as net income (loss) or operating income (loss). The Company uses these non-GAAP financial measures to supplement its U.S. GAAP results in order to provide a more complete understanding of the factors and trends affecting its operations.
You are encouraged to evaluate the adjustments to Adjusted EBITDA and FFO, including the reasons the Company considers them appropriate for supplemental analysis. The presentations of Adjusted EBITDA and FFO should not be construed as an inference that the future results the Company will be unaffected by unusual or nonrecurring items.
The Company further utilizes non-GAAP financial measures to determine the NAV and MSV of our shares.
Adjusted EBITDA
Adjusted EBITDA is a non-GAAP financial measure that the Company uses as a performance measure as well as for internal planning purposes. We believe that Adjusted EBITDA is useful to management and investors in providing a measure of core financial performance adjusted to allow for comparisons of results of operations across reporting periods on a consistent basis as it includes adjustments relating to items that are not indicative on the ongoing operating performance of the business.
The Company defines Adjusted EBITDA as net income (loss) before: (i) interest expense; (ii) income taxes; (iii) depreciation expense; (iv) amortization expense (including contract amortization); (v) accretion; (vi) impairment of long-lived assets; (vii) amounts attributable to our redeemable and non-redeemable noncontrolling interests; (vii)(viii) unrealized gains and losses on financial instruments; (viii)(ix) other income (loss); and (ix)(x) foreign currency gain (loss). Additionally, the Company further adjusts for the following items described below:
•Share-based compensation is excluded from Adjusted EBITDA as it is different from other forms of compensation as it is a non-cash expense and is highly variable. For example, a cash salary generally has a fixed and unvarying cash cost. In contrast, the expense associated with an equity-based award is generally unrelated to the amount of cash ultimately received by the employee, and the cost to the Company is based on a share-based compensation valuation methodology and underlying assumptions that may vary over time;
•The change in fair value of contingent consideration, which is related to the Acquisition, is excluded from Adjusted EBITDA, if any such change occurs during the period. The non-cash, mark-to-market adjustments are based on the expected achievement of revenue targets that are difficult to forecast and can be variable, making comparisons across historical and future quarters difficult to evaluate; and
•Other costs that are not consistently occurring, not reflective of expected future operating expense and provide no insight into the fundamentals of current or past operations of our business are excluded from Adjusted EBITDA. This includes costs such as professional services and legal fees, some of which were incurred as part of the Acquisition andtransition to the change in statusNon-Investment Basis, and other non-recurring costs unrelated to the ongoing operations of the Company.
Adjusted EBITDA is a performance measure used by management that is not calculated in accordance with U.S. GAAP. Adjusted EBITDA should not be considered in isolation from or as superior to or as a substitute for net income (loss), operating income (loss) or any other measure of financial performance calculated in accordance with U.S. GAAP. Additionally, our calculations of Adjusted EBITDA may not be comparable to similarly titled measures reported by other companies.
The following table reconciles Net income (loss)loss attributable to Greenbacker Renewable Energy Company LLC to Adjusted EBITDA:
52 | | | | | | | | | | | | | | | |
| (in thousands) | | | | | For the year ended December 31, 2023 | | For the period from May 19, 2022 through December 31, 2022 |
| Net loss attributable to Greenbacker Renewable Energy Company LLC | | | | | $ | (79,471) | | | $ | (724) | |
| Add back or deduct the following: | | | | | | | |
| Net loss attributable to noncontrolling interests | | | | | (96,935) | | | (59,439) | |
| Net income attributable to redeemable noncontrolling interests | | | | | 819 | | | — | |
| (Benefit from) provision for income taxes | | | | | (21,548) | | | 3,005 | |
| Interest expense, net | | | | | 40,519 | | | 15,889 | |
| Realized (gain) loss on interest rate swaps, net | | | | | (2,428) | | | 1,322 | |
| Unrealized (gain) loss on interest rate swaps, net | | | | | (17,763) | | | 249 | |
| Unrealized (gain) on investments, net | | | | | (932) | | | (398) | |
| Other expense, net | | | | | 267 | | | 108 | |
Depreciation, amortization and accretion(1) | | | | | 134,647 | | | 49,772 | |
| EBITDA | | | | | $ | (42,825) | | | $ | 9,784 | |
| Share-based compensation expense | | | | | 11,248 | | | 6,903 | |
| Change in fair value of contingent consideration | | | | | (603) | | | 2,100 | |
| | | | | | | |
| Impairment of long-lived assets | | | | | 59,294 | | | — | |
| | | | | | | |
| Non-recurring professional services and legal fees | | | | | 3,388 | | | 7,593 | |
| Non-recurring salaries and personnel related expenses | | | | | 1,250 | | | — | |
| Adjusted EBITDA | | | | | $ | 31,752 | | | $ | 26,380 | |
| | | | | | | | | | | |
| For the three months ended December 31, 2022 | | For the period from May 19, 2022 through December 31, 2022 |
| Net income (loss) attributable to Greenbacker Renewable Energy Company LLC | $ | 2,316,095 | | | $ | (724,977) | |
| Add back or deduct the following: | | | |
| Net loss attributable to noncontrolling interests | (35,340,385) | | | (59,439,202) | |
| Provision for income taxes | 4,123,471 | | | 3,005,119 | |
| Interest expense, net | 6,509,062 | | | 15,889,125 | |
| Realized loss on interest rate swaps, net | 1,322,219 | | | 1,322,219 | |
| Unrealized loss on interest rate swaps, net | 249,150 | | | 249,150 | |
| Unrealized gain on investments, net | (4,750,173) | | | (398,479) | |
| Other (income) expense, net | (363,849) | | | 107,890 | |
Depreciation, amortization and accretion(1) | 23,121,330 | | | 49,771,964 | |
| EBITDA | $ | (2,813,080) | | | $ | 9,782,809 | |
| Share-based compensation expense | 2,726,900 | | | 6,903,931 | |
| Change in fair value of contingent consideration | 1,300,000 | | | 2,100,000 | |
| Non-recurring professional fees associated with the Acquisition and change in status | 2,893,260 | | | 7,593,649 | |
| Adjusted EBITDA | $ | 4,107,080 | | | $ | 26,380,389 | |
(1) Includes contract amortization, net in the amount of $4.3$8.1 million and $10.5 million for the three monthsyear ended December 31, 20222023 and for the period from May 19, 2022 through December 31, 2022, respectively, which isare included in Contract amortization, net on the Consolidated StatementStatements of Operations.
FFO
FFOFunds from Operations (“FFO”) is a non-GAAP financial measure that the Company uses as a performance measure to analyze net earnings from operations without the effects of certain non-recurring items that are not indicative of the ongoing operating performance of the business.
FFO is calculated using Adjusted EBITDA less the impact of interest expense (excluding the non-cash component) and distributions to tax equity investorsTax Equity Investors under the financing facilities associated with our IPP segment. The Company does not include any distributions made to GDEV limited partners in the calculation of FFO. For the period from May 19, 2022 through December 31, 2022, the distributions to the limited partners were the result of an exit from a historical investment whereby GDEV collected on an existing loan made to a third-party and distributed a portion of the proceeds to the limited partners. For the year ended December 31, 2023, there were no distributions made to GDEV limited partners as a result of the sale in the fourth quarter of 2022 (refer to Note 2. Significant Accounting Policies in the Notes to the Consolidated Financial Statements for further detail). The Company excludes these distributions as the underlying source of distribution (collection of a loan) is not recorded within Adjusted EBITDA and is therefore not a component of our earnings from operations.
The Company believes that the analysis and presentation of FFO will enhance our investor’s understanding of the ongoing performance of our operating business. The Company will consider FFO, in addition to other GAAP and non-GAAP measures, in assessing operating performance and as a proxy for growth in distribution coverage over the long-term.
FFO should not be considered in isolation from or as a superior to or as a substitute for net income (loss), operating income (loss) or any other measure of financial performance calculated in accordance with U.S. GAAP.
The following table reconciles Net income (loss)loss attributable to Greenbacker Renewable Energy Company LLC to Adjusted EBITDA and then to FFO:
53 | | | | | | | | | | | | | | | |
| (in thousands) | | | | | For the year ended December 31, 2023 | | For the period from May 19, 2022 through December 31, 2022 |
| Net loss attributable to Greenbacker Renewable Energy Company LLC | | | | | $ | (79,471) | | | $ | (724) | |
| Add back or deduct the following: | | | | | | | |
| Net loss attributable to noncontrolling interests | | | | | (96,935) | | | (59,439) | |
| Net income attributable to redeemable noncontrolling interests | | | | | 819 | | | — | |
| (Benefit from) provision for income taxes | | | | | (21,548) | | | 3,005 | |
| Interest expense, net | | | | | 40,519 | | | 15,889 | |
| Realized (gain) loss on interest rate swaps, net | | | | | (2,428) | | | 1,322 | |
| Unrealized (gain) loss on interest rate swaps, net | | | | | (17,763) | | | 249 | |
| Unrealized (gain) on investments, net | | | | | (932) | | | (398) | |
| Other expense, net | | | | | 267 | | | 108 | |
Depreciation, amortization and accretion(1) | | | | | 134,647 | | | 49,772 | |
| | | | | | | |
| Impairment of long-lived assets | | | | | 59,294 | | | — | |
| Share-based compensation expense | | | | | 11,248 | | | 6,903 | |
| Change in fair value of contingent consideration | | | | | (603) | | | 2,100 | |
| Non-recurring professional services and legal fees | | | | | 3,388 | | | 7,593 | |
| Non-recurring salaries and personnel related expenses | | | | | 1,250 | | | — | |
| Adjusted EBITDA | | | | | $ | 31,752 | | | $ | 26,380 | |
| Cash portion of interest expense | | | | | (27,473) | | | (11,783) | |
| Distributions to tax equity investors | | | | | (15,748) | | | (11,363) | |
| FFO | | | | | $ | (11,469) | | | $ | 3,234 | |
| | | | | | | | | | | |
| For the three months ended December 31, 2022 | | For the period from May 19, 2022 through December 31, 2022 |
| Net income (loss) attributable to Greenbacker Renewable Energy Company LLC | $ | 2,316,095 | | | $ | (724,977) | |
| Add back or deduct the following: | | | |
| Net loss attributable to noncontrolling interests | (35,340,385) | | | (59,439,202) | |
| Provision for income taxes | 4,123,471 | | | 3,005,119 | |
| Interest expense, net | 6,509,062 | | | 15,889,125 | |
| Realized loss on interest rate swaps, net | 1,322,219 | | | 1,322,219 | |
| Unrealized loss on interest rate swaps, net | 249,150 | | | 249,150 | |
| Unrealized gain on investments, net | (4,750,173) | | | (398,479) | |
| Other (income) expense, net | (363,849) | | | 107,890 | |
Depreciation, amortization and accretion(1) | 23,121,330 | | | 49,771,964 | |
| Share-based compensation expense | 2,726,900 | | | 6,903,931 | |
| Change in fair value of contingent consideration | 1,300,000 | | | 2,100,000 | |
| Non-recurring professional fees associated with the Acquisition and change in status | 2,893,260 | | | 7,593,649 | |
| Adjusted EBITDA | $ | 4,107,080 | | | $ | 26,380,389 | |
| Cash portion of interest expense | (3,731,978) | | | (11,782,595) | |
| Distributions to tax equity investors | (3,769,534) | | | (11,362,597) | |
| FFO | $ | (3,394,432) | | | $ | 3,235,197 | |
(1) Includes contract amortization, net in the amount of $4.3$8.1 million and $10.5 million for the three monthsyear ended December 31, 20222023 and for the period from May 19, 2022 through December 31, 2022, respectively, which isare included in Contract amortization, net on the Consolidated StatementStatements of Operations.
Net Asset Value and Monthly Share Value
Net Asset Value
Prior to the Acquisition, we determined NAV for presentation in our U.S. GAAP financial statements. The Company has historically utilized NAV as the input into both MSV and the offering price of our shares. As a result of the Acquisition, under the Non-Investment Basis, NAV is no longer presented in our Consolidated Financial statements effective May 19, 2022 and forward. However, the Company continues to calculate both NAV and MSV in accordance with valuation guidelines as approved by our Board of Directors. The Company offers shares pursuant to the DRP and accepts repurchases under the SRP.SRP in connection with the death, disability or determination of incompetence of a shareholder. Both the DRP and the SRP are based upon the current MSV per class in effect.
The calculation of our NAV is intended to be a calculation of the fair value of our assets less our outstanding liabilities as described below and will differ from the book value of our equity reflected in our Consolidated Financial Statements as prepared under the Non-Investment Basis. Under the Non-Investment Basis, we are required to issue Consolidated Financial Statements based on historical cost in accordance with U.S. GAAP. To calculate our NAV for the purpose of establishing a purchase and repurchase price for our shares, we have adopted a model, as explained below, that adjusts the value of our assets and liabilities from historical cost to fair value generally in accordance with the U.S. GAAP principles set forth in ASC Topic 820, Fair Value Measurements (“ASC 820”).
To calculate our NAV, the Company has established procedures to estimate fair value of its investments generally in accordance with ASC 820 that the Company’s Board of Directors has reviewed and approved. To the extent that such market data is available, the Company uses observable market data to estimate the fair value of investments. In the absence of quoted market prices in active markets or quoted market prices for similar assets in markets that are not active, the Company uses the valuation methodologies described below with unobservable data based on the best available information in the circumstances. These methodologies incorporate the Company’s assumptions about the factors that a market participant would use to value the asset.
For investments for which quoted market prices are not available, which comprise most of our investment portfolio, fair value is estimated by using the cost, income or market approach. The income approach assumes that value is created by the expectation of future benefits, discounted by a risk premium, to calculate a current cash value. This estimate is the fair value: thevalue (the amount an investor would be willing to pay to receive those future benefits.benefits). The market approach compares either recent
comparable transactions to the investment or an offer to purchase an investment based upon a qualified bid: abid (a signed term sheet and/or a signed purchase agreement.agreement). Adjustments to proposed prices are made to account for the probability of the deal closing, changes between proposed and executed terms, and any dissimilarity between the comparable transactions and their underlying investments. If multiple bids are qualified in the same valuation period, a blended market approach will be calculated.
The Company considers all assets that are fully construction readyconstruction-ready with no impediments to begin construction and where the costs to complete such projects are well understood for the income approach. The fair value of such eligible projects is determined based upon a discounted cash flow methodology. If the portfolio has any significant portion of value that remains subject to negotiation or contract or if other significant risks to complete the project exist, the investment may be held at cost as an approximation of fair value. These valuation methodologies involve a significant degree of judgment by management.
In determining the appropriate fair value of an investment using these approaches, the most significant information and assumptions include, as applicable: available current market data, including relevant and applicable comparable market transactions, applicable market yields and multiples, security covenants, call protection provisions, information rights, the nature and realizable value of any collateral, the investment’s ability to make payments, its earnings and discounted cash flows, the markets in which the project does business, comparisons of financial ratios of peer companies that are public, comparable mergers and acquisitions, the principal market and enterprise values and environmental factors, among other factors.
The Board of Directors has approved the selection of an independent valuation firm to review the Company’s valuation methodology and to work with management to provide additional inputs for consideration by Thethe Company’s Board of Directors with respect to the fair value of investments. Currently, one quarter (25%) of the Company’s investments will be reviewed by an independent valuation firm each quarter on a rotating quarterly basis. Accordingly, each such investment is evaluated by an independent valuation firm at least once each twelve-month calendar period.
The determination of the fair value of the Company’s investments requires judgment, especially with respect to investments for which market quotations are not available. For most of the Company’s investments, market quotations are not available. Due to the inherent uncertainty of determining the fair value of investments that do not have a readily available market value, the fair value of the investments may differ significantly from the values that would have been used had a readily available market value existed for such investments, and the differences could be material. Because the calculation of Company’s NAV is based, in part, on the fair value of Company’s investments as determined by management, our calculation of NAV is to a degree subjective and could be adversely affected if the determinations regarding the fair value of the Company’s investments were materially higher than the values that the Company ultimately realize upon the disposal of such investments.
The following table reconciles total equity per our Consolidated Balance SheetSheets prepared under the Non-Investment Basis as of December 31, 20222023 to our NAV:
| | | | | |
| (in thousands, except per share data) | December 31, 20222023 |
| Total equity | $ | 1,788,681,8531,623,540 | |
| Add back or deduct the following: | |
| Noncontrolling interests | (84,007,911)(113,875) | |
| Redeemable noncontrolling interests | (2,179) | |
Accumulated unrealized appreciation (depreciation) in fair value of investments | 16,624,532113,362 | |
Net asset value (members'(members’ equity) | $ | 1,721,298,4741,620,848 | |
| |
| Shares outstanding | 198,044,410198,622 | |
| NAV per share | $ | 8.698.16 | |
The aggregate NAV of the Company’s common shares as of December 31, 2022 is $1,721.3 million,2023 was $1.6 billion, or $8.69$8.16 per share, and was determined in accordance with the valuation guidelines as approved by the Company’s Board of Directors. As discussed in Note 2. Significant Accounting Policies under the Non-Investment Basis, priorPrior to the May 19, 2022 change in status, the Company recorded its renewable energy projects at fair value and recorded the changes in fair value as an unrealized gain or loss. Upon the change in status, this fair value accounting is no longer applicable, and the Company presents on a consolidated basis the underlying assets and liabilities of its subsidiaries in accordance with the applicable U.S. GAAP.
The following details the adjustments to reconcile total equity as determined under U.S. GAAP to NAV:
Noncontrolling Interests
•Under the Non-Investment Basis, the Consolidated Financial Statements include the accounts of the Company, its wholly owned subsidiaries, and those of its subsidiaries in which it has a controlling financial and/or voting interest. Refer to Note 16.17. Noncontrolling Interests and Redeemable Noncontrolling Interests underin the Non-Investment BasisNotes to the Consolidated Financial Statements (Non-Investment Basis) for further discussion; and
•The Company excludes NCI for purposes of determining NAV as to remove the portion of net assets that are not attributable, directly or indirectly, to the Company. This includes the allocation of net income (loss) attributable to noncontrolling interests.
Accumulated Unrealized Appreciation (Depreciation) in Fair Value of Investments
•Our renewable energy assets are presented at historical cost and all debt facilities are recorded at their carrying value in the Consolidated Financial Statements prepared under U.S. GAAP. As such, any increases or decreases in the fair market value of our renewable energy assets or our debt are not recorded in U.S. GAAP equity. For purposes of determining NAV, our renewable energy projects and project levelproject-level debt are recorded at fair value. As a result, we include the accumulated unrealized appreciation (depreciation) in fair value of our renewable energy projects and project levelproject-level debt in NAV. The inception-to-date accumulated unrealized appreciation (depreciation) in fair value of our renewable energy projects as determined under the Investment Basis is included in U.S. GAAP equity as of May 19, 2022 (refer to Note 2. Significant Accounting Policies under the Non-Investment BasisCompany’s 2022 Form 10-K for further discussion of change in presentation due to change in status). As such, the adjustments reflect the change in unrealized appreciation (depreciation) in fair value of our renewable energy projects and project levelproject-level debt from May 19, 2022 and prospectively; and
•The fair value of the Company’s derivative instruments, which represent interest rate swap contracts, and the related unrealized gain (loss) are already recorded within U.S. GAAP equity. As such, the unrealized gain (loss) associated with the fair value of the Company’s renewable energy projects does not include the impact of our hedging activities associated with interest rate volatility on project levelproject-level debt.
The following table provides for a breakdown of the major components of our NAV as of December 31, 2022:2023:
| | | | | |
| (in thousands) | | | | | |
| Components of NAV | December 31, 20222023 |
| Investment in renewable energy projects and secured loans, at fair value | $ | 2,191,502,2692,312,776 | |
| Cash and cash equivalents and Restricted cash | 190,698,09277,887 | |
| Derivative assets | 195,839,516142,168 | |
| Other current assets | 45,918,32055,150 | |
| Other noncurrent assets | 326,230,024334,476 | |
| Derivative liabilities | (5,833) | |
| Other current liabilities | (77,374,743)(49,042) | |
Long-term debt, net ofincluding current portion | (953,548,526)(1,094,420) | |
| Other noncurrent liabilities | (197,966,478)(152,314) | |
| Net Asset Value | $ | 1,721,298,4741,620,848 | |
| Shares outstanding | 198,044,410198,622 | |
The following table provides a breakdown of our total NAV and NAV per share by class as of December 31, 2022:2023:
| | | | | | | | | | | | | | | | | | | | | | | | | | | | | | | | | | | | | | | | | | | | | | | | | | | | | |
| Class | | |
| A | | C | | I | | P-A | | P-I | | P-D | | P-S | | P-T | | Total |
| NAV | $ | 134,102,828 | | | $ | 21,634,185 | | | $ | 53,213,100 | | | $ | 7,004,571 | | | $ | 1,104,046,479 | | | $ | 1,685,206 | | | $ | 397,506,168 | | | $ | 2,105,937 | | | $ | 1,721,298,474 | |
| Shares outstanding | 16,140,997 | | | 2,672,994 | | | 6,403,191 | | | 814,900 | | | 125,313,984 | | | 191,573 | | | 46,261,457 | | | 245,314 | | | 198,044,410 | |
| NAV per share as of December 31, 2022 | $ | 8.308 | | | $ | 8.094 | | | $ | 8.310 | | | $ | 8.596 | | | $ | 8.810 | | | $ | 8.797 | | | $ | 8.593 | | | $ | 8.585 | | | |
| | | | | | | | | | | | | | | | | | | | | | | | | | | | | | | | | | | | | | | | | | | | | | | | | | | | | | | | | | | |
| (in thousands, except per share data) | | | | | | | | | | | | | | | | |
| Class | | |
| A | | C | | I | | P-A | | P-I | | P-D | | P-S | | P-T | | EO | | Total |
| NAV | $ | 123,127 | | | $ | 20,730 | | | $ | 50,903 | | | $ | 6,871 | | | $ | 1,026,347 | | | $ | 1,588 | | | $ | 358,464 | | | $ | 2,022 | | | $ | 30,796 | | | $ | 1,620,848 | |
| Shares outstanding | 15,809 | | | 2,706 | | | 6,533 | | | 850 | | | 124,039 | | | 192 | | | 44,514 | | | 249 | | | 3,730 | | | 198,622 | |
| NAV per share as of December 31, 2023 | $ | 7.788 | | | $ | 7.659 | | | $ | 7.792 | | | $ | 8.085 | | | $ | 8.274 | | | $ | 8.263 | | | $ | 8.053 | | | $ | 8.124 | | | $ | 8.274 | | | |
Monthly Share Value
In addition to the description above to determine our non-GAAP NAV, we have adopted a model, as explained below, that adjusts NAV to MSV. The Company offers shares pursuant to the DRP and accepts repurchases under the SRP.SRP in connection with the death, disability or determination of incompetence of a shareholder. Both the DRP and the SRP are based upon the current MSV per class in effect.
We calculate our MSV per share in accordance with the valuation guidelines that have been approved by our Board of Directors. As a general rule we will continue to monitor the valuation of the Company’s entire investment portfolio on a daily basis and make adjustments to the NAV and MSV as necessary as soon as is practical thereafter to reflect any changes in market conditions that materially impact the value of our shares. On the last business day of every month, the Company will consider the appropriateness of the MSV. As part of that consideration, it will consider the current market values of our liquid and illiquid investment portfolios.
MSV is the basis for: (1) determining the price offered for each class of our shares pursuant to the DRP and the price per share that is paid to shareholder participants in our SRP; and (2) the value of an investment in our shares, as shown on each shareholder’s periodic customer account statement. While we believe our MSV calculation methodologies are consistent with standard industry practices, there is no rule or regulation that requires we calculate MSV in a certain way. MSV should not be considered equivalent to stockholders’ equity or any other U.S. GAAP measure.
The Company’s quarterly process to determine MSV per share class is performed in accordance with procedures approved by the Company’s Board of Directors. The MSV per share class as of December 31, 20222023 was approved by the Company’s Board of Directors.
Our MSV per share does not represent the amount of our assets less our liabilities in accordance with U.S. GAAP. We do not represent, warrant or guarantee that:
•A shareholder would be able to realize the MSV per share for the class of shares a shareholder owns if the shareholder attempts to sell its shares;
•A shareholder would ultimately realize distributions per share equal to the MSV per share for the class of shares it owns upon liquidation of our assets and settlement of our liabilities or upon a sale of our Company;
•Shares of our limited liability company interests would trade at their MSV per share on a national securities exchange;
•A third-party would offer the MSV per share for each class of shares in an arm’s-length transaction to purchase all or substantially all of our shares; or
•The MSV per share would equate to a market price of an open-ended renewable energy fund.
The following details the adjustments to reconcile members’ equity as determined under U.S. GAAP to our MSV:
•The accrued shareholder servicing fee represents the accrual for the full cost of the shareholder servicing fee for Class P-S, Class P-T and Class C shares. Under U.S. GAAP and NAV, we accrued the full cost of the shareholder servicing fee payable over the life of each share (assuming such share remains outstanding the length of time required to pay the maximum shareholder servicing fee) as an offering cost at the time we sold the Class P-S, Class P-T and Class C shares. For purposes of our MSV, we recognize the shareholder servicing fee as a reduction of MSV on a monthly basis as such fee is paid; and
•Under GAAP and NAV, organization costs are expensed as incurred and offering costs are charged to equity as such amounts are incurred. For MSV, such costs will be recognized as a reduction to MSV as they are charged to equity ratably over 60 months.
Results of Operations - Investment Basis
A discussion of the results of operations under the Investment Basis for the period from January 1, 2022 through May 18, 2022 and the year ended December 31, 2021 is included below. All references to the “LLC” in this “Results of Operations – Investment Basis” section refer to Greenbacker Renewable Energy Company LLC and itits consolidated subsidiaries (GREC, GREC HoldCo, GREC Administration LLC, and Danforth Shared Services LLC) prior to the Acquisition, unless otherwise expressly stated or context requires otherwise.
| | | | | |
| (in thousands) | For the period from January 1, 2022 through May 18, 2022 |
| Investment income: | |
| Dividend income | $ | 12,547 | |
| Interest income | 1,279 | |
| Total investment income | $ | 13,826 | |
| Key Operating expenses: | |
| Management fee expense | $ | 10,662 | |
| Performance participation fee | 384 | |
| Other expenses | 11,981 | |
| Total expenses | 23,027 | |
| Net investment loss before taxes | (9,201) | |
| (Benefit from) income taxes | (4,315) | |
| Net investment loss | $ | (4,886) | |
| Net change in realized and unrealized gain (loss) on investments, foreign currency translation and deferred tax assets: | |
| Net realized loss on investments | $ | (2) | |
| Net change in unrealized appreciation (depreciation) on: | |
| Investments | 13,648 | |
| Foreign currency translation | (26) | |
| Swap contracts | 35,266 | |
| (Provision for) income taxes on realized and unrealized gain (loss) on investments, foreign currency translation and swap contracts | (13,223) | |
| Net increase in net assets attributed to members' equity | $ | 30,777 | |
| | | | | | | | | | | |
| For the period from January 1, 2022 through May 18, 2022 | | For the year ended December 31, 2021 |
| Investment income: | | | |
| Dividend income | $ | 12,547,447 | | | $ | 28,631,462 | |
| Interest income | 1,279,349 | | | 3,919,675 | |
| Total investment income | $ | 13,826,796 | | | $ | 32,551,137 | |
| Key Operating expenses: | | | |
| Management fee expense | $ | 10,661,560 | | | $ | 21,940,099 | |
| Performance participation fee | 384,065 | | | 4,672,078 | |
| Administrator expenses | 2,155,303 | | | — | |
| Other expenses | 9,825,810 | | | 12,172,583 | |
| Total expenses | $ | 23,026,738 | | | $ | 38,784,760 | |
| Net investment loss before taxes | (9,199,942) | | | (6,233,623) | |
| (Benefit from) income taxes | (4,315,392) | | | (9,050,004) | |
| Net investment (loss) income | $ | (4,884,550) | | | $ | 2,655,809 | |
| Net change in realized and unrealized gain (loss) on investments, foreign currency translation and deferred tax assets: | | | |
| Net realized loss on investments | $ | (1,688) | | | $ | (29,182) | |
| Net change in unrealized appreciation (depreciation) on: | | | |
| Investments | 13,647,821 | | | 56,023,470 | |
| Foreign currency translation | (26,172) | | | 10,727 | |
| Swap contracts | 35,266,332 | | | 2,248,926 | |
| (Provision for) income taxes on realized and unrealized gain (loss) on investments, foreign currency translation and swap contracts | (13,223,285) | | | (17,888,961) | |
| Net increase in net assets attributed to members' equity | $ | 30,778,458 | | | $ | 43,020,789 | |
Revenues
As the majority of our assets consist of equity investments in entities established to own and operate our renewable energy projects, the majority of the revenue we generated prior to the Acquisition is in the form of dividend income. Dividend income is not equivalent to the gross revenue produced at the project level, as included in the Non-Investment Basis, but is instead the amount of free cash that was distributed from the project entities to the LLC from time to time after paying for all project-level expenses, remitting principal payments not funded by the LLC, and complying with any specific project-level debt and tax equity covenant, less any expenses incurred by the LLC or GREC for services provided by Greenbacker Administration directly relating to the ongoing operations of the project companies. Thus, the presentation of investment income in our Consolidated Financial Statements as prepared under the Investment Basis differs from the traditional presentation shown in the financial statements or entities not prepared in accordance with ASC 946 and, most notably, is not equivalent to revenue as one might expect to see under the Non-Investment Basis.
The other major component of our revenue is interest income earned on the LLC's debt investments, including loans to developers and loans made directly or indirectly to renewable energy projects. Dividend income for the period from January 1, 2022 through May 18, 2022 totaled $12.5 million, while interest income earned on our cash, cash equivalents, and secured loans (including the amortization of origination and other fees) amounted to $1.3 million. Dividend income for the year ended December 31, 2021 totaled $28.6 million, while interest income earned on the LLC's cash, cash equivalents, and secured loans (including the amortization of origination and other fees) amounted to $3.9 million.
Expenses
For the period from January 1, 2022 through May 18, 2022, we incurred $23.0 million in operating expenses. For the year ended December 31, 2021, we incurred $38.8 million in operating expenses.
Prior to July 1, 2021, the base management fee payable to GCM was calculated at a monthly rate of 0.17% (2.00% annually) of our gross assets (including amounts borrowed up to $50.0 million) until gross assets exceed $800.0 million. The base management fee monthly rate decreased to 0.15% (1.75% annually) for gross assets between $800.0 million to $1.5 billion
and 0.13% (1.50% annually) for gross assets greater than $1.5 billion. For services rendered under the advisory agreement, the base management fee was payable monthly in arrears or more frequently as authorized under the advisory agreement. The base management fee was calculated based on the average of the values of our gross assets for each day of the prior month. Base management fees for any partial period were appropriately prorated. The base management fee had the ability to be deferred or waived, in whole or in part, at the election of GCM. All or any part of the deferred base management fee not taken as to any period was deferred without interest and may be taken in any period prior to the occurrence of a liquidity event as determined by GCM in its sole discretion. On July 1, 2021, the LLC entered into the Advisory Agreement with GCM. Effective July 1, 2021, the base management fee payable to GCM was calculated at a monthly rate of 0.17% (2.00% annually) of the net assets until the net assets exceed $800.0 million. The base management fee monthly rate will decrease to 0.15% (1.75% annually) for net assets between $800.0 million to $1.5 billion and to 0.13% (1.50% annually) for net assets greater than $1.5 billion. Following the completion of the Acquisition and the termination of the Advisory Agreement, the LLC no longer pays a management fee to GCM. For the period from January 1, 2022 through May 18, 2022, we incurred $10.7 million in management fees due toresulting from the increase in net assets most notably in 2021 due to a significant increase in capital raised. For the year ended December 31, 2021, GCM earned $21.9 million in management fees.
The Special Unitholder, an entity affiliated with GCM, held the special unit in LLC entitling it to a performance participation fee as well as a liquidation performance participation fee payable upon a listing or a liquidation. The fees paid to the Special Unitholder as outlined in the Fourth Operating Agreement were effective for periods subsequent to March 31, 2020 and prior to May 18, 2022. For the period from January 1, 2022 through May 18, 2022, we incurred $0.4 million in performance fees. For the year ended December 31, 2021, we incurred $4.7 million in performance fees.
For the period from January 1, 2022 through May 18, 2022, we incurred $2.2 million in expenses from Greenbacker Administration (the “Administrator”)the Administrator in excess of the dividend income from the project companies due to the structure of certain of the project company agreements that only allow for distributions to be determined quarterly. These expenses related to certain asset management, construction management, compliance and oversight services, as well as accounting and administrative services performed by the Administrator, and are recorded to Administrator expenses on the Consolidated StatementsStatement of Operations.Operations for the period from January 1, 2022 through May 18, 2022.
The residual expenses incurred during the period from January 1, 2022 through May 18, 2022 included other operating expenses such as other professional fees and legal expenses, which consisted of certain costs associated with the Acquisition and the transition to Non-Investment Basis.
Lastly, for the period from January 1, 2022 through May 18, 2022, we generated a tax (benefit)benefit of $(4.3) million. For the year ended December 31, 2021, the LLC generated a tax (benefit) of $(9.1)$4.3 million. The benefit recorded within Net investment (loss) incomeloss is mainly derived from net operating losses incurred by the LLC.
Net Change in Realized and Unrealized Gain (Loss) on Investments, Foreign Currency Translation and Deferred Tax Assets
Net realized loss on investments, Net change in unrealized appreciation (depreciation) on Investments, and Net change in unrealized appreciation (depreciation) on Foreign currency translations are reported separately on the Consolidated StatementsStatement of Operations as prepared under the Investment Basis. We measured realized gains or losses as the difference between the net proceeds from the sale, repayment, or disposal of an asset and the adjusted cost basis of the asset, without regard to unrealized appreciation or depreciation previously recognized. Net change in unrealized appreciation or depreciation will reflect the change in investment values during the reporting period, including any reversal of previously recorded unrealized appreciation or depreciation, when gains or losses are realized.
For the period from January 1, 2022 through May 18, 2022, the LLC recognized a net change in unrealized appreciation of $48.9 million, driven by the change in value of investments and swap contracts.
For the year ended December 31, 2021, we recorded a net change in unrealized appreciation of $58.3 million driven by the change in value of investments and swap contracts. The realized gain (loss) for the year ended December 31, 2021 were not material.
The (provision for) income taxes on realized and unrealized gain (loss) on investments, foreign currency translation and swap contracts was $(13.2) million for the period from January 1, 2022 through May 18, 2022. The provision is mainly derived from unrealized tax basis gains on the LLC's investments offset by net operating losses incurred and investment tax credit carryforwards related to the LLC's investments which, unlike for financial statement purposes under U.S. GAAP, are consolidated for tax purposes.
The (provision for) income taxes on realized and unrealized gain (loss) on investments, foreign currency translation and swap contracts was $(17.9) million for the year ended December 31, 2021. The provision is mainly derived from unrealized tax basis gains on the LLC's investments offset by net operating losses incurred and investment tax credit carryforwards related to the LLC's investments which, unlike for financial statement purposes under U.S. GAAP, are consolidated for tax purposes.
Changes in Net Assets from Operations
For the period from January 1, 2022 through May 18, 2022, we recorded a net increase in net assets resulting from operations of $30.8 million, or $0.18 per share. The increase in net assets for the period from January 1, 2022 through May 18, 2022 primarily relates to our unrealized appreciation on investments and swap contracts, offset by our net investment loss earned during the period, and change in benefit from deferred taxes on unrealized appreciation (depreciation) on investments.
For the year ended December 31, 2021, we recorded a net increase in net assets resulting from operations
Electricity Production by Our Fleet
Our strategy of purchasing distributed generation and opportunistic utility scale projects enables us to continue building a highly diversified portfolio. While buying and operating smallermiddle-market projects poses certain challenges compared with buying large single projects, we see significant benefits associated with these smallermiddle-market projects in terms of investment return potential due to less competition with large capital providers, opportunity to buy pipelines of deals from developers, and the overall scalability of the asset class, where solar and wind projects can be purchased to match capital inflows.
The power-production capacity of the Company’s operating fleet of renewable energy projects increased by 178 MW0.3 GW on a year-over-year basis as the Company acquired new operating projects and its under-construction projects entered commercial operation. This expansion included a new milestone: the Company's largest operating clean energy asset to date. The 104 MW solar project reached commercial operation in late June 2022, and has begun producing clean energy in Carbon County, Utah.
As illustrated below, this capacity growth enabled the Company’s fleet of clean energy projects to produce well over 2,350,0002.5 million MWh of total power during the year ended December 31, 2022,2023, marking a year-over-year increase of 59%7%. The increased production is driven by the solar energy segment, which included more than 1,060,0001.5 million MWh of solar energy, and more than 1,190,000 MWh of wind power, representing year-over-year growth of 84% and 49%, in the respective energy segments.38%.
| | MWh by Technology | MWh by Technology | | For the three months ended December 31, 2022 | | For the year ended December 31, 2022 | | For the three months ended December 31, 2021 | | For the year ended December 31, 2021 | | QoQ change for the period ended December 31, 2022 | | YoY change for the year ended December 31, 2022 |
| Commercial Solar | | 202,513 | | | 1,067,114 | | | 114,715 | | | 580,330 | | | 77 | % | | 84 | % |
| MWh by Technology | |
| MWh by Technology | | | | | Year ended December 31,
2023 | | | | Year ended December 31,
2022 | | | | YoY change for the year ended December 31 |
| Solar | | Solar | | | | 1,473,384 | | | | | 1,067,114 | | | | | 38 | % |
| Wind | Wind | | 334,616 | | | 1,198,236 | | | 262,975 | | | 804,558 | | | 27 | % | | 49 | % | Wind | | | | 978,236 | | | | | 1,198,236 | | | | 1,198,236 | | | | | (18) | | | | (18) | % |
| Biomass | Biomass | | 20,568 | | | 90,385 | | | 24,810 | | | 95,033 | | | (17) | % | | (5) | % | Biomass | | | | 57,880 | | | | | 90,385 | | | | 90,385 | | | | | (36) | | | | (36) | % |
| Total | Total | | 557,697 | | | 2,355,735 | | | 402,500 | | | 1,479,921 | | | 39 | % | | 59 | % | Total | | | | 2,509,500 | | | | | 2,355,735 | | | | 2,355,735 | | | | | 7 | | | | 7 | % |
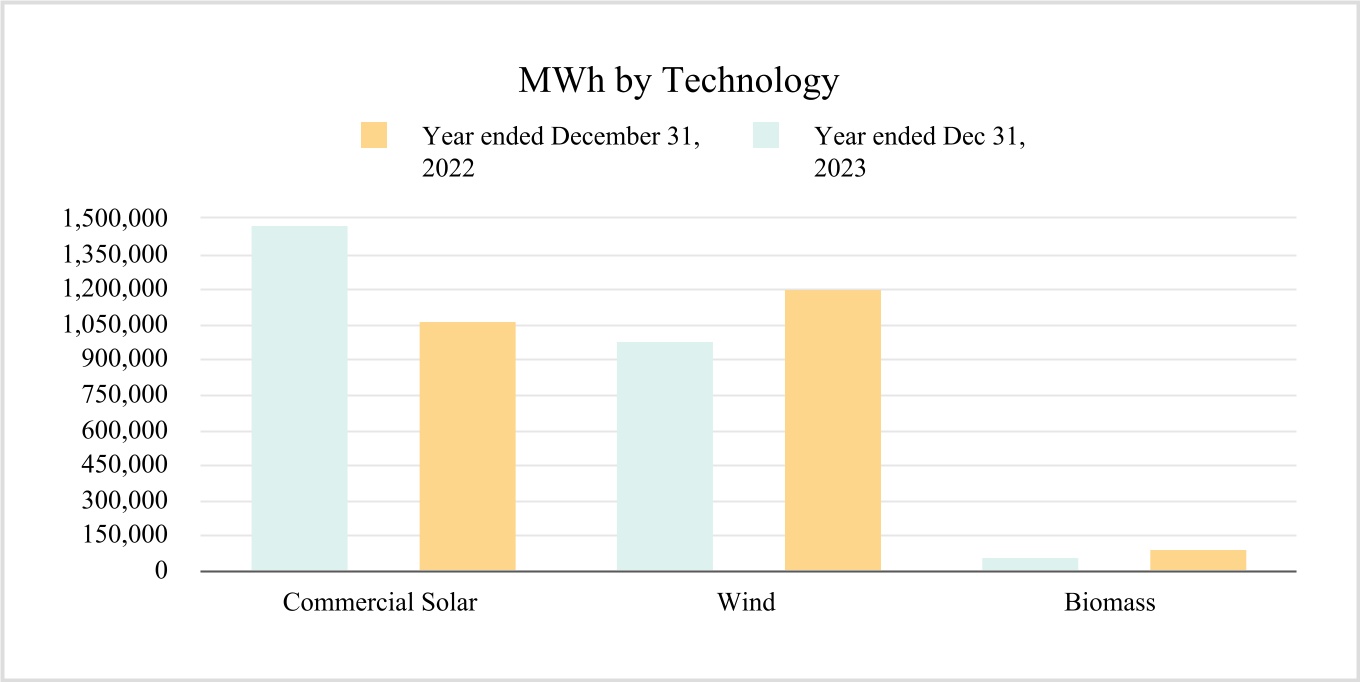
Dividend Coverage Ratio and Realized Gains - Investment Basis
Towards the end of 2017, GCM began to observe an increase in the opportunities to participate in projects that were largely similar to our operating assets in terms of the long-term risks, but which had the potential for additional returns if we could manage additional risks in the early stages of the investment lifecycle. As a result, we determined that we should expand our investment capabilities to include four basic investment categories: operating assets, assets before their commercial operation date, assets at notice to proceed, and special situations. Since then, inIn addition to acquiring operating assets, a substantial portion of our investment activity consists of acquiring pre-operational assets, which we then fund through construction until such time as the assets are placed in service and start generating revenue. Depending on the circumstances, the construction process can take several months, during which time we are not generating revenues from these investments and are paying distributions on the capital raised to fund the investments. When determining the price to be paid for pre-operational assets, we perform a discounted cash flow analysis of the lifetime operating returns of the projects and incorporatingincorporate the pre-operational period into our analysis. Through the construction period, we continue to incur substantial operating expenses associated with owning and managing these investments as well as pay distributions on the capital raised to fund the investments. Thus, our Consolidated Financial Statements and overall dividend coverage ratio had been negatively impacted in recent years.
An analysis of the LLC’s dividend coverage ratio for the period prior to Acquisition as indicated below is as follows:
| | | | | | | | | | | | | | | | | | | | | | | | | | | | | | | | | | | |
| Description | For the period from January 1, 2022 through May 18, 2022 | | For the year ended December 31, 2021 | | For the year ended December 31, 2020 | | For the year ended December 31, 2019 | | For the year ended December 31, 2018 | | For the year ended December 31, 2017 |
| Net investment (loss) income before taxes | $ | (9,199,942) | | $ | (6,233,623) | | $ | 1,645,856 | | $ | 4,213,800 | | $ | 9,681,310 | | $ | 7,459,040 |
| Shareholder distributions (total including DRP) | $ | 32,202,840 | | $ | 71,114,670 | | $ | 31,038,522 | | $ | 25,884,100 | | $ | 17,738,130 | | $ | 11,403,610 |
| Dividend coverage ratio (net investment income/total distributions) | (28.6) | % | | (8.8) | % | | 5.3 | % | | 16.3 | % | | 54.6 | % | | 65.4 | % |
| Realized (losses) gains | $ | (1,688) | | $ | (29,182) | | $ | 7,830,550 | | $ | 12,915,740 | | $ | — | | | $ | 694,000 |
| Gross dividend coverage ratio (net investment income and realized gains/total shareholder distributions) | (28.6) | % | | (8.8) | % | | 30.5 | % | | 66.2 | % | | 54.6 | % | | 71.5 | % |
History of Distribution Coverage - Investment Basis
2014 - 2018
During the period from April 2014, when we started raising capital, through the end of 2017, our investment strategy consisted wholly of purchasing operating renewable energy projects that were in service and generating income from the sale of electricity under long-term power purchase contracts. By investing exclusively in operating assets, the LLC was able to demonstrate steady improvement in distribution coverage through that period. This initial operational period also corresponded to a significant increase in assets under management, as well as the deployment of capital in income producing renewable energy operating assets. During 2018, the LLC began to expand its investment focus with the purchase of the Midway III project in September 2018. There were no assets under construction in 2017, whereas by December 31, 2018, the LLC’s investment portfolio included a total of $67.0 million of to-be-constructed assets. Given the substantial increase in non-income-generating assets, the distribution coverage ratio fell to 54.58% on average assets by December 31, 2018.
2019
By December 31, 2019, total capital deployed in pre-operational and non-earning assets reached approximately $128.6 million which amount to 31.5% of net assets. In addition, Greenbacker Administration costs increased approximately $3.0 million year over year due to the increase in specialist headcount to manage the construction and operational risks associated with these investment initiatives. These increased costs directly reduced the operating cash flows from project-level entities that would otherwise have been available to distribute to the LLC as dividend income. When these projects commenced operations, any increase in the fair value of the project was recognized as an unrealized gain on the Consolidated Statements of Operations, not as investment income. Thus, while costs incurred prior to operation reduced the dividend coverage ratio, any unrealized gains on the value of the project after reaching operations had no effect on the dividend coverage ratio.
2020
As of December 31, 2020 total capital deployed in pre-operational and non-earning assets reached approximately $144.4 million which amounts to 26.0% of net assets. In addition, Greenbacker Administration costs continued to increase due to the increase in specialist headcount to manage the construction and operational risks associated with these investment initiatives. These increased costs directly reduced the operating cash flows from project-level entities that would otherwise have been available to distribute to the LLC as dividend income. Consistent with 2019, as these projects commenced operations, any increase in the fair value of the project was recognized as an unrealized gain on the Consolidated Statements of Operations, not as investment income. Thus, while costs incurred prior to operation reduced the dividend coverage ratio, any unrealized gains on the value of the project after reaching operations had no effect on the dividend coverage ratio.
2021
As of December 31, 2021, total capital deployed in pre-operational and non-earning assets reached approximately $383.6 million which amounted to 26.6% of net assets. Additionally, as a result of the significant capital raised during the year ended December 31, 2021, the LLC had $67.4 million in investments in money market funds as of December 31, 2021, amounting to an additional 4.8% of our net assets. Any change in fair value of the LLC's investments, whether the projects were operating or pre-operational, was recognized as an unrealized gain on the Consolidated Statements of Operations, not as investment income. Thus, while costs incurred prior to operation reduced the dividend coverage ratio, any unrealized gains on the value of the project before or after reaching operations had no effect on the dividend coverage ratio. From a near-term financial perspective, the LLC's Consolidated Financial Statements and overall dividend coverage ratio were negatively impacted.
2022
For the period from January 1, 2022 through May 18, 2022, the LLC continued to see the effects of capital deployed in pre-operational and non-earning assets on distribution coverage. In addition to those impacts, the LLC also recognized increased operating expenses largely made up of legal expenses and other professional fees associated with the Acquisition and resulting change in status to the Non-Investment Basis. These costs are considered to be non-recurring and are unrelated to the continuing operations of the LLC and therefore, are not expected to impact in future periods. | | | | | | | | | | | | | | | | | | |
| (dollars in thousands) | | | | | | | | | | | | |
| Description | | For the period from January 1, 2022 through May 18, 2022 | | | | | | | | | | |
| Net investment loss before taxes | | $ | (9,200) | | | | | | | | | | |
| Shareholder distributions (total including DRP) | | $ | 32,203 | | | | | | | | | | |
| Dividend coverage ratio (net investment income/total distributions) | | (28.6) | % | | | | | | | | | | |
| Realized losses | | $ | (2) | | | | | | | | | | |
| Gross dividend coverage ratio (net investment income and realized gains/total shareholder distributions) | | (28.6) | % | | | | | | | | | | |
Given the change in status to the Non-Investment Basis, the Company will no longer presentreports Net investment income in the Consolidated Financial Statements. The Company will utilizeutilizes metrics presented within the Consolidated Financial Statements as prepared under the U.S. GAAP Non-Investment Basis, as well as non-GAAP metrics, Adjusted EBITDA and FFO, in evaluating and reporting on the sources
of funding for shareholder distributions and the underlying drivers of our financial results in the current period as well as prospectively.periods subsequent to the change in status.
Liquidity and Capital Resources
Overview
Liquidity is a measure of our ability to meet potentialour cash requirements, including ongoing commitments to repay borrowings, fund and maintain our current and future renewable energy project assets, make distributions toacquire, construct and develop our shareholders and other general business needs. We will use significant cash to fund the acquisition, construction and operation offuture renewable energy and energy efficiency projects, make investments in renewable energy businesses, repay principal and interest on our borrowings, make distributions to our shareholders, repurchase our common shares pursuant to the SRP in connection with the death, disability or determination of incompetence of a shareholder, and fund our operations.other general business needs.
Our short-term liquidity requirements consist primarily of funds necessary to pay for our operating expenses, including our general and administrative expenses as well as interest payments on our outstanding debt, and to paymake distributions to our shareholders.shareholders and to repurchase our common shares pursuant to our SRP in connection with the death, disability or determination of incompetence of a shareholder. We also have a significant pipeline of currently contracted and potential future development, construction and acquisition projects, all of which will require short-term funding. We expect to meet our short-term liquidity requirements primarily from operating cash flow, cash on hand, and borrowings under our existing financing sources.sources and future debt and equity financing.
Our long-term liquidity needs consist primarily of funds necessary to repay debt and to acquire, construct and constructdevelop renewable energy and energy efficiency projects. We expect to meet our long-term liquidity requirements with operating cash flow, cash on hand, borrowings under our existing financing sources and future debt and equity financing. Our ability to access these capital sources may be impacted by unfavorable market conditions, particularly in the debt and equity capital markets, which are outside of our control.
We expect that our primary sources of financing will be through corporate-level credit facilities or other secured and unsecured borrowings, but we may also issue equity or debt securities. In addition, we expect to use other financing methods at the project level as necessary, including joint venture structures, construction loans, tax equity bridge loans, property mortgages, letters of credit, sale and leaseback transactions, other lease transactions and other arrangements, any of which may be unsecured or may be secured by mortgages or other interests in our assets. In addition, other sources of capital may include tax equity financings, sale of tax credits, governmental grant proceeds, and governmental grants.proceeds from sales of assets and capital repayments from investments.
Tax equity investors —Equity Investors, passive investors which could be a financial institution,institutions, insurance companycompanies or corporation — contributescorporations, contribute capital based on construction milestones in exchange for a share of the tax credits (and other tax benefits such as accelerated depreciation) and cash flows generated by a qualifying physical investment. Initially, the tax equity investor receives substantially all of the non-cash value attributable to the renewable energy systems and energy storage systems, which includes accelerated depreciation and Section 48(a) ITCs or Section 45(a) PTC; and generally between 15%-30% of the cash generated by the asset. These allocations then flip once certain time or yield basedyield-based milestones are met. Time basedTime-based flips occur on a set date after a five-year recapture period while yield basedyield-based flips occur after the tax equity investor achieves a specified return typically on an after-tax basis which may last longer than expected if the portfolio company’s energy projects perform below our expectations. After the flip occurs, we receive substantially all of the cash and tax allocations.
Our liquidity plans are subject to a number of risks and uncertainties, including those described in Part I — Item 1A. Risk Factors of this Annual Report some of which are outside of our control. Macroeconomic conditions could hinder our business plans, which could, in turn, adversely affect our financing strategy.
As of December 31, 2023 and 2022, the Company had $96.9 million and $143.2 million, respectively, in Cash and cash equivalents and $85.2 million and $47.5 million, respectively, in Restricted cash.cash, current. Our current Cash, cash equivalents and Restricted cash balance is generally reflective of the cash necessary to fund normal operations. In 2023,the short-term, we anticipate continuing to (1) increase our draw on current financing facilities;facilities, and (2) enter into new financing arrangements. Our primary sources of cash have generally consisted of:
•the net proceeds from our public and private offerings;
•cash flows generated from our renewable energy projects, including interest earned on secured loans;
•proceeds from sales of assets and capital repayments from investments;
•tax equity capital contributions in partnerships where the Company is the managing member; and
•borrowing capacity under current financing sources.
As of December 31, 2023 and 2022, the Company had $1.1 billion and $987.1 million, respectively, in outstanding notes payable.
| | | | | | | | | | | | | | | | | | | | | | | | | | |
| (dollars in thousands) | | Outstanding as of December 31, 2023 | | Outstanding as of December 31, 2022 | | Interest rate | | Maturity date |
GREC Entity HoldCo(1) | | $ | 65,951 | | | $ | 74,197 | | | Daily SOFR + 1.85% | | June 20, 2025 |
| Midway III Manager LLC | | 13,932 | | | 14,610 | | | 3 mo. SOFR + 1.73% | | September 28, 2025 |
| Trillium Manager LLC | | 68,785 | | | 72,737 | | | Daily SOFR + 1.98% | | June 9, 2027 |
GB Wind Holdco LLC(2) | | 50,408 | | | 122,684 | | | 3 mo. SOFR + 1.38% | | Various(3) |
| Greenbacker Wind Holdings II LLC | | 70,628 | | | 72,477 | | | 3 mo. SOFR + 1.98% | | December 31, 2026 |
| Conic Manager LLC | | 23,363 | | | 24,356 | | | 3 mo. SOFR + 1.75% | | August 8, 2026 |
| Turquoise Manager LLC | | 30,994 | | | 31,687 | | | 3 mo. SOFR + 1.35% | | December 23, 2027 |
| Eagle Valley Clean Energy LLC | | 35,389 | | | 35,112 | | | Various(4) | | January 2, 2057 |
| Eagle Valley Clean Energy LLC (Premium financing agreement) | | — | | | 1,064 | | | 6.99% | | November 30, 2023(5) |
| Greenbacker Equipment Acquisition Company LLC | | — | | | 6,500 | | | Prime + 1.00% | | December 31, 2023(6) |
| ECA Finco I, LLC | | 18,563 | | | 19,757 | | | 3 mo. SOFR + 2.60% | | February 25, 2028 |
| GB Solar TE 2020 Manager LLC | | 18,506 | | | 19,182 | | | 3 mo. SOFR + 1.88% | | October 30, 2026 |
| Sego Lily Solar Manager LLC | | 133,898 | | | 137,445 | | | 3 mo. SOFR + 1.53% | | June 30, 2028 |
| Celadon Manager LLC | | 72,853 | | | 61,925 | | | Daily SOFR + 1.60% | | February 18, 2029 |
| GRP II Borealis Solar LLC | | 40,646 | | | 41,788 | | | 3 mo. SOFR + 2.00% | | June 30, 2027 |
| Ponderosa Manager LLC | | 88,594 | | | 147,080 | | | 3 mo. SOFR + 1.40% | | October 4, 2029(7) |
| PRC Nemasket LLC | | 41,806 | | | 44,488 | | | Daily SOFR + 1.25% | | November 1, 2029 |
| GREC Holdings 1 LLC | | 74,594 | | | 60,000 | | | 1 mo. SOFR + Applicable Margin(8) | | November 29, 2027 |
| Dogwood GB Manager LLC | | 57,463 | | | — | | | 1 mo. SOFR + 1.63% | | March 29, 2030 |
| GREC Warehouse Holdings I LLC | | 155,558 | | | — | | | 3 mo. SOFR + 2.03% | | August 11, 2026 |
| Total debt | | $ | 1,061,931 | | | $ | 987,089 | | | | | |
| Less: Total unamortized discount and deferred financing fees | | (43,679) | | | (40,459) | | | | | |
Less: Current portion of long-term debt(9) | | (82,855) | | | (95,870) | | | | | |
| | | | | | | | |
| Total long-term debt, net | | $ | 935,397 | | | $ | 850,760 | | | | | |
(1)See the description below and Part II – Item 8 – Note 11. Debt, in the Notes to the Consolidated Financial Statements prepared under the Non-Investment Basis of the credit agreement below for a discussion of GREC Entity HoldCo’s non-compliance with the debt service coverage ratio (as defined in the credit agreement) as of and for the fiscal quarter ended December 31, 2023.
(2)The GB Wind Holdco LLC tax equity bridge loans totaling $69.5 million were paid in full, and $63.1 million was paid on the term loan facility with proceeds from the Company’s failed sale-leaseback arrangements in November and December 2023. In addition, in the year ended December 31, 2023, there were additional borrowings of $69.5 million offset by $9.2 million of repayments in the ordinary course of business.
(3)The GB Wind Holdco LLC tax equity bridge loan and repower term loans mature on March 31, 2024 and December 31, 2027, respectively.
(4)Eagle Valley Clean Energy LLC’s loan includes a term loan that bears interest at a fixed rate of 1.69% and a loan governed by a debt settlement agreement that bears interest at a fixed rate of 1.91%.
(5)The loan was paid in full in October 2023.
(6)On October 23, 2023, the maturity date was amended to December 31, 2023 in the Fourth Amendment to the Loan and Security Agreement. The loan was paid in full in December 2023.
(7)The Ponderosa Manager LLC tax equity bridge loan of $34.5 million was paid in full in October 2023.
(8)GREC Holdings 1 LLC’s loan includes interest on the outstanding principal at the term SOFR index rate plus a spread adjustment plus applicable margin (spread adjustment of 0.10%; applicable margin ranging between 1.75% and 2.00%).
(9)Adjusted for $6.1 million of unamortized debt discount and deferred financing fees pertaining to current portion of long-term debt of $88.9 million.
We remain focused on maintaining liquidity and financial flexibility and continue to monitor the capital and credit markets. Beyond the primary sources of liquidity we use to meet our cash requirements, we are exploring a variety of financing options to supplement our current cash flows in order to allow us to maintain normal future operations and to take advantage of the investment opportunities available in the marketplace. These financing options include, among others, raising capital in the public or private capital markets and establishing new financing arrangements with commercial banks. However, we cannot predict with certainty what terms any such financing would have or the cost we would incur in connection with such financing or whether we will be able to consummate any such financing.
| | | | | | | | | | | | | | | | | | | | |
| | Outstanding | | Interest rate | | Maturity date |
| GREC Entity HoldCo | | 74,196,983 | | | 1 mo. LIBOR + 1.75% | | June 20, 2025 |
| Midway III Manager LLC | | 14,609,867 | | | 3 mo. LIBOR + 1.63% | | October 31, 2025 |
| Trillium Manager LLC | | 72,736,786 | | | 3 mo. LIBOR + 1.88% | | June 9, 2027 |
| GB Wind Holdco LLC | | 122,684,036 | | | 3 mo. LIBOR + 1.38% | | November 22, 2027 |
| Greenbacker Wind Holdings II LLC | | 72,476,839 | | | 3 mo. LIBOR + 1.88% | | December 31, 2026 |
| Conic Manager LLC | | 24,356,358 | | | 3 mo. LIBOR + 1.75% | | April 1, 2028 |
| Turquoise Manager LLC | | 31,687,423 | | | 3 mo. LIBOR + 1.25% | | December 23, 2027 |
| Eagle Valley Clean Energy LLC | | 35,112,342 | | | 1.91% | | January 2, 2057 |
| Eagle Valley Clean Energy LLC (Premium financing agreement) | | 1,063,438 | | | 6.99% | | November 30, 2023 |
| Greenbacker Equipment Acquisition Company LLC | | 6,500,000 | | | Prime + 1.00% | | March 31, 2023 |
| ECA Finco I, LLC | | 19,756,803 | | | 3 mo. LIBOR + 2.25% | | February 25, 2028 |
| GB Solar TE 2020 Manager LLC | | 19,182,430 | | | 3 mo. LIBOR + 1.88% | | October 30, 2026 |
| Sego Lily Solar Manager LLC | | 137,445,285 | | | 1 mo. SOFR + 1.38% | | August 17, 2028 |
| Celadon Manager LLC | | 61,925,120 | | | 1 mo. SOFR + 1.50% | | February 18, 2029 |
| GRP II Borealis Solar LLC | | 41,787,517 | | | 3 mo. LIBOR + 2.50% | | June 30, 2027 |
| Ponderosa Manager LLC | | 147,080,167 | | | 1 mo. SOFR + 1.10% | | Various |
| PRC Nemasket LLC | | 44,487,662 | | | Daily SOFR + 1.25% | | November 1, 2029 |
| GREC Holdings 1 LLC | | 60,000,000 | | | 1 mo. SOFR + 1.75% | | November 29, 2027 |
| Total debt | | $ | 987,089,056 | | | | | |
| Less: Current portion of long-term debt | | (95,869,554) | | | | | |
| Less: Discount on long-term debt | | (28,628,520) | | | | | |
| Less: Deferred financing fees | | (11,830,541) | | | | | |
| Total long-term debt, net | | $ | 850,760,441 | | | | | |
We also suspended our SRP effective September 23, 2023 (except with respect to repurchase requests made in connection with the death, qualifying disability or determination of incompetence of a shareholder), and as a result, we expect to be able to devote a greater amount of our liquidity and capital resources to executing our broader business strategy.
If we are unable to expand our sources of financing, fully utilize our available cash or otherwise meet the required terms and financial covenants associated with our financing arrangements, it may have an adverse effect on our ability to make distributions to our shareholders and to fund our operations. Our liquidity plans are also subject to a number of risks and uncertainties, including those described under the section titled Part I — Item 1A. Risk Factors in this Annual Report on Form 10-K for the year ended December 31, 2023.
Debt Outstanding
We supplement our equity capital and increase potential returns through the use of prudent levels of borrowings both at the corporate level and the project level. The Fifth Operating Agreement does not impose limitations on the amount of borrowings we may employ either at the corporate level or the project level. Our current policy is to generally target a leverage ratio of up to $2 of debt for every $1 of equity on our overall portfolio, with individual allocations of leverage based on the mix of asset types and obligors.
The weighted average interest rate including associated swap agreements, and deferred financing costs and capitalized interest on total debt outstanding was 3.59%3.66% as of December 31, 2022.2023.
The following table sets forth certain information about our debt outstanding:
| | Period ending December 31 | | Principal Payments |
| 2023 | | $ | 100,174,824 | |
| (in thousands) | |
| Period ending December 31, | |
| Period ending December 31, | |
| Period ending December 31, | | | Principal Payments |
| 2024 | 2024 | | 37,846,974 | |
| 2025 | 2025 | | 103,930,544 | |
| 2026 | 2026 | | 109,250,321 | |
| 2027 | 2027 | | 284,224,979 | |
| 2028 | |
| Thereafter | Thereafter | | 351,661,414 | |
| $ | 987,089,056 | |
| | $ | |
In the future, we expect that our ongoing sources of financing will be through corporate-level credit facilities or other secured and unsecured borrowings. In addition, we expect to use other financing methods at the project level as necessary, including joint venture structures, construction loans, tax equity bridge loans, property mortgages, letters of credit, sale and leaseback transactions, other lease transactions and other arrangements, any of which may be unsecured or may be secured by
mortgages or other interests in our assets. Other sources of capital may include tax equity financings, whereby an investor receives an allocation of tax benefits as well as cash distribution.
As of and for the fiscal quarter ended December 31, 2023, GREC Entity HoldCo was not in compliance with the debt service coverage ratio (as defined in the credit agreement) for the credit agreement related to GREC Entity HoldCo, which resulted in the Company’s classification of the debt to current liability as of December 31, 2023. A default under the credit agreement permits the administrative agent, among other things, to declare all or any part of the outstanding principal amount of the loans under the credit agreement and related interest due and payable. The Company is working in good faith with the lender to secure a waiver of default. While the Company expects to receive a waiver of default, there is no guarantee that the Company will receive such waiver. Further there are no cross-defaults associated with this technical default. The Company may use cash on hand, leverage additional borrowing or sell certain assets to meet the obligations if the debt is accelerated. Refer to Part II – Item 8 – Note 11. Debt in the Notes to the Consolidated Financial Statements prepared under the Non-Investment Basis for additional information.
Changes in Cash Flows - Non-Investment Basis
The following table shows cash flows from operating activities, investing activities and financing activities for the stated period for the Company:
| | | | | |
| For the period from May 19, 2022 through December 31, 2022 |
Net cash provided by (used in) operating activities | $ | 11,694,693 | |
Net cash provided by (used in) investing activities | (468,097,376) | |
Net cash provided by (used in) financing activities | 441,651,458 | |
Increase (decrease) in cash, cash equivalents and restricted cash | (14,751,225) | |
| | | | | | | | | | | |
| (in thousands) | For the year ended December 31, 2023 | | For the period from May 19, 2022 through December 31, 2022 |
| Net cash provided by operating activities | $ | 62,401 | | | $ | 11,695 | |
| Net cash used in investing activities | (323,179) | | | (468,098) | |
| Net cash provided by financing activities | 257,755 | | | 441,652 | |
| Net decrease in cash, cash equivalents and restricted cash | (3,023) | | | (14,751) | |
Operating Activities
Net cash provided by operating activities was $62.4 million for the year ended December 31, 2023. The net loss for the year ended December 31, 2023, excluding the impact of non-cash items, resulted in a source of cash inflow of $4.7 million, which is attributable to operating results from the Company’s IPP and IM segments and the costs attributable to the Company’s corporate functions. The Company’s operating activities included a decrease in net working capital of $57.7 million primarily driven by the termination of interest rate swaps as well as increased accounts payable and accrued expenses offset by increased other current and noncurrent assets and accounts receivable.
Net cash provided by operating activities was $11.7 million for the period from May 19, 2022 through December 31, 2022. The net loss for the period from May 19, 2022 through December 31, 2022, excluding the impact of non-cash items, resulted in a source of cash inflow of $8.4 million, which is attributable to operating results from the Company’s IPP segment offset by operating losses on the IM segment and cash expenses forcosts attributable to the Company’s corporate functions. The Company’s operating activities included an increase in net working capital of $3.3 million primarily driven by the timing of collections on accounts receivable and changes to accounts payable and accrued expenses.
Investing Activities
Net cash used in investing activities was $323.2 million for the year ended December 31, 2023. Cash outflows were driven by $360.7 million of purchases of property, plant and equipment and relate primarily to payments made on ongoing construction projects within our solar and wind fleet, for remaining purchase price liabilities on existing projects and new acquisitions within the IPP segment. Additional cash outflows consist of $5.3 million related to the purchase of new investments. This was offset by $30.7 million received in principal repayments of notes receivable, primarily from OYA in the first quarter then Cider and Shepherds Run in the fourth quarter, as well as $8.1 million for deposits returned for property, plant and equipment.
Net cash used in investing activities was $468.1 million for the period from May 19, 2022 through December 31, 2022. Cash outflows were driven by $393.3 million of purchases of property, plant and equipment and relate primarily to payments made on ongoing construction projects within our solar and wind fleet, for remaining purchase price liabilities on existing projects and new acquisitions within the IPP segment. An additional cash outflow of $34.8 million was driven by the purchase of new investments for GDEV prior to deconsolidation, as well as loans made to other parties for $48.2 million, primarily the Cider and OYA secured loans. This was offset by $17.5 million received in principal repayments received, primarily from Chaberton and OYA, as well as $5.5 million proceeds from the sale of the Company’s investment in GDEV on November 18, 2022.
Financing Activities
Net cash provided by financing activities was $257.8 million for the year ended December 31, 2023. The Company's financing activities were driven by proceeds from borrowings of $425.5 million related to the GREC Warehouse Holdings I LLC, GREC Holdings 1 LLC, GB Wind Holdco LLC, Dogwood GB Manager LLC, Celadon Manager LLC and Ponderosa Manager LLC debt facilities. In addition, contributions from Tax Equity Investors totaled $144.9 million primarily driven by contributions to Dogwood Holdco, LLC and Ponderosa Holdings, LLC. The Company also received $241.0 million of proceeds related to failed sale-leaseback arrangements entered into related to certain wind assets. This was offset by distributions to shareholders of $87.6 million, and payments on borrowings of $351.8 million, primarily related to the GREC Holdings 1 LLC, GB Wind Holdco LLC, Ponderosa Manager LLC and GREC Entity Holdco debt facilities. Results were further offset by $82.7 million for repurchases of shares pursuant to the SRP and distributions of $17.5 million to Tax Equity Investors.
Net cash provided by financing activities was $441.7 million for the period from May 19, 2022 through December 31, 2022. The Company's financing activities were driven by proceeds from borrowings of $499.7 million related to the Celadon Manager LLC, PRC Nemasket LLC, Sego Lily Solar Manager LLC and Ponderosa Manager LLC debt facilities. In addition, contributions from GDEV and tax equity investorsTax Equity Investors totaled $104.5 million. This was offset by distributions to shareholders of $51.5 million, and payments on borrowings of $81.6 million, primarily related to the GB Wind Holdco LLC, GREC Entity Holdco and Trillium Manager LLC debt. Results were further offset by $17.2 million for repurchases of shares pursuant to the SRP and distributions of $11.2 million to tax equity investorsTax Equity Investors and GDEV investors prior to deconsolidation.
Changes in Cash Flows - Investment Basis
The following table shows cash flows from operating activities, investing activities and financing activities for the period from January 1, 2022 through May 18, 2022 and the year ended December 31, 2021 for the LLC:
| | | | | | | | | | | |
| For the period from January 1, 2022 through May 18, 2022 | | For the year ended December 31, 2021 |
| Net cash (used in) operating activities | $ | (71,665,183) | | | $ | (731,514,893) | |
| Net cash provided by financing activities | 57,864,270 | | | 848,702,449 | |
| (Decrease) increase in cash, cash equivalents and restricted cash | (13,800,913) | | | 117,187,556 | |
| | | | | | | |
| (in thousands) | For the period from January 1, 2022 through May 18, 2022 | | |
| Net cash (used in) operating activities | $ | (71,665) | | | |
| Net cash provided by financing activities | 57,864 | | | |
| (Decrease) in cash, cash equivalents and restricted cash | (13,801) | | | |
Operating Activities
Net cash used in operating activities was $71.7 million for the period from January 1, 2022 through May 18, 2022. Cash flows used in operating activities before net working capital changes was $73.2 million, which largely consisted of gross funding of new or existing investments, offset by return of capital and sales of money market funds. The cash used in gross funding of new or existing investments of $339.4 million was driven primarily by commercial solar assets, as well as the procurement of equipment, and the acquisition of a 55.455 MW operating wind project located in New York.
Net cash used in operating activities was $731.5 million for the year ended December 31, 2021. Cash flows used in operating activities before net working capital changes was $725.2 million, which largely consisted of gross funding of new or existing investments and purchases of money market funds, offset by return of capital. The cash used in gross funding of new or existing investments of $1.1 billion was driven primarily by commercial solar assets, as well as the procurement of equipment, and the acquisition of a 50.7 MW pre-operational wind project located in California.
Financing Activities
Net cash provided by financing activities was $57.9 million for the period from January 1, 2022 through May 18, 2022. The LLC’s financing activities were primarily driven by proceeds from issuance of common shares, net for $105.2 million, which consisted of new capital raised during the period from January 1, 2022 through May 18, 2022.raised. This was offset by $30.9 million of payments for distributions to shareholders and $13.8 million of repurchases of shares pursuant to the SRP.
Net cash provided by financing activities was $848.7 million for the year ended December 31, 2021. The LLC’s financing activities were primarily driven by proceeds from issuance of common shares, net for $933.9 million, which consisted of new capital raised during the year ended December 31, 2021. This was offset by $55.1 million of payments for distributions to shareholders and $20.7 million for repurchases of shares pursuant to the SRP, as well as payments on borrowings of $8.0 million.
Hedging Activities
The Company manages interest rate risk primarily through the use of derivative financial instruments.
The Company documents the relationship between derivatives and hedged items, as well as the risk-management objective and the strategy for undertaking hedge transactions, at the inception of the hedging relationship. This documentation includes linking cash flow hedges to specific forecasted transactions. The Company also assesses, both at the hedge’s inception and on an ongoing basis, whether the derivative instruments that are used are highly effective in offsetting changes in cash flows of the hedged items. The Company discontinues hedge accounting when it determines that the derivative is no longer effective in offsetting changes in the fair valuesvalue or cash flows of the hedged item, the derivative is settled or terminates, a hedged forecasted transaction is no longer probable of occurring, or a treatment of the derivative as a hedge is no longer appropriate or intended. When a cash flow hedge is discontinued but the hedged cash flows or forecasted transactions are still expected to occur, gains or losses that were accumulated in other comprehensive income are amortized into earnings over the same periods during which the hedged transactions will affect earnings.
The Company’s objective in using interest rate derivatives is to add stability to interest expense and to manage its exposure to interest rate movements. To accomplish this objective, the Company has entered into interest rate swaps as part of its interest rate risk management strategy. These interest rate swaps are designated as cash flow hedges and involve the receipt of variable rate amounts from a counterparty in exchange for the Company making fixed interest rate payments. For derivatives designated as cash flow hedges, the changes in the fair value of the derivative are initially reported in other comprehensive income (outside of earnings), net of tax, and are subsequently reclassified to earnings when the hedged transaction affects earnings. The Company assesses the effectiveness of each hedging relationship by utilizing a third-party statistical regression analysis. Amounts reported in accumulated other comprehensive income related to designated derivatives will be reclassified to interest expense as interest payments are made on the Company’s variable ratevariable-rate liabilities.
SeeRefer to Note 11.12. Derivative Instruments in the Notes to the Consolidated Financial Statements (Non-Investment Basis) for further information with respect to the Company's derivative instruments.
Contractual Obligations
The Company has a variety of contractual obligations and commitments, both short termshort-term and long termlong-term in nature. We have included the following information related to commitments of the Company to further assist investors in understanding our outstanding commitments.
Advisory and Administration Agreements
Prior to the Acquisition, Greenbacker Administration served as our Administrator pursuant to the Administration Agreement. The Administration Agreement was terminated in connection with the Acquisition. Greenbacker Administration continues to perform certain asset management, construction management, compliance and oversight services, as well as asset accounting and administrative services, for many of the Company’s assets.
Refer to Note 4. Related Party Agreements and Transaction Agreements in the Notes to the Consolidated Financial Statements (Investment Basis) for further details.
Letters of Credit
The Company is required to provide security under the terms of several of its power purchase agreements, permits, lease agreements and other project documents as well as many of its loan agreements. As of December 31, 2023, the Company has provided the requisite security for these agreements in the form of a standby letter of credit of $169.7 million. As of December 31, 2023, the Company had no unused letters of credit.
Pledge of Collateral and Unsecured Guarantee of Loans to Subsidiaries
Pursuant to various project loan agreements between the Company's subsidiaries and various lenders, the Company has pledged solar and wind operating assets as well as the membership interests in various subsidiaries as collateral for the term loans with maturity dates ranging from March 2023June 2025 through January 2057.
Investment in To-Be-Constructed Assets and Membership Interest Purchase Commitments
Pursuant to various engineering, procurement and construction contracts and membership interest purchase agreements to which certain of the Company's subsidiaries are individually a party, the subsidiaries, and indirectly the Company, have committed an outstanding balance of approximately $157.5 million$1.2 billion to complete construction of the facilities.facilities and the closing of the purchase of membership interest pursuant to all conditions being met under such agreements. Based upon current construction and closing schedules, the expectation is that these commitments will be fulfilled in 2023 into 2024. In addition, pursuant to various membership interest purchase agreements to which the Company via its subsidiaries are a party, the Company has committed an outstanding balance of approximately $943.4 million to complete the closing pursuant to all conditions being met under the membership interest purchase agreements as of December 31, 2022.between 2024 and 2027. The Company plans to use debt and tax equity financing as well as cash on hand to fund such commitments.
Power Purchase Agreements
The Company has long-term PPAs with its offtake customers. Under the PPAs, the Company is required to deliver agreed-upon quantities based on the agreements for successive periods, typically between one to five year rolling periods, over the terms of the PPAs. As of December 31, 2023, the Company was in compliance with all agreed-upon delivery quantities.
Renewable Energy Credits Commitments
For certain solar and wind power systems, the Company has received incentives in the form of RECs. In certain cases, the entities have entered into fixed-price, fixed volumefixed-volume forward sale transactions to monetize these RECs for specific entities. If we are unable to satisfy the transaction requirements due to lack of production, we may have to purchase RECs on the spot market and/or pay specified replacement cost damages. Based upon current production projections, we do not expect a requirement to purchase RECs to fulfill our current REC sales contracts. IfWhen RECs earned by the entities are not sold either on a forward basis they are soldor in the spot market, with revenue is recorded inwhen the accounts of the underlying investment when received.REC is transferred.
Recording of a sale of RECs under U.S. GAAP is accounted for under ASC Topic 606, Revenue from Contracts with Customers.Customers (“ASC 606”). There are no differences in the process and related revenue recognition between REC sales to utilities and non-utility customers. Revenue is recorded when all revenue recognition criteria are met, including that there is persuasive evidence that an arrangement exists (typically through a contract), services are rendered through the production of electricity, pricing is fixed and determinable under the contract, and collectability is reasonably assured. The accounting policy adopted is that the revenue recognition criteria are met when the energy is produced, and a REC is created and transferred to a third party.party when sold on a forward basis or in the spot market.
If any of our REC counterparties fail to satisfy their contractual obligations, our revenues may decrease under replacement agreements, and we may incur expenses locating and executing such replacement agreements. For the majority of the forward REC contracts currently effective as of December 31, 2022,2023, GREC and/or the Company has provided an unsecured guaranty related to the delivery obligations under these contracts. The amount of the unsecured guaranty on REC contracts is nil as of December 31, 2022.2023.
Leases
Lease agreements are evaluated at inception to determine whether they represent finance or operating leases. The Company has determined its site leases represent operating leases, and accordingly, minimum rental expense is recognized on a straight-line basis over the lease term beginning with the lease commencement date. For finance leases, the minimum rental expense is recognized in a front-loaded expense pattern. Refer to Note 10. Leases in the Notes to the Consolidated Financial Statements (Non-Investment Basis) for further details on the Company’s lease obligations.
Pledge of Parent Company Guarantees
Pursuant to various tax equity structures, which are governed by various agreements to which certain of the Company'sCompany’s subsidiaries are individually a party to, the Company has provided unsecured guarantees to support the commitments and obligations of these underlying tax equity agreements in an amount of $452.3$842.7 million as of December 31, 2022.2023. As of December 31, 2022,2023, the Company is not aware of any events that could trigger the Company’s obligations under these guarantees.
In addition, the Company, along with the parent company of the other 50.00% member of OYA, provided a guarantee to the tax equity investor member in one of the partnerships, for which OYA is the partner, for the payment and performance of all obligations of these subsidiaries under the partnership documents as well as affiliate contracts. As of December 31, 2023, the Company considers it remote that it would be required to make payments under any of these guarantees. Refer to Note 5. Variable Interest Entities in the Notes to the Consolidated Financial Statements (Non-Investment Basis) for further details.
Distributions
Subject to the Board of Directors’ review and approval and applicable legal restrictions, we intend to authorize and declare distributions on a quarterly basis and pay distributions on a monthly basis. We will calculate each shareholder’s specific distribution amount for the period using record and declaration dates, and each member’s distributions will begin to accrue on the date we accept each member’s subscription for shares. From time to time, we may also pay interim special distributions in the form of cash or shares, with the approval of our Board of Directors.
Distributions will be made on all classes of our shares at the same time. The cash distributions with respect to the Class C, P-S and P-T shares are lower than the cash distributions with respect to Class A, I, P-A, P-I and P-D shares because of the distribution fee relating to Class C, P-S and P-T shares, which will be allocated as a class-specific charge. Amounts distributed to each class will be allocated among the holders of our shares in such class in proportion to their shares.
Cash distributions for the year ended December 31, 20222023 were funded from cash on hand and other external financing sources. The Company expects to continue to fund distributions from a combination of cash on hand, cash from operations as well as other external financing sources. Due to the Company’s change in acquisition strategy to include a greater number ofown pre-operational assets that are not yet generating cash from operations as well as the Company’s strategy of engaging in initiatives that include repowering projects where the existing assets are being retrofit with new and/or refurbished technology, including erecting taller, more efficient wind turbines to increase productivity, a significant amount of distributions will continue to be funded from other external financing sources until such projects become operational. Management fee and incentive fee revenue from our IM segment willis also be utilized as a source of capital to fund distributions as this portion of our business grows.
Share Repurchase Program
The Company, through approval by its Board of Directors, adopted the SRP, pursuant to which the Company would conduct quarterly share repurchases to allow members to sell all or a portion of their shares (of any class) back to the Company at a price equal to the then current monthly share value for that class of shares.
The SRP includes numerous restrictions that will limit a shareholder’s ability to sell shares. At the sole discretion of the Board of Directors, the Company may also use cash on hand (including the proceeds from the issuance of new shares), cash available from borrowings or other external financing sources and cash from liquidation of investments to repurchase shares.
A shareholders’ right to purchase is subject to the availability of funds and the other provisions of the SRP. Additionally, a shareholder must hold his or her shares for a minimum of one year before he or she can participate in the SRP, subject to any of the following special circumstances: (i) the written request of the estate, heir or beneficiary or a deceased shareholder; (ii) a qualifying disability of the shareholder for a non-temporary period of time, provided that the condition causing the qualifying disability was not pre-existing on the date that the shareholder became a shareholder; (iii) a determination of incompetence of the shareholder by a state or federal court located in the United States; or (iv) as determined by the Board of Directors, in their discretion, to be in the interests of the Company. If a member has made more than one purchase of shares, the one-year holding period will be calculated separately with respect to each purchase.
The quarterly share repurchases limits for the SRP are set forth below.
| | | | | |
| Quarter Ending | Share Repurchase Limit(s) |
| September 30, 2021, and each quarter thereafter | During any 12-month period, 20.00% of the weighted average number of outstanding shares |
| During any fiscal quarter, 5.00% of the weighted average number of shares outstanding in the prior four fiscal quarters |
The Company may repurchase fewer shares than have been requested in any particular quarter to be repurchased under the SRP, or none at all, in its discretion at any time. Further, the Board of Directors may modify, suspend or terminate the SRP if it deems such action to be in the best interest of the Company and its shareholders or in response to regulatory changes or changes in law.
On September 23, 2023, the Board of Directors approved the suspension of the SRP effective immediately, except for repurchase requests made in connection with the death, qualifying disability or determination of incompetence of a shareholder. As a result of the suspension of the SRP, the Company will not accept or otherwise process any additional repurchase requests (except as noted above) until such time, if any, as the Board of Directors affirmatively authorizes the recommencement of the SRP. However, the Company can make no assurances as to whether this will happen or the timing or terms of any recommencement.
The Company has received an order for the SRP from the SEC under Rule 102(a) of Regulation M under the Exchange Act. In addition, the SRP is substantially similar to repurchase programs for which the SEC has stated it will not recommend enforcement action under Rule 13e-4 and Regulation 14E under the Exchange Act.
Off-Balance Sheet Arrangements
AsIn the ordinary course of December 31, 2022, we dobusiness, the Company engages in financial transactions that are not havepresented on our Consolidated Balance Sheets or may be recorded on our Consolidated Balance Sheets in amounts that are different from the full contract or notional amount of the transaction. The Company’s off-balance sheet arrangements.arrangements consist primarily of unfunded commitments and guarantees to the Tax Equity Investors, which may affect our liquidity and funding requirements based on the likelihood that borrowers will advance funds under the loan commitments or we will be required to perform under the guarantee obligations. Refer to Note 5. Variable Interest Entities in the Notes to the Consolidated Financial Statements (Non-Investment Basis) for further details.
Critical Accounting Policies and Use of Estimates
The following discussion addresses the accounting policies utilized based on our current operations. Our most critical accounting policies involve decisions and assessments that affect our reported assets and liabilities as well as our reported revenues and expenses. We believe that all the decisions and assessments upon which our Consolidated Financial Statements are based were reasonable as of the time made and were based upon information available to us at that time. Our critical accounting policies and accounting estimates may be expanded over time as we continue to implement our business and operating strategy. The material accounting policies and estimates that are most critical to an investor’s understanding of our financial results and condition, as well as those that require complex judgment decisions by our management, are discussed below.
Non-Investment Basis
Basis of Presentation
Since inception and prior to the Acquisition, the Company’s historical financial statements were prepared using the investment company basis of accounting in accordance with ASC 946. ASC 946, or Investment Basis, requires that if there is a subsequent change in the purpose and design of an entity, the entity should reevaluate its status as an investment company. As a result of the Acquisition and other steps taken by the Company to transition the focus of the Company’s business from being an investor in clean energy projects to a diversified independent power producer coupled with an asset management business, the Company no longer exhibits the fundamental characteristics of, and no longer qualifies as, an investment company. The Company discontinued applying the guidance in ASC 946 and began to account for the change in status prospectively in accordance with other U.S. GAAP topics, or Non-Investment Basis, as of the date of the change in status, or May 19, 2022.
Noncontrolling Interests, Redeemable Noncontrolling Interests and Hypothetical Liquidation at Book Value
NCI representrepresents the portion of the Company’s net income (loss), net assets and comprehensive income (loss) that areis not allocable to the Company as they represent third-party interests in the net assets of the respective entity and are based on the contractual allocations within the respective operating agreement or allocated to NCI attributable to the limited partner investors.
For certain NCI when the preferences on profit sharing on liquidation rights and priorities differ from the ownership percentages, the Company considers ASC Topic 970, Real Estate - General, and applies the HLBV method of reporting. Under the HLBV method, the amounts of income and loss attributed to the NCI reflect the changes in the amounts the third parties would hypothetically receive at each balance sheet date based on the liquidation provisions of the respective partnership agreements. HLBV assumes that the proceeds available for distribution are equivalent to the unadjusted, stand-alone net assets of each respective partnership, as determined under U.S. GAAP. The third-party noncontrolling interests in the Consolidated StatementStatements of Operations and Consolidated StatementStatements of Comprehensive Income (Loss), if applicable, are determined based on the difference in the carrying amounts of NCI on the Consolidated Balance SheetSheets between reporting dates, adjusted for any capital transactions between the Company and third-party investors that occurred during the respective period.
The Company accounts for the portion of net assets in the consolidated entities attributable to the noncontrolling investors as RNCI or NCI in its Consolidated Financial StatementsStatements. NCI is measured using the HLBV method and RNCI is measured using the greater of the estimated redemption value or HLBV method. NCI in subsidiaries that are redeemable at the option of the NCI holder are classified as RNCI on the Consolidated Balance Sheet.
Fair Value Measurements
ASC 820 prioritizes the use of market-based inputs over entity-specific inputs and establishes a three-level hierarchy for fair value measurements based upon the transparency of inputs to the valuation. The three levels of valuation hierarchy are defined as follows:
Level 1: Unadjusted quoted prices for identical assets or liabilities in active markets.
Level 2: Other significant observable inputs that are sourced either directly or indirectly from publications or pricing services, including dealer or broker markets, for identical or comparable assets or liabilities. Generally, these inputs should be widely accepted and public, non-proprietary, and sourced from an independent third party.
Level 3: Inputs derived from a significant amount of unobservable market data and derived primarily through the use of internal valuation methodologies.
The Company has financial assets and liabilities within Level 2 and Level 3 of the three-level hierarchy.
Revenue Recognition
The Company recognizes revenue from contracts with customers in accordance with ASC Topic 606, Revenue from Contracts with Customers, which provides a five-step model for recognizing revenue as follows:
1.Identify the contract
2.Identify performance obligations
3.Determine the transaction price
4.Allocate the transaction price
5.Recognize revenue
The Company has elected as a practical expedient the accounting policy under which it excludes from the transaction price, sales taxes it collects from its customers assessed by a governmental authority.authorities. The Company, therefore, reports sales revenue net of any sales tax.taxes.
Energy Sales
The Company’s revenue is primarily derived from the sale of power under long-term PPAs. The Company’s PPAs generally have a term between 10-2010-30 years. Customers consist of commercial property owners, corporate entities, municipal entities, and utility companies located within the continental United States and Canada. The Company operates solar, wind, biomass, and battery systems.
Certain of these PPAs are accounted for as leases.leases with variable lease payments. ASC Topic 842, Leases (“ASC 842”), requires the minimumvariable lease payments received to be amortized over the term of the lease and variable lease revenue to be recorded in the period when the changes in facts and circumstances on which the variable lease payments are based occur. See further detail regarding the Company’s PPAs accounted for as leases in Note 9.10. Leases. Sales are subject to economic and weather conditions and may fluctuate based on changes in the industry, regulatory policies, tax incentives, trade policies, and financial markets.
The Company has identified the sale of renewable energy and capacity, and when bundled into the PPA, RECs, as the performance obligations within its PPAs. The Company transfers control of the electricity and capacity over time, and the customer simultaneously receives and consumes the benefits provided by the Company'sCompany’s performance as it performs. The RECs bundled into PPAs are generated upon generation of renewable power from our renewable energy generatingenergy-generating assets. Accordingly, the Company has concluded that the sale of electricity, capacity, and when included in the contract, RECs, represent series of distinct goods or services that are substantially the same and that have the same pattern of transfer to the customer. Each distinct transfer of electricity in kWh that the Company promises to transfer to the customer meets the criteria to be a performance obligation satisfied over time. The Company recognizes revenue based on the amount metered and invoiced on the basis of the contract prices multiplied by kWh delivered. The Company applies the invoicing practical expedient to recognize revenue in circumstances where the amount of revenue recognized is determined based on the output produced.
Renewable Energy Credits Sales and Other Incentives
The Company has concluded the sale of RECs performance obligation that are not required to be generated by a specific renewable energy generatingenergy-generating asset is satisfied at the point in time in which control is transferred to the customer, which may be
upon delivery of the attributes or delivery of the related renewable energy, dependent on whether the contract number of RECs is a fixed amount or based upon the amount of power generated. This represents the point in time where the Company has a present right to payment and the customer has significant risks and rewards related to ownership of the RECs.
In a bundled contract to sell energy and RECs, all performance obligations are deemed to be delivered at the same time. In such cases, the Company does not allocate the transaction price to multiple performance obligations.
Contract Amortization
Intangible assets and out-of-market contracts recognized from PPAs and RECs assumed through acquisitions related to the sale of energy in future periods for which the fair value has been determined to be less (more) than market are amortized to revenue over the term of each underlying contract on a straight-line basis.
Investment Management Revenue
The Company also performs investment management and other administrative services for other funds in the sustainable infrastructure renewable energy industry. Such services comprise many activities which constitute a series of distinct services satisfied over time. These activities include capital raising and capital deployment, marketing and other investor relations functions as well as technical asset management, finance and accounting, legal and other administrative services. The performance obligation is satisfied over time because the customer simultaneously receives and consumes the benefits provided by the entity’s performance as the Company performs. The Company utilizes an output method based on time elapsed to measure progress towards satisfaction of the performance obligation.
Interest Revenue
Interest revenue relates to the Company's secured loans to developers within the renewable energy industry. To the extent the Company expects to collect such amounts, interest revenue is recorded on an accrual basis. If there is reason to doubt an ability to collect such interest, interest receivable on loans is not accrued for accounting purposes. Original issue discounts, market discounts or market premiums are accreted or amortized using the effective interest method as interest revenue. Prepayment premiums on loans are recorded as interest revenue when received. Any application, origination or other fees earned by the Company in arranging or issuing debt are amortized over the expected term of the loan.
Loans are placed on non-accrual status when principal and interest are 90 days or more past due, or when there is a reasonable doubt that principal or interest will be collected. Accrued interest is generally reversed when a loan is placed on non-accrual status. Interest payments received on non-accrual loans may be recognized as revenue or applied to principal depending upon management’s judgment regarding collectability. Non-accrual loans are generally restored to accrual status when past due principal and interest is paid and, in management’s judgment, is likely to remain current.
Goodwill
Goodwill reflects the excess of the consideration transferred, including the fair value of any contingent consideration, over the assigned fair values of the identifiable net assets acquired. Goodwill is not amortized and is tested for impairment at least on an annual basis during the fourth quarter or more frequently if facts or circumstances indicate that the goodwill might be impaired. In assessing goodwill for impairment, the Company may elect to use a qualitative assessment to determine whether the existence of events or circumstances leadslead to a determination that it is more likely than not that the fair value of goodwill is less than its carrying amount. If the Company determines it is not more likely than not that the fair value of goodwill is less than its carrying amount, the Company will not be required to perform any additional tests in assessing goodwill for impairment. If the Company concludes otherwise, or elects not to perform the qualitative assessment, then the Company will be required to perform the quantitative impairment test. If the estimated fair value of the reporting unit is less than its carrying value, the Company performs additional quantitative analysis to determine if the reporting unit’s goodwill has been impaired. Impairment is indicated if the estimated fair value of the reporting unit is less than the carrying amount of the reporting unit, and an impairment charge is recognized for the differential.
Acquisitions
For acquisitions meeting the definition of a business combination, the acquisition method of accounting is used in accordance with ASC Topic 805, Business Combinations (“ASC 805”). The consideration transferred for the acquired business is allocated to the assets acquired and liabilities assumed based on the fair values at the date of acquisition, including identifiable intangible assets. Any excess of the amount paid over the estimated fair value of the identifiable net assets acquired is allocated to goodwill. These fair value determinations require judgment and involve the use of significant estimates and assumptions, including assumptions with respect to future cash inflows and outflows, discount rates, implied rate of return and
weighted average cost of capital, asset lives and market multiples, among other items. Acquisition-related costs, such as professional fees, are excluded from the consideration transferred and are expensed as incurred.
Asset acquisitions are measured based on the cost to the Company, including transaction costs. Asset acquisition costs, or the consideration transferred by the Company, are assumed to be equal to the fair value of the net assets acquired. If the consideration transferred is cash, measurement is based on the amount of cash paid to the seller, as well as transaction costs incurred. The cost of an asset acquisition is allocated to the assets acquired based on their relative estimated fair values. Goodwill is not recognized in an asset acquisition.
The Company records contingent consideration related to its asset acquisitions when it is both probable that the Company will be required to pay such amounts and the amount is estimable. These contingencies generally relate to payments due upon the acquired projects reaching milestones as specified in the acquisition agreements. As of December 31, 2023 and 2022, the Company has recorded a liability of $16.5 million and $25.9 million, respectively, within Contingent consideration, current on the Consolidated Balance Sheets related to these agreements.
Income Taxes
The Company intends to operate so that it will qualify to be treated as a partnership for U.S. federal income tax purposes under the Internal Revenue Code. As such, it will not be subject to any U.S. federal and state income taxes. In any year, it is possible that the Company will not meet the qualifying income exception and will not qualify to be treated as a partnership. If the Company does not meet the qualifying income exception, the members would then be treated as stockholders in a corporation, and the Company would become taxable as a corporation for U.S. federal income tax purposes under the Internal Revenue Code. The Company would be required to pay income tax at corporate rates on its net taxable income. To the extent of the Company’s earnings and profits, the payment of the distributions would not be deductible by the Company, and distributions to members from the Company would constitute dividend income taxable to such members.
The Company conducts substantially all its operations through its wholly owned subsidiary, GREC, which is a corporation that is subject to federal, state, provincial, local and foreign income taxes based on income. Accordingly, most of its operations will be subject to federal, state, provincial, local and foreign income taxes in the jurisdictions in which it operates.
Income taxes are accounted for under the assets and liabilities method. Deferred tax assets and liabilities are recorded for the estimated future tax consequences attributable to differences between items that are recognized in the Consolidated Financial Statements and tax returns in different years. Deferred tax assets and liabilities are measured using enacted tax rates expected to apply to taxable income in the years in which those temporary differences are expected to be recovered or settled. The effect on deferred tax assets and liabilities of a change in tax rates is recognized in income in the period that includes the enactment date.
PTCs are recognized as wind energy from qualified projects is generated and sold based on a per kWh rate prescribed in applicable federal and state statutes. The tax benefits of PTCs are recognized as either reductions to current income taxes payable, unless limited by tax law, in which instance they are deferred tax assets with a carry forward period of 20 years. The Company recognizes ITCs as a reduction to income tax expense when the related energy property is placed into service.
For income tax benefits to be recognized, including uncertain tax benefits, a tax position must be more likely than not to be sustained upon examination by taxing authorities. The amount recognized is measured as the largest amount of the benefit that is more likely than not to be realized upon ultimate settlement. A valuation allowance is established against net deferred tax assets if, based on the weight of available evidence, it is more likely than not that some or all of the net deferred tax assets will not be realized. Changes in recognition or measurement are reflected in the period in which the change in judgment occurs. Interest and penalties associated with income taxes, if any, will be recognized in general and administrative expense.
The Company follows the authoritative guidance on accounting for uncertainty in income taxes and has concluded it has no material uncertain tax positions to be recognized at this time.
LeasesImpairment of Long-Lived Assets
In February 2016accordance with ASC Topic 360, Property, Plant, and as subsequently modified, the FASB issued ASU No. 2016-02, Leases, or ASC 842, with the objective to increase transparency and comparability among organizations related to their leasing arrangements. This comprehensive new standard amends and supersedes existing lease accounting guidance and is intended to increase transparency and comparability among organizations by recognizing ROU leaseEquipment, long-lived assets and lease liabilities onintangible assets with determinable useful lives are reviewed for impairment whenever events or changes in circumstances indicate that the balance sheetcarrying amount of an asset may not be recoverable. Recoverability of assets to be held and requiring disclosureused is measured by a comparison of key information about leasing arrangements. Lease expense continuesthe carrying amount of the assets to the future undiscounted net cash flows expected to be generated by the asset. If such assets are considered to be impaired, the impairment to be recognized in a manner similar to legacy U.S. GAAP. As of December 31, 2022,is measured by the Company was no longer considered an “emerging growth company” pursuant toamount by which the provisions of the JOBS Act, enacted on April 5, 2012. For as long as the Company was an “emerging growth company,” we were permitted to take advantage of certain exemptions from various reporting requirements or extended
transition periods for complying with new or revised accounting standards, including adoption of this ASU for fiscal years beginning after December 15, 2021. The Company adopted ASC 842 effective January 1, 2022 using the modified retrospective approach.
Under ASC 842, a lease is a contract, or part of a contract, that conveys the right to control the use of identified property, plant or equipment (i.e., an identified asset) for a period of time in exchange for consideration. The Company’s contracts determined to be or contain a lease include explicitly or implicitly identified assets where the lessee has the right to control the usecarrying amount of the assets duringexceeds the lease term.
To reducefair value of the burden of adoption and ongoing compliance with ASC 842, a number of practical expedients and policy elections are available under the new guidance. The Company elected the “package of practical expedients” permitted under the transition guidance, which allowed the Company to not reassess whether contracts entered into prior to adoption are or contain leases and also allowed the Company to carryforward the historical lease classification for existing leases. The Company also elected the hindsight practical expedient and therefore reassessed the lease term for existing leases.
The Company made an accounting policy election under ASC 842 not to recognize ROU assets and lease liabilities for leases with a termwould be charged to earnings. Assets to be disposed of twelve months or less. For all other leases, the Company recognizes ROU assets and lease liabilities based on the present value of lease payments over the lease termare reported at the commencement datelower of the lease.carrying amount or fair value less the costs to sell.
Investment Basis
Basis of Presentation
For the period through May 18, 2022, the LLC's Consolidated Financial Statements were prepared using the specialized accounting principles of ASC 946. In accordance with this specialized accounting guidance, the LLC recognized and carried all its investments, including investments in the underlying operating entities, at fair value with changes in fair value recognized in earnings. Additionally, the LLC did not apply the equity method of accounting to its investments. The LLC carried its liabilities at amounts payable, net of unamortized premiums or discounts. The LLC did not elect to carry its non-investment liabilities at fair value. Net assets were calculated as the carrying amounts of assets, including the fair value of investments, less the carrying amounts of its liabilities.
Valuation of Investments at Fair Value
ASC 820 defines fair value, establishes a framework for measuring fair value in accordance with U.S. GAAP, and expands disclosures about fair value. The LLC recognizes and accounts for its investments at fair value. The fair value of the investments does not reflect transaction costs that may be incurred upon disposition of the investments.
Fair value is defined as the price that would be received to sell an asset or paid to transfer a liability in an orderly transaction between market participants. Fair value is an exchange price notion under which fair value is the price in an orderly transaction between market participants to sell an asset or transfer a liability in the market in which the reporting entity would transact for the asset or liability.
GCM has established procedures to estimate the fair value of its investments that the LLC’s Board of Directors has reviewed and approved. To the extent that such market data is available, the LLC will use observable market data to estimate the fair value of investments. In the absence of quoted market prices in active markets or quoted market prices for similar assets in markets that are not active, the LLC will use the valuation methodologies described below with unobservable data based on the best available information in the circumstances. These methodologies incorporate the LLC’s assumptions about the factors that a market participant would use to value the asset.
The LLC considers investments in money market funds to be short-term investments. Short-term investments are stated at cost, which approximates fair value.
For investments for which quoted market prices are not available, which comprise most of our investment portfolio, fair value is estimated by using the cost, income or market approach. The income approach assumes that value is created by the expectation of future benefits, discounted by a risk premium, to calculate a current cash value. This estimate is the fair value: thevalue (the amount an investor would be willing to pay to receive those future benefits.benefits). The market approach compares either recent comparable transactions to the investment or an offer to purchase an investment based upon a qualified bid: abid (a signed term sheet and/or a signed purchase agreement.agreement). Adjustments to proposed prices are made to account for the probability of the deal closing, changes between proposed and executed terms, and any dissimilarity between the comparable transactions and their underlying investments. If multiple bids are qualified in the same valuation period, a blended market approach will be calculated.
Prior to the second quarter of 2020, fair value for pre-operational assets was approximated using the cost approach. Beginning in the second quarter of 2020, GCM expanded the criteria whereby certain pre-operational assets are identified and qualified for the income approach, rather than the cost approach, for approximating fair value. Currently, GCM considers all owned assets that are fully construction readyconstruction-ready with no impediments to begin construction and where the costs to complete such projects are well understood for the income approach. The fair value of such eligible projects is determined based upon a discounted cash flow methodology. If the portfolio has any significant portion of value that remains subject to negotiation or contract or if other significant risks to complete the project exist, the investment may be held at cost, as an approximation of fair value. These valuation methodologies involve a significant degree of judgment by GCM.
In determining the appropriate fair value of an investment using these approaches, the most significant information and assumptions include, as applicable: available current market data, including relevant and applicable comparable market transactions, applicable market yields and multiples, security covenants, call protection provisions, information rights, the nature and realizable value of any collateral, the investment’s ability to make payments, its earnings and discounted cash flows, the markets in which the project does business, comparisons of financial ratios of peer companies that are public, comparable mergers and acquisitions, the principal market and enterprise values, and environmental factors, among other factors.
The estimated fair values will not necessarily represent the amounts that may be ultimately realized due to the occurrence or non-occurrence of future circumstances that cannot be reasonably determined. Because of the inherent uncertainty of the valuation of the investments, the estimate of fair values may differ significantly from the value that would have been used had a broader market for the investments existed.
The authoritative accounting guidance prioritizes the use of market-based inputs over entity-specific inputs and establishes a three-level hierarchy for fair value measurements based upon the transparency of inputs to the valuation. The three levels of valuation hierarchy are defined as follows:
Level 1: Unadjusted quoted prices for identical assets or liabilities in active markets.
Level 2: Other significant observable inputs that are sourced either directly or indirectly from publications or pricing services, including dealer or broker markets, for identical or comparable assets or liabilities. Generally, these inputs should be widely accepted and public, non-proprietary and sourced from an independent third party.
Level 3: Inputs derived from a significant amount of unobservable market data and derived primarily through the use of internal valuation methodologies.
In all cases, the level in the fair value hierarchy within which the fair value measurement in its entirety falls will be determined based on the lowest level of input that is significant to the fair value measurement. Our assessment of the significance of an input to the fair value measurement in its entirety requires judgment and considers factors specific to each investment.
Recently Issued Accounting Pronouncements
SeeRefer to Note 2. Significant Accounting Policies in the Notes to our unauditedthe Consolidated Financial Statements (Non-Investment Basis) for a discussion of recent accounting pronouncements and recently issued accounting pronouncements not yet adopted under the Non-Investment Basis.
ITEM 7A. QUANTITATIVE AND QUALITATIVE DISCLOSURES ABOUT MARKET RISK
The following qualitative disclosures regarding our market risk exposures, — except for (i) those disclosures that are statements of historical fact;fact, and (ii) the descriptions of how we manage our primary market risk exposures, — constitute forward-looking statements within the meaning of Section 27A of the Securities Act and Section 21E of the Exchange Act. Our primary market risk exposures as well as the strategies used and to be used by us managing such exposures are subject to numerous uncertainties, contingencies and risks, any one of which could cause the actual results of our risk controls to differ materially from the objectives of such strategies. Government interventions, defaults and expropriations, illiquid markets, the emergence of dominant fundamental factors, political upheavals, changes in historical price relationships, an influx of new market participants, increased regulation and many other factors could result in material losses as well as in material changes to our risk exposures and risk management strategies. There can be no assurance that our current market exposure and/or risk management strategies will not change materially or that any such strategies will be effective in either the short or long term. Investors must be prepared to lose all or substantially all their investment in the shares.
We anticipate that our primary market risks will be related to commodity prices, the credit quality of our counterparties and project companies, changes in market interest rates and changes in government incentives. We will seek to manage these risks while at the same time seeking to provide an opportunity for shareholders to realize attractive returns through ownership of our shares.
Commodity Price Risk
Acquisitions of renewable energy and energy efficiency projects and businesses expose us to volatility in the market prices of electricity. To stabilize our revenue, we generally expect our projects will have PPAs with local utilities and offtakers that ensure all or most of electricity generated by each project will be purchased at the contracted price. In the event any electricity is not purchased by the offtaker or the energy produced exceeds the offtaker’s capacity, we generally will sell that excess energy to the local utility or another suitable counterparty, which would ensure revenue is generated for all electricity produced. We may be exposed to the risk that the offtaker will fail to perform under the PPA, with the result that we will have to sell our electricity at the market price, which could be either advantageous or disadvantageous, depending on the market price of electricity at that point in time.
In regard to the market price of oil, our investments are little affected by the volatility in this market, as most oil consumed in the U.S. today is used for transportation infrastructure and not for the generation of electricity. Volatility in the market price of natural gas can result in volatility in the market price of electricity. The contractual status of our projects limits our exposure to volatility in the market prices of electricity caused by volatility in the market price of natural gas to our projects’ post-PPA periods, to situations where an offtaker is unable to fulfill their contractual obligation to buy the power the projects generate, or to situations where the projects generate energy in excess of that agreed upon in their PPAs and the excess power is sold to the market.
In regard to the market price of other commodities, increases in the costs of raw materials used in the construction of our renewable energy assets, could materially adversely affect the cost required to bring our projects to commercial operation. To mitigate this risk, we (i) when possible, share this risk with developers from whom we purchase in construction and pre-construction assets, and (ii) pursue large forward procurement strategies to secure equipment for our in constructionin-construction portfolio from large and credit worthy suppliers of equipment with fixed price contracts. When we do assume pricing risk for equipment, we budget for what we believe are conservative contingencies within our construction budgets.
Credit Risk
Through our acquisitions in our target assets, we expect to be indirectly exposed to credit risk relating to counterparties to the electricity sales agreements (including PPAs) for our projects as well as the businesses in which we invest. If counterparties to the electricity sales agreements for our projects or the businesses in which we invest are unable to make payments to us when due, or at all, our financial condition and results of operations could be materially adversely affected. The Company will seek to mitigate this risk by deploying a comprehensive review and asset selection process and careful ongoing monitoring of acquired assets. In addition, we will seek contracts with high-credit-quality counterparties. Nevertheless, unanticipated credit losses could occur, which could adversely impact our operating results.
Changes in Market Interest Rates
With respect to our business operations, general increases in interest rates over time may cause the interest expense associated with our borrowings to increase, and the value of our debt investments to decline. Conversely, general decreases in interest rates over time may cause the interest expense associated with our borrowings to decrease, and the value of our secured
loans to increase. As discussed above, we attempt to use of interest rate derivatives to add stability to interest expense and to manage its exposure to interest rate movements. To accomplish this objective, the Company has entered into interest rate swaps as part of its interest rate risk management strategy. These interest rate swaps are designated as cash flow hedges and involve the receipt of variable rate amounts from a counterparty in exchange for the Company making fixed interest rate payments.
Changes in Government Incentives
Retrospective changes in the levels of government incentives may have a negative impact on our current renewable energy projects. Prospective changes in the levels of government incentives, including renewable energy credits and investment tax credits, may impact the relative attractiveness of future acquisitions in various renewable energy projects, which could make it difficult for the Company to find suitable acquisitions in the sector.
ITEM 8. CONSOLIDATED FINANCIAL STATEMENTS AND SUPPLEMENTARY DATA
INDEX TO CONSOLIDATED FINANCIAL STATEMENTS
| | | | | |
| PAGE |
| |
| Consolidated Financial Statements (Non-Investment Basis) | |
| |
| |
| |
| |
| |
| |
| |
| |
| |
| |
| |
| |
| |
| |
| |
| |
| |
| Consolidated Financial Statements (Investment Basis) | |
| |
| |
| |
| |
| |
| |
| |
| |
| |
| |
| |
| |
| |
| |
| |
| |
| |
| |
Report of Independent Registered Public Accounting Firm
To the Members and Board of Directors
Greenbacker Renewable Energy Company LLC:
Opinion on the Consolidated Financial Statements
We have audited the accompanying consolidated balance sheetsheets of Greenbacker Renewable Energy Company LLC and subsidiaries (the Company) as of December 31, 2023 and December 31, 2022, and the related consolidated statementstatements of operations, comprehensive income (loss), redeemable noncontrolling interests and equity, and cash flows for the year ended December 31, 2023 and for the period from May 19, 2022 throughDecember 31, 2022, and the related notes (collectively, the consolidated financial statements). In our opinion, the consolidated financial statements present fairly, in all material respects, the financial position of the Company as of December 31, 2023 and December 31, 2022, and the results of its operations and its cash flows for the year ended December 31, 2023 and for the period from May 19, 2022 throughDecember 31, 2022, in conformity with U.S. generally accepted accounting principles.
Change in Accounting Principle
As discussed in Note 2 to the consolidated financial statements, the Company discontinued the application of investment company accounting guidance in Financial Accounting Standards Board Accounting Standard Codification Topic 946, Financial Services - Investment Companies as of May 19, 2022 and prospectively applied other generally accepted accounting principles for companies which are not investment companies.
Basis for Opinion
These consolidated financial statements are the responsibility of the Company’s management. Our responsibility is to express an opinion on these consolidated financial statements based on our audit.audits. We are a public accounting firm registered with the Public Company Accounting Oversight Board (United States) (PCAOB) and are required to be independent with respect to the Company in accordance with the U.S. federal securities laws and the applicable rules and regulations of the Securities and Exchange Commission and the PCAOB.
We conducted our auditaudits in accordance with the standards of the PCAOB. Those standards require that we plan and perform the audit to obtain reasonable assurance about whether the consolidated financial statements are free of material misstatement, whether due to error or fraud. The Company is not required to have, nor were we engaged to perform, an audit of its internal control over financial reporting. As part of our audit,audits, we are required to obtain an understanding of internal control over financial reporting but not for the purpose of expressing an opinion on the effectiveness of the Company’s internal control over financial reporting. Accordingly, we express no such opinion.
Our auditaudits included performing procedures to assess the risks of material misstatement of the consolidated financial statements, whether due to error or fraud, and performing procedures that respond to those risks. Such procedures included examining, on a test basis, evidence regarding the amounts and disclosures in the consolidated financial statements. Our auditaudits also included evaluating the accounting principles used and significant estimates made by management, as well as evaluating the overall presentation of the consolidated financial statements. We believe that our audit providesaudits provide a reasonable basis for our opinion.
Critical Audit MattersMatter
The critical audit mattersmatter communicated below are mattersis a matter arising from the current period audit of the consolidated financial statements that werewas communicated or required to be communicated to the audit committee and that: (1) relaterelates to accounts or disclosures that are material to the consolidated financial statements and (2) involved our especially challenging, subjective, or complex judgments. The communication of a critical audit mattersmatter does not alter in any way our opinion on the consolidated financial statements, taken as a whole, and we are not, by communicating the critical audit mattersmatter below, providing a separate opinionsopinion on the critical audit mattersmatter or on the accounts or disclosures to which they relate.it relates.
Evaluation of the newly formed tax equity partnershipspartnership
As discussed in Notes 2, 5, 13, and 1617 of the consolidated financial statements, (non-investment basis), the Company participates in certain tax equity partnerships that qualify as variable interest entities (VIEs). For certain noncontrolling interests (NCI) when the preferences on profit sharing on liquidation rights and priorities differ from the ownership percentages, the Company applies the HLBVHypothetical Liquidation at Book Value (HLBV) method of reporting. Under the HLBV method, the amounts of income and loss attributed to the NCI reflect the changes in the amounts the third parties would hypothetically receive at each balance sheet date based on the liquidation provisions of the respective partnership agreements. HLBV assumes that the proceeds available for distribution are equivalent to the unadjusted, stand-alone net assets of each respective partnership. Nonredeemable noncontrolling interests as of December 31, 2022,2023, and net loss attributable to noncontrolling interests for the period ended May 19 2022 to December 31, 20222023 were $83.3$113.9 million and $60.7$96.9 million, respectively.
We identified the evaluation of the newly formed tax equity partnershipspartnership in the current year as a critical audit matter. This was due to the challenging, subjective,Challenging and complex auditor judgement was required to evaluate the HLBV methodology, which included specialized skills and knowledge to evaluate thatthe consistency of the HLBV methodology used was consistent with the liquidation provisions of the underlying operating and partnership agreements for liquidation, which can be based on complex income tax rules and regulations.
The following are the primary procedures we performed to address this critical audit matter. We evaluated the design of certain internal controls over the Company’s review of the HLBV model,tax equity partnership process, including controls related to reviewthe setup of and consistency of the setup and accountingHLBV methodology with the provision of the partnership liquidation model in relation to theunderlying operating and partnership agreements provisions, as well as the applicable tax regulations.for liquidation. We read the operating and partnership agreements and compared them against the Company’s partnership liquidationHLBV model for the corresponding tax equity partnership. We involved tax professionals with specialized skills and knowledge, who assisted in:
•analyzing the tax status of the entitiesnewly formed tax equity partnership and the requirements of the operating and partnership agreement provisions, as well as the partnership tax regulations.regulations
•evaluating the Company’s methodology for calculating the hypothetical liquidation amounts for athe newly formed tax equity partnership in accordance with the operating and partnership agreement provisions, as well as the partnership tax regulations.
Valuation of channel partner relationships intangible asset and contingent consideration
As discussed in Note 3 of the consolidated financial statements (non-investment basis), on May 19, 2022, the Company completed a management internalization transaction pursuant to which it acquired substantially all of the business and assets including intellectual property and personnel of its external advisor, Greenbacker Capital Management (GCM), Greenbacker Administration, Greenbacker Development Opportunities GP I, LLC (GDEV GP) (collectively, the “Acquired Entities”) for a total purchase consideration of $294.1 million. As a result of the transaction the Company acquired channel partner relationship intangible assets with an acquisition-date fair value of $94.7 million. Additionally, as part of the total purchase consideration, the Company recorded contingent consideration related to approximately 13 million of a newly created common shares of the Company designated as “the Earnout Shares”. The Earnout Shares are part of the purchase consideration and are non-participating shares until the achievement of separate benchmark quarter-end run-rate revenue targets applicable to each series at which point they will become Participating Earnout Shares. The acquisition-date fair value determined for the contingent consideration was $73.6 million.
We identified the evaluation of the initial fair value of the of the channel partner relationship intangible asset (channel partner relationships) and the initial contingent consideration from the acquisition of the Acquired Entities as a critical audit matter. A high degree of subjective auditor judgment was required to evaluate certain assumptions in the discounted cash flow models used to determine the fair value of the channel partner relationships and in the Monte-Carlo simulation to determine the fair value of the contingent consideration. Such assumptions included in
the valuation of the channel partner relationships included projected capital raise, attrition rate, and discount rate applied. Such assumptions included in the valuation of the contingent consideration included projected revenue run-rate, revenue volatility, and share price volatility. Changes in these assumptions could have a significant impact on the fair value of the channel partner relationships or contingent consideration liability.
The following are the primary procedures we performed to address this critical audit matter. We evaluated the design of certain internal controls related to the Company’s acquisition date valuation process, specifically controls over the development of the above listed assumptions used to value the channel partner relationships and contingent consideration. We evaluated the projected capital raise and the associated projected revenue run-rate, along with the attrition rate by comparing these assumptions to the pre-acquisition historical performance of both the Company and the Acquired Entities. In addition, we involved valuation professionals with specialized skills and knowledge who assisted in:
•evaluating the customer attrition rate utilized by the Company in the fair value of the channel partner relationships by observing relationship assets recorded in financial statements of public companies related to the acquisitions of asset managers and compared the relationship assets percentage of total acquired net assets in the aforementioned public companies to that of the Company
•evaluating the Company’s discount rate utilized by the Company for the channel partner relationships by comparing the aforementioned rate against a discount rate range that was independently developed using observable market data from a guideline public company set
•evaluating the Company’s expected share price and revenue volatility utilized in the Company’s contingent consideration calculation by comparing the aforementioned volatilities against share price and revenue volatility indications that were independently developed based upon observable market data from a guideline public comparable company set and adjustments to capture Company-specific factors
•developing a fair value estimate of the channel partner relationship intangible assets using the Company’s cash flow projections and independently developed discount rate and comparing it to the Company’s estimate.
•developing a fair value estimate of the contingent consideration using a parallel Monte-Carlo simulation and comparing it to the Company’s estimate.
We have served as the Company’s auditor since 2012.
New York, New York
March 31, 202328, 2024
Consolidated Financial Statements (Non-Investment Basis)
GREENBACKER RENEWABLE ENERGY COMPANY LLC AND SUBSIDIARIES
CONSOLIDATED BALANCE SHEETSHEETS
| | | | | |
| December 31, 2022 |
Assets | |
Current assets: | |
Cash and cash equivalents | $ | 143,223,982 | |
Restricted cash | 47,474,110 |
Accounts receivable | 20,440,153 |
Derivative assets, current | 24,446,790 |
Notes receivable, current | 59,106,434 |
Other current assets | 29,624,295 |
Total current assets | 324,315,764 | |
Noncurrent assets: | |
Property, plant and equipment, net | 1,889,705,529 |
Intangible assets, net | 540,620,964 |
Goodwill | 221,313,776 |
Investments, at fair value | 92,554,266 |
Derivative assets | 171,392,726 |
Other noncurrent assets | 147,339,466 |
Total noncurrent assets | 3,062,926,727 | |
Total assets | $ | 3,387,242,491 | |
| |
Liabilities, Redeemable Noncontrolling Interests and Equity | |
Current liabilities: | |
Accounts payable and accrued expenses | $ | 50,701,644 | |
Shareholder distributions payable | 9,670,283 | |
Contingent consideration, current | 25,891,317 | |
Current portion of long-term debt | 95,869,554 | |
Redemptions payable | 32,198,102 | |
Other current liabilities | 10,861,131 | |
Total current liabilities | 225,192,031 | |
Noncurrent liabilities: | |
Long-term debt, net of current portion | 850,760,441 | |
Contingent consideration | 75,700,000 | |
Deferred tax liabilities, net | 85,654,803 | |
Operating lease liabilities | 101,281,144 | |
Out-of-market contracts, net | 218,112,321 | |
Other noncurrent liabilities | 39,825,898 | |
Total noncurrent liabilities | 1,371,334,607 | |
Total liabilities | $ | 1,596,526,638 | |
| |
Commitments and contingencies (Note 13. Commitments and Contingencies) | |
| |
Redeemable noncontrolling interests | 2,034,000 | |
| |
Equity: | |
Preferred shares, par value, $0.001 per share, 50,000,000 authorized; none issued and outstanding | — | |
Common shares, par value, $0.001 per share, 350,000,000 authorized, 198,044,410 outstanding | 198,044 | |
Additional paid-in capital | 1,763,061,377 | |
Accumulated deficit | (114,679,721) | |
Accumulated other comprehensive income | 56,094,242 | |
Noncontrolling interests | 84,007,911 | |
Total equity | 1,788,681,853 | |
Total liabilities, redeemable noncontrolling interests and equity | $ | 3,387,242,491 | |
(in thousands, except per share data) | | | | | | | | | | | |
| December 31, 2023 | | December 31, 2022 |
| | | |
| Assets | | | |
| Current assets: | | | |
| Cash and cash equivalents | $ | 96,872 | | | $ | 143,224 | |
| Restricted cash, current | 85,235 | | | 47,474 |
| Accounts receivable | 23,310 | | | 20,440 |
| Derivative assets, current | 24,062 | | | 24,447 |
| Notes receivable, current | 28,491 | | | 59,106 |
| Other current assets | 33,938 | | | 29,624 |
| Total current assets | 291,908 | | | 324,315 | |
| Noncurrent assets: | | | |
| Restricted cash | 5,568 | | | — |
| Property, plant and equipment, net | 2,133,877 | | | 1,889,706 |
| Intangible assets, net | 453,214 | | | 540,621 |
| Goodwill | 221,314 | | | 221,314 |
| Investments, at fair value | 94,878 | | | 92,554 |
| Derivative assets | 118,106 | | | 171,393 |
| Other noncurrent assets | 140,740 | | | 147,339 |
| Total noncurrent assets | 3,167,697 | | | 3,062,927 | |
| Total assets | $ | 3,459,605 | | | $ | 3,387,242 | |
| | | |
| Liabilities, Redeemable Noncontrolling Interests and Equity | | | |
| Current liabilities: | | | |
| Accounts payable and accrued expenses | $ | 79,288 | | | $ | 50,702 | |
| Shareholder distributions payable | 7,606 | | | 9,670 | |
| Contingent consideration, current | 16,546 | | | 25,891 | |
| Current portion of long-term debt | 82,855 | | | 95,870 | |
| Current portion of failed sale-leaseback financing | 69,436 | | | — | |
| Redemptions payable | 361 | | | 32,198 | |
| Other current liabilities | 7,636 | | | 10,862 | |
| Total current liabilities | 263,728 | | | 225,193 | |
| Noncurrent liabilities: | | | |
| Long-term debt, net of current portion | 935,397 | | | 850,760 | |
| Failed sale-leaseback financing, net of current portion | 169,829 | | | — | |
| Contingent consideration | 42,307 | | | 75,700 | |
| Derivative liabilities | 5,833 | | | — | |
| Deferred tax liabilities, net | 58,696 | | | 85,655 | |
| Operating lease liabilities | 108,406 | | | 101,281 | |
| Out-of-market contracts, net | 194,785 | | | 218,112 | |
| Other noncurrent liabilities | 47,659 | | | 39,826 | |
| Total noncurrent liabilities | 1,562,912 | | | 1,371,334 | |
| Total liabilities | $ | 1,826,640 | | | $ | 1,596,527 | |
| | | |
| Commitments and contingencies (Note 15. Commitments and Contingencies) | | | |
| | | |
| Redeemable noncontrolling interests | 2,179 | | | 2,034 | |
| Redeemable common shares, par value, $0.001 per share, 873 outstanding | 1 | | | — | |
| Redeemable common shares, additional paid-in capital | 7,245 | | | — | |
| | | |
| Equity: | | | |
| Preferred shares, par value, $0.001 per share, 50,000 authorized; none issued and outstanding | — | | | — | |
| Common shares, par value, $0.001 per share, 350,000 authorized, 197,749 and 198,044 outstanding as of 2023 and 2022, respectively | 198 | | | 198 | |
| Additional paid-in capital | 1,770,060 | | | 1,763,061 | |
| Accumulated deficit | (306,525) | | | (114,680) | |
| Accumulated other comprehensive income | 45,932 | | | 56,094 | |
| Noncontrolling interests | 113,875 | | | 84,008 | |
| Total equity | 1,623,540 | | | 1,788,681 | |
| Total liabilities, redeemable noncontrolling interests and equity | $ | 3,459,605 | | | $ | 3,387,242 | |
The accompanying notes are an integral part of these Consolidated Financial Statements.
GREENBACKER RENEWABLE ENERGY COMPANY LLC AND SUBSIDIARIES
CONSOLIDATED STATEMENTS OF OPERATIONS
(in thousands, except per share data)
| | | | | | | | | | | | | | | |
| | | | | For the year ended December 31, 2023 | | For the period from May 19, 2022 through December 31, 2022 |
| Revenue | | | | | | | |
| Energy revenue | | | | | $ | 159,301 | | | $ | 101,596 | |
| Investment Management revenue | | | | | 13,490 | | | 1,919 | |
| Other revenue | | | | | 8,434 | | | 7,506 | |
| Contract amortization, net | | | | | (8,060) | | | (10,529) | |
| Total revenue | | | | | 173,165 | | | 100,492 | |
| | | | | | | |
| Operating expenses | | | | | | | |
| Direct operating costs | | | | | 105,586 | | | 55,889 | |
| General and administrative | | | | | 60,014 | | | 45,442 | |
| Depreciation, amortization and accretion | | | | | 125,743 | | | 39,149 | |
| | | | | | | |
| Impairment of long-lived assets | | | | | 59,294 | | | — | |
| Total operating expenses | | | | | 350,637 | | | 140,480 | |
| | | | | | | |
| Operating loss | | | | | (177,472) | | | (39,988) | |
| | | | | | | |
| Interest expense, net | | | | | (40,519) | | | (15,889) | |
| Realized gain (loss) on interest rate swaps, net | | | | | 2,428 | | | (1,322) | |
| Unrealized gain (loss) on interest rate swaps, net | | | | | 17,763 | | | (249) | |
| Unrealized gain on investments, net | | | | | 932 | | | 398 | |
| Other expense, net | | | | | (267) | | | (108) | |
| | | | | | | |
| Net loss before income taxes | | | | | (197,135) | | | (57,158) | |
| Benefit from (provision for) income taxes | | | | | 21,548 | | | (3,005) | |
| Net loss | | | | | (175,587) | | | (60,163) | |
| Less: Net loss attributable to noncontrolling interests | | | | | (96,935) | | | (59,439) | |
| Less: Net income attributable to redeemable noncontrolling interests | | | | | 819 | | | — | |
| Net loss attributable to Greenbacker Renewable Energy Company LLC | | | | | $ | (79,471) | | | $ | (724) | |
| | | | | | | |
| Earnings per share | | | | | | | |
| Basic | | | | | $ | (0.40) | | | $ | 0.00 | |
| Diluted | | | | | $ | (0.40) | | | $ | 0.00 | |
| | | | | | | |
| Weighted average shares outstanding | | | | | | | |
| Basic | | | | | 199,293 | | | 201,668 | |
| Diluted | | | | | 199,293 | | | 201,668 | |
The accompanying notes are an integral part of these Consolidated Financial Statements.
GREENBACKER RENEWABLE ENERGY COMPANY LLC AND SUBSIDIARIES
CONSOLIDATED STATEMENTSTATEMENTS OF OPERATIONSCOMPREHENSIVE INCOME (LOSS)
| | | | | |
| For the period from May 19, 2022 through December 31, 2022 |
Revenue | |
Energy revenue | $ | 101,595,947 | |
Investment Management revenue | 1,918,911 | |
Other revenue | 7,505,530 | |
Contract amortization, net | (10,529,266) | |
Total revenue | 100,491,122 | |
| |
Operating expenses | |
Direct operating costs | 55,888,695 | |
General and administrative | 45,442,346 | |
Depreciation, amortization and accretion | 39,149,236 | |
Total operating expenses | 140,480,277 | |
| |
Operating loss | (39,989,155) | |
| |
Interest expense, net | (15,889,125) | |
Realized loss on interest rate swaps, net | (1,322,219) | |
Unrealized loss on interest rate swaps, net | (249,150) | |
Unrealized gain on investments, net | 398,479 | |
Other expense, net | (107,890) | |
| |
Net loss before income taxes | (57,159,060) | |
Provision for income taxes | (3,005,119) | |
Net loss | (60,164,179) | |
Net loss attributable to noncontrolling interests | (59,439,202) | |
Net loss attributable to Greenbacker Renewable Energy Company LLC | $ | (724,977) | |
| |
Earnings per share | |
Basic | $ | 0.00 | |
| |
Weighted average shares outstanding | |
Basic | 201,667,520 | |
(in thousands) | | | | | | | | | | | | | | | |
| | | | | For the year ended December 31, 2023 | | For the period from May 19, 2022 through December 31, 2022 |
| Net loss | | | | | $ | (175,587) | | | $ | (60,163) | |
| | | | | | | |
| Other comprehensive (loss) income, net of tax: | | | | | | | |
| Unrealized (loss) gain on derivatives designated as cash flow hedges and changes in Other comprehensive (loss) income, net of tax | | | | | (10,162) | | | 56,094 | |
| Total other comprehensive (loss) income, net of tax | | | | | $ | (10,162) | | | $ | 56,094 | |
| | | | | | | |
| Comprehensive loss | | | | | (185,749) | | | (4,069) | |
| Less: Comprehensive loss attributable to noncontrolling interests | | | | | (96,935) | | | (59,439) | |
| Less: Comprehensive gain attributable to redeemable noncontrolling interests | | | | | 819 | | | — | |
| Comprehensive (loss) income attributable to Greenbacker Renewable Energy Company LLC | | | | | $ | (89,633) | | | $ | 55,370 | |
The accompanying notes are an integral part of these Consolidated Financial Statements.
GREENBACKER RENEWABLE ENERGY COMPANY LLC AND SUBSIDIARIES
CONSOLIDATED STATEMENTSTATEMENTS OF COMPREHENSIVE INCOME (LOSS)EQUITY
| | | | | |
| For the period from May 19, 2022 through December 31, 2022 |
Net loss | $ | (60,164,179) | |
| |
Other comprehensive income, net of tax: | |
Unrealized gain on derivatives designated as cash flow hedges, net of tax | 56,094,242 | |
Total other comprehensive income, net of tax | $ | 56,094,242 | |
| |
Comprehensive loss | (4,069,937) | |
Less: Comprehensive loss attributable to noncontrolling interests | (59,439,202) | |
Comprehensive income attributable to Greenbacker Renewable Energy Company LLC | $ | 55,369,265 | |
(in thousands) | | | | | | | | | | | | | | | | | | | | | | | | | | | | | | | | | | | | | | | | | | | | | | | | | | | | | | | | | | | | | | | | | |
| Shares | | Par
Value | | Additional paid-in capital | | Accumulated deficit | | Accumulated other comprehensive income | | Noncontrolling interests | | Total
equity | | Redeemable common shares | | Par value - redeemable common shares | | Additional paid-in capital - redeemable common shares | | Redeemable noncontrolling interests |
| Balances as of December 31, 2022 | 198,044 | | $ | 198 | | | $ | 1,763,061 | | | $ | (114,680) | | | $ | 56,094 | | | $ | 84,008 | | | $ | 1,788,681 | | | — | | | $ | — | | | $ | — | | | $ | 2,034 | |
| Issuance of common shares under distribution reinvestment plan | 2,636 | | | 3 | | | 22,490 | | | — | | | — | | | — | | | 22,493 | | | — | | | — | | | — | | | — | |
| Repurchases of common shares | (5,811) | | | (6) | | | (50,877) | | | — | | | — | | | — | | | (50,883) | | | — | | | — | | | — | | | — | |
| Proceeds from shares transferred | 1 | | | — | | | — | | | — | | | — | | | — | | | — | | | — | | | — | | | — | | | — | |
| Deferred sales commissions | — | | | — | | | — | | | (2,784) | | | — | | | — | | | (2,784) | | | — | | | — | | | — | | | — | |
| Shareholder distributions | — | | | — | | | — | | | (109,993) | | | — | | | — | | | (109,993) | | | — | | | — | | | 4 | | | — | |
| Other comprehensive loss, net of tax | — | | | — | | | — | | | — | | | (10,162) | | | — | | | (10,162) | | | — | | | — | | | — | | | — | |
| Contributions from noncontrolling interests, net | — | | | — | | | — | | | — | | | — | | | 144,860 | | | 144,860 | | | — | | | — | | | — | | | — | |
| Distributions to noncontrolling interests | — | | | — | | | — | | | — | | | — | | | (15,748) | | | (15,748) | | | — | | | — | | | — | | | (674) | |
| Buyout of noncontrolling interests | — | | | — | | | 757 | | | — | | | — | | | (1,621) | | | (864) | | | — | | | — | | | — | | | — | |
| Earnout Share participation | 3,730 | | | 4 | | | 32,786 | | | — | | | — | | | — | | | 32,790 | | | — | | | — | | | — | | | — | |
| Share-based compensation expense | 22 | | | — | | | 9,486 | | | — | | | — | | | — | | | 9,486 | | | — | | | — | | | — | | | — | |
| Reclassification of participating Earnout Shares to temporary equity | (131) | | | — | | | (1,139) | | | 54 | | | — | | | — | | | (1,085) | | | 131 | | | — | | | 1,085 | | | — | |
| Reclassification of Class P-I shares to temporary equity | (742) | | | (1) | | | (6,504) | | | 349 | | | — | | | — | | | (6,156) | | | 742 | | | 1 | | | 6,156 | | | — | |
| Other noncontrolling interest activity | — | | | — | | | — | | | — | | | — | | | (689) | | | (689) | | | — | | | — | | | — | | | — | |
| | | | | | | | | | | | | | | | | | | | | |
| Net (loss) income | — | | | — | | | — | | | (79,471) | | | — | | | (96,935) | | | (176,406) | | | — | | | — | | | — | | | 819 | |
| Balances as of December 31, 2023 | 197,749 | | $ | 198 | | | $ | 1,770,060 | | | $ | (306,525) | | | $ | 45,932 | | | 113,875 | | | $ | 1,623,540 | | | 873 | | | $ | 1 | | | $ | 7,245 | | | $ | 2,179 | |
The accompanying notes are an integral part of these Consolidated Financial Statements.
GREENBACKER RENEWABLE ENERGY COMPANY LLC AND SUBSIDIARIES
CONSOLIDATED STATEMENTSTATEMENTS OF REDEEMABLE NONCONTROLLING INTERESTS AND EQUITY
| | | | | | | | | | | | | | | | | | | | | | | | | | | | | | | | | | | | | | | | | | | | | | | |
| Shares | | Par
Value | | Additional paid-in capital | | Accumulated deficit | | Accumulated other comprehensive income | | Noncontrolling interests | | Total
equity | | Redeemable noncontrolling interests |
| Balances as of May 19, 2022 | 177,455,448 | | $ | 177,455 | | | $ | 1,574,042,087 | | | $ | (30,479,634) | | | $ | — | | | $ | 72,779,714 | | | $ | 1,616,519,622 | | | $ | 2,034,000 | |
| Consolidation of Greenbacker Development Opportunities Fund I, LP | — | | | — | | | — | | | — | | | — | | | 45,445,898 | | | 45,445,898 | | | — | |
| Deconsolidation of Greenbacker Development Opportunities Fund I, LP | — | | | — | | | — | | | 21,969 | | | — | | | (66,215,297) | | | (66,193,328) | | | — | |
| Consolidation of Greenbacker Development Opportunities Fund I GP | — | | | — | | | — | | | — | | | — | | | 533,315 | | | 533,315 | | | — | |
| Issuance of common shares as consideration transferred for Acquisition | 24,393,025 | | | 24,393 | | | 214,902,546 | | | — | | | — | | | — | | | 214,926,939 | | | — | |
| Issuance of common shares under distribution reinvestment plan | 1,790,050 | | | 1,790 | | | 15,644,549 | | | — | | | — | | | — | | | 15,646,339 | | | — | |
| Repurchases of common shares | (5,614,980) | | | (5,615) | | | (49,399,559) | | | — | | | — | | | — | | | (49,405,174) | | | — | |
| Other capital activity | 16,279 | | | 16 | | | 967,827 | | | 130,875 | | | — | | | — | | | 1,098,718 | | | — | |
| Deferred sales commissions | — | | | — | | | — | | | (8,755,340) | | | — | | | — | | | (8,755,340) | | | — | |
| Shareholder distributions | — | | | — | | | — | | | (74,872,614) | | | — | | | — | | | (74,872,614) | | | — | |
| Other comprehensive income | — | | | — | | | — | | | — | | | 56,094,242 | | | — | | | 56,094,242 | | | — | |
| Contributions from noncontrolling interests, net | — | | | — | | | — | | | — | | | — | | | 104,848,470 | | | 104,848,470 | | | — | |
| Distributions to noncontrolling interests | — | | | — | | | — | | | — | | | — | | | (13,944,987) | | | (13,944,987) | | | — | |
| Share-based compensation expense | 4,588 | | | 5 | | | 6,903,927 | | | — | | | — | | | — | | | 6,903,932 | | | — | |
| Net loss | — | | | — | | | — | | | (724,977) | | | — | | | (59,439,202) | | | (60,164,179) | | | — | |
| Balances as of December 31, 2022 | 198,044,410 | | $ | 198,044 | | | $ | 1,763,061,377 | | | $ | (114,679,721) | | | $ | 56,094,242 | | | $ | 84,007,911 | | | $ | 1,788,681,853 | | | $ | 2,034,000 | |
| | | | | | | | | | | | | | | | | | | | | | | | | | | | | | | | | | | | | | | | | | | | | | | |
| Shares | | Par
Value | | Additional paid-in capital | | Accumulated deficit | | Accumulated other comprehensive income | | Noncontrolling interests | | Total
equity | | Redeemable noncontrolling interests |
| Balances as of May 19, 2022 | 177,455 | | $ | 177 | | | $ | 1,574,042 | | | $ | (30,480) | | | $ | — | | | $ | 72,780 | | | $ | 1,616,519 | | | $ | 2,034 | |
| Consolidation of Greenbacker Development Opportunities Fund I, LP | — | | | — | | | — | | | — | | | — | | | 45,446 | | | 45,446 | | | — | |
| Deconsolidation of Greenbacker Development Opportunities Fund I, LP | — | | | — | | | — | | | 22 | | | — | | | (66,215) | | | (66,193) | | | — | |
| Consolidation of Greenbacker Development Opportunities Fund I GP | — | | | — | | | — | | | — | | | — | | | 533 | | | 533 | | | — | |
| Issuance of common shares as consideration transferred for Acquisition | 24,393 | | | 25 | | | 214,902 | | | — | | | — | | | — | | | 214,927 | | | — | |
| Issuance of common shares under distribution reinvestment plan | 1,790 | | | 2 | | | 15,645 | | | — | | | — | | | — | | | 15,647 | | | — | |
| Repurchases of common shares | (5,615) | | | (6) | | | (49,400) | | | — | | | — | | | — | | | (49,406) | | | — | |
| Other capital activity | 16 | | | — | | | 968 | | | 130 | | | — | | | — | | | 1,098 | | | — | |
| Deferred sales commissions | — | | | — | | | — | | | (8,755) | | | — | | | — | | | (8,755) | | | — | |
| Shareholder distributions | — | | | — | | | — | | | (74,873) | | | — | | | — | | | (74,873) | | | — | |
| Other comprehensive income | — | | | — | | | — | | | — | | | 56,094 | | | — | | | 56,094 | | | — | |
| Contributions from noncontrolling interests, net | — | | | — | | | — | | | — | | | — | | | 104,848 | | | 104,848 | | | — | |
| Distributions to noncontrolling interests | — | | | — | | | — | | | — | | | — | | | (13,945) | | | (13,945) | | | — | |
| Share-based compensation expense | 5 | | | — | | | 6,904 | | | — | | | — | | | — | | | 6,904 | | | — | |
| Net loss | — | | | — | | | — | | | (724) | | | — | | | (59,439) | | | (60,163) | | | — | |
| Balances as of December 31, 2022 | 198,044 | | $ | 198 | | | $ | 1,763,061 | | | $ | (114,680) | | | $ | 56,094 | | | $ | 84,008 | | | $ | 1,788,681 | | | $ | 2,034 | |
The accompanying notes are an integral part of these Consolidated Financial Statements.
GREENBACKER RENEWABLE ENERGY COMPANY LLC AND SUBSIDIARIES
CONSOLIDATED STATEMENTSTATEMENTS OF CASH FLOWS
| | | | | |
| For the period from May 19, 2022 through December 31, 2022 |
Cash Flows from Operating Activities | |
Net loss | $ | (60,164,179) | |
Adjustments to reconcile net loss to net cash provided by operating activities: | |
Depreciation, amortization and accretion | 49,678,502 | |
Provision for doubtful accounts | 181,698 | |
Share-based compensation expense | 6,903,927 | |
Changes in fair value of contingent consideration | 2,100,000 | |
Amortization of financing costs and debt discounts | 2,476,373 | |
Amortization of interest rate swap contracts into net loss | 3,280,384 | |
Realized gain on sale of investment in GDEV | (286,637) | |
Unrealized gain on investments | (398,479) | |
Provision for income taxes | 3,005,119 | |
Change in the carrying amount of ROU assets | 1,658,593 | |
Changes in operating assets and liabilities: | |
Accounts receivable | 7,641,112 | |
Other current and noncurrent assets | (5,208,892) | |
Accounts payable and accrued expenses | (2,723,285) | |
Operating lease liabilities | 31,827 | |
Other current and noncurrent liabilities | 3,518,630 | |
Net cash provided by operating activities | 11,694,693 | |
| |
Cash Flows from Investing Activities | |
Purchases of property, plant and equipment | (393,257,250) | |
Deposits paid for property, plant and equipment | (16,449,780) | |
Purchases of investments | (34,801,034) | |
Loans made to other parties | (48,237,785) | |
Receipts from loans made to other parties | 17,466,949 | |
Cash acquired from Acquisition and consolidation of GDEV, net | 1,714,463 | |
Proceeds from sale of investment in and deconsolidation of GDEV | 5,467,061 | |
Net cash used in investing activities | (468,097,376) | |
| |
Cash Flows from Financing Activities | |
Shareholder distributions | (51,524,858) | |
Return of collateral paid for swap contract | 11,827,000 | |
Repurchases of common shares | (17,207,072) | |
Other capital activity | 1,143,680 | |
Deferred sales commissions | (1,851,886) | |
Contributions from noncontrolling interests | 104,549,810 | |
Distributions to noncontrolling interests | (11,150,952) | |
Proceeds from borrowings | 499,654,015 | |
Payments on borrowings | (81,620,812) | |
Payments for loan origination costs | (12,167,467) | |
Net cash provided by financing activities | 441,651,458 | |
| |
Net decrease in Cash, cash equivalents and Restricted cash | (14,751,225) | |
Cash, cash equivalents and Restricted cash at beginning of period* | 205,449,317 | |
Cash, cash equivalents and Restricted cash at end of period | $ | 190,698,092 | |
| |
Supplemental Disclosures | |
Interest paid, net of amounts capitalized | $ | 12,987,837 | |
| |
Non-cash investing and financing activities | |
Deferred sales commission payable | 10,973,113 | |
Capital expenditures incurred but not paid | 24,283,948 | |
| |
Non-cash distributions to noncontrolling interests | 2,794,035 | |
(in thousands) | | | | | | | | | | | |
| For the year ended December 31, 2023 | | For the period from May 19, 2022 through December 31, 2022 |
| Cash Flows from Operating Activities | | | |
| Net loss | $ | (175,587) | | | $ | (60,163) | |
| Adjustments to reconcile net loss to net cash provided by operating activities: | | | |
| Depreciation, amortization and accretion | 133,803 | | | 49,678 | |
| | | |
| Impairment of long-lived assets | 59,294 | | | — | |
| | | |
| Share-based compensation expense | 11,248 | | | 6,904 | |
| Changes in fair value of contingent consideration | (603) | | | 2,100 | |
| Amortization of financing costs and debt discounts | 6,711 | | | 2,476 | |
| Amortization of interest rate swap contracts | 6,750 | | | 1,709 | |
| | | |
| Change in fair value of interest rate swaps | (17,763) | | | 249 | |
| Realized (gain) loss on interest rate swaps | (2,428) | | | 1,322 | |
| Change in fair value of investments | (932) | | | (398) | |
| Deferred income taxes | (21,548) | | | 3,005 | |
| | | |
| Other | 5,743 | | | 1,553 | |
| Changes in operating assets and liabilities: | | | |
| Accounts receivable | (2,959) | | | 7,641 | |
| | | |
| Current and noncurrent derivative assets | 56,696 | | | — | |
| Other current and noncurrent assets | (10,661) | | | (5,209) | |
| Accounts payable and accrued expenses | 14,891 | | | (2,723) | |
| Operating lease liabilities | (1,290) | | | 32 | |
| Other current and noncurrent liabilities | 1,036 | | | 3,519 | |
| Net cash provided by operating activities | 62,401 | | | 11,695 | |
| | | |
| Cash Flows from Investing Activities | | | |
| Purchases of property, plant and equipment | (360,650) | | | (393,257) | |
| Deposits returned (paid) for property, plant and equipment, net | 8,138 | | | (16,450) | |
| Purchases of investments | (5,298) | | | (34,801) | |
| Sales of investments | 3,906 | | | — | |
| Loans made to other parties | — | | | (48,238) | |
| Receipts of notes receivable to other parties | 30,725 | | | 17,467 | |
| Cash acquired from Acquisition and consolidation of GDEV, net | — | | | 1,714 | |
| Proceeds from sale of investment in and deconsolidation of GDEV | — | | | 5,467 | |
| Net cash used in investing activities | (323,179) | | | (468,098) | |
| | | |
| Cash Flows from Financing Activities | | | |
| Shareholder distributions | (87,597) | | | (51,525) | |
| Return of collateral paid for swap contract | 1,735 | | | 11,827 | |
| Repurchases of common shares | (82,719) | | | (17,207) | |
| Deferred sales commissions | (3,486) | | | (1,852) | |
| Contributions from noncontrolling interests | 144,895 | | | 104,550 | |
| Distributions to noncontrolling interests | (17,498) | | | (11,151) | |
| | | |
| Proceeds from borrowings | 425,532 | | | 499,654 | |
| Payments on borrowings | (351,764) | | | (81,621) | |
| Proceeds from failed sale-leaseback | 240,969 | | | — | |
| Payments for loan origination costs | (11,447) | | | (12,167) | |
| Other capital activity | (865) | | | 1,144 | |
| Net cash provided by financing activities | 257,755 | | | 441,652 | |
| | | |
| Net decrease in Cash, cash equivalents and Restricted cash | (3,023) | | | (14,751) | |
| Cash, cash equivalents and Restricted cash at beginning of period* | 190,698 | | | 205,449 | |
| Cash, cash equivalents and Restricted cash at end of period | $ | 187,675 | | | $ | 190,698 | |
| | | |
| | | |
| | | |
| | | |
| | | |
| | | |
| | | |
| | | |
| | | |
| | | |
| | | |
*Cash, cash equivalents and Restricted cash as of May 19,18, 2022 includes all consolidated subsidiaries of the Company upon the change in status. Refer to Note 2. Significant Accounting Policies for additional discussion.
The accompanying notes are an integral part of these Consolidated Financial Statements.
GREENBACKER RENEWABLE ENERGY COMPANY LLC AND SUBSIDIARIES
NOTES TO CONSOLIDATED FINANCIAL STATEMENTS
December 31, 2022
These Notes to the Consolidated Financial Statements were prepared under the Non-Investment Basis as of December 31, 2023 and December 31, 2022 and for the year ended December 31, 2023 and the period from May 19, 2022 through December 31, 2022. All references to the "Company"“Company” in these Notes refer to Greenbacker Renewable Energy Company LLC and its consolidated subsidiaries unless otherwise expressly stated or context requires otherwise. This report does not constitute an offer of any of the Company’s managed funds as described herein.
Note 1. Organization and Operations of the Company
Organization
Greenbacker Renewable Energy Company LLC (the “Company”) is a Delaware limited liability company formed in December 2012. The Company is an energy transition, renewable energy and investment management company that acquires, constructs and operates renewable energy and energy efficiency projects, as well as finances the construction and/or operation of these and other sustainable development projects and businesses and provides through GCM investment management services to funds within the sustainable infrastructure and renewable energy industry. As of December 31, 2022,2023, the Company’s fleet comprised 456435 renewable energy projects with an aggregate power production capacity of approximately 3.13.3 GW, when fully operational.which includes operating capacity of approximately 1.5 GW and pre-operational capacity of approximately 1.8 GW. As of December 31, 2022,2023, GCM serves as the registered investment adviser of four funds in the sustainable and renewable energy industry.
The Company conducts substantially all its operations through its wholly owned subsidiary, GREC. Until May 19, 2022, the Company was externally managed by GCM. As of and after May 19, 2022, the Company operates as a fully integrated and internally managed company after acquiring GCM and several other related entities, which are now wholly owned subsidiaries of GREC. The Company’s fiscal year-end is December 31.
The Company previously conducted continuous public offerings of Class A, C, and I shares of limited liability company interests, along with Class A, C, and I shares pursuant to the Company’s DRP. The public offerings were initially commenced in August 2013 and terminated March 29, 2019, raising a total of $253.4 million. The Company also privately offered Class P-A, P-I, P-D, P-T and P-S shares. These private offerings were conducted between April 2016 and March 16, 2022, raising a total of $1.4 billion. The Company currently offers the DRP pursuant to which shareholders may elect to have the full amount of cash distributions reinvested in additional shares. The Company also offersoffered the SRP pursuant to which quarterly share repurchases arewere conducted to allow shareholders to sell shares back to the Company.
Management Internalization
On May 19, 2022, the Company completed the Acquisition pursuant to which it acquired substantially all of the business and assets, including intellectual property and personnel of its external advisor, GCM, an investment management and energy transition, renewable energy, energy efficiency and sustainability-related project acquisition, consulting and development company that is registered as an investment adviser under the Investment Advisers Act, of 1940, as amended (the “Advisers Act”), Greenbacker Administration and certain other affiliated companies. All of the acquired businesses and assets were immediately thereafter contributed by the Company to GREC. As a result of the Acquisition, the Company operates as a fully integrated and internally managed company with its own dedicated executive management team and other employees to manage its business and operations. The Company now operates with the capabilities of both an actively managed owner-operator of sustainable infrastructure and renewable energy businesses and as an active third-party investment manager of other funds within the sustainable infrastructure and renewable energy industry.
Refer to Note 3. Acquisitions for additional discussionfurther details.
Note 2. Significant Accounting Policies
Basis of Presentation
Since inception and prior to the Acquisition, the Company’s historical financial statements were prepared using the investment company basis of accounting in accordance with ASC 946. ASC 946, or Investment Basis, requires that if there is a subsequent change in the purpose and design of an entity, the entity should reevaluate its status as an investment company. As a result of the Acquisition and other steps taken by the Company to transition the focus of the Company’s business from being an investor in clean energy projects to a diversified independent power producer coupled with an investment management
business, the Company no longer exhibits the fundamental characteristics of, and no longer qualifies as, an investment company. The Company discontinued applying the guidance in ASC 946 and began to account for the change in status prospectively in accordance with Non-Investment Basis as of the date of the change in status, or May 19, 2022 (the closing date of the Acquisition). In accordance with ASC 946, the fair value of an investment at the date of the change in status shall be the investment'sinvestment’s initial carrying amount on a Non-Investment Basis.
The Company's Consolidated Financial Statements for the periodperiods beginning on May 19, 2022 are prepared on a consolidated, Non-Investment Basis to include the financial position, results of operations, and cash flows of the Company and its consolidated subsidiaries rather than on an Investment Basis. This change in status and the accompanying accounting policies affect the comparability of the Consolidated Financial Statements as of and for the historical periods as presented in this annual report on Form 10-K (this “Annual Report”).Annual Report.
As such, this Annual Report includes the following:
Non-Investment Basis
•Consolidated Balance SheetSheets as of December 31, 2023 and 2022
•Consolidated StatementStatements of Operations for the year ended December 31, 2023 and the period from May 19, 2022 through December 31, 2022
•Consolidated StatementStatements of Comprehensive Income (Loss) for the year ended December 31, 2023 and the period from May 19, 2022 through December 31, 2022
•Consolidated StatementStatements of Redeemable Noncontrolling Interests and Equity for the year ended December 31, 2023 and the period from May 19, 2022 through December 31, 2022
•Consolidated StatementStatements of Cash Flows for the year ended December 31, 2023 and the period from May 19, 2022 through December 31, 2022
•Notes to the Consolidated Financial Statements
Investment Basis
•Consolidated Statement of Assets and Liabilities as of December 31, 2021
•Consolidated Statements of Operations for the period from January 1, 2022 through May 18, 2022 and the year ended December 31, 2021
•Consolidated StatementsStatement of Changes in Net Assets for the period from January 1, 2022 through May 18, 2022 and the year ended December 31, 2021
•Consolidated StatementsStatement of Cash Flows fromfor the period from January 1, 2022 through May 18, 2022 and the year ended December 31, 2021
•Consolidated Schedule of Investments as of December 31, 2021
•Notes to the Consolidated Financial Statements
The Company presents amounts in the Consolidated Financial Statements in thousands within tables and millions within text (unless otherwise specified), and calculates all percentages and per-share data from underlying whole-dollar amounts. Thus, certain amounts may not foot, cross foot, or recalculate based on reported numbers due to rounding. Prior period amounts have been updated to be presented in thousands and differences to prior filings are due to rounding.
Reclassifications
Certain prior period amounts have been reclassified to conform to the current period presentation. These reclassifications had no impact on prior periods’ results.
Change in Presentation due to Change in Status
Effective May 19, 2022, the date of the change in status, the Company prospectively discontinued its application of ASC 946 and, as a result, changed the presentation of the Company's Consolidated Financial Statements. The most significant changes are:
•The Consolidated Statement of Assets and Liabilities has been changed to a Consolidated Balance Sheet;
•The Consolidated Statement of Operations is no longer presented in the format required under ASC 946. The Company will present the Consolidated Statement of Operations as required under Non-Investment Basis U.S. GAAP. A Consolidated Statement of Other Comprehensive Income (Loss) will be presented, if and when applicable;
•The Consolidated Schedule of Investments has been removed;
•The Consolidated Statement of Cash Flows has been changed, including now containing a section for investing activities;
•Certain footnotes have been changed or removed to reflect conformity with applicable U.S. GAAP under a Non-Investment Basis; and
•The Company re-evaluated its interests in all entities to determine whether they are variable interests, and re-evaluated its investments, including its investments in partially owned entities, to determine if they are VIEs, as required under ASC Topic 810, Consolidation ("(“ASC 810"810”). The Company also re-evaluated consolidation considerations for all of its investments in VIEs and partially owned entities as required under ASC 810. Applicable disclosures related to VIEs and other partially owned entities have been included in these Notes to the Consolidated Financial Statements.
Prior to the May 19, 2022 change in status, the Company recorded its investments in the renewable energy projects at fair value and recorded the changes in fair value as an unrealized gain or loss. In accordance with ASC 946, the fair value of an investment at the date of the change in status shall be the investment's initial carrying amount on a Non-Investment Basis. Upon the change in status, this fair value accounting is no longer applicable, and the Company now presents on a consolidated basis the underlying assets and liabilities of its subsidiaries on a consolidated basis in accordance with the applicable U.S. GAAP. The following is a summary of the allocation of the net assets of the Company as of the date of the change in status, May 19, 2022:
| | | | | |
| (in thousands) | May 19, 2022 |
Total members'members’ equity (net assets) | $ | 1,543,739,9081,543,740 | |
| Plus: Fair value of redeemable noncontrolling interests and noncontrolling interests | 74,813,71474,814 | |
| Total net assets of the Company | $ | 1,618,553,6221,618,554 | |
| |
| Assets | |
| Cash, cash equivalents and Restricted cash | $ | 205,449,317205,449 | |
| Other current assets | 103,875,227103,875 | |
| Total current assets | 309,324,544309,324 | |
| Property, plant and equipment | 1,522,994,9191,522,995 | |
| Intangible assets | 465,375,389465,375 | |
| Investments, at fair value | 90,425,06790,425 | |
| Derivative assets | 118,547,764118,548 | |
| Other noncurrent assets | 36,360,78636,361 | |
| Total noncurrent assets | 2,233,703,9252,233,704 | |
| Total assets | 2,543,028,4692,543,028 | |
| |
| Liabilities | |
| Accounts payable and accrued expenses | $ | 59,521,77059,522 | |
| Other current liabilities | 67,617,94767,618 | |
| Total current liabilities | 127,139,717127,140 | |
| Long-term debt, net | 501,200,081501,200 | |
| Out-of-market contracts | 229,576,646229,576 | |
| Other noncurrent liabilities | 66,558,40366,558 | |
| Total noncurrent liabilities | 797,335,130797,334 | |
| Total liabilities | 924,474,847924,474 | |
| |
Total members'members’ equity, redeemable noncontrolling interests and noncontrolling interests | $ | 1,618,553,6221,618,554 | |
The Company will continue to recognizerecognizes and measuremeasures its RNCI, Derivative assets (current and noncurrent) and Investments, at fair value. Refer to Note 16.17. Noncontrolling Interests and Redeemable Noncontrolling Interests, Note 11.12. Derivative Instruments and Note 6. Fair Value Measurements and Investments for further information surrounding fair value approach and inputs used.
As discussed below, the Company adopted ASC 842 as of January 1, 2022. On May 19, 2022, the Company also recognized operating lease, or ROU, assets of $95.1 million, operating lease liabilities, current of $1.2 million and operating lease liabilities, noncurrent of $93.5 million of its subsidiaries that were formerly part of the Company’s investments. The ROU asset and lease liability balances in the May 19, 2022 allocation are not included in the table above. See Note 9.10. Leases for further details on the ROU assets and lease liabilities recognized at May 19, 2022.
Basis of Consolidation
The Consolidated Financial Statements and related notes have been preparedpresented on the Non-Investment Basis of accounting in accordance with U.S. GAAP and in conformity with the rules and regulations of the SEC applicable to financial information. The Consolidated Financial Statements include the accounts of the Company, its wholly-ownedwholly owned subsidiaries, and those of its subsidiaries in which it has a controlling financial and/or voting interest. All intercompany balances and transactions have been eliminated in consolidation. The Company determines whether it has a controlling interest in an entity by first evaluating whether the entity is a VIE under U.S. GAAP as discussed further below.
In connection with the Acquisition, the Company consolidated the results of operations and financial position of GDEV during the period from May 19, 2022 through November 17, 2022. Management determined that GDEV is an investment company under ASC 946 for the purposes of financial reporting. In accordance with ASC 946, when an investment company’s results of operations are consolidated with and into the financial statements of a company that does not follow ASC 946, the results of operations and statement of financial position of the investment company shall continue to be presented in accordance with ASC 946. As such, in the preparation of the Consolidated Financial Statements during the period May 19, 2022 through November 17, 2022, GDEV was presented in the Consolidated Financial Statements of the Company utilizing ASC 946 accounting requirements. ASC 946 requires investments of an investment company to be recorded at the estimated fair value in the Consolidated Balance SheetSheets and the unrealized gains and/or losses in an investment’s fair value to be recognized on a current basis in the Consolidated StatementStatements of Operations. On November 18, 2022, GREC sold its investment in GDEV to an unrelated third party for total purchase consideration of $5.7 million. The Company realized a gain on sale of this investment in the amount of $0.3 million, which is included in Other expense, net on the Consolidated StatementStatements of Operations. The Company has determined as a result of the sale of GREC’s investment in GDEV that it is no longer the primary beneficiary of GDEV. As a result, as of November 18, 2022, GDEV is no longer considered a consolidated subsidiary of the Company, and therefore its financial position is not included on the Consolidated Balance SheetSheets as of December 31, 2022. Further, the revenue, expenses and income of GDEV are only included within the Company’s Consolidated StatementStatements of Operations for the period May 19, 2022 through November 17, 2022, the date of the deconsolidation. Additionally, the results of operations and financial position of GDEV GP, which GREC has a controlling voting interest in and whose operations are exclusively related to its role as the general partner of GDEV, are no longer eliminated in consolidation beginning with the deconsolidation on November 18, 2022.
The following table summarizes the impact of the sale and deconsolidation of GDEV:GDEV as of November 18, 2022 on the Consolidated Financial Statements:
| | | | | | | | | | | | | | | | | |
| (in thousands) | Balances Prior to Deconsolidation | | Impact of Sale and Deconsolidation | | November 18, 2022 |
| Assets | | | | | |
| Current assets: | | | | | |
| Cash and cash equivalents | $ | 191 | | | $ | 5,467 | | | $ | 5,658 | |
| Other current assets | 84 | | | 164 | | | 248 | |
| Total current assets | $ | 275 | | | $ | 5,631 | | | $ | 5,906 | |
| Noncurrent assets: | | | | | |
| Investments, at fair value | $ | 73,632 | | | $ | (71,658) | | | $ | 1,974 | |
| Total noncurrent assets | 73,632 | | | (71,658) | | | 1,974 | |
| Total assets | $ | 73,907 | | | $ | (66,027) | | | $ | 7,880 | |
| | | | | |
| Liabilities, Redeemable Noncontrolling Interests and Equity | | | | | |
| Current liabilities: | | | | | |
| Other current liabilities | 120 | | | (120) | | | — | |
| Total current liabilities | 120 | | | (120) | | | — | |
| Total liabilities | $ | 120 | | | $ | (120) | | | $ | — | |
| Equity: | | | | | |
| Greenbacker Renewable Energy Company LLC controlling interest | $ | 7,594 | | | $ | — | | | $ | 7,594 | |
| Accumulated deficit | (22) | | | 308 | | | 286 | |
| Noncontrolling interests | 66,215 | | | (66,215) | | | — | |
| Total equity | $ | 73,787 | | | $ | (65,907) | | | $ | 7,880 | |
| Total liabilities, redeemable noncontrolling interests and equity | $ | 73,907 | | | $ | (66,027) | | | $ | 7,880 | |
| | | | | | | | | | | | | | | | | |
| Balances Prior to Deconsolidation | | Impact of Sale and Deconsolidation | | November 18, 2022 |
| Assets | | | | | |
| Current assets: | | | | | |
| Cash and cash equivalents | $ | 191,406 | | | $ | 5,467,061 | | | $ | 5,658,467 | |
| Other current assets | 83,612 | | | 164,042 | | | 247,654 | |
| Total current assets | $ | 275,018 | | | $ | 5,631,103 | | | $ | 5,906,121 | |
| Noncurrent assets: | | | | | |
| Investments, at fair value | $ | 73,632,120 | | | $ | (71,657,942) | | | $ | 1,974,178 | |
| Total noncurrent assets | 73,632,120 | | | (71,657,942) | | | 1,974,178 | |
| Total assets | $ | 73,907,138 | | | $ | (66,026,839) | | | $ | 7,880,299 | |
| | | | | |
| Liabilities, Redeemable Noncontrolling Interests and Equity | | | | | |
| Current liabilities: | | | | | |
| Other current liabilities | 120,147 | | | (120,147) | | | — | |
| Total current liabilities | 120,147 | | | (120,147) | | | — | |
| Total liabilities | $ | 120,147 | | | $ | (120,147) | | | $ | — | |
| Equity: | | | | | |
| Greenbacker Renewable Energy Company LLC controlling interest | $ | 7,593,663 | | | $ | — | | | $ | 7,593,663 | |
| Accumulated deficit | (21,969) | | | 308,606 | | | 286,637 | |
| Noncontrolling interests | 66,215,297 | | | (66,215,297) | | | — | |
| Total equity | $ | 73,786,991 | | | $ | (65,906,691) | | | $ | 7,880,300 | |
| Total liabilities, redeemable noncontrolling interests and equity | $ | 73,907,138 | | | $ | (66,026,838) | | | $ | 7,880,300 | |
Variable Interest Entities
The Company assesses entities for consolidation in accordance with ASC 810. The Company first considers whether an entity is considered a VIE and therefore whether to apply the VIE model. Entities that do not qualify as VIEs are evaluated for consolidation as voting interest entities (“VOE”) under the voting interest model. The Company consolidates all VIE’sVIEs in which it holds a controlling financial interest, and all VOE’sVOE that it controls through a majority voting interest or through other means. The Company evaluates whether an entity is a VIE upon acquisition of ownership interest or when reconsideration events occur as outlined per ASC 810.
The consolidation guidance requires an analysis to determine (a) whether an entity in which the Company holds a variable interest is a VIE and (b) whether the Company’s has a controlling financial interest. An entity is a VIE if any one of the following conditions exist:exists: (i) the legal entity does not have sufficient equity investment at risk, (ii) the equity investors at risk, as a group, lack the characteristics of a controlling financial interest, or (iii) the legal entity is structured with disproportionate voting rights.
A controlling financial interest is defined as (i) the power to direct the activities of a VIE that most significantly impact the VIE’sVIEs economic performance and (ii) the obligation to absorb losses of the VIE or the right to receive benefits from the VIE that could potentially be significant to the VIE.
Refer to Note 5. Variable Interest Entities for further details.
Equity Method Investments
When the Company does not have a controlling financial interest in an entity but exerts significant influence over the entity’s operating and financial decisions, the Company applies the equity method of accounting. The Company has elected the fair value option for each of its equity method investments. The Company reflects changes in the fair value of its equity method investments in Net unrealizedUnrealized gain (loss) on investments, net on the Consolidated StatementStatements of Operations. Dividend income is recorded in Other revenue on the Consolidated StatementStatements of Operations as of the date that dividends are declared by the
investee. The value of the Company's equity method investments areis recorded to Investments, at fair value on the Consolidated Balance Sheet.Sheets. On the Consolidated Statements of Cash Flows, the Company classifies distributions received from its investees using the “nature-of-the-distribution” approach. Quarterly operating distributions are classified as cash provided from operating activities, while distributions representing proceeds from the sale of property, plant, or equipment or membership interests in subsidiaries of the investees are classified as cash provided from investing activities.
Refer to Note 5. Variable Interest Entities and Note 6. Fair Value Measurements and Investments for further details.
Noncontrolling Interests, Redeemable Noncontrolling Interests and Hypothetical Liquidation at Book Value
NCI representrepresents the portion of the Company’s net income (loss), net assets and comprehensive income (loss) that areis not allocable to the Company as they represent third-party interests in the net assets of the respective entity and are based on the contractual allocations within the respective operating agreement or allocated to NCI attributable to the limited partner investors.
For certain NCI when the preferences on profit sharing on liquidation rights and priorities differ from the ownership percentages, the Company considers ASC Topic 970, Real Estate - General, and applies the HLBV method of reporting. Under the HLBV method, the amounts of income and loss attributed to the NCI reflect the changes in the amounts the third parties would hypothetically receive at each balance sheet date based on the liquidation provisions of the respective partnership agreements. HLBV assumes that the proceeds available for distribution are equivalent to the unadjusted, stand-alone net assets of each respective partnership, as determined under U.S. GAAP. The third-party noncontrolling interests in the Consolidated StatementStatements of Operations and Consolidated StatementStatements of Comprehensive Income (Loss), if applicable, are determined based on the difference in the carrying amounts of NCI on the Consolidated Balance SheetSheets between reporting dates, adjusted for any capital transactions between the Company and third-party investors that occurred during the respective period.
The Company accounts for the portion of net assets in the consolidated entities attributable to the noncontrolling investors as RNCI or NCI in its Consolidated Financial StatementsStatements. NCI is measured using the HLBV method and RNCI is measured using the greater of the estimated redemption value or HLBV method. NCI in subsidiaries that are redeemable at the option of the NCI holder are classified as RNCI on the Consolidated Balance Sheet.Sheets.
Refer to Note 16.17. Noncontrolling Interests and Redeemable Noncontrolling Interests for further details.
Use of Estimates
The preparation of the Company’s Consolidated Financial Statements in conformity with U.S. GAAP requires management to make estimates and assumptions that affect the reported amounts of certain assets and liabilities and the amounts of contingent liabilities at the balance sheet date and the reported amounts of revenues and expenses during the reporting period. Actual results could differ from those estimates.
Cash and Cash Equivalents
Cash and cash equivalents include investments in highly liquid money market instruments with an original maturity of three months or less.
Restricted Cash
Restricted cash consists of cash accounts used as collateral for letters of credit and requirements for financial institutional loan requirementsloans and purchase and sale agreements that are restricted for use on certain of the Company'sCompany’s renewable energy projects.
Supplemental Cash Flow Information
The following table provides a reconciliation of cash and cash equivalents and restricted cash as of December 31, 2023 and 2022:
| | | | | | | | | | | |
| (in thousands) | December 31, 2023 | | December 31, 2022 |
| Cash and cash equivalents | $ | 96,872 | | | $ | 143,224 | |
| Restricted cash, current | 85,235 | | | 47,474 |
| Restricted cash | 5,568 | | | — | |
| Total cash and cash equivalents and restricted cash | $ | 187,675 | | | $ | 190,698 | |
The following table presents information regarding the Company’s non-cash investing and financing activities as well as the cash paid for interest for the year ended December 31, 2023 and for the period from May 19, 2022 through December 31, 2022:
| | | | | | | | | | | |
| (in thousands) | For the year ended December 31, 2023 | | For the period from May 19, 2022 through December 31, 2022 |
| Non-cash investing and financing activities | | | |
| Deferred sales commission payable | $ | 10,270 | | | $ | 10,973 | |
| Redemptions payable | 361 | | | 32,198 | |
| Distribution payable to shareholders | 7,606 | | | 7,703 | |
| Capital expenditures incurred but not paid | 38,009 | | | 24,284 | |
| | | |
| Non-cash distributions to noncontrolling interests | 2,293 | | | 2,794 | |
| | | |
| Cash paid for | | | |
| Interest paid, net of amounts capitalized | $ | 23,608 | | | $ | 12,988 | |
Accounts Receivable and Allowance for Doubtful Accounts
Accounts receivable are recorded at the invoiced amount, net of allowance for doubtful accounts. Accounts receivable also include unbilled accounts receivable, which is comprised of the monthly power generated under PPAs not yet invoiced. The Company reviews its accounts receivable for collectability and records an allowance for doubtful accounts for estimated uncollectible accounts receivable as deemed necessary. Accounts receivable are written off when they are no longer deemed collectible. The allowance is based on the Company'sCompany’s assessment of known delinquent accounts, historical experience and other currently available evidence of the collectability and the aging of accounts receivable. The underlying assumptions, estimates and assessments the Company uses to provide for losses are updated to reflect the Company'sCompany’s view of current conditions. Changes in such estimates could significantly affect the allowance for losses. It is possible the Company will experience credit losses that are different from the Company'sCompany’s current estimates. Based on the Company'sCompany’s assessment performed as of December 31, 2023 and 2022, the allowance for doubtful accounts recorded was not material.
Fair Value Measurements
ASC Topic 820, Fair Value Measurements (“ASC 820”), prioritizes the use of market-based inputs over entity-specific inputs and establishes a three-level hierarchy for fair value measurements based upon the transparency of inputs to the valuation. The three levels of valuation hierarchy are defined as follows:
Level 1: Unadjusted quoted prices for identical assets or liabilities in active markets.
Level 2: Other significant observable inputs that are sourced either directly or indirectly from publications or pricing services, including dealer or broker markets, for identical or comparable assets or liabilities. Generally, these inputs should be widely accepted and public, non-proprietary, and sourced from an independent third party.
Level 3: Inputs derived from a significant amount of unobservable market data and derived primarily through the use of internal valuation methodologies.
Refer to Note 6. Fair Value Measurements and Investments for further details.
Property, Plant and Equipment, net
Property, plant and equipment is stated at historical cost net of accumulated depreciation. Depreciation is computed on a straight-line basis over the estimated remaining useful lives of individual assets or classes of assets noted in the table below or, when the asset is on property subject to a lease or other site control contract, the remaining lease or other contractual periods and renewals that are deemed to be reasonably certain at the date the assets are purchased, if less than the estimated remaining useful life. Additions and improvements extending asset lives beyond their remaining estimated useful lives are capitalized, while repairs and maintenance, including planned major maintenance, are charged to expense as incurred.
| | | | | |
| Asset Class | Useful Lives (Years) |
| Solar energy systems | 35 years |
| Wind energy systems | 30 years |
| Battery storage systems | 10 years |
All costs directly related to the acquisition, development, and construction of long-lived assets are capitalized, including taxes and insurance incurred during the construction phase. A portion of interest costs, including amortization of debt issuance and financing costs associated with the generation facilities'facilities’ financing arrangements, are capitalized during construction. Development costs includesinclude the project development costs, which are expensed until it is probable that commercial success will be achieved. Once the assets are placed into service, all of the capitalized costs are depreciated over the estimated useful lives of the assets.
Refer to Note 7.8. Property, Plant and Equipment for further details.
Goodwill
Goodwill reflects the excess of the consideration transferred, including the fair value of any contingent consideration, over the assigned fair values of the identifiable net assets acquired. Goodwill is not amortized and is tested for impairment at least on an annual basis during the fourth quarter or more frequently if facts or circumstances indicate that the goodwill might be impaired. In assessing goodwill for impairment, the Company may elect to use a qualitative assessment to determine whether the existence of events or circumstances leadslead to a determination that it is more likely than not that the fair value of goodwill is less than its carrying amount. If the Company determines it is not more likely than not that the fair value of goodwill is less than its carrying amount, the Company will not be required to perform any additional tests in assessing goodwill for impairment. If the Company concludes otherwise, or elects not to perform the qualitative assessment, then the Company will be required to perform the quantitative impairment test. If the estimated fair value of the reporting unit is less than its carrying value, the Company performs additional quantitative analysis to determine if the reporting unit’s goodwill has been impaired. Impairment is indicated if the estimated fair value of the reporting unit is less than the carrying amount of the reporting unit, and an impairment charge is recognized for the differential.
During the period from May 19, 2022 through December 31, 2022, the Company recorded $221.3 million of goodwill related to the Acquisition, which is not deductible for tax purposes.
The Company did not recognize any impairment charges on goodwill for the period from May 19, 2022 through December 31, 2022.
Refer to Note 8.9. Goodwill, Other Intangible Assets and Out-of-market Contracts for further details.
Amortizable and Other Intangible Assets and Out-of-market Contracts
Contract-based intangible assets, including intangible assets and liabilities (out-of-market contracts) associated with PPAsPPA and REC agreements, represent the value of rights that arise from contractual arrangements. When the Company acquires a project with an existing PPA or REC agreement in an asset acquisition or business combination, and the terms of the contract are favorable or unfavorable relative to market terms, the Company recognizes intangible assets or liabilities in its accounting for the acquisition. In addition, in the Company’s accounting for the transition from the Investment Basis to the Non-Investment Basis, the Company identified and recorded contract-based intangible assets and liabilities associated with its existing PPAsPPA and REC agreements, as applicable. The Company amortizes identifiable intangible assets consisting of channel partner relationships, out-of-market PPAs, out-of-market REC contracts and trademarks because these assets have finite lives. The Company’s amortizable intangible assets with finite lives are amortized on a straight-line basis over the estimated useful lives. The basis of amortization approximates the pattern in which the assets are utilized over their estimated useful lives.
The contract-based intangible assets and liabilities (out-of-market contracts) associated with PPA and REC agreements for which the fair value has been determined to be less (more) than market are amortized to revenue over the term of each underlying contract on a straight-line basis.
The Company capitalizes implementation costs related to cloud computing (i.e., hosting) arrangements that are accounted for as a service contract that meets the Company's finite lived intangibleaccounting requirement for capitalization as such implementation costs were incurred to develop or utilize internal-use software hosted by a third-party vendor. The capitalized implementation costs are recorded as part of Other noncurrent assets was $17.2 million for the period from May 19, 2022 through December 31, 2022. This includes $10.5 million of net contract amortization on PPA and REC contract intangible assets and out-of-market contracts recorded within Contract amortization, net on the Consolidated StatementBalance Sheets and is amortized over the length of Operations, and $6.7 million of amortization expense on channel partner relationships and trademark intangible assets recordedthe service contract within Depreciation, amortization and accretionDirect operating costs on the Consolidated StatementStatements of Operations.
Refer to Note 8.9. Goodwill, Other Intangible Assets and Out-of-market Contracts for further details.
Impairment of Long-Lived Assets
In accordance with ASC Topic 360, Property, Plant, and Equipment, long-lived assets and intangible assets with determinable useful lives are reviewed for impairment whenever events or changes in circumstances indicate that the carrying amount of an asset may not be recoverable. Recoverability of assets to be held and used is measured by a comparison of the carrying amount of the assets to the future undiscounted net cash flows expected to be generated by the asset. If such assets are considered to be impaired, the impairment to be recognized is measured by the amount by which the carrying amount of the assets exceeds the fair value of the assets and would be charged to earnings. Assets to be disposed of are reported at the lower of the carrying amount or fair value less the costs to sell.
For the year ended December 31, 2023, the Company recognized impairment of long-lived assets of $59.3 million associated with a certain renewable energy asset of which $7.3 million was associated with the plant and equipment asset, and the remainder of which was associated with the favorable PPA contract. Refer to Note 8. Property, Plant and Equipment and Note 9. Goodwill, Other Intangible Assets and Out-of-market Contracts for further details. The Company did not recognize any impairment charges on long-lived assets for the period from May 19, 2022 through December 31, 2022.
Notes Receivable
The Company’s notes receivable consists of loans made by the Company, who serves as the debt holder, to different entities serving as borrowers, as a way to finance the development and construction of renewable energy projects. The Company accounts for its notes receivable in accordance with ASC Topic 310, Receivables (“ASC 310”).
In accordance with ASC 310, notes receivable held for investment are reported on the balance sheet at their amortized cost basis. The amortized cost basis is the amount at which a financing receivable or investment is originated or acquired, adjusted for applicable accrued interest, accretion, or amortization of premium, discount, and net deferred fees or costs, or other adjustments. The Company's notes receivable were all issued at their respective principal amounts. Interest income will be recognized based on the contractual rate in the loan agreement and any premium/premium or discount will be amortized to interest income using the effective interest rate method. Further, for loans where paid in kindpaid-in-kind interest at the election of the borrower is present and for loans where the rate of interest changes over the life of the loan, such interest rate features will be considered and included in the effective interest rate calculation and recognition of interest income. The Company does not currently maintain a loan loss allowance as it has not experienced any such losses in historical periods and does not anticipate future losses. The Company evaluates any potential need for loan loss reserves on a periodic basis based on relevant internal and external factors that affect loan collectability, including the amount of outstanding loans owed to the Company, current collection patterns and current economic trends. As these conditions change, the Company may need to record allowances in future periods.
The Company classifies its loans on a current (due within 12 months of reporting date) and long term (due in excess of 12 months from reporting date) basis in accordance with stated maturity dates.
Interest income from the notes receivable represents operating income from ordinary business activities and areis presented as Other revenue on the Consolidated StatementStatements of Operations.
Refer to Note 7. Notes Receivable and Note 4. Revenue for further details.
Allowance for Credit Losses
The Company’s notesCompany establishes a notes receivable consistsloss reserve when available information indicates that it is probable a loss has occurred based on the carrying value of each note receivable within the portfolio and the amount of the following:
| | | | | | | | | | | |
| As of December 31, 2022 | Interest rate | Maturity date |
| Notes receivable, current | | | |
| Cider | $ | 41,863,680 | | 8.00% | 3/31/2023 |
| OYA | 8,491,226 | | 9.00% | 2/17/2023(1) |
| Shepherds Run | 8,751,528 | | 8.00% | 12/31/2023 |
| Total notes receivable, current | $ | 59,106,434 | | | |
| Notes receivable, noncurrent | | | |
| New Market | $ | 5,008,070 | | 9.00% | 9/30/2022(2) |
| SE Solar | 5,009,984 | | 9.00% | 2/15/2023(3) |
| Kane Warehouse | 275,871 | | 10.25% | 2/28/2025 |
| Total notes receivable, noncurrent | $ | 10,293,925 | | | |
| Total notes receivable | $ | 69,400,359 | | | |
(1)The loan was paidloss can be reasonably estimated. Significant judgment is required in full on February 17, 2023.
(2)Option for purchase agreement exercised on September 30, 2022. The parties involved are working in good faith to enter into a purchase agreement.
(3)The parties involved are working in good faith on an extension todetermining the agreement.
The notes receivable current, areloss reserve, including estimates of the likelihood of default and the estimated fair value of the collateral, if any. For the year ended December 31, 2023, the Company recorded within Notes receivable, current on the Consolidated Balance Sheet. The notes receivable noncurrent are recorded within Other noncurrent assets onloss reserves of $2.0 million. The Company did not record a loss reserve for the Consolidated Balance Sheet.year ended December 31, 2022.
Debt Issuance, Deferred Financing Costs and Debt Discount
Deferred financing costs are amortized over the term of the Company’s financing arrangements using the effective interest method as a component of interest expense. Unamortized deferred financing costs are reflected as an offset to the scheduled principal payments and are presented as a reduction of Long-term debt, net of current portion, on the Consolidated Balance Sheet.Sheets. Unamortized deferred financing costs related to unfunded commitments are recorded within Other noncurrent assets on the Consolidated Balance Sheets.
As a result of the change in status from the Investment Basis to the Non-Investment Basis, the Company recorded a debt discount given that the fair value of the majority of its debt facilities was lower than the outstanding principal balance. The total debt discount recorded on May 19, 2022, the date of the change in status, was $29.6 million. Unamortized debt discounts are reflected as an offset to the scheduled principal payments and are presented as a reduction to Long-term debt, net of current portion on the Consolidated Balance Sheet.Sheets.
Refer to Note 10.11. Debt for further details.
Acquisitions
For acquisitions meeting the definition of a business combination, the acquisition method of accounting is used in accordance with ASC Topic 805, Business Combinations (“ASC 805”). The consideration transferred for the acquired business is allocated to the assets acquired and liabilities assumed based on the fair values at the date of acquisition, including identifiable intangible assets. Any excess of the amount paid over the estimated fair value of the identifiable net assets acquired is allocated to goodwill. These fair value determinations require judgment and involve the use of significant estimates and assumptions, including assumptions with respect to future cash inflows and outflows, discount rates, implied rate of return and weighted average cost of capital, asset lives and market multiples, among other items. Acquisition-related costs, such as professional fees, are excluded from the consideration transferred and are expensed as incurred.
Asset acquisitions are measured based on the cost to the Company, including transaction costs. Asset acquisition costs, or the consideration transferred by the Company, are assumed to be equal to the fair value of the net assets acquired. If the consideration transferred is cash, measurement is based on the amount of cash paid to the seller, as well as transaction costs incurred. The cost of an asset acquisition is allocated to the assets acquired based on their relative estimated fair values. Goodwill is not recognized in an asset acquisition.
The Company records contingent consideration related to its asset acquisitions when it is both probable that the Company will be required to pay such amounts and the amount is estimable. These contingencies generally relate to payments due upon the acquired projects reaching milestones as specified in the acquisition agreements. As of December 31, 2022, the Company has recorded a liability of $25.9 million within Contingent consideration, current on the Consolidated Balance Sheet related
Refer to these agreements.Note 3. Acquisitions for further details.
Segment Information
ASC Topic 280, Segment Reporting establishes standards for reporting information about operating segments. Operating segments are defined as components of an enterprise where discrete financial information is available and evaluated regularly by the CODM, or decision-making group, in deciding how to allocate resources and in assessing performance. The Company manages its business as two operating segments and two reportable segments. Segment information is consistent with how the CODM reviews the business, makes resource allocation decisions, and assesses performance. Refer to Note 19.21. Segment Reporting for further details.
Distribution Policy
Distributions to members, if any, will be authorized and declared quarterly by the Company's Boardboard of Directors quarterlydirectors of the Company (the “Board of Directors”) in advance and paid monthly.monthly in the form of cash or shares. From time to time, the Company may also pay interim special distributions in the form of cash or shares, with the approval of the Company's Board of Directors. Distributions will be made on all classes of shares at the same time. The cash or share distributions paid to the shareholder with respect to the Class C, P-S and P-T shares will be lower than the cash or share distributions with respect to the Company’s other share classes because of the distribution fee associated with the Class C, P-S and P-T shares, which is allocated specifically to such classes. Amounts distributed to each class are allocated amongst the holders of the shares in such class in proportion to their shares.
Refer to Note 17. Members'18. Equity for further details.
Earnings per Share
In accordance with the provisions of ASC Topic 260, Earnings per Share (“ASC 260”), basic earnings per share is computed by dividing earnings available to common members by the weighted average number of shares outstanding during the period. Other potentially dilutive common shares, and the related impact to earnings, are considered when calculatingDiluted earnings per share on a diluted basis, if applicable. The Company had no dilutive instrumentsis calculated by dividing net income by the weighted-average number of common shares outstanding during the year, adjusted for the period from May 19, 2022 through December 31, 2022.effect of potentially dilutive securities. The Company’s potentially dilutive securities consist of unvested share-based compensation awards calculated using the treasury stock method, unless the effect is anti-dilutive.
The Earnout Shares issued as part of the Acquisition will have no impact on either basic or diluted earnings per share until they are fully participating. Refer to Note 3. Acquisitions for additional discussion of the Earnout Shares and Note 18.20. Earnings Per Share for further details regarding earnings per share.details.
Revenue Recognition
The Company recognizes revenue from contracts with customers in accordance with ASC Topic 606, Revenue from Contracts with Customers (“ASC 606”), which provides a five-step model for recognizing revenue as follows:
1.Identify the contract
2.Identify performance obligations
3.Determine the transaction price
4.Allocate the transaction price
5.Recognize revenue
The Company has elected as a practical expedient the accounting policy under which it excludes from the transaction price, sales taxes it collects from its customers assessed by a governmental authority.authorities. The Company, therefore, reports sales revenue net of any sales tax.taxes.
Energy Sales
The Company’s revenue is primarily derived from the sale of power under long-term PPAs. The Company’s PPAs generally have a term between 10-2010-30 years. Customers consist of commercial property owners, corporate entities, municipal
entities, and utility companies located within the continental United States and Canada. The Company operates solar, wind, biomass, and battery systems.
Certain of these PPAs are accounted for as leases.leases with variable lease payments. ASC Topic 842, Leases (“ASC 842”), requires the minimumvariable lease payments received to be amortized over the term of the lease and variable lease revenue to be recorded in the period when the changes in facts and circumstances on which the variable lease payments are based occur. See further detail regarding the Company’s PPAs accounted for as leases in Note 9.10. Leases. Sales are subject to economic and weather conditions and may fluctuate based on changes in the industry, regulatory policies, tax incentives, trade policies, and financial markets.
The Company has identified the sale of renewable energy and capacity, and when bundled into the PPA, RECs, as the performance obligations within its PPAs. The Company transfers control of the electricity and capacity over time, and the customer simultaneously receives and consumes the benefits provided by the Company'sCompany’s performance as it performs. The RECs bundled into PPAs are generated upon generation of renewable power from our renewable energy generatingenergy-generating assets. Accordingly, the Company has concluded that the sale of electricity, capacity, and when included in the contract, RECs, represent series of distinct goods or services that are substantially the same and that have the same pattern of transfer to the customer. Each distinct transfer of electricity in kWh that the Company promises to transfer to the customer meets the criteria to be a performance obligation satisfied over time. The Company recognizes revenue based on the amount metered and invoiced on the basis of the contract prices multiplied by kWh delivered. The Company applies the invoicing practical expedient to recognize revenue in circumstances where the amount of revenue recognized is determined based on the output produced.
Renewable Energy Credits Sales and Other Incentives
The Company has concluded the sale of RECs performance obligation that are not required to be generated by a specific renewable energy generatingenergy-generating asset is satisfied at the point in time in which control is transferred to the customer, which may be upon delivery of the attributes or delivery of the related renewable energy, dependent on whether the contract number of RECs is a fixed amount or based upon the amount of power generated. This represents the point in time where the Company has a present right to payment and the customer has significant risks and rewards related to ownership of the RECs.
In a bundled contract to sell energy and RECs, all performance obligations are deemed to be delivered at the same time. In such cases, the Company does not allocate the transaction price to multiple performance obligations.
Contract Amortization
Intangible assets and out-of-market contracts recognized from PPAs and RECs assumed through acquisitions related to the sale of energy in future periods for which the fair value has been determined to be less (more) than market are amortized to revenue over the term of each underlying contract on a straight-line basis.
Investment Management Revenue
The Company also performs investment management and other administrative services for other funds in the sustainable infrastructure renewable energy industry. Such services comprise many activities which constitute a series of distinct services satisfied over time. These activities include capital raising and capital deployment, marketing and other investor relations functions as well as technical asset management, finance and accounting, legal and other administrative services. The performance obligation is satisfied over time because the customer simultaneously receives and consumes the benefits provided by the entity’s performance as the Company performs. The Company utilizes an output method based on time elapsed to measure progress towards satisfaction of the performance obligation.
Interest Revenue
Interest revenue relates to the Company's secured loans to developers within the renewable energy industry. To the extent the Company expects to collect such amounts, interest revenue is recorded on an accrual basis. If there is reason to doubt an ability to collect such interest, interest receivable on loans is not accrued for accounting purposes. Original issueissuance discounts, market discounts or market premiums are accreted or amortized using the effective interest method as interest revenue. Prepayment premiums on loans are recorded as interest revenue when received. Any application, origination or other fees earned by the Company in arranging or issuing debt are amortized over the expected term of the loan.
Loans are placed on non-accrual status when principal and interest are 90 days or more past due, or when there is a reasonable doubt that principal or interest will be collected. Accrued interest is generally reversed when a loan is placed on non-accrual status. Interest payments received on non-accrual loans may be recognized as revenue or applied to principal depending upon management’s judgment regarding collectability. Non-accrual loans are generally restored to accrual status when past due principal and interest isare paid and, in management’s judgment, isare likely to remain current.
Refer to Note 4. Revenue for further details.
Asset Retirement Obligations
Asset retirement obligations or AROs,(“AROs”), are accounted for in accordance with ASC Topic 410-20, Asset Retirement Obligations (“ASC 410-20”). AROs associated with long-lived assets included within the scope of ASC 410-20 are those for which a legal obligation exists under enacted laws, statutes, and written or oral contracts, including obligations arising under the doctrine of promissory estoppel, and for which the timing and/or method of settlement may be conditional on a future event. ASC 410-20 requires an entity to recognize the fair value of a liability for an ARO in the period in which it is incurred and a reasonable estimate of fair value can be made.
Upon initial recognition of a liability for an ARO, the asset retirement cost is capitalized by increasing the carrying amount of the related long-lived asset by the same amount. Over time, the liability is accreted to its future value, while the capitalized cost is depreciated over the useful life of the related asset. The Company's AROs are primarily related to the future dismantlement of solar or wind equipment placed on leased property at the end of the contractual term. As part of the Company’s change in status as discussed previously, the Company determined the fair value of the AROs as of May 19, 2022.
Refer to Note 12.13. Asset Retirement Obligations for further details.
Deferred Sales Commissions
The Company defers certain costs, principally sales commissions and related compensation, which are paid to the dealer manager and may be reallowed to financial advisors and broker-dealers in the future in connection with the sale of shares sold with a reduced front-end load sales charge and a trail fee. The costs expected to be incurred at the time of the sale of such shares are recorded as a liability on the date of sale and represent the aggregate amount due for such costs over the period beginning at the time of sale and ending on the earlier date ofof: (1) when the maximum amount of sales commission and related compensation is reached under regulatory regulations; (2) the date which approximates an expected liquidity event for the Company; or (3) the expected holding period of the investment. The costs expected to be incurred at the time of the sale of the Class P-T and Class P-S shares wereare recorded as a liability on the date of sale and represent the aggregate amount due for such costs over the period beginning at the time of sale and ending on the earlier date ofof: (1) the date which approximates an expected liquidity event for the Company; or (2) the expected holding period of the investment. The upfront liability is calculated at the time of sale, using the 85 basis points per annum fee multiplied by the expected holding period of such share. Deferred sales commissions for Class C, P-T and P-S shares are paid monthly, in the form of a reduction to shareholder distributions, to the third-party dealer manager at a rate equal to 1/12th of the 85 basis points per annum fee. The estimated amount of the liability can be updated as management's assumption surrounding an expected liquidity event changes or if the maximum of sales-related commissions and costs under regulatory regulations is attained.
As of December 31, 2023 and 2022, the Company recorded a liability for deferred sales commissions in the amount of $10.3 million and $11.0 million, respectively, of which $3.73.5 million is and $3.7 million, respectively, are included in Other current liabilities and the remaining $6.8 million and $7.3 million, respectively, are included in Other noncurrent liabilities on the Consolidated Balance Sheet.Sheets.
Share-Based
Share-based Compensation
InThe Company grants certain share-based compensation awards under the Greenbacker Renewable Energy Company LLC 2023 Equity Incentive Plan (the “2023 Equity Incentive Plan”). The grant date fair value for restricted share units granted under the 2023 Equity Incentive Plan is determined based on the MSV of the Company’s Class P-I shares on the business day prior to the grant, reduced by the present value of the expected dividends during the vesting period. Additionally, in connection with the Acquisition, certain of the Earnout Shares that were issued to Group LLC as part of the consideration were subsequently issued by Group LLC to certain employees of the Company in exchange for their employment services post Acquisition. As a result, thepost-Acquisition. The Company accounts for the issuance of these Earnout Shares to employeesawards in accordance with ASC Topic 718, Compensation - Stock Compensation(“ (“ASC 718”). The Company recognizes share forfeituresShare-based compensation costs are primarily recognized over the applicable requisite service period of the award, generally using the straight-line method. Forfeitures are recorded as they occur.incurred.
Refer to Note 3. Acquisitions and Note 19. Share-based Compensation for further details.
Derivative Instruments
ASC Topic 815, Derivatives and Hedging ("(“ASC 815"815”), requires companies to recognize all of its derivative instruments as either assets or liabilities in the Consolidated Balance SheetSheets at fair value. The accounting for changes in the fair value (i.e., gains or losses) of a derivative instrument depends on whether it has been designated under hedge accounting and qualifies as part of a hedging relationship and on the type of hedging relationship. For derivative instruments that are designated and qualify as hedging instruments, an entity must designate the hedging instrument based upon the exposure being hedged. For derivative instruments not designated as hedging instruments, the gain or loss is recognized in the Consolidated StatementStatements of Operations during the current period. The Company only uses derivative financial instruments to the extent necessary to hedge identified business risks and does not hold or issue derivative financial instruments for trading purposes. When there is a master netting agreement with a financial institution, any gain or loss on interest rate swaps with the same financial institution are netted for financial statement presentation.
The Company entered into certain interest rate swaps to manage its interest rate risk and accounts for these as derivative instruments under ASC 815. The Company designates qualifying interest rate derivatives as a hedge of a forecasted transaction of the variability of cash flows to be paid related to a recognized liability under a cash flow hedge. Under a cash flow hedge, the gain or loss on the derivative is reported in other comprehensive income and is reclassified into earnings in the same periods during which the hedged transaction affects earnings and is recorded to the same income statement line item as the hedged item. The changes in the fair value of derivatives that do not qualify for hedge accounting or are not designated as hedging instruments are recognized immediately in current earnings. Cash flows on hedges are classified in the Consolidated StatementStatements of Cash Flows the same as cash flows of the items being hedged.
The Company documents the relationship between derivatives and hedged items, as well as the risk-management objective and the strategy for undertaking hedge transactions, at the inception of the hedging relationship. This documentation includes linking cash flow hedges to specific forecasted transactions. The Company also assesses, both at the hedge’s inception and on an ongoing basis, whether the derivative instruments that are used are highly effective in offsetting changes in cash flows of the hedged items. The Company discontinues hedge accounting when it determines that the derivative is no longer effective in offsetting changes in the fair values or cash flows of the hedged item, the derivative is settled or terminates, a hedged forecasted transaction is no longer probable of occurring, or a treatment of the derivative as a hedge is no longer appropriate or intended. When a cash flow hedge is discontinued but the hedged cash flows or forecasted transactions are still expected to occur, gains or losses that were accumulated in other comprehensive income are amortized into earnings over the same periods during which the hedged transactions will affect earnings.
Refer to Note 11.12. Derivative Instruments for further details.
Income Taxes
The Company intends to operate so that it will qualify to be treated as a partnership for U.S. federal income tax purposes under the Internal Revenue Code. As such, it will not be subject to any U.S. federal and state income taxes. In any year, it is possible that the Company will not meet the qualifying income exception and will not qualify to be treated as a partnership. If the Company does not meet the qualifying income exception, the members would then be treated as stockholders in a corporation, and the Company would become taxable as a corporation for U.S. federal income tax purposes under the Internal Revenue Code. The Company would be required to pay income tax at corporate rates on its net taxable income. To the extent of the Company’s earnings and profits, the payment of the distributions would not be deductible by the Company, and distributions to members from the Company would constitute dividend income taxable to such members.
The Company conducts substantially all its operations through its wholly owned subsidiary, GREC, which is a corporation that is subject to federal, state, provincial, local and foreign income taxes based on income. Accordingly, most of its operations will be subject to federal, state, provincial, local and foreign income taxes in the jurisdictions in which it operates. As of December 31, 2023 and 2022, including territories and provinces, the Company operates in 36 jurisdictions.
Income taxes are accounted for under the assets and liabilities method. Deferred tax assets and liabilities are recorded for the estimated future tax consequences attributable to differences between items that are recognized in the Consolidated Financial Statements and tax returns in different years. Deferred tax assets and liabilities are measured using enacted tax rates expected to apply to taxable income in the years in which those temporary differences are expected to be recovered or settled. The effect on deferred tax assets and liabilities of a change in tax rates is recognized in income in the period that includes the enactment date.
PTCs are recognized as wind energy from qualified projects is generated and sold based on a per kWh rate prescribed in applicable federal and state statutes. The tax benefits of PTCs are recognized as either reductions to current income taxes payable, unless limited by tax law, in which instance they are deferred tax assets with a carry forward period of 20 years. The Company recognizes ITCs as a reduction to income tax expense when the related energy property is placed into service.
For income tax benefits to be recognized, including uncertain tax benefits, a tax position must be more likely than not to be sustained upon examination by taxing authorities. The amount recognized is measured as the largest amount of the benefit that is more likely than not to be realized upon ultimate settlement. A valuation allowance is established against net deferred tax assets if, based on the weight of available evidence, it is more likely than not that some or all of the net deferred tax assets will not be realized. Changes in recognition or measurement are reflected in the period in which the change in judgment occurs. Interest and penalties associated with income taxes, if any, will be recognized in general and administrative expense.
The Company follows the authoritative guidance on accounting for uncertainty in income taxes and has concluded it has no material uncertain tax positions to be recognized at this time.
Leases
In February 2016 and as subsequently modified, the FASB issued ASU No. 2016-02, Leases, or ASC 842, with the objective to increase transparency and comparability among organizations related to their leasing arrangements. This comprehensive new standard amends and supersedes existing lease accounting guidance and is intended to increase transparency and comparability among organizations by recognizing ROU lease assets and lease liabilities on the balance sheet and requiring disclosure of key information about leasing arrangements. Lease expense continues to be recognized in a manner similar to legacy U.S. GAAP. As of December 31, 2022, the Company was no longer considered an “emerging growth company” pursuant to the provisions of the JOBS Act, enacted on April 5, 2012. For as long as the Company was an “emerging growth company,” we were permitted to take advantage of certain exemptions from various reporting requirements or extended transition periods for complying with new or revised accounting standards, including adoption of this ASU for fiscal years beginning after December 15, 2021. The Company adopted ASC 842 effective January 1, 2022 using the modified retrospective approach.
Under ASC 842, a lease is a contract, or part of a contract, that conveys the right to control the use of identified property, plant or equipment (i.e., an identified asset) for a period of time in exchange for consideration. The Company’s contracts determined to be or to contain a lease include explicitly or implicitly identified assets where the lessee has the right to control the use of the assets during the lease term.
To reduce the burden of adoption and ongoing compliance with ASC 842, a number of practical expedients and policy elections are available under the new guidance. The Company elected the “package of practical expedients” permitted under the transition guidance, which allowed the Company to not reassess whether contracts entered into prior to adoption are or contain leases and also allowed the Company to carryforward the historical lease classification for existing leases. The Company also elected the hindsight practical expedient and therefore reassessed the lease term for existing leases.
The Company made an accounting policy election under ASC 842 not to recognize ROU assets and lease liabilities for leases with a term of twelve months or less. For all other leases, the Company recognizes ROU assets and lease liabilities based on the present value of lease payments over the lease term at the commencement date of the lease.
Future lease payments may include fixed rent escalation clauses or payments that depend on an index (such as the consumer price index). Certain leases require variable lease payments based on the amount of energy generation of the related assets which are recorded in variable lease expense or revenue depending upon whether the Company is the lessee or lessor in the arrangement. Subsequent changes based on an index and other periodic market-rate adjustments to base rent are recorded in Direct operating costs on the Consolidated Statements of Operations in the period incurred.
The Company’s leases may include non-lease components representing additional services transferred to the Company, such as common area maintenance for real estate. The Company made an accounting policy election for each class of underlying asset not to separate non-lease components and instead to account for each separate lease component and the non-lease components associated with that lease component as a single lease component. Non-lease components that are variable in nature are recorded in Direct operating costs in the period incurred.
The Company uses its incremental borrowing rate to determine the present value of lease payments as the Company’s leases do not have a readily determinable implicit discount rate. The incremental borrowing rate is the rate of interest the Company would have to pay to borrow on a collateralized basis over a similar term and amount in a similar economic environment.
Upon adoption, the Company recognized ROU assets and lease liabilities for operating leases in the amount of $0.2 million and $0.2 million, respectively, related to office leases where the Company was the lessorlessee as of January 1, 2022. The remainder of the Company’s leases as of December 31, 20222023 were acquired in the Acquisition, recognized as part of the transition to a Non-Investment Basis, or entered into subsequent to May 19, 2022. The cumulative effect adjustment recorded to the opening balance of retained earnings upon adoption was not material to the Consolidated Balance Sheet.
Refer to Note 9.10. Leases for further details.
Risks and Uncertainties
The Company’s business and the success of its strategies are affected by global and national economic, political and market conditions generally and also by the local economic conditions where its assets are located. Certain external events such as public health crises (such as COVID-19), natural disasters and geopolitical events, including the ongoing conflict between Russia, Belarus and Ukraine, and the more recent conflict between Israel and Hamas, have recently led to increased financial and credit market volatility and disruptions, leading to record inflationary pressure, rising interest rates, supply chain issues, labor shortages and recessionary concerns. In response to inflationary pressure, the Federal Reserve and other global central banks raised interest rates in 2022 and 2023. The full impact of such external events on the financial and credit markets and consequently on the Company’s future financial conditions and results of operations is uncertain and cannot be fully predicted. The Company will continue to monitor these events and will adjust its operations as necessary.
Concentration of Risk
The Company’s derivative financial instruments and PPAs potentially subject the Company to concentrations of credit risk. The maximum exposure to loss due to credit risk of counterparties to either, (i) the Company’s derivative financial instruments or (ii) the Company’s PPAs, would generally equal (a) the fair value of derivative financial instruments presented in the Company’s Consolidated Balance SheetSheets or (b) the revenue otherwise expected to be earned under the terms of the PPAs had the
relevant offtakers performed their obligations. The Company manages this credit risk by maintaining a diversified portfolio of creditworthy counterparties.
The Company determines which customers, if any, comprise over ten percent of either revenue or accounts receivable. ForThe Company had no customers from which revenue was over ten percent of total revenue for the period from May 19, 2022 throughyear ended December 31, 2022, the2023. The Company had one customer from which revenue was 11.8% of total revenue.revenue for the period from May 19, 2022 through December 31, 2022. As of December 31, 2023, the Company had one customer from which the receivable balance was 24.4% of total accounts receivable. No one customer receivable balance represented ten percent or more of accounts receivable as of December 31, 2022.
Refer to Note 11.12. Derivative Instruments and Note 4. Revenue for further details.
The Company's business and the success
Table of its strategies are affected by global and national economic, political and market conditions generally and also by the local economic conditions where its assets are located. Certain external events such as public health crises, including COVID-19 and its variants, natural disasters and geopolitical events, including the ongoing conflict between Russia, Belarus and Ukraine, have recently led to increased financial and credit market volatility and disruptions, leading to record inflationary pressure, rising interest rates, supply chain issues, labor shortages and recessionary concerns. Although more normalized activities have resumed and there has been improvement due to global and domestic vaccination efforts, at this time the Company cannot predict the full extent of the impacts of the COVID-19 pandemic on the Company and the economy as a whole. Additionally, in response to recent inflationary pressure, the U.S. Federal Reserve and other global central banks have raised interest rates in 2022 and have indicated likely further interest rate increases. The full impact of such external events on the financial and credit markets and consequently on the Company’s financial conditions and results of operations is uncertain and cannot be fully predicted. The Company will continue to monitor these events and will adjust its operations as necessary.Contents Recently Issued Accounting Pronouncements
In June 2016,Effective January 1, 2023, the FASB issued ASUCompany adopted Accounting Standards Update (“ASU”) No. 2016-13, Financial Instruments – Credit Losses (Topic 326), subsequently amended by ASU No. 2018-19 and ASU No. 2019-10, which provides financial statement users with more useful information about the current expected credit losses and changes how entities measure credit losses on financial instruments and the timing of when such losses are recognized by utilizing a lifetime expected credit loss measurement. The guidance is effective for fiscal years and interim periods within those years beginning after January 1, 2023. The Company does not believe the adoption of this ASU willdid not have a material impact on itsthe Company’s Consolidated Financial Statements and related disclosures.
In March 2020,Effective January 1, 2023, the FASB issuedCompany adopted ASU No. 2020-04, "Reference“Reference Rate Reform (Topic 848): Facilitation of the effects of Reference Rate Reform on Financial Reporting,"” which provides companies with optional financial reporting alternatives to reduce the cost and complexity associated with the accounting for contracts and hedging relationships affected by reference rate reform. The amendments apply to contracts and hedging relationships that reference the LIBOR or another reference rate to be discontinued because of reference rate reform. The adoption of this ASU did not have a material impact on the Company’s Consolidated Financial Statements and related disclosures.
In November 2023, the FASB issued ASU No. 2023-07, “Segment Reporting (Topic 280): Improvements to Reportable Segment Disclosures,” that would enhance disclosures for significant segment expenses for all public entities required to report segment information in this updateaccordance with ASC 280. ASC 280 requires a public entity to report for each reportable segment a measure of segment profit or loss that its CODM uses to assess segment performance and to make decisions about resource allocations. The amendments in ASU 2023-07 improve financial reporting by requiring disclosure of incremental segment information on an annual and interim basis for all public entities to enable investors to develop more useful financial analyses. Currently, Topic 280 requires that a public entity disclose certain information about its reportable segments. For example, a public entity is required to report a measure of segment profit or loss that the CODM uses to assess segment performance and make decisions about allocating resources. ASC 280 also requires other specified segment items and amounts such as depreciation, amortization and depletion expense to be disclosed under certain circumstances. The amendments in ASU 2023-07 do not change or remove those disclosure requirements. The amendments in ASU 2023-07 also do not change how a public entity identifies its operating segments, aggregates those operating segments, or applies the quantitative thresholds to determine its reportable segments. The amendments in ASU 2023-07 are effective for all entities as of March 12, 2020 throughfiscal years beginning after December 31, 2024, as extended in the fourth quarter of 2022. An15, 2023, and interim periods within fiscal years beginning after December 15, 2024. Early adoption is permitted. A public entity may elect toshould apply the amendments for contracts as of any date fromin ASU 2023-07 retrospectively to all prior periods presented in the beginning of an interim period that includes or is subsequent to March 12, 2020.financial statements. The Company intends to apply the amendments for its relevant contracts and is currentlystill evaluating the impact of thethis ASU and the effectimpact on its Condensed Consolidated Financial Statements and related disclosures.
In December 2023, the FASB issued ASU No. 2023-09, “Income Taxes (Topic 740): Improvements to Income Tax Disclosures,” which requires disclosure of disaggregated income taxes paid, prescribes standard categories for the components of the effective tax rate reconciliation, and modifies other income tax-related disclosures. For public business entities, the amendments in ASU 2023-09 are effective for fiscal years beginning after December 15, 2024. The Company is still evaluating the impact of this ASU and the impact on its Consolidated Financial Statements and related disclosures.
Changes to U.S. GAAP are established by the FASB in the form of ASUs to the FASB Accounting Standards Codification. ASUs issued which are not specifically listed above were assessed and have already been adopted in a prior period or determined to be either not applicable or are not expected to have a material impact on the Company’s Consolidated Financial Statements and related disclosures.
Note 3. Acquisitions
2023 Transactions
For acquisitions in which the Company acquires assets, including intangible assets, and assumes liabilities that do not constitute a business, the amount of the purchase consideration is equal to the fair value of the net assets acquired. The purchase consideration, including transaction costs, is allocated to the individual assets and liabilities assumed based on their relative fair values.
During the year ended December 31, 2023, the Company acquired membership interests in 18 renewable energy projects, all of which were either in development or under construction, for a total consideration of $41.4 million. The purchase price of the assets acquired during the year ended December 31, 2023 was allocated on a relative fair value basis to the assets acquired. For the year ended December 31, 2023, $37.1 million and $4.3 million were allocated to Property, plant and equipment, net and Intangible assets, net, respectively, on the Consolidated Balance Sheets. Intangible assets acquired were favorable PPA assets with a weighted-average amortization period of 21.6 years.
2022 Transactions
Management Internalization
On May 19, 2022, the Company completed a management internalization transaction pursuant to which it acquired substantially all of the business and assets including intellectual property and personnel of its external advisor, GCM, Greenbacker Administration and GDEV GP (collectively, the “Acquired Entities”). All of the acquired business and assets were immediately thereafter contributed by the Company to GREC. Additionally, as a result of the Acquisition, the Company acquired a controlling interest in GDEV and, as such, in connection with the Acquisition, consolidated the results of operations and financial position of GDEV. Refer to Note 2. Significant Accounting Policies and Note 5. Variable Interest Entities for additional discussion, including the subsequent deconsolidation of GDEV.
The Acquisition was implemented under the terms of the Contribution Agreement, dated as of May 19, 2022, by and between the Company and GCM'sGCM’s former parent, Group LLC, a subsequent contribution agreement between the Company and GREC pursuant to which all the acquired businesses and assets were immediately contributed by the Company to GREC, and certain related agreements.
In connection with the Acquisition, Group LLC received consideration of 24,365,13324.4 million Class P-I common shares, par value $0.001 per share (the “Class P-I shares”) and 13,071,15313.1 million of a newly created class of common shares of the Company designated as the Earnout Shares, par value $0.001 per share. The number of Class P-I shares issued in the transaction was based on $8.798 per Class P-I share, the last reported net asset value published by the Company on March 31, 2022 (or an aggregate value of $214.4 million, net of seller related deal fees and expenses paid by the Company). In accordance with ASC 805, the Company is required to determine the fair value of consideration transferred as of the Acquisition close date of May 19, 2022, which value was determined to be $8.81 per Class P-I share (or an aggregate value of $214.7 million, net of seller related deal fees and expenses paid by the Company). In December 2022, the consideration was finalized, and 27,89227.9 thousand additional Class P-I shares (or an aggregate value of $0.2 million, net of seller related deal fees and expenses paid by the Company) were issued to Group LLC.
The Earnout Shares are divided into three separate series, designated as “Tranche 1 Earnout Shares,” “Tranche 2 Earnout Shares,” and “Tranche 3 Earnout Shares.” The Earnout Shares are comprised of 4,357,0514.4 million Tranche 1 Earnout Shares, 4,357,0514.4 million Tranche 2 Earnout Shares, and 4,357,0514.4 million Tranche 3 Earnout Shares (consisting of 378,8740.4 million Class A Tranche 3 Earnout Shares and 3,978,1774.0 million Class B Tranche 3 Earnout Shares). All of the Earnout Shares except for the Class B Tranche 3 Earnout Shares were considered purchase consideration in the Acquisition (see below under "Share-based compensation"“Share-based compensation” for further discussion of the Class B Tranche 3 Earnout Shares). Each separate series of Earnout Shares initially do not have the right to participate in any distributions payable by the Company. However, upon the achievement of separate benchmark quarter-end run-rate revenue targets applicable to each series, or upon the occurrence of certain liquidity events, each series of Earnout Shares can become “Participating Earnout Shares.” The run-rate revenue of the Company or GREC (the “Run Rate Revenue”) upon which the benchmark targets are based is determined primarily by the calculation of third-party management fee revenue during each quarter and additional capital raised from the closing of the Acquisition through December 31, 2025 (as may be extended to December 31, 2026 upon the achievement of certain Run Rate Revenue targets).
The Earnout Shares may become Participating Earnout Shares as follows: (i) if the Run Rate Revenue during any calendar quarter exceeds $8.3 million but is less than $12.5 million, 2,904,4102.9 million of the Tranche 1 Earnout Shares will automatically achieve the status of Participating Earnout Shares, with the balance of such Tranche 1 Earnout Shares becoming Participating Earnout Shares ratably up to $12.5 million of Run Rate Revenue, and if the Run Rate Revenue during any calendar quarter equals or exceeds $12.5 million, 100% of the Tranche 1 Earnout shares will automatically achieve the status of Participating Earnout Shares; (ii) if the Run Rate Revenue during any calendar quarter exceeds $16.7 million but is less than $25.0 million, 2,904,4102.9 million of the Tranche 2 Earnout Shares will automatically achieve the status of Participating Earnout Shares, with the balance of such Tranche 2 Earnout Shares becoming Participating Earnout Shares ratably up to $25.0 million of Run Rate Revenue, and if the Run Rate Revenue during any calendar quarter equals or exceeds $25.0 million, 100% of the Tranche 2 Earnout shares will automatically achieve the status of Participating Earnout Shares; and (iii) if the Run Rate Revenue during any calendar quarter exceeds $25.0 million but is less than $37.5 million, the Class A Tranche 3 Earnout Shares and 2,525,8272.5 million of the Class B Tranche 3 Earnout Shares will automatically achieve the status of Participating Earnout Shares, with the balance of such Class B Tranche 3 Earnout Shares becoming Participating Earnout Shares ratably up to $37.5 million of Run Rate Revenue, and if the Run Rate Revenue during any calendar quarter equals or exceeds $37.5 million, 100% of the Tranche 3 Earnout shares will automatically achieve the status of Participating Earnout Shares.
Upon achieving Participating Earnout Share status, such Earnout Shares will become entitled to priority allocations of profits and increases in value from the Company, and will (i) have equivalent economic and other rights as the Class P-I shares of the Company, (ii) vote together as a single class with the Class P-I shares on all matters submitted to holders of Class P-I shares generally, (iii) not have separate voting rights on any matters (other than amendments to the terms of the Participating Earnout Shares that affect such Participating Earnout Shares adversely and in a manner that is different from the terms of the Class P-I shares), and (iv) have the right to participate in all distributions payable by the Company, as if they were, and on a pari passu basis with, the Class P-I shares, subject to, with respect to (i) and (iv), the allocation of sufficient amounts to the Earnout Shares. At its election, a holder may convert its Participating Earnout Shares into Class P-I shares after the holder’s Earnout Shares have been allocated sufficient profits or increases of value from the Company. Refer to Note 18. Equity for additional details.
The aggregate purchase consideration transferred from the Company to Group LLC in exchange for the equity interests in the Acquired Entities totaled $335.0 million assuming the then share price of $8.798 per share, the last reported net asset value published by the Company on March 31, 2022. In accordance with ASC 805, the Company is required to determine the fair value of consideration transferred as of the Acquisition close date of May 19, 2022. The aggregate purchase consideration is
valued at $294.1 million, which was paid in the form of the Class P-I shares (“Equity consideration” in the table below) and all of the Earnout Shares, except for the Class B Tranche 3 Earnout Shares (“Contingent consideration” in the table below) as described above. As of the Acquisition close date, the fair value of the Class P-I shares was determined to be $8.81 per Class P-I share. TheAs of the Acquisition close date, the fair value of the contingent consideration was estimated to be $73.6 million, which is included in Contingent consideration on the Consolidated Balance Sheet.Sheets. The Earnout Shares included in purchase consideration arewere classified as contingent consideration liabilities and are subject to recurring fair value measurements. As of December 31, 2023 and 2022, the fair value of the contingent consideration was $42.3 million and $75.7 million.million, respectively. The $33.4 million total change of the contingent consideration consists of a $0.6 million decrease in fair value and a $32.8 million change due to 3.7 million shares becoming participating in 2023. The total change in fair value of the contingent consideration is included in General and administrative expenses on the Consolidated StatementStatements of Operations. The following is a summary of the purchase consideration, as well as the fair value of the NCI in GDEV GP and GDEV at the acquisition date:
| | May 19, 2022 | | Adjustments | | May 19, 2022 as Adjusted |
| (in thousands) | | (in thousands) | May 19, 2022 | | Adjustments | | May 19, 2022 as Adjusted |
| Fair value of consideration transferred: | Fair value of consideration transferred: | | | | | |
| Equity consideration | |
| Equity consideration | |
| Equity consideration | Equity consideration | $ | 214,926,938 | | | $ | — | | | $ | 214,926,938 | |
| Contingent consideration | Contingent consideration | 73,600,000 | | | — | | | 73,600,000 | |
| Assumed expenses of Group LLC | Assumed expenses of Group LLC | 6,227,104 | | | — | | | 6,227,104 | |
| Assumed debt (paid at closing) | Assumed debt (paid at closing) | 1,500,000 | | | — | | | 1,500,000 | |
| Extinguishment of liabilities | Extinguishment of liabilities | (2,171,328) | | | — | | | (2,171,328) | |
| Total purchase consideration | Total purchase consideration | $ | 294,082,714 | | | $ | — | | | $ | 294,082,714 | |
| Fair value of the Company’s investment in GDEV (held before the Acquisition) | Fair value of the Company’s investment in GDEV (held before the Acquisition) | 3,768,406 | | | (149) | | | 3,768,257 | |
| Fair value of the NCI in GDEV GP | Fair value of the NCI in GDEV GP | 533,315 | | | (192,432) | | | 340,883 | |
| Fair value of the NCI in GDEV | Fair value of the NCI in GDEV | 45,445,898 | | | 491,043 | | | 45,936,941 | |
| Total amount to allocate to net assets acquired and consolidated | Total amount to allocate to net assets acquired and consolidated | $ | 343,830,333 | | | $ | 298,462 | | | $ | 344,128,795 | |
As a result of the Company obtaining control over GDEV, the Company’s previously held interest in GDEV was remeasured to fair value. The Company’s interest in GDEV had previously been measured at fair value under ASC 946 and therefore the remeasurement did not result in an adjustment or gain or loss recognized.
The Acquisition was accounted for as a business combination using the acquisition method of accounting in accordance with ASC 805. The purchase price has been allocated to the tangible assets and identifiable intangible assets acquired, and liabilities assumed, based upon their estimated fair values as of the acquisition date. In conjunction with the application of the acquisition method of accounting, the Company recognized the NCI in GDEV GP and GDEV at fair value as of the acquisition date. The fair value of the NCI, a Level 3 fair value measurement, was determined based upon a discounted cash flow methodology.
The excess of the purchase price over the tangible and intangible assets acquired, and liabilities assumed, has been recorded as Goodwill on the Consolidated Balance Sheet.Sheets. The Acquisition resulted in recorded goodwill of $221.3 million as a result of a higher consideration multiple paid driven by quality of the operations, including the workforce, and how the Company expects to leverage and scale the business to create additional value for its shareholders.
The Company evaluates this goodwill for impairment on an annual basis and does not amortize the acquired goodwill balance for financial statement purposes. Goodwill is not expected to be deductible for income tax purposes. TheAs part of the purchase price allocation, the goodwill was allocated $200.3 million to the IPP segment and $21.0 million to the IM segment. Refer to Note 8.9. Goodwill, Other Intangible Assets and Out-of-market Contracts for further discussion on the goodwill recorded as a result of the Acquisition.
During 2022, the Company made certain adjustments to the estimated fair value of the assets and liabilities assumed at the date of the Acquisition and the resulting consolidation of GDEV GP and GDEV. During the three months ended December 31, 2022, the Company finalized the purchase accounting for the Acquisition. The adjusted purchase price allocation is reflected in the accompanying Consolidated Balance SheetSheets as of December 31, 2023 and 2022. The following table details the purchase price allocation as of May 19, 2022 before adjustment, the adjustments made during the three months ended December 31, 2022 and the adjusted purchase price allocation as of May 19, 2022. No adjustments were made during the year ended December 31, 2023.
| | May 19, 2022 | | 2022 Adjustments | | May 19, 2022 as Adjusted |
| (in thousands) | | (in thousands) | May 19, 2022 | | 2022 Adjustments | | May 19, 2022 as Adjusted |
| Net working capital (including cash) | Net working capital (including cash) | $ | 8,819,403 | | | $ | — | | | $ | 8,819,403 | |
| Property, plant and equipment | Property, plant and equipment | 75,594 | | | — | | | 75,594 | |
| Investments, at fair value and other noncurrent assets | Investments, at fair value and other noncurrent assets | 42,355,783 | | | — | | | 42,355,783 | |
| Trademarks | Trademarks | 2,800,000 | | | — | | | 2,800,000 | |
| Channel partner relationships | Channel partner relationships | 95,100,000 | | | (400,000) | | | 94,700,000 | |
| Carried interest | Carried interest | 278,689 | | | (278,689) | | | — | |
| Other liabilities | Other liabilities | (759,902) | | | — | | | (759,902) | |
| Deferred tax liability | Deferred tax liability | (25,779,277) | | | 603,418 | | | (25,175,859) | |
| Goodwill | Goodwill | 220,940,043 | | | 373,733 | | | 221,313,776 | |
| Sum of acquired and consolidated net assets | Sum of acquired and consolidated net assets | $ | 343,830,333 | | | $ | 298,462 | | | $ | 344,128,795 | |
The fair values of the acquired trade accounts receivables, prepaid and other current assets, accounts payable and accrued expenses, and other current liabilities approximate their carrying values due to the short-term nature of the expected timeframe to collect the amounts due, realize the balances, or settle the amounts payable, accrued expenses, and theexpenses. The related cash inflows or outflows are not expected to materially vary from the contractual amounts.
As part of the purchase price allocation, the Company also determined the identifiable intangible assets were: (i) channel partner relationships, and (ii) trademarks. The fair values of the intangible assets were estimated using the income approach, specifically the multi-period excess earnings method. The discounted cash flows used in the fair value determination of these intangible assets were based on estimates used to price the transaction, and the discount rates applied were benchmarked with reference to the implied rate of return from the transaction model and the weighted average cost of capital. These non-recurring fair value measurements are primarily determined using these unobservable inputs. Accordingly, these fair value measurements are classified within Level 3 of the fair value hierarchy.
The following table summarizes the acquired goodwill and identifiable intangible assets, updated acquisition date fair value, and weighted-average amortization period:
| | | | | | | | |
| Identified intangible asset | Acquisition date fair value | Weighted-average amortization period (years) |
| Trademarks | $ | 2,800,000 | | 12 |
| Channel partner relationships | 94,700,000 | | 11 |
| Goodwill | 221,313,776 | | — | |
The change in the fair value of the channel partner relationships intangible asset during the three months ended December 31, 2022 did not result in a change in the respective weighted-average amortization period of 11 years. There were no changes to the fair value of the trademarks intangible asset or weighted-average amortization during the three months ended December 31, 2022. | | | | | | | | |
| (dollars in thousands) | | |
| Identified intangible asset | Acquisition date fair value | Weighted-average amortization period (years) |
| Trademarks | $ | 2,800 | | 12 |
| Channel partner relationships | 94,700 | | 11 |
| Goodwill | 221,314 | | — | |
In conjunction with the Acquisition, the Company incurred $3.4 million of buyer transaction costs during the year ended December 31, 2022, of which $2.6 million was recognized in Operating expenses in the Consolidated Statement of Operations under the Investment Basis during the period from January 1, 2022 through May 18, 2022. The residual $0.8 million of buyer transaction costs werewas recognized in General and administrative expenses in the Consolidated StatementStatements of Operations for the period from May 19, 2022 through December 31, 2022.
The results of operations from the Acquired Entities are included in the Consolidated Financial Statements of the Company from the date of Acquisition. The revenue contributed by the Acquisition during the period from May 19, 2022 through December 31, 2022 was $1.9 million. No pro forma information has been included in these Consolidated Financial Statements for the period that the Acquired Entities were not part of the consolidated results as they are not material.
Share-based compensation
In connection with the Acquisition, the Earnout Shares were issued to Group LLC. Group LLC then distributed to its members the Class P-I shares and a majority of the Earnout Shares (including Tranche 1 Earnout Shares, Tranche 2 Earnout Shares and Class A of Tranche 3 Earnout Shares). Class B of the Tranche 3 Earnout Shares, however, were distributed by Group LLC to GB EO Holder LLC (“EO Holder”), an entity formed by Group LLC with the sole purpose of holding the Class
B Tranche 3 Earnout Shares and distributing its equity to employees of the Company. As such, the Class B Tranche 3 Earnout Shares are classified as share-based compensation as a result of the issuance of the EO Holder equity to employees of the Company by Group LLC in exchange for their employment services post Acquisitionpost-Acquisition as a vesting condition. Accordingly, the Class B Tranche 3 Earnout Shares are not part of the consideration transferred, and the Company accounts for the issuance of these shares to employees in accordance with ASC 718.
EO Holder had 3,978,1774.0 million equity awards authorized to be issued, and in connection with the above described issuances to employees of the Company, issued 3,198,1353.2 million in awards as of December 31, 2022,2023, all to employees of the Company. The EO Holder equity awards issued (“EO Awards”) are equity classified, and compensation expense is based on the grant-date fair value of the GB EO Holder equity awards, $10.96 per share, which was based on the grant-date fair value of the Class B Tranche 3 Earnout Shares held by EO Holder. EO Awards shall vest in one, two or three tranches over a service period ranging from one, two, three years or longer, depending on whether and when certain run rate revenue levels are achieved as described above for the Class B Tranche 3 Earnout Shares. Compensation expense is currently amortized using the graded vesting approach over estimated vesting periods determined by the performance outcome considered probable to achieve as of December 31, 2022.
For the period from May 19, 2022 through December 31, 2022, the Company recognized share-based compensation expenses of $6.9 million, which are included in General2023. Refer to Note 16. Related Parties and administrative expenses in the Consolidated Statement of Operations. As of December 31, 2022, unrecognized share-based compensation expense associated with the EO Awards is $27.3 million, which is expected to be amortized over a weighted average period of 2.5 years. The Company recognized total forfeitures of $0.1 million during the period from May 19, 2022 through December 31, 2022.Note 19. Share-based Compensation for additional details
In addition, prior to the Acquisition, GDEV GP had issued carried interest to GREC as the initial investor in GDEV and to certain employees of GCM that provided services to GDEV GP. The carried interest units held by GREC were sold to a third party investor as part of the sale of GREC’s interest in GDEV on November 18, 2022. Holders of carried interest receive distributions based on carried interest received by GDEV GP from GDEV once the management fee shortfall has been reduced to zero. Vesting among employees is based on either the continued service of the participant or on the achievement of performance goals set out in the applicable award agreement. There was no change to the carried interest holdings as a result of the Acquisition. The Company accounts for the carried interests issued to employees in accordance with ASC Topic 710, Compensation - Compensation—General ("(“ASC 710"710”).
The carried interests issued to employees are liability classified, and compensation expense for the carried interests is based on the change in the fair value
Other Acquisitions
For acquisitions in which the Company acquires assets, including intangible assets, and assumes liabilities that do not constitute a business, the amount of the purchase consideration is equal to the fair value of the net assets acquired. The purchase consideration, including transaction costs, is allocated to the individual assets and liabilities assumed based on their relative fair values.
During the period from May 19, 2022 through December 31, 2022, the Company acquired membership interests in 30 renewable energy projects, all of which were either in development or under construction, for total consideration of $76.3 million. The purchase price of the assets acquired during the year ended December 31, 2022 has been allocated on a relative fair value basis as follows:
| | | | | |
| (in thousands) | |
| |
| Land | $ | 5,111,1575,111 | |
| Property, plant and equipment | 71,156,18371,156 | |
| Intangible assets | 1,193,0001,193 | |
| ROU asset | 2,923,3332,923 | |
| Less: Liabilities assumed | (4,111,186)(4,111) | |
| Total | $ | 76,272,48776,272 | |
The following table summarizes the acquired identifiable intangible assets, acquisition date estimated fair value, and weighted average amortization period for intangible assets acquired as a result of the asset acquisitions completed during the year ended December 31, 2022:
| | | | | | | | |
| (dollars in thousands) | | |
| Identified intangible asset | Acquisition data fair value | Weighted-average amortization period (years) |
| PPA contracts - out-of-market | $ | (889) | | 20 |
| REC contracts - favorable | $ | 1,193 | | 20 |
Contingent Consideration
The Company records contingent consideration related to its asset acquisitions when it is both probable that the Company will be required to pay such amounts and the amount is estimable. These contingencies generally relate to payments due upon the acquired projects reaching milestones as specified in the acquisition agreements. As of December 31, 2023 and 2022, the Company has recorded a liability of $16.5 million and $25.9 million, respectively, within Contingent consideration, current on the Consolidated Balance Sheets related to these agreements.
| | | | | | | | |
| Identified intangible asset | Acquisition data fair value | Weighted-average amortization period (years) |
| PPA contracts - out-of-market | $ | (889,000) | | 20 |
| REC contracts - favorable | $ | 1,193,000 | | 20 |
Note 4. Revenue
Disaggregation of Revenue
The following table provides information on the disaggregation of revenue as recordedreported in the Consolidated StatementStatements of Operations:
| | | | | |
| Period from May 19, 2022 through December 31, 2022 |
Energy sales | $ | 86,186,684 | |
RECs and other incentives | 15,409,263 | |
Investment Management revenue | 1,918,911 | |
Other revenue | 7,505,530 | |
Contract amortization, net | (10,529,266) | |
Total revenue | 100,491,122 | |
Less: Contract amortization, net | 10,529,266 | |
Less: Lease revenue | (6,025,782) | |
Less: Investment, dividend and interest income | (7,511,660) | |
Total revenue from contracts with customers | $ | 97,482,946 | |
| | | | | | | | | | | | | | | |
| (in thousands) | | | | | For the year ended December 31, 2023 | | For the period from May 19, 2022 through December 31, 2022 |
| Energy sales | | | | | $ | 138,530 | | | $ | 86,187 | |
| RECs and other incentives | | | | | 20,771 | | | 15,409 | |
| Investment Management revenue | | | | | 13,490 | | | 1,919 | |
| Other revenue | | | | | 8,434 | | | 7,506 | |
| Contract amortization, net | | | | | (8,060) | | | (10,529) | |
| Total revenue | | | | | 173,165 | | | 100,492 | |
| Less: Contract amortization, net | | | | | 8,060 | | | 10,529 | |
| Less: Lease revenue | | | | | (10,147) | | | (6,026) | |
| Less: Investment, dividend and interest income | | | | | (7,760) | | | (7,512) | |
| Total revenue from contracts with customers | | | | | $ | 163,318 | | | $ | 97,483 | |
Contract Amortization, net
Intangible assets and out-of-market contracts recognized from PPAsPPA and REC contracts assumed through acquisitions related to the sale of energy in future periods for which the fair value has been determined to be less (more) than market are amortized to revenue over the term of each underlying contract on a straight-line basis.
Contract Balances
Company billing practices are dictated by the contract terms and are typically done in arrears based upon the amount of power delivered in the prior period.
The Company did not record any contract assets as of December 31, 2023 and 2022, as none of its rights to payment were subject to a particular event other than passage of time. Included within the Accounts receivable balance on the Consolidated Balance Sheet, the Company had a receivable balanceSheets are balances of $19.9 million and $19.0 million related to contracts with customers as of December 31, 2022.2023 and 2022, respectively. The Company'sCompany had a receivable balance related to contracts with customersof $25.1 million as of May 19, 2022 was $25.1 million.2022.
The Company has contract liabilities related to amounts received in advance from certain PPA customers upon the related solar projects reaching COD. TheAs of December 31, 2023, the Company recorded $3.6 million of contract liabilities in Other noncurrent liabilities in the Consolidated Balance Sheets. As of December 31, 2022, the Company recorded $0.7 million of contractscontract liabilities as of December 31, 2022.in Other current liabilities in the Consolidated Balance Sheets. The Company’s amortization due to contract liabilities waswere not material for the year ended December 31, 2023 and the period from May 19, 2022 through December 31, 2022.
Costs to Obtain a Contract
The Company’s incremental costs of obtaining a contract (i.e., commissions) are recognized as an asset if the entity expects to recover them. These costs are amortized over the expected period of benefit of the related contracts. The Company has capitalized $3.9 million and $1.6 million inof costs to obtain a contract as of December 31, 2023 and 2022, respectively. The Company’s amortization related to costs to obtain a contract were not material for the year ended December 31, 2023, and the period from May 19, 2022 through December 31, 2022.
Remaining Performance Obligations
Remaining performance obligations represent fixed contracted revenue related to the Company's commitment to deliver a certain number of RECs in the future that has not been recognized, which includes amounts that will be billed and recognized as revenue in future periods. As of December 31, 2022,2023, the Company had $19.1$12.2 million of remaining performance obligations. The following table includes the approximate amounts expected to be recognized related to remaining performance obligations as of December 31:
| | | | | |
| (in thousands) | Amount |
| 2024 | $ | 4,993 | |
| 2025 | 1,987 | |
| 2026 | 1,855 | |
| 2027 | 788 | |
| 2028 | 788 | |
| Thereafter | 1,816 | |
| Total | $ | 12,227 | |
| | | | | |
| Amount |
| 2023 | $ | 6,898,932 | |
| 2024 | 4,993,097 | |
| 2025 | 1,987,489 | |
| 2026 | 1,855,290 | |
| 2027 | 788,102 | |
| Thereafter | 2,604,233 | |
| Total | $ | 19,127,143 | |
Note 5. Variable Interest Entities
Consolidated Variable Interest Entities
As described in Note 2. Significant Accounting Policies, theThe Company assesses entities for consolidation in accordance with ASC 810 and consolidates entities that are VIEs for which the Company has been designated as the primary beneficiary. The Company did not recognize any gain or loss on the initial consolidation of any of its VIEs.
The Company through various wholly-ownedwholly owned subsidiaries, is the managing member in 15 tax equity partnerships where the other members are Tax Equity Investors under tax equity financing facilities. Tax Equity Investors are passive investors, usually large tax-paying financial entities such as banks, insurance companies and utility affiliates that use these investments to reduce future tax liabilities. Refer to Note 16.17. Noncontrolling Interests and Redeemable Noncontrolling Interests for further discussion. These entities generate income through renewable energy and sustainable development projects primarily within North America. The entities represent a diversified portfolio of income-producing renewable energy power facilities that sell long-term electricity contracts to offtakers with high credit quality, such as utilities, municipalities, and corporations. The Company has determined that these tax equity partnerships are VIEs. Additionally, through its role as managing member of these VIEs, the Company has the power to direct the activities that most significantly impact the economic performance of these VIEs. In addition, the Company has the obligation to absorb losses or the right to receive benefits that could potentially be more than insignificant to the VIEs.
As of December 31, 2023 and 2022, the Company consolidated each tax equity partnership for which it is the managing member and considered the primary beneficiary. TheAs of December 31, 2023, the assets and liabilities of the consolidated tax equity partnerships totaled approximately $1.5 billion and $283.4 million, respectively. As of December 31, 2022, the assets and liabilities of the consolidated tax equity partnerships totaled approximately $1.3 billion and $215.3 million, respectively, as of December 31, 2022.respectively. The assets largely consisted of property, plant and equipment, and the liabilities primarily consisted of the out-of-market contracts.
Unconsolidated Variable Interest Entities
Prior to the sale of GREC’s interest in GDEV on November 18, 2022, GDEV was a consolidated subsidiary of the Company. In October 2020, GDEV was launched to make private equity and development capital investments in the sustainable infrastructure industry. Prior to the Acquisition, GREC made a direct equity investment in GDEV. As the initial investor, GREC was awarded a 10.00% carried interest participation in GDEV GP, GDEV’s general partner. The amended and restated limited partnership agreement of GDEV provide for a 20.00% carried interest over an 8.00% hurdle, subject to side letter agreements. On May 19, 2022, in conjunction with the Acquisition and specifically the acquisition of a 75.00% equity interest stake in GDEV GP, the Company assumed GDEV GP's additional commitment to GDEV and gained control over GDEV GP under the voting interest model. Additionally, the Company, through GDEV GP’s role as general partner of the GDEV partnership, assumed operational control over GDEV. As a result, the Company has determined that GDEV is a VIE. Prior to the transaction, GREC had an equity interest of approximately 7.37% in GDEV (fair value of approximately $3.8 million as of May 19, 2022). As a result of the acquisition of 75.00% of the equity interests in GDEV GP, the Company acquired an additional 2.80% equity interest in GDEV (fair value of approximately $1.4 million as of May 19, 2022). Additionally, certain officers and other members of management of the Company had prior to the Acquisition and still have an aggregate equity interest of less than 1.00% in GDEV, and an employee of the Company holds the remaining 25.00% of the equity interest in GDEV GP. As a result of GDEV GP’s control over GDEV, in combination with the resulting equity interest the Company and its officers and management had in GDEV, the Company previously determined that it was the primary beneficiary of GDEV. As a result, the results of operations of GDEV were consolidated.
As previously discussed in Note 2. Significant Accounting Policies, GDEV presents its stand-alone financial statements in accordance with ASC 946. In accordance with ASC 946, when a company that follows ASC 946 is consolidated into financial
statements of a company that does not follow ASC 946, the results of operations and statement of position of the investment company shall continue to be presented in accordance with ASC 946. As such, the results of operations and statement of position of GDEV were presented in accordance with ASC 946.
On November 18, 2022, GREC sold its investment in GDEV to an unrelated third party. As of December 31, 2022,2023, GDEV GP held 3.70%2.80% of the interests in GDEV. The Company has determined that it is no longer the primary beneficiary of GDEV. Therefore, the Company no longer consolidates GDEV. See Note 2. Significant Accounting Policies for additional information on the deconsolidation. After the deconsolidation, management has determined that the Company can still exert significant influence over operating and financial policies because of its ownership of GDEV GP. Accordingly, the Company accounts for its investment in GDEV as an equity method investment and has elected the fair value option as management deems fair value to be more relevant than historical cost. The Company’s maximum exposure to loss as a result of its involvement with GDEV is equal to $2.5$3.3 million, which is the sum of the Company’s existing investment in GDEV and the remaining commitments to GDEV, less the portion attributable to the noncontrolling interest in GDEV GP.
On November 15, 2022, the Company, through its majority ownedmajority-owned subsidiary GDEV GP II, made an investment in GDEV II totaling $0.3$0.7 million. The Company has determined that GDEV II is a VIE but that it is not the primary beneficiary. Therefore, the Company does not consolidate GDEV II. The Company can exert significant influence over operating and financial policies because of its ownership of GDEV GP II, GDEV II’s general partner. Accordingly, GDEV GP II, which is a consolidated subsidiary of the Company, accounted for its investment in GDEV II as an equity method investment and elected the fair value option as management deems fair value to be more relevant than historical cost. The Company’s maximum exposure to loss as a result of its involvement with GDEV II is $1.5$2.7 million, which is GDEV GP II’s total capital commitment to GDEV II, less the portion of the capital commitment attributable to the noncontrolling interest in GDEV GP II.
During February 2016, Aurora Solar was formed.formed to develop, construct, own, finance, and operate a portfolio of 19 solar projects. As of December 31, 2022,2023, the Company’s investment represented approximately 49.00% of Aurora Solar’s issued and outstanding common shares. The Company determined that Aurora Solar is a VIE but that it is not the primary beneficiary because it does not have the power to direct the activities that most significantly impact Aurora Solar. The Company can exert significant influence over operating and financial policies because of its ownership interest in Aurora Solar. Accordingly, the Company accounts for its investment in the common shares of Aurora Solar as an equity method investment and has elected the fair value option as management deems fair value to be more relevant than historical cost. The Company’s maximum exposure to loss is equal to the value of its investment in Aurora Solar.
During September 2021, OYA, previously OYA Solar, was formed. As of December 31, 2022,2023, the Company’s investment represented approximately 50.00% of OYA Solar’sOYA’s issued and outstanding equity shares. The Company determined that OYA Solar is a VIE but that it is not the primary beneficiary because it does not have the power to direct the activities that most significantly impact OYA Solar.OYA. The Company can exert significant influence over operating and financial policies because of its ownership interest in OYA Solar.OYA. Accordingly, the Company accounts for its investment in the preferred shares of OYA Solar as an equity method investment and has elected the fair value option as management deems fair value to be more relevant than historical cost. The Company’s maximum exposure to loss as of December 31, 2022,2023, includes the current value of its investment in OYA Solar, the Company’s remaining unfunded commitments to OYA Solar of $3.9 million, and the guaranteed amounts discussed in the following paragraphs. Pursuant to the amended and restated limited liability company agreement of OYA, Solar, the other 50.00% member has indemnified the Company against any draws or demands under these guarantees. The Company is not able to quantify its exposure to loss as a result of certain of these guarantees as noted below. Since the Company has elected the fair value option to account for its investment in the preferred shares of OYA, the Company is also required to measure all of its other financial interests in OYA at fair value, including these guarantees. As of December 31, 2023 and 2022, the fair value of the guarantees is included within the fair value of the investment.
On October 26, 2023, OYA, an unconsolidated investment of the Company, sold the membership interests in nine of its underlying projects. The Company considers it remote that it would be requiredreceived proceeds of $3.7 million as a result of this sale pursuant to make payments under anya sale proceeds sharing agreement between the Company, OYA’s parent company, and other financing parties. The impact of these guarantees.this sale was taken into consideration in determining the fair value of the Company’s investment in OYA as of December 31, 2023.
ThreeFour subsidiaries of OYA Solar have entered into tax equity partnerships with investor members. The Company, along with the parent company of the other 50.00% member of OYA, Solar, provided guarantees to the tax equity investor members in three of these partnerships for the payment and performance of all obligations of these subsidiaries under the partnership documents as well as affiliate contracts. In October 2023, in association with the sale of certain projects, two of these arrangements were terminated prior to the tax equity investor members are required to make demand for payment or performanceinvestor’s making any capital contributions, resulting in the termination of the guaranteed obligations by the parent company of the other 50.00% member prior to making a demand from the Company for payment or performance of the guaranteed obligations. Two of the three guarantees do not have maximum liability amounts, and therefore the Company is not able to quantify the maximum potential amount of future payments (undiscounted) that the Company could be required to make under theassociated guarantees. Under the third guarantee, the maximum potential amount of future payments (undiscounted) that the Company could be required to make under the guarantee is $21.3$18.8 million, with certain exceptions in which case the limit would not apply. The guaranteesguarantee will remain in full force and effect untiluntil: (1) the termination of the limited liability company agreementsagreement of the tax equity partnerships,partnership, (2) the transfer of the tax equity investor members’ membership interests, and/or (3) the obligations under the guaranteesguarantee are performed in full, depending on the specific terms of the guarantee. The Company has not recorded a liability for these guarantees.
In addition, certain subsidiaries of OYA Solar have entered into loantwo separate financing agreements with certain financial institutions. The Company has provided guarantees of certain obligations under the loan agreements upon the occurrence and continuance of a
trigger event. The parent company of the other 50.00% member of OYA Solar has also provided a guarantee to the financial institutions, and the Company is only obligated to perform in the event that the parent company of the other 50.00% member fails to perform under its guarantees. The guarantees do not have maximum liability amounts, and therefore, the Company is not able to quantify the maximum potential amount of future payments (undiscounted) that the Company could be required to make under these guarantees. The subsidiaries of OYA currently have outstanding loans with a principal amount of $33.4 million as of December 31, 2023. The guarantees are expected to terminate on the maturity dates of the loans in 2028 and 2029, and2029.
On August 22, 2023, the Company has not recordedprovided an additional guarantee to one of the financial institutions in which the Company agreed to fund remaining construction costs for certain underlying projects in the maximum amount of $18.2 million as well as excess construction loans upon term conversion in the maximum amount of $1.2 million. On October 4, 2023, the Company funded $1.2 million of construction costs pursuant to a liability for these guarantees.call under this guarantee. The Company recovered $1.0 million of this amount through the sale of nine of the projects previously owned by OYA on October 26, 2023. The inflows and outflows associated with this guarantee are incorporated in the valuation of the investment. In association with the sale, this guarantee was terminated.
Note 6. Fair Value Measurements and Investments
Authoritative guidance on fair value measurements defines fair value as the price that would be received to sell an asset or paid to transfer a liability in the principal or most advantageous market in an orderly transaction between marketplace participants. This guidance also establishes a framework for classifying the inputs used to determine fair value into three levels within a hierarchy. Refer to Note 2. Significant Accounting Policies for
The following table presents the definitions of eachfair values of the three levels.Company's financial assets and liabilities as of December 31, 2023 and the basis for determining their fair values:
| | | | | | | | | | | | | | | | | | | | | | | |
| Fair Value as of December 31, 2023 |
| (in thousands) | Level 1 | | Level 2 | | Level 3 | | Total |
| Derivative assets | $ | — | | | $ | 142,168 | | | $ | — | | | $ | 142,168 | |
| Derivative liabilities | — | | | (5,833) | | | — | | | (5,833) | |
| | | | | | | |
| Equity method investments | — | | | — | | | 94,878 | | | 94,878 | |
| Contingent consideration | — | | | — | | | (42,307) | | | (42,307) | |
| Total | $ | — | | | $ | 136,335 | | | $ | 52,571 | | | $ | 188,906 | |
The following table presents the fair values of the Company's financial assets and liabilities as of December 31, 2022 and the basis for determining their fair values:
| | Fair value as of December 31, 2022 | |
| Level 1 | | Level 2 | | Level 3 | | Total |
| Fair Value as of December 31, 2022 | | | Fair Value as of December 31, 2022 |
| (in thousands) | | (in thousands) | Level 1 | | Level 2 | | Level 3 | | Total |
| Derivative assets | Derivative assets | | $ | — | | | $ | 195,839,516 | | | $ | — | | | $ | 195,839,516 | |
| | Equity method investments | Equity method investments | | — | | | — | | | 92,554,266 | | | 92,554,266 | |
| | Equity method investments | |
| | Equity method investments | |
| Contingent consideration | Contingent consideration | | — | | | — | | | (75,700,000) | | | (75,700,000) | |
| Total | Total | | $ | — | | | $ | 195,839,516 | | | $ | 16,854,266 | | | $ | 212,693,782 | |
The following table reconciles the beginning and ending balances for instruments that are recognized at fair value in the consolidated financial statementsConsolidated Financial Statements as of December 31, 2023 using significant unobservable inputs:
| | | | | | | | | | | | | | | | | | | | | | | | | | | | | | | | | | | | | | | | | |
| Balance as of May 19,
2022 | | Acquired and consolidated in the Acquisition | | Purchases | | Sales and deconsolidation | | Unrealized gain on investments, net | | Change in contingent consideration | | Balance as of December 31,
2022 |
| Other investments | $ | 3,846,586 | | | $ | 38,587,628 | | | $ | 29,326,673 | | | $ | (73,632,120) | | | $ | 1,871,233 | | | $ | — | | | $ | — | |
| Equity method investments | 86,578,481 | | | — | | | 5,474,361 | | | 1,974,178 | | | (1,472,754) | | | — | | | 92,554,266 | |
| Contingent consideration | — | | | (73,600,000) | | | — | | | — | | | — | | | (2,100,000) | | | (75,700,000) | |
| Total | $ | 90,425,067 | | | $ | (35,012,372) | | | $ | 34,801,034 | | | $ | (71,657,942) | | | $ | 398,479 | | | $ | (2,100,000) | | | $ | 16,854,266 | |
| | | | | | | | | | | | | | | | | | | |
| (in thousands) | Equity method investments | | Contingent consideration | | | | Total |
| Balance as of December 31, 2022 | $ | 92,554 | | | $ | (75,700) | | | | | $ | 16,854 | |
| | | | | | | |
| Purchases | 5,298 | | | — | | | | | 5,298 | |
| Return of capital | (3,906) | | | — | | | | | (3,906) | |
| Unrealized gain on investments, net | 932 | | | — | | | | | 932 | |
| Change in contingent consideration | — | | | 603 | | | | | 603 | |
| Reclassification of participating Earnout Shares | — | | | 32,790 | | | | | 32,790 | |
| | | | | | | |
| Balance as of December 31, 2023 | $ | 94,878 | | | $ | (42,307) | | | | | $ | 52,571 | |
The Company does not have any non-financial assets or liabilities measured at fair value as of December 31, 2022.
The Company uses several different valuation techniques to measure the fair value of assets and liabilities. Certain financial instruments may be valued using multiple inputs, including discount rates, expected cash flows, and other inputs. The assessment of the significance of any particular input to the fair value measurement requires judgment and may affect the fair value measurement of assets and liabilities and the placement of those assets and liabilities within the fair value hierarchy levels. Non-performance risk, including the consideration of a credit valuation adjustment, is also considered in the determination of fair value for all assets and liabilities measured at fair value.2023. There were no transfers between Levels 1, 2, or 3 for the period from May 19, 2022 throughyear ended December 31, 2022.2023.
Derivative assets and liabilities—liabilities
The Company estimates the fair value of its interest rate derivatives using a discounted cash flow valuation technique based on the net amount of estimated future cash flows related to the agreements. The primary inputs used in the fair value measurement include the contractual terms of the derivative agreements, current interest rates, and credit spreads. The significant inputs for the resulting fair value measurement are market-observable inputs, and thus the swaps are classified as Level 2 in the fair value hierarchy.
Equity method investments—investments
In the table above, certain equity method investments may be valued at the purchase price for a period of time after an acquisition as the best indicator of fair value. In addition, certain valuations of investments may be entirely or partially derived by reference to observable valuation measures for a pending or consummated transaction. In the absence of quoted prices in active markets, the Company uses a variety of techniques to measure the fair value of its investments. The methodologies incorporate the Company’s assumptions about the factors that a market participant would use to value the investment. The various unobservable inputs used to determine the Level 3 valuations may have similar or diverging impacts on valuation. Significant increases and decreases in these inputs in isolation and interrelationships between
those inputs could result in significantly higher or lower fair value measurements.
The following table quantifies the significant unobservable inputs used in determining the fair value of equity method investments as of December 31, 2022:2023. The weighted averages are calculated based on the relative fair value of each investment as of December 31, 2023:
| | | | | | | | |
| Unobservable Input | | Input/Range |
| Discount rate | | 6.80%-7.80% (median 7.30%7.8%-11.0% (weighted average 8.3%) |
| kWh production | | 0.50%0.5%-0.6% annual degradation in production (weighted average 0.5%) |
| Potential leverage and estimated remaining useful life | | 29.529.0-34.2 years (weighted average 30.0 years) |
Prior to the deconsolidation of GDEV as discussed in Note 2. Significant Accounting Policies, the Company’s investments included the results of consolidating the financial position and results of operations of GDEV. The Company, through its majority ownedmajority-owned subsidiary GDEV GP, continues to hold an investment in GDEV as of December 31, 2023 and 2022. The Company accounts for this investment as an equity method investment.
As discussed in Note 5. Variable Interest Entities, the Company through its majority ownedmajority-owned subsidiary GDEV GP II made an investment in GDEV II on November 15, 2022. The Company accounts for this investment as an equity method investment.
The
As of December 31, 2023, the Company has unfunded commitments to GDEV I and GDEV II of $1.0$0.3 million and $1.3 million, respectively. The investments in GDEV I and GDEV II represent investments in a partnership in which no partner is permitted to make a withdrawal of any of its capital contributions. GDEV GP and GDEV GP II are required to cause the respective partnerships to distribute, as distributions, amounts available to the partners within 90 days of the receipt of amounts available for distribution in the sole discretion of the GDEV GP and GDEV GP II, respectively.
As of December 31, 2023, the value of the Company's investments in OYA, Aurora Solar, GDEV I and GDEV II, its equity method investments, were $16.2 million, $73.0 million, $4.1 million and $1.6 million, respectively. As of December 31, 2022, the value of the Company's investments in OYA, Aurora Solar, GDEV I and GDEV II, its equity method investments, were $18.6 million, $71.3 million, $2.3 million and $0.3 million, respectively. Equity method investments are recorded to Investments, at fair value on the Consolidated Balance Sheet as ofSheets. During the year ended December 31, 2022.2023, the Company recorded an unrealized gain of $0.9 million due to an unrealized gain of $1.6 million on Aurora Solar and $1.1 million on GDEV I, offset by an unrealized loss of $1.8 million on OYA. During the period from May 19, 2022 through December 31, 2022, the Company recorded a netan unrealized gain on investments of $0.4 million due to unrealized gains of $1.9 million related to GDEV from May 19, 2022 to November 17, 2022, prior to deconsolidation, and an immaterial gain related to GDEV GP’s investment in GDEV from November 18, 2022 to December 31, 2022, offset by an unrealized loss of $1.7 million on Aurora Solar. The unrealized gain isUnrealized gains and losses are recorded in Unrealized gain on investments, net on the Consolidated StatementStatements of Operations.
Contingent consideration—consideration
The Company estimates the fair value of its contingent consideration associated with the Acquisition based on the likelihood of payment related to the contingent clause and the date when payment is expected to occur. The contingent consideration is reflected in Contingent consideration included in noncurrent liabilities on the Consolidated Balance Sheet. Sheets.
For the year ended December 31, 2023, the Company recorded a decrease in fair value of contingent consideration of $0.6 million as a decrease in General and administrative expenses on the Consolidated Statements of Operations. As of December 31, 2023, $32.8 million of contingent consideration was settled with the participation of a certain amount of Earnout Shares, which were issued in connection with the Acquisition. The amount was reclassified from Contingent consideration to Common shares, par value, and Additional paid-in capital, as well as Redeemable common shares, par value and Redeemable common shares, additional paid-in capital on the Consolidated Balance Sheets. Refer to Note 18. Equity for further detail.
For the period from May 19, 2022 through December 31, 2022, the Company recorded a changean increase in fair value of contingent consideration of $2.1 million as an increase in General and administrative expenses on the Consolidated StatementStatements of Operations.
The fair value of the contingent consideration is measured based on significant unobservable inputs, including the contractual payment amount due upon reaching the designated thresholds, the discount rate, and the date when payment is expected and is classified as Level 3 in the fair value hierarchy. The various unobservable inputs used to determine the Level 3 valuation may have similar or diverging impacts on valuation. Significant increases and decreases in these inputs in isolation and interrelationships between those inputs could result in significantly higher or lower fair value measurements.
The following quantifies the significant unobservable inputs used to determine the fair value of contingent consideration as of December 31, 2022:2023:
| | | | | | | | |
| Unobservable Input | | Input/Range |
| | |
| | |
| | |
| | |
| | |
| | |
| Risk-Free Rate Over Earnout Term | | 4.10%4.0% |
| Revenue Discount Rate | | 11.00%9.5% |
| Annualized Revenue Volatility | | 42.50%40.0% |
| Annualized Share Price Volatility | | 27.50%30.0% |
| Quarterly Revenue / Share Price Correlation | | 45.00%40.0% |
Note 7. Notes Receivable
The Company’s notes receivable consists of the following as of December 31, 2023 and 2022:
| | | | | | | | | | | | | | | | | | | | | | | | | | | | | |
| (dollars in thousands) | As of December 31, 2023 | | As of December 31, 2022 | | Year of origination | | Interest rate | | Maturity date |
| Notes receivable, current | | | | | | | | | |
| Cider | $ | 25,749 | | | $ | 41,864 | | | 2022 | | 8.00% | | 6/30/2024(1) |
| OYA | — | | | 8,491 | | | 2022 | | 9.00% | | 2/17/2023(2) |
| Shepherds Run | 2,742 | | | 8,751 | | | 2020 | | 8.00% | | 3/31/2024(1) |
| Total notes receivable, current | $ | 28,491 | | | $ | 59,106 | | | | | | | |
| Notes receivable, noncurrent | | | | | | | | | |
| New Market | $ | 5,008 | | | $ | 5,008 | | | 2019 | | 9.00% | | 9/30/2022(3) |
| SE Solar | 5,010 | | | 5,010 | | | 2019 | | 9.00% | | 5/31/2023(4) |
| Kane Warehouse | 166 | | | 276 | | | 2015 | | 10.25% | | 2/24/2025 |
| Total notes receivable, noncurrent | $ | 10,184 | | | $ | 10,294 | | | | | | | |
Loan reserve(5) | (2,000) | | | — | | | | | | | |
| Total notes receivable | $ | 36,675 | | | $ | 69,400 | | | | | | | |
(1)The note receivable agreements were amended with an extension to the agreements on February 6, 2024.
(2)The note receivable was paid in full on February 17, 2023.
(3)Option for purchase agreement exercised on September 30, 2022. The parties involved are working in good faith to enter into a purchase agreement.
(4)The parties involved are working in good faith on an extension to the agreement.
(5)As of December 31, 2023, SE Solar and New Market have not been repaid. As such, the Company has recorded a reserve representing an allowance for credit losses for the estimated uncollectible portion of these notes in the amount of $2.0 million for the year ended December 31, 2023 and is recorded within Direct operating costs on the Consolidated Statements of Operations.
The notes receivable, current are recorded within Notes receivable, current on the Consolidated Balance Sheets. The notes receivable, noncurrent are recorded within Other noncurrent assets on the Consolidated Balance Sheets. Notes receivable are recorded at amortized cost and exclude interest receivable. As of December 31, 2023, interest receivables of $6.3 million and $3.9 million, were recorded within Other current assets and Other noncurrent assets, respectively, on the Consolidated Balance Sheets. As of December 31, 2022, interest receivables of $2.4 million and $3.0 million were recorded within Other current assets and Other noncurrent assets, respectively, on the Consolidated Balance Sheets.
Note 7.8. Property, Plant and Equipment
Property, plant and equipment, net consists of the following:
| | | | | | | | | | | |
| (in thousands) | December 31, 2023 | | December 31, 2022 |
| Land | $ | 23,473 | | | $ | 16,321 | |
| Plant and equipment | 2,169,573 | | | 1,874,201 | |
| Asset retirement obligation | 34,003 | | | 30,483 | |
| Finance right-of-use asset | 65 | | | — | |
| Other | 262 | | | 320 | |
| Total property, plant and equipment | $ | 2,227,376 | | | $ | 1,921,325 | |
| Accumulated depreciation | (93,499) | | | (31,619) | |
| Property, plant and equipment, net | $ | 2,133,877 | | | $ | 1,889,706 | |
| | | | | |
| December 31, 2022 |
Land | $ | 16,320,841 | |
Plant and equipment | 1,874,201,117 | |
Asset retirement obligation | 30,483,255 | |
Other | 319,536 | |
Total property, plant and equipment | $ | 1,921,324,749 | |
Accumulated depreciation | (31,619,220) | |
Property, plant and equipment, net | $ | 1,889,705,529 | |
December 31, 2023, Property, plant and equipment, net, includes construction-in-progress of $439.4 million, and construction-in-progress includes $106.3 million of development costs. As of December 31, 2022, Property, plant and equipment, net, includes construction-in-progress of $396.2 million. Construction-in-progress$569.4 million, and construction-in-progress includes $116.6 million of development costs.
Depreciation expense was $113.9 million and $31.6 million for the year ended December 31, 2023 and the period from May 19, 2022 through December 31, 2022, respectively. Depreciation expense is recorded within Depreciation, amortization and accretion on the Consolidated Statements of Operations. The Company engaged in three wind repower projects where the existing assets were retrofitted with new and/or refurbished technology, including erecting taller, more efficient wind turbines to increase productivity. Depreciation of fixed assets replaced is accelerated between the mobilization milestone date in the related EPC contract and the date of de-electrification of the project site. Accelerated depreciation related to the three projects resulted in $51.9 million of additional depreciation during the year ended December 31, 2023.
During the year ended December 31, 2023, the Company recognized impairment of long-lived assets of $59.3 million associated with a certain renewable energy asset of which $7.3 million was associated with the plant and equipment asset, and the remainder of which was associated with the related favorable PPA contracts. The impairment analysis reviews certain qualitative factors as well as the results of long-term operating expectations and the project’s carrying value to determine if impairment indicators are present. The impairment analysis indicated that the projected future cash flows for the certain project no longer supported the recoverability of the carrying value of the related long-lived assets. The fair value of the asset was determined using an income approach by applying a discounted cash flow methodology to the updated long-term budget for the asset. The income approach included key inputs such as forecasted merchant power prices, operations and maintenance expense, and discount rates. The resulting fair value is a Level 3 fair value measurement. This charge was recorded to the Company’s IPP segment. The Company did not recognize any impairment charges on long-lived assets for the period from May 19, 2022 through December 31, 2022 was $31.6 million, and is recorded within Depreciation, amortization and accretion on the Consolidated Statement2022.
Note 8.9. Goodwill, Other Intangible Assets and Out-of-market Contracts
Goodwill
As of May 19, 2022, the closing date of the Acquisition, and as of December 31, 2023 and 2022, goodwill totaled $221.3 million.million and $221.3 million, respectively. The Company did not recognize any impairment charges on goodwill for the year ended December 31, 2023 or the period from May 19, 2022 through December 31, 2022.
Other Intangible Assets and Out-of-market Contracts
The Company has two categories of intangibles, those related to the Acquisition discussed in Note 3. Acquisitions, and those related to the Company's consolidated subsidiaries resulting from PPA and REC contracts.
Other intangible assets as of December 31, 2023 consisted of the following:
| | Gross carrying amount | | Accumulated amortization | | Net intangible assets as of December 31, 2022 |
| (in thousands) | | (in thousands) | Gross carrying amount | | Accumulated amortization | | Net intangible assets as of December 31, 2023 |
| PPA contracts | PPA contracts | $ | 422,176,259 | | | $ | (18,459,864) | | | $ | 403,716,395 | |
| REC contracts | REC contracts | 46,235,383 | | | (1,164,753) | | | 45,070,630 | |
| Trademarks | Trademarks | 2,800,000 | | | (466,667) | | | 2,333,333 | |
| Channel partner relationships | Channel partner relationships | 94,700,000 | | | (6,199,394) | | | 88,500,606 | |
| Other intangible assets | Other intangible assets | 1,000,000 | | | — | | | 1,000,000 | |
| Total intangible assets, net | Total intangible assets, net | $ | 566,911,642 | | | $ | (26,290,678) | | | $ | 540,620,964 | |
Amortization expense related to intangible assets reported on the Consolidated Balance Sheets was $40.8 million for the year ended December 31, 2023, which included $31.6 million of Contract amortization, net that was recorded as a reduction to revenue for favorable PPA and REC contracts in the Consolidated Statements of Operations.
Other intangible assets as of December 31, 2022 consisted of the following:
| | | | | | | | | | | | | | | | | |
| (in thousands) | Gross carrying amount | | Accumulated amortization | | Net intangible assets as of December 31, 2022 |
| PPA contracts | $ | 422,176 | | | $ | (18,460) | | | $ | 403,716 | |
| REC contracts | 46,235 | | | (1,165) | | | 45,070 | |
| Trademarks | 2,800 | | | (467) | | | 2,333 | |
| Channel partner relationships | 94,700 | | | (6,198) | | | 88,502 | |
| Other intangible assets | 1,000 | | | — | | | 1,000 | |
| Total intangible assets, net | $ | 566,911 | | | $ | (26,290) | | | $ | 540,621 | |
Amortization expense related to intangible assets recorded as assets on the Consolidated Balance Sheets $26.3 million for the period from May 19, 2022 through December 31, 2022, which includes $19.6 million of Contract amortization, net that was recorded as a reduction to revenue for favorable PPA and REC contracts in the Consolidated StatementStatements of Operations.
The Company also has PPA and REC contracts that are held in an unfavorable position (out-of-market contracts), which consists of the following as of December 31, 2023:
| | | | | | | | | | | | | | | | | |
| (in thousands) | Gross carrying amount | | Accumulated amortization | | Net out-of-market contracts as of December 31, 2023 |
| PPA contracts | $ | (198,629) | | | $ | 13,203 | | | $ | (185,426) | |
| | | | | |
| REC contracts | (19,763) | | | 10,404 | | | (9,359) | |
| | | | | |
| Total out-of-market contracts, net | $ | (218,392) | | | $ | 23,607 | | | $ | (194,785) | |
The amounts recorded to out-of-market contracts are amortized to Contract amortization, net similar to favorable PPA and REC contracts. The Company recorded $23.5 million of contract amortization contra-expense as an increase to revenue related to out-of-market contracts during the year ended December 31, 2023. This included $9.0 million in out-of-market contract retirements and $14.5 million of contract amortization. Of the $9.0 million in out-of-market contract retirements, $5.4 million is attributable to an unfavorable PPA contract associated with a project for which the construction is no longer probable, and $3.6 million is attributable to the termination of an unfavorable REC contract.
PPA and REC contracts that are held in an unfavorable position (out-of-market contracts) consists of the following as of December 31, 2022:
| | Gross carrying amount | | Accumulated amortization | | Net out-of-market contracts as of December 31, 2022 |
| (in thousands) | | (in thousands) | Gross carrying amount | | Accumulated amortization | | Net out-of-market contracts as of December 31, 2022 |
| PPA contracts | PPA contracts | $ | (198,445,904) | | | $ | 4,881,935 | | | $ | (193,563,969) | |
PPA contracts - signed MIPA assets(1) | PPA contracts - signed MIPA assets(1) | (5,401,517) | | | — | | | (5,401,517) | |
| REC contracts | REC contracts | (19,763,291) | | | 4,213,416 | | | (15,549,875) | |
REC contracts - signed MIPA assets(1) | REC contracts - signed MIPA assets(1) | (3,596,960) | | | — | | | (3,596,960) | |
| Total out-of-market contracts, net | Total out-of-market contracts, net | $ | (227,207,672) | | | $ | 9,095,351 | | | $ | (218,112,321) | |
(1)Signed MIPA assets are defined as assets that have an executed contractual MIPA or Purchase and Sale Agreement but have not yet closed.
The amounts recorded to out-of-market contracts are amortized to Contract amortization, net similar to favorable PPA and REC contracts. The Company recorded $9.1 million of contract amortization contra-expense as an increase to revenue related to out-of-market contracts during the period from May 19, 2022 through December 31, 2022.
The net impact ofContract amortization on PPA and REC contractscontract intangible assets and out-of-market contracts is recorded within Contract amortization, net on the Consolidated Statements of Operations. Amortization expense on channel partner relationships and trademark intangible assets is recorded within Depreciation, amortization and accretion on the Consolidated Statements of Operations.
Amortization expense related to the Company's finite-lived intangible assets and liabilities (out-of-market contracts) was a$17.3 million for the year ended December 31, 2023. This includes $8.1 million of net $10.5contract amortization on PPA and REC contract intangible assets and out-of-market contracts, and $9.2 million of amortization expense duringon channel partner relationships and trademark intangible assets.
Amortization expense related to the Company’s finite-lived intangible assets and liabilities (out-of-market contracts) was $17.2 million for the period from May 19, 2022 through December 31, 2022, respectively. This includes $10.5 million of net contract amortization on PPA and REC contract intangible assets and out-of-market contracts and $6.7 million of amortization expense on channel partner relationships and trademark intangible assets.
As discussed in Note 8. Property, Plant and Equipment, the Company determined that there was an impairment of an intangible asset contract and, as such, recorded a charge of $59.3 million associated with a certain renewable energy asset, of which is recorded as Contract amortization, net in$7.3 million was associated with the Consolidated Statementplant and equipment asset, and the remainder of Operations.which was associated with the related favorable PPA contracts.
Estimated future annual amortization expense, net for the above amortizable intangible assets and out-of-market contracts for the remaining periods through December 31, 20222023 as follows:
| | Amortization Expense |
| 2023 | $ | 26,911,723 | |
| (in thousands) | | (in thousands) | Amortization Expense |
| 2024 | 2024 | 28,529,561 | |
| 2025 | 2025 | 30,792,701 | |
| 2026 | 2026 | 30,931,996 | |
| 2027 | 2027 | 31,145,578 | |
| 2028 | |
| Thereafter | Thereafter | 174,197,084 | |
| Total | Total | $ | 322,508,643 | |
Note 9.10. Leases
Lessee Arrangements
The Company has site lease agreements with various entities for the properties where renewable energy facilities have been constructed which provide the right to own and operate the projects on land and rooftops. The Company’s most significant lease liabilities relate to real estate leases that have initial contract lease terms ranging from one to 50 years. Certain leases include renewal and termination options. The Company considered a number of factors when evaluating whether the options in its lease contracts were reasonably certain of exercise, such as importance of the lease to overall operations, costs to negotiate a new lease, and costs of equipment constructed on the land. Management included the impact of any renewal options that the Company deemed to be reasonably certain of being exercised in its measurement and classification of its leases.
Leases are classified as either operating or financing. For operating leases, the Company has recognized a lease liability equal to the present value of the remaining lease payments, and a ROU asset equal to the lease liability, subject to certain adjustments, such as for prepaid rents. The Company used its incremental borrowing rate to determine the present value of the lease payments. Operating leases result in a straight-line lease expense. The Company has determined that all of itsexpense, while finance leases that existed as of December 31, 2022 are operating leases.result in a front-loaded expense pattern.
There were no impairment indicators identified during the year ended December 31, 2023 or the period from May 19, 2022 through December 31, 2022 that required an impairment test for the Company’s ROU assets or other long-lived assets in accordance with ASC 360.
The components of lease expense and supplemental cash flow information related to leases for the periodperiods indicated are as follows:
| | | | | |
| Period from May 19, 2022 through December 31, 2022 |
| Lease cost | |
| Operating lease cost | $ | 6,110,415 |
| Short-term lease cost | 131,089 |
| Variable lease cost | 643,641 |
| Total lease cost | $ | 6,885,145 |
| |
| Other information | |
| Cash paid for amounts included in the measurement of lease liabilities | $ | 3,676,200 |
| Operating cash flows from operating leases | $ | (3,676,200) |
| ROU assets obtained in exchange for new operating lease liabilities | $ | 110,412,328 |
| Weighted average remaining lease term – operating leases | 28 years |
| Weighted average discount rate – operating leases | 6.73% |
| | | | | | | | | | | | | | | |
| (in thousands) | | | | | For the year ended December 31, 2023 | | For the period from May 19, 2022 through December 31, 2022 |
| Lease cost | | | | | | | |
| Finance lease cost | | | | | | | |
| Amortization of right-of-use assets | | | | | $ | 39 | | $ | — |
| Interest on lease liabilities | | | | | 11 | | — |
| Total finance lease cost | | | | | 50 | | — |
| Operating lease cost | | | | | 9,916 | | 6,110 |
| Short-term lease cost | | | | | 339 | | 131 |
| Variable lease cost | | | | | 1,525 | | 644 |
| Total lease cost | | | | | $ | 11,830 | | $ | 6,885 |
| | | | | | | |
| | | | | | | |
| | | | | | | |
| | | | | | | |
| | | | | | | |
| | | | | | | |
| | | | | | | |
| | | | | | | |
| | | | | | | |
| | | | | | | |
| | | | | | | |
| | | | | | | |
| | | | | | | |
The following table presents supplemental cash flow and other information related to our leases:
| | | | | | | | | | | |
| (dollars in thousands) | December 31, 2023 | | December 31, 2022 |
| Other information | | | |
Cash paid for amounts included in the measurement of lease liabilities(1) | $ | 7,975 | | $ | 3,676 | |
Operating cash flows from finance leases(1) | $ | (11) | | $ | — | |
Operating cash flows from operating leases(1) | $ | (7,908) | | $ | (3,676) | |
Financing cash flows from finance leases(1) | $ | (56) | | $ | — | |
| ROU assets obtained in exchange for new finance lease liabilities | $ | 88 | | $ | — | |
| ROU assets obtained in exchange for new operating lease liabilities | $ | 10,091 | | $ | 110,412 | |
| Weighted average remaining lease term – finance leases | 3.2 years | | N/A |
| Weighted average remaining lease term – operating leases | 28.3 years | | 28.0 years |
| Weighted average discount rate – finance leases | 5.69% | | — | % |
| Weighted average discount rate – operating leases | 6.61% | | 6.73 | % |
(1) Supplemental cash flow information presented for the year ended December 31, 2022 is attributable to the prorated period from May 19, 2022 (the date of the Acquisition) through December 31, 2022.
OperatingFor the year ended December 31, 2023 and the period from May 19, 2022 through December 31, 2022, operating lease cost includesincluded $0.7 million and $0.4 million, respectively, associated with leases embedded in PPAs for which no or de minimis payments are made. The Company estimates the fair value of the lease payments and grosses up both revenue and expense by this amount. OperatingFor the year ended December 31, 2023 and the period from May 19, 2022 through December 31, 2022, operating lease cost also includesincluded $0.8 million and $0.7 million, respectively, of lease cost capitalized to the cost of projects during development and construction.
The supplemental balance sheet information related to leases for the period isperiods indicated are as follows:
| | | | | |
| December 31, 2022 |
Operating leases | |
Operating lease assets | $ | 102,594,813 | |
| |
Operating lease liabilities, current | (2,193,343) | |
Operating lease liabilities, noncurrent | (101,281,144) | |
Total operating lease liabilities | $ | (103,474,487) | |
| | | | | | | | | | | |
| (in thousands) | December 31, 2023 | | December 31, 2022 |
| Operating leases | | | |
| Operating lease assets | $ | 108,606 | | | $ | 102,595 | |
| | | |
| Operating lease liabilities, current | (2,262) | | | (2,193) | |
| Operating lease liabilities, noncurrent | (108,406) | | | (101,281) | |
| Total operating lease liabilities | $ | (110,668) | | | $ | (103,474) | |
| | | |
| Finance leases | | | |
| Property, plant and equipment, at cost | $ | 65 | | | $ | — | |
| Accumulated depreciation | (13) | | | — | |
| Property, plant and equipment, net | 52 | | | — | |
| | | |
| Other current liabilities | (16) | | | — | |
| Other long-term liabilities | (37) | | | — | |
| Total finance lease liabilities | $ | (53) | | | $ | — | |
Operating lease assets and operating lease liabilities, current, are recorded in Other noncurrent assets and Other current liabilities, respectively, on the Consolidated Balance Sheet.Sheets. Finance lease assets and liabilities current and noncurrent are recorded in Property, plant and equipment, net, Other current liabilities and Other noncurrent liabilities, respectively, on the Consolidated Balance Sheets.
Maturities of the Company’s lease liabilities are as follows:
| | (in thousands) | |
| Year Ending | Year Ending | Operating Leases |
| 2023 | $ | 8,541,786 | |
| Year Ending | |
| Year Ending | | Operating Leases | | Finance Leases |
| 2024 | 2024 | 8,609,098 | |
| 2025 | 2025 | 8,538,998 | |
| 2026 | 2026 | 8,538,259 | |
| 2027 | 2027 | 8,573,244 | |
| 2028 | |
| Thereafter | Thereafter | 200,218,632 | |
| Total lease payments | Total lease payments | 243,020,017 | |
| Less: Imputed interest | Less: Imputed interest | (139,545,530) | |
| Present value of lease liabilities | Present value of lease liabilities | $ | 103,474,487 | |
Lessor Arrangements
A portion of the Company’s operating revenues are generated from delivering electricity and related products from owned solar and wind renewable energy facilities under PPAs in which the Company is the lessor. In addition, the Company has certain energy optimization service agreements that involve the use of a battery in which the Company is the lessor.
For these PPAs, revenue is recognized when electricity is delivered and is accounted for as rental income under the lease standard. The adoption of ASC 842 did not have an impact on the accounting policy for rental income from the Company’s PPAs in which it is the lessor. The Company elected the package of practical expedients available under ASC 842, which did not require the Company to reassess its lease classification from ASC 840.Topic 840, Other Assets and Deferred Costs. Additionally, the Company elected the practical expedient to not separate lease and non-lease components for lessors. This election allows energy (lease component) and RECs (non-lease components) under bundled PPAs to be accounted for as a singular lease unit of account under ASC 842. The Company’s PPAs do not contain any residual value guarantees or material restrictive covenants.
As a result of the adoption of ASC 842 on January 1, 2022, the Company does not expect that PPAs that it enters into in the future will meet the definition of a lease. The Company may enter into battery storage agreements or bundled solar and storage agreements in the future that may contain one or more lease components.
Certain of the Company’s PPAs related to its solar or wind generating plants qualify as operating leases with remaining terms through 2047. Certain agreements include renewal, termination or purchase options. Property subject to operating leases where the Company or one of its subsidiaries is the lessor is included in Property, plant and equipment, net on the Consolidated Balance SheetSheets, and rental income from these leases is included in Energy revenue on the Consolidated StatementStatements of Operations. Lease income is based on energy generation;generation, and therefore all rental income is variable under these leases. The variable lease
income related to these agreements for the year ended December 31, 2023 and the period from May 19, 2022 through December 31, 2022 was $10.1 million and $6.0 million, andrespectively. Variable lease income is included in Energy revenue on the Consolidated StatementStatements of Operations. As of December 31, 2023 and 2022, the Company’s solar and wind generating plants subject to these leases had a total carrying value of $61.7 million and $67.4 million.million, respectively.
Certain of the Company’s energy optimization service agreements qualify as operating leases with remaining terms through 2031. Lease income under these agreements is generally fixed and recognized on a straight-line basis over the term of the lease. The lease income related to these agreements for the period from May 19, 2022 throughyear ended December 31, 2022 were2023 was not material and is not expected to be material for the ensuing five years.
Note 10.11. Debt
The Company has entered into credit facilities and loan agreements through its subsidiaries, as described below.
| | Outstanding | | Interest rate | | Maturity date |
| GREC Entity HoldCo | | 74,196,983 | | | 1 mo. LIBOR + 1.75% | | June 20, 2025 |
| (dollars in thousands) | | (dollars in thousands) | Outstanding as of December 31, 2023 | | Outstanding as of December 31, 2022 | | Interest rate | | Maturity date |
GREC Entity HoldCo(1) | | GREC Entity HoldCo(1) | $ | 65,951 | | | $ | 74,197 | | | Daily SOFR + 1.85% | | June 20, 2025 |
| Midway III Manager LLC | Midway III Manager LLC | | 14,609,867 | | | 3 mo. LIBOR + 1.63% | | October 31, 2025 | Midway III Manager LLC | 13,932 | | | 14,610 | | 14,610 | | | 3 mo. SOFR + 1.73% | | 3 mo. SOFR + 1.73% | | September 28, 2025 |
| Trillium Manager LLC | Trillium Manager LLC | | 72,736,786 | | | 3 mo. LIBOR + 1.88% | | June 9, 2027 | Trillium Manager LLC | 68,785 | | | 72,737 | | 72,737 | | | Daily SOFR + 1.98% | | Daily SOFR + 1.98% | | June 9, 2027 |
| GB Wind Holdco LLC | | 122,684,036 | | | 3 mo. LIBOR + 1.38% | | November 22, 2027 |
GB Wind Holdco LLC(2) | | GB Wind Holdco LLC(2) | 50,408 | | | 122,684 | | | 3 mo. SOFR + 1.38% | | Various(3) |
| Greenbacker Wind Holdings II LLC | Greenbacker Wind Holdings II LLC | | 72,476,839 | | | 3 mo. LIBOR + 1.88% | | December 31, 2026 | Greenbacker Wind Holdings II LLC | 70,628 | | | 72,477 | | 72,477 | | | 3 mo. SOFR + 1.98% | | 3 mo. SOFR + 1.98% | | December 31, 2026 |
| Conic Manager LLC | Conic Manager LLC | | 24,356,358 | | | 3 mo. LIBOR + 1.75% | | April 1, 2028 | Conic Manager LLC | 23,363 | | | 24,356 | | 24,356 | | | 3 mo. SOFR + 1.75% | | 3 mo. SOFR + 1.75% | | August 8, 2026 |
| Turquoise Manager LLC | Turquoise Manager LLC | | 31,687,423 | | | 3 mo. LIBOR + 1.25% | | December 23, 2027 | Turquoise Manager LLC | 30,994 | | | 31,687 | | 31,687 | | | 3 mo. SOFR + 1.35% | | 3 mo. SOFR + 1.35% | | December 23, 2027 |
| Eagle Valley Clean Energy LLC | Eagle Valley Clean Energy LLC | | 35,112,342 | | | 1.91% | | January 2, 2057 | Eagle Valley Clean Energy LLC | 35,389 | | | 35,112 | | 35,112 | | | Various(4) | | Various(4) | | January 2, 2057 |
| Eagle Valley Clean Energy LLC (Premium financing agreement) | Eagle Valley Clean Energy LLC (Premium financing agreement) | | 1,063,438 | | | 6.99% | | November 30, 2023 | Eagle Valley Clean Energy LLC (Premium financing agreement) | — | | | 1,064 | | 1,064 | | | 6.99% | | 6.99% | | November 30, 2023(5) |
| Greenbacker Equipment Acquisition Company LLC | Greenbacker Equipment Acquisition Company LLC | | 6,500,000 | | | Prime + 1.00% | | March 31, 2023 | Greenbacker Equipment Acquisition Company LLC | — | | | 6,500 | | 6,500 | | | Prime + 1.00% | | Prime + 1.00% | | December 31, 2023(6) |
| ECA Finco I, LLC | ECA Finco I, LLC | | 19,756,803 | | | 3 mo. LIBOR + 2.25% | | February 25, 2028 | ECA Finco I, LLC | 18,563 | | | 19,757 | | 19,757 | | | 3 mo. SOFR + 2.60% | | 3 mo. SOFR + 2.60% | | February 25, 2028 |
| GB Solar TE 2020 Manager LLC | GB Solar TE 2020 Manager LLC | | 19,182,430 | | | 3 mo. LIBOR + 1.88% | | October 30, 2026 | GB Solar TE 2020 Manager LLC | 18,506 | | | 19,182 | | 19,182 | | | 3 mo. SOFR + 1.88% | | 3 mo. SOFR + 1.88% | | October 30, 2026 |
| Sego Lily Solar Manager LLC | Sego Lily Solar Manager LLC | | 137,445,285 | | | 1 mo. SOFR + 1.38% | | August 17, 2028 | Sego Lily Solar Manager LLC | 133,898 | | | 137,445 | | 137,445 | | | 3 mo. SOFR + 1.53% | | 3 mo. SOFR + 1.53% | | June 30, 2028 |
| Celadon Manager LLC | Celadon Manager LLC | | 61,925,120 | | | 1 mo. SOFR + 1.50% | | February 18, 2029 | Celadon Manager LLC | 72,853 | | | 61,925 | | 61,925 | | | Daily SOFR + 1.60% | | Daily SOFR + 1.60% | | February 18, 2029 |
| GRP II Borealis Solar LLC | GRP II Borealis Solar LLC | | 41,787,517 | | | 3 mo. LIBOR + 2.50% | | June 30, 2027 | GRP II Borealis Solar LLC | 40,646 | | | 41,788 | | 41,788 | | | 3 mo. SOFR + 2.00% | | 3 mo. SOFR + 2.00% | | June 30, 2027 |
| Ponderosa Manager LLC | Ponderosa Manager LLC | | 147,080,167 | | | 1 mo. SOFR + 1.10% | | Various | Ponderosa Manager LLC | 88,594 | | | 147,080 | | 147,080 | | | 3 mo. SOFR + 1.40% | | 3 mo. SOFR + 1.40% | | October 4, 2029(7) |
| PRC Nemasket LLC | PRC Nemasket LLC | | 44,487,662 | | | Daily SOFR + 1.25% | | November 1, 2029 | PRC Nemasket LLC | 41,806 | | | 44,488 | | 44,488 | | | Daily SOFR + 1.25% | | Daily SOFR + 1.25% | | November 1, 2029 |
| GREC Holdings 1 LLC | GREC Holdings 1 LLC | | 60,000,000 | | | 1 mo. SOFR + 1.75% | | November 29, 2027 | GREC Holdings 1 LLC | 74,594 | | | 60,000 | | 60,000 | | | 1 mo. SOFR + Applicable Margin(8) | | 1 mo. SOFR + Applicable Margin(8) | | November 29, 2027 |
| Dogwood GB Manager LLC | | Dogwood GB Manager LLC | 57,463 | | | — | | | 1 mo. SOFR + 1.63% | | March 29, 2030 |
| GREC Warehouse Holdings I LLC | | GREC Warehouse Holdings I LLC | 155,558 | | | — | | | 3 mo. SOFR + 2.03% | | August 11, 2026 |
| Total debt | Total debt | | $ | 987,089,056 | | |
| Less: Current portion of long-term debt | | (95,869,554) | | |
| Less: Discount on long-term debt | | (28,628,520) | | |
| Less: Deferred financing fees | | (11,830,541) | | |
| Less: Total unamortized discount and deferred financing fees | |
| Less: Total unamortized discount and deferred financing fees | |
| Less: Total unamortized discount and deferred financing fees | |
Less: Current portion of long-term debt(9) | |
Less: Current portion of long-term debt(9) | |
Less: Current portion of long-term debt(9) | |
| Total long-term debt, net | Total long-term debt, net | | $ | 850,760,441 | | |
| Total long-term debt, net | |
| Total long-term debt, net | |
(1)See the description of the credit agreement below for a discussion of GREC Entity HoldCoHoldCo’s non-compliance with the debt service coverage ratio (as defined in the credit agreement) as of and for the fiscal quarter ended December 31, 2023.
On(2)The GB Wind Holdco LLC tax equity bridge loans totaling $69.5 million were paid in full, and $63.1 million was paid on the term loan facility with proceeds from the Company’s failed sale-leaseback arrangements in November 25, 2021, GREC Entity HoldCo converted itsand December 2023. In addition, in the year ended December 31, 2023, there were additional borrowings of $69.5 million offset by $9.2 million of repayments in the ordinary course of business.
(3)The GB Wind Holdco LLC tax equity bridge loan toand repower term loans mature on March 31, 2024 and December 31, 2027, respectively.
(4)Eagle Valley Clean Energy LLC’s loan includes a term loan with a maturity on June 20, 2025. The loanthat bears interest at a fixed rate equalof 1.69% and a loan governed by a debt settlement agreement that bears interest at a fixed rate of 1.91%.
(5)The loan was paid in full in October 2023.
(6)On October 23, 2023, the maturity date was amended to December 31, 2023 in the Fourth Amendment to the one-month LIBORLoan and Security Agreement. The loan was paid in full in December 2023.
(7)The Ponderosa Manager LLC tax equity bridge loan of $34.5 million was paid in full in October 2023.
(8)GREC Holdings 1 LLC’s loan includes interest on the outstanding principal at the term SOFR index rate plus 1.75%. The loan is secured by alla spread adjustment plus applicable margin (spread adjustment of 0.10%; applicable margin ranging between 1.75% and 2.00%).
(9)Adjusted for $6.1 million of unamortized debt discount and deferred financing fees pertaining to current portion of long-term debt of $88.9 million.
During the assets of GREC Entity HoldCoyears ended December 31, 2023 and the equity interests of each direct and indirect subsidiary of the Company. The Company, GREC and each direct and indirect subsidiary of2022, the Company are guarantorsentered into new or modified existing debt facilities as noted below:
GREC Holdings 1 LLC
On November 29, 2022, GREC Holdings 1 LLC entered into a credit agreement with a syndicate of lenders for an aggregate revolving credit facility commitment of $150.0 million with the Company’s obligationsallowance for increases of credit of no more than $50.0 million. On March 21, 2023, the facility was amended to increase the aggregate commitment to $200.0 million. Advances under the loan. This guarantee was removed in November 2022 as a condition to the closing of the revolving credit facility, at GREC Holdings I, LLC. GREC has pledged all of the equity interests of GREC Entity HoldCo as collateral for this credit facility. Refer to Note 6. Borrowingsunder the Investment Basis for further detail.
Midway III Manager LLC
On October 31, 2018, Midway III Manager LLC converted its construction loan to a term loan. During the period from May 19, 2022 through December 31, 2022, Midway reached the fourth anniversary of the term conversion. As such, pursuant to the terms of the term loan agreement, the interest rate on the term loan changed from annual interest at three-month LIBOR plus 1.50% to three-month LIBOR plus 1.63%. This change in interest rate is effective through the maturity date of November 29, 2027, will bear interest at the term loan.SOFR index rate plus a spread adjustment plus applicable margin (spread adjustment of 0.10%; applicable margin ranging between 1.75% and 2.00%), and base rate loans will bear interest of the base rate plus applicable margin (base rate being greatest of prime rate, index floor, or federal funds rate plus 0.50%; applicable margin ranging between 0.75% and 1.00%).
Dogwood GB Manager LLC
Principal and interest payments are made onlenders to provide a term loan in an aggregate principal amount of up to $47.1 million. On May 30, 2023, the last day of each three-month period throughloan agreement was amended to increase the scheduled maturity date of October 31, 2025.aggregate principal amount up to $90.6 million. The loan is secured by a first-priority security interest in all assets of Midway IIIDogwood GB Manager LLC, including a pledge of (a) MidwayDogwood GB Manager LLC’sLLC's interest in Midway IIIDogwood Holdings LLC, and (b) GREC’sGREC Holdings 1 LLC's ownership interests in Midway IIIDogwood GB Manager LLC.
Trillium Manager LLC
On June 9, 2020, Trillium Manager LLC entered into a The interest rate on the loan agreement which provided for certain construction, revolving and term loans in an amount not to exceed $100.0 million. The revolving loans were available until the Borrowing Base availability End Date, defined as two years after the June 9, 2020 closing date after which all outstanding revolving loans converted into the term loan. The term loan bears interest at a rate of three-month LIBORis one-month SOFR plus an applicable margin, which is 1.88%1.63% per annum through the fourth anniversary of the closing date and 2.00%1.75% per annum after the fourth anniversary of the closing date and increasingdate. Thereafter, the interest rate will increase by 0.13%0.12% for each fourth anniversary. The borrower is only required to pay interest in quarterly installments through the fifth anniversary thereafter.of the closing date, and thereafter is required to pay quarterly installments of principal and interest through the maturity date, March 29, 2030.
GREC Warehouse Holdings I LLC
On August 11, 2023, GREC Warehouse Holdings 1 LLC entered into a credit agreement with a syndicate of lenders for an aggregate revolving credit facility commitment of $75.0 million with the allowance for increases of credit of no more than $175.0 million. On October 16, 2023, the credit agreement was amended to increase the commitment to $225.0 million with the allowance for increases of credit of no more than $25.0 million. The loanrevolving credit facility will bear interest at the three-month SOFR plus an applicable margin, which is 2.03% through the second anniversary of the closing date and 2.28% per annum after the second anniversary of the closing date through the maturity date, August 11, 2026. Borrowings under the credit facility are secured by a first-priority security interest in all assets of Trillium Manager LLC, including a pledge of (a) Trillium Manager LLC's interest in Trillium Holdings LLC and, (b) GREC's ownershipcertain equity interests in Trillium Manager LLC. Principalthe borrower and interest payments are made onits wholly owned subsidiaries held by indirect wholly owned subsidiaries of the last day of each three-month period through the scheduled maturity date of June 9, 2027. In addition, Trillium Manager LLC is party to several letter of credit facility agreements, not to exceed $5.0 million.Company.
GB Wind Holdco LLC
On September 15, 2023 and November 22, 2019,14, 2023, the GB Wind Holdco LLC entered into a loan agreement that was subsequently amended and restated on January 13, 2020, to providedprovide financing in connection with the operation and maintenancerepower of certain wind facilities. The loan bears interest at the three-month LIBORSOFR rate plus an applicable margin, which is 1.38% per annum through the fourth anniversary of the closing date and 1.50% per annum after the fourth anniversary of the closing date and increasing by 0.13% for each fourth anniversary thereafter. Principal and interest payments are made on the last day of each three-month period through the scheduledapplicable maturity date of November 22, 2027. The loan is secured by wind energy facilities owned through wholly owned subsidiaries.
Greenbacker Wind Holdings II LLC
On November 20, 2020, Greenbacker Wind Holdings II LLC entered into a financing agreement syndicated with various lenders who agreed to provide long-term financing. On February 19, 2021, Greenbacker Wind Holdings II LLC entered into a second loan agreement pursuant to an amended and restated financing agreement. The loan bears interest at the three-month LIBOR rate plus an applicable margin, which is 1.88% per annum until the fourth anniversary of the term conversion date and 2.00% per annum after the fourth anniversary of the term conversion date. Principal and interest payments are made on the last day of each three-month period through the scheduled maturity date of December 31, 2026. The loan is secured by wind energy facilities owned and operated by Greenbacker Wind Holdings II LLC and a pledge of Holiday Hill Manager LLC's interest in Holiday Hill Holdings LLC.
Conic Manager LLC
On August 8, 2019, Conic Manager LLC entered into a loan agreement. On April 1, 2021, Conic Manager LLC converted its term loan to a revolving line of credit facility in the aggregate principal amount of up to $24.4 million. There is a commitment fee equal to 0.30% per annum on any unused amount. The revolving line of credit facility was available to be drawn until October 31, 2022,2027, at which point the outstanding balance convertedall unpaid principal, interest, fees, cost, and all other obligations with respect to a term loan. Principal and interest payments are made on the last day of each three-month period with principal payments commencing on January 21, 2023 and continuing through the scheduled maturity date of April 1, 2028. The loan bears interest at a rate per annum equal to the LIBOR rate plus 1.75%. The loan is secured by a first-priority security interest in all assets of Conic Manager LLC, including a pledge of (a) Conic Manager LLC's interest in Conic Holdings LLC and, (b) GREC's ownership interests in Conic Manager LLC.
Turquoise Manager LLC
On February 12, 2020, Turquoise Manager LLC entered into a financing agreement syndicated with various lenders who agreed to provide a construction loan facility, an ITC bridge loan facility, and a term loan facility in connection with the construction and development of a solar energy facility. On December 23, 2020, the term loan conversion date occurred,shall be due and the construction loan and ITCpayable. The tax equity bridge loan were repaid in full. The term loan is secured by a first-priority security interest in all assets of Turquoise Manager LLC, including a pledge of (a) Turquoise Manager LLC's interest in Turquoise Holdings LLC and, (b) GREC's ownership interests in Turquoise Manager LLC. The term loan bearsloans bear interest at the three-month LIBORSOFR rate plus an applicable margin, which is 1.25%1.3% per annum through the fifth anniversary of the term conversion, and 1.38% per annum
thereafter through the maturity date, December 23, 2027.annum. Principal and interest payments arefor the tax equity bridge loans shall be made on the last day of each three-month period throughapplicable maturity dates for the scheduled maturity date.
Eagle Valley Clean Energy LLC
On April 24, 2019, Eagle Valley Clean Energy LLC ("EVCE"), as a termapplicable repowering projects, currently only applicable to one of the Company’s acquisition of EVCE, entered into a debt settlement agreement and amended its loan. Pursuant to the debt settlement agreement, the amendment deferred interest payments through March 31, 2024 (the “Interest Forbearance Period”), deferred principal payments through March 31, 2029 (the “Principal Forbearance Period”), provided for certain waivers, and waived any existing events of default. During the Interest Forbearance Period, EVCE is required to make quarterly interest payments of not less than $85,000. Interest will continue to accrue at the then available 30-year fixed interest rate, 1.91%, and will be added to the principal balance, both of which will be payable every three months following the expiration of the Principal Forbearance Period. The loan matures on January 2, 2057.
On November 30, 2021, EVCE entered into a premium financing agreement for $1.2 million with an insurance company to provide financing for insurance policies. The loan bears interest at a fixed interest rate of 6.99% per annum through the maturity date, November 30, 2023.
Greenbacker Equipment Acquisition Company LLC
On January 29, 2021, Greenbacker Equipment Acquisition Company LLC entered into a loan and security agreement to provide an equipment financing line up to $6.5 million. which was advanced on February 1, 2021. The loan bears interest at a rate equal to 1.00% above the prime rate, as it appears in the Wall Street Journal, payable monthly and the principal is payable on the maturity date, March 31, 2023.
ECA Finco I LLC
On February 25, 2021, ECA Finco I, LLC's loan converted to a term loan. The loan bears interest at the three-month LIBOR rate plus an applicable margin, which is 2.25% per annum until February 25, 2025, and 2.50% per annum thereafter through the maturity date. Principal and interest payments are made on the last day of each three-month periodrepower projects through the scheduled maturity date of February 25, 2028. The term loan is secured by a first-priority security interest in all assets of ECA Finco I, LLC, including a pledge of (a) ECA Finco I, LLC’s interest in ECA Holdco I and, (b) GREC's ownership interests in ECA Holdco I.
GB Solar TE 2020 Manager LLC
On October 30, 2020, GB Solar TE 2020 Manager LLC entered into a loan agreement syndicated with various lenders in an amount not to exceed $19.6 million. The loan bears interest at the three-month LIBOR rate plus an applicable margin, which is 1.88% through the fourth anniversary of the closing date, 2.00% per annum after the fourth anniversary of the closing date and increasing by 0.13% for each fourth anniversary thereafter. The loan is secured by a first-priority security interest in all assets of GB Solar TE 2020 Manager LLC, including a pledge of (a) GB Solar TE 2020 Manager LLC's interest in GB Solar TE 2020 Holdings LLC and, (b) GREC's ownership interests in GB Solar TE 2020 Manager LLC. The loan requires quarterly payments of interest only through September 30, 2022, after which it requires quarterly payments of principal and interest through the maturity date, October 30, 2026.March 31, 2024.
Sego Lily Solar Manager LLC
On January 28, 2022, Utility Solar AcquisitionCo 2021 LLC, as a co-borrower with Sego Lily Solar Manager LLC, entered into a financing agreement to provide a construction loan facility, an ITC bridge loan facility, and a term loan facility in connection with the construction and operations of renewable energy facilities. The financing agreement was subsequently amended on June 9, 2022 to add commitments to provide term loans for two wind energy projects. The loan is secured by a first-priority security interest in all assets of Sego Lily Solar Manager LLC, including a pledge of (a) Sego Lily Solar Manager LLC 's interest in Sego Lily Solar Holdings LLC and Graphite Solar Holdings LLC, and (b) GREC's ownership interests in Sego Lily Solar Manager LLC. On August 17, 2022, the loan converted to a term loan. The term loans bear interest at the one-month SOFR plus an applicable margin, which is 1.38%1.53% per annum until the fourth anniversary of the term conversion and 1.50% from and including the fourth anniversary and increasing by 0.13% for each fourth anniversary thereafter. Principal and interest payments are made on the last day of each three-month period through the scheduled maturity date of August 17,June 30, 2028.
Celadon Manager LLC
On February 18, 2022, Celadon Manager LLC entered into a loan agreement syndicated with various lenders in an amount not to exceed $71.0 million. The loan is secured by a first-priority security interest in all assets of Celadon Manager LLC, including a pledge of (a) Celadon Manager LLC's interest in Celadon Holdings LLC, and (b) GREC's ownership interests in Celadon Manager LLC. The loan bears interest at the one-month SOFR plus an applicable margin, which is 1.50%1.60% through the fifth anniversary of the closing date, 1.63% per annum after the fifth anniversary of the closing date and increasing by 0.13% for each fifth anniversary thereafter. The loan requires quarterly payments of interest only through the fifth anniversary of the closing date, after which it requires quarterly payments of principal and interest through the maturity date, February 18, 2029.
GRP II Borealis Solar LLC
On February 28, 2017, GRP II Borealis Solar LLC entered into an amended and restated financing agreement syndicated with various lenders who agreed to provide a term loan in an amount not to exceed $60.0 million. The term loan bears interest at the three-month LIBOR rate plus an applicable margin, which is 2.50% through the maturity date, June 30, 2027.
Ponderosa Manager LLC
On July 26, 2022, Ponderosa Manager LLC and Utility Solar AcquisitionCo 2022 LLC jointly entered into a financing agreement syndicated with various lenders who agreed to provide certain construction, ITC bridge and aggregation loan facilities in an amount not to exceed $173.4 million. The construction and aggregation loan facilities havereached the end of their availability periods throughin 2023. On October 4, 2023, upon which dates the Company hasrepaid the option to repayITC bridge loan and the outstanding principal or convert theconstruction aggregation loans were converted into a term loan. The ITC bridge loans have maturity dates through 2023. The debt is a constructionterm loan whereby the Company elected a SOFR of 1.10% (construction loan margin of 1.00% and SOFR index adjustment of 0.10%). The loans bearbears interest at SOFR plus 1.10% until1.4% through the maturity or conversion date.date of October 4, 2029.
PRC Nemasket LLC
On November 1, 2022, PRC Nemasket LLC entered into a financing agreement. The bankslenders agreed to provide a term loan not to exceed $45.0 million in aggregate. The principal of the term loan shall be due and payable in quarterly principal installments, with final payment due on the maturity date, November 1, 2029. The banks also agreed to extend letters of credit to the borrower not to exceed $2.5 million in aggregate. The letters of credit have an expiration date agreed to at the time of issuance, with an expiration date of no more than twelve months after the date of the of letter issuance. All loans bearsbear interest at SOFR with an applicable margin of 1.25%, increasing to 1.38% after the fourth anniversary of the closing date.
GREC Holdings 1 LLCEntity HoldCo
On November 29, 2022,25, 2021, GREC Holdings 1 LLC entered intoEntity HoldCo converted its loan to a term loan with a maturity on June 20, 2025. The loan bears interest at a rate equal to the daily SOFR rate plus 1.85%. The loan is secured by, among other customary interests, a pledge of all of the issued and outstanding equity interests of GREC Entity HoldCo as a collateral for this credit agreement. The credit agreement with a syndicatewas amended to eliminate any guarantee from either GREC LLC or GREC in November 2022. As of lendersand for an aggregate revolving credit facility commitment of $150.0 million,the fiscal quarter ended December 31, 2023, GREC Entity HoldCo was not in compliance with the allowancedebt service coverage ratio (as defined in the credit agreement) for increasesthis credit agreement, which resulted in the Company’s classification of creditthe debt to the current liability as of no more than $50.0 million. AdvancesDecember 31, 2023. A default under the revolving credit facility will bear interest atagreement permits the term SOFR index rate plus a spread adjustment plus applicable margin (spread adjustment of 0.10%; applicable margin ranging between 1.75% and 2.00%), and base rate loans will bear interestadministrative agent, among other things, to declare all or any part of the base rate plus applicable margin (base rate being greatestoutstanding principal amount of prime rate, index floor, or federal funds rate plus 0.5%; applicable margin ranging between 0.75%the loans under the credit agreement and 1.00%).related interest immediately due and payable. The Company is working in good faith with the lender to secure a waiver of default. While the Company expects to receive a waiver of default, there is no guarantee that the company will receive such waiver. Further, there are no cross-defaults associated with this technical default.
The Company has entered into interest rate swap contracts to manage the interest rate risk associated with its outstanding borrowings. Refer to Note 11.12. Derivative Instruments for further discussion.
The following table shows the components of interest expense related to the Company'sCompany’s borrowings for the year ended December 31, 2023 and the period from May 19, 2022 through December 31, 2022:
| | | | | | | | |
| | Period from May 19, 2022 through December 31, 2022 |
Loan interest | | $ | 16,092,601 | |
Commitment / letter of credit fees | | 2,013,308 | |
Amortization of deferred financing costs | | 1,532,817 | |
Amortization of discount on notes payable | | 943,556 | |
Interest capitalized | | (4,614,299) | |
Total | | $ | 15,967,983 | |
| | | | | | | | | | | | | | | |
| (in thousands) | | | | | For the year ended December 31, 2023 | | For the period from May 19, 2022 through December 31, 2022 |
Loan interest(1) | | | | | $ | 54,615 | | | $ | 16,093 | |
| Commitment / letter of credit fees | | | | | 2,986 | | | 2,013 | |
| Amortization of deferred financing fees and discount | | | | | 6,690 | | | 1,533 | |
| Interest capitalized | | | | | (23,378) | | | (4,614) | |
| Total | | | | | $ | 40,913 | | | $ | 15,025 | |
$26.7 million as a reduction of loan interest. Interest expense disclosed in the table above is included within Interest expense, net on the Consolidated StatementStatements of Operations.
The principal payments due on borrowings for each of the next five years ending December 31, 2023 and thereafter, are as follows:
| | Period ending December 31 | | Principal Payments |
| 2023 | | $ | 100,174,824 | |
| (in thousands) | |
| Period ending December 31, | |
| Period ending December 31, | |
| Period ending December 31, | | | Principal Payments |
| 2024 | 2024 | | 37,846,974 | |
| 2025 | 2025 | | 103,930,544 | |
| 2026 | 2026 | | 109,250,321 | |
| 2027 | 2027 | | 284,224,979 | |
| 2028 | |
| Thereafter | Thereafter | | 351,661,414 | |
| $ | 987,089,056 | |
| | $ | |
Other Financing Arrangements
In November and December 2023, the Company entered into sale-leaseback arrangements related to certain wind assets with an initial lease term of 9.3 and 20.0 years, respectively, for total cash proceeds of $240.9 million. The Company utilized the proceeds to pay down $132.6 million of existing debt and $1.0 million in transaction costs. Under the lease agreements, the Company is required to make total lease payments of $158.6 million over the respective lease terms. In addition, in accordance with the lease agreements, the Company has an early buyout option in December 2029. The early buyout option is defined as the fair market value of the project at the buyout date or an amount set forth in the lease agreement, whichever is greater. As part of the arrangement, the Company will still operate and earn revenues from the facilities throughout the lease term while the lessor will be entitled to all available tax credits. As part of the sale-leaseback transaction, the Company entered into a tax indemnity agreement. As part of the agreement, with respect to the leased assets, the lessor holds indemnification rights related to a disallowance or reduction of assumed tax deductions and tax credits. Subject to certain requirements set forth within the tax indemnity agreement, the Company would be required to pay the lessor for all reduced or disallowed tax deductions and credits.
The sale-leaseback arrangements did not meet the criteria of a sale for accounting purposes. As such, the Company accounted for these transactions as a failed sale-leaseback and financing arrangements. As of December 31, 2023, the Company recorded $69.4 million and $169.8 million of financing obligations within Current portion of failed sale-leaseback financing and Failed sale-leaseback financing, net of current portion, respectively, on the Consolidated Balance Sheets. In connection with the transaction, the Company recorded origination costs as an offset to the failed sale-leaseback financing liability. As of December 31, 2023, the Company recorded $0.3 million and $1.4 million of origination costs which are recorded as a reduction to Current portion of failed sale-leaseback financing and Failed sale-leaseback financing, net of current portion, respectively, on the Consolidated Balance Sheets.
The future payments on failed sale-leaseback financing arrangements for each of the next five years ending December 31, 2023 and thereafter, are as follows:
| | | | | | | | |
| (in thousands) | | |
| Period ending December 31, | | Future Payments |
| 2024 | | $ | 69,722 | |
| 2025 | | 9,685 | |
| 2026 | | 9,900 | |
| 2027 | | 10,046 | |
| 2028 | | 10,028 | |
| Thereafter | | 49,201 | |
| Total lease payments | | $ | 158,582 | |
| | |
| | |
Note 11.12. Derivative Instruments
The Company manages interest rate risk primarily through the use of derivative financial instruments.
Cash Flow Hedges of Interest Rate Risk
The Company’s objective in using interest rate derivatives is to add stability to interest expense and to manage its exposure to interest rate movements. To accomplish this objective, the Company, through its wholly owned subsidiaries, has entered into interest rate swaps as part of its interest rate risk management strategy. TheseCertain of these interest rate swaps are designated as cash flow hedges and involve the receipt of variable rate amounts from a counterparty in exchange for the Company making fixed interest rate payments at fixed rates. These fixed rates, rangingfor all interest rate swaps regardless of designation, range between 0.61%0.41% and 3.21%4.37%.
On May 19, 2022,The following tables reflect the designation date, the Company’s cash flow hedges were a $123.3 million net asset. The initiallocation and estimated fair value positions of derivative contracts at:
| | | | | | | | | | | | | | | | | | | | | | | |
| (in thousands) | | | December 31, 2023 |
| Balance sheet location | | Outstanding notional amount | | Fair Value - Assets | | Fair Value - (Liabilities) |
| | | | | | | |
| Derivatives Designated as Hedging Instruments |
| Interest rate swap contracts | Derivative assets, current / Derivative assets / (Derivative liabilities) | | $ | 861,322 | | | $ | 98,669 | | | $ | (489) | |
| Derivatives Not Designated as Hedging Instruments |
| Interest rate swap contracts | Derivative assets, current / Derivative assets / (Derivative liabilities) | | 463,063 | | | 43,499 | | | (5,344) | |
| Total | | | $ | 1,324,385 | | | $ | 142,168 | | | $ | (5,833) | |
As of December 31, 2023, the cash flow hedges on the designation date at May 19, 2022 is recognizednotional amount for derivatives designated as hedging instruments includes $751.2 million associated with currently effective swaps and $110.1 million associated with forward starting swaps. The notional amount for derivatives not designated as hedging instruments includes $112.6 million associated with swaps currently in Derivative assets, current,effect, $65.7 million associated with forward starting swaps, and Derivative assets, included in noncurrent assets, in the Consolidated Balance Sheet.$284.7 million associated with a deal contingent swap. The fair value of the effective portion of the interest rate swap is recognized into income under a systematicswaps have maturities between 2025 and rational method over the life of the hedging instrument and is presented in the same line item on the Consolidated Statement of Operations as the earnings effect of the hedged item, with the offset recorded to Other comprehensive income. For the period May 19, 2022 through December 31, 2022, the Company recorded $1.7 million as an increase in Interest expense, net in the Consolidated Statement of Operations in association with the recognition of the initial fair value of the interest rate hedges on the designation date.2050.
| | | | | | | | | | | | | | | | | | | | | | | |
| (in thousands) | | | December 31, 2022 |
| Derivatives Designated as Hedging Instruments | Balance sheet location | | Outstanding notional amount | | Fair Value - Assets | | Fair Value - (Liabilities) |
| Interest rate swap contracts | Derivative assets / (Other liabilities) | | $ | 1,527,814 | | | $ | 195,840 | | | $ | — | |
As of December 31, 2022, the fair value of the Company's interest rate swaps was a $195.8 million asset with an outstanding notional amount of $1.5 billion. The notional amount includes $700.8 million associated with currently effective swaps, $542.3 million associated with forward starting swaps, and $284.7 million associated with deal contingent swaps. The interest rateAll swaps have maturities between 2025 and 2050.were designated as hedging instruments as of December 31, 2022.
The following table reflectsprovides information on the location and estimated fair value positions of derivative contracts at:as recorded in the Consolidated Statements of Comprehensive Income (Loss) and Consolidated Statements of Operations:
| | | | | | | | | | | | | | |
| | December 31, 2022 |
| Derivatives Designated as Hedging Instruments | Balance sheet location | Outstanding notional amount | Fair Value - Assets | Fair Value - (Liabilities) |
| Interest rate swap contracts | Derivative Assets / (Other Liabilities) | $1,527,813,754 | $195,839,516 | $— |
| | | | | | | | | | | |
| Year ended December 31, 2023 |
| (in thousands) | Derivatives Designated as Hedging Instruments | | Derivatives Not Designated as Hedging Instruments |
| Consolidated Other Comprehensive (Loss) Income | | | |
| Loss recognized in other comprehensive income | $ | (20,545) | | | $ | — | |
| Amortization of off-market derivatives | 6,974 | | | (224) | |
| Less: Taxes on total net loss recognized in other comprehensive income | 3,633 | | | — | |
| | | |
| Consolidated Statements of Operations | | | |
| Change in unrealized gain of interest rate swaps, net | 6,546 | | | 11,217 | |
| Realized gain on interest rate swaps, net | 2,428 | | | — | |
| | | | | | | | | | | |
| For the period from May 19, 2022 through December 31, 2022 |
| (in thousands) | Derivatives Designated as Hedging Instruments | | Derivatives Not Designated as Hedging Instruments |
| Consolidated Other Comprehensive (Loss) Income | | | |
| Gain recognized in other comprehensive income | $ | 74,086 | | | $ | — | |
| Amortization of off-market derivatives | 2,056 | | | — | |
| Less: Taxes on total net gain recognized in other comprehensive income | (20,048) | | | — | |
| | | |
| Consolidated Statements of Operations | | | |
| Change in unrealized loss of interest rate swaps, net | (249) | | | — | |
| Realized loss on interest rate swaps, net | (1,322) | | | — | |
For derivatives designated as cash flow hedges, the changes in the fair value of the derivative are initially reported in other comprehensive income (outside of earnings), and are subsequently reclassified to earnings when the hedged transaction affects earnings. The Company assesses the effectiveness of each hedging relationship by utilizing a statistical regression analysis.
For derivatives not designated in a hedging relationship, the period from May 19, 2022 through December 31, 2022,changes in fair value of the Company recognized a gain of $54.4 million, net of taxes of $20.0 million,derivative are reported immediately in Unrealized gain on derivatives designated as cash flow hedges, net of tax in the Consolidated Statement of Comprehensive Income (Loss), related to the Company's cash flow hedge accounting. For the period May 19,
2022 through December 31, 2022, the Company recorded a realized loss of $1.3 million in Realized loss on interest rate swaps, net on the Consolidated Statement of Operations.earnings.
Amounts reported in accumulated other comprehensive income related to designated derivatives will be reclassified to interest expense as interest payments are made on the Company’s variable rate liabilities. For the period from May 19, 2022 through December 31, 2022, there was a $4.2 million loss associated with a favorable settlement received under the Company’s interest rate swap agreements reclassified from accumulated other comprehensive income to income as a decrease in interest expense offset by $1.7 million of amortization as discussed above. During the next twelve months, the Company estimates that a gainexisting gains of $24.4$22.8 million currently reflected in Accumulated other comprehensive income will be reclassified to incomeearnings as a decrease in interest expense as interest payments are made.
From time to time, the Company designates interest rate swaps when they have a non-zero fair value. In particular, on the date that the Company transitioned from Investment Basis to Non-Investment Basis, the Company designated all of its then existing interest rate swaps as cash flow hedges. The non-zero fair value of these cash flow hedges on the designation date is recognized into income under a systematic and rational method over the life of the hedging instrument and is presented in the same line item on the Consolidated Statements of Operations as the earnings effect of the hedged item, with the offset recorded to Other comprehensive income (loss). In addition, the Company periodically dedesignates interest rate swaps as hedging instruments voluntarily or in association with the termination of the swaps. When the Company dedesignates a lossswap as a hedging instrument, the Company evaluates whether the forecasted transactions previously hedged by the interest rate swap are not probable of $12.4occurring and, if so, reclassifies the amount recorded in Accumulated other comprehensive income to Unrealized gain (loss) on interest rate swaps, net in the Consolidated Statements of Operations. When the Company determines that the forecasted transactions previously hedged by the interest rate swap are not probable of not occurring, the Company recognizes the amounts within Accumulated other comprehensive income related to the dedesignated interest rate swap into interest expense as the originally forecasted transactions affect earnings.
The non-zero designation date value of cash flow hedges and dedesignated cash flow hedges for which the originally forecasted transactions are not probable of not occurring are amortized and reclassified from other comprehensive income to interest expense. For swaps not designated as cash flow hedges, the designation date value will still be amortized and reclassified from other comprehensive income to Interest expense, net in the Consolidated Statements of Operations.
As of December 31, 2023, the Company expects $36.1 million to be reclassified from Accumulated other comprehensive income to earnings as an increase to interest expense through 2050; the life of the hedge forecasted transactions. During the next twelve months, the Company estimates that $5.6 million will be reclassified from Accumulated other comprehensive income to incomeearnings as an increase into interest expense in associationassociated with the recognitionamortization of these non-zero fair value and dedesignated cash flow hedges.
On November 12, 2023 and December 29, 2023, the Company amended two existing interest rate swap agreements to reduce the existing notional amount of the initial fair valueswaps, which were designated in an effective hedging relationship. As the hedged forecasted transaction was probable of not occurring, the Company reclassified a $2.4 million gain from Accumulated other comprehensive income to Unrealized gain (loss) on interest rate swaps, net in the Consolidated Statements of Operations.
During the year ended December 31, 2023, the Company received $59.6 million in cash and recorded a receivable of $2.5 million as a result of the full or partial termination of interest rate hedgesswaps. The Company collected the outstanding receivable of $2.5 million on January 5, 2024. The cash proceeds received are included in Net cash provided by operating activities in the designation date.Consolidated Statements of Cash Flows.
From
Additionally, from time to time, the Company utilizes derivative instruments for the purposes of hedgingmanaging interest rate risk on future term debt instruments. Since the debt agreements have not yet closed, in order to lock in the terms, the Company mademay make payments for the amount of $1.7 million to be maintained as cash collateral. As of December 31, 2023 and 2022, thisthe Company recorded nil and $1.7 million, respectively, of cash collateral is recorded in Other current assets in the Consolidated Balance Sheet.Sheets.
Note 12.13. Asset Retirement Obligations
The following table represents the balance of AROsAROs as of December 31, 2022,2023, as well as the additions, settlements and accretion related to the Company's AROsAROs for the period from May 19, 2022 throughyear ended December 31, 2022:2023:
| | | | | |
Balance as of May 19, 2022(in thousands) | | $29,383,847 | |
Revisions in estimates for current obligations | — | |
Asset retirement obligation settled during current period | — | |
Asset retirement obligation incurred during current period | 1,165,035 | |
Accretion expense | 863,956 | |
| Balance as of December 31, 2022 | $ | 31,412,83831,413 | |
| Adjustments in estimates for current obligations | (217) | |
| Asset retirement obligation settled during current period | (337) | |
| Asset retirement obligation incurred during current period | 1,425 | |
| Accretion expense | 2,622 | |
| Balance as of December 31, 2023 | $ | 34,906 | |
Note 14. Income Taxes
The Company conducts most of its operations through GREC, its taxable wholly owned subsidiary. The Company’s consolidated income tax (benefit) provision consists of the following:
| | | | | | | | | | | |
| (in thousands) | For the year ended December 31, 2023 | | For the period from May 19, 2022 through December 31, 2022 |
| Federal | $ | (19,269) | | | $ | 985 | |
| State | (2,290) | | | 2,019 | |
| Foreign | 11 | | | 1 | |
| Deferred (benefit) provision for income taxes | $ | (21,548) | | | $ | 3,005 | |
The principal differences between the Company’s effective tax rate of 10.9% and (5.2)% on operations and the U.S. federal statutory income tax rate as of December 31, 2023 and 2022, respectively, are as follows:
| | | | | | | | | | | | | | | | | | | | | | | |
| (in thousands) | For the year ended December 31, 2023 | | Percentage | | For the period from May 19, 2022 through December 31, 2022 | | Percentage |
| Tax (benefit) at statutory U.S. federal income tax rate | $ | (41,398) | | | 21.0 | % | | $ | (12,002) | | | 21.0 | % |
| State income taxes, net of federal benefit | (7,050) | | | 3.6 | % | | 937 | | | (1.6) | % |
| Noncontrolling interest | 20,184 | | | (10.2) | % | | 12,482 | | | (21.8) | % |
| Share-based compensation | 1,816 | | | (0.9) | % | | 1,441 | | | (2.5) | % |
| Federal tax credits | (1,293) | | | 0.6 | % | | (2,100) | | | 3.7 | % |
| Change in valuation allowance | 4,330 | | | (2.2) | % | | 658 | | | (1.2) | % |
| Permanent differences (GREC LLC and other - net) | 1,863 | | | (1.0) | % | | 1,589 | | | (2.8) | % |
| Actual provision for income taxes | $ | (21,548) | | | 10.9 | % | | $ | 3,005 | | | (5.2) | % |
Deferred tax assets (liabilities) reported on the accompanying Consolidated Balance Sheets as of December 31, 2023 and 2022 are as follows:
| | | | | | | | | | | |
| (in thousands) | December 31, 2023 | | December 31, 2022 |
| Net operating losses | $ | 99,469 | | | $ | 98,911 | |
| Long-term debt and failed sale-leaseback financing | 58,519 | | | — | |
| Federal tax credits | 17,671 | | | 16,252 | |
| Operating lease liabilities | 13,825 | | | 14,282 | |
| Asset retirement obligations | 5,035 | | | 5,287 | |
| Disallowed interest | — | | | 5,028 | |
| Other | 3,678 | | | 3,571 | |
| Total deferred tax assets | 198,197 | | | 143,331 | |
| Less: Valuation allowance | (6,500) | | | (2,170) | |
| Deferred tax assets, net of valuation allowance | $ | 191,697 | | | $ | 141,161 | |
| | | |
| Property, plant, and equipment | $ | (77,752) | | | $ | (48,090) | |
| Investments in flow-through entities taxed as partnerships | (68,245) | | | (41,667) | |
| Intangibles | (54,823) | | | (64,834) | |
| Derivative assets | (35,900) | | | (51,569) | |
| Operating lease assets | (13,555) | | | (14,070) | |
| Long-term debt | — | | | (4,658) | |
| Total deferred tax liabilities | (250,275) | | | (224,888) | |
| Deferred tax liabilities, net | $ | 58,578 | | | $ | 83,727 | |
As of December 31, 2023, the Company’s net deferred tax liability of $58.6 million consists of a deferred tax liability of $58.7 million, offset by a deferred tax asset of $0.1 million, which are recorded to Deferred tax liabilities, net and Other noncurrent assets, respectively, on the Consolidated Balance Sheets.
As of December 31, 2022, the AROsCompany’s net deferred tax liability of $83.7 million consists of a deferred tax liability of $85.7 million, offset by a deferred tax asset of $1.9 million, which are recorded into Deferred tax liabilities, net and Other noncurrent liabilities inassets, respectively, on the Consolidated Balance Sheet.Sheets.
As of December 31, 2023, the Company has federal net operating loss carry-forwards of approximately $368.7 million. Approximately $329.2 million of the carry-forward is indefinite-lived with the remaining $39.5 million expiring in 2036 and 2037. Federal tax credit carryforwards are approximately $17.7 million and will expire between 2035 and 2043.
As of December 31, 2023, state net operating loss and carryforwards total approximately $412.2 million. Approximately $66.4 million of the net operating loss carry-forward is indefinite-lived with the remaining $345.8 million expiring between 2024 and 2043 with earlier years expirations reserved by a valuation allowance.
In assessing the realizability of deferred tax assets, management considers whether it is more likely than not that some portion or all of the deferred tax assets will not be realized. As of December 31, 2023, management has applied a partial valuation allowance of $6.5 million against the deferred tax assets resulting from certain state net operating loss carryforwards where it is more likely than not that they will not be utilized during their carryforward period.
Federal and state statutes of limitations are generally open for all years in which the Company has generated net operating losses, the earliest of which is the year ended December 31, 2014.
The Company assessed its tax positions for all open tax years as of December 31, 2023 for all U.S. federal and state, and foreign tax jurisdictions for the years 2014 through 2023. The results of this assessment are included in the Company’s tax provision and deferred tax assets as of December 31, 2023.
The Company is under audit by federal tax authorities at one of its tax equity partnerships for the fiscal year 2021. There have not been any proposed adjustments at this stage of the examination. The examination is expected to be finalized in the fiscal year 2025.
Note 13.15. Commitments and Contingencies
Legal Proceedings
The Company may become involved in legal proceedings, administrative proceedings, claims and other litigation that arise in the ordinary course of business. Individuals and interest groups may sue to challenge the issuance of a permit for a renewable energy project or seek to enjoin construction of a wind energy project. In addition, the Company may be subject to legal proceedings or claims contesting the construction or operation of its renewable energy projects. In defending itself in these proceedings, the Company may incur significant expenses in legal fees and other related expenses regardless of the outcome of such proceedings. Unfavorable outcomes or developments relating to these proceedings, such as judgments for monetary damages, injunctions or denial or revocation of permits, could have a material adverse effect on the Company's business, financial condition and results of operations. In addition, settlement of claims could adversely affect the Company's financial condition and results of operations. As of December 31, 2022,2023, the Company is not aware of any legal proceedings that might have a significant adverse impact on the Company.
Letters of Credit
The Company is required to provide security under the terms of several of its power purchase agreements, permits, lease agreements and other project documents as well as many of its loan agreements. As of December 31, 2022,2023, the Company has provided the requisite security for these agreements in the form of a standby letter of credit of $109.3$169.7 million. As of December 31, 2022,2023, the Company had no amounts had been drawn under theseunused letters of credit.
Pledge of Collateral and Unsecured Guarantee of Loans to Subsidiaries
Pursuant to various project loan agreements between the Company's subsidiaries and various lenders, the Company has pledged solar and wind operating assets as well as the membership interests in various subsidiaries as collateral for the term loans with maturity dates ranging from March 2023June 2025 through January 2057.
Investment in To-Be-Constructed Assets and Membership Interest Purchase Commitments
Pursuant to various engineering, procurement and construction contracts and membership interest purchase agreements to which certain of the Company's subsidiaries are individually a party, the subsidiaries, and indirectly the Company, have committed an outstanding balance of approximately $157.5 million$1.2 billion to complete construction of the facilities.facilities and the closing of the purchase of membership interest pursuant to all conditions being met under such agreements. Based upon current construction and closing schedules, the expectation is that these commitments will be fulfilled in 2023 into 2024. In addition, pursuant to various membership interest purchase agreements to which the Company via its subsidiaries are a party, the Company has committed an outstanding balance of approximately $943.4 million to complete the closing pursuant to all conditions being met under the membership interest purchase agreements as of December 31, 2022.between 2024 and 2027. The Company plans to use debt and tax equity financing as well as cash on hand to fund such commitments.
Power Purchase Agreements
The Company has long-term PPAs with its offtake customers. Under the PPAs, the Company is required to deliver agreed uponagreed-upon quantities based on the agreements for successive periods, typically between one to five year rolling periods, over the terms of the PPAs. For the period from May 19, 2022 throughAs of December 31, 2022,2023, the Company was in compliance with all agreed uponagreed-upon delivery quantities.
Renewable Energy Credit Commitments
The Company enters into two different types of forward sales agreements. The first type of forward sales agreement is to sell 100% of the RECs produced by certain renewable energy systems. Total REC sales will depend on total production at each renewable energy system. The second type of forward sales agreement is to sell a specified number of RECs at fixed prices during specific periods between 2023 through2024 and 2041. As of December 31, 2022,2023, the Company's commitments with third parties under REC sales contracts are as follows:
| | Number of RECs |
| 2023 | 181,877 |
| (in thousands) | | (in thousands) | | Number of RECs |
| 2024 | 2024 | 176,050 | 2024 | | 176 |
| 2025 | 2025 | 59,435 | 2025 | | 59 |
| 2026 | 2026 | 55,291 | 2026 | | 55 |
| 2027 | 2027 | 27,823 | | 2027 | | 28 |
| 2028 | | 2028 | | 28 |
| Thereafter | Thereafter | 201,643 | Thereafter | | 174 |
| Total | Total | 702,119 | Total | | 520 |
Leases
Agreements to lease assetsLease agreements are evaluated at inception to determine whether they represent finance or operating leases. The Company has determined its site leases represent operating leases, and accordingly, minimum rental expense is recognized on a straight-line basis over the lease term beginning with the lease commencement date. For finance leases, the minimum rental expense is recognized in a front-loaded expense pattern. Refer to Note 9.10. Leases for further discussion of the Company’s operating lease obligations.future minimum commitments under all non-cancellable leases.
Pledge of Parent Company Guarantees
Pursuant to various tax equity structures, which are governed by various agreements to which certain of the Company'sCompany’s subsidiaries are individually a party to, the Company has provided unsecured guarantees to support the commitments and obligations of these underlying tax equity agreements in an amount of $452.3$842.7 million as of December 31, 2022.2023. As of December 31, 2022,2023, the Company is not aware of any events that could trigger the Company’s obligations under these guarantees.
Refer to Note 1. Organization and Operations of the Company, Note 5. Variable Interest Entities, Note 9.10. Leases, and Note 14.16. Related Parties for an additional discussion of the Company’s commitments and contingencies.
Note 14.16. Related Parties
The related party disclosures as included herein reflect such matters as of May 19, 2022 and prospectively. Certain of the related party agreements and transactions were impacted by the Acquisition and are detailed in Note 5.4. Related Party
Agreements and Transaction Agreements as included in the Notes to the Consolidated Financial Statements as prepared under the Investment Basis.
Immediately prior to the closing of the Acquisition on May 19, 2022, GCM owned 23,60123.6 thousand Class A shares and 2,7762.8 thousand Class P-D shares. In connection with the Acquisition, all Class A shares and Class P-D shares held by GCM were forfeited, retired and cancelled. The forfeiture, retirement, and cancellation of the shares held by GCM for $0.2 million is reflected inwas recorded to Other capital activity on the Consolidated StatementStatements of Redeemable Noncontrolling Interests and Equity.
Modified Special Unit
In accordance with the terms of the Fourth Operating Agreement, the Special Unitholder was the holder of the Special Unit, which, prior to the completion of the Acquisition, entitled itthe Special Unitholder to receive the Performance Participation Fee and Liquidation Performance Participation Fee, each as described in detail in Note 5.4. Related Party Agreements and Transaction Agreements as included in the Notes to the Consolidated Financial Statements as prepared under the Investment Basis.
Prior to the Acquisition, under the Fourth Operating Agreement, the “Liquidation Performance Participation Fee” payable to the Special Unitholder was equal to 20.0% of the net proceeds from a liquidation of the Company in excess of adjusted capital, as measured immediately prior to liquidation. Adjusted capital was defined as the Company's NAV immediately prior to the time of a liquidation or a listing. In the event of any liquidity event that involved a listing of the Company's shares, or a transaction in which the Company’s members received shares of a company that was listed, on a national securities exchange, the Liquidation Performance Participation Fee would have been equal to 20.0% of the amount, if any, by which the Company's listing value following such liquidity event exceeded the adjusted capital, as calculated immediately prior to such listing (the “Listing Premium”). Any such Listing Premium and related Liquidation Performance Participation Fee would be determined and payable in arrears 30 days after the commencement of trading following such liquidity event.
Following the Acquisition, under the Fifth Operating Agreement, the “Liquidation Performance Participation Distribution” is payable to GB Liquidation Performancethe LPU Holder LLC (the “LPU Holder”) upon the same terms described above with the exception that amounts that may be earned upon the occurrence of a listing of the Company’s shares (or a transaction in which the Company’s members receive shares of a company that is listed) on a national securities exchange are no longer payable in cash, but only in additional Class P-I shares, which will be valued for such purpose at their then fair market value as determined in accordance with the terms of the Fifth Operating Agreement at the time of such listing. In the case of a liquidation of the Company, amounts payable may be paid in additional shares of the Company, other securities and/or cash. Refer to Note 17. Members'18. Equity for additional details on the Liquidation Performance Unit.
Transition Services Agreement
In connection with the Acquisition, Group LLC and certain other parties (together, the “Service Recipients”) entered into a transition services agreement with Greenbacker Administration (the “Transition Services Agreement”). In November 2023, Group LLC and the Service Recipients entered into an amended transition services agreement (the “Amended Transition Services Agreement”), pursuant to which Greenbacker Administration is providing certain financial and corporate recordkeeping services to the Service Recipients until the earlier ofof: (i) December 31, 2023 (or December 31, 2026 in the case of one of the Service Recipients),2025; (ii) such time as the parties terminate the services arrangement,arrangement; or (iii) one month after such Service Recipient has been liquidated and dissolved. The Service Recipients shall be required to pay a fee of $200 per hour per person performing the services it receives under both the Transition Services Agreement and Amended Transition Services Agreement. The impact of the Transition Services Agreement and Amended Transition Services Agreement, as applicable, to the Consolidated Financial Statements for the year ended December 31, 2023 and the period from May 19, 2022 through December 31, 2022 was not material.
Registration Rights Agreement
In connection with the Acquisition, the Company, GREC, Group LLC and the LPU Holder entered into a customary registration rights agreement, (the “Registration Rights Agreement”), pursuant to which GREC has agreed to use commercially reasonable efforts to prepare and file with the SEC not later than 12 months from the beginning of the first full calendar month following completion of an initial public offering by GREC a shelf registration statement relating to the resale of shares of common stock of GREC that may in the future be held by Group LLC, the LPU Holder and/or their respective members to the extent their shares of the Company are repurchased, redeemed, exchanged or converted into shares of common stock of GREC. GREC has agreed to pay customary registration expenses and to provide customary indemnification in connection with the foregoing registration rights.
Executive Protection Plan
In connection with the closing of the Acquisition, each of Mr. Charles Wheeler and Mr. David Sher terminated their employment agreements with Group LLC, and such employment agreement was superseded by offer letters from GREC and participation in the GREC Executive Protection Plan.
GCM Managed Funds
Prior to the Acquisition, GCM served as the external advisor of four investment entities -entities: the Company, GROZ, GDEV I and GREC II. The Advisory Agreement between GCM and the Company was terminated in connection with the Acquisition. However, the Company continues to provide through GCM investment management services to GROZ, GDEV I and GREC II as a result of the acquisition of GCM. As a result, the Company began to record Investment Management revenue on the Consolidated StatementStatements of Operations, as applicable, and more fully described below. In addition, the Company entered into an advisory agreement with GDEV II on November 11, 2022.
Base management fees under GCM’s advisory fee agreement with GROZ are calculated at a monthly rate of 0.125% (1.50% annually) of the average gross invested capital for GROZ. During the year ended December 31, 2023 and the period from May 19, 2022 through December 31, 2022, the Company earned $0.3 million and $0.2 million, respectively, in management fees from GROZ. Management fees from GROZ which isare included in Investment Management revenue on the Consolidated StatementStatements of Operations. The management fees earned are payable monthly, in arrears. As of December 31, 2023 and 2022, the Company was owed $0.2 million and $0.1 million, respectively, in management fees from GROZ, which is included in Accounts receivable on the Consolidated Balance Sheet.Sheets.
The Company is also eligible to receive certain performance-based incentive fee distributions from GROZ, including upon liquidation of GROZ, subject to certain distribution thresholds as defined in the amended and restated limited liability company operating agreement of GROZ. The Company did not recognize any revenue related to GROZ incentive fee distributions for the year ended December 31, 2023 or the period from May 19, 2022 through December 31, 2022.
Base management fees under GCM’s advisory fee agreements with GDEV and GDEV B, dated March 3, 2022, are calculated as follows.described herein. For the period from March 3, 2022 through the date on which the commitment period ends (as defined in the GDEV and GDEV B amended and restated limited partnership agreements), the management fee is calculated at an annual rate of 1.75% to 2.00%, depending on the limited partner, of the aggregate capital commitments to GDEV and GDEV B. Beginning on the date following the date on which the commitment period terminates, the management fee is calculated at an annual rate of 1.75% to 2.00%, depending on the limited partner, of the aggregate cost basis of all portfolio securities of GDEV and GDEV B. The management fees earned are payable quarterly in advance. As a result of the Company consolidating GDEV during the period from May 19, 2022 through November 17, 2022, $0.9 million of management fee revenue earned under the advisory agreement with GDEV was considered intercompany revenue and was therefore eliminated in consolidation. As a result of the deconsolidation of GDEV on November 18, 2022, management fee revenue is no longer eliminated in consolidation and is recorded on the Consolidated StatementStatements of Operations. Refer to Note 2. Significant Accounting Policies for further information on the deconsolidation of GDEV. During the period from November 18, 2022 through December 31, 2022, the Company earned $0.2 million in management fees from GDEV, which is included in Investment Management revenue on the Consolidated StatementStatements of Operations. As of December 31, 2022, the Company was not owed any management fees from GDEV. Management fee revenue earned under the advisory agreement with GDEV B is not considered intercompany revenue, and therefore is not eliminated in consolidation. During the period from May 19, 2022 through December 31, 2022, the Company earned $0.4 million in management fees from GDEV B, which is included in Investment Management revenue on the Consolidated StatementStatements of Operations. During the year ended December 31, 2023, the Company earned $2.4 million in management fees from GDEV I, which is included in Investment Management revenue on the Consolidated Statements of Operations. As of December 31, 2023 and 2022, the Company was not owed any management fees from GDEV I. As of December 31, 2023 and 2022, GDEV BI prepaid the Company management fees of nil and $0.6 million, in management fees to the Company,respectively, which is included in Other current liabilities on the Consolidated Balance Sheet.Sheets.
The Company is also eligible to receive certain performance-based incentive fee distributions from GDEV I, including upon liquidation of GDEV I, subject to certain distribution thresholds as defined in the amended and restated limited liability partnership agreements of GDEV I. The Company did not recognize any revenue related to GDEV I incentive fee distributions for the year ended December 31, 2023 and the period from May 19, 2022 through December 31, 2022.
Base management fees under GCM'sGCM’s advisory agreement with GDEV II, dated November 11, 2022, are calculated as follows.described herein. For the period from November 11, 2022 through the date on which the commitment period ends (as defined in the GDEV II amended and restated limited partnership agreement), the management fee is calculated at an annual rate of 1.50% to 2.00%, depending on the limited partner, of the aggregate capital commitments to GDEV II. Beginning on the date following the date on which the commitment period terminates, the management fee iswill be calculated at an annual rate of 1.50% to 2.00%, depending on the limited partner, of the aggregate cost basis of all portfolio securities of GDEV II. The management fees earned are payable quarterly in advance. During the year ended December 31, 2023 and the period from November 11, 2022 through December 31, 2022, the Company earned $2.0 million and $0.2 million, respectively, in management fees from GDEV II, which is included in Investment
Management revenue on the Consolidated StatementStatements of Operations. As of December 31, 2023 and 2022, the Company was owed $0.8 million and $0.2 million, respectively, in management fees from GDEV II, which is included in Accounts receivable on the Consolidated Balance Sheet.Sheets.
The Company is also eligible to receive certain performance-based incentive fee distributions from GDEV II, including upon liquidation of GDEV II, subject to certain distribution thresholds as defined in the amended and restated limited liability partnership agreements of GDEV II. The Company did not recognize any revenue related to GDEV II incentive fee distributions for the year ended December 31, 2023 or the period from November 11, 2022 through December 31, 2022.
Base management fees under GCM'sGCM’s advisory fee agreement with GREC II are to be calculated at a monthly rate of 1.25% annually of the aggregate NAV of the net assets attributable to Class F shares of GREC II plus an annual percentage of the aggregate NAV of the net assets attributable to Class I, Class D, Class T, and Class S shares in accordance with the following schedule:
| | | | | |
Aggregate NAV
(Class I, Class D, Class T, and Class S shares) | Management Fee |
| On NAV up to and including $1,500,000,000 | 1.75% (0.15% monthly) |
| On NAV in excess of $1,500,000,000 | 1.50% (0.13% monthly) |
Due toDuring the year ended December 31, 2023, the Company earned $3.9 million in management fees from GREC II's early stageII, which is included in Investment Management revenue on the Consolidated Statements of development,Operations. As of December 31, 2023, the Company was owed $2.3 million in management fees from GREC II, which is included in Accounts receivable on the Consolidated Balance Sheets. For the period from May 19, 2022 through December 31, 2022, the Company did not earn any management fees under the advisory agreement during the period from May 19, 2022 through December 31, 2022.due to GREC II’s early stage of development.
The Company is also eligible to receive certain performance-based incentive fees from GREC II, including upon liquidation of GREC II, subject to certain distribution thresholds as defined in the advisory agreement between GCM and GREC II. For the year ended December 31, 2023 and the period from May 19, 2022 through December 31, 2022, the Company recognized $1.7 million and $0.9 million, in revenuerespectively, related to GREC II performance-based incentive fees, which are included in OtherInvestment Management revenue on the Consolidated StatementStatements of Operations,Operations. As of December 31, 2023 and 2022, the Company was owed $0.5 million and $0.9 million, respectively, in performance-based incentive fees, asrespectively, which are included in Accounts receivable on the Consolidated Balance Sheets.
In addition, the Company earns administrative fee revenue for certain technical, financial, legal, accounting, tax and operational asset management services performed by Greenbacker Administration. Pursuant to the administration agreement between GREC II and Greenbacker Administration, GREC II will reimburse Greenbacker Administration for the costs and expenses incurred by Greenbacker Administration and any sub-administrators in performing their obligations and providing personnel and facilities to GREC II. During the year ended December 31, 2023, the Company earned $3.5 million in administrative fee revenue, which is included in Investment Management revenue on the Consolidated Statements of Operations. The Company did not recognize any administrative fee revenue for the period from May 19, 2022 through December 31, 2022. As of December 31, 2022,2023, the Company was owed $2.4 million in administrative fees from GREC II, which is included in Accounts receivable on the Consolidated Balance Sheet.Sheets.
During the year ended December 31, 2023, the Company guaranteed $34.9 million of costs to complete ongoing construction of certain facilities currently owned or to be acquired by GREC II pursuant to the terms and conditions of various construction related contracts. As of December 31, 2023, the Company was not aware of any events that could trigger the Company’s obligations under these guarantees. During March 2024, the Company assigned $18.1 million of guarantees to GREC II and intends to assign the remaining guarantees.
Other Related Party Transactions
The Company entered into secured loans to finance the purchase and installation of energy-efficient lighting with AEC Companies. Certain of the loans with LED Funding LLC, an AEC Company, converted to a lease on the day the energy efficiency upgrades became operational. AEC Companies are considered related parties as the members of these entities own a direct, noncontrolling ownership interest in the Company. The loans between the AEC Companies and the Company, and the subsequent leases, were negotiated at an arm’s length and contain standard terms and conditions that would be included in third-party lending agreements, including required security and collateral, interest rates based upon risk of the specific loan, and term of the loan. As of December 31, 2023 and 2022, the Company was owed $0.1 million and $0.1 million, respectively, in lease payments from AEC Companies, which is included in Accounts receivable on the Consolidated Balance Sheet.Sheets. As of December 31, 2023 and 2022, the principal balance of the loan receivable was $0.2 million and $0.3 million, respectively, which is included in Other noncurrent assets on the Consolidated Balance Sheet,Sheets. The interest receivable as of December 31, 2023 and interest receivable2022 was not material. PaymentsThe Company received payments of $0.1 million and $0.1 million on the operating leases and the loan receivable, respectively, during both the year ended December 31, 2023 and the period from May 19, 2022 through December 31, 2022 were $0.1 million.2022.
Note 15. Income Taxes
TheOn September 1, 2023, GREC (together with the Company) and Mehul Mehta entered into a separation agreement where Mr. Mehta’s role as Chief Investment Officer with the Company conducts most of its operations through GREC, its taxable wholly owned subsidiary. The Company’s consolidated income tax provision consists of the following:
| | | | | |
| Period from May 19, 2022 through December 31, 2022 |
Federal | $ | 984,603 | |
State | 2,019,115 | |
Foreign | 1,401 | |
Deferred provision for income taxes | $ | 3,005,119 | |
The principal differences between the Company's effective tax rateterminated on operationsSeptember 1, 2023, and the U.S. federal statutory income tax rateCompany engaged Mr. Mehta as a consultant. Pursuant to the separation agreement, Mr. Mehta will receive cash severance of December 31, 2022 are$1.3 million and a grant of 0.1 million cash-settled restricted share units, of which a certain portion vested on February 17, 2024, with the remainder vesting on February 17, 2025. Mr. Mehta’s previous grant of 0.1 million restricted share units were forfeited. A certain number of Mr. Mehta’s Earnout Shares will vest on an accelerated basis on May 19, 2024. Mr. Mehta will also have the ability to have Class P-I shares repurchased depending on whether the Company’s current SRP has been terminated or suspended. Refer to Note 19. Share-based Compensation for additional information on Mr. Mehta’s forfeited restricted share units and granted cash-settled restricted share units. All participating Earnout Shares and Class P-I shares were reclassified as follows:
| | | | | | | | |
| Period from May 19, 2022 through December 31, 2022 | Percentage |
| Tax (benefit) at statutory U.S. federal income tax rate | $ | (12,001,750) | | 21.0 | % |
| State income taxes, net of federal benefit | 937,456 | | (1.6) | % |
| Noncontrolling interest | 12,482,232 | | (21.8) | % |
| Share-based compensation | 1,441,163 | | (2.5) | % |
| Federal tax credits | (2,100,381) | | 3.7 | % |
| Change in valuation allowance | 657,644 | | (1.2) | % |
| Permanent differences (GREC LLC and other - net) | 1,588,755 | | (2.8) | % |
| Actual provision for income taxes | $ | 3,005,119 | | (5.2) | % |
Deferred tax assets (liabilities) have been classified on the accompanying Consolidated Balance Sheet as of December 31, 2022 as follows:
| | | | | |
| 2022 |
Net operating losses | $ | 98,911,035 | |
Federal tax credits | 16,251,724 | |
Operating lease liabilities | 14,281,891 | |
Asset retirement obligations | 5,286,656 | |
Disallowed interest | 5,027,580 | |
Other | 3,570,566 | |
Total deferred tax assets | 143,329,452 | |
Less: Valuation allowance | (2,170,000) | |
Deferred tax assets, net of valuation allowance | $ | 141,159,452 | |
| |
Investments in flow-through entities taxed as partnerships | $ | (41,666,863) | |
Derivative assets | (51,568,960) | |
Property, plant,temporary equity and equipment | (48,090,012) | |
Intangibles | (64,833,949) | |
Operating lease assets | (14,070,292) | |
Long-term debt | (4,657,929) | |
Total deferred tax liabilities | $ | (224,888,005) | |
Deferred tax liabilities, net | $ | 83,728,553 | |
The Company’s net deferred tax liability of $83.7 million consists of a deferred tax liability of $85.7 million, offset by a deferred tax asset of $1.9 million, which are recorded to Deferred tax liabilities, netwithin Redeemable common shares, par value and Other noncurrent assets, respectively,Redeemable common shares, additional paid-in capital on the Consolidated Balance Sheet.Sheets.
As of December 31, 2022,In addition, the Company has federal net operating loss carry-forwards of approximately $372.1 million. Approximately $322.6 millionentered into a consulting agreement with Mr. Mehta to provide certain consulting, transition and other services. The term of the carry-forwardconsulting agreement is indefinite livedfrom September 1, 2023 through January 2, 2024, with total consideration of $0.2 million paid in accordance with the remaining $49.5 million expiringCompany’s normal payroll schedule. The consulting agreement expired in 2034 through 2037. Federal tax credit carryforwards are approximately $16.3 million and expire in 2035 through 2042.
State net operating loss and carryforwards total approximately $383.2 million. Approximately $40.8 million of the net operating loss carry-forward is indefinite livedaccordance with the remaining $342.4 million expiring in 2023 through 2042 with earlier years expirations reserved by a valuation allowance.
In assessing the realizability of deferred tax assets, management considers whether it is more likely than not that some portion or all of the deferred tax assets will not be realized. As of December 31, 2022, management has applied a partialits terms on January 2, 2024.
valuation allowance of $2.2 million against the deferred tax assets resulting from certain state net operating loss carryforwards where it is more likely than not that they will not be utilized during their carryforward period.
Federal and state statutes of limitations are generally open for all years in which the Company has generated net operating losses, the earliest of which is the year ended December 31, 2014.
The Company assessed its tax positions for all open tax years as of December 31, 2022 for all U.S. federal and state, and foreign tax jurisdictions for the years 2014 through 2022. The results of this assessment are included in the Company’s tax provision and deferred tax assets as of December 31, 2022.
Note 16.17. Noncontrolling Interests and Redeemable Noncontrolling Interests
NCI represents the portion of net assets in consolidated subsidiaries that are not attributable, directly or indirectly, to the Company. For accounting purposes, the holders of NCI of consolidated subsidiaries of the Company include Tax Equity Investors under the tax equity financing facilities as well as the NCI in GDEV GP and GDEV GP II, which are held by an employee of the Company, and GDEV, which NCI was held by other limited partners of the partnership prior to the deconsolidation event on November 18, 2022.
Tax Equity Investors are passive investors, usually large tax-paying financial entities such as banks, insurance companies and utility affiliates that use these investments to reduce future tax liabilities. Depending on the arrangement, until the Tax Equity Investors achieve their agreed-upon rate of return, they are entitled to a portion of the applicable project’s operating cash flow as well as substantially all of the project’s investment tax credits, accelerated depreciation and taxable income or loss. Typically, tax equity financing transactions are structured so that the Tax Equity Investors reach their target return between five and 10 years after the applicable project achieves commercial operation. The Company has determined that the contractual arrangements with Tax Equity Investors represent substantive profit-sharing arrangements and that income or loss should be attributed to these NCIs in each period using a balance sheet approach referred to as the HLBV method. As of December 31, 2023, RNCI attributable to Tax Equity Investors after adjusting the carrying amount to the redemption value was $2.2 million, and nonredeemable NCI attributable to Tax Equity Investors was $113.7 million. As of December 31, 2022, RNCI attributable to Tax Equity Investors after adjusting the carrying amount to the redemption value was $2.0 million, and nonredeemable NCI attributable to Tax Equity Investors was $83.3 million. Net income (loss)loss attributable to noncontrolling interests for Tax Equity Investors was $(60.7)$95.7 million and $60.7 million for the year ended December 31, 2023 and the period from May 19, 2022 through December 31, 2022.2022, respectively. For the year ended December 31, 2023, contributions from Tax Equity Investors, net of syndication costs of $7.1 million, totaled $144.7 million, all of which was received in the period, and distributions to Tax Equity Investors totaled $17.0 million, of which $14.7 million was paid in the period. For the period from May 19, 2022 through December 31, 2022, contributions from Tax Equity Investors net of syndication costs totaled $82.7 million, all of which waswere received in the period, and distributions to Tax Equity Investors totaled $11.4 million, of which $8.6 million was paid in the period.
The Company allocates income and loss to the NCI in GDEV GP based on the contractual allocations within the GDEV GP operating agreement. As of December 31, 2023 and 2022, the NCI attributable to the GDEV GP was not material and $0.5 million.million, respectively. Net income (loss) attributable to noncontrolling interests at GDEV GP for the year ended December 31, 2023 and the period from May 19, 2022 through December 31, 2022 was not material.
The Company allocates income and loss to the NCI in GDEV GP II based on the contractual allocations within the GDEV GP II operating agreement. As of December 31, 2023 and 2022, the NCI attributable to the GDEV GP II was not material. There was no netNet income (loss) attributable to noncontrolling interests at GDEV GP II for the year ended December 31, 2023 and the period from May 19, 2022 through December 31, 2022.2022 was not material.
The noncontrolling interests in GDEV represented the component of equity held by limited partners, excluding the equity held by the Company, prior to the deconsolidation of GDEV on November 18, 2022 as discussed in Note 5. Variable Interest Entities. The portion of the net investment gains (losses) of GDEV attributable to the limited partner investors was allocated to noncontrolling interests prior to the deconsolidation. Net income (loss) attributable to noncontrolling interests at GDEV was $1.2 million for the period from May 19, 2022 through November 17, 2022. For the period from May 19, 2022 through November 17, 2022, contributions from the GDEV limited partners net of carried interest totaled $22.2 million, of which $22.2 million werewas received in the respective period. For the period from May 19, 2022 through November 17, 2022, distributions to the limited partners totaled $2.6 million, all of which were paid in the respective periods.period. As a result of the deconsolidation event on November 18, 2022, there was no NCI attributable to GDEV investors as of December 31, 2023 or 2022.
As of December 31, 2023 and 2022, NCI attributable to other noncontrolling interest was $0.2 million.million and $0.2 million, respectively.
Note 17. Members'18. Equity
General
Pursuant to the terms of the Fifth Operating Agreement, the Company may issue up to 400,000,000400.0 million shares, 350,000,000350.0 million of which shares are currently designated as Class A, C, I, P-A, P-D, P-S, P-T, P-I shares and Earnout Shares (collectively, common shares), and 50,000,00050.0 million are designated as preferred shares. Except as described below, each class of common shares will have the same voting rights and rights to participate in distributions payable by the Company.
In connection with the Acquisition, the Company issued 13,071,15313.1 million newly designated Earnout Shares to Group LLC pursuant to a certificate of share designation of Class EO common shares of the Company (the “Certificate of Designation”).The Certificate of Designation was subsequently amended and restated in February 2024 (the “Amended and Restated Certificate of Designation”). The Amended and Restated Certificate of Designation amended the provision providing for the allocation of net capital gains realized in connection with the actual or hypothetical sale of all or substantially all of the assets of the Company.. Earnout Shares are divided into three separate series, designated as “Tranche 1 Earnout Shares,” “Tranche 2 Earnout Shares,” and “Tranche 3 Earnout Shares,” and are comprised of 4,357,0514.4 million Tranche 1 Earnout Shares, 4,357,0514.4 million Tranche 2 Earnout Shares, and 4,357,0514.4 million Tranche 3 Earnout Shares. Each separate series of Earnout Shares initially do not have the right to participate in any distributions paid by the Company. However, upon the achievement of separate benchmark targets applicable to each series in accordance with the terms of the Amended and Restated Certificate of Designation, or upon the occurrence of certain liquidity events, each series of Earnout Shares can become “ParticipatingParticipating Earnout Shares”Shares and will become entitled to priority allocations of profits and increases in value from the Company, and will (i) have equivalent economic and other rights as the Class P-I shares of the Company, (ii) vote together as a single class with the Class P-I shares on all matters submitted to holders of Class P-I shares generally, (iii) not have separate voting rights on any matters (other than amendments to the terms of the Participating Earnout Shares that affect such Participating Earnout Shares adversely and in a manner that is different from the terms of the Class P-I shares), and (iv) have the right to participate in all distributions payable by the Company, as if they were, and on a pari passu basis with, the Class P-I shares for all purposes set forth in the Fifth Operating Agreement. Prior to the satisfaction of these targets as per the terms and conditions of the Amended and Restated Certificate of Designation, Earnout Shares will not be entitled to (x) vote with other shares on matters submitted to the holders of shares generally or (y) receive any distributions made to any other holders of shares (and will not be entitled to any accrual of distributions prior to achieving the targets described in the Amended and Restated Certificate of Designation). As of December 31, 2023, certain Earnout Shares have earned participating status as discussed in Earnout Shares below.
In connection with the Acquisition, Group LLC received consideration of 24,393,02524.4 million Class P-I shares and 13,071,15313.1 million Earnout Shares. Holders of the Class P-I shares or Earnout Shares issued pursuant to the Contribution Agreement will not be permitted to sell or transfer the Class P-I shares or Earnout Shares for twelve months after the closing date of the Acquisition.
The Company offers shares pursuant to the DRP, and offers an SRP pursuant to which quarterly share repurchases are conducted to allow shareholders to sell shares back to the Company.
The following table is a summary of the shares issued and repurchased during the period and outstanding as of December 31, 2022:
| | | | | | | | | | | | | | | | | | | | | | | | | | | | | | | | | | | | | | | | | |
| Shares Outstanding as of May 19, 2022 | | Shares Issued to Complete the Acquisition | | Other Capital Activity | | Shares Issued through Reinvestment of Distributions During the Period | | Shares Repurchased During the Period | | Shares Transferred During the Period | | Shares Outstanding as of December 31, 2022 |
| Class A | 16,626,973 | | — | | (23,601) | | 278,470 | | (740,845) | | — | | 16,140,997 |
| Class C | 2,766,760 | | — | | — | | 61,152 | | (154,918) | | — | | 2,672,994 |
| Class I | 6,445,062 | | — | | — | | 157,542 | | (199,413) | | — | | 6,403,191 |
| Class P-A | 794,193 | | — | | — | | 21,867 | | (1,160) | | — | | 814,900 |
| Class P-I | 103,334,227 | | 24,393,025 | | 45,664 | | 810,287 | | (3,504,789) | | 235,570 | | 125,313,984 |
| Class P-D | 198,948 | | — | | (2,776) | | 837 | | (5,436) | | — | | 191,573 |
| Class P-S | 47,047,838 | | — | | — | | 456,028 | | (1,008,419) | | (233,990) | | 46,261,457 |
| Class P-T | 241,447 | | — | | — | | 3,867 | | — | | — | | 245,314 |
| Total | 177,455,448 | | 24,393,025 | | 19,287 | | 1,790,050 | | (5,614,980) | | 1,580 | | 198,044,410 |
As of December 31, 2022, none of the Company’s preferred shares were issued and outstanding.
The Fifth Operating Agreement authorizes the Company'sCompany’s Board of Directors, without approval of any of the members, to increase the number of shares the Company is authorized to issue and to classify and reclassify any authorized but unissued class or series of shares into any other class or series of shares having such designations, preferences, right, power and duties as may be specified by the Company's Board of Directors. The Fifth Operating Agreement also authorizes the Company's Board of Directors, without approval of any of the members, to issue additional shares of any class or series for the consideration and on the terms and conditions established by the Company's Board of Directors. In addition, the Company may also issue additional limited liability company interests that have designations, preferences, right, powers and duties that are different from, and may be senior to, those applicable to the common shares.
Distribution Reinvestment Plan
The Company adopted a DRP through which the Company’s Class A, C and I shareholders could elect to purchase additional shares with distributions from the Company rather than receiving the cash distributions. The DRP was amended as of February 1, 2021 to include all share classes. Shares issued pursuant to the DRP will have the same voting rights as shares offered pursuant to the Company's prior public and private offerings. As of November 30, 2020,April 17, 2023, pursuant to the Company's Registration StatementCompany’s Post-Effective Amendment No. 1 to Form S-3 on Form S-3DS-1 (File No. 333-251021), itthe Company was offering up to $20.0 million in Class A, C and I shares to its existing Class A, C, and I shareholders pursuant to the Third Amended and Restated DRP. As of January 17, 2024, the Company ceased offering the shares under the previously effective registration statement, and pursuant to the Company’s new registration statement on Form S-3 (File No. 333-276532), the Company is offering up to $20.0 million in Class A, C and I shares to its existing Class A, C and I shareholders pursuant to the Third Amended and Restated DRP. No dealer manager fees, selling commissions or other sales charges will be paid with respect to shares issued pursuant to the DRP except for distribution fees on Class C, P-S and P-T shares.shares (as discussed in Note 2. Significant Accounting Policies). At its discretion, the Board of Directors may amend, suspend or terminate the DRP. The Board of Directors may alsoDRP as well as modify or waive the terms of the DRP with respect to certain or all shareholders, in its discretion, to be in the best interests of the Company. A participant may terminate participationthe election to participate in the DRP by written notice to the plan administrator received by the plan administrator at least 10 days prior to the distribution payment date.
As of December 31, 2022,2023, the Company issued 2,854,5083.3 million Class A shares, 501,8160.6 million Class C shares, 1,387,9451.6 million Class I shares, 48,8990.1 million Class P-A shares, 1,592,4762.8 million Class P-I shares, 2,3803.7 thousand Class P-D shares, 938,0831.6 million Class P-S shares, and 8,19014.4 thousand Class P-T shares for a total of 7,334,29710.0 million aggregate shares issued under the DRP. As of December 31, 2022, the Company issued 2.9 million Class A shares, 0.5 million Class C shares, 1.4 million Class I shares, 48.9 thousand Class P-A shares, 1.6 million Class P-I shares, 2.4 thousand Class P-D shares, 0.9 million Class P-S shares, and 8.2 thousand Class P-T shares for a total of 7.3 million aggregate shares issued under the DRP.
Share Repurchase Program
The Company, offers anthrough approval by its Board of Directors, adopted the SRP, pursuant to which the Company would conduct quarterly share repurchases are conducted to allow members to sell all or a portion of their shares (of any class) back to the Company at a price equal to the then current monthly share value for that class of shares.
The SRP includes numerous restrictions that will limit a shareholder’s ability to sell shares. At the sole discretion of the Board of Directors, the Company may also use cash on hand (including the proceeds from the issuance of new shares), cash available from borrowings or other external financing sources and cash from liquidation of investments to repurchase shares.
A shareholders’ right to purchase is subject to the availability of funds and the other provisions of the SRP. Additionally, a membershareholder must hold his or her shares for a minimum of one year before he or she can participate in the SRP, subject to any of the following special circumstances: (i) the written request of the estate, heir or beneficiary or a deceased shareholder; (ii) a qualifying disability of the shareholder for a non-temporary period of time provided that the condition causing the qualifying disability was not pre-existing on the date that the shareholder became a shareholder; (iii) a determination of incompetence of the shareholder by a state or federal court located in the United States; or (iv) as determined by the Board of Directors, in their discretion, to be in the interests of the Company. If a member has made more than one purchase of shares, the one-year holding period will be calculated separately with respect to each purchase.
Effective September 1, 2020, the Company, through approval by its Board of Directors, adopted an amended SRP, pursuant to which the Company will conduct quarterly share repurchases to allow members to sell all or a portion of their shares (of any class) back to the Company. The quarterly share repurchases limits for the Company’s new SRP are set forth below.
| | | | | |
| Quarter Ending | Share Repurchase Limit(s) |
| September 30, 2021, and each quarter thereafter | During any 12-month period, 20.00% of the weighted average number of outstanding shares |
| During any fiscal quarter, 5.00% of the weighted average number of shares outstanding in the prior four fiscal quarters |
The Company may repurchase fewer shares than have been requested in any particular quarter to be repurchased under the SRP, or none at all, in its discretion at any time. Further, the Board of Directors may modify, suspend or terminate the SRP if it deems such action to be in the best interest of the Company and its shareholders or in response to regulatory changes or changes in law.
On September 23, 2023, the Board of Directors approved the suspension of the SRP effective immediately, except for repurchase requests made in connection with the death, qualifying disability or determination of incompetence of a shareholder. As a result of the suspension of the SRP, the Company will not accept or otherwise process any additional repurchase requests (except as noted above) until such time, if any, as the Board of Directors affirmatively authorizes the recommencement of the SRP. However, the Company can make no assurances as to whether this will happen or the timing or terms of any recommencement.
The Company delayed the payment with respect to the shares repurchased by the Company for the second quarter and distributed related proceeds in the fourth quarter of 2023. The Company also paid an additional supplemental payment to these redeeming shareholders based on the amount of distributions that the redeeming shareholders would have received from July 1, 2023 through the final date on which the shares are paid, had the Company not repurchased the shares. During the year ended December 31, 2023, the Company recorded and paid $0.7 million related to this supplemental payment to Interest expense, net on the Consolidated Statements of Operations.
The Company has received an order for the SRP from the SEC under Rule 102(a) of Regulation M under the Exchange Act. In addition, the SRP is substantially similar to repurchase programs for which the SEC has stated it will not recommend enforcement action under Rule 13e-4 and Regulation 14E under the Exchange Act.
Liquidation Performance Unit
In connection with the Acquisition, the Company issued a new Liquidation Performance Unit (the “LPU”) to the LPU Holder to replace the Special Unit previously issued to GCM. The Special Unit was contributed in connection with and immediately prior to the Acquisition from Group LLC, and therefore, was cancelled and terminated. The LPU Holder was formed on May 19, 2022 with the sole purpose of holding the LPU and is a wholly owned subsidiary of Group LLC.
Upon As per the terms of the agreement, upon an initial public offering of GREC (the “Listing”) or the liquidation of the Company, the LPU Holder shall be entitled to the Liquidation Performance Participation Distribution, the value and character of which is determined as follows:
a.if the Liquidation Performance Participation Distribution is payable as a result of a liquidation, the Liquidation Performance Participation Distribution will equal 20.00% of the net proceeds from the liquidation remaining after the other members of the Company have received their share of net proceeds; or
b.if the Liquidation Performance Participation Distribution is payable as a result of a Listing, the Liquidation Performance Participation Distribution will equal 20.00% of any premium the Company receives from the Listing. Additionally, the Liquidation Performance Participation Distribution shall be payable by converting the LPU into a number of newly issued Class P-I shares equal to the Liquidation Performance Participation Distribution divided by the Class P-I share value as of the first month end following the 30th trading day following such an IPO.
Since none of the events that would trigger the Liquidation Performance Participation Distribution was considered probable to occur, no liability was recognized related to the LPU as of December 31, 2022.2023.
Additionally, certain employees of the Company received profits interest units from the LPU Holder in exchange for employment services. Since the LPU Holder does not have any other operations or assets, the distribution an employee grantee shall receive from these profits interest units is the equivalent of the Liquidation Performance Participation Distribution the Company shall make to the LPU Holder. The Company has determined that the profits interest units do not represent a substantive class of the Company’s equity, and therefore, shall account for the potential distribution to employees as a payable in accordance with ASC 710.Topic 710, Compensation—General. Since none of the events that would trigger the distribution was considered probable to occur, no liability was recognized as of December 31, 2022,2023, and no compensation expensesexpense was recognized for the period fromyear ended December 31, 2023.
Earnout Shares
As discussed in Note 3. Acquisitions, on May 19, 2022, throughthe Company completed a management internalization transaction pursuant to which it acquired substantially all of the business and assets including intellectual property and personnel of its external advisor, GCM, Greenbacker Administration and GDEV GP (collectively, the “Acquired Entities”).
The Acquisition was implemented under the terms of the Contribution Agreement, dated as of May 19, 2022, by and between the Company and GCM's former parent, Group LLC, a subsequent contribution agreement between the Company and GREC pursuant to which all the acquired businesses and assets were immediately contributed by the Company to GREC, and certain related agreements.
In connection with the Acquisition, Group LLC received consideration of 24.4 million Class P-I common shares, par value $0.001 per share (the “Class P-I shares”) and 13.1 million of a newly created class of common shares of the Company designated as the Earnout Shares, par value $0.001 per share.
The Earnout Shares included in purchase consideration are classified as contingent consideration liabilities and are subject to recurring fair value measurements until they reach the status of Participating Earnout Shares. As of December 31, 2022.2023, the Run Rate Revenue exceeded $8.3 million but was less than $12.5 million. Accordingly, a total of 3.7 million Tranche 1 Earnout Shares with a fair value of $32.8 million achieved the status of Participating Earnout Shares for the year ended December 31, 2023, which was reclassified from Contingent consideration to Common stock, par value, and Additional paid-in capital, as well as Redeemable common shares, par value and Redeemable common shares, additional paid-in capital on the Consolidated Balance Sheets. As of December 31, 2023 and 2022, the fair value of the Earnout Shares that had not yet achieved the status of Participating Earnout Shares was $42.3 million and $75.7 million, respectively. The change in fair value of the contingent consideration related to Participating Earnout Shares is reclassified from Contingent consideration to Common shares, par value, and Additional paid-in capital, as well as Redeemable common shares, par value and Redeemable common shares, additional paid-in capital on the Consolidated Balance Sheets. The change in fair value of the contingent consideration, excluding the reclassification associated with Earnout Shares that achieved the status of Participating Earnout Shares, is included in General and administrative expense on the Consolidated Statements of Operations.
As of December 31, 2023, none of the Company’s preferred shares were issued and outstanding.
The following table is a summary of the shares issued, participating and repurchased during the period and outstanding as of December 31, 2023:
| | | | | | | | | | | | | | | | | | | | | | | | | | | | | | | | | | | | | | | | | | | | | | | | | | | | | | | | | | | | | | |
| (in thousands) | | Class A | | Class C | | Class I | | Class P-A | | Class P-I | | Class P-D | | Class P-S | | Class P-T | | Class EO(1) | | Total |
| Shares outstanding as of May 19, 2022 | | 16,627 | | | 2,767 | | | 6,445 | | | 794 | | | 103,334 | | | 199 | | | 47,048 | | | 241 | | | — | | | 177,455 | |
| Shares issued to complete the acquisition | | — | | | — | | | — | | | — | | | 24,393 | | | — | | | — | | | — | | | — | | | 24,393 | |
| Shares issued through reinvestment of distributions | | 278 | | | 61 | | | 158 | | | 22 | | | 810 | | | 1 | | | 456 | | | 4 | | | — | | | 1,790 | |
| Shares repurchased | | (741) | | | (155) | | | (199) | | | (1) | | | (3,505) | | | (6) | | | (1,008) | | | — | | | — | | | (5,615) | |
| Shares transferred | | — | | | — | | | — | | | — | | | 236 | | | — | | | (234) | | | — | | | — | | | 2 | |
| Other capital activity | | (24) | | | — | | | — | | | — | | | 46 | | | (3) | | | — | | | — | | | — | | | 19 | |
| Shares outstanding as of December 31, 2022 | | 16,140 | | | 2,673 | | | 6,404 | | | 815 | | | 125,314 | | | 191 | | | 46,262 | | | 245 | | | — | | | 198,044 | |
| Shares issued through reinvestment of distributions | | 411 | | | 93 | | | 238 | | | 35 | | | 1,180 | | | 1 | | | 671 | | | 7 | | | — | | | 2,636 | |
| Shares repurchased | | (742) | | | (60) | | | (109) | | | — | | | (2,741) | | | — | | | (2,156) | | | (3) | | | — | | | (5,811) | |
| Shares transferred | | — | | | — | | | — | | | — | | | 264 | | | — | | | (263) | | | — | | | — | | | 1 | |
| Other capital activity | | — | | | — | | | — | | | — | | | 22 | | | — | | | — | | | — | | | 3,730 | | | 3,752 | |
| Shares outstanding as of December 31, 2023 | | 15,809 | | | 2,706 | | | 6,533 | | | 850 | | | 124,039 | | | 192 | | | 44,514 | | | 249 | | | 3,730 | | | 198,622 | |
(1)Class EO Other capital activity relates to shares that achieved participating Earnout Share status as discussed in Earnout Shares above.
Distributions
On the last business day of each month, with the authorization of the boardits Board of directors of the Company (the “Board of Directors”),Directors, the Company declares distributions on each outstanding Class A, C, I, P-A, P-I, P-D, P-T, P-S shares and P-S shares.Earnout Shares. These distributions are calculated based on shareholders of record for each day in amounts equal to that exhibited in the table below based upon distribution period and class of share.
| | Class of Share |
| | | | Class of Share | | | | | | Class of Share |
| Distribution Period | Distribution Period | | A | | C | | I | | P-A | | P-I | | P-D | | P-T | | P-S | Distribution Period | | A | | C | | I | | P-A | | P-I | | P-D | | P-T | | P-S | | EO |
| 1-Nov-15 | 1-Nov-15 | | 31-Jan-16 | | $ | 0.00165 | | | $ | 0.00165 | | | $ | 0.00165 | | | $ | — | | | $ | — | | | $ | — | | | $ | — | | | $ | — | |
| 1-Feb-16 | 1-Feb-16 | | 30-Apr-16 | | $ | 0.00166 | | | $ | 0.00166 | | | $ | 0.00166 | | | $ | — | | | $ | — | | | $ | — | | | $ | — | | | $ | — | |
| 1-May-16 | 1-May-16 | | 31-Jul-16 | | $ | 0.00166 | | | $ | 0.00166 | | | $ | 0.00166 | | | $ | 0.00158 | | | $ | 0.00158 | | | $ | — | | | $ | — | | | $ | — | |
| 1-Aug-16 | 1-Aug-16 | | 31-Oct-16 | | $ | 0.00168 | | | $ | 0.00168 | | | $ | 0.00168 | | | $ | 0.00160 | | | $ | 0.00160 | | | $ | — | | | $ | — | | | $ | — | |
| 1-Nov-16 | 1-Nov-16 | | 31-Jan-17 | | $ | 0.00169 | | | $ | 0.00164 | | | $ | 0.00169 | | | $ | 0.00160 | | | $ | 0.00160 | | | $ | — | | | $ | — | | | $ | — | |
| 1-Feb-17 | 1-Feb-17 | | 30-Apr-17 | | $ | 0.00168 | | | $ | 0.00164 | | | $ | 0.00168 | | | $ | 0.00160 | | | $ | 0.00160 | | | $ | — | | | $ | — | | | $ | — | |
| 1-May-17 | 1-May-17 | | 31-Jul-17 | | $ | 0.00167 | | | $ | 0.00163 | | | $ | 0.00167 | | | $ | 0.00160 | | | $ | 0.00158 | | | $ | — | | | $ | — | | | $ | — | |
| 1-Aug-17 | 1-Aug-17 | | 31-Oct-17 | | $ | 0.00167 | | | $ | 0.00163 | | | $ | 0.00167 | | | $ | — | | | $ | 0.00159 | | | $ | — | | | $ | — | | | $ | — | |
| 1-Nov-17 | 1-Nov-17 | | 31-Oct-18 | | $ | 0.00167 | | | $ | 0.00163 | | | $ | 0.00167 | | | $ | — | | | $ | 0.00158 | | | $ | — | | | $ | — | | | $ | — | |
| 1-Nov-18 | 1-Nov-18 | | 30-Apr-20 | | $ | 0.00167 | | | $ | 0.00163 | | | $ | 0.00167 | | | $ | 0.00165 | | | $ | 0.00158 | | | $ | — | | | $ | — | | | $ | — | |
| 1-May-20 | 1-May-20 | | 30-Nov-20 | | $ | 0.00152 | | | $ | 0.00149 | | | $ | 0.00152 | | | $ | 0.00153 | | | $ | 0.00158 | | | $ | — | | | $ | — | | | $ | — | |
| 1-Dec-20 | 1-Dec-20 | | 31-Dec-22 | | $ | 0.00152 | | | $ | 0.00149 | | | $ | 0.00152 | | | $ | 0.00152 | | | $ | 0.00158 | | | $ | 0.00158 | | | $ | 0.00158 | | | $ | 0.00158 | |
| 1-Jul-23 | |
OnThe following table reflects the last business daydistributions declared during the year ended December 31, 2023:
| | | | | | | | | | | | | | | | | | | | |
| (in thousands) | | | | | | |
| Pay Date | | Paid in Cash | | Value of Shares Issued under DRP | | Total |
| February 1, 2023 | | $ | 7,386 | | | $ | 1,975 | | | $ | 9,361 | |
| March 1, 2023 | | 6,679 | | | 1,777 | | | 8,456 | |
| March 31, 2023 | | 7,420 | | | 1,942 | | | 9,362 | |
| May 1, 2023 | | 7,114 | | | 1,888 | | | 9,002 | |
| June 1, 2023 | | 7,373 | | | 1,934 | | | 9,307 | |
| July 3, 2023 | | 7,145 | | | 1,871 | | | 9,016 | |
| August 1, 2023 | | 7,232 | | | 1,926 | | | 9,158 | |
| September 1, 2023 | | 7,226 | | | 1,935 | | | 9,161 | |
| October 2, 2023 | | 7,003 | | | 1,872 | | | 8,875 | |
| November 2, 2023 | | 7,352 | | | 1,841 | | | 9,193 | |
| December 1, 2023 | | 7,964 | | | 1,746 | | | 9,710 | |
| January 2, 2024 | | 7,606 | | | 1,786 | | | 9,392 | |
| Total | | $ | 87,500 | | | $ | 22,493 | | | $ | 109,993 | |
The following table reflects the distributions declared during the period from May 19, 2022 through December 31, 2022:
| | (in thousands) | |
| Pay Date | |
| Pay Date | |
| Pay Date | Pay Date | | Paid in
Cash | | Value of
Shares
Issued under DRP | | Total | | Paid in cash | | Value of Shares Issued under DRP | | Total |
| June 1, 2022 | June 1, 2022 | | $ | 6,954,111 | | | $ | 2,020,049 | | | $ | 8,974,160 | |
| July 1, 2022 | July 1, 2022 | | 7,344,811 | | | 1,889,655 | | | 9,234,466 | |
| August 1, 2022 | August 1, 2022 | | 7,570,118 | | | 1,955,461 | | | 9,525,579 | |
| September 1, 2022 | September 1, 2022 | | 7,564,952 | | | 1,973,079 | | | 9,538,031 | |
| October 3, 2022 | October 3, 2022 | | 7,312,905 | | | 1,922,613 | | | 9,235,518 | |
| November 1, 2022 | November 1, 2022 | | 7,507,085 | | | 1,986,513 | | | 9,493,598 | |
| December 1, 2022 | December 1, 2022 | | 7,270,876 | | | 1,930,103 | | | 9,200,979 | |
| January 3, 2023 | January 3, 2023 | | 7,702,756 | | | 1,967,527 | | | 9,670,283 | |
| Total | Total | | $ | 59,227,614 | | | $ | 15,645,000 | | | $ | 74,872,614 | |
All distributions paid for the year ended December 31, 2023 and the period from May 19, 2022 through December 31, 2022 are expected to be reported as a return of capital to members for tax reporting purposes.
Cash distributions for the year ended May 19, 2022 through December 31, 20222023 were funded from cash on hand and other external financing sources. The Company expects to continue to fund distributions from a combination of cash on hand, cash from operations as well as other external financing sources. Due to the Company’s change in acquisition strategy to include a greater number ofown pre-operational assets that are not yet generating cash from operations as well as the Company’s strategy of engaging in initiatives that include repowering projects where the existing assets are being retrofit with new and/or refurbished technology, including erecting taller, more efficient wind turbines to increase productivity, a significant amount of distributions will continue to be funded from other external financing sources until such projects become operational. Management fee and incentive fee revenue from our IM segment willis also be utilized as a source of capital to fund distributions as this portion of our business grows.
Beginning July 1, 2023, the Company authorized and declared distributions for Earnout Shares in cash.
Note 19. Share-based Compensation
In May 2023, the Company’s Board of Directors adopted the 2023 Equity Incentive Plan, which authorized an aggregate of 5% of the common shares that are issued and outstanding as Class P-I shares for issuance to employees and non-employee directors. The maximum number of common shares authorized will be automatically increased by 1% on each anniversary of the effective date of the 2023 Equity Incentive Plan, until the total aggregate amount of issuable shares is 10% of the common shares issued and outstanding. The 2023 Equity Incentive Plan allows for the issuance of certain share awards. The Company’s Board of Directors determines the period over which share-based awards become exercisable and awards generally vest over a one to four-year period. As of December 31, 2023, there were 8.5 million shares available for future grants under the 2023 Equity Incentive Plan.
Share-based compensation expense is recognized within Direct operating costs and General and administrative expense on the Consolidated Statements of Operations. The Company accounts for forfeitures as they occur. The following table summarizes share-based compensation expense recognized during the year ended December 31, 2023:
| | | | | | | |
| (in thousands) | | | For the year ended December 31, 2023 |
| Restricted share units | | | $ | 370 | |
| Cash-settled restricted share units | | | 678 | |
| Performance restricted share units | | | 441 | |
| Director’s fees | | | 195 | |
GDEV I incentive fees(1) | | | 919 | |
| GDEV II special profits interest | | | 164 | |
EO Awards(2) | | | 8,481 | |
| Total | | | $ | 11,248 | |
(1) The GDEV I incentive fees are carried interest that were issued by GDEV GP to certain employees of GCM that provided services to GDEV GP. Refer to Note 3. Acquisitions for additional information.
(2) The Earnout Shareswere granted in connection with the Acquisition. Refer to Note 3. Acquisitions for additional information.
Restricted Share Units
The Company grants service-based restricted share units to employees and non-employee directors under the 2023 Equity Incentive Plan. Compensation expense for these service-based restricted share units is based on the MSV of the Company’s Class P-I shares on the business day prior to grant and is recognized ratably over the service period. There were 0.4 million of restricted share units granted during the year ended December 31, 2023 with a weighted average fair value of $8.03 per share. Unrecognized compensation expense related to restricted share units as of December 31, 2023 was $1.7 million, which the Company expects to recognize over a weighted average period of 1.56 years.
The following table provides a summary of the restricted share unit activity during the year ended December 31, 2023:
| | | | | | | | | | | |
| (in thousands, except for per share data) | Restricted Share Units | | Weighted Average Fair Value |
| Unvested balance as of December 31, 2022 | — | | $ | — | |
| Granted | 352 | | $ | 8.03 | |
| | | |
| Forfeited | (85) | | $ | 8.83 | |
| Unvested balance as of December 31, 2023 | 267 | | $ | 7.78 | |
Forfeited units during the year ended December 31, 2023 were re-granted as cash-settled restricted share units.
Cash-Settled Restricted Share Units
As discussed in Note 16. Related Parties, in September 2023, 0.1 million previously issued restricted share units were forfeited and the Company simultaneously awarded 0.1 million new cash-settled restricted share units to a former employee of the Company. Of these cash-settled restricted share units, 67% will vest on February 17, 2024, and 33% will vest on February 17, 2025 if the employee does not violate the terms of a restrictive covenant set forth in such former employee’s separation agreement with the Company. The awards were fully vested on the grant date because the restrictive covenant does not create a substantive service condition. The fair value of these cash-settled restricted share units was $0.7 million on the grant date. The cash-settled restricted share units are measured at fair value each quarter until settled. The change in the fair value of the cash-settled restricted share units from the grant date through December 31, 2023 was not material.
Performance Restricted Share Units
In August 2023, the Company granted performance restricted share units of up to 1.1 million shares of the Company’s Class P-I shares to certain employees. The awards had a grant date fair value of approximately $4.7 million using a Black-Scholes-Merton model. The performance restricted share units are both a market and service-based award in accordance with ASC 718. Shares under this award will be earned based on total shareholder return between May 23, 2023 and May 23, 2026. Shares earned will vest on August 9, 2027. The Company will recognize the entire $4.7 million of compensation expense for this award, regardless of whether such conditions are met, over the requisite service period unless units are forfeited during the period.
The following table summarizes the assumptions and related information used to determine the grant-date fair value of performance restricted share units awarded for the August 2023 performance restricted share unit grant:
| | | | | | | | |
| Inputs | | Performance Restricted Share Units |
| Weighted average grant-date fair value per Class P-I share | | $ | 8.76 |
| Performance period (in years) | | 3.0 |
| Expected share volatility | | 32.2 | % |
| Dividend yield | | — | % |
| Daily distribution rate | | $ | 0.00158 |
| Risk-free interest rate | | 4.5 | % |
The following table provides a summary of performance restricted share unit activity during the year ended December 31, 2023:
| | | | | | | | | | | | | |
| (in thousands, except per share data) | Performance Restricted Share Units | | Weighted Average Fair Value | | |
| Unvested balance as of December 31, 2022 | — | | $ | — | | | |
| Granted | 1,067 | | $ | 4.40 | | | |
| | | | | |
| | | | | |
| Unvested balance as of December 31, 2023 | 1,067 | | $ | 4.40 | | | |
EO Awards
The Company recognized share-based compensation expenses of $8.5 million and $6.9 million for the year ended December 31, 2023 and the period from May 19, 2022 through December 31, 2022, respectively, related to the EO Awards, which are included in General and administrative expenses in the Consolidated Statements of Operations. As of December 31, 2023, unrecognized share-based compensation expense associated with the EO Awards is $15.2 million, which is expected to be amortized over a weighted average period of 2.0 years. The Company recognized total forfeitures of $2.2 million and $0.1 million during the year ended December 31, 2023 and the period from May 19, 2022 through December 31, 2022, respectively. Refer to Note 3. Acquisitions for additional details.
GDEV I Incentive Fees
The GDEV I incentive fees were carried interest issued by GDEV GP to certain employees of GCM that provided services to GDEV GP. The Company accounts for the carried interests issued to employees in accordance with ASC 710. The carried interests issued to employees are liability classified, and compensation expense for the carried interests is based on the change in the fair value of the carried interests. For the year ended December 31, 2023 and the period from May 19, 2022 through December 31, 2022, the compensation expense recognized on the carried interests was $0.9 million and $0.4 million, respectively, which are included in General and administrative expenses in the Consolidated Statements of Operations. Refer to Note 3. Acquisitions for additional details.
Note 18.20. Earnings Per Share
BasicThe following table sets forth the computation of basic and diluted earnings per share is calculated by dividing netfor the periods indicated:
| | | | | | | | | | | | | | | |
| (in thousands, except per share data) | | | | | For the year ended December 31, 2023 | | For the period from May 19, 2022 through December 31, 2022 |
| Basic and diluted: | | | | | | | |
| Net loss attributable to Greenbacker Renewable Energy Company LLC | | | | | $ | (79,471) | | | $ | (724) | |
| | | | | | | |
| | | | | | | |
| Weighted average common shares outstanding used in computing net loss per share—basic | | | | | 199,293 | | 201,668 |
| | | | | | | |
| Weighted average common shares outstanding used in computing net loss per share—diluted | | | | | 199,293 | | 201,668 |
| | | | | | | |
| Net loss attributable to Greenbacker Renewable Energy Company LLC | | | | | | | |
| Net loss per share—basic | | | | | $ | (0.40) | | | $ | 0.00 | |
| Net loss per share—diluted | | | | | $ | (0.40) | | | $ | 0.00 | |
Securities that could potentially be dilutive are excluded from the computation of diluted loss attributableper share when a loss from continuing operations exists because their inclusion would result in an anti-dilutive effect on per share amounts. The effect of 1.4 million shares related to the common shareholdersCompany’s share-based compensation awards for the year ended December 31, 2023 were excluded from the calculation of the Company by the weighted average number of common shares outstanding during the period.
The following table reconciles the numerator and the denominator used to calculate basicdiluted earnings per share:share as effect of such shares would have been anti-dilutive. The Company did not have any potentially dilutive shares for the period from May 19, 2022 through December 31, 2022.
| | | | | | | | |
| | Period from May 19, 2022 through December 31, 2022 |
Numerator | | |
Net loss attributable to Greenbacker Renewable Energy Company LLC | | $ | (724,977) | |
| | |
Denominator | | |
Weighted average shares, basic | | 201,667,520 |
| | |
Net loss attributable to Greenbacker Renewable Energy Company LLC | | |
Basic | | $ | 0.00 | |
Note 19.21. Segment Reporting
The Company determines its operating segments and reports segment information in accordance with how the Company’s CODM allocates resources and assesses performance. The Company’s CODM is its Chief Executive Officer. The Company’s operating segments are aggregated into two reportable segments, described below.below:
•IPP – The IPP business represents the active management and operations of the Company's fleet of renewable energy projects, including those in late-stage development and under construction. The Company's renewable energy projects generally earn revenue through the sale of generated electricity as well as frequently through the sale of other commodities such as RECs. In certain cases, the Company also serves as a minority member in renewable energy projects where it does not actively manage and operate the project but receives periodic dividends. The Company also
provides loans to developers for the construction of renewable energy and energy efficiency projects as an incremental revenue stream for IPP.
The IPP business includes the direct costs to operate the Company's fleet, including costs such as operations and maintenance, repairs, and other costs incurred at the project / site level. Additionally, the Company employs a dedicated team of technical asset managers as well as a construction team to oversee the development and operations of our fleet. Such costs are recorded as Direct operating costs for IPP.
The IPP business also includes the allocable portion of the Company’s General and administrative expenses, which represents overhead functions such as: finance and accounting, legal, information technology, human resources and other general functions that support the operations of IPP.
•IM – The IM business represents GCM’s investment management platform, –which is a renewable energy, energy efficiency and sustainability-related project acquisition, consulting and development company that is registered as an investment adviser under the Advisers Act. The IM business will also includeincludes administrative services provided by Greenbacker Administration for managed funds in the renewable energy industry as an additional revenue stream.
The Company's IM business includes the direct costs incurred for the investment management services for managed funds and other marketing and investor relation services. This includes the costs to raise and deploy capital for such funds. Such costs are recorded as Direct operating costs for IM.
The IM business also includes the allocable portion of the Company’s General and administrative expenses, which represents overhead functions such as: finance and accounting, legal, information technology, human resources and other general functions that support the operations of IM.
The following table presents the Company’s reportable segment financial results:
| | | | | | | | |
| | Period from May 19, 2022 through December 31, 2022 |
Energy revenue | | $ | 101,595,947 | |
Other revenue | | 7,505,530 | |
Contract amortization, net | | (10,529,266) | |
Total IPP revenue | | $ | 98,572,211 | |
| | |
Investment Management revenue | | $ | 1,918,911 | |
| | | | | | | | | | | | | | | |
| (in thousands) | | | | | For the year ended December 31, 2023 | | For the period from May 19, 2022 through December 31, 2022 |
| Energy revenue | | | | | $ | 159,301 | | | $ | 101,596 | |
| Other revenue | | | | | 8,434 | | | 7,506 | |
| Contract amortization, net | | | | | (8,060) | | | (10,529) | |
| Total IPP revenue | | | | | $ | 159,675 | | | $ | 98,573 | |
| | | | | | | |
| Investment Management revenue | | | | | $ | 13,490 | | | $ | 1,919 | |
The Company's CODM evaluates the financial performance of each segment using Segment Adjusted EBITDA, which excludes: (i) unallocated corporate expenses; (ii) interest expense; (iii) income taxes; (iv) depreciation expense; (v) amortization expense (including contract amortization); (vi) accretion; (vi)(vii) impairment of long-lived assets; (viii) share-based compensation; (vii)(ix) other non-recurring costs that are unrelated to the continuing operations of the Company'sCompany’s segments; and (viii)(x) amounts attributable to our redeemable and non-redeemable controlling interests. Additionally, the Company does not allocate foreign currency gains and losses, other income and losses, change in fair value of contingent consideration (if any), and unrealized gains and losses to our operating segments. See “Results of Operations - Non-Investment Basis” Item 72 for additional discussion on Segment Adjusted EBITDA and segment results for the period from May 19, 2022 through December 31, 2022.results.
The following table reconciles total Segment Adjusted EBITDA to Net loss attributable to Greenbacker Renewable Energy Company LLC:
| | | | | | | | |
| | For the period May 19, 2022 through December 31, 2022 |
Segment Adjusted EBITDA: | | |
IPP Adjusted EBITDA | | $ | 53,626,933 | |
IM Adjusted EBITDA | | (8,479,896) | |
Total Segment Adjusted EBITDA | | $ | 45,147,037 | |
| | |
Reconciliation: | | |
Total Segment Adjusted EBITDA | | $ | 45,147,037 | |
Unallocated corporate expenses | | (18,766,648) | |
Total Adjusted EBITDA | | 26,380,389 | |
| | |
Less: | | |
Share-based compensation expense | | 6,903,931 | |
Change in fair value of contingent consideration | | 2,100,000 | |
Non-recurring professional fees associated with the Acquisition and change in status | | 7,593,649 | |
Depreciation, amortization and accretion(1)
| | 49,771,964 | |
Operating loss | | $ | (39,989,155) | |
| | |
Interest expense, net | | (15,889,125) | |
Realized loss on interest rate swaps, net | | (1,322,219) | |
Unrealized loss on interest rate swaps, net | | (249,150) | |
Unrealized gain on investments, net | | 398,479 | |
Other expense, net | | (107,890) | |
Net loss before income taxes | | $ | (57,159,060) | |
| | |
Provision for income taxes | | (3,005,119) | |
Net loss | | $ | (60,164,179) | |
| | |
Less: Net loss attributable to noncontrolling interests | | (59,439,202) | |
Net loss attributable to Greenbacker Renewable Energy Company LLC | | $ | (724,977) | |
| | | | | | | | | | | | | | | |
| (in thousands) | | | | | For the year ended December 31, 2023 | | For the period from May 19, 2022 through December 31, 2022 |
| Segment Adjusted EBITDA: | | | | | | | |
| IPP Adjusted EBITDA | | | | | $ | 62,180 | | | $ | 53,627 | |
| IM Adjusted EBITDA | | | | | (2,674) | | | (8,480) | |
| Total Segment Adjusted EBITDA | | | | | $ | 59,506 | | | $ | 45,147 | |
| | | | | | | |
| Reconciliation: | | | | | | | |
| Total Segment Adjusted EBITDA | | | | | $ | 59,506 | | | $ | 45,147 | |
| Unallocated corporate expenses | | | | | (27,754) | | | (18,767) | |
| Total Adjusted EBITDA | | | | | 31,752 | | | 26,380 | |
| | | | | | | |
| Less: | | | | | | | |
| Share-based compensation expense | | | | | 11,248 | | | 6,903 | |
| Change in fair value of contingent consideration | | | | | (603) | | | 2,100 | |
| Non-recurring professional services and legal fees | | | | | 3,388 | | | 7,593 | |
| Non-recurring salaries and personnel related expenses | | | | | 1,250 | | | — | |
Depreciation, amortization and accretion(1) | | | | | 134,647 | | | 49,772 | |
| | | | | | | |
| Impairment of long-lived assets | | | | | 59,294 | | | — | |
| | | | | | | |
| Operating loss | | | | | $ | (177,472) | | | $ | (39,988) | |
| | | | | | | |
| Interest expense, net | | | | | (40,519) | | | (15,889) | |
| Realized gain (loss) on interest rate swaps, net | | | | | 2,428 | | | (1,322) | |
| Unrealized gain (loss) on interest rate swaps, net | | | | | 17,763 | | | (249) | |
| Unrealized gain on investments, net | | | | | 932 | | | 398 | |
| Other expense, net | | | | | (267) | | | (108) | |
| Net loss before income taxes | | | | | $ | (197,135) | | | $ | (57,158) | |
| | | | | | | |
| Benefit from (provision for) income taxes | | | | | 21,548 | | | (3,005) | |
| Net loss | | | | | $ | (175,587) | | | $ | (60,163) | |
| | | | | | | |
| Less: Net loss attributable to noncontrolling interests | | | | | (96,935) | | | (59,439) | |
| Less: Net income attributable to redeemable noncontrolling interests | | | | | 819 | | | — | |
| Net loss attributable to Greenbacker Renewable Energy Company LLC | | | | | $ | (79,471) | | | $ | (724) | |
(1)Includes contract amortization, net in the amount of $8.1 million, and $10.5 million for the year ended December 31, 2023, and the period from May 19, 2022 through December 31, 2022, respectively, which isare included in Contract amortization, net on the Consolidated StatementStatements of Operations.
Assets are not allocated to the Company’s segments for internal reporting purposes.
Note 20.22. Subsequent Events
The Company has evaluated events that have occurred after the balance sheet date but before the financial statements are issued and has determined that there were no subsequent events requiring adjustment or disclosure in the Consolidated Financial Statements, except as described below.
Tax equity fundings
During the period of January 1, 2023 through March 31, 2023, Tax Equity Investors provided contributions totaling $10.8 million relating to existing tax equity partnerships during the period.
Debt facilitiesbelow:
On January 26, 2023 and February 17, 2023,2024, the Company madefiled a registration statement on Form S-3 (File No. 333-276532) offering up to $20.0 million in Class A, C and I shares to its existing Class A, C, and I shareholders pursuant to the Third Amended and Restated DRP, which allows existing holders of shares to elect to have the full amount of their cash distributions from the Company reinvested in additional drawsshares of the same share class rather than receive the cash distributions. Subsequently, on February 26, 2024, the Company filed Post-Effective Amendment No. 2 to Form S-3 on Form S-1 (File No. 333-251021) deregistering its previously effective registration statement offering shares pursuant to the Third Amended and Restated DRP. The Company ceased offering the shares under the previously effective registration statement on January 17, 2024, which is the effective date of the Company’s new registration statement on Form S-3. The Company accepted aggregate gross proceeds of $19.6 million under the previously effective registration statement and deregistered the remaining $0.4 million from the offering.
On January 22, 2024, the Company borrowed $13.6 millionunder its GREC Warehouse Holdings I LLC revolving credit facility.
On January 23, 2024, the Company amended the Dogwood GB Manager LLC loan agreement to decrease the maximum commitment amount from $90.6 million to $58.7 million.
On February 8, 2024, the Company filed a registration statement on Form S-8 (File No. 333-276944), registering 8,469,497 Class P-I shares to be offered to participants pursuant to the 2023 Equity Incentive Plan.
On February 9, 2024, the Company terminated one deal contingent swap and received consideration of $47.2 million.
On February 29, 2024, the Company entered into a sale-leaseback arrangement related to a wind asset with an initial lease term of 20 years for total cash proceeds of $111.5 million. The Company utilized the proceeds to pay down $32.9 million of existing debt for GB Wind Holdco LLC. In accordance with the lease agreements, the Company has two early buyout options in 2029 and 2033. As part of $6.1 millionthe arrangement, the Company will still operate and $12.5 million, respectively.earn revenues from the facilities throughout the lease term while the lessor will be entitled to all available tax credits. As part of the sale-leaseback transaction, the Company entered into a tax indemnity agreement.
On March 8, 2024, the Company received tax equity funding of $5.7 million.
Report of Independent Registered Public Accounting Firm
To the Members and Board of Directors
Greenbacker Renewable Energy Company LLC:
Opinion on the Consolidated Financial Statements
We have audited the accompanying consolidated statement of operations, changes in net assets, and liabilitiescash flows of Greenbacker Renewable Energy Company LLC and Subsidiariessubsidiaries (the Company), including the consolidated schedule of investments as of December 31, 2021, and the related consolidated statements of operations, changes in net assets, and cash flows for the period from January 1, 2022 to May 18, 2022, and the year ended December 31, 2021, and the related notes (collectively, the consolidated financial statements). In our opinion, the consolidated financial statements present fairly, in all material respects, the financial position of the Company as of December 31, 2021, and the results of its operations, the changes in its net assets, and its cash flows of the Company for the period from January 1, 2022 to May 18, 2022 and the year then ended December 31, 2021, in conformity with U.S. generally accepted accounting principles.
Basis for Opinion
These consolidated financial statements are the responsibility of the Company'sCompany’s management. Our responsibility is to express an opinion on these consolidated financial statements based on our audits.audit. We are a public accounting firm registered with the Public Company Accounting Oversight Board (United States) (PCAOB) and are required to be independent with respect to the Company in accordance with the U.S. federal securities laws and the applicable rules and regulations of the Securities and Exchange Commission and the PCAOB.
We conducted our auditsaudit in accordance with the standards of the PCAOB. Those standards require that we plan and perform the audit to obtain reasonable assurance about whether the consolidated financial statements are free of material misstatement, whether due to error or fraud. The Company is not required to have, nor were we engaged to perform, an audit of its internal control over financial reporting. As part of our audits,audit, we are required to obtain an understanding of internal control over financial reporting but not for the purpose of expressing an opinion on the effectiveness of the Company’s internal control over financial reporting. Accordingly, we express no such opinion.
Our auditsaudit included performing procedures to assess the risks of material misstatement of the consolidated financial statements, whether due to error or fraud, and performing procedures that respond to those risks. Such procedures included examining, on a test basis, evidence regarding the amounts and disclosures in the consolidated financial statements. Our auditsaudit also included evaluating the accounting principles used and significant estimates made by management, as well as evaluating the overall presentation of the consolidated financial statements. We believe that our audits provideaudit provides a reasonable basis for our opinion.
Critical Audit MattersMatter
The critical audit matter communicated below is a matter arising from the current period audit of the consolidated financial statements that werewas communicated or required to be communicated to the audit committee and that: (1) relaterelates to accounts or disclosures that are material to the consolidated financial statements and (2) involved our especially challenging, subjective, or complex judgments. The communication of a critical audit mattersmatter does not alter in any way our opinion on the consolidated financial statements, taken as a whole, and we are not, by communicating the critical audit matter below, providing a separate opinion on the critical audit matter or on the accountaccounts or disclosuredisclosures to which it relates.
Fair Value of Certain Level III Investments
As discussed in Notes 2, 3, and 4 to the consolidated financial statements, the Company measures its investments at fair value using different valuation techniques including the income, cost, or market approach. The income
approach requires multiple inputs, including discount rates, expected cash flows, and other inputs. For the period from January 1, 2022 to May 18, 2022, the Company recorded a net change in unrealized appreciation on investments of $13.6 million, which represents the impact of the change in fair value of the Company’s investments.
We identified the assessment of the fair value for the Level III portfolio investments utilizing the income approach as a critical audit matter. Evaluating certain assumptions used to measure the fair value of the Level III portfolio investments utilizing the income approach involved a high degree of subjective auditor judgment. Specifically, subjective auditor judgment was required to assess the discount rates applied to the forecasted cash flows of these Level III portfolio investments. In addition, evaluation of the discount rates required the involvement of valuation professionals with specialized skills and knowledge.
The following are the primary procedures we performed to address this critical audit matter. We evaluated the design of certain internal controls over the Company'sCompany’s process to measure the fair value of Level III portfolio investments, including controls related to the development of the discount rates. We involved valuation professionals with specialized skills and knowledge, who for a selection of investments evaluated the discount rates used by the Company by comparing them to a range of independently developed discount rates using publicly available market data for comparable companies.
We have served as the Company’s auditor since 2012.
New York, New York
March 31, 2023
Consolidated Financial Statements (Investment Basis)
GREENBACKER RENEWABLE ENERGY COMPANY LLC AND SUBSIDIARIES
CONSOLIDATED STATEMENT OF ASSETS AND LIABILITIESOPERATIONS
(in thousands, except per share data)
| | | | | | | | |
| | December 31,
2021For the period from January 1, 2022 through May 18, 2022 |
| Investment income: | | |
AssetsInvestment income from controlled, affiliated investments: | | |
Investments in controlled/affiliated portfolios, at fair value (cost $1,191,393,635) | Dividend income | $ | 1,335,063,41912,547 | |
Investments in non-controlled/non-affiliated portfolios, at fair value (cost of $33,286,139) | | 33,286,139 | |
Investments in money market funds, at fair value (cost of $67,392,443) | | 67,392,443 | |
Cash and cash equivalents | | 92,179,779 | |
Restricted cash | | 29,683,613 | |
Shareholder contribution receivable | | 2,052,750 | |
Dividend receivable | | 10,481,202 | |
Investment sales receivable | | 69,994 | |
Return of capital receivable | | 654,622 | |
Other assets** | | 11,695,159 | |
Total assetsinvestment income from controlled, affiliated investments | | $ | 1,582,559,12012,547 | |
| | |
LiabilitiesInvestment income from non-controlled, non-affiliated investments: | | |
Swap contracts, at fair valueInterest income | 1,279 | |
| Total investment income | $ | 7,501,98313,826 | |
| |
Deferred tax liabilities, net of allowanceOperating expenses: | | 26,707,096 | |
Payable for investments purchased | | 420,594 | |
Term note payable, net of financing costs | | 79,413,622 | |
Management fee payableexpense | 10,662 | |
| Audit and tax expense | 2,271,687907 | |
| Interest and financing expenses | 1,314 | |
| General and administration expenses | 206 | |
Performance participation fee payable | | 3,359,269384 | |
Accounts payable and accruedLegal expenses | | 2,915,2103,041 | |
Due to GCMDirectors fees and expenses | | 607,610568 | |
Shareholder distributions payableTransfer agent expense | | 7,930,813301 | |
Payable for repurchases of common sharesOther professional fees expenses | | 7,493,9782,532 | |
Deferred sales commission payableAdministrator expenses | 2,155 | |
| Other expenses * | 4,626,626957 | |
Total liabilitiesexpenses | 23,027 | |
| Net investment loss before taxes | (9,201) | |
| (Benefit from) income taxes | (4,315) | |
| Net investment loss | (4,886) | |
| |
| Net change in realized and unrealized gain (loss) on investments, foreign currency translation and deferred tax assets: | |
| Net realized loss on investments | (2) | |
| Net change in unrealized appreciation (depreciation) on: | |
| Investments | 13,648 | |
| Foreign currency translation | (26) | |
| Swap contracts | 35,266 | |
| (Provision for) income taxes on realized and unrealized gain (loss) on investments, foreign currency translation and swap contracts | (13,223) | |
| Net increase in net assets attributed to members' equity | $ | 143,248,48830,777 | |
| | |
Commitments and contingencies (Note 10. Commitments and Contingencies) | | |
| | |
Members' Equity (Net Assets) | | |
Preferred shares, par value, $.001Common share per share 50,000,000 authorized; none issuedinformation —basic and outstandingdiluted: | |
| Net investment loss | $ | — (0.03) | |
Common shares, par value, $.001 per share, 350,000,000 authorized; 165,387,519 shares issued and outstanding | | 165,388 | |
Paid-in capitalNet increase in excess of par value | | 1,468,107,899 | |
Accumulated (losses)* | | (28,962,655) | |
| | |
| | |
Total members’net assets attributed to members' equity | | 1,439,310,632 | |
Total liabilities and equity | | $ | 1,582,559,1200.18 | |
| | |
Net assets, Class A (sharesWeighted average common shares outstanding of 16,580,558) | | $ | 137,994,947174,130 | |
Net assets, Class C (shares outstanding of 2,741,963) | | 22,290,310 | |
Net assets, Class I (shares outstanding of 6,449,493) | | 53,665,823 | |
Net assets, Class P-A (shares outstanding of 783,593) | | 6,721,670 | |
Net assets, Class P-D (shares outstanding of 198,548) | | 1,747,603 | |
Net assets, Class P-I (shares outstanding of 92,069,013) | | 810,046,418 | |
Net assets, Class P-S (shares outstanding of 46,324,757) | | 404,803,246 | |
Net assets, Class P-T (shares outstanding of 239,594) | | 2,040,615 | |
Total common members’ equity | | $ | 1,439,310,632 | |
*Accumulated deficit, accumulated net realized gain on investments, and accumulated unrealized appreciation (depreciation) on investments, net of deferred taxes, foreign currency translation, and swap contracts are included in accumulated gains (losses).
** As of December 31, 2021, Other assets includes $5.0 million of cash collateral associated with a derivative instrument.
The accompanying notes are an integral part of these Consolidated Financial Statements.
GREENBACKER RENEWABLE ENERGY COMPANY LLC AND SUBSIDIARIES
CONSOLIDATED STATEMENTS OF OPERATIONS
| | | | | | | | | | | | |
| For the period from January 1, 2022 through May 18, 2022 | | For the year ended December 31, 2021 | |
| Investment income: | | | | |
| Investment income from controlled, affiliated investments: | | | | |
| Dividend income | $ | 12,547,447 | | | $ | 28,631,462 | | |
| Interest income | — | | | — | | |
| Total investment income from controlled, affiliated investments | $ | 12,547,447 | | | $ | 28,631,462 | | |
| | | | |
| Investment income from non-controlled, non-affiliated investments: | | | | |
| Interest income | 1,279,349 | | | 3,919,675 | | |
| Total investment income | $ | 13,826,796 | | | $ | 32,551,137 | | |
| | | | |
| Operating expenses: | | | | |
| Management fee expense | 10,661,560 | | | 21,940,099 | | |
| Audit and tax expense | 906,679 | | | 1,812,189 | | |
| Interest and financing expenses | 1,313,882 | | | 2,988,749 | | |
| General and administration expenses | 205,718 | | | 658,439 | | |
| Performance participation fee | 384,065 | | | 4,672,078 | | |
| Legal expenses | 3,040,571 | | | 535,759 | | |
| Directors fees and expenses | 568,489 | | | 432,860 | | |
| Transfer agent expense | 301,362 | | | 701,321 | | |
| Other professional fees expenses | 2,531,932 | | | 2,696,668 | | |
| Administrator expenses | 2,155,303 | | | — | | |
| Other expenses * | 957,177 | | | 2,346,598 | | |
| | | | |
| | | | |
| Total expenses | 23,026,738 | | | 38,784,760 | | |
| Net investment loss before taxes | (9,199,942) | | | (6,233,623) | | |
| (Benefit from) income taxes | (4,315,392) | | | (9,050,004) | | |
| Franchise tax expense | — | | | 160,572 | | |
| Net investment (loss) income | (4,884,550) | | | 2,655,809 | | |
| | | | |
| Net change in realized and unrealized gain (loss) on investments, foreign currency translation and deferred tax assets: | | | | |
| Net realized loss on investments | (1,688) | | | (29,182) | | |
| Net change in unrealized appreciation (depreciation) on: | | | | |
| Investments | 13,647,821 | | | 56,023,470 | | |
| Foreign currency translation | (26,172) | | | 10,727 | | |
| Swap contracts | 35,266,332 | | | 2,248,926 | | |
| (Provision for) income taxes on realized and unrealized gain (loss) on investments, foreign currency translation and swap contracts | (13,223,285) | | | (17,888,961) | | |
| | | | |
| | | | |
| Net increase in net assets attributed to members' equity | $ | 30,778,458 | | | $ | 43,020,789 | | |
| | | | |
| Common share per share information —basic and diluted: | | | | |
| Net investment (loss) income | $ | (0.03) | | | $ | 0.02 | | |
| Net increase in net assets attributed to members' equity | $ | 0.18 | | | $ | 0.34 | | |
| Weighted average common shares outstanding | 174,129,549 | | | 126,458,860 | | |
* For the period from January 1, 2022 through May 18, 2022, Other expenses includes $0.7 million of net realized losses on swap contracts. For the year ended December 31, 2021, Other expenses includes $2.0 million of net realized losses on swap contracts.
The accompanying notes are an integral part of these Consolidated Financial Statements.
GREENBACKER RENEWABLE ENERGY COMPANY LLC AND SUBSIDIARIES
CONSOLIDATED STATEMENTSSTATEMENT OF CHANGES IN NET ASSETS
| | | | | | | | | | | | | | | | | | | | | | | | | | | | | | | | | | | | | | | | | | | | | | | | | | | | | | | | | |
| Shares | | Par
Value | | Paid-in
capital
in excess
of par
value | | Accumulated
deficit | | Accumulated
net realized
gain on
investments | | Accumulated
unrealized
appreciation
(depreciation)
on investments,
net of
deferred taxes | | Accumulated
unrealized
appreciation
(depreciation)
on foreign
currency
translation | | Accumulated
unrealized
appreciation
(depreciation)
on swap contracts | | | | | | Total
members’
equity
(net assets) |
| | | | | | | | | | | | | | | | | | | | | |
| | | | | | | | | | | | | | | | | | | | | |
| | | | | | | | | | | | | | | | | | | | | |
| | | | | | | | | | | | | | | | | | | | | |
| | | | | | | | | | | | | | | | | | | | | |
| | | | | | | | | | | | | | | | | | | | | |
| | | | | | | | | | | | | | | | | | | | | |
| | | | | | | | | | | | | | | | | | | | | |
| | | | | | | | | | | | | | | | | | | | | |
| | | | | | | | | | | | | | | | | | | | | |
| | | | | | | | | | | | | | | | | | | | | |
| | | | | | | | | | | | | | | | | | | | | |
| | | | | | | | | | | | | | | | | | | | | |
| | | | | | | | | | | | | | | | | | | | | |
| Balances as of December 31, 2020 | 62,870,347 | | | $ | 62,870 | | | $ | 550,896,111 | | | $ | (60,708,055) | | | $ | 18,141,632 | | | $ | 55,759,375 | | | $ | (108,971) | | | $ | (8,491,103) | | | | | | | $ | 555,551,859 | |
| Proceeds from issuance of common shares, net | 103,638,424 | | | 103,638 | | | 928,182,804 | | | — | | | — | | | — | | | — | | | — | | | | | | | 928,286,442 | |
| Issuance of common shares under distribution reinvestment plan | 1,418,253 | | | 1,418 | | | 12,289,558 | | | — | | | — | | | — | | | — | | | — | | | | | | | 12,290,976 | |
| Repurchases of common shares | (2,538,197) | | | (2,538) | | | (22,201,916) | | | — | | | — | | | — | | | — | | | — | | | | | | | (22,204,454) | |
| Proceeds from shares transferred | (1,308) | | | — | | | — | | | — | | | — | | | — | | | — | | | — | | | | | | | — | |
| Offering costs | — | | | — | | | (1,058,658) | | | — | | | — | | | — | | | — | | | — | | | | | | | (1,058,658) | |
| Deferred sales commissions | — | | | — | | | — | | | (5,461,652) | | | — | | | — | | | — | | | — | | | | | | | (5,461,652) | |
| Shareholder distributions | — | | | — | | | — | | | (71,114,670) | | | — | | | — | | | — | | | — | | | | | | | (71,114,670) | |
| Net investment income | — | | | — | | | — | | | 2,655,809 | | | — | | | — | | | — | | | — | | | | | | | 2,655,809 | |
| Net realized loss on investments | — | | | — | | | — | | | — | | | (29,182) | | | — | | | — | | | — | | | | | | | (29,182) | |
| Net change in unrealized appreciation on investments | — | | | — | | | — | | | — | | | — | | | 56,023,470 | | | — | | | — | | | | | | | 56,023,470 | |
| Net change in unrealized appreciation on foreign currency translation | — | | | — | | | — | | | — | | | — | | | — | | | 10,727 | | | — | | | | | | | 10,727 | |
| Net change in unrealized appreciation on swap contracts | — | | | — | | | — | | | — | | | — | | | — | | | — | | | 2,248,926 | | | | | | | 2,248,926 | |
| (Provision for) income taxes on realized and unrealized gain loss on investments, foreign currency translation and swap contracts | — | | | — | | | — | | | — | | | — | | | (17,888,961) | | | — | | | — | | | | | | | (17,888,961) | |
| Balances as of December 31, 2021 | 165,387,519 | | | $ | 165,388 | | | $ | 1,468,107,899 | | | $ | (134,628,568) | | | $ | 18,112,450 | | | $ | 93,893,884 | | | $ | (98,244) | | | $ | (6,242,177) | | | | | | | $ | 1,439,310,632 | |
| Proceeds from issuance of common shares, net | 11,924,799 | | | 11,924 | | | 104,939,688 | | | — | | | — | | | — | | | — | | | — | | | | | | | 104,951,612 | |
| Issuance of common shares under distribution reinvestment plan | 863,276 | | | 863 | | | 7,485,869 | | | — | | | — | | | — | | | — | | | — | | | | | | | 7,486,732 | |
| Repurchases of common shares | (720,146) | | | (720) | | | (6,261,773) | | | — | | | — | | | — | | | — | | | — | | | | | | | (6,262,493) | |
| Offering costs | — | | | — | | | (229,596) | | | — | | | — | | | — | | | — | | | — | | | | | | | (229,596) | |
| Deferred sales commissions | — | | | — | | | — | | | (92,597) | | | — | | | — | | | — | | | — | | | | | | | (92,597) | |
| Shareholder distributions | — | | | — | | | — | | | (32,202,840) | | | — | | | — | | | — | | | — | | | | | | | (32,202,840) | |
| Net investment loss | — | | | — | | | — | | | (4,884,550) | | | — | | | — | | | — | | | — | | | | | | | (4,884,550) | |
| Net realized loss on investments | — | | | — | | | — | | | — | | | (1,688) | | | — | | | — | | | — | | | | | | | (1,688) | |
| Net change in unrealized appreciation on investments | — | | | — | | | — | | | — | | | — | | | 13,647,821 | | | — | | | — | | | | | | | 13,647,821 | |
| Net change in unrealized depreciation on foreign currency translation | — | | | — | | | — | | | — | | | — | | | — | | | (26,172) | | | — | | | | | | | (26,172) | |
| Net change in unrealized appreciation on swap contracts | — | | | — | | | — | | | — | | | — | | | — | | | — | | | 35,266,332 | | | | | | | 35,266,332 | |
| (Provision for) benefit from income taxes on realized and unrealized loss on investments, foreign currency translation and swap contracts | — | | | — | | | — | | | — | | | — | | | (13,223,285) | | | — | | | — | | | | | | | (13,223,285) | |
| Balances as of May 18, 2022 | 177,455,448 | | | $ | 177,455 | | | $ | 1,574,042,087 | | | $ | (171,808,555) | | | $ | 18,110,762 | | | $ | 94,318,420 | | | $ | (124,416) | | | $ | 29,024,155 | | | | | | | $ | 1,543,739,908 | |
| | | | | | | | | | | | | | | | | | | | | | | | | | | | | | | | | | | | | | | | | | | | | | | | | | | | | |
| Shares | | Par
Value | | Paid-in
capital
in excess
of par
value | | Accumulated
deficit | | Accumulated
net realized
gain on
investments | | Accumulated
unrealized
appreciation
(depreciation)
on investments,
net of
deferred taxes | | Accumulated
unrealized
appreciation
(depreciation)
on foreign
currency
translation | | Accumulated
unrealized
appreciation
(depreciation)
on swap contracts | | Total
members’
equity
(net assets) |
| Balances as of December 31, 2021 | 165,384 | | | $ | 165 | | | $ | 1,468,108 | | | $ | (134,629) | | | $ | 18,112 | | | $ | 93,894 | | | $ | (98) | | | $ | (6,242) | | | $ | 1,439,310 | |
| Proceeds from issuance of common shares, net | 11,925 | | | 12 | | | 104,940 | | | — | | | — | | | — | | | — | | | — | | | 104,952 | |
| Issuance of common shares under distribution reinvestment plan | 865 | | | 1 | | | 7,485 | | | — | | | — | | | — | | | — | | | — | | | 7,486 | |
| Repurchases of common shares | (719) | | | (1) | | | (6,262) | | | — | | | — | | | — | | | — | | | — | | | (6,263) | |
| Offering costs | — | | | — | | | (229) | | | — | | | — | | | — | | | — | | | — | | | (229) | |
| Deferred sales commissions | — | | | — | | | — | | | (93) | | | — | | | — | | | — | | | — | | | (93) | |
| Shareholder distributions | — | | | — | | | — | | | (32,203) | | | — | | | — | | | — | | | — | | | (32,203) | |
| Net investment loss | — | | | — | | | — | | | (4,886) | | | — | | | — | | | — | | | — | | | (4,886) | |
| Net realized loss on investments | — | | | — | | | — | | | — | | | (2) | | | — | | | — | | | — | | | (2) | |
| Net change in unrealized appreciation on investments | — | | | — | | | — | | | — | | | — | | | 13,648 | | | — | | | — | | | 13,648 | |
| Net change in unrealized depreciation on foreign currency translation | — | | | — | | | — | | | — | | | — | | | — | | | (26) | | | — | | | (26) | |
| Net change in unrealized appreciation on swap contracts | — | | | — | | | — | | | — | | | — | | | — | | | — | | | 35,267 | | | 35,267 | |
| (Provision for) benefit from income taxes on realized and unrealized gain (loss) on investments, foreign currency translation and swap contracts | — | | | — | | | — | | | — | | | — | | | (13,223) | | | — | | | — | | | (13,223) | |
| Balances as of May 18, 2022 | 177,455 | | | $ | 177 | | | $ | 1,574,042 | | | $ | (171,811) | | | $ | 18,110 | | | $ | 94,319 | | | $ | (124) | | | $ | 29,025 | | | $ | 1,543,738 | |
The accompanying notes are an integral part of these Consolidated Financial Statements.
GREENBACKER RENEWABLE ENERGY COMPANY LLC AND SUBSIDIARIES
CONSOLIDATED STATEMENTSSTATEMENT OF CASH FLOWS
| | | | | | | | | | | | |
| For the period from January 1, 2022 through May 18, 2022 | | For the year ended December 31, 2021 | |
| Operating activities: | | | | |
| Net increase in net assets from operations | $ | 30,778,458 | | | $ | 43,020,789 | | |
| Adjustments to reconcile net increase in net assets from operations to net cash provided by (used in) operating activities: | | | | |
| Amortization of deferred financing costs | 520,183 | | | 905,959 | | |
| Gross funding of new or existing investments | (339,424,218) | | | (1,113,729,511) | | |
| Return of capital | 210,519,840 | | | 440,266,245 | | |
| Proceeds from principal payments and sales of investments | 12,325,274 | | | 9,928,720 | | |
| Sales (purchases) of money market funds, net | 52,101,113 | | | (56,219,716) | | |
| Net realized loss on investments | 1,688 | | | 29,182 | | |
| Net change in unrealized (appreciation) on investments | (13,647,821) | | | (56,023,470) | | |
| Net change in unrealized depreciation (appreciation) on foreign currency translation | 26,172 | | | (10,727) | | |
| Net change in unrealized (appreciation) on swap contracts | (35,266,332) | | | (2,248,926) | | |
| Deferred tax expense | 8,907,893 | | | 8,838,958 | | |
| (Increase) decrease in other assets: | | | | |
| Receivable for investments sold | 69,994 | | | 4,689,190 | | |
| Receivable for return of capital | (498,282) | | | 1,505,140 | | |
| Dividend receivable | (1,319,990) | | | (3,299,573) | | |
| Other assets | 821,032 | | | (8,496,287) | | |
| Increase (decrease) in other liabilities: | | | | |
| Payable for investments purchased | 324,115 | | | (4,030,976) | | |
| Management fee payable | (861,491) | | | 1,216,087 | | |
| Performance participation fee payable | (2,974,704) | | | (180,783) | | |
| Accounts payable and accrued expenses | 5,931,893 | | | 2,324,806 | | |
| Net cash (used in) operating activities | $ | (71,665,183) | | | $ | (731,514,893) | | |
| | | | |
| Financing activities: | | | | |
| | | | |
| Paydowns on credit facility and term note | (1,266,578) | | | (7,993,991) | | |
| | | | |
| Proceeds from issuance of common shares, net | 105,248,439 | | | 933,869,472 | | |
| Distributions paid | (30,891,000) | | | (55,097,266) | | |
| Offering costs | (809,401) | | | (452,799) | | |
| Deferred sales commission | (660,719) | | | (966,901) | | |
| Repurchases of common shares | (13,756,471) | | | (20,656,066) | | |
| | | | |
| Net cash provided by financing activities | $ | 57,864,270 | | | $ | 848,702,449 | | |
| | | | |
| Net (decrease) increase in cash and cash equivalents | (13,800,913) | | | 117,187,556 | | |
| Cash, cash equivalents and restricted cash, beginning of period | 121,863,392 | | | 4,675,836 | | |
| Cash, cash equivalents and restricted cash, end of period | $ | 108,062,479 | | | $ | 121,863,392 | | |
| | | | |
| Reconciliation of cash, cash equivalents and restricted cash | | | | |
| Cash and cash equivalents | $ | 72,110,606 | | | $ | 92,179,779 | | |
| Restricted cash | 35,951,873 | | | 29,683,613 | | |
| Total cash, cash equivalents and restricted cash | $ | 108,062,479 | | | $ | 121,863,392 | | |
| | | | |
| Supplemental disclosure of cash flow information: | | | | |
| Cash interest paid during the period | $ | 532,081 | | | $ | 1,659,715 | | |
| Shareholder contribution receivable from sale of common shares | $ | — | | | $ | 2,052,750 | | |
| Due to GCM for offering costs | $ | 27,805 | | | $ | 607,610 | | |
| Deferred sales commission payable | $ | 4,058,504 | | | $ | 4,626,626 | | |
| | | | | |
| For the period from January 1, 2022 through May 18, 2022 |
| Operating activities: | |
| Net increase in net assets from operations | $ | 30,777 | |
| Adjustments to reconcile net increase in net assets from operations to net cash provided by (used in) operating activities: | |
| Amortization of deferred financing costs | 520 | |
| Gross funding of new or existing investments | (339,424) | |
| Return of capital | 210,520 | |
| Proceeds from principal payments and sales of investments | 12,325 | |
| Sales of money market funds, net | 52,101 | |
| Net realized loss on investments | 2 | |
| Net change in unrealized (appreciation) on investments | (13,648) | |
| Net change in unrealized depreciation on foreign currency translation | 26 | |
| Net change in unrealized (appreciation) on swap contracts | (35,265) | |
| Deferred tax expense | 8,908 | |
| (Increase) decrease in other assets: | |
| Receivable for investments sold | 70 | |
| Receivable for return of capital | (498) | |
| Dividend receivable | (1,320) | |
| Other assets | 821 | |
| Increase (decrease) in other liabilities: | |
| Payable for investments purchased | 324 | |
| Management fee payable | (861) | |
| Performance participation fee payable | (2,975) | |
| Accounts payable and accrued expenses | 5,932 | |
| Net cash (used in) operating activities | (71,665) | |
| |
| Financing activities: | |
| Paydowns on credit facility and term note | (1,267) | |
| Proceeds from issuance of common shares, net | 105,248 | |
| Distributions paid | (30,891) | |
| Offering costs | (809) | |
| Deferred sales commission | (661) | |
| Repurchases of common shares | (13,756) | |
| Net cash provided by financing activities | 57,864 | |
| |
| Net decrease in cash and cash equivalents | (13,801) | |
| Cash, cash equivalents and restricted cash, beginning of period | 121,863 | |
| Cash, cash equivalents and restricted cash, end of period | $ | 108,062 | |
| |
| Reconciliation of cash, cash equivalents and restricted cash | |
| Cash and cash equivalents | $ | 72,110 | |
| Restricted cash | 35,952 | |
| Total cash, cash equivalents and restricted cash | $ | 108,062 | |
| |
| Supplemental disclosure of cash flow information: | |
| Cash interest paid during the period | $ | 532 | |
| |
| Due to GCM for offering costs | $ | 28 | |
| Deferred sales commission payable | $ | 4,059 | |
The accompanying notes are an integral part of these Consolidated Financial Statements.
GREENBACKER RENEWABLE ENERGY COMPANY LLC AND SUBSIDIARIES
CONSOLIDATED SCHEDULE OF INVESTMENTS
December 31, 2021
| | | | | | | | | | | | | | | | | | | | | | | | | | | | | | | | | | | | | | | | | |
Investments in
controlled/affiliated portfolios | | Interest | | Maturity | | Shares or Principal Amount | | Cost | | Fair
Value | | Percentage of Net Assets(a) |
| Limited Liability Company Member Interests in the United States- Not readily marketable | | | | | | | | | | | | | |
| | | | | | | | | | | | | |
| Battery Storage | | | | | | | | | | | | | |
| Pacifica Portfolio (e) | | | | | | | 100% Ownership | | $ | 11,288,841 | | | $ | 10,747,811 | | | 0.7 | % |
Total Battery Storage - 0.7% | | | | | | | | | $ | 11,288,841 | | | $ | 10,747,811 | | | 0.7 | % |
| | | | | | | | | | | | | |
| Biomass | | | | | | | | | | | | | |
| Eagle Valley Biomass Portfolio | | | | | | | 100% Ownership | | $ | 24,533,222 | | | $ | 17,184,912 | | | 1.2 | % |
Total Biomass - 1.2% | | | | | | | | | $ | 24,533,222 | | | $ | 17,184,912 | | | 1.2 | % |
| | | | | | | | | | | | | |
| Commercial Solar | | | | | | | | | | | | | |
| Celadon Portfolio (e) | | | | | | | 100% Ownership or Managing Member, Equity Owner | | $ | 165,129,450 | | | $ | 187,410,880 | | | 13.0 | % |
| GEH Portfolio (e) | | | | | | | 100% Ownership or Managing Member, Equity Owner | | 150,463,205 | | | 157,925,117 | | | 11.0 | % |
| Ponderosa Portfolio (e) | | | | | | | 100% Ownership | | 49,514,975 | | | 59,577,751 | | | 4.1 | % |
| Sego Lily - Solar Portfolio (e) | | | | | | | 100% Ownership or Managing Member, Equity Owner | | 107,621,275 | | | 122,272,431 | | | 8.5 | % |
| Trillium Portfolio | | | | | | | Managing Member, Equity Owner | | 74,764,309 | | | 101,432,185 | | | 7.0 | % |
| Other Commercial Solar Portfolios (d)(e) | | | | | | | 100% Ownership or Managing Member, Equity Owner | | 250,865,362 | | | 302,548,767 | | | 21.0 | % |
Total Commercial Solar - 64.6% | | | | | | | | | $ | 798,358,576 | | | $ | 931,167,131 | | | 64.6 | % |
| | | | | | | | | | | | | |
| Wind | | | | | | | | | | | | | |
| Sego Lily - Wind Portfolio | | | | | | | Managing Member Equity Owner | | $ | 117,410,390 | | | $ | 140,965,616 | | | 9.8 | % |
| Greenbacker Wind Holdings II Portfolio | | | | | | | 100% Ownership or Managing Member, Equity Owner | | 62,787,210 | | | 62,272,198 | | | 4.3 | % |
| Greenbacker Wind - HoldCo Portfolio | | | | | | | 100% Ownership | | 84,674,188 | | | 78,025,844 | | | 5.4 | % |
| Other Wind Investments Portfolios | | | | | | | 100% Ownership | | 56,638,076 | | | 58,770,864 | | | 4.1 | % |
Total Wind - 23.6% | | | | | | | | | $ | 321,509,864 | | | $ | 340,034,522 | | | 23.6 | % |
| | | | | | | | | | | | | | | | | | | | | | | | | | | | | | | | | | | | | | | | | |
Investments in
controlled/affiliated portfolios | | Interest | | Maturity | | Shares or Principal Amount | | Cost | | Fair
Value | | Percentage of Net Assets(a) |
| | | | | | | | | | | | | |
| Other Investments | | | | | | | | | | | | | |
| Other Portfolios | | | | | | | (c) | | $ | 35,034,396 | | | $ | 35,243,259 | | | 2.4 | % |
Total Other Investments - 2.4% | | | | | | | | | $ | 35,034,396 | | | $ | 35,243,259 | | | 2.4 | % |
| | | | | | | | | | | | | |
| Energy Efficiency in the United States | | | | | | | | | | | | | |
| Other Energy Efficiency Portfolios | | | | | | | (b) | | $ | 668,736 | | | $ | 685,784 | | | — | % |
Total Energy Efficiency - —% | | | | | | | | | $ | 668,736 | | | $ | 685,784 | | | — | % |
| Total Investments in controlled/affiliated portfolios | | | | | | | | | $ | 1,191,393,635 | | | $ | 1,335,063,419 | | | 92.5 | % |
| | | | | | | | | | | | | |
| Investments in non-controlled/non-affiliated portfolios | | | | | | | | | | | | | |
| Secured Loans - Not readily marketable | | | | | | | | | | | | | |
| Chaberton Loan | | 8.00% | | | 9/30/2022 | | $2,247,962 | | $ | 2,247,962 | | | $ | 2,247,962 | | | 0.2 | % |
| Encore Loan | | 10.00% | | | 1/31/2022 | | $3,058,527 | | 3,058,527 | | | 3,058,527 | | | 0.2 | % |
| Hudson Loan | | 8.00% | | | 1/31/2022 | | $4,984,650 | | 4,984,650 | | | 4,984,650 | | | 0.3 | % |
| Hudson II Loan | | 8.00% | | | 1/31/2022 | | $4,227,098 | | 4,227,098 | | | 4,227,098 | | | 0.3 | % |
| New Market Loan | | 9.00% | | | 3/31/2022 | | $5,008,070 | | 5,008,070 | | | 5,008,070 | | | 0.3 | % |
| Shepherd's Run Loan | | 8.00% | | | 9/30/2022 | | $8,751,528 | | 8,751,528 | | | 8,751,528 | | | 0.6 | % |
| SE Solar Loan | | 9.00% | | | 3/31/2022 | | $5,008,304 | | 5,008,304 | | | 5,008,304 | | | 0.3 | % |
Total Secured Loans - Not readily marketable - 2.2% | | | | | | | | | $ | 33,286,139 | | | $ | 33,286,139 | | | 2.2 | % |
| Total Investments in non-controlled/non-affiliated portfolios | | | | | | | | | $ | 33,286,139 | | | $ | 33,286,139 | | | 2.2 | % |
| | | | | | | | | | | | | |
| Investments in Money Market Funds | | | | | | | | | | | | | |
| Allspring Treasury Plus Money Market Fund - Institutional Class | | | | | | | $16,823,110 | | $ | 16,823,110 | | | $ | 16,823,110 | | | 1.2 | % |
| Fidelity Government Portfolio - Class I | | | | | | | $16,873,111 | | 16,873,111 | | | 16,873,111 | | | 1.2 | % |
| First American Government Obligations Fund - Class X | | | | | | | $16,823,111 | | 16,823,111 | | | 16,823,111 | | | 1.2 | % |
| First American Government Obligations Fund - Class Z | | | | | | | $50,000 | | 50,000 | | | 50,000 | | | — | % |
| | | | | | | | | | | | | | | | | | | | | | | | | | | | | | | | | | | | | | | | | |
Investments in
controlled/affiliated portfolios | | Interest | | Maturity | | Shares or Principal Amount | | Cost | | Fair
Value | | Percentage of Net Assets(a) |
| JP Morgan US Government Money Market Fund - Class L | | | | | | | $16,823,111 | | 16,823,111 | | | 16,823,111 | | | 1.2 | % |
Total Investments in Money Market Funds - 4.8% | | | | | | | | | $ | 67,392,443 | | | $ | 67,392,443 | | | 4.8 | % |
| | | | | | | | | | | | | |
TOTAL INVESTMENTS: 99.5% | | | | | | | | | $ | 1,292,072,217 | | | $ | 1,435,742,001 | | | 99.5 | % |
LIABILITIES IN EXCESS OF OTHER ASSETS OTHER THAN INVESTMENTS: 0.5% | | | | | | | | | | | 3,568,631 | | | 0.5 | % |
TOTAL NET ASSETS: 100.0% | | | | | | | | | | | $ | 1,439,310,632 | | | 100.0 | % |
(a)Percentages are based on net assets of $1,439,310,632 as of December 31, 2021.
(b)Includes capital leases and secured loans.
(c)Includes pre-acquisition and due diligence expenses.
(d)Includes the Canadian Northern Lights assets, which are located outside of the United States of America and are a Capital Stock investment.
(e)Includes assets that have not reached COD.
Interest Rate Swaps
| | | | | | | | | | | | | | | | | | | | | | | | | | | | | | | | | | | | | | | | | | | | |
| Counterparty | | Pay / Receive Floating Rate | | Floating Rate Index | | Fixed Pay Rate | | Payment Frequency | | Maturity Date | | Notional Amount | | Value |
| Fifth Third Financial Risk Solutions | | Receive | | 1-MO-USD-LIBOR | | 2.261% | | Monthly | | 2/29/2032 | | $ | 15,406,096 | | | $ | (767,195) | |
| Fifth Third Financial Risk Solutions | | Receive | | 1-MO-USD-LIBOR | | 2.648% | | Monthly | | 12/31/2038 | | 26,207,255 | | | (1,899,786) | |
| Fifth Third Financial Risk Solutions | | Receive | | 1-MO-USD-LIBOR | | 2.965% | | Monthly | | 12/31/2038 | | 3,607,242 | | | (378,543) | |
| Fifth Third Financial Risk Solutions | | Receive | | 1-MO-USD-LIBOR | | 2.688% | | Monthly | | 12/31/2034 | | 31,616,866 | | | (2,294,124) | |
| Fifth Third Financial Risk Solutions | | Receive | | 1-MO-USD-LIBOR | | 1.642% | | Monthly | | 6/30/2040 | | 5,314,050 | | | (106,475) | |
| Canadian Imperial Bank of Commerce | | Receive | | USD-SOFR-COMPOUND | | 1.604% | | Quarterly | | 6/30/2044 | | 284,692,696 | | | (2,055,860) | |
| | | | | | | | | | | | | | $ | (7,501,983) | |
The accompanying notes are an integral part of these Consolidated Financial Statements.
GREENBACKER RENEWABLE ENERGY COMPANY LLC AND SUBSIDIARIES
NOTES TO CONSOLIDATED FINANCIAL STATEMENTS
December 31, 2022
These Notes to the Consolidated Financial Statements were prepared under the Investment Basis as of and for the period(s) ended May 18, 2022. All references to the “LLC” in these Notes refer to Greenbacker Renewable Energy Company LLC and its consolidated subsidiaries (GREC, GREC HoldCo, GREC Administration LLC, and Danforth Shared Services LLC), unless otherwise expressly stated or context requires otherwise.
Note 1. Organization and Operations of the LLC
For a detailed description, refer to Note 1. Organization and Operations of the Company as included in the Notes to the Consolidated Financial Statements as included in the Non-Investment Basis section of Item 8 of this Annual Report.
Prior to May 19, 2022, the LLC was externally managed and is an energy company that acquires, constructs and operates renewable energy and energy efficiency projects as well as finances the construction and/or operation of these and other sustainable development projects and businesses. The LLC conducts substantially all its operations through its wholly owned subsidiary, GREC. GREC is a Maryland corporation formed in November 2011, and the LLC currently holds all the outstanding shares of capital stock of GREC. GREC HoldCo, a wholly owned subsidiary of GREC, was formed in Delaware in June 2016. GREC Administration LLC and Danforth Shared Services LLC, both wholly owned subsidiaries of GREC, were formed in Delaware in January 2020 and May 2019, respectively. The consolidated financial results of the LLC have historically included the results of the LLC and its consolidated subsidiaries, GREC, GREC HoldCo, and GREC Administration LLC and Danforth Shared Services LLC, both of which provide administrative services to LLC and its subsidiaries. As of and prior to May 18, 2022, the use of “we”, “us”, and “our” refer, collectively to the LLC, GREC, GREC HoldCo, GREC Administration LLC, and Danforth Shared Services LLC, unless otherwise expressly stated or context otherwise requires.
The LLC was externally managed and advised by GCM, a renewable energy, energy efficiency and sustainability-related project acquisition, consulting and development company that is registered as an investment adviser under the Advisers Act. GCM was acquired by the LLC as part of the Acquisition on May 19, 2022.
Note 2. Significant Accounting Policies
Basis of Presentation
The LLC’s Consolidated Financial Statements are prepared in accordance with U.S. GAAP, which requires the use of estimates, assumptions and the exercise of subjective judgment as to future uncertainties. Actual results could differ from those estimates, assumptions and judgments. Significant items subject to such estimates will include determining the fair value of investments, revenue recognition, income tax uncertainties and other contingencies. As of and prior to May 18, 2022, the Consolidated Financial Statements of the LLC include the accounts of the LLC and its consolidated subsidiaries, GREC, GREC HoldCo, and GREC Administration LLC and Danforth Shared Services LLC, both of which provide administrative services to the LLC. All intercompany accounts and transactions have been eliminated.
Since inception and through May 18, 2022, the LLC’s Consolidated Financial Statements were prepared using the specialized accounting principles of ASC Topic 946. In accordance with this specialized accounting guidance, also referred to as the Investment Basis, the LLC recognized and carried all its investments, including investments in the underlying operating entities, at fair value with changes in fair value recognized in earnings. Additionally, the LLC did not apply the equity method of accounting to its investments. The LLC carried its liabilities at amounts payable, net of unamortized premiums or discounts. The LLC did not elect to carry its non-investment liabilities at fair value. Net assets are calculated as the carrying amounts of assets, including the fair value of investments, less the carrying amounts of its liabilities.
The financial information associated with the Consolidated Financial Statements under the Investment Basis has been prepared by management and, in the opinion of management, contains all adjustments and eliminations necessary for a fair presentation in accordance with U.S. GAAP.
The Company presents amounts in the Consolidated Financial Statements in thousands within tables and millions within text (unless otherwise specified), and calculates all percentages and per-share data from underlying whole-dollar amounts. Thus, certain amounts may not foot, crossfoot, or recalculate based on reported numbers due to rounding. Prior period amounts have been updated to be presented in thousands and differences to prior filings are due to rounding.
Basis of Consolidation
As provided under Regulation S-X and ASC 946, the LLC would generally not consolidate its investment in a company other than a wholly owned investment company or controlled operating company whose business consists of providing services to the LLC. Accordingly, the LLC consolidated in its Consolidated Financial Statements the accounts of certain wholly owned subsidiaries that meet the criteria. All significant intercompany balances and transactions have been eliminated in consolidation.
Cash and Cash Equivalents
Cash consists of demand deposits at a financial institution. Such deposits may be in excess of the Federal Deposit Insurance Corporation insurance limits. The LLC has not experienced any losses in any such accounts.
Restricted Cash
Restricted cash consists of cash accounts or letters of credit that are restricted for use on specific investments.
Foreign Currency Translation
The accounting records of the LLC are maintained in U.S. Dollars. The fair value of investments and other assets and liabilities denominated in non-U.S. currencies are translated into U.S. Dollars using the exchange rate at the end of each reporting period. Amounts related to the purchases and sales of investments, investment income and expenses are translated at the rates of exchange prevailing on the respective dates of such transactions.
Net unrealized currency gains and losses arising from valuing foreign currency-denominated assets and liabilities at the current exchange rate are reflected as part of Net change in unrealized appreciation (depreciation) on Foreign currency translation in the Consolidated StatementsStatement of Operations.
Foreign security and currency translations may involve certain considerations and risks not typically associated with investing in U.S. companies and U.S. government securities. These risks include, but are not limited to, currency fluctuations and revaluations and future adverse political, social and economic developments, which could cause investments in foreign markets to be less liquid and prices to be more volatile than those of comparable U.S. companies or U.S. government securities.
Valuation of Investments at Fair Value
ASC Topic 820, Fair Value Measurements, defines fair value, establishes a framework for measuring fair value in accordance with U.S. GAAP and expands disclosures about fair value. The LLC recognizes and accounts for its investments at fair value. The fair value of the investments does not reflect transaction costs that may be incurred upon disposition of the investments.
Fair value is defined as the price that would be received to sell an asset or paid to transfer a liability in an orderly transaction between market participants. Fair value is an exchange price notion under which fair value is the price in an orderly transaction between market participants to sell an asset or transfer a liability in the market in which the reporting entity would transact for the asset or liability.
GCM has established procedures to estimate the fair value of its investments that the LLC’s Board of Directors has reviewed and approved. To the extent that such market data is available, the LLC will use observable market data to estimate the fair value of investments. In the absence of quoted market prices in active markets, or quoted market prices for similar assets in markets that are not active, the LLC will use the valuation methodologies described below with unobservable data based on the best available information in the circumstances. These methodologies incorporate the LLC’s assumptions about the factors that a market participant would use to value the asset.
The LLC considers investments in money market funds to be short-term investments. Short-term investments are stated at cost, which approximates fair value.
For investments for which quoted market prices are not available, which comprise most of our investment portfolio, fair value is estimated by using the cost, income or market approach. The income approach assumes that value is created by the expectation of future benefits, discounted by a risk premium, to calculate a current cash value. This estimate is the fair value: the amount an investor would be willing to pay to receive those future benefits. The market approach compares either recent comparable transactions to the investment or an offer to purchase an investment based upon a qualified bid: a signed term sheet and/or a signed purchase agreement. Adjustments to proposed prices are made to account for the probability of the deal closing, changes between proposed and executed terms, and any dissimilarity between the comparable transactions and their underlying investments. If multiple bids are qualified in the same valuation period, a blended market approach will be calculated.
Prior to the second quarter of 2020, fair value for pre-operational assets was approximated using the cost approach. Beginning in the second quarter of 2020, GCM expanded the criteria whereby certain pre-operational assets are identified and qualified for the income approach, rather than the cost approach, for approximating fair value. GCM considers all owned assets that are fully construction readyconstruction-ready with no impediments to begin construction and where the costs to complete such projects are well understood for the income approach. The fair value of such eligible projects is determined based upon a discounted cash flow methodology. If the portfolio has any significant portion of value that remains subject to negotiation or contract or if other
significant risks to complete the project exist, the investment may be held at cost, as an approximation of fair value. These valuation methodologies involve a significant degree of judgment by GCM.
In determining the appropriate fair value of an investment using these approaches, the most significant information and assumptions include, as applicable: available current market data, including relevant and applicable comparable market transactions, applicable market yields and multiples, security covenants, call protection provisions, information rights, the nature and realizable value of any collateral, the investment’s ability to make payments, its earnings and discounted cash flows, the markets in which the project does business, comparisons of financial ratios of peer companies that are public, comparable mergers and acquisitions, the principal market and enterprise values and environmental factors, among other factors.
The estimated fair values will not necessarily represent the amounts that may be ultimately realized due to the occurrence or non-occurrence of future circumstances that cannot be reasonably determined. Because of the inherent uncertainty of the valuation of the investments, the estimate of fair values may differ significantly from the value that would have been used had a broader market for the investments existed.
The authoritative accounting guidance prioritizes the use of market-based inputs over entity-specific inputs and establishes a three-level hierarchy for fair value measurements based upon the transparency of inputs to the valuation. The three levels of valuation hierarchy are defined as follows:
Level 1: Unadjusted quoted prices for identical assets or liabilities in active markets.
Level 2: Other significant observable inputs that are sourced either directly or indirectly from publications or pricing services, including dealer or broker markets, for identical or comparable assets or liabilities. Generally, these inputs should be widely accepted and public, non-proprietary and sourced from an independent third party.
Level 3: Inputs derived from a significant amount of unobservable market data and derived primarily through the use of internal valuation methodologies.
In all cases, the level in the fair value hierarchy within which the fair value measurement in its entirety falls will be determined based on the lowest level of input that is significant to the fair value measurement. Our assessment of the significance of an input to the fair value measurement in its entirety requires judgment and considers factors specific to each investment.
Calculation of Net Asset Value
NAV by share class is calculated by subtracting total liabilities for each class from the total carrying amount of all assets for that class, which includes the fair value of investments. NAV per share is calculated by dividing net asset value for each class by the total number of outstanding common shares for that class on the reporting date. For purposes of calculating our NAV, the LLC carries all liabilities at cost.
Earnings per Share
In accordance with the provisions of ASC Topic 260, Earnings per Share, basic earnings per share is computed by dividing earnings available to common members by the weighted average number of shares outstanding during the period. Other potentially dilutive common shares, and the related impact to earnings, are considered when calculating earnings per share on a diluted basis.
The following information sets forth the computation of the weighted average basic and diluted net increase in net assets attributed to common members per share and net investment (loss) incomeloss per share for the period from January 1, 2022 through May 18, 2022 and the year ended December 31, 2021. 2022.
| | | | | | | | | | | | |
| For the period from January 1, 2022 through May 18, 2022 | | For the year ended December 31,
2021 | |
| Basic and diluted | | | | |
| Net investment (loss) income | $ | (4,884,550) | | | $ | 2,655,809 | | |
| Net increase in net assets attributed to common members | $ | 30,778,458 | | | $ | 43,020,789 | | |
| Net investment (loss) income per share | $ | (0.03) | | | $ | 0.02 | | |
| Net increase in net assets attributed to common members per share | $ | 0.18 | | | $ | 0.34 | | |
| Weighted average common shares outstanding | 174,129,549 | | | 126,458,860 | | |
| | | | | |
| (in thousands, except per share data) | For the period from January 1, 2022 through May 18, 2022 |
| Basic and diluted | |
| Net investment loss | $ | (4,886) | |
| Net increase in net assets attributed to common members | $ | 30,777 | |
| Net investment loss per share | $ | (0.03) | |
| Net increase in net assets attributed to common members per share | $ | 0.18 | |
| Weighted average common shares outstanding | 174,130 | |
Revenue Recognition
To the extent the LLC expects to collect such amounts, interest income is recorded on an accrual basis. If there is reason to doubt an ability to collect such interest, interest receivable on loans is not accrued for accounting purposes. Original issue discounts, market discounts or market premiums are accreted or amortized using the effective interest method as interest income. Prepayment premiums on loans are recorded as interest income when received. Any application, origination or other fees earned by the LLC in arranging or issuing debt are amortized over the expected term of the loan.
Loans are placed on non-accrual status when principal and interest are 90 days or more past due, or when there is a reasonable doubt that principal or interest will be collected. Accrued interest is generally reversed when a loan is placed on non-accrual. Interest payments received on non-accrual loans may be recognized as income or applied to principal depending upon management’s judgment regarding collectability. Non-accrual loans are generally restored to accrual status when past due and principal and interest is paid and, in management’s judgment, is likely to remain current.
Dividend income is recorded when dividends are declared and determined that collection is probable. The timing and amount of dividend income is determined on at least a quarterly basis and, in certain cases, can only be determined quarterly based on the underlying project company agreements. This process includes an analysis at the individual project company level based on cash available from operations and working capital needed for the project company operations. Dividend income from the LLC's privately held, equity investments is recognized when approved.
Dividend income as reported on the Consolidated Statement of Operations reflects dividend income from project companies less any expenses incurred by the LLC or GREC for the services provided by Greenbacker Administration directly relating to the ongoing operation of the project companies.
Administrator Expenses
Greenbacker Administration served as the LLC’s administrator from commencement of operations through May 18, 2022. Under the terms of the Administration Agreement between the LLC, GREC and the Administrator, certain asset management, construction management, compliance and oversight services, as well as asset accounting and administrative services, were performed by the Administrator. The Administration Agreement was terminated in connectconnection with the Acquisition. The fees incurred for these services are recorded as a reduction to Dividend income in the Consolidated StatementsStatement of Operations to the extent that there is sufficient dividend income from the individual project entities. Administrator expenses in excess of dividend income are recorded with Operating expenses on the Consolidated Statement of Operations.
For the period from January 1, 2022 through May 18, 2022, the LLC incurred expenses from the Administrator in excess of the dividend income from the project companies due to the structure of certain of the project company agreements that only allow for distributions to be determined quarterly. The Administrator expensesexpense in excess of dividend income was $2.2 million and was recorded as Administrator expenses on the Consolidated Statement of Operations.Operations for the period from January 1, 2022 through May 18, 2022.
Net Realized Gains or Losses and Net Change in Unrealized Appreciation or Depreciation on Investments
Without regard to unrealized appreciation or depreciation previously recognized, realized gains or losses will be measured as the difference between the net proceeds from the sale, repayment, or disposal of an asset and the adjusted cost basis of the asset. Net change in unrealized appreciation or depreciation will reflect the change in investment values during the reporting period, including any reversal of previously recorded unrealized appreciation or depreciation when gains or losses are realized.
Payment-in-Kind
For loans with contractual payment-in-kind interest, if the fair value of the investment indicates that such interest is collectible, any interest will be added to the principal balance of such investments and be recorded as income.
Distribution Policy
Distributions to members, if any, will be authorized and declared by the LLC's Board of Directors quarterly in advance and paid monthly. From time to time, we may also pay interim special distributions in the form of cash or shares, with the approval of our Board of Directors. Distributions will be made on all classes of shares at the same time. The cash distributions paid to the shareholder with respect to the Class C, P-S and P-T shares will be lower than the cash distributions with respect to the LLC’s other share classes because of the distribution fee associated with the Class C, P-S and P-T shares, which is allocated specifically to these classes' net assets. Amounts distributed to each class are allocated amongst the holders of the shares in such class in proportion to their shares. Distributions declared by our Board of Directors are recognized as distribution liabilities on the ex-dividend date.
Organization and Offering Costs
O&O costs other than sales commissions and the dealer manager fee, were initially paid by GCM and/or dealer manager on behalf of the LLC in connection with its formation and the offering of its shares pursuant to now-terminated Registration Statements on Form S-1 (File No. 333-178786-01 and File No. 333-211571, respectively).
Prior to the Acquisition, the LLC was obligated to reimburse GCM for O&O costs that it incurred on behalf of the LLC, in accordance with the Advisory Agreement. However, with respect to the LLC’s public offerings, the aggregate of selling commissions, dealer manager fees and other O&O costs borne by the LLC was not to exceed 15.00% of gross offering proceeds.
Offering costs incurred by GCM in conjunction with the offering of shares of Class P-A, P-S, P-T and P-D under our private placement memoranda were subject to the reimbursement by the LLC up to 0.50% (50 basis points) of gross offering proceeds for each such class of shares. The costs incurred by GCM prior to the Acquisition and costs incurred by our dealer manager were recognized as a liability of the LLC to the extent that the LLC was obligated to reimburse GCM and/or dealer manager. When recognized by the LLC, organizational costs are expensed and offering costs, excluding selling commissions and dealer manager fees, were recognized as a reduction of the proceeds from the offering. As of December 31, 2021, $1.1 million in O&O costs were incurred by GCM with respect to the LLC's offering, of which $0.6 million is a current payable and $0.5 million was reimbursed to GCM. In connection with the Acquisition, all O&O costs due to GCM were paid concurrently with the closing of the Acquisition on May 19, 2022. Following the Acquisition, the LLC is no longer obligated to reimburse GCM for O&O costs.
Financing Costs
Financing costs incurred by the LLC for the issuance of debt liabilities are deferred and amortized using the straight-line method over the life of the debt liability. Financing costs related to debt liabilities incurred by the LLC are presented on the Consolidated Statement of Assets and Liabilities as a direct deduction from the carrying amount of that debt liability.
Return of Capital Receivable
For operational assets, if the project company has inadequate cash to fund day-to-day expenses, the LLC will loan funds to that project company through an investment. Once the project company has adequate cash, they will repay the loan by sending a return of capital distribution. As of December 31, 2021, a return of capital receivable of $0.7 million was recorded on the Consolidated Statement of Assets and Liabilities.
Performance Participation Fee
Under the Fourth Operating Agreement, the incentive fee payable by the LLC was simplified to be structured with two components: the "Performance“Performance Participation Fee"Fee” and the "Liquidation“Liquidation Performance Participation Fee"Fee” (each as defined in Note 5.4. Related Party Agreements and Transaction Agreements). Prior to the Acquisition, the Performance Participation Fee was based on the LLC's total return amount during the relevant calculation period. The calculation of the Performance Participation Fee is further detailed in Note 5.4. Related Party Agreements and Transaction Agreements. The Performance Participation Fee was accounted for and classified as an operating expense and reflected as the Performance participation fee on the Consolidated StatementsStatement of Operations. Under the Fourth Operating Agreement, aThe Performance participation fee payable of $3.4 million was recorded as of December 31, 2021 in the Consolidated Statement of Assets and Liabilities. The Performance participation fee
recorded on the Consolidated StatementsStatement of Operations for the period from January 1, 2022 through May 18, 2022 is $0.4 million. The Performance participation fee recorded on the Consolidated Statements
Deferred Sales Commissions
The LLC defers certain costs, principally sales commissions and related compensation, which are paid to the dealer manager and may be reallowed to financial advisors and broker-dealers in the future in connection with the sale of shares sold with a reduced front-end load sales charge and a trail fee. The costs expected to be incurred at the time of the sale of the Class C shares are recorded as a liability on the date of sale and represents the aggregate amount due for such costs over the period beginning at the time of sale and ending on the earlier date of (1) when the maximum amount of sales commission and related compensation is reached under regulatory regulations; (2) the date which approximates an expected liquidity event for the LLC; or (3) the expected holding period of the investment. The costs expected to be incurred at the time of the sale of the Class P-T and Class P-S shares are recorded as a liability on the date of sale and represents the aggregate amount due for such costs over the period beginning at the time of sale and ending on the earlier date of (1) the date which approximates an expected liquidity event for the LLC; or (2) the expected holding period of the investment. The upfront liability is calculated at the time of sale, using the 85 basis points per annum fee, multiplied by the expected holding period of such share. Deferred sales commissions for Class C, P-T and P-S are paid monthly, in the form of a reduction to shareholder distributions, to the third-party dealer manager at a rate equal to 1/12th of 85 basis points. The estimated amount of the liability can be updated as management's assumption surrounding an expected liquidity event changes or if the maximum of sales-related commissions and costs under regulatory regulations is attained. As of December 31, 2021, the LLC recorded a liability for deferred sales commissions in the amount of $4.6 million on the Consolidated Statement of Assets and Liabilities.
Reclassifications
Certain prior year amounts have been reclassified to conform with current year presentation. These reclassifications had no impact on prior periods’ results.
Derivative Instruments
The LLC may utilize interest rate swaps to modify interest rate characteristics of existing debt obligations to manage interest rate exposure. These are recorded at fair value either as assets or liabilities in the accompanying Consolidated Statement of Assets and Liabilities with changes in the fair value of interest rate swaps during the period recognized as either an unrealized appreciation or depreciation in the accompanying Consolidated Statements of Operations. On the expiration, termination or settlement of a derivatives contract, the LLC generally records a gain or loss. When there is a master netting agreement with a financial institution, any gain or loss on interest rate swaps with the same financial institution are netted for financial statement presentation.
The fair value of interest rate swap contracts open as of December 31, 2021 is included on the Consolidated Schedule of Investments by contract. As of December 31, 2021, the LLC’s average monthly notional exposure to interest rate swap contracts was $109.6 million.
Consolidated Statement of Assets and Liabilities – Fair Value of Derivatives at December 31, 2021
| | | | | | | | | | | | | | | | | | | | | | | |
| Asset Derivatives | | Liability Derivatives |
Risk Exposure | Consolidated Statement
of Assets and Liabilities
Location | | Fair Value | | Consolidated Statement
of Assets and Liabilities
Location | | Fair Value* |
Swaps | | | | | | | |
Interest Rate Risk | Swap contracts, at fair value | | $ | — | | | Swap contracts, at fair value | | $ | 7,501,983 | |
| | | $ | — | | | | | $ | 7,501,983 | |
*Reflects the net amount of the interest rate swaps with Fifth Third Financial Risk Solutions.
The effect of derivative instruments on the Consolidated StatementsStatement of Operations
| | | | | | | | | | | | | | | |
| Risk Exposure | | Change in net unrealized depreciation on derivative transactions for the period from January 1, 2022 through May 18, 2022 | | Change in net unrealized depreciation on derivative transactions for the year ended December 31,
2021 | |
| Swaps | | | | | |
| Interest Rate Risk | | $ | 35,266,332 | | | $ | 2,248,926 | | |
| | $ | 35,266,332 | | | $ | 2,248,926 | | |
| | | | | | | | |
| (in thousands) | | |
| Risk Exposure | | Change in net unrealized appreciation on derivative transactions for the period from January 1, 2022 through May 18, 2022 |
| Swaps | | |
| Interest Rate Risk | | $ | 35,266 | |
| | $ | 35,266 | |
| | | | | | | | | | | | | | | |
| Risk Exposure | | Other expenses for the period from January 1, 2022 through May 18, 2022 | | Other expenses for the year ended December 31,
2021 | |
| Swaps | | | | | |
| Interest Rate Risk | | $ | 650,906 | | | $ | 2,024,070 | | |
| | $ | 650,906 | | | $ | 2,024,070 | | |
| | | | | | | | |
| (in thousands) | | |
| Risk Exposure | | Other expenses for the period from January 1, 2022 through May 18, 2022 |
| Swaps | | |
| Interest Rate Risk | | $ | 651 | |
| | $ | 651 | |
By using derivative instruments, the LLC is exposed to the counterparty’s credit risk — the risk that derivative counterparties may not perform in accordance with the contractual provisions offset by the value of any collateral received. The LLC’s exposure to credit risk associated with counterparty non-performance is limited to collateral posted and the unrealized gains inherent in such transactions that are recognized in the Consolidated Statement of Assets and Liabilities.Financial Statements. As appropriate, the LLC minimizes counterparty credit risk through credit monitoring procedures and managing margin and collateral requirements.
During December 2021, the LLC entered into an agreement for the purpose of hedging our investment in a pre-operating solar facility that the LLC has contracted to acquire. The derivative instrument has a trade date of December 15, 2021, an effective date of March 31, 2024 and an initial notional amount of $284.7 million. The fixed rate is 1.60%. Per the terms of the agreement, the swap is contingent on the transaction closing. While the transaction has not yet closed, in order to lock in the terms, the LLC made a payment for the amount of $5.0 million to be maintained as cash collateral. As
Regarding our investment in the Canadian Northern Lights assets included in the Other Commercial Solar Portfolios, we have foreign currency risk related to our revenue and operating expenses, which are denominated in Canadian Dollars as opposed to U.S. Dollars.
Income Taxes
The LLC intends to operate so that it will qualify to be treated as a partnership for U.S. federal income tax purposes under the Internal Revenue Code. As such, it will not be subject to any U.S. federal and state income taxes. In any year, it is possible that the LLC will not meet the qualifying income exception and will not qualify to be treated as a partnership. If the LLC does not meet the qualifying income exception, the members would then be treated as stockholders in a corporation, and the LLC would become taxable as a corporation for U.S. federal income tax purposes under the Internal Revenue Code, the LLC would be required to pay income tax at corporate rates on its net taxable income. To the extent of the LLC’s earnings and profits, and the payment of the distributions would not be deductible by the LLC, distributions to members from the LLC would constitute dividend income taxable to such members.
The LLC conducts substantially all its operations through its wholly owned subsidiary, GREC, which is a corporation that is subject to federal, state, provincial, local and foreign income taxes based on income. Accordingly, most of its operations will be subject to U.S. federal, state, provincial, local and foreign income taxes in the jurisdictions in which it resides. As of May 18, 2022, including territories and provinces, the portfolio resides in 36 jurisdictions.
Income taxes are accounted for under the assets and liabilities method. Deferred tax assets and liabilities are recorded for the estimated future tax consequences attributable to differences between items that are recognized in the Consolidated Financial Statements and tax returns in different years. Deferred tax assets and liabilities are measured using enacted tax rates expected to apply to taxable income in the years in which those temporary differences are expected to be recovered or settled. The effect on deferred tax assets and liabilities of a change in tax rates is recognized in income in the period that includes the enactment date.
For income tax benefits to be recognized, including uncertain tax benefits, a tax position must be more likely than not to be sustained upon examination by taxing authorities. The amount recognized is measured as the largest amount of the benefit that is more likely than not to be realized upon ultimate settlement. A valuation allowance is established against net deferred tax assets if, based on the weight of available evidence, it is more likely than not that some or all of the net deferred tax assets will not be realized. Changes in recognition or measurement are reflected in the period in which the change in judgment occurs. Interest and penalties associated with income taxes, if any, will be recognized in general and administrative expense.
The LLC does not consolidate its investments for financial statements; rather, it accounts for its investments at fair value under the specialized accounting of ASC 946. The tax attributes of the individual investments will be considered and incorporated in the LLC’s fair value estimates for those investments. The amounts recognized in the Consolidated Financial Statements for unrealized appreciation and depreciation will result in a difference between the Consolidated Financial Statements and the cost basis of the assets for tax purposes. These differences will be recognized as deferred tax assets and liabilities. Generally, the entities that hold the LLC’s investments will be included in the consolidated tax return of GREC and the differences between the amounts recognized for financial statement purposes and the tax return will be recognized as additional deferred tax assets and liabilities.
The LLC follows the authoritative guidance on accounting for uncertainty in income taxes and has concluded it has no material uncertain tax positions to be recognized at this time.
The LLC assessed its tax positions for all open tax years as of May 18, 2022 for all U.S. federal and state tax jurisdictions for the years 2014 through 2021. The results of this assessment are included in the LLC’s tax provision and deferred tax assets as of May 18, 2022.
Note 3. Investments
The composition ofeffective tax rate for the LLC’s investments as of December 31, 2021,period from January 1, 2022 through May 18, 2022 is 22.5%. For the period from January 1, 2022 through May 18, 2022, the primary items giving rise to the difference between the 21.0% statutory rate for corporations and the 22.5% effective tax rate are state taxes, federal tax credits, and other permanent differences primarily related to expenses recorded at fair value, were as follows:the partnership level which are not taxable.
| | | | | | | | | | | | | | | | | |
| Investments at
Cost | | Investments at
Fair Value | | Fair Value
Percentage of
Total Portfolio |
| Battery Storage: | | | | | |
| Pacifica Portfolio | $ | 11,288,841 | | | $ | 10,747,811 | | | 0.7 | % |
| Subtotal | $ | 11,288,841 | | | $ | 10,747,811 | | | 0.7 | % |
| Biomass: | | | | | |
| Eagle Valley Biomass Portfolio | $ | 24,533,222 | | | $ | 17,184,912 | | | 1.2 | % |
| Subtotal | $ | 24,533,222 | | | $ | 17,184,912 | | | 1.2 | % |
| Commercial Solar: | | | | | |
| Celadon Portfolio | $ | 165,129,450 | | | $ | 187,410,880 | | | 13.1 | % |
| GEH Portfolio | 150,463,205 | | | 157,925,117 | | | 11.0 | % |
| Ponderosa Portfolio | 49,514,975 | | | 59,577,751 | | | 4.1 | % |
| Sego Lily - Solar Portfolio | 107,621,275 | | | 122,272,431 | | | 8.5 | % |
| Trillium Portfolio | 74,764,309 | | | 101,432,185 | | | 7.1 | % |
| Other Commercial Solar Portfolios | 250,865,362 | | | 302,548,767 | | | 21.1 | % |
| Subtotal | $ | 798,358,576 | | | $ | 931,167,131 | | | 64.9 | % |
| Wind: | | | | | |
| Sego Lily - Wind Portfolio | $ | 117,410,390 | | | $ | 140,965,616 | | | 9.8 | % |
| Greenbacker Wind Holdings II Portfolio | 62,787,210 | | | 62,272,198 | | | 4.3 | % |
| Greenbacker Wind - HoldCo Portfolio | 84,674,188 | | | 78,025,844 | | | 5.4 | % |
| Other Wind Investments Portfolios | 56,638,076 | | | 58,770,864 | | | 4.1 | % |
| Subtotal | $ | 321,509,864 | | | $ | 340,034,522 | | | 23.6 | % |
| Other Investments: | | | | | |
| Other Portfolios | $ | 35,034,396 | | | $ | 35,243,259 | | | 2.5 | % |
| Subtotal | $ | 35,034,396 | | | $ | 35,243,259 | | | 2.5 | % |
| Energy Efficiency: | | | | | |
| Other Energy Efficiency Portfolios | $ | 668,736 | | | $ | 685,784 | | | 0.1 | % |
| Subtotal | $ | 668,736 | | | $ | 685,784 | | | 0.1 | % |
| Secured Loans: | | | | | |
| Chaberton Loan | $ | 2,247,962 | | | $ | 2,247,962 | | | 0.2 | % |
| Encore Loan | 3,058,527 | | | 3,058,527 | | | 0.2 | % |
| Hudson Loan | 4,984,650 | | | 4,984,650 | | | 0.3 | % |
| Hudson II Loan | 4,227,098 | | | 4,227,098 | | | 0.3 | % |
| New Market Loan | 5,008,070 | | | 5,008,070 | | | 0.3 | % |
| Shepherd's Run Loan | 8,751,528 | | | 8,751,528 | | | 0.6 | % |
| SE Solar Loan | 5,008,304 | | | 5,008,304 | | | 0.3 | % |
| Subtotal | $ | 33,286,139 | | | $ | 33,286,139 | | | 2.2 | % |
| Investments in Money Market Funds: | | | | | |
| Allspring Treasury Plus Money Market Fund - Institutional Class | $ | 16,823,110 | | | $ | 16,823,110 | | | 1.2 | % |
| Fidelity Government Portfolio - Class I | 16,873,111 | | | 16,873,111 | | | 1.2 | % |
| First American Government Obligations Fund - Class X | 16,823,111 | | | 16,823,111 | | | 1.2 | % |
| First American Government Obligations Fund - Class Z | 50,000 | | | 50,000 | | | — | % |
| JPMorgan US Government Money Market Fund - Class L | 16,823,111 | | | 16,823,111 | | | 1.2 | % |
| Subtotal | $ | 67,392,443 | | | $ | 67,392,443 | | | 4.8 | % |
| Total | $ | 1,292,072,217 | | | $ | 1,435,742,001 | | | 100.0 | % |
The composition of the LLC’s investments as of December 31, 2021 by geographic region, at cost and fair value, were as follows:
| | | | | | | | | | | | | | | | | |
| Investments
at Cost | | Investments
at Fair
Value | | Fair Value
Percentage
of Total
Portfolio |
| United States: | | | | | |
| East Region | $ | 376,929,916 | | | $ | 444,160,983 | | | 30.9 | % |
| Mid-West Region | 222,573,610 | | | 233,427,679 | | | 16.3 | |
| Mountain Region | 268,907,355 | | | 286,693,236 | | | 20.0 | |
| South Region | 105,516,478 | | | 111,030,877 | | | 7.7 | |
| West Region | 249,149,279 | | | 291,286,897 | | | 20.3 | |
| Total United States | 1,223,076,638 | | | 1,366,599,672 | | | 95.2 | % |
| Canada: | 1,603,136 | | | 1,749,886 | | | 0.1 | |
| Money Market Funds: | 67,392,443 | | | 67,392,443 | | | 4.7 | |
| Total | $ | 1,292,072,217 | | | $ | 1,435,742,001 | | | 100.0 | % |
The composition of the LLC’s investments as of December 31, 2021 by industry, at cost and fair value, were as follows:
| | | | | | | | | | | | | | | | | |
| Investments
at Cost | | Investments
at Fair
Value | | Fair Value
Percentage
of Total
Portfolio |
Battery Storage (2) | $ | 11,288,841 | | | $ | 10,747,811 | | | 0.7 | % |
| Biomass | 24,533,222 | | | 17,184,912 | | | 1.2 | |
Commercial Solar (1)(2) | 831,644,715 | | | 964,453,270 | | | 67.2 | |
| Wind | 321,509,864 | | | 340,034,522 | | | 23.7 | |
| Other Investments | 35,034,396 | | | 35,243,259 | | | 2.5 | |
| Energy Efficiency | 668,736 | | | 685,784 | | | — | |
| Money Market Funds | 67,392,443 | | | 67,392,443 | | | 4.7 | |
| Total | $ | 1,292,072,217 | | | $ | 1,435,742,001 | | | 100.0 | % |
(1) Includes loans in the amount of $33,286,139.
(2) Includes assets that have not reached COD.
Investments held as of December 31, 2021 are considered Control Investments, which are defined as investments in companies in which the LLC owns 25% or more of the voting securities of such company, have greater than 50% representation on such company’s board of directors, or are investments in limited liability companies for which the LLC serves as managing member.
Note 4.3. Valuation of Investments at Fair Value
The following table presents fair value measurements of investments, by major class, as of December 31, 2021, according to the fair value hierarchy:
| | | | | | | | | | | | | | | | | | | | | | | |
| Valuation Inputs |
| Level 1 | | Level 2 | | Level 3 | | Fair Value |
| Limited Liability Company Member Interests | $ | — | | | $ | — | | | $ | 1,332,932,893 | | | $ | 1,332,932,893 | |
| Capital Stock | — | | | — | | | 1,749,886 | | | 1,749,886 | |
| Energy Efficiency Secured Loans | — | | | — | | | 380,640 | | | 380,640 | |
| Secured Loans - Other | — | | | — | | | 33,286,139 | | | 33,286,139 | |
| Money Market Funds | 67,392,443 | | | — | | | — | | | 67,392,443 | |
| Total | $ | 67,392,443 | | | $ | — | | | $ | 1,368,349,558 | | | $ | 1,435,742,001 | |
| Other Financial Instruments* | | | | | | | |
| Open swap contracts - liabilities | $ | — | | | $ | (7,501,983) | | | $ | — | | | $ | (7,501,983) | |
| Total | $ | — | | | $ | (7,501,983) | | | $ | — | | | $ | (7,501,983) | |
* Other financial instruments are derivatives, such as futures, forward currency contracts and swaps. These instruments are reflected at the unrealized appreciation (depreciation) on the instrument.
The following table provides a reconciliation of the beginning and ending balances for investments that use Level 3 inputs for the period ended May 18, 2022:
| | Balance as of December 31,
2021 | | Net
change in
unrealized
appreciation
on
investments | | Translation
of
assets and
liabilities
denominated
in foreign
currencies | | Purchases | | Cost adjustments(1) | | Sales and repayments of investments(2) | | Net
realized
(loss) on
investments | | Balance as of May 18,
2022 |
| (in thousands) | | (in thousands) | Balance as of December 31,
2021 | | Net
change in
unrealized
appreciation
on investments | | Translation
of assets
and
liabilities
denominated
in foreign
currencies | | Purchases | | Cost adjustments(1) | | Sales and repayments of investments(2) | | Net
realized
loss on
investments | | Balance as of May 18,
2022 |
| Limited Liability Company Member Interests | Limited Liability Company Member Interests | $ | 1,332,932,893 | | | $ | 13,652,146 | | | $ | — | | | $ | 322,059,701 | | | $ | (210,519,840) | | | $ | — | | | $ | (1,688) | | | $ | 1,458,123,212 | |
| Capital Stock | Capital Stock | 1,749,886 | | | (4,325) | | | (26,172) | | | — | | | — | | | — | | | — | | | 1,719,389 | |
| Energy Efficiency - Secured Loans | Energy Efficiency - Secured Loans | 380,640 | | | — | | | — | | | — | | | — | | | (55,000) | | | — | | | 325,640 | |
| Secured Loans - Other | Secured Loans - Other | 33,286,139 | | | — | | | — | | | 17,364,517 | | | — | | | (12,270,274) | | | — | | | 38,380,382 | |
| Total | Total | $ | 1,368,349,558 | | | $ | 13,647,821 | | | $ | (26,172) | | | $ | 339,424,218 | | | $ | (210,519,840) | | | $ | (12,325,274) | | | $ | (1,688) | | | $ | 1,498,548,623 | |
(1)Includes paid-in-kind interest, return of capital and additional investments in existing investments, if any.
(2)Includes principal repayments on loans.
The total change in unrealized appreciation included in the Consolidated StatementsStatement of Operations within Net change in unrealized appreciation (depreciation) on Investments and Foreign currency translation for the period from January 1, 2022 through May 18, 2022 attributable to Level 3 investments still held was $13.6 million. Reclassifications impacting Level 3 of the fair value hierarchy are reported as transfers in or out of Level 3 as of the beginning of the period in which the reclassifications occur. There were no reclassifications attributable to Level 3 investments during the period from January 1, 2022 through May 18, 2022.
The following table provides a reconciliation of the beginning and ending balances for investments that use Level 3 inputs for the year ended December 31, 2021:
| | | | | | | | | | | | | | | | | | | | | | | | | | | | | | | | | | | | | | | | | | | | | | | |
| Balance as of December 31,
2020 | | Net
change in
unrealized
appreciation
on
investments | | Translation
of
assets and
liabilities
denominated
in foreign
currencies | | Purchases | | Cost adjustments(1) | | Sales and repayments of investments(2) | | Net
realized
(loss) on
investments | | Balance as of December 31,
2021 |
| Limited Liability Company Member Interests | $ | 609,394,039 | | | $ | 55,973,939 | | | $ | — | | | $ | 1,089,298,390 | | | $ | (440,266,245) | | | $ | 18,561,952 | | | $ | (29,182) | | | $ | 1,332,932,893 | |
| Capital Stock | 1,689,628 | | | 49,531 | | | 10,727 | | | — | | | — | | | — | | | — | | | 1,749,886 | |
| Energy Efficiency - Secured Loans | 398,640 | | | — | | | — | | | — | | | — | | | (18,000) | | | — | | | 380,640 | |
| Secured Loans - Other | 37,327,690 | | | — | | | — | | | 24,431,121 | | | — | | | (28,472,672) | | | — | | | 33,286,139 | |
| Total | $ | 648,809,997 | | | $ | 56,023,470 | | | $ | 10,727 | | | $ | 1,113,729,511 | | | $ | (440,266,245) | | | $ | (9,928,720) | | | $ | (29,182) | | | $ | 1,368,349,558 | |
(1)Includes paid-in-kind interest, return of capital and additional investments in existing investments, if any.
(2)Includes principal repayments on loans.
The total change in unrealized appreciation included in the Consolidated Statements of Operations within net change in unrealized appreciation (depreciation) on Investments and Foreign currency translation for the year ended December 31, 2021 attributable to Level 3 investments and foreign currency translation still held as of December 31, 2021 was $56.0 million, respectively. Reclassifications impacting Level 3 of the fair value hierarchy are reported as transfers in or out of Level 3 as of the beginning of the period in which the reclassifications occur. There were no reclassifications attributable to Level 3 investments during the year ended December 31, 2021.
As of December 31, 2021, most of the LLC’s portfolio investments utilized Level 3 inputs. The following table presents the quantitative information about Level 3 fair value measurements of the LLC’s investments as of December 31, 2021:
| | | | | | | | | | | | | | | | | | | | | | | |
| Fair Value | | Valuation
Techniques | | Unobservable
Inputs | | Range of Inputs
(weighted average) |
Battery Storage* | $ | 10,747,811 | | | Income Approach and Transaction Cost | | Discount rate, kWh storage, potential leverage and estimated remaining useful life | | 9.37%, 2.16% annual degradation in production, 11.0 years |
Biomass | $ | 17,184,912 | | | Income Approach | | Discount rate, kWh production, potential leverage and estimated remaining useful life | | 8.25%, No annual degradation in production, 12.0 years |
Commercial Solar* | $ | 931,167,131 | | | Income Approach and Transaction Cost | | Discount rate, kWh production, potential leverage and estimated remaining useful life | | 3.50%-9.07% (7.63%), 0%-0.50% (0.50%) annual degradation in production, 9.2-39.0 (33.6) years |
Wind | $ | 340,034,522 | | | Income Approach | | Discount rate, kWh production, potential leverage and estimated remaining useful life | | 7.75%-8.43% (7.81%) No annual degradation in production 18.7-31.0 (26.4) years |
Other Investments | $ | 35,243,259 | | | Transaction Cost | | Not Applicable | | Not Applicable |
Energy Efficiency | $ | 685,784 | | | Income and Collateral-Based Approach | | Market yields and value of collateral | | 10.25%
No annual degradation in production
3.2-4.0 (3.6) years
|
Secured Loans | $ | 33,286,139 | | | Yield Analysis | | Market yields | | 8.00%-10.00% (8.48%) |
*Includes assets that have not reached COD.
GCM utilizes primarily proprietary discounted cash flow pricing models in the fair value measurement of the LLC’s investments. Significant unobservable inputs include discount rates and estimates related to the future production of electricity. Significant increases or decreases in discount rates used or actual kilowatt-hour production can significantly increase or decrease the fair value measurement.
Note 5.4. Related Party Agreements and Transaction Agreements
The related party disclosures as included herein reflects such matters as of May 18, 2022 and prior to such date. Certain of the related party agreements and transactions were impacted by the Acquisition and are detailed in Note 14.16. Related Parties as included in the Notes to the Consolidated Financial Statements as prepared under the Non-Investment Basis.
Prior to the Acquisition, the LLC had executed advisory and administration agreements with GCM and Greenbacker Administration, which entitled GCM, and certain affiliates of GCM, to specified fees upon the provision of certain services with regard to the ongoing management of the LLC as well as reimbursement of O&O costs incurred by GCM on behalf of the LLC (as discussed in Note 2. Significant Accounting Policies) and certain other operating costs incurred by GCM on behalf of the LLC. As the LLC’s previous public offering was terminated on March 29, 2019, its former dealer manager will no longer receive any selling commissions or dealer manager fees. However, our former dealer manager will continue to receive distribution fees on Class C shares until the maximum amount of commissions and dealer manager fees permitted by applicable regulation is reached.
With respect to Class C shares only, the LLC pays the former dealer manager a distribution fee that accrues daily in an amount equal to 1/365th of 0.80% of the amount of the net asset value for the Class C shares for such day on a continuous basis from year to year. The LLC will stop paying distribution fees at the earlier of 1) a listing of the Class C shares on a national securities exchange; 2) total underwriting compensation in the offering equals 10.0% of the gross proceeds from the primary offering of Class C shares, following the completion of such offering; or 3) Class C shares are no longer outstanding. The dealer manager may re-allow all or a portion of the distribution fee to participating broker-dealers and servicing broker-dealers. The LLC estimated the amount of distribution fees expected to be paid and recorded that liability at the time of sale of such
shares. The liability is included in Deferred sales commission payable on the Consolidated Statement of Assets and Liabilities and fees recorded in Accumulated (losses) (specific to the Class C shares) on the Consolidated Statement of Assets and Liabilities. The LLC continues to assess the value of the liability on a regular basis.
The LLC also reimbursed GCM for the O&O costs (other than selling commissions and dealer manager fees) it had incurred on the LLC’s behalf related to the now terminated Registration Statements, only to the extent that the reimbursement would not cause the selling commissions, dealer manager fee and the other O&O costs borne by the LLC to exceed 15.00% of the gross offering proceeds as the amount of proceeds increases.
Offering costs incurred by GCM in conjunction with the offering of shares of Class P-A, P-S, P-T and P-D under our current private placement memoranda were subject to the reimbursement by the LLC up to 0.50% (50 basis points) of gross offering proceeds for each such class of shares.
Prior to May 19, 2022, the term “Special Unitholder” referred to GREC Advisors, LLC, a Delaware limited liability company, which was a subsidiary of GCM and “special unit”, referred to the special unit of limited liability company interest in the LLC. This entitled the Special Unitholder to receive a Performance Participation Fee.
Prior to the Acquisition, the fees and reimbursement obligations related to the operation of the LLC were as follows:
| | | | | | | | |
| Type of Compensation and Recipient | | Determination of Amount |
| Base Management Fees — GCM | | Prior to July 1, 2021, the base management fee payable to GCM was calculated at a monthly rate of 0.17% (2.00% annually) of our gross assets (including amounts borrowed up to $50.0 million) until gross assets exceed $800.0 million. The base management fee monthly rate decreased to 0.15% (1.75% annually) for gross assets between $800.0 million to $1.5 billion and 0.13% (1.50% annually) for gross assets greater than $1.5 billion. For services rendered under the advisory agreement, the base management fee was payable monthly in arrears, or more frequently as authorized under the advisory agreement. The base management fee was calculated based on the average of the values of our gross assets for each day of the prior month. Base management fees for any partial period were appropriately prorated. The base management fee had the ability to be deferred or waived, in whole or in part, at the election of GCM. All or any part of the deferred base management fee not taken as to any period was deferred without interest and may be taken in any period prior to the occurrence of a liquidity event as determined by GCM in its sole discretion. On July 1, 2021, the LLC entered into the Advisory Agreement with GCM. Effective July 1, 2021, the base management fee payable to GCM was calculated at a monthly rate of 0.17% (2.00% annually) of the net assets until the net assets exceed $800.0 million. The base management fee monthly rate will decrease to 0.15% (1.75% annually) for net assets between $800.0 million to $1.5 billion and to 0.13% (1.50% annually) for net assets greater than $1.5 billion. Following the completion of the Acquisition and the termination of the Advisory Agreement, the LLC no longer pays a management fee to GCM. |
| | | | | | | | |
Type of Compensation and Recipient | | Determination of Amount |
| Performance Participation Fees | | Prior to the Acquisition, under the Fourth Operating Agreement, the “Performance Participation Fee” which the Special Unitholder was entitled to was calculated and payable in arrears, for an amount equal to 12.5% of the total return generated by the LLC during the most recently completed fiscal quarter, subject to a hurdle amount of 1.50% (or 6% annualized) (the “Hurdle Amount”), a loss carryforward amount and a fee carryforward amount. The “Total Return Amount” is defined for each quarterly calculation period, as an amount equal to the sum of:
•The aggregate amount of all cash distributions accrued or paid (without duplication) during such quarter on the shares outstanding at the end of such quarter, plus
•The amount of the change in aggregate NAV of such shares since the beginning of such quarter, before giving effect to (x) changes in the aggregate NAV of such shares during such quarter resulting solely from the net proceeds of issuances and/or repurchase of shares by the LLC, and (y) the amount of any accrual of the Performance Participation Fee during such quarter. |
| | | | | | | | |
| Type of Compensation and Recipient | | Determination of Amount |
| | The calculation of the Total Return Amount for each period included any appreciation or depreciation in the NAV of the shares issued during such period but exclude the proceeds from the initial issuance of such shares. The total NAV of the shares outstanding as of the last business day of a calendar quarter was the amount against which changes in the total NAV of the shares outstanding during the subsequent calendar quarter was measured. Furthermore, the “Loss Carryforward Amount” was initially equal to zero and cumulatively increased in any calendar quarter by the absolute value of any negative total return for such quarter and cumulatively decreased in any calendar quarter by the amount of any positive total return. The “Fee Carryforward Amount” was also initially equal to zero, and cumulatively increased in any calendar quarter by (i) the amount, if any, by which the Hurdle Amount (noted above) for such quarter exceeded any positive Total Return Amount for such quarter; and (ii) the amount, if any, by which the catch-up amount for such quarter exceeded excess profits for such quarter. The fee carryforward amount was cumulatively decreased in any calendar quarter by the amount, if any, of the Fee Carryforward Amount paid to the Special Unitholder for such quarter. Neither the Loss Carryforward Amount nor the Fee Carryforward Amount were permitted to less than zero at any given time. |
| | The Special Unitholder shall receive the Performance Participation Fee as follows:
● if the Total Return Amount for the applicable period exceeded the sum of (x) the Hurdle Amount for such period and (y) the Loss Carryforward Amount for such Period (any such excess, “Excess Profits”), 100% of such Excess Profits until the total amount paid to the Special Unitholder equals 12.5% of the sum of (x) the Hurdle Amount for such period and (y) any amount paid to the Special Unitholder pursuant to this clause (the “Catch-Up Amount”);
● to the extent there were remaining Excess Profits after payment of the Catch-Up Amount, 100% of such remaining Excess Profits until such amount paid to the Special Unitholder equaled the amount of the Fee Carryforward Amount for such period; and
● to the extent there are remaining Excess Profits after payment of the Catch-Up Amount and the Fee Carryforward Amount (as defined above), 12.5% of such remaining Excess Profits. |
| | The Liquidation Performance Participation Fee payable to the Special Unitholder will equal 20.0% of the net proceeds from a liquidation of the LLC in excess of adjusted capital, as measured immediately prior to liquidation. Adjusted capital shall mean the LLC NAV immediately prior to the time of a liquidation or a listing. In the event of any liquidity event that involves a listing of the LLC's shares, or a transaction in which the LLC's members receive shares of a company that is listed, on a national securities exchange, the Liquidation Performance Participation Fee will equal 20.0% of the amount, if any, by which the LLC's listing value following such liquidity event exceeds the adjusted capital, as calculated immediately prior to such listing (the “Listing Premium”). Any such Listing Premium and related Liquidation Performance Participation Fee will be determined and payable in arrears 30 days after the commencement of trading following such liquidity event. |
For the period from January 1, 2022 through May 18, 2022, GCM earned $10.7 million in management fees. For the year ended December 31, 2021, GCM earned $21.9 million in management fees. As of December 31, 2021, the LLC owed $2.3 million to GCM in management fees, which amounts are included in Management fee payable on the Consolidated Statement of Assets and Liabilities.
The Performance participation fee recorded on the Consolidated StatementsStatement of Operations for the period from January 1, 2022 through May 18, 2022 is $0.4 million. The Performance participation fee recorded on the Consolidated Statements of Operations for the year ended December 31, 2021 is $4.7 million.
The Performance Participation Fee payable and due for the year ended December 31, 2021 was $3.4 million.
As of December 31, 2021, $0.6 million were due to GCM for O&O costs related to the private continuous offering and shown as Due to GCM on the Consolidated Statement of Assets and Liabilities.
As of May 18, 2022, GCM owned 23,60123.6 thousand Class A shares and 2,776 Class P-D shares. As of December 31, 2021, GCM owned 23,601 Class A shares and 2,7762.8 thousand Class P-D shares.
The LLC entered into secured loans to finance the purchase and installation of energy-efficient lighting with LED Funding LLC and AEC Companies. Certain of the loans with LED Funding LLC, converted to a lease on the day the energy efficiency upgrades became operational. AEC Companies are considered related parties, as the members of these entities own an indirect, noncontrolling ownership interest in GCM. The loans outstanding between the AEC Companies and the LLC, and the subsequent leases, were negotiated at an arm’s length and contain standard terms and conditions that would be included in third-party lending agreements, including required security and collateral, interest rates based upon risk of the specific loan, and term of the loan. As of May 18, 2022, all loans and leases are considered current per their terms.
On October 9, 2020, GREC made a $5.0 million LP commitment to GDEV, which was increased to $6.1 million in the fourth quarter of 2020. In April 2021, the commitment to GDEV increased to $7.5 million. As the initial investor, GREC was awarded a 10.00% carried interest participation in GDEV GP, GDEV's general partner. GDEV is an affiliate of GREC as GDEV shares the same investment advisor as the LLC. As of May 18, 2022, $2.9 million of the commitment was funded.
On December 22, 2020 the LLC, through its wholly owned subsidiary, Citrine Solar LLC, entered into a third transaction with GROZ to sell Gliden Solar, LLC. The asset was sold for a purchase price of $12.8 million based upon the fair value of the investment as determined by an independent third-party appraiser. The transaction resulted in an initial realized gain of $1.6 million all of which was recorded in the year ended December 31, 2020. The proceeds related to the Investment sales receivable were subsequently collected by April 30, 2021.
Note 6.5. Borrowings
On January 5, 2018, the LLC, through GREC HoldCo, entered into a credit facility agreement (the "Credit Facility"“Credit Facility”). The Credit Facility consisted of a loan of up to the lesser of $60.0 million or a borrowing base amount based on various solar projects that act as collateral for the Credit Facility, of which approximately $25.7 million was drawn down at closing. The Credit Facility allowed for additional drawdowns through December 31, 2018 and converted to a term loan with a maturity on January 5, 2024.
On June 20, 2019, the LLC, through GREC HoldCo, entered into an amended and restated credit agreement (the "New“New Credit Facility"Facility”). The New Credit Facility consists of a loan of up to the lesser of $110.0 million or a borrowing base amount based on various solar projects that act as collateral for the credit facility, of which approximately $58.3 million was drawn down at closing. In November 2020, the LLC, through GREC HoldCo, entered into the Second Amended and Restated Credit Agreement, which amends the New Credit Facility to make available a non-revolving line of credit facility that will convert into a term loan facility and a letter of credit facility. The commitments of the lenders aggregate to $97.8 million between existing term loans, future committed loans and letters of credit, of which approximately $90.7 million was drawn at closing. The New Credit Facility allows for additional drawdowns through November 25, 2021, at which point the outstanding loans shall convert to an additional term loan that matures on June 20, 2025.
The LLC used the net proceeds of borrowings under the New Credit Facility for investment in additional alternative energy power generation assets that are anticipated to become projects and for other general corporate purposes. Loans made under the New Credit Facility bear interest at 1.75% in excess of the three-month LIBOR. Prior to the New Credit Facility converting to a term loan, quarterly commitment fees on the average daily unused portion of the Credit Facility were payable at a rate per annum of 0.50%.
Borrowings under the New Credit Facility are back-leveraged and secured by all of the assets of GREC HoldCo and the equity interests of each direct and indirect subsidiary of the LLC. The LLC, GREC and each direct and indirect subsidiary of the LLC are guarantors of the LLC’s obligations under the New Credit Facility. GREC has pledged all of the equity interests of GREC HoldCo as collateral for the New Credit Facility.
Regarding the Credit Facility, the LLC has entered into five separate interest rate swap agreements as economic hedges. The first swap, with a trade date of June 15, 2017, an effective date of June 30, 2018 and an initial notional amount of $20.9 million was used to swap the floating-rate interest payments on an additional principal amount of the Credit Facility, for a corresponding fixed payment. The fixed swap rate is 2.26%. The second swap, with a trade date of January 11, 2018, an effective date of December 31, 2018 and an initial notional amount of $29.6 million was used to swap the floating-rate interest payments on the remaining unhedged portion of the Credit Facility, as well as the estimated additional drawdowns, for a corresponding fixed payment. The fixed swap rate is 2.65%. The third swap, with a trade date of February 7, 2018, an effective date of December 31, 2018 and an initial notional amount of $4.2 million was used to swap the floating-rate interest payments on the remaining unhedged portion of the Credit Facility, as well as the estimated additional drawdowns, for a corresponding fixed payment. The fixed swap rate is 2.97%. The fourth swap, with a trade date of January 2, 2019, an effective date of September 30, 2019 and an initial notional amount of $38.2 million was used to swap the floating-rate interest payments on the remaining unhedged portion of the Credit Facility, as well as the estimated additional drawdowns, for a corresponding fixed payment. The fixed swap rate is 2.69%. The fifth swap, with a trade date of February 19, 2021, an effective date of February 26, 2021 and an initial notional amount of $7.1 million was used to swap the floating-rate interest payments on the remaining unhedged portion of the Credit Facility, as well as the estimated additional drawdowns, for a corresponding fixed payment. The fixed swap rate is 1.64%.
If an event of default shall occur and be continuing under the New Credit Facility, the commitments under the New Credit Facility may be terminated and the principal amount outstanding under the New Credit Facility, together with all accrued unpaid interest and other amounts owing in respect thereof, may be declared immediately due and payable.
On December 6, 2019, GREC entered into a $15.0 million revolving letter of credit facility (“LC Facility”) agreement. On January 30, 2020, the LC Facility was amended to include an equipment loan, and the amount of $5.6 million was drawn down under the equipment facility loan. On March 18, 2020, a repayment of $1.9 million was made, reducing the outstanding balance of the equipment facility loan. On June 9, 2020, a repayment of the remaining outstanding balance occurred. In October 2020, the LC Facility agreement was amended to increase the aggregate principal amount to $22.5 million. On April 1, 2021, the LC Facility agreement was amended to maintain cash collateral in an amount equal to 100.00% of the outstanding obligation and the letter of credit fee was reduced from 2.25% to 0.75%. On June 3, 2021, the LC Facility agreement was amended to extend the maturity date to September 4, 2021. On September 3, 2021, the LC Facility agreement was amended to extend the maturity date to September 4, 2022. On September 28, 2021, the LC Facility agreement was amended to increase the aggregate principal amount to $32.5 million. On February 2, 2022, the LC Facility agreement was amended to increase the aggregate principal amount to $40.0 million.
The LLC’s borrowings as of December 31, 2021 was as follows:
| | | | | | | | | | | | | | | | | | | | | | | | | | | | | | | | |
| | December 31, 2021 |
| | Aggregate Principal
Amount Available | | Principal Amount
Outstanding | | Carrying Value | | Deferred Financing
Costs | | Term Note Payable,
Net of Financing Costs |
| New Credit Facility | | $ | 97,822,841 | | | $ | 82,151,509 | | | $ | 82,151,509 | | | $ | 2,737,887 | | | $ | 79,413,622 | |
| LC Facility | | 32,500,000 | | | — | | | — | | | — | | | — | |
| Total | | $ | 130,322,841 | | | $ | 82,151,509 | | | $ | 82,151,509 | | | $ | 2,737,887 | | | $ | 79,413,622 | |
The following table shows the components of interest expense related to the LLC's borrowings for the period from January 1, 2022 through May 18, 2022 and the year ended December 31, 2021:2022:
| | | | | | | | | | | | |
| For the period from January 1, 2022 through May 18, 2022 | | For the year ended December 31,
2021 | |
| Credit Facility commitment fee | $ | 136,171 | | | $ | 423,075 | | |
| Credit Facility loan interest | 657,528 | | | 1,659,715 | | |
| Amortization of deferred financing costs | 520,183 | | | 905,959 | | |
| Total | $ | 1,313,882 | | | $ | 2,988,749 | | |
| Weighted average interest rate on Credit Facility | 2.0 | % | | 1.9 | % | |
| Weighted average outstanding balance of Credit Facility | $ | 81,707,643 | | | $ | 87,020,554 | | |
| | | | | | |
| (dollars in thousands) | For the period from January 1, 2022 through May 18, 2022 | |
| Credit Facility commitment fee | $ | 136 | | |
| Credit Facility loan interest | 658 | | |
| Amortization of deferred financing costs | 520 | | |
| Total | $ | 1,314 | | |
| Weighted average interest rate on Credit Facility | 2.0 | % | |
| Weighted average outstanding balance of Credit Facility | $ | 81,708 | | |
Note 7.6. Members’ Equity
General
Pursuant to the terms of the Operating Agreement, the LLC may issue up to 400,000,000400.0 million shares, of which 350,000,000350.0 million shares are currently designated as Class A, C, I, P-A, P-D, P-S, P-T and P-I shares (collectively, common shares), and 50,000,00050.0 million are designated as preferred shares and one special unit. Each class of common shares has the same voting rights.
Class P-A shares were not offered for sale from March 29, 2019 through October 17, 2020, but were reinstated as of October 18, 2020, along with the commencement of three new share classes: P-D, P-T and P-S.
The following table is a summary of the shares issued and repurchased during the period and outstanding as of May 18, 2022:
| | Shares Outstanding as of December 31,
2021 | | Shares
Sold
During the Period | | Shares
Issued
through
Reinvestment of
Distributions
During
the Period | | Shares
Repurchased
During
the Period | | | Shares Outstanding as of May 18,
2022 |
| (in thousands) | |
| (in thousands) | |
| (in thousands) | | Shares Outstanding as of December 31,
2021 | | Shares
Sold
During the Period | | Shares
Issued
through
Reinvestment of
Distributions
During
the Period | | Shares
Repurchased
During
the Period | | | | Shares Outstanding as of May 18,
2022 |
| Class A shares | Class A shares | 16,580,558 | | | — | | | 137,884 | | | (91,469) | | | | 16,626,973 | |
| Class C shares | Class C shares | 2,741,963 | | | — | | | 31,007 | | | (6,210) | | | | 2,766,760 | |
| Class I shares | Class I shares | 6,449,493 | | | — | | | 77,618 | | | (82,049) | | | | 6,445,062 | |
| Class P-A shares | Class P-A shares | 783,593 | | | — | | | 10,600 | | | — | | | | 794,193 | |
| Class P-I shares | Class P-I shares | 92,069,013 | | | 11,211,603 | | | 370,820 | | | (317,209) | | | | 103,334,227 | |
| Class P-D shares | Class P-D shares | 198,548 | | | — | | | 400 | | | — | | | | 198,948 | |
| Class P-S shares | Class P-S shares | 46,324,757 | | | 713,196 | | | 233,094 | | | (223,209) | | | | 47,047,838 | |
| Class P-T shares | Class P-T shares | 239,594 | | | — | | | 1,853 | | | — | | | | 241,447 | |
| Total | Total | 165,387,519 | | | 11,924,799 | | | 863,276 | | | (720,146) | | | | 177,455,448 | |
The following table is a summary of the shares issued and repurchased during the period and outstanding as of December 31, 2021:
| | | | | | | | | | | | | | | | | | | | | | | | | | | | | | | | | | | |
| Shares Outstanding as of December 31,
2020 | | Shares Sold
During
the Period | | Shares
Issued
through
Reinvestment
of
Distributions
During
the Period | | Shares
Repurchased
During the
Period | | Shares Transferred During the Period | | Shares Outstanding as of December 31,
2021 |
| Class A shares | 16,844,129 | | | — | | | 413,371 | | | (661,926) | | | (15,016) | | | 16,580,558 | |
| Class C shares | 2,734,661 | | | — | | | 93,130 | | | (85,828) | | | — | | | 2,741,963 | |
| Class I shares | 6,526,001 | | | — | | | 231,377 | | | (296,575) | | | (11,310) | | | 6,449,493 | |
| Class P-A shares | 55,264 | | | 711,897 | | | 16,432 | | | — | | | — | | | 783,593 | |
| Class P-I shares | 36,710,292 | | | 56,416,202 | | | 411,369 | | | (1,493,868) | | | 25,018 | | | 92,069,013 | |
| Class P-D shares | — | | | 197,405 | | | 1,143 | | | — | | | — | | | 198,548 | |
| Class P-S shares | — | | | 46,075,796 | | | 248,961 | | | — | | | — | | | 46,324,757 | |
| Class P-T shares | — | | | 237,124 | | | 2,470 | | | — | | | — | | | 239,594 | |
| Total | 62,870,347 | | | 103,638,424 | | | 1,418,253 | | | (2,538,197) | | | (1,308) | | | 165,387,519 | |
The proceeds from shares sold and the value of shares issued through the reinvestment of distributions for each class of shares for the for the period from January 1, 2022 through May 18, 2022 and for the year ended December 31, 2021 were as follows:
| | | | | | | | | | | | | | | | | | | | | | | | | | | | | | | | | | | | | | | | | | | | | | | | | | | | | |
| Class A
shares | | Class C
shares | | Class I
shares | | Class P-A
shares | | Class P-I
shares | | Class P-D
shares | | Class P-S
shares | | Class P-T
shares | | Total |
| For the period from January 1, 2022 through May 18, 2022: | | | | | | | | | | | | | | | | | |
| Proceeds from Shares Sold | $ | — | | | $ | — | | | $ | — | | | $ | — | | | $ | 98,650,613 | | | $ | — | | | $ | 6,300,999 | | | $ | — | | | $ | 104,951,612 | |
| Proceeds from Shares Issued through Reinvestment of Distributions | $ | 1,148,176 | | | $ | 252,049 | | | $ | 646,222 | | | $ | 91,397 | | | $ | 3,262,904 | | | $ | 3,540 | | | $ | 2,065,980 | | | $ | 16,464 | | | $ | 7,486,732 | |
| For the year ended December 31, 2021: | | | | | | | | | | | | | | | | | |
| Proceeds from Shares Sold | $ | — | | | $ | — | | | $ | — | | | $ | 6,210,692 | | | $ | 504,228,647 | | | $ | 1,774,641 | | | $ | 413,941,487 | | | $ | 2,130,975 | | | $ | 928,286,442 | |
| Proceeds from Shares Issued through Reinvestment of Distributions | $ | 3,511,041 | | | $ | 768,984 | | | $ | 1,964,922 | | | $ | 142,773 | | | $ | 3,648,652 | | | $ | 10,264 | | | $ | 2,222,218 | | | $ | 22,122 | | | $ | 12,290,976 | |
| | | | | | | | | | | | | | | | | |
| | | | | | | | | | | | | | | | | |
| | | | | | | | | | | | | | | | | |
As of December 31, 2021, none of the LLC’s preferred shares were issued and outstanding. | | | | | | | | | | | | | | | | | | | | | | | | | | | | | | | | | | | | | | | | | | | | | | | | | | | | | |
| (in thousands) | Class A
shares | | Class C
shares | | Class I
shares | | Class P-A
shares | | Class P-I
shares | | Class P-D
shares | | Class P-S
shares | | Class P-T
shares | | Total |
| For the period from January 1, 2022 through May 18, 2022: | | | | | | | | | | | | | | | | | |
| Proceeds from Shares Sold | $ | — | | | $ | — | | | $ | — | | | $ | — | | | $ | 98,651 | | | $ | — | | | $ | 6,301 | | | $ | — | | | $ | 104,952 | |
| Proceeds from Shares Issued through Reinvestment of Distributions | $ | 1,148 | | | $ | 252 | | | $ | 646 | | | $ | 91 | | | $ | 3,263 | | | $ | 4 | | | $ | 2,066 | | | $ | 16 | | | $ | 7,486 | |
| | | | | | | | | | | | | | | | | |
| | | | | | | | | | | | | | | | | |
| | | | | | | | | | | | | | | | | |
Distribution Reinvestment Plan
The LLC adopted a DRP through which the LLC’s Class A, C and I shareholders may elect to have the full amount of cash distributions reinvested in additional shares rather than receiving the cash distributions. The DRP was amended as of February 1, 2021 to include all share classes. Shares issued pursuant to the DRP will have the same voting rights as shares offered pursuant to the LLC’s prior public and current private offerings. As of November 30, 2020, pursuant to ourthe LLC’s Registration Statement on Form S-3D (File No. 333-251021), the LLC was offering up to $20.0 million in Class A, C and I shares to our existing shareholders pursuant to the DRP. No dealer manager fees, selling commissions or other sales charges will be paid with respect to shares issued pursuant to the DRP except for distribution fees on Class C, P-S and P-T shares. At its discretion, the Board of Directors may amend, suspend or terminate the DRP. The Board of Directors may also modify or waive the terms of the DRP with respect to certain or all shareholders, in its discretion, to be in the best interests of the LLC. A participant may terminate participation in the DRP by written notice to the plan administrator, received by the plan administrator at least 10 days prior to the distribution payment date.
As of May 18, 2022, the LLC issued 2,576,0382.6 million Class A shares, 440,6640.4 million Class C shares, 1,230,4031.2 million Class I shares, 27,03227.0 thousand Class P-A shares, 782,1890.8 million Class P-I shares, 1,5431.5 thousand Class P-D shares, 482,0550.5 million Class P-S shares and 4,3234.3 thousand Class P-T shares for a total of 5,544,2475.5 million aggregate shares issued under the DRP. As of December 31, 2021, the LLC issued 2,438,154 Class A shares, 409,657 Class C shares, 1,152,785 Class I shares, 16,432 Class P-A shares, 411,369 Class P-I shares, 1,143 Class P-D shares, 248,961 Class P-S shares and 2,470 Class P-T shares for a total of 4,680,971 aggregate shares issued under the DRP.
Share Repurchase Program
The LLC offers athe SRP pursuant to which quarterly share repurchases will be conducted to allow members to sell shares back to the LLC at a price equal to the then current offering price less the selling commissions and dealer manager fees associated with that class of shares.
The SRP includes numerous restrictions that will limit a shareholder’s ability to sell shares. At the sole discretion of the Board of Directors, the LLC may also use cash on hand (including the proceeds from the issuance of new shares), cash available from borrowings and cash from liquidation of investments to repurchase shares.
A shareholders’ right to purchase is subject to the availability of funds and the other provisions of the SRP. Additionally, a member must hold his or her shares for a minimum of one year before he or she can participate in the SRP, subject to any of the following special circumstances: (i) the written request of the estate, heir or beneficiary or a deceased shareholder; (ii) a qualifying disability of the shareholder for a non-temporary period of time provided that the condition causing the qualifying disability was not pre-existing on the date that the shareholder became a shareholder; (iii) a determination of incompetence of the shareholder by a state or federal court located in the United States; or (iv) as determined by the Board of Directors, in their discretion, to be in the interests of the LLC. If a member has made more than one purchase of shares, the one-year holding period will be calculated separately with respect to each purchase.
Through September 30, 2020, quarterly share repurchases were conducted to allow up to approximately 5.00% of the weighted average number of outstanding shares in any 12-month period to be repurchased by the LLC. Effective September 1, 2020, the LLC, through approval by its Board of Directors, adopted an amended SRP, pursuant to which the LLC will conduct quarterly share repurchases to allow members to sell all or a portion of their shares (of any class) back to the LLC. The quarterly share repurchase limits for the LLC's new SRP are set forth below.
| | | | | | | | |
| Quarter Ending | | Share Repurchase Limit(s) |
| December 31, 2020 | | During such fiscal quarter, 1.88% of the weighted average number of shares outstanding in the prior four fiscal quarters |
| March 31, 2021 | | During such fiscal quarter, 2.50% of the weighted average number of shares outstanding in the prior four fiscal quarters |
| June 30, 2021 | | During such fiscal quarter, 3.75% of the weighted average number of shares outstanding in the prior four fiscal quarters |
| September 30, 2021, and each quarter thereafter | | During any 12-month period, 20.00% of the weighted average number of outstanding shares
During any fiscal quarter, 5.00% of the weighted average number of shares outstanding in the prior four fiscal quarters |
The LLC has received an order for the SRP from the SEC under Rule 102(a) of Regulation M under the Exchange Act. In addition, the SRP is substantially similar to repurchase programs for which the SEC has stated it will not recommend enforcement action under Rule 13e-4 and Regulation 14E under the Exchange Act.
Note 8.7. Distributions
On the last business day of each month, with the authorization of the LLC’s Board of Directors, the LLC declares distributions on each outstanding Class A, C, I, P-A, P-I, P-D, P-T and P-S shares. These distributions are calculated based on shareholders of record for each day in amounts equal to that exhibited in the table below based upon distribution period and class of share.
| | Class of Share |
| | | | Class of Share | | | | | | Class of Share |
| Distribution Period | Distribution Period | | A | | C | | I | | P-A | | P-I | | P-D | | P-T | | P-S | Distribution Period | | A | | C | | I | | P-A | | P-I | | P-D | | P-T | | P-S |
| 1-Nov-15 | 1-Nov-15 | | 31-Jan-16 | | $ | 0.00165 | | | $ | 0.00165 | | | $ | 0.00165 | | | $ | — | | | $ | — | | | $ | — | | | $ | — | | | $ | — | |
| 1-Feb-16 | 1-Feb-16 | | 30-Apr-16 | | $ | 0.00166 | | | $ | 0.00166 | | | $ | 0.00166 | | | $ | — | | | $ | — | | | $ | — | | | $ | — | | | $ | — | |
| 1-May-16 | 1-May-16 | | 31-Jul-16 | | $ | 0.00166 | | | $ | 0.00166 | | | $ | 0.00166 | | | $ | 0.00158 | | | $ | 0.00158 | | | $ | — | | | $ | — | | | $ | — | |
| 1-Aug-16 | 1-Aug-16 | | 31-Oct-16 | | $ | 0.00168 | | | $ | 0.00168 | | | $ | 0.00168 | | | $ | 0.00160 | | | $ | 0.00160 | | | $ | — | | | $ | — | | | $ | — | |
| 1-Nov-16 | 1-Nov-16 | | 31-Jan-17 | | $ | 0.00169 | | | $ | 0.00164 | | | $ | 0.00169 | | | $ | 0.00160 | | | $ | 0.00160 | | | $ | — | | | $ | — | | | $ | — | |
| 1-Feb-17 | 1-Feb-17 | | 30-Apr-17 | | $ | 0.00168 | | | $ | 0.00164 | | | $ | 0.00168 | | | $ | 0.00160 | | | $ | 0.00160 | | | $ | — | | | $ | — | | | $ | — | |
| 1-May-17 | 1-May-17 | | 31-Jul-17 | | $ | 0.00167 | | | $ | 0.00163 | | | $ | 0.00167 | | | $ | 0.00160 | | | $ | 0.00158 | | | $ | — | | | $ | — | | | $ | — | |
| 1-Aug-17 | 1-Aug-17 | | 31-Oct-17 | | $ | 0.00167 | | | $ | 0.00163 | | | $ | 0.00167 | | | $ | — | | | $ | 0.00159 | | | $ | — | | | $ | — | | | $ | — | |
| 1-Nov-17 | 1-Nov-17 | | 31-Oct-18 | | $ | 0.00167 | | | $ | 0.00163 | | | $ | 0.00167 | | | $ | — | | | $ | 0.00158 | | | $ | — | | | $ | — | | | $ | — | |
| 1-Nov-18 | 1-Nov-18 | | 30-Apr-20 | | $ | 0.00167 | | | $ | 0.00163 | | | $ | 0.00167 | | | $ | 0.00165 | | | $ | 0.00158 | | | $ | — | | | $ | — | | | $ | — | |
| 1-May-20 | 1-May-20 | | 30-Nov-20 | | $ | 0.00152 | | | $ | 0.00149 | | | $ | 0.00152 | | | $ | 0.00153 | | | $ | 0.00158 | | | $ | — | | | $ | — | | | $ | — | |
| 1-Dec-20 | 1-Dec-20 | | 31-Dec-22 | | $ | 0.00152 | | | $ | 0.00149 | | | $ | 0.00152 | | | $ | 0.00152 | | | $ | 0.00158 | | | $ | 0.00158 | | | $ | 0.00158 | | | $ | 0.00158 | |
The following table reflects the distributions declared during the period from January 1, 2022 through May 18, 2022:
| | | | | | | | | | | | | | | | | | | | |
| Pay Date | | Paid in
Cash | | Value of
Shares
Issued under DRP | | Total |
| February 1, 2022 | | $ | 6,216,132 | | | $ | 1,856,347 | | | $ | 8,072,479 | |
| March 1, 2022 | | 5,712,141 | | | 1,720,315 | | | 7,432,456 | |
| April 1, 2022 | | 6,496,827 | | | 1,975,380 | | | 8,472,207 | |
| May 2, 2022 | | 6,291,008 | | | 1,934,690 | | | 8,225,698 | |
| Total | | $ | 24,716,108 | | | $ | 7,486,732 | | | $ | 32,202,840 | |
The following table reflects the distributions declared during the year ended December 31, 2021:
| | | | | | | | | | | | | | | | | | | | |
| Pay Date | | Paid in
Cash | | Value of
Shares
Issued under DRP | | Total |
| February 1, 2021 | | $ | 2,555,800 | | | $ | 538,241 | | | $ | 3,094,041 | |
| March 4, 2021 | | 3,063,308 | | | 487,868 | | | 3,551,176 | |
| April 1, 2021 | | 4,783,092 | | | 523,715 | | | 5,306,807 | |
| May 3, 2021 | | 4,733,419 | | | 565,208 | | | 5,298,627 | |
| June 1, 2021 | | 4,762,355 | | | 886,124 | | | 5,648,479 | |
| July 1, 2021 | | 4,709,348 | | | 960,096 | | | 5,669,444 | |
| August 2, 2021 | | 5,217,796 | | | 1,071,227 | | | 6,289,023 | |
| September 1, 2021 | | 5,423,345 | | | 1,145,375 | | | 6,568,720 | |
| October 1, 2021 | | 5,516,811 | | | 1,229,494 | | | 6,746,305 | |
| November 1, 2021 | | 5,946,262 | | | 1,463,710 | | | 7,409,972 | |
| December 1, 2021 | | 5,938,698 | | | 1,662,579 | | | 7,601,277 | |
| January 3, 2022 | | 6,174,878 | | | 1,755,921 | | | 7,930,799 | |
| Total | | $ | 58,825,112 | | | $ | 12,289,558 | | | $ | 71,114,670 | |
| | | | | | | | | | | | | | | | | | | | |
| (in thousands) | | | | | | |
| Pay Date | | Paid in
Cash | | Value of
Shares
Issued under DRP | | Total |
| February 1, 2022 | | $ | 6,216 | | | $ | 1,856 | | | $ | 8,072 | |
| March 1, 2022 | | 5,712 | | | 1,720 | | | 7,432 | |
| April 1, 2022 | | 6,497 | | | 1,975 | | | 8,472 | |
| May 2, 2022 | | 6,291 | | | 1,935 | | | 8,226 | |
| Total | | $ | 24,716 | | | $ | 7,486 | | | $ | 32,202 | |
All distributions paid for the period from January 1, 2022 through May 18, 2022 are expected to be reported as a return of capital to members for tax reporting purposes, and all distributions paid for the year ended December 31, 2021 were reported as a returnpurposes.
Cash distributions paid during the periods presented were funded from the following sources noted below:
| | | | | | | | | | | | |
| For the period from January 1, 2022 through May 18, 2022 | | For the year ended December 31,
2021 | |
| Cash from operations | $ | — | | | $ | — | | |
| Offering proceeds | 30,891,000 | | | 55,097,266 | | |
| Total cash distributions | $ | 30,891,000 | | | $ | 55,097,266 | | |
| | | | | | |
| (in thousands) | For the period from January 1, 2022 through May 18, 2022 | |
| Cash from operations | $ | — | | |
| Offering proceeds | 30,891 | | |
| Total cash distributions | $ | 30,891 | | |
The LLC expects to continue to fund distributions from a combination of cash from operations as well as other external financing sources. Due to the LLC’s change in acquisition strategy to include a greater number of pre-operational assets, a significant amount of distributions will continue to be funded from other external financing sources.
Note 9. Income Taxes8. Financial Highlights
The following is a schedule of the financial highlights of the LLC conducts most of its operations through GREC, its taxable wholly owned subsidiary. The consolidated income tax provisionattributed to Class A, C, I, P-A, P-I, P-D, P-S and P-T shares for the period from January 1, 2022 through May 18, 20222022.
| | | | | | | | | | | | | | | | | | | | | | | | | | | | | | | | | | | | | | | | | | | | | | | |
| For the period from January 1, 2022 through May 18, 2022 |
| (in thousands, except per share data and percentages) | Class A
shares | | Class C
shares | | Class I
shares | | Class P-A
shares | | Class P-I
shares | | Class P-D
shares | | Class P-S
shares | | Class P-T
shares |
Per share data attributed to common shares (1) | | | | | | | | | | | | | | | |
| Net Asset Value at beginning of period | $ | 8.32 | | | $ | 8.13 | | | $ | 8.32 | | | $ | 8.58 | | | $ | 8.80 | | | $ | 8.80 | | | $ | 8.74 | | | $ | 8.52 | |
| Net investment loss | (0.03) | | | (0.03) | | | (0.03) | | | (0.03) | | | (0.03) | | | (0.03) | | | (0.03) | | | (0.03) | |
| Net realized and unrealized gain on investments and swap contracts | 0.28 | | | 0.28 | | | 0.28 | | | 0.28 | | | 0.28 | | | 0.28 | | | 0.28 | | | 0.28 | |
Change in translation of assets and liabilities denominated in foreign currencies (2) | — | | | — | | | — | | | — | | | — | | | — | | | — | | | — | |
| (Provision for) benefit from income taxes on realized and unrealized gain (loss) on investments, foreign currency translation and swap contracts | (0.07) | | | (0.07) | | | (0.07) | | | (0.07) | | | (0.07) | | | (0.07) | | | (0.07) | | | (0.07) | |
| Net increase in net assets attributed to common members | 0.18 | | | 0.18 | | | 0.18 | | | 0.18 | | | 0.18 | | | 0.18 | | | 0.18 | | | 0.18 | |
| Shareholder distributions: | | | | | | | | | | | | | | | |
| Distributions from net investment income | — | | | — | | | — | | | — | | | — | | | — | | | — | | | — | |
| Distributions from offering proceeds | (0.18) | | | (0.18) | | | (0.18) | | | (0.18) | | | (0.19) | | | (0.19) | | | (0.19) | | | (0.19) | |
Other (3) | (0.02) | | | — | | | (0.02) | | | (0.01) | | | — | | | — | | | (0.01) | | | 0.01 | |
| Net decrease in members’ equity attributed to common shares | (0.20) | | | (0.18) | | | (0.20) | | | (0.19) | | | (0.19) | | | (0.19) | | | (0.20) | | | (0.18) | |
| Net asset value for common shares at end of period | $ | 8.30 | | | $ | 8.13 | | | $ | 8.30 | | | $ | 8.57 | | | $ | 8.79 | | | $ | 8.79 | | | $ | 8.72 | | | $ | 8.52 | |
| Common members’ equity at end of period | $ | 138,069 | | | $ | 22,503 | | | $ | 53,501 | | | $ | 6,803 | | | $ | 908,568 | | | $ | 1,748 | | | $ | 410,490 | | | $ | 2,057 | |
| Common shares outstanding at end of period | 16,627 | | | 2,767 | | | 6,445 | | | 794 | | | 103,334 | | | 199 | | | 47,048 | | 241 |
| | | | | | | | | | | | | | | |
| Ratio/Supplemental data for common shares (annualized): | | | | | | | | | | | | | | | |
| Total return attributed to common shares based on net asset value | 1.93 | % | | 2.24 | % | | 1.97 | % | | 2.07 | % | | 2.10 | % | | 2.06 | % | | 2.00 | % | | 2.31 | % |
| Ratio of net investment income to average net assets | (2.58 | %) | | (2.64 | %) | | (2.59 | %) | | (2.50 | %) | | (2.43 | %) | | (2.44) | % | | (2.46) | % | | (2.52) | % |
| Ratio of operating expenses to average net assets | 12.18 | % | | 12.44 | % | | 12.19 | % | | 11.79 | % | | 11.46 | % | | 11.52 | % | | 11.60 | % | | 11.87 | % |
| Portfolio turnover rate | 0.84 | % | | 0.84 | % | | 0.84 | % | | 0.84 | % | | 0.84 | % | | 0.84 | % | | 0.84 | % | | 0.84 | % |
(1)The per share data for Class A, C, I, P-A, P-I, P-D, P-S and year ended December 31, 2021 is composed ofP-T shares were derived by using the following:
| | | | | | | | | | | | | | | | | |
| Current | | Deferred | | Total |
| For the period from January 1, 2022 through May 18, 2022 | | | | | |
| U.S. federal | $ | — | | | $ | 6,514,622 | | | $ | 6,514,622 | |
| State and local | — | | | 2,393,271 | | | 2,393,271 | |
| Foreign jurisdiction | — | | | — | | | — | |
| Provision for income taxes | $ | — | | | $ | 8,907,893 | | | $ | 8,907,893 | |
| Change in valuation allowance | — | | | — | | | — | |
| Provision for income taxes, net | $ | — | | | $ | 8,907,893 | | | $ | 8,907,893 | |
| | | | | | | | | | | | | | | | | |
| Current | | Deferred | | Total |
| Year Ended December 31, 2021 | | | | | |
| U.S. federal | $ | — | | | $ | 5,075,307 | | | $ | 5,075,307 | |
| State and local | — | | | 2,946,388 | | | 2,946,388 | |
| Foreign jurisdiction | — | | | — | | | — | |
| Provision for income taxes | $ | — | | | $ | 8,021,695 | | | $ | 8,021,695 | |
| Change in valuation allowance | — | | | 817,262 | | | 817,262 | |
| Provision for income taxes, net | $ | — | | | $ | 8,838,957 | | | $ | 8,838,957 | |
The principal differences between our effective tax rate on operations and the U.S. federal statutory income tax rate are as follows:
| | | | | | | | | | | | | | | | | | | |
| For the period from January 1, 2022 through May 18, 2022 | Percentage | | 2021 | Percentage | | |
| Taxes at statutory U.S. federal income tax rate | $ | 8,320,219 | | 21.0 | % | | $ | 10,890,547 | | 21.0 | % | | |
| Permanent differences (GREC LLC and other) | 624,645 | | 1.6 | % | | 347,555 | | 0.7 | % | | |
| State income taxes, net of federal benefit | 1,890,684 | | 4.8 | % | | 2,253,655 | | 4.3 | % | | |
| Write off state credits | — | | — | % | | 334,079 | | 0.6 | % | | |
| Rate changes | — | | — | % | | — | | — | % | | |
| Return to provision and other adjustments | (40,196) | | (0.1) | % | | (1,850,554) | | (3.6) | % | | |
| Federal tax credits | (1,887,459) | | (4.8) | % | | (3,953,587) | | (7.6) | % | | |
| Change in valuation allowance | — | | — | % | | 817,262 | | 1.6 | % | | |
| Actual provision for income taxes | $ | 8,907,893 | | 22.5 | % | | $ | 8,838,957 | | 17.0 | % | | |
Deferred tax assets (liabilities) have been classified on the accompanying Consolidated Statement of Assets and Liabilities as of December 31, 2021 as follows:
| | | | | |
| 2021 |
Amortization | $ | 42,799 | |
Disallowed interest | 4,731,734 | |
Net operating losses | 60,652,197 | |
Federal and state tax credits | 11,996,064 | |
Unrealized gains | (102,617,534) | |
Deferred tax liabilities | $ | (25,194,740) | |
Less: valuation allowance | (1,512,356) | |
Deferred tax liabilities, net | $ | (26,707,096) | |
In assessing the realizability of deferred tax assets, management considers whether it is more likely than not that some portion or all of the deferred tax assets will not be realized. The ultimate realization of deferred tax assets is dependent upon the generation of future taxable incomeweighted average shares outstanding during the periods in which those temporary differences become deductible. Management considers the scheduled reversal of deferred tax assets, projected future taxable income and tax planning strategies in making this assessment. Based upon projections for future taxable income over the periods in which the deferred tax assets would be deductible, management as of December 31, 2021 has applied a partial valuation allowance of $1.5 million against the deferred tax assets that are not more likely than not to be utilized during their carryforward period.
The LLC follows the authoritative guidance on accounting for uncertainty in income taxes and has concluded it has no material uncertain tax positions to be recognized at this time.
The LLC assessed its tax positions and filings for all open tax years as of May 18, 2022 for all federal and state tax jurisdictions for the years 2014 through 2021.
The effective tax rate for the period from January 1, 2022 through May 18, 2022, which were 16.6 million, 2.8 million, 6.5 million, 0.8 million, 100.0 million, 0.2 million, 47.0 million and 0.2 million, respectively.
(2)Amount is 22.5%. Forless than $0.01 per share.
(3)Represents the impact of different share amounts used in calculating certain per share data based on weighted average shares outstanding during the period from January 1, 2022 through May 18, 2022, the primary items giving rise to the difference between the 21.0% statutory rate for corporations and the 22.5% effective tax rate are state taxes, federal tax credits, andimpact of shares at a price other permanent differences primarily related to expenses recorded atthan the partnership level which are not taxable.
The effective tax rate for the year ended December 31, 2021 is 17.0%. The primary items giving rise to the difference between the 21.0% statutory rate and the 17.0% effective tax rate are primarily state taxes, 2020 provision to return adjustments and federal tax credits.
Federal and state statutes of limitations are effectively open for all years in which the LLC has generated net operating losses, the earliest of which is the year ended December 31, 2014, until the years those losses were utilized are closed.
Note 10. Commitments and Contingencies
Refer to Note 13. Commitments and Contingencies in the Notes to the Consolidated Financial Statements as prepared on the Non-Investment Basis for disclosures regarding the LLC's commitments and contingencies as of December 31, 2022. The information as included herein reflects such matters as of December 31, 2021.
Legal Proceedings
The LLC may become involved in legal proceedings, administrative proceedings, claims and other litigation that arise in the ordinary course of business. Individuals and interest groups may sue to challenge the issuance of a permit for a renewable energy project or seek to enjoin construction of a wind energy project. In addition, the LLC may be subject to legal proceedings or claims contesting the construction or operation of our renewable energy projects. In defending itself in these proceedings, the LLC may incur significant expenses in legal fees and other related expenses, regardless of the outcome of such proceedings. Unfavorable outcomes or developments relating to these proceedings, such as judgments for monetary damages, injunctions or denial or revocation of permits, could have a material adverse effect on the LLC's business, financial condition and results of operations. In addition, settlement of claims could adversely affect the LLC's financial condition and results of operations. As of December 31, 2021, the LLC was not aware of any legal proceedings that might have a significant adverse impact on the LLC.
Pledge of Collateral and Unsecured Guarantee of Loans to Subsidiaries
Pursuant to various project loan agreements between the operating entities of the LLC, subsidiary holding companies and various lenders, the operating entities and the subsidiary holding companies have pledged all solar operating assets as well as the membership interests in various operating subsidiaries as collateral for the term loans with maturity dates ranging from June 2022 through September 2049.
Investment in To-Be-Constructed Assets and Membership Interest Purchase Commitments
Pursuant to various engineering, procurement and construction contracts to which 42 entities of the LLC are individually a party, the entities, and indirectly the LLC, have committed an outstanding balance of approximately $540.2 million to complete construction of the facilities. Based upon current construction schedules, the expectation is that these commitments will be fulfilled in 2022 into 2024. In addition, pursuant to various membership interest purchase agreements to which the LLC’s operating entities are individually a party, the operating entities, and indirectly the LLC, have committed an outstanding balance of approximately $1.0 billion to complete the closing pursuant to all conditions being met under the membership interest purchase agreements as of December 31, 2021. The LLC plans to use debt and tax equity financing as well as cash on hand to fund such commitments.
Unsecured Guarantee of Subsidiary Renewable Energy Credit Forward Contracts
For the majority of the forward REC contracts currently effective as of December 31, 2021 where a subsidiary of the LLC is the principal, the LLC has provided an unsecured guarantee related to the delivery obligations. The amount of the unsecured guaranty related to REC delivery performance obligations is nil as of December 31, 2021.
Pledge of Parent Company Guarantees
Pursuant to various contracts in which the LLC has provided a parent company guarantee, excluding those discussed above, the operating entities, and indirectly the LLC, have committed an additional $114.4 million in unsecured guarantees in the event of a default at the underlying entity, as of December 31, 2021.asset value.
See Note 2. Significant Accounting Policies and Note 5. Related Party Agreements and Transaction Agreements for an additional discussion of the LLC’s commitments and contingencies.
Note 11. Financial HighlightsITEM 9. CHANGES IN AND DISAGREEMENTS WITH ACCOUNTANTS ON ACCOUNTING AND FINANCIAL DISCLOSURE
The following is a schedule of the financial highlights of the LLC attributed to Class A, C, I, P-A, P-I, P-D, P-S and P-T shares for the period from January 1, 2022 through May 18, 2022.
| | | | | | | | | | | | | | | | | | | | | | | | | | | | | | | | | | | | | | | | | | | | | | | |
| For the period from January 1, 2022 through May 18, 2022 |
| Class A
shares | | Class C
shares | | Class I
shares | | Class P-A
shares | | Class P-I
shares | | Class P-D
shares | | Class P-S
shares | | Class P-T
shares |
Per share data attributed to common shares (1) | | | | | | | | | | | | | | | |
| Net Asset Value at beginning of period | $ | 8.32 | | | $ | 8.13 | | | $ | 8.32 | | | $ | 8.58 | | | $ | 8.80 | | | $ | 8.80 | | | $ | 8.74 | | | $ | 8.52 | |
| Net investment loss | (0.03) | | | (0.03) | | | (0.03) | | | (0.03) | | | (0.03) | | | (0.03) | | | (0.03) | | | (0.03) | |
| Net realized and unrealized gain on investments and swap contracts | 0.28 | | | 0.28 | | | 0.28 | | | 0.28 | | | 0.28 | | | 0.28 | | | 0.28 | | | 0.28 | |
Change in translation of assets and liabilities denominated in foreign currencies (2) | — | | | — | | | — | | | — | | | — | | | — | | | — | | | — | |
| (Provision for) benefit from income taxes on realized and unrealized gain (loss) on investments and foreign currency translation | (0.07) | | | (0.07) | | | (0.07) | | | (0.07) | | | (0.07) | | | (0.07) | | | (0.07) | | | (0.07) | |
| Net increase in net assets attributed to common members | 0.18 | | | 0.18 | | | 0.18 | | | 0.18 | | | 0.18 | | | 0.18 | | | 0.18 | | | 0.18 | |
| Shareholder distributions: | | | | | | | | | | | | | | | |
| Distributions from net investment income | — | | | — | | | — | | | — | | | — | | | — | | | — | | | — | |
| Distributions from offering proceeds | (0.18) | | | (0.18) | | | (0.18) | | | (0.18) | | | (0.19) | | | (0.19) | | | (0.19) | | | (0.19) | |
Other(3) | (0.02) | | | — | | | (0.02) | | | (0.01) | | | — | | | — | | | (0.01) | | | 0.01 | |
| Net decrease in members’ equity attributed to common shares | (0.20) | | | (0.18) | | | (0.20) | | | (0.19) | | | (0.19) | | | (0.19) | | | (0.20) | | | (0.18) | |
| Net asset value for common shares at end of period | $ | 8.30 | | | $ | 8.13 | | | $ | 8.30 | | | $ | 8.57 | | | $ | 8.79 | | | $ | 8.79 | | | $ | 8.72 | | | $ | 8.52 | |
| Common members’ equity at end of period | $ | 138,068,890 | | | $ | 22,503,138 | | | $ | 53,501,158 | | | $ | 6,803,177 | | | $ | 908,567,764 | | | $ | 1,747,849 | | | $ | 410,490,496 | | | $ | 2,057,436 | |
| Common shares outstanding at end of period | 16,626,973 | | | 2,766,760 | | | 6,445,062 | | | 794,193 | | | 103,334,227 | | | 198,948 | | | 47,047,838 | | 241,447 |
| | | | | | | | | | | | | | | |
| Ratio/supplemental data for common shares (annualized) | | | | | | | | | | | | | | | |
| Total return attributed to common shares based on net asset value | 1.93 | % | | 2.24 | % | | 1.97 | % | | 2.07 | % | | 2.10 | % | | 2.06 | % | | 2.00 | % | | 2.31 | % |
| Ratio of net investment income to average net assets | (2.58 | %) | | (2.64 | %) | | (2.59 | %) | | (2.50 | %) | | (2.43 | %) | | (2.44) | % | | (2.46) | % | | (2.52) | % |
| Ratio of operating expenses to average net assets | 12.18 | % | | 12.44 | % | | 12.19 | % | | 11.79 | % | | 11.46 | % | | 11.52 | % | | 11.60 | % | | 11.87 | % |
| Portfolio turnover rate | 0.84 | % | | 0.84 | % | | 0.84 | % | | 0.84 | % | | 0.84 | % | | 0.84 | % | | 0.84 | % | | 0.84 | % |
(1)The per share data for Class A, C, I, P-A, P-I, P-D, P-S and P-T shares were derived by using the weighted average shares outstanding during the period from January 1, 2022 through May 18, 2022, which were 16,611,759, 2,754,050, 6,456,343, 788,471, 100,036,952, 198,732, 47,042,796 and 240,446, respectively.
(2)Amount is less than $0.01 per share.
(3)Represents the impact of different share amounts used in calculating certain per share data based on weighted average shares outstanding during the period and the impact of shares at a price other than the net asset value.
The following is a schedule of financial highlights of the LLC attributed to Class A, C, I, P-A, P-I, P-D, P-S and P-T shares for the year ended December 31, 2021.
| | | | | | | | | | | | | | | | | | | | | | | | | | | | | | | | | | | | | | | | | | | | | | | |
| For the year ended December 31, 2021 |
| Class A
shares | | Class C
shares | | Class I
shares | | Class P-A
shares | | Class P-I
shares | | Class P-D
shares | | Class P-S
shares | | Class P-T
shares |
Per share data attributed to common shares (1) | | | | | | | | | | | | | | | |
| Net Asset Value at beginning of period | $ | 8.61 | | | $ | 8.35 | | | $ | 8.61 | | | $ | 8.70 | | | $ | 9.02 | | | $ | 8.96 | | | $ | 8.84 | | | $ | 8.57 | |
| Net investment income | 0.02 | | | 0.02 | | | 0.02 | | | 0.02 | | | 0.02 | | | 0.02 | | | 0.02 | | | 0.02 | |
| Net realized and unrealized gain on investments, and swap contracts | 0.46 | | | 0.46 | | | 0.46 | | | 0.46 | | | 0.46 | | | 0.46 | | | 0.46 | | | 0.46 | |
Change in translation of assets and liabilities denominated in foreign currencies (2) | — | | | — | | | — | | | — | | | — | | | — | | | — | | | — | |
| (Provision for) income taxes on realized and gain (loss) on investments, foreign currency translation and swap contracts | (0.14) | | | (0.14) | | | (0.14) | | | (0.14) | | | (0.14) | | | (0.14) | | | (0.14) | | | (0.14) | |
| Net increase in net assets attributed to common members | 0.34 | | | 0.34 | | | 0.34 | | | 0.34 | | | 0.34 | | | 0.34 | | | 0.34 | | | 0.34 | |
| Shareholder distributions: | | | | | | | | | | | | | | | |
| Distributions from net investment income | — | | | — | | | — | | | — | | | — | | | — | | | — | | | — | |
| Distributions from offering proceeds | (0.56) | | | (0.54) | | | (0.56) | | | (0.56) | | | (0.58) | | | (0.53) | | | (0.53) | | | (0.53) | |
Other(3) | (0.07) | | | (0.02) | | | (0.07) | | | 0.10 | | | 0.02 | | | 0.03 | | | 0.09 | | | 0.14 | |
| Net decrease in members’ equity attributed to common shares | (0.63) | | | (0.56) | | | (0.63) | | | (0.46) | | | (0.56) | | | (0.50) | | | (0.44) | | | (0.39) | |
| Net asset value for common shares at end of period | $ | 8.32 | | | $ | 8.13 | | | $ | 8.32 | | | $ | 8.58 | | | $ | 8.80 | | | $ | 8.80 | | | $ | 8.74 | | | $ | 8.52 | |
| Common members’ equity at end of period | $ | 137,994,947 | | | $ | 22,290,310 | | | $ | 53,665,823 | | | $ | 6,721,670 | | | $ | 810,046,418 | | | $ | 1,747,603 | | | $ | 404,803,246 | | | $ | 2,040,615 | |
| Common shares outstanding at end of period | 16,580,558 | | | 2,741,963 | | | 6,449,493 | | | 783,593 | | | 92,069,013 | | | 198,548 | | | 46,324,757 | | | 239,594 | |
| | | | | | | | | | | | | | | |
| Ratio/supplemental data for common shares (annualized) | | | | | | | | | | | | | | | |
| Total return attributed to common shares based on net asset value | 3.29 | % | | 4.03 | % | | 3.29 | % | | 5.18 | % | | 4.13 | % | | 3.81 | % | | 4.98 | % | | 5.48 | % |
| Ratio of net investment income to average net assets | 0.25 | % | | 0.26 | % | | 0.25 | % | | 0.23 | % | | 0.24 | % | | 0.22 | % | | 0.24 | % | | 0.24 | % |
| Ratio of operating expenses to average net assets | 3.68 | % | | 3.77 | % | | 3.67 | % | | 3.34 | % | | 3.45 | % | | 3.28 | % | | 3.53 | % | | 3.48 | % |
| Portfolio turnover rate | 0.98 | % | | 0.98 | % | | 0.98 | % | | 0.98 | % | | 0.98 | % | | 0.98 | % | | 0.98 | % | | 0.98 | % |
(1)The per share data for Class A, C, I, P-A, P-I, P-D, P-S and P-T shares were derived by using the weighted average shares outstanding during the period ended December 31, 2021, which were 16,741,429, 2,751,320, 6,552,391, 479,717, 67,370,914, 129,799, 32,304,342 and 128,948, respectively.
(2)Amount is less than $0.01.
(3)Represents the impact of different share amounts used in calculating certain per share data based on weighted average shares outstanding during the period and the impact of shares at a price other than the net asset value.
ITEM 9. CHANGES IN AND DISAGREEMENTS WITH ACCOUNTANTS ON ACCOUNTING AND FINANCIAL DISCLOSURE
None.
ITEM 9A. CONTROLS AND PROCEDURES
Disclosure Controls
In accordance with Rules 13a-15(b) and 15d-15(b) of the Exchange Act, we, under the supervision and with the participation of our Chief Executive Officer and Chief Accounting Officer, carried out an evaluation of the effectiveness of our disclosure controls and procedures (as defined in Rule 13a-15(e) and Rule 15d-15(e) of the Exchange Act) as of the end of the period covered by this Annual Report, and determined that the disclosure controls and procedures are effective. Our disclosure controls and procedures are designed to provide reasonable assurance that information we are required to disclose in the reports that we file or submit under the Exchange Act are recorded, processed and summarized and reported within the time period specified in the applicable rules and forms.
Management’s Report on Internal Control over Financial Reporting
Our internal control over financial reporting is a process designed to provide reasonable assurance regarding the reliability of financial reporting and the preparation of financial statements for external purposes in accordance with GAAP. The internal control over financial reporting for the Company includes those policies and procedures that (i) pertain to the maintenance of records that, in reasonable detail, accurately and fairly reflect the transactions and dispositions of assets; (ii) provide reasonable assurance that transactions are recorded as necessary to permit preparation of financial statements in accordance with GAAP, and that receipts and expenditures are being made only in accordance with authorizations of our management; and (iii) provide reasonable assurance regarding the prevention or timely detection of unauthorized acquisition, use or disposition of assets that could have a material effect on the consolidated financial statements of the Company.
Because of its inherent limitations, internal control over financial reporting may not prevent or detect misstatements. All internal control systems, no matter how well designed, have inherent limitations, including the possibility of human error and the circumvention of overriding controls. Accordingly, even effective internal control over financial reporting can provide only reasonable assurance with respect to financial statement preparation. Also, projections of any evaluation of effectiveness to future periods are subject to the risk that controls may become inadequate because of changes in conditions, or that the degree of compliance with the policies or procedures may deteriorate.
Our management assessed the effectiveness of the internal control over financial reporting as of December 31, 2022,2023, based on the framework set forth by the Committee of Sponsoring Organizations of the Treadway Commission (COSO) in its 2013 framework as part of its assessment. Based on that assessment, our management concluded that, as of December 31, 2022,2023, the internal control over financial reporting for the Company is effective based on the criteria established in Internal Control-Integrated Framework.
This Annual Report does not include an attestation report of the Company’s independent registered public accounting firm regarding internal control over financial reporting. Our management’s report was not subject to attestation by the Company’s independent registered public accounting firm pursuant to the rules of the SEC that permit the Company to provide only management’s report in this Annual Report.
Change in Internal Control Over Financial Reporting
No change occurred in our internal control over financial reporting (as defined in Rule 13a-15(f) and 15d-15(f) of the Exchange Act) during the year ended December 31, 20222023 that has materially affected, or is reasonably likely to materially affect, our internal control over financial reporting.
Limitations on the Effectiveness of Controls
Any control system, no matter how well designed and operated, can only provide reasonable (but not absolute) assurance that its objectives will be met. Furthermore, no evaluation of controls can provide absolute assurance that all control issues and instances of fraud, if any, have been detected.
ITEM 9B. OTHER INFORMATION
None.
ITEM 9C. DISCLOSURE REGARDING FOREIGN JURISDICTIONS THAT PREVENT INSPECTIONS
Not Applicable.
PART III
ITEM 10. DIRECTORS, EXECUTIVE OFFICERS AND CORPORATE GOVERNANCE
The information required by this Item 10 will be included under the heading “Corporate“Directors, Corporate Governance Matters”and Executive Officers” in the Company’s definitive proxy statement which will be filed with the SEC within 120 days after December 31, 2022,2023, in connection with the solicitation of proxies for the Company’s 20232024 annual meeting of shareholders (the “2023“2024 Proxy Statement”) and is incorporated herein by reference.
ITEM 11. EXECUTIVE COMPENSATION
The information required by this Item 11 will be included in the Company’s 20232024 Proxy Statement under the headings “Corporate Governance Matters”“Compensation of Directors and Executive Officers” and is incorporated herein by reference.
ITEM 12. SECURITY OWNERSHIP OF CERTAIN BENEFICIAL OWNERS AND MANAGEMENT AND RELATED MEMBER MATTERS
The information required by this Item 12 relating to security ownership of certain beneficial owners and management will be included in the Company’s 20232024 Proxy Statement under the heading “Ownership of Securities” and is incorporated herein by reference.
ITEM 13. CERTAIN RELATIONSHIPS AND RELATED TRANSACTIONS, AND DIRECTOR INDEPENDENCE
The information required by this Item 13, to the extent applicable, will be included in the Company's 2023Company’s 2024 Proxy Statement under the heading “Corporate Governance Matters”“Certain Relationships and Related Transactions” and is incorporated herein by reference.
ITEM 14. PRINCIPAL ACCOUNTANT FEES AND SERVICES
The information required by this Item 14 will be included in the Company’s 20232024 Proxy Statement under the heading “Independent Registered Public Accounting Firm” and is incorporated herein by reference.
PART IV
ITEM 15. EXHIBITS, CONSOLIDATED FINANCIAL STATEMENT SCHEDULES
The following exhibits are included, or incorporated by reference, in this Annual Report for the year ended December 31, 2022 (and are numbered in accordance with Item 601 of Regulation S-K).
(a)Documents Filed as Part of this Report
(1)The following Consolidated Financial Statements of Greenbacker Renewable Energy Company LLC and related notes thereto, together with the Report of Independent Registered Public Accounting Firm of KPMG LLP (PCAOB ID: 185) thereon, are included herein:
Non-Investment Basis
•Consolidated Balance SheetSheets as of December 31, 2023 and 2022
•Consolidated StatementStatements of Operations for the year ended December 31, 2023 and the period from May 19, 2022 through December 31, 2022
•Consolidated StatementStatements of Comprehensive Income (Loss) for the year ended December 31, 2023 and the period from May 19, 2022 through December 31, 2022
•Consolidated StatementStatements of Redeemable Noncontrolling Interests and Equity for the year ended December 31, 2023 and the period from May 19, 2022 through December 31, 2022
•Consolidated StatementStatements of Cash Flows for the year ended December 31, 2023 and the period from May 19, 2022 through December 31, 2022
•Notes to the Consolidated Financial Statements
Investment Basis
•Consolidated Statement of Assets and Liabilities as of December 31, 2021
•Consolidated Statements of Operations for the period from January 1, 2022 through May 18, 2022 and the year ended December 31, 2021
•Consolidated StatementsStatement of Changes in Net Assets for the period from January 1, 2022 through May 18, 2022 and the year ended December 31, 2021
•Consolidated StatementsStatement of Cash Flows fromfor the period from January 1, 2022 through May 18, 2022 and the year ended December 31, 2021
•Consolidated Schedule of Investments as of December 31, 2021
•Notes to the Consolidated Financial Statements
(2)Financial Statement Schedules have been omitted because they are not applicable, or the required information is shown in the Consolidated Financial Statements or Notes thereto in Item 8 of this Annual Report.
(b)Exhibits
The following exhibits, as required by Item 601 of Regulation S-K, are filed as part of this report or hereby incorporated by reference to exhibits previously filed with the Securities and Exchange Commission:Commission as stated below:
| | | | | | | | |
Exhibit
Number | | Description of Document |
| | |
| 2.1 | | |
| | |
| 2.2 | | |
| | |
| | | | | | | | |
Exhibit
Number | | Description of Document |
| 3.3 | | |
| | |
| 4.1 | | |
| | |
| 4.2 | | |
| | |
| 4.3 | | |
| | |
| 10.1 | | |
| | |
4.2*10.2 | | |
| | |
| 10.3 | | |
| | |
10.110.4 | | |
| | |
10.210.5 | | |
| | |
10.310.6 | | |
| | |
10.410.7 | | |
| | |
10.510.8 | | |
| | |
10.610.9 | | Credit Agreement among GREC Entity HoldCo LLC, as Borrower, Greenbacker Renewable Energy Corporation, as Intermediate Holdco, Greenbacker Renewable Energy Company LLC, as Parent, and the lenders named therein,, dated July 11, 2016 (Incorporated by reference from Exhibit 10.1 of the Registrant’s Form 8-K (File No. 333-178786-01) filed on July 14, 2016) |
| | |
10.710.10 | | Credit Agreement among GREC Entity HoldCo LLC, as Borrower, Greenbacker Renewable Energy Corporation, as Intermediate Holdco, Greenbacker Renewable Energy Company LLC, as Parent, and the lenders named therein,, dated January 5, 2018 (Incorporated by reference from Exhibit 10.1 of the Registrant’s Form 8-K (File No. 000-55610) filed on January 10, 2018) |
| | |
10.810.11 | | Amended and Restated Credit Agreement among GREC Entity HoldCo LLC, as Borrower, Greenbacker Renewable Energy Corporation, as Intermediate Holdco, Greenbacker Renewable Energy Company LLC, as Parent, and the lendersnamed therein,, dated June 20, 2019 (Incorporated by reference from Exhibit 10.1 of the Registrant’s Form 8-K (File No. 000-55610) filed on June 25, 2019) |
| | |
| 10.12* | | |
| | |
| 10.13 | | |
| | |
| | | | | | | | |
Exhibit
Number | | Description of Document |
| 10.14 | | |
| | |
| 10.15 | | |
| | |
| 10.16 | | Credit Agreement among GREC Holdings 1 LLC, as Borrower, and Fifth Third Bank, National Association, KeyBanc Capital Markets Inc., Wells Fargo Bank, National Association, and the lenders named therein, dated November 29, 2022 (Incorporated by reference from Exhibit 10.1 of the Registrant’s Form 8-K (File No. 000-55610) filed on January 11, 2024) |
| | |
| 10.17 | | AmendedCredit Agreement among GREC Holdings 1 LLC, as Borrower, and Fifth Third Bank, National Association, KeyBanc Capital Markets Inc., Wells Fargo Bank, National Association, and the lenders named therein, dated March 21, 2023 (Incorporated by reference from Exhibit 10.2 of the Registrant’s Form 8-K (File No. 000-55610) filed on January 11, 2024) |
| | |
| 14.1 | | |
| | |
| 21.1* | | |
| | |
21.1* | | |
| | |
| 23.1* | | |
| 24.1* | |
| 23.2* | | |
| | |
| 24.1* | | |
| | |
| 31.1* | | |
| | |
| 31.2* | | |
| | |
| 32.1** | | |
| | |
| 32.2** | | |
| | |
| | | | | | | | |
| 101* | | The following materials from Greenbacker Renewable Energy Company LLC’s Annual Report on Form 10-K for the year ended December 31, 2022,2023, filed on March 31, 2023,28, 2024, formatted in XBRL (eXtensible Business Reporting Language):
Non-Investment Basis: (i) Consolidated Balance Sheet;Sheets; (ii) Consolidated StatementStatements of Operations; (iii) Consolidated StatementStatements of Comprehensive Income (Loss); (iv) Consolidated StatementStatements of Redeemable Noncontrolling Interests and Equity; (v) Consolidated StatementStatements of Cash Flows; and (vi) Notes to the Consolidated Financial Statements
Investment Basis: (i) Consolidated Statement of Assets and Liabilities;Operations; (ii) Consolidated Statements of Operations; (iii) Consolidated StatementsStatement of Changes in Net Assets; (iv)(iii) Consolidated StatementsStatement of Cash Flows; (v) Consolidated Schedule of Investments; and (vi)(iv) Notes to the Consolidated Financial Statements |
| | |
| 104 | | Cover page interactive data file, formatted in Inline XBRL and contained in Exhibit 101 |
*Filed herewith.
** Furnished herewith.
ITEM 16. FORM 10-K SUMMARY
None.
SIGNATURES
Pursuant to the requirements of the Securities Exchange Act of 1934, the registrant has duly caused this report to be signed on its behalf by the undersigned, thereunto duly authorized.
| | | | | | | | | | | |
| | Greenbacker Renewable Energy Company LLC |
Date: March 31, 202328, 2024 | | By | /s/ Charles Wheeler |
| | | Charles Wheeler Chairman, Chief Executive Officer and Director principal executive officer |
| | | |
Date: March 31, 202328, 2024 | | By | /s/ Michael Landenberger |
| | | Michael Landenberger Chief Accounting Officer principal financial and principal accounting officer |
Pursuant to the requirements of the Securities Exchange Act of 1934, this report has been signed below by the following persons on behalf of the registrant and in the capacities and on the dates indicated.
| | | | | | | | | | | | | | |
| Signature | | Title | | Date |
| | | | |
| /s/ Charles Wheeler | | Chairman, Chief Executive Officer and Director | | March 31, 202328, 2024 |
| Charles Wheeler | | principal executive officer | | |
| | | | |
| /s/ Michael Landenberger | | Chief Accounting Officer | | March 31, 202328, 2024 |
| Michael Landenberger | | principal financial and principal accounting officer | | |
KNOW ALL MEN BY THESE PRESENTS, that each person whose signature appears below constitutes and appoints each of Charles Wheeler and Michael Landenberger respectively, as histo be their true and lawful attorney-in-fact and agent,agents, with full power of substitution and resubstitution, for himthem and hisin their name, place and stead, in any and all capacities (unless revoked in writing), to sign this report and any or all amendments to this Annual Report,thereto, and to file the same, with all exhibits thereto and other documents in connection therewith, with the SEC, granting unto said attorney-in-factSecurities and agent, full power and authority to do and perform eachExchange Commission,, and every act and thing requisite and necessary or desirable to be done, in and about the premises, as fully to all intents and purposes as hethey might or could do in person, herebythereby ratifying and confirming all that said attorney-in-fact and agentagents or any of histhem, or their substitute or substitutes, may lawfully do or cause to be done by virtue hereof.
Pursuant to the requirements of the Securities Exchange Act of 1934, this report has been signed below by the following persons on behalf of the registrant and in the capacities and on the dates indicated.
| | | | | | | | | | | |
| /s/ David Sher | | | |
| David Sher | | Director | March 31, 202328, 2024 |
| | | |
| /s/ Kathleen Cuocolo | | | |
| Kathleen Cuocolo | | Director | March 31, 202328, 2024 |
| | | |
| /s/ Robert Herriott | | | |
| Robert Herriott | | Director | March 31, 202328, 2024 |
| | | |
| /s/ David M. Kastin | | | |
| David M. Kastin | | Director | March 31, 202328, 2024 |
| | | |
| /s/ Robert Brennan | | | |
| Robert Brennan | | Director | March 31, 202328, 2024 |
| | | |
| /s/ Cynthia Curtis | | | |
| Cynthia Curtis | | Director | March 31, 202328, 2024 |